Brices Creek, NC Map & Demographics
Brices Creek Map
Brices Creek Overview
$57,776
PER CAPITA INCOME
$116,186
AVG FAMILY INCOME
$112,813
AVG HOUSEHOLD INCOME
44.5%
WAGE / INCOME GAP [ % ]
55.5¢/ $1
WAGE / INCOME GAP [ $ ]
0.49
INEQUALITY / GINI INDEX
3,678
TOTAL POPULATION
1,653
MALE POPULATION
2,025
FEMALE POPULATION
81.63
MALES / 100 FEMALES
122.50
FEMALES / 100 MALES
49.9
MEDIAN AGE
2.9
AVG FAMILY SIZE
2.5
AVG HOUSEHOLD SIZE
1,736
LABOR FORCE [ PEOPLE ]
56.5%
PERCENT IN LABOR FORCE
1.1%
UNEMPLOYMENT RATE
Income in Brices Creek
Income Overview in Brices Creek
Per Capita Income in Brices Creek is $57,776, while median incomes of families and households are $116,186 and $112,813 respectively.
| Characteristic | Number | Measure |
| Per Capita Income | 3,678 | $57,776 |
| Median Family Income | 1,144 | $116,186 |
| Mean Family Income | 1,144 | $170,760 |
| Median Household Income | 1,485 | $112,813 |
| Mean Household Income | 1,485 | $145,607 |
| Income Deficit | 1,144 | $0 |
| Wage / Income Gap (%) | 3,678 | 44.51% |
| Wage / Income Gap ($) | 3,678 | 55.49¢ per $1 |
| Gini / Inequality Index | 3,678 | 0.49 |
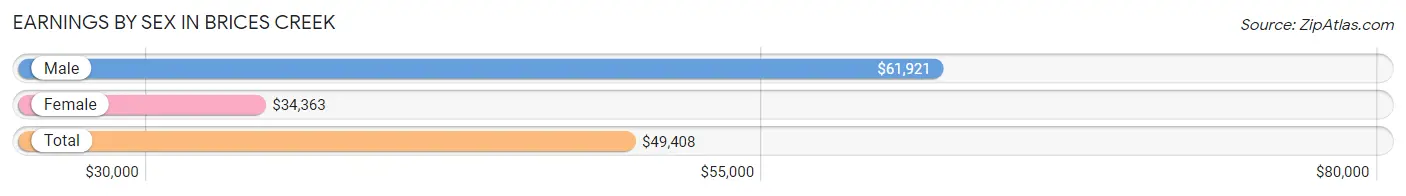
Earnings by Sex in Brices Creek
Average Earnings in Brices Creek are $49,408, $61,921 for men and $34,363 for women, a difference of 44.5%.
| Sex | Number | Average Earnings |
| Male | 918 (51.7%) | $61,921 |
| Female | 857 (48.3%) | $34,363 |
| Total | 1,775 (100.0%) | $49,408 |
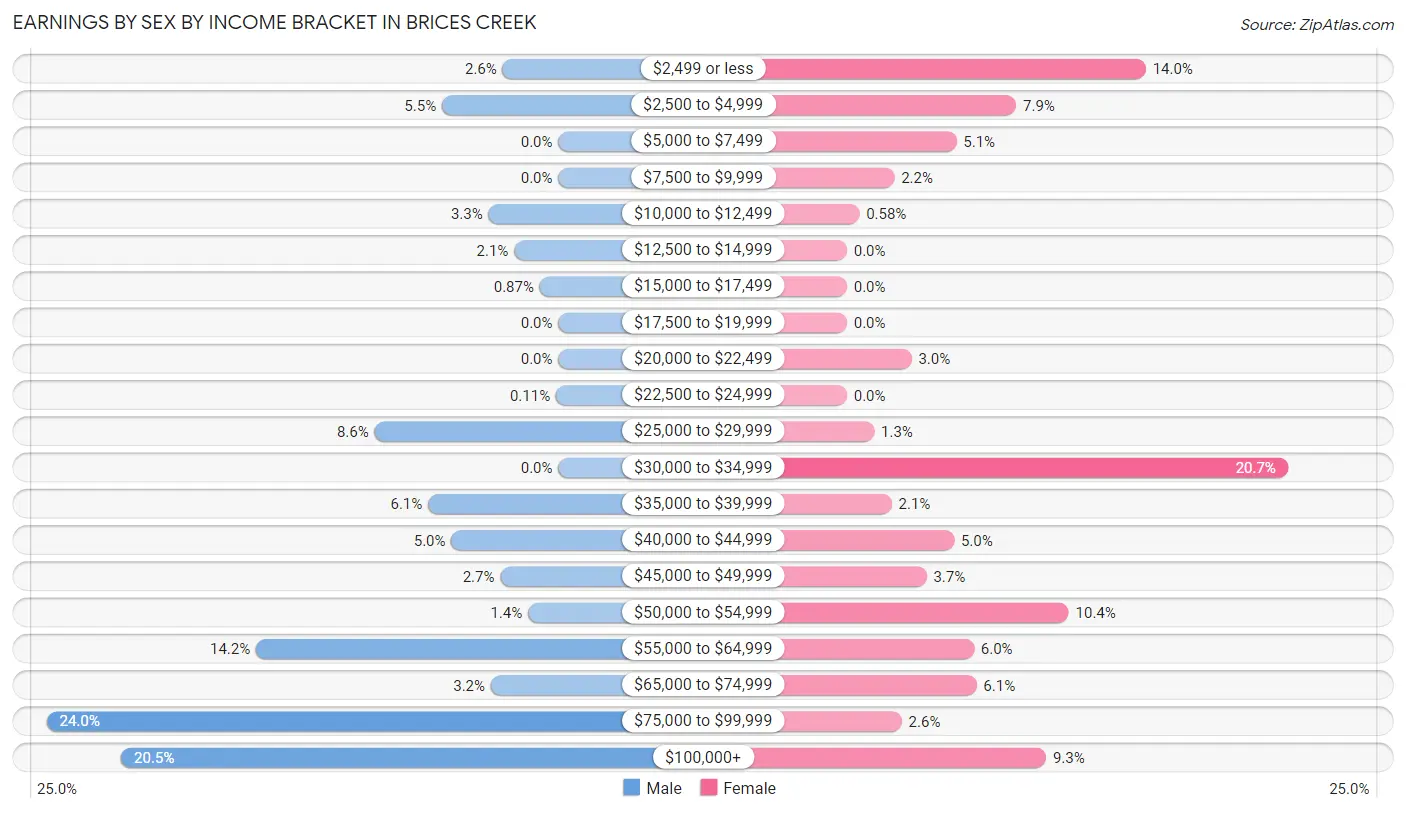
Earnings by Sex by Income Bracket in Brices Creek
The most common earnings brackets in Brices Creek are $75,000 to $99,999 for men (220 | 24.0%) and $30,000 to $34,999 for women (177 | 20.6%).
| Income | Male | Female |
| $2,499 or less | 24 (2.6%) | 120 (14.0%) |
| $2,500 to $4,999 | 50 (5.4%) | 68 (7.9%) |
| $5,000 to $7,499 | 0 (0.0%) | 44 (5.1%) |
| $7,500 to $9,999 | 0 (0.0%) | 19 (2.2%) |
| $10,000 to $12,499 | 30 (3.3%) | 5 (0.6%) |
| $12,500 to $14,999 | 19 (2.1%) | 0 (0.0%) |
| $15,000 to $17,499 | 8 (0.9%) | 0 (0.0%) |
| $17,500 to $19,999 | 0 (0.0%) | 0 (0.0%) |
| $20,000 to $22,499 | 0 (0.0%) | 26 (3.0%) |
| $22,500 to $24,999 | 1 (0.1%) | 0 (0.0%) |
| $25,000 to $29,999 | 79 (8.6%) | 11 (1.3%) |
| $30,000 to $34,999 | 0 (0.0%) | 177 (20.6%) |
| $35,000 to $39,999 | 56 (6.1%) | 18 (2.1%) |
| $40,000 to $44,999 | 46 (5.0%) | 43 (5.0%) |
| $45,000 to $49,999 | 25 (2.7%) | 32 (3.7%) |
| $50,000 to $54,999 | 13 (1.4%) | 89 (10.4%) |
| $55,000 to $64,999 | 130 (14.2%) | 51 (5.9%) |
| $65,000 to $74,999 | 29 (3.2%) | 52 (6.1%) |
| $75,000 to $99,999 | 220 (24.0%) | 22 (2.6%) |
| $100,000+ | 188 (20.5%) | 80 (9.3%) |
| Total | 918 (100.0%) | 857 (100.0%) |
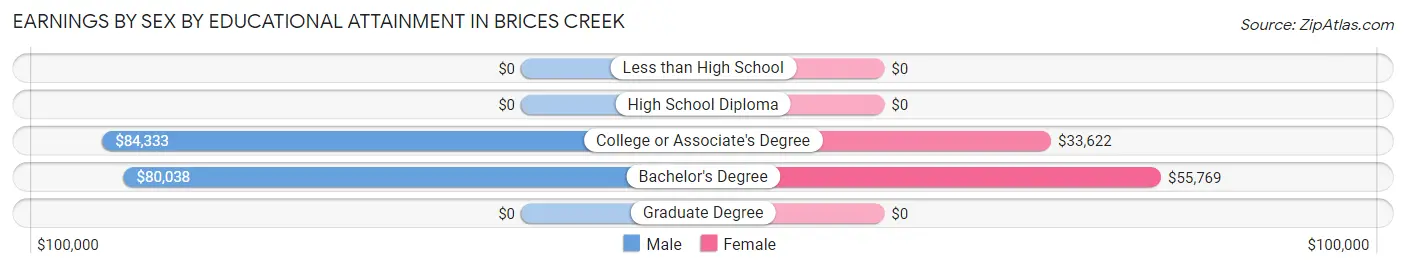
Earnings by Sex by Educational Attainment in Brices Creek
Average earnings in Brices Creek are $79,602 for men and $42,674 for women, a difference of 46.4%. Men with an educational attainment of college or associate's degree enjoy the highest average annual earnings of $84,333, while those with bachelor's degree education earn the least with $80,038. Women with an educational attainment of bachelor's degree earn the most with the average annual earnings of $55,769, while those with college or associate's degree education have the smallest earnings of $33,622.
| Educational Attainment | Male Income | Female Income |
| Less than High School | - | - |
| High School Diploma | - | - |
| College or Associate's Degree | $84,333 | $33,622 |
| Bachelor's Degree | $80,038 | $55,769 |
| Graduate Degree | - | - |
| Total | $79,602 | $42,674 |
Family Income in Brices Creek
Family Income Brackets in Brices Creek
According to the Brices Creek family income data, there are 442 families falling into the $100,000 to $149,999 income range, which is the most common income bracket and makes up 38.6% of all families.
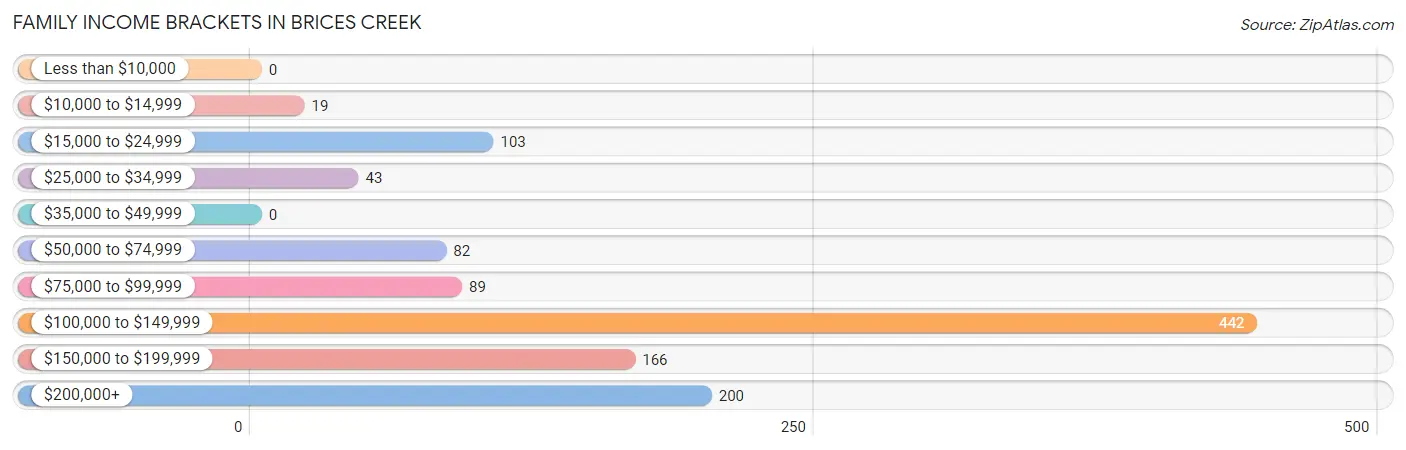
| Income Bracket | # Families | % Families |
| Less than $10,000 | 0 | 0.0% |
| $10,000 to $14,999 | 19 | 1.7% |
| $15,000 to $24,999 | 103 | 9.0% |
| $25,000 to $34,999 | 43 | 3.8% |
| $35,000 to $49,999 | 0 | 0.0% |
| $50,000 to $74,999 | 82 | 7.2% |
| $75,000 to $99,999 | 89 | 7.8% |
| $100,000 to $149,999 | 442 | 38.6% |
| $150,000 to $199,999 | 166 | 14.5% |
| $200,000+ | 200 | 17.5% |
Family Income by Famaliy Size in Brices Creek
4-person families (74 | 6.5%) account for the highest median family income in Brices Creek with $181,111 per family, while 2-person families (692 | 60.5%) have the highest median income of $57,140 per family member.
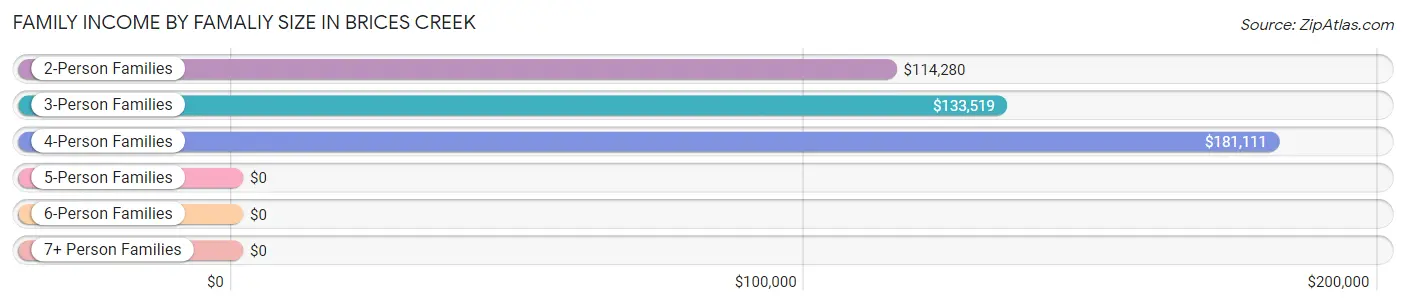
| Income Bracket | # Families | Median Income |
| 2-Person Families | 692 (60.5%) | $114,280 |
| 3-Person Families | 242 (21.1%) | $133,519 |
| 4-Person Families | 74 (6.5%) | $181,111 |
| 5-Person Families | 123 (10.7%) | $0 |
| 6-Person Families | 0 (0.0%) | $0 |
| 7+ Person Families | 13 (1.1%) | $0 |
| Total | 1,144 (100.0%) | $116,186 |
Family Income by Number of Earners in Brices Creek
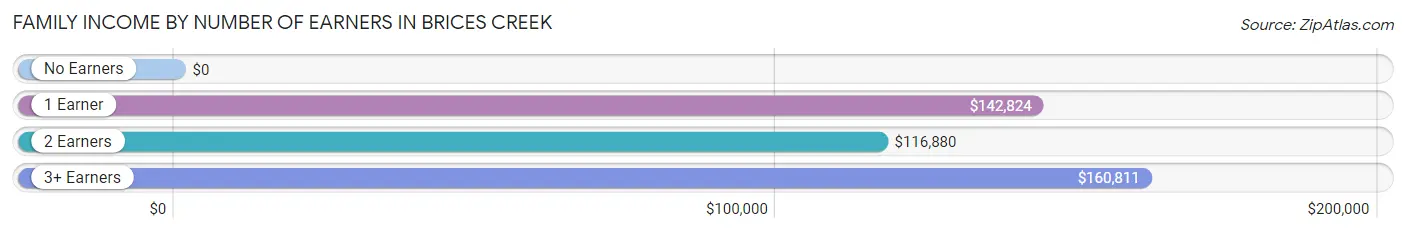
| Number of Earners | # Families | Median Income |
| No Earners | 333 (29.1%) | $0 |
| 1 Earner | 223 (19.5%) | $142,824 |
| 2 Earners | 438 (38.3%) | $116,880 |
| 3+ Earners | 150 (13.1%) | $160,811 |
| Total | 1,144 (100.0%) | $116,186 |
Household Income in Brices Creek
Household Income Brackets in Brices Creek
With 466 households falling in the category, the $100,000 to $149,999 income range is the most frequent in Brices Creek, accounting for 31.4% of all households. In contrast, only 19 households (1.3%) fall into the $10,000 to $14,999 income bracket, making it the least populous group.
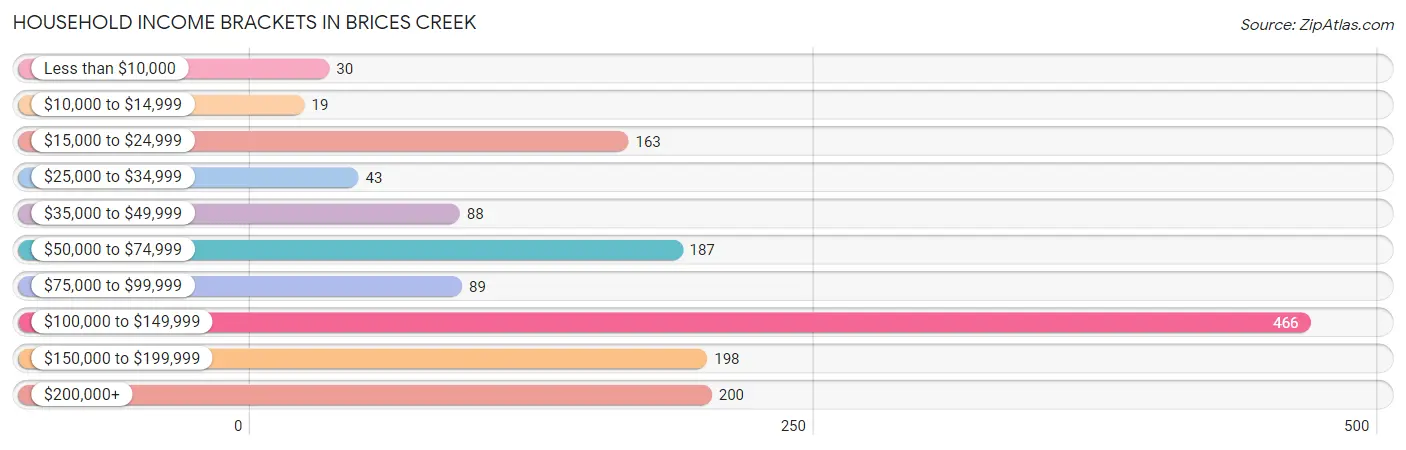
| Income Bracket | # Households | % Households |
| Less than $10,000 | 30 | 2.0% |
| $10,000 to $14,999 | 19 | 1.3% |
| $15,000 to $24,999 | 163 | 11.0% |
| $25,000 to $34,999 | 43 | 2.9% |
| $35,000 to $49,999 | 88 | 5.9% |
| $50,000 to $74,999 | 187 | 12.6% |
| $75,000 to $99,999 | 89 | 6.0% |
| $100,000 to $149,999 | 466 | 31.4% |
| $150,000 to $199,999 | 198 | 13.3% |
| $200,000+ | 200 | 13.5% |
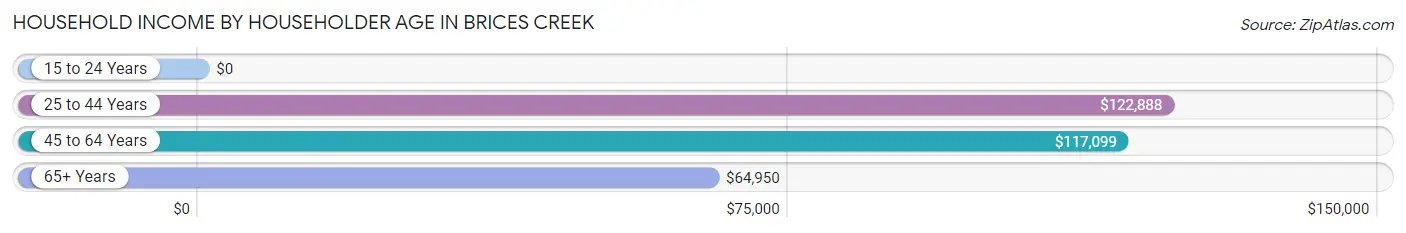
Household Income by Householder Age in Brices Creek
The median household income in Brices Creek is $112,813, with the highest median household income of $122,888 found in the 25 to 44 years age bracket for the primary householder. A total of 237 households (16.0%) fall into this category. Meanwhile, the 15 to 24 years age bracket for the primary householder has the lowest median household income of $0, with 56 households (3.8%) in this group.
| Income Bracket | # Households | Median Income |
| 15 to 24 Years | 56 (3.8%) | $0 |
| 25 to 44 Years | 237 (16.0%) | $122,888 |
| 45 to 64 Years | 640 (43.1%) | $117,099 |
| 65+ Years | 552 (37.2%) | $64,950 |
| Total | 1,485 (100.0%) | $112,813 |
Poverty in Brices Creek
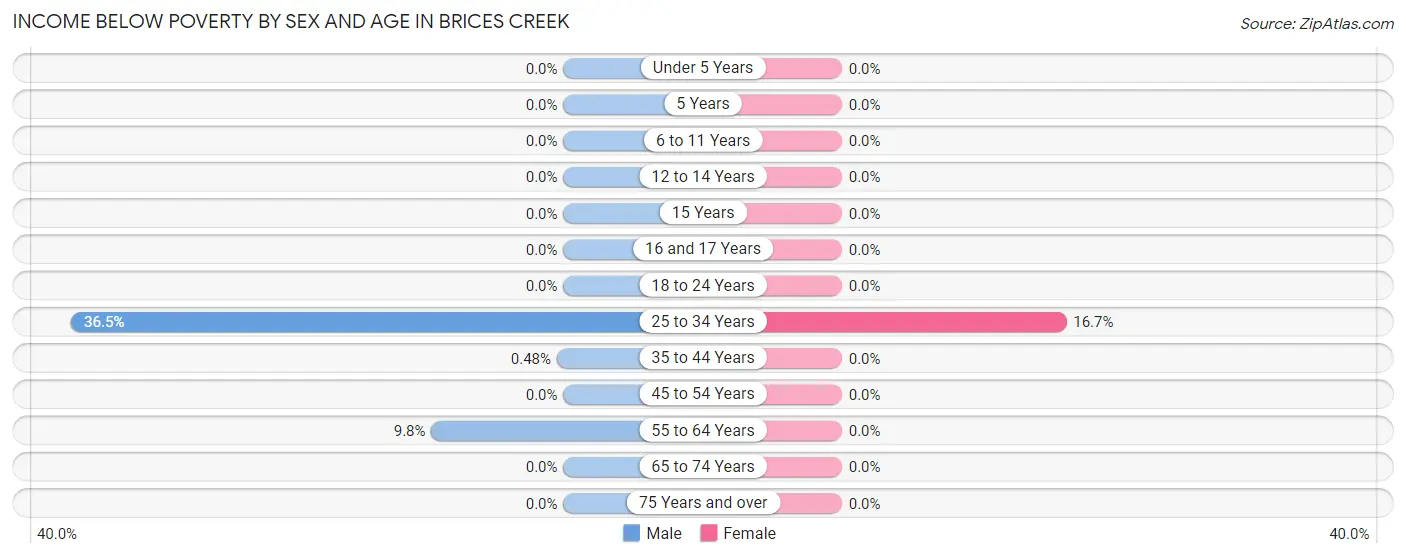
Income Below Poverty by Sex and Age in Brices Creek
With 3.0% poverty level for males and 1.3% for females among the residents of Brices Creek, 25 to 34 year old males and 25 to 34 year old females are the most vulnerable to poverty, with 19 males (36.5%) and 26 females (16.7%) in their respective age groups living below the poverty level.
| Age Bracket | Male | Female |
| Under 5 Years | 0 (0.0%) | 0 (0.0%) |
| 5 Years | 0 (0.0%) | 0 (0.0%) |
| 6 to 11 Years | 0 (0.0%) | 0 (0.0%) |
| 12 to 14 Years | 0 (0.0%) | 0 (0.0%) |
| 15 Years | 0 (0.0%) | 0 (0.0%) |
| 16 and 17 Years | 0 (0.0%) | 0 (0.0%) |
| 18 to 24 Years | 0 (0.0%) | 0 (0.0%) |
| 25 to 34 Years | 19 (36.5%) | 26 (16.7%) |
| 35 to 44 Years | 1 (0.5%) | 0 (0.0%) |
| 45 to 54 Years | 0 (0.0%) | 0 (0.0%) |
| 55 to 64 Years | 30 (9.8%) | 0 (0.0%) |
| 65 to 74 Years | 0 (0.0%) | 0 (0.0%) |
| 75 Years and over | 0 (0.0%) | 0 (0.0%) |
| Total | 50 (3.0%) | 26 (1.3%) |
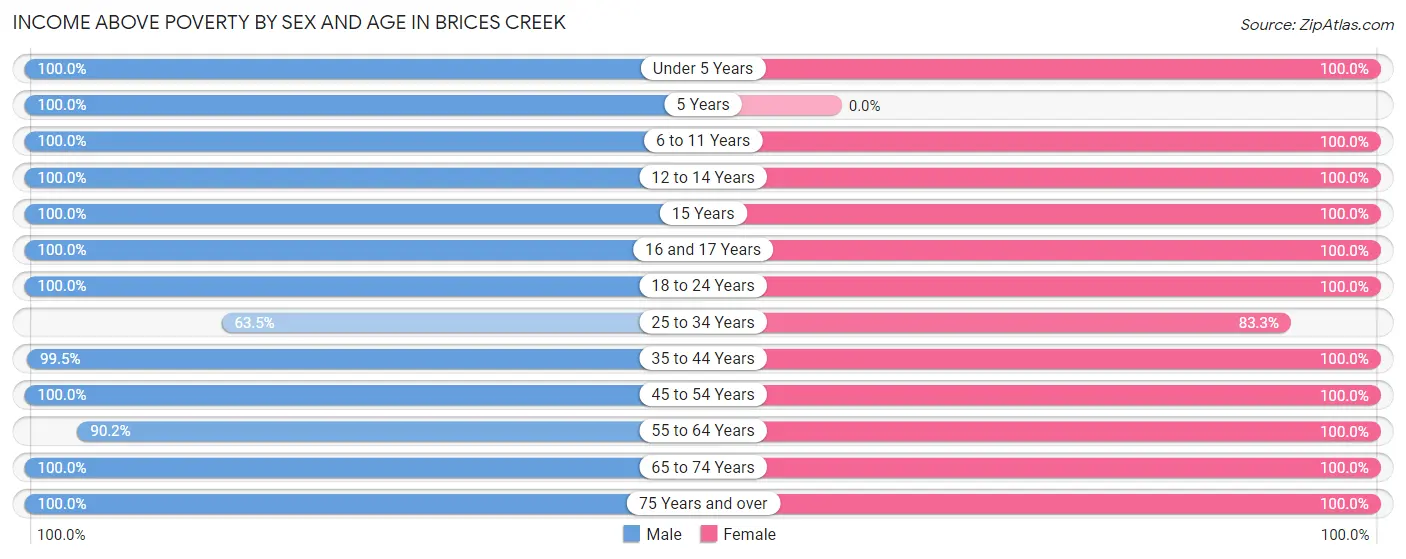
Income Above Poverty by Sex and Age in Brices Creek
According to the poverty statistics in Brices Creek, males aged under 5 years and females aged under 5 years are the age groups that are most secure financially, with 100.0% of males and 100.0% of females in these age groups living above the poverty line.
| Age Bracket | Male | Female |
| Under 5 Years | 51 (100.0%) | 89 (100.0%) |
| 5 Years | 21 (100.0%) | 0 (0.0%) |
| 6 to 11 Years | 30 (100.0%) | 142 (100.0%) |
| 12 to 14 Years | 137 (100.0%) | 70 (100.0%) |
| 15 Years | 43 (100.0%) | 23 (100.0%) |
| 16 and 17 Years | 77 (100.0%) | 130 (100.0%) |
| 18 to 24 Years | 106 (100.0%) | 60 (100.0%) |
| 25 to 34 Years | 33 (63.5%) | 130 (83.3%) |
| 35 to 44 Years | 207 (99.5%) | 219 (100.0%) |
| 45 to 54 Years | 221 (100.0%) | 274 (100.0%) |
| 55 to 64 Years | 276 (90.2%) | 366 (100.0%) |
| 65 to 74 Years | 214 (100.0%) | 239 (100.0%) |
| 75 Years and over | 186 (100.0%) | 257 (100.0%) |
| Total | 1,602 (97.0%) | 1,999 (98.7%) |
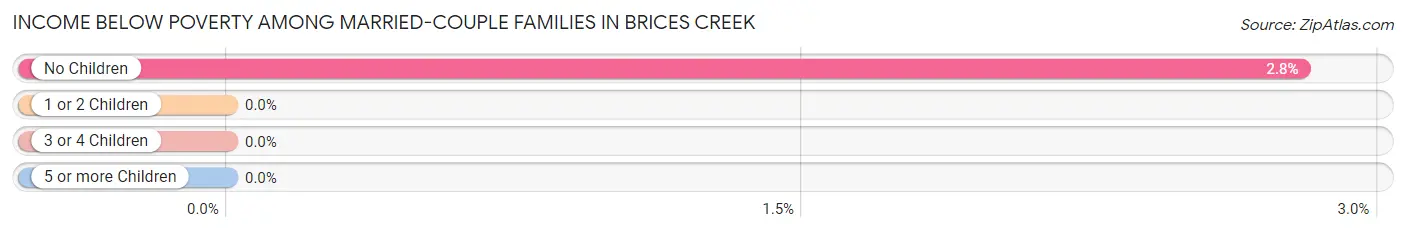
Income Below Poverty Among Married-Couple Families in Brices Creek
The poverty statistics for married-couple families in Brices Creek show that 1.9% or 19 of the total 976 families live below the poverty line. Families with no children have the highest poverty rate of 2.8%, comprising of 19 families. On the other hand, families with 1 or 2 children have the lowest poverty rate of 0.0%, which includes 0 families.
| Children | Above Poverty | Below Poverty |
| No Children | 660 (97.2%) | 19 (2.8%) |
| 1 or 2 Children | 161 (100.0%) | 0 (0.0%) |
| 3 or 4 Children | 123 (100.0%) | 0 (0.0%) |
| 5 or more Children | 13 (100.0%) | 0 (0.0%) |
| Total | 957 (98.1%) | 19 (1.9%) |
Income Below Poverty Among Single-Parent Households in Brices Creek
| Children | Single Father | Single Mother |
| No Children | 0 (0.0%) | 0 (0.0%) |
| 1 or 2 Children | 0 (0.0%) | 0 (0.0%) |
| 3 or 4 Children | 0 (0.0%) | 0 (0.0%) |
| 5 or more Children | 0 (0.0%) | 0 (0.0%) |
| Total | 0 (0.0%) | 0 (0.0%) |
Income Below Poverty Among Married-Couple vs Single-Parent Households in Brices Creek
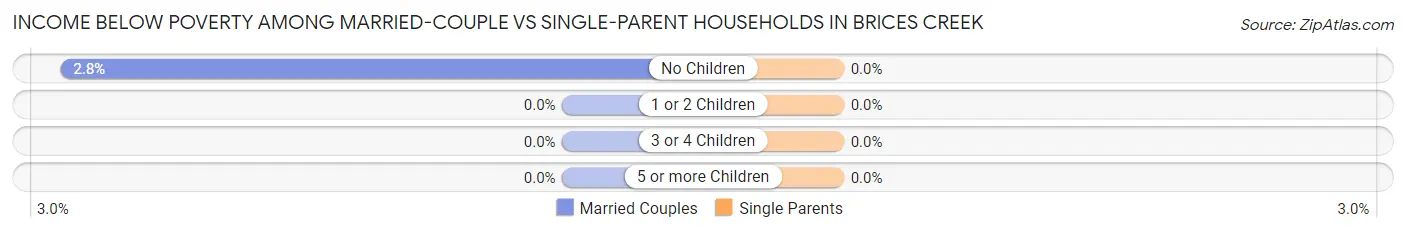
| Children | Married-Couple Families | Single-Parent Households |
| No Children | 19 (2.8%) | 0 (0.0%) |
| 1 or 2 Children | 0 (0.0%) | 0 (0.0%) |
| 3 or 4 Children | 0 (0.0%) | 0 (0.0%) |
| 5 or more Children | 0 (0.0%) | 0 (0.0%) |
| Total | 19 (1.9%) | 0 (0.0%) |
Race in Brices Creek
The most populous races in Brices Creek are White / Caucasian (3,359 | 91.3%), Black / African American (213 | 5.8%), and Hispanic or Latino (179 | 4.9%).
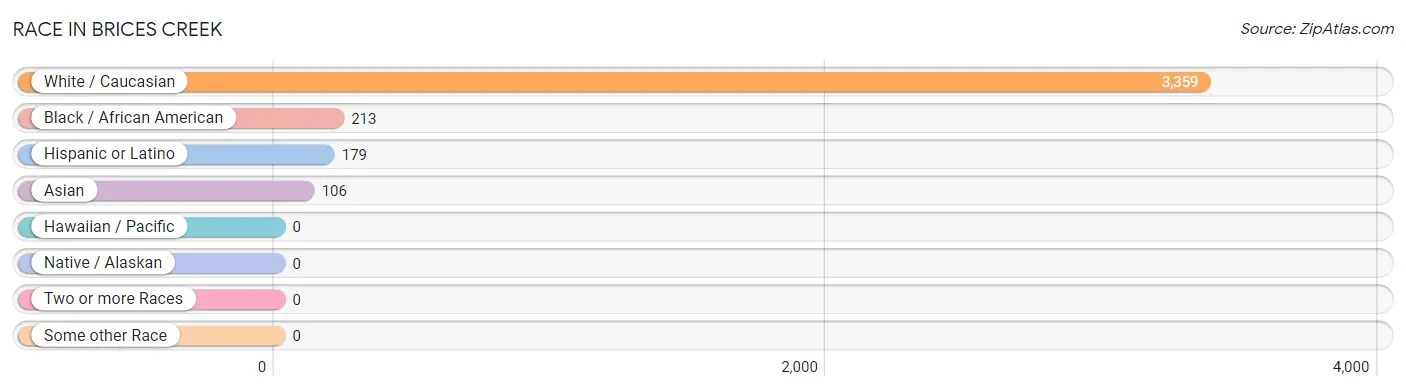
| Race | # Population | % Population |
| Asian | 106 | 2.9% |
| Black / African American | 213 | 5.8% |
| Hawaiian / Pacific | 0 | 0.0% |
| Hispanic or Latino | 179 | 4.9% |
| Native / Alaskan | 0 | 0.0% |
| White / Caucasian | 3,359 | 91.3% |
| Two or more Races | 0 | 0.0% |
| Some other Race | 0 | 0.0% |
| Total | 3,678 | 100.0% |
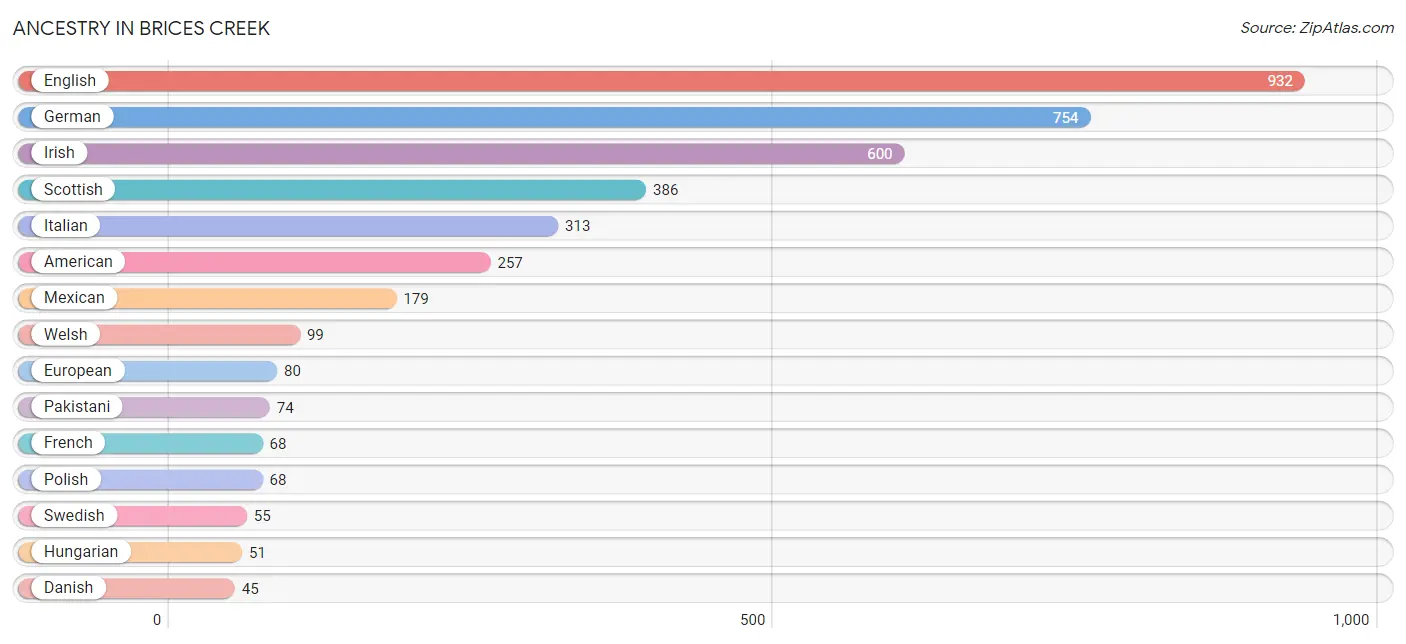
Ancestry in Brices Creek
The most populous ancestries reported in Brices Creek are English (932 | 25.3%), German (754 | 20.5%), Irish (600 | 16.3%), Scottish (386 | 10.5%), and Italian (313 | 8.5%), together accounting for 81.1% of all Brices Creek residents.
| Ancestry | # Population | % Population |
| American | 257 | 7.0% |
| British | 13 | 0.4% |
| Czech | 15 | 0.4% |
| Czechoslovakian | 30 | 0.8% |
| Danish | 45 | 1.2% |
| English | 932 | 25.3% |
| European | 80 | 2.2% |
| French | 68 | 1.8% |
| German | 754 | 20.5% |
| Hungarian | 51 | 1.4% |
| Irish | 600 | 16.3% |
| Italian | 313 | 8.5% |
| Korean | 32 | 0.9% |
| Mexican | 179 | 4.9% |
| Norwegian | 26 | 0.7% |
| Pakistani | 74 | 2.0% |
| Polish | 68 | 1.8% |
| Scandinavian | 13 | 0.4% |
| Scotch-Irish | 26 | 0.7% |
| Scottish | 386 | 10.5% |
| Serbian | 32 | 0.9% |
| Swedish | 55 | 1.5% |
| Welsh | 99 | 2.7% | View All 23 Rows |
Immigrants in Brices Creek
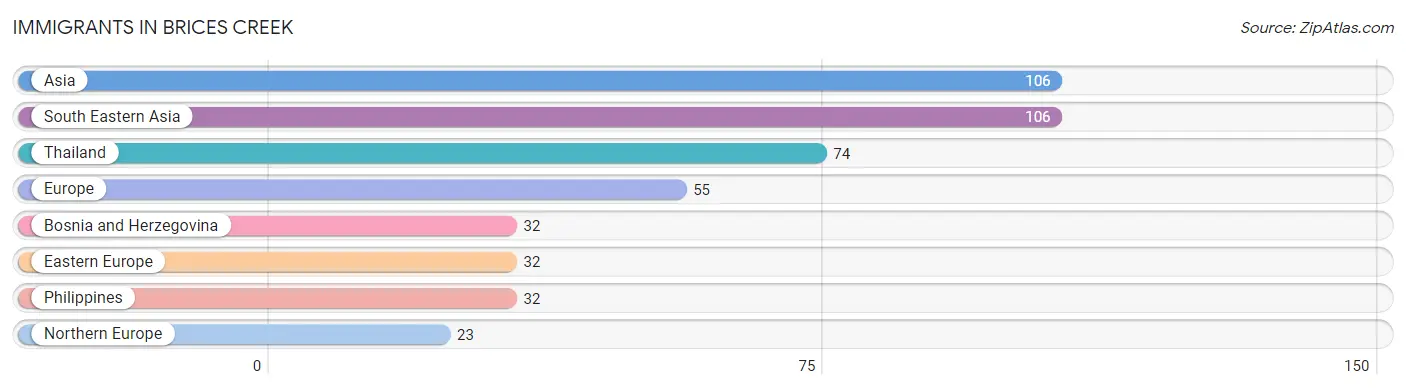
The most numerous immigrant groups reported in Brices Creek came from Asia (106 | 2.9%), South Eastern Asia (106 | 2.9%), Thailand (74 | 2.0%), Europe (55 | 1.5%), and Bosnia and Herzegovina (32 | 0.9%), together accounting for 10.1% of all Brices Creek residents.
| Immigration Origin | # Population | % Population |
| Asia | 106 | 2.9% |
| Bosnia and Herzegovina | 32 | 0.9% |
| Eastern Europe | 32 | 0.9% |
| Europe | 55 | 1.5% |
| Northern Europe | 23 | 0.6% |
| Philippines | 32 | 0.9% |
| South Eastern Asia | 106 | 2.9% |
| Thailand | 74 | 2.0% | View All 8 Rows |
Sex and Age in Brices Creek
Sex and Age in Brices Creek
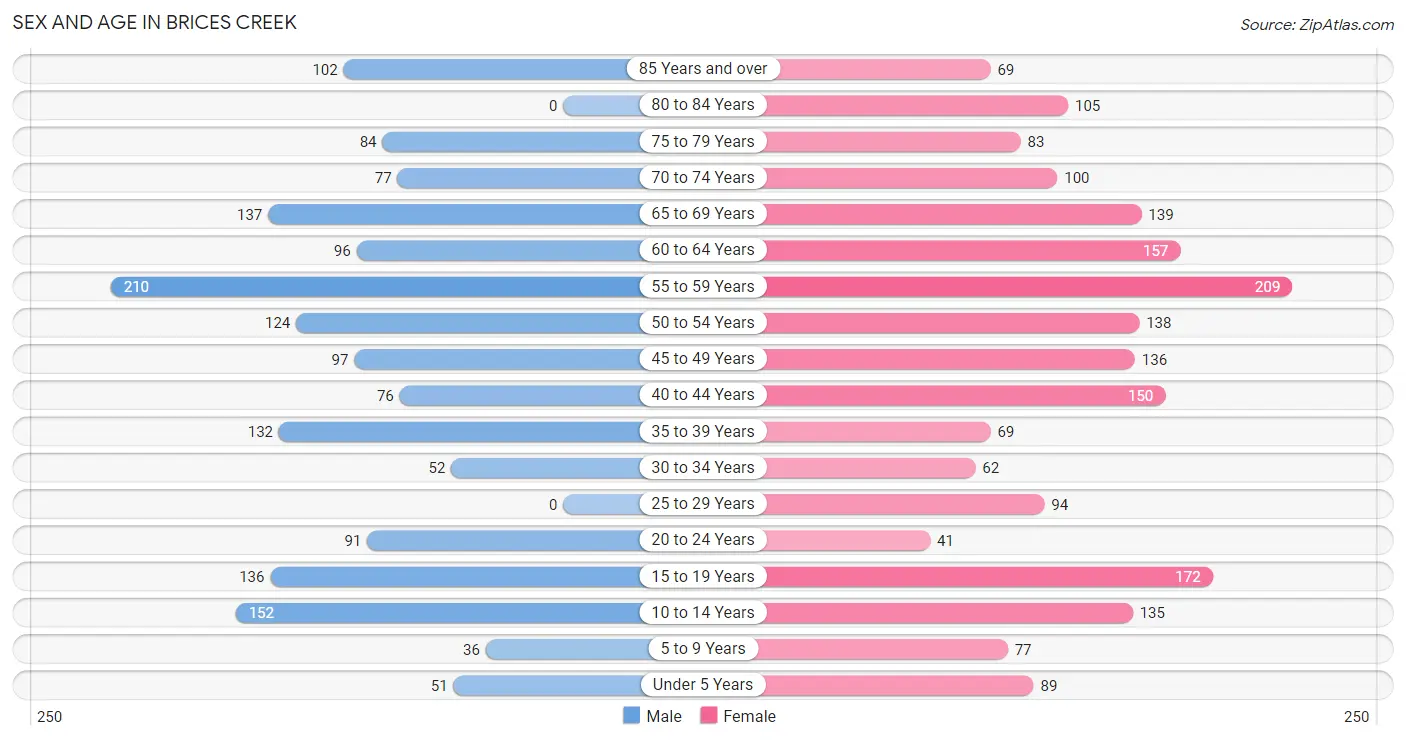
The most populous age groups in Brices Creek are 55 to 59 Years (210 | 12.7%) for men and 55 to 59 Years (209 | 10.3%) for women.
| Age Bracket | Male | Female |
| Under 5 Years | 51 (3.1%) | 89 (4.4%) |
| 5 to 9 Years | 36 (2.2%) | 77 (3.8%) |
| 10 to 14 Years | 152 (9.2%) | 135 (6.7%) |
| 15 to 19 Years | 136 (8.2%) | 172 (8.5%) |
| 20 to 24 Years | 91 (5.5%) | 41 (2.0%) |
| 25 to 29 Years | 0 (0.0%) | 94 (4.6%) |
| 30 to 34 Years | 52 (3.2%) | 62 (3.1%) |
| 35 to 39 Years | 132 (8.0%) | 69 (3.4%) |
| 40 to 44 Years | 76 (4.6%) | 150 (7.4%) |
| 45 to 49 Years | 97 (5.9%) | 136 (6.7%) |
| 50 to 54 Years | 124 (7.5%) | 138 (6.8%) |
| 55 to 59 Years | 210 (12.7%) | 209 (10.3%) |
| 60 to 64 Years | 96 (5.8%) | 157 (7.7%) |
| 65 to 69 Years | 137 (8.3%) | 139 (6.9%) |
| 70 to 74 Years | 77 (4.7%) | 100 (4.9%) |
| 75 to 79 Years | 84 (5.1%) | 83 (4.1%) |
| 80 to 84 Years | 0 (0.0%) | 105 (5.2%) |
| 85 Years and over | 102 (6.2%) | 69 (3.4%) |
| Total | 1,653 (100.0%) | 2,025 (100.0%) |
Families and Households in Brices Creek
Median Family Size in Brices Creek
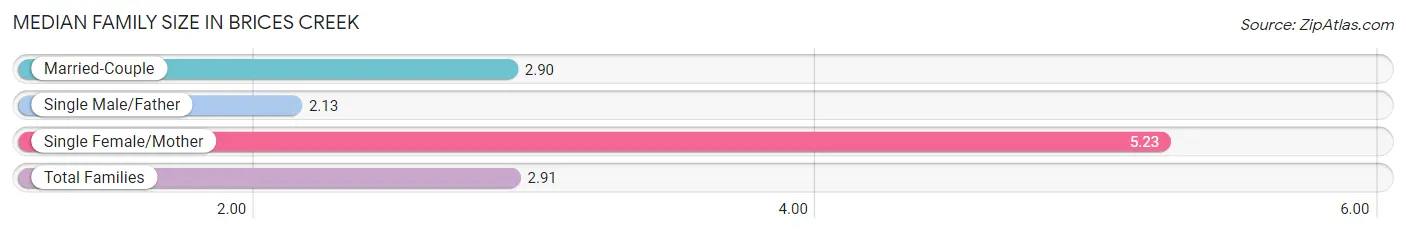
The median family size in Brices Creek is 2.91 persons per family, with single female/mother families (48 | 4.2%) accounting for the largest median family size of 5.23 persons per family. On the other hand, single male/father families (120 | 10.5%) represent the smallest median family size with 2.13 persons per family.
| Family Type | # Families | Family Size |
| Married-Couple | 976 (85.3%) | 2.90 |
| Single Male/Father | 120 (10.5%) | 2.13 |
| Single Female/Mother | 48 (4.2%) | 5.23 |
| Total Families | 1,144 (100.0%) | 2.91 |
Median Household Size in Brices Creek
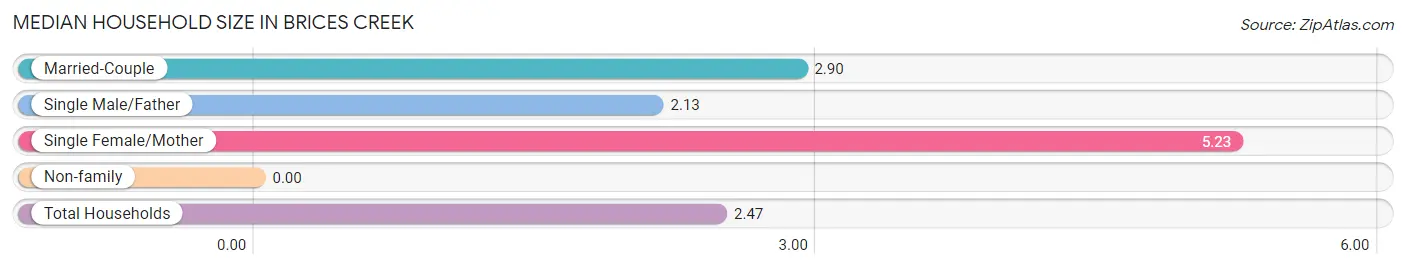
| Household Type | # Households | Household Size |
| Married-Couple | 976 (65.7%) | 2.90 |
| Single Male/Father | 120 (8.1%) | 2.13 |
| Single Female/Mother | 48 (3.2%) | 5.23 |
| Non-family | 341 (23.0%) | - |
| Total Households | 1,485 (100.0%) | 2.47 |
Household Size by Marriage Status in Brices Creek
Out of a total of 1,485 households in Brices Creek, 1,144 (77.0%) are family households, while 341 (23.0%) are nonfamily households. The most numerous type of family households are 2-person households, comprising 692, and the most common type of nonfamily households are 1-person households, comprising 341.
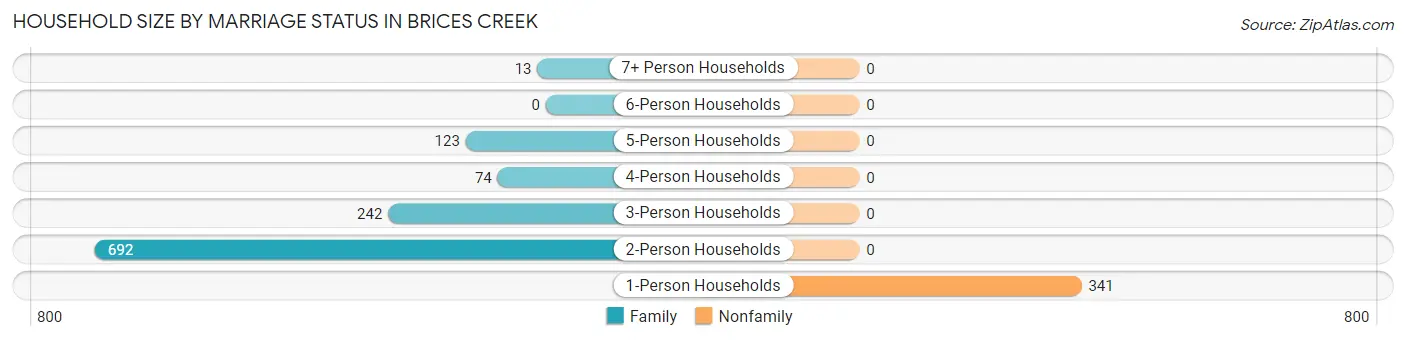
| Household Size | Family Households | Nonfamily Households |
| 1-Person Households | - | 341 (23.0%) |
| 2-Person Households | 692 (46.6%) | 0 (0.0%) |
| 3-Person Households | 242 (16.3%) | 0 (0.0%) |
| 4-Person Households | 74 (5.0%) | 0 (0.0%) |
| 5-Person Households | 123 (8.3%) | 0 (0.0%) |
| 6-Person Households | 0 (0.0%) | 0 (0.0%) |
| 7+ Person Households | 13 (0.9%) | 0 (0.0%) |
| Total | 1,144 (77.0%) | 341 (23.0%) |
Female Fertility in Brices Creek
Fertility by Age in Brices Creek
| Age Bracket | Women with Births | Births / 1,000 Women |
| 15 to 19 years | 0 (0.0%) | 0.0 |
| 20 to 34 years | 0 (0.0%) | 0.0 |
| 35 to 50 years | 0 (0.0%) | 0.0 |
| Total | 0 (0.0%) | 0.0 |
Fertility by Age by Marriage Status in Brices Creek
| Age Bracket | Married | Unmarried |
| 15 to 19 years | 0 (0.0%) | 0 (0.0%) |
| 20 to 34 years | 0 (0.0%) | 0 (0.0%) |
| 35 to 50 years | 0 (0.0%) | 0 (0.0%) |
| Total | 0 (0.0%) | 0 (0.0%) |
Fertility by Education in Brices Creek
| Educational Attainment | Women with Births | Births / 1,000 Women |
| Less than High School | 0 (0.0%) | 0.0 |
| High School Diploma | 0 (0.0%) | 0.0 |
| College or Associate's Degree | 0 (0.0%) | 0.0 |
| Bachelor's Degree | 0 (0.0%) | 0.0 |
| Graduate Degree | 0 (0.0%) | 0.0 |
| Total | 0 (0.0%) | 0.0 |
Fertility by Education by Marriage Status in Brices Creek
| Educational Attainment | Married | Unmarried |
| Less than High School | 0 (0.0%) | 0 (0.0%) |
| High School Diploma | 0 (0.0%) | 0 (0.0%) |
| College or Associate's Degree | 0 (0.0%) | 0 (0.0%) |
| Bachelor's Degree | 0 (0.0%) | 0 (0.0%) |
| Graduate Degree | 0 (0.0%) | 0 (0.0%) |
| Total | 0 (0.0%) | 0 (0.0%) |
Employment Characteristics in Brices Creek
Employment by Class of Employer in Brices Creek
Among the 1,716 employed individuals in Brices Creek, private company employees (795 | 46.3%), local government employees (268 | 15.6%), and federal government employees (226 | 13.2%) make up the most common classes of employment.
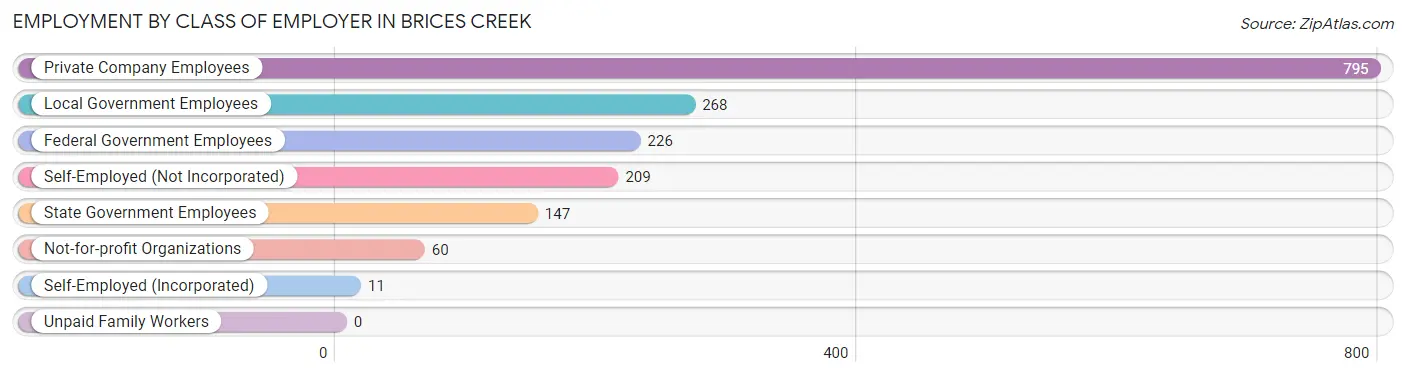
| Employer Class | # Employees | % Employees |
| Private Company Employees | 795 | 46.3% |
| Self-Employed (Incorporated) | 11 | 0.6% |
| Self-Employed (Not Incorporated) | 209 | 12.2% |
| Not-for-profit Organizations | 60 | 3.5% |
| Local Government Employees | 268 | 15.6% |
| State Government Employees | 147 | 8.6% |
| Federal Government Employees | 226 | 13.2% |
| Unpaid Family Workers | 0 | 0.0% |
| Total | 1,716 | 100.0% |
Employment Status by Age in Brices Creek
According to the labor force statistics for Brices Creek, out of the total population over 16 years of age (3,072), 56.5% or 1,736 individuals are in the labor force, with 1.1% or 19 of them unemployed. The age group with the highest labor force participation rate is 20 to 24 years, with 100.0% or 132 individuals in the labor force. Within the labor force, the 16 to 19 years age range has the highest percentage of unemployed individuals, with 11.8% or 19 of them being unemployed.
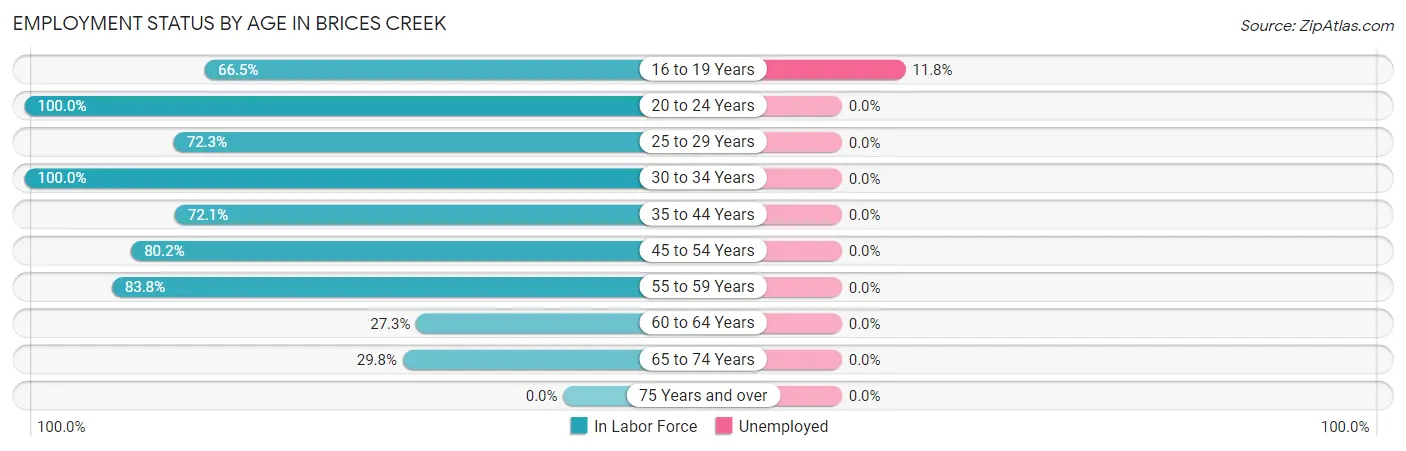
| Age Bracket | In Labor Force | Unemployed |
| 16 to 19 Years | 161 (66.5%) | 19 (11.8%) |
| 20 to 24 Years | 132 (100.0%) | 0 (0.0%) |
| 25 to 29 Years | 68 (72.3%) | 0 (0.0%) |
| 30 to 34 Years | 114 (100.0%) | 0 (0.0%) |
| 35 to 44 Years | 308 (72.1%) | 0 (0.0%) |
| 45 to 54 Years | 397 (80.2%) | 0 (0.0%) |
| 55 to 59 Years | 351 (83.8%) | 0 (0.0%) |
| 60 to 64 Years | 69 (27.3%) | 0 (0.0%) |
| 65 to 74 Years | 135 (29.8%) | 0 (0.0%) |
| 75 Years and over | 0 (0.0%) | 0 (0.0%) |
| Total | 1,736 (56.5%) | 19 (1.1%) |
Employment Status by Educational Attainment in Brices Creek
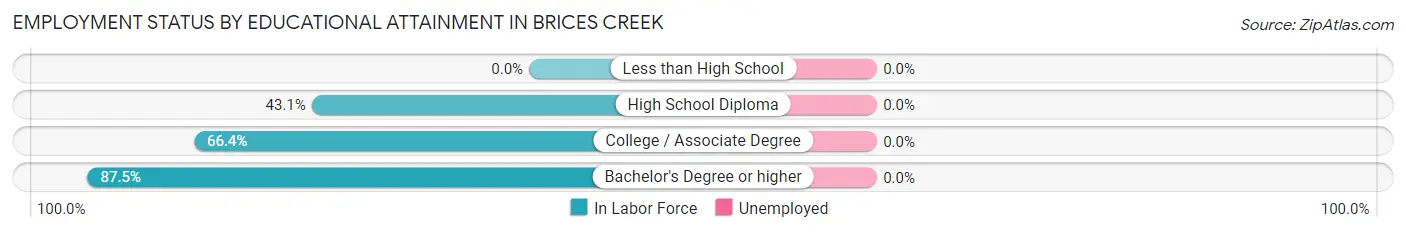
| Educational Attainment | In Labor Force | Unemployed |
| Less than High School | 0 (0.0%) | 0 (0.0%) |
| High School Diploma | 93 (43.1%) | 0 (0.0%) |
| College / Associate Degree | 546 (66.4%) | 0 (0.0%) |
| Bachelor's Degree or higher | 668 (87.5%) | 0 (0.0%) |
| Total | 1,306 (72.5%) | 0 (0.0%) |
Employment Occupations by Sex in Brices Creek
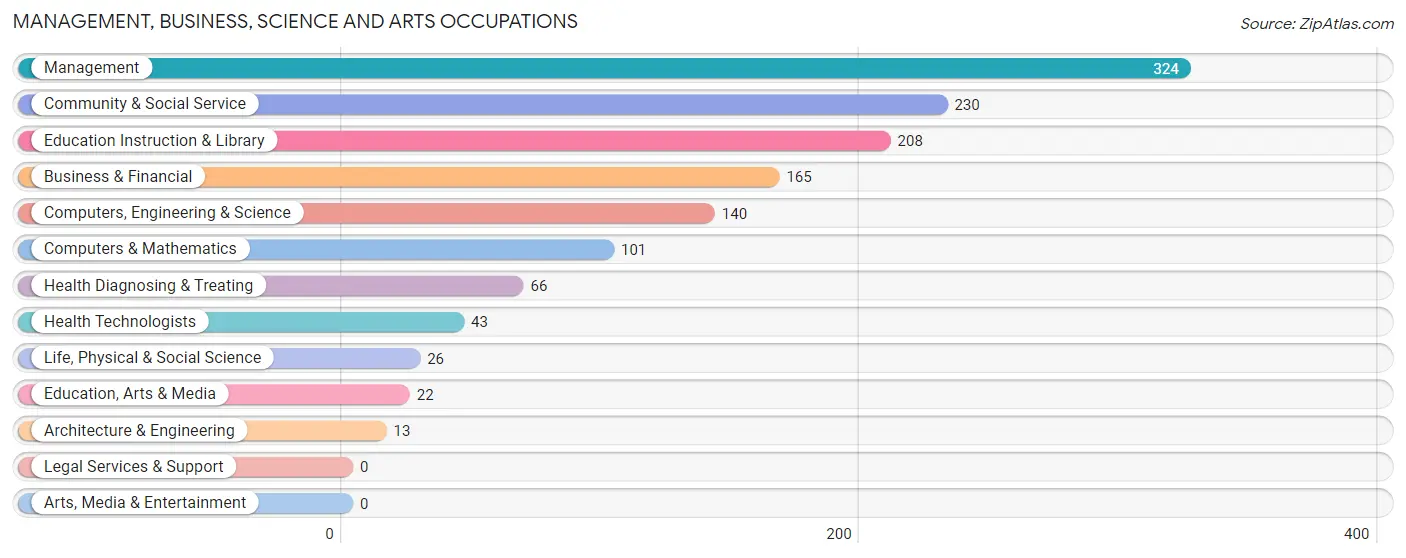
Management, Business, Science and Arts Occupations
The most common Management, Business, Science and Arts occupations in Brices Creek are Management (324 | 19.2%), Community & Social Service (230 | 13.6%), Education Instruction & Library (208 | 12.3%), Business & Financial (165 | 9.8%), and Computers, Engineering & Science (140 | 8.3%).
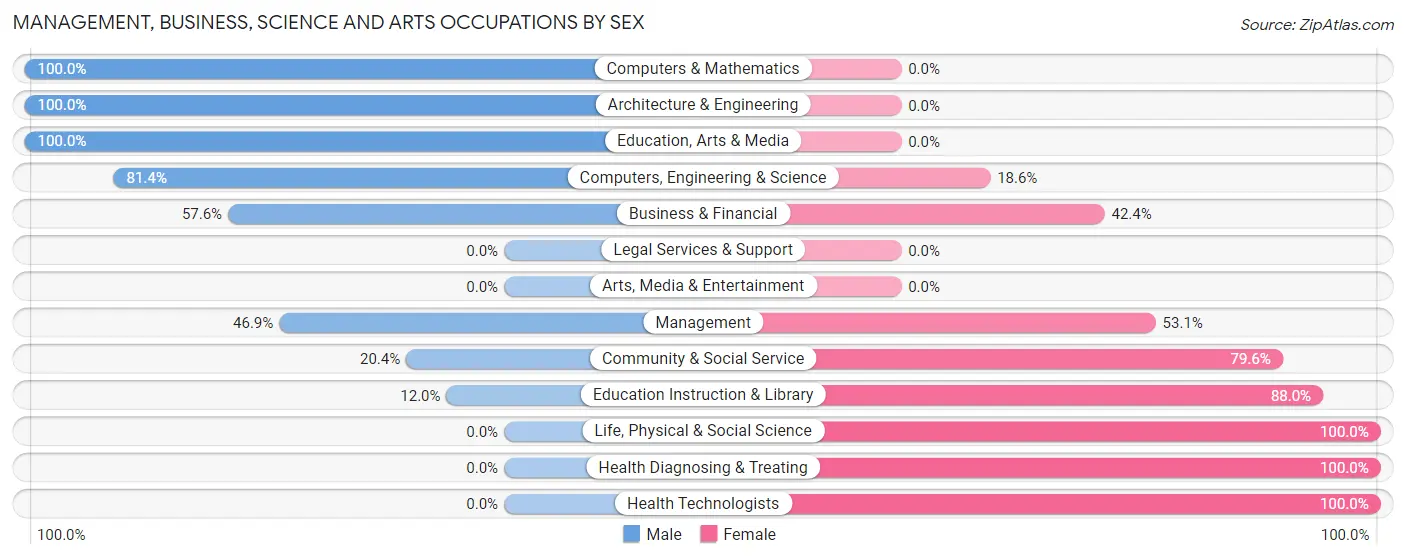
Management, Business, Science and Arts Occupations by Sex
Within the Management, Business, Science and Arts occupations in Brices Creek, the most male-oriented occupations are Computers & Mathematics (100.0%), Architecture & Engineering (100.0%), and Education, Arts & Media (100.0%), while the most female-oriented occupations are Life, Physical & Social Science (100.0%), Health Diagnosing & Treating (100.0%), and Health Technologists (100.0%).
| Occupation | Male | Female |
| Management | 152 (46.9%) | 172 (53.1%) |
| Business & Financial | 95 (57.6%) | 70 (42.4%) |
| Computers, Engineering & Science | 114 (81.4%) | 26 (18.6%) |
| Computers & Mathematics | 101 (100.0%) | 0 (0.0%) |
| Architecture & Engineering | 13 (100.0%) | 0 (0.0%) |
| Life, Physical & Social Science | 0 (0.0%) | 26 (100.0%) |
| Community & Social Service | 47 (20.4%) | 183 (79.6%) |
| Education, Arts & Media | 22 (100.0%) | 0 (0.0%) |
| Legal Services & Support | 0 (0.0%) | 0 (0.0%) |
| Education Instruction & Library | 25 (12.0%) | 183 (88.0%) |
| Arts, Media & Entertainment | 0 (0.0%) | 0 (0.0%) |
| Health Diagnosing & Treating | 0 (0.0%) | 66 (100.0%) |
| Health Technologists | 0 (0.0%) | 43 (100.0%) |
| Total (Category) | 408 (44.1%) | 517 (55.9%) |
| Total (Overall) | 863 (51.2%) | 824 (48.8%) |
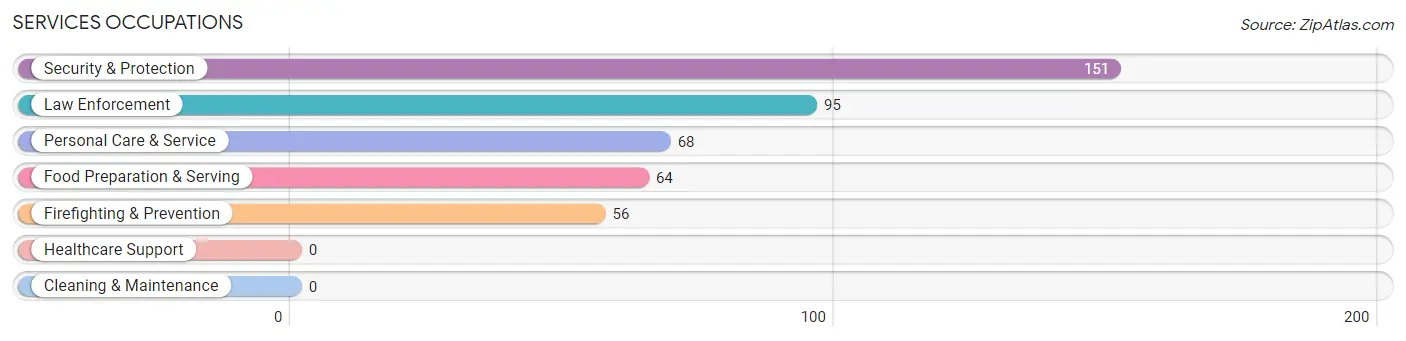
Services Occupations
The most common Services occupations in Brices Creek are Security & Protection (151 | 8.9%), Law Enforcement (95 | 5.6%), Personal Care & Service (68 | 4.0%), Food Preparation & Serving (64 | 3.8%), and Firefighting & Prevention (56 | 3.3%).
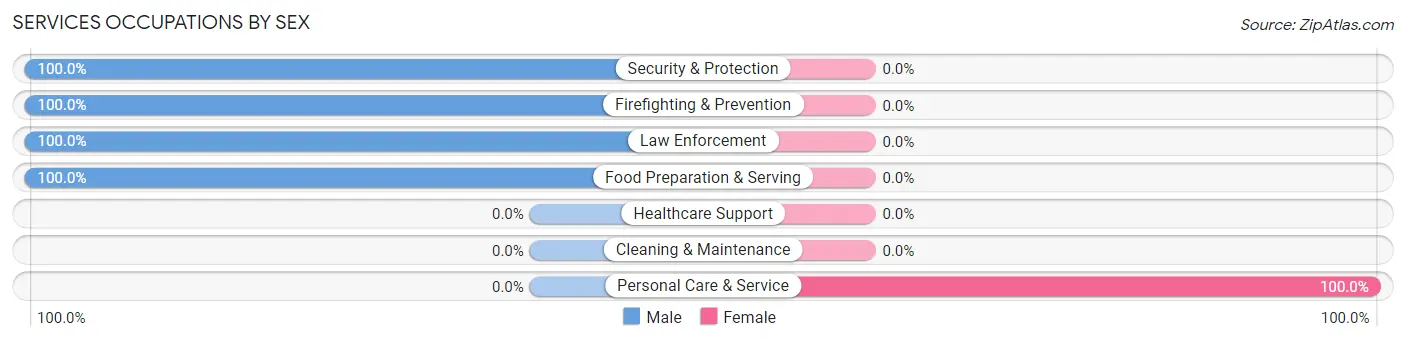
Services Occupations by Sex
| Occupation | Male | Female |
| Healthcare Support | 0 (0.0%) | 0 (0.0%) |
| Security & Protection | 151 (100.0%) | 0 (0.0%) |
| Firefighting & Prevention | 56 (100.0%) | 0 (0.0%) |
| Law Enforcement | 95 (100.0%) | 0 (0.0%) |
| Food Preparation & Serving | 64 (100.0%) | 0 (0.0%) |
| Cleaning & Maintenance | 0 (0.0%) | 0 (0.0%) |
| Personal Care & Service | 0 (0.0%) | 68 (100.0%) |
| Total (Category) | 215 (76.0%) | 68 (24.0%) |
| Total (Overall) | 863 (51.2%) | 824 (48.8%) |
Sales and Office Occupations
The most common Sales and Office occupations in Brices Creek are Office & Administration (137 | 8.1%), and Sales & Related (110 | 6.5%).
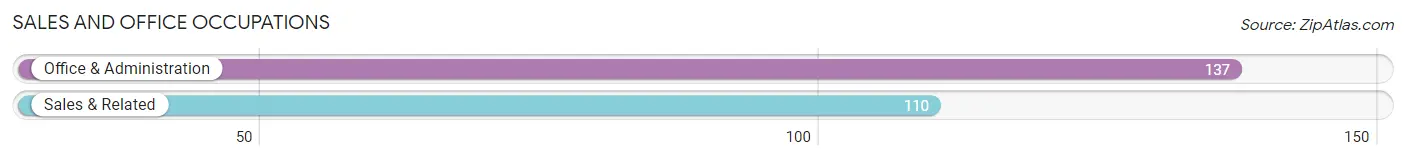
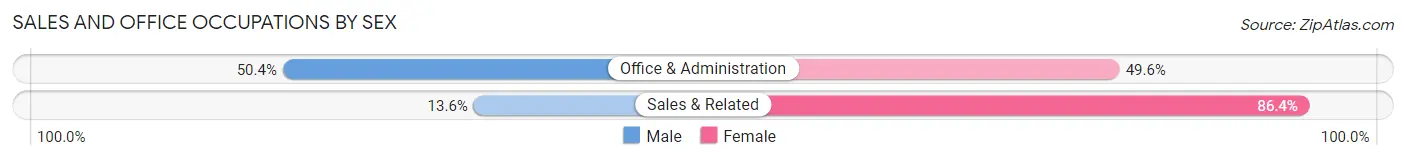
Sales and Office Occupations by Sex
| Occupation | Male | Female |
| Sales & Related | 15 (13.6%) | 95 (86.4%) |
| Office & Administration | 69 (50.4%) | 68 (49.6%) |
| Total (Category) | 84 (34.0%) | 163 (66.0%) |
| Total (Overall) | 863 (51.2%) | 824 (48.8%) |
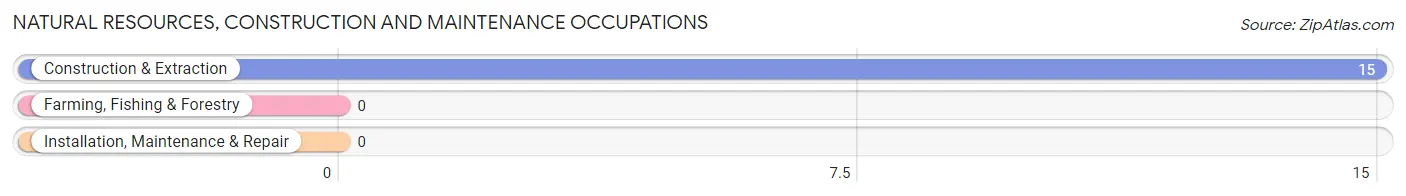
Natural Resources, Construction and Maintenance Occupations
The most common Natural Resources, Construction and Maintenance occupations in Brices Creek are , and Construction & Extraction (15 | 0.9%).
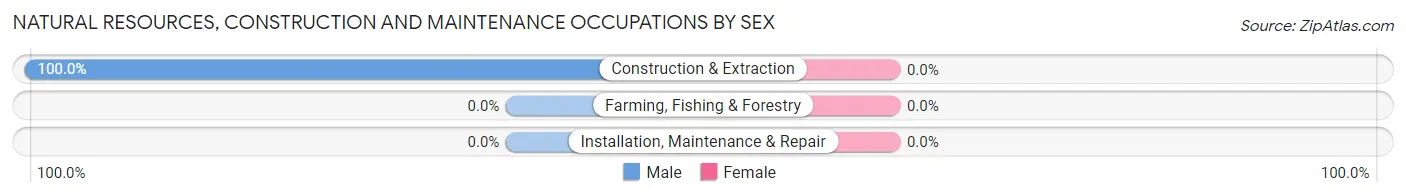
Natural Resources, Construction and Maintenance Occupations by Sex
| Occupation | Male | Female |
| Farming, Fishing & Forestry | 0 (0.0%) | 0 (0.0%) |
| Construction & Extraction | 15 (100.0%) | 0 (0.0%) |
| Installation, Maintenance & Repair | 0 (0.0%) | 0 (0.0%) |
| Total (Category) | 15 (100.0%) | 0 (0.0%) |
| Total (Overall) | 863 (51.2%) | 824 (48.8%) |
Production, Transportation and Moving Occupations
The most common Production, Transportation and Moving occupations in Brices Creek are Production (102 | 6.0%), Material Moving (88 | 5.2%), and Transportation (27 | 1.6%).
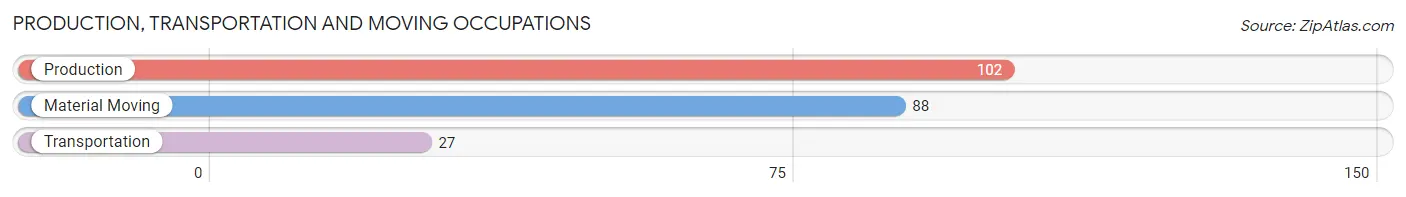
Production, Transportation and Moving Occupations by Sex
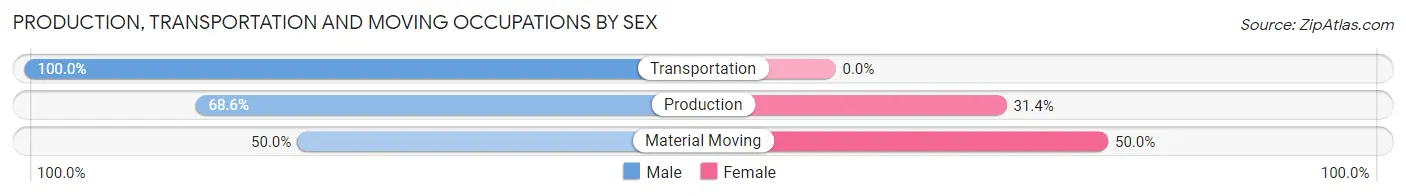
| Occupation | Male | Female |
| Production | 70 (68.6%) | 32 (31.4%) |
| Transportation | 27 (100.0%) | 0 (0.0%) |
| Material Moving | 44 (50.0%) | 44 (50.0%) |
| Total (Category) | 141 (65.0%) | 76 (35.0%) |
| Total (Overall) | 863 (51.2%) | 824 (48.8%) |
Employment Industries by Sex in Brices Creek
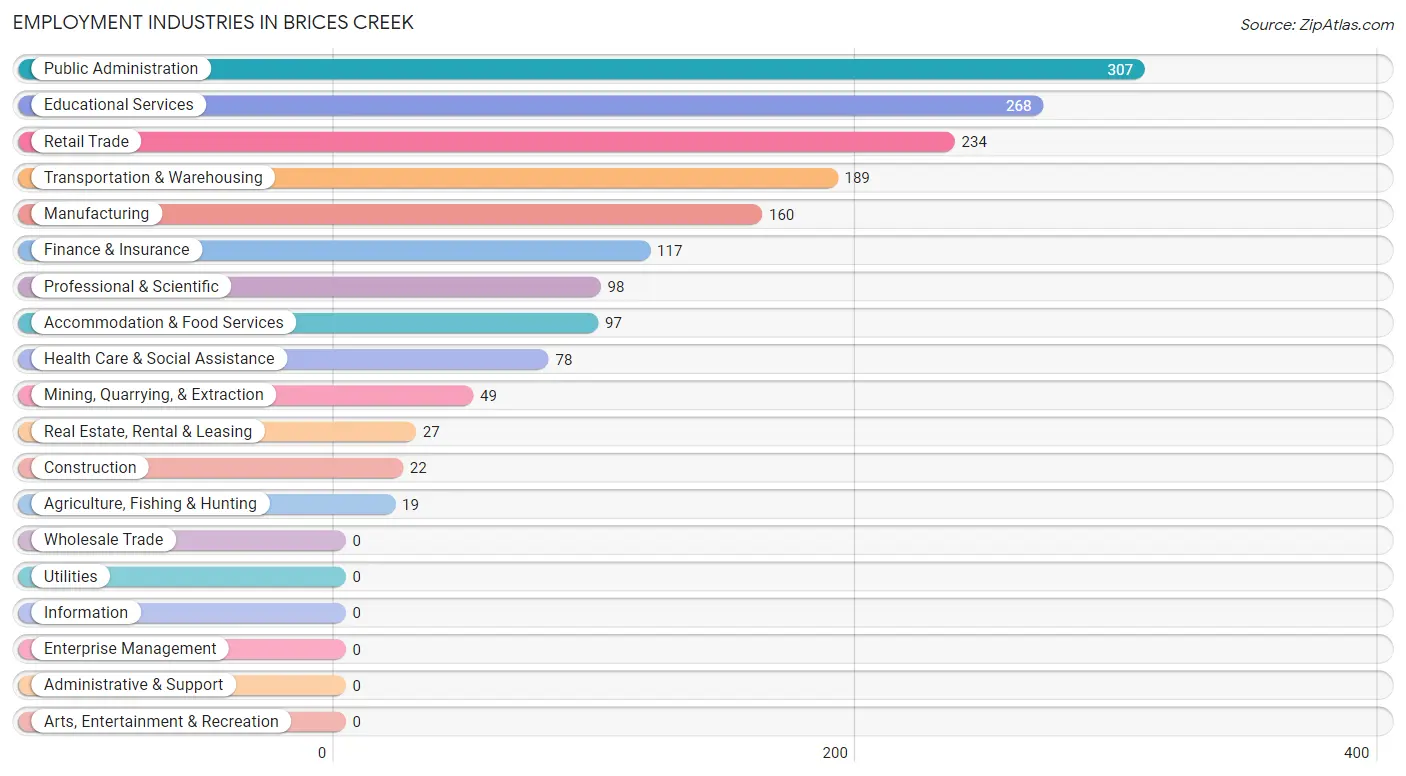
Employment Industries in Brices Creek
The major employment industries in Brices Creek include Public Administration (307 | 18.2%), Educational Services (268 | 15.9%), Retail Trade (234 | 13.9%), Transportation & Warehousing (189 | 11.2%), and Manufacturing (160 | 9.5%).
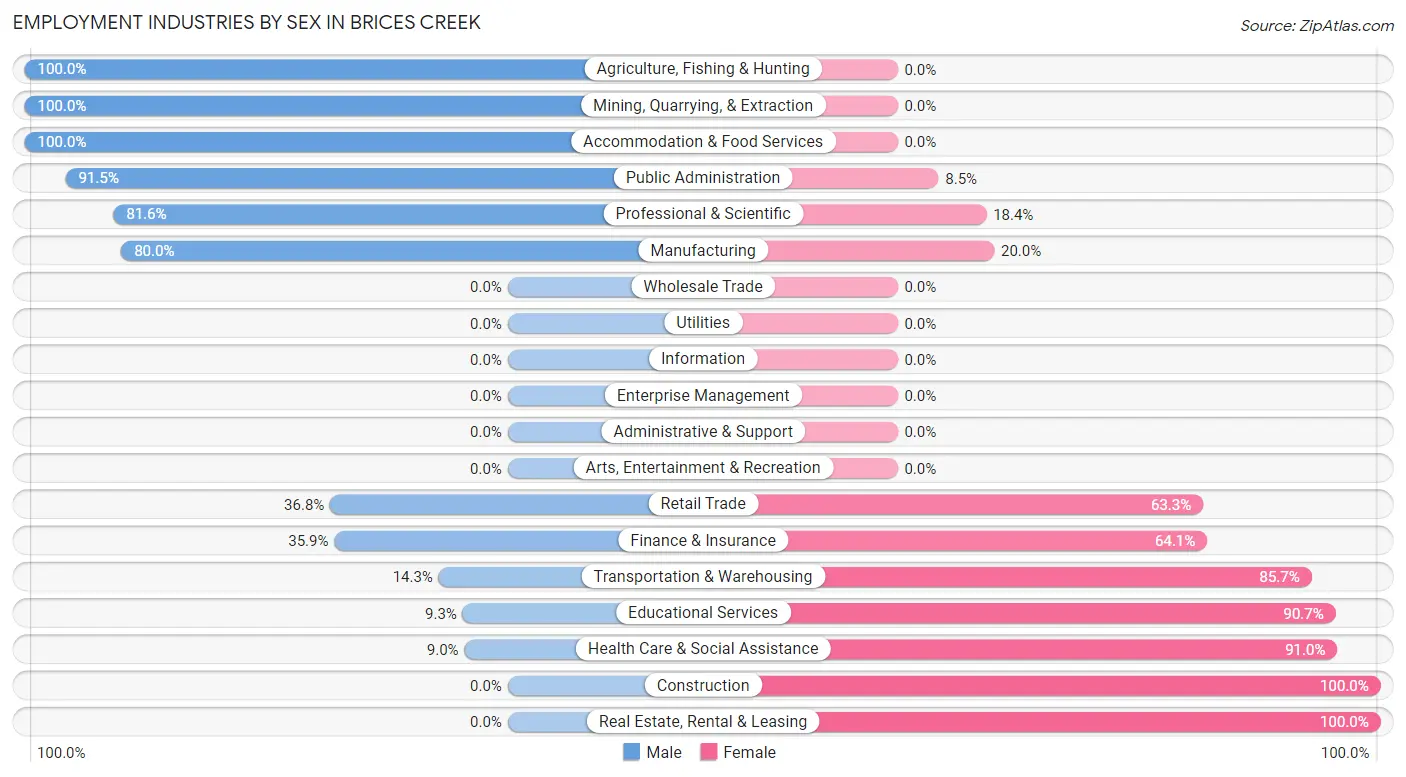
Employment Industries by Sex in Brices Creek
The Brices Creek industries that see more men than women are Agriculture, Fishing & Hunting (100.0%), Mining, Quarrying, & Extraction (100.0%), and Accommodation & Food Services (100.0%), whereas the industries that tend to have a higher number of women are Construction (100.0%), Real Estate, Rental & Leasing (100.0%), and Health Care & Social Assistance (91.0%).
| Industry | Male | Female |
| Agriculture, Fishing & Hunting | 19 (100.0%) | 0 (0.0%) |
| Mining, Quarrying, & Extraction | 49 (100.0%) | 0 (0.0%) |
| Construction | 0 (0.0%) | 22 (100.0%) |
| Manufacturing | 128 (80.0%) | 32 (20.0%) |
| Wholesale Trade | 0 (0.0%) | 0 (0.0%) |
| Retail Trade | 86 (36.7%) | 148 (63.2%) |
| Transportation & Warehousing | 27 (14.3%) | 162 (85.7%) |
| Utilities | 0 (0.0%) | 0 (0.0%) |
| Information | 0 (0.0%) | 0 (0.0%) |
| Finance & Insurance | 42 (35.9%) | 75 (64.1%) |
| Real Estate, Rental & Leasing | 0 (0.0%) | 27 (100.0%) |
| Professional & Scientific | 80 (81.6%) | 18 (18.4%) |
| Enterprise Management | 0 (0.0%) | 0 (0.0%) |
| Administrative & Support | 0 (0.0%) | 0 (0.0%) |
| Educational Services | 25 (9.3%) | 243 (90.7%) |
| Health Care & Social Assistance | 7 (9.0%) | 71 (91.0%) |
| Arts, Entertainment & Recreation | 0 (0.0%) | 0 (0.0%) |
| Accommodation & Food Services | 97 (100.0%) | 0 (0.0%) |
| Public Administration | 281 (91.5%) | 26 (8.5%) |
| Total | 863 (51.2%) | 824 (48.8%) |
Education in Brices Creek
School Enrollment in Brices Creek
The most common levels of schooling among the 896 students in Brices Creek are middle school (222 | 24.8%), college / undergraduate (206 | 23.0%), and high school (179 | 20.0%).
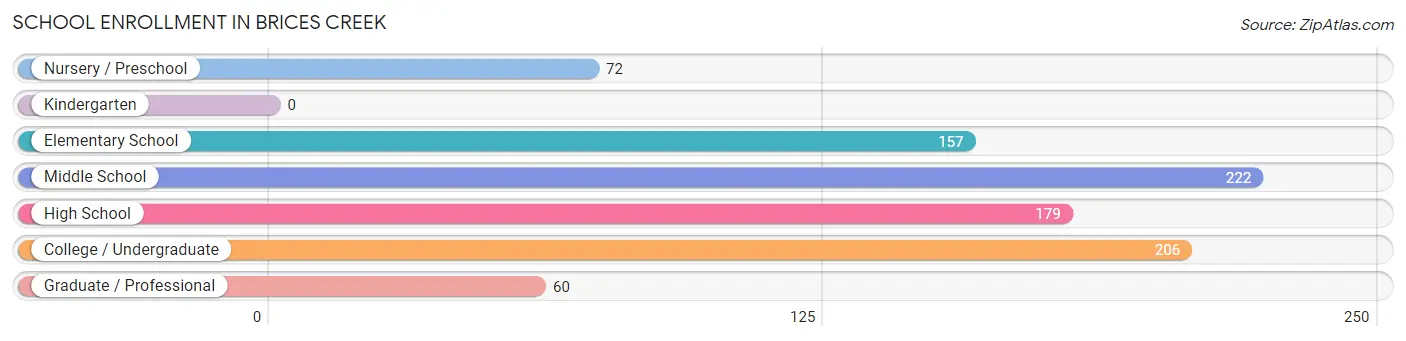
| School Level | # Students | % Students |
| Nursery / Preschool | 72 | 8.0% |
| Kindergarten | 0 | 0.0% |
| Elementary School | 157 | 17.5% |
| Middle School | 222 | 24.8% |
| High School | 179 | 20.0% |
| College / Undergraduate | 206 | 23.0% |
| Graduate / Professional | 60 | 6.7% |
| Total | 896 | 100.0% |
School Enrollment by Age by Funding Source in Brices Creek
Out of a total of 896 students who are enrolled in schools in Brices Creek, 219 (24.4%) attend a private institution, while the remaining 677 (75.6%) are enrolled in public schools. The age group of 3 to 4 year olds has the highest likelihood of being enrolled in private schools, with 37 (72.6% in the age bracket) enrolled. Conversely, the age group of 5 to 9 year old has the lowest likelihood of being enrolled in a private school, with 113 (100.0% in the age bracket) attending a public institution.
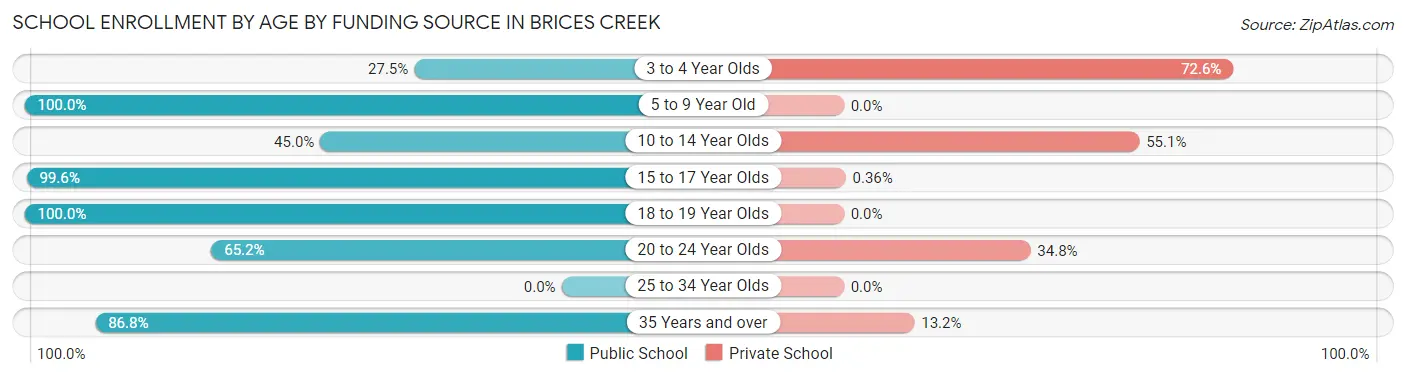
| Age Bracket | Public School | Private School |
| 3 to 4 Year Olds | 14 (27.5%) | 37 (72.6%) |
| 5 to 9 Year Old | 113 (100.0%) | 0 (0.0%) |
| 10 to 14 Year Olds | 129 (45.0%) | 158 (55.0%) |
| 15 to 17 Year Olds | 273 (99.6%) | 1 (0.4%) |
| 18 to 19 Year Olds | 34 (100.0%) | 0 (0.0%) |
| 20 to 24 Year Olds | 15 (65.2%) | 8 (34.8%) |
| 25 to 34 Year Olds | 0 (0.0%) | 0 (0.0%) |
| 35 Years and over | 99 (86.8%) | 15 (13.2%) |
| Total | 677 (75.6%) | 219 (24.4%) |
Educational Attainment by Field of Study in Brices Creek
Science & technology (180 | 17.4%), business (169 | 16.3%), liberal arts & history (160 | 15.4%), education (152 | 14.7%), and engineering (120 | 11.6%) are the most common fields of study among 1,037 individuals in Brices Creek who have obtained a bachelor's degree or higher.
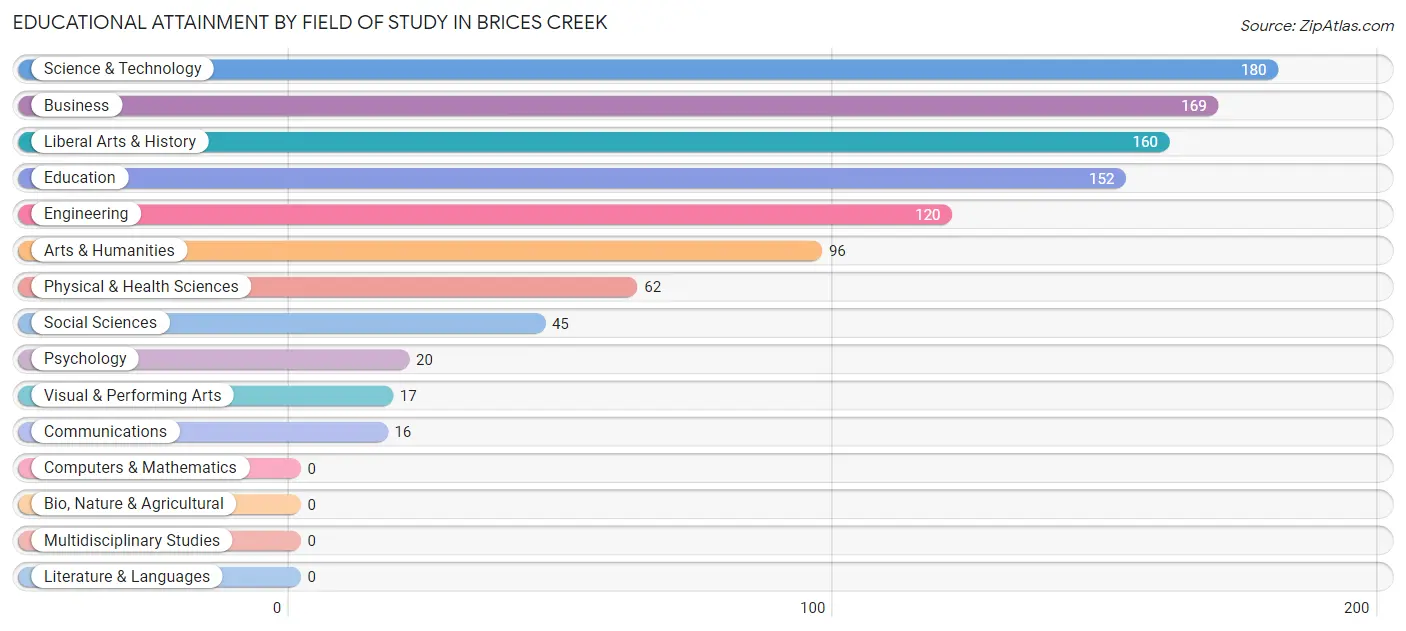
| Field of Study | # Graduates | % Graduates |
| Computers & Mathematics | 0 | 0.0% |
| Bio, Nature & Agricultural | 0 | 0.0% |
| Physical & Health Sciences | 62 | 6.0% |
| Psychology | 20 | 1.9% |
| Social Sciences | 45 | 4.3% |
| Engineering | 120 | 11.6% |
| Multidisciplinary Studies | 0 | 0.0% |
| Science & Technology | 180 | 17.4% |
| Business | 169 | 16.3% |
| Education | 152 | 14.7% |
| Literature & Languages | 0 | 0.0% |
| Liberal Arts & History | 160 | 15.4% |
| Visual & Performing Arts | 17 | 1.6% |
| Communications | 16 | 1.5% |
| Arts & Humanities | 96 | 9.3% |
| Total | 1,037 | 100.0% |
Transportation & Commute in Brices Creek
Vehicle Availability by Sex in Brices Creek
The most prevalent vehicle ownership categories in Brices Creek are males with 4 vehicles (290, accounting for 32.5%) and females with 4 vehicles (223, making up 35.2%).
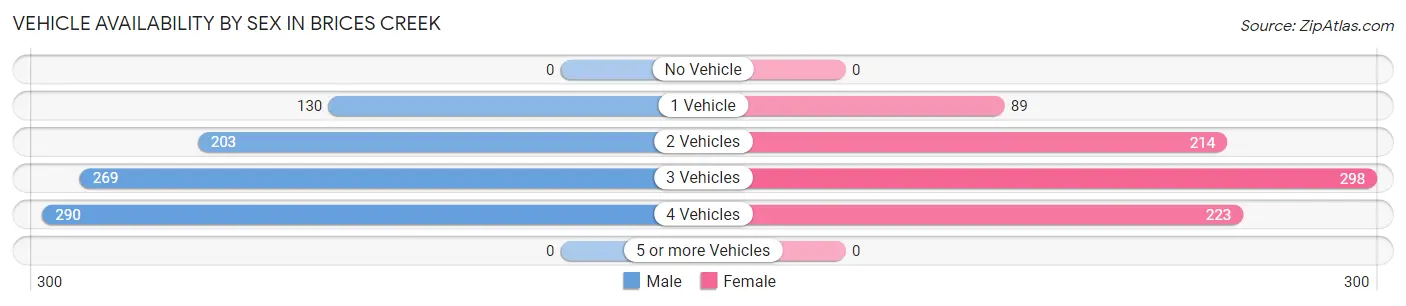
| Vehicles Available | Male | Female |
| No Vehicle | 0 (0.0%) | 0 (0.0%) |
| 1 Vehicle | 130 (14.6%) | 89 (10.8%) |
| 2 Vehicles | 203 (22.8%) | 214 (26.0%) |
| 3 Vehicles | 269 (30.2%) | 298 (36.2%) |
| 4 Vehicles | 290 (32.5%) | 223 (27.1%) |
| 5 or more Vehicles | 0 (0.0%) | 0 (0.0%) |
| Total | 892 (100.0%) | 824 (100.0%) |
Commute Time in Brices Creek
The most frequently occuring commute durations in Brices Creek are 15 to 19 minutes (320 commuters, 24.1%), 20 to 24 minutes (242 commuters, 18.2%), and 10 to 14 minutes (193 commuters, 14.5%).
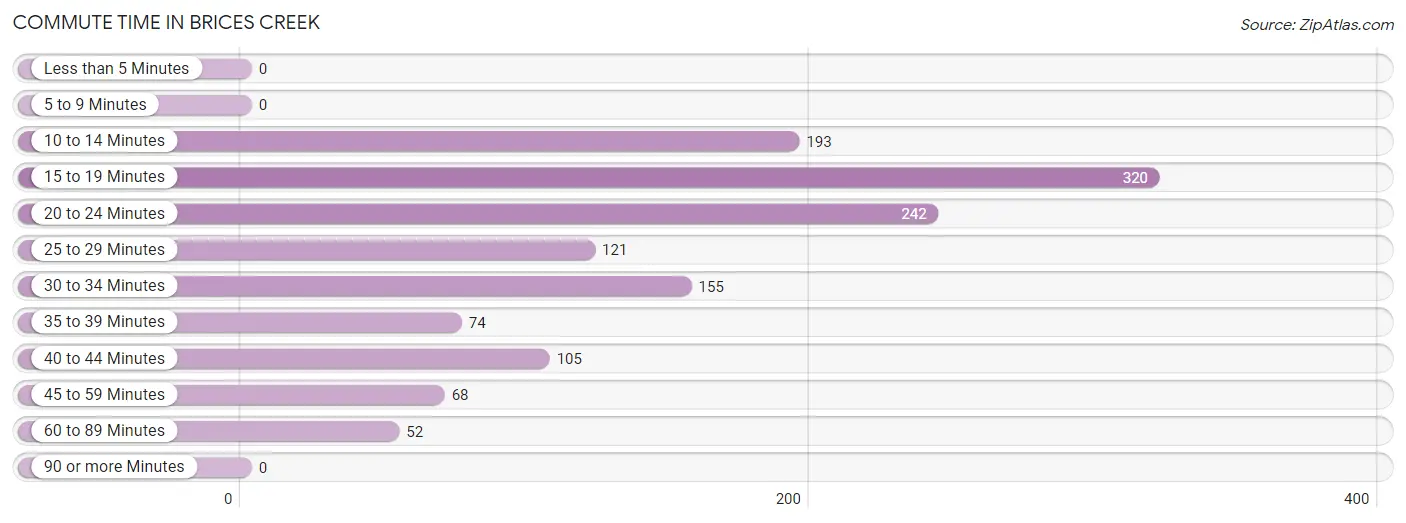
| Commute Time | # Commuters | % Commuters |
| Less than 5 Minutes | 0 | 0.0% |
| 5 to 9 Minutes | 0 | 0.0% |
| 10 to 14 Minutes | 193 | 14.5% |
| 15 to 19 Minutes | 320 | 24.1% |
| 20 to 24 Minutes | 242 | 18.2% |
| 25 to 29 Minutes | 121 | 9.1% |
| 30 to 34 Minutes | 155 | 11.7% |
| 35 to 39 Minutes | 74 | 5.6% |
| 40 to 44 Minutes | 105 | 7.9% |
| 45 to 59 Minutes | 68 | 5.1% |
| 60 to 89 Minutes | 52 | 3.9% |
| 90 or more Minutes | 0 | 0.0% |
Commute Time by Sex in Brices Creek
The most common commute times in Brices Creek are 10 to 14 minutes (159 commuters, 21.7%) for males and 20 to 24 minutes (184 commuters, 30.7%) for females.
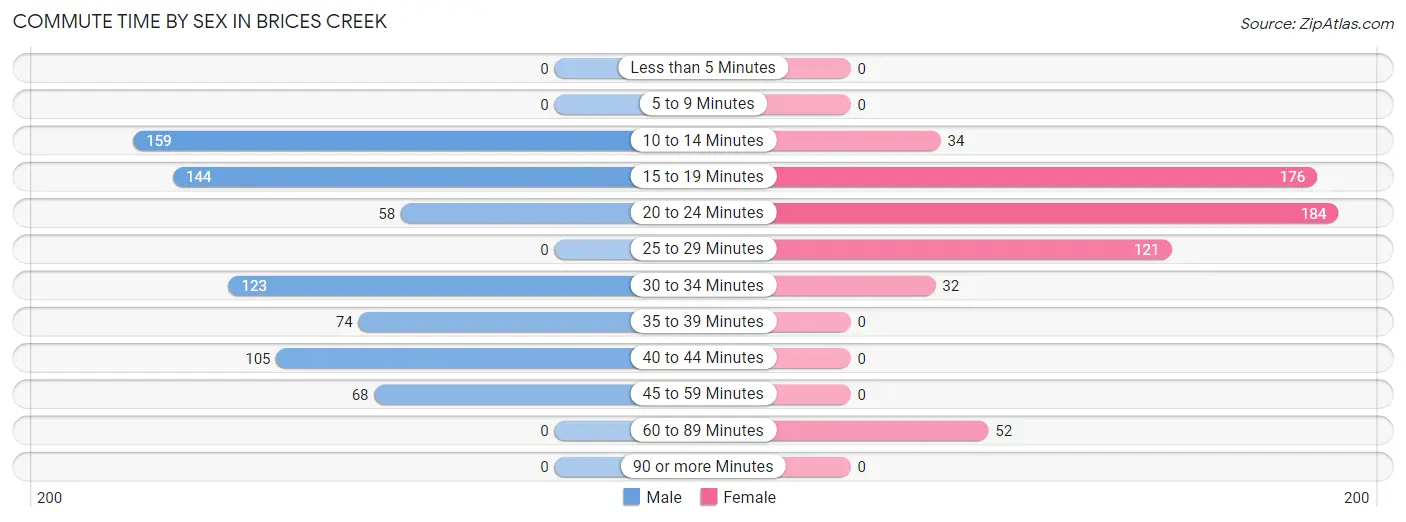
| Commute Time | Male | Female |
| Less than 5 Minutes | 0 (0.0%) | 0 (0.0%) |
| 5 to 9 Minutes | 0 (0.0%) | 0 (0.0%) |
| 10 to 14 Minutes | 159 (21.7%) | 34 (5.7%) |
| 15 to 19 Minutes | 144 (19.7%) | 176 (29.4%) |
| 20 to 24 Minutes | 58 (7.9%) | 184 (30.7%) |
| 25 to 29 Minutes | 0 (0.0%) | 121 (20.2%) |
| 30 to 34 Minutes | 123 (16.8%) | 32 (5.3%) |
| 35 to 39 Minutes | 74 (10.1%) | 0 (0.0%) |
| 40 to 44 Minutes | 105 (14.4%) | 0 (0.0%) |
| 45 to 59 Minutes | 68 (9.3%) | 0 (0.0%) |
| 60 to 89 Minutes | 0 (0.0%) | 52 (8.7%) |
| 90 or more Minutes | 0 (0.0%) | 0 (0.0%) |
Time of Departure to Work by Sex in Brices Creek
The most frequent times of departure to work in Brices Creek are 7:00 AM to 7:29 AM (201, 27.5%) for males and 7:00 AM to 7:29 AM (166, 27.7%) for females.
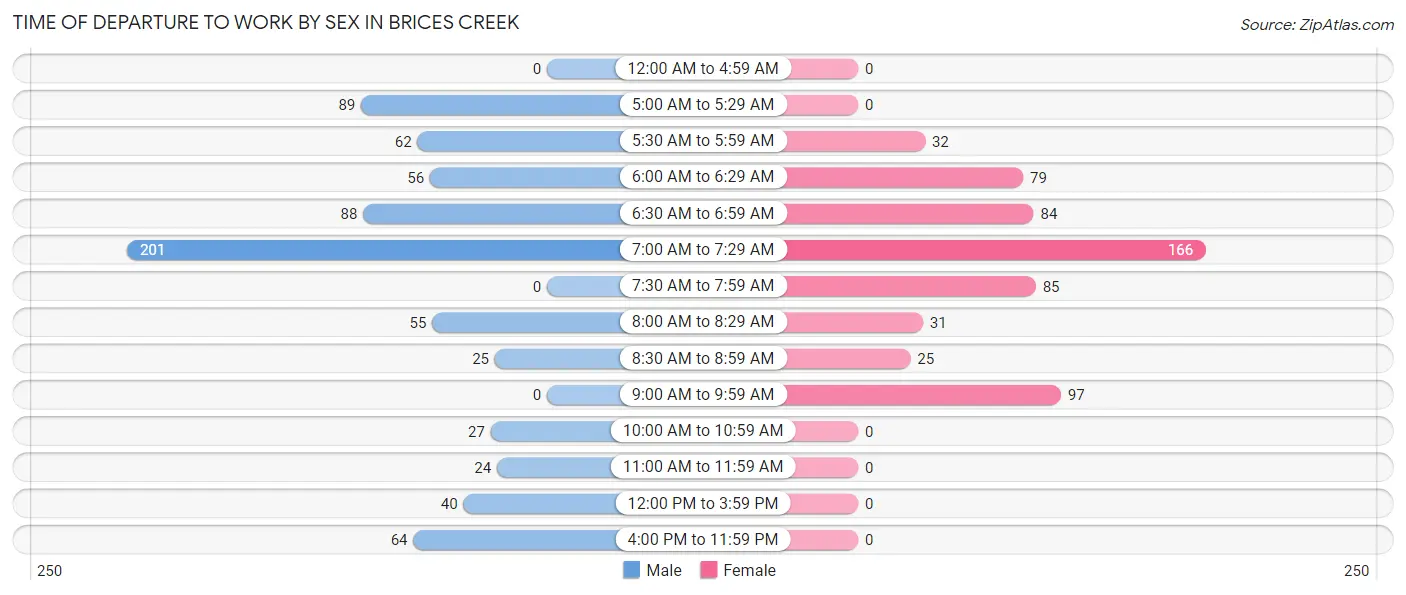
| Time of Departure | Male | Female |
| 12:00 AM to 4:59 AM | 0 (0.0%) | 0 (0.0%) |
| 5:00 AM to 5:29 AM | 89 (12.2%) | 0 (0.0%) |
| 5:30 AM to 5:59 AM | 62 (8.5%) | 32 (5.3%) |
| 6:00 AM to 6:29 AM | 56 (7.7%) | 79 (13.2%) |
| 6:30 AM to 6:59 AM | 88 (12.0%) | 84 (14.0%) |
| 7:00 AM to 7:29 AM | 201 (27.5%) | 166 (27.7%) |
| 7:30 AM to 7:59 AM | 0 (0.0%) | 85 (14.2%) |
| 8:00 AM to 8:29 AM | 55 (7.5%) | 31 (5.2%) |
| 8:30 AM to 8:59 AM | 25 (3.4%) | 25 (4.2%) |
| 9:00 AM to 9:59 AM | 0 (0.0%) | 97 (16.2%) |
| 10:00 AM to 10:59 AM | 27 (3.7%) | 0 (0.0%) |
| 11:00 AM to 11:59 AM | 24 (3.3%) | 0 (0.0%) |
| 12:00 PM to 3:59 PM | 40 (5.5%) | 0 (0.0%) |
| 4:00 PM to 11:59 PM | 64 (8.8%) | 0 (0.0%) |
| Total | 731 (100.0%) | 599 (100.0%) |
Housing Occupancy in Brices Creek
Occupancy by Ownership in Brices Creek
Of the total 1,485 dwellings in Brices Creek, owner-occupied units account for 1,360 (91.6%), while renter-occupied units make up 125 (8.4%).
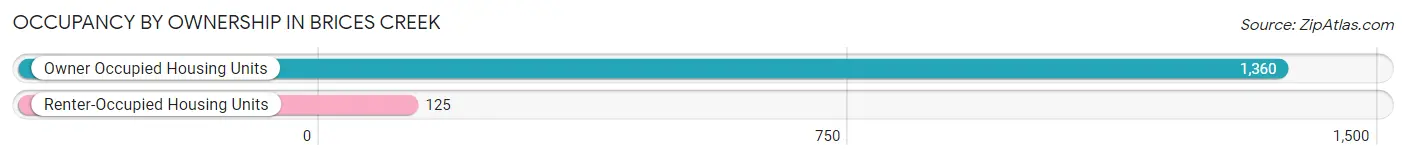
| Occupancy | # Housing Units | % Housing Units |
| Owner Occupied Housing Units | 1,360 | 91.6% |
| Renter-Occupied Housing Units | 125 | 8.4% |
| Total Occupied Housing Units | 1,485 | 100.0% |
Occupancy by Household Size in Brices Creek
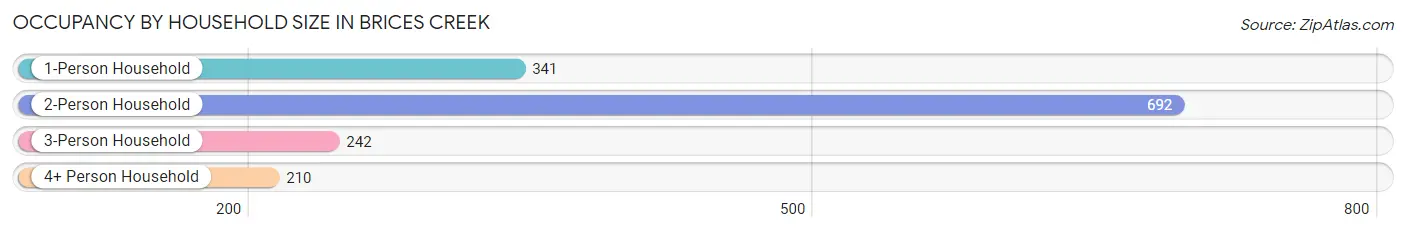
| Household Size | # Housing Units | % Housing Units |
| 1-Person Household | 341 | 23.0% |
| 2-Person Household | 692 | 46.6% |
| 3-Person Household | 242 | 16.3% |
| 4+ Person Household | 210 | 14.1% |
| Total Housing Units | 1,485 | 100.0% |
Occupancy by Ownership by Household Size in Brices Creek
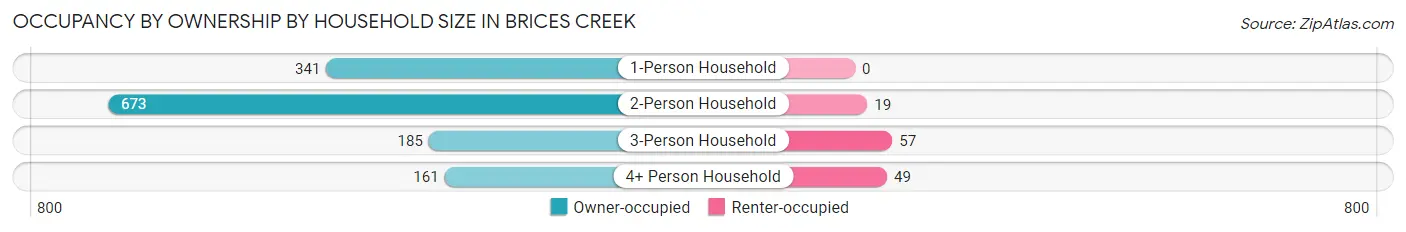
| Household Size | Owner-occupied | Renter-occupied |
| 1-Person Household | 341 (100.0%) | 0 (0.0%) |
| 2-Person Household | 673 (97.3%) | 19 (2.8%) |
| 3-Person Household | 185 (76.4%) | 57 (23.5%) |
| 4+ Person Household | 161 (76.7%) | 49 (23.3%) |
| Total Housing Units | 1,360 (91.6%) | 125 (8.4%) |
Occupancy by Educational Attainment in Brices Creek
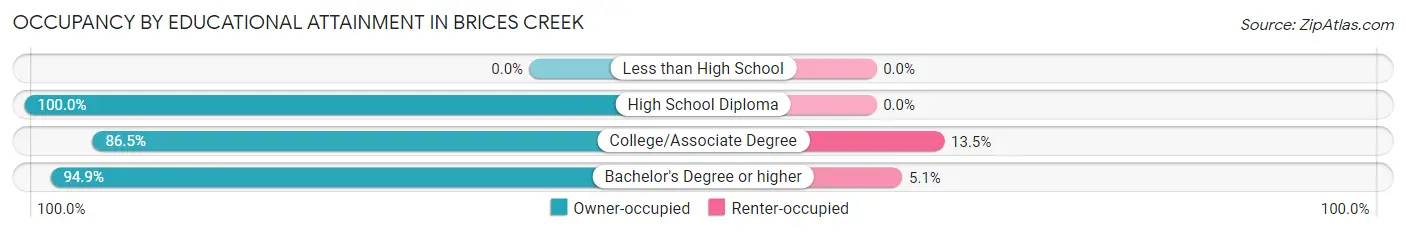
| Household Size | Owner-occupied | Renter-occupied |
| Less than High School | 0 (0.0%) | 0 (0.0%) |
| High School Diploma | 184 (100.0%) | 0 (0.0%) |
| College/Associate Degree | 604 (86.5%) | 94 (13.5%) |
| Bachelor's Degree or higher | 572 (94.9%) | 31 (5.1%) |
Occupancy by Age of Householder in Brices Creek
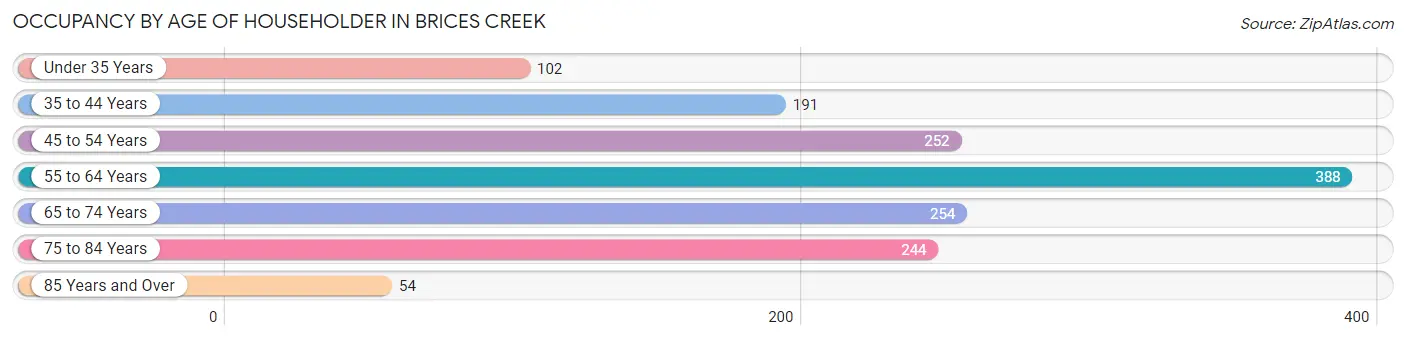
| Age Bracket | # Households | % Households |
| Under 35 Years | 102 | 6.9% |
| 35 to 44 Years | 191 | 12.9% |
| 45 to 54 Years | 252 | 17.0% |
| 55 to 64 Years | 388 | 26.1% |
| 65 to 74 Years | 254 | 17.1% |
| 75 to 84 Years | 244 | 16.4% |
| 85 Years and Over | 54 | 3.6% |
| Total | 1,485 | 100.0% |
Housing Finances in Brices Creek
Median Income by Occupancy in Brices Creek
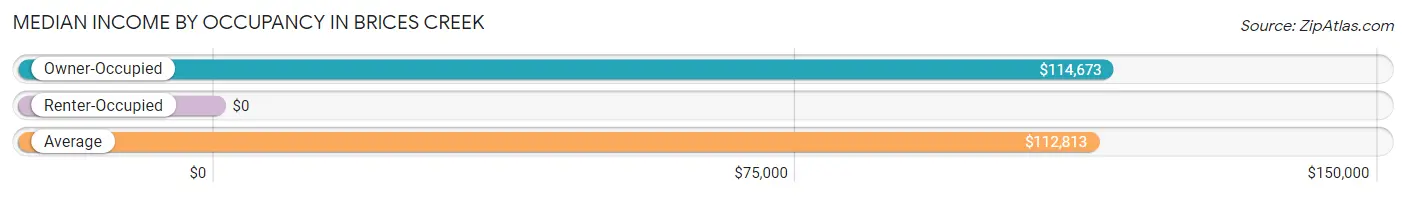
| Occupancy Type | # Households | Median Income |
| Owner-Occupied | 1,360 (91.6%) | $114,673 |
| Renter-Occupied | 125 (8.4%) | $0 |
| Average | 1,485 (100.0%) | $112,813 |
Occupancy by Householder Income Bracket in Brices Creek
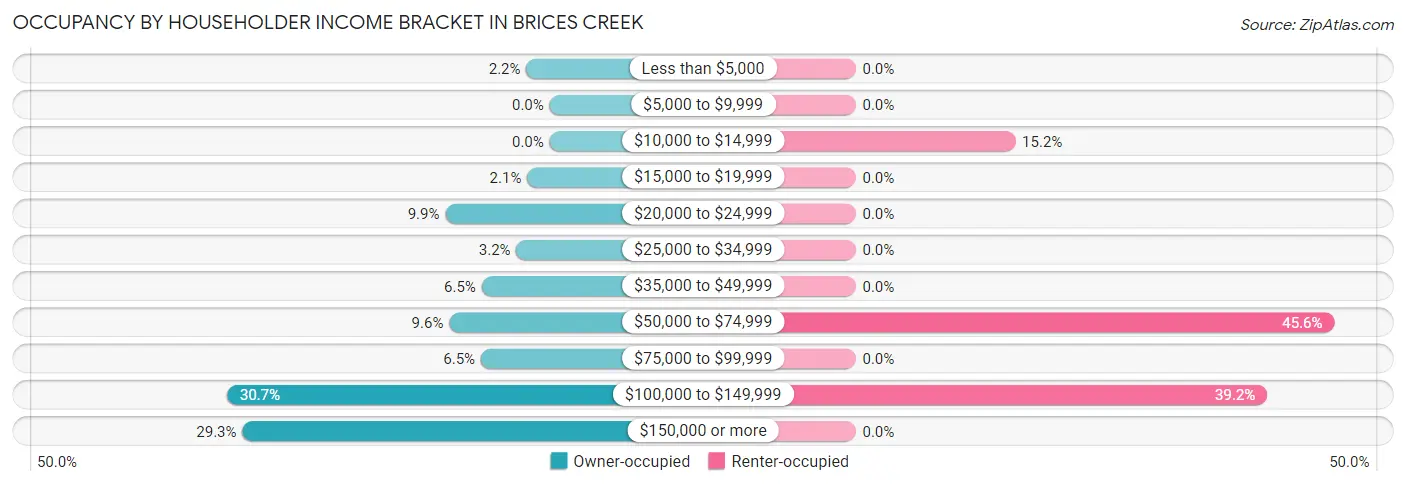
| Income Bracket | Owner-occupied | Renter-occupied |
| Less than $5,000 | 30 (2.2%) | 0 (0.0%) |
| $5,000 to $9,999 | 0 (0.0%) | 0 (0.0%) |
| $10,000 to $14,999 | 0 (0.0%) | 19 (15.2%) |
| $15,000 to $19,999 | 29 (2.1%) | 0 (0.0%) |
| $20,000 to $24,999 | 135 (9.9%) | 0 (0.0%) |
| $25,000 to $34,999 | 43 (3.2%) | 0 (0.0%) |
| $35,000 to $49,999 | 88 (6.5%) | 0 (0.0%) |
| $50,000 to $74,999 | 130 (9.6%) | 57 (45.6%) |
| $75,000 to $99,999 | 89 (6.5%) | 0 (0.0%) |
| $100,000 to $149,999 | 418 (30.7%) | 49 (39.2%) |
| $150,000 or more | 398 (29.3%) | 0 (0.0%) |
| Total | 1,360 (100.0%) | 125 (100.0%) |
Monthly Housing Cost Tiers in Brices Creek
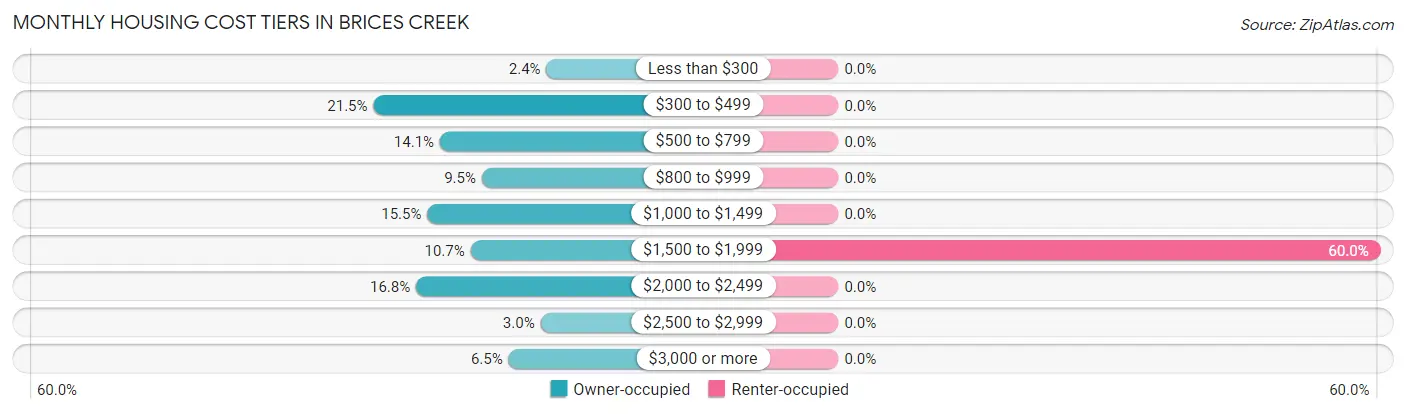
| Monthly Cost | Owner-occupied | Renter-occupied |
| Less than $300 | 32 (2.4%) | 0 (0.0%) |
| $300 to $499 | 292 (21.5%) | 0 (0.0%) |
| $500 to $799 | 192 (14.1%) | 0 (0.0%) |
| $800 to $999 | 129 (9.5%) | 0 (0.0%) |
| $1,000 to $1,499 | 211 (15.5%) | 0 (0.0%) |
| $1,500 to $1,999 | 146 (10.7%) | 75 (60.0%) |
| $2,000 to $2,499 | 228 (16.8%) | 0 (0.0%) |
| $2,500 to $2,999 | 41 (3.0%) | 0 (0.0%) |
| $3,000 or more | 89 (6.5%) | 0 (0.0%) |
| Total | 1,360 (100.0%) | 125 (100.0%) |
Physical Housing Characteristics in Brices Creek
Housing Structures in Brices Creek
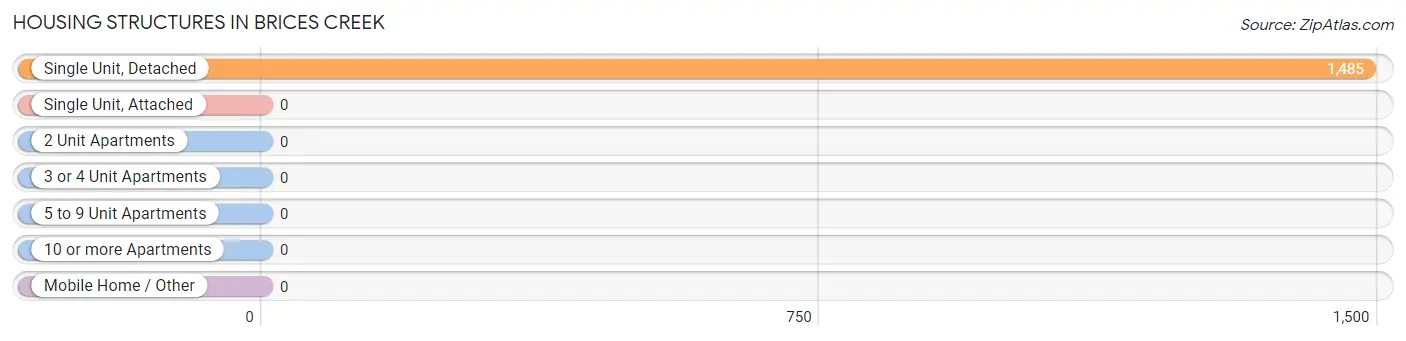
| Structure Type | # Housing Units | % Housing Units |
| Single Unit, Detached | 1,485 | 100.0% |
| Single Unit, Attached | 0 | 0.0% |
| 2 Unit Apartments | 0 | 0.0% |
| 3 or 4 Unit Apartments | 0 | 0.0% |
| 5 to 9 Unit Apartments | 0 | 0.0% |
| 10 or more Apartments | 0 | 0.0% |
| Mobile Home / Other | 0 | 0.0% |
| Total | 1,485 | 100.0% |
Housing Structures by Occupancy in Brices Creek
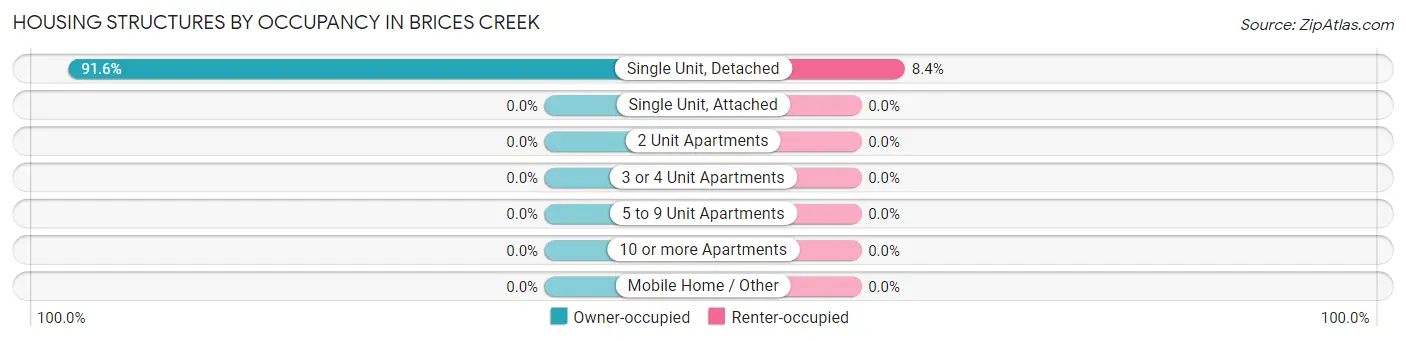
| Structure Type | Owner-occupied | Renter-occupied |
| Single Unit, Detached | 1,360 (91.6%) | 125 (8.4%) |
| Single Unit, Attached | 0 (0.0%) | 0 (0.0%) |
| 2 Unit Apartments | 0 (0.0%) | 0 (0.0%) |
| 3 or 4 Unit Apartments | 0 (0.0%) | 0 (0.0%) |
| 5 to 9 Unit Apartments | 0 (0.0%) | 0 (0.0%) |
| 10 or more Apartments | 0 (0.0%) | 0 (0.0%) |
| Mobile Home / Other | 0 (0.0%) | 0 (0.0%) |
| Total | 1,360 (91.6%) | 125 (8.4%) |
Housing Structures by Number of Rooms in Brices Creek
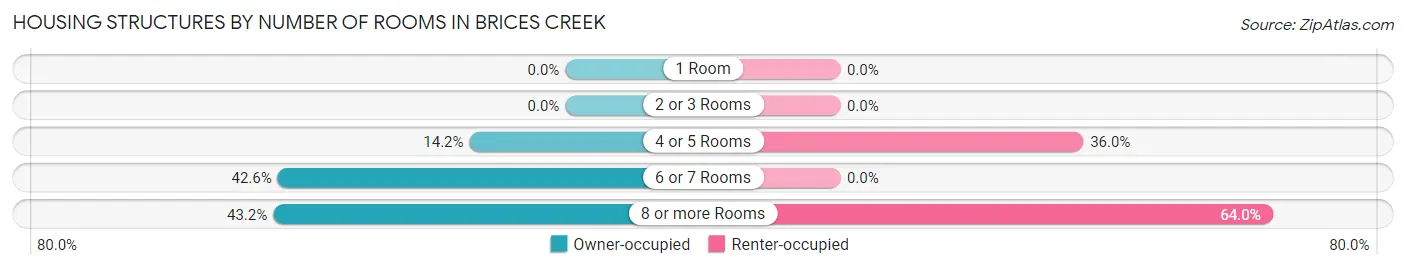
| Number of Rooms | Owner-occupied | Renter-occupied |
| 1 Room | 0 (0.0%) | 0 (0.0%) |
| 2 or 3 Rooms | 0 (0.0%) | 0 (0.0%) |
| 4 or 5 Rooms | 193 (14.2%) | 45 (36.0%) |
| 6 or 7 Rooms | 579 (42.6%) | 0 (0.0%) |
| 8 or more Rooms | 588 (43.2%) | 80 (64.0%) |
| Total | 1,360 (100.0%) | 125 (100.0%) |
Housing Structure by Heating Type in Brices Creek
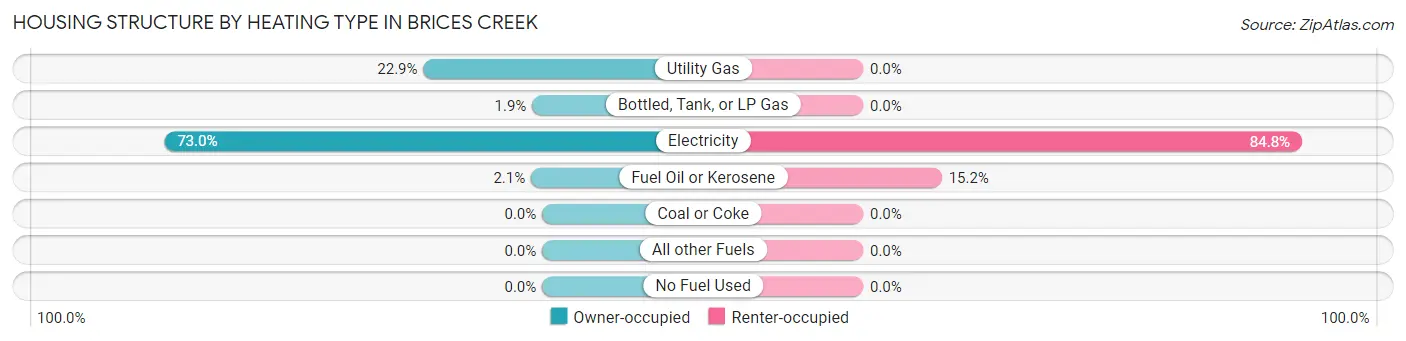
| Heating Type | Owner-occupied | Renter-occupied |
| Utility Gas | 312 (22.9%) | 0 (0.0%) |
| Bottled, Tank, or LP Gas | 26 (1.9%) | 0 (0.0%) |
| Electricity | 993 (73.0%) | 106 (84.8%) |
| Fuel Oil or Kerosene | 29 (2.1%) | 19 (15.2%) |
| Coal or Coke | 0 (0.0%) | 0 (0.0%) |
| All other Fuels | 0 (0.0%) | 0 (0.0%) |
| No Fuel Used | 0 (0.0%) | 0 (0.0%) |
| Total | 1,360 (100.0%) | 125 (100.0%) |
Household Vehicle Usage in Brices Creek
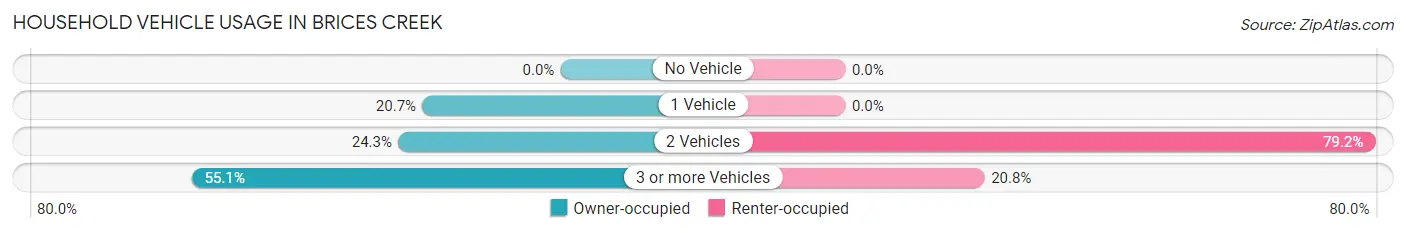
| Vehicles per Household | Owner-occupied | Renter-occupied |
| No Vehicle | 0 (0.0%) | 0 (0.0%) |
| 1 Vehicle | 281 (20.7%) | 0 (0.0%) |
| 2 Vehicles | 330 (24.3%) | 99 (79.2%) |
| 3 or more Vehicles | 749 (55.1%) | 26 (20.8%) |
| Total | 1,360 (100.0%) | 125 (100.0%) |
Real Estate & Mortgages in Brices Creek
Real Estate and Mortgage Overview in Brices Creek
| Characteristic | Without Mortgage | With Mortgage |
| Housing Units | 509 | 851 |
| Median Property Value | $325,200 | $301,200 |
| Median Household Income | $114,131 | $315 |
| Monthly Housing Costs | $414 | $89 |
| Real Estate Taxes | $1,341 | $0 |
Property Value by Mortgage Status in Brices Creek
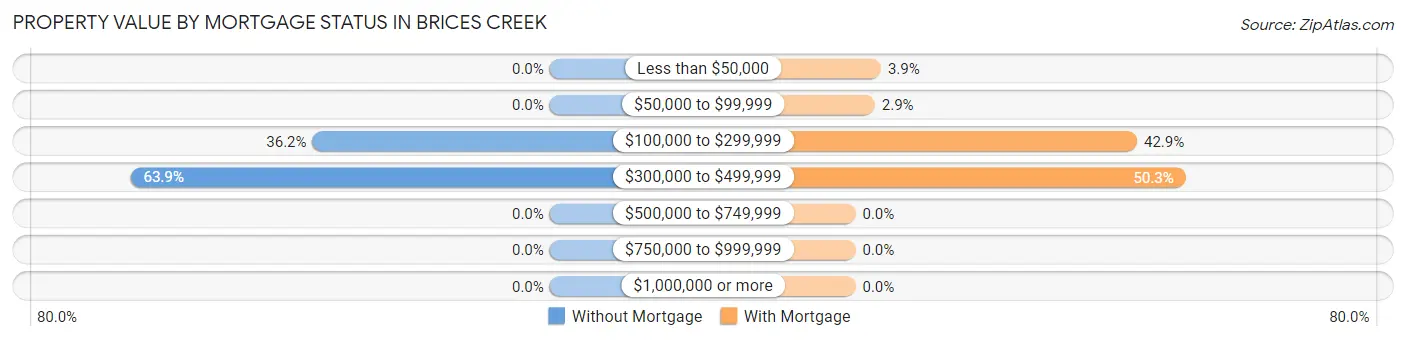
| Property Value | Without Mortgage | With Mortgage |
| Less than $50,000 | 0 (0.0%) | 33 (3.9%) |
| $50,000 to $99,999 | 0 (0.0%) | 25 (2.9%) |
| $100,000 to $299,999 | 184 (36.1%) | 365 (42.9%) |
| $300,000 to $499,999 | 325 (63.8%) | 428 (50.3%) |
| $500,000 to $749,999 | 0 (0.0%) | 0 (0.0%) |
| $750,000 to $999,999 | 0 (0.0%) | 0 (0.0%) |
| $1,000,000 or more | 0 (0.0%) | 0 (0.0%) |
| Total | 509 (100.0%) | 851 (100.0%) |
Household Income by Mortgage Status in Brices Creek
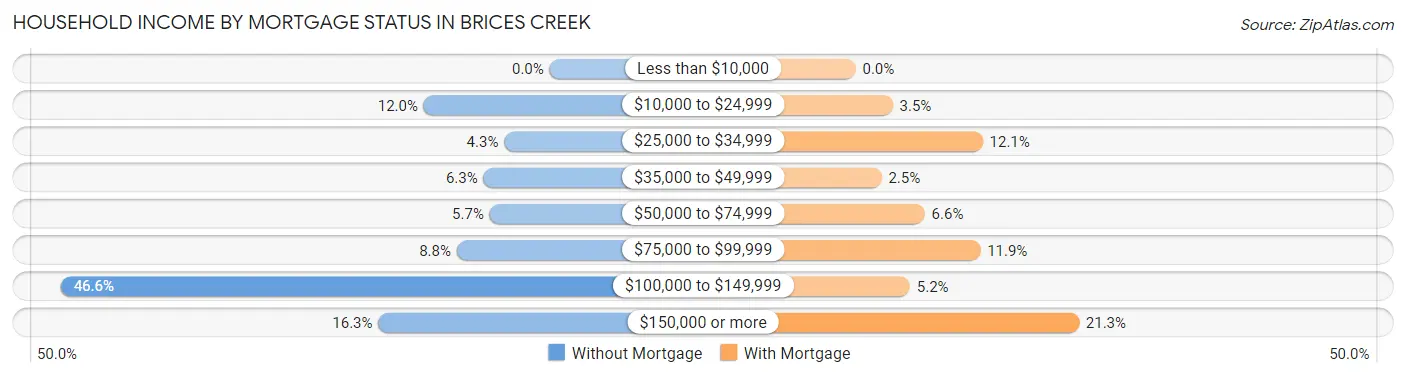
| Household Income | Without Mortgage | With Mortgage |
| Less than $10,000 | 0 (0.0%) | 0 (0.0%) |
| $10,000 to $24,999 | 61 (12.0%) | 30 (3.5%) |
| $25,000 to $34,999 | 22 (4.3%) | 103 (12.1%) |
| $35,000 to $49,999 | 32 (6.3%) | 21 (2.5%) |
| $50,000 to $74,999 | 29 (5.7%) | 56 (6.6%) |
| $75,000 to $99,999 | 45 (8.8%) | 101 (11.9%) |
| $100,000 to $149,999 | 237 (46.6%) | 44 (5.2%) |
| $150,000 or more | 83 (16.3%) | 181 (21.3%) |
| Total | 509 (100.0%) | 851 (100.0%) |
Property Value to Household Income Ratio in Brices Creek
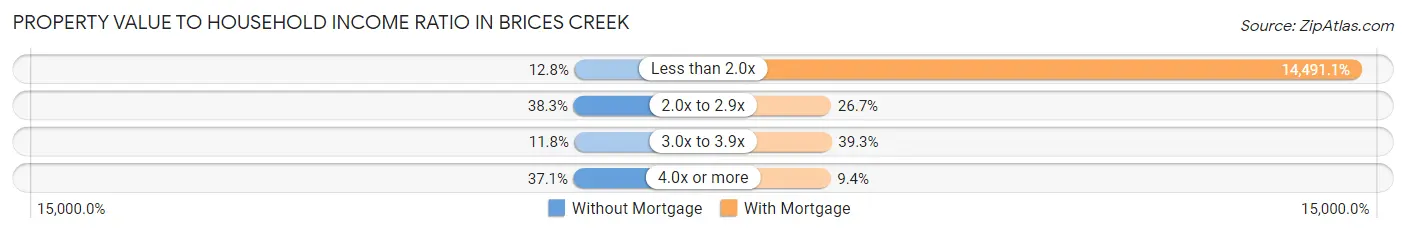
| Value-to-Income Ratio | Without Mortgage | With Mortgage |
| Less than 2.0x | 65 (12.8%) | 123,319 (14,491.1%) |
| 2.0x to 2.9x | 195 (38.3%) | 227 (26.7%) |
| 3.0x to 3.9x | 60 (11.8%) | 334 (39.3%) |
| 4.0x or more | 189 (37.1%) | 80 (9.4%) |
| Total | 509 (100.0%) | 851 (100.0%) |
Real Estate Taxes by Mortgage Status in Brices Creek
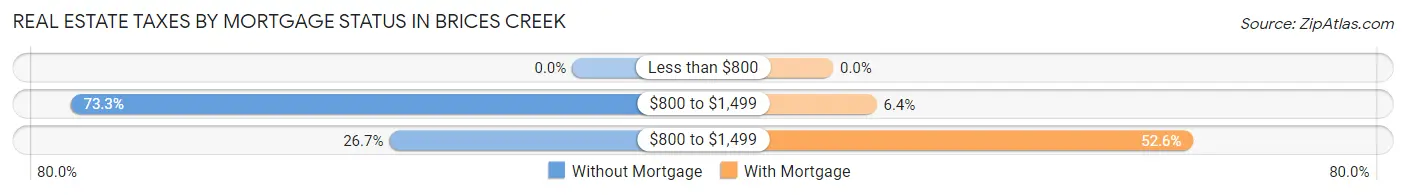
| Property Taxes | Without Mortgage | With Mortgage |
| Less than $800 | 0 (0.0%) | 0 (0.0%) |
| $800 to $1,499 | 373 (73.3%) | 54 (6.4%) |
| $800 to $1,499 | 136 (26.7%) | 448 (52.6%) |
| Total | 509 (100.0%) | 851 (100.0%) |
Health & Disability in Brices Creek
Health Insurance Coverage by Age in Brices Creek
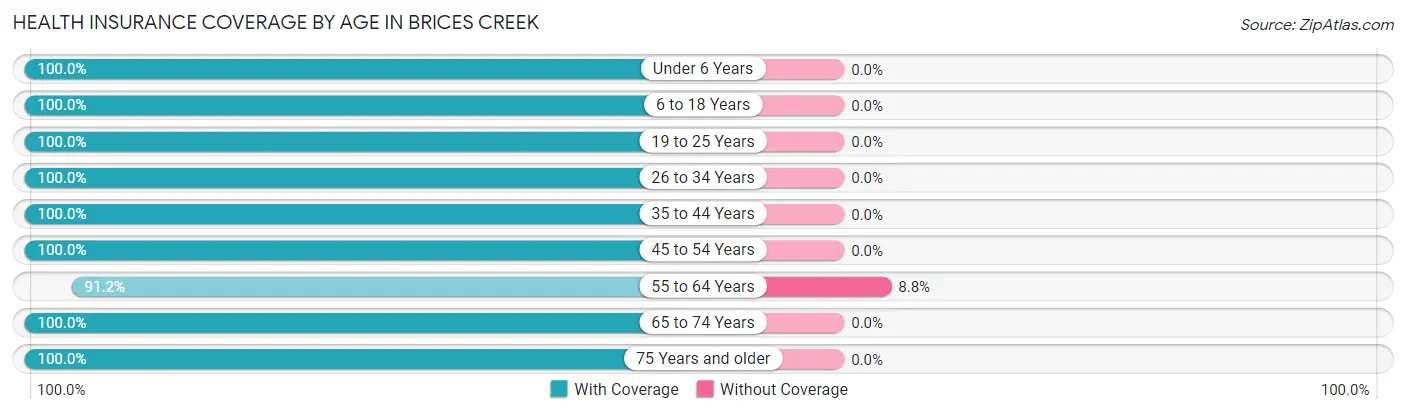
| Age Bracket | With Coverage | Without Coverage |
| Under 6 Years | 161 (100.0%) | 0 (0.0%) |
| 6 to 18 Years | 671 (100.0%) | 0 (0.0%) |
| 19 to 25 Years | 147 (100.0%) | 0 (0.0%) |
| 26 to 34 Years | 208 (100.0%) | 0 (0.0%) |
| 35 to 44 Years | 398 (100.0%) | 0 (0.0%) |
| 45 to 54 Years | 495 (100.0%) | 0 (0.0%) |
| 55 to 64 Years | 613 (91.2%) | 59 (8.8%) |
| 65 to 74 Years | 453 (100.0%) | 0 (0.0%) |
| 75 Years and older | 443 (100.0%) | 0 (0.0%) |
| Total | 3,589 (98.4%) | 59 (1.6%) |
Health Insurance Coverage by Citizenship Status in Brices Creek
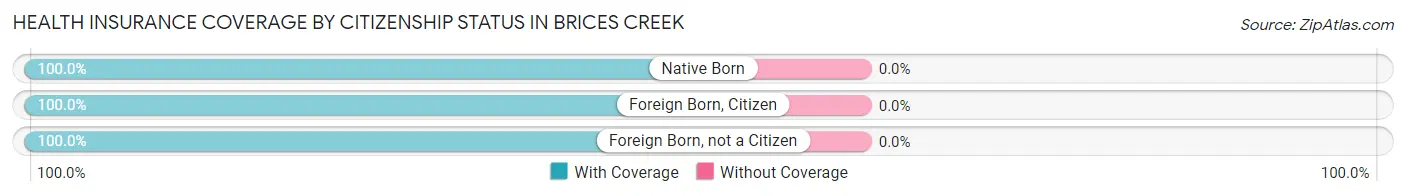
| Citizenship Status | With Coverage | Without Coverage |
| Native Born | 161 (100.0%) | 0 (0.0%) |
| Foreign Born, Citizen | 671 (100.0%) | 0 (0.0%) |
| Foreign Born, not a Citizen | 147 (100.0%) | 0 (0.0%) |
Health Insurance Coverage by Household Income in Brices Creek
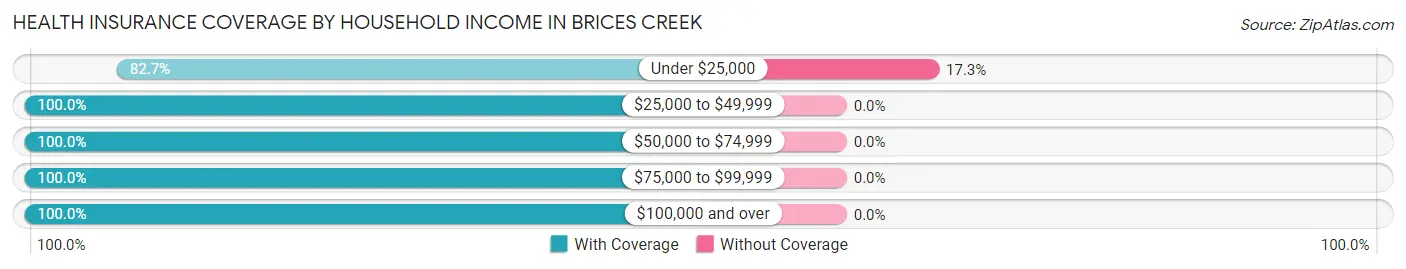
| Household Income | With Coverage | Without Coverage |
| Under $25,000 | 282 (82.7%) | 59 (17.3%) |
| $25,000 to $49,999 | 263 (100.0%) | 0 (0.0%) |
| $50,000 to $74,999 | 360 (100.0%) | 0 (0.0%) |
| $75,000 to $99,999 | 223 (100.0%) | 0 (0.0%) |
| $100,000 and over | 2,458 (100.0%) | 0 (0.0%) |
Public vs Private Health Insurance Coverage by Age in Brices Creek
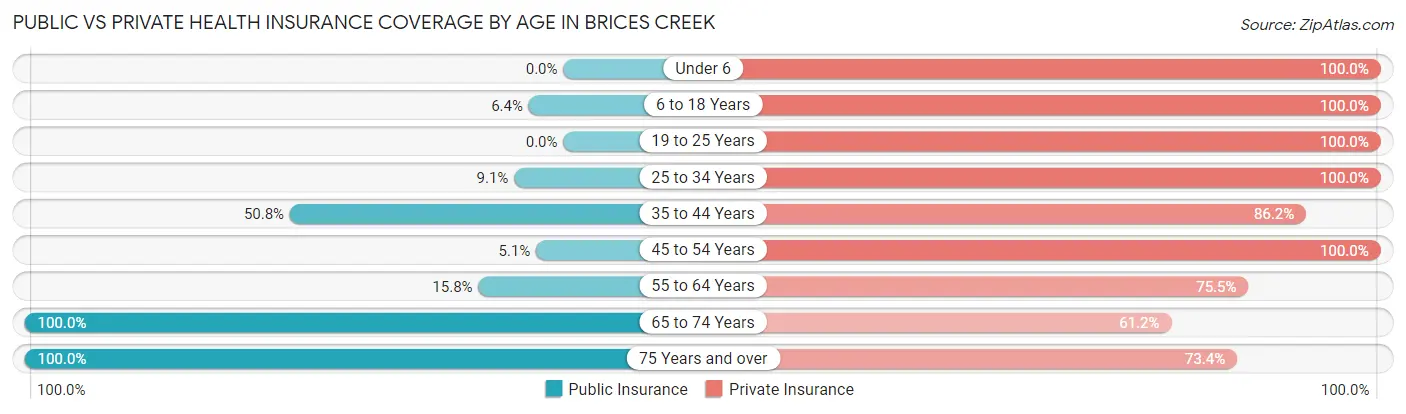
| Age Bracket | Public Insurance | Private Insurance |
| Under 6 | 0 (0.0%) | 161 (100.0%) |
| 6 to 18 Years | 43 (6.4%) | 671 (100.0%) |
| 19 to 25 Years | 0 (0.0%) | 147 (100.0%) |
| 25 to 34 Years | 19 (9.1%) | 208 (100.0%) |
| 35 to 44 Years | 202 (50.7%) | 343 (86.2%) |
| 45 to 54 Years | 25 (5.1%) | 495 (100.0%) |
| 55 to 64 Years | 106 (15.8%) | 507 (75.4%) |
| 65 to 74 Years | 453 (100.0%) | 277 (61.2%) |
| 75 Years and over | 443 (100.0%) | 325 (73.4%) |
| Total | 1,291 (35.4%) | 3,134 (85.9%) |
Disability Status by Sex by Age in Brices Creek
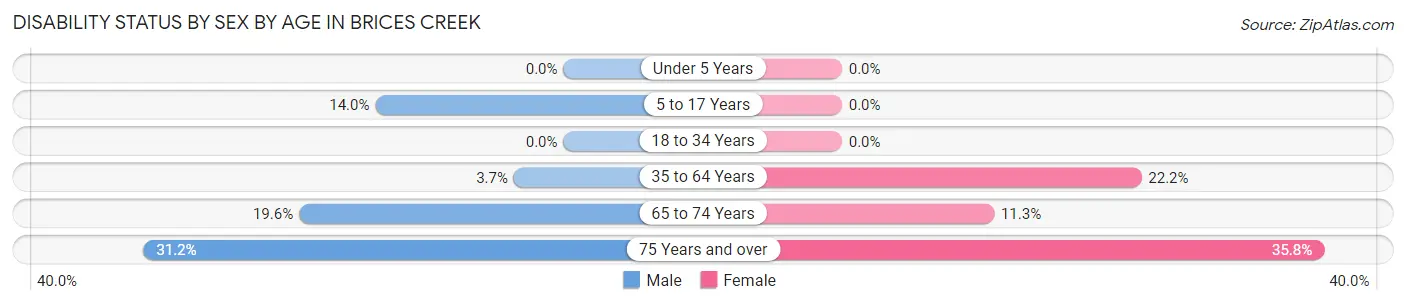
| Age Bracket | Male | Female |
| Under 5 Years | 0 (0.0%) | 0 (0.0%) |
| 5 to 17 Years | 43 (14.0%) | 0 (0.0%) |
| 18 to 34 Years | 0 (0.0%) | 0 (0.0%) |
| 35 to 64 Years | 26 (3.7%) | 191 (22.2%) |
| 65 to 74 Years | 42 (19.6%) | 27 (11.3%) |
| 75 Years and over | 58 (31.2%) | 92 (35.8%) |
Disability Class by Sex by Age in Brices Creek
Disability Class: Hearing Difficulty
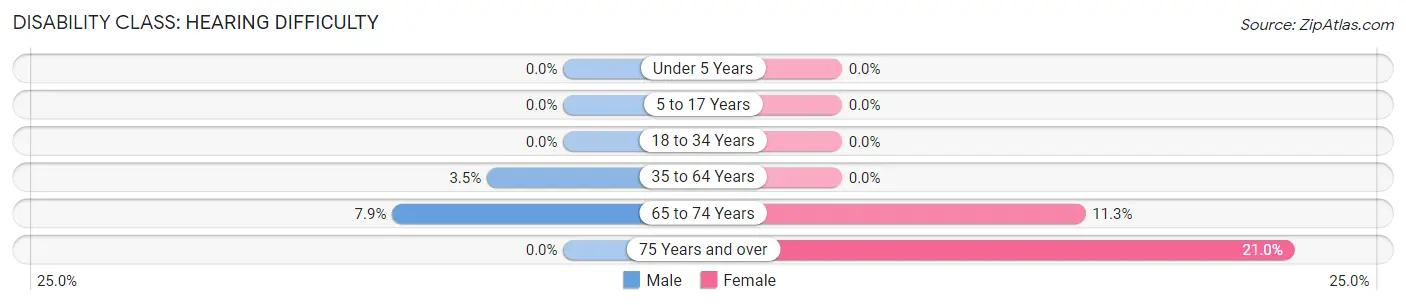
| Age Bracket | Male | Female |
| Under 5 Years | 0 (0.0%) | 0 (0.0%) |
| 5 to 17 Years | 0 (0.0%) | 0 (0.0%) |
| 18 to 34 Years | 0 (0.0%) | 0 (0.0%) |
| 35 to 64 Years | 25 (3.5%) | 0 (0.0%) |
| 65 to 74 Years | 17 (7.9%) | 27 (11.3%) |
| 75 Years and over | 0 (0.0%) | 54 (21.0%) |
Disability Class: Vision Difficulty
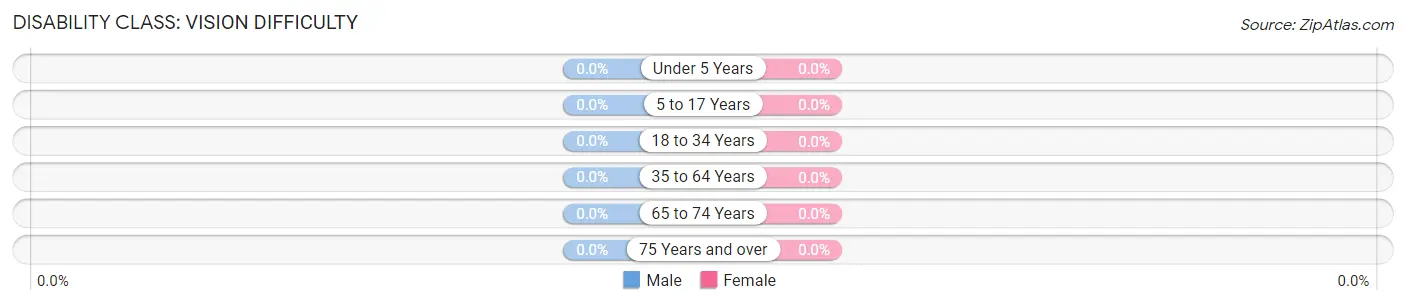
| Age Bracket | Male | Female |
| Under 5 Years | 0 (0.0%) | 0 (0.0%) |
| 5 to 17 Years | 0 (0.0%) | 0 (0.0%) |
| 18 to 34 Years | 0 (0.0%) | 0 (0.0%) |
| 35 to 64 Years | 0 (0.0%) | 0 (0.0%) |
| 65 to 74 Years | 0 (0.0%) | 0 (0.0%) |
| 75 Years and over | 0 (0.0%) | 0 (0.0%) |
Disability Class: Cognitive Difficulty
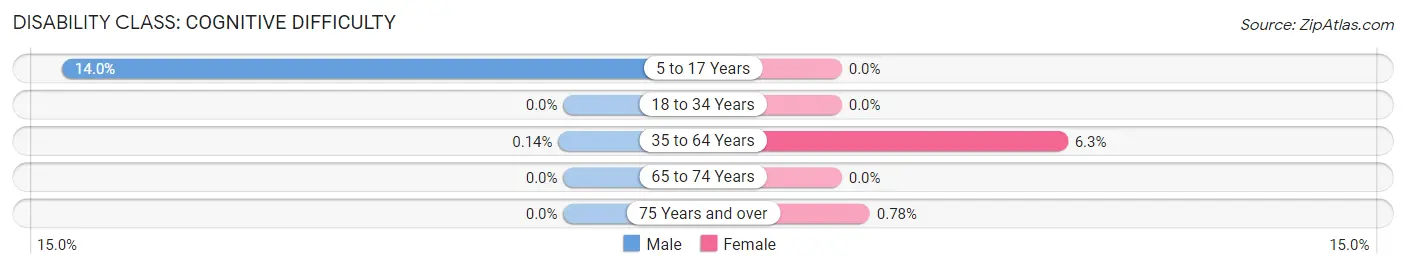
| Age Bracket | Male | Female |
| 5 to 17 Years | 43 (14.0%) | 0 (0.0%) |
| 18 to 34 Years | 0 (0.0%) | 0 (0.0%) |
| 35 to 64 Years | 1 (0.1%) | 54 (6.3%) |
| 65 to 74 Years | 0 (0.0%) | 0 (0.0%) |
| 75 Years and over | 0 (0.0%) | 2 (0.8%) |
Disability Class: Ambulatory Difficulty
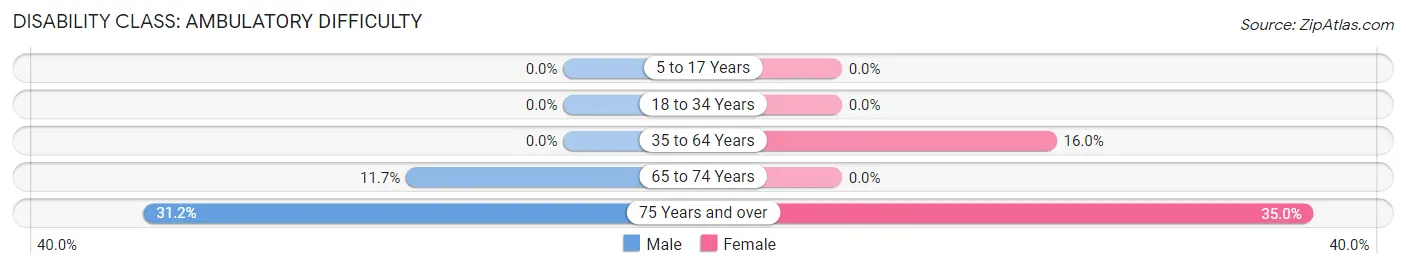
| Age Bracket | Male | Female |
| 5 to 17 Years | 0 (0.0%) | 0 (0.0%) |
| 18 to 34 Years | 0 (0.0%) | 0 (0.0%) |
| 35 to 64 Years | 0 (0.0%) | 137 (16.0%) |
| 65 to 74 Years | 25 (11.7%) | 0 (0.0%) |
| 75 Years and over | 58 (31.2%) | 90 (35.0%) |
Disability Class: Self-Care Difficulty
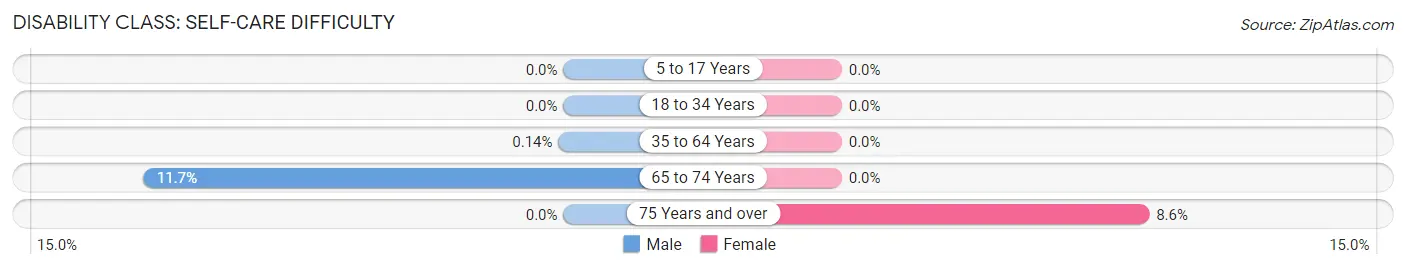
| Age Bracket | Male | Female |
| 5 to 17 Years | 0 (0.0%) | 0 (0.0%) |
| 18 to 34 Years | 0 (0.0%) | 0 (0.0%) |
| 35 to 64 Years | 1 (0.1%) | 0 (0.0%) |
| 65 to 74 Years | 25 (11.7%) | 0 (0.0%) |
| 75 Years and over | 0 (0.0%) | 22 (8.6%) |
Technology Access in Brices Creek
Computing Device Access in Brices Creek
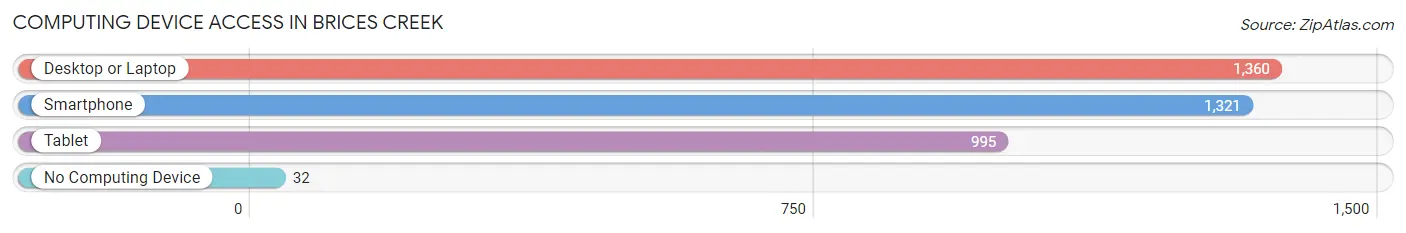
| Device Type | # Households | % Households |
| Desktop or Laptop | 1,360 | 91.6% |
| Smartphone | 1,321 | 89.0% |
| Tablet | 995 | 67.0% |
| No Computing Device | 32 | 2.1% |
| Total | 1,485 | 100.0% |
Internet Access in Brices Creek
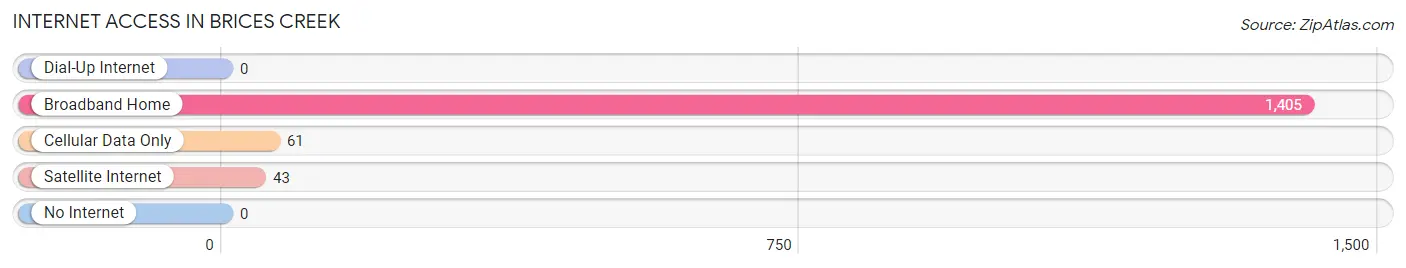
| Internet Type | # Households | % Households |
| Dial-Up Internet | 0 | 0.0% |
| Broadband Home | 1,405 | 94.6% |
| Cellular Data Only | 61 | 4.1% |
| Satellite Internet | 43 | 2.9% |
| No Internet | 0 | 0.0% |
| Total | 1,485 | 100.0% |
Brices Creek Summary
Brices Creek is a small unincorporated community located in Craven County, North Carolina. It is situated on the banks of the Neuse River, approximately 10 miles east of New Bern. The community is home to a variety of businesses, including a marina, a boat launch, and a few restaurants.
History
The area now known as Brices Creek was first settled in the late 1700s by a group of settlers from Scotland. The settlers named the area after a local creek, which was named after a Scottish settler named Brice. The area was primarily used for farming and fishing, and the settlers built a small church and a few homes.
In the early 1800s, the area was home to a small trading post, which served as a hub for local farmers and fishermen. The trading post was eventually replaced by a general store, which served the community until the early 1900s.
In the late 1800s, the area began to experience a period of growth and development. The first school was built in 1891, and a post office was established in 1895. The area also saw the construction of a railroad line, which connected Brices Creek to New Bern and other nearby towns.
Geography
Brices Creek is located in Craven County, North Carolina. It is situated on the banks of the Neuse River, approximately 10 miles east of New Bern. The community is surrounded by a variety of natural features, including the Croatan National Forest, the Neuse River, and the Brices Creek Wildlife Management Area.
The area is characterized by a humid subtropical climate, with hot, humid summers and mild winters. The average annual temperature is around 70 degrees Fahrenheit, and the average annual precipitation is around 50 inches.
Economy
The economy of Brices Creek is largely based on tourism and recreation. The area is home to a variety of businesses, including a marina, a boat launch, and a few restaurants. The area also attracts visitors for its natural beauty, and it is a popular destination for fishing, boating, and other outdoor activities.
Demographics
As of the 2010 census, the population of Brices Creek was 1,845. The racial makeup of the community was 94.3% White, 2.2% African American, 0.7% Native American, 0.3% Asian, and 2.5% from other races. The median household income was $37,917, and the median family income was $45,938.
Conclusion
Brices Creek is a small unincorporated community located in Craven County, North Carolina. It is situated on the banks of the Neuse River, approximately 10 miles east of New Bern. The area was first settled in the late 1700s by a group of settlers from Scotland, and it has since grown into a popular destination for fishing, boating, and other outdoor activities. The economy of Brices Creek is largely based on tourism and recreation, and the population of the community was 1,845 as of the 2010 census.
Common Questions
What is Per Capita Income in Brices Creek?
Per Capita income in Brices Creek is $57,776.
What is the Median Family Income in Brices Creek?
Median Family Income in Brices Creek is $116,186.
What is the Median Household income in Brices Creek?
Median Household Income in Brices Creek is $112,813.
What is Income or Wage Gap in Brices Creek?
Income or Wage Gap in Brices Creek is 44.5%.
Women in Brices Creek earn 55.5 cents for every dollar earned by a man.
What is Inequality or Gini Index in Brices Creek?
Inequality or Gini Index in Brices Creek is 0.49.
What is the Total Population of Brices Creek?
Total Population of Brices Creek is 3,678.
What is the Total Male Population of Brices Creek?
Total Male Population of Brices Creek is 1,653.
What is the Total Female Population of Brices Creek?
Total Female Population of Brices Creek is 2,025.
What is the Ratio of Males per 100 Females in Brices Creek?
There are 81.63 Males per 100 Females in Brices Creek.
What is the Ratio of Females per 100 Males in Brices Creek?
There are 122.50 Females per 100 Males in Brices Creek.
What is the Median Population Age in Brices Creek?
Median Population Age in Brices Creek is 49.9 Years.
What is the Average Family Size in Brices Creek
Average Family Size in Brices Creek is 2.9 People.
What is the Average Household Size in Brices Creek
Average Household Size in Brices Creek is 2.5 People.
How Large is the Labor Force in Brices Creek?
There are 1,736 People in the Labor Forcein in Brices Creek.
What is the Percentage of People in the Labor Force in Brices Creek?
56.5% of People are in the Labor Force in Brices Creek.
What is the Unemployment Rate in Brices Creek?
Unemployment Rate in Brices Creek is 1.1%.