Hoopers Creek, NC Map & Demographics
Hoopers Creek Map
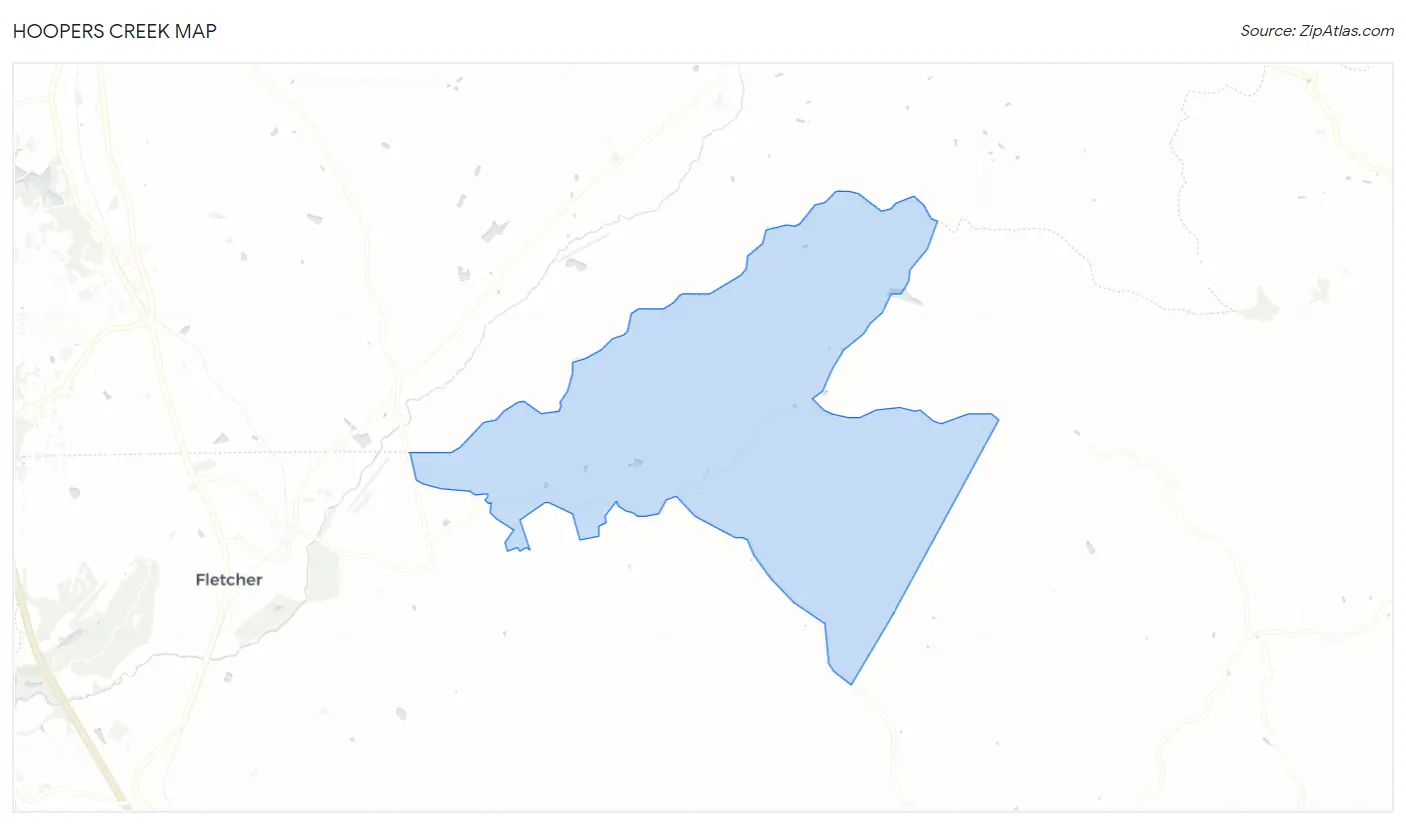
Hoopers Creek Overview
$22,445
PER CAPITA INCOME
$69,625
AVG FAMILY INCOME
$63,750
AVG HOUSEHOLD INCOME
35.2%
WAGE / INCOME GAP [ % ]
64.8¢/ $1
WAGE / INCOME GAP [ $ ]
0.33
INEQUALITY / GINI INDEX
1,515
TOTAL POPULATION
637
MALE POPULATION
878
FEMALE POPULATION
72.55
MALES / 100 FEMALES
137.83
FEMALES / 100 MALES
41.0
MEDIAN AGE
3.2
AVG FAMILY SIZE
2.6
AVG HOUSEHOLD SIZE
578
LABOR FORCE [ PEOPLE ]
48.7%
PERCENT IN LABOR FORCE
3.3%
UNEMPLOYMENT RATE
Income in Hoopers Creek
Income Overview in Hoopers Creek
Per Capita Income in Hoopers Creek is $22,445, while median incomes of families and households are $69,625 and $63,750 respectively.
| Characteristic | Number | Measure |
| Per Capita Income | 1,515 | $22,445 |
| Median Family Income | 413 | $69,625 |
| Mean Family Income | 413 | $68,684 |
| Median Household Income | 582 | $63,750 |
| Mean Household Income | 582 | $57,204 |
| Income Deficit | 413 | $0 |
| Wage / Income Gap (%) | 1,515 | 35.16% |
| Wage / Income Gap ($) | 1,515 | 64.84¢ per $1 |
| Gini / Inequality Index | 1,515 | 0.33 |
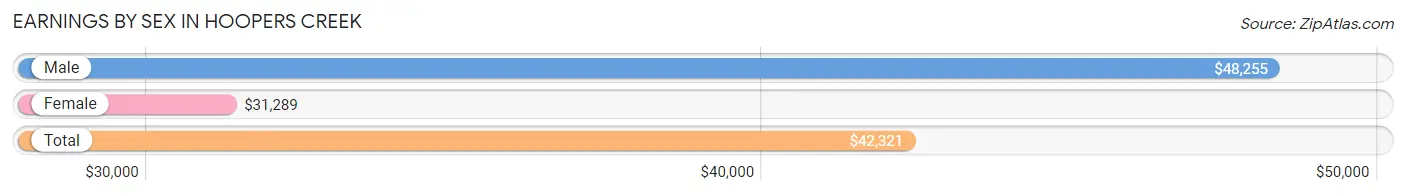
Earnings by Sex in Hoopers Creek
Average Earnings in Hoopers Creek are $42,321, $48,255 for men and $31,289 for women, a difference of 35.2%.
| Sex | Number | Average Earnings |
| Male | 388 (63.7%) | $48,255 |
| Female | 221 (36.3%) | $31,289 |
| Total | 609 (100.0%) | $42,321 |
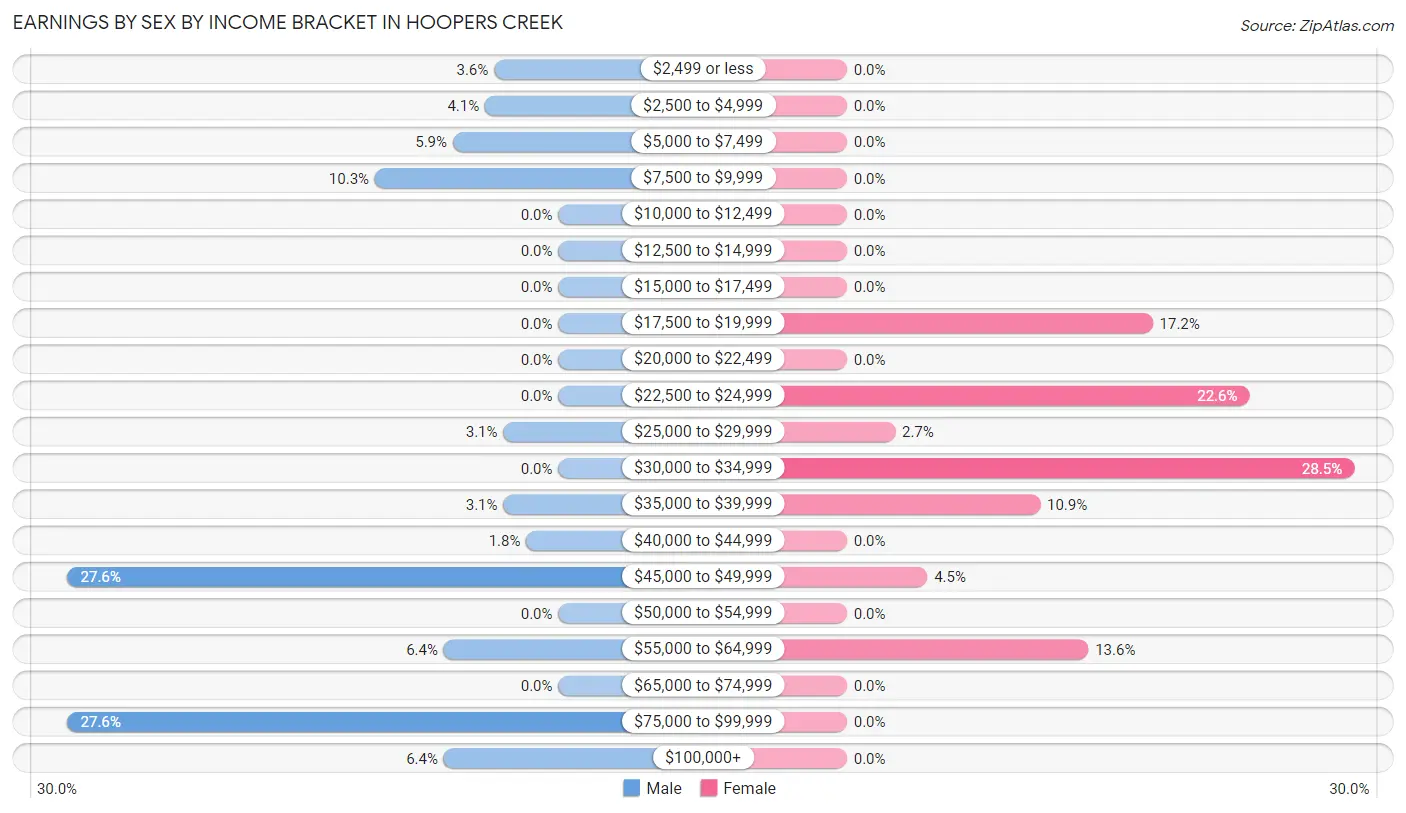
Earnings by Sex by Income Bracket in Hoopers Creek
The most common earnings brackets in Hoopers Creek are $45,000 to $49,999 for men (107 | 27.6%) and $30,000 to $34,999 for women (63 | 28.5%).
| Income | Male | Female |
| $2,499 or less | 14 (3.6%) | 0 (0.0%) |
| $2,500 to $4,999 | 16 (4.1%) | 0 (0.0%) |
| $5,000 to $7,499 | 23 (5.9%) | 0 (0.0%) |
| $7,500 to $9,999 | 40 (10.3%) | 0 (0.0%) |
| $10,000 to $12,499 | 0 (0.0%) | 0 (0.0%) |
| $12,500 to $14,999 | 0 (0.0%) | 0 (0.0%) |
| $15,000 to $17,499 | 0 (0.0%) | 0 (0.0%) |
| $17,500 to $19,999 | 0 (0.0%) | 38 (17.2%) |
| $20,000 to $22,499 | 0 (0.0%) | 0 (0.0%) |
| $22,500 to $24,999 | 0 (0.0%) | 50 (22.6%) |
| $25,000 to $29,999 | 12 (3.1%) | 6 (2.7%) |
| $30,000 to $34,999 | 0 (0.0%) | 63 (28.5%) |
| $35,000 to $39,999 | 12 (3.1%) | 24 (10.9%) |
| $40,000 to $44,999 | 7 (1.8%) | 0 (0.0%) |
| $45,000 to $49,999 | 107 (27.6%) | 10 (4.5%) |
| $50,000 to $54,999 | 0 (0.0%) | 0 (0.0%) |
| $55,000 to $64,999 | 25 (6.4%) | 30 (13.6%) |
| $65,000 to $74,999 | 0 (0.0%) | 0 (0.0%) |
| $75,000 to $99,999 | 107 (27.6%) | 0 (0.0%) |
| $100,000+ | 25 (6.4%) | 0 (0.0%) |
| Total | 388 (100.0%) | 221 (100.0%) |
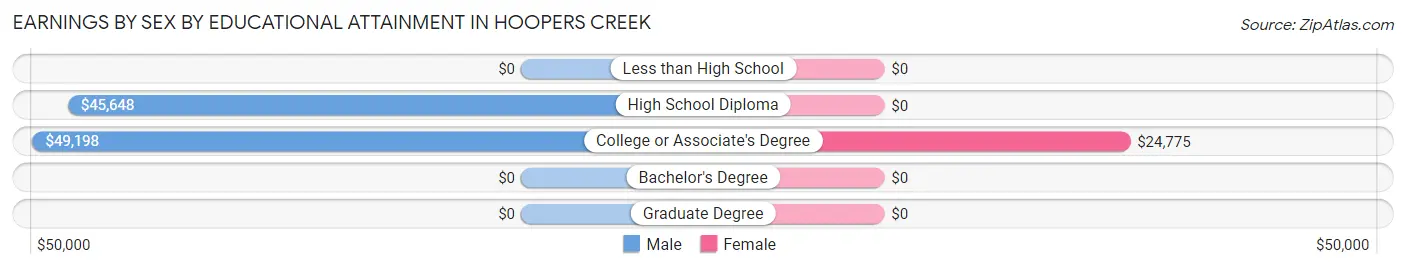
Earnings by Sex by Educational Attainment in Hoopers Creek
Average earnings in Hoopers Creek are $48,632 for men and $30,352 for women, a difference of 37.6%. Men with an educational attainment of college or associate's degree enjoy the highest average annual earnings of $49,198, while those with high school diploma education earn the least with $45,648. Women with an educational attainment of college or associate's degree earn the most with the average annual earnings of $24,775, while those with college or associate's degree education have the smallest earnings of $24,775.
| Educational Attainment | Male Income | Female Income |
| Less than High School | - | - |
| High School Diploma | $45,648 | $0 |
| College or Associate's Degree | $49,198 | $24,775 |
| Bachelor's Degree | - | - |
| Graduate Degree | - | - |
| Total | $48,632 | $30,352 |
Family Income in Hoopers Creek
Family Income Brackets in Hoopers Creek
According to the Hoopers Creek family income data, there are 166 families falling into the $75,000 to $99,999 income range, which is the most common income bracket and makes up 40.2% of all families.
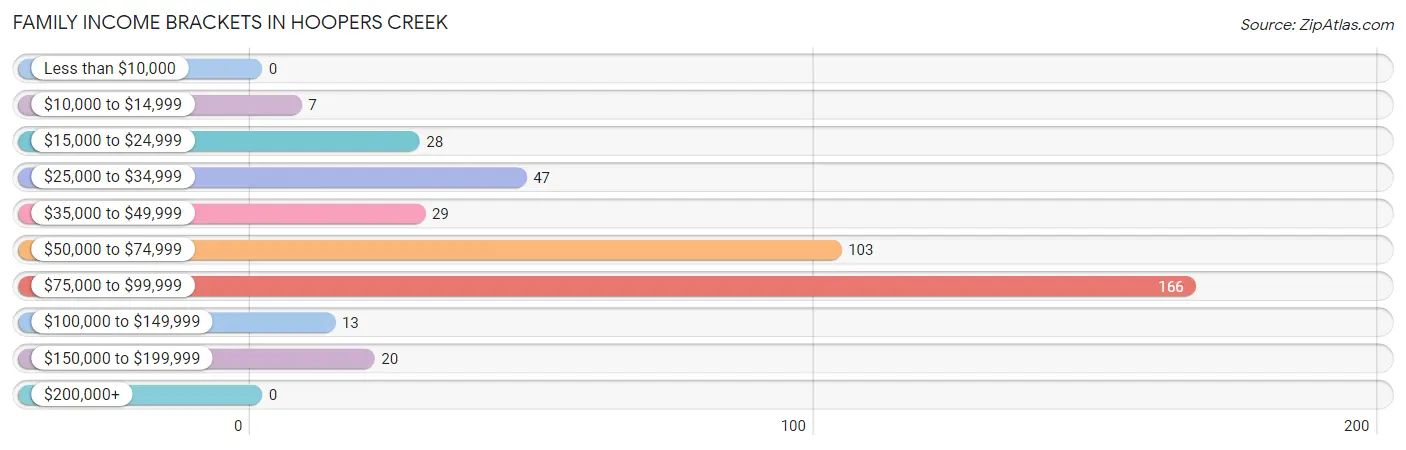
| Income Bracket | # Families | % Families |
| Less than $10,000 | 0 | 0.0% |
| $10,000 to $14,999 | 7 | 1.7% |
| $15,000 to $24,999 | 28 | 6.8% |
| $25,000 to $34,999 | 47 | 11.4% |
| $35,000 to $49,999 | 29 | 7.0% |
| $50,000 to $74,999 | 103 | 24.9% |
| $75,000 to $99,999 | 166 | 40.2% |
| $100,000 to $149,999 | 13 | 3.1% |
| $150,000 to $199,999 | 20 | 4.8% |
| $200,000+ | 0 | 0.0% |
Family Income by Famaliy Size in Hoopers Creek
3-person families (32 | 7.7%) account for the highest median family income in Hoopers Creek with $82,917 per family, while 2-person families (218 | 52.8%) have the highest median income of $33,800 per family member.
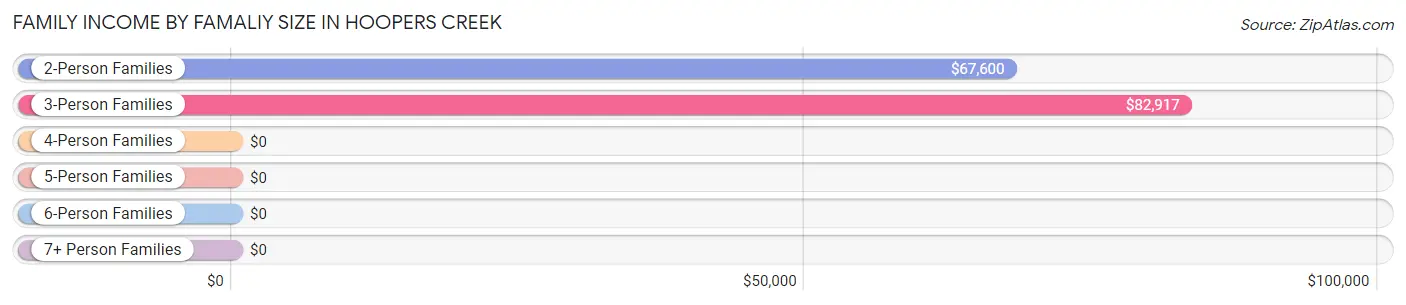
| Income Bracket | # Families | Median Income |
| 2-Person Families | 218 (52.8%) | $67,600 |
| 3-Person Families | 32 (7.7%) | $82,917 |
| 4-Person Families | 69 (16.7%) | $0 |
| 5-Person Families | 86 (20.8%) | $0 |
| 6-Person Families | 8 (1.9%) | $0 |
| 7+ Person Families | 0 (0.0%) | $0 |
| Total | 413 (100.0%) | $69,625 |
Family Income by Number of Earners in Hoopers Creek
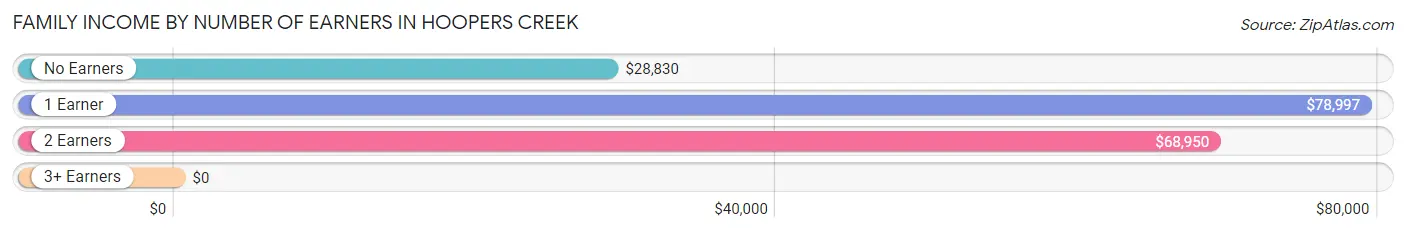
| Number of Earners | # Families | Median Income |
| No Earners | 84 (20.3%) | $28,830 |
| 1 Earner | 157 (38.0%) | $78,997 |
| 2 Earners | 140 (33.9%) | $68,950 |
| 3+ Earners | 32 (7.7%) | $0 |
| Total | 413 (100.0%) | $69,625 |
Household Income in Hoopers Creek
Household Income Brackets in Hoopers Creek
With 166 households falling in the category, the $75,000 to $99,999 income range is the most frequent in Hoopers Creek, accounting for 28.5% of all households.
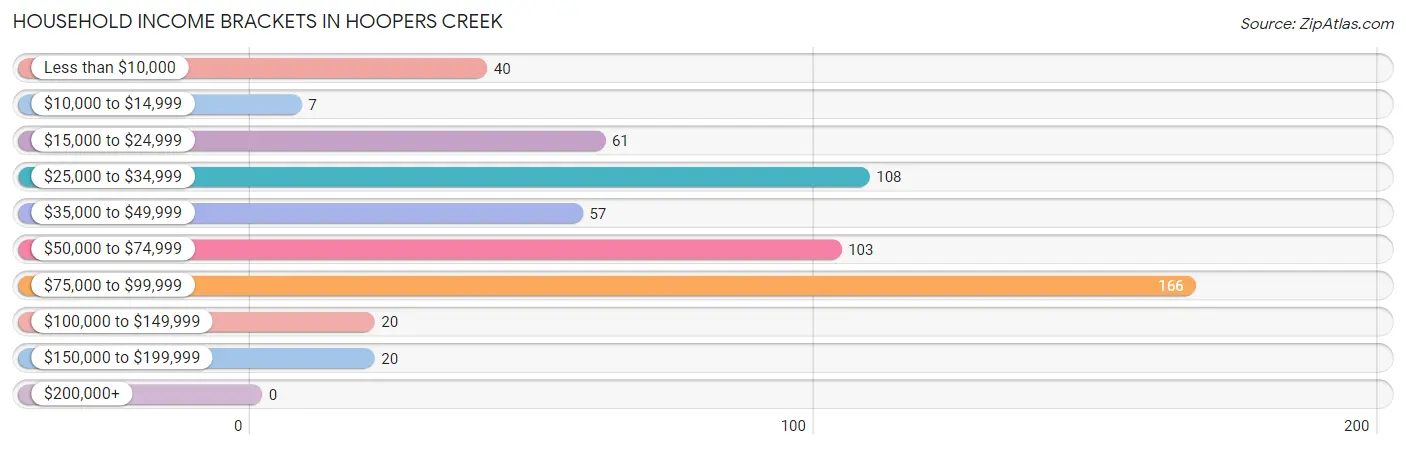
| Income Bracket | # Households | % Households |
| Less than $10,000 | 40 | 6.9% |
| $10,000 to $14,999 | 7 | 1.2% |
| $15,000 to $24,999 | 61 | 10.5% |
| $25,000 to $34,999 | 108 | 18.6% |
| $35,000 to $49,999 | 57 | 9.8% |
| $50,000 to $74,999 | 103 | 17.7% |
| $75,000 to $99,999 | 166 | 28.5% |
| $100,000 to $149,999 | 20 | 3.4% |
| $150,000 to $199,999 | 20 | 3.4% |
| $200,000+ | 0 | 0.0% |
Household Income by Householder Age in Hoopers Creek
The median household income in Hoopers Creek is $63,750, with the highest median household income of $77,747 found in the 25 to 44 years age bracket for the primary householder. A total of 215 households (36.9%) fall into this category.
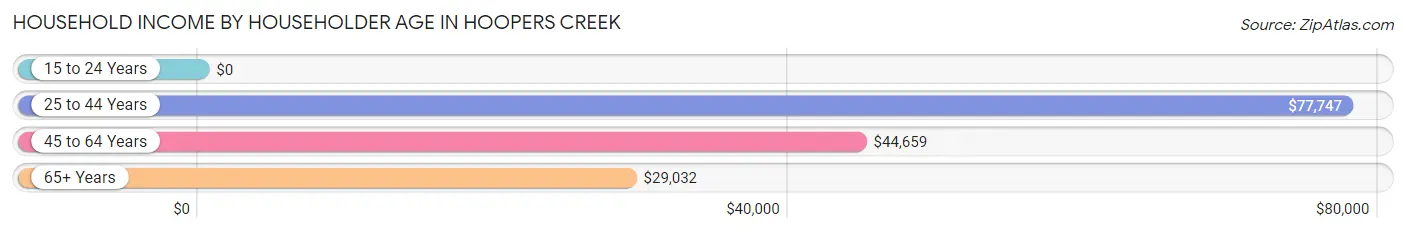
| Income Bracket | # Households | Median Income |
| 15 to 24 Years | 0 (0.0%) | $0 |
| 25 to 44 Years | 215 (36.9%) | $77,747 |
| 45 to 64 Years | 205 (35.2%) | $44,659 |
| 65+ Years | 162 (27.8%) | $29,032 |
| Total | 582 (100.0%) | $63,750 |
Poverty in Hoopers Creek
Income Below Poverty by Sex and Age in Hoopers Creek
With 14.1% poverty level for males and 3.8% for females among the residents of Hoopers Creek, 5 year old males and 65 to 74 year old females are the most vulnerable to poverty, with 16 males (100.0%) and 15 females (18.3%) in their respective age groups living below the poverty level.
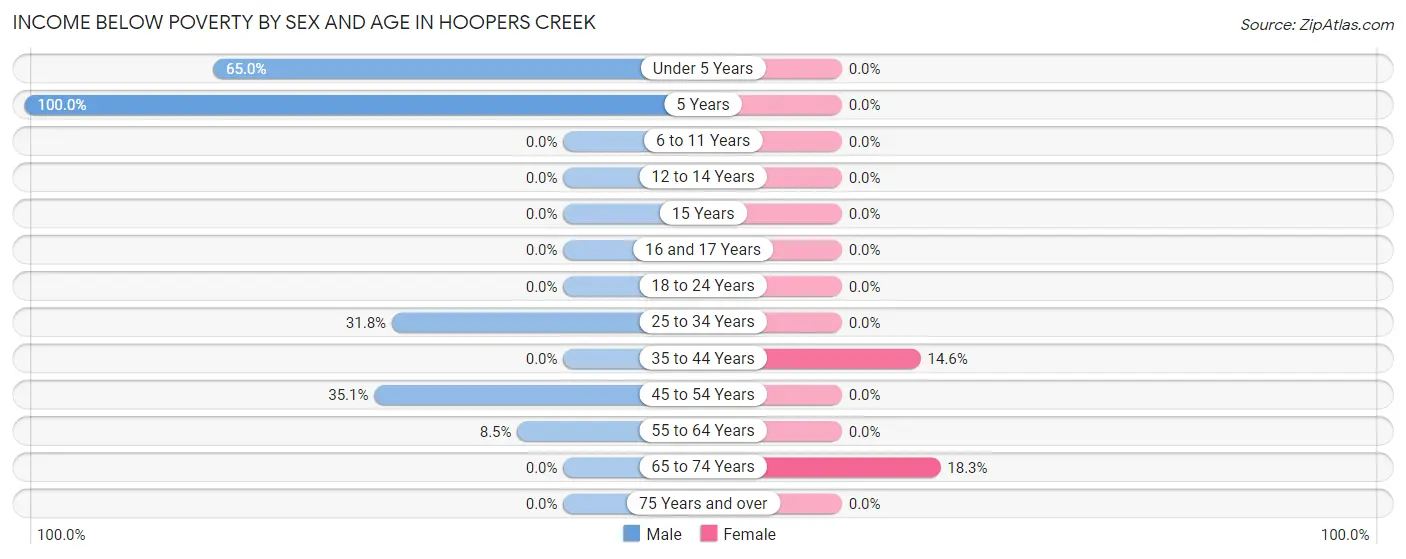
| Age Bracket | Male | Female |
| Under 5 Years | 13 (65.0%) | 0 (0.0%) |
| 5 Years | 16 (100.0%) | 0 (0.0%) |
| 6 to 11 Years | 0 (0.0%) | 0 (0.0%) |
| 12 to 14 Years | 0 (0.0%) | 0 (0.0%) |
| 15 Years | 0 (0.0%) | 0 (0.0%) |
| 16 and 17 Years | 0 (0.0%) | 0 (0.0%) |
| 18 to 24 Years | 0 (0.0%) | 0 (0.0%) |
| 25 to 34 Years | 14 (31.8%) | 0 (0.0%) |
| 35 to 44 Years | 0 (0.0%) | 18 (14.6%) |
| 45 to 54 Years | 40 (35.1%) | 0 (0.0%) |
| 55 to 64 Years | 7 (8.5%) | 0 (0.0%) |
| 65 to 74 Years | 0 (0.0%) | 15 (18.3%) |
| 75 Years and over | 0 (0.0%) | 0 (0.0%) |
| Total | 90 (14.1%) | 33 (3.8%) |
Income Above Poverty by Sex and Age in Hoopers Creek
According to the poverty statistics in Hoopers Creek, males aged 6 to 11 years and females aged under 5 years are the age groups that are most secure financially, with 100.0% of males and 100.0% of females in these age groups living above the poverty line.
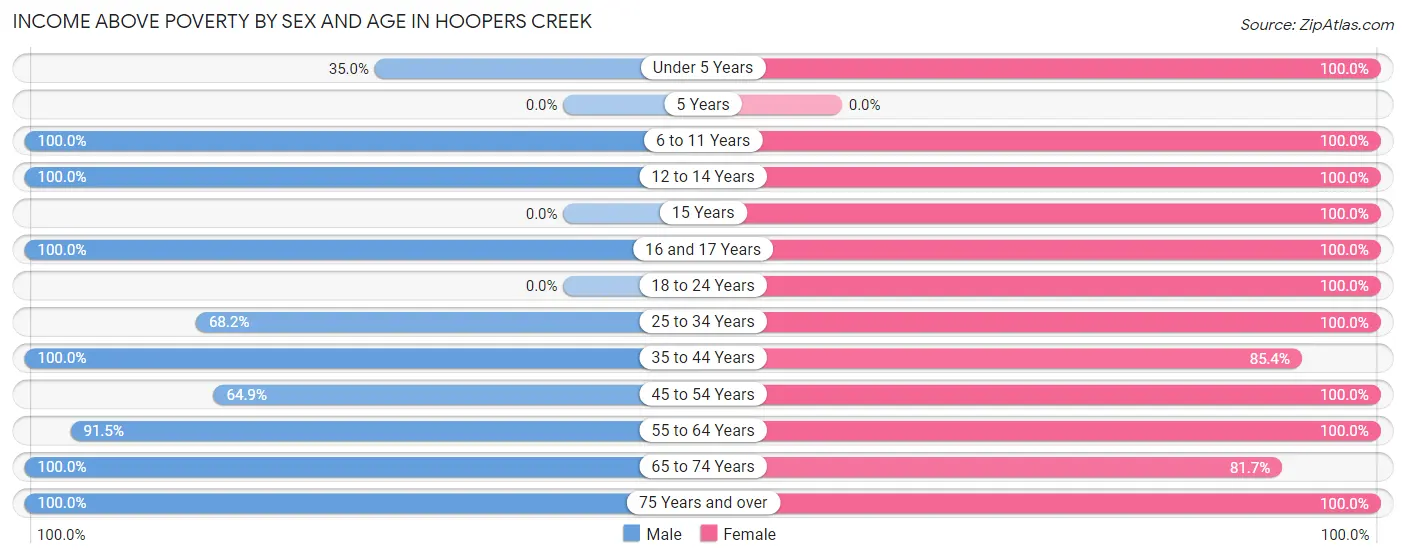
| Age Bracket | Male | Female |
| Under 5 Years | 7 (35.0%) | 19 (100.0%) |
| 5 Years | 0 (0.0%) | 0 (0.0%) |
| 6 to 11 Years | 38 (100.0%) | 9 (100.0%) |
| 12 to 14 Years | 21 (100.0%) | 108 (100.0%) |
| 15 Years | 0 (0.0%) | 98 (100.0%) |
| 16 and 17 Years | 16 (100.0%) | 103 (100.0%) |
| 18 to 24 Years | 0 (0.0%) | 40 (100.0%) |
| 25 to 34 Years | 30 (68.2%) | 82 (100.0%) |
| 35 to 44 Years | 171 (100.0%) | 105 (85.4%) |
| 45 to 54 Years | 74 (64.9%) | 92 (100.0%) |
| 55 to 64 Years | 75 (91.5%) | 50 (100.0%) |
| 65 to 74 Years | 92 (100.0%) | 67 (81.7%) |
| 75 Years and over | 23 (100.0%) | 72 (100.0%) |
| Total | 547 (85.9%) | 845 (96.2%) |
Income Below Poverty Among Married-Couple Families in Hoopers Creek
The poverty statistics for married-couple families in Hoopers Creek show that 6.0% or 25 of the total 413 families live below the poverty line. Families with 1 or 2 children have the highest poverty rate of 24.0%, comprising of 18 families. On the other hand, families with 3 or 4 children have the lowest poverty rate of 0.0%, which includes 0 families.
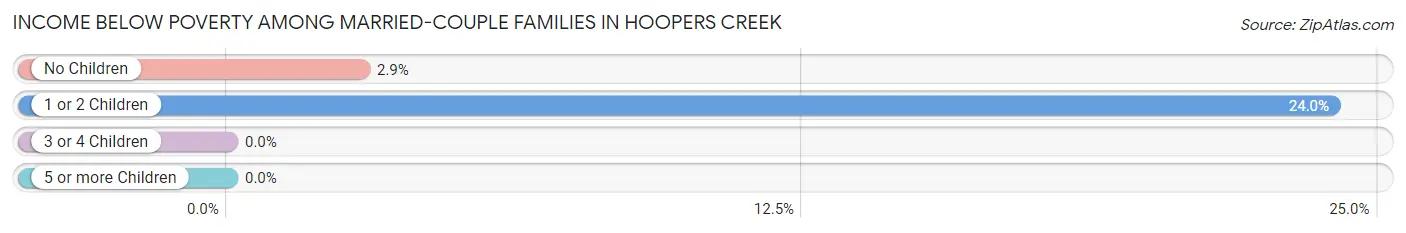
| Children | Above Poverty | Below Poverty |
| No Children | 237 (97.1%) | 7 (2.9%) |
| 1 or 2 Children | 57 (76.0%) | 18 (24.0%) |
| 3 or 4 Children | 94 (100.0%) | 0 (0.0%) |
| 5 or more Children | 0 (0.0%) | 0 (0.0%) |
| Total | 388 (94.0%) | 25 (6.0%) |
Income Below Poverty Among Single-Parent Households in Hoopers Creek
| Children | Single Father | Single Mother |
| No Children | 0 (0.0%) | 0 (0.0%) |
| 1 or 2 Children | 0 (0.0%) | 0 (0.0%) |
| 3 or 4 Children | 0 (0.0%) | 0 (0.0%) |
| 5 or more Children | 0 (0.0%) | 0 (0.0%) |
| Total | 0 (0.0%) | 0 (0.0%) |
Income Below Poverty Among Married-Couple vs Single-Parent Households in Hoopers Creek
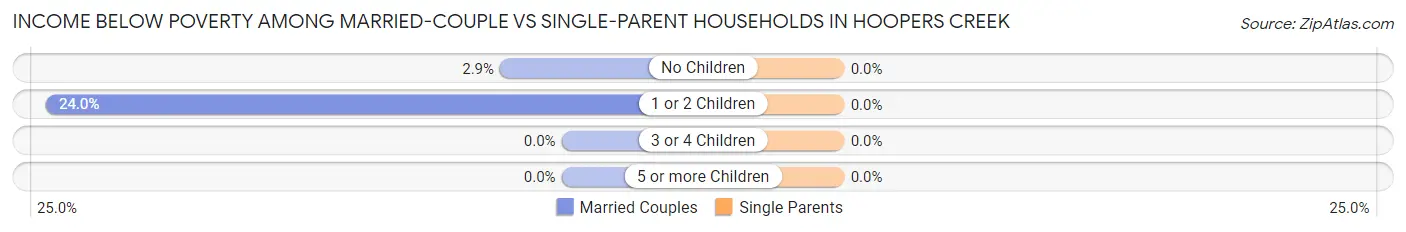
| Children | Married-Couple Families | Single-Parent Households |
| No Children | 7 (2.9%) | 0 (0.0%) |
| 1 or 2 Children | 18 (24.0%) | 0 (0.0%) |
| 3 or 4 Children | 0 (0.0%) | 0 (0.0%) |
| 5 or more Children | 0 (0.0%) | 0 (0.0%) |
| Total | 25 (6.0%) | 0 (0.0%) |
Race in Hoopers Creek
The most populous races in Hoopers Creek are White / Caucasian (1,493 | 98.6%), Hispanic or Latino (39 | 2.6%), and Two or more Races (22 | 1.5%).
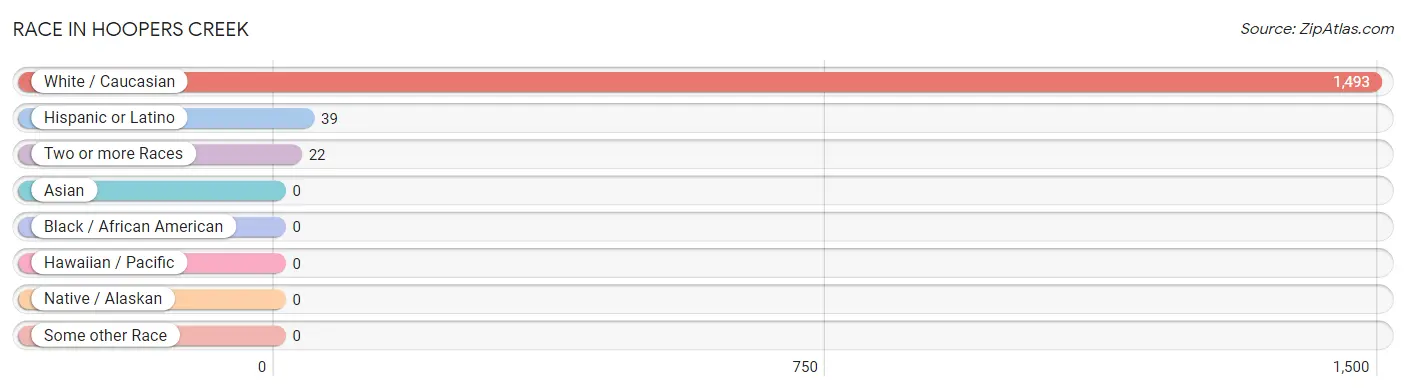
| Race | # Population | % Population |
| Asian | 0 | 0.0% |
| Black / African American | 0 | 0.0% |
| Hawaiian / Pacific | 0 | 0.0% |
| Hispanic or Latino | 39 | 2.6% |
| Native / Alaskan | 0 | 0.0% |
| White / Caucasian | 1,493 | 98.6% |
| Two or more Races | 22 | 1.5% |
| Some other Race | 0 | 0.0% |
| Total | 1,515 | 100.0% |
Ancestry in Hoopers Creek
The most populous ancestries reported in Hoopers Creek are Scotch-Irish (377 | 24.9%), German (201 | 13.3%), English (160 | 10.6%), Irish (128 | 8.5%), and American (106 | 7.0%), together accounting for 64.2% of all Hoopers Creek residents.
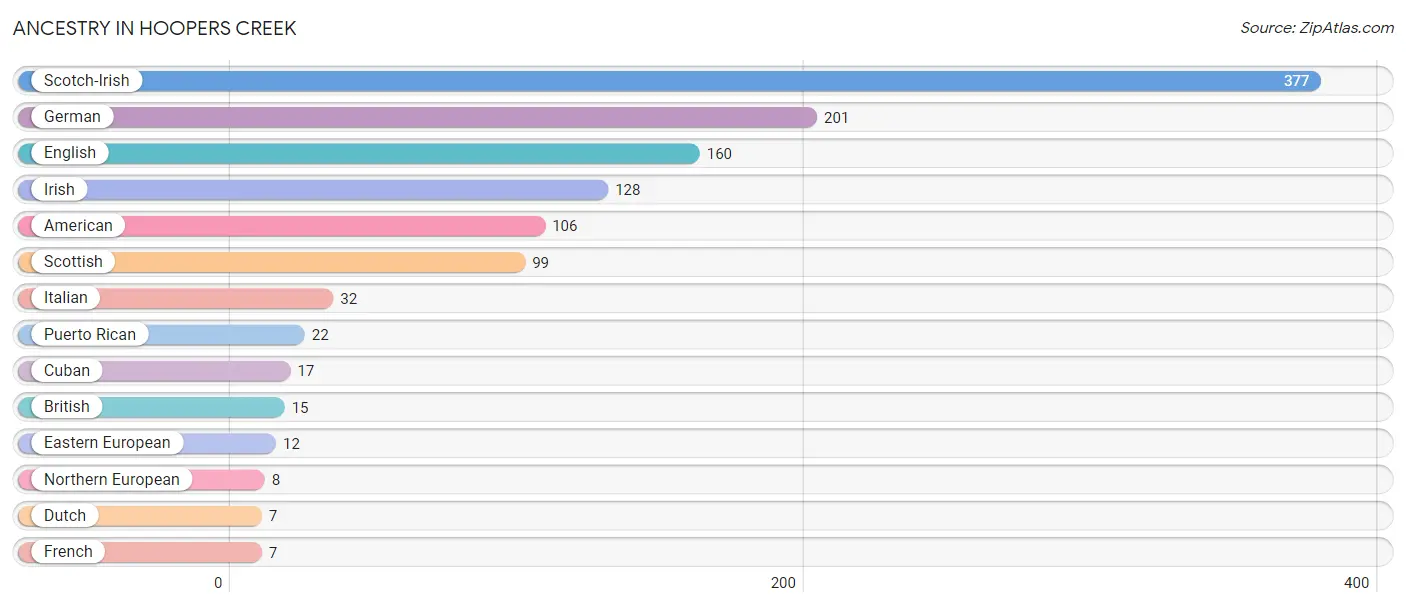
| Ancestry | # Population | % Population |
| American | 106 | 7.0% |
| British | 15 | 1.0% |
| Cuban | 17 | 1.1% |
| Dutch | 7 | 0.5% |
| Eastern European | 12 | 0.8% |
| English | 160 | 10.6% |
| French | 7 | 0.5% |
| German | 201 | 13.3% |
| Irish | 128 | 8.5% |
| Italian | 32 | 2.1% |
| Northern European | 8 | 0.5% |
| Puerto Rican | 22 | 1.5% |
| Scotch-Irish | 377 | 24.9% |
| Scottish | 99 | 6.5% | View All 14 Rows |
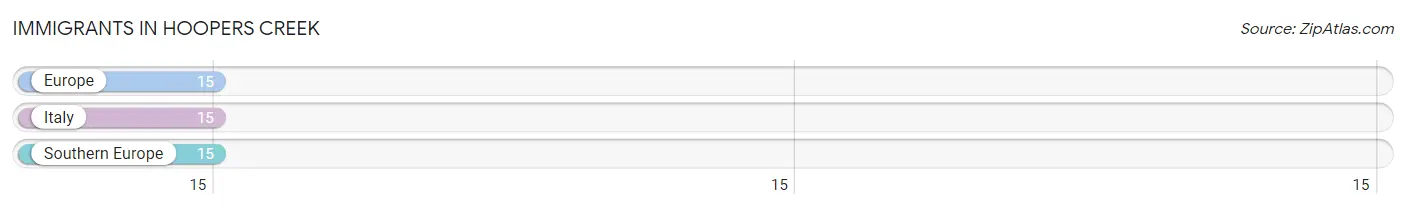
Immigrants in Hoopers Creek
The most numerous immigrant groups reported in Hoopers Creek came from Europe (15 | 1.0%), Italy (15 | 1.0%), and Southern Europe (15 | 1.0%), together accounting for 3.0% of all Hoopers Creek residents.
| Immigration Origin | # Population | % Population |
| Europe | 15 | 1.0% |
| Italy | 15 | 1.0% |
| Southern Europe | 15 | 1.0% | View All 3 Rows |
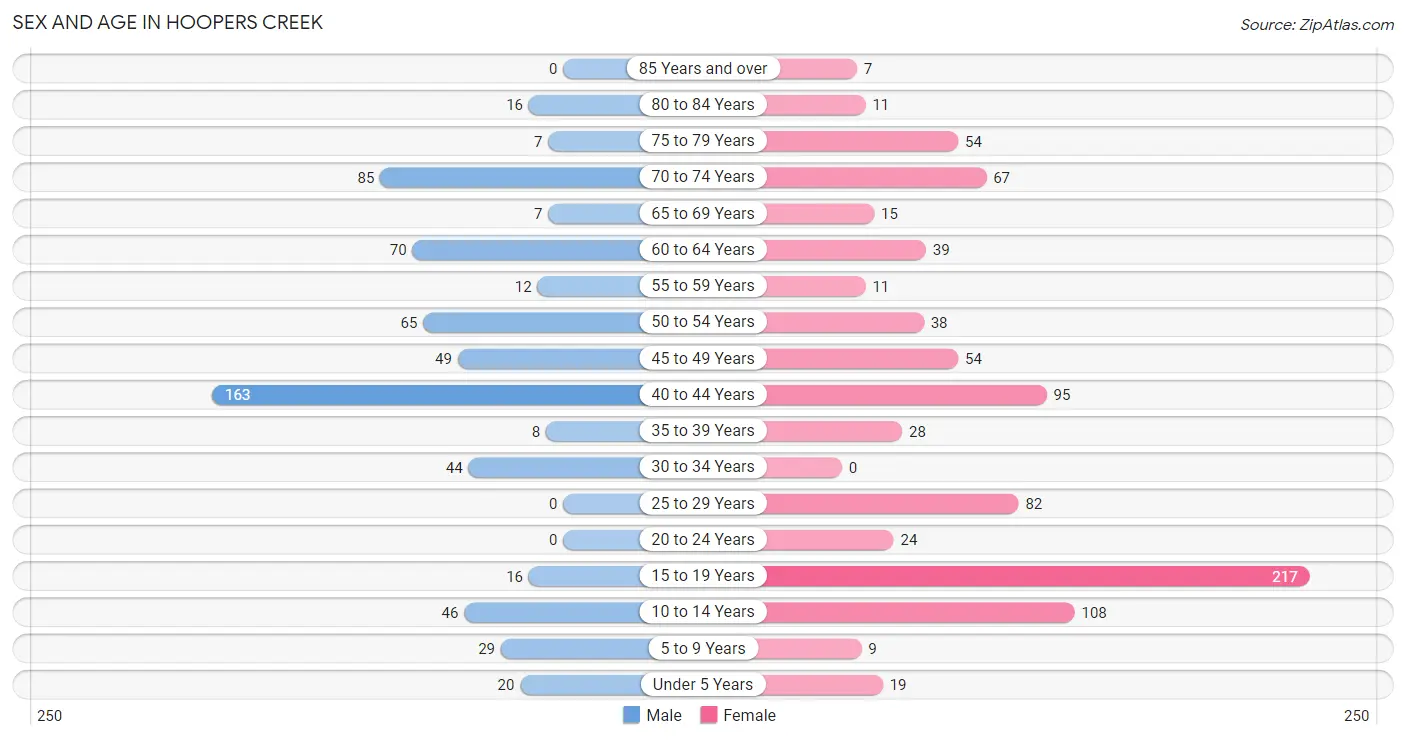
Sex and Age in Hoopers Creek
Sex and Age in Hoopers Creek
The most populous age groups in Hoopers Creek are 40 to 44 Years (163 | 25.6%) for men and 15 to 19 Years (217 | 24.7%) for women.
| Age Bracket | Male | Female |
| Under 5 Years | 20 (3.1%) | 19 (2.2%) |
| 5 to 9 Years | 29 (4.5%) | 9 (1.0%) |
| 10 to 14 Years | 46 (7.2%) | 108 (12.3%) |
| 15 to 19 Years | 16 (2.5%) | 217 (24.7%) |
| 20 to 24 Years | 0 (0.0%) | 24 (2.7%) |
| 25 to 29 Years | 0 (0.0%) | 82 (9.3%) |
| 30 to 34 Years | 44 (6.9%) | 0 (0.0%) |
| 35 to 39 Years | 8 (1.3%) | 28 (3.2%) |
| 40 to 44 Years | 163 (25.6%) | 95 (10.8%) |
| 45 to 49 Years | 49 (7.7%) | 54 (6.1%) |
| 50 to 54 Years | 65 (10.2%) | 38 (4.3%) |
| 55 to 59 Years | 12 (1.9%) | 11 (1.3%) |
| 60 to 64 Years | 70 (11.0%) | 39 (4.4%) |
| 65 to 69 Years | 7 (1.1%) | 15 (1.7%) |
| 70 to 74 Years | 85 (13.3%) | 67 (7.6%) |
| 75 to 79 Years | 7 (1.1%) | 54 (6.1%) |
| 80 to 84 Years | 16 (2.5%) | 11 (1.3%) |
| 85 Years and over | 0 (0.0%) | 7 (0.8%) |
| Total | 637 (100.0%) | 878 (100.0%) |
Families and Households in Hoopers Creek
Median Family Size in Hoopers Creek
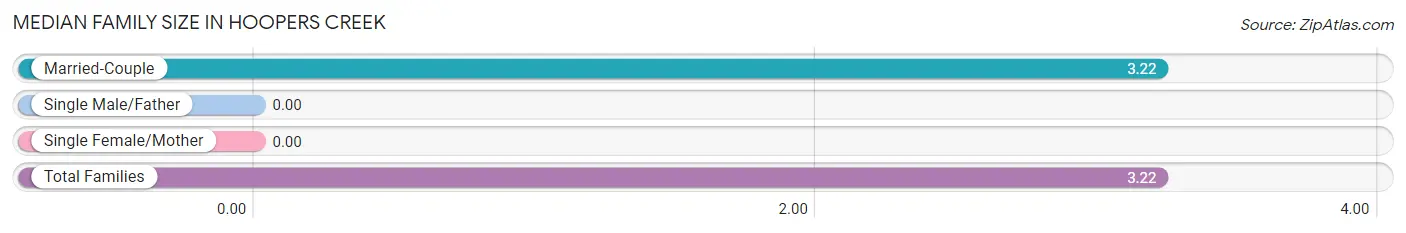
| Family Type | # Families | Family Size |
| Married-Couple | 413 (100.0%) | 3.22 |
| Single Male/Father | 0 (0.0%) | - |
| Single Female/Mother | 0 (0.0%) | - |
| Total Families | 413 (100.0%) | 3.22 |
Median Household Size in Hoopers Creek
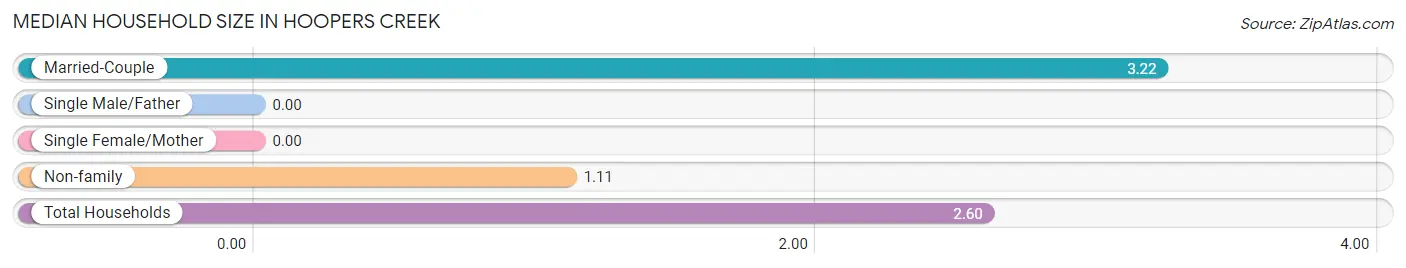
| Household Type | # Households | Household Size |
| Married-Couple | 413 (71.0%) | 3.22 |
| Single Male/Father | 0 (0.0%) | - |
| Single Female/Mother | 0 (0.0%) | - |
| Non-family | 169 (29.0%) | 1.11 |
| Total Households | 582 (100.0%) | 2.60 |
Household Size by Marriage Status in Hoopers Creek
Out of a total of 582 households in Hoopers Creek, 413 (71.0%) are family households, while 169 (29.0%) are nonfamily households. The most numerous type of family households are 2-person households, comprising 218, and the most common type of nonfamily households are 1-person households, comprising 160.
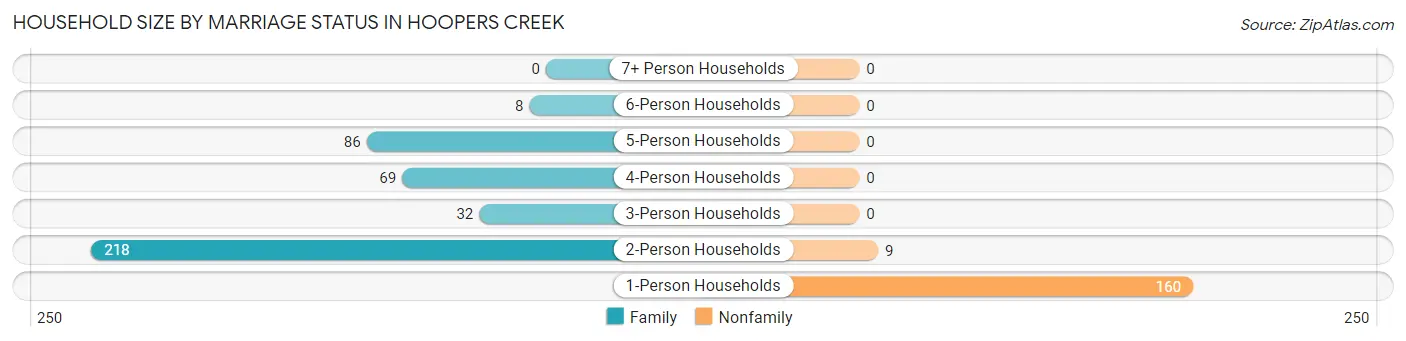
| Household Size | Family Households | Nonfamily Households |
| 1-Person Households | - | 160 (27.5%) |
| 2-Person Households | 218 (37.5%) | 9 (1.5%) |
| 3-Person Households | 32 (5.5%) | 0 (0.0%) |
| 4-Person Households | 69 (11.9%) | 0 (0.0%) |
| 5-Person Households | 86 (14.8%) | 0 (0.0%) |
| 6-Person Households | 8 (1.4%) | 0 (0.0%) |
| 7+ Person Households | 0 (0.0%) | 0 (0.0%) |
| Total | 413 (71.0%) | 169 (29.0%) |
Female Fertility in Hoopers Creek
Fertility by Age in Hoopers Creek
| Age Bracket | Women with Births | Births / 1,000 Women |
| 15 to 19 years | 0 (0.0%) | 0.0 |
| 20 to 34 years | 0 (0.0%) | 0.0 |
| 35 to 50 years | 0 (0.0%) | 0.0 |
| Total | 0 (0.0%) | 0.0 |
Fertility by Age by Marriage Status in Hoopers Creek
| Age Bracket | Married | Unmarried |
| 15 to 19 years | 0 (0.0%) | 0 (0.0%) |
| 20 to 34 years | 0 (0.0%) | 0 (0.0%) |
| 35 to 50 years | 0 (0.0%) | 0 (0.0%) |
| Total | 0 (0.0%) | 0 (0.0%) |
Fertility by Education in Hoopers Creek
| Educational Attainment | Women with Births | Births / 1,000 Women |
| Less than High School | 0 (0.0%) | 0.0 |
| High School Diploma | 0 (0.0%) | 0.0 |
| College or Associate's Degree | 0 (0.0%) | 0.0 |
| Bachelor's Degree | 0 (0.0%) | 0.0 |
| Graduate Degree | 0 (0.0%) | 0.0 |
| Total | 0 (0.0%) | 0.0 |
Fertility by Education by Marriage Status in Hoopers Creek
| Educational Attainment | Married | Unmarried |
| Less than High School | 0 (0.0%) | 0 (0.0%) |
| High School Diploma | 0 (0.0%) | 0 (0.0%) |
| College or Associate's Degree | 0 (0.0%) | 0 (0.0%) |
| Bachelor's Degree | 0 (0.0%) | 0 (0.0%) |
| Graduate Degree | 0 (0.0%) | 0 (0.0%) |
| Total | 0 (0.0%) | 0 (0.0%) |
Employment Characteristics in Hoopers Creek
Employment by Class of Employer in Hoopers Creek
Among the 559 employed individuals in Hoopers Creek, private company employees (316 | 56.5%), not-for-profit organizations (123 | 22.0%), and self-employed (not incorporated) (76 | 13.6%) make up the most common classes of employment.
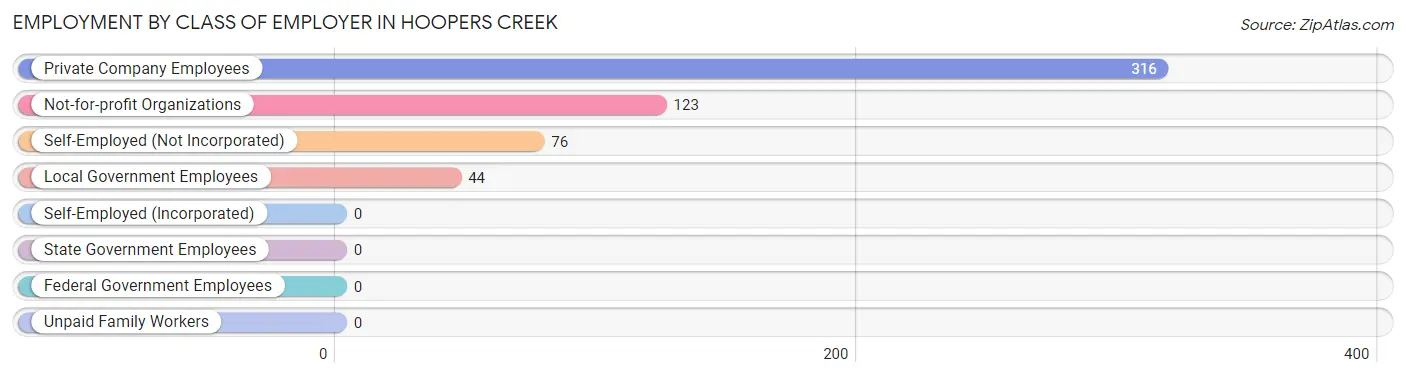
| Employer Class | # Employees | % Employees |
| Private Company Employees | 316 | 56.5% |
| Self-Employed (Incorporated) | 0 | 0.0% |
| Self-Employed (Not Incorporated) | 76 | 13.6% |
| Not-for-profit Organizations | 123 | 22.0% |
| Local Government Employees | 44 | 7.9% |
| State Government Employees | 0 | 0.0% |
| Federal Government Employees | 0 | 0.0% |
| Unpaid Family Workers | 0 | 0.0% |
| Total | 559 | 100.0% |
Employment Status by Age in Hoopers Creek
According to the labor force statistics for Hoopers Creek, out of the total population over 16 years of age (1,186), 48.7% or 578 individuals are in the labor force, with 3.3% or 19 of them unemployed. The age group with the highest labor force participation rate is 20 to 24 years, with 100.0% or 24 individuals in the labor force. Within the labor force, the 45 to 54 years age range has the highest percentage of unemployed individuals, with 9.9% or 19 of them being unemployed.
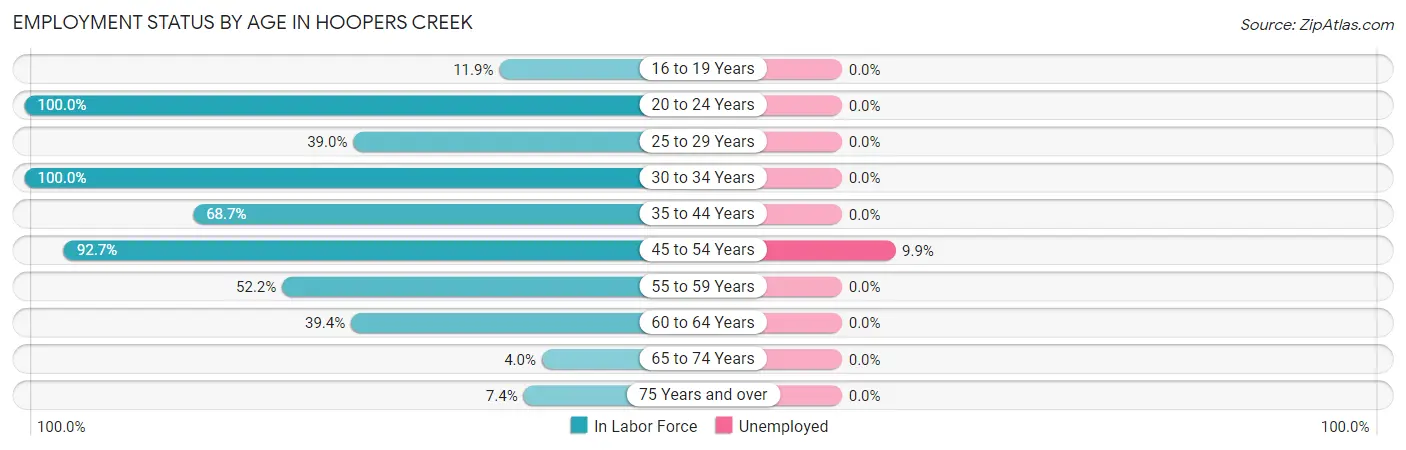
| Age Bracket | In Labor Force | Unemployed |
| 16 to 19 Years | 16 (11.9%) | 0 (0.0%) |
| 20 to 24 Years | 24 (100.0%) | 0 (0.0%) |
| 25 to 29 Years | 32 (39.0%) | 0 (0.0%) |
| 30 to 34 Years | 44 (100.0%) | 0 (0.0%) |
| 35 to 44 Years | 202 (68.7%) | 0 (0.0%) |
| 45 to 54 Years | 191 (92.7%) | 19 (9.9%) |
| 55 to 59 Years | 12 (52.2%) | 0 (0.0%) |
| 60 to 64 Years | 43 (39.4%) | 0 (0.0%) |
| 65 to 74 Years | 7 (4.0%) | 0 (0.0%) |
| 75 Years and over | 7 (7.4%) | 0 (0.0%) |
| Total | 578 (48.7%) | 19 (3.3%) |
Employment Status by Educational Attainment in Hoopers Creek
According to labor force statistics for Hoopers Creek, 69.1% of individuals (524) out of the total population between 25 and 64 years of age (758) are in the labor force, with 3.6% or 19 of them being unemployed. The group with the highest labor force participation rate are those with the educational attainment of bachelor's degree or higher, with 79.5% or 178 individuals in the labor force. Within the labor force, individuals with bachelor's degree or higher education have the highest percentage of unemployment, with 10.7% or 19 of them being unemployed.
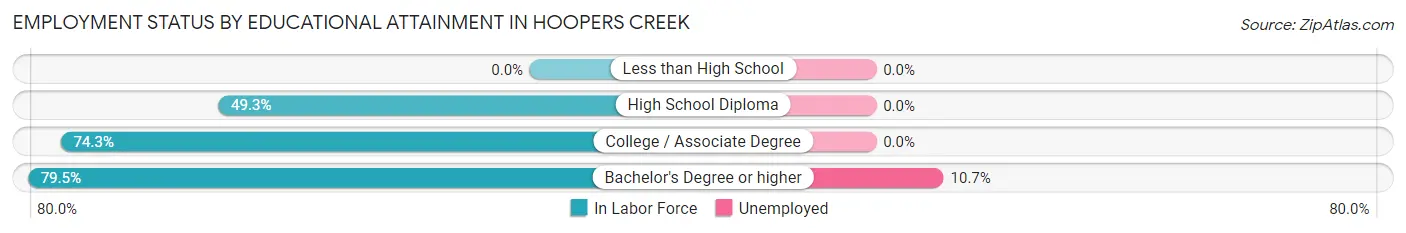
| Educational Attainment | In Labor Force | Unemployed |
| Less than High School | 0 (0.0%) | 0 (0.0%) |
| High School Diploma | 100 (49.3%) | 0 (0.0%) |
| College / Associate Degree | 246 (74.3%) | 0 (0.0%) |
| Bachelor's Degree or higher | 178 (79.5%) | 24 (10.7%) |
| Total | 524 (69.1%) | 27 (3.6%) |
Employment Occupations by Sex in Hoopers Creek
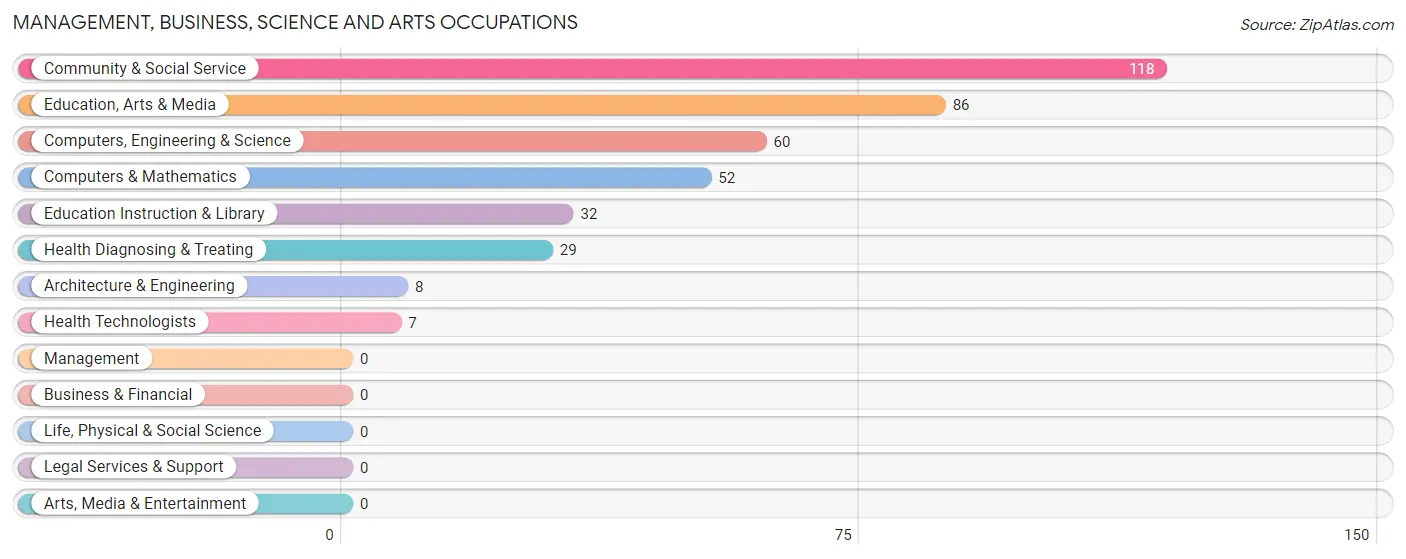
Management, Business, Science and Arts Occupations
The most common Management, Business, Science and Arts occupations in Hoopers Creek are Community & Social Service (118 | 21.1%), Education, Arts & Media (86 | 15.4%), Computers, Engineering & Science (60 | 10.7%), Computers & Mathematics (52 | 9.3%), and Education Instruction & Library (32 | 5.7%).
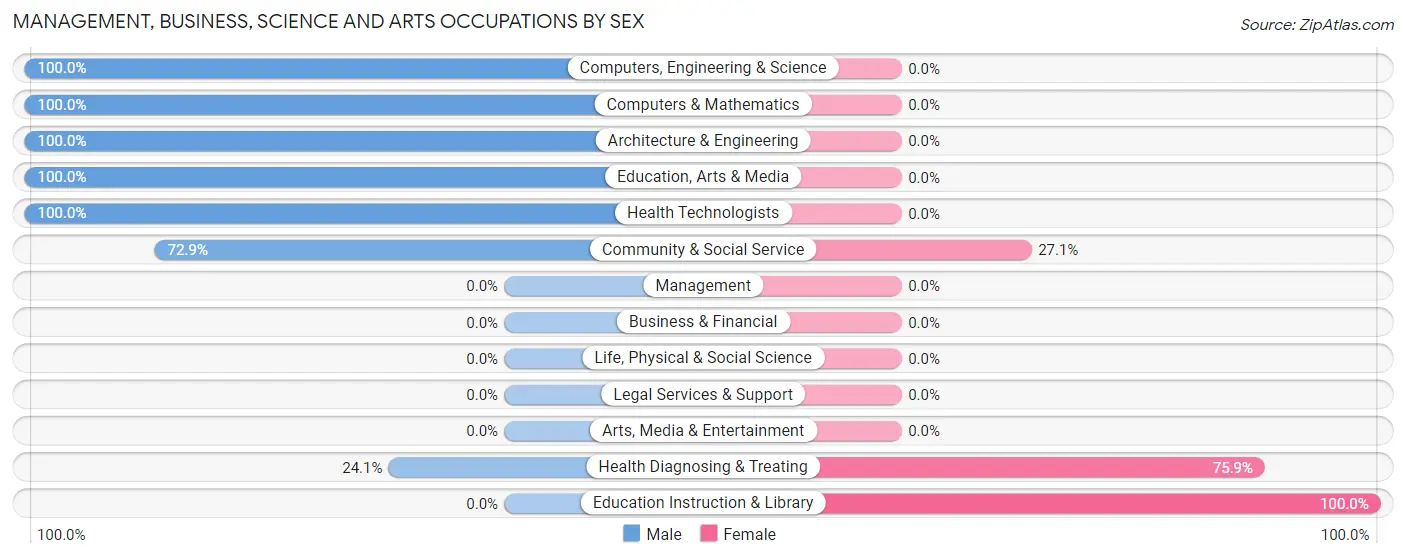
Management, Business, Science and Arts Occupations by Sex
Within the Management, Business, Science and Arts occupations in Hoopers Creek, the most male-oriented occupations are Computers, Engineering & Science (100.0%), Computers & Mathematics (100.0%), and Architecture & Engineering (100.0%), while the most female-oriented occupations are Education Instruction & Library (100.0%), Health Diagnosing & Treating (75.9%), and Community & Social Service (27.1%).
| Occupation | Male | Female |
| Management | 0 (0.0%) | 0 (0.0%) |
| Business & Financial | 0 (0.0%) | 0 (0.0%) |
| Computers, Engineering & Science | 60 (100.0%) | 0 (0.0%) |
| Computers & Mathematics | 52 (100.0%) | 0 (0.0%) |
| Architecture & Engineering | 8 (100.0%) | 0 (0.0%) |
| Life, Physical & Social Science | 0 (0.0%) | 0 (0.0%) |
| Community & Social Service | 86 (72.9%) | 32 (27.1%) |
| Education, Arts & Media | 86 (100.0%) | 0 (0.0%) |
| Legal Services & Support | 0 (0.0%) | 0 (0.0%) |
| Education Instruction & Library | 0 (0.0%) | 32 (100.0%) |
| Arts, Media & Entertainment | 0 (0.0%) | 0 (0.0%) |
| Health Diagnosing & Treating | 7 (24.1%) | 22 (75.9%) |
| Health Technologists | 7 (100.0%) | 0 (0.0%) |
| Total (Category) | 153 (73.9%) | 54 (26.1%) |
| Total (Overall) | 388 (69.4%) | 171 (30.6%) |
Services Occupations
Services Occupations by Sex
| Occupation | Male | Female |
| Healthcare Support | 0 (0.0%) | 0 (0.0%) |
| Security & Protection | 0 (0.0%) | 0 (0.0%) |
| Firefighting & Prevention | 0 (0.0%) | 0 (0.0%) |
| Law Enforcement | 0 (0.0%) | 0 (0.0%) |
| Food Preparation & Serving | 0 (0.0%) | 0 (0.0%) |
| Cleaning & Maintenance | 0 (0.0%) | 0 (0.0%) |
| Personal Care & Service | 0 (0.0%) | 0 (0.0%) |
| Total (Category) | 0 (0.0%) | 0 (0.0%) |
| Total (Overall) | 388 (69.4%) | 171 (30.6%) |
Sales and Office Occupations
The most common Sales and Office occupations in Hoopers Creek are Sales & Related (95 | 17.0%), and Office & Administration (69 | 12.3%).
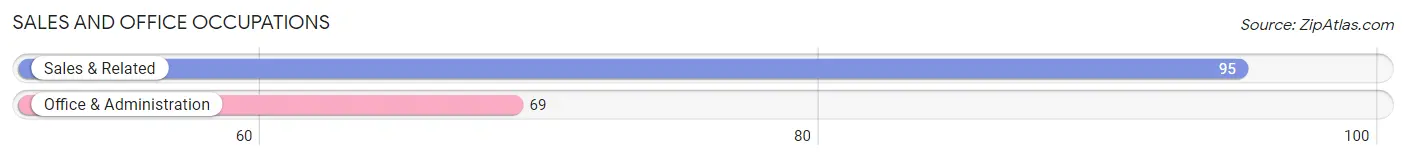
Sales and Office Occupations by Sex
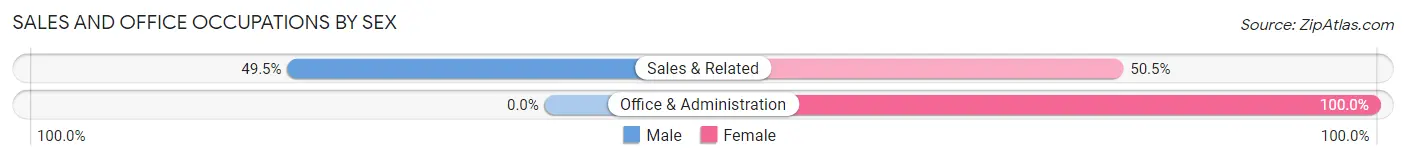
| Occupation | Male | Female |
| Sales & Related | 47 (49.5%) | 48 (50.5%) |
| Office & Administration | 0 (0.0%) | 69 (100.0%) |
| Total (Category) | 47 (28.7%) | 117 (71.3%) |
| Total (Overall) | 388 (69.4%) | 171 (30.6%) |
Natural Resources, Construction and Maintenance Occupations
The most common Natural Resources, Construction and Maintenance occupations in Hoopers Creek are Installation, Maintenance & Repair (74 | 13.2%), and Construction & Extraction (19 | 3.4%).
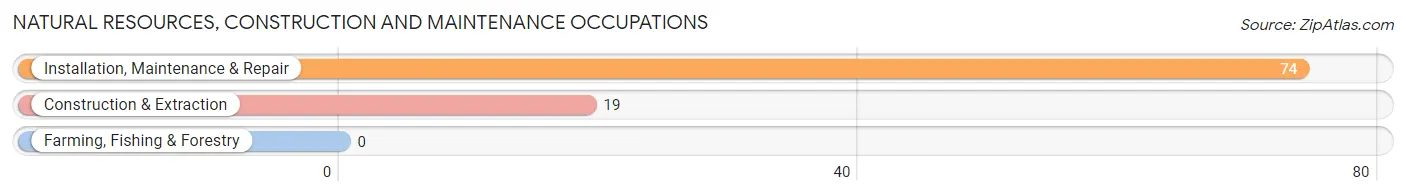
Natural Resources, Construction and Maintenance Occupations by Sex
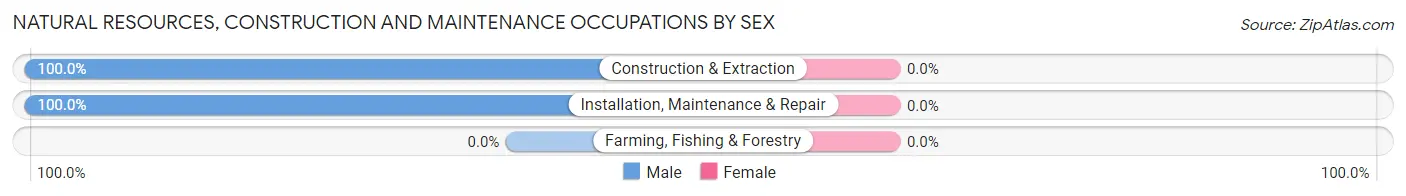
| Occupation | Male | Female |
| Farming, Fishing & Forestry | 0 (0.0%) | 0 (0.0%) |
| Construction & Extraction | 19 (100.0%) | 0 (0.0%) |
| Installation, Maintenance & Repair | 74 (100.0%) | 0 (0.0%) |
| Total (Category) | 93 (100.0%) | 0 (0.0%) |
| Total (Overall) | 388 (69.4%) | 171 (30.6%) |
Production, Transportation and Moving Occupations
The most common Production, Transportation and Moving occupations in Hoopers Creek are Transportation (72 | 12.9%), Material Moving (16 | 2.9%), and Production (7 | 1.3%).
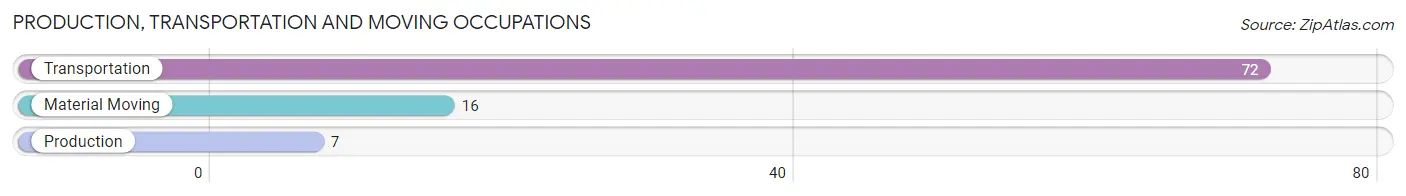
Production, Transportation and Moving Occupations by Sex
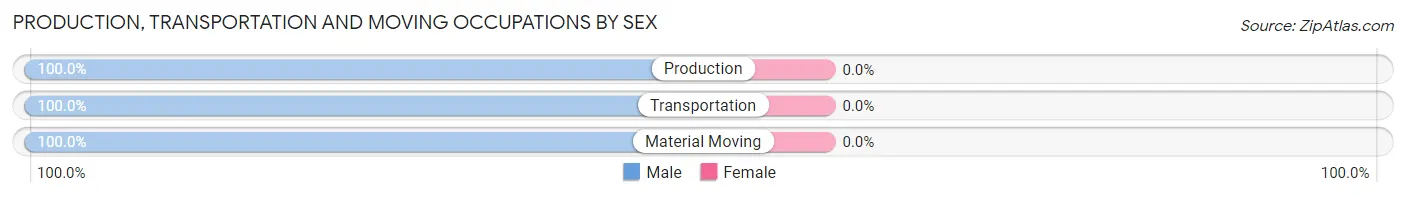
| Occupation | Male | Female |
| Production | 7 (100.0%) | 0 (0.0%) |
| Transportation | 72 (100.0%) | 0 (0.0%) |
| Material Moving | 16 (100.0%) | 0 (0.0%) |
| Total (Category) | 95 (100.0%) | 0 (0.0%) |
| Total (Overall) | 388 (69.4%) | 171 (30.6%) |
Employment Industries by Sex in Hoopers Creek
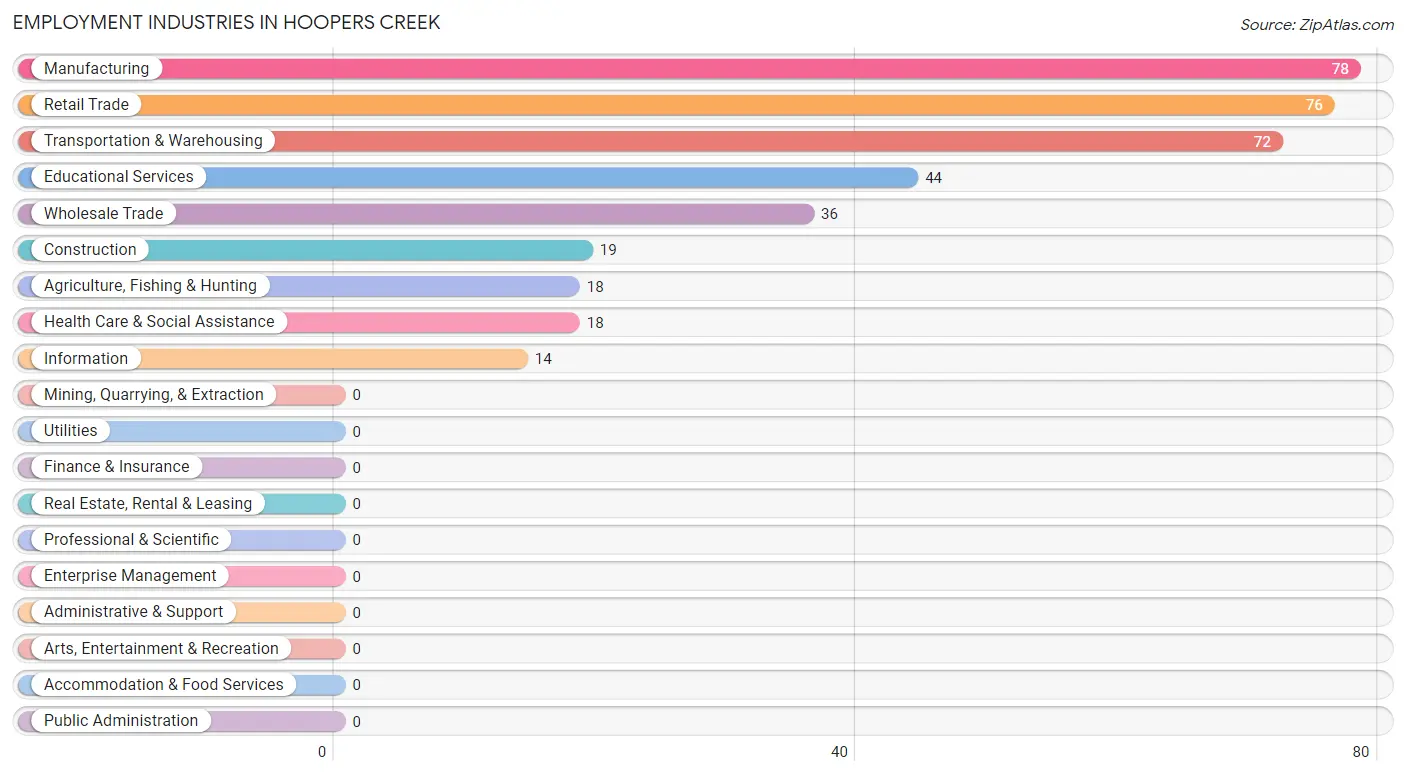
Employment Industries in Hoopers Creek
The major employment industries in Hoopers Creek include Manufacturing (78 | 14.0%), Retail Trade (76 | 13.6%), Transportation & Warehousing (72 | 12.9%), Educational Services (44 | 7.9%), and Wholesale Trade (36 | 6.4%).
Employment Industries by Sex in Hoopers Creek
The Hoopers Creek industries that see more men than women are Construction (100.0%), Manufacturing (100.0%), and Transportation & Warehousing (100.0%), whereas the industries that tend to have a higher number of women are Agriculture, Fishing & Hunting (100.0%), Health Care & Social Assistance (100.0%), and Educational Services (72.7%).
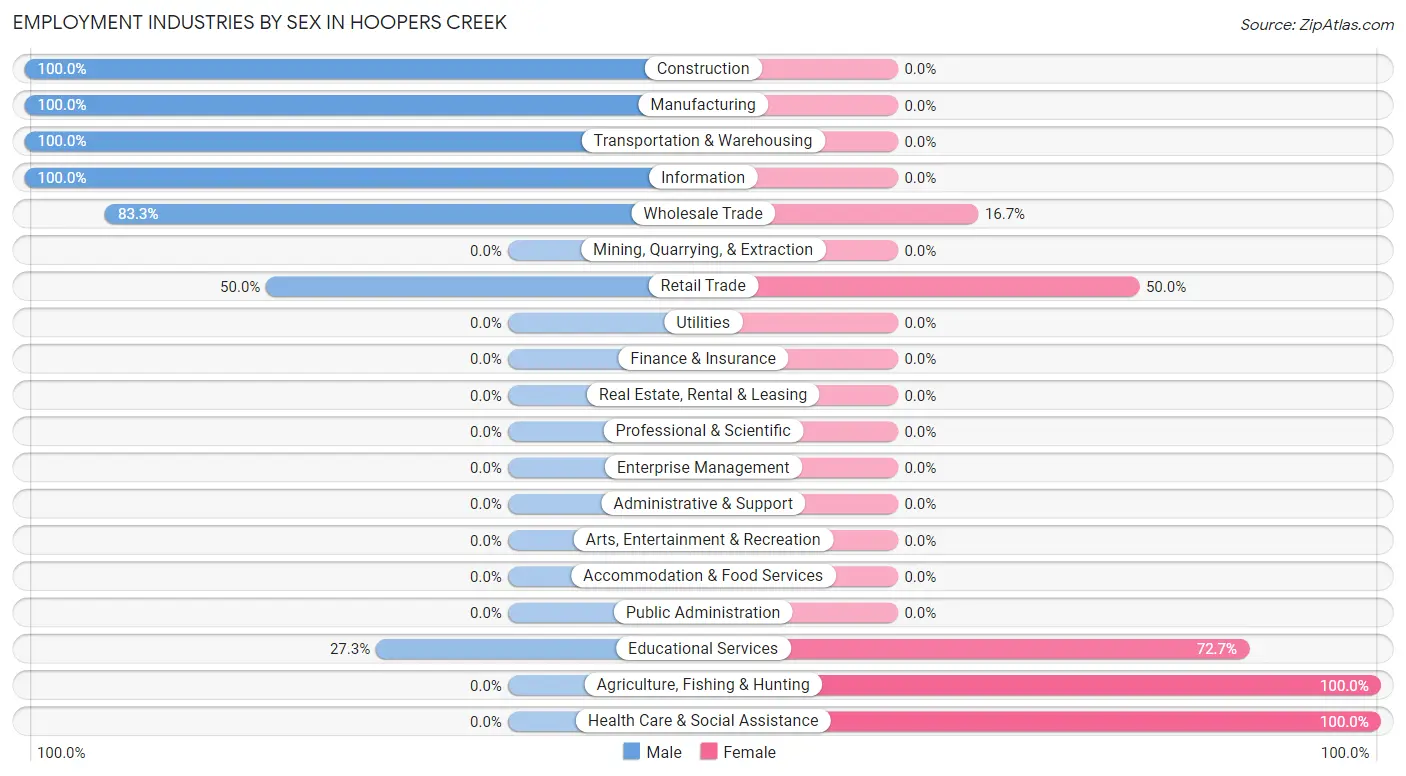
| Industry | Male | Female |
| Agriculture, Fishing & Hunting | 0 (0.0%) | 18 (100.0%) |
| Mining, Quarrying, & Extraction | 0 (0.0%) | 0 (0.0%) |
| Construction | 19 (100.0%) | 0 (0.0%) |
| Manufacturing | 78 (100.0%) | 0 (0.0%) |
| Wholesale Trade | 30 (83.3%) | 6 (16.7%) |
| Retail Trade | 38 (50.0%) | 38 (50.0%) |
| Transportation & Warehousing | 72 (100.0%) | 0 (0.0%) |
| Utilities | 0 (0.0%) | 0 (0.0%) |
| Information | 14 (100.0%) | 0 (0.0%) |
| Finance & Insurance | 0 (0.0%) | 0 (0.0%) |
| Real Estate, Rental & Leasing | 0 (0.0%) | 0 (0.0%) |
| Professional & Scientific | 0 (0.0%) | 0 (0.0%) |
| Enterprise Management | 0 (0.0%) | 0 (0.0%) |
| Administrative & Support | 0 (0.0%) | 0 (0.0%) |
| Educational Services | 12 (27.3%) | 32 (72.7%) |
| Health Care & Social Assistance | 0 (0.0%) | 18 (100.0%) |
| Arts, Entertainment & Recreation | 0 (0.0%) | 0 (0.0%) |
| Accommodation & Food Services | 0 (0.0%) | 0 (0.0%) |
| Public Administration | 0 (0.0%) | 0 (0.0%) |
| Total | 388 (69.4%) | 171 (30.6%) |
Education in Hoopers Creek
School Enrollment in Hoopers Creek
The most common levels of schooling among the 483 students in Hoopers Creek are high school (233 | 48.2%), middle school (129 | 26.7%), and elementary school (47 | 9.7%).
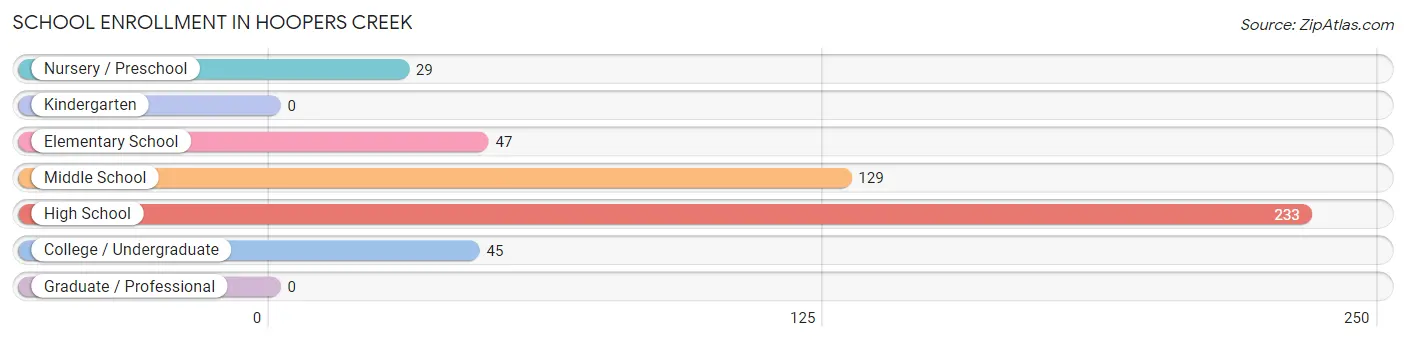
| School Level | # Students | % Students |
| Nursery / Preschool | 29 | 6.0% |
| Kindergarten | 0 | 0.0% |
| Elementary School | 47 | 9.7% |
| Middle School | 129 | 26.7% |
| High School | 233 | 48.2% |
| College / Undergraduate | 45 | 9.3% |
| Graduate / Professional | 0 | 0.0% |
| Total | 483 | 100.0% |
School Enrollment by Age by Funding Source in Hoopers Creek
Out of a total of 483 students who are enrolled in schools in Hoopers Creek, 236 (48.9%) attend a private institution, while the remaining 247 (51.1%) are enrolled in public schools. The age group of 3 to 4 year olds has the highest likelihood of being enrolled in private schools, with 13 (100.0% in the age bracket) enrolled. Conversely, the age group of 18 to 19 year olds has the lowest likelihood of being enrolled in a private school, with 16 (100.0% in the age bracket) attending a public institution.
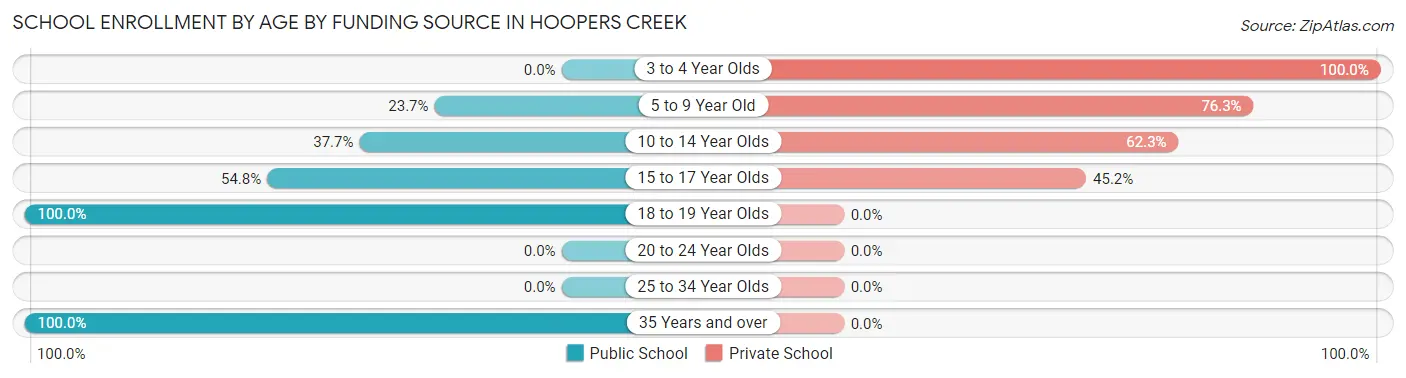
| Age Bracket | Public School | Private School |
| 3 to 4 Year Olds | 0 (0.0%) | 13 (100.0%) |
| 5 to 9 Year Old | 9 (23.7%) | 29 (76.3%) |
| 10 to 14 Year Olds | 58 (37.7%) | 96 (62.3%) |
| 15 to 17 Year Olds | 119 (54.8%) | 98 (45.2%) |
| 18 to 19 Year Olds | 16 (100.0%) | 0 (0.0%) |
| 20 to 24 Year Olds | 0 (0.0%) | 0 (0.0%) |
| 25 to 34 Year Olds | 0 (0.0%) | 0 (0.0%) |
| 35 Years and over | 45 (100.0%) | 0 (0.0%) |
| Total | 247 (51.1%) | 236 (48.9%) |
Educational Attainment by Field of Study in Hoopers Creek
Liberal arts & history (86 | 31.5%), science & technology (53 | 19.4%), business (41 | 15.0%), bio, nature & agricultural (28 | 10.3%), and social sciences (25 | 9.2%) are the most common fields of study among 273 individuals in Hoopers Creek who have obtained a bachelor's degree or higher.
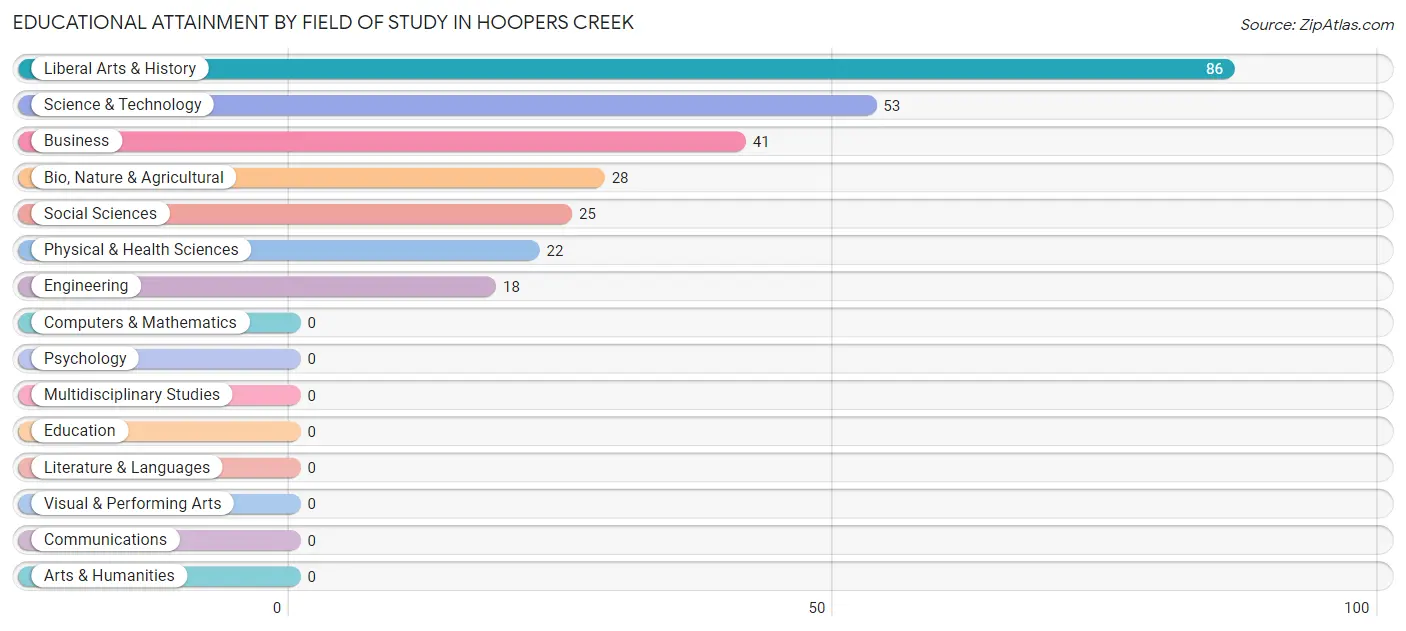
| Field of Study | # Graduates | % Graduates |
| Computers & Mathematics | 0 | 0.0% |
| Bio, Nature & Agricultural | 28 | 10.3% |
| Physical & Health Sciences | 22 | 8.1% |
| Psychology | 0 | 0.0% |
| Social Sciences | 25 | 9.2% |
| Engineering | 18 | 6.6% |
| Multidisciplinary Studies | 0 | 0.0% |
| Science & Technology | 53 | 19.4% |
| Business | 41 | 15.0% |
| Education | 0 | 0.0% |
| Literature & Languages | 0 | 0.0% |
| Liberal Arts & History | 86 | 31.5% |
| Visual & Performing Arts | 0 | 0.0% |
| Communications | 0 | 0.0% |
| Arts & Humanities | 0 | 0.0% |
| Total | 273 | 100.0% |
Transportation & Commute in Hoopers Creek
Vehicle Availability by Sex in Hoopers Creek
The most prevalent vehicle ownership categories in Hoopers Creek are males with 2 vehicles (134, accounting for 34.5%) and females with 2 vehicles (68, making up 78.4%).
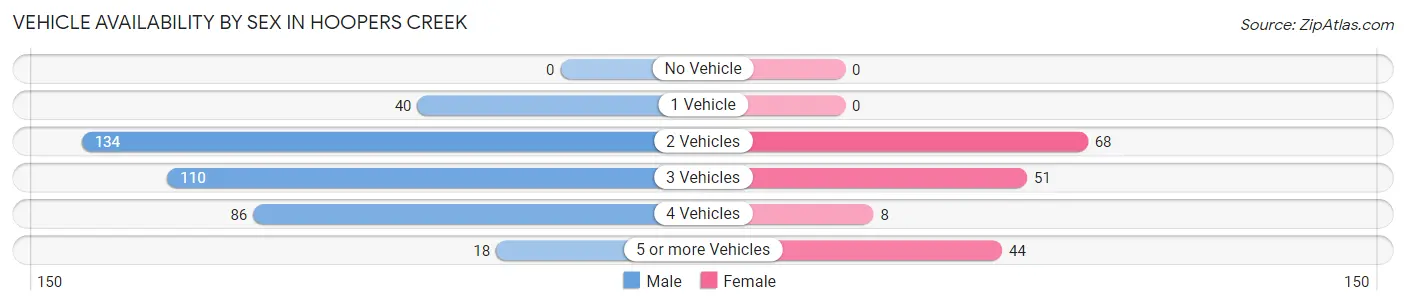
| Vehicles Available | Male | Female |
| No Vehicle | 0 (0.0%) | 0 (0.0%) |
| 1 Vehicle | 40 (10.3%) | 0 (0.0%) |
| 2 Vehicles | 134 (34.5%) | 68 (39.8%) |
| 3 Vehicles | 110 (28.3%) | 51 (29.8%) |
| 4 Vehicles | 86 (22.2%) | 8 (4.7%) |
| 5 or more Vehicles | 18 (4.6%) | 44 (25.7%) |
| Total | 388 (100.0%) | 171 (100.0%) |
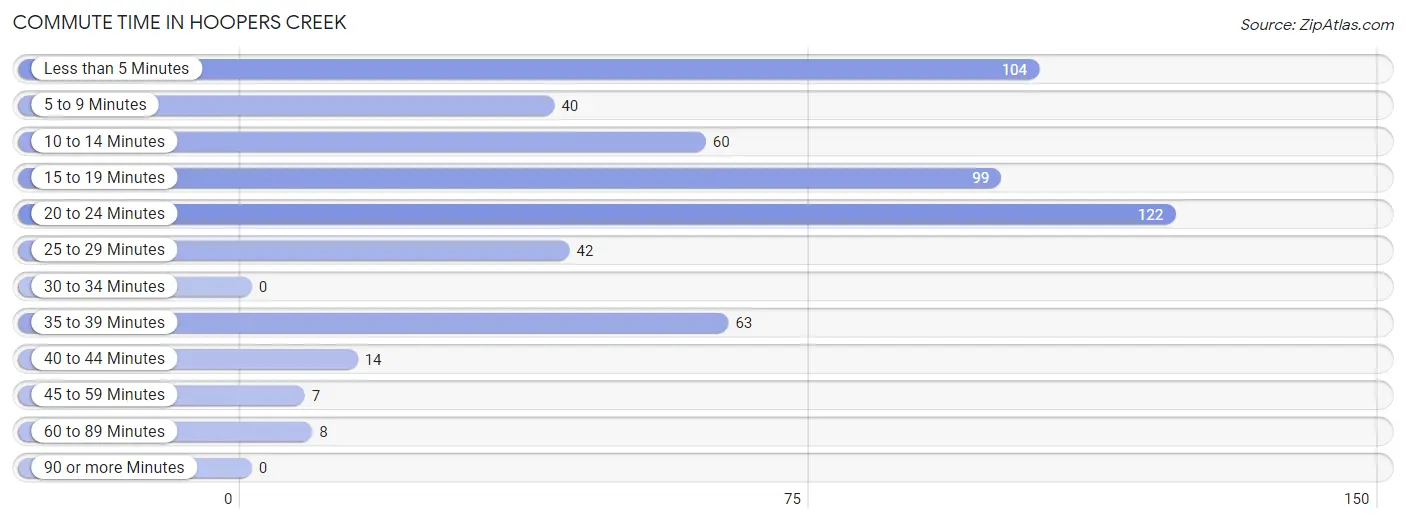
Commute Time in Hoopers Creek
The most frequently occuring commute durations in Hoopers Creek are 20 to 24 minutes (122 commuters, 21.8%), less than 5 minutes (104 commuters, 18.6%), and 15 to 19 minutes (99 commuters, 17.7%).
| Commute Time | # Commuters | % Commuters |
| Less than 5 Minutes | 104 | 18.6% |
| 5 to 9 Minutes | 40 | 7.2% |
| 10 to 14 Minutes | 60 | 10.7% |
| 15 to 19 Minutes | 99 | 17.7% |
| 20 to 24 Minutes | 122 | 21.8% |
| 25 to 29 Minutes | 42 | 7.5% |
| 30 to 34 Minutes | 0 | 0.0% |
| 35 to 39 Minutes | 63 | 11.3% |
| 40 to 44 Minutes | 14 | 2.5% |
| 45 to 59 Minutes | 7 | 1.3% |
| 60 to 89 Minutes | 8 | 1.4% |
| 90 or more Minutes | 0 | 0.0% |
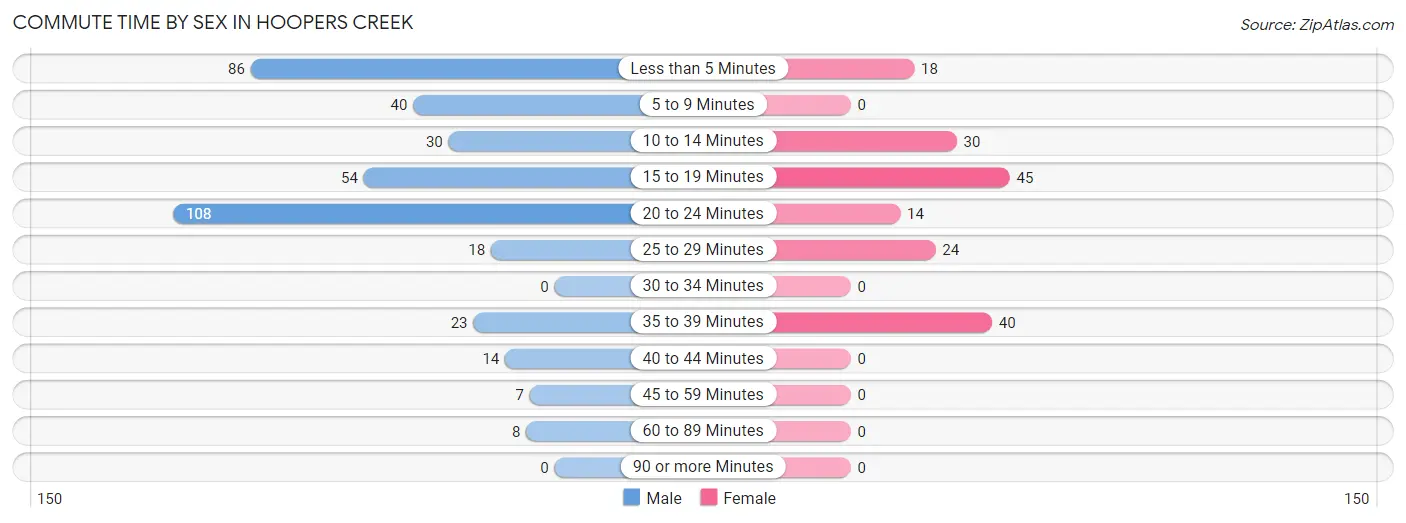
Commute Time by Sex in Hoopers Creek
The most common commute times in Hoopers Creek are 20 to 24 minutes (108 commuters, 27.8%) for males and 15 to 19 minutes (45 commuters, 26.3%) for females.
| Commute Time | Male | Female |
| Less than 5 Minutes | 86 (22.2%) | 18 (10.5%) |
| 5 to 9 Minutes | 40 (10.3%) | 0 (0.0%) |
| 10 to 14 Minutes | 30 (7.7%) | 30 (17.5%) |
| 15 to 19 Minutes | 54 (13.9%) | 45 (26.3%) |
| 20 to 24 Minutes | 108 (27.8%) | 14 (8.2%) |
| 25 to 29 Minutes | 18 (4.6%) | 24 (14.0%) |
| 30 to 34 Minutes | 0 (0.0%) | 0 (0.0%) |
| 35 to 39 Minutes | 23 (5.9%) | 40 (23.4%) |
| 40 to 44 Minutes | 14 (3.6%) | 0 (0.0%) |
| 45 to 59 Minutes | 7 (1.8%) | 0 (0.0%) |
| 60 to 89 Minutes | 8 (2.1%) | 0 (0.0%) |
| 90 or more Minutes | 0 (0.0%) | 0 (0.0%) |
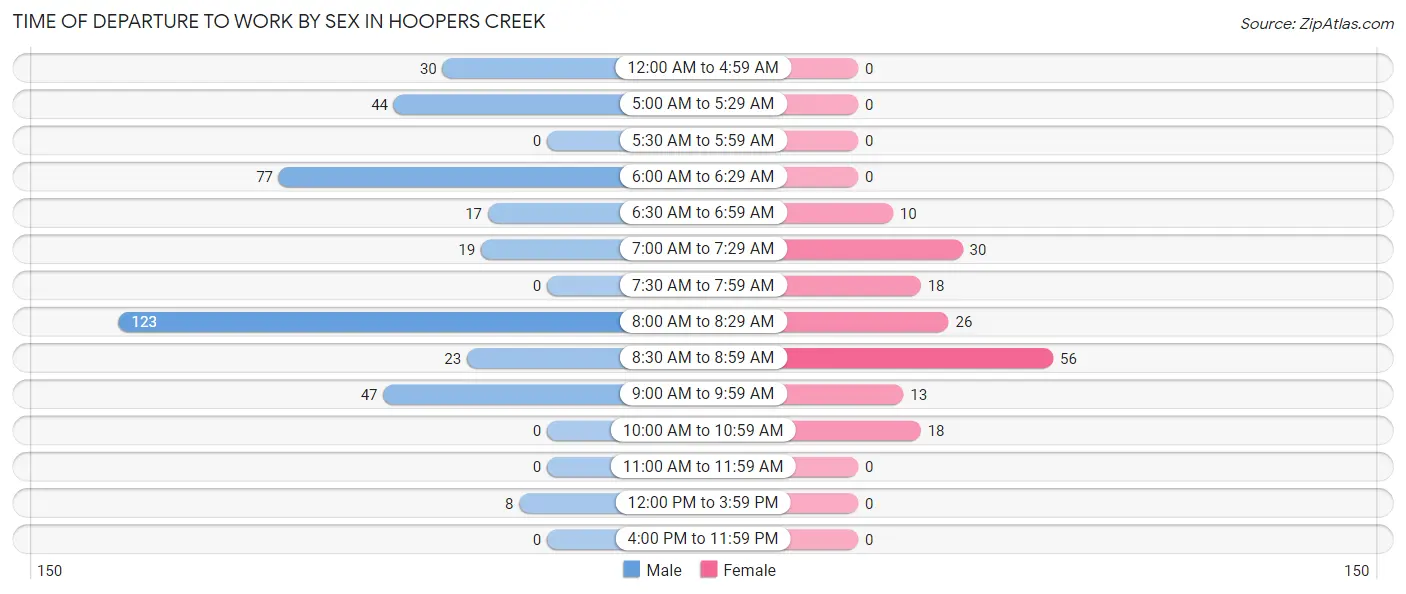
Time of Departure to Work by Sex in Hoopers Creek
The most frequent times of departure to work in Hoopers Creek are 8:00 AM to 8:29 AM (123, 31.7%) for males and 8:30 AM to 8:59 AM (56, 32.8%) for females.
| Time of Departure | Male | Female |
| 12:00 AM to 4:59 AM | 30 (7.7%) | 0 (0.0%) |
| 5:00 AM to 5:29 AM | 44 (11.3%) | 0 (0.0%) |
| 5:30 AM to 5:59 AM | 0 (0.0%) | 0 (0.0%) |
| 6:00 AM to 6:29 AM | 77 (19.9%) | 0 (0.0%) |
| 6:30 AM to 6:59 AM | 17 (4.4%) | 10 (5.9%) |
| 7:00 AM to 7:29 AM | 19 (4.9%) | 30 (17.5%) |
| 7:30 AM to 7:59 AM | 0 (0.0%) | 18 (10.5%) |
| 8:00 AM to 8:29 AM | 123 (31.7%) | 26 (15.2%) |
| 8:30 AM to 8:59 AM | 23 (5.9%) | 56 (32.8%) |
| 9:00 AM to 9:59 AM | 47 (12.1%) | 13 (7.6%) |
| 10:00 AM to 10:59 AM | 0 (0.0%) | 18 (10.5%) |
| 11:00 AM to 11:59 AM | 0 (0.0%) | 0 (0.0%) |
| 12:00 PM to 3:59 PM | 8 (2.1%) | 0 (0.0%) |
| 4:00 PM to 11:59 PM | 0 (0.0%) | 0 (0.0%) |
| Total | 388 (100.0%) | 171 (100.0%) |
Housing Occupancy in Hoopers Creek
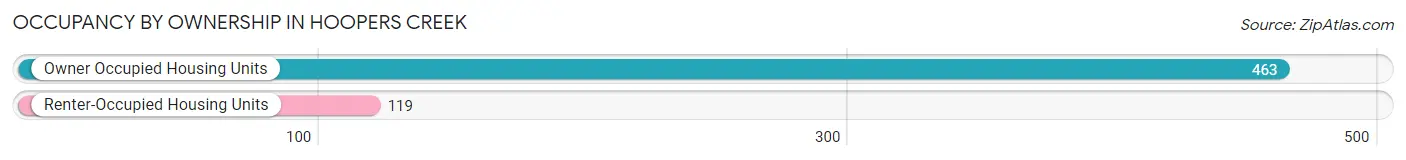
Occupancy by Ownership in Hoopers Creek
Of the total 582 dwellings in Hoopers Creek, owner-occupied units account for 463 (79.5%), while renter-occupied units make up 119 (20.4%).
| Occupancy | # Housing Units | % Housing Units |
| Owner Occupied Housing Units | 463 | 79.5% |
| Renter-Occupied Housing Units | 119 | 20.4% |
| Total Occupied Housing Units | 582 | 100.0% |
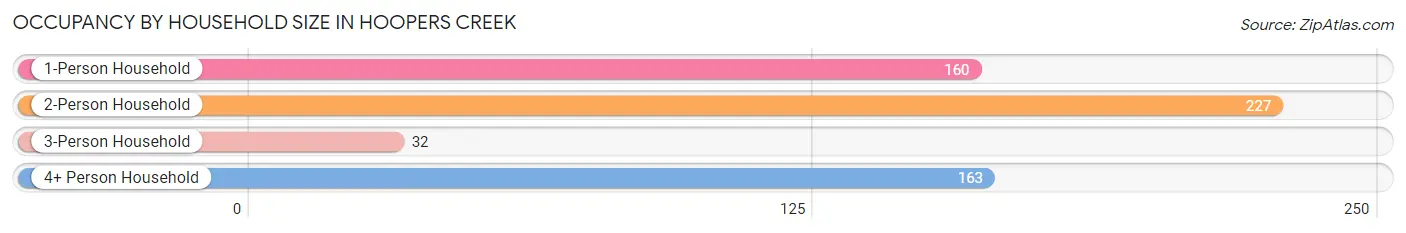
Occupancy by Household Size in Hoopers Creek
| Household Size | # Housing Units | % Housing Units |
| 1-Person Household | 160 | 27.5% |
| 2-Person Household | 227 | 39.0% |
| 3-Person Household | 32 | 5.5% |
| 4+ Person Household | 163 | 28.0% |
| Total Housing Units | 582 | 100.0% |
Occupancy by Ownership by Household Size in Hoopers Creek
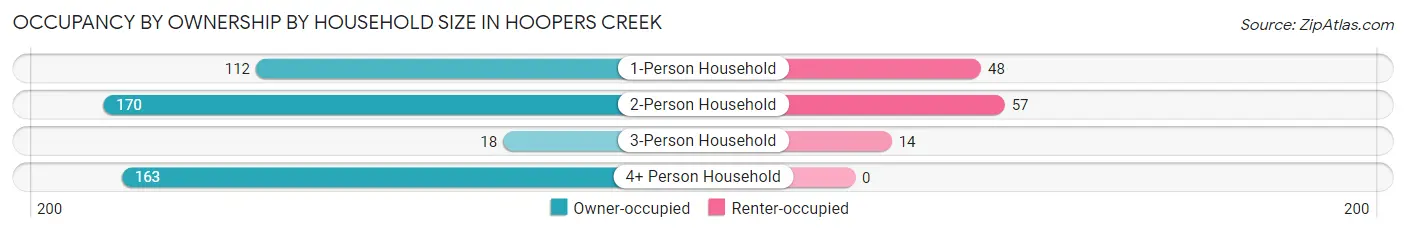
| Household Size | Owner-occupied | Renter-occupied |
| 1-Person Household | 112 (70.0%) | 48 (30.0%) |
| 2-Person Household | 170 (74.9%) | 57 (25.1%) |
| 3-Person Household | 18 (56.2%) | 14 (43.8%) |
| 4+ Person Household | 163 (100.0%) | 0 (0.0%) |
| Total Housing Units | 463 (79.5%) | 119 (20.4%) |
Occupancy by Educational Attainment in Hoopers Creek
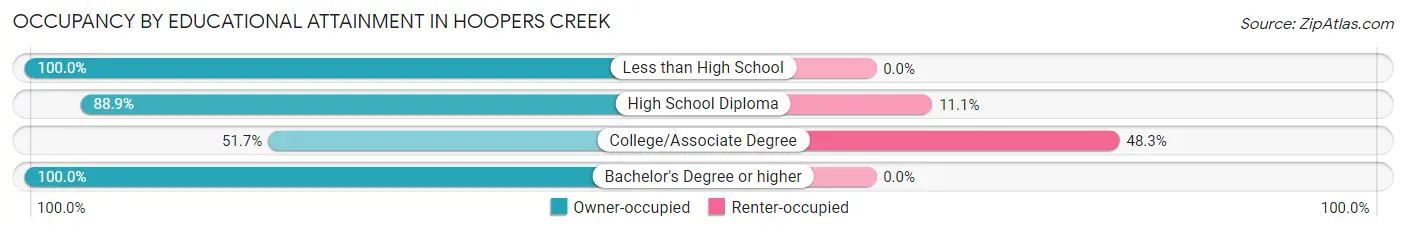
| Household Size | Owner-occupied | Renter-occupied |
| Less than High School | 57 (100.0%) | 0 (0.0%) |
| High School Diploma | 64 (88.9%) | 8 (11.1%) |
| College/Associate Degree | 119 (51.7%) | 111 (48.3%) |
| Bachelor's Degree or higher | 223 (100.0%) | 0 (0.0%) |
Occupancy by Age of Householder in Hoopers Creek
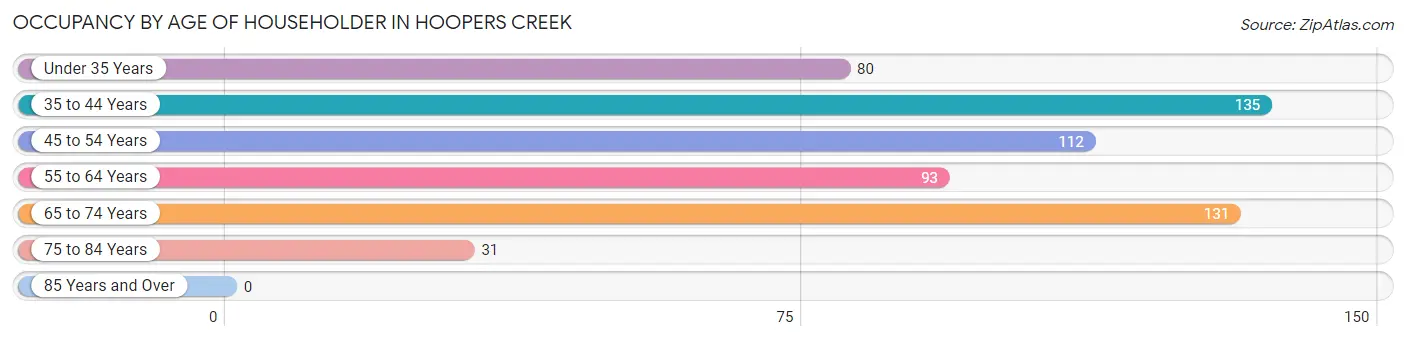
| Age Bracket | # Households | % Households |
| Under 35 Years | 80 | 13.8% |
| 35 to 44 Years | 135 | 23.2% |
| 45 to 54 Years | 112 | 19.2% |
| 55 to 64 Years | 93 | 16.0% |
| 65 to 74 Years | 131 | 22.5% |
| 75 to 84 Years | 31 | 5.3% |
| 85 Years and Over | 0 | 0.0% |
| Total | 582 | 100.0% |
Housing Finances in Hoopers Creek
Median Income by Occupancy in Hoopers Creek
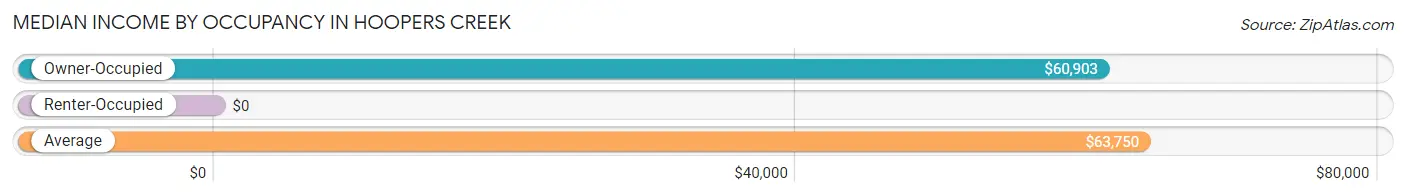
| Occupancy Type | # Households | Median Income |
| Owner-Occupied | 463 (79.5%) | $60,903 |
| Renter-Occupied | 119 (20.4%) | $0 |
| Average | 582 (100.0%) | $63,750 |
Occupancy by Householder Income Bracket in Hoopers Creek
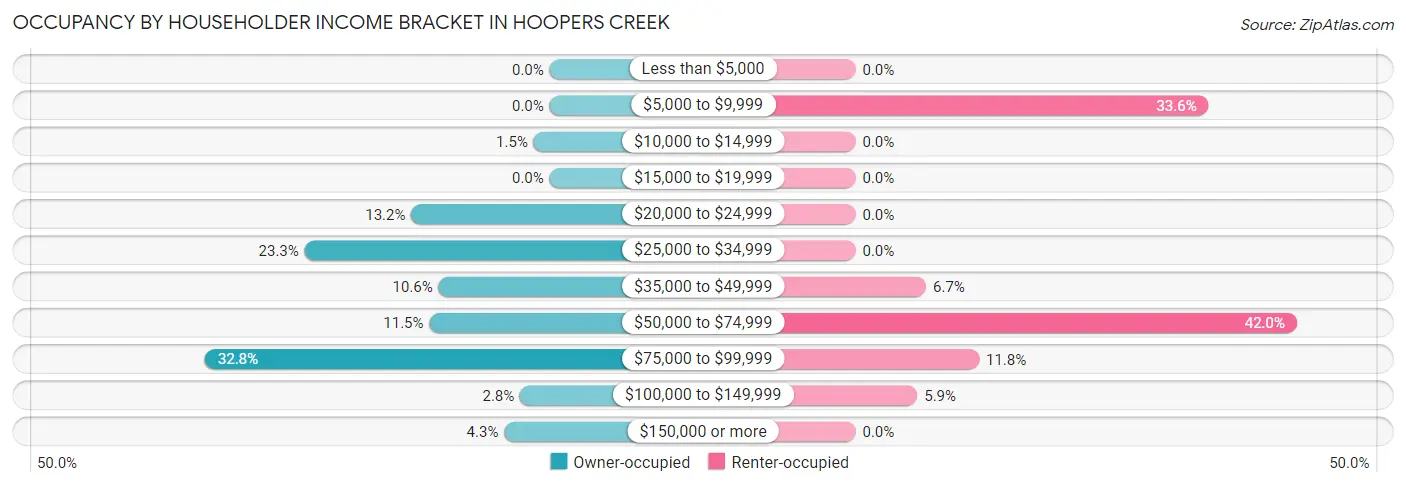
| Income Bracket | Owner-occupied | Renter-occupied |
| Less than $5,000 | 0 (0.0%) | 0 (0.0%) |
| $5,000 to $9,999 | 0 (0.0%) | 40 (33.6%) |
| $10,000 to $14,999 | 7 (1.5%) | 0 (0.0%) |
| $15,000 to $19,999 | 0 (0.0%) | 0 (0.0%) |
| $20,000 to $24,999 | 61 (13.2%) | 0 (0.0%) |
| $25,000 to $34,999 | 108 (23.3%) | 0 (0.0%) |
| $35,000 to $49,999 | 49 (10.6%) | 8 (6.7%) |
| $50,000 to $74,999 | 53 (11.5%) | 50 (42.0%) |
| $75,000 to $99,999 | 152 (32.8%) | 14 (11.8%) |
| $100,000 to $149,999 | 13 (2.8%) | 7 (5.9%) |
| $150,000 or more | 20 (4.3%) | 0 (0.0%) |
| Total | 463 (100.0%) | 119 (100.0%) |
Monthly Housing Cost Tiers in Hoopers Creek
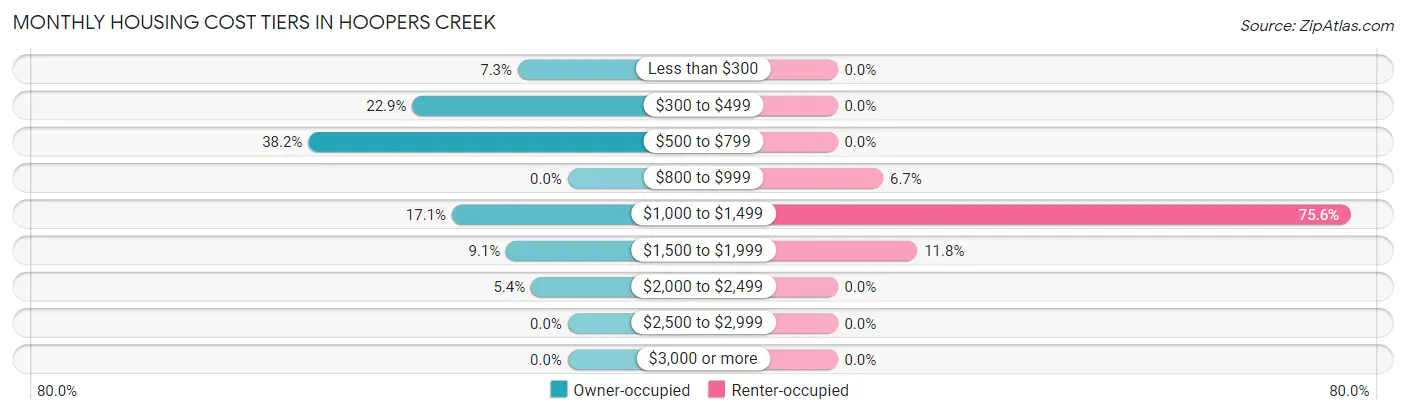
| Monthly Cost | Owner-occupied | Renter-occupied |
| Less than $300 | 34 (7.3%) | 0 (0.0%) |
| $300 to $499 | 106 (22.9%) | 0 (0.0%) |
| $500 to $799 | 177 (38.2%) | 0 (0.0%) |
| $800 to $999 | 0 (0.0%) | 8 (6.7%) |
| $1,000 to $1,499 | 79 (17.1%) | 90 (75.6%) |
| $1,500 to $1,999 | 42 (9.1%) | 14 (11.8%) |
| $2,000 to $2,499 | 25 (5.4%) | 0 (0.0%) |
| $2,500 to $2,999 | 0 (0.0%) | 0 (0.0%) |
| $3,000 or more | 0 (0.0%) | 0 (0.0%) |
| Total | 463 (100.0%) | 119 (100.0%) |
Physical Housing Characteristics in Hoopers Creek
Housing Structures in Hoopers Creek
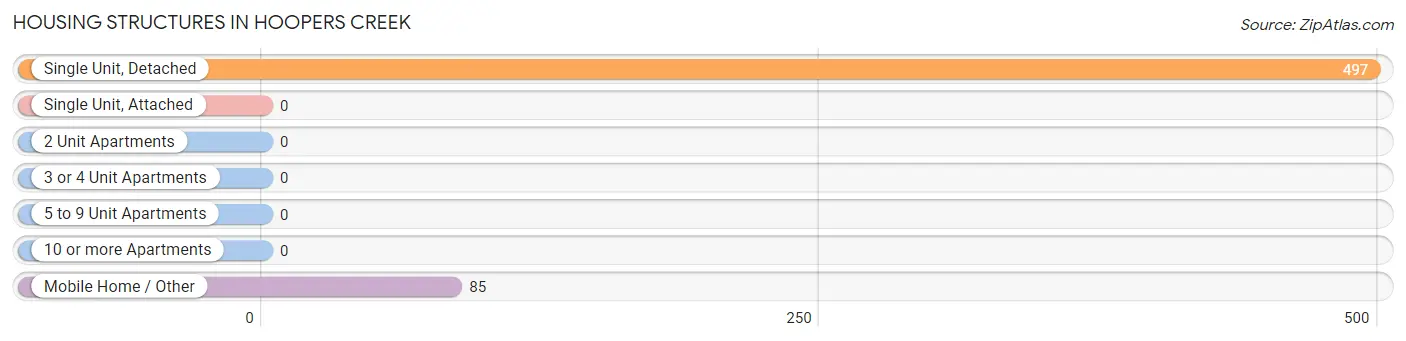
| Structure Type | # Housing Units | % Housing Units |
| Single Unit, Detached | 497 | 85.4% |
| Single Unit, Attached | 0 | 0.0% |
| 2 Unit Apartments | 0 | 0.0% |
| 3 or 4 Unit Apartments | 0 | 0.0% |
| 5 to 9 Unit Apartments | 0 | 0.0% |
| 10 or more Apartments | 0 | 0.0% |
| Mobile Home / Other | 85 | 14.6% |
| Total | 582 | 100.0% |
Housing Structures by Occupancy in Hoopers Creek
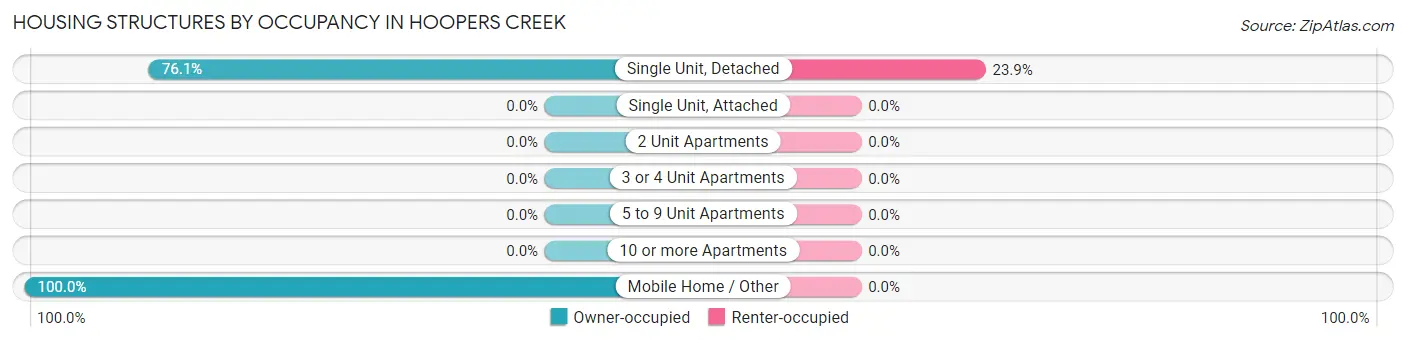
| Structure Type | Owner-occupied | Renter-occupied |
| Single Unit, Detached | 378 (76.1%) | 119 (23.9%) |
| Single Unit, Attached | 0 (0.0%) | 0 (0.0%) |
| 2 Unit Apartments | 0 (0.0%) | 0 (0.0%) |
| 3 or 4 Unit Apartments | 0 (0.0%) | 0 (0.0%) |
| 5 to 9 Unit Apartments | 0 (0.0%) | 0 (0.0%) |
| 10 or more Apartments | 0 (0.0%) | 0 (0.0%) |
| Mobile Home / Other | 85 (100.0%) | 0 (0.0%) |
| Total | 463 (79.5%) | 119 (20.4%) |
Housing Structures by Number of Rooms in Hoopers Creek
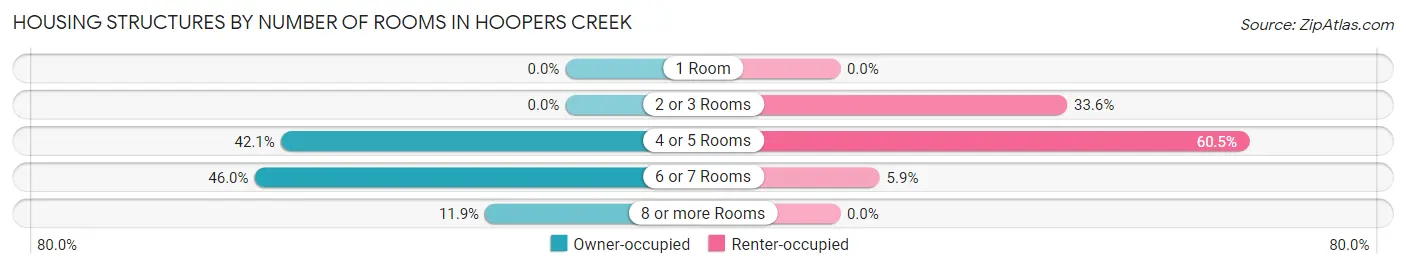
| Number of Rooms | Owner-occupied | Renter-occupied |
| 1 Room | 0 (0.0%) | 0 (0.0%) |
| 2 or 3 Rooms | 0 (0.0%) | 40 (33.6%) |
| 4 or 5 Rooms | 195 (42.1%) | 72 (60.5%) |
| 6 or 7 Rooms | 213 (46.0%) | 7 (5.9%) |
| 8 or more Rooms | 55 (11.9%) | 0 (0.0%) |
| Total | 463 (100.0%) | 119 (100.0%) |
Housing Structure by Heating Type in Hoopers Creek
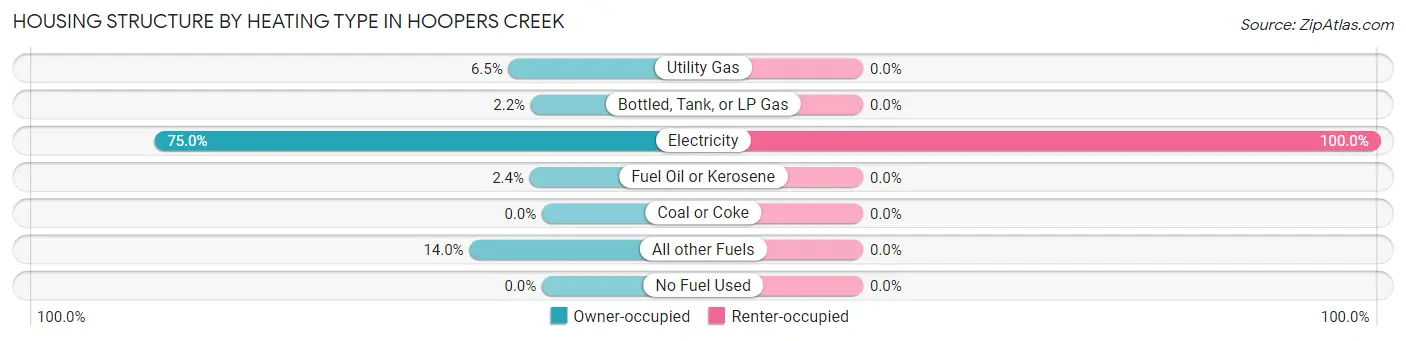
| Heating Type | Owner-occupied | Renter-occupied |
| Utility Gas | 30 (6.5%) | 0 (0.0%) |
| Bottled, Tank, or LP Gas | 10 (2.2%) | 0 (0.0%) |
| Electricity | 347 (75.0%) | 119 (100.0%) |
| Fuel Oil or Kerosene | 11 (2.4%) | 0 (0.0%) |
| Coal or Coke | 0 (0.0%) | 0 (0.0%) |
| All other Fuels | 65 (14.0%) | 0 (0.0%) |
| No Fuel Used | 0 (0.0%) | 0 (0.0%) |
| Total | 463 (100.0%) | 119 (100.0%) |
Household Vehicle Usage in Hoopers Creek
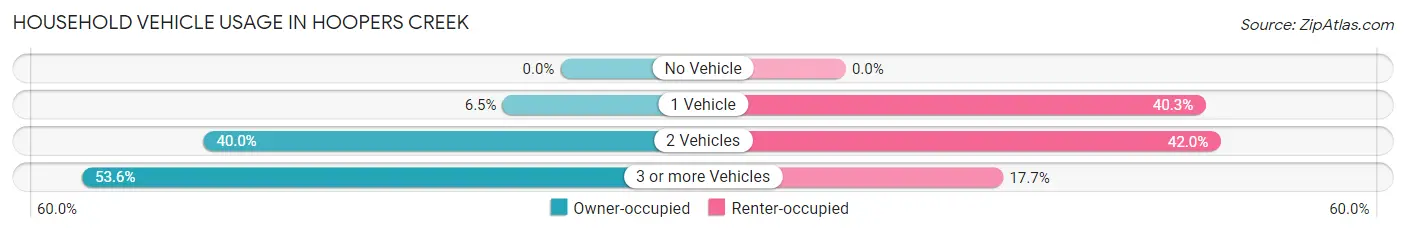
| Vehicles per Household | Owner-occupied | Renter-occupied |
| No Vehicle | 0 (0.0%) | 0 (0.0%) |
| 1 Vehicle | 30 (6.5%) | 48 (40.3%) |
| 2 Vehicles | 185 (40.0%) | 50 (42.0%) |
| 3 or more Vehicles | 248 (53.6%) | 21 (17.6%) |
| Total | 463 (100.0%) | 119 (100.0%) |
Real Estate & Mortgages in Hoopers Creek
Real Estate and Mortgage Overview in Hoopers Creek
| Characteristic | Without Mortgage | With Mortgage |
| Housing Units | 233 | 230 |
| Median Property Value | $116,000 | $291,000 |
| Median Household Income | $61,375 | $0 |
| Monthly Housing Costs | $465 | $0 |
| Real Estate Taxes | - | - |
Property Value by Mortgage Status in Hoopers Creek
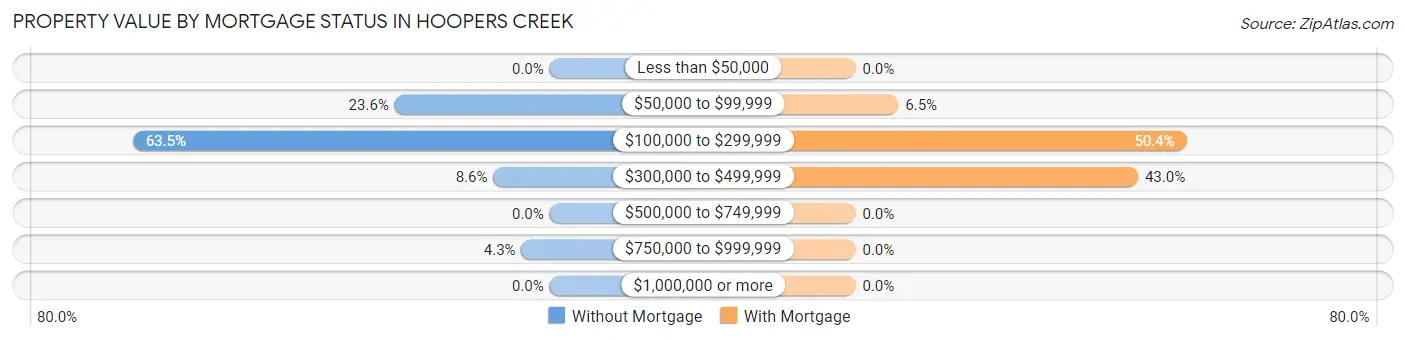
| Property Value | Without Mortgage | With Mortgage |
| Less than $50,000 | 0 (0.0%) | 0 (0.0%) |
| $50,000 to $99,999 | 55 (23.6%) | 15 (6.5%) |
| $100,000 to $299,999 | 148 (63.5%) | 116 (50.4%) |
| $300,000 to $499,999 | 20 (8.6%) | 99 (43.0%) |
| $500,000 to $749,999 | 0 (0.0%) | 0 (0.0%) |
| $750,000 to $999,999 | 10 (4.3%) | 0 (0.0%) |
| $1,000,000 or more | 0 (0.0%) | 0 (0.0%) |
| Total | 233 (100.0%) | 230 (100.0%) |
Household Income by Mortgage Status in Hoopers Creek
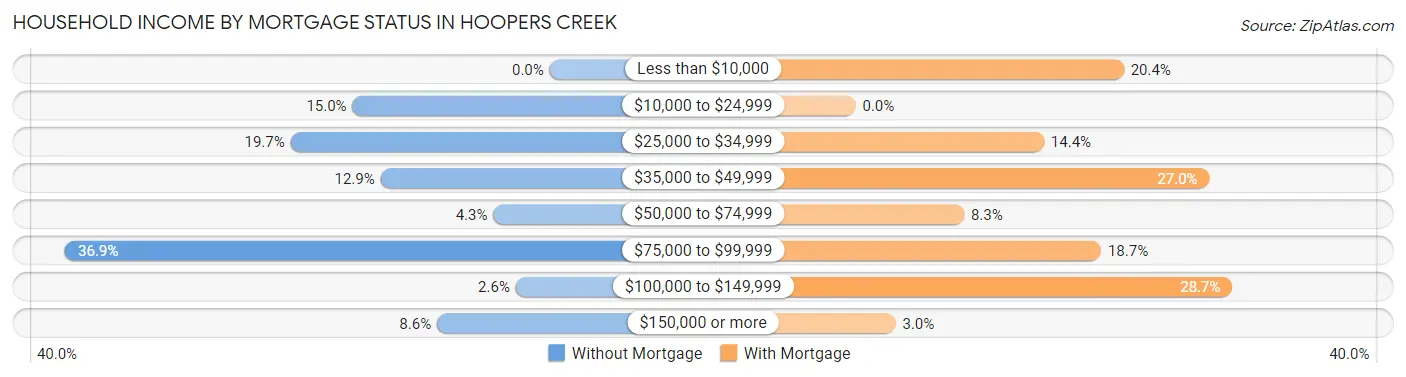
| Household Income | Without Mortgage | With Mortgage |
| Less than $10,000 | 0 (0.0%) | 47 (20.4%) |
| $10,000 to $24,999 | 35 (15.0%) | 0 (0.0%) |
| $25,000 to $34,999 | 46 (19.7%) | 33 (14.3%) |
| $35,000 to $49,999 | 30 (12.9%) | 62 (27.0%) |
| $50,000 to $74,999 | 10 (4.3%) | 19 (8.3%) |
| $75,000 to $99,999 | 86 (36.9%) | 43 (18.7%) |
| $100,000 to $149,999 | 6 (2.6%) | 66 (28.7%) |
| $150,000 or more | 20 (8.6%) | 7 (3.0%) |
| Total | 233 (100.0%) | 230 (100.0%) |
Property Value to Household Income Ratio in Hoopers Creek
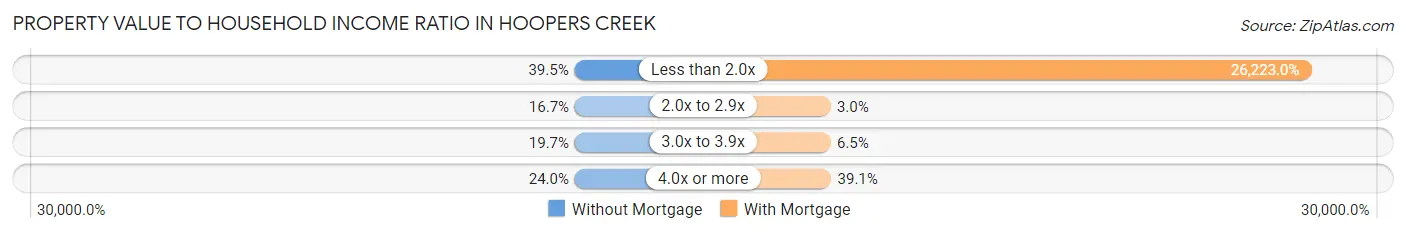
| Value-to-Income Ratio | Without Mortgage | With Mortgage |
| Less than 2.0x | 92 (39.5%) | 60,313 (26,223.0%) |
| 2.0x to 2.9x | 39 (16.7%) | 7 (3.0%) |
| 3.0x to 3.9x | 46 (19.7%) | 15 (6.5%) |
| 4.0x or more | 56 (24.0%) | 90 (39.1%) |
| Total | 233 (100.0%) | 230 (100.0%) |
Real Estate Taxes by Mortgage Status in Hoopers Creek
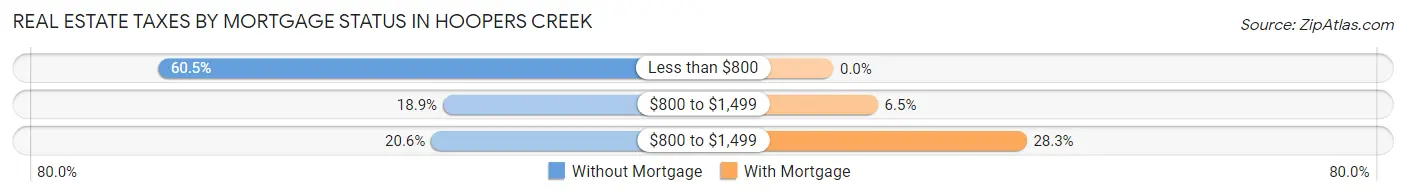
| Property Taxes | Without Mortgage | With Mortgage |
| Less than $800 | 141 (60.5%) | 0 (0.0%) |
| $800 to $1,499 | 44 (18.9%) | 15 (6.5%) |
| $800 to $1,499 | 48 (20.6%) | 65 (28.3%) |
| Total | 233 (100.0%) | 230 (100.0%) |
Health & Disability in Hoopers Creek
Health Insurance Coverage by Age in Hoopers Creek
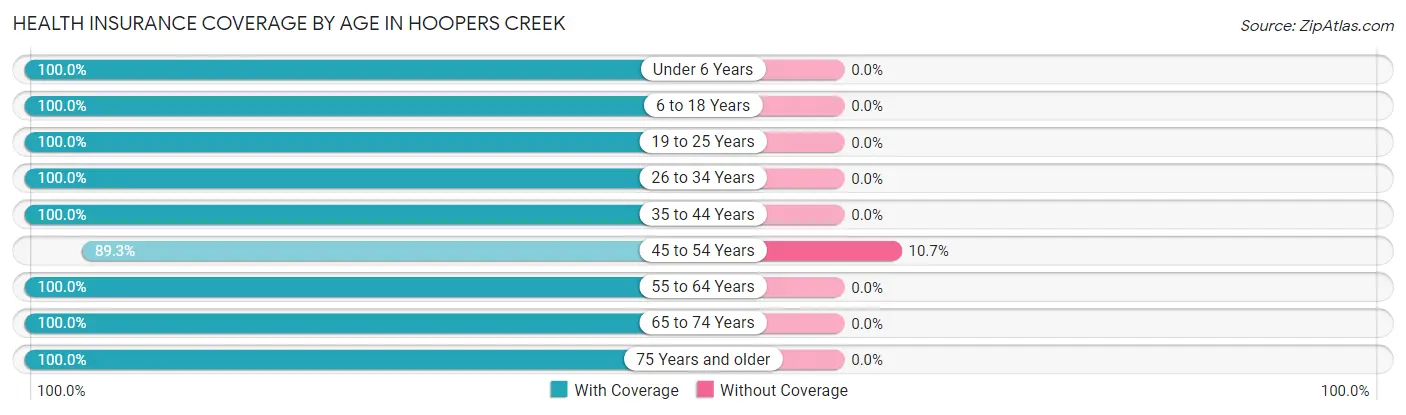
| Age Bracket | With Coverage | Without Coverage |
| Under 6 Years | 55 (100.0%) | 0 (0.0%) |
| 6 to 18 Years | 409 (100.0%) | 0 (0.0%) |
| 19 to 25 Years | 74 (100.0%) | 0 (0.0%) |
| 26 to 34 Years | 76 (100.0%) | 0 (0.0%) |
| 35 to 44 Years | 294 (100.0%) | 0 (0.0%) |
| 45 to 54 Years | 184 (89.3%) | 22 (10.7%) |
| 55 to 64 Years | 132 (100.0%) | 0 (0.0%) |
| 65 to 74 Years | 174 (100.0%) | 0 (0.0%) |
| 75 Years and older | 95 (100.0%) | 0 (0.0%) |
| Total | 1,493 (98.6%) | 22 (1.5%) |
Health Insurance Coverage by Citizenship Status in Hoopers Creek
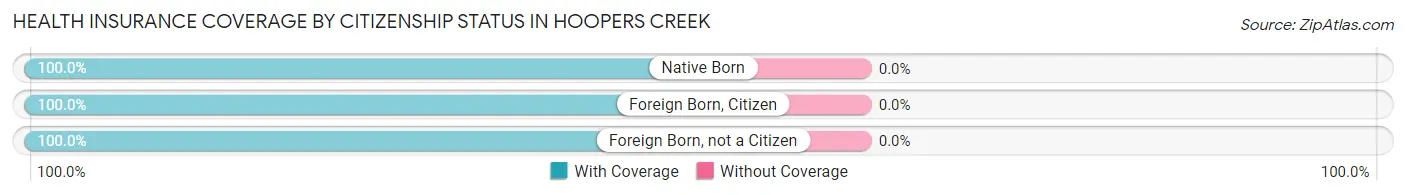
| Citizenship Status | With Coverage | Without Coverage |
| Native Born | 55 (100.0%) | 0 (0.0%) |
| Foreign Born, Citizen | 409 (100.0%) | 0 (0.0%) |
| Foreign Born, not a Citizen | 74 (100.0%) | 0 (0.0%) |
Health Insurance Coverage by Household Income in Hoopers Creek
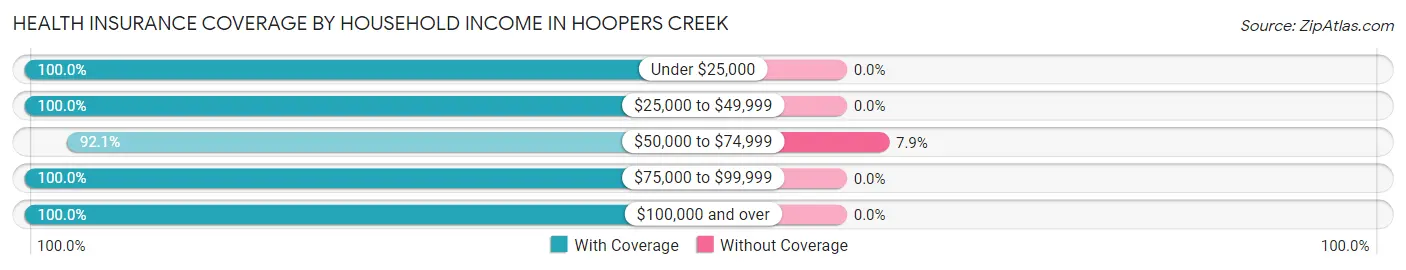
| Household Income | With Coverage | Without Coverage |
| Under $25,000 | 167 (100.0%) | 0 (0.0%) |
| $25,000 to $49,999 | 317 (100.0%) | 0 (0.0%) |
| $50,000 to $74,999 | 256 (92.1%) | 22 (7.9%) |
| $75,000 to $99,999 | 634 (100.0%) | 0 (0.0%) |
| $100,000 and over | 119 (100.0%) | 0 (0.0%) |
Public vs Private Health Insurance Coverage by Age in Hoopers Creek
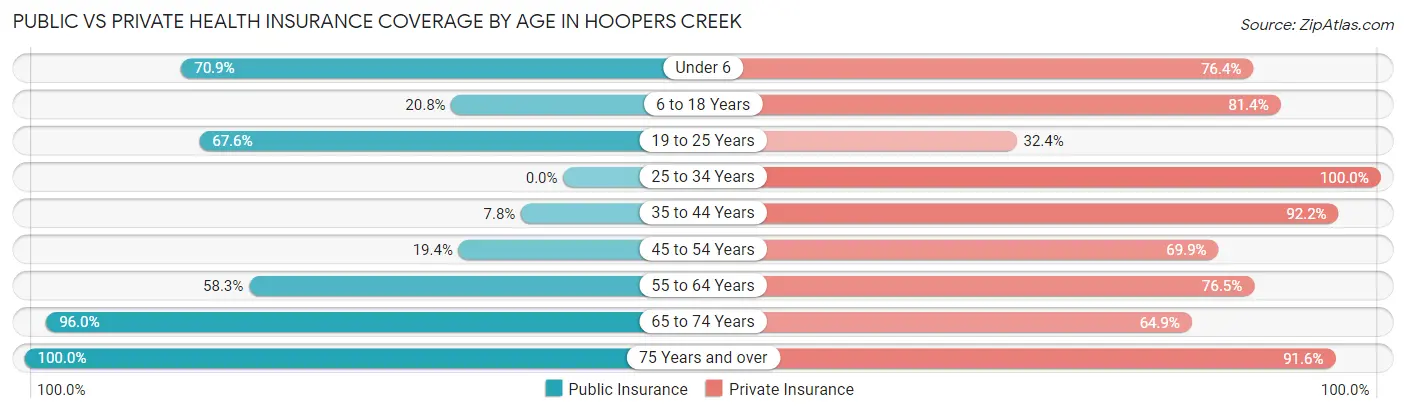
| Age Bracket | Public Insurance | Private Insurance |
| Under 6 | 39 (70.9%) | 42 (76.4%) |
| 6 to 18 Years | 85 (20.8%) | 333 (81.4%) |
| 19 to 25 Years | 50 (67.6%) | 24 (32.4%) |
| 25 to 34 Years | 0 (0.0%) | 76 (100.0%) |
| 35 to 44 Years | 23 (7.8%) | 271 (92.2%) |
| 45 to 54 Years | 40 (19.4%) | 144 (69.9%) |
| 55 to 64 Years | 77 (58.3%) | 101 (76.5%) |
| 65 to 74 Years | 167 (96.0%) | 113 (64.9%) |
| 75 Years and over | 95 (100.0%) | 87 (91.6%) |
| Total | 576 (38.0%) | 1,191 (78.6%) |
Disability Status by Sex by Age in Hoopers Creek
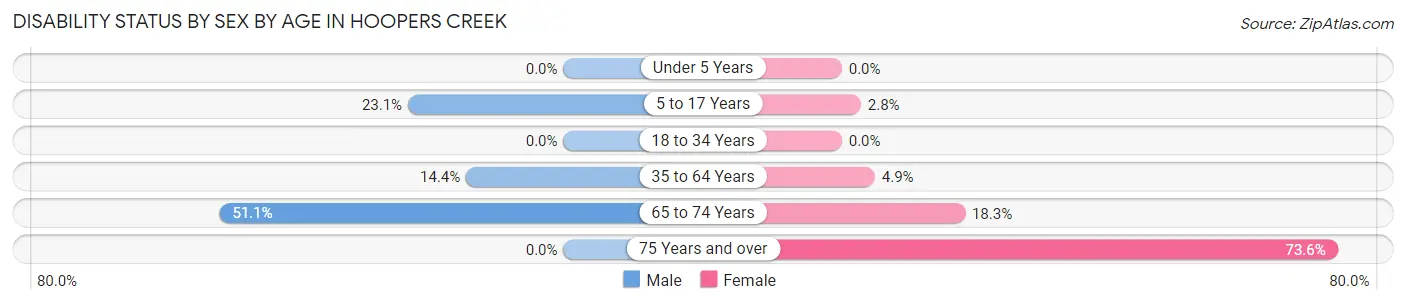
| Age Bracket | Male | Female |
| Under 5 Years | 0 (0.0%) | 0 (0.0%) |
| 5 to 17 Years | 21 (23.1%) | 9 (2.8%) |
| 18 to 34 Years | 0 (0.0%) | 0 (0.0%) |
| 35 to 64 Years | 53 (14.4%) | 13 (4.9%) |
| 65 to 74 Years | 47 (51.1%) | 15 (18.3%) |
| 75 Years and over | 0 (0.0%) | 53 (73.6%) |
Disability Class by Sex by Age in Hoopers Creek
Disability Class: Hearing Difficulty
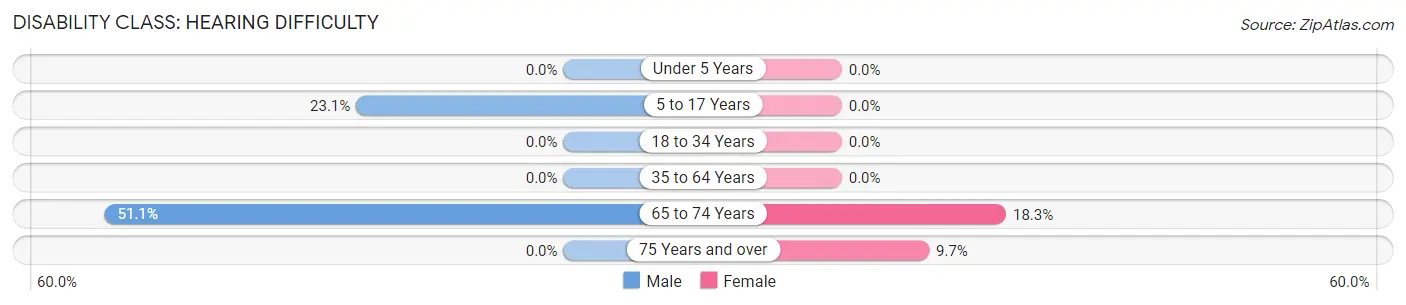
| Age Bracket | Male | Female |
| Under 5 Years | 0 (0.0%) | 0 (0.0%) |
| 5 to 17 Years | 21 (23.1%) | 0 (0.0%) |
| 18 to 34 Years | 0 (0.0%) | 0 (0.0%) |
| 35 to 64 Years | 0 (0.0%) | 0 (0.0%) |
| 65 to 74 Years | 47 (51.1%) | 15 (18.3%) |
| 75 Years and over | 0 (0.0%) | 7 (9.7%) |
Disability Class: Vision Difficulty

| Age Bracket | Male | Female |
| Under 5 Years | 0 (0.0%) | 0 (0.0%) |
| 5 to 17 Years | 0 (0.0%) | 0 (0.0%) |
| 18 to 34 Years | 0 (0.0%) | 0 (0.0%) |
| 35 to 64 Years | 0 (0.0%) | 0 (0.0%) |
| 65 to 74 Years | 0 (0.0%) | 15 (18.3%) |
| 75 Years and over | 0 (0.0%) | 0 (0.0%) |
Disability Class: Cognitive Difficulty
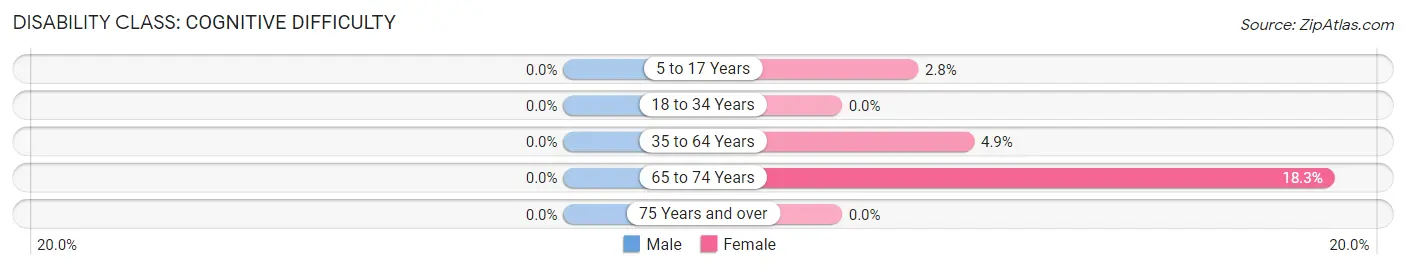
| Age Bracket | Male | Female |
| 5 to 17 Years | 0 (0.0%) | 9 (2.8%) |
| 18 to 34 Years | 0 (0.0%) | 0 (0.0%) |
| 35 to 64 Years | 0 (0.0%) | 13 (4.9%) |
| 65 to 74 Years | 0 (0.0%) | 15 (18.3%) |
| 75 Years and over | 0 (0.0%) | 0 (0.0%) |
Disability Class: Ambulatory Difficulty
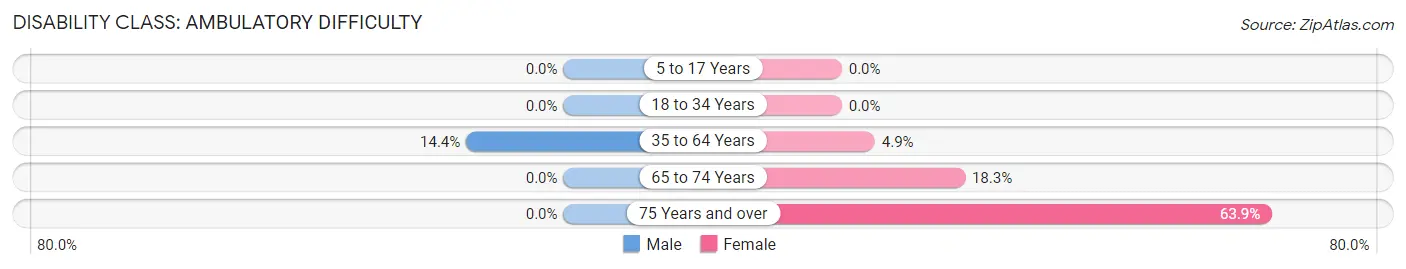
| Age Bracket | Male | Female |
| 5 to 17 Years | 0 (0.0%) | 0 (0.0%) |
| 18 to 34 Years | 0 (0.0%) | 0 (0.0%) |
| 35 to 64 Years | 53 (14.4%) | 13 (4.9%) |
| 65 to 74 Years | 0 (0.0%) | 15 (18.3%) |
| 75 Years and over | 0 (0.0%) | 46 (63.9%) |
Disability Class: Self-Care Difficulty
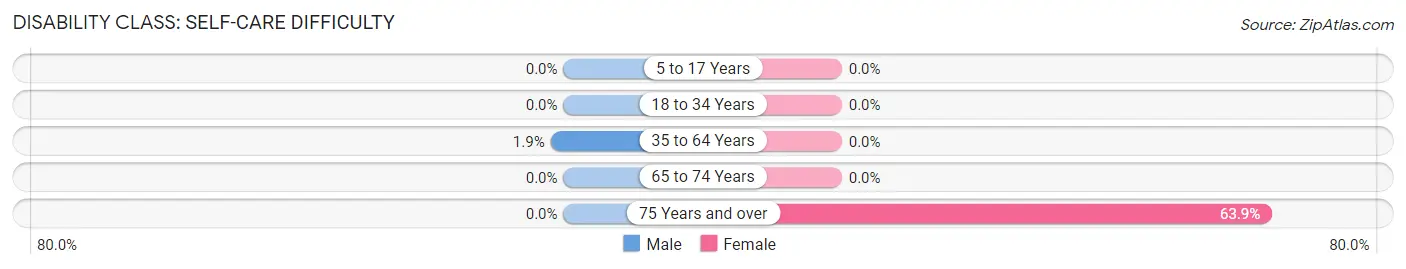
| Age Bracket | Male | Female |
| 5 to 17 Years | 0 (0.0%) | 0 (0.0%) |
| 18 to 34 Years | 0 (0.0%) | 0 (0.0%) |
| 35 to 64 Years | 7 (1.9%) | 0 (0.0%) |
| 65 to 74 Years | 0 (0.0%) | 0 (0.0%) |
| 75 Years and over | 0 (0.0%) | 46 (63.9%) |
Technology Access in Hoopers Creek
Computing Device Access in Hoopers Creek
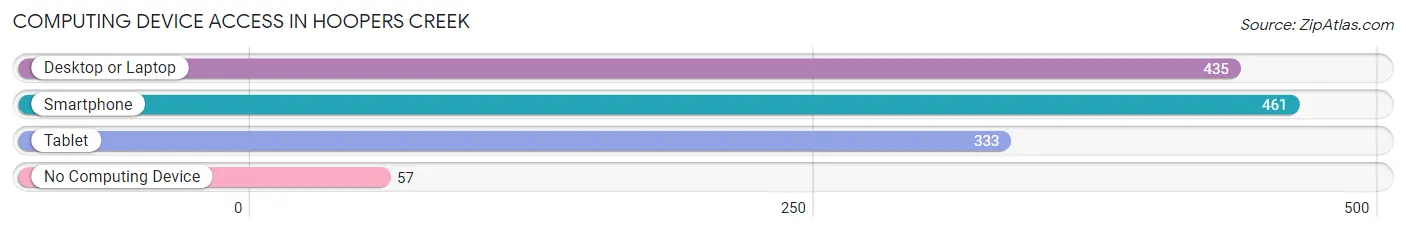
| Device Type | # Households | % Households |
| Desktop or Laptop | 435 | 74.7% |
| Smartphone | 461 | 79.2% |
| Tablet | 333 | 57.2% |
| No Computing Device | 57 | 9.8% |
| Total | 582 | 100.0% |
Internet Access in Hoopers Creek
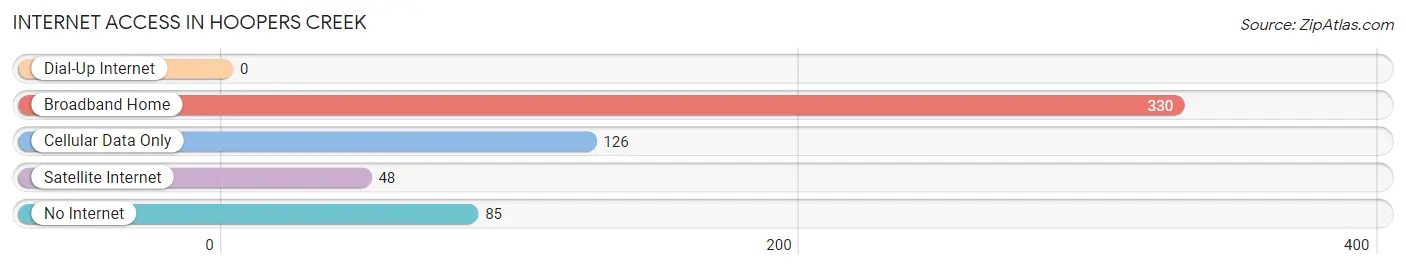
| Internet Type | # Households | % Households |
| Dial-Up Internet | 0 | 0.0% |
| Broadband Home | 330 | 56.7% |
| Cellular Data Only | 126 | 21.6% |
| Satellite Internet | 48 | 8.3% |
| No Internet | 85 | 14.6% |
| Total | 582 | 100.0% |
Hoopers Creek Summary
Hoopers Creek is a small unincorporated community located in Henderson County, North Carolina. It is situated in the foothills of the Blue Ridge Mountains, approximately 20 miles south of Asheville. The community is named after the Hoopers Creek, which flows through the area.
Geography
Hoopers Creek is located in the Blue Ridge Mountains of western North Carolina. The community is situated in the foothills of the Blue Ridge Mountains, approximately 20 miles south of Asheville. The elevation of the area is approximately 2,000 feet above sea level. The area is characterized by rolling hills, lush forests, and numerous creeks and streams. The Hoopers Creek itself is a tributary of the French Broad River.
The climate of the area is temperate, with mild winters and warm summers. The average annual temperature is around 60 degrees Fahrenheit. The average annual precipitation is around 45 inches.
Economy
The economy of Hoopers Creek is largely based on agriculture and forestry. The area is home to several small farms, which produce a variety of crops, including corn, soybeans, and hay. The area is also home to several timber companies, which harvest timber from the surrounding forests.
In addition to agriculture and forestry, the area is home to several small businesses, including restaurants, convenience stores, and gas stations. The area is also home to several small manufacturing companies, which produce a variety of products, including furniture, textiles, and electronics.
Demographics
As of the 2010 census, the population of Hoopers Creek was 1,845. The racial makeup of the area was 97.3% White, 0.7% African American, 0.3% Native American, 0.2% Asian, and 1.5% from other races. The median household income was $37,917, and the median family income was $45,917.
The area is home to several churches, including the Hoopers Creek Baptist Church, the Hoopers Creek United Methodist Church, and the Hoopers Creek Presbyterian Church. The area is also home to several schools, including the Hoopers Creek Elementary School, the Hoopers Creek Middle School, and the Hoopers Creek High School.
Conclusion
Hoopers Creek is a small unincorporated community located in Henderson County, North Carolina. It is situated in the foothills of the Blue Ridge Mountains, approximately 20 miles south of Asheville. The economy of the area is largely based on agriculture and forestry, and the area is home to several small businesses. The population of the area is 1,845, and the median household income is $37,917. The area is home to several churches and schools, and is a popular destination for outdoor recreation.
Common Questions
What is Per Capita Income in Hoopers Creek?
Per Capita income in Hoopers Creek is $22,445.
What is the Median Family Income in Hoopers Creek?
Median Family Income in Hoopers Creek is $69,625.
What is the Median Household income in Hoopers Creek?
Median Household Income in Hoopers Creek is $63,750.
What is Income or Wage Gap in Hoopers Creek?
Income or Wage Gap in Hoopers Creek is 35.2%.
Women in Hoopers Creek earn 64.8 cents for every dollar earned by a man.
What is Inequality or Gini Index in Hoopers Creek?
Inequality or Gini Index in Hoopers Creek is 0.33.
What is the Total Population of Hoopers Creek?
Total Population of Hoopers Creek is 1,515.
What is the Total Male Population of Hoopers Creek?
Total Male Population of Hoopers Creek is 637.
What is the Total Female Population of Hoopers Creek?
Total Female Population of Hoopers Creek is 878.
What is the Ratio of Males per 100 Females in Hoopers Creek?
There are 72.55 Males per 100 Females in Hoopers Creek.
What is the Ratio of Females per 100 Males in Hoopers Creek?
There are 137.83 Females per 100 Males in Hoopers Creek.
What is the Median Population Age in Hoopers Creek?
Median Population Age in Hoopers Creek is 41.0 Years.
What is the Average Family Size in Hoopers Creek
Average Family Size in Hoopers Creek is 3.2 People.
What is the Average Household Size in Hoopers Creek
Average Household Size in Hoopers Creek is 2.6 People.
How Large is the Labor Force in Hoopers Creek?
There are 578 People in the Labor Forcein in Hoopers Creek.
What is the Percentage of People in the Labor Force in Hoopers Creek?
48.7% of People are in the Labor Force in Hoopers Creek.
What is the Unemployment Rate in Hoopers Creek?
Unemployment Rate in Hoopers Creek is 3.3%.