James City, NC Map & Demographics
James City Map
James City Overview
$30,889
PER CAPITA INCOME
$69,359
AVG FAMILY INCOME
$62,227
AVG HOUSEHOLD INCOME
27.5%
WAGE / INCOME GAP [ % ]
72.5¢/ $1
WAGE / INCOME GAP [ $ ]
$3,880
FAMILY INCOME DEFICIT
0.42
INEQUALITY / GINI INDEX
5,186
TOTAL POPULATION
2,361
MALE POPULATION
2,825
FEMALE POPULATION
83.58
MALES / 100 FEMALES
119.65
FEMALES / 100 MALES
44.3
MEDIAN AGE
2.8
AVG FAMILY SIZE
2.5
AVG HOUSEHOLD SIZE
2,562
LABOR FORCE [ PEOPLE ]
59.3%
PERCENT IN LABOR FORCE
4.8%
UNEMPLOYMENT RATE
Income in James City
Income Overview in James City
Per Capita Income in James City is $30,889, while median incomes of families and households are $69,359 and $62,227 respectively.
| Characteristic | Number | Measure |
| Per Capita Income | 5,186 | $30,889 |
| Median Family Income | 1,439 | $69,359 |
| Mean Family Income | 1,439 | $86,080 |
| Median Household Income | 2,027 | $62,227 |
| Mean Household Income | 2,027 | $75,250 |
| Income Deficit | 1,439 | $3,880 |
| Wage / Income Gap (%) | 5,186 | 27.48% |
| Wage / Income Gap ($) | 5,186 | 72.52¢ per $1 |
| Gini / Inequality Index | 5,186 | 0.42 |
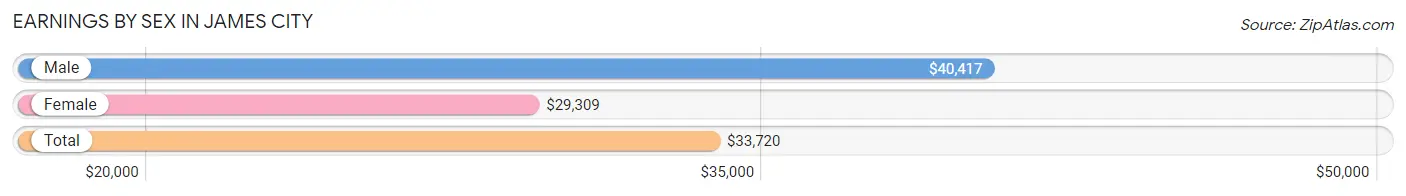
Earnings by Sex in James City
Average Earnings in James City are $33,720, $40,417 for men and $29,309 for women, a difference of 27.5%.
| Sex | Number | Average Earnings |
| Male | 1,326 (51.6%) | $40,417 |
| Female | 1,244 (48.4%) | $29,309 |
| Total | 2,570 (100.0%) | $33,720 |
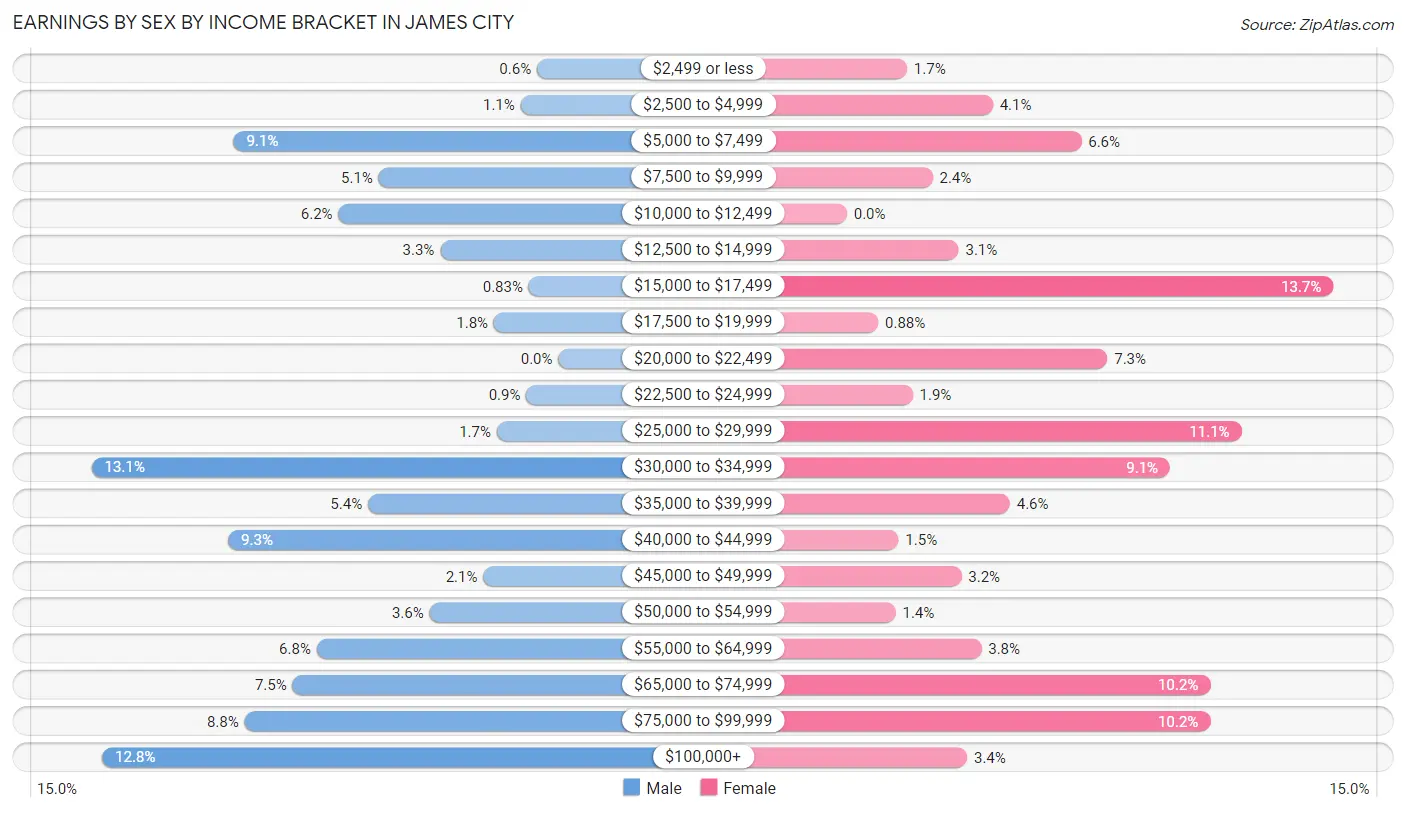
Earnings by Sex by Income Bracket in James City
The most common earnings brackets in James City are $30,000 to $34,999 for men (174 | 13.1%) and $15,000 to $17,499 for women (170 | 13.7%).
| Income | Male | Female |
| $2,499 or less | 8 (0.6%) | 21 (1.7%) |
| $2,500 to $4,999 | 14 (1.1%) | 51 (4.1%) |
| $5,000 to $7,499 | 121 (9.1%) | 82 (6.6%) |
| $7,500 to $9,999 | 67 (5.1%) | 30 (2.4%) |
| $10,000 to $12,499 | 82 (6.2%) | 0 (0.0%) |
| $12,500 to $14,999 | 44 (3.3%) | 39 (3.1%) |
| $15,000 to $17,499 | 11 (0.8%) | 170 (13.7%) |
| $17,500 to $19,999 | 24 (1.8%) | 11 (0.9%) |
| $20,000 to $22,499 | 0 (0.0%) | 91 (7.3%) |
| $22,500 to $24,999 | 12 (0.9%) | 23 (1.8%) |
| $25,000 to $29,999 | 23 (1.7%) | 138 (11.1%) |
| $30,000 to $34,999 | 174 (13.1%) | 113 (9.1%) |
| $35,000 to $39,999 | 71 (5.3%) | 57 (4.6%) |
| $40,000 to $44,999 | 123 (9.3%) | 18 (1.5%) |
| $45,000 to $49,999 | 28 (2.1%) | 40 (3.2%) |
| $50,000 to $54,999 | 48 (3.6%) | 17 (1.4%) |
| $55,000 to $64,999 | 90 (6.8%) | 47 (3.8%) |
| $65,000 to $74,999 | 99 (7.5%) | 127 (10.2%) |
| $75,000 to $99,999 | 117 (8.8%) | 127 (10.2%) |
| $100,000+ | 170 (12.8%) | 42 (3.4%) |
| Total | 1,326 (100.0%) | 1,244 (100.0%) |
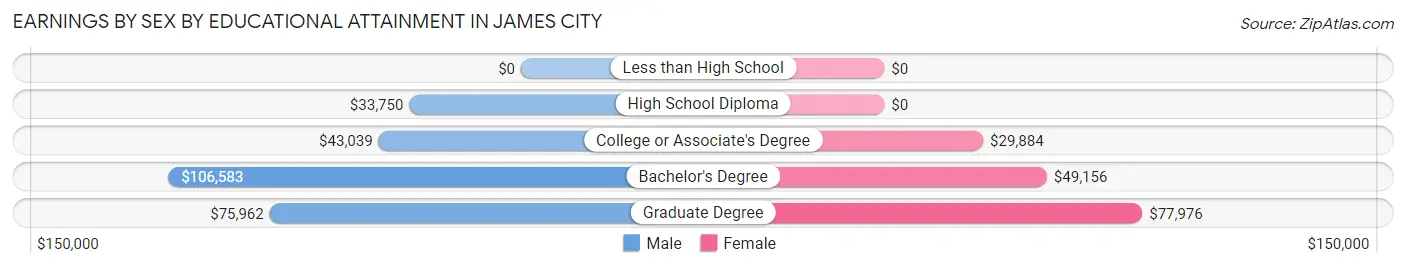
Earnings by Sex by Educational Attainment in James City
Average earnings in James City are $43,456 for men and $32,847 for women, a difference of 24.4%. Men with an educational attainment of bachelor's degree enjoy the highest average annual earnings of $106,583, while those with high school diploma education earn the least with $33,750. Women with an educational attainment of graduate degree earn the most with the average annual earnings of $77,976, while those with college or associate's degree education have the smallest earnings of $29,884.
| Educational Attainment | Male Income | Female Income |
| Less than High School | - | - |
| High School Diploma | $33,750 | $0 |
| College or Associate's Degree | $43,039 | $29,884 |
| Bachelor's Degree | $106,583 | $49,156 |
| Graduate Degree | $75,962 | $77,976 |
| Total | $43,456 | $32,847 |
Family Income in James City
Family Income Brackets in James City
According to the James City family income data, there are 391 families falling into the $50,000 to $74,999 income range, which is the most common income bracket and makes up 27.2% of all families.
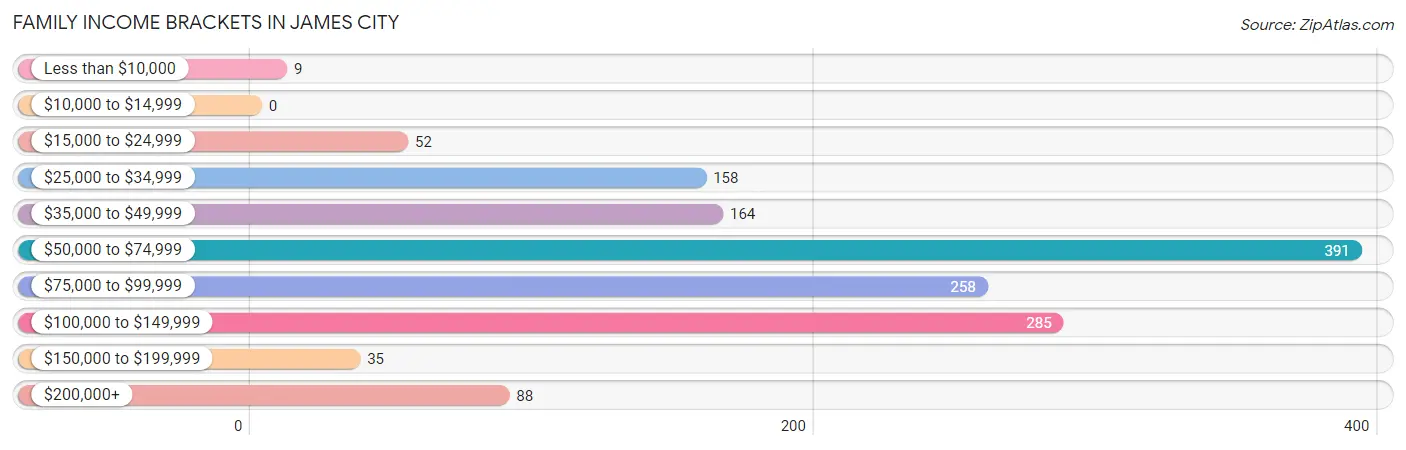
| Income Bracket | # Families | % Families |
| Less than $10,000 | 9 | 0.6% |
| $10,000 to $14,999 | 0 | 0.0% |
| $15,000 to $24,999 | 52 | 3.6% |
| $25,000 to $34,999 | 158 | 11.0% |
| $35,000 to $49,999 | 164 | 11.4% |
| $50,000 to $74,999 | 391 | 27.2% |
| $75,000 to $99,999 | 258 | 17.9% |
| $100,000 to $149,999 | 285 | 19.8% |
| $150,000 to $199,999 | 35 | 2.4% |
| $200,000+ | 88 | 6.1% |
Family Income by Famaliy Size in James City
4-person families (161 | 11.2%) account for the highest median family income in James City with $118,006 per family, while 2-person families (962 | 66.8%) have the highest median income of $34,193 per family member.
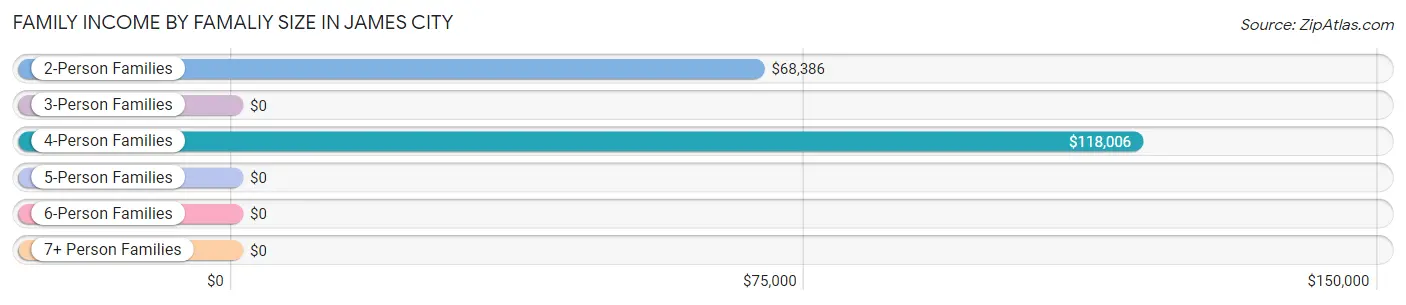
| Income Bracket | # Families | Median Income |
| 2-Person Families | 962 (66.8%) | $68,386 |
| 3-Person Families | 183 (12.7%) | $0 |
| 4-Person Families | 161 (11.2%) | $118,006 |
| 5-Person Families | 112 (7.8%) | $0 |
| 6-Person Families | 21 (1.5%) | $0 |
| 7+ Person Families | 0 (0.0%) | $0 |
| Total | 1,439 (100.0%) | $69,359 |
Family Income by Number of Earners in James City
The median family income in James City is $69,359, with families comprising 3+ earners (77) having the highest median family income of $160,234, while families with no earners (292) have the lowest median family income of $38,571, accounting for 5.3% and 20.3% of families, respectively.
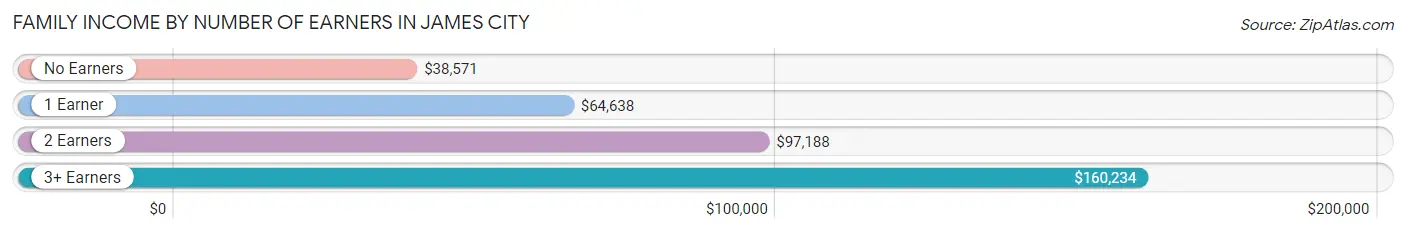
| Number of Earners | # Families | Median Income |
| No Earners | 292 (20.3%) | $38,571 |
| 1 Earner | 515 (35.8%) | $64,638 |
| 2 Earners | 555 (38.6%) | $97,188 |
| 3+ Earners | 77 (5.3%) | $160,234 |
| Total | 1,439 (100.0%) | $69,359 |
Household Income in James City
Household Income Brackets in James City
With 369 households falling in the category, the $100,000 to $149,999 income range is the most frequent in James City, accounting for 18.2% of all households. In contrast, only 34 households (1.7%) fall into the $150,000 to $199,999 income bracket, making it the least populous group.
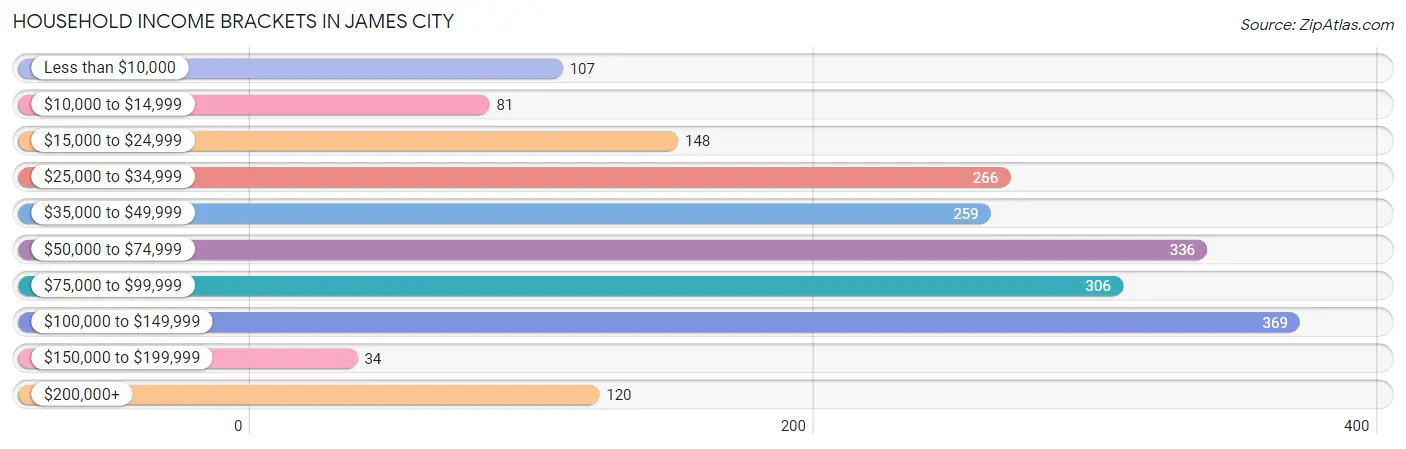
| Income Bracket | # Households | % Households |
| Less than $10,000 | 107 | 5.3% |
| $10,000 to $14,999 | 81 | 4.0% |
| $15,000 to $24,999 | 148 | 7.3% |
| $25,000 to $34,999 | 266 | 13.1% |
| $35,000 to $49,999 | 259 | 12.8% |
| $50,000 to $74,999 | 336 | 16.6% |
| $75,000 to $99,999 | 306 | 15.1% |
| $100,000 to $149,999 | 369 | 18.2% |
| $150,000 to $199,999 | 34 | 1.7% |
| $200,000+ | 120 | 5.9% |
Household Income by Householder Age in James City
The median household income in James City is $62,227, with the highest median household income of $76,250 found in the 25 to 44 years age bracket for the primary householder. A total of 597 households (29.4%) fall into this category. Meanwhile, the 15 to 24 years age bracket for the primary householder has the lowest median household income of $0, with 61 households (3.0%) in this group.
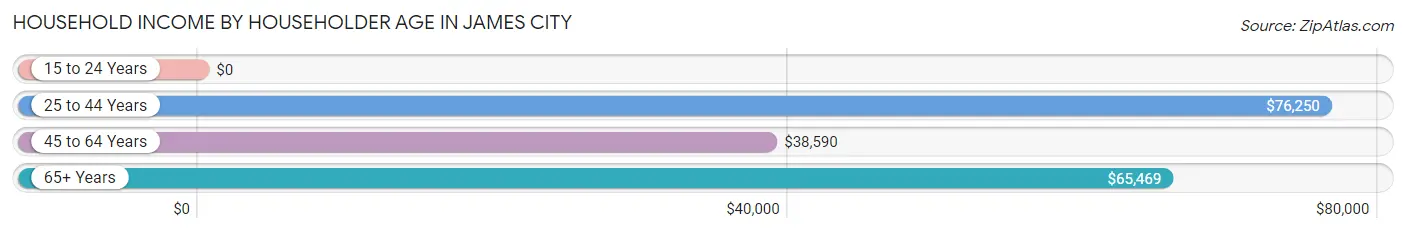
| Income Bracket | # Households | Median Income |
| 15 to 24 Years | 61 (3.0%) | $0 |
| 25 to 44 Years | 597 (29.4%) | $76,250 |
| 45 to 64 Years | 850 (41.9%) | $38,590 |
| 65+ Years | 519 (25.6%) | $65,469 |
| Total | 2,027 (100.0%) | $62,227 |
Poverty in James City
Income Below Poverty by Sex and Age in James City
With 9.4% poverty level for males and 15.4% for females among the residents of James City, 45 to 54 year old males and under 5 year old females are the most vulnerable to poverty, with 73 males (21.9%) and 21 females (52.5%) in their respective age groups living below the poverty level.
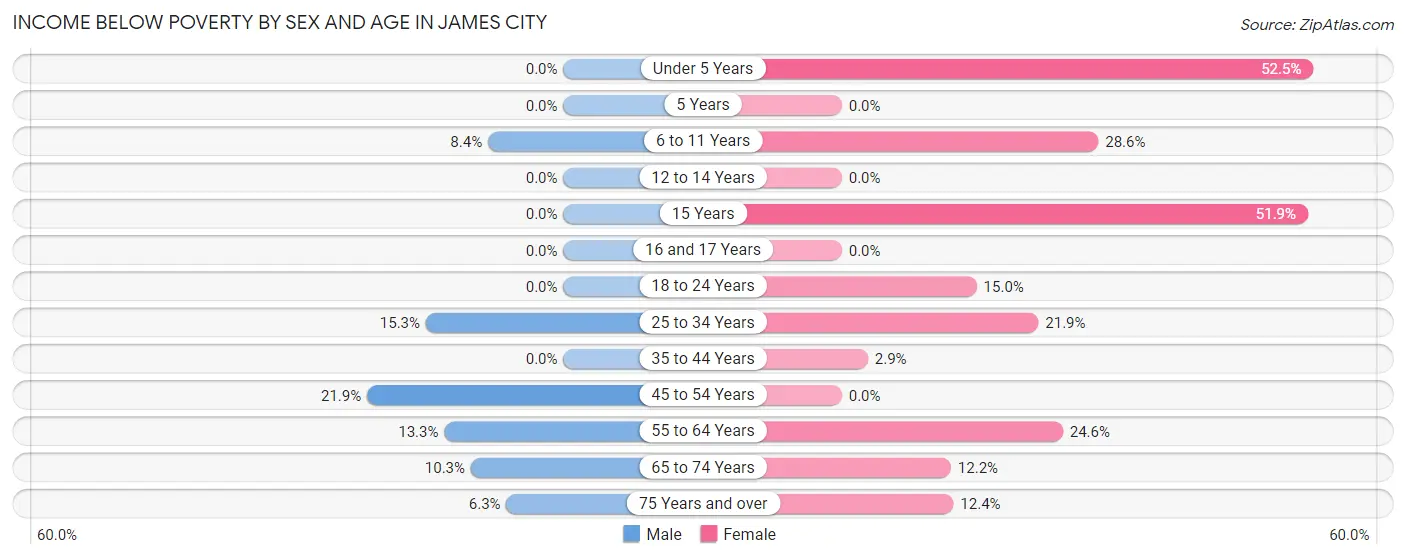
| Age Bracket | Male | Female |
| Under 5 Years | 0 (0.0%) | 21 (52.5%) |
| 5 Years | 0 (0.0%) | 0 (0.0%) |
| 6 to 11 Years | 12 (8.4%) | 82 (28.6%) |
| 12 to 14 Years | 0 (0.0%) | 0 (0.0%) |
| 15 Years | 0 (0.0%) | 41 (51.9%) |
| 16 and 17 Years | 0 (0.0%) | 0 (0.0%) |
| 18 to 24 Years | 0 (0.0%) | 38 (15.0%) |
| 25 to 34 Years | 45 (15.3%) | 44 (21.9%) |
| 35 to 44 Years | 0 (0.0%) | 13 (2.9%) |
| 45 to 54 Years | 73 (21.9%) | 0 (0.0%) |
| 55 to 64 Years | 50 (13.3%) | 111 (24.6%) |
| 65 to 74 Years | 31 (10.3%) | 43 (12.1%) |
| 75 Years and over | 9 (6.3%) | 23 (12.4%) |
| Total | 220 (9.4%) | 416 (15.4%) |
Income Above Poverty by Sex and Age in James City
According to the poverty statistics in James City, males aged under 5 years and females aged 5 years are the age groups that are most secure financially, with 100.0% of males and 100.0% of females in these age groups living above the poverty line.
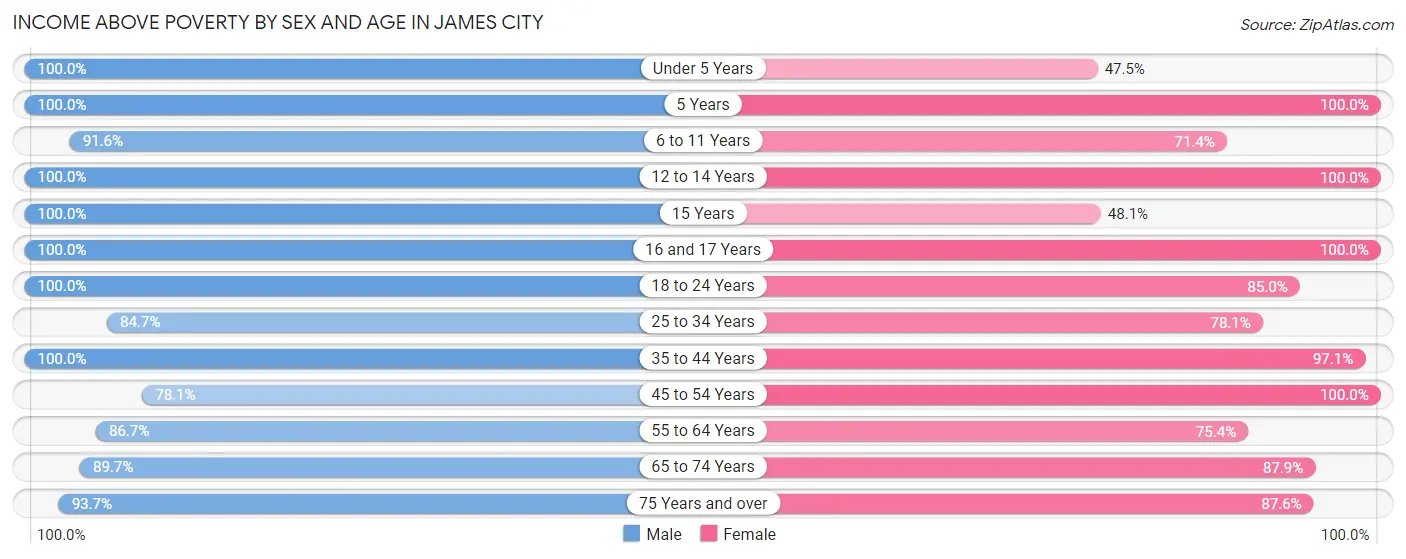
| Age Bracket | Male | Female |
| Under 5 Years | 101 (100.0%) | 19 (47.5%) |
| 5 Years | 54 (100.0%) | 37 (100.0%) |
| 6 to 11 Years | 131 (91.6%) | 205 (71.4%) |
| 12 to 14 Years | 48 (100.0%) | 18 (100.0%) |
| 15 Years | 19 (100.0%) | 38 (48.1%) |
| 16 and 17 Years | 86 (100.0%) | 76 (100.0%) |
| 18 to 24 Years | 125 (100.0%) | 215 (85.0%) |
| 25 to 34 Years | 249 (84.7%) | 157 (78.1%) |
| 35 to 44 Years | 317 (100.0%) | 436 (97.1%) |
| 45 to 54 Years | 261 (78.1%) | 278 (100.0%) |
| 55 to 64 Years | 327 (86.7%) | 340 (75.4%) |
| 65 to 74 Years | 270 (89.7%) | 311 (87.8%) |
| 75 Years and over | 133 (93.7%) | 162 (87.6%) |
| Total | 2,121 (90.6%) | 2,292 (84.6%) |
Income Below Poverty Among Married-Couple Families in James City
The poverty statistics for married-couple families in James City show that 7.2% or 74 of the total 1,025 families live below the poverty line. Families with 3 or 4 children have the highest poverty rate of 38.2%, comprising of 29 families. On the other hand, families with no children have the lowest poverty rate of 4.5%, which includes 30 families.
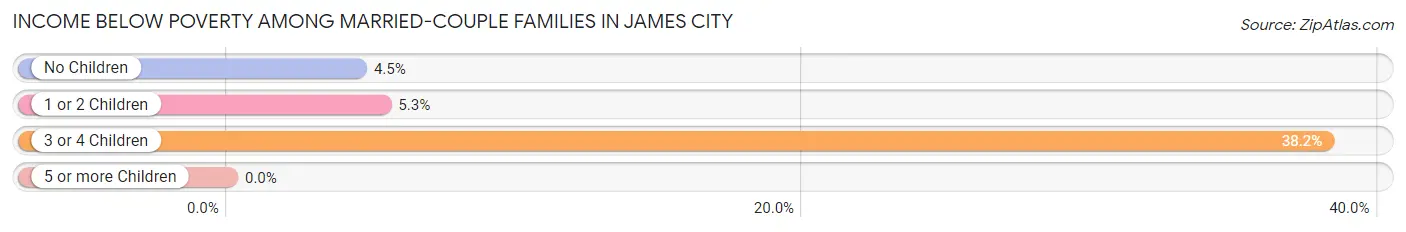
| Children | Above Poverty | Below Poverty |
| No Children | 638 (95.5%) | 30 (4.5%) |
| 1 or 2 Children | 266 (94.7%) | 15 (5.3%) |
| 3 or 4 Children | 47 (61.8%) | 29 (38.2%) |
| 5 or more Children | 0 (0.0%) | 0 (0.0%) |
| Total | 951 (92.8%) | 74 (7.2%) |
Income Below Poverty Among Single-Parent Households in James City
| Children | Single Father | Single Mother |
| No Children | 0 (0.0%) | 0 (0.0%) |
| 1 or 2 Children | 0 (0.0%) | 0 (0.0%) |
| 3 or 4 Children | 0 (0.0%) | 0 (0.0%) |
| 5 or more Children | 0 (0.0%) | 0 (0.0%) |
| Total | 0 (0.0%) | 0 (0.0%) |
Income Below Poverty Among Married-Couple vs Single-Parent Households in James City
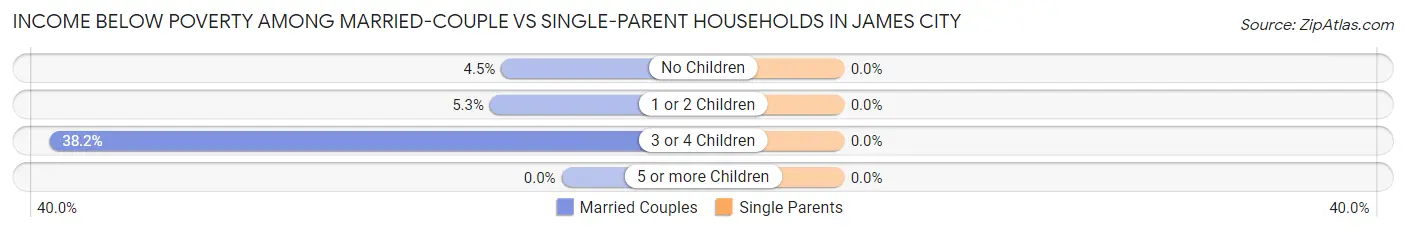
| Children | Married-Couple Families | Single-Parent Households |
| No Children | 30 (4.5%) | 0 (0.0%) |
| 1 or 2 Children | 15 (5.3%) | 0 (0.0%) |
| 3 or 4 Children | 29 (38.2%) | 0 (0.0%) |
| 5 or more Children | 0 (0.0%) | 0 (0.0%) |
| Total | 74 (7.2%) | 0 (0.0%) |
Race in James City
The most populous races in James City are White / Caucasian (3,814 | 73.5%), Black / African American (853 | 16.5%), and Two or more Races (396 | 7.6%).
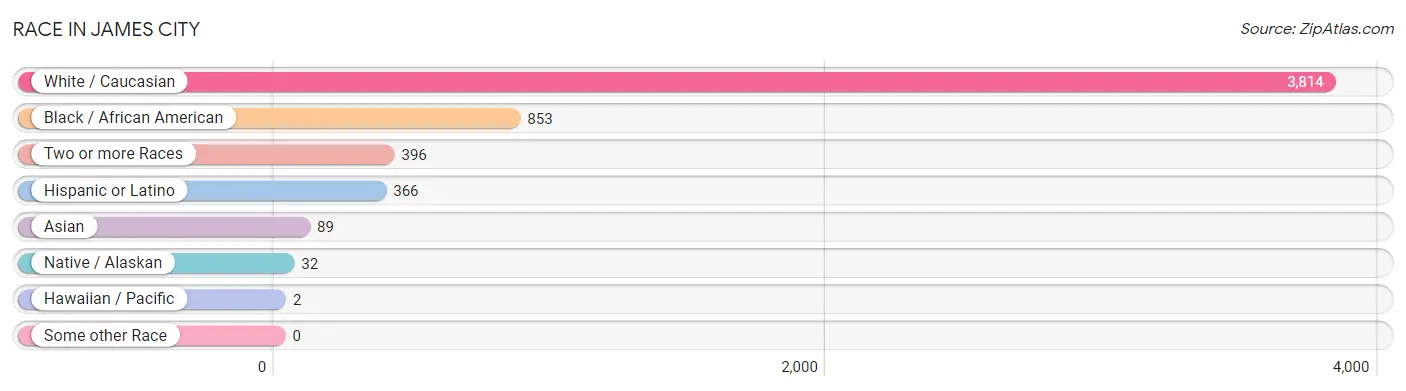
| Race | # Population | % Population |
| Asian | 89 | 1.7% |
| Black / African American | 853 | 16.5% |
| Hawaiian / Pacific | 2 | 0.0% |
| Hispanic or Latino | 366 | 7.1% |
| Native / Alaskan | 32 | 0.6% |
| White / Caucasian | 3,814 | 73.5% |
| Two or more Races | 396 | 7.6% |
| Some other Race | 0 | 0.0% |
| Total | 5,186 | 100.0% |
Ancestry in James City
The most populous ancestries reported in James City are American (1,073 | 20.7%), English (684 | 13.2%), Irish (653 | 12.6%), German (523 | 10.1%), and Mexican (277 | 5.3%), together accounting for 61.9% of all James City residents.
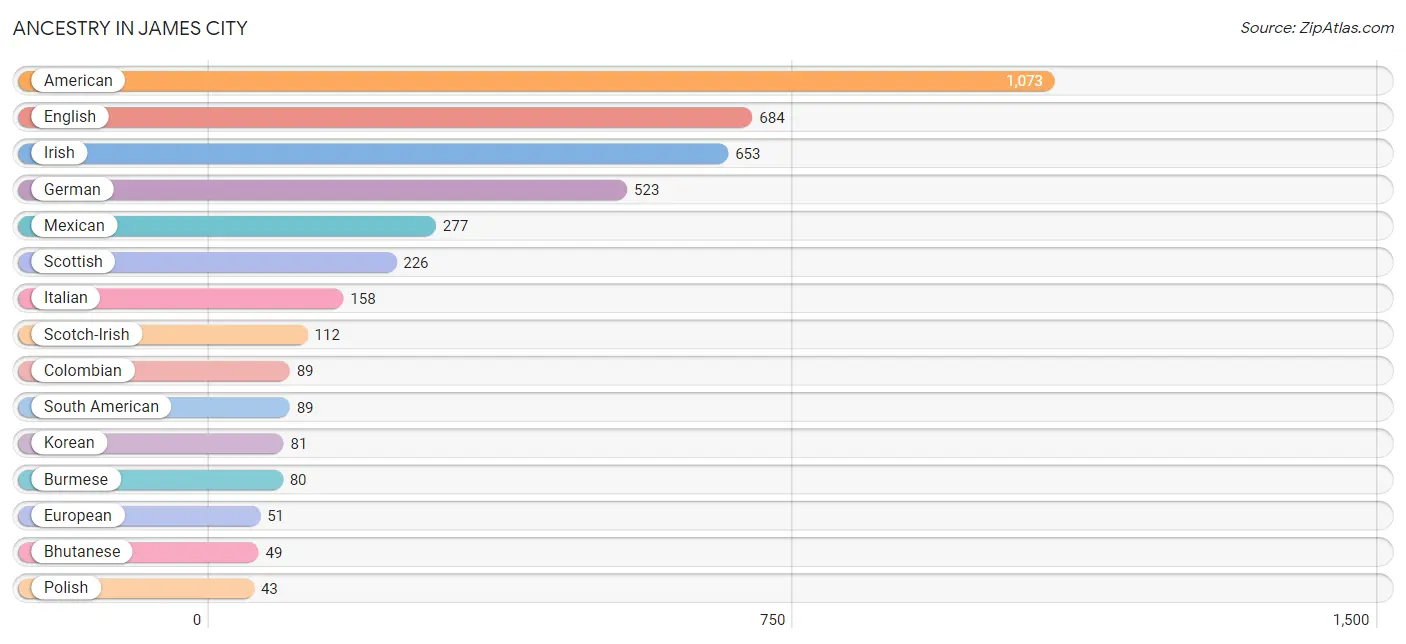
| Ancestry | # Population | % Population |
| American | 1,073 | 20.7% |
| Arab | 20 | 0.4% |
| Armenian | 17 | 0.3% |
| Austrian | 9 | 0.2% |
| Bhutanese | 49 | 0.9% |
| British | 31 | 0.6% |
| Burmese | 80 | 1.5% |
| Central American Indian | 24 | 0.5% |
| Colombian | 89 | 1.7% |
| Danish | 8 | 0.2% |
| Dutch | 23 | 0.4% |
| Eastern European | 18 | 0.4% |
| English | 684 | 13.2% |
| European | 51 | 1.0% |
| French | 11 | 0.2% |
| German | 523 | 10.1% |
| Guamanian / Chamorro | 5 | 0.1% |
| Icelander | 6 | 0.1% |
| Irish | 653 | 12.6% |
| Italian | 158 | 3.0% |
| Jamaican | 30 | 0.6% |
| Korean | 81 | 1.6% |
| Lebanese | 20 | 0.4% |
| Mexican | 277 | 5.3% |
| Norwegian | 15 | 0.3% |
| Polish | 43 | 0.8% |
| Romanian | 31 | 0.6% |
| Scandinavian | 5 | 0.1% |
| Scotch-Irish | 112 | 2.2% |
| Scottish | 226 | 4.4% |
| Slovak | 42 | 0.8% |
| South American | 89 | 1.7% |
| Swiss | 12 | 0.2% |
| Welsh | 15 | 0.3% | View All 34 Rows |
Immigrants in James City
The most numerous immigrant groups reported in James City came from Latin America (130 | 2.5%), Central America (102 | 2.0%), Mexico (102 | 2.0%), Asia (91 | 1.8%), and South Eastern Asia (83 | 1.6%), together accounting for 9.8% of all James City residents.
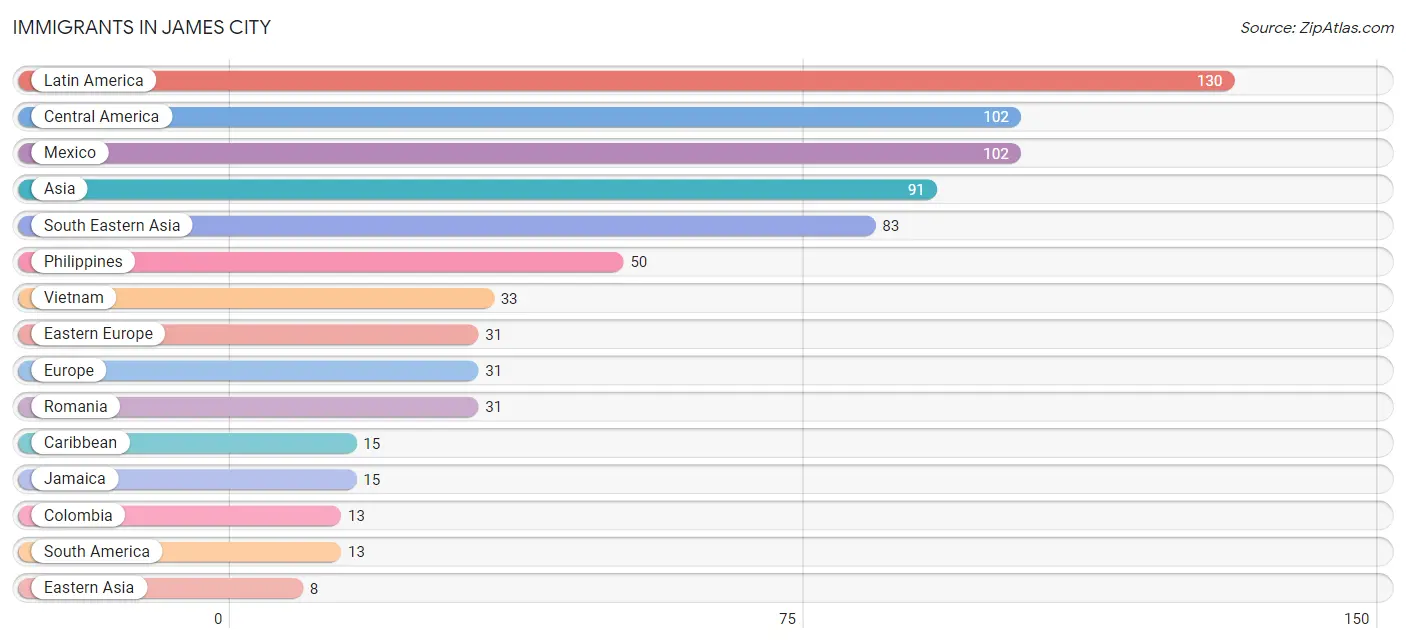
| Immigration Origin | # Population | % Population |
| Asia | 91 | 1.8% |
| Caribbean | 15 | 0.3% |
| Central America | 102 | 2.0% |
| Colombia | 13 | 0.3% |
| Eastern Asia | 8 | 0.2% |
| Eastern Europe | 31 | 0.6% |
| Europe | 31 | 0.6% |
| Jamaica | 15 | 0.3% |
| Japan | 8 | 0.2% |
| Latin America | 130 | 2.5% |
| Mexico | 102 | 2.0% |
| Philippines | 50 | 1.0% |
| Romania | 31 | 0.6% |
| South America | 13 | 0.3% |
| South Eastern Asia | 83 | 1.6% |
| Vietnam | 33 | 0.6% | View All 16 Rows |
Sex and Age in James City
Sex and Age in James City
The most populous age groups in James City are 25 to 29 Years (270 | 11.4%) for men and 60 to 64 Years (331 | 11.7%) for women.
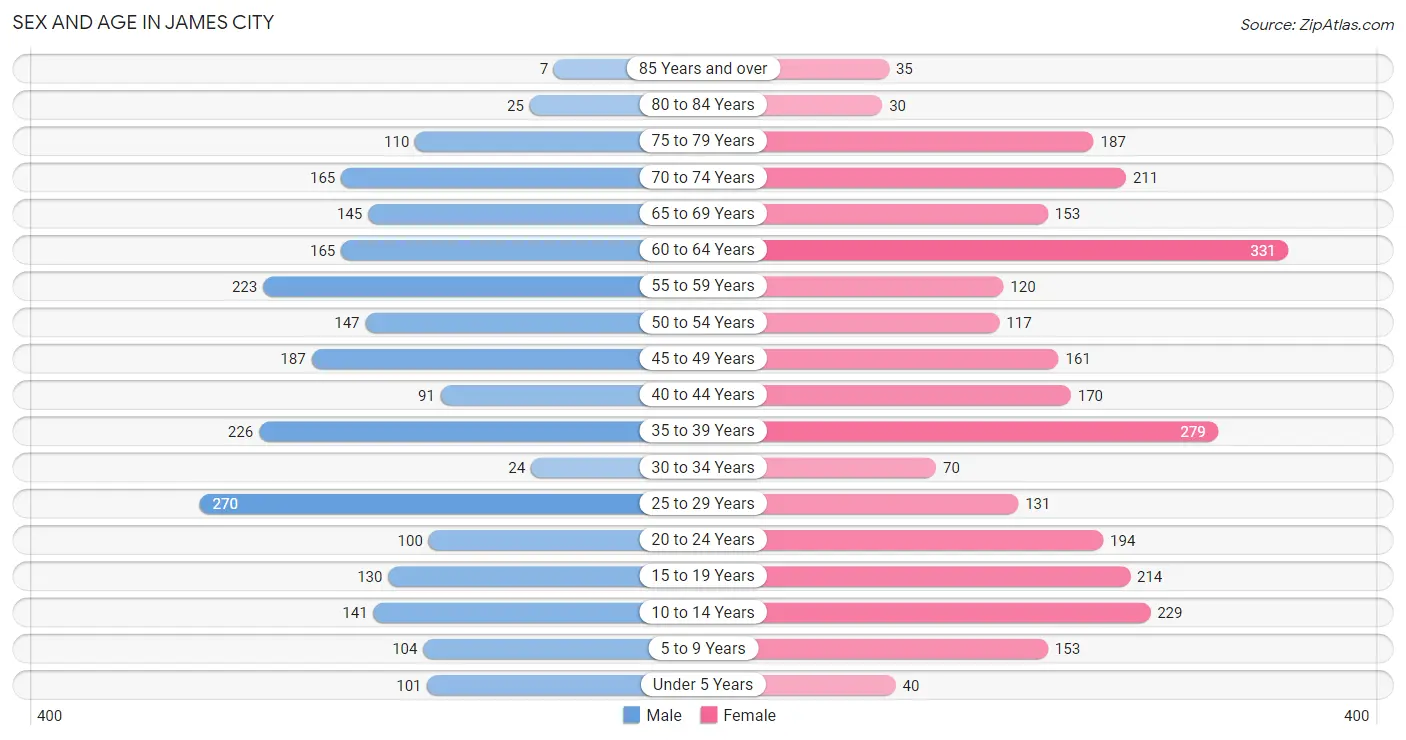
| Age Bracket | Male | Female |
| Under 5 Years | 101 (4.3%) | 40 (1.4%) |
| 5 to 9 Years | 104 (4.4%) | 153 (5.4%) |
| 10 to 14 Years | 141 (6.0%) | 229 (8.1%) |
| 15 to 19 Years | 130 (5.5%) | 214 (7.6%) |
| 20 to 24 Years | 100 (4.2%) | 194 (6.9%) |
| 25 to 29 Years | 270 (11.4%) | 131 (4.6%) |
| 30 to 34 Years | 24 (1.0%) | 70 (2.5%) |
| 35 to 39 Years | 226 (9.6%) | 279 (9.9%) |
| 40 to 44 Years | 91 (3.8%) | 170 (6.0%) |
| 45 to 49 Years | 187 (7.9%) | 161 (5.7%) |
| 50 to 54 Years | 147 (6.2%) | 117 (4.1%) |
| 55 to 59 Years | 223 (9.5%) | 120 (4.3%) |
| 60 to 64 Years | 165 (7.0%) | 331 (11.7%) |
| 65 to 69 Years | 145 (6.1%) | 153 (5.4%) |
| 70 to 74 Years | 165 (7.0%) | 211 (7.5%) |
| 75 to 79 Years | 110 (4.7%) | 187 (6.6%) |
| 80 to 84 Years | 25 (1.1%) | 30 (1.1%) |
| 85 Years and over | 7 (0.3%) | 35 (1.2%) |
| Total | 2,361 (100.0%) | 2,825 (100.0%) |
Families and Households in James City
Median Family Size in James City
The median family size in James City is 2.83 persons per family, with married-couple families (1,025 | 71.2%) accounting for the largest median family size of 3.1 persons per family. On the other hand, single female/mother families (124 | 8.6%) represent the smallest median family size with 1.92 persons per family.
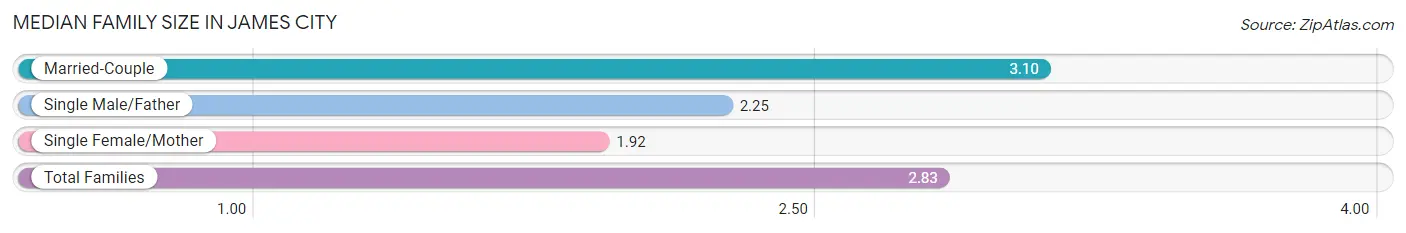
| Family Type | # Families | Family Size |
| Married-Couple | 1,025 (71.2%) | 3.10 |
| Single Male/Father | 290 (20.2%) | 2.25 |
| Single Female/Mother | 124 (8.6%) | 1.92 |
| Total Families | 1,439 (100.0%) | 2.83 |
Median Household Size in James City
The median household size in James City is 2.48 persons per household, with married-couple households (1,025 | 50.6%) accounting for the largest median household size of 3.19 persons per household. non-family households (588 | 29.0%) represent the smallest median household size with 1.11 persons per household.
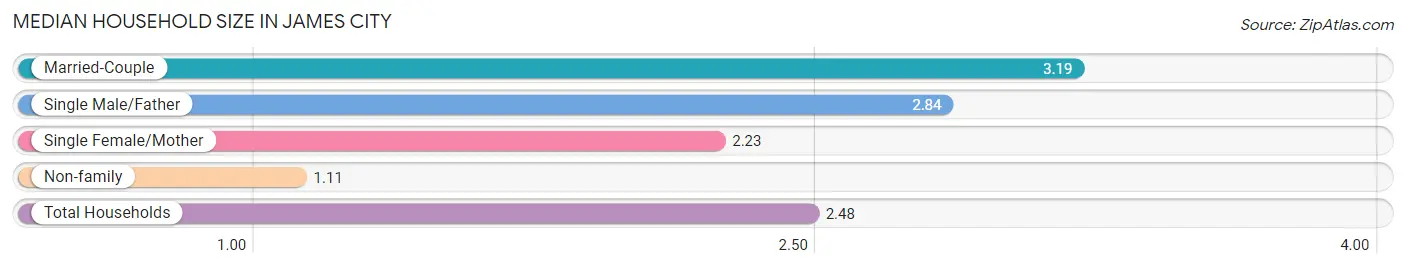
| Household Type | # Households | Household Size |
| Married-Couple | 1,025 (50.6%) | 3.19 |
| Single Male/Father | 290 (14.3%) | 2.84 |
| Single Female/Mother | 124 (6.1%) | 2.23 |
| Non-family | 588 (29.0%) | 1.11 |
| Total Households | 2,027 (100.0%) | 2.48 |
Household Size by Marriage Status in James City
Out of a total of 2,027 households in James City, 1,439 (71.0%) are family households, while 588 (29.0%) are nonfamily households. The most numerous type of family households are 2-person households, comprising 724, and the most common type of nonfamily households are 1-person households, comprising 526.
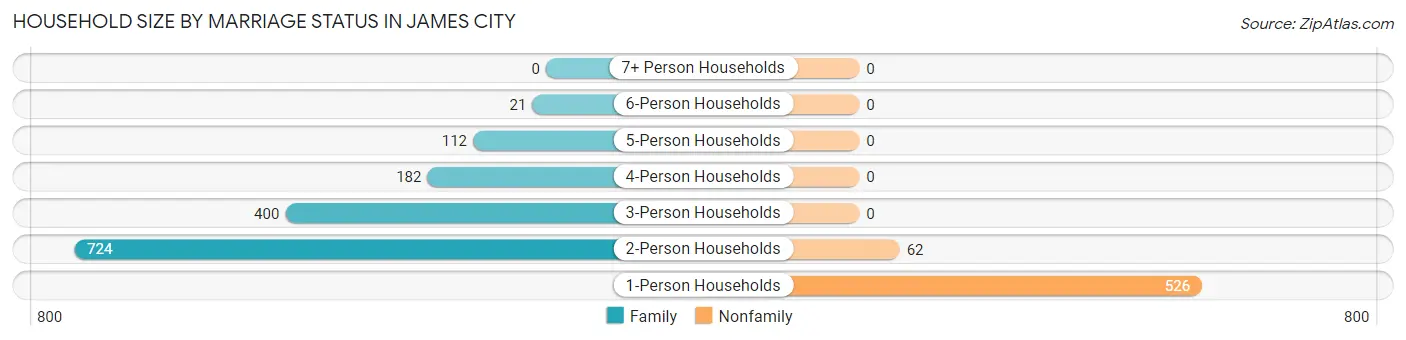
| Household Size | Family Households | Nonfamily Households |
| 1-Person Households | - | 526 (26.0%) |
| 2-Person Households | 724 (35.7%) | 62 (3.1%) |
| 3-Person Households | 400 (19.7%) | 0 (0.0%) |
| 4-Person Households | 182 (9.0%) | 0 (0.0%) |
| 5-Person Households | 112 (5.5%) | 0 (0.0%) |
| 6-Person Households | 21 (1.0%) | 0 (0.0%) |
| 7+ Person Households | 0 (0.0%) | 0 (0.0%) |
| Total | 1,439 (71.0%) | 588 (29.0%) |
Female Fertility in James City
Fertility by Age in James City
Average fertility rate in James City is 15.0 births per 1,000 women. Women in the age bracket of 20 to 34 years have the highest fertility rate with 46.0 births per 1,000 women. Women in the age bracket of 20 to 34 years acount for 100.0% of all women with births.
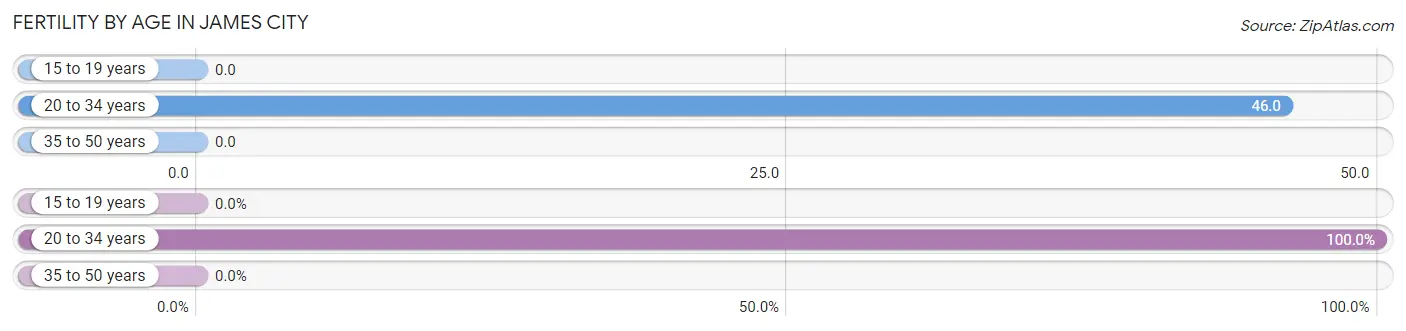
| Age Bracket | Women with Births | Births / 1,000 Women |
| 15 to 19 years | 0 (0.0%) | 0.0 |
| 20 to 34 years | 18 (100.0%) | 46.0 |
| 35 to 50 years | 0 (0.0%) | 0.0 |
| Total | 18 (100.0%) | 15.0 |
Fertility by Age by Marriage Status in James City
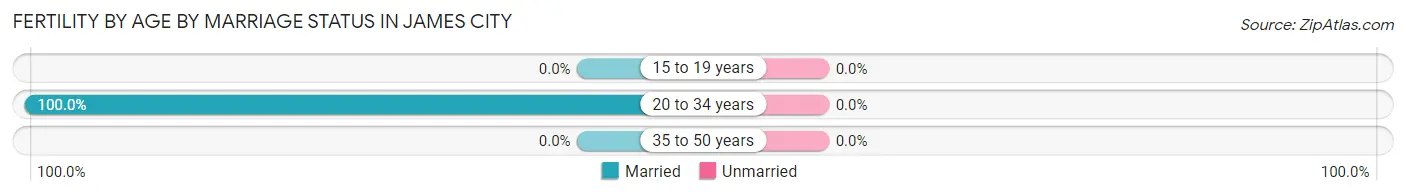
| Age Bracket | Married | Unmarried |
| 15 to 19 years | 0 (0.0%) | 0 (0.0%) |
| 20 to 34 years | 18 (100.0%) | 0 (0.0%) |
| 35 to 50 years | 0 (0.0%) | 0 (0.0%) |
| Total | 18 (100.0%) | 0 (0.0%) |
Fertility by Education in James City
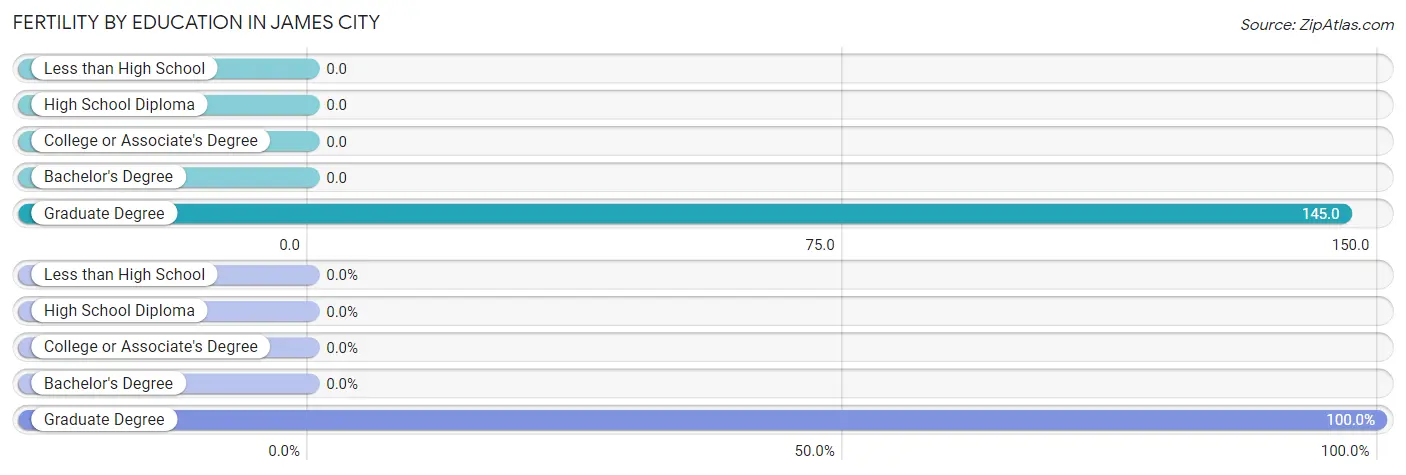
| Educational Attainment | Women with Births | Births / 1,000 Women |
| Less than High School | 0 (0.0%) | 0.0 |
| High School Diploma | 0 (0.0%) | 0.0 |
| College or Associate's Degree | 0 (0.0%) | 0.0 |
| Bachelor's Degree | 0 (0.0%) | 0.0 |
| Graduate Degree | 18 (100.0%) | 145.0 |
| Total | 18 (100.0%) | 15.0 |
Fertility by Education by Marriage Status in James City
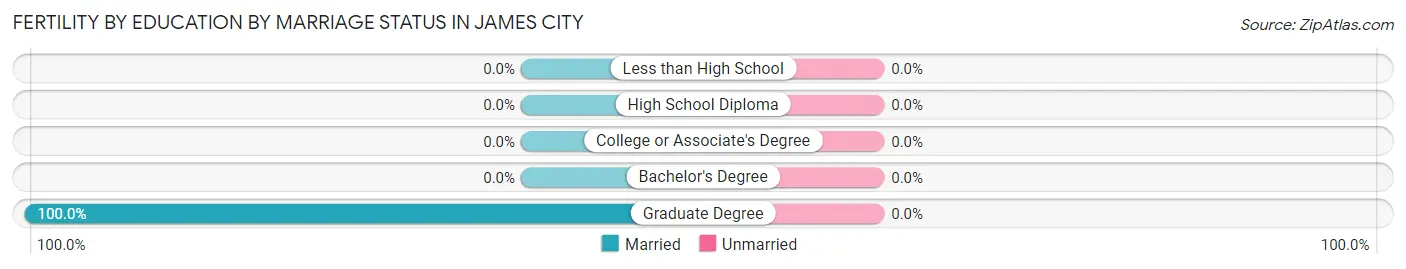
| Educational Attainment | Married | Unmarried |
| Less than High School | 0 (0.0%) | 0 (0.0%) |
| High School Diploma | 0 (0.0%) | 0 (0.0%) |
| College or Associate's Degree | 0 (0.0%) | 0 (0.0%) |
| Bachelor's Degree | 0 (0.0%) | 0 (0.0%) |
| Graduate Degree | 18 (100.0%) | 0 (0.0%) |
| Total | 18 (100.0%) | 0 (0.0%) |
Employment Characteristics in James City
Employment by Class of Employer in James City
Among the 2,433 employed individuals in James City, private company employees (1,781 | 73.2%), federal government employees (303 | 12.4%), and not-for-profit organizations (98 | 4.0%) make up the most common classes of employment.
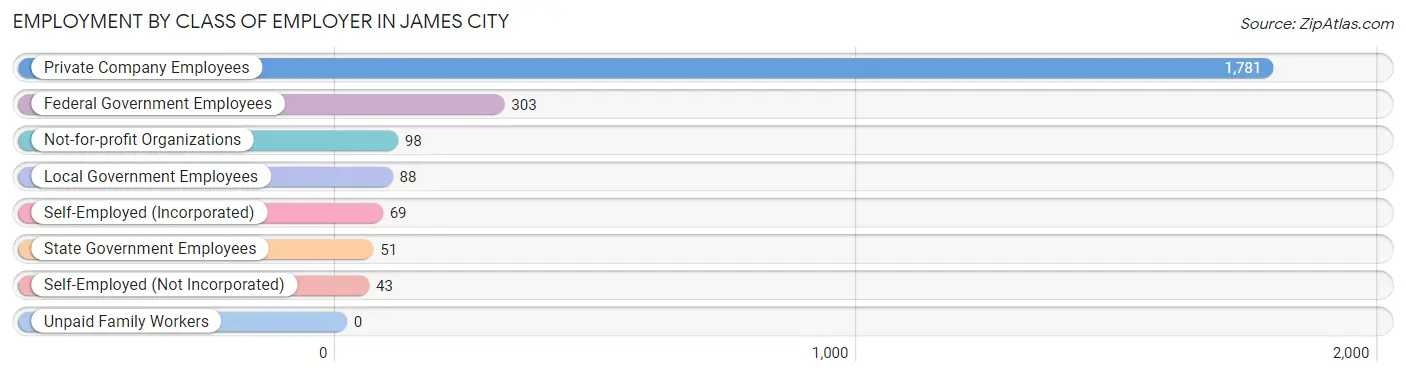
| Employer Class | # Employees | % Employees |
| Private Company Employees | 1,781 | 73.2% |
| Self-Employed (Incorporated) | 69 | 2.8% |
| Self-Employed (Not Incorporated) | 43 | 1.8% |
| Not-for-profit Organizations | 98 | 4.0% |
| Local Government Employees | 88 | 3.6% |
| State Government Employees | 51 | 2.1% |
| Federal Government Employees | 303 | 12.4% |
| Unpaid Family Workers | 0 | 0.0% |
| Total | 2,433 | 100.0% |
Employment Status by Age in James City
According to the labor force statistics for James City, out of the total population over 16 years of age (4,320), 59.3% or 2,562 individuals are in the labor force, with 4.8% or 123 of them unemployed. The age group with the highest labor force participation rate is 20 to 24 years, with 96.3% or 283 individuals in the labor force. Within the labor force, the 16 to 19 years age range has the highest percentage of unemployed individuals, with 20.5% or 34 of them being unemployed.
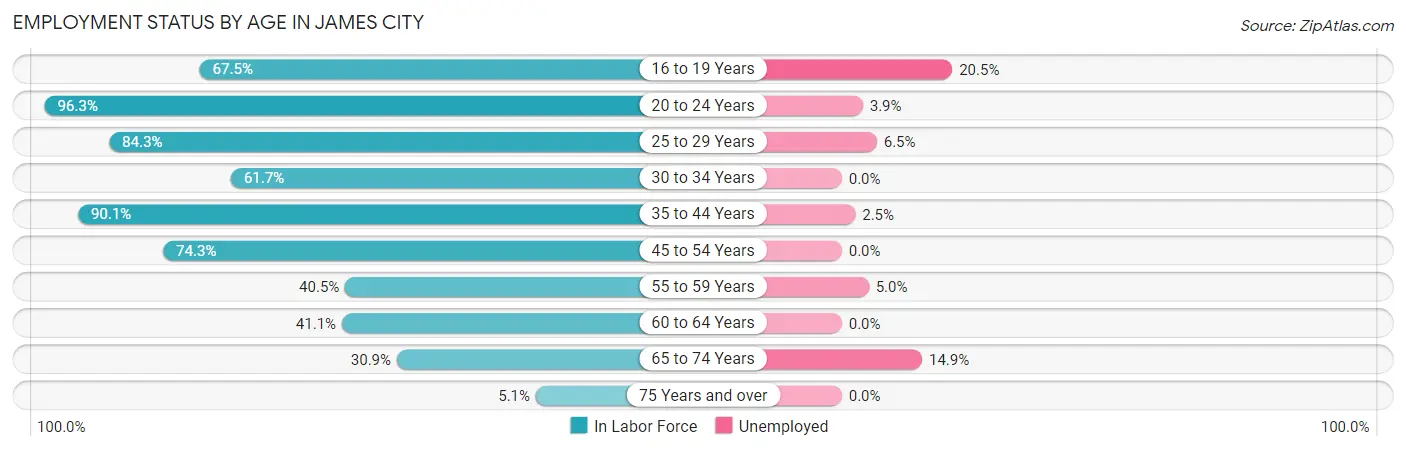
| Age Bracket | In Labor Force | Unemployed |
| 16 to 19 Years | 166 (67.5%) | 34 (20.5%) |
| 20 to 24 Years | 283 (96.3%) | 11 (3.9%) |
| 25 to 29 Years | 338 (84.3%) | 22 (6.5%) |
| 30 to 34 Years | 58 (61.7%) | 0 (0.0%) |
| 35 to 44 Years | 690 (90.1%) | 17 (2.5%) |
| 45 to 54 Years | 455 (74.3%) | 0 (0.0%) |
| 55 to 59 Years | 139 (40.5%) | 7 (5.0%) |
| 60 to 64 Years | 204 (41.1%) | 0 (0.0%) |
| 65 to 74 Years | 208 (30.9%) | 31 (14.9%) |
| 75 Years and over | 20 (5.1%) | 0 (0.0%) |
| Total | 2,562 (59.3%) | 123 (4.8%) |
Employment Status by Educational Attainment in James City
According to labor force statistics for James City, 69.5% of individuals (1,885) out of the total population between 25 and 64 years of age (2,712) are in the labor force, with 2.4% or 45 of them being unemployed. The group with the highest labor force participation rate are those with the educational attainment of bachelor's degree or higher, with 87.4% or 452 individuals in the labor force. Within the labor force, individuals with less than high school education have the highest percentage of unemployment, with 15.1% or 21 of them being unemployed.
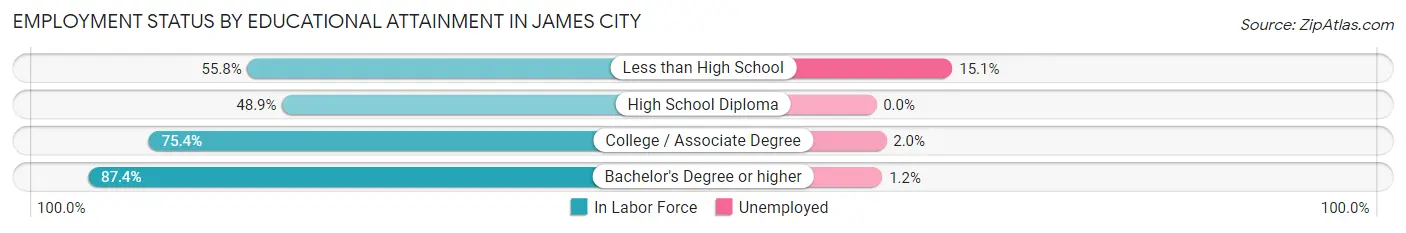
| Educational Attainment | In Labor Force | Unemployed |
| Less than High School | 139 (55.8%) | 38 (15.1%) |
| High School Diploma | 321 (48.9%) | 0 (0.0%) |
| College / Associate Degree | 972 (75.4%) | 26 (2.0%) |
| Bachelor's Degree or higher | 452 (87.4%) | 6 (1.2%) |
| Total | 1,885 (69.5%) | 65 (2.4%) |
Employment Occupations by Sex in James City
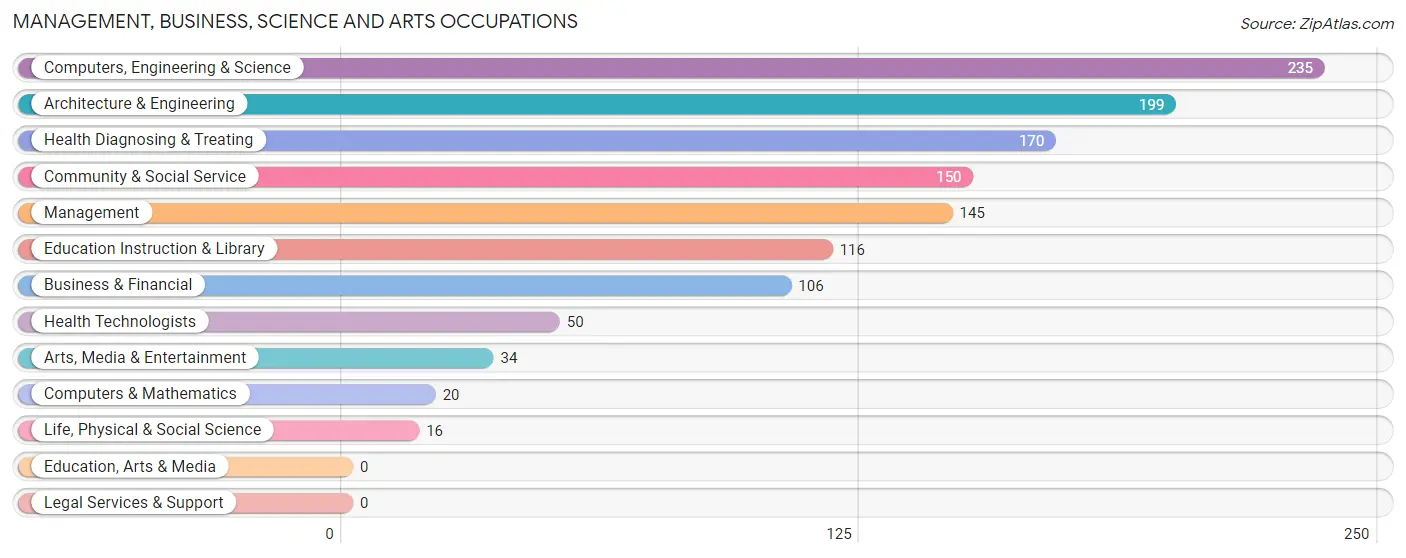
Management, Business, Science and Arts Occupations
The most common Management, Business, Science and Arts occupations in James City are Computers, Engineering & Science (235 | 9.8%), Architecture & Engineering (199 | 8.3%), Health Diagnosing & Treating (170 | 7.1%), Community & Social Service (150 | 6.2%), and Management (145 | 6.0%).
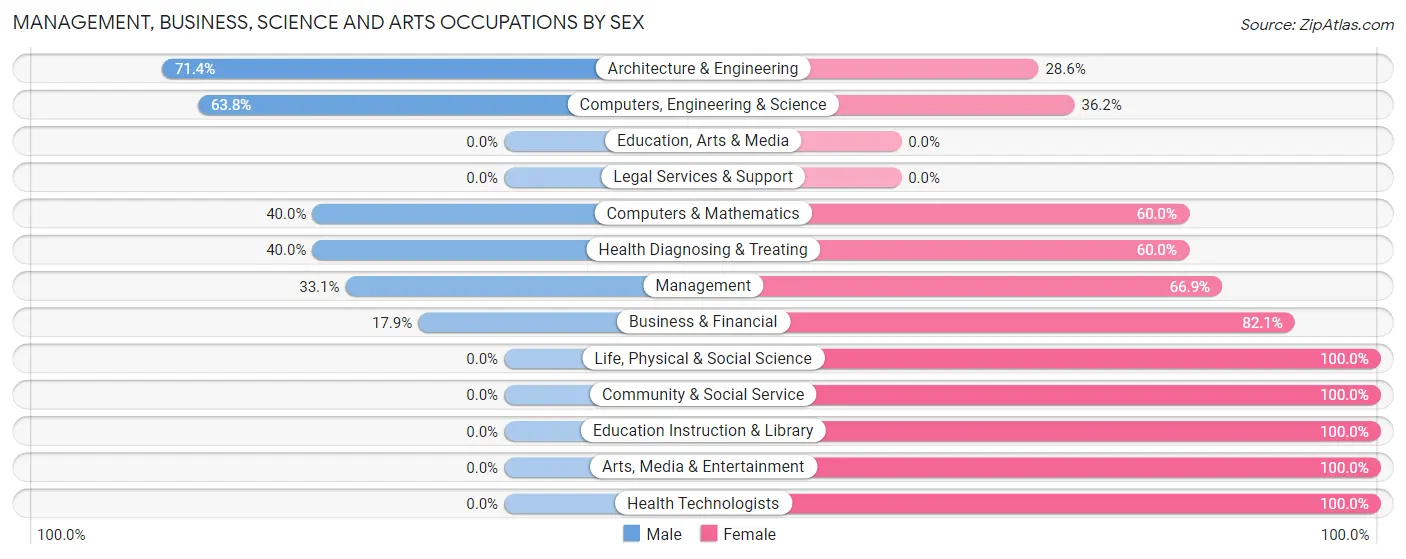
Management, Business, Science and Arts Occupations by Sex
Within the Management, Business, Science and Arts occupations in James City, the most male-oriented occupations are Architecture & Engineering (71.4%), Computers, Engineering & Science (63.8%), and Computers & Mathematics (40.0%), while the most female-oriented occupations are Life, Physical & Social Science (100.0%), Community & Social Service (100.0%), and Education Instruction & Library (100.0%).
| Occupation | Male | Female |
| Management | 48 (33.1%) | 97 (66.9%) |
| Business & Financial | 19 (17.9%) | 87 (82.1%) |
| Computers, Engineering & Science | 150 (63.8%) | 85 (36.2%) |
| Computers & Mathematics | 8 (40.0%) | 12 (60.0%) |
| Architecture & Engineering | 142 (71.4%) | 57 (28.6%) |
| Life, Physical & Social Science | 0 (0.0%) | 16 (100.0%) |
| Community & Social Service | 0 (0.0%) | 150 (100.0%) |
| Education, Arts & Media | 0 (0.0%) | 0 (0.0%) |
| Legal Services & Support | 0 (0.0%) | 0 (0.0%) |
| Education Instruction & Library | 0 (0.0%) | 116 (100.0%) |
| Arts, Media & Entertainment | 0 (0.0%) | 34 (100.0%) |
| Health Diagnosing & Treating | 68 (40.0%) | 102 (60.0%) |
| Health Technologists | 0 (0.0%) | 50 (100.0%) |
| Total (Category) | 285 (35.4%) | 521 (64.6%) |
| Total (Overall) | 1,202 (50.1%) | 1,198 (49.9%) |
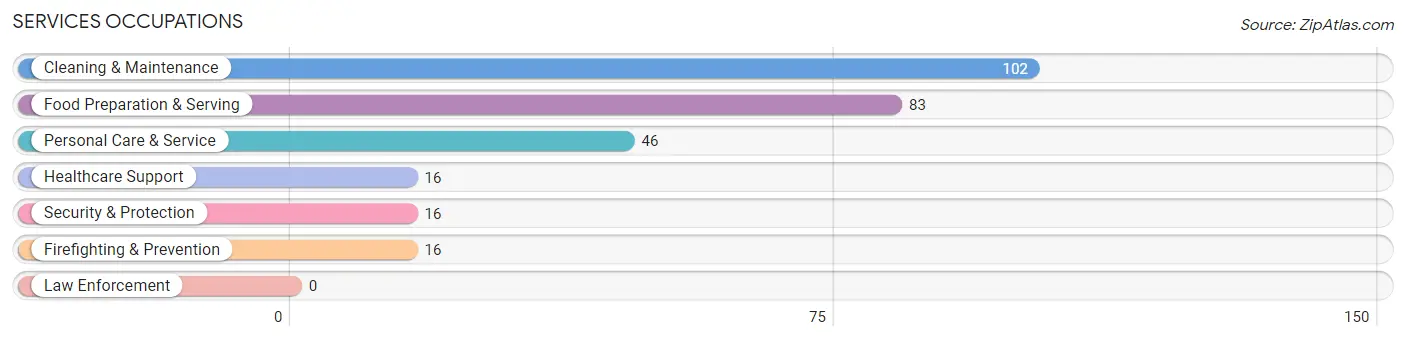
Services Occupations
The most common Services occupations in James City are Cleaning & Maintenance (102 | 4.3%), Food Preparation & Serving (83 | 3.5%), Personal Care & Service (46 | 1.9%), Healthcare Support (16 | 0.7%), and Security & Protection (16 | 0.7%).
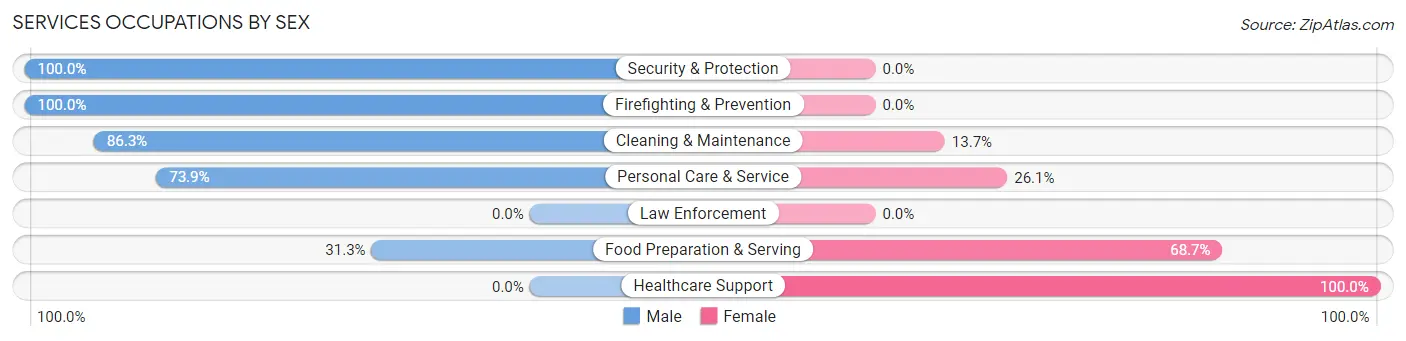
Services Occupations by Sex
Within the Services occupations in James City, the most male-oriented occupations are Security & Protection (100.0%), Firefighting & Prevention (100.0%), and Cleaning & Maintenance (86.3%), while the most female-oriented occupations are Healthcare Support (100.0%), Food Preparation & Serving (68.7%), and Personal Care & Service (26.1%).
| Occupation | Male | Female |
| Healthcare Support | 0 (0.0%) | 16 (100.0%) |
| Security & Protection | 16 (100.0%) | 0 (0.0%) |
| Firefighting & Prevention | 16 (100.0%) | 0 (0.0%) |
| Law Enforcement | 0 (0.0%) | 0 (0.0%) |
| Food Preparation & Serving | 26 (31.3%) | 57 (68.7%) |
| Cleaning & Maintenance | 88 (86.3%) | 14 (13.7%) |
| Personal Care & Service | 34 (73.9%) | 12 (26.1%) |
| Total (Category) | 164 (62.4%) | 99 (37.6%) |
| Total (Overall) | 1,202 (50.1%) | 1,198 (49.9%) |
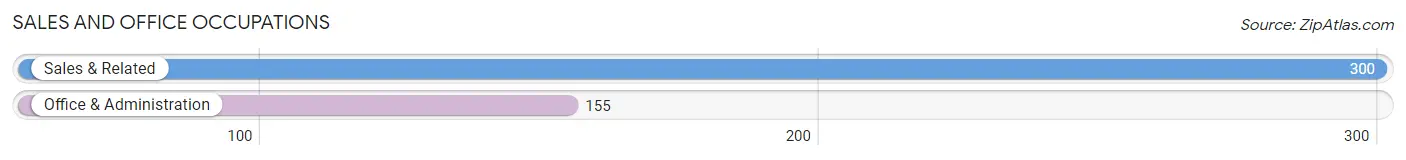
Sales and Office Occupations
The most common Sales and Office occupations in James City are Sales & Related (300 | 12.5%), and Office & Administration (155 | 6.5%).
Sales and Office Occupations by Sex
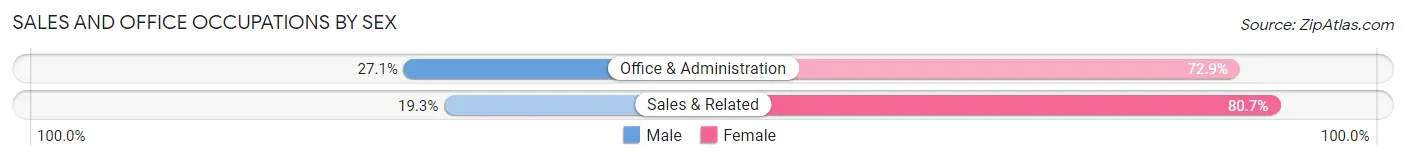
| Occupation | Male | Female |
| Sales & Related | 58 (19.3%) | 242 (80.7%) |
| Office & Administration | 42 (27.1%) | 113 (72.9%) |
| Total (Category) | 100 (22.0%) | 355 (78.0%) |
| Total (Overall) | 1,202 (50.1%) | 1,198 (49.9%) |
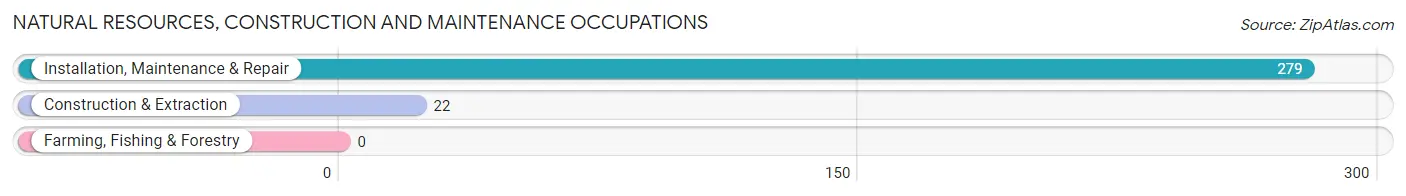
Natural Resources, Construction and Maintenance Occupations
The most common Natural Resources, Construction and Maintenance occupations in James City are Installation, Maintenance & Repair (279 | 11.6%), and Construction & Extraction (22 | 0.9%).
Natural Resources, Construction and Maintenance Occupations by Sex
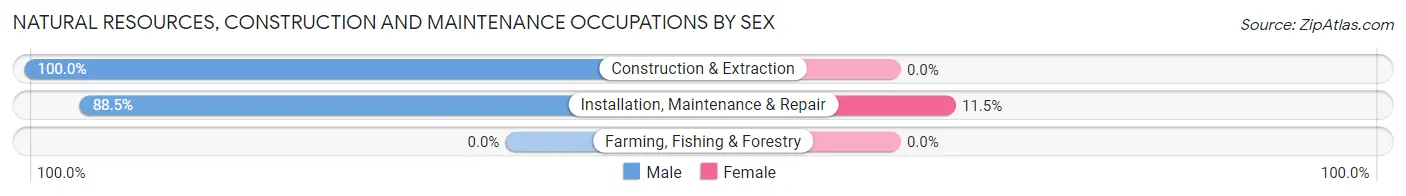
| Occupation | Male | Female |
| Farming, Fishing & Forestry | 0 (0.0%) | 0 (0.0%) |
| Construction & Extraction | 22 (100.0%) | 0 (0.0%) |
| Installation, Maintenance & Repair | 247 (88.5%) | 32 (11.5%) |
| Total (Category) | 269 (89.4%) | 32 (10.6%) |
| Total (Overall) | 1,202 (50.1%) | 1,198 (49.9%) |
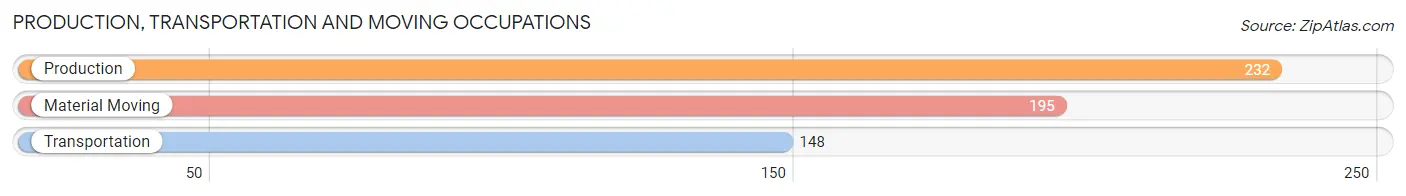
Production, Transportation and Moving Occupations
The most common Production, Transportation and Moving occupations in James City are Production (232 | 9.7%), Material Moving (195 | 8.1%), and Transportation (148 | 6.2%).
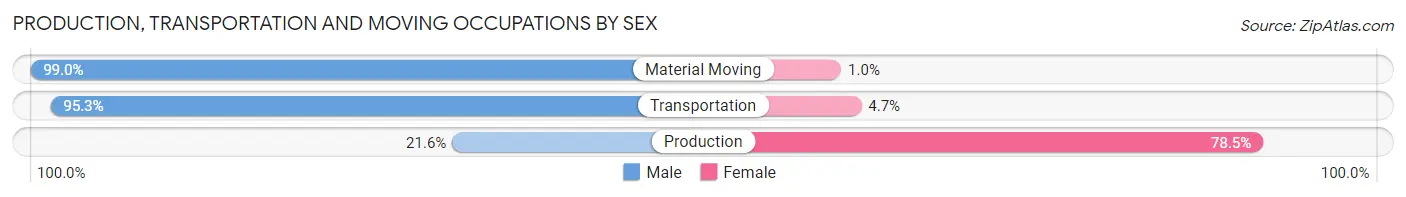
Production, Transportation and Moving Occupations by Sex
| Occupation | Male | Female |
| Production | 50 (21.5%) | 182 (78.4%) |
| Transportation | 141 (95.3%) | 7 (4.7%) |
| Material Moving | 193 (99.0%) | 2 (1.0%) |
| Total (Category) | 384 (66.8%) | 191 (33.2%) |
| Total (Overall) | 1,202 (50.1%) | 1,198 (49.9%) |
Employment Industries by Sex in James City
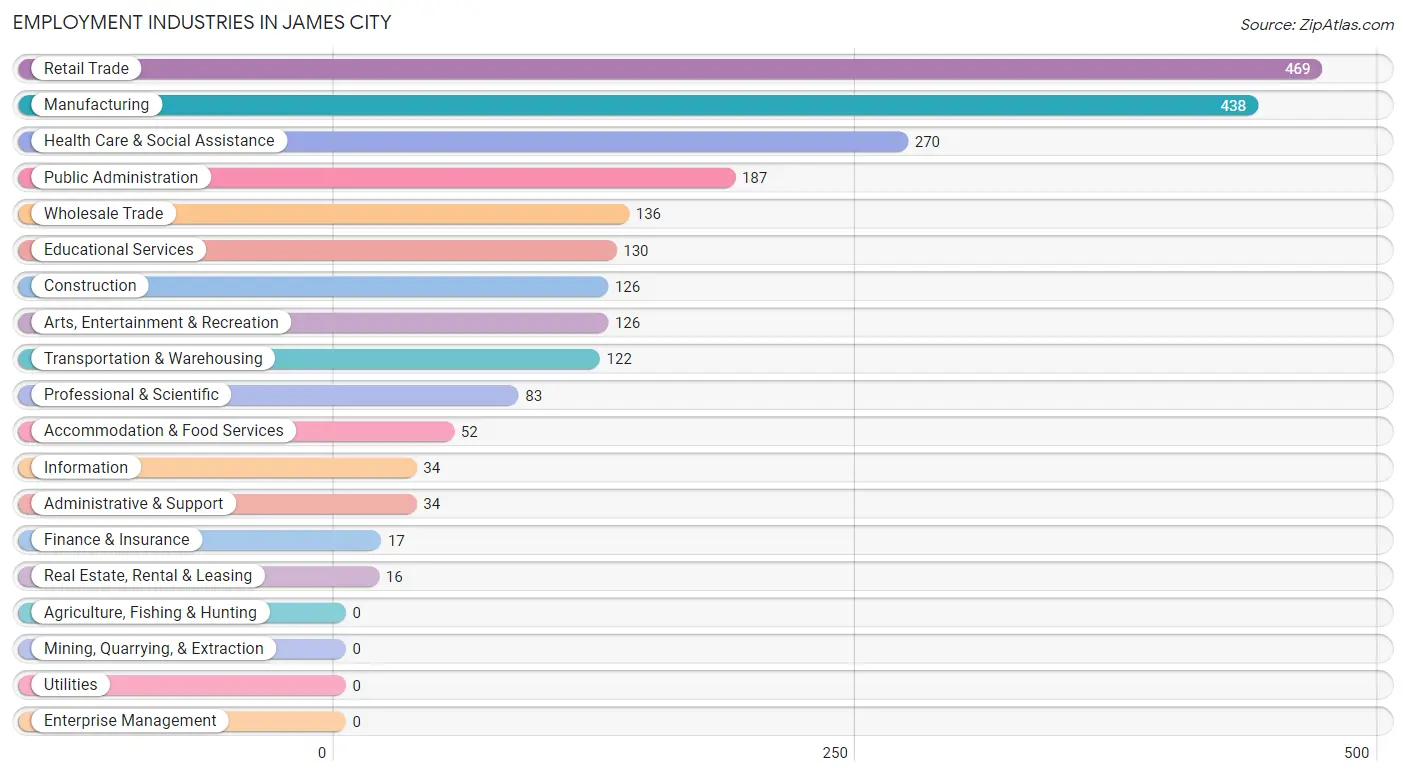
Employment Industries in James City
The major employment industries in James City include Retail Trade (469 | 19.5%), Manufacturing (438 | 18.2%), Health Care & Social Assistance (270 | 11.3%), Public Administration (187 | 7.8%), and Wholesale Trade (136 | 5.7%).
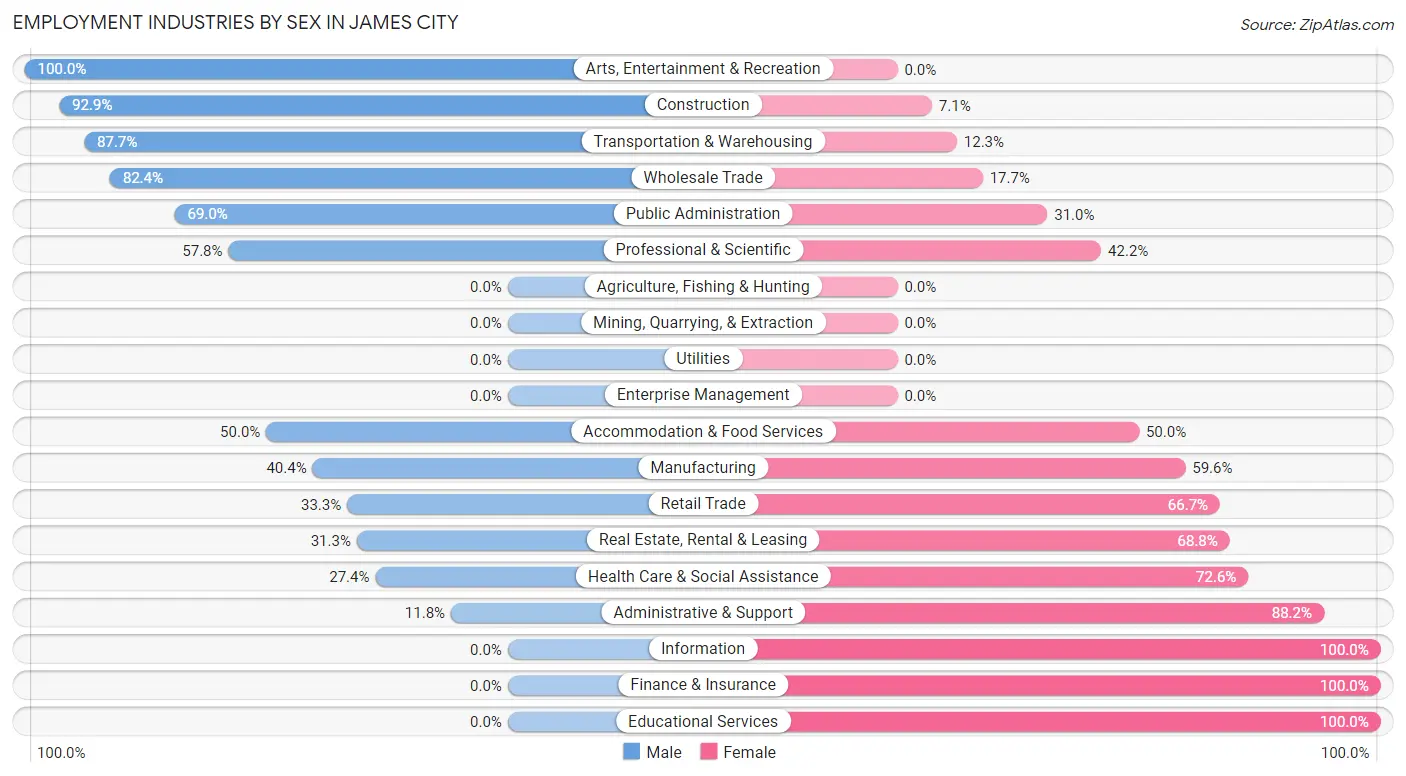
Employment Industries by Sex in James City
The James City industries that see more men than women are Arts, Entertainment & Recreation (100.0%), Construction (92.9%), and Transportation & Warehousing (87.7%), whereas the industries that tend to have a higher number of women are Information (100.0%), Finance & Insurance (100.0%), and Educational Services (100.0%).
| Industry | Male | Female |
| Agriculture, Fishing & Hunting | 0 (0.0%) | 0 (0.0%) |
| Mining, Quarrying, & Extraction | 0 (0.0%) | 0 (0.0%) |
| Construction | 117 (92.9%) | 9 (7.1%) |
| Manufacturing | 177 (40.4%) | 261 (59.6%) |
| Wholesale Trade | 112 (82.4%) | 24 (17.6%) |
| Retail Trade | 156 (33.3%) | 313 (66.7%) |
| Transportation & Warehousing | 107 (87.7%) | 15 (12.3%) |
| Utilities | 0 (0.0%) | 0 (0.0%) |
| Information | 0 (0.0%) | 34 (100.0%) |
| Finance & Insurance | 0 (0.0%) | 17 (100.0%) |
| Real Estate, Rental & Leasing | 5 (31.2%) | 11 (68.8%) |
| Professional & Scientific | 48 (57.8%) | 35 (42.2%) |
| Enterprise Management | 0 (0.0%) | 0 (0.0%) |
| Administrative & Support | 4 (11.8%) | 30 (88.2%) |
| Educational Services | 0 (0.0%) | 130 (100.0%) |
| Health Care & Social Assistance | 74 (27.4%) | 196 (72.6%) |
| Arts, Entertainment & Recreation | 126 (100.0%) | 0 (0.0%) |
| Accommodation & Food Services | 26 (50.0%) | 26 (50.0%) |
| Public Administration | 129 (69.0%) | 58 (31.0%) |
| Total | 1,202 (50.1%) | 1,198 (49.9%) |
Education in James City
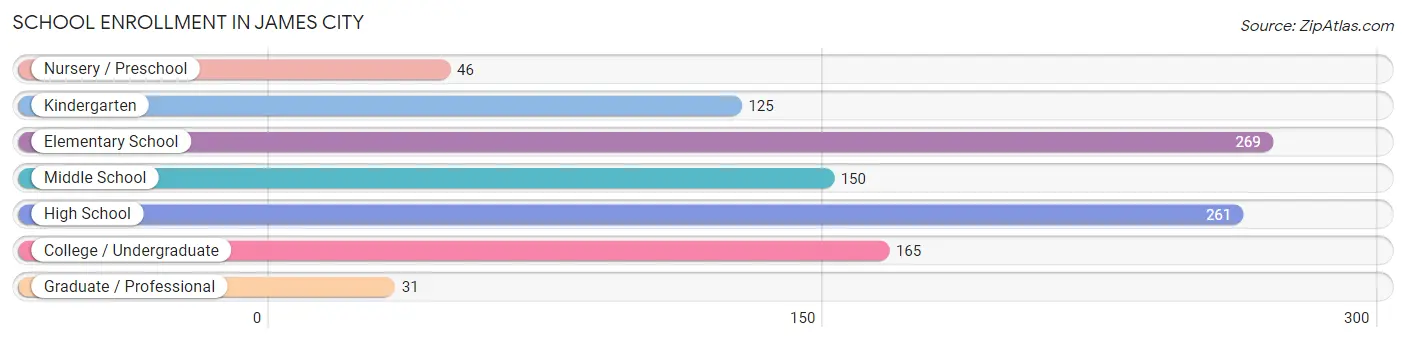
School Enrollment in James City
The most common levels of schooling among the 1,047 students in James City are elementary school (269 | 25.7%), high school (261 | 24.9%), and college / undergraduate (165 | 15.8%).
| School Level | # Students | % Students |
| Nursery / Preschool | 46 | 4.4% |
| Kindergarten | 125 | 11.9% |
| Elementary School | 269 | 25.7% |
| Middle School | 150 | 14.3% |
| High School | 261 | 24.9% |
| College / Undergraduate | 165 | 15.8% |
| Graduate / Professional | 31 | 3.0% |
| Total | 1,047 | 100.0% |
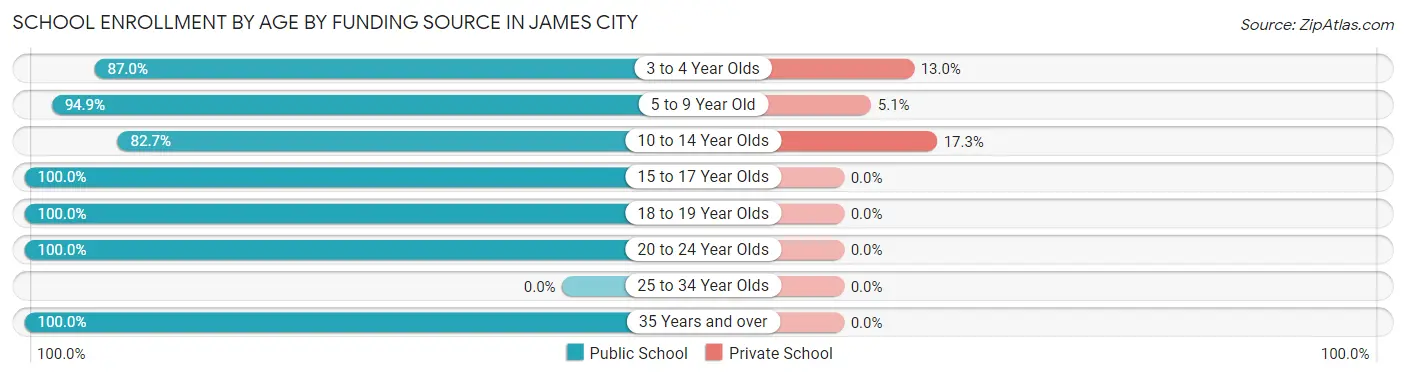
School Enrollment by Age by Funding Source in James City
Out of a total of 1,047 students who are enrolled in schools in James City, 71 (6.8%) attend a private institution, while the remaining 976 (93.2%) are enrolled in public schools. The age group of 10 to 14 year olds has the highest likelihood of being enrolled in private schools, with 52 (17.3% in the age bracket) enrolled. Conversely, the age group of 15 to 17 year olds has the lowest likelihood of being enrolled in a private school, with 226 (100.0% in the age bracket) attending a public institution.
| Age Bracket | Public School | Private School |
| 3 to 4 Year Olds | 40 (87.0%) | 6 (13.0%) |
| 5 to 9 Year Old | 244 (94.9%) | 13 (5.1%) |
| 10 to 14 Year Olds | 248 (82.7%) | 52 (17.3%) |
| 15 to 17 Year Olds | 226 (100.0%) | 0 (0.0%) |
| 18 to 19 Year Olds | 77 (100.0%) | 0 (0.0%) |
| 20 to 24 Year Olds | 58 (100.0%) | 0 (0.0%) |
| 25 to 34 Year Olds | 0 (0.0%) | 0 (0.0%) |
| 35 Years and over | 83 (100.0%) | 0 (0.0%) |
| Total | 976 (93.2%) | 71 (6.8%) |
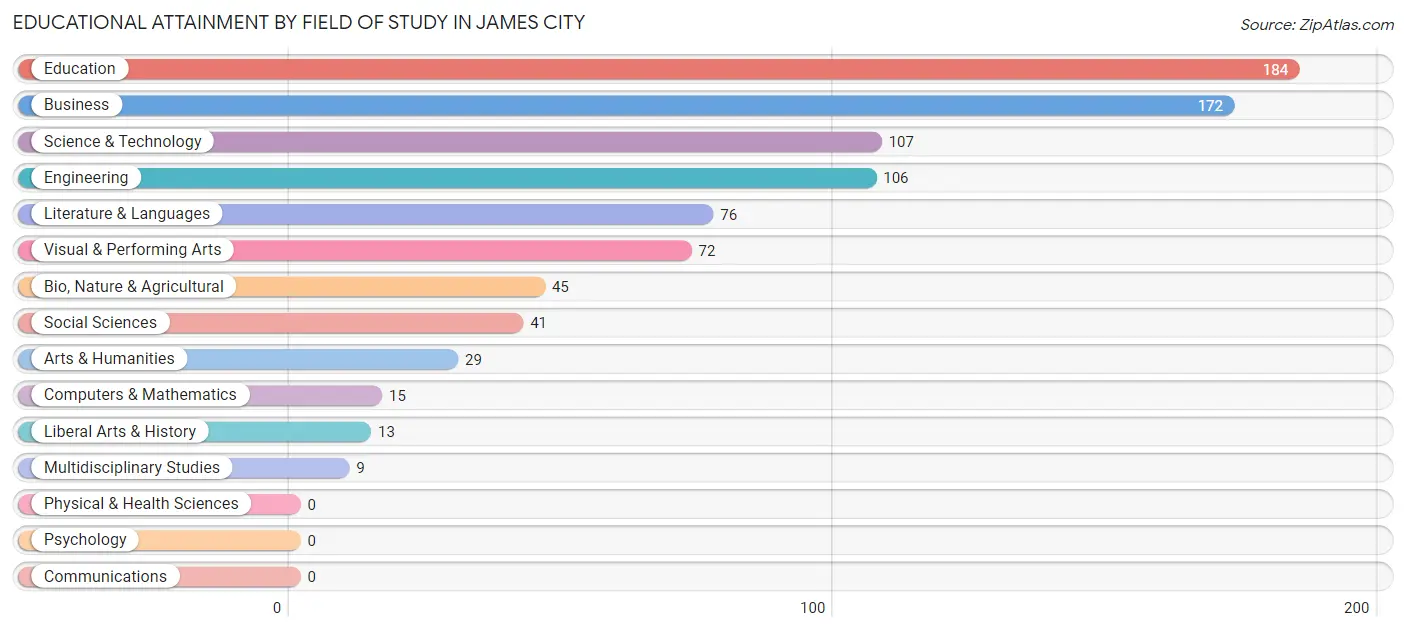
Educational Attainment by Field of Study in James City
Education (184 | 21.2%), business (172 | 19.8%), science & technology (107 | 12.3%), engineering (106 | 12.2%), and literature & languages (76 | 8.7%) are the most common fields of study among 869 individuals in James City who have obtained a bachelor's degree or higher.
| Field of Study | # Graduates | % Graduates |
| Computers & Mathematics | 15 | 1.7% |
| Bio, Nature & Agricultural | 45 | 5.2% |
| Physical & Health Sciences | 0 | 0.0% |
| Psychology | 0 | 0.0% |
| Social Sciences | 41 | 4.7% |
| Engineering | 106 | 12.2% |
| Multidisciplinary Studies | 9 | 1.0% |
| Science & Technology | 107 | 12.3% |
| Business | 172 | 19.8% |
| Education | 184 | 21.2% |
| Literature & Languages | 76 | 8.7% |
| Liberal Arts & History | 13 | 1.5% |
| Visual & Performing Arts | 72 | 8.3% |
| Communications | 0 | 0.0% |
| Arts & Humanities | 29 | 3.3% |
| Total | 869 | 100.0% |
Transportation & Commute in James City
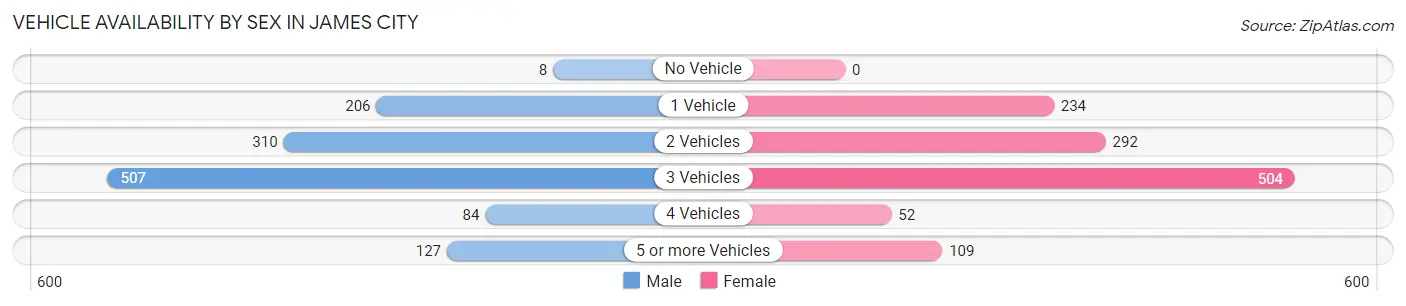
Vehicle Availability by Sex in James City
The most prevalent vehicle ownership categories in James City are males with 3 vehicles (507, accounting for 40.8%) and females with 3 vehicles (504, making up 42.6%).
| Vehicles Available | Male | Female |
| No Vehicle | 8 (0.6%) | 0 (0.0%) |
| 1 Vehicle | 206 (16.6%) | 234 (19.7%) |
| 2 Vehicles | 310 (25.0%) | 292 (24.5%) |
| 3 Vehicles | 507 (40.8%) | 504 (42.3%) |
| 4 Vehicles | 84 (6.8%) | 52 (4.4%) |
| 5 or more Vehicles | 127 (10.2%) | 109 (9.1%) |
| Total | 1,242 (100.0%) | 1,191 (100.0%) |
Commute Time in James City
The most frequently occuring commute durations in James City are 10 to 14 minutes (593 commuters, 26.1%), 15 to 19 minutes (533 commuters, 23.4%), and 20 to 24 minutes (414 commuters, 18.2%).
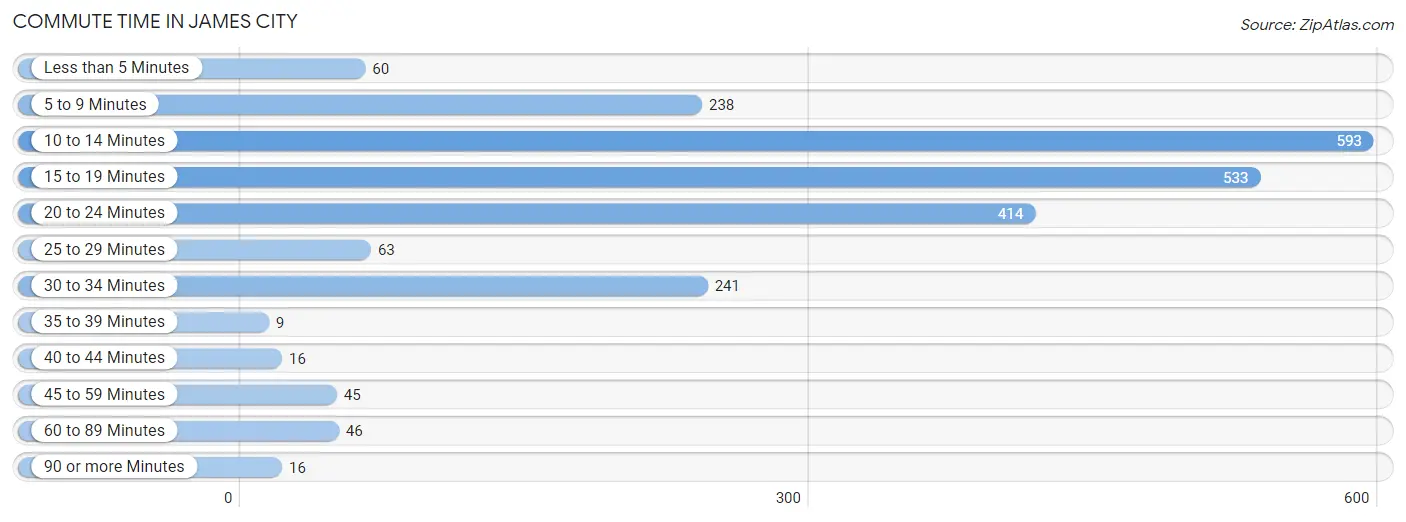
| Commute Time | # Commuters | % Commuters |
| Less than 5 Minutes | 60 | 2.6% |
| 5 to 9 Minutes | 238 | 10.5% |
| 10 to 14 Minutes | 593 | 26.1% |
| 15 to 19 Minutes | 533 | 23.4% |
| 20 to 24 Minutes | 414 | 18.2% |
| 25 to 29 Minutes | 63 | 2.8% |
| 30 to 34 Minutes | 241 | 10.6% |
| 35 to 39 Minutes | 9 | 0.4% |
| 40 to 44 Minutes | 16 | 0.7% |
| 45 to 59 Minutes | 45 | 2.0% |
| 60 to 89 Minutes | 46 | 2.0% |
| 90 or more Minutes | 16 | 0.7% |
Commute Time by Sex in James City
The most common commute times in James City are 10 to 14 minutes (370 commuters, 32.5%) for males and 20 to 24 minutes (257 commuters, 22.6%) for females.
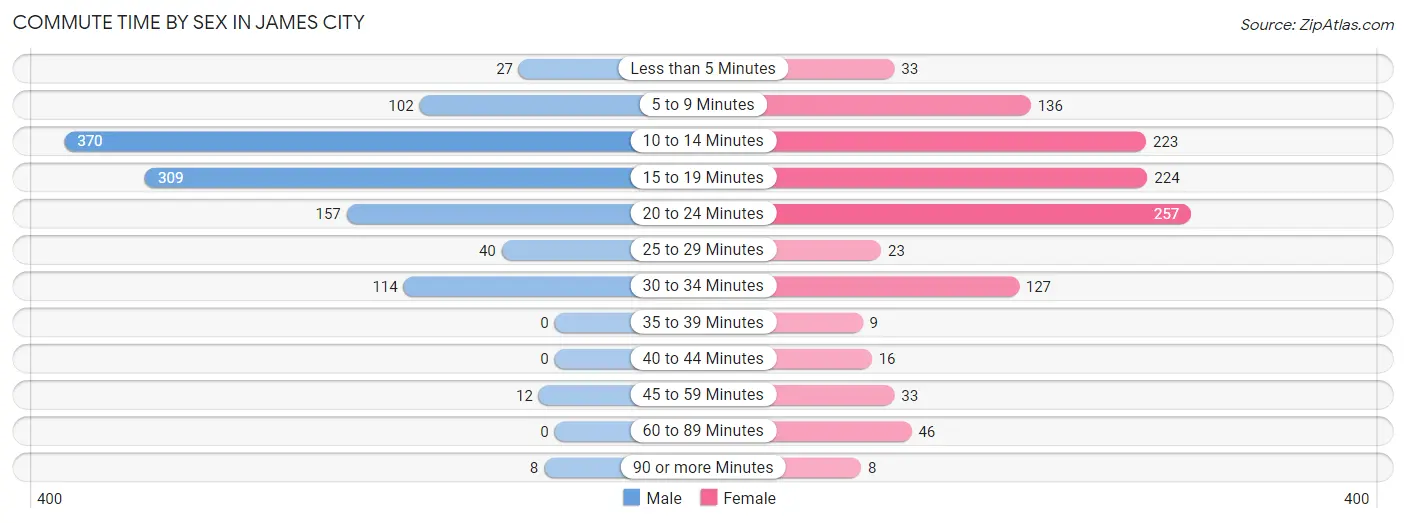
| Commute Time | Male | Female |
| Less than 5 Minutes | 27 (2.4%) | 33 (2.9%) |
| 5 to 9 Minutes | 102 (9.0%) | 136 (12.0%) |
| 10 to 14 Minutes | 370 (32.5%) | 223 (19.7%) |
| 15 to 19 Minutes | 309 (27.1%) | 224 (19.7%) |
| 20 to 24 Minutes | 157 (13.8%) | 257 (22.6%) |
| 25 to 29 Minutes | 40 (3.5%) | 23 (2.0%) |
| 30 to 34 Minutes | 114 (10.0%) | 127 (11.2%) |
| 35 to 39 Minutes | 0 (0.0%) | 9 (0.8%) |
| 40 to 44 Minutes | 0 (0.0%) | 16 (1.4%) |
| 45 to 59 Minutes | 12 (1.1%) | 33 (2.9%) |
| 60 to 89 Minutes | 0 (0.0%) | 46 (4.1%) |
| 90 or more Minutes | 8 (0.7%) | 8 (0.7%) |
Time of Departure to Work by Sex in James City
The most frequent times of departure to work in James City are 7:00 AM to 7:29 AM (225, 19.8%) for males and 6:30 AM to 6:59 AM (264, 23.3%) for females.
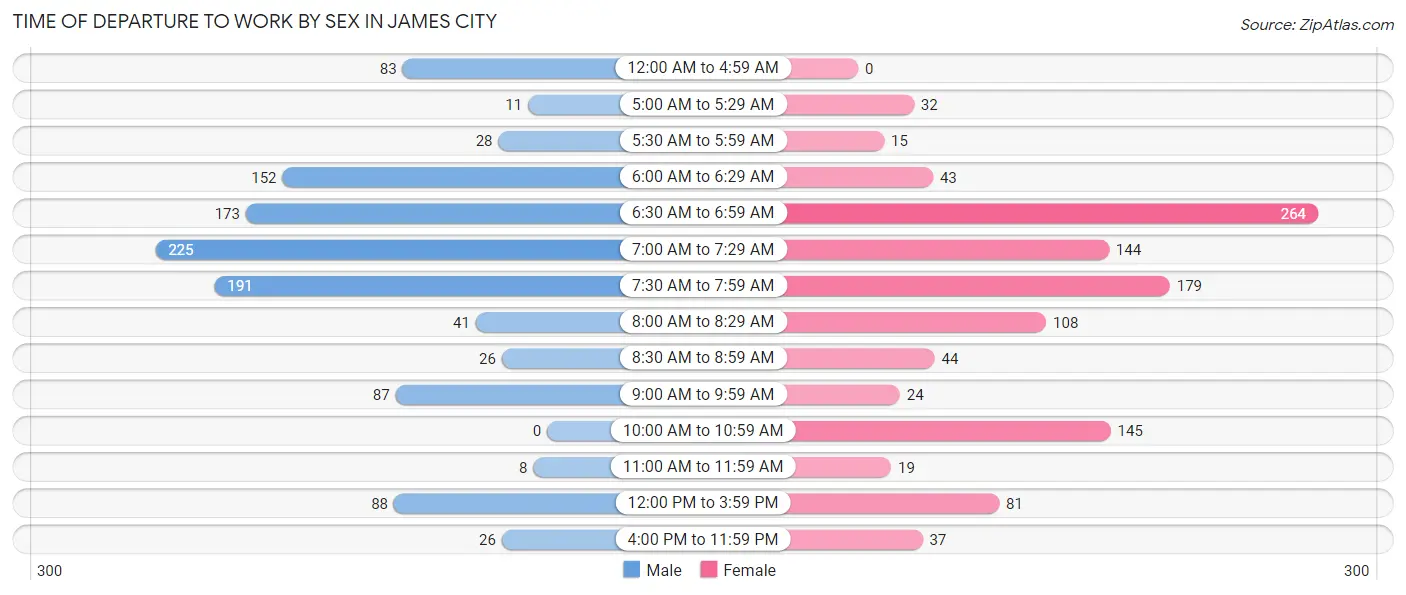
| Time of Departure | Male | Female |
| 12:00 AM to 4:59 AM | 83 (7.3%) | 0 (0.0%) |
| 5:00 AM to 5:29 AM | 11 (1.0%) | 32 (2.8%) |
| 5:30 AM to 5:59 AM | 28 (2.5%) | 15 (1.3%) |
| 6:00 AM to 6:29 AM | 152 (13.4%) | 43 (3.8%) |
| 6:30 AM to 6:59 AM | 173 (15.2%) | 264 (23.3%) |
| 7:00 AM to 7:29 AM | 225 (19.8%) | 144 (12.7%) |
| 7:30 AM to 7:59 AM | 191 (16.8%) | 179 (15.8%) |
| 8:00 AM to 8:29 AM | 41 (3.6%) | 108 (9.5%) |
| 8:30 AM to 8:59 AM | 26 (2.3%) | 44 (3.9%) |
| 9:00 AM to 9:59 AM | 87 (7.6%) | 24 (2.1%) |
| 10:00 AM to 10:59 AM | 0 (0.0%) | 145 (12.8%) |
| 11:00 AM to 11:59 AM | 8 (0.7%) | 19 (1.7%) |
| 12:00 PM to 3:59 PM | 88 (7.7%) | 81 (7.1%) |
| 4:00 PM to 11:59 PM | 26 (2.3%) | 37 (3.3%) |
| Total | 1,139 (100.0%) | 1,135 (100.0%) |
Housing Occupancy in James City
Occupancy by Ownership in James City
Of the total 2,027 dwellings in James City, owner-occupied units account for 1,534 (75.7%), while renter-occupied units make up 493 (24.3%).
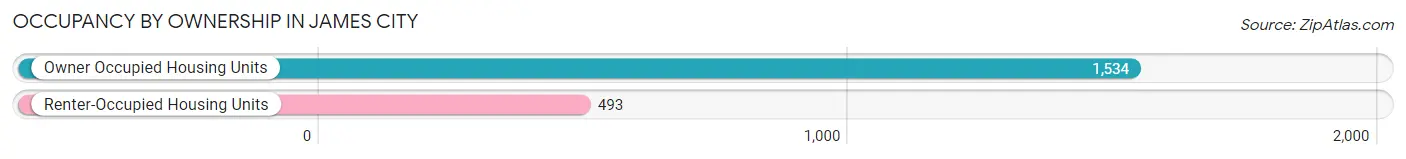
| Occupancy | # Housing Units | % Housing Units |
| Owner Occupied Housing Units | 1,534 | 75.7% |
| Renter-Occupied Housing Units | 493 | 24.3% |
| Total Occupied Housing Units | 2,027 | 100.0% |
Occupancy by Household Size in James City
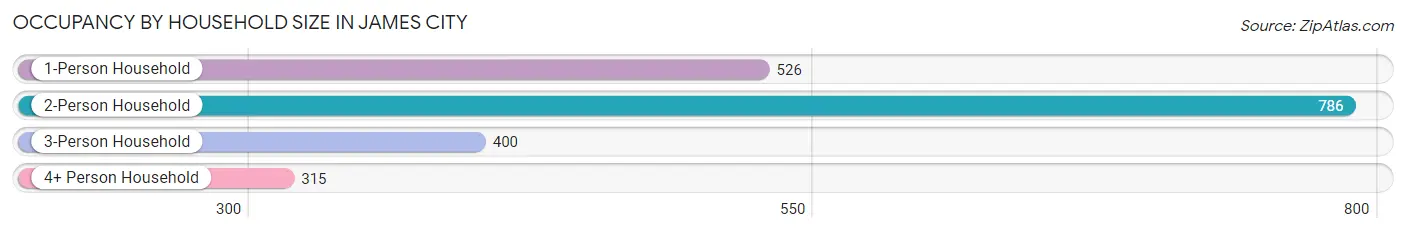
| Household Size | # Housing Units | % Housing Units |
| 1-Person Household | 526 | 26.0% |
| 2-Person Household | 786 | 38.8% |
| 3-Person Household | 400 | 19.7% |
| 4+ Person Household | 315 | 15.5% |
| Total Housing Units | 2,027 | 100.0% |
Occupancy by Ownership by Household Size in James City
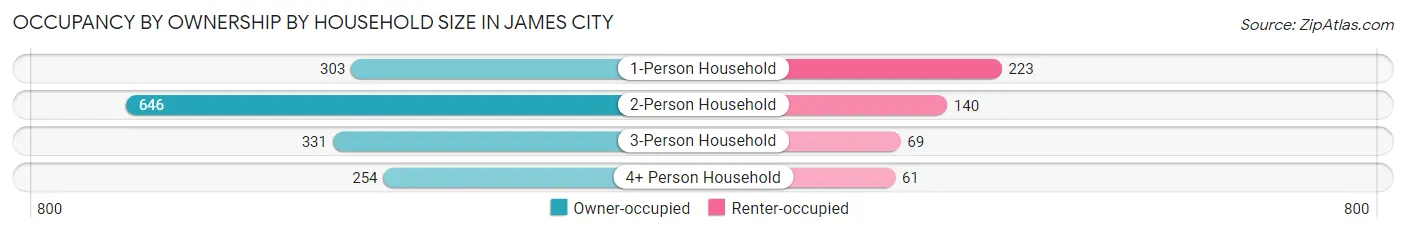
| Household Size | Owner-occupied | Renter-occupied |
| 1-Person Household | 303 (57.6%) | 223 (42.4%) |
| 2-Person Household | 646 (82.2%) | 140 (17.8%) |
| 3-Person Household | 331 (82.8%) | 69 (17.2%) |
| 4+ Person Household | 254 (80.6%) | 61 (19.4%) |
| Total Housing Units | 1,534 (75.7%) | 493 (24.3%) |
Occupancy by Educational Attainment in James City
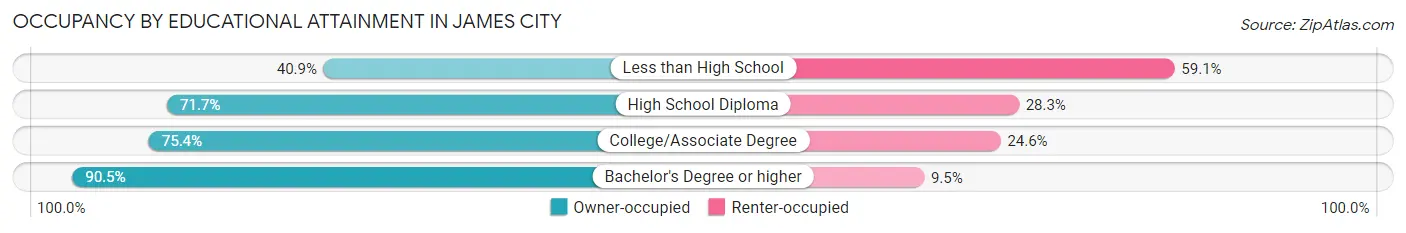
| Household Size | Owner-occupied | Renter-occupied |
| Less than High School | 47 (40.9%) | 68 (59.1%) |
| High School Diploma | 325 (71.7%) | 128 (28.3%) |
| College/Associate Degree | 789 (75.4%) | 258 (24.6%) |
| Bachelor's Degree or higher | 373 (90.5%) | 39 (9.5%) |
Occupancy by Age of Householder in James City
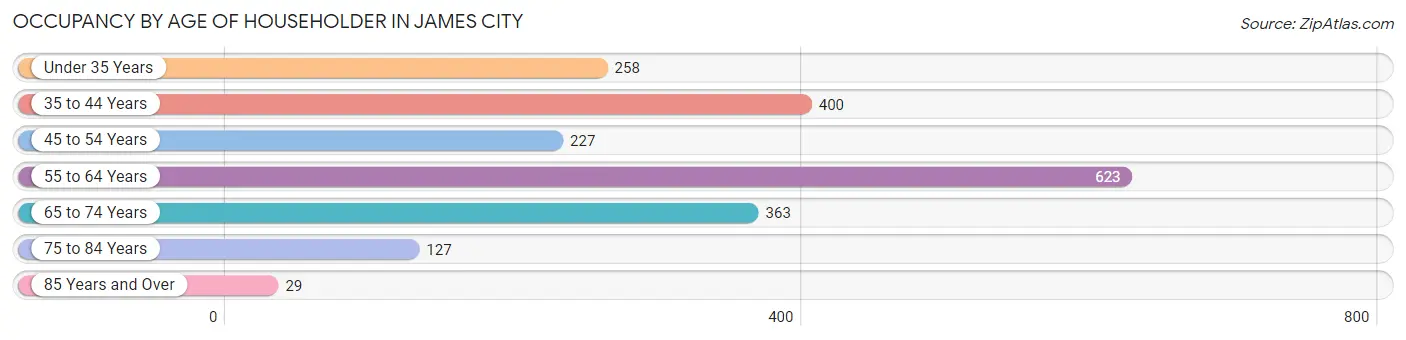
| Age Bracket | # Households | % Households |
| Under 35 Years | 258 | 12.7% |
| 35 to 44 Years | 400 | 19.7% |
| 45 to 54 Years | 227 | 11.2% |
| 55 to 64 Years | 623 | 30.7% |
| 65 to 74 Years | 363 | 17.9% |
| 75 to 84 Years | 127 | 6.3% |
| 85 Years and Over | 29 | 1.4% |
| Total | 2,027 | 100.0% |
Housing Finances in James City
Median Income by Occupancy in James City
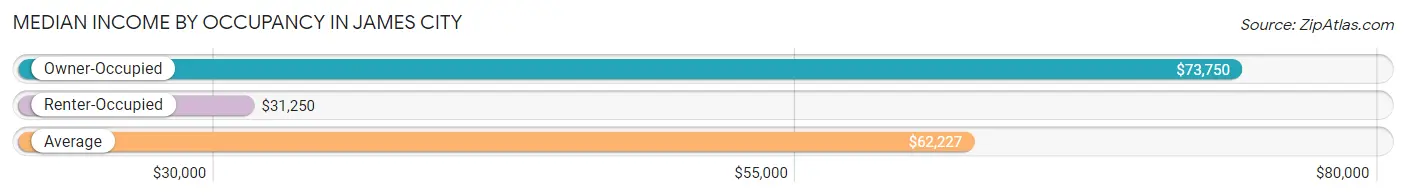
| Occupancy Type | # Households | Median Income |
| Owner-Occupied | 1,534 (75.7%) | $73,750 |
| Renter-Occupied | 493 (24.3%) | $31,250 |
| Average | 2,027 (100.0%) | $62,227 |
Occupancy by Householder Income Bracket in James City
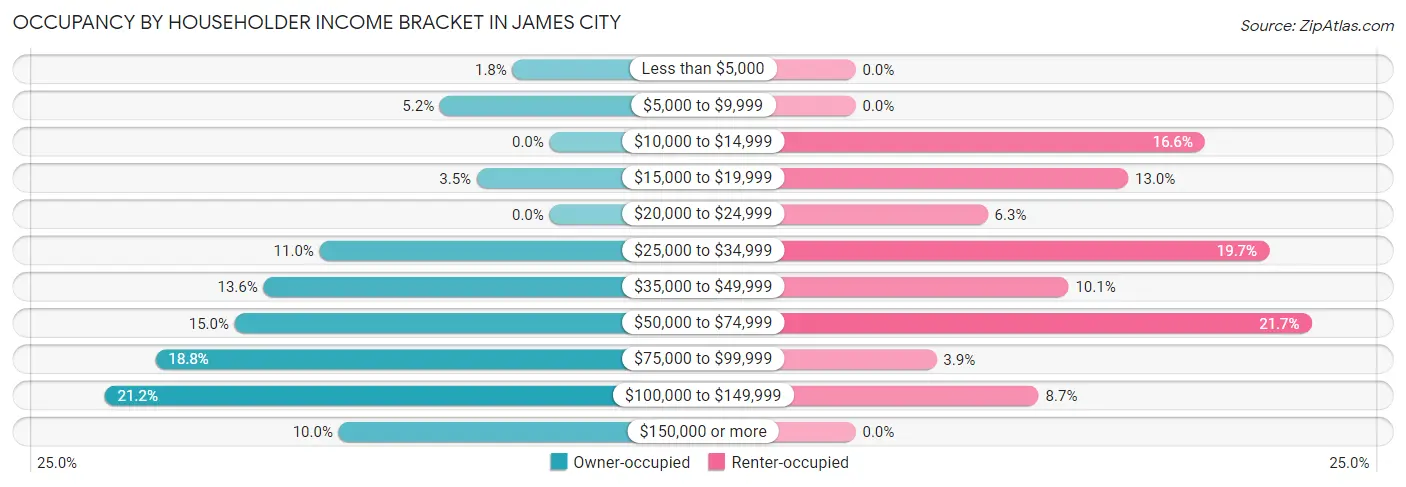
| Income Bracket | Owner-occupied | Renter-occupied |
| Less than $5,000 | 27 (1.8%) | 0 (0.0%) |
| $5,000 to $9,999 | 80 (5.2%) | 0 (0.0%) |
| $10,000 to $14,999 | 0 (0.0%) | 82 (16.6%) |
| $15,000 to $19,999 | 53 (3.5%) | 64 (13.0%) |
| $20,000 to $24,999 | 0 (0.0%) | 31 (6.3%) |
| $25,000 to $34,999 | 168 (11.0%) | 97 (19.7%) |
| $35,000 to $49,999 | 209 (13.6%) | 50 (10.1%) |
| $50,000 to $74,999 | 230 (15.0%) | 107 (21.7%) |
| $75,000 to $99,999 | 288 (18.8%) | 19 (3.8%) |
| $100,000 to $149,999 | 325 (21.2%) | 43 (8.7%) |
| $150,000 or more | 154 (10.0%) | 0 (0.0%) |
| Total | 1,534 (100.0%) | 493 (100.0%) |
Monthly Housing Cost Tiers in James City
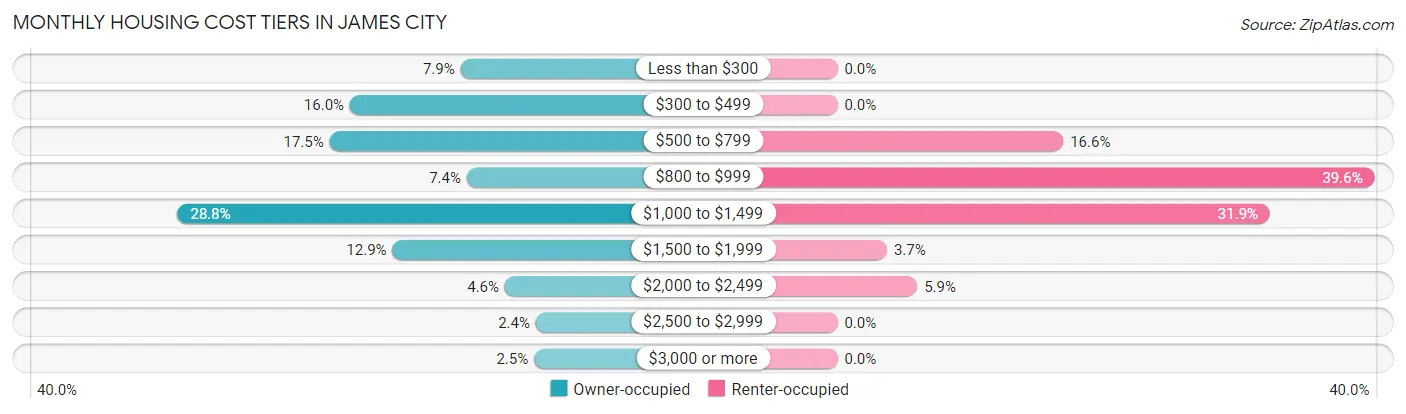
| Monthly Cost | Owner-occupied | Renter-occupied |
| Less than $300 | 121 (7.9%) | 0 (0.0%) |
| $300 to $499 | 246 (16.0%) | 0 (0.0%) |
| $500 to $799 | 269 (17.5%) | 82 (16.6%) |
| $800 to $999 | 114 (7.4%) | 195 (39.6%) |
| $1,000 to $1,499 | 441 (28.7%) | 157 (31.9%) |
| $1,500 to $1,999 | 198 (12.9%) | 18 (3.6%) |
| $2,000 to $2,499 | 71 (4.6%) | 29 (5.9%) |
| $2,500 to $2,999 | 36 (2.4%) | 0 (0.0%) |
| $3,000 or more | 38 (2.5%) | 0 (0.0%) |
| Total | 1,534 (100.0%) | 493 (100.0%) |
Physical Housing Characteristics in James City
Housing Structures in James City
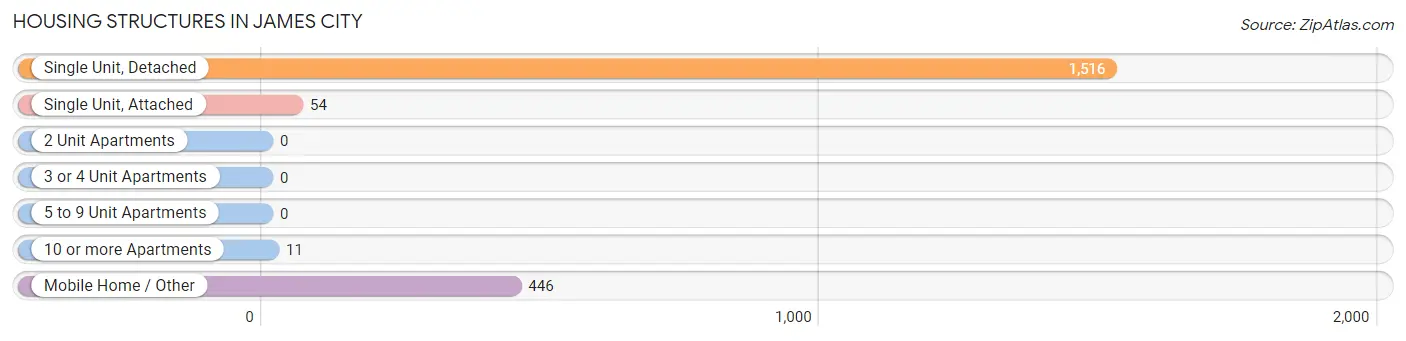
| Structure Type | # Housing Units | % Housing Units |
| Single Unit, Detached | 1,516 | 74.8% |
| Single Unit, Attached | 54 | 2.7% |
| 2 Unit Apartments | 0 | 0.0% |
| 3 or 4 Unit Apartments | 0 | 0.0% |
| 5 to 9 Unit Apartments | 0 | 0.0% |
| 10 or more Apartments | 11 | 0.5% |
| Mobile Home / Other | 446 | 22.0% |
| Total | 2,027 | 100.0% |
Housing Structures by Occupancy in James City
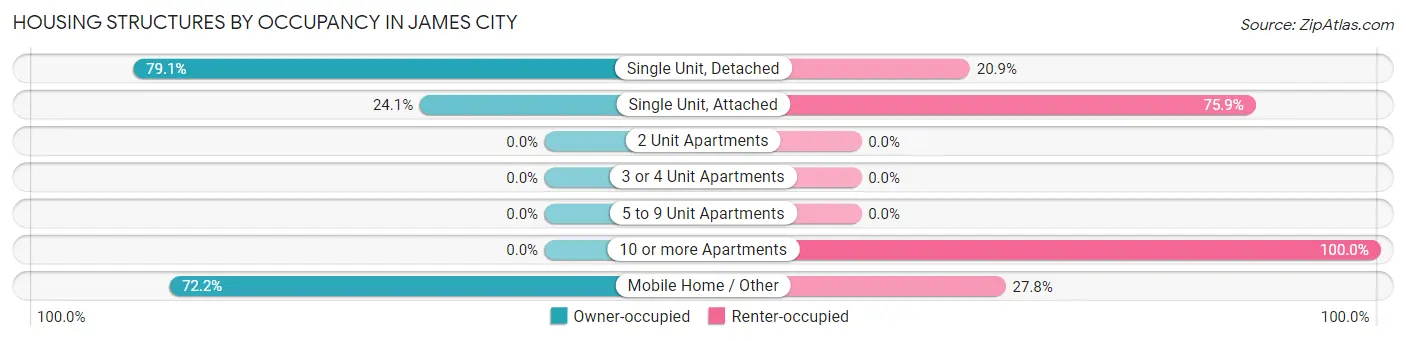
| Structure Type | Owner-occupied | Renter-occupied |
| Single Unit, Detached | 1,199 (79.1%) | 317 (20.9%) |
| Single Unit, Attached | 13 (24.1%) | 41 (75.9%) |
| 2 Unit Apartments | 0 (0.0%) | 0 (0.0%) |
| 3 or 4 Unit Apartments | 0 (0.0%) | 0 (0.0%) |
| 5 to 9 Unit Apartments | 0 (0.0%) | 0 (0.0%) |
| 10 or more Apartments | 0 (0.0%) | 11 (100.0%) |
| Mobile Home / Other | 322 (72.2%) | 124 (27.8%) |
| Total | 1,534 (75.7%) | 493 (24.3%) |
Housing Structures by Number of Rooms in James City
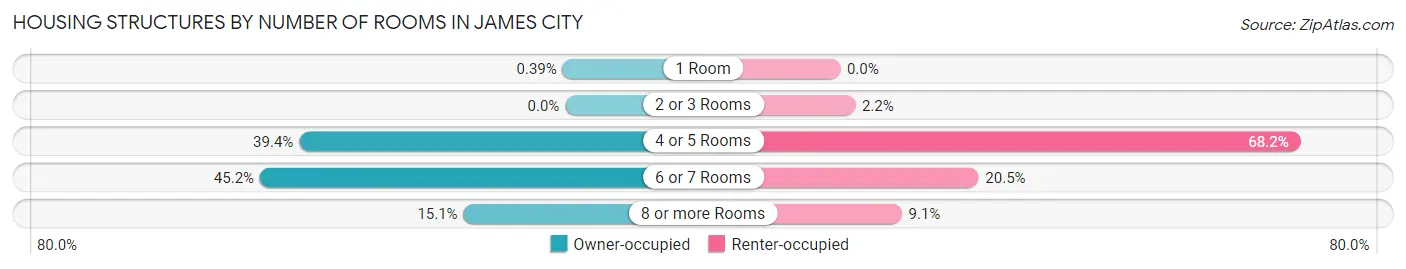
| Number of Rooms | Owner-occupied | Renter-occupied |
| 1 Room | 6 (0.4%) | 0 (0.0%) |
| 2 or 3 Rooms | 0 (0.0%) | 11 (2.2%) |
| 4 or 5 Rooms | 604 (39.4%) | 336 (68.1%) |
| 6 or 7 Rooms | 693 (45.2%) | 101 (20.5%) |
| 8 or more Rooms | 231 (15.1%) | 45 (9.1%) |
| Total | 1,534 (100.0%) | 493 (100.0%) |
Housing Structure by Heating Type in James City
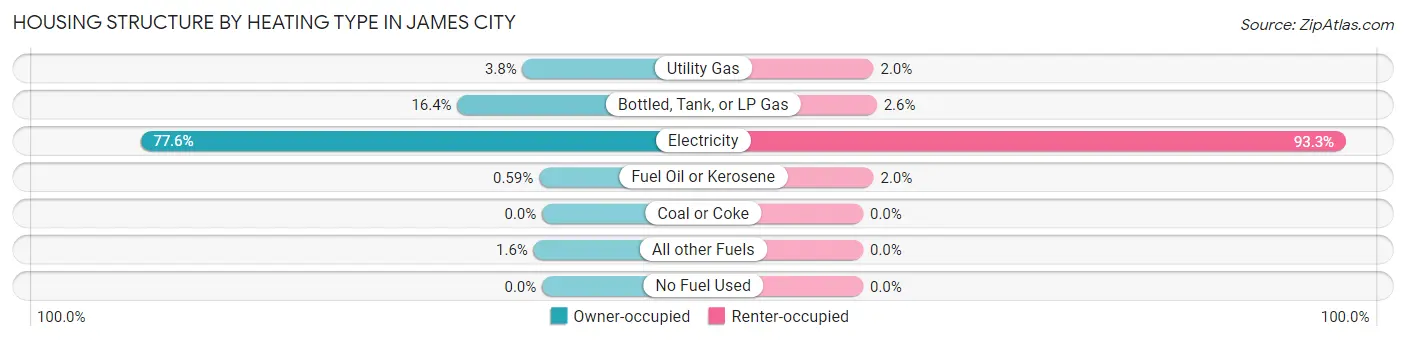
| Heating Type | Owner-occupied | Renter-occupied |
| Utility Gas | 58 (3.8%) | 10 (2.0%) |
| Bottled, Tank, or LP Gas | 251 (16.4%) | 13 (2.6%) |
| Electricity | 1,191 (77.6%) | 460 (93.3%) |
| Fuel Oil or Kerosene | 9 (0.6%) | 10 (2.0%) |
| Coal or Coke | 0 (0.0%) | 0 (0.0%) |
| All other Fuels | 25 (1.6%) | 0 (0.0%) |
| No Fuel Used | 0 (0.0%) | 0 (0.0%) |
| Total | 1,534 (100.0%) | 493 (100.0%) |
Household Vehicle Usage in James City
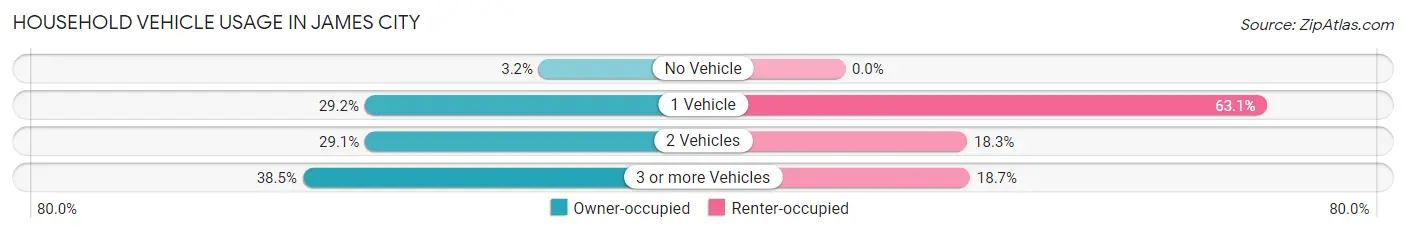
| Vehicles per Household | Owner-occupied | Renter-occupied |
| No Vehicle | 49 (3.2%) | 0 (0.0%) |
| 1 Vehicle | 448 (29.2%) | 311 (63.1%) |
| 2 Vehicles | 447 (29.1%) | 90 (18.3%) |
| 3 or more Vehicles | 590 (38.5%) | 92 (18.7%) |
| Total | 1,534 (100.0%) | 493 (100.0%) |
Real Estate & Mortgages in James City
Real Estate and Mortgage Overview in James City
| Characteristic | Without Mortgage | With Mortgage |
| Housing Units | 546 | 988 |
| Median Property Value | $116,400 | $158,000 |
| Median Household Income | $45,417 | $110 |
| Monthly Housing Costs | $444 | $38 |
| Real Estate Taxes | $705 | $0 |
Property Value by Mortgage Status in James City
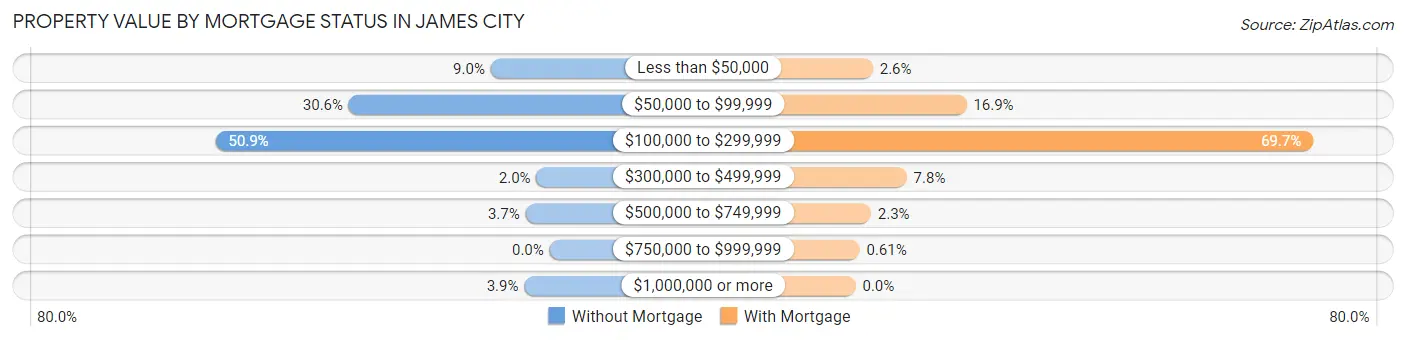
| Property Value | Without Mortgage | With Mortgage |
| Less than $50,000 | 49 (9.0%) | 26 (2.6%) |
| $50,000 to $99,999 | 167 (30.6%) | 167 (16.9%) |
| $100,000 to $299,999 | 278 (50.9%) | 689 (69.7%) |
| $300,000 to $499,999 | 11 (2.0%) | 77 (7.8%) |
| $500,000 to $749,999 | 20 (3.7%) | 23 (2.3%) |
| $750,000 to $999,999 | 0 (0.0%) | 6 (0.6%) |
| $1,000,000 or more | 21 (3.8%) | 0 (0.0%) |
| Total | 546 (100.0%) | 988 (100.0%) |
Household Income by Mortgage Status in James City
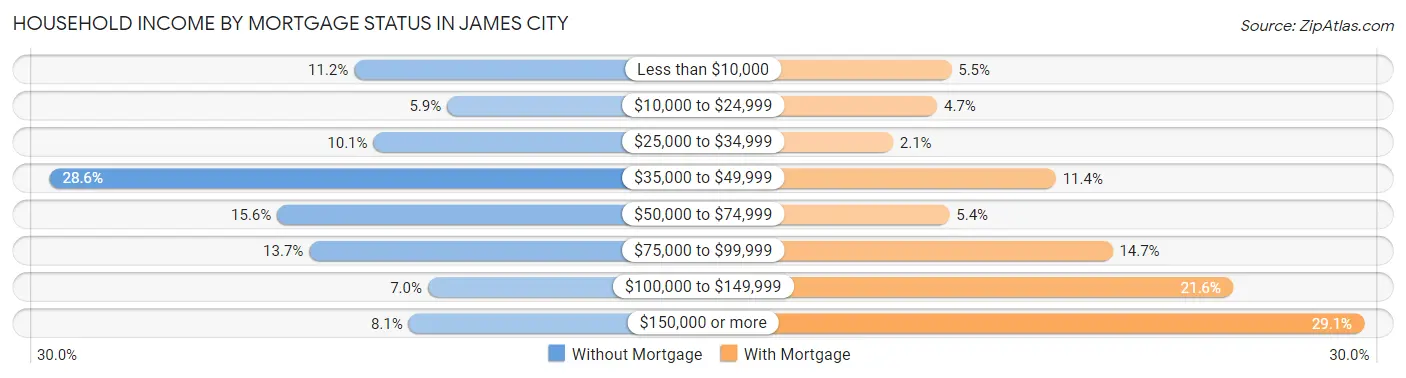
| Household Income | Without Mortgage | With Mortgage |
| Less than $10,000 | 61 (11.2%) | 54 (5.5%) |
| $10,000 to $24,999 | 32 (5.9%) | 46 (4.7%) |
| $25,000 to $34,999 | 55 (10.1%) | 21 (2.1%) |
| $35,000 to $49,999 | 156 (28.6%) | 113 (11.4%) |
| $50,000 to $74,999 | 85 (15.6%) | 53 (5.4%) |
| $75,000 to $99,999 | 75 (13.7%) | 145 (14.7%) |
| $100,000 to $149,999 | 38 (7.0%) | 213 (21.6%) |
| $150,000 or more | 44 (8.1%) | 287 (29.0%) |
| Total | 546 (100.0%) | 988 (100.0%) |
Property Value to Household Income Ratio in James City
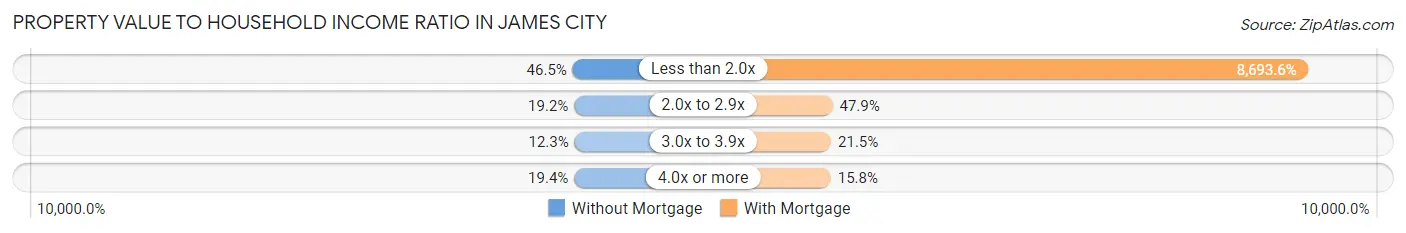
| Value-to-Income Ratio | Without Mortgage | With Mortgage |
| Less than 2.0x | 254 (46.5%) | 85,893 (8,693.6%) |
| 2.0x to 2.9x | 105 (19.2%) | 473 (47.9%) |
| 3.0x to 3.9x | 67 (12.3%) | 212 (21.5%) |
| 4.0x or more | 106 (19.4%) | 156 (15.8%) |
| Total | 546 (100.0%) | 988 (100.0%) |
Real Estate Taxes by Mortgage Status in James City
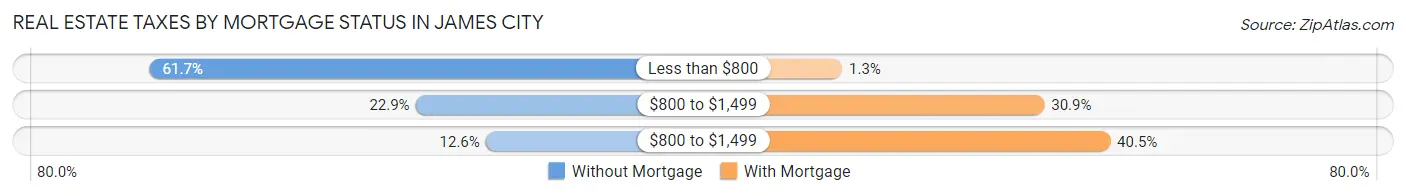
| Property Taxes | Without Mortgage | With Mortgage |
| Less than $800 | 337 (61.7%) | 13 (1.3%) |
| $800 to $1,499 | 125 (22.9%) | 305 (30.9%) |
| $800 to $1,499 | 69 (12.6%) | 400 (40.5%) |
| Total | 546 (100.0%) | 988 (100.0%) |
Health & Disability in James City
Health Insurance Coverage by Age in James City
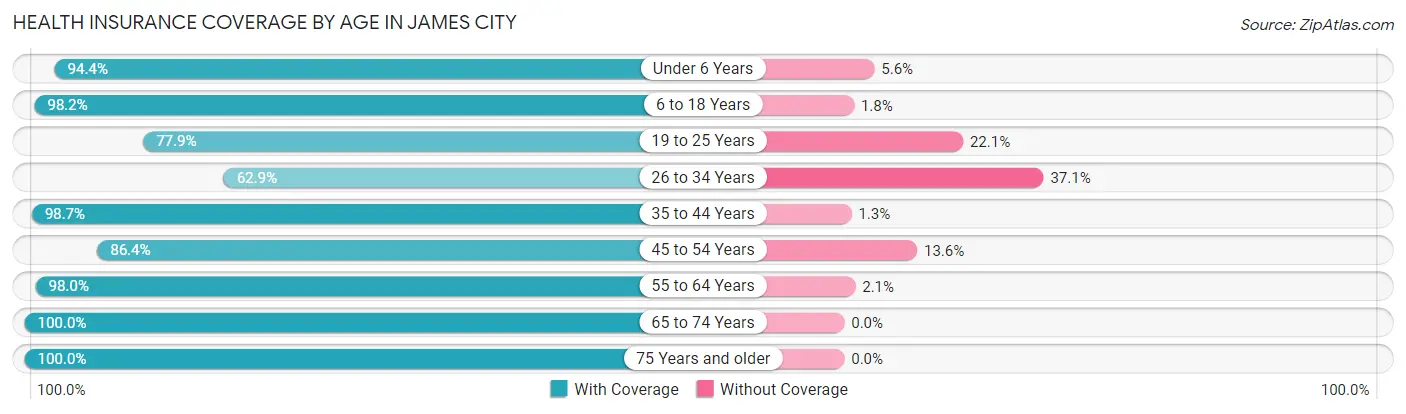
| Age Bracket | With Coverage | Without Coverage |
| Under 6 Years | 219 (94.4%) | 13 (5.6%) |
| 6 to 18 Years | 815 (98.2%) | 15 (1.8%) |
| 19 to 25 Years | 359 (77.9%) | 102 (22.1%) |
| 26 to 34 Years | 220 (62.9%) | 130 (37.1%) |
| 35 to 44 Years | 744 (98.7%) | 10 (1.3%) |
| 45 to 54 Years | 529 (86.4%) | 83 (13.6%) |
| 55 to 64 Years | 811 (98.0%) | 17 (2.1%) |
| 65 to 74 Years | 655 (100.0%) | 0 (0.0%) |
| 75 Years and older | 327 (100.0%) | 0 (0.0%) |
| Total | 4,679 (92.7%) | 370 (7.3%) |
Health Insurance Coverage by Citizenship Status in James City
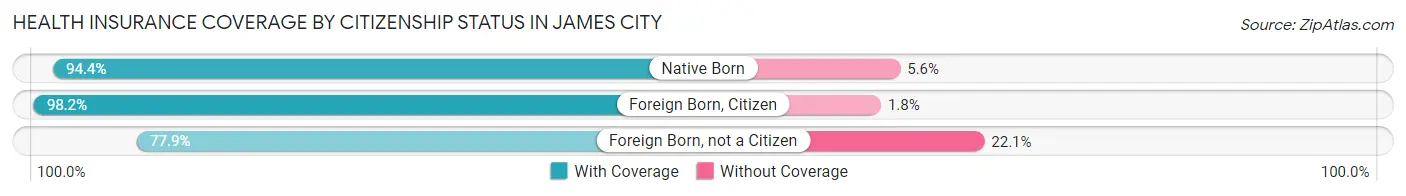
| Citizenship Status | With Coverage | Without Coverage |
| Native Born | 219 (94.4%) | 13 (5.6%) |
| Foreign Born, Citizen | 815 (98.2%) | 15 (1.8%) |
| Foreign Born, not a Citizen | 359 (77.9%) | 102 (22.1%) |
Health Insurance Coverage by Household Income in James City
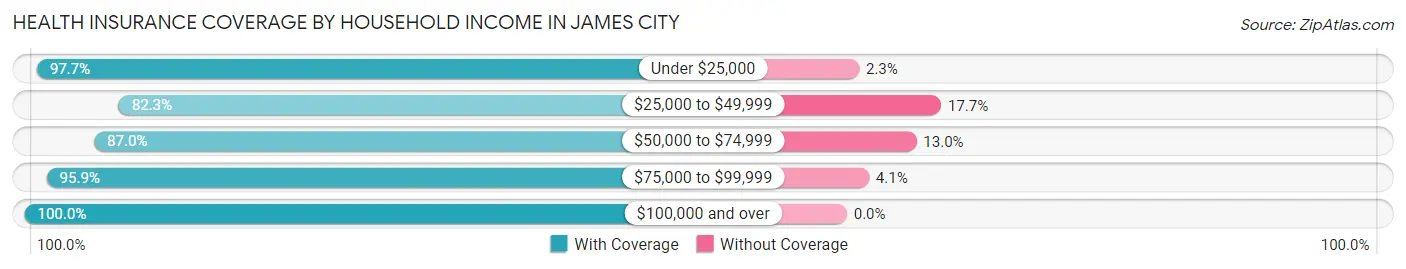
| Household Income | With Coverage | Without Coverage |
| Under $25,000 | 426 (97.7%) | 10 (2.3%) |
| $25,000 to $49,999 | 1,068 (82.3%) | 229 (17.7%) |
| $50,000 to $74,999 | 620 (87.0%) | 93 (13.0%) |
| $75,000 to $99,999 | 879 (95.9%) | 38 (4.1%) |
| $100,000 and over | 1,615 (100.0%) | 0 (0.0%) |
Public vs Private Health Insurance Coverage by Age in James City
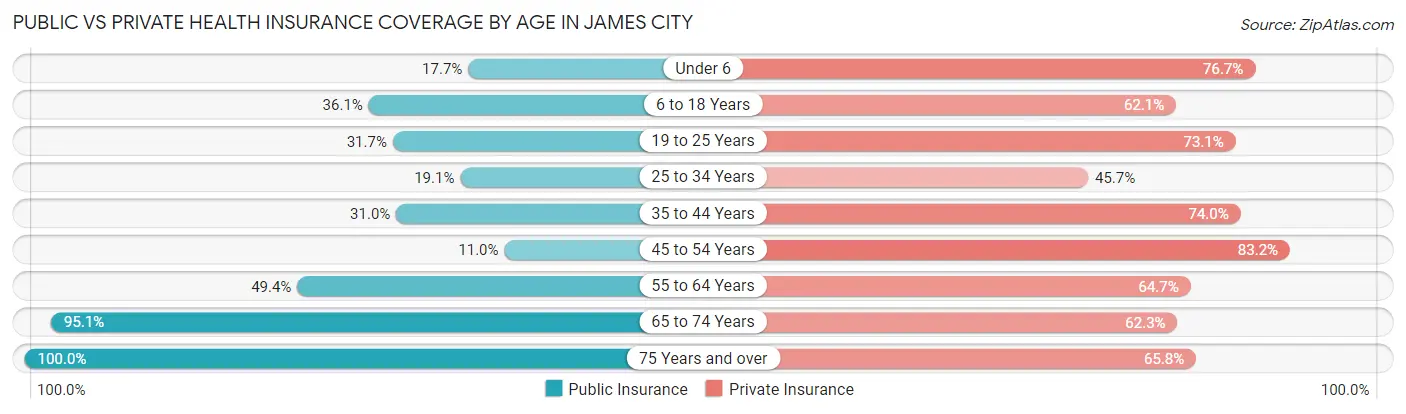
| Age Bracket | Public Insurance | Private Insurance |
| Under 6 | 41 (17.7%) | 178 (76.7%) |
| 6 to 18 Years | 300 (36.1%) | 515 (62.1%) |
| 19 to 25 Years | 146 (31.7%) | 337 (73.1%) |
| 25 to 34 Years | 67 (19.1%) | 160 (45.7%) |
| 35 to 44 Years | 234 (31.0%) | 558 (74.0%) |
| 45 to 54 Years | 67 (11.0%) | 509 (83.2%) |
| 55 to 64 Years | 409 (49.4%) | 536 (64.7%) |
| 65 to 74 Years | 623 (95.1%) | 408 (62.3%) |
| 75 Years and over | 327 (100.0%) | 215 (65.7%) |
| Total | 2,214 (43.9%) | 3,416 (67.7%) |
Disability Status by Sex by Age in James City
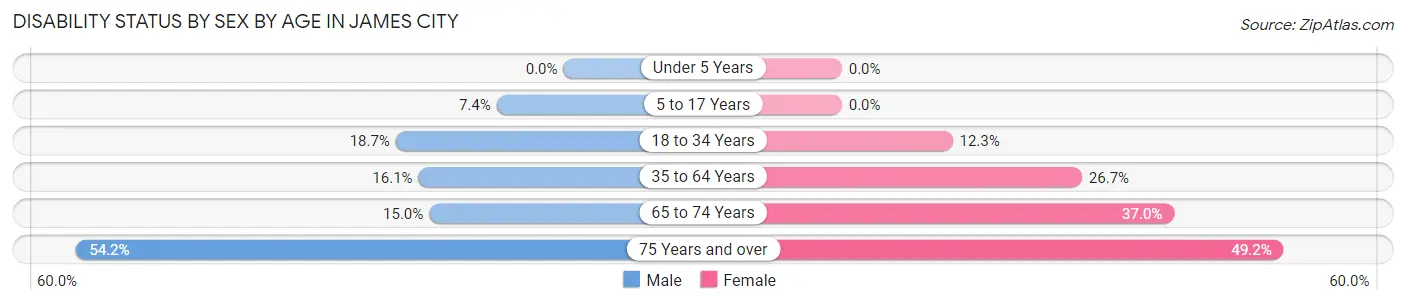
| Age Bracket | Male | Female |
| Under 5 Years | 0 (0.0%) | 0 (0.0%) |
| 5 to 17 Years | 26 (7.4%) | 0 (0.0%) |
| 18 to 34 Years | 73 (18.7%) | 56 (12.3%) |
| 35 to 64 Years | 164 (16.1%) | 315 (26.7%) |
| 65 to 74 Years | 45 (14.9%) | 131 (37.0%) |
| 75 Years and over | 77 (54.2%) | 91 (49.2%) |
Disability Class by Sex by Age in James City
Disability Class: Hearing Difficulty
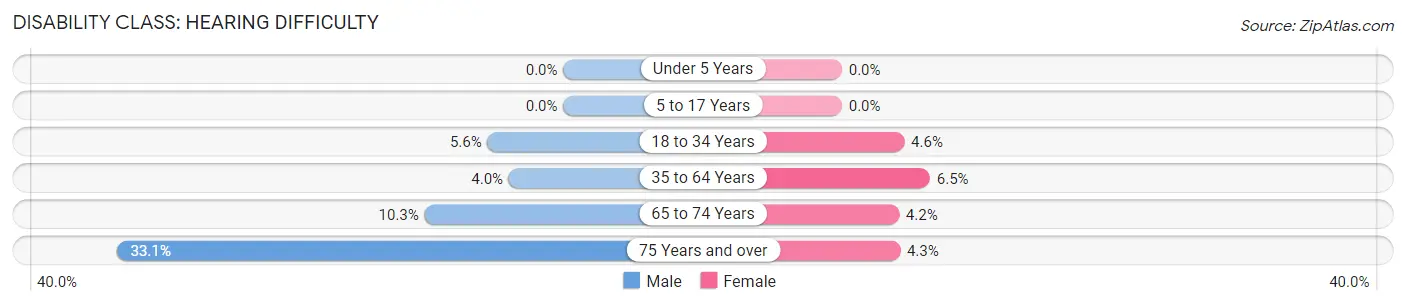
| Age Bracket | Male | Female |
| Under 5 Years | 0 (0.0%) | 0 (0.0%) |
| 5 to 17 Years | 0 (0.0%) | 0 (0.0%) |
| 18 to 34 Years | 22 (5.6%) | 21 (4.6%) |
| 35 to 64 Years | 41 (4.0%) | 77 (6.5%) |
| 65 to 74 Years | 31 (10.3%) | 15 (4.2%) |
| 75 Years and over | 47 (33.1%) | 8 (4.3%) |
Disability Class: Vision Difficulty
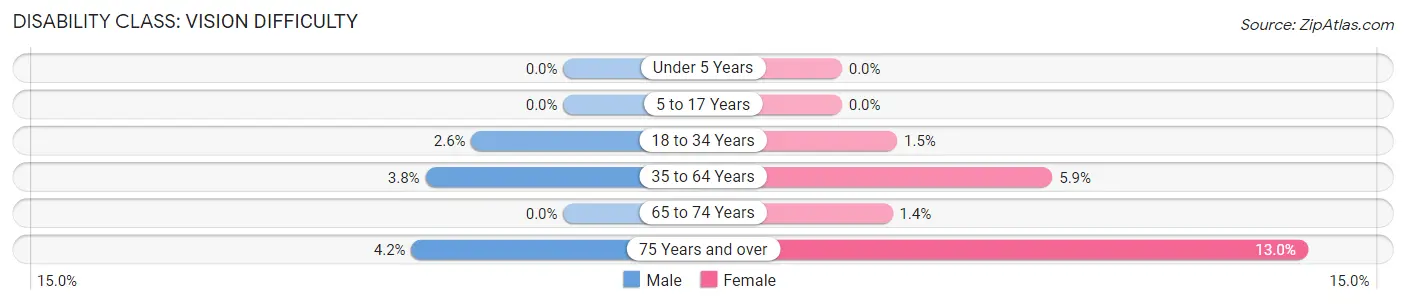
| Age Bracket | Male | Female |
| Under 5 Years | 0 (0.0%) | 0 (0.0%) |
| 5 to 17 Years | 0 (0.0%) | 0 (0.0%) |
| 18 to 34 Years | 10 (2.6%) | 7 (1.5%) |
| 35 to 64 Years | 39 (3.8%) | 69 (5.9%) |
| 65 to 74 Years | 0 (0.0%) | 5 (1.4%) |
| 75 Years and over | 6 (4.2%) | 24 (13.0%) |
Disability Class: Cognitive Difficulty
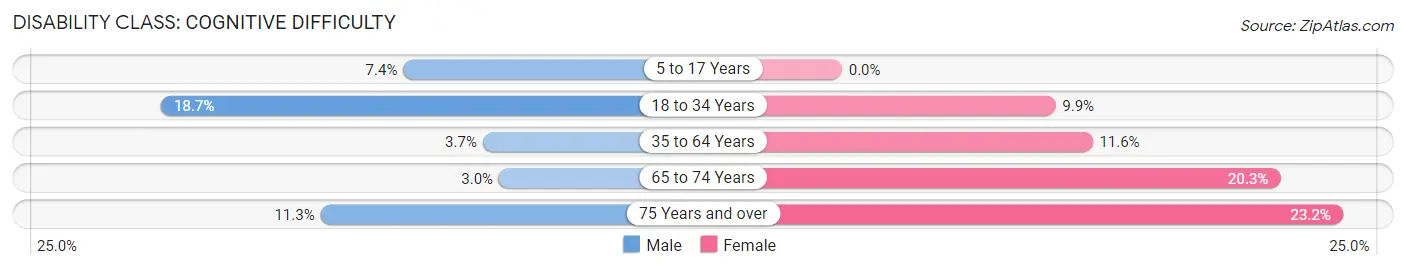
| Age Bracket | Male | Female |
| 5 to 17 Years | 26 (7.4%) | 0 (0.0%) |
| 18 to 34 Years | 73 (18.7%) | 45 (9.9%) |
| 35 to 64 Years | 38 (3.7%) | 137 (11.6%) |
| 65 to 74 Years | 9 (3.0%) | 72 (20.3%) |
| 75 Years and over | 16 (11.3%) | 43 (23.2%) |
Disability Class: Ambulatory Difficulty
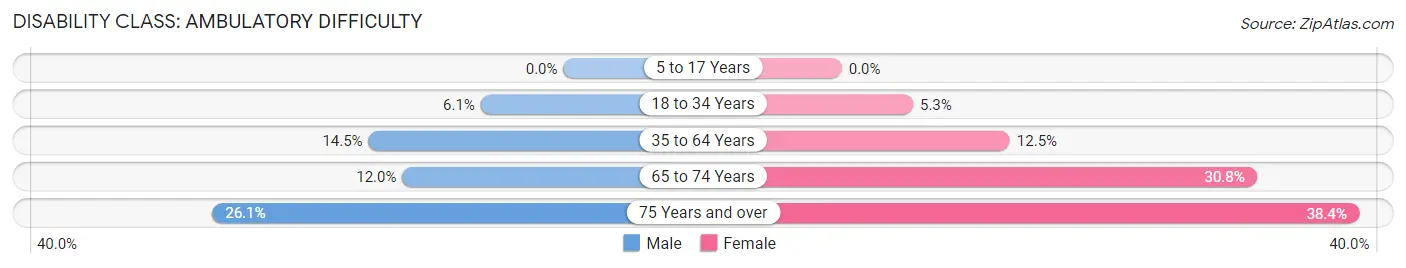
| Age Bracket | Male | Female |
| 5 to 17 Years | 0 (0.0%) | 0 (0.0%) |
| 18 to 34 Years | 24 (6.1%) | 24 (5.3%) |
| 35 to 64 Years | 147 (14.5%) | 147 (12.5%) |
| 65 to 74 Years | 36 (12.0%) | 109 (30.8%) |
| 75 Years and over | 37 (26.1%) | 71 (38.4%) |
Disability Class: Self-Care Difficulty
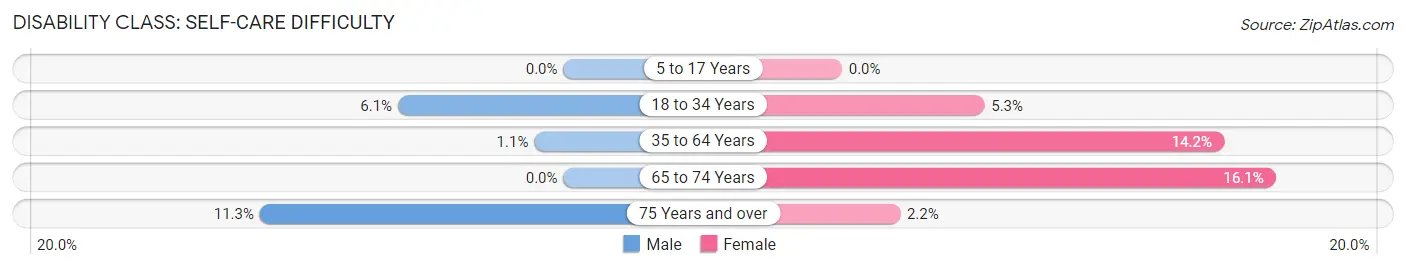
| Age Bracket | Male | Female |
| 5 to 17 Years | 0 (0.0%) | 0 (0.0%) |
| 18 to 34 Years | 24 (6.1%) | 24 (5.3%) |
| 35 to 64 Years | 11 (1.1%) | 167 (14.2%) |
| 65 to 74 Years | 0 (0.0%) | 57 (16.1%) |
| 75 Years and over | 16 (11.3%) | 4 (2.2%) |
Technology Access in James City
Computing Device Access in James City
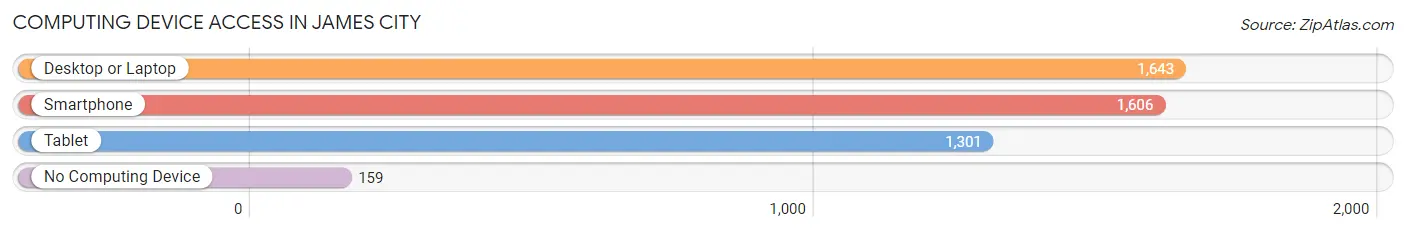
| Device Type | # Households | % Households |
| Desktop or Laptop | 1,643 | 81.1% |
| Smartphone | 1,606 | 79.2% |
| Tablet | 1,301 | 64.2% |
| No Computing Device | 159 | 7.8% |
| Total | 2,027 | 100.0% |
Internet Access in James City
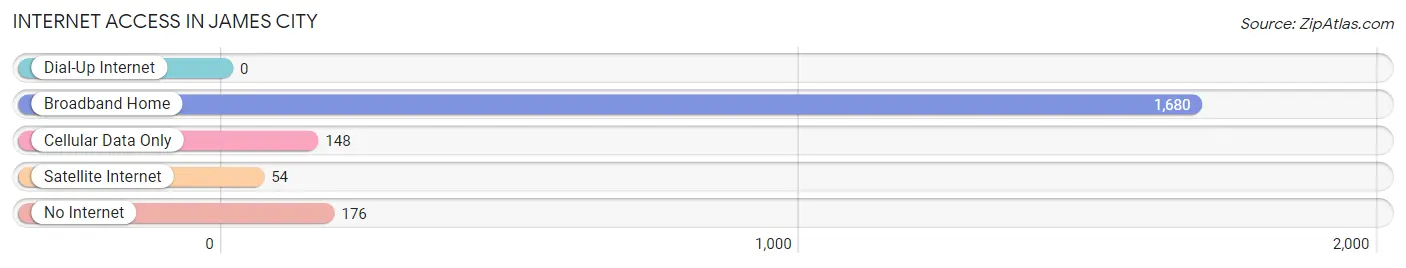
| Internet Type | # Households | % Households |
| Dial-Up Internet | 0 | 0.0% |
| Broadband Home | 1,680 | 82.9% |
| Cellular Data Only | 148 | 7.3% |
| Satellite Internet | 54 | 2.7% |
| No Internet | 176 | 8.7% |
| Total | 2,027 | 100.0% |
James City Summary
James City is a small town located in North Carolina, United States. It is situated in the eastern part of the state, in the coastal plain region. The town is located in Craven County, and is part of the New Bern Metropolitan Statistical Area. The population of James City was estimated to be 1,845 in 2019.
History
James City was founded in 1790 by James and Mary Smith, who were among the first settlers in the area. The town was named after James Smith, who was a Revolutionary War veteran. The town was originally a small farming community, and the Smiths were the first to cultivate the land. The town grew slowly over the years, and by the mid-1800s, it had become a thriving community.
In the late 1800s, James City was a popular destination for tourists, as it was located near the Neuse River. The town was also known for its fishing and hunting opportunities. In the early 1900s, the town began to experience a decline in population, as many of the residents moved away to larger cities.
Geography
James City is located in the eastern part of North Carolina, in the coastal plain region. The town is situated in Craven County, and is part of the New Bern Metropolitan Statistical Area. The town is located near the Neuse River, and is surrounded by forests and wetlands. The town is located approximately 30 miles from the Atlantic Ocean.
The climate in James City is humid subtropical, with hot and humid summers and mild winters. The average annual temperature is around 70 degrees Fahrenheit, and the average annual precipitation is around 50 inches.
Economy
The economy of James City is largely based on agriculture and tourism. The town is home to several farms, which produce a variety of crops, including corn, soybeans, and cotton. The town is also home to several tourist attractions, including the Neuse River, which is popular for fishing and boating.
The town is also home to several small businesses, including restaurants, retail stores, and service providers. The town is also home to a few manufacturing companies, which produce a variety of products, including furniture and clothing.
Demographics
As of 2019, the population of James City was estimated to be 1,845. The population is predominantly white, with a small percentage of African Americans and Hispanics. The median household income in the town is around $45,000, and the median home value is around $150,000. The town has a low unemployment rate, and the poverty rate is around 10%.
Conclusion
James City is a small town located in North Carolina, United States. It is situated in the eastern part of the state, in the coastal plain region. The town is located in Craven County, and is part of the New Bern Metropolitan Statistical Area. The population of James City was estimated to be 1,845 in 2019. The town is largely based on agriculture and tourism, and is home to several small businesses. The population is predominantly white, with a small percentage of African Americans and Hispanics. The median household income in the town is around $45,000, and the median home value is around $150,000.
Common Questions
What is Per Capita Income in James City?
Per Capita income in James City is $30,889.
What is the Median Family Income in James City?
Median Family Income in James City is $69,359.
What is the Median Household income in James City?
Median Household Income in James City is $62,227.
What is Income or Wage Gap in James City?
Income or Wage Gap in James City is 27.5%.
Women in James City earn 72.5 cents for every dollar earned by a man.
What is Family Income Deficit in James City?
Family Income Deficit in James City is $3,880.
Families that are below poverty line in James City earn $3,880 less on average than the poverty threshold level.
What is Inequality or Gini Index in James City?
Inequality or Gini Index in James City is 0.42.
What is the Total Population of James City?
Total Population of James City is 5,186.
What is the Total Male Population of James City?
Total Male Population of James City is 2,361.
What is the Total Female Population of James City?
Total Female Population of James City is 2,825.
What is the Ratio of Males per 100 Females in James City?
There are 83.58 Males per 100 Females in James City.
What is the Ratio of Females per 100 Males in James City?
There are 119.65 Females per 100 Males in James City.
What is the Median Population Age in James City?
Median Population Age in James City is 44.3 Years.
What is the Average Family Size in James City
Average Family Size in James City is 2.8 People.
What is the Average Household Size in James City
Average Household Size in James City is 2.5 People.
How Large is the Labor Force in James City?
There are 2,562 People in the Labor Forcein in James City.
What is the Percentage of People in the Labor Force in James City?
59.3% of People are in the Labor Force in James City.
What is the Unemployment Rate in James City?
Unemployment Rate in James City is 4.8%.