Walnut Creek, NC Map & Demographics
Walnut Creek Map
Walnut Creek Overview
$84,712
PER CAPITA INCOME
$178,000
AVG FAMILY INCOME
$149,875
AVG HOUSEHOLD INCOME
14.9%
WAGE / INCOME GAP [ % ]
85.1¢/ $1
WAGE / INCOME GAP [ $ ]
0.46
INEQUALITY / GINI INDEX
1,570
TOTAL POPULATION
941
MALE POPULATION
629
FEMALE POPULATION
149.60
MALES / 100 FEMALES
66.84
FEMALES / 100 MALES
44.2
MEDIAN AGE
3.0
AVG FAMILY SIZE
2.8
AVG HOUSEHOLD SIZE
691
LABOR FORCE [ PEOPLE ]
57.0%
PERCENT IN LABOR FORCE
2.4%
UNEMPLOYMENT RATE
Income in Walnut Creek
Income Overview in Walnut Creek
Per Capita Income in Walnut Creek is $84,712, while median incomes of families and households are $178,000 and $149,875 respectively.
| Characteristic | Number | Measure |
| Per Capita Income | 1,570 | $84,712 |
| Median Family Income | 500 | $178,000 |
| Mean Family Income | 500 | $247,306 |
| Median Household Income | 557 | $149,875 |
| Mean Household Income | 557 | $232,960 |
| Income Deficit | 500 | $0 |
| Wage / Income Gap (%) | 1,570 | 14.93% |
| Wage / Income Gap ($) | 1,570 | 85.07¢ per $1 |
| Gini / Inequality Index | 1,570 | 0.46 |
Earnings by Sex in Walnut Creek
Average Earnings in Walnut Creek are $71,406, $79,612 for men and $67,727 for women, a difference of 14.9%.
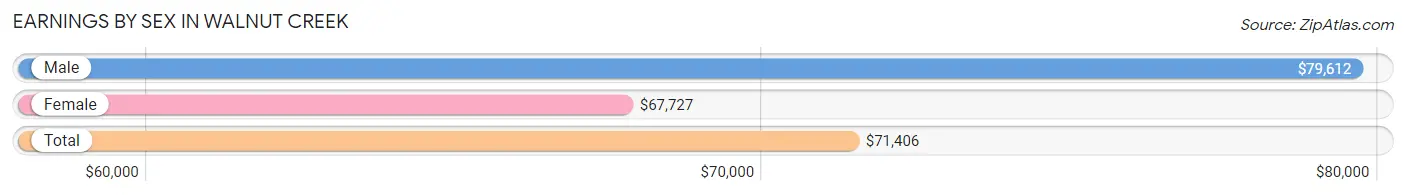
| Sex | Number | Average Earnings |
| Male | 535 (68.7%) | $79,612 |
| Female | 244 (31.3%) | $67,727 |
| Total | 779 (100.0%) | $71,406 |
Earnings by Sex by Income Bracket in Walnut Creek
The most common earnings brackets in Walnut Creek are $100,000+ for men (246 | 46.0%) and $100,000+ for women (70 | 28.7%).
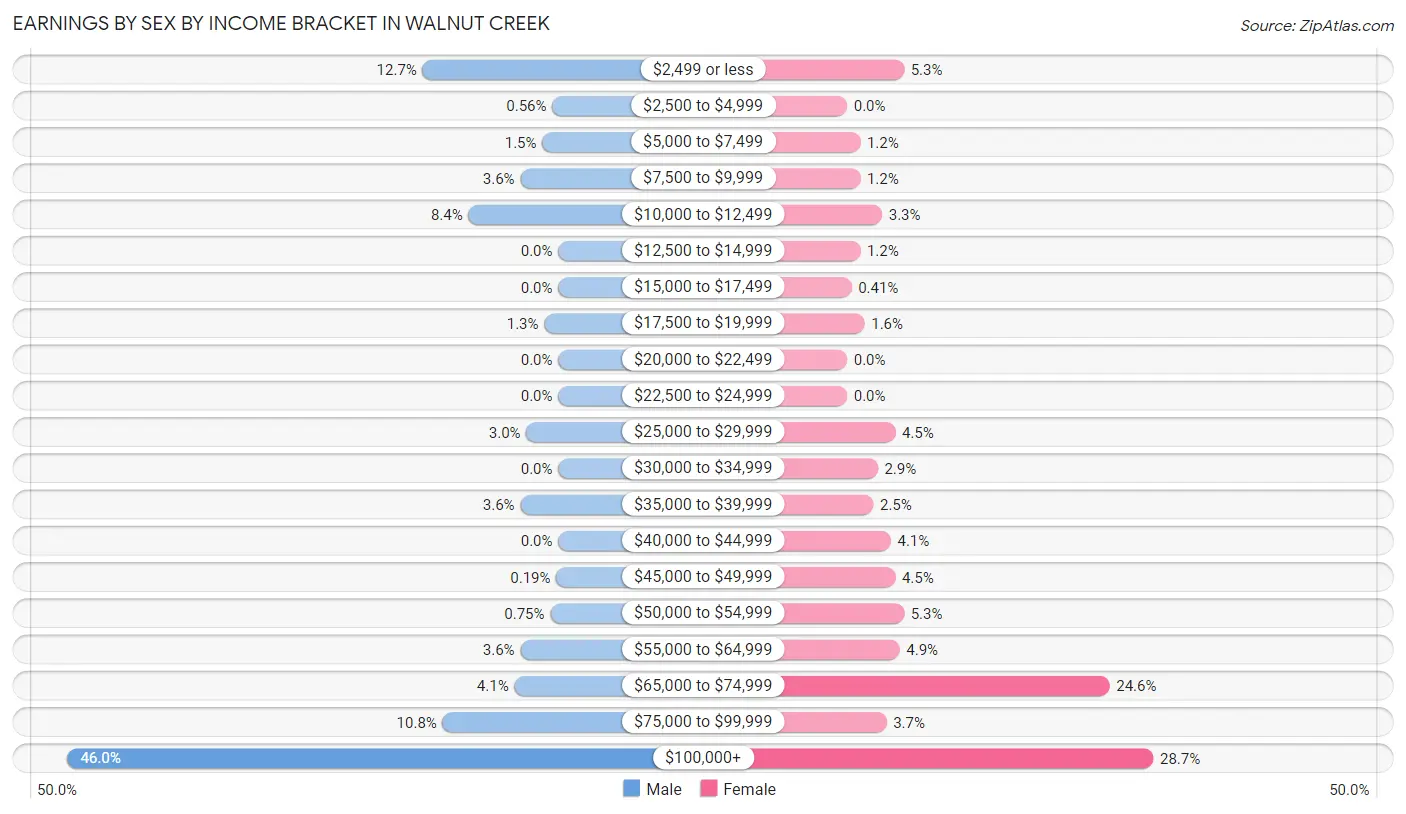
| Income | Male | Female |
| $2,499 or less | 68 (12.7%) | 13 (5.3%) |
| $2,500 to $4,999 | 3 (0.6%) | 0 (0.0%) |
| $5,000 to $7,499 | 8 (1.5%) | 3 (1.2%) |
| $7,500 to $9,999 | 19 (3.5%) | 3 (1.2%) |
| $10,000 to $12,499 | 45 (8.4%) | 8 (3.3%) |
| $12,500 to $14,999 | 0 (0.0%) | 3 (1.2%) |
| $15,000 to $17,499 | 0 (0.0%) | 1 (0.4%) |
| $17,500 to $19,999 | 7 (1.3%) | 4 (1.6%) |
| $20,000 to $22,499 | 0 (0.0%) | 0 (0.0%) |
| $22,500 to $24,999 | 0 (0.0%) | 0 (0.0%) |
| $25,000 to $29,999 | 16 (3.0%) | 11 (4.5%) |
| $30,000 to $34,999 | 0 (0.0%) | 7 (2.9%) |
| $35,000 to $39,999 | 19 (3.5%) | 6 (2.5%) |
| $40,000 to $44,999 | 0 (0.0%) | 10 (4.1%) |
| $45,000 to $49,999 | 1 (0.2%) | 11 (4.5%) |
| $50,000 to $54,999 | 4 (0.7%) | 13 (5.3%) |
| $55,000 to $64,999 | 19 (3.5%) | 12 (4.9%) |
| $65,000 to $74,999 | 22 (4.1%) | 60 (24.6%) |
| $75,000 to $99,999 | 58 (10.8%) | 9 (3.7%) |
| $100,000+ | 246 (46.0%) | 70 (28.7%) |
| Total | 535 (100.0%) | 244 (100.0%) |
Earnings by Sex by Educational Attainment in Walnut Creek
Average earnings in Walnut Creek are $111,979 for men and $67,841 for women, a difference of 39.4%. Men with an educational attainment of graduate degree enjoy the highest average annual earnings of $180,625, while those with bachelor's degree education earn the least with $110,313. Women with an educational attainment of graduate degree earn the most with the average annual earnings of $121,979, while those with bachelor's degree education have the smallest earnings of $46,250.
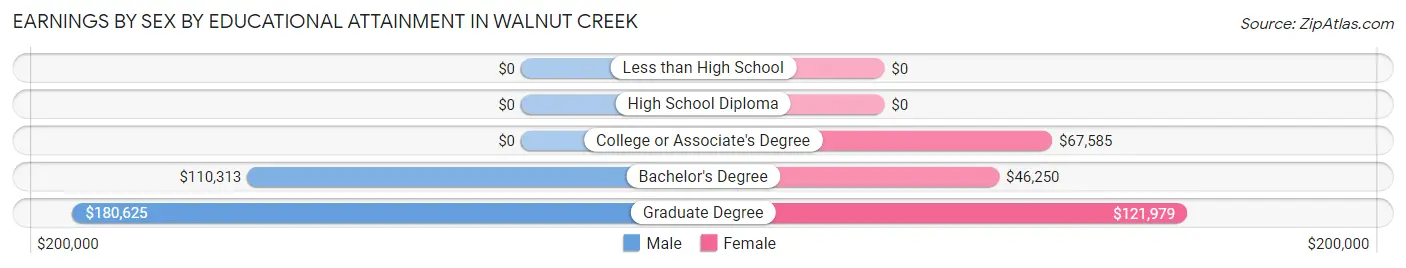
| Educational Attainment | Male Income | Female Income |
| Less than High School | - | - |
| High School Diploma | - | - |
| College or Associate's Degree | - | - |
| Bachelor's Degree | $110,313 | $46,250 |
| Graduate Degree | $180,625 | $121,979 |
| Total | $111,979 | $67,841 |
Family Income in Walnut Creek
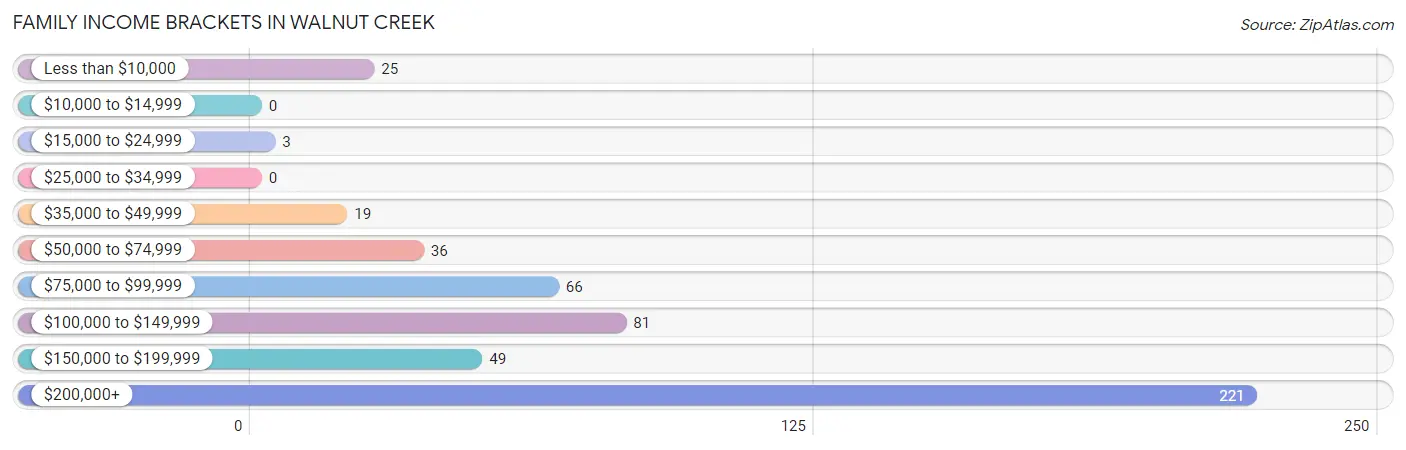
Family Income Brackets in Walnut Creek
According to the Walnut Creek family income data, there are 221 families falling into the $200,000+ income range, which is the most common income bracket and makes up 44.2% of all families.
| Income Bracket | # Families | % Families |
| Less than $10,000 | 25 | 5.0% |
| $10,000 to $14,999 | 0 | 0.0% |
| $15,000 to $24,999 | 3 | 0.6% |
| $25,000 to $34,999 | 0 | 0.0% |
| $35,000 to $49,999 | 19 | 3.8% |
| $50,000 to $74,999 | 36 | 7.2% |
| $75,000 to $99,999 | 66 | 13.2% |
| $100,000 to $149,999 | 81 | 16.2% |
| $150,000 to $199,999 | 49 | 9.8% |
| $200,000+ | 221 | 44.2% |
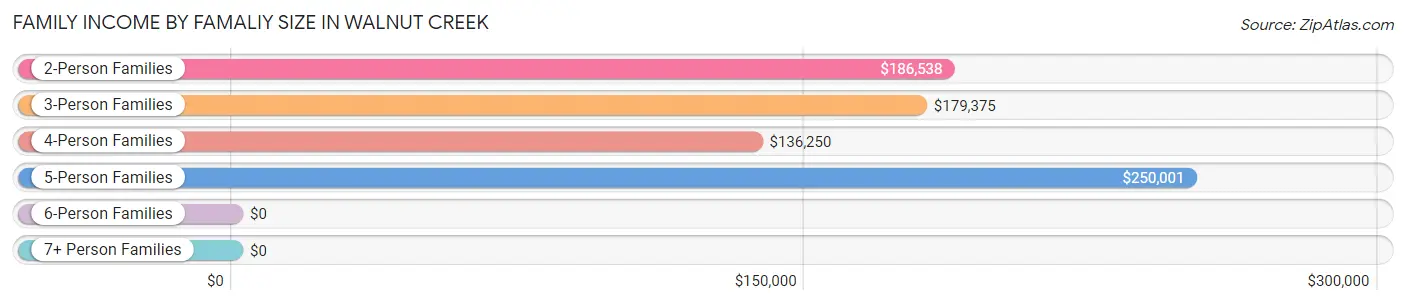
Family Income by Famaliy Size in Walnut Creek
5-person families (40 | 8.0%) account for the highest median family income in Walnut Creek with $250,001 per family, while 2-person families (204 | 40.8%) have the highest median income of $93,269 per family member.
| Income Bracket | # Families | Median Income |
| 2-Person Families | 204 (40.8%) | $186,538 |
| 3-Person Families | 111 (22.2%) | $179,375 |
| 4-Person Families | 139 (27.8%) | $136,250 |
| 5-Person Families | 40 (8.0%) | $250,001 |
| 6-Person Families | 6 (1.2%) | $0 |
| 7+ Person Families | 0 (0.0%) | $0 |
| Total | 500 (100.0%) | $178,000 |
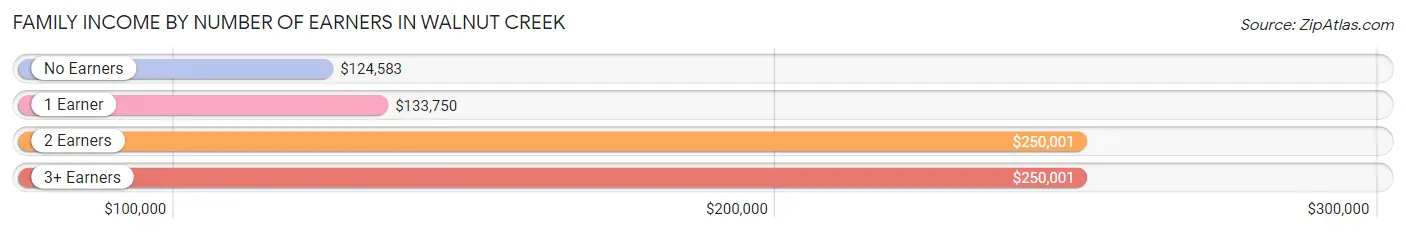
Family Income by Number of Earners in Walnut Creek
The median family income in Walnut Creek is $178,000, with families comprising 2 earners (158) having the highest median family income of $250,001, while families with no earners (75) have the lowest median family income of $124,583, accounting for 31.6% and 15.0% of families, respectively.
| Number of Earners | # Families | Median Income |
| No Earners | 75 (15.0%) | $124,583 |
| 1 Earner | 188 (37.6%) | $133,750 |
| 2 Earners | 158 (31.6%) | $250,001 |
| 3+ Earners | 79 (15.8%) | $250,001 |
| Total | 500 (100.0%) | $178,000 |
Household Income in Walnut Creek
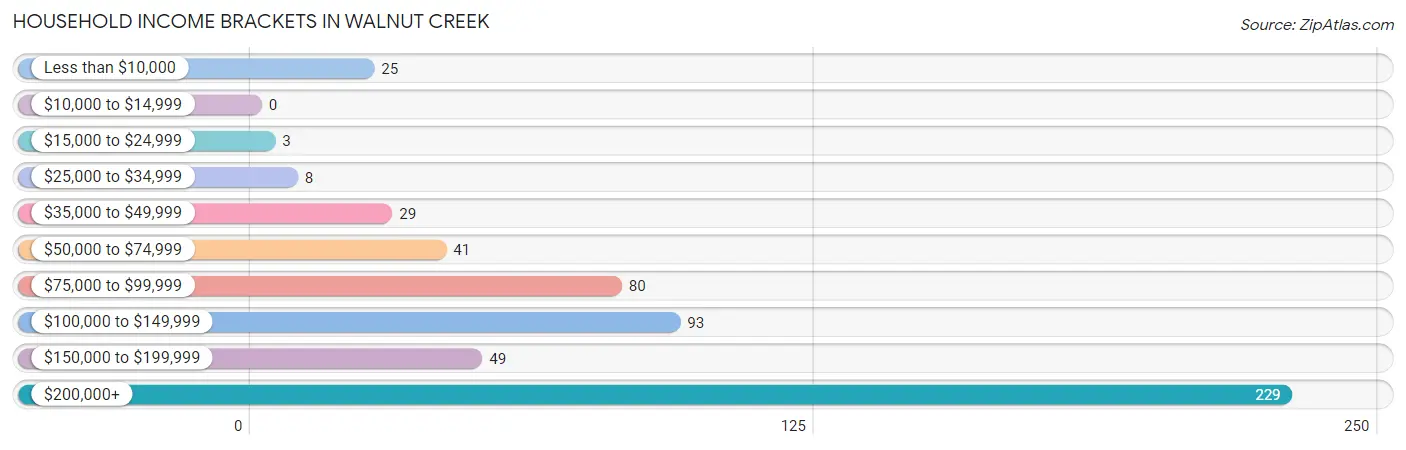
Household Income Brackets in Walnut Creek
With 229 households falling in the category, the $200,000+ income range is the most frequent in Walnut Creek, accounting for 41.1% of all households.
| Income Bracket | # Households | % Households |
| Less than $10,000 | 25 | 4.5% |
| $10,000 to $14,999 | 0 | 0.0% |
| $15,000 to $24,999 | 3 | 0.5% |
| $25,000 to $34,999 | 8 | 1.4% |
| $35,000 to $49,999 | 29 | 5.2% |
| $50,000 to $74,999 | 41 | 7.4% |
| $75,000 to $99,999 | 80 | 14.4% |
| $100,000 to $149,999 | 93 | 16.7% |
| $150,000 to $199,999 | 49 | 8.8% |
| $200,000+ | 229 | 41.1% |
Household Income by Householder Age in Walnut Creek
The median household income in Walnut Creek is $149,875, with the highest median household income of $244,063 found in the 45 to 64 years age bracket for the primary householder. A total of 237 households (42.5%) fall into this category. Meanwhile, the 15 to 24 years age bracket for the primary householder has the lowest median household income of $0, with 10 households (1.8%) in this group.
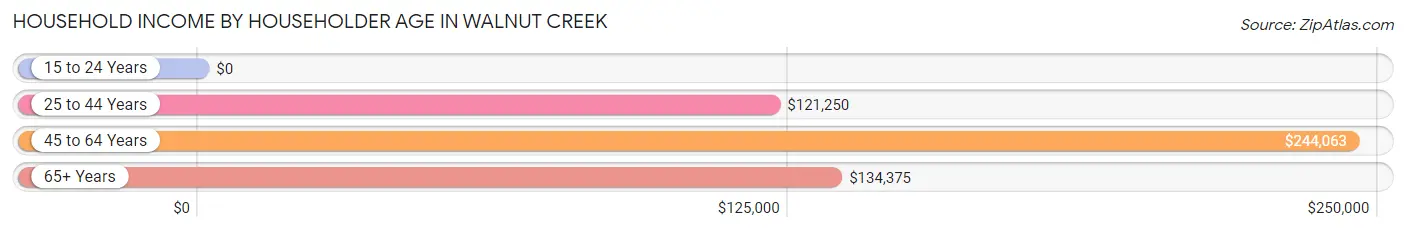
| Income Bracket | # Households | Median Income |
| 15 to 24 Years | 10 (1.8%) | $0 |
| 25 to 44 Years | 131 (23.5%) | $121,250 |
| 45 to 64 Years | 237 (42.5%) | $244,063 |
| 65+ Years | 179 (32.1%) | $134,375 |
| Total | 557 (100.0%) | $149,875 |
Poverty in Walnut Creek
Income Below Poverty by Sex and Age in Walnut Creek
With 4.7% poverty level for males and 7.1% for females among the residents of Walnut Creek, 16 and 17 year old males and under 5 year old females are the most vulnerable to poverty, with 9 males (18.4%) and 23 females (50.0%) in their respective age groups living below the poverty level.
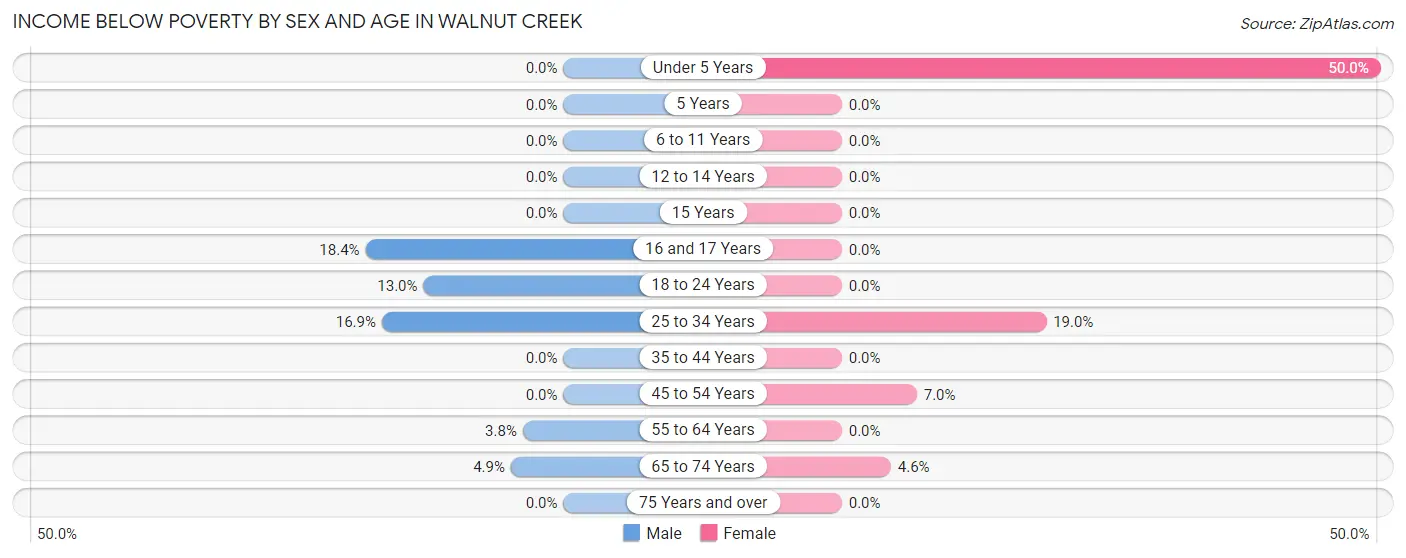
| Age Bracket | Male | Female |
| Under 5 Years | 0 (0.0%) | 23 (50.0%) |
| 5 Years | 0 (0.0%) | 0 (0.0%) |
| 6 to 11 Years | 0 (0.0%) | 0 (0.0%) |
| 12 to 14 Years | 0 (0.0%) | 0 (0.0%) |
| 15 Years | 0 (0.0%) | 0 (0.0%) |
| 16 and 17 Years | 9 (18.4%) | 0 (0.0%) |
| 18 to 24 Years | 10 (13.0%) | 0 (0.0%) |
| 25 to 34 Years | 15 (16.9%) | 11 (19.0%) |
| 35 to 44 Years | 0 (0.0%) | 0 (0.0%) |
| 45 to 54 Years | 0 (0.0%) | 8 (7.0%) |
| 55 to 64 Years | 4 (3.8%) | 0 (0.0%) |
| 65 to 74 Years | 6 (4.9%) | 3 (4.5%) |
| 75 Years and over | 0 (0.0%) | 0 (0.0%) |
| Total | 44 (4.7%) | 45 (7.1%) |
Income Above Poverty by Sex and Age in Walnut Creek
According to the poverty statistics in Walnut Creek, males aged under 5 years and females aged 5 years are the age groups that are most secure financially, with 100.0% of males and 100.0% of females in these age groups living above the poverty line.
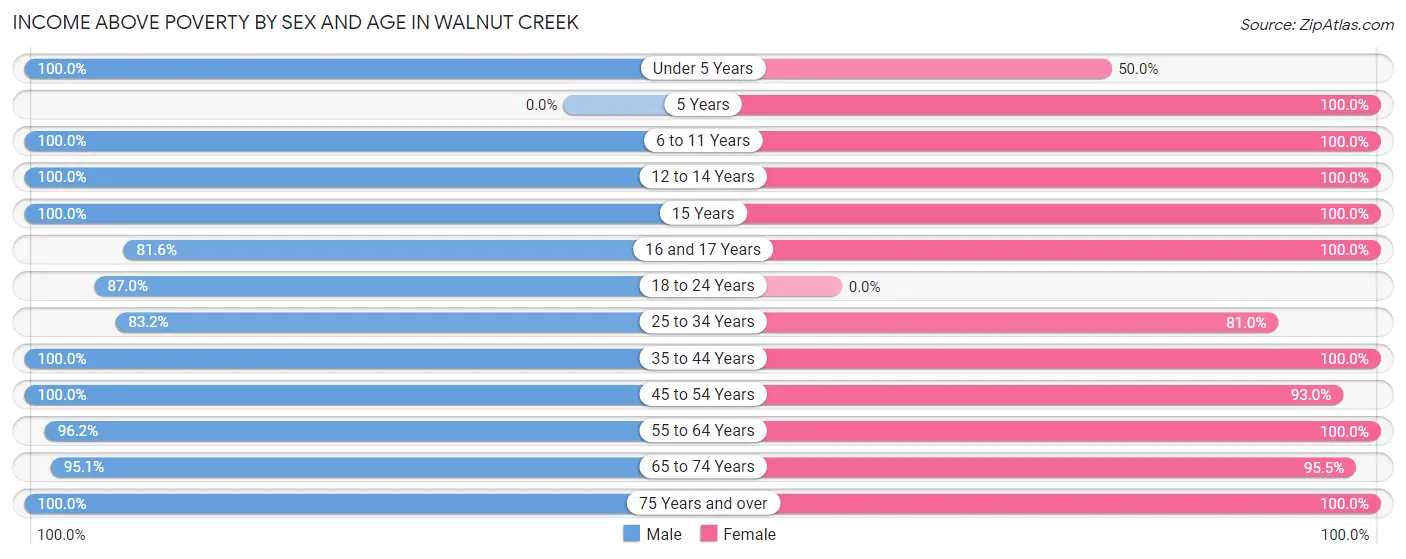
| Age Bracket | Male | Female |
| Under 5 Years | 69 (100.0%) | 23 (50.0%) |
| 5 Years | 0 (0.0%) | 3 (100.0%) |
| 6 to 11 Years | 61 (100.0%) | 44 (100.0%) |
| 12 to 14 Years | 67 (100.0%) | 23 (100.0%) |
| 15 Years | 31 (100.0%) | 13 (100.0%) |
| 16 and 17 Years | 40 (81.6%) | 9 (100.0%) |
| 18 to 24 Years | 67 (87.0%) | 0 (0.0%) |
| 25 to 34 Years | 74 (83.2%) | 47 (81.0%) |
| 35 to 44 Years | 98 (100.0%) | 87 (100.0%) |
| 45 to 54 Years | 130 (100.0%) | 107 (93.0%) |
| 55 to 64 Years | 102 (96.2%) | 138 (100.0%) |
| 65 to 74 Years | 117 (95.1%) | 63 (95.5%) |
| 75 Years and over | 41 (100.0%) | 27 (100.0%) |
| Total | 897 (95.3%) | 584 (92.8%) |
Income Below Poverty Among Married-Couple Families in Walnut Creek
The poverty statistics for married-couple families in Walnut Creek show that 4.0% or 18 of the total 455 families live below the poverty line. Families with 1 or 2 children have the highest poverty rate of 8.0%, comprising of 15 families. On the other hand, families with 3 or 4 children have the lowest poverty rate of 0.0%, which includes 0 families.
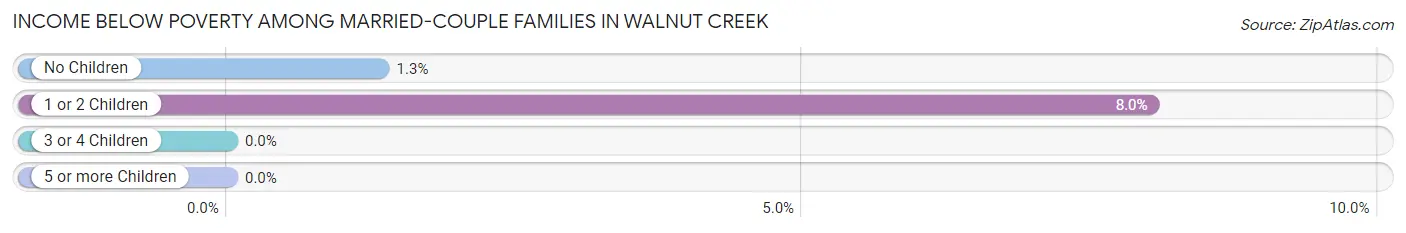
| Children | Above Poverty | Below Poverty |
| No Children | 225 (98.7%) | 3 (1.3%) |
| 1 or 2 Children | 172 (92.0%) | 15 (8.0%) |
| 3 or 4 Children | 40 (100.0%) | 0 (0.0%) |
| 5 or more Children | 0 (0.0%) | 0 (0.0%) |
| Total | 437 (96.0%) | 18 (4.0%) |
Income Below Poverty Among Single-Parent Households in Walnut Creek
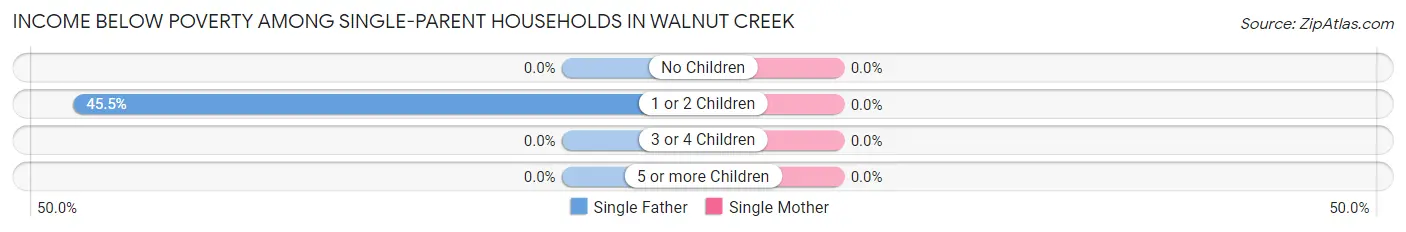
| Children | Single Father | Single Mother |
| No Children | 0 (0.0%) | 0 (0.0%) |
| 1 or 2 Children | 10 (45.5%) | 0 (0.0%) |
| 3 or 4 Children | 0 (0.0%) | 0 (0.0%) |
| 5 or more Children | 0 (0.0%) | 0 (0.0%) |
| Total | 10 (23.8%) | 0 (0.0%) |
Income Below Poverty Among Married-Couple vs Single-Parent Households in Walnut Creek
The poverty data for Walnut Creek shows that 18 of the married-couple family households (4.0%) and 10 of the single-parent households (22.2%) are living below the poverty level. Within the married-couple family households, those with 1 or 2 children have the highest poverty rate, with 15 households (8.0%) falling below the poverty line. Among the single-parent households, those with 1 or 2 children have the highest poverty rate, with 10 household (45.5%) living below poverty.
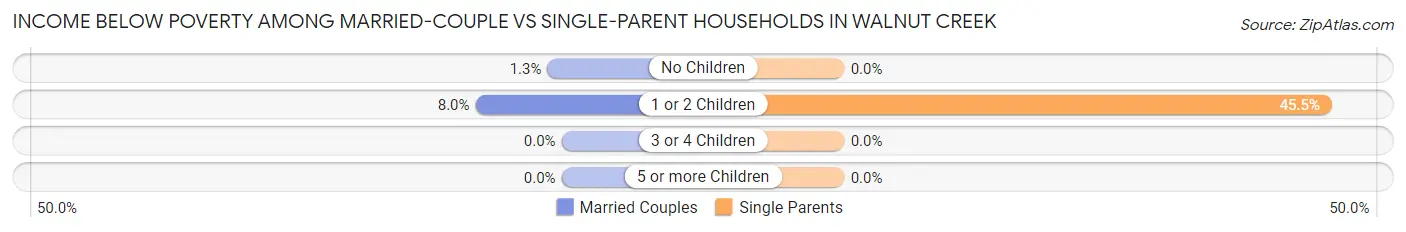
| Children | Married-Couple Families | Single-Parent Households |
| No Children | 3 (1.3%) | 0 (0.0%) |
| 1 or 2 Children | 15 (8.0%) | 10 (45.5%) |
| 3 or 4 Children | 0 (0.0%) | 0 (0.0%) |
| 5 or more Children | 0 (0.0%) | 0 (0.0%) |
| Total | 18 (4.0%) | 10 (22.2%) |
Race in Walnut Creek
The most populous races in Walnut Creek are White / Caucasian (1,492 | 95.0%), Two or more Races (43 | 2.7%), and Black / African American (24 | 1.5%).
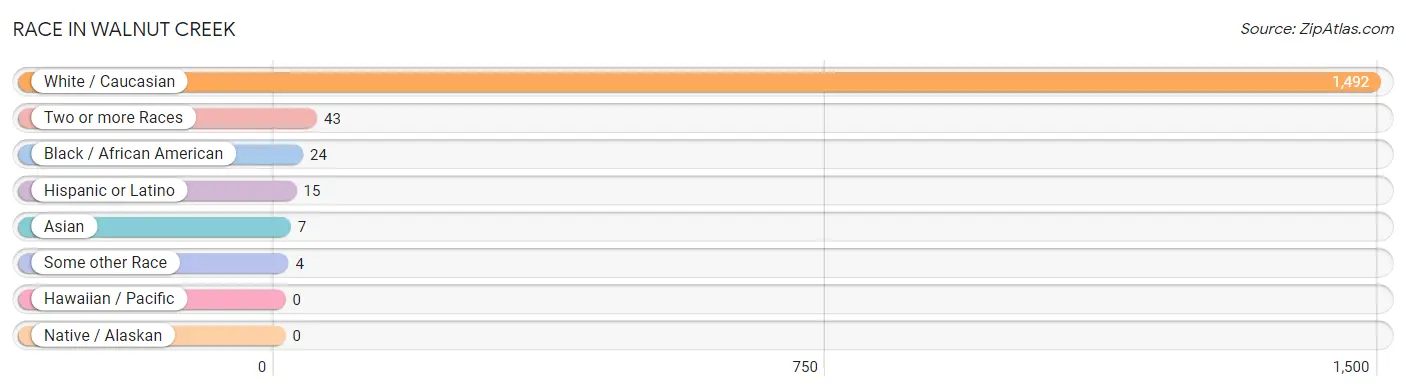
| Race | # Population | % Population |
| Asian | 7 | 0.4% |
| Black / African American | 24 | 1.5% |
| Hawaiian / Pacific | 0 | 0.0% |
| Hispanic or Latino | 15 | 1.0% |
| Native / Alaskan | 0 | 0.0% |
| White / Caucasian | 1,492 | 95.0% |
| Two or more Races | 43 | 2.7% |
| Some other Race | 4 | 0.3% |
| Total | 1,570 | 100.0% |
Ancestry in Walnut Creek
The most populous ancestries reported in Walnut Creek are English (405 | 25.8%), German (226 | 14.4%), American (128 | 8.2%), Irish (97 | 6.2%), and Scotch-Irish (89 | 5.7%), together accounting for 60.2% of all Walnut Creek residents.
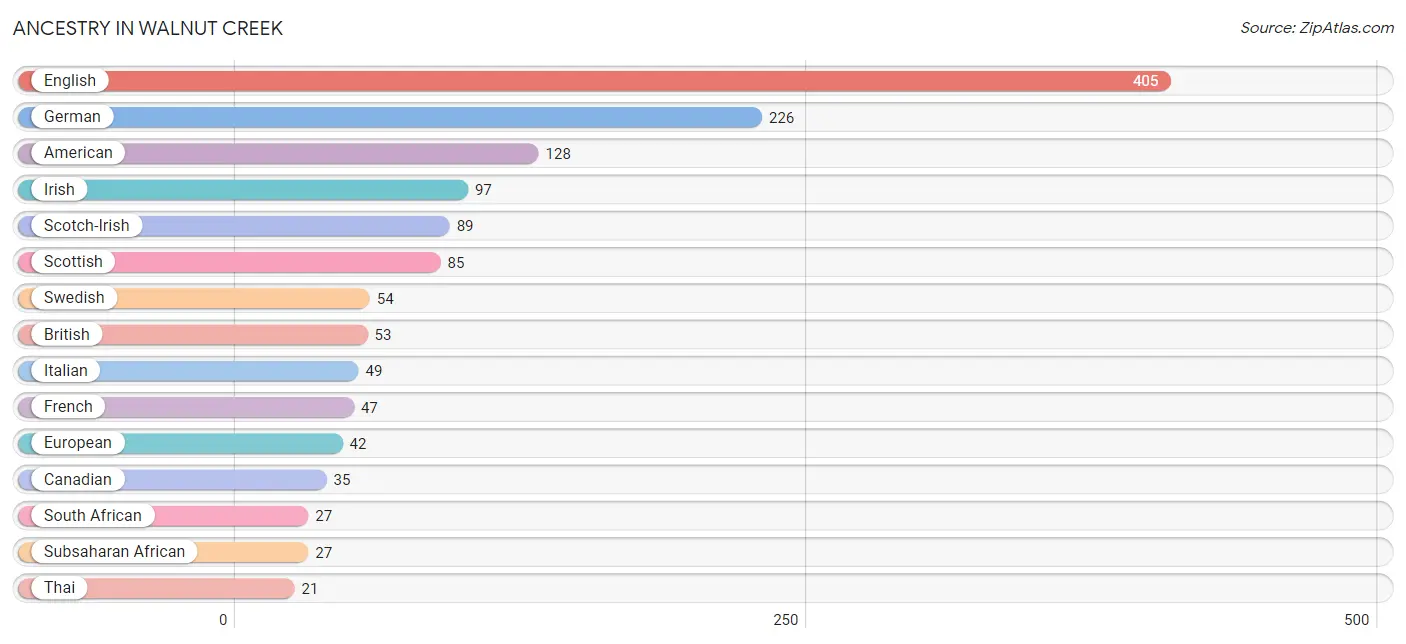
| Ancestry | # Population | % Population |
| American | 128 | 8.2% |
| Arab | 2 | 0.1% |
| Belgian | 4 | 0.3% |
| Bhutanese | 3 | 0.2% |
| British | 53 | 3.4% |
| Canadian | 35 | 2.2% |
| Cherokee | 4 | 0.3% |
| Chilean | 1 | 0.1% |
| Dutch | 7 | 0.4% |
| English | 405 | 25.8% |
| European | 42 | 2.7% |
| French | 47 | 3.0% |
| German | 226 | 14.4% |
| Greek | 7 | 0.4% |
| Hungarian | 3 | 0.2% |
| Irish | 97 | 6.2% |
| Italian | 49 | 3.1% |
| Norwegian | 15 | 1.0% |
| Polish | 11 | 0.7% |
| Portuguese | 3 | 0.2% |
| Puerto Rican | 2 | 0.1% |
| Romanian | 3 | 0.2% |
| Scandinavian | 3 | 0.2% |
| Scotch-Irish | 89 | 5.7% |
| Scottish | 85 | 5.4% |
| Slavic | 12 | 0.8% |
| Slovene | 10 | 0.6% |
| South African | 27 | 1.7% |
| South American | 1 | 0.1% |
| Spanish | 3 | 0.2% |
| Subsaharan African | 27 | 1.7% |
| Swedish | 54 | 3.4% |
| Swiss | 2 | 0.1% |
| Syrian | 2 | 0.1% |
| Thai | 21 | 1.3% |
| Welsh | 3 | 0.2% | View All 36 Rows |
Immigrants in Walnut Creek
The most numerous immigrant groups reported in Walnut Creek came from Canada (32 | 2.0%), Africa (24 | 1.5%), South Africa (24 | 1.5%), Europe (7 | 0.4%), and Asia (4 | 0.3%), together accounting for 5.8% of all Walnut Creek residents.
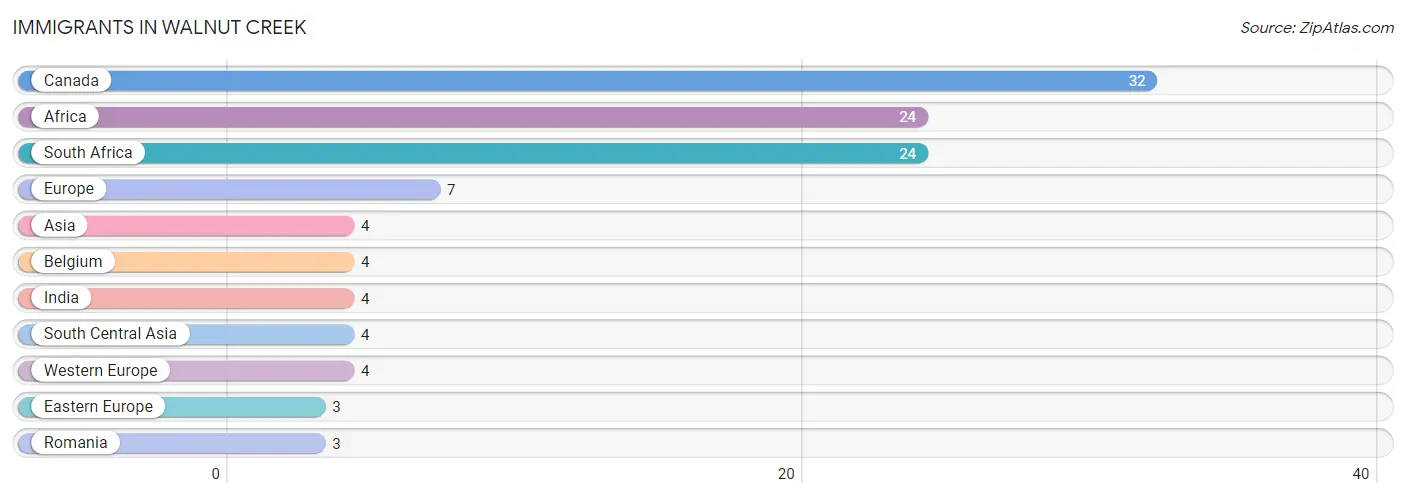
| Immigration Origin | # Population | % Population |
| Africa | 24 | 1.5% |
| Asia | 4 | 0.3% |
| Belgium | 4 | 0.3% |
| Canada | 32 | 2.0% |
| Eastern Europe | 3 | 0.2% |
| Europe | 7 | 0.4% |
| India | 4 | 0.3% |
| Romania | 3 | 0.2% |
| South Africa | 24 | 1.5% |
| South Central Asia | 4 | 0.3% |
| Western Europe | 4 | 0.3% | View All 11 Rows |
Sex and Age in Walnut Creek
Sex and Age in Walnut Creek
The most populous age groups in Walnut Creek are 15 to 19 Years (130 | 13.8%) for men and 60 to 64 Years (106 | 16.9%) for women.
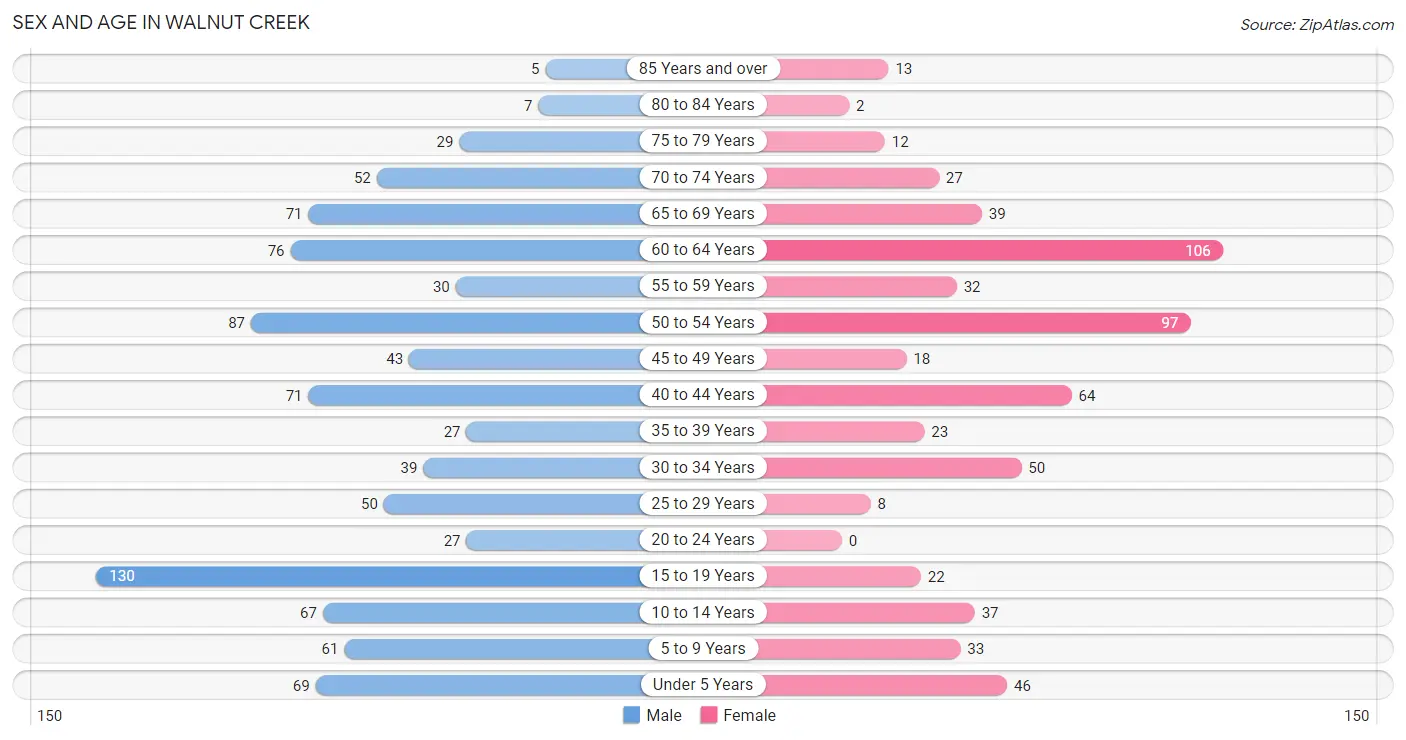
| Age Bracket | Male | Female |
| Under 5 Years | 69 (7.3%) | 46 (7.3%) |
| 5 to 9 Years | 61 (6.5%) | 33 (5.2%) |
| 10 to 14 Years | 67 (7.1%) | 37 (5.9%) |
| 15 to 19 Years | 130 (13.8%) | 22 (3.5%) |
| 20 to 24 Years | 27 (2.9%) | 0 (0.0%) |
| 25 to 29 Years | 50 (5.3%) | 8 (1.3%) |
| 30 to 34 Years | 39 (4.1%) | 50 (8.0%) |
| 35 to 39 Years | 27 (2.9%) | 23 (3.7%) |
| 40 to 44 Years | 71 (7.5%) | 64 (10.2%) |
| 45 to 49 Years | 43 (4.6%) | 18 (2.9%) |
| 50 to 54 Years | 87 (9.2%) | 97 (15.4%) |
| 55 to 59 Years | 30 (3.2%) | 32 (5.1%) |
| 60 to 64 Years | 76 (8.1%) | 106 (16.9%) |
| 65 to 69 Years | 71 (7.5%) | 39 (6.2%) |
| 70 to 74 Years | 52 (5.5%) | 27 (4.3%) |
| 75 to 79 Years | 29 (3.1%) | 12 (1.9%) |
| 80 to 84 Years | 7 (0.7%) | 2 (0.3%) |
| 85 Years and over | 5 (0.5%) | 13 (2.1%) |
| Total | 941 (100.0%) | 629 (100.0%) |
Families and Households in Walnut Creek
Median Family Size in Walnut Creek
The median family size in Walnut Creek is 3.01 persons per family, with married-couple families (455 | 91.0%) accounting for the largest median family size of 3.02 persons per family. On the other hand, single female/mother families (3 | 0.6%) represent the smallest median family size with 2.33 persons per family.
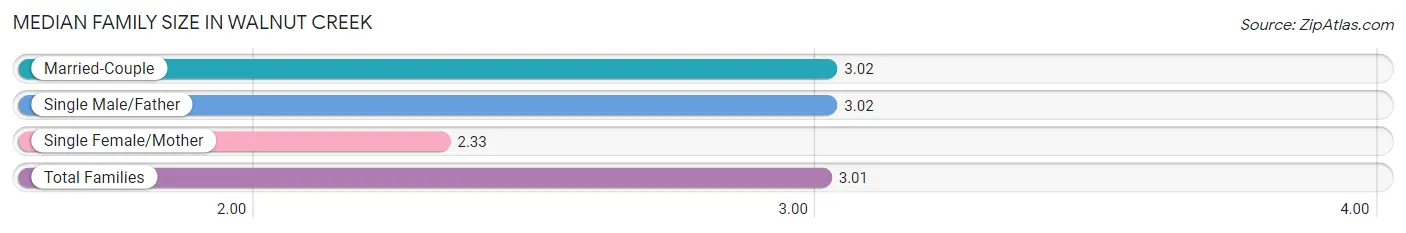
| Family Type | # Families | Family Size |
| Married-Couple | 455 (91.0%) | 3.02 |
| Single Male/Father | 42 (8.4%) | 3.02 |
| Single Female/Mother | 3 (0.6%) | 2.33 |
| Total Families | 500 (100.0%) | 3.01 |
Median Household Size in Walnut Creek
The median household size in Walnut Creek is 2.82 persons per household, with married-couple households (455 | 81.7%) accounting for the largest median household size of 3.02 persons per household. non-family households (57 | 10.2%) represent the smallest median household size with 1.12 persons per household.
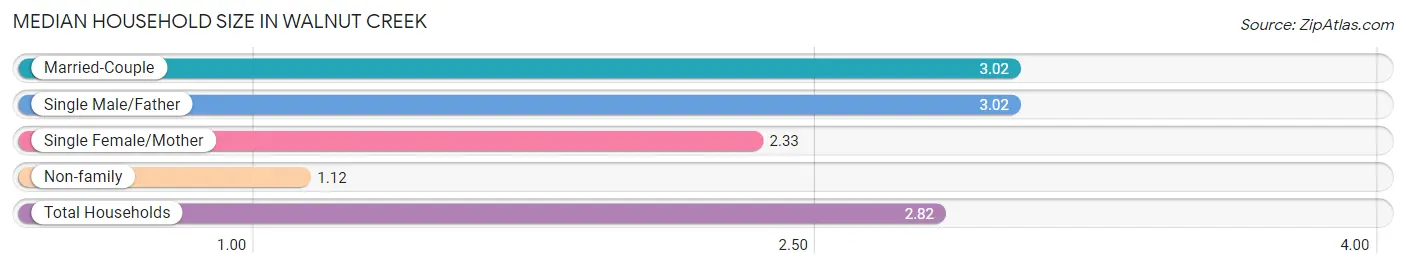
| Household Type | # Households | Household Size |
| Married-Couple | 455 (81.7%) | 3.02 |
| Single Male/Father | 42 (7.5%) | 3.02 |
| Single Female/Mother | 3 (0.5%) | 2.33 |
| Non-family | 57 (10.2%) | 1.12 |
| Total Households | 557 (100.0%) | 2.82 |
Household Size by Marriage Status in Walnut Creek
Out of a total of 557 households in Walnut Creek, 500 (89.8%) are family households, while 57 (10.2%) are nonfamily households. The most numerous type of family households are 2-person households, comprising 204, and the most common type of nonfamily households are 1-person households, comprising 51.
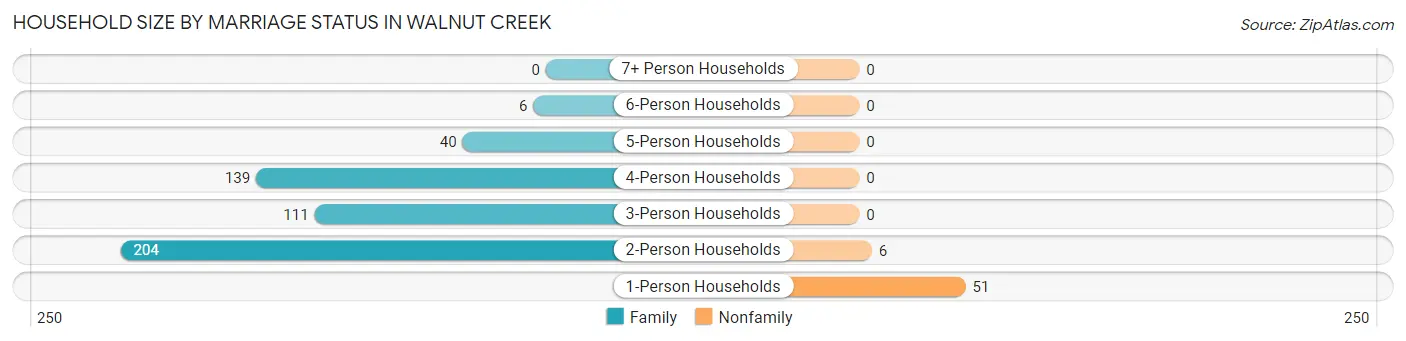
| Household Size | Family Households | Nonfamily Households |
| 1-Person Households | - | 51 (9.2%) |
| 2-Person Households | 204 (36.6%) | 6 (1.1%) |
| 3-Person Households | 111 (19.9%) | 0 (0.0%) |
| 4-Person Households | 139 (25.0%) | 0 (0.0%) |
| 5-Person Households | 40 (7.2%) | 0 (0.0%) |
| 6-Person Households | 6 (1.1%) | 0 (0.0%) |
| 7+ Person Households | 0 (0.0%) | 0 (0.0%) |
| Total | 500 (89.8%) | 57 (10.2%) |
Female Fertility in Walnut Creek
Fertility by Age in Walnut Creek
Average fertility rate in Walnut Creek is 107.0 births per 1,000 women. Women in the age bracket of 20 to 34 years have the highest fertility rate with 293.0 births per 1,000 women. Women in the age bracket of 20 to 34 years acount for 80.9% of all women with births.
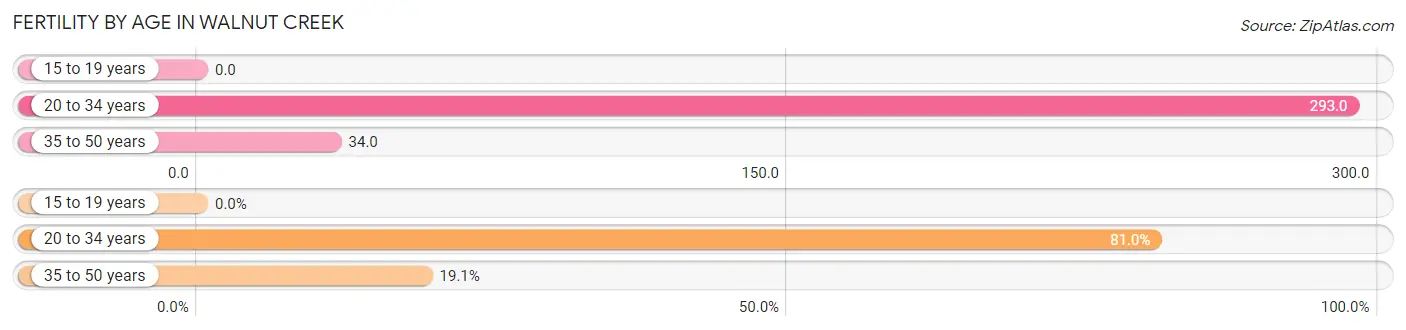
| Age Bracket | Women with Births | Births / 1,000 Women |
| 15 to 19 years | 0 (0.0%) | 0.0 |
| 20 to 34 years | 17 (80.9%) | 293.0 |
| 35 to 50 years | 4 (19.1%) | 34.0 |
| Total | 21 (100.0%) | 107.0 |
Fertility by Age by Marriage Status in Walnut Creek
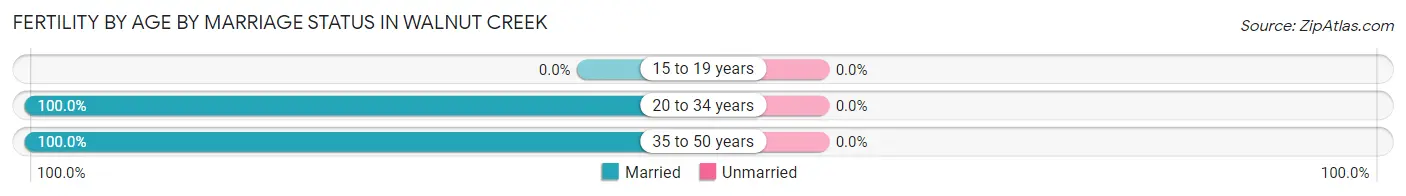
| Age Bracket | Married | Unmarried |
| 15 to 19 years | 0 (0.0%) | 0 (0.0%) |
| 20 to 34 years | 17 (100.0%) | 0 (0.0%) |
| 35 to 50 years | 4 (100.0%) | 0 (0.0%) |
| Total | 21 (100.0%) | 0 (0.0%) |
Fertility by Education in Walnut Creek
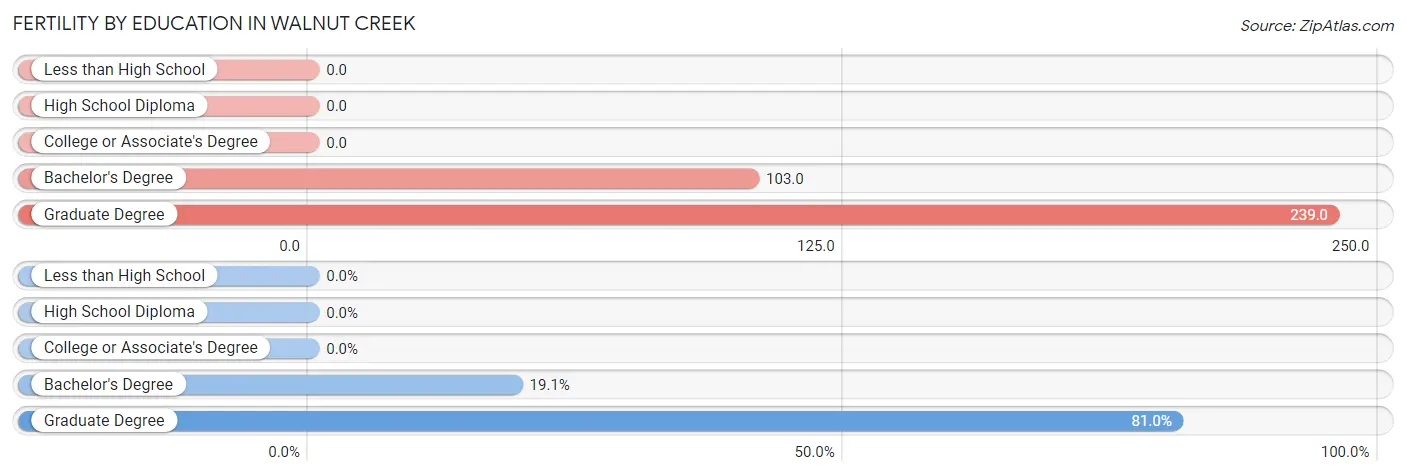
| Educational Attainment | Women with Births | Births / 1,000 Women |
| Less than High School | 0 (0.0%) | 0.0 |
| High School Diploma | 0 (0.0%) | 0.0 |
| College or Associate's Degree | 0 (0.0%) | 0.0 |
| Bachelor's Degree | 4 (19.1%) | 103.0 |
| Graduate Degree | 17 (80.9%) | 239.0 |
| Total | 21 (100.0%) | 107.0 |
Fertility by Education by Marriage Status in Walnut Creek
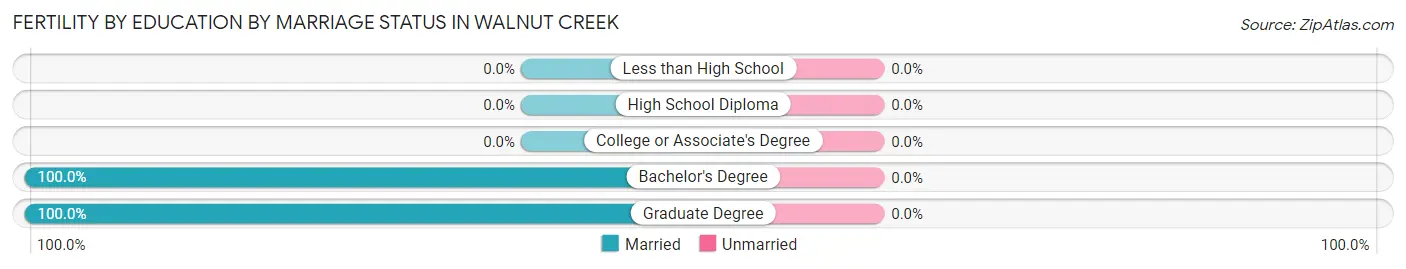
| Educational Attainment | Married | Unmarried |
| Less than High School | 0 (0.0%) | 0 (0.0%) |
| High School Diploma | 0 (0.0%) | 0 (0.0%) |
| College or Associate's Degree | 0 (0.0%) | 0 (0.0%) |
| Bachelor's Degree | 4 (100.0%) | 0 (0.0%) |
| Graduate Degree | 17 (100.0%) | 0 (0.0%) |
| Total | 21 (100.0%) | 0 (0.0%) |
Employment Characteristics in Walnut Creek
Employment by Class of Employer in Walnut Creek
Among the 629 employed individuals in Walnut Creek, private company employees (304 | 48.3%), self-employed (incorporated) (111 | 17.6%), and not-for-profit organizations (78 | 12.4%) make up the most common classes of employment.
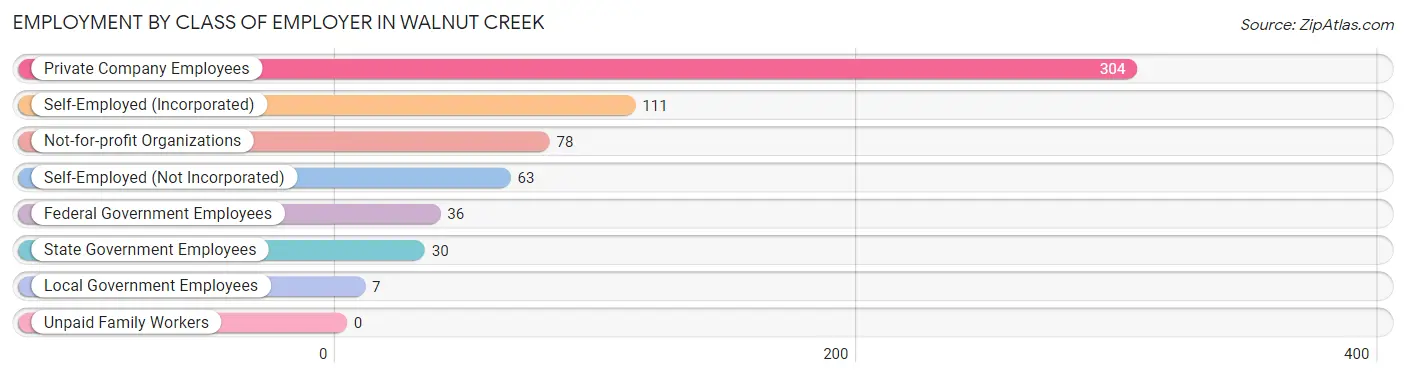
| Employer Class | # Employees | % Employees |
| Private Company Employees | 304 | 48.3% |
| Self-Employed (Incorporated) | 111 | 17.6% |
| Self-Employed (Not Incorporated) | 63 | 10.0% |
| Not-for-profit Organizations | 78 | 12.4% |
| Local Government Employees | 7 | 1.1% |
| State Government Employees | 30 | 4.8% |
| Federal Government Employees | 36 | 5.7% |
| Unpaid Family Workers | 0 | 0.0% |
| Total | 629 | 100.0% |
Employment Status by Age in Walnut Creek
According to the labor force statistics for Walnut Creek, out of the total population over 16 years of age (1,213), 57.0% or 691 individuals are in the labor force, with 2.4% or 17 of them unemployed. The age group with the highest labor force participation rate is 25 to 29 years, with 96.6% or 56 individuals in the labor force. Within the labor force, the 30 to 34 years age range has the highest percentage of unemployed individuals, with 31.4% or 16 of them being unemployed.
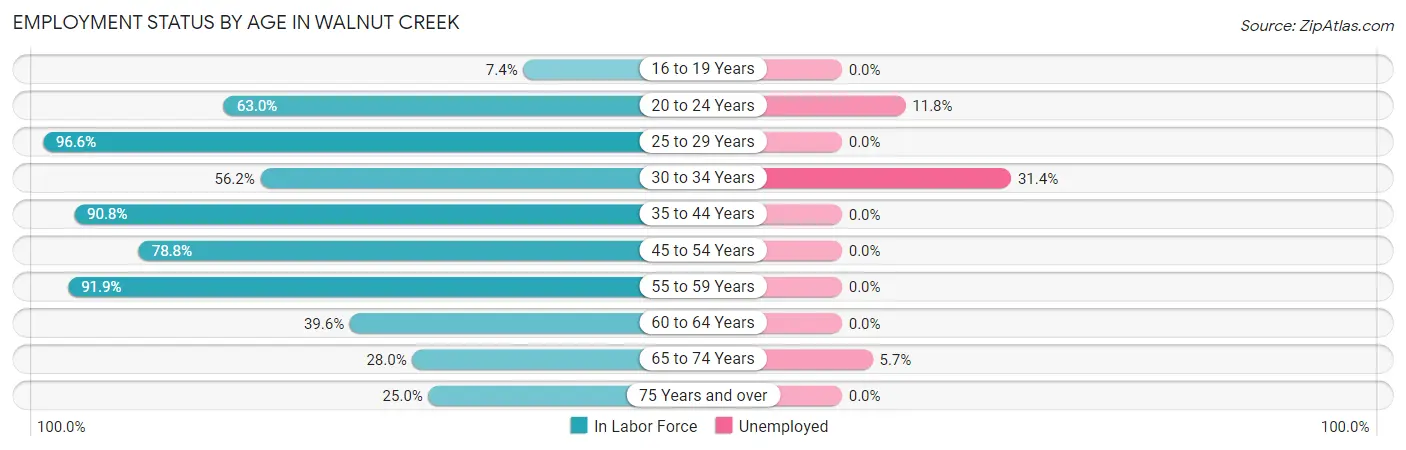
| Age Bracket | In Labor Force | Unemployed |
| 16 to 19 Years | 8 (7.4%) | 0 (0.0%) |
| 20 to 24 Years | 17 (63.0%) | 2 (11.8%) |
| 25 to 29 Years | 56 (96.6%) | 0 (0.0%) |
| 30 to 34 Years | 50 (56.2%) | 16 (31.4%) |
| 35 to 44 Years | 168 (90.8%) | 0 (0.0%) |
| 45 to 54 Years | 193 (78.8%) | 0 (0.0%) |
| 55 to 59 Years | 57 (91.9%) | 0 (0.0%) |
| 60 to 64 Years | 72 (39.6%) | 0 (0.0%) |
| 65 to 74 Years | 53 (28.0%) | 3 (5.7%) |
| 75 Years and over | 17 (25.0%) | 0 (0.0%) |
| Total | 691 (57.0%) | 17 (2.4%) |
Employment Status by Educational Attainment in Walnut Creek
According to labor force statistics for Walnut Creek, 72.6% of individuals (596) out of the total population between 25 and 64 years of age (821) are in the labor force, with 1.9% or 11 of them being unemployed. The group with the highest labor force participation rate are those with the educational attainment of bachelor's degree or higher, with 79.3% or 447 individuals in the labor force. Within the labor force, individuals with less than high school education have the highest percentage of unemployment, with 36.7% or 11 of them being unemployed.
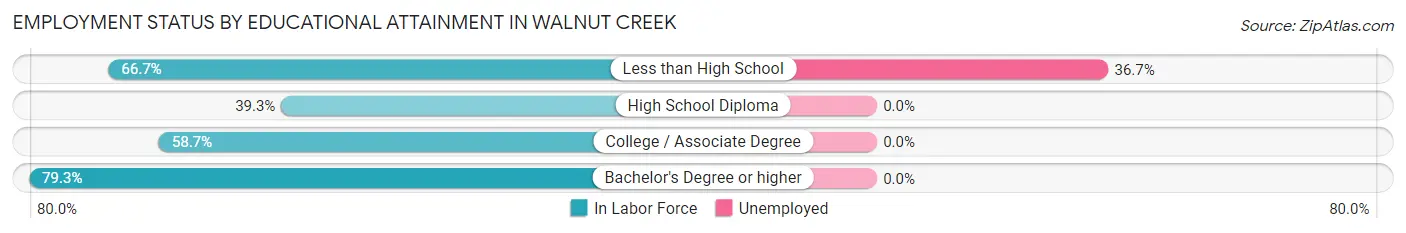
| Educational Attainment | In Labor Force | Unemployed |
| Less than High School | 30 (66.7%) | 17 (36.7%) |
| High School Diploma | 11 (39.3%) | 0 (0.0%) |
| College / Associate Degree | 108 (58.7%) | 0 (0.0%) |
| Bachelor's Degree or higher | 447 (79.3%) | 0 (0.0%) |
| Total | 596 (72.6%) | 16 (1.9%) |
Employment Occupations by Sex in Walnut Creek
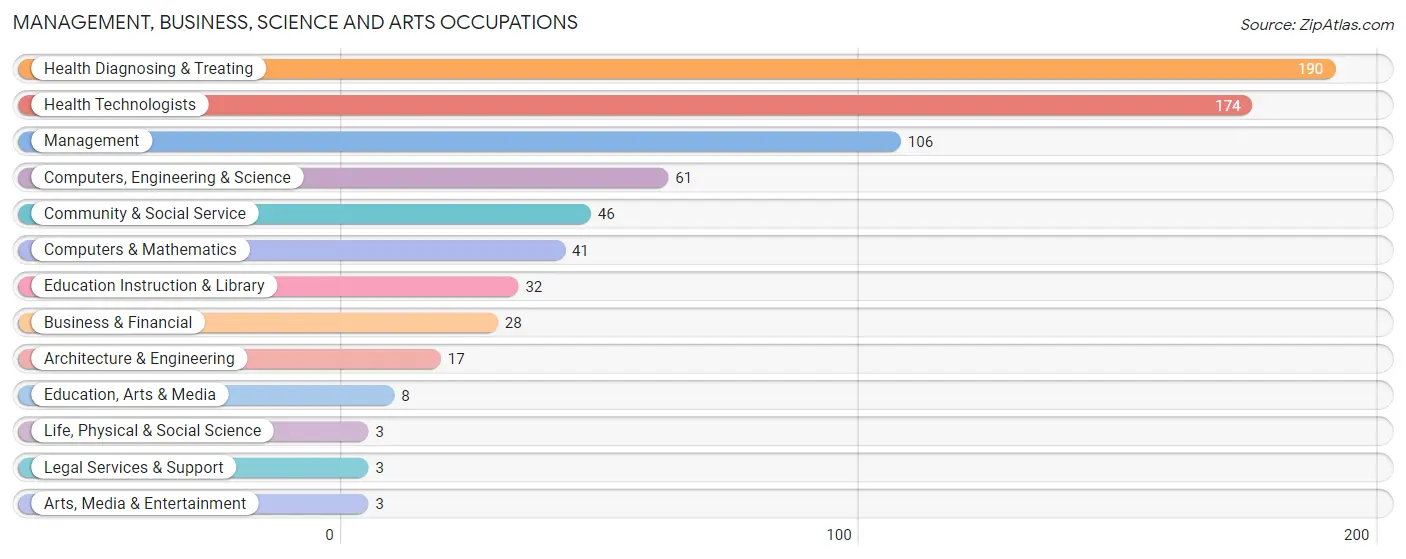
Management, Business, Science and Arts Occupations
The most common Management, Business, Science and Arts occupations in Walnut Creek are Health Diagnosing & Treating (190 | 29.0%), Health Technologists (174 | 26.6%), Management (106 | 16.2%), Computers, Engineering & Science (61 | 9.3%), and Community & Social Service (46 | 7.0%).
Management, Business, Science and Arts Occupations by Sex
Within the Management, Business, Science and Arts occupations in Walnut Creek, the most male-oriented occupations are Architecture & Engineering (100.0%), Life, Physical & Social Science (100.0%), and Legal Services & Support (100.0%), while the most female-oriented occupations are Arts, Media & Entertainment (100.0%), Education, Arts & Media (50.0%), and Community & Social Service (41.3%).
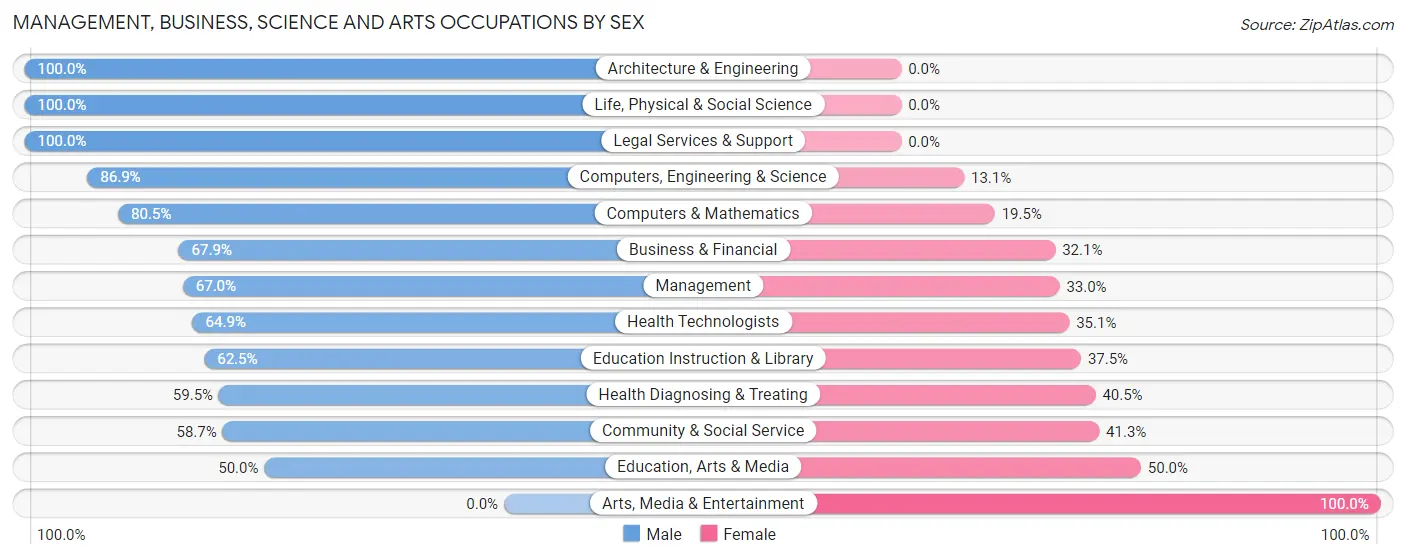
| Occupation | Male | Female |
| Management | 71 (67.0%) | 35 (33.0%) |
| Business & Financial | 19 (67.9%) | 9 (32.1%) |
| Computers, Engineering & Science | 53 (86.9%) | 8 (13.1%) |
| Computers & Mathematics | 33 (80.5%) | 8 (19.5%) |
| Architecture & Engineering | 17 (100.0%) | 0 (0.0%) |
| Life, Physical & Social Science | 3 (100.0%) | 0 (0.0%) |
| Community & Social Service | 27 (58.7%) | 19 (41.3%) |
| Education, Arts & Media | 4 (50.0%) | 4 (50.0%) |
| Legal Services & Support | 3 (100.0%) | 0 (0.0%) |
| Education Instruction & Library | 20 (62.5%) | 12 (37.5%) |
| Arts, Media & Entertainment | 0 (0.0%) | 3 (100.0%) |
| Health Diagnosing & Treating | 113 (59.5%) | 77 (40.5%) |
| Health Technologists | 113 (64.9%) | 61 (35.1%) |
| Total (Category) | 283 (65.7%) | 148 (34.3%) |
| Total (Overall) | 430 (65.7%) | 224 (34.3%) |
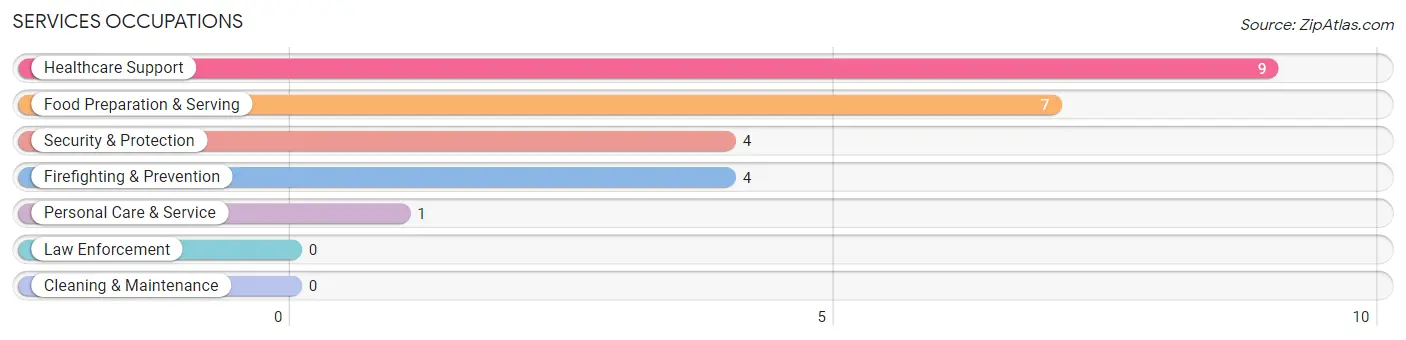
Services Occupations
The most common Services occupations in Walnut Creek are Healthcare Support (9 | 1.4%), Food Preparation & Serving (7 | 1.1%), Security & Protection (4 | 0.6%), Firefighting & Prevention (4 | 0.6%), and Personal Care & Service (1 | 0.2%).
Services Occupations by Sex
Within the Services occupations in Walnut Creek, the most male-oriented occupations are Security & Protection (100.0%), Firefighting & Prevention (100.0%), and Food Preparation & Serving (100.0%), while the most female-oriented occupations are Healthcare Support (100.0%), and Personal Care & Service (100.0%).
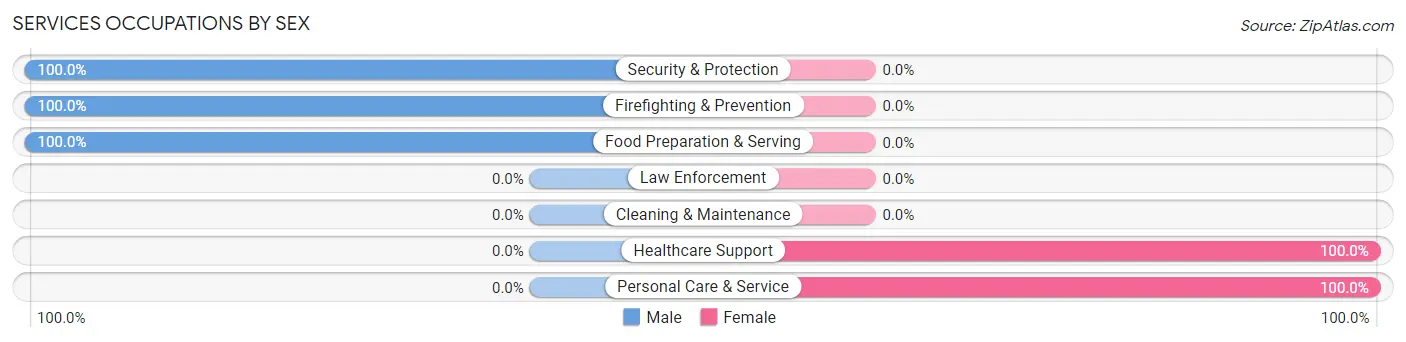
| Occupation | Male | Female |
| Healthcare Support | 0 (0.0%) | 9 (100.0%) |
| Security & Protection | 4 (100.0%) | 0 (0.0%) |
| Firefighting & Prevention | 4 (100.0%) | 0 (0.0%) |
| Law Enforcement | 0 (0.0%) | 0 (0.0%) |
| Food Preparation & Serving | 7 (100.0%) | 0 (0.0%) |
| Cleaning & Maintenance | 0 (0.0%) | 0 (0.0%) |
| Personal Care & Service | 0 (0.0%) | 1 (100.0%) |
| Total (Category) | 11 (52.4%) | 10 (47.6%) |
| Total (Overall) | 430 (65.7%) | 224 (34.3%) |
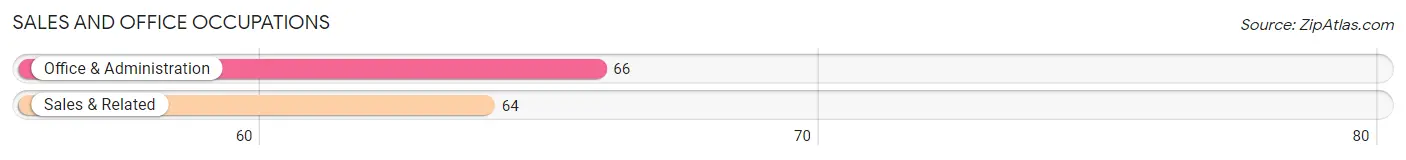
Sales and Office Occupations
The most common Sales and Office occupations in Walnut Creek are Office & Administration (66 | 10.1%), and Sales & Related (64 | 9.8%).
Sales and Office Occupations by Sex
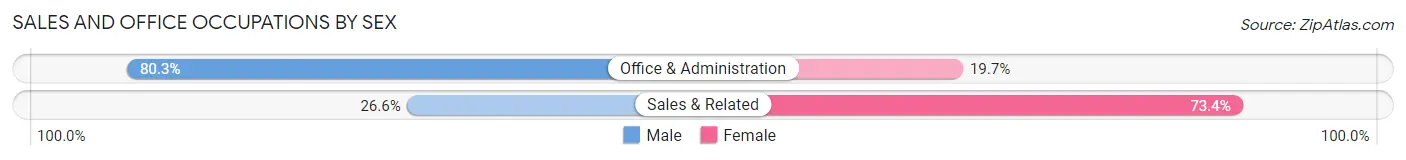
| Occupation | Male | Female |
| Sales & Related | 17 (26.6%) | 47 (73.4%) |
| Office & Administration | 53 (80.3%) | 13 (19.7%) |
| Total (Category) | 70 (53.8%) | 60 (46.2%) |
| Total (Overall) | 430 (65.7%) | 224 (34.3%) |
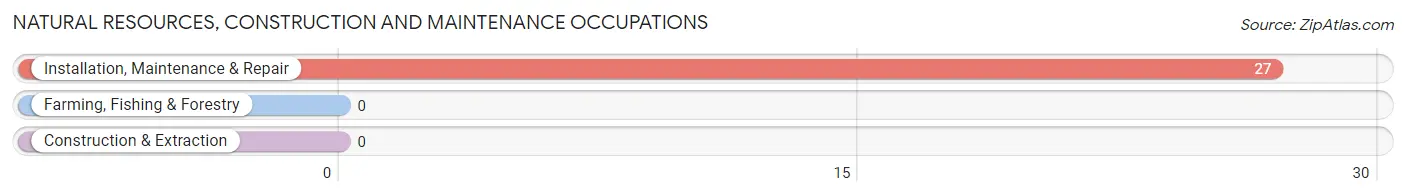
Natural Resources, Construction and Maintenance Occupations
The most common Natural Resources, Construction and Maintenance occupations in Walnut Creek are , and Installation, Maintenance & Repair (27 | 4.1%).
Natural Resources, Construction and Maintenance Occupations by Sex
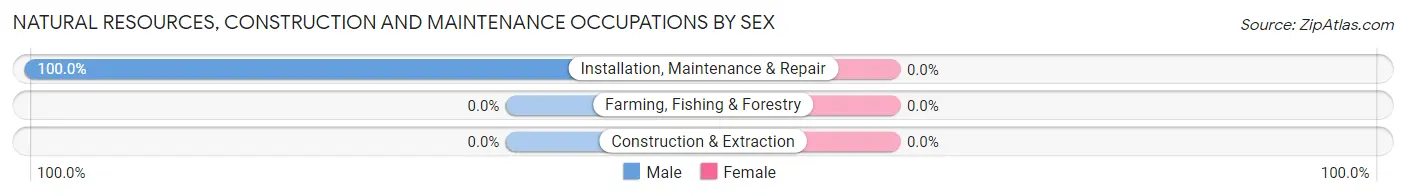
| Occupation | Male | Female |
| Farming, Fishing & Forestry | 0 (0.0%) | 0 (0.0%) |
| Construction & Extraction | 0 (0.0%) | 0 (0.0%) |
| Installation, Maintenance & Repair | 27 (100.0%) | 0 (0.0%) |
| Total (Category) | 27 (100.0%) | 0 (0.0%) |
| Total (Overall) | 430 (65.7%) | 224 (34.3%) |
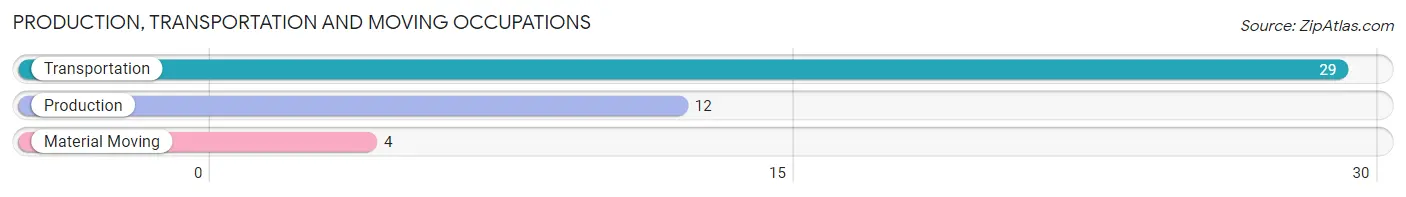
Production, Transportation and Moving Occupations
The most common Production, Transportation and Moving occupations in Walnut Creek are Transportation (29 | 4.4%), Production (12 | 1.8%), and Material Moving (4 | 0.6%).
Production, Transportation and Moving Occupations by Sex
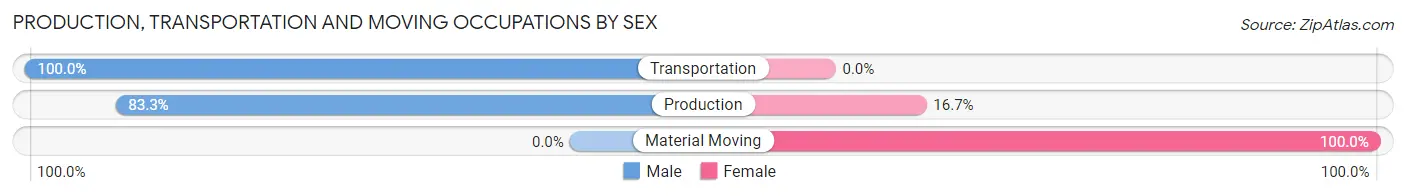
| Occupation | Male | Female |
| Production | 10 (83.3%) | 2 (16.7%) |
| Transportation | 29 (100.0%) | 0 (0.0%) |
| Material Moving | 0 (0.0%) | 4 (100.0%) |
| Total (Category) | 39 (86.7%) | 6 (13.3%) |
| Total (Overall) | 430 (65.7%) | 224 (34.3%) |
Employment Industries by Sex in Walnut Creek
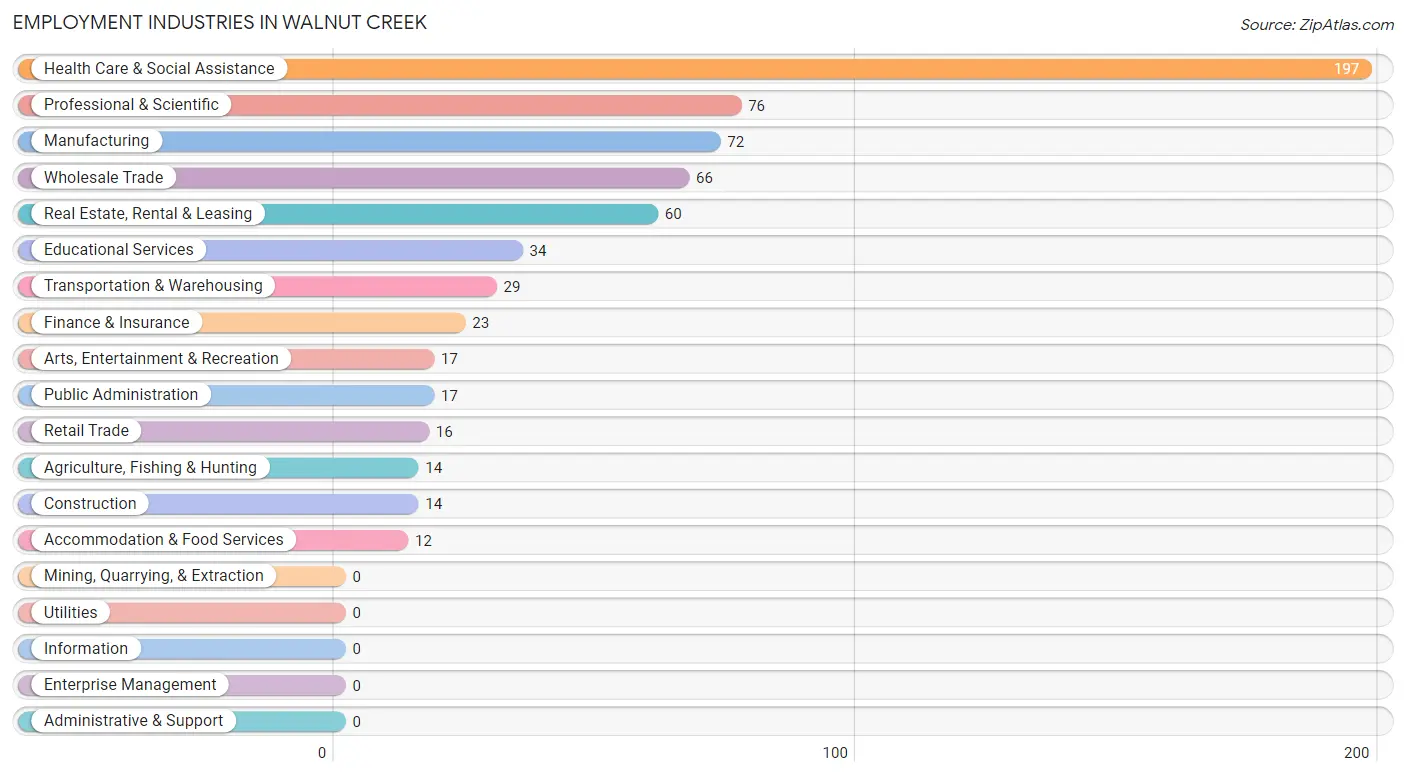
Employment Industries in Walnut Creek
The major employment industries in Walnut Creek include Health Care & Social Assistance (197 | 30.1%), Professional & Scientific (76 | 11.6%), Manufacturing (72 | 11.0%), Wholesale Trade (66 | 10.1%), and Real Estate, Rental & Leasing (60 | 9.2%).
Employment Industries by Sex in Walnut Creek
The Walnut Creek industries that see more men than women are Agriculture, Fishing & Hunting (100.0%), Construction (100.0%), and Transportation & Warehousing (100.0%), whereas the industries that tend to have a higher number of women are Real Estate, Rental & Leasing (86.7%), Health Care & Social Assistance (55.8%), and Public Administration (52.9%).
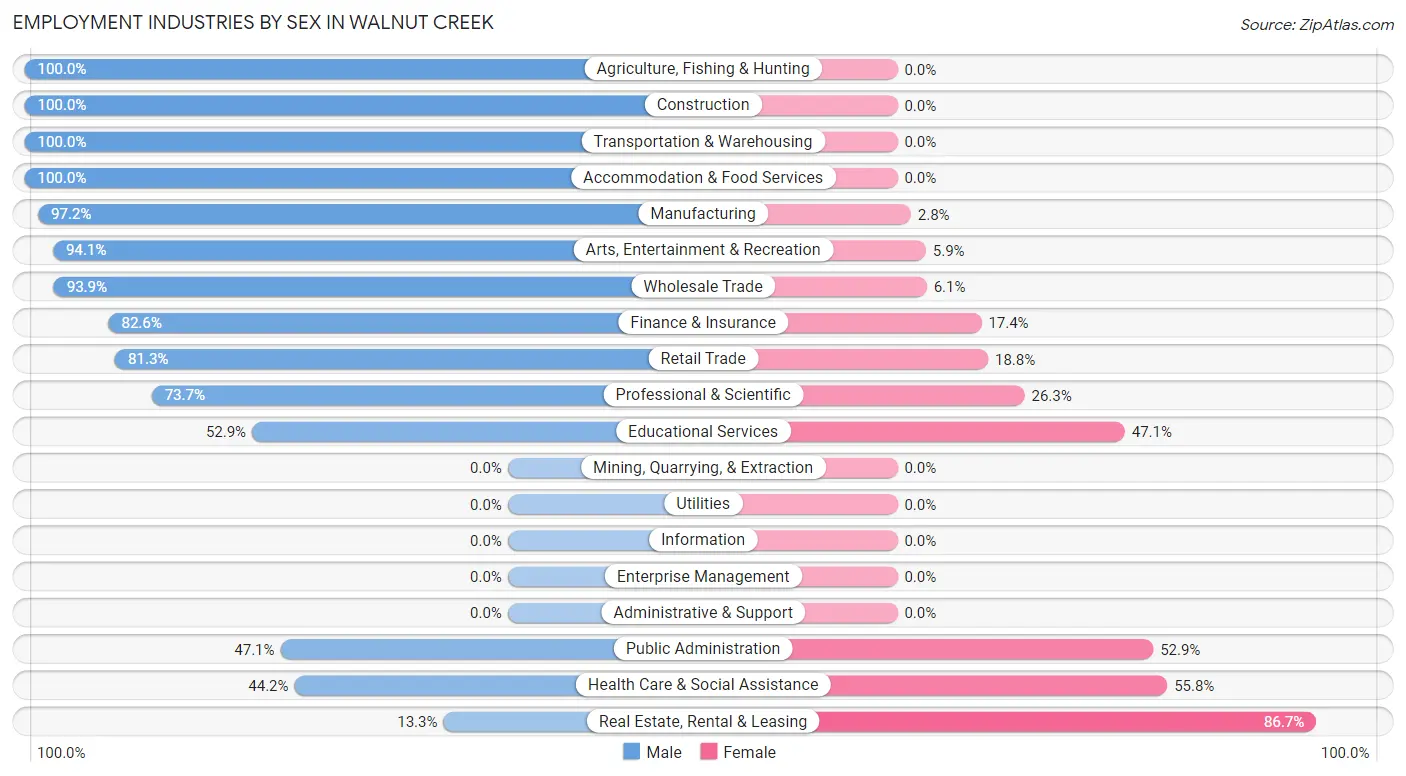
| Industry | Male | Female |
| Agriculture, Fishing & Hunting | 14 (100.0%) | 0 (0.0%) |
| Mining, Quarrying, & Extraction | 0 (0.0%) | 0 (0.0%) |
| Construction | 14 (100.0%) | 0 (0.0%) |
| Manufacturing | 70 (97.2%) | 2 (2.8%) |
| Wholesale Trade | 62 (93.9%) | 4 (6.1%) |
| Retail Trade | 13 (81.2%) | 3 (18.8%) |
| Transportation & Warehousing | 29 (100.0%) | 0 (0.0%) |
| Utilities | 0 (0.0%) | 0 (0.0%) |
| Information | 0 (0.0%) | 0 (0.0%) |
| Finance & Insurance | 19 (82.6%) | 4 (17.4%) |
| Real Estate, Rental & Leasing | 8 (13.3%) | 52 (86.7%) |
| Professional & Scientific | 56 (73.7%) | 20 (26.3%) |
| Enterprise Management | 0 (0.0%) | 0 (0.0%) |
| Administrative & Support | 0 (0.0%) | 0 (0.0%) |
| Educational Services | 18 (52.9%) | 16 (47.1%) |
| Health Care & Social Assistance | 87 (44.2%) | 110 (55.8%) |
| Arts, Entertainment & Recreation | 16 (94.1%) | 1 (5.9%) |
| Accommodation & Food Services | 12 (100.0%) | 0 (0.0%) |
| Public Administration | 8 (47.1%) | 9 (52.9%) |
| Total | 430 (65.7%) | 224 (34.3%) |
Education in Walnut Creek
School Enrollment in Walnut Creek
The most common levels of schooling among the 409 students in Walnut Creek are middle school (103 | 25.2%), high school (100 | 24.4%), and elementary school (91 | 22.3%).
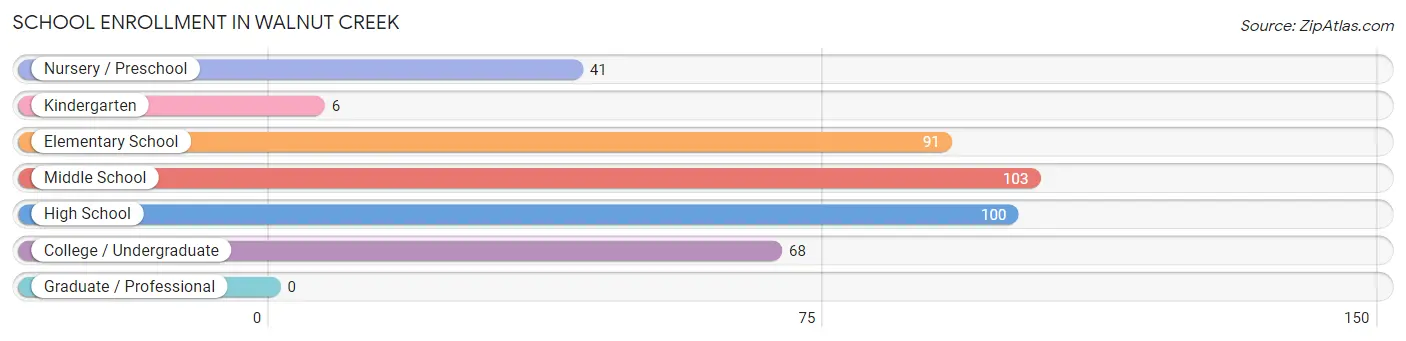
| School Level | # Students | % Students |
| Nursery / Preschool | 41 | 10.0% |
| Kindergarten | 6 | 1.5% |
| Elementary School | 91 | 22.3% |
| Middle School | 103 | 25.2% |
| High School | 100 | 24.4% |
| College / Undergraduate | 68 | 16.6% |
| Graduate / Professional | 0 | 0.0% |
| Total | 409 | 100.0% |
School Enrollment by Age by Funding Source in Walnut Creek
Out of a total of 409 students who are enrolled in schools in Walnut Creek, 144 (35.2%) attend a private institution, while the remaining 265 (64.8%) are enrolled in public schools. The age group of 3 to 4 year olds has the highest likelihood of being enrolled in private schools, with 37 (90.2% in the age bracket) enrolled. Conversely, the age group of 18 to 19 year olds has the lowest likelihood of being enrolled in a private school, with 50 (100.0% in the age bracket) attending a public institution.
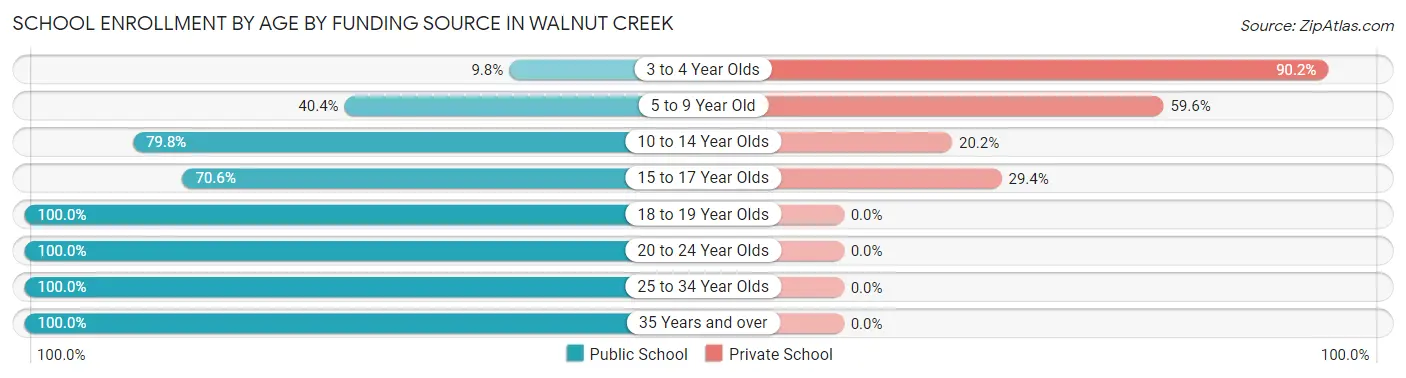
| Age Bracket | Public School | Private School |
| 3 to 4 Year Olds | 4 (9.8%) | 37 (90.2%) |
| 5 to 9 Year Old | 38 (40.4%) | 56 (59.6%) |
| 10 to 14 Year Olds | 83 (79.8%) | 21 (20.2%) |
| 15 to 17 Year Olds | 72 (70.6%) | 30 (29.4%) |
| 18 to 19 Year Olds | 50 (100.0%) | 0 (0.0%) |
| 20 to 24 Year Olds | 3 (100.0%) | 0 (0.0%) |
| 25 to 34 Year Olds | 4 (100.0%) | 0 (0.0%) |
| 35 Years and over | 11 (100.0%) | 0 (0.0%) |
| Total | 265 (64.8%) | 144 (35.2%) |
Educational Attainment by Field of Study in Walnut Creek
Bio, nature & agricultural (135 | 17.0%), physical & health sciences (106 | 13.3%), business (103 | 12.9%), science & technology (96 | 12.1%), and arts & humanities (60 | 7.5%) are the most common fields of study among 796 individuals in Walnut Creek who have obtained a bachelor's degree or higher.
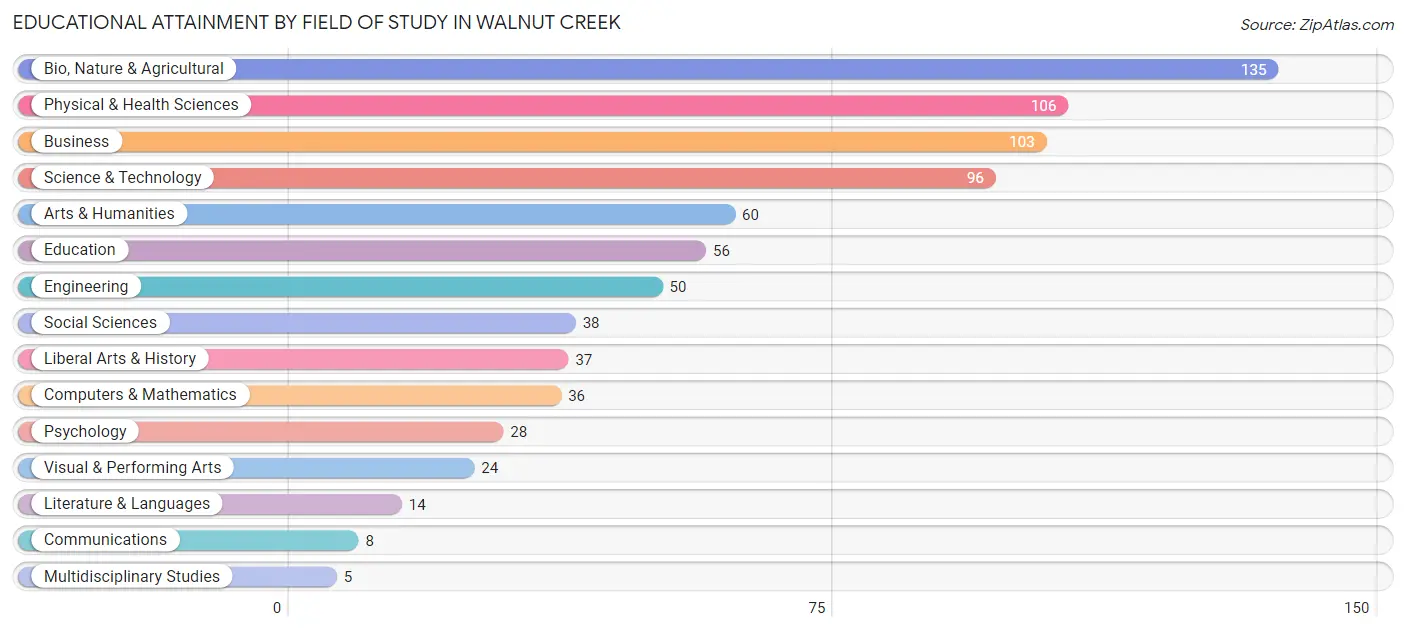
| Field of Study | # Graduates | % Graduates |
| Computers & Mathematics | 36 | 4.5% |
| Bio, Nature & Agricultural | 135 | 17.0% |
| Physical & Health Sciences | 106 | 13.3% |
| Psychology | 28 | 3.5% |
| Social Sciences | 38 | 4.8% |
| Engineering | 50 | 6.3% |
| Multidisciplinary Studies | 5 | 0.6% |
| Science & Technology | 96 | 12.1% |
| Business | 103 | 12.9% |
| Education | 56 | 7.0% |
| Literature & Languages | 14 | 1.8% |
| Liberal Arts & History | 37 | 4.6% |
| Visual & Performing Arts | 24 | 3.0% |
| Communications | 8 | 1.0% |
| Arts & Humanities | 60 | 7.5% |
| Total | 796 | 100.0% |
Transportation & Commute in Walnut Creek
Vehicle Availability by Sex in Walnut Creek
The most prevalent vehicle ownership categories in Walnut Creek are males with 3 vehicles (176, accounting for 39.0%) and females with 3 vehicles (43, making up 98.9%).
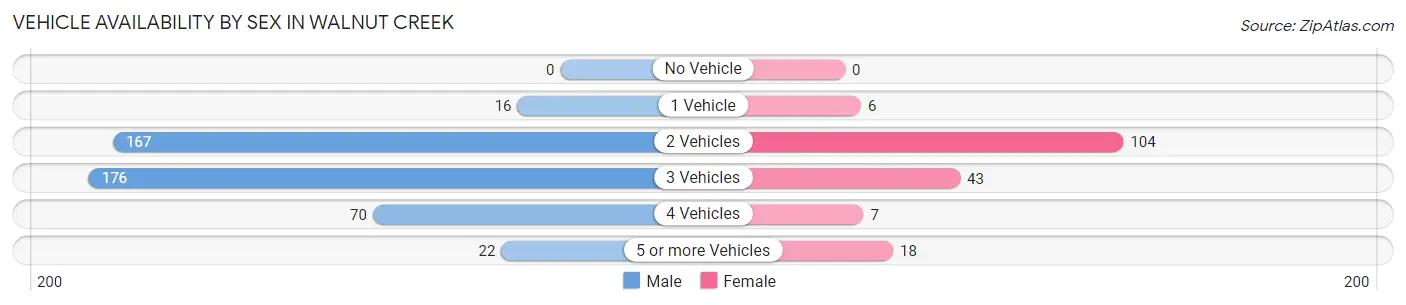
| Vehicles Available | Male | Female |
| No Vehicle | 0 (0.0%) | 0 (0.0%) |
| 1 Vehicle | 16 (3.5%) | 6 (3.4%) |
| 2 Vehicles | 167 (37.0%) | 104 (58.4%) |
| 3 Vehicles | 176 (39.0%) | 43 (24.2%) |
| 4 Vehicles | 70 (15.5%) | 7 (3.9%) |
| 5 or more Vehicles | 22 (4.9%) | 18 (10.1%) |
| Total | 451 (100.0%) | 178 (100.0%) |
Commute Time in Walnut Creek
The most frequently occuring commute durations in Walnut Creek are 15 to 19 minutes (174 commuters, 31.9%), 20 to 24 minutes (114 commuters, 20.9%), and 10 to 14 minutes (104 commuters, 19.1%).
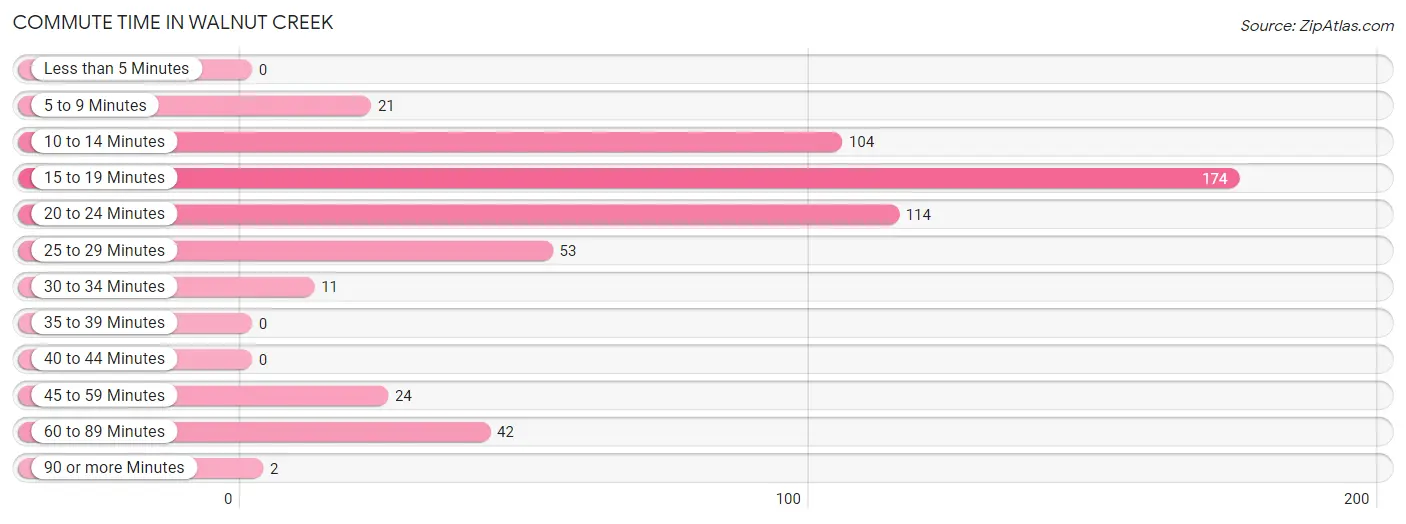
| Commute Time | # Commuters | % Commuters |
| Less than 5 Minutes | 0 | 0.0% |
| 5 to 9 Minutes | 21 | 3.8% |
| 10 to 14 Minutes | 104 | 19.1% |
| 15 to 19 Minutes | 174 | 31.9% |
| 20 to 24 Minutes | 114 | 20.9% |
| 25 to 29 Minutes | 53 | 9.7% |
| 30 to 34 Minutes | 11 | 2.0% |
| 35 to 39 Minutes | 0 | 0.0% |
| 40 to 44 Minutes | 0 | 0.0% |
| 45 to 59 Minutes | 24 | 4.4% |
| 60 to 89 Minutes | 42 | 7.7% |
| 90 or more Minutes | 2 | 0.4% |
Commute Time by Sex in Walnut Creek
The most common commute times in Walnut Creek are 20 to 24 minutes (91 commuters, 24.1%) for males and 15 to 19 minutes (87 commuters, 51.8%) for females.
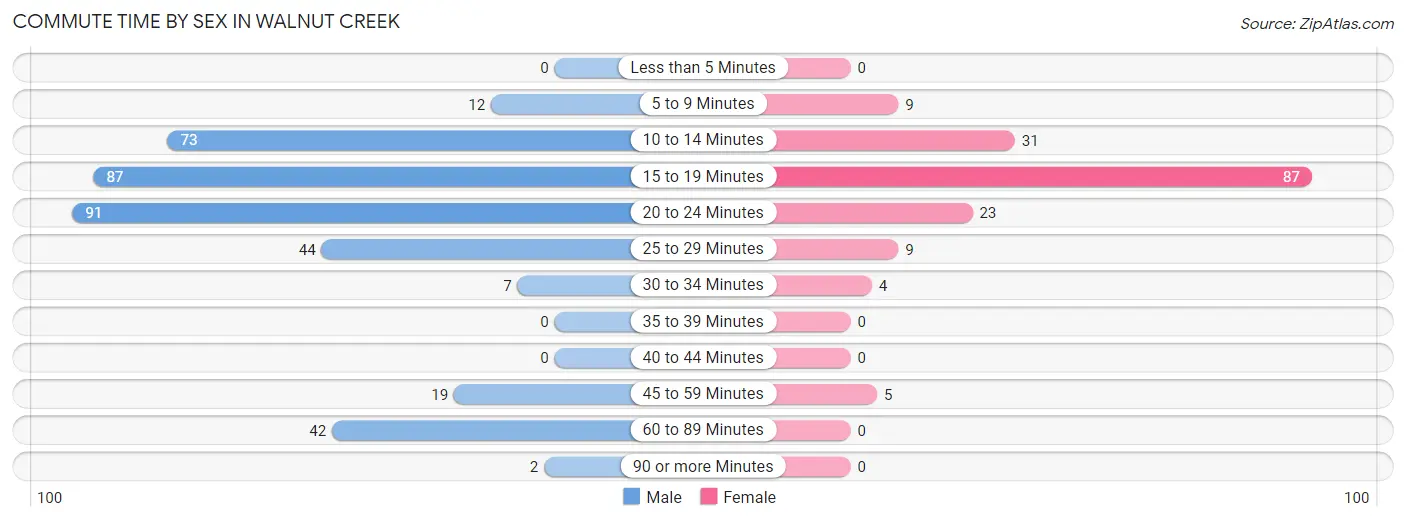
| Commute Time | Male | Female |
| Less than 5 Minutes | 0 (0.0%) | 0 (0.0%) |
| 5 to 9 Minutes | 12 (3.2%) | 9 (5.4%) |
| 10 to 14 Minutes | 73 (19.4%) | 31 (18.4%) |
| 15 to 19 Minutes | 87 (23.1%) | 87 (51.8%) |
| 20 to 24 Minutes | 91 (24.1%) | 23 (13.7%) |
| 25 to 29 Minutes | 44 (11.7%) | 9 (5.4%) |
| 30 to 34 Minutes | 7 (1.9%) | 4 (2.4%) |
| 35 to 39 Minutes | 0 (0.0%) | 0 (0.0%) |
| 40 to 44 Minutes | 0 (0.0%) | 0 (0.0%) |
| 45 to 59 Minutes | 19 (5.0%) | 5 (3.0%) |
| 60 to 89 Minutes | 42 (11.1%) | 0 (0.0%) |
| 90 or more Minutes | 2 (0.5%) | 0 (0.0%) |
Time of Departure to Work by Sex in Walnut Creek
The most frequent times of departure to work in Walnut Creek are 7:30 AM to 7:59 AM (95, 25.2%) for males and 6:30 AM to 6:59 AM (43, 25.6%) for females.
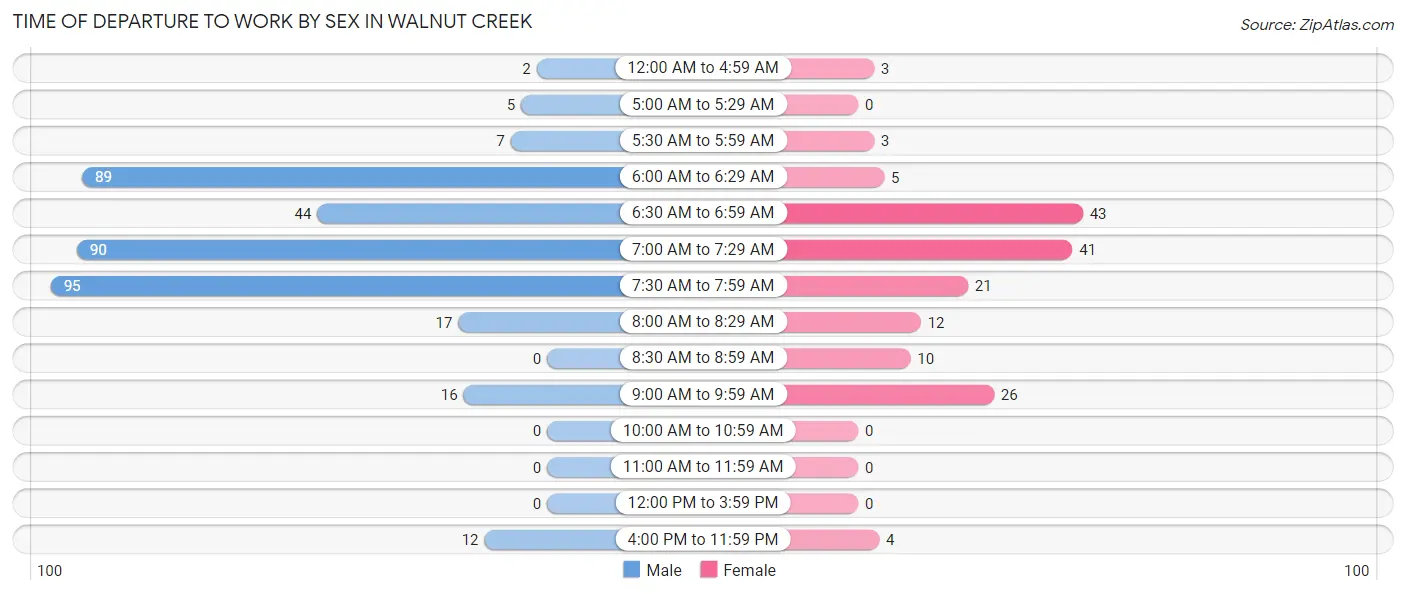
| Time of Departure | Male | Female |
| 12:00 AM to 4:59 AM | 2 (0.5%) | 3 (1.8%) |
| 5:00 AM to 5:29 AM | 5 (1.3%) | 0 (0.0%) |
| 5:30 AM to 5:59 AM | 7 (1.9%) | 3 (1.8%) |
| 6:00 AM to 6:29 AM | 89 (23.6%) | 5 (3.0%) |
| 6:30 AM to 6:59 AM | 44 (11.7%) | 43 (25.6%) |
| 7:00 AM to 7:29 AM | 90 (23.9%) | 41 (24.4%) |
| 7:30 AM to 7:59 AM | 95 (25.2%) | 21 (12.5%) |
| 8:00 AM to 8:29 AM | 17 (4.5%) | 12 (7.1%) |
| 8:30 AM to 8:59 AM | 0 (0.0%) | 10 (5.9%) |
| 9:00 AM to 9:59 AM | 16 (4.2%) | 26 (15.5%) |
| 10:00 AM to 10:59 AM | 0 (0.0%) | 0 (0.0%) |
| 11:00 AM to 11:59 AM | 0 (0.0%) | 0 (0.0%) |
| 12:00 PM to 3:59 PM | 0 (0.0%) | 0 (0.0%) |
| 4:00 PM to 11:59 PM | 12 (3.2%) | 4 (2.4%) |
| Total | 377 (100.0%) | 168 (100.0%) |
Housing Occupancy in Walnut Creek
Occupancy by Ownership in Walnut Creek
Of the total 557 dwellings in Walnut Creek, owner-occupied units account for 492 (88.3%), while renter-occupied units make up 65 (11.7%).
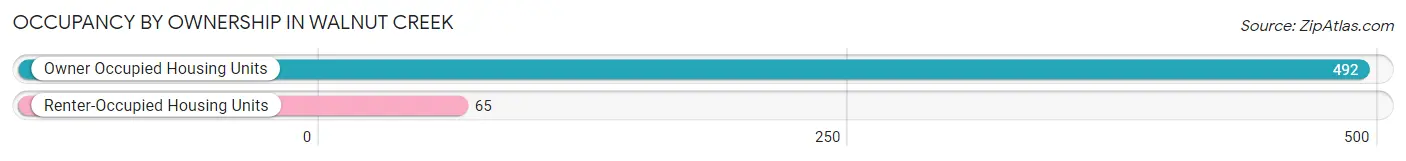
| Occupancy | # Housing Units | % Housing Units |
| Owner Occupied Housing Units | 492 | 88.3% |
| Renter-Occupied Housing Units | 65 | 11.7% |
| Total Occupied Housing Units | 557 | 100.0% |
Occupancy by Household Size in Walnut Creek
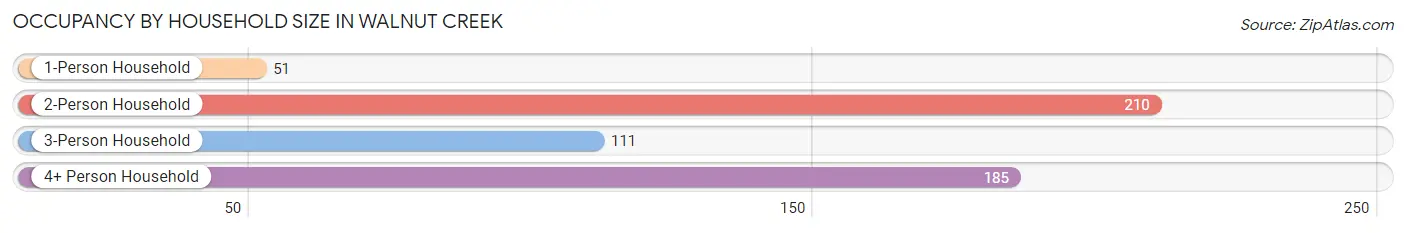
| Household Size | # Housing Units | % Housing Units |
| 1-Person Household | 51 | 9.2% |
| 2-Person Household | 210 | 37.7% |
| 3-Person Household | 111 | 19.9% |
| 4+ Person Household | 185 | 33.2% |
| Total Housing Units | 557 | 100.0% |
Occupancy by Ownership by Household Size in Walnut Creek
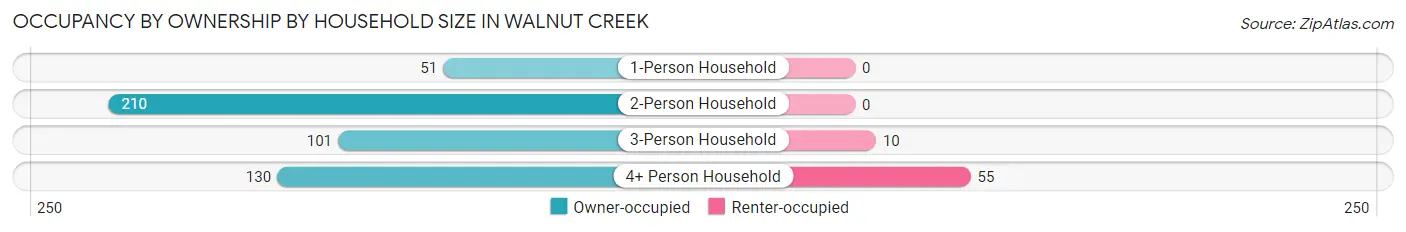
| Household Size | Owner-occupied | Renter-occupied |
| 1-Person Household | 51 (100.0%) | 0 (0.0%) |
| 2-Person Household | 210 (100.0%) | 0 (0.0%) |
| 3-Person Household | 101 (91.0%) | 10 (9.0%) |
| 4+ Person Household | 130 (70.3%) | 55 (29.7%) |
| Total Housing Units | 492 (88.3%) | 65 (11.7%) |
Occupancy by Educational Attainment in Walnut Creek
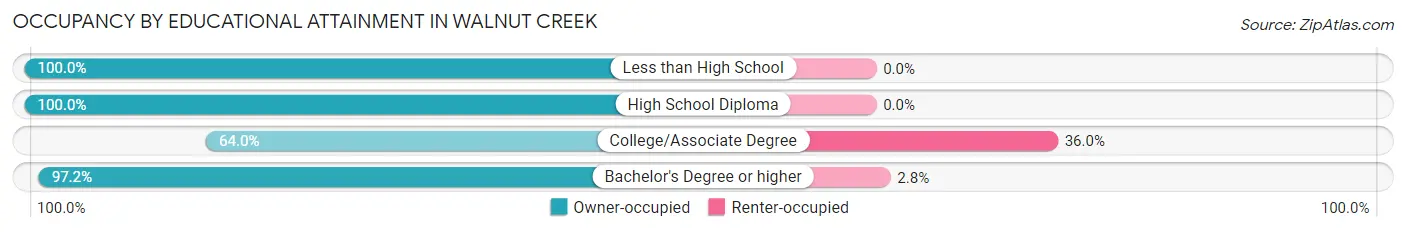
| Household Size | Owner-occupied | Renter-occupied |
| Less than High School | 6 (100.0%) | 0 (0.0%) |
| High School Diploma | 11 (100.0%) | 0 (0.0%) |
| College/Associate Degree | 96 (64.0%) | 54 (36.0%) |
| Bachelor's Degree or higher | 379 (97.2%) | 11 (2.8%) |
Occupancy by Age of Householder in Walnut Creek
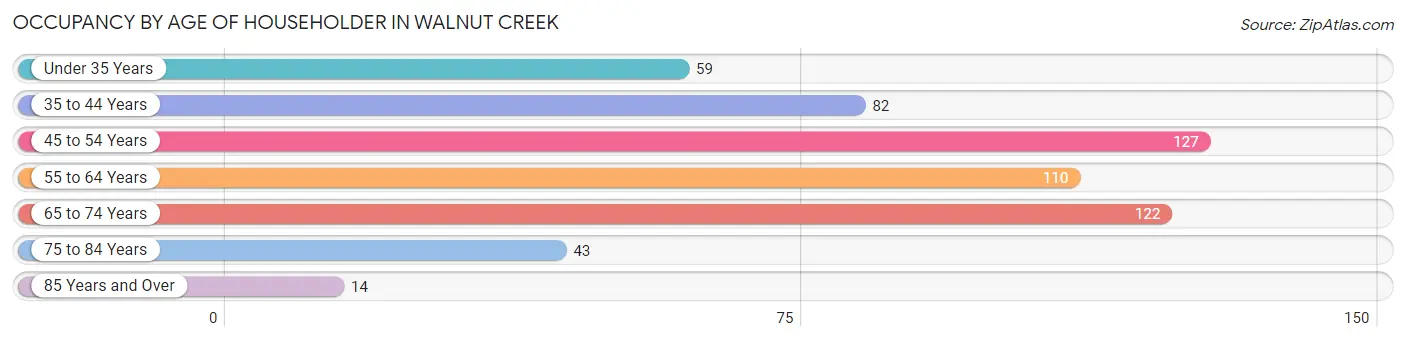
| Age Bracket | # Households | % Households |
| Under 35 Years | 59 | 10.6% |
| 35 to 44 Years | 82 | 14.7% |
| 45 to 54 Years | 127 | 22.8% |
| 55 to 64 Years | 110 | 19.8% |
| 65 to 74 Years | 122 | 21.9% |
| 75 to 84 Years | 43 | 7.7% |
| 85 Years and Over | 14 | 2.5% |
| Total | 557 | 100.0% |
Housing Finances in Walnut Creek
Median Income by Occupancy in Walnut Creek
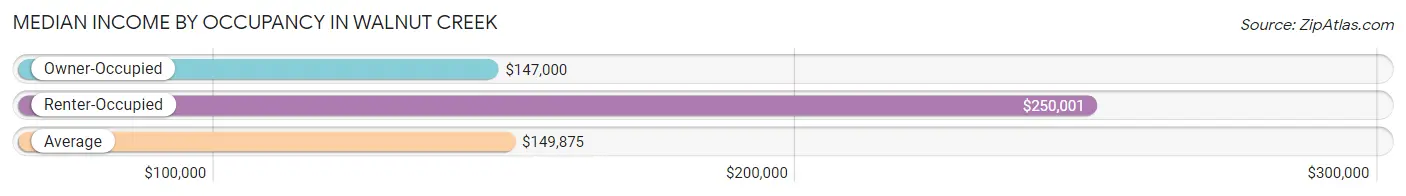
| Occupancy Type | # Households | Median Income |
| Owner-Occupied | 492 (88.3%) | $147,000 |
| Renter-Occupied | 65 (11.7%) | $250,001 |
| Average | 557 (100.0%) | $149,875 |
Occupancy by Householder Income Bracket in Walnut Creek
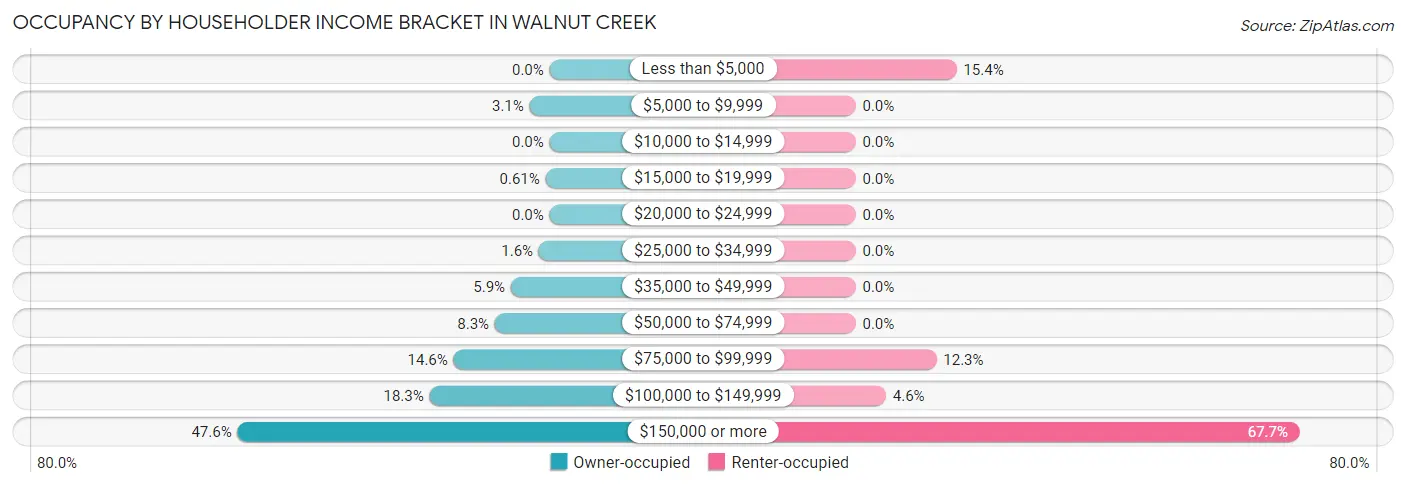
| Income Bracket | Owner-occupied | Renter-occupied |
| Less than $5,000 | 0 (0.0%) | 10 (15.4%) |
| $5,000 to $9,999 | 15 (3.0%) | 0 (0.0%) |
| $10,000 to $14,999 | 0 (0.0%) | 0 (0.0%) |
| $15,000 to $19,999 | 3 (0.6%) | 0 (0.0%) |
| $20,000 to $24,999 | 0 (0.0%) | 0 (0.0%) |
| $25,000 to $34,999 | 8 (1.6%) | 0 (0.0%) |
| $35,000 to $49,999 | 29 (5.9%) | 0 (0.0%) |
| $50,000 to $74,999 | 41 (8.3%) | 0 (0.0%) |
| $75,000 to $99,999 | 72 (14.6%) | 8 (12.3%) |
| $100,000 to $149,999 | 90 (18.3%) | 3 (4.6%) |
| $150,000 or more | 234 (47.6%) | 44 (67.7%) |
| Total | 492 (100.0%) | 65 (100.0%) |
Monthly Housing Cost Tiers in Walnut Creek
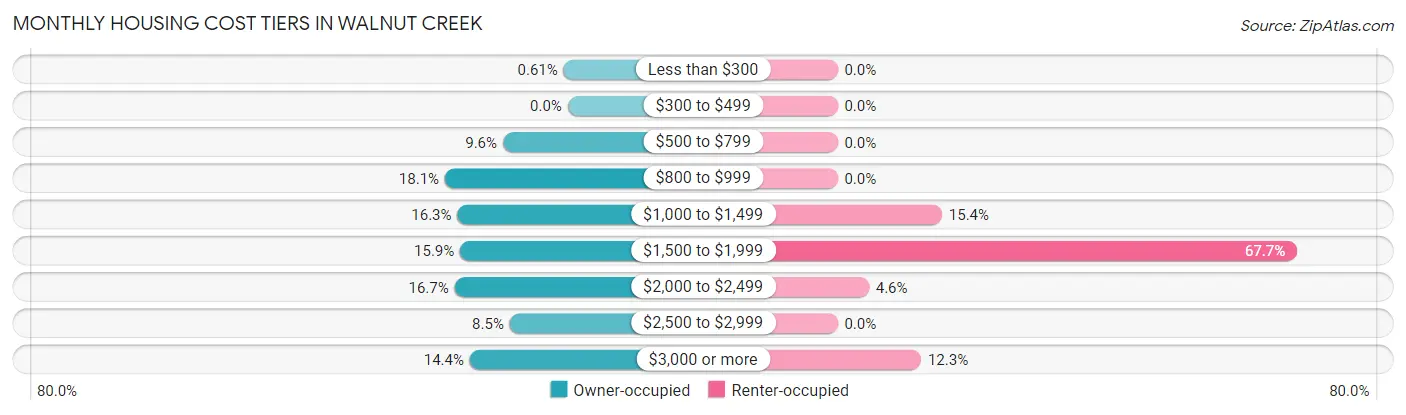
| Monthly Cost | Owner-occupied | Renter-occupied |
| Less than $300 | 3 (0.6%) | 0 (0.0%) |
| $300 to $499 | 0 (0.0%) | 0 (0.0%) |
| $500 to $799 | 47 (9.6%) | 0 (0.0%) |
| $800 to $999 | 89 (18.1%) | 0 (0.0%) |
| $1,000 to $1,499 | 80 (16.3%) | 10 (15.4%) |
| $1,500 to $1,999 | 78 (15.9%) | 44 (67.7%) |
| $2,000 to $2,499 | 82 (16.7%) | 3 (4.6%) |
| $2,500 to $2,999 | 42 (8.5%) | 0 (0.0%) |
| $3,000 or more | 71 (14.4%) | 8 (12.3%) |
| Total | 492 (100.0%) | 65 (100.0%) |
Physical Housing Characteristics in Walnut Creek
Housing Structures in Walnut Creek
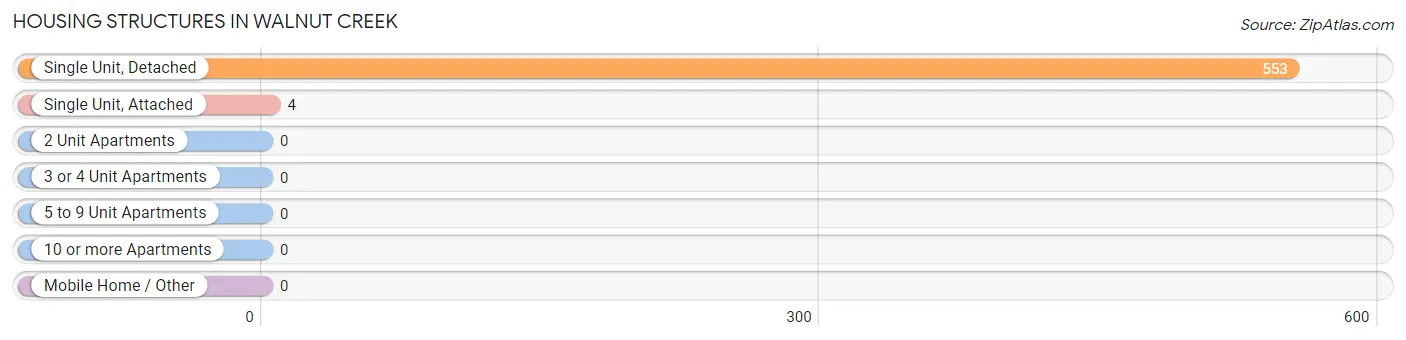
| Structure Type | # Housing Units | % Housing Units |
| Single Unit, Detached | 553 | 99.3% |
| Single Unit, Attached | 4 | 0.7% |
| 2 Unit Apartments | 0 | 0.0% |
| 3 or 4 Unit Apartments | 0 | 0.0% |
| 5 to 9 Unit Apartments | 0 | 0.0% |
| 10 or more Apartments | 0 | 0.0% |
| Mobile Home / Other | 0 | 0.0% |
| Total | 557 | 100.0% |
Housing Structures by Occupancy in Walnut Creek
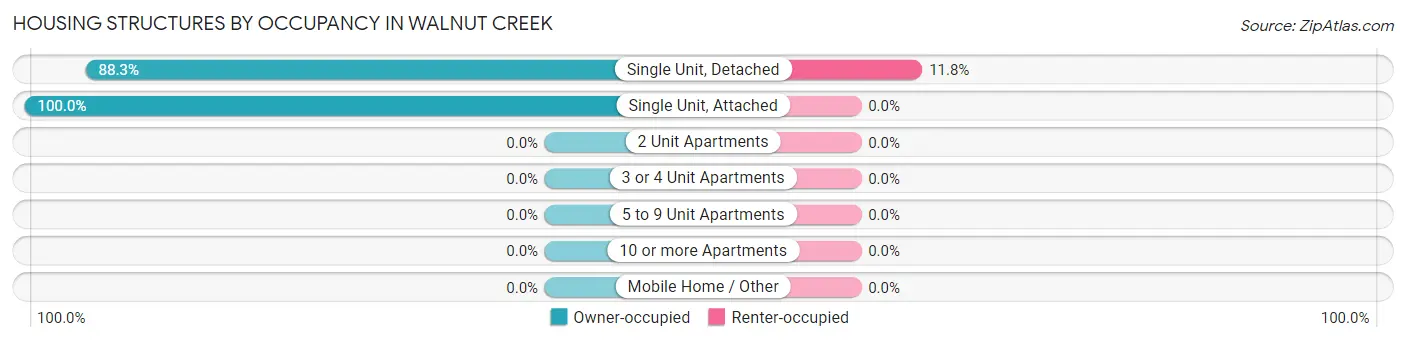
| Structure Type | Owner-occupied | Renter-occupied |
| Single Unit, Detached | 488 (88.2%) | 65 (11.7%) |
| Single Unit, Attached | 4 (100.0%) | 0 (0.0%) |
| 2 Unit Apartments | 0 (0.0%) | 0 (0.0%) |
| 3 or 4 Unit Apartments | 0 (0.0%) | 0 (0.0%) |
| 5 to 9 Unit Apartments | 0 (0.0%) | 0 (0.0%) |
| 10 or more Apartments | 0 (0.0%) | 0 (0.0%) |
| Mobile Home / Other | 0 (0.0%) | 0 (0.0%) |
| Total | 492 (88.3%) | 65 (11.7%) |
Housing Structures by Number of Rooms in Walnut Creek
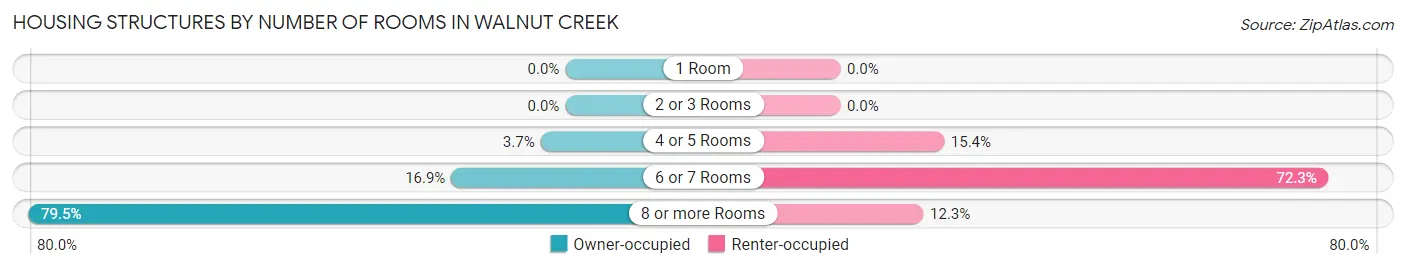
| Number of Rooms | Owner-occupied | Renter-occupied |
| 1 Room | 0 (0.0%) | 0 (0.0%) |
| 2 or 3 Rooms | 0 (0.0%) | 0 (0.0%) |
| 4 or 5 Rooms | 18 (3.7%) | 10 (15.4%) |
| 6 or 7 Rooms | 83 (16.9%) | 47 (72.3%) |
| 8 or more Rooms | 391 (79.5%) | 8 (12.3%) |
| Total | 492 (100.0%) | 65 (100.0%) |
Housing Structure by Heating Type in Walnut Creek
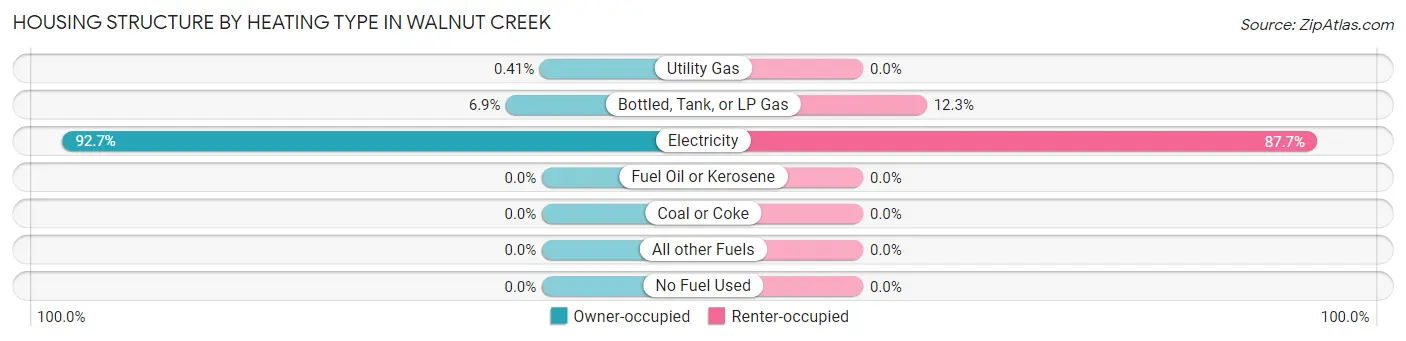
| Heating Type | Owner-occupied | Renter-occupied |
| Utility Gas | 2 (0.4%) | 0 (0.0%) |
| Bottled, Tank, or LP Gas | 34 (6.9%) | 8 (12.3%) |
| Electricity | 456 (92.7%) | 57 (87.7%) |
| Fuel Oil or Kerosene | 0 (0.0%) | 0 (0.0%) |
| Coal or Coke | 0 (0.0%) | 0 (0.0%) |
| All other Fuels | 0 (0.0%) | 0 (0.0%) |
| No Fuel Used | 0 (0.0%) | 0 (0.0%) |
| Total | 492 (100.0%) | 65 (100.0%) |
Household Vehicle Usage in Walnut Creek
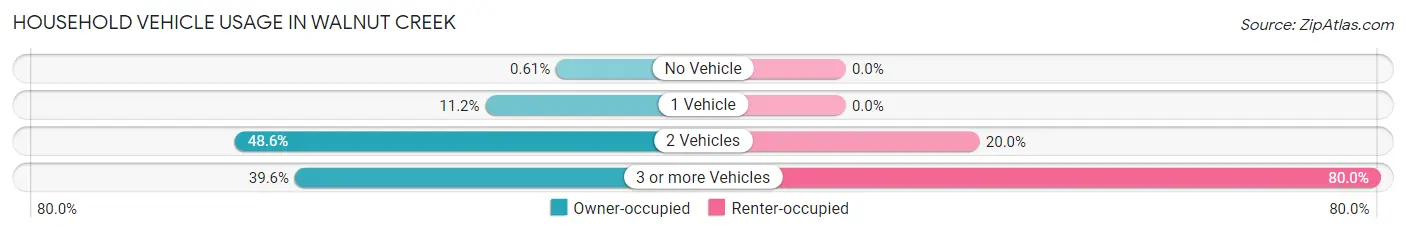
| Vehicles per Household | Owner-occupied | Renter-occupied |
| No Vehicle | 3 (0.6%) | 0 (0.0%) |
| 1 Vehicle | 55 (11.2%) | 0 (0.0%) |
| 2 Vehicles | 239 (48.6%) | 13 (20.0%) |
| 3 or more Vehicles | 195 (39.6%) | 52 (80.0%) |
| Total | 492 (100.0%) | 65 (100.0%) |
Real Estate & Mortgages in Walnut Creek
Real Estate and Mortgage Overview in Walnut Creek
| Characteristic | Without Mortgage | With Mortgage |
| Housing Units | 209 | 283 |
| Median Property Value | $437,500 | $433,100 |
| Median Household Income | $238,750 | $118 |
| Monthly Housing Costs | $939 | $71 |
| Real Estate Taxes | $4,164 | $3 |
Property Value by Mortgage Status in Walnut Creek
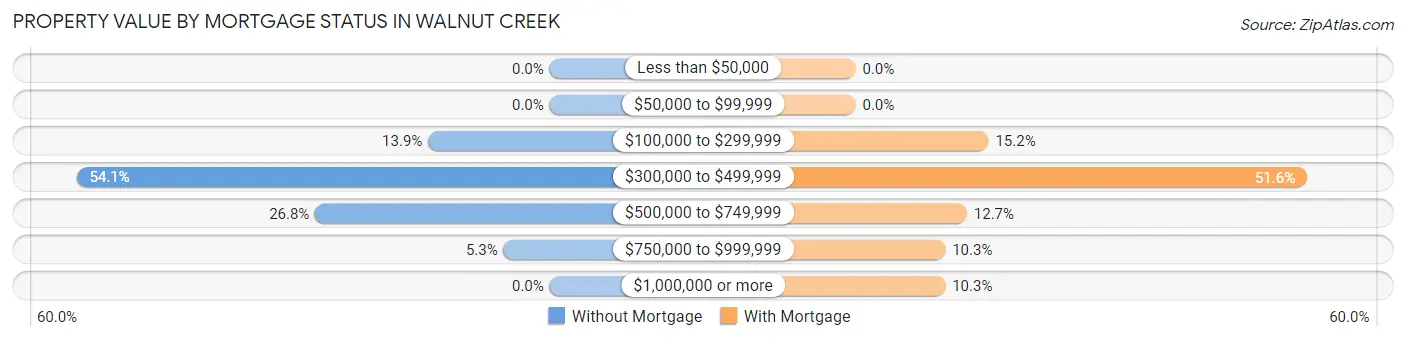
| Property Value | Without Mortgage | With Mortgage |
| Less than $50,000 | 0 (0.0%) | 0 (0.0%) |
| $50,000 to $99,999 | 0 (0.0%) | 0 (0.0%) |
| $100,000 to $299,999 | 29 (13.9%) | 43 (15.2%) |
| $300,000 to $499,999 | 113 (54.1%) | 146 (51.6%) |
| $500,000 to $749,999 | 56 (26.8%) | 36 (12.7%) |
| $750,000 to $999,999 | 11 (5.3%) | 29 (10.2%) |
| $1,000,000 or more | 0 (0.0%) | 29 (10.2%) |
| Total | 209 (100.0%) | 283 (100.0%) |
Household Income by Mortgage Status in Walnut Creek
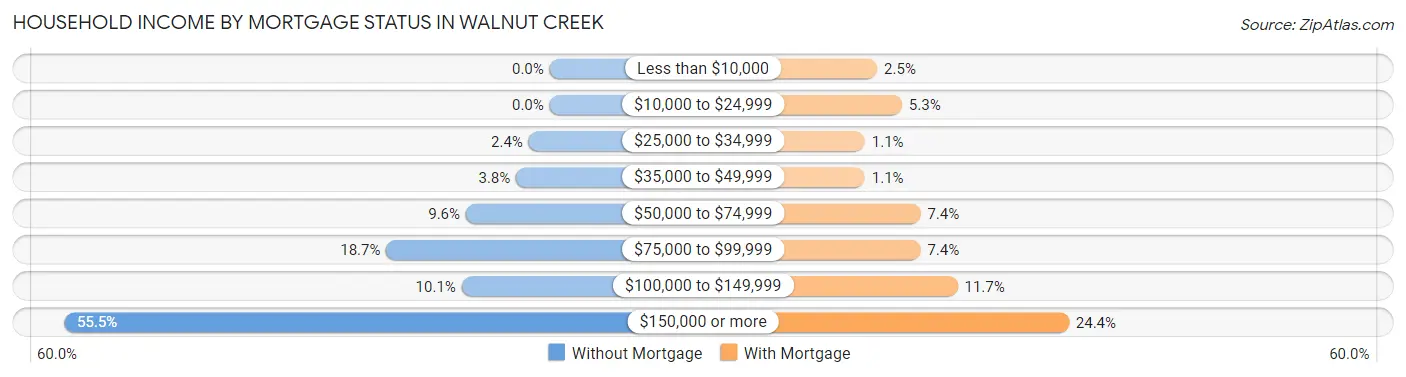
| Household Income | Without Mortgage | With Mortgage |
| Less than $10,000 | 0 (0.0%) | 7 (2.5%) |
| $10,000 to $24,999 | 0 (0.0%) | 15 (5.3%) |
| $25,000 to $34,999 | 5 (2.4%) | 3 (1.1%) |
| $35,000 to $49,999 | 8 (3.8%) | 3 (1.1%) |
| $50,000 to $74,999 | 20 (9.6%) | 21 (7.4%) |
| $75,000 to $99,999 | 39 (18.7%) | 21 (7.4%) |
| $100,000 to $149,999 | 21 (10.1%) | 33 (11.7%) |
| $150,000 or more | 116 (55.5%) | 69 (24.4%) |
| Total | 209 (100.0%) | 283 (100.0%) |
Property Value to Household Income Ratio in Walnut Creek
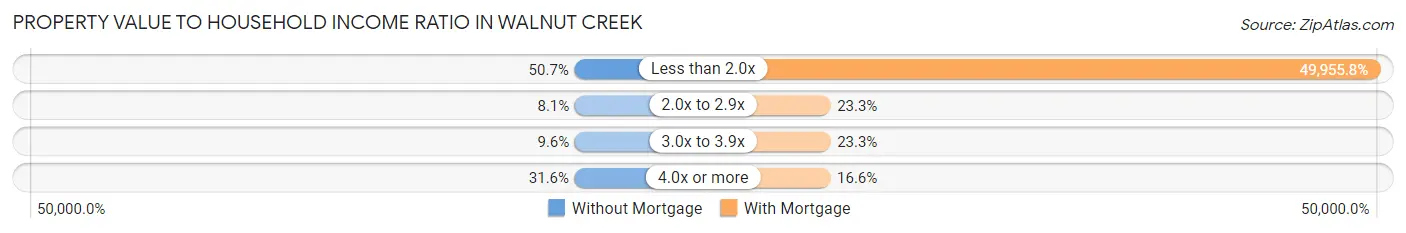
| Value-to-Income Ratio | Without Mortgage | With Mortgage |
| Less than 2.0x | 106 (50.7%) | 141,375 (49,955.8%) |
| 2.0x to 2.9x | 17 (8.1%) | 66 (23.3%) |
| 3.0x to 3.9x | 20 (9.6%) | 66 (23.3%) |
| 4.0x or more | 66 (31.6%) | 47 (16.6%) |
| Total | 209 (100.0%) | 283 (100.0%) |
Real Estate Taxes by Mortgage Status in Walnut Creek
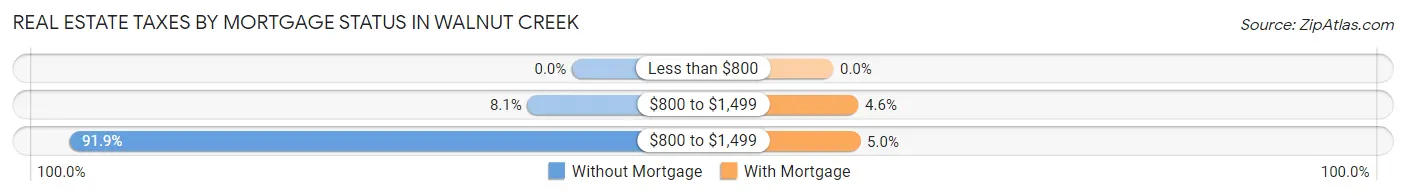
| Property Taxes | Without Mortgage | With Mortgage |
| Less than $800 | 0 (0.0%) | 0 (0.0%) |
| $800 to $1,499 | 17 (8.1%) | 13 (4.6%) |
| $800 to $1,499 | 192 (91.9%) | 14 (5.0%) |
| Total | 209 (100.0%) | 283 (100.0%) |
Health & Disability in Walnut Creek
Health Insurance Coverage by Age in Walnut Creek
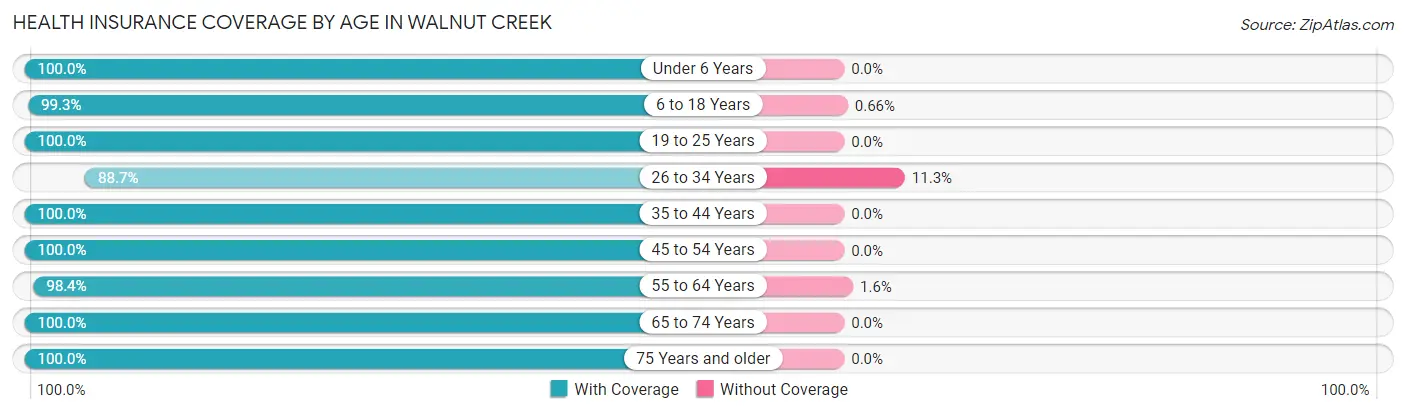
| Age Bracket | With Coverage | Without Coverage |
| Under 6 Years | 118 (100.0%) | 0 (0.0%) |
| 6 to 18 Years | 299 (99.3%) | 2 (0.7%) |
| 19 to 25 Years | 90 (100.0%) | 0 (0.0%) |
| 26 to 34 Years | 102 (88.7%) | 13 (11.3%) |
| 35 to 44 Years | 179 (100.0%) | 0 (0.0%) |
| 45 to 54 Years | 245 (100.0%) | 0 (0.0%) |
| 55 to 64 Years | 240 (98.4%) | 4 (1.6%) |
| 65 to 74 Years | 189 (100.0%) | 0 (0.0%) |
| 75 Years and older | 68 (100.0%) | 0 (0.0%) |
| Total | 1,530 (98.8%) | 19 (1.2%) |
Health Insurance Coverage by Citizenship Status in Walnut Creek
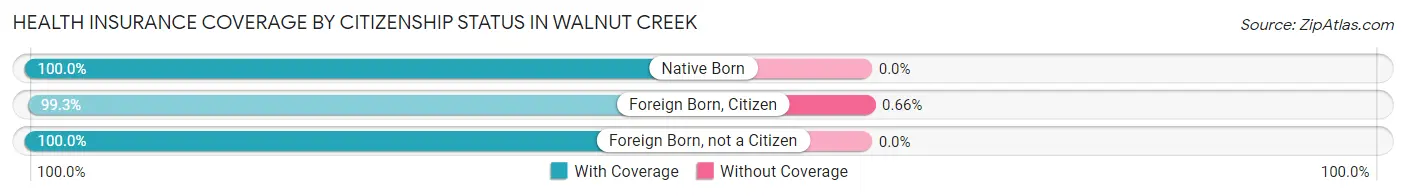
| Citizenship Status | With Coverage | Without Coverage |
| Native Born | 118 (100.0%) | 0 (0.0%) |
| Foreign Born, Citizen | 299 (99.3%) | 2 (0.7%) |
| Foreign Born, not a Citizen | 90 (100.0%) | 0 (0.0%) |
Health Insurance Coverage by Household Income in Walnut Creek
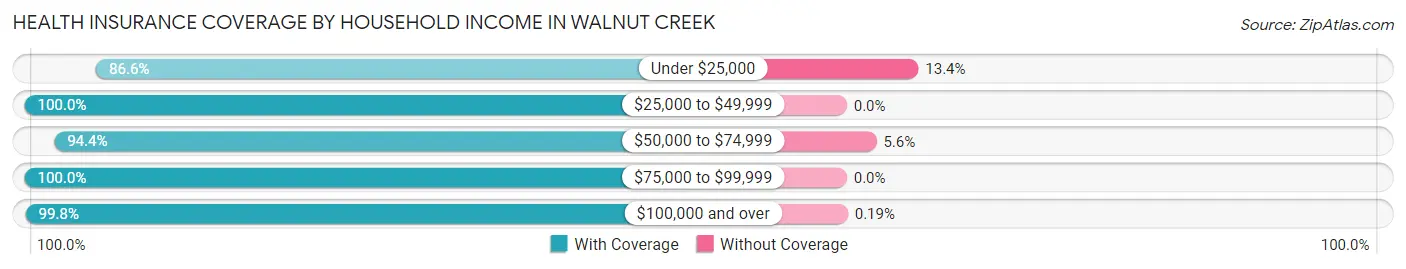
| Household Income | With Coverage | Without Coverage |
| Under $25,000 | 71 (86.6%) | 11 (13.4%) |
| $25,000 to $49,999 | 81 (100.0%) | 0 (0.0%) |
| $50,000 to $74,999 | 102 (94.4%) | 6 (5.6%) |
| $75,000 to $99,999 | 208 (100.0%) | 0 (0.0%) |
| $100,000 and over | 1,068 (99.8%) | 2 (0.2%) |
Public vs Private Health Insurance Coverage by Age in Walnut Creek
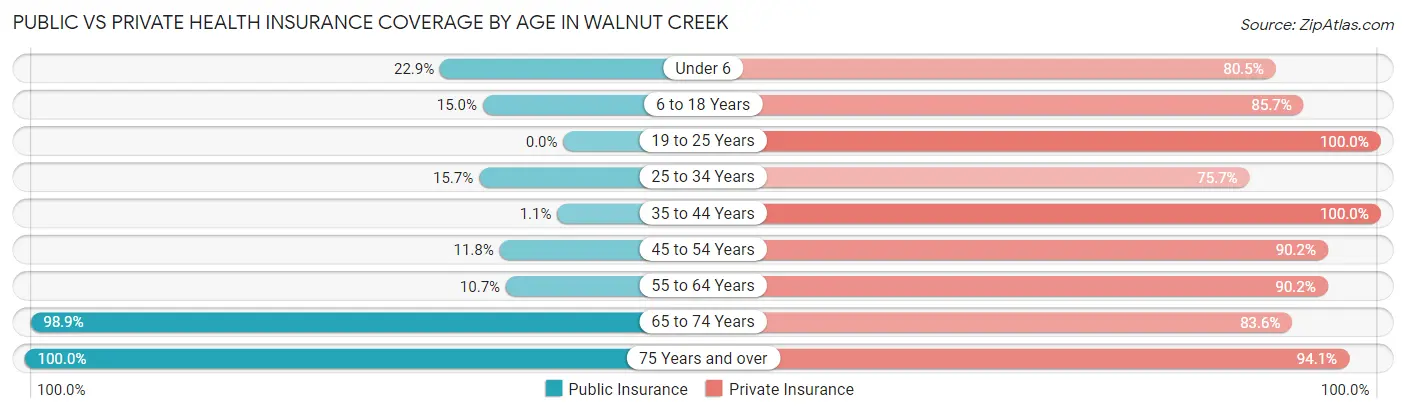
| Age Bracket | Public Insurance | Private Insurance |
| Under 6 | 27 (22.9%) | 95 (80.5%) |
| 6 to 18 Years | 45 (14.9%) | 258 (85.7%) |
| 19 to 25 Years | 0 (0.0%) | 90 (100.0%) |
| 25 to 34 Years | 18 (15.7%) | 87 (75.6%) |
| 35 to 44 Years | 2 (1.1%) | 179 (100.0%) |
| 45 to 54 Years | 29 (11.8%) | 221 (90.2%) |
| 55 to 64 Years | 26 (10.7%) | 220 (90.2%) |
| 65 to 74 Years | 187 (98.9%) | 158 (83.6%) |
| 75 Years and over | 68 (100.0%) | 64 (94.1%) |
| Total | 402 (26.0%) | 1,372 (88.6%) |
Disability Status by Sex by Age in Walnut Creek
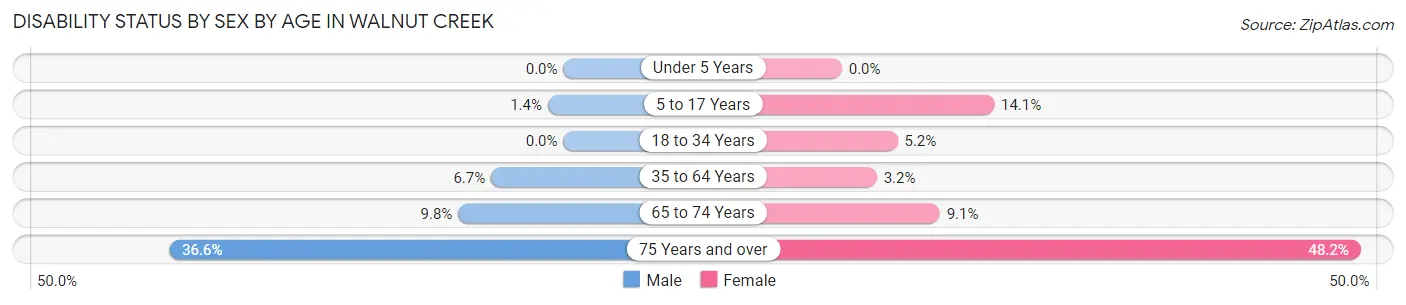
| Age Bracket | Male | Female |
| Under 5 Years | 0 (0.0%) | 0 (0.0%) |
| 5 to 17 Years | 3 (1.4%) | 13 (14.1%) |
| 18 to 34 Years | 0 (0.0%) | 3 (5.2%) |
| 35 to 64 Years | 22 (6.7%) | 11 (3.2%) |
| 65 to 74 Years | 12 (9.8%) | 6 (9.1%) |
| 75 Years and over | 15 (36.6%) | 13 (48.1%) |
Disability Class by Sex by Age in Walnut Creek
Disability Class: Hearing Difficulty
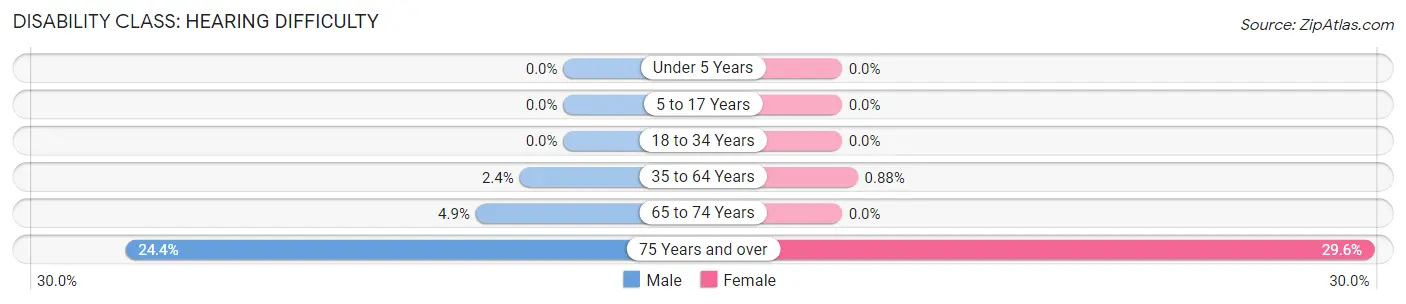
| Age Bracket | Male | Female |
| Under 5 Years | 0 (0.0%) | 0 (0.0%) |
| 5 to 17 Years | 0 (0.0%) | 0 (0.0%) |
| 18 to 34 Years | 0 (0.0%) | 0 (0.0%) |
| 35 to 64 Years | 8 (2.4%) | 3 (0.9%) |
| 65 to 74 Years | 6 (4.9%) | 0 (0.0%) |
| 75 Years and over | 10 (24.4%) | 8 (29.6%) |
Disability Class: Vision Difficulty
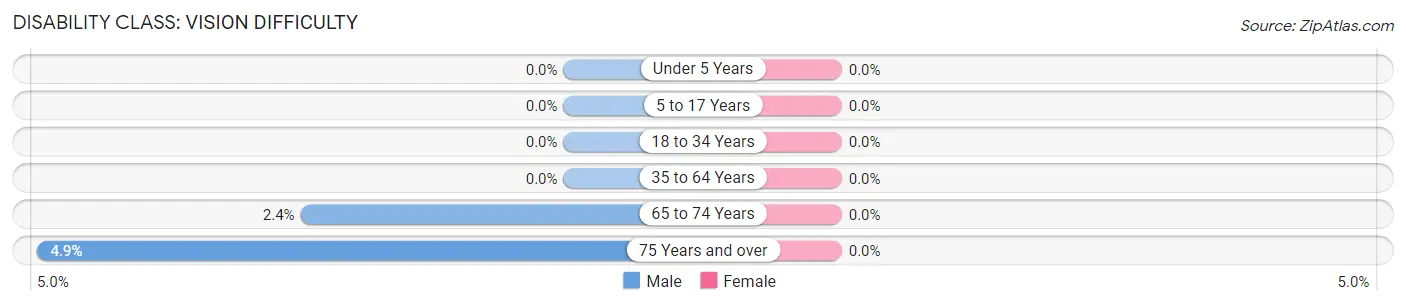
| Age Bracket | Male | Female |
| Under 5 Years | 0 (0.0%) | 0 (0.0%) |
| 5 to 17 Years | 0 (0.0%) | 0 (0.0%) |
| 18 to 34 Years | 0 (0.0%) | 0 (0.0%) |
| 35 to 64 Years | 0 (0.0%) | 0 (0.0%) |
| 65 to 74 Years | 3 (2.4%) | 0 (0.0%) |
| 75 Years and over | 2 (4.9%) | 0 (0.0%) |
Disability Class: Cognitive Difficulty
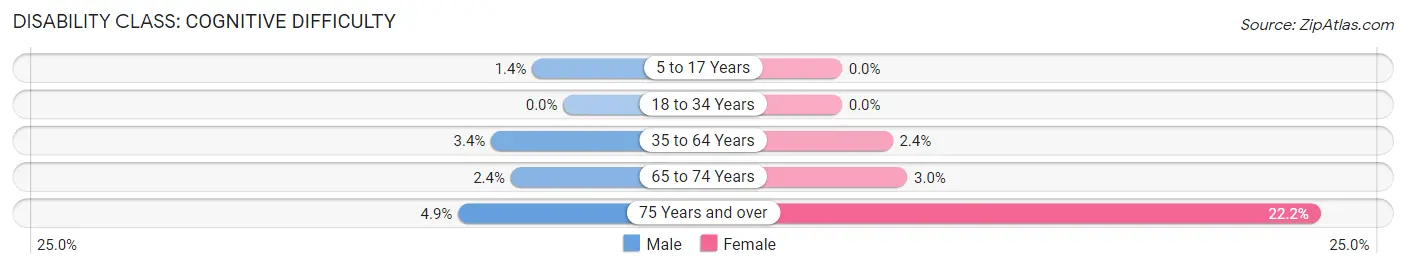
| Age Bracket | Male | Female |
| 5 to 17 Years | 3 (1.4%) | 0 (0.0%) |
| 18 to 34 Years | 0 (0.0%) | 0 (0.0%) |
| 35 to 64 Years | 11 (3.4%) | 8 (2.4%) |
| 65 to 74 Years | 3 (2.4%) | 2 (3.0%) |
| 75 Years and over | 2 (4.9%) | 6 (22.2%) |
Disability Class: Ambulatory Difficulty
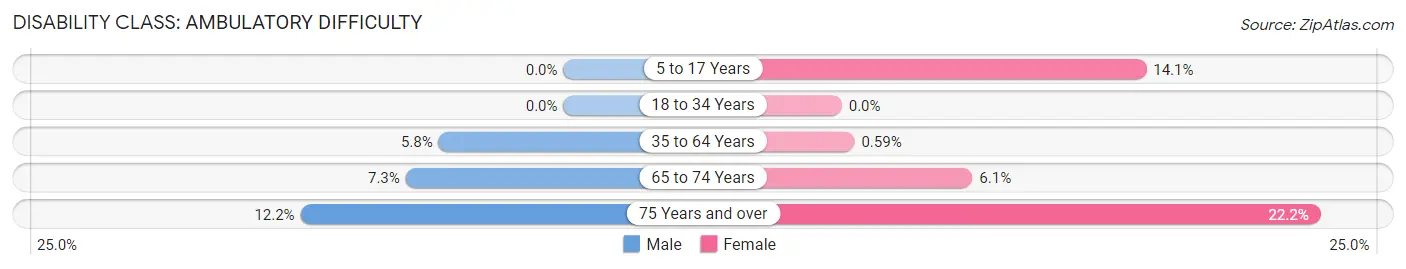
| Age Bracket | Male | Female |
| 5 to 17 Years | 0 (0.0%) | 13 (14.1%) |
| 18 to 34 Years | 0 (0.0%) | 0 (0.0%) |
| 35 to 64 Years | 19 (5.8%) | 2 (0.6%) |
| 65 to 74 Years | 9 (7.3%) | 4 (6.1%) |
| 75 Years and over | 5 (12.2%) | 6 (22.2%) |
Disability Class: Self-Care Difficulty
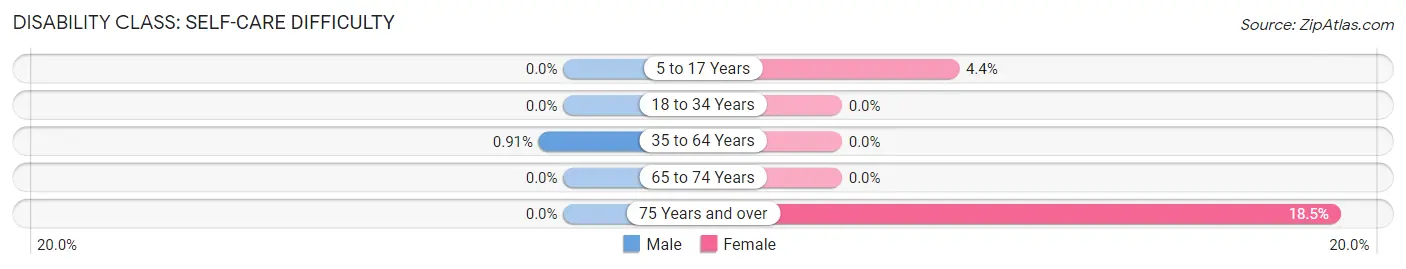
| Age Bracket | Male | Female |
| 5 to 17 Years | 0 (0.0%) | 4 (4.3%) |
| 18 to 34 Years | 0 (0.0%) | 0 (0.0%) |
| 35 to 64 Years | 3 (0.9%) | 0 (0.0%) |
| 65 to 74 Years | 0 (0.0%) | 0 (0.0%) |
| 75 Years and over | 0 (0.0%) | 5 (18.5%) |
Technology Access in Walnut Creek
Computing Device Access in Walnut Creek
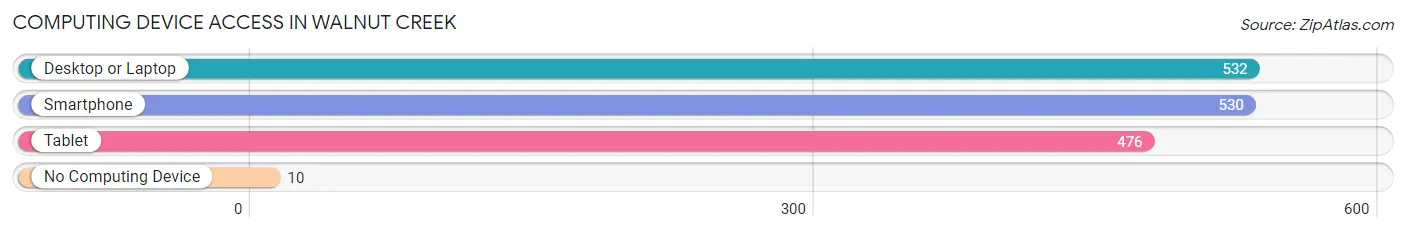
| Device Type | # Households | % Households |
| Desktop or Laptop | 532 | 95.5% |
| Smartphone | 530 | 95.2% |
| Tablet | 476 | 85.5% |
| No Computing Device | 10 | 1.8% |
| Total | 557 | 100.0% |
Internet Access in Walnut Creek
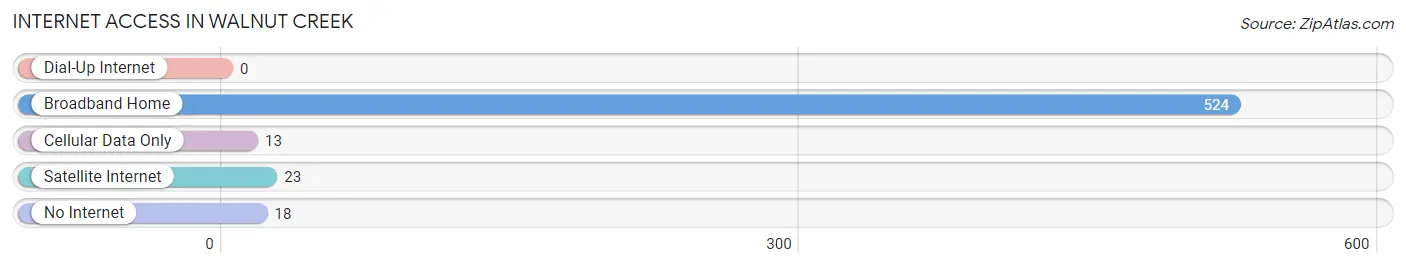
| Internet Type | # Households | % Households |
| Dial-Up Internet | 0 | 0.0% |
| Broadband Home | 524 | 94.1% |
| Cellular Data Only | 13 | 2.3% |
| Satellite Internet | 23 | 4.1% |
| No Internet | 18 | 3.2% |
| Total | 557 | 100.0% |
Walnut Creek Summary
Walnut Creek is a small town located in the state of North Carolina, in the United States. It is situated in the foothills of the Blue Ridge Mountains, in the Yadkin Valley region of the state. The town is located in the county of Wilkes, and is part of the North Wilkesboro Micropolitan Statistical Area. The population of Walnut Creek was estimated to be 1,845 in the year 2020.
Geography
Walnut Creek is located in the foothills of the Blue Ridge Mountains, in the Yadkin Valley region of North Carolina. The town is situated in Wilkes County, and is part of the North Wilkesboro Micropolitan Statistical Area. The town is located at an elevation of 1,068 feet above sea level. The town is located at the intersection of US Highway 421 and NC Highway 268. The town is located approximately 30 miles north of Winston-Salem, and approximately 50 miles south of Boone.
The town is located in a rural area, and is surrounded by rolling hills and farmland. The town is located near the Yadkin River, and is also close to the Blue Ridge Parkway. The town is located in a temperate climate, with hot summers and cold winters.
History
Walnut Creek was founded in 1845 by a group of settlers from Wilkes County. The town was named after the nearby creek, which was named for the abundance of walnut trees in the area. The town was originally a farming community, and the main crops grown in the area were corn, wheat, and tobacco.
In the late 19th century, the town began to grow and develop. The town was incorporated in 1891, and the first mayor was elected in 1892. The town was home to several businesses, including a general store, a blacksmith shop, and a grist mill.
In the early 20th century, the town began to experience a period of growth and development. The town was home to several factories, including a cotton mill, a furniture factory, and a canning factory. The town also had a railroad station, which connected the town to the larger cities in the region.
Economy
The economy of Walnut Creek is largely based on agriculture and manufacturing. The town is home to several farms, which produce a variety of crops, including corn, wheat, and tobacco. The town is also home to several factories, which produce furniture, canned goods, and other products.
The town is also home to several small businesses, including restaurants, shops, and other services. The town is also home to several tourist attractions, including the Yadkin Valley Wine Trail, the Yadkin Valley Scenic Byway, and the Blue Ridge Parkway.
Demographics
The population of Walnut Creek was estimated to be 1,845 in the year 2020. The town has a population that is predominantly white, with a small percentage of African Americans and Hispanics. The median household income in the town is $37,000, and the median home value is $150,000. The town has a poverty rate of 16.3%, which is higher than the national average.
Conclusion
Walnut Creek is a small town located in the foothills of the Blue Ridge Mountains, in the Yadkin Valley region of North Carolina. The town was founded in 1845, and has a population of 1,845 as of 2020. The town has a largely agricultural and manufacturing-based economy, and is home to several tourist attractions. The town has a predominantly white population, with a small percentage of African Americans and Hispanics. The median household income in the town is $37,000, and the median home value is $150,000.
Common Questions
What is Per Capita Income in Walnut Creek?
Per Capita income in Walnut Creek is $84,712.
What is the Median Family Income in Walnut Creek?
Median Family Income in Walnut Creek is $178,000.
What is the Median Household income in Walnut Creek?
Median Household Income in Walnut Creek is $149,875.
What is Income or Wage Gap in Walnut Creek?
Income or Wage Gap in Walnut Creek is 14.9%.
Women in Walnut Creek earn 85.1 cents for every dollar earned by a man.
What is Inequality or Gini Index in Walnut Creek?
Inequality or Gini Index in Walnut Creek is 0.46.
What is the Total Population of Walnut Creek?
Total Population of Walnut Creek is 1,570.
What is the Total Male Population of Walnut Creek?
Total Male Population of Walnut Creek is 941.
What is the Total Female Population of Walnut Creek?
Total Female Population of Walnut Creek is 629.
What is the Ratio of Males per 100 Females in Walnut Creek?
There are 149.60 Males per 100 Females in Walnut Creek.
What is the Ratio of Females per 100 Males in Walnut Creek?
There are 66.84 Females per 100 Males in Walnut Creek.
What is the Median Population Age in Walnut Creek?
Median Population Age in Walnut Creek is 44.2 Years.
What is the Average Family Size in Walnut Creek
Average Family Size in Walnut Creek is 3.0 People.
What is the Average Household Size in Walnut Creek
Average Household Size in Walnut Creek is 2.8 People.
How Large is the Labor Force in Walnut Creek?
There are 691 People in the Labor Forcein in Walnut Creek.
What is the Percentage of People in the Labor Force in Walnut Creek?
57.0% of People are in the Labor Force in Walnut Creek.
What is the Unemployment Rate in Walnut Creek?
Unemployment Rate in Walnut Creek is 2.4%.