Pine Knoll Shores, NC Map & Demographics
Pine Knoll Shores Map
Pine Knoll Shores Overview
$69,925
PER CAPITA INCOME
$115,000
AVG FAMILY INCOME
$92,656
AVG HOUSEHOLD INCOME
13.8%
WAGE / INCOME GAP [ % ]
86.2¢/ $1
WAGE / INCOME GAP [ $ ]
0.49
INEQUALITY / GINI INDEX
1,363
TOTAL POPULATION
673
MALE POPULATION
690
FEMALE POPULATION
97.54
MALES / 100 FEMALES
102.53
FEMALES / 100 MALES
66.0
MEDIAN AGE
2.3
AVG FAMILY SIZE
2.0
AVG HOUSEHOLD SIZE
466
LABOR FORCE [ PEOPLE ]
37.3%
PERCENT IN LABOR FORCE
3.3%
UNEMPLOYMENT RATE
Income in Pine Knoll Shores
Income Overview in Pine Knoll Shores
Per Capita Income in Pine Knoll Shores is $69,925, while median incomes of families and households are $115,000 and $92,656 respectively.
| Characteristic | Number | Measure |
| Per Capita Income | 1,363 | $69,925 |
| Median Family Income | 508 | $115,000 |
| Mean Family Income | 508 | $159,507 |
| Median Household Income | 691 | $92,656 |
| Mean Household Income | 691 | $136,890 |
| Income Deficit | 508 | $0 |
| Wage / Income Gap (%) | 1,363 | 13.78% |
| Wage / Income Gap ($) | 1,363 | 86.22¢ per $1 |
| Gini / Inequality Index | 1,363 | 0.49 |
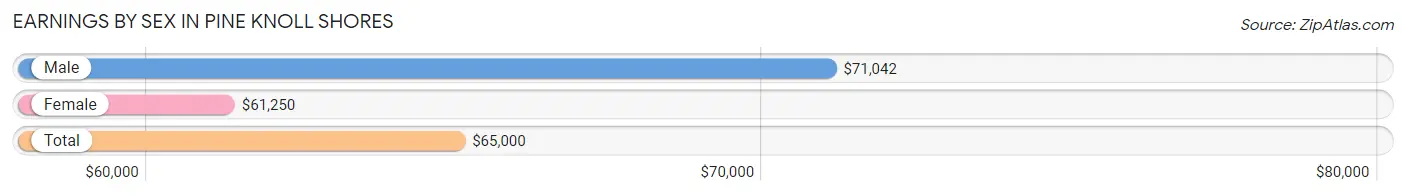
Earnings by Sex in Pine Knoll Shores
Average Earnings in Pine Knoll Shores are $65,000, $71,042 for men and $61,250 for women, a difference of 13.8%.
| Sex | Number | Average Earnings |
| Male | 306 (59.3%) | $71,042 |
| Female | 210 (40.7%) | $61,250 |
| Total | 516 (100.0%) | $65,000 |
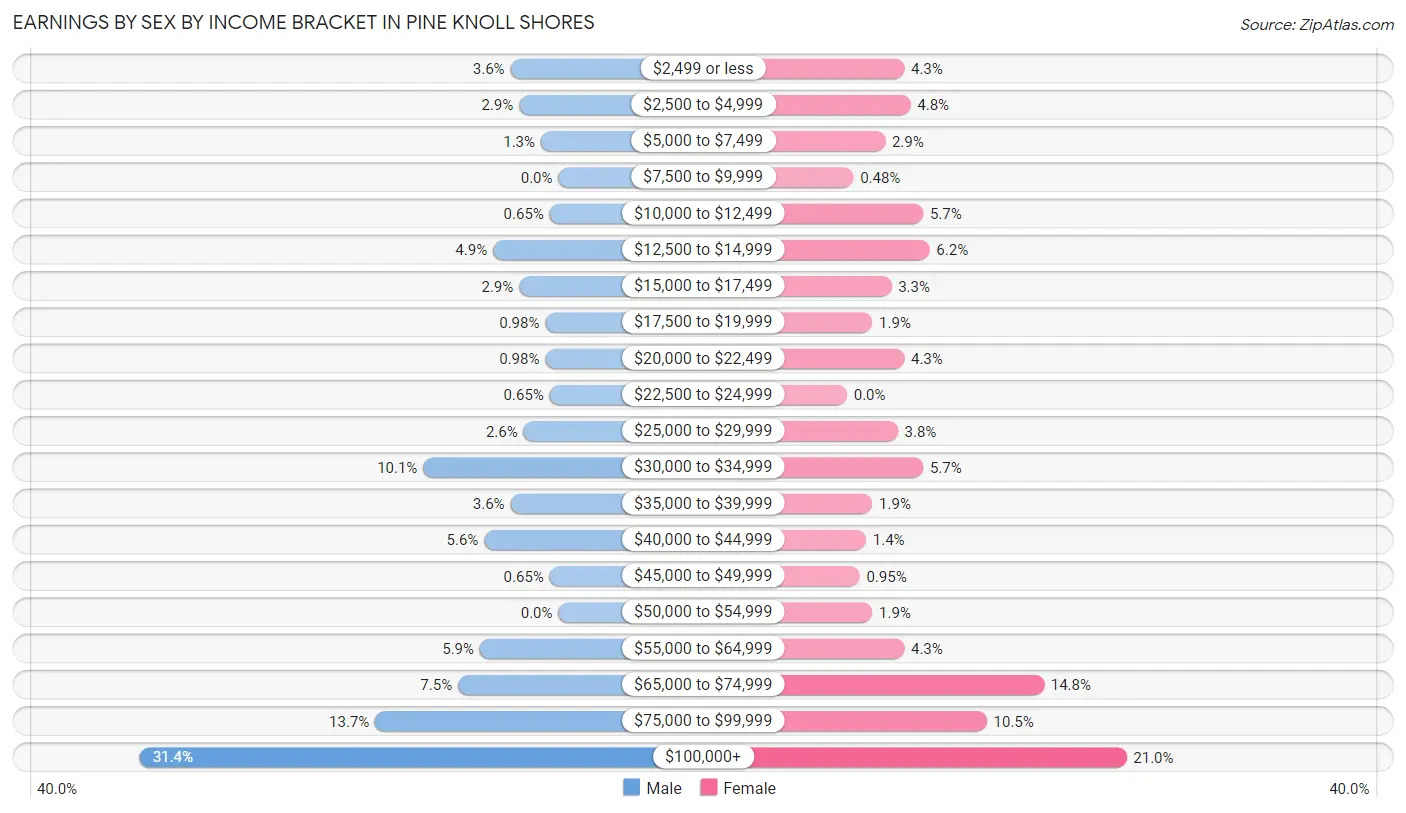
Earnings by Sex by Income Bracket in Pine Knoll Shores
The most common earnings brackets in Pine Knoll Shores are $100,000+ for men (96 | 31.4%) and $100,000+ for women (44 | 20.9%).
| Income | Male | Female |
| $2,499 or less | 11 (3.6%) | 9 (4.3%) |
| $2,500 to $4,999 | 9 (2.9%) | 10 (4.8%) |
| $5,000 to $7,499 | 4 (1.3%) | 6 (2.9%) |
| $7,500 to $9,999 | 0 (0.0%) | 1 (0.5%) |
| $10,000 to $12,499 | 2 (0.6%) | 12 (5.7%) |
| $12,500 to $14,999 | 15 (4.9%) | 13 (6.2%) |
| $15,000 to $17,499 | 9 (2.9%) | 7 (3.3%) |
| $17,500 to $19,999 | 3 (1.0%) | 4 (1.9%) |
| $20,000 to $22,499 | 3 (1.0%) | 9 (4.3%) |
| $22,500 to $24,999 | 2 (0.6%) | 0 (0.0%) |
| $25,000 to $29,999 | 8 (2.6%) | 8 (3.8%) |
| $30,000 to $34,999 | 31 (10.1%) | 12 (5.7%) |
| $35,000 to $39,999 | 11 (3.6%) | 4 (1.9%) |
| $40,000 to $44,999 | 17 (5.6%) | 3 (1.4%) |
| $45,000 to $49,999 | 2 (0.6%) | 2 (0.9%) |
| $50,000 to $54,999 | 0 (0.0%) | 4 (1.9%) |
| $55,000 to $64,999 | 18 (5.9%) | 9 (4.3%) |
| $65,000 to $74,999 | 23 (7.5%) | 31 (14.8%) |
| $75,000 to $99,999 | 42 (13.7%) | 22 (10.5%) |
| $100,000+ | 96 (31.4%) | 44 (20.9%) |
| Total | 306 (100.0%) | 210 (100.0%) |
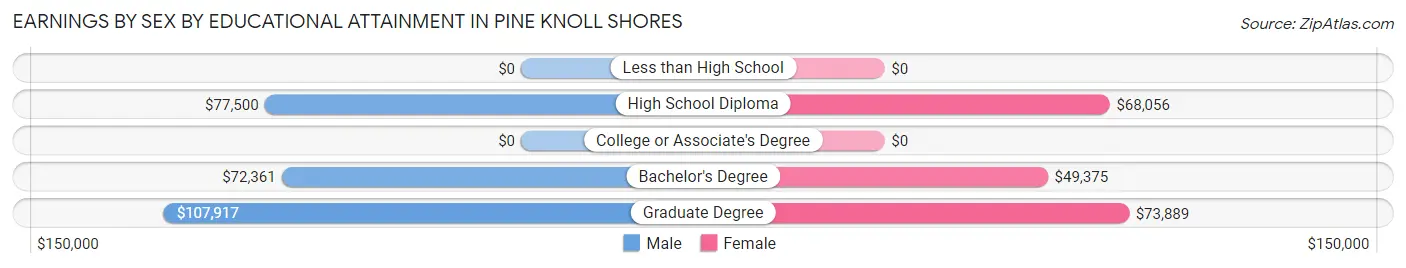
Earnings by Sex by Educational Attainment in Pine Knoll Shores
Average earnings in Pine Knoll Shores are $71,771 for men and $63,214 for women, a difference of 11.9%. Men with an educational attainment of graduate degree enjoy the highest average annual earnings of $107,917, while those with bachelor's degree education earn the least with $72,361. Women with an educational attainment of graduate degree earn the most with the average annual earnings of $73,889, while those with bachelor's degree education have the smallest earnings of $49,375.
| Educational Attainment | Male Income | Female Income |
| Less than High School | - | - |
| High School Diploma | $77,500 | $68,056 |
| College or Associate's Degree | - | - |
| Bachelor's Degree | $72,361 | $49,375 |
| Graduate Degree | $107,917 | $73,889 |
| Total | $71,771 | $63,214 |
Family Income in Pine Knoll Shores
Family Income Brackets in Pine Knoll Shores
According to the Pine Knoll Shores family income data, there are 120 families falling into the $200,000+ income range, which is the most common income bracket and makes up 23.6% of all families. Conversely, the $10,000 to $14,999 income bracket is the least frequent group with only 3 families (0.6%) belonging to this category.
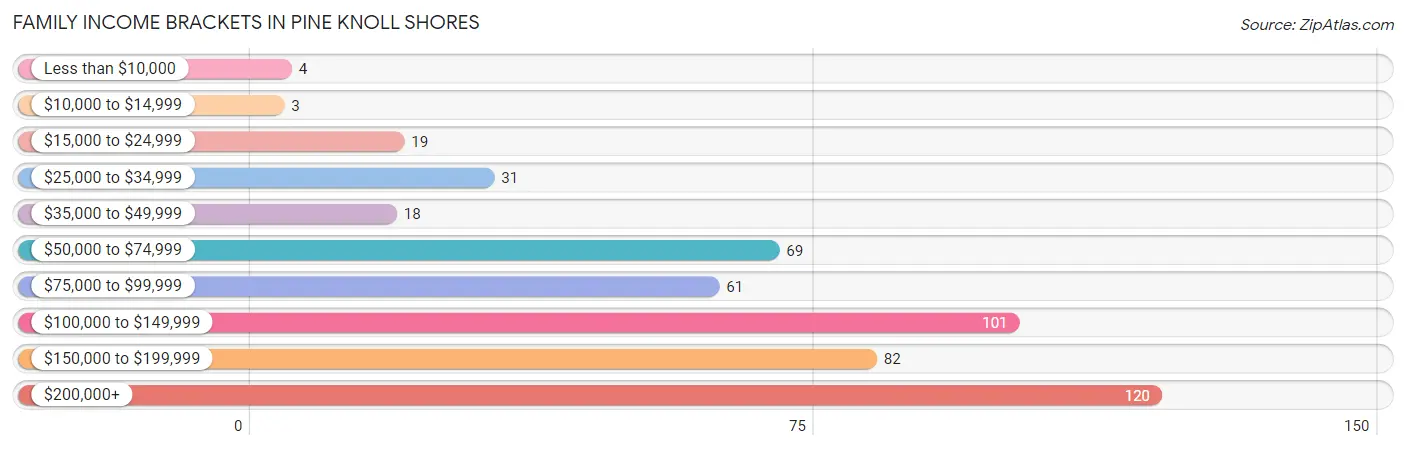
| Income Bracket | # Families | % Families |
| Less than $10,000 | 4 | 0.8% |
| $10,000 to $14,999 | 3 | 0.6% |
| $15,000 to $24,999 | 19 | 3.7% |
| $25,000 to $34,999 | 31 | 6.1% |
| $35,000 to $49,999 | 18 | 3.5% |
| $50,000 to $74,999 | 69 | 13.6% |
| $75,000 to $99,999 | 61 | 12.0% |
| $100,000 to $149,999 | 101 | 19.9% |
| $150,000 to $199,999 | 82 | 16.1% |
| $200,000+ | 120 | 23.6% |
Family Income by Famaliy Size in Pine Knoll Shores
3-person families (42 | 8.3%) account for the highest median family income in Pine Knoll Shores with $153,333 per family, while 2-person families (422 | 83.1%) have the highest median income of $53,334 per family member.
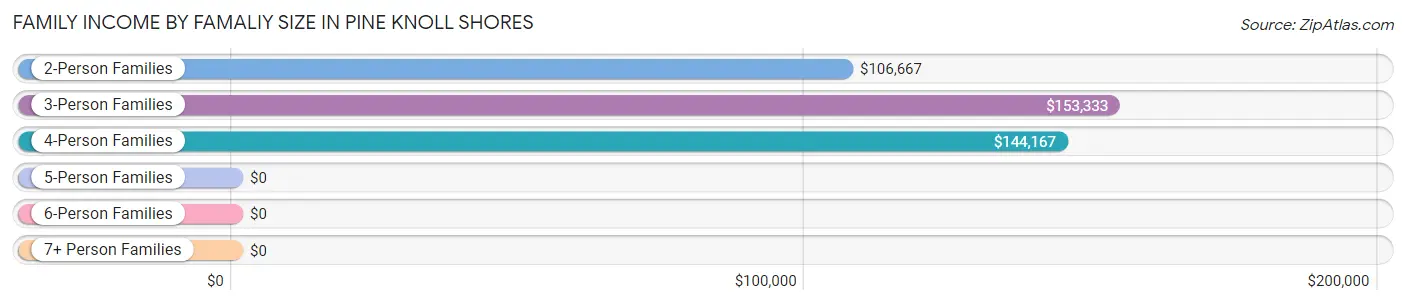
| Income Bracket | # Families | Median Income |
| 2-Person Families | 422 (83.1%) | $106,667 |
| 3-Person Families | 42 (8.3%) | $153,333 |
| 4-Person Families | 34 (6.7%) | $144,167 |
| 5-Person Families | 7 (1.4%) | $0 |
| 6-Person Families | 0 (0.0%) | $0 |
| 7+ Person Families | 3 (0.6%) | $0 |
| Total | 508 (100.0%) | $115,000 |
Family Income by Number of Earners in Pine Knoll Shores
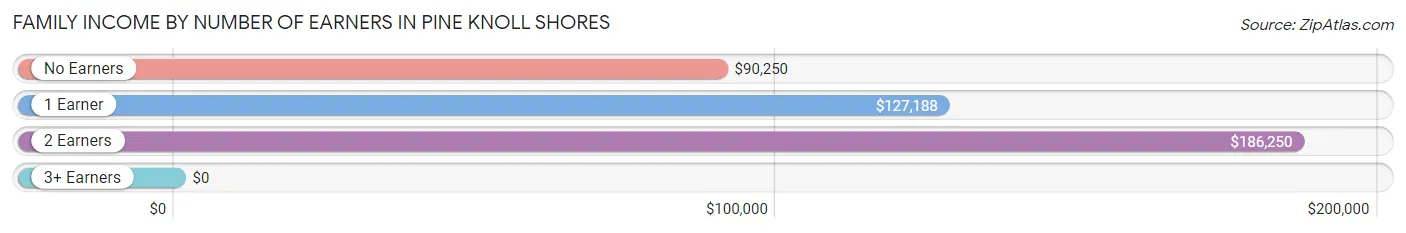
| Number of Earners | # Families | Median Income |
| No Earners | 251 (49.4%) | $90,250 |
| 1 Earner | 111 (21.8%) | $127,188 |
| 2 Earners | 132 (26.0%) | $186,250 |
| 3+ Earners | 14 (2.8%) | $0 |
| Total | 508 (100.0%) | $115,000 |
Household Income in Pine Knoll Shores
Household Income Brackets in Pine Knoll Shores
With 131 households falling in the category, the $200,000+ income range is the most frequent in Pine Knoll Shores, accounting for 19.0% of all households. In contrast, only 3 households (0.4%) fall into the $10,000 to $14,999 income bracket, making it the least populous group.
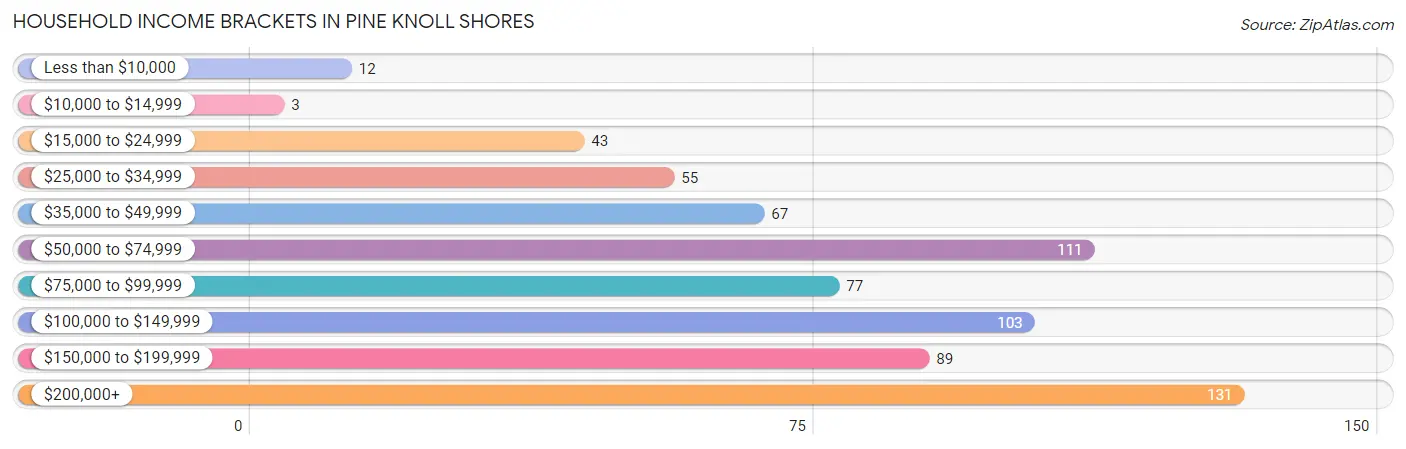
| Income Bracket | # Households | % Households |
| Less than $10,000 | 12 | 1.7% |
| $10,000 to $14,999 | 3 | 0.4% |
| $15,000 to $24,999 | 43 | 6.2% |
| $25,000 to $34,999 | 55 | 8.0% |
| $35,000 to $49,999 | 67 | 9.7% |
| $50,000 to $74,999 | 111 | 16.1% |
| $75,000 to $99,999 | 77 | 11.1% |
| $100,000 to $149,999 | 103 | 14.9% |
| $150,000 to $199,999 | 89 | 12.9% |
| $200,000+ | 131 | 19.0% |
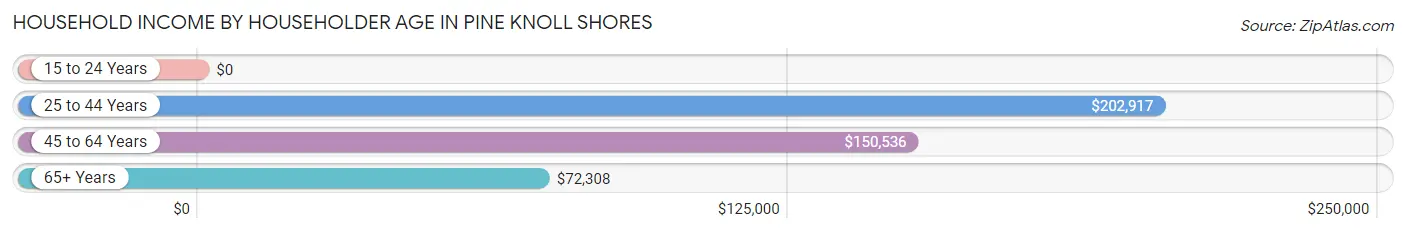
Household Income by Householder Age in Pine Knoll Shores
The median household income in Pine Knoll Shores is $92,656, with the highest median household income of $202,917 found in the 25 to 44 years age bracket for the primary householder. A total of 71 households (10.3%) fall into this category. Meanwhile, the 15 to 24 years age bracket for the primary householder has the lowest median household income of $0, with 3 households (0.4%) in this group.
| Income Bracket | # Households | Median Income |
| 15 to 24 Years | 3 (0.4%) | $0 |
| 25 to 44 Years | 71 (10.3%) | $202,917 |
| 45 to 64 Years | 223 (32.3%) | $150,536 |
| 65+ Years | 394 (57.0%) | $72,308 |
| Total | 691 (100.0%) | $92,656 |
Poverty in Pine Knoll Shores
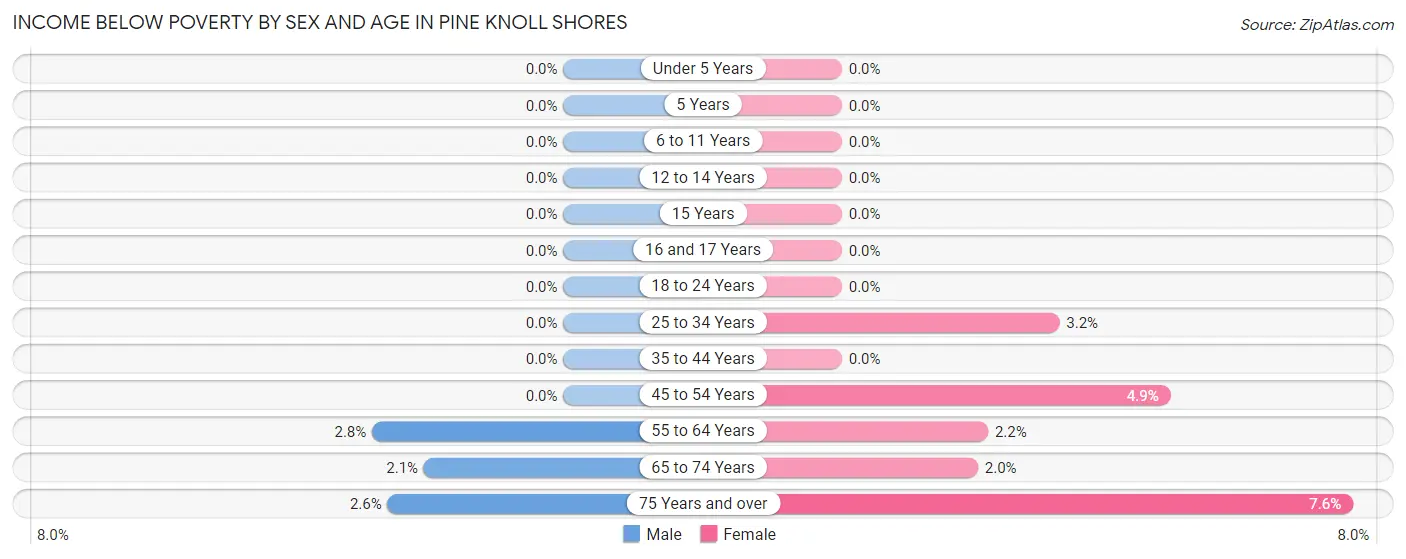
Income Below Poverty by Sex and Age in Pine Knoll Shores
With 1.8% poverty level for males and 3.2% for females among the residents of Pine Knoll Shores, 55 to 64 year old males and 75 year old and over females are the most vulnerable to poverty, with 4 males (2.8%) and 12 females (7.6%) in their respective age groups living below the poverty level.
| Age Bracket | Male | Female |
| Under 5 Years | 0 (0.0%) | 0 (0.0%) |
| 5 Years | 0 (0.0%) | 0 (0.0%) |
| 6 to 11 Years | 0 (0.0%) | 0 (0.0%) |
| 12 to 14 Years | 0 (0.0%) | 0 (0.0%) |
| 15 Years | 0 (0.0%) | 0 (0.0%) |
| 16 and 17 Years | 0 (0.0%) | 0 (0.0%) |
| 18 to 24 Years | 0 (0.0%) | 0 (0.0%) |
| 25 to 34 Years | 0 (0.0%) | 1 (3.2%) |
| 35 to 44 Years | 0 (0.0%) | 0 (0.0%) |
| 45 to 54 Years | 0 (0.0%) | 2 (4.9%) |
| 55 to 64 Years | 4 (2.8%) | 3 (2.2%) |
| 65 to 74 Years | 4 (2.1%) | 4 (2.0%) |
| 75 Years and over | 4 (2.6%) | 12 (7.6%) |
| Total | 12 (1.8%) | 22 (3.2%) |
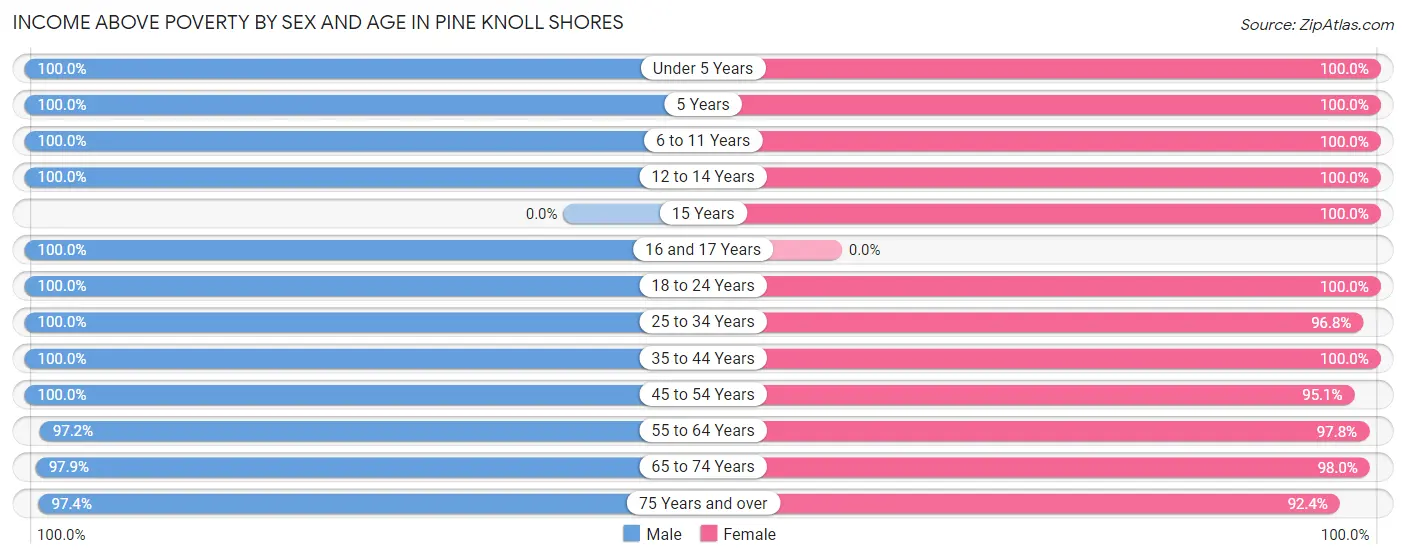
Income Above Poverty by Sex and Age in Pine Knoll Shores
According to the poverty statistics in Pine Knoll Shores, males aged under 5 years and females aged under 5 years are the age groups that are most secure financially, with 100.0% of males and 100.0% of females in these age groups living above the poverty line.
| Age Bracket | Male | Female |
| Under 5 Years | 10 (100.0%) | 11 (100.0%) |
| 5 Years | 7 (100.0%) | 13 (100.0%) |
| 6 to 11 Years | 16 (100.0%) | 22 (100.0%) |
| 12 to 14 Years | 12 (100.0%) | 18 (100.0%) |
| 15 Years | 0 (0.0%) | 4 (100.0%) |
| 16 and 17 Years | 4 (100.0%) | 0 (0.0%) |
| 18 to 24 Years | 6 (100.0%) | 8 (100.0%) |
| 25 to 34 Years | 26 (100.0%) | 30 (96.8%) |
| 35 to 44 Years | 66 (100.0%) | 48 (100.0%) |
| 45 to 54 Years | 39 (100.0%) | 39 (95.1%) |
| 55 to 64 Years | 137 (97.2%) | 135 (97.8%) |
| 65 to 74 Years | 189 (97.9%) | 194 (98.0%) |
| 75 Years and over | 149 (97.4%) | 146 (92.4%) |
| Total | 661 (98.2%) | 668 (96.8%) |
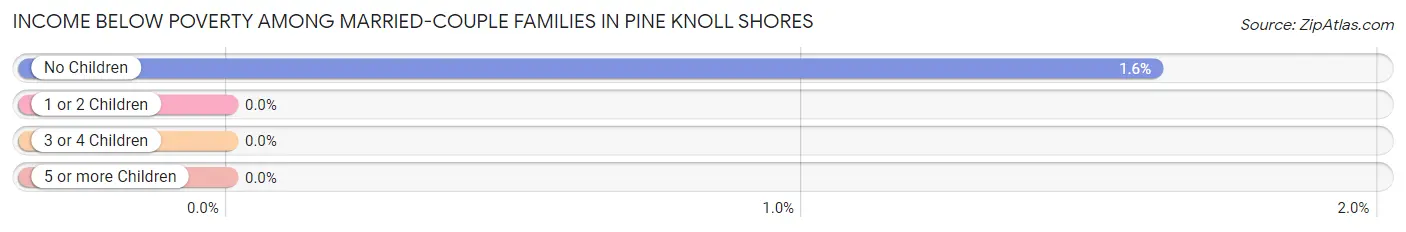
Income Below Poverty Among Married-Couple Families in Pine Knoll Shores
The poverty statistics for married-couple families in Pine Knoll Shores show that 1.4% or 7 of the total 496 families live below the poverty line. Families with no children have the highest poverty rate of 1.6%, comprising of 7 families. On the other hand, families with 1 or 2 children have the lowest poverty rate of 0.0%, which includes 0 families.
| Children | Above Poverty | Below Poverty |
| No Children | 428 (98.4%) | 7 (1.6%) |
| 1 or 2 Children | 51 (100.0%) | 0 (0.0%) |
| 3 or 4 Children | 7 (100.0%) | 0 (0.0%) |
| 5 or more Children | 3 (100.0%) | 0 (0.0%) |
| Total | 489 (98.6%) | 7 (1.4%) |
Income Below Poverty Among Single-Parent Households in Pine Knoll Shores
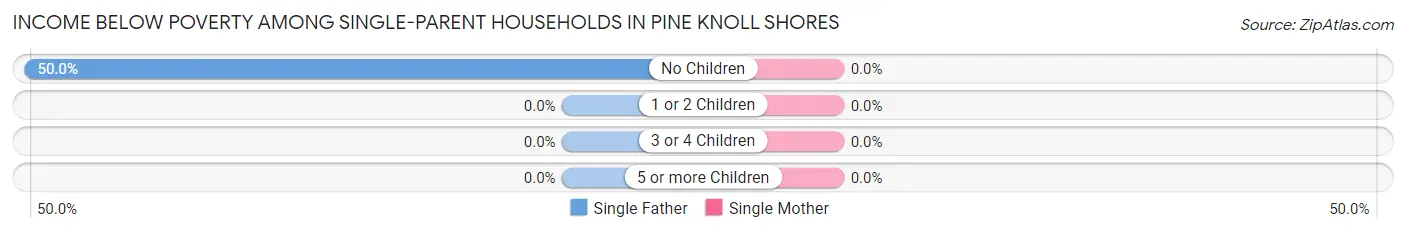
| Children | Single Father | Single Mother |
| No Children | 2 (50.0%) | 0 (0.0%) |
| 1 or 2 Children | 0 (0.0%) | 0 (0.0%) |
| 3 or 4 Children | 0 (0.0%) | 0 (0.0%) |
| 5 or more Children | 0 (0.0%) | 0 (0.0%) |
| Total | 2 (22.2%) | 0 (0.0%) |
Income Below Poverty Among Married-Couple vs Single-Parent Households in Pine Knoll Shores
The poverty data for Pine Knoll Shores shows that 7 of the married-couple family households (1.4%) and 2 of the single-parent households (16.7%) are living below the poverty level. Within the married-couple family households, those with no children have the highest poverty rate, with 7 households (1.6%) falling below the poverty line. Among the single-parent households, those with no children have the highest poverty rate, with 2 household (40.0%) living below poverty.
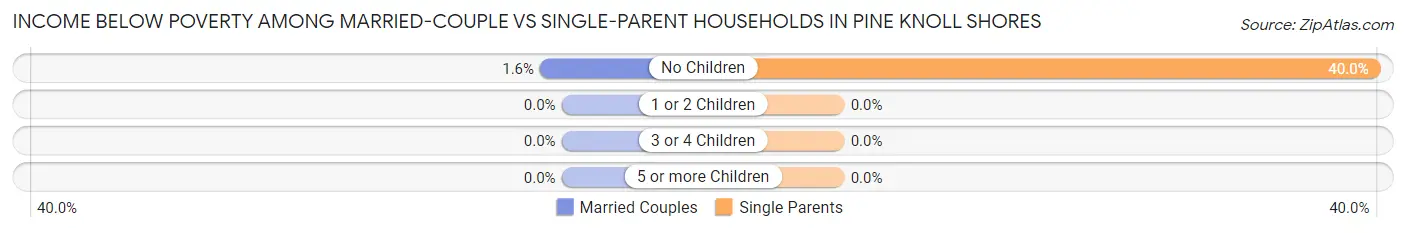
| Children | Married-Couple Families | Single-Parent Households |
| No Children | 7 (1.6%) | 2 (40.0%) |
| 1 or 2 Children | 0 (0.0%) | 0 (0.0%) |
| 3 or 4 Children | 0 (0.0%) | 0 (0.0%) |
| 5 or more Children | 0 (0.0%) | 0 (0.0%) |
| Total | 7 (1.4%) | 2 (16.7%) |
Race in Pine Knoll Shores
The most populous races in Pine Knoll Shores are White / Caucasian (1,338 | 98.2%), Two or more Races (18 | 1.3%), and Hispanic or Latino (7 | 0.5%).
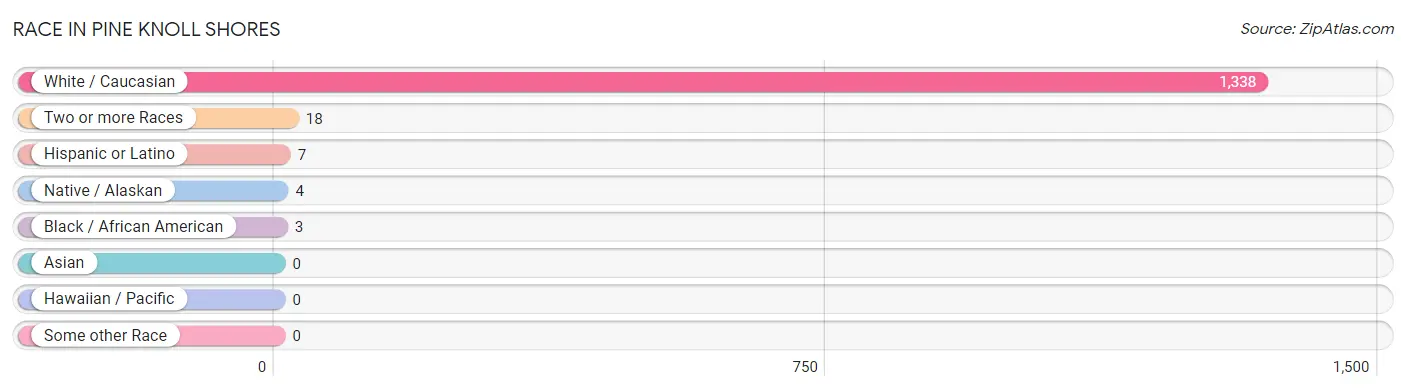
| Race | # Population | % Population |
| Asian | 0 | 0.0% |
| Black / African American | 3 | 0.2% |
| Hawaiian / Pacific | 0 | 0.0% |
| Hispanic or Latino | 7 | 0.5% |
| Native / Alaskan | 4 | 0.3% |
| White / Caucasian | 1,338 | 98.2% |
| Two or more Races | 18 | 1.3% |
| Some other Race | 0 | 0.0% |
| Total | 1,363 | 100.0% |
Ancestry in Pine Knoll Shores
The most populous ancestries reported in Pine Knoll Shores are English (375 | 27.5%), German (331 | 24.3%), Irish (221 | 16.2%), American (97 | 7.1%), and European (76 | 5.6%), together accounting for 80.7% of all Pine Knoll Shores residents.
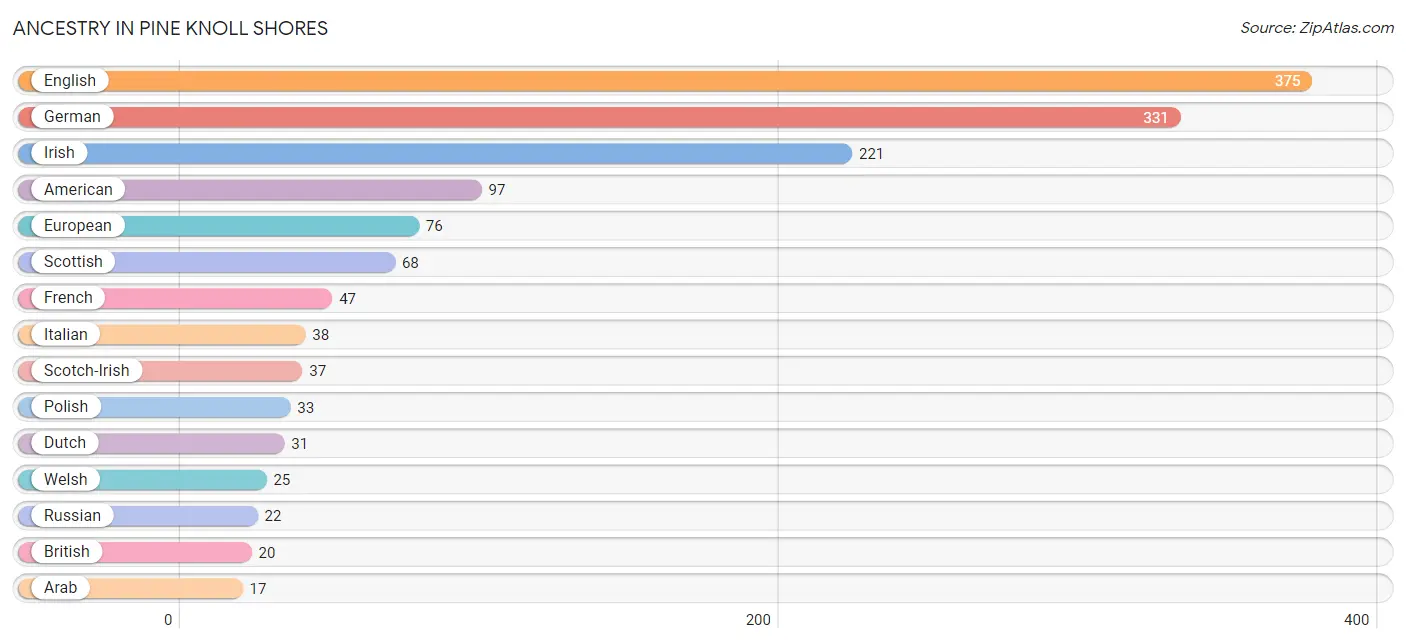
| Ancestry | # Population | % Population |
| American | 97 | 7.1% |
| Arab | 17 | 1.3% |
| British | 20 | 1.5% |
| Canadian | 5 | 0.4% |
| Central American | 4 | 0.3% |
| Central American Indian | 4 | 0.3% |
| Croatian | 3 | 0.2% |
| Czech | 4 | 0.3% |
| Dutch | 31 | 2.3% |
| Eastern European | 2 | 0.2% |
| English | 375 | 27.5% |
| European | 76 | 5.6% |
| Finnish | 5 | 0.4% |
| French | 47 | 3.5% |
| French Canadian | 4 | 0.3% |
| German | 331 | 24.3% |
| Guatemalan | 4 | 0.3% |
| Irish | 221 | 16.2% |
| Italian | 38 | 2.8% |
| Lebanese | 10 | 0.7% |
| Lithuanian | 1 | 0.1% |
| Maltese | 4 | 0.3% |
| Moroccan | 7 | 0.5% |
| Northern European | 4 | 0.3% |
| Norwegian | 10 | 0.7% |
| Polish | 33 | 2.4% |
| Portuguese | 3 | 0.2% |
| Russian | 22 | 1.6% |
| Scandinavian | 2 | 0.2% |
| Scotch-Irish | 37 | 2.7% |
| Scottish | 68 | 5.0% |
| Spanish | 3 | 0.2% |
| Swedish | 12 | 0.9% |
| Swiss | 10 | 0.7% |
| Welsh | 25 | 1.8% | View All 35 Rows |
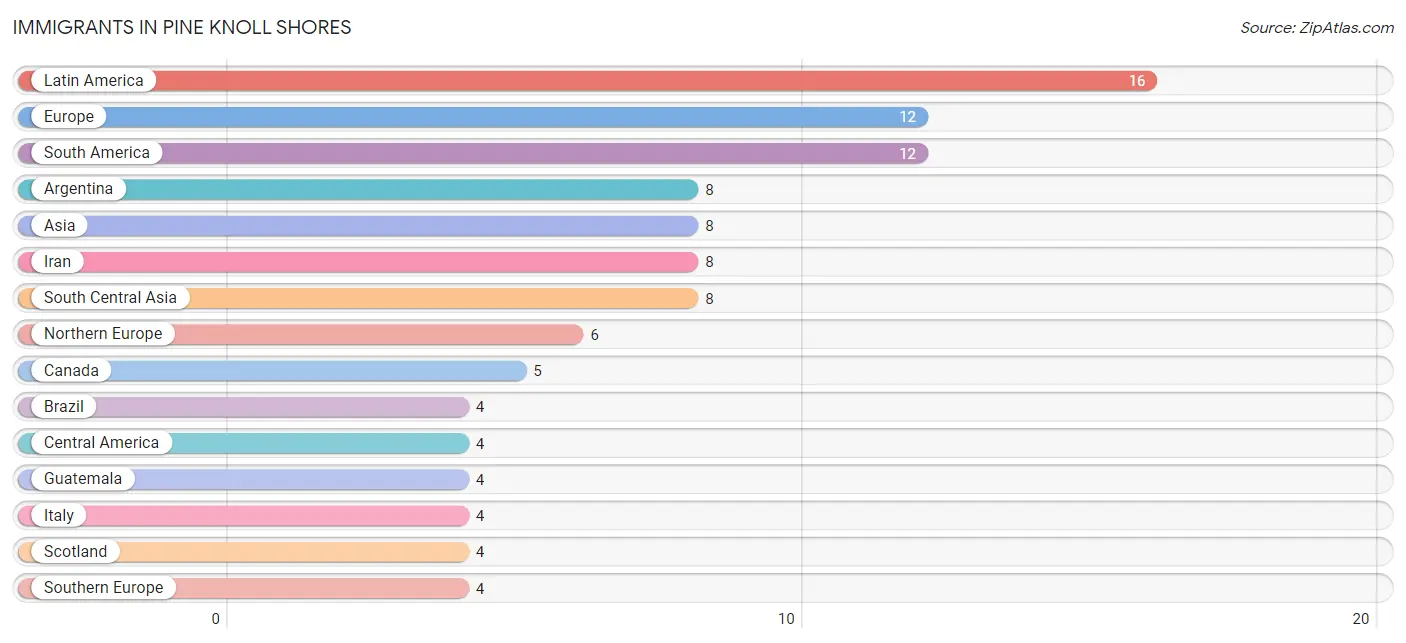
Immigrants in Pine Knoll Shores
The most numerous immigrant groups reported in Pine Knoll Shores came from Latin America (16 | 1.2%), Europe (12 | 0.9%), South America (12 | 0.9%), Argentina (8 | 0.6%), and Asia (8 | 0.6%), together accounting for 4.1% of all Pine Knoll Shores residents.
| Immigration Origin | # Population | % Population |
| Africa | 3 | 0.2% |
| Argentina | 8 | 0.6% |
| Asia | 8 | 0.6% |
| Australia | 2 | 0.2% |
| Brazil | 4 | 0.3% |
| Canada | 5 | 0.4% |
| Central America | 4 | 0.3% |
| Europe | 12 | 0.9% |
| Germany | 2 | 0.2% |
| Guatemala | 4 | 0.3% |
| Iran | 8 | 0.6% |
| Italy | 4 | 0.3% |
| Latin America | 16 | 1.2% |
| Morocco | 3 | 0.2% |
| Northern Africa | 3 | 0.2% |
| Northern Europe | 6 | 0.4% |
| Oceania | 2 | 0.2% |
| Scotland | 4 | 0.3% |
| South America | 12 | 0.9% |
| South Central Asia | 8 | 0.6% |
| Southern Europe | 4 | 0.3% |
| Western Europe | 2 | 0.2% | View All 22 Rows |
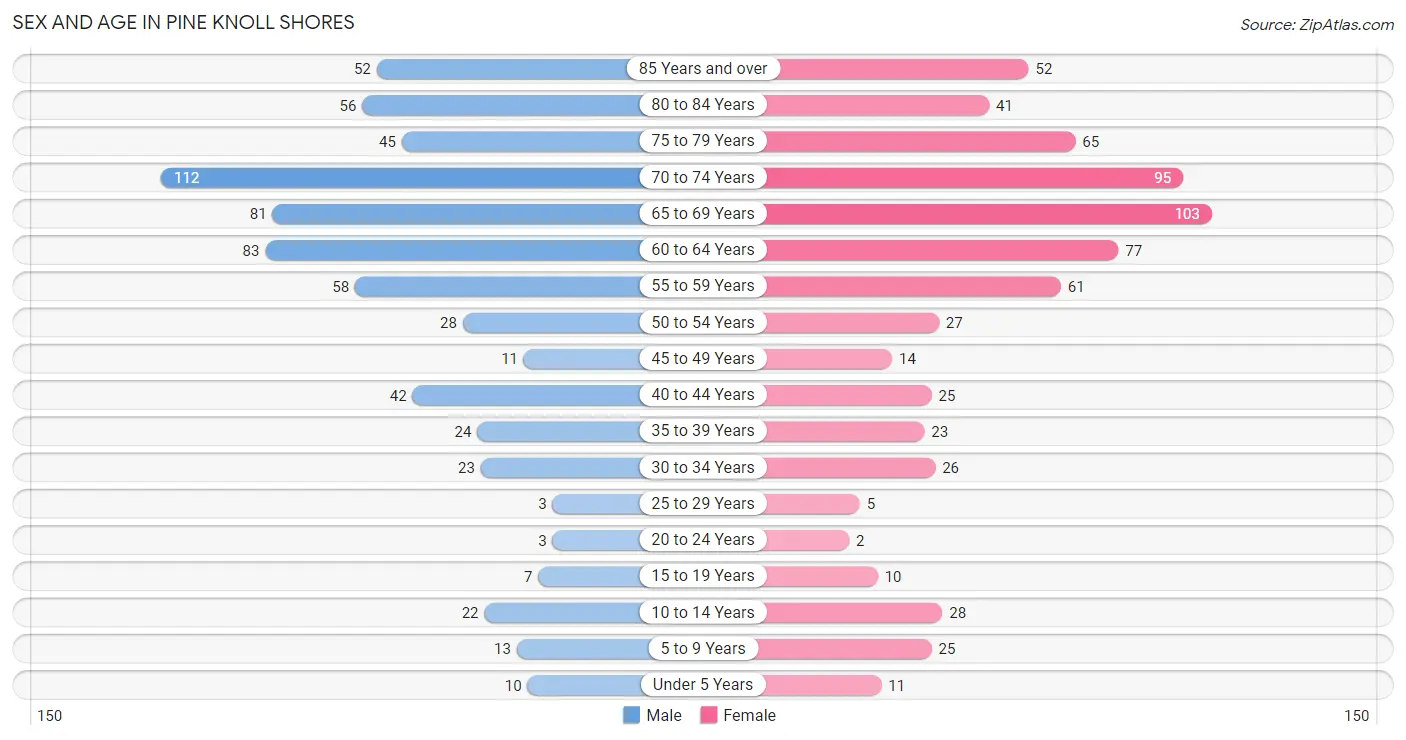
Sex and Age in Pine Knoll Shores
Sex and Age in Pine Knoll Shores
The most populous age groups in Pine Knoll Shores are 70 to 74 Years (112 | 16.6%) for men and 65 to 69 Years (103 | 14.9%) for women.
| Age Bracket | Male | Female |
| Under 5 Years | 10 (1.5%) | 11 (1.6%) |
| 5 to 9 Years | 13 (1.9%) | 25 (3.6%) |
| 10 to 14 Years | 22 (3.3%) | 28 (4.1%) |
| 15 to 19 Years | 7 (1.0%) | 10 (1.5%) |
| 20 to 24 Years | 3 (0.4%) | 2 (0.3%) |
| 25 to 29 Years | 3 (0.4%) | 5 (0.7%) |
| 30 to 34 Years | 23 (3.4%) | 26 (3.8%) |
| 35 to 39 Years | 24 (3.6%) | 23 (3.3%) |
| 40 to 44 Years | 42 (6.2%) | 25 (3.6%) |
| 45 to 49 Years | 11 (1.6%) | 14 (2.0%) |
| 50 to 54 Years | 28 (4.2%) | 27 (3.9%) |
| 55 to 59 Years | 58 (8.6%) | 61 (8.8%) |
| 60 to 64 Years | 83 (12.3%) | 77 (11.2%) |
| 65 to 69 Years | 81 (12.0%) | 103 (14.9%) |
| 70 to 74 Years | 112 (16.6%) | 95 (13.8%) |
| 75 to 79 Years | 45 (6.7%) | 65 (9.4%) |
| 80 to 84 Years | 56 (8.3%) | 41 (5.9%) |
| 85 Years and over | 52 (7.7%) | 52 (7.5%) |
| Total | 673 (100.0%) | 690 (100.0%) |
Families and Households in Pine Knoll Shores
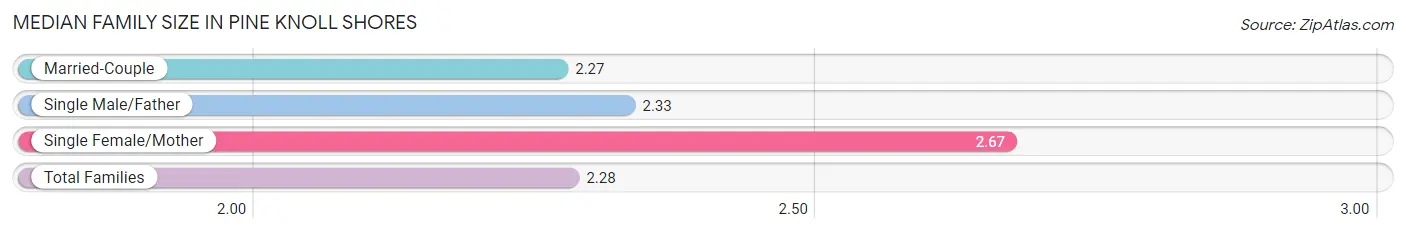
Median Family Size in Pine Knoll Shores
The median family size in Pine Knoll Shores is 2.28 persons per family, with single female/mother families (3 | 0.6%) accounting for the largest median family size of 2.67 persons per family. On the other hand, married-couple families (496 | 97.6%) represent the smallest median family size with 2.27 persons per family.
| Family Type | # Families | Family Size |
| Married-Couple | 496 (97.6%) | 2.27 |
| Single Male/Father | 9 (1.8%) | 2.33 |
| Single Female/Mother | 3 (0.6%) | 2.67 |
| Total Families | 508 (100.0%) | 2.28 |
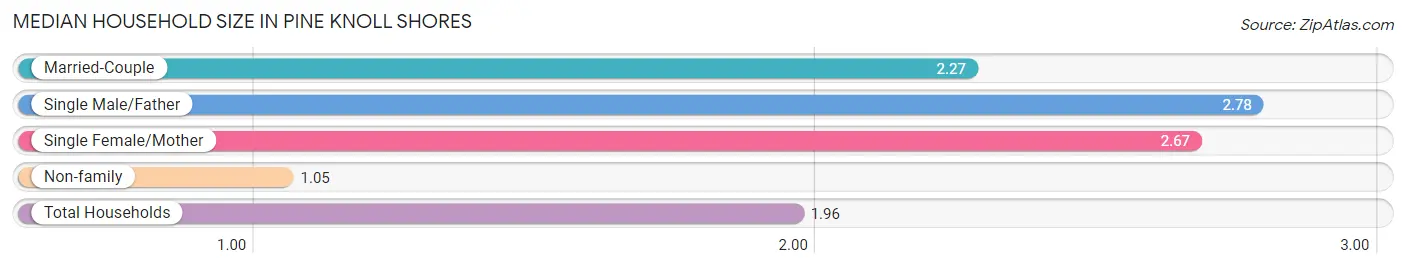
Median Household Size in Pine Knoll Shores
The median household size in Pine Knoll Shores is 1.96 persons per household, with single male/father households (9 | 1.3%) accounting for the largest median household size of 2.78 persons per household. non-family households (183 | 26.5%) represent the smallest median household size with 1.05 persons per household.
| Household Type | # Households | Household Size |
| Married-Couple | 496 (71.8%) | 2.27 |
| Single Male/Father | 9 (1.3%) | 2.78 |
| Single Female/Mother | 3 (0.4%) | 2.67 |
| Non-family | 183 (26.5%) | 1.05 |
| Total Households | 691 (100.0%) | 1.96 |
Household Size by Marriage Status in Pine Knoll Shores
Out of a total of 691 households in Pine Knoll Shores, 508 (73.5%) are family households, while 183 (26.5%) are nonfamily households. The most numerous type of family households are 2-person households, comprising 418, and the most common type of nonfamily households are 1-person households, comprising 173.
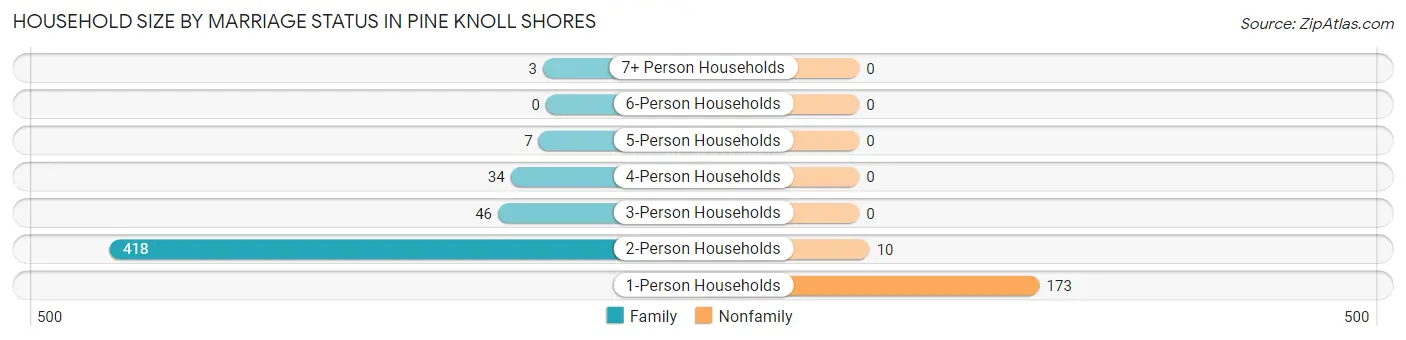
| Household Size | Family Households | Nonfamily Households |
| 1-Person Households | - | 173 (25.0%) |
| 2-Person Households | 418 (60.5%) | 10 (1.5%) |
| 3-Person Households | 46 (6.7%) | 0 (0.0%) |
| 4-Person Households | 34 (4.9%) | 0 (0.0%) |
| 5-Person Households | 7 (1.0%) | 0 (0.0%) |
| 6-Person Households | 0 (0.0%) | 0 (0.0%) |
| 7+ Person Households | 3 (0.4%) | 0 (0.0%) |
| Total | 508 (73.5%) | 183 (26.5%) |
Female Fertility in Pine Knoll Shores
Fertility by Age in Pine Knoll Shores
Average fertility rate in Pine Knoll Shores is 9.0 births per 1,000 women. Women in the age bracket of 35 to 50 years have the highest fertility rate with 15.0 births per 1,000 women. Women in the age bracket of 35 to 50 years acount for 100.0% of all women with births.
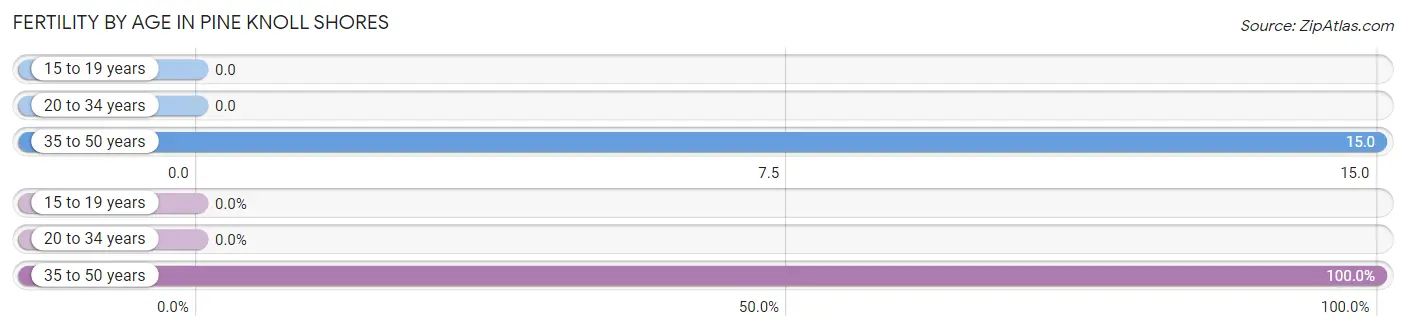
| Age Bracket | Women with Births | Births / 1,000 Women |
| 15 to 19 years | 0 (0.0%) | 0.0 |
| 20 to 34 years | 0 (0.0%) | 0.0 |
| 35 to 50 years | 1 (100.0%) | 15.0 |
| Total | 1 (100.0%) | 9.0 |
Fertility by Age by Marriage Status in Pine Knoll Shores
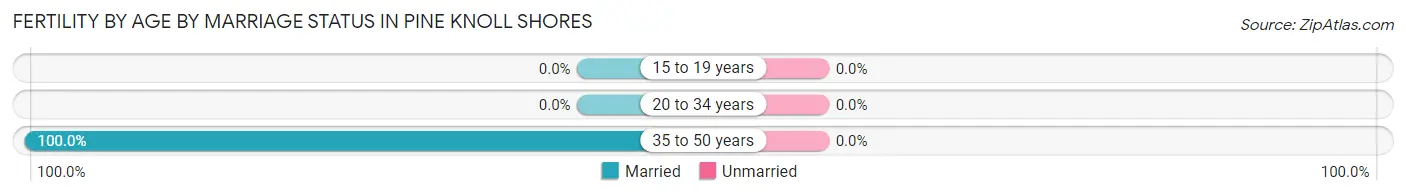
| Age Bracket | Married | Unmarried |
| 15 to 19 years | 0 (0.0%) | 0 (0.0%) |
| 20 to 34 years | 0 (0.0%) | 0 (0.0%) |
| 35 to 50 years | 1 (100.0%) | 0 (0.0%) |
| Total | 1 (100.0%) | 0 (0.0%) |
Fertility by Education in Pine Knoll Shores
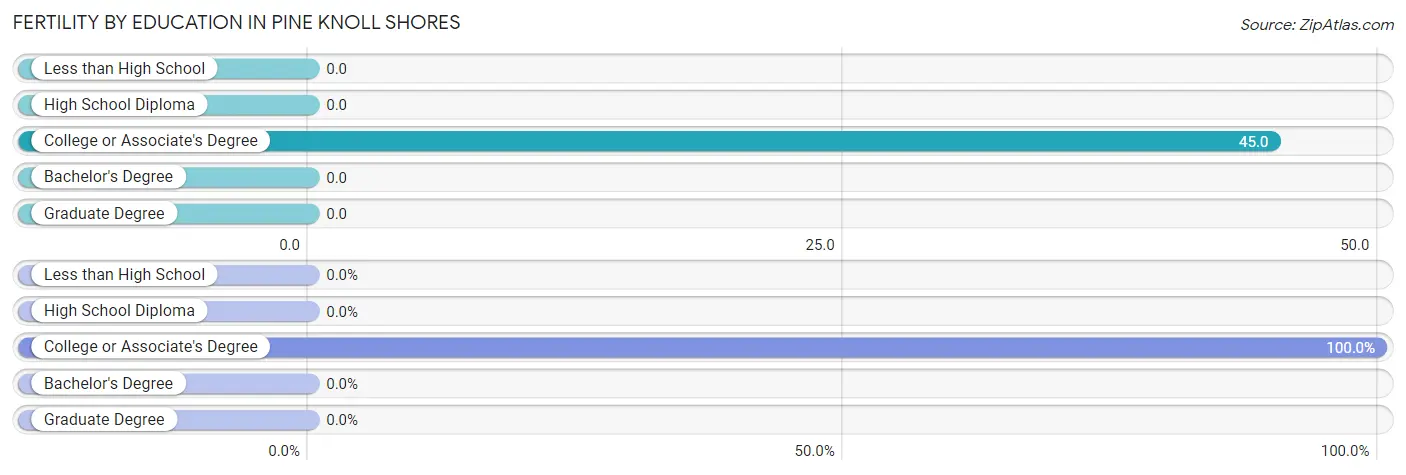
| Educational Attainment | Women with Births | Births / 1,000 Women |
| Less than High School | 0 (0.0%) | 0.0 |
| High School Diploma | 0 (0.0%) | 0.0 |
| College or Associate's Degree | 1 (100.0%) | 45.0 |
| Bachelor's Degree | 0 (0.0%) | 0.0 |
| Graduate Degree | 0 (0.0%) | 0.0 |
| Total | 1 (100.0%) | 9.0 |
Fertility by Education by Marriage Status in Pine Knoll Shores
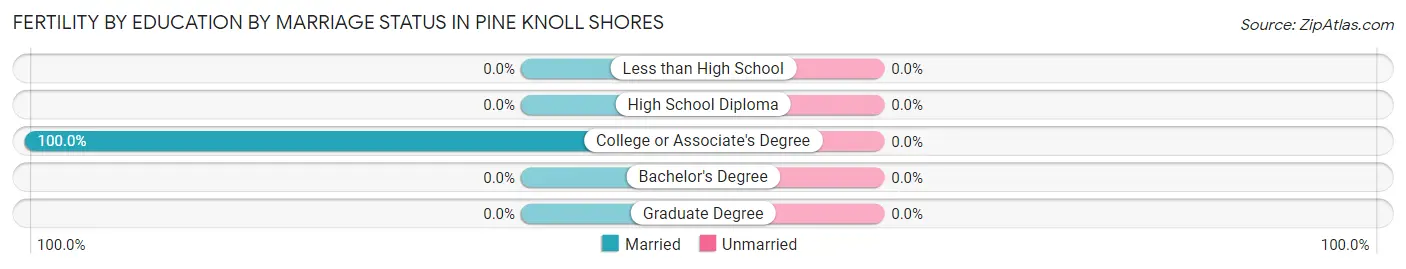
| Educational Attainment | Married | Unmarried |
| Less than High School | 0 (0.0%) | 0 (0.0%) |
| High School Diploma | 0 (0.0%) | 0 (0.0%) |
| College or Associate's Degree | 1 (100.0%) | 0 (0.0%) |
| Bachelor's Degree | 0 (0.0%) | 0 (0.0%) |
| Graduate Degree | 0 (0.0%) | 0 (0.0%) |
| Total | 1 (100.0%) | 0 (0.0%) |
Employment Characteristics in Pine Knoll Shores
Employment by Class of Employer in Pine Knoll Shores
Among the 428 employed individuals in Pine Knoll Shores, private company employees (257 | 60.1%), self-employed (not incorporated) (56 | 13.1%), and not-for-profit organizations (36 | 8.4%) make up the most common classes of employment.
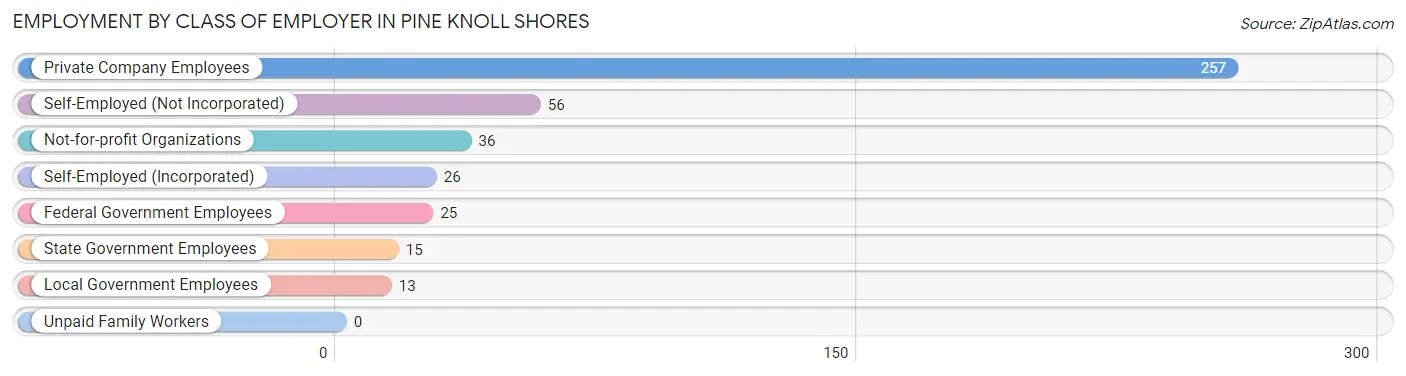
| Employer Class | # Employees | % Employees |
| Private Company Employees | 257 | 60.1% |
| Self-Employed (Incorporated) | 26 | 6.1% |
| Self-Employed (Not Incorporated) | 56 | 13.1% |
| Not-for-profit Organizations | 36 | 8.4% |
| Local Government Employees | 13 | 3.0% |
| State Government Employees | 15 | 3.5% |
| Federal Government Employees | 25 | 5.8% |
| Unpaid Family Workers | 0 | 0.0% |
| Total | 428 | 100.0% |
Employment Status by Age in Pine Knoll Shores
According to the labor force statistics for Pine Knoll Shores, out of the total population over 16 years of age (1,250), 37.3% or 466 individuals are in the labor force, with 3.3% or 15 of them unemployed. The age group with the highest labor force participation rate is 25 to 29 years, with 100.0% or 8 individuals in the labor force. Within the labor force, the 25 to 29 years age range has the highest percentage of unemployed individuals, with 62.5% or 5 of them being unemployed.
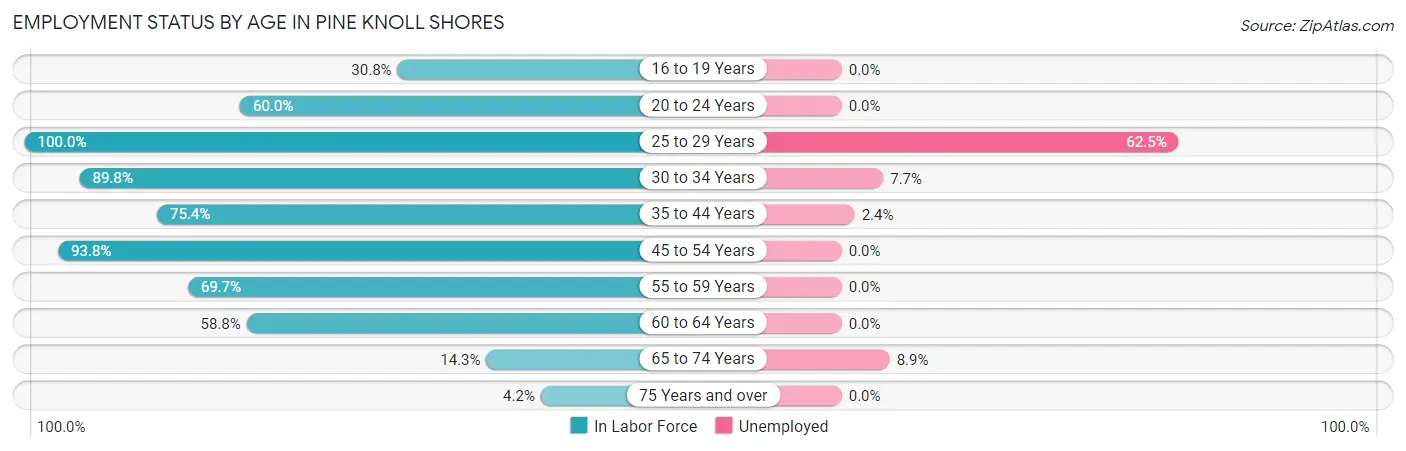
| Age Bracket | In Labor Force | Unemployed |
| 16 to 19 Years | 4 (30.8%) | 0 (0.0%) |
| 20 to 24 Years | 3 (60.0%) | 0 (0.0%) |
| 25 to 29 Years | 8 (100.0%) | 5 (62.5%) |
| 30 to 34 Years | 44 (89.8%) | 3 (7.7%) |
| 35 to 44 Years | 86 (75.4%) | 2 (2.4%) |
| 45 to 54 Years | 75 (93.8%) | 0 (0.0%) |
| 55 to 59 Years | 83 (69.7%) | 0 (0.0%) |
| 60 to 64 Years | 94 (58.8%) | 0 (0.0%) |
| 65 to 74 Years | 56 (14.3%) | 5 (8.9%) |
| 75 Years and over | 13 (4.2%) | 0 (0.0%) |
| Total | 466 (37.3%) | 15 (3.3%) |
Employment Status by Educational Attainment in Pine Knoll Shores
According to labor force statistics for Pine Knoll Shores, 73.6% of individuals (390) out of the total population between 25 and 64 years of age (530) are in the labor force, with 2.6% or 10 of them being unemployed. The group with the highest labor force participation rate are those with the educational attainment of bachelor's degree or higher, with 78.1% or 250 individuals in the labor force. Within the labor force, individuals with bachelor's degree or higher education have the highest percentage of unemployment, with 3.2% or 8 of them being unemployed.
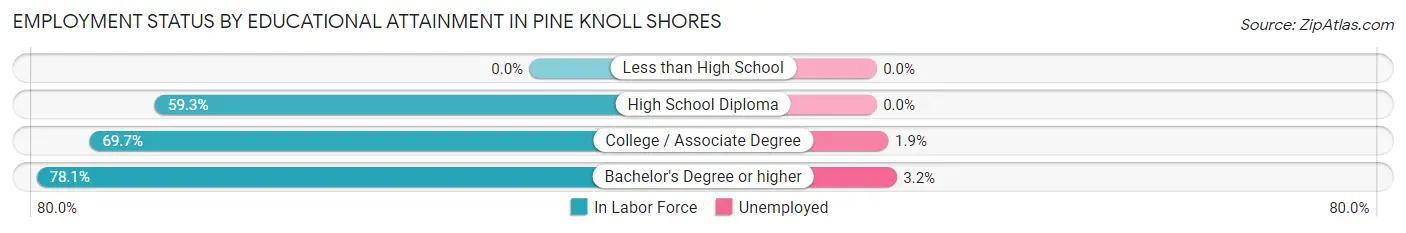
| Educational Attainment | In Labor Force | Unemployed |
| Less than High School | 0 (0.0%) | 0 (0.0%) |
| High School Diploma | 32 (59.3%) | 0 (0.0%) |
| College / Associate Degree | 108 (69.7%) | 3 (1.9%) |
| Bachelor's Degree or higher | 250 (78.1%) | 10 (3.2%) |
| Total | 390 (73.6%) | 14 (2.6%) |
Employment Occupations by Sex in Pine Knoll Shores
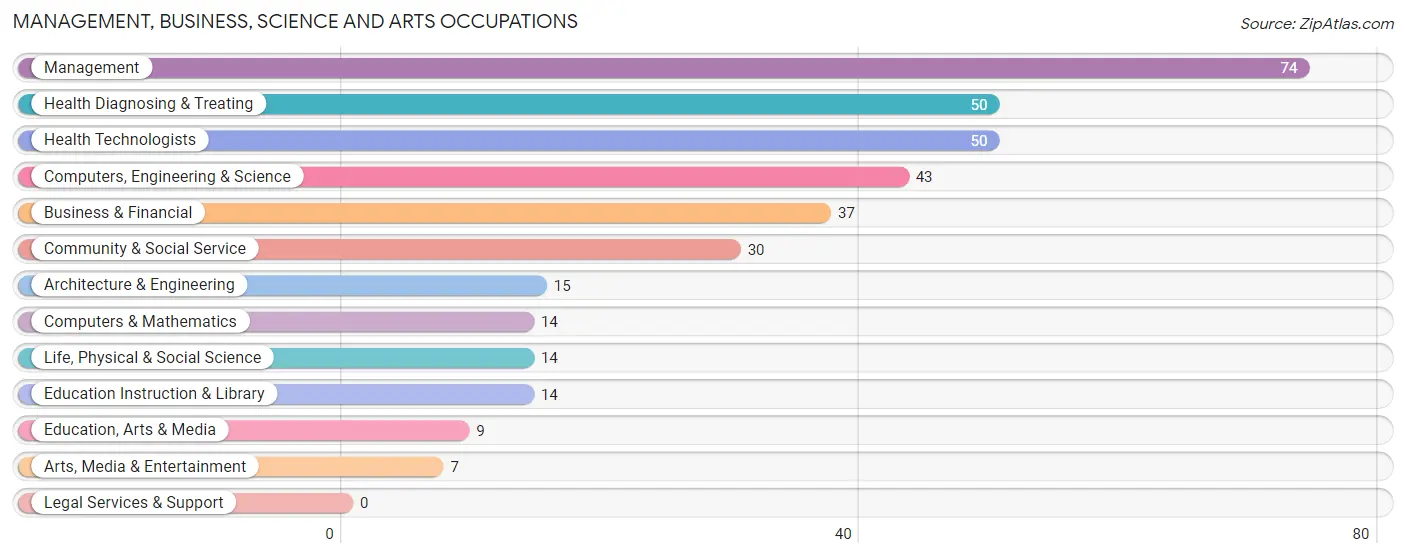
Management, Business, Science and Arts Occupations
The most common Management, Business, Science and Arts occupations in Pine Knoll Shores are Management (74 | 16.7%), Health Diagnosing & Treating (50 | 11.3%), Health Technologists (50 | 11.3%), Computers, Engineering & Science (43 | 9.7%), and Business & Financial (37 | 8.3%).
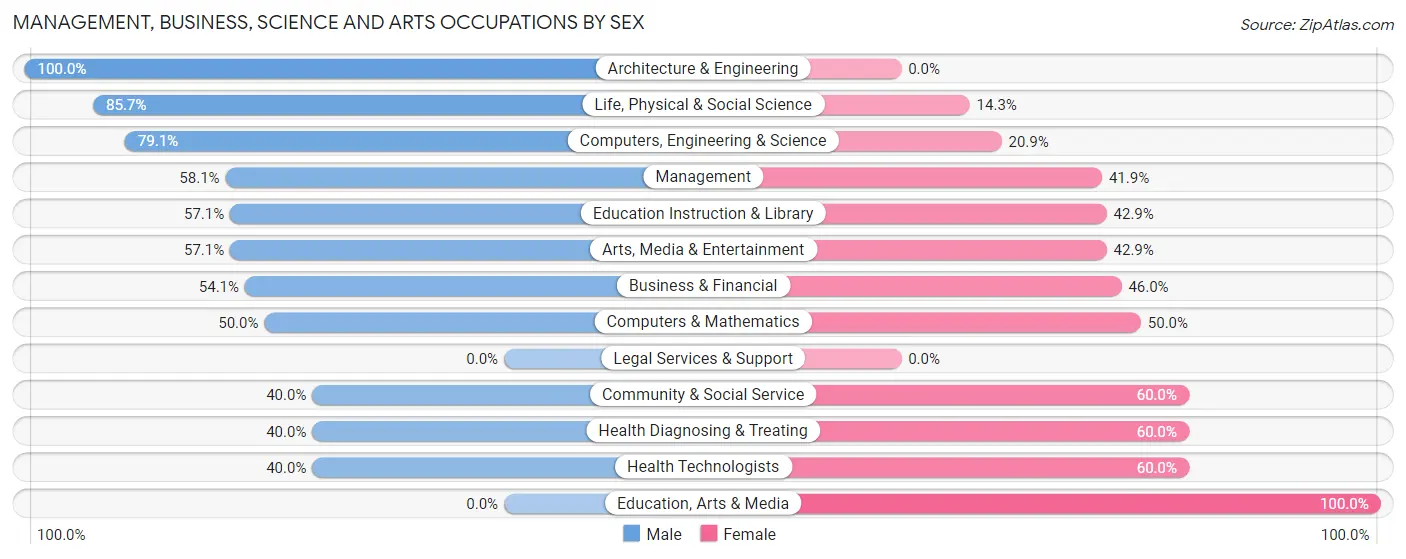
Management, Business, Science and Arts Occupations by Sex
Within the Management, Business, Science and Arts occupations in Pine Knoll Shores, the most male-oriented occupations are Architecture & Engineering (100.0%), Life, Physical & Social Science (85.7%), and Computers, Engineering & Science (79.1%), while the most female-oriented occupations are Education, Arts & Media (100.0%), Community & Social Service (60.0%), and Health Diagnosing & Treating (60.0%).
| Occupation | Male | Female |
| Management | 43 (58.1%) | 31 (41.9%) |
| Business & Financial | 20 (54.0%) | 17 (46.0%) |
| Computers, Engineering & Science | 34 (79.1%) | 9 (20.9%) |
| Computers & Mathematics | 7 (50.0%) | 7 (50.0%) |
| Architecture & Engineering | 15 (100.0%) | 0 (0.0%) |
| Life, Physical & Social Science | 12 (85.7%) | 2 (14.3%) |
| Community & Social Service | 12 (40.0%) | 18 (60.0%) |
| Education, Arts & Media | 0 (0.0%) | 9 (100.0%) |
| Legal Services & Support | 0 (0.0%) | 0 (0.0%) |
| Education Instruction & Library | 8 (57.1%) | 6 (42.9%) |
| Arts, Media & Entertainment | 4 (57.1%) | 3 (42.9%) |
| Health Diagnosing & Treating | 20 (40.0%) | 30 (60.0%) |
| Health Technologists | 20 (40.0%) | 30 (60.0%) |
| Total (Category) | 129 (55.1%) | 105 (44.9%) |
| Total (Overall) | 264 (59.5%) | 180 (40.5%) |
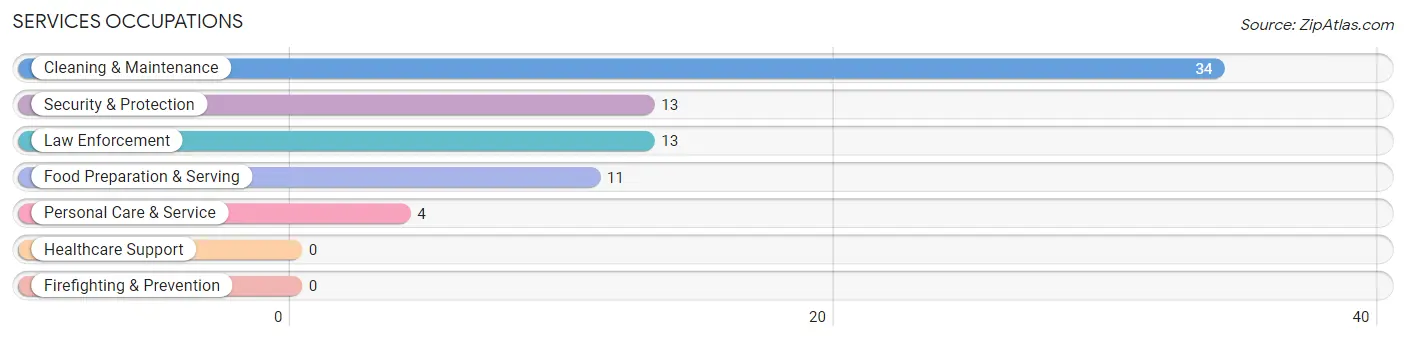
Services Occupations
The most common Services occupations in Pine Knoll Shores are Cleaning & Maintenance (34 | 7.7%), Security & Protection (13 | 2.9%), Law Enforcement (13 | 2.9%), Food Preparation & Serving (11 | 2.5%), and Personal Care & Service (4 | 0.9%).
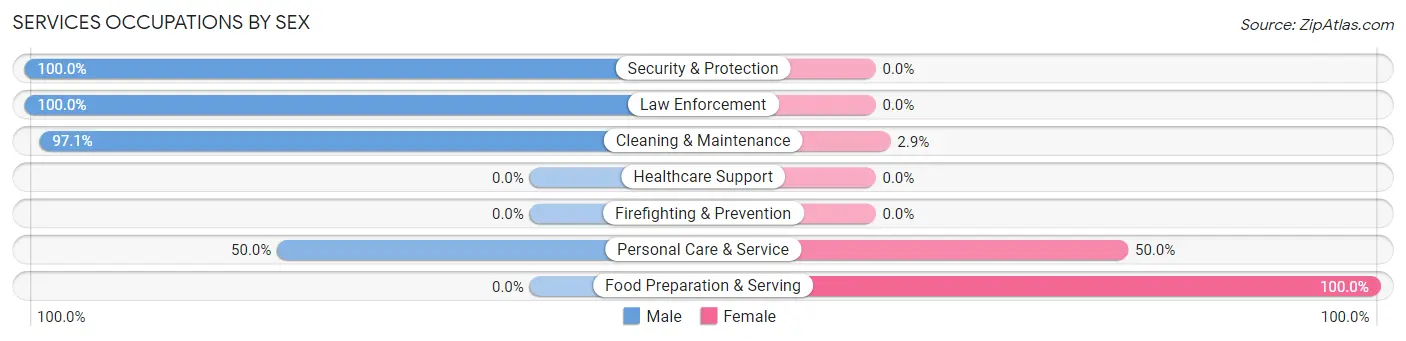
Services Occupations by Sex
Within the Services occupations in Pine Knoll Shores, the most male-oriented occupations are Security & Protection (100.0%), Law Enforcement (100.0%), and Cleaning & Maintenance (97.1%), while the most female-oriented occupations are Food Preparation & Serving (100.0%), Personal Care & Service (50.0%), and Cleaning & Maintenance (2.9%).
| Occupation | Male | Female |
| Healthcare Support | 0 (0.0%) | 0 (0.0%) |
| Security & Protection | 13 (100.0%) | 0 (0.0%) |
| Firefighting & Prevention | 0 (0.0%) | 0 (0.0%) |
| Law Enforcement | 13 (100.0%) | 0 (0.0%) |
| Food Preparation & Serving | 0 (0.0%) | 11 (100.0%) |
| Cleaning & Maintenance | 33 (97.1%) | 1 (2.9%) |
| Personal Care & Service | 2 (50.0%) | 2 (50.0%) |
| Total (Category) | 48 (77.4%) | 14 (22.6%) |
| Total (Overall) | 264 (59.5%) | 180 (40.5%) |
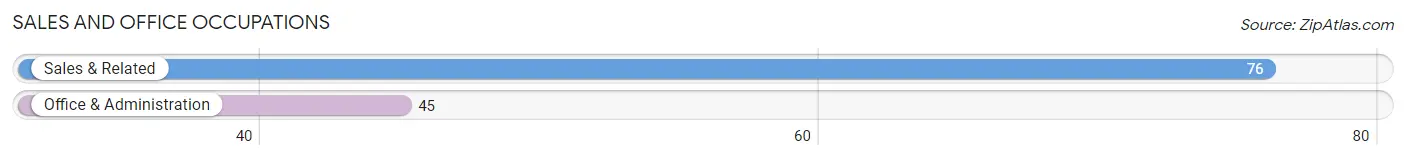
Sales and Office Occupations
The most common Sales and Office occupations in Pine Knoll Shores are Sales & Related (76 | 17.1%), and Office & Administration (45 | 10.1%).
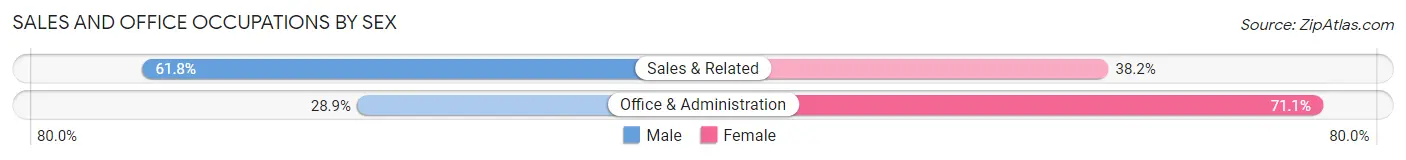
Sales and Office Occupations by Sex
| Occupation | Male | Female |
| Sales & Related | 47 (61.8%) | 29 (38.2%) |
| Office & Administration | 13 (28.9%) | 32 (71.1%) |
| Total (Category) | 60 (49.6%) | 61 (50.4%) |
| Total (Overall) | 264 (59.5%) | 180 (40.5%) |
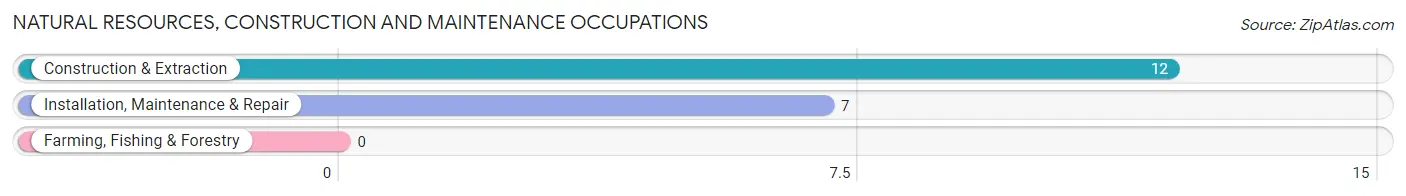
Natural Resources, Construction and Maintenance Occupations
The most common Natural Resources, Construction and Maintenance occupations in Pine Knoll Shores are Construction & Extraction (12 | 2.7%), and Installation, Maintenance & Repair (7 | 1.6%).
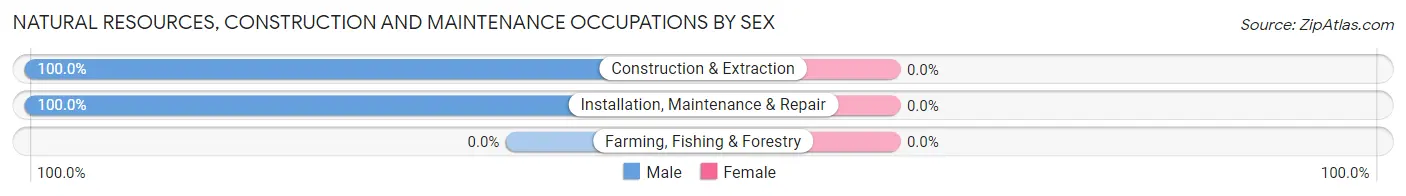
Natural Resources, Construction and Maintenance Occupations by Sex
| Occupation | Male | Female |
| Farming, Fishing & Forestry | 0 (0.0%) | 0 (0.0%) |
| Construction & Extraction | 12 (100.0%) | 0 (0.0%) |
| Installation, Maintenance & Repair | 7 (100.0%) | 0 (0.0%) |
| Total (Category) | 19 (100.0%) | 0 (0.0%) |
| Total (Overall) | 264 (59.5%) | 180 (40.5%) |
Production, Transportation and Moving Occupations
The most common Production, Transportation and Moving occupations in Pine Knoll Shores are Production (5 | 1.1%), and Transportation (3 | 0.7%).
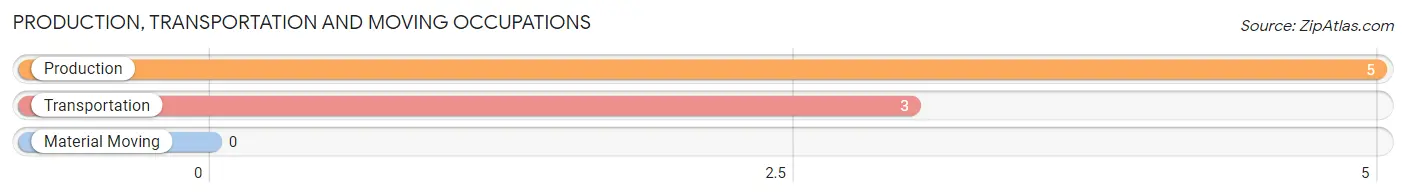
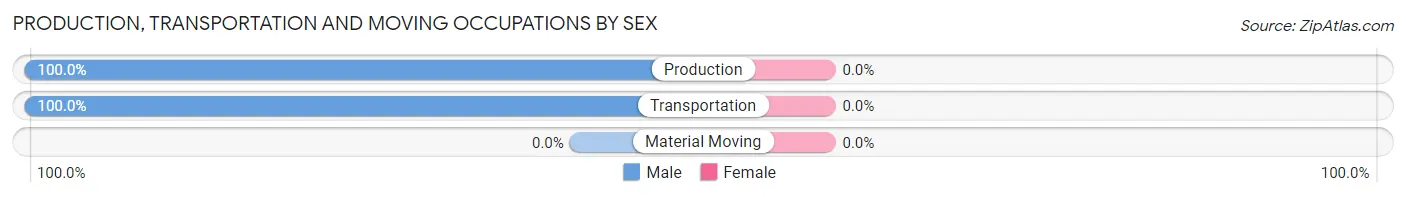
Production, Transportation and Moving Occupations by Sex
| Occupation | Male | Female |
| Production | 5 (100.0%) | 0 (0.0%) |
| Transportation | 3 (100.0%) | 0 (0.0%) |
| Material Moving | 0 (0.0%) | 0 (0.0%) |
| Total (Category) | 8 (100.0%) | 0 (0.0%) |
| Total (Overall) | 264 (59.5%) | 180 (40.5%) |
Employment Industries by Sex in Pine Knoll Shores
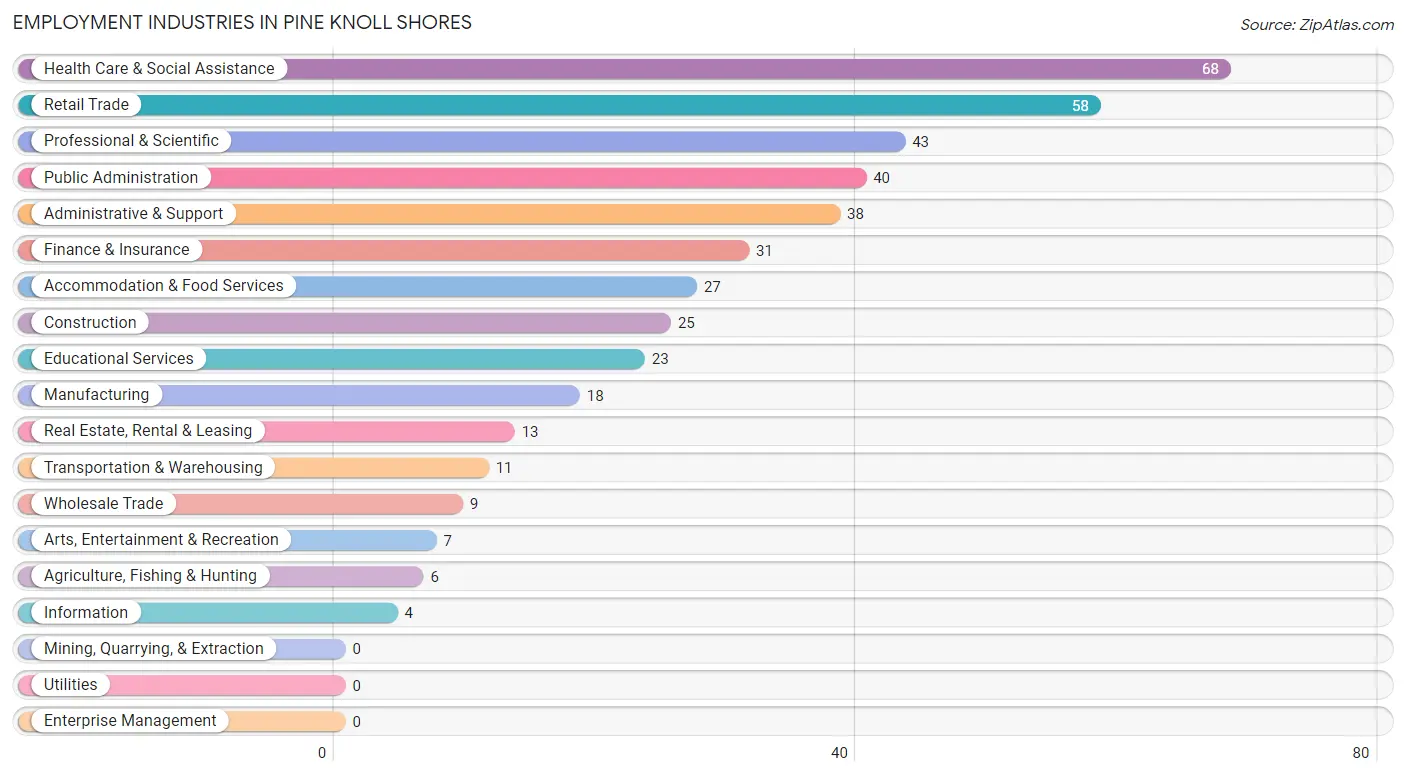
Employment Industries in Pine Knoll Shores
The major employment industries in Pine Knoll Shores include Health Care & Social Assistance (68 | 15.3%), Retail Trade (58 | 13.1%), Professional & Scientific (43 | 9.7%), Public Administration (40 | 9.0%), and Administrative & Support (38 | 8.6%).
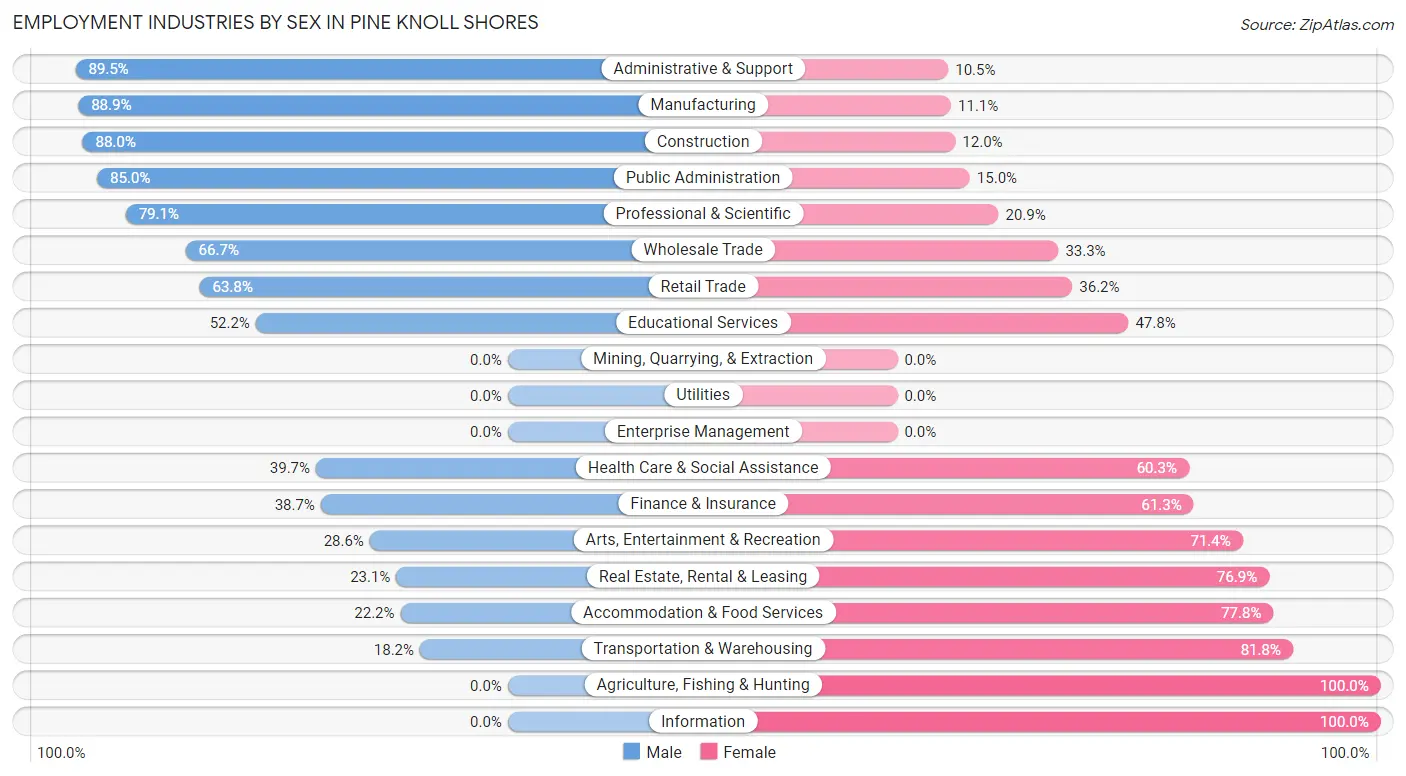
Employment Industries by Sex in Pine Knoll Shores
The Pine Knoll Shores industries that see more men than women are Administrative & Support (89.5%), Manufacturing (88.9%), and Construction (88.0%), whereas the industries that tend to have a higher number of women are Agriculture, Fishing & Hunting (100.0%), Information (100.0%), and Transportation & Warehousing (81.8%).
| Industry | Male | Female |
| Agriculture, Fishing & Hunting | 0 (0.0%) | 6 (100.0%) |
| Mining, Quarrying, & Extraction | 0 (0.0%) | 0 (0.0%) |
| Construction | 22 (88.0%) | 3 (12.0%) |
| Manufacturing | 16 (88.9%) | 2 (11.1%) |
| Wholesale Trade | 6 (66.7%) | 3 (33.3%) |
| Retail Trade | 37 (63.8%) | 21 (36.2%) |
| Transportation & Warehousing | 2 (18.2%) | 9 (81.8%) |
| Utilities | 0 (0.0%) | 0 (0.0%) |
| Information | 0 (0.0%) | 4 (100.0%) |
| Finance & Insurance | 12 (38.7%) | 19 (61.3%) |
| Real Estate, Rental & Leasing | 3 (23.1%) | 10 (76.9%) |
| Professional & Scientific | 34 (79.1%) | 9 (20.9%) |
| Enterprise Management | 0 (0.0%) | 0 (0.0%) |
| Administrative & Support | 34 (89.5%) | 4 (10.5%) |
| Educational Services | 12 (52.2%) | 11 (47.8%) |
| Health Care & Social Assistance | 27 (39.7%) | 41 (60.3%) |
| Arts, Entertainment & Recreation | 2 (28.6%) | 5 (71.4%) |
| Accommodation & Food Services | 6 (22.2%) | 21 (77.8%) |
| Public Administration | 34 (85.0%) | 6 (15.0%) |
| Total | 264 (59.5%) | 180 (40.5%) |
Education in Pine Knoll Shores
School Enrollment in Pine Knoll Shores
The most common levels of schooling among the 133 students in Pine Knoll Shores are middle school (42 | 31.6%), high school (20 | 15.0%), and kindergarten (18 | 13.5%).
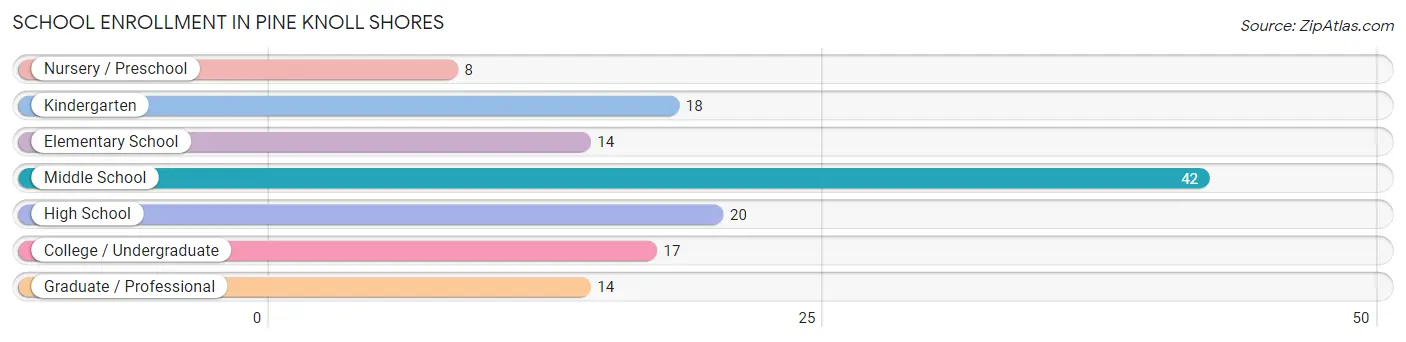
| School Level | # Students | % Students |
| Nursery / Preschool | 8 | 6.0% |
| Kindergarten | 18 | 13.5% |
| Elementary School | 14 | 10.5% |
| Middle School | 42 | 31.6% |
| High School | 20 | 15.0% |
| College / Undergraduate | 17 | 12.8% |
| Graduate / Professional | 14 | 10.5% |
| Total | 133 | 100.0% |
School Enrollment by Age by Funding Source in Pine Knoll Shores
Out of a total of 133 students who are enrolled in schools in Pine Knoll Shores, 39 (29.3%) attend a private institution, while the remaining 94 (70.7%) are enrolled in public schools. The age group of 3 to 4 year olds has the highest likelihood of being enrolled in private schools, with 5 (100.0% in the age bracket) enrolled. Conversely, the age group of 15 to 17 year olds has the lowest likelihood of being enrolled in a private school, with 8 (100.0% in the age bracket) attending a public institution.
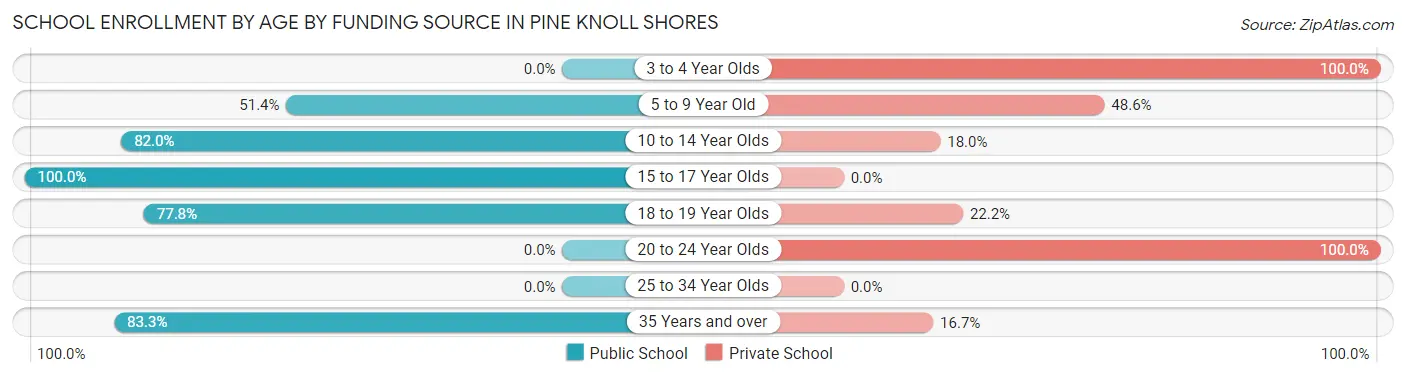
| Age Bracket | Public School | Private School |
| 3 to 4 Year Olds | 0 (0.0%) | 5 (100.0%) |
| 5 to 9 Year Old | 18 (51.4%) | 17 (48.6%) |
| 10 to 14 Year Olds | 41 (82.0%) | 9 (18.0%) |
| 15 to 17 Year Olds | 8 (100.0%) | 0 (0.0%) |
| 18 to 19 Year Olds | 7 (77.8%) | 2 (22.2%) |
| 20 to 24 Year Olds | 0 (0.0%) | 2 (100.0%) |
| 25 to 34 Year Olds | 0 (0.0%) | 0 (0.0%) |
| 35 Years and over | 20 (83.3%) | 4 (16.7%) |
| Total | 94 (70.7%) | 39 (29.3%) |
Educational Attainment by Field of Study in Pine Knoll Shores
Business (134 | 16.3%), education (126 | 15.3%), social sciences (99 | 12.0%), bio, nature & agricultural (65 | 7.9%), and science & technology (64 | 7.8%) are the most common fields of study among 822 individuals in Pine Knoll Shores who have obtained a bachelor's degree or higher.
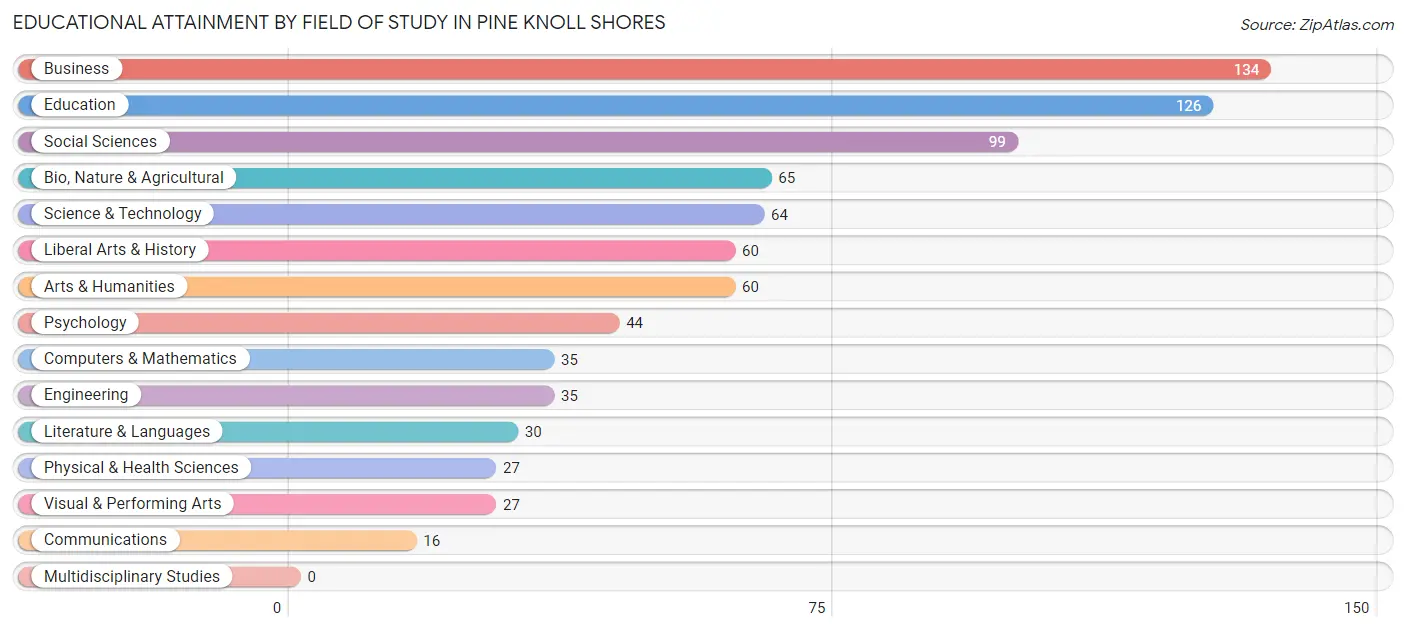
| Field of Study | # Graduates | % Graduates |
| Computers & Mathematics | 35 | 4.3% |
| Bio, Nature & Agricultural | 65 | 7.9% |
| Physical & Health Sciences | 27 | 3.3% |
| Psychology | 44 | 5.3% |
| Social Sciences | 99 | 12.0% |
| Engineering | 35 | 4.3% |
| Multidisciplinary Studies | 0 | 0.0% |
| Science & Technology | 64 | 7.8% |
| Business | 134 | 16.3% |
| Education | 126 | 15.3% |
| Literature & Languages | 30 | 3.6% |
| Liberal Arts & History | 60 | 7.3% |
| Visual & Performing Arts | 27 | 3.3% |
| Communications | 16 | 1.9% |
| Arts & Humanities | 60 | 7.3% |
| Total | 822 | 100.0% |
Transportation & Commute in Pine Knoll Shores
Vehicle Availability by Sex in Pine Knoll Shores
The most prevalent vehicle ownership categories in Pine Knoll Shores are males with 2 vehicles (145, accounting for 56.6%) and females with 2 vehicles (75, making up 84.8%).
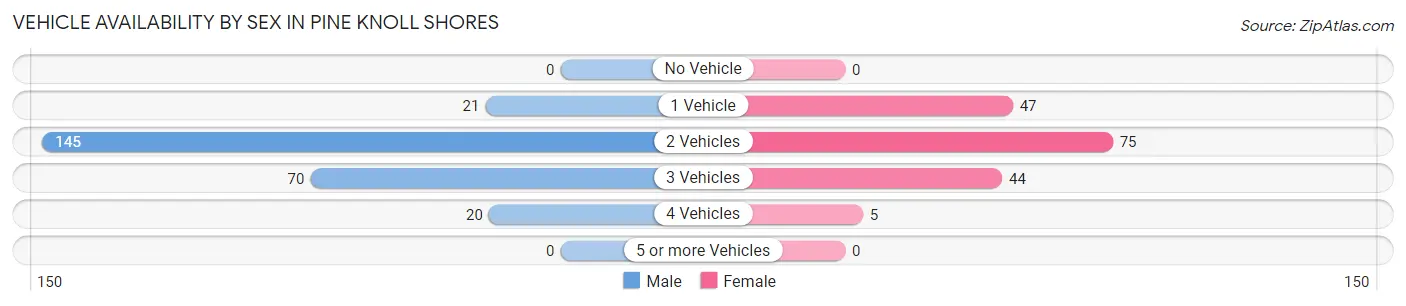
| Vehicles Available | Male | Female |
| No Vehicle | 0 (0.0%) | 0 (0.0%) |
| 1 Vehicle | 21 (8.2%) | 47 (27.5%) |
| 2 Vehicles | 145 (56.6%) | 75 (43.9%) |
| 3 Vehicles | 70 (27.3%) | 44 (25.7%) |
| 4 Vehicles | 20 (7.8%) | 5 (2.9%) |
| 5 or more Vehicles | 0 (0.0%) | 0 (0.0%) |
| Total | 256 (100.0%) | 171 (100.0%) |
Commute Time in Pine Knoll Shores
The most frequently occuring commute durations in Pine Knoll Shores are 15 to 19 minutes (68 commuters, 21.3%), 10 to 14 minutes (56 commuters, 17.5%), and 20 to 24 minutes (45 commuters, 14.1%).
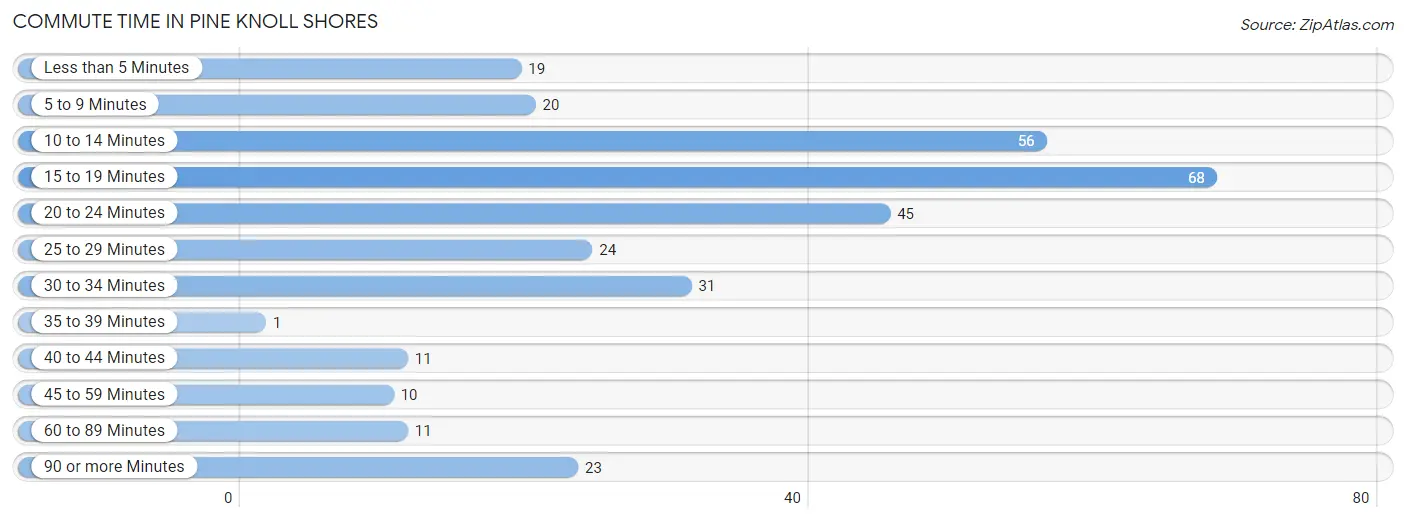
| Commute Time | # Commuters | % Commuters |
| Less than 5 Minutes | 19 | 6.0% |
| 5 to 9 Minutes | 20 | 6.3% |
| 10 to 14 Minutes | 56 | 17.5% |
| 15 to 19 Minutes | 68 | 21.3% |
| 20 to 24 Minutes | 45 | 14.1% |
| 25 to 29 Minutes | 24 | 7.5% |
| 30 to 34 Minutes | 31 | 9.7% |
| 35 to 39 Minutes | 1 | 0.3% |
| 40 to 44 Minutes | 11 | 3.5% |
| 45 to 59 Minutes | 10 | 3.1% |
| 60 to 89 Minutes | 11 | 3.5% |
| 90 or more Minutes | 23 | 7.2% |
Commute Time by Sex in Pine Knoll Shores
The most common commute times in Pine Knoll Shores are 15 to 19 minutes (39 commuters, 20.6%) for males and 10 to 14 minutes (35 commuters, 26.9%) for females.
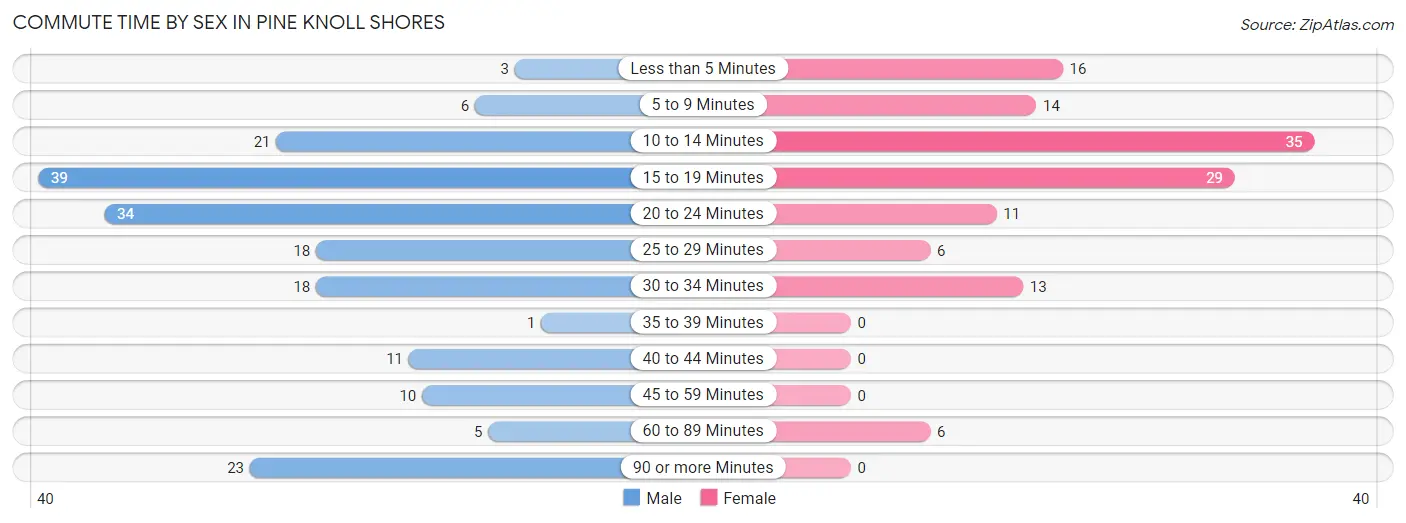
| Commute Time | Male | Female |
| Less than 5 Minutes | 3 (1.6%) | 16 (12.3%) |
| 5 to 9 Minutes | 6 (3.2%) | 14 (10.8%) |
| 10 to 14 Minutes | 21 (11.1%) | 35 (26.9%) |
| 15 to 19 Minutes | 39 (20.6%) | 29 (22.3%) |
| 20 to 24 Minutes | 34 (18.0%) | 11 (8.5%) |
| 25 to 29 Minutes | 18 (9.5%) | 6 (4.6%) |
| 30 to 34 Minutes | 18 (9.5%) | 13 (10.0%) |
| 35 to 39 Minutes | 1 (0.5%) | 0 (0.0%) |
| 40 to 44 Minutes | 11 (5.8%) | 0 (0.0%) |
| 45 to 59 Minutes | 10 (5.3%) | 0 (0.0%) |
| 60 to 89 Minutes | 5 (2.6%) | 6 (4.6%) |
| 90 or more Minutes | 23 (12.2%) | 0 (0.0%) |
Time of Departure to Work by Sex in Pine Knoll Shores
The most frequent times of departure to work in Pine Knoll Shores are 7:00 AM to 7:29 AM (45, 23.8%) for males and 7:30 AM to 7:59 AM (21, 16.2%) for females.
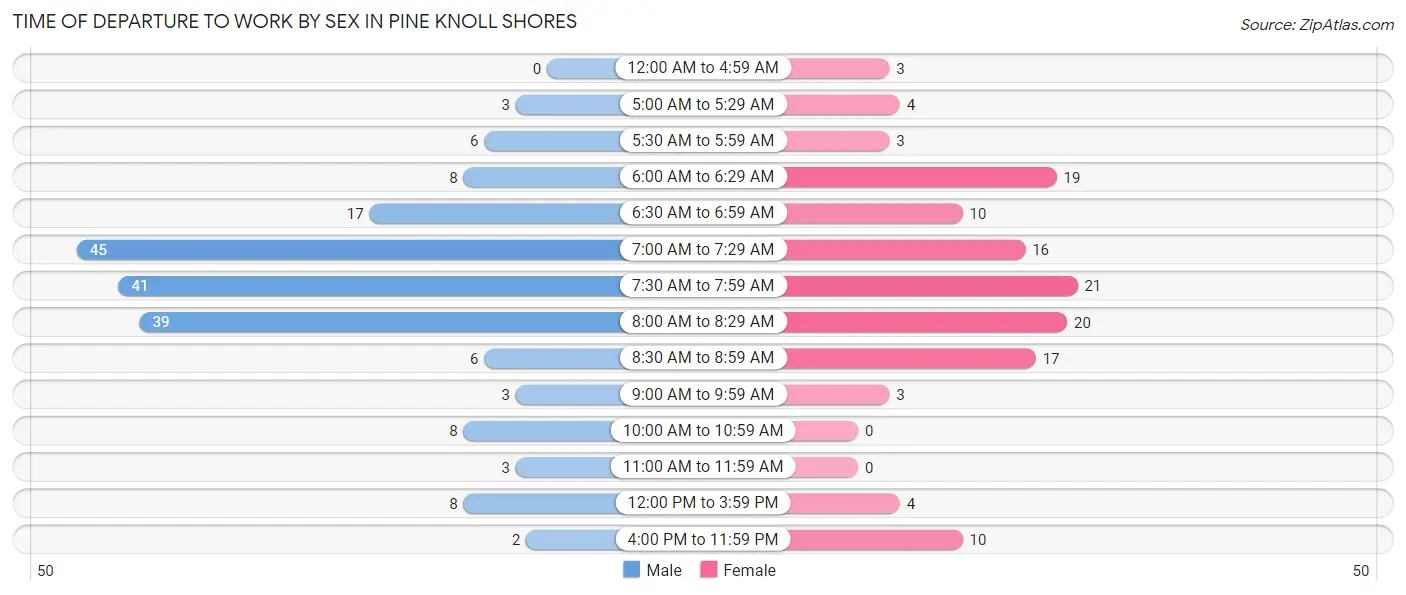
| Time of Departure | Male | Female |
| 12:00 AM to 4:59 AM | 0 (0.0%) | 3 (2.3%) |
| 5:00 AM to 5:29 AM | 3 (1.6%) | 4 (3.1%) |
| 5:30 AM to 5:59 AM | 6 (3.2%) | 3 (2.3%) |
| 6:00 AM to 6:29 AM | 8 (4.2%) | 19 (14.6%) |
| 6:30 AM to 6:59 AM | 17 (9.0%) | 10 (7.7%) |
| 7:00 AM to 7:29 AM | 45 (23.8%) | 16 (12.3%) |
| 7:30 AM to 7:59 AM | 41 (21.7%) | 21 (16.2%) |
| 8:00 AM to 8:29 AM | 39 (20.6%) | 20 (15.4%) |
| 8:30 AM to 8:59 AM | 6 (3.2%) | 17 (13.1%) |
| 9:00 AM to 9:59 AM | 3 (1.6%) | 3 (2.3%) |
| 10:00 AM to 10:59 AM | 8 (4.2%) | 0 (0.0%) |
| 11:00 AM to 11:59 AM | 3 (1.6%) | 0 (0.0%) |
| 12:00 PM to 3:59 PM | 8 (4.2%) | 4 (3.1%) |
| 4:00 PM to 11:59 PM | 2 (1.1%) | 10 (7.7%) |
| Total | 189 (100.0%) | 130 (100.0%) |
Housing Occupancy in Pine Knoll Shores
Occupancy by Ownership in Pine Knoll Shores
Of the total 691 dwellings in Pine Knoll Shores, owner-occupied units account for 657 (95.1%), while renter-occupied units make up 34 (4.9%).
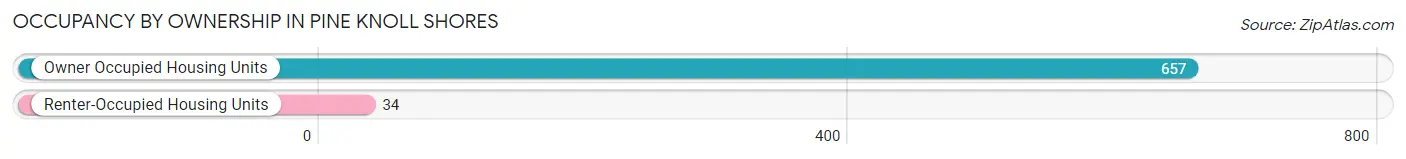
| Occupancy | # Housing Units | % Housing Units |
| Owner Occupied Housing Units | 657 | 95.1% |
| Renter-Occupied Housing Units | 34 | 4.9% |
| Total Occupied Housing Units | 691 | 100.0% |
Occupancy by Household Size in Pine Knoll Shores
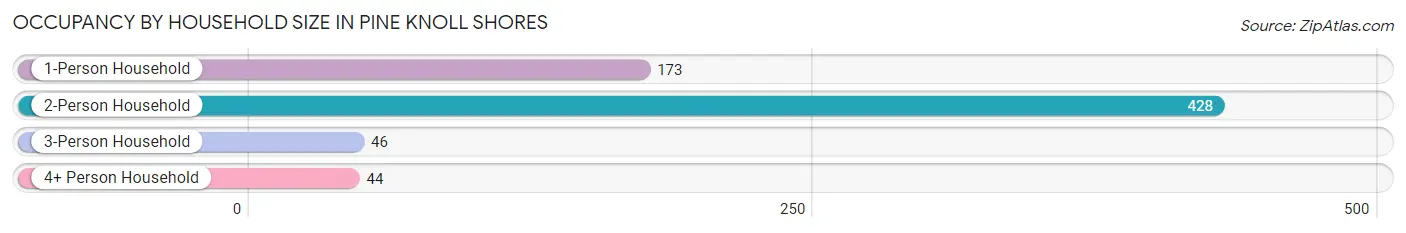
| Household Size | # Housing Units | % Housing Units |
| 1-Person Household | 173 | 25.0% |
| 2-Person Household | 428 | 61.9% |
| 3-Person Household | 46 | 6.7% |
| 4+ Person Household | 44 | 6.4% |
| Total Housing Units | 691 | 100.0% |
Occupancy by Ownership by Household Size in Pine Knoll Shores
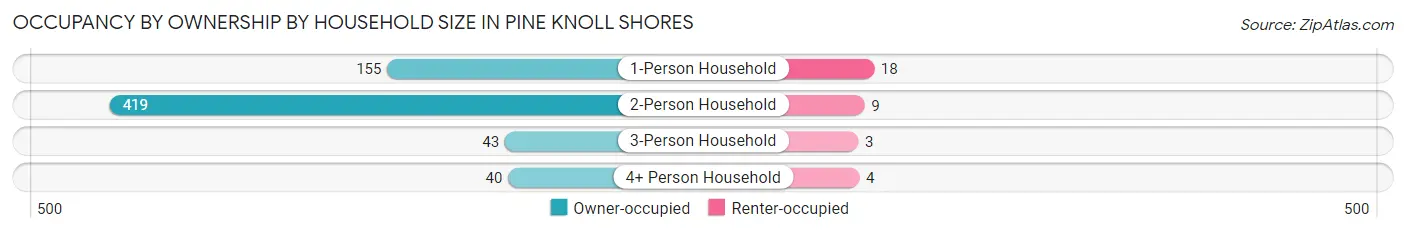
| Household Size | Owner-occupied | Renter-occupied |
| 1-Person Household | 155 (89.6%) | 18 (10.4%) |
| 2-Person Household | 419 (97.9%) | 9 (2.1%) |
| 3-Person Household | 43 (93.5%) | 3 (6.5%) |
| 4+ Person Household | 40 (90.9%) | 4 (9.1%) |
| Total Housing Units | 657 (95.1%) | 34 (4.9%) |
Occupancy by Educational Attainment in Pine Knoll Shores
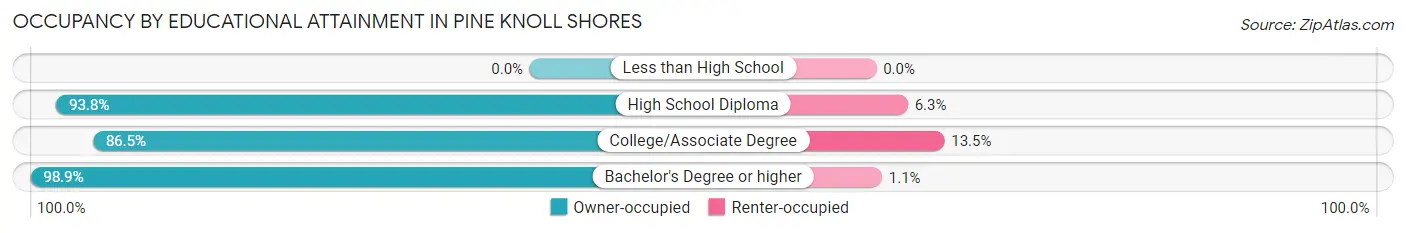
| Household Size | Owner-occupied | Renter-occupied |
| Less than High School | 0 (0.0%) | 0 (0.0%) |
| High School Diploma | 60 (93.8%) | 4 (6.2%) |
| College/Associate Degree | 160 (86.5%) | 25 (13.5%) |
| Bachelor's Degree or higher | 437 (98.9%) | 5 (1.1%) |
Occupancy by Age of Householder in Pine Knoll Shores
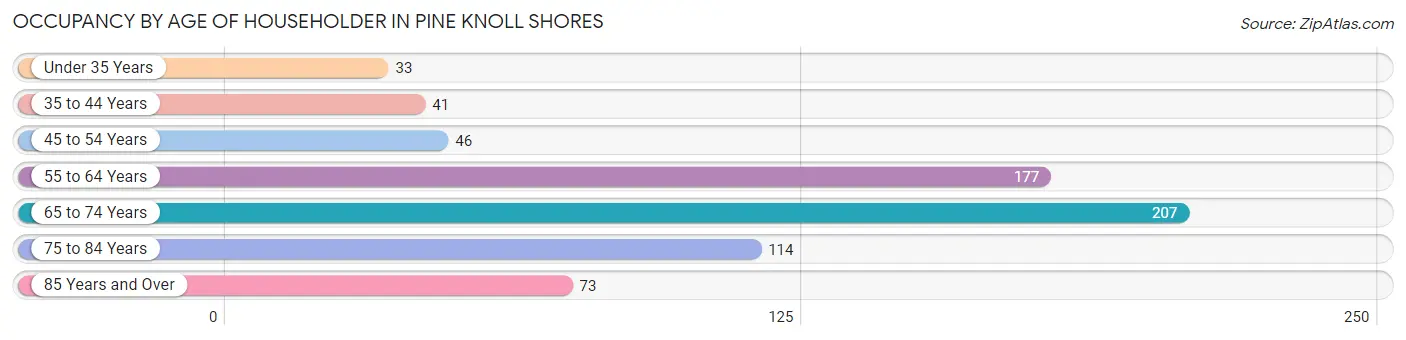
| Age Bracket | # Households | % Households |
| Under 35 Years | 33 | 4.8% |
| 35 to 44 Years | 41 | 5.9% |
| 45 to 54 Years | 46 | 6.7% |
| 55 to 64 Years | 177 | 25.6% |
| 65 to 74 Years | 207 | 30.0% |
| 75 to 84 Years | 114 | 16.5% |
| 85 Years and Over | 73 | 10.6% |
| Total | 691 | 100.0% |
Housing Finances in Pine Knoll Shores
Median Income by Occupancy in Pine Knoll Shores
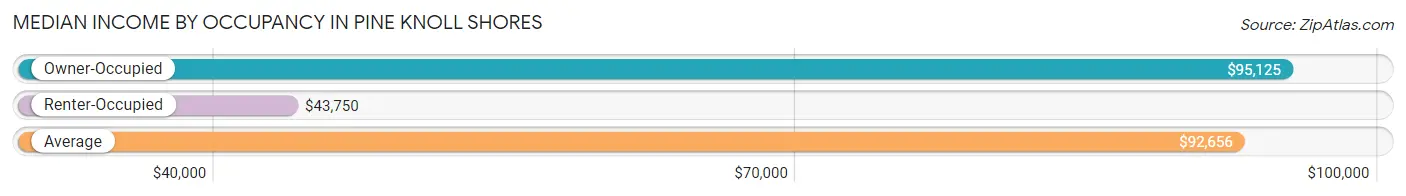
| Occupancy Type | # Households | Median Income |
| Owner-Occupied | 657 (95.1%) | $95,125 |
| Renter-Occupied | 34 (4.9%) | $43,750 |
| Average | 691 (100.0%) | $92,656 |
Occupancy by Householder Income Bracket in Pine Knoll Shores
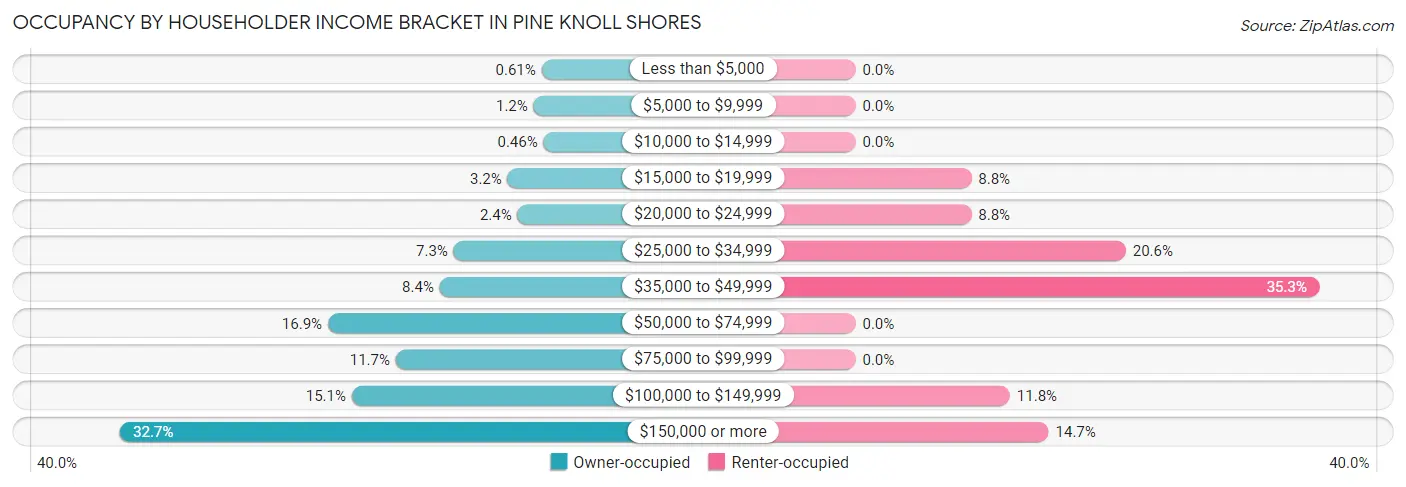
| Income Bracket | Owner-occupied | Renter-occupied |
| Less than $5,000 | 4 (0.6%) | 0 (0.0%) |
| $5,000 to $9,999 | 8 (1.2%) | 0 (0.0%) |
| $10,000 to $14,999 | 3 (0.5%) | 0 (0.0%) |
| $15,000 to $19,999 | 21 (3.2%) | 3 (8.8%) |
| $20,000 to $24,999 | 16 (2.4%) | 3 (8.8%) |
| $25,000 to $34,999 | 48 (7.3%) | 7 (20.6%) |
| $35,000 to $49,999 | 55 (8.4%) | 12 (35.3%) |
| $50,000 to $74,999 | 111 (16.9%) | 0 (0.0%) |
| $75,000 to $99,999 | 77 (11.7%) | 0 (0.0%) |
| $100,000 to $149,999 | 99 (15.1%) | 4 (11.8%) |
| $150,000 or more | 215 (32.7%) | 5 (14.7%) |
| Total | 657 (100.0%) | 34 (100.0%) |
Monthly Housing Cost Tiers in Pine Knoll Shores
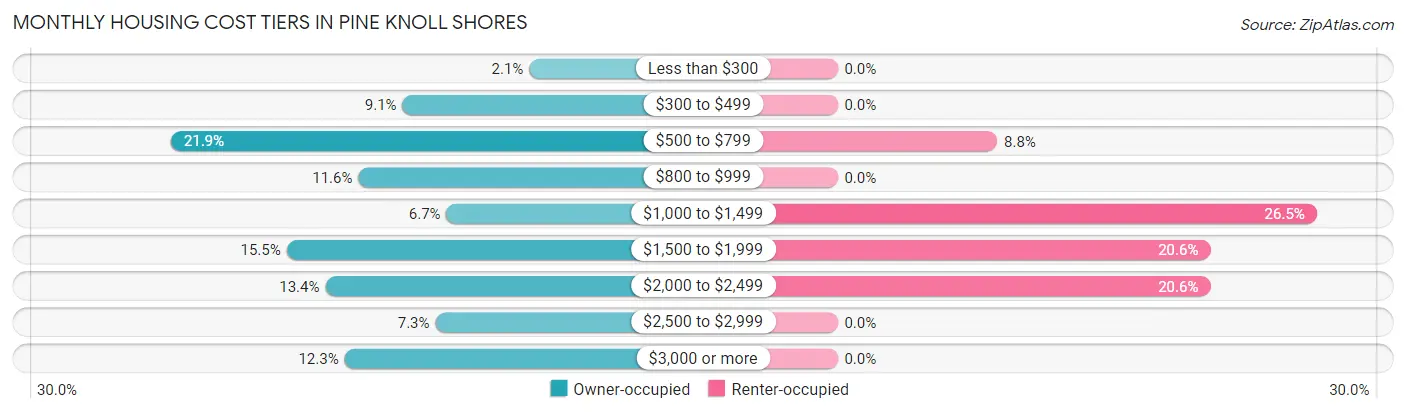
| Monthly Cost | Owner-occupied | Renter-occupied |
| Less than $300 | 14 (2.1%) | 0 (0.0%) |
| $300 to $499 | 60 (9.1%) | 0 (0.0%) |
| $500 to $799 | 144 (21.9%) | 3 (8.8%) |
| $800 to $999 | 76 (11.6%) | 0 (0.0%) |
| $1,000 to $1,499 | 44 (6.7%) | 9 (26.5%) |
| $1,500 to $1,999 | 102 (15.5%) | 7 (20.6%) |
| $2,000 to $2,499 | 88 (13.4%) | 7 (20.6%) |
| $2,500 to $2,999 | 48 (7.3%) | 0 (0.0%) |
| $3,000 or more | 81 (12.3%) | 0 (0.0%) |
| Total | 657 (100.0%) | 34 (100.0%) |
Physical Housing Characteristics in Pine Knoll Shores
Housing Structures in Pine Knoll Shores
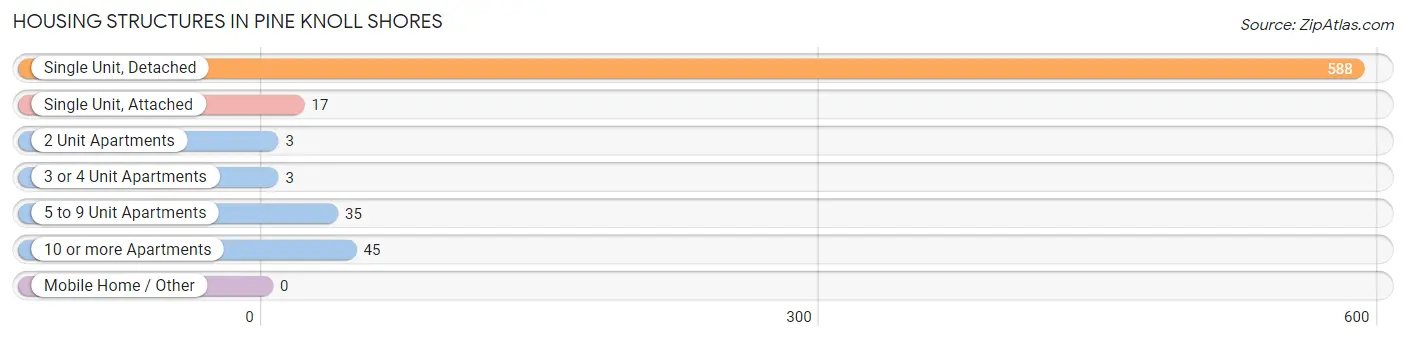
| Structure Type | # Housing Units | % Housing Units |
| Single Unit, Detached | 588 | 85.1% |
| Single Unit, Attached | 17 | 2.5% |
| 2 Unit Apartments | 3 | 0.4% |
| 3 or 4 Unit Apartments | 3 | 0.4% |
| 5 to 9 Unit Apartments | 35 | 5.1% |
| 10 or more Apartments | 45 | 6.5% |
| Mobile Home / Other | 0 | 0.0% |
| Total | 691 | 100.0% |
Housing Structures by Occupancy in Pine Knoll Shores
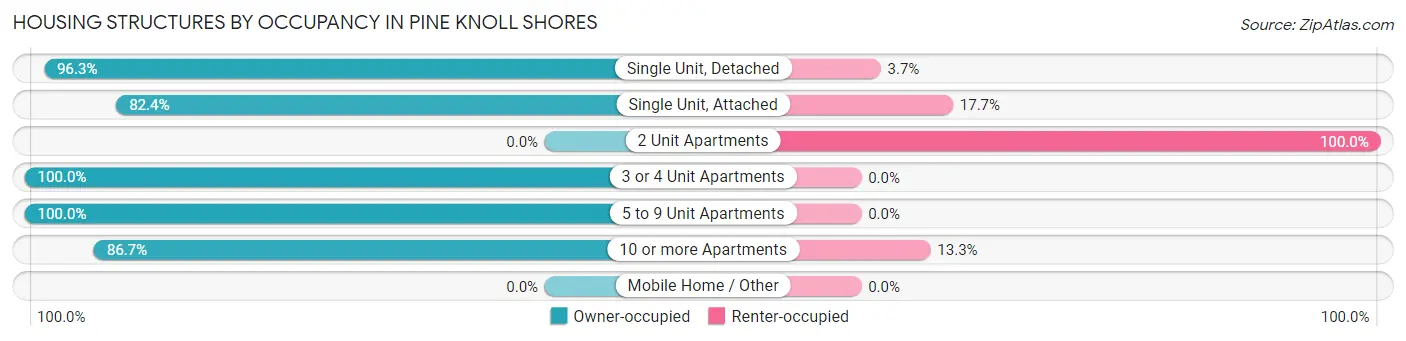
| Structure Type | Owner-occupied | Renter-occupied |
| Single Unit, Detached | 566 (96.3%) | 22 (3.7%) |
| Single Unit, Attached | 14 (82.4%) | 3 (17.6%) |
| 2 Unit Apartments | 0 (0.0%) | 3 (100.0%) |
| 3 or 4 Unit Apartments | 3 (100.0%) | 0 (0.0%) |
| 5 to 9 Unit Apartments | 35 (100.0%) | 0 (0.0%) |
| 10 or more Apartments | 39 (86.7%) | 6 (13.3%) |
| Mobile Home / Other | 0 (0.0%) | 0 (0.0%) |
| Total | 657 (95.1%) | 34 (4.9%) |
Housing Structures by Number of Rooms in Pine Knoll Shores
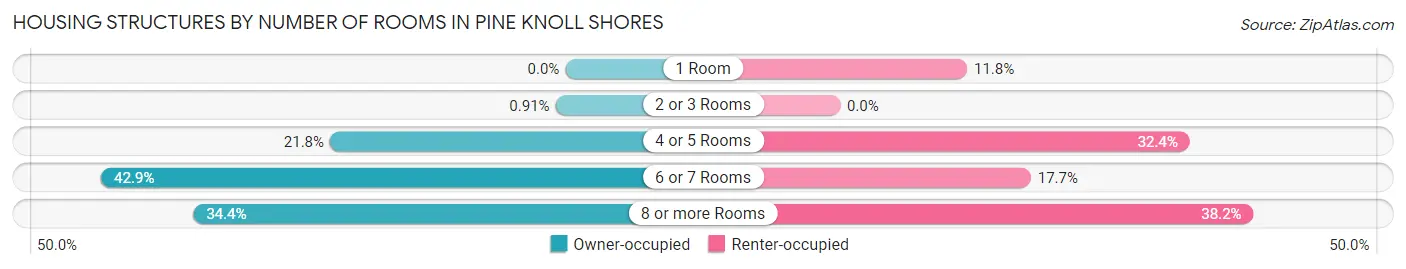
| Number of Rooms | Owner-occupied | Renter-occupied |
| 1 Room | 0 (0.0%) | 4 (11.8%) |
| 2 or 3 Rooms | 6 (0.9%) | 0 (0.0%) |
| 4 or 5 Rooms | 143 (21.8%) | 11 (32.4%) |
| 6 or 7 Rooms | 282 (42.9%) | 6 (17.6%) |
| 8 or more Rooms | 226 (34.4%) | 13 (38.2%) |
| Total | 657 (100.0%) | 34 (100.0%) |
Housing Structure by Heating Type in Pine Knoll Shores
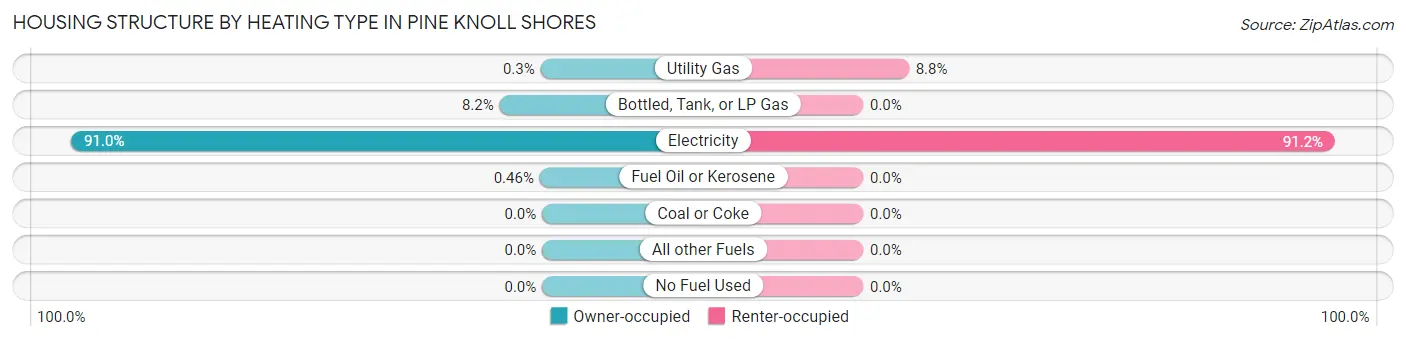
| Heating Type | Owner-occupied | Renter-occupied |
| Utility Gas | 2 (0.3%) | 3 (8.8%) |
| Bottled, Tank, or LP Gas | 54 (8.2%) | 0 (0.0%) |
| Electricity | 598 (91.0%) | 31 (91.2%) |
| Fuel Oil or Kerosene | 3 (0.5%) | 0 (0.0%) |
| Coal or Coke | 0 (0.0%) | 0 (0.0%) |
| All other Fuels | 0 (0.0%) | 0 (0.0%) |
| No Fuel Used | 0 (0.0%) | 0 (0.0%) |
| Total | 657 (100.0%) | 34 (100.0%) |
Household Vehicle Usage in Pine Knoll Shores
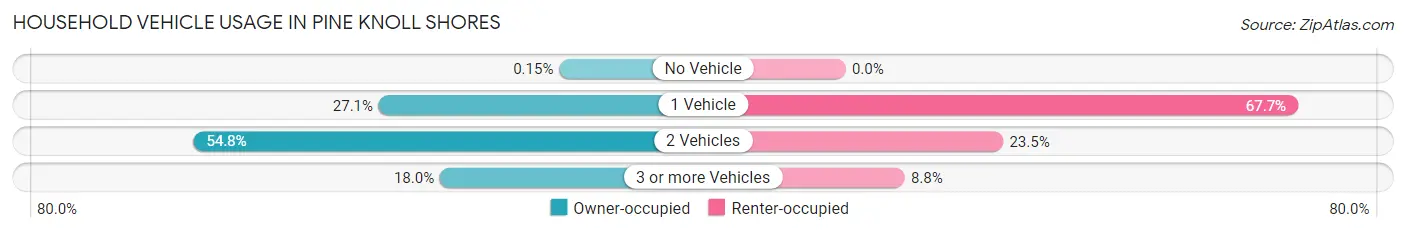
| Vehicles per Household | Owner-occupied | Renter-occupied |
| No Vehicle | 1 (0.2%) | 0 (0.0%) |
| 1 Vehicle | 178 (27.1%) | 23 (67.6%) |
| 2 Vehicles | 360 (54.8%) | 8 (23.5%) |
| 3 or more Vehicles | 118 (18.0%) | 3 (8.8%) |
| Total | 657 (100.0%) | 34 (100.0%) |
Real Estate & Mortgages in Pine Knoll Shores
Real Estate and Mortgage Overview in Pine Knoll Shores
| Characteristic | Without Mortgage | With Mortgage |
| Housing Units | 356 | 301 |
| Median Property Value | $458,200 | $547,500 |
| Median Household Income | $73,750 | $125 |
| Monthly Housing Costs | $696 | $81 |
| Real Estate Taxes | $2,318 | $0 |
Property Value by Mortgage Status in Pine Knoll Shores
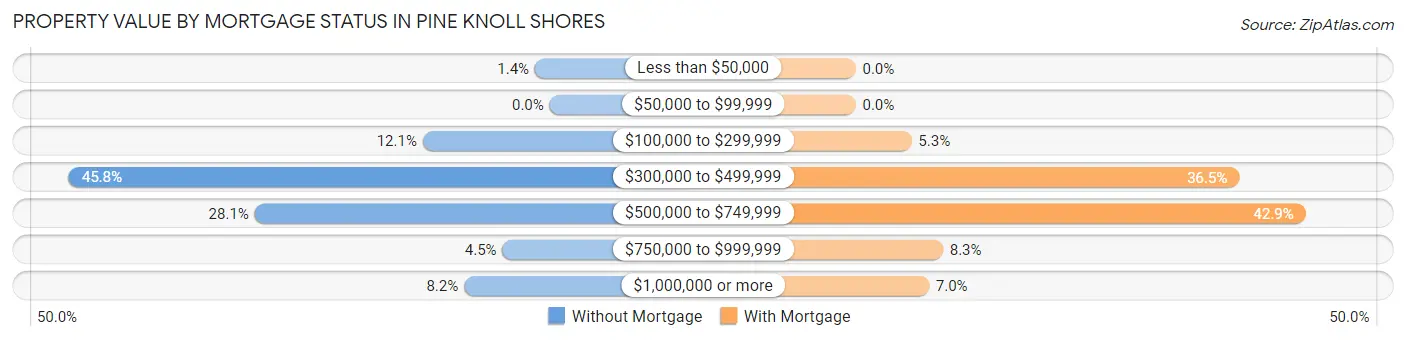
| Property Value | Without Mortgage | With Mortgage |
| Less than $50,000 | 5 (1.4%) | 0 (0.0%) |
| $50,000 to $99,999 | 0 (0.0%) | 0 (0.0%) |
| $100,000 to $299,999 | 43 (12.1%) | 16 (5.3%) |
| $300,000 to $499,999 | 163 (45.8%) | 110 (36.5%) |
| $500,000 to $749,999 | 100 (28.1%) | 129 (42.9%) |
| $750,000 to $999,999 | 16 (4.5%) | 25 (8.3%) |
| $1,000,000 or more | 29 (8.2%) | 21 (7.0%) |
| Total | 356 (100.0%) | 301 (100.0%) |
Household Income by Mortgage Status in Pine Knoll Shores
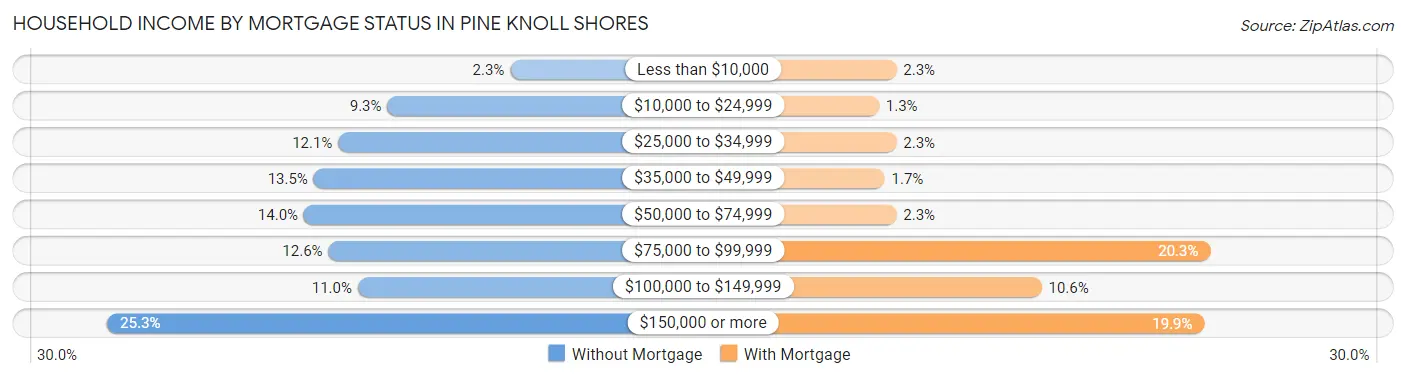
| Household Income | Without Mortgage | With Mortgage |
| Less than $10,000 | 8 (2.2%) | 7 (2.3%) |
| $10,000 to $24,999 | 33 (9.3%) | 4 (1.3%) |
| $25,000 to $34,999 | 43 (12.1%) | 7 (2.3%) |
| $35,000 to $49,999 | 48 (13.5%) | 5 (1.7%) |
| $50,000 to $74,999 | 50 (14.0%) | 7 (2.3%) |
| $75,000 to $99,999 | 45 (12.6%) | 61 (20.3%) |
| $100,000 to $149,999 | 39 (11.0%) | 32 (10.6%) |
| $150,000 or more | 90 (25.3%) | 60 (19.9%) |
| Total | 356 (100.0%) | 301 (100.0%) |
Property Value to Household Income Ratio in Pine Knoll Shores
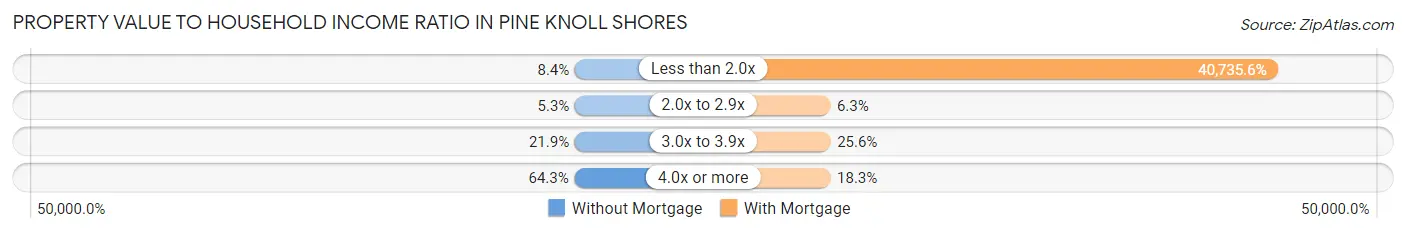
| Value-to-Income Ratio | Without Mortgage | With Mortgage |
| Less than 2.0x | 30 (8.4%) | 122,614 (40,735.6%) |
| 2.0x to 2.9x | 19 (5.3%) | 19 (6.3%) |
| 3.0x to 3.9x | 78 (21.9%) | 77 (25.6%) |
| 4.0x or more | 229 (64.3%) | 55 (18.3%) |
| Total | 356 (100.0%) | 301 (100.0%) |
Real Estate Taxes by Mortgage Status in Pine Knoll Shores
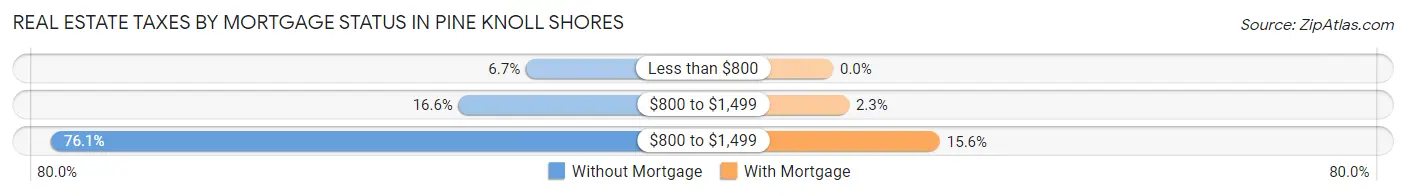
| Property Taxes | Without Mortgage | With Mortgage |
| Less than $800 | 24 (6.7%) | 0 (0.0%) |
| $800 to $1,499 | 59 (16.6%) | 7 (2.3%) |
| $800 to $1,499 | 271 (76.1%) | 47 (15.6%) |
| Total | 356 (100.0%) | 301 (100.0%) |
Health & Disability in Pine Knoll Shores
Health Insurance Coverage by Age in Pine Knoll Shores
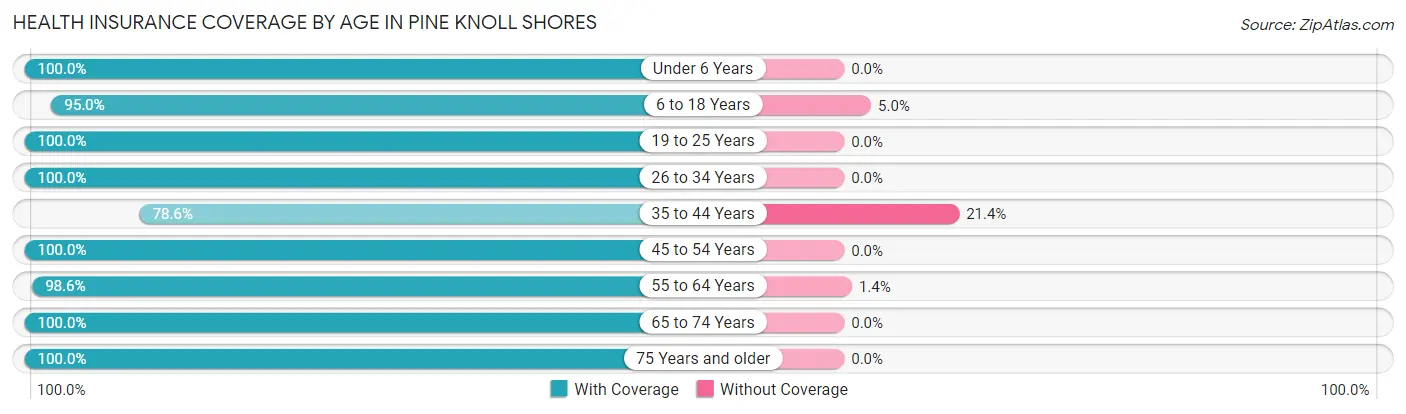
| Age Bracket | With Coverage | Without Coverage |
| Under 6 Years | 41 (100.0%) | 0 (0.0%) |
| 6 to 18 Years | 76 (95.0%) | 4 (5.0%) |
| 19 to 25 Years | 18 (100.0%) | 0 (0.0%) |
| 26 to 34 Years | 44 (100.0%) | 0 (0.0%) |
| 35 to 44 Years | 88 (78.6%) | 24 (21.4%) |
| 45 to 54 Years | 80 (100.0%) | 0 (0.0%) |
| 55 to 64 Years | 275 (98.6%) | 4 (1.4%) |
| 65 to 74 Years | 391 (100.0%) | 0 (0.0%) |
| 75 Years and older | 311 (100.0%) | 0 (0.0%) |
| Total | 1,324 (97.6%) | 32 (2.4%) |
Health Insurance Coverage by Citizenship Status in Pine Knoll Shores
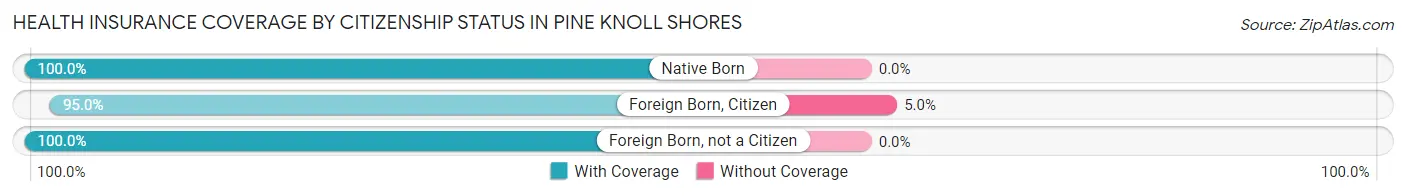
| Citizenship Status | With Coverage | Without Coverage |
| Native Born | 41 (100.0%) | 0 (0.0%) |
| Foreign Born, Citizen | 76 (95.0%) | 4 (5.0%) |
| Foreign Born, not a Citizen | 18 (100.0%) | 0 (0.0%) |
Health Insurance Coverage by Household Income in Pine Knoll Shores
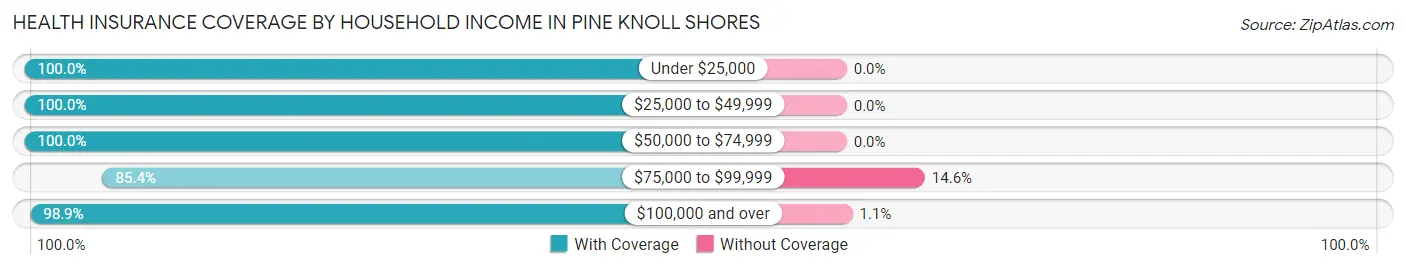
| Household Income | With Coverage | Without Coverage |
| Under $25,000 | 84 (100.0%) | 0 (0.0%) |
| $25,000 to $49,999 | 173 (100.0%) | 0 (0.0%) |
| $50,000 to $74,999 | 186 (100.0%) | 0 (0.0%) |
| $75,000 to $99,999 | 140 (85.4%) | 24 (14.6%) |
| $100,000 and over | 732 (98.9%) | 8 (1.1%) |
Public vs Private Health Insurance Coverage by Age in Pine Knoll Shores
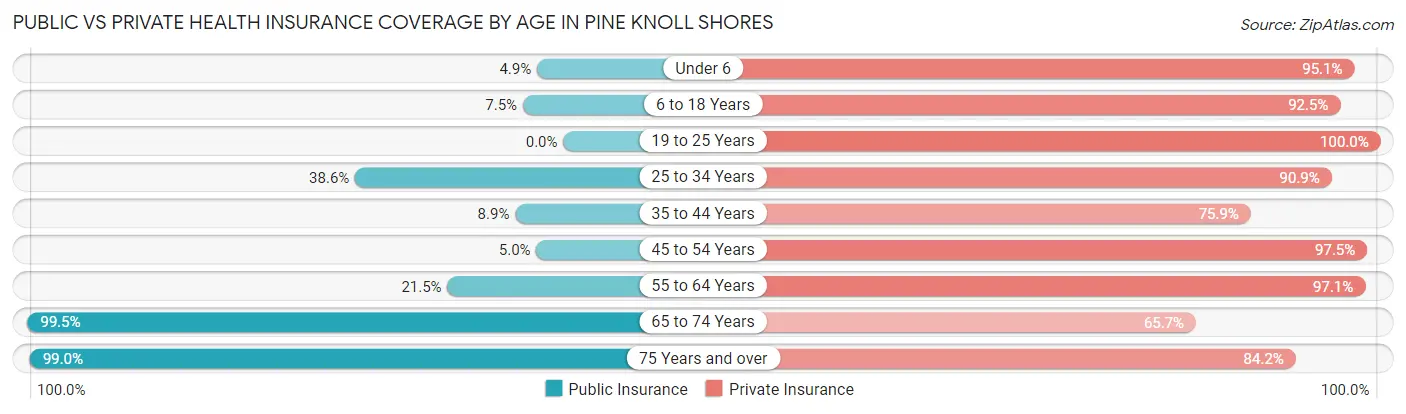
| Age Bracket | Public Insurance | Private Insurance |
| Under 6 | 2 (4.9%) | 39 (95.1%) |
| 6 to 18 Years | 6 (7.5%) | 74 (92.5%) |
| 19 to 25 Years | 0 (0.0%) | 18 (100.0%) |
| 25 to 34 Years | 17 (38.6%) | 40 (90.9%) |
| 35 to 44 Years | 10 (8.9%) | 85 (75.9%) |
| 45 to 54 Years | 4 (5.0%) | 78 (97.5%) |
| 55 to 64 Years | 60 (21.5%) | 271 (97.1%) |
| 65 to 74 Years | 389 (99.5%) | 257 (65.7%) |
| 75 Years and over | 308 (99.0%) | 262 (84.2%) |
| Total | 796 (58.7%) | 1,124 (82.9%) |
Disability Status by Sex by Age in Pine Knoll Shores
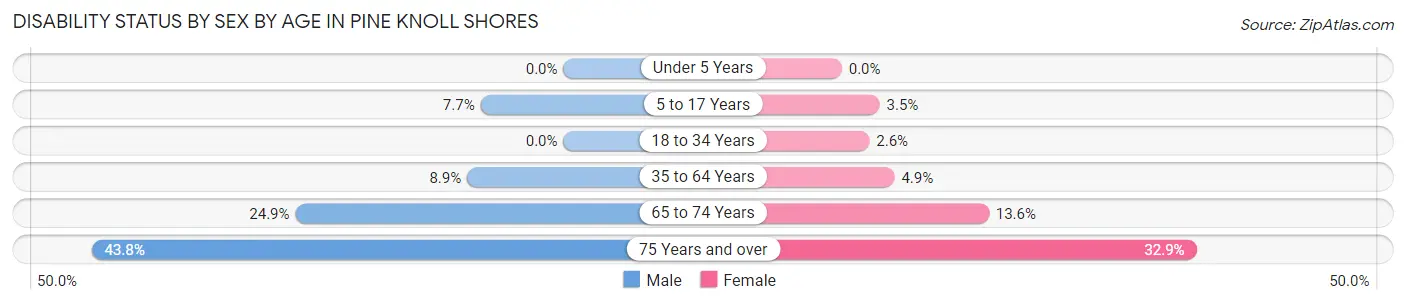
| Age Bracket | Male | Female |
| Under 5 Years | 0 (0.0%) | 0 (0.0%) |
| 5 to 17 Years | 3 (7.7%) | 2 (3.5%) |
| 18 to 34 Years | 0 (0.0%) | 1 (2.6%) |
| 35 to 64 Years | 22 (8.9%) | 11 (4.9%) |
| 65 to 74 Years | 48 (24.9%) | 27 (13.6%) |
| 75 Years and over | 67 (43.8%) | 52 (32.9%) |
Disability Class by Sex by Age in Pine Knoll Shores
Disability Class: Hearing Difficulty
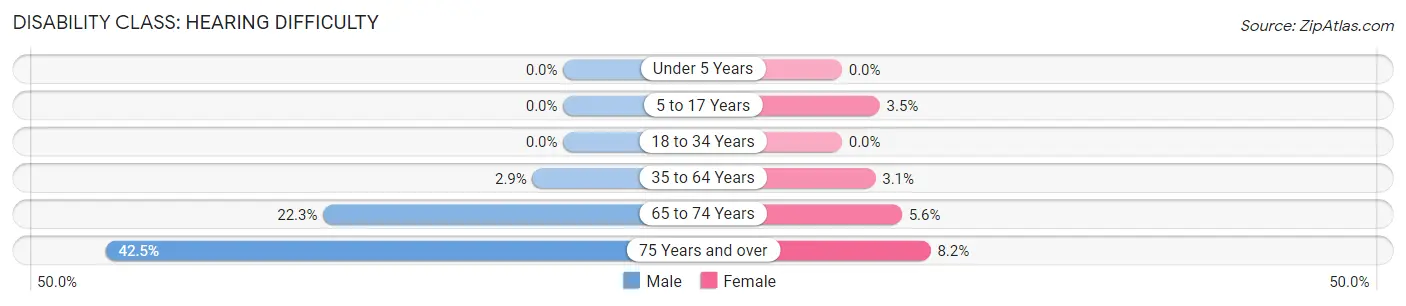
| Age Bracket | Male | Female |
| Under 5 Years | 0 (0.0%) | 0 (0.0%) |
| 5 to 17 Years | 0 (0.0%) | 2 (3.5%) |
| 18 to 34 Years | 0 (0.0%) | 0 (0.0%) |
| 35 to 64 Years | 7 (2.9%) | 7 (3.1%) |
| 65 to 74 Years | 43 (22.3%) | 11 (5.6%) |
| 75 Years and over | 65 (42.5%) | 13 (8.2%) |
Disability Class: Vision Difficulty
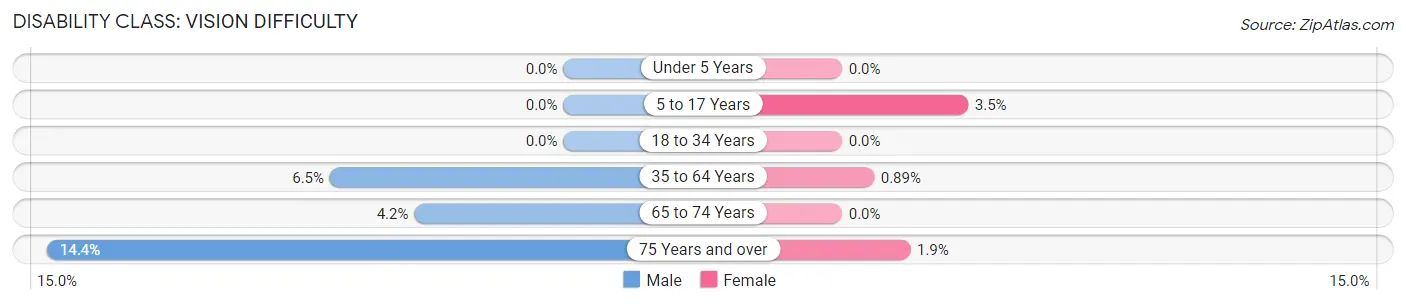
| Age Bracket | Male | Female |
| Under 5 Years | 0 (0.0%) | 0 (0.0%) |
| 5 to 17 Years | 0 (0.0%) | 2 (3.5%) |
| 18 to 34 Years | 0 (0.0%) | 0 (0.0%) |
| 35 to 64 Years | 16 (6.5%) | 2 (0.9%) |
| 65 to 74 Years | 8 (4.2%) | 0 (0.0%) |
| 75 Years and over | 22 (14.4%) | 3 (1.9%) |
Disability Class: Cognitive Difficulty
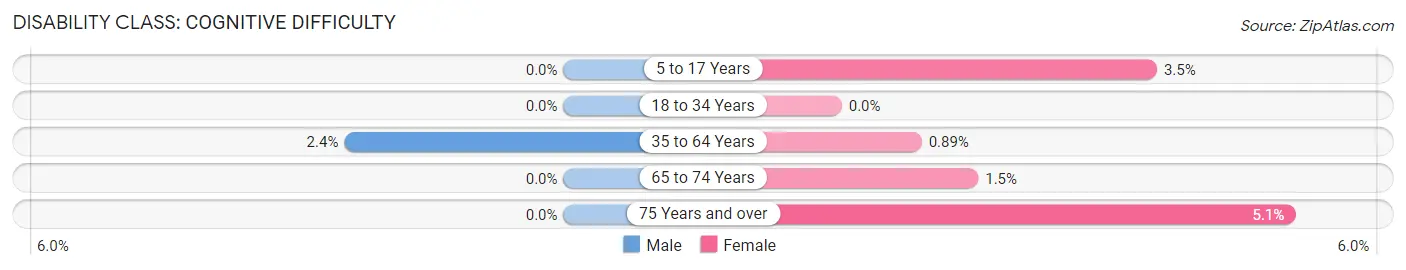
| Age Bracket | Male | Female |
| 5 to 17 Years | 0 (0.0%) | 2 (3.5%) |
| 18 to 34 Years | 0 (0.0%) | 0 (0.0%) |
| 35 to 64 Years | 6 (2.4%) | 2 (0.9%) |
| 65 to 74 Years | 0 (0.0%) | 3 (1.5%) |
| 75 Years and over | 0 (0.0%) | 8 (5.1%) |
Disability Class: Ambulatory Difficulty
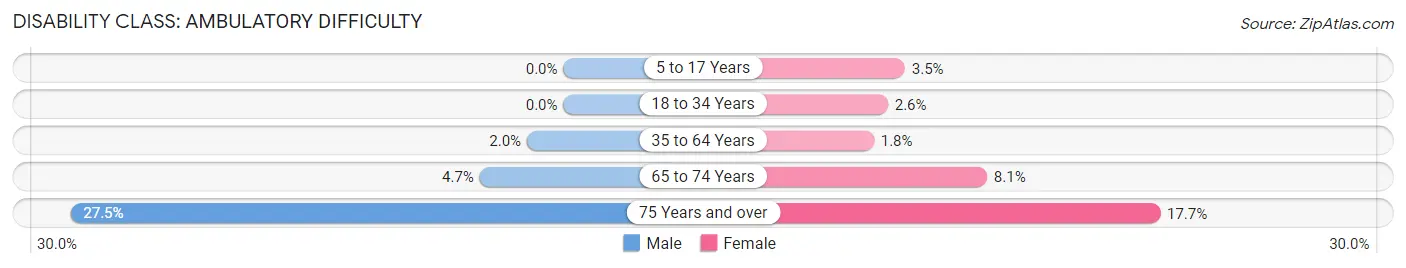
| Age Bracket | Male | Female |
| 5 to 17 Years | 0 (0.0%) | 2 (3.5%) |
| 18 to 34 Years | 0 (0.0%) | 1 (2.6%) |
| 35 to 64 Years | 5 (2.0%) | 4 (1.8%) |
| 65 to 74 Years | 9 (4.7%) | 16 (8.1%) |
| 75 Years and over | 42 (27.5%) | 28 (17.7%) |
Disability Class: Self-Care Difficulty
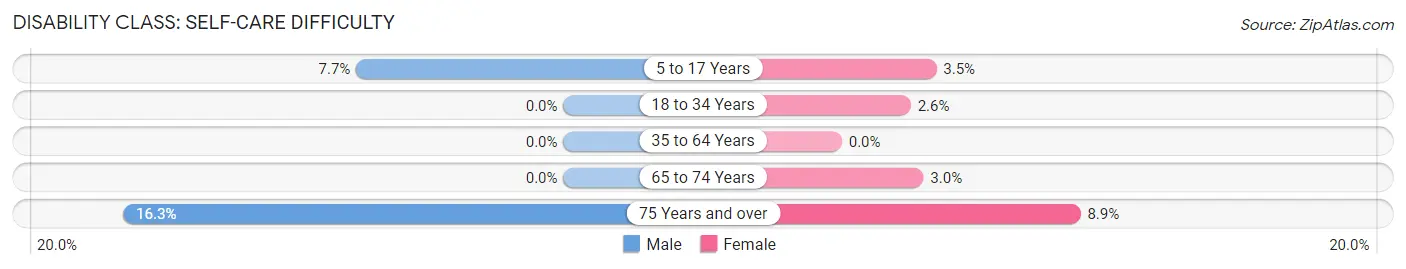
| Age Bracket | Male | Female |
| 5 to 17 Years | 3 (7.7%) | 2 (3.5%) |
| 18 to 34 Years | 0 (0.0%) | 1 (2.6%) |
| 35 to 64 Years | 0 (0.0%) | 0 (0.0%) |
| 65 to 74 Years | 0 (0.0%) | 6 (3.0%) |
| 75 Years and over | 25 (16.3%) | 14 (8.9%) |
Technology Access in Pine Knoll Shores
Computing Device Access in Pine Knoll Shores
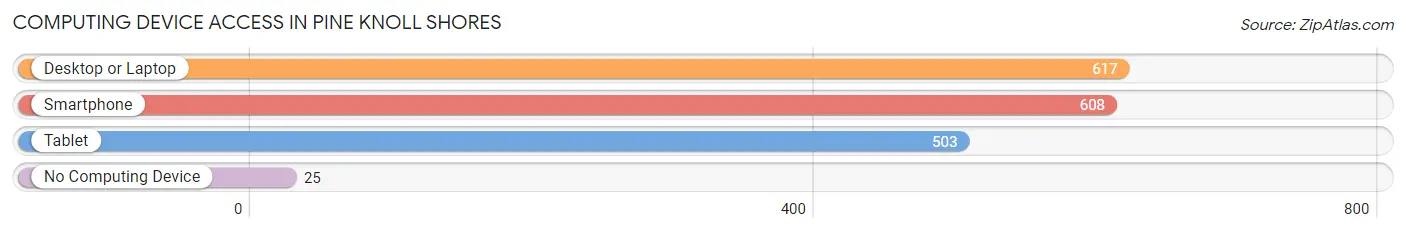
| Device Type | # Households | % Households |
| Desktop or Laptop | 617 | 89.3% |
| Smartphone | 608 | 88.0% |
| Tablet | 503 | 72.8% |
| No Computing Device | 25 | 3.6% |
| Total | 691 | 100.0% |
Internet Access in Pine Knoll Shores
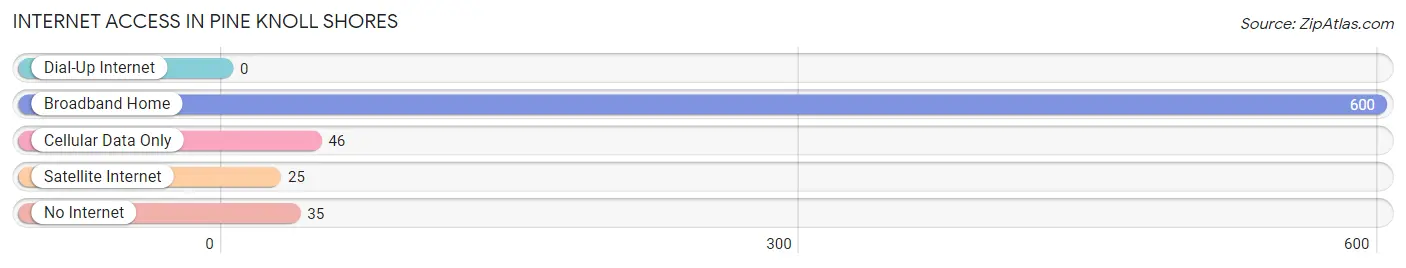
| Internet Type | # Households | % Households |
| Dial-Up Internet | 0 | 0.0% |
| Broadband Home | 600 | 86.8% |
| Cellular Data Only | 46 | 6.7% |
| Satellite Internet | 25 | 3.6% |
| No Internet | 35 | 5.1% |
| Total | 691 | 100.0% |
Pine Knoll Shores Summary
Pine Knoll Shores is a small town located in Carteret County, North Carolina. It is situated on the southern end of Bogue Banks, a barrier island that stretches along the coast of North Carolina. The town is bordered by the Atlantic Ocean to the east and the Bogue Sound to the west. It is part of the Crystal Coast, a region of the North Carolina coast that is known for its beautiful beaches and abundant wildlife.
History
Pine Knoll Shores was first settled in the late 1800s by a group of fishermen and farmers. The town was originally known as “Piney Knoll” and was home to a small fishing village. In the early 1900s, the town was renamed “Pine Knoll Shores” and began to attract more visitors. The town was incorporated in 1953 and has since grown to become a popular tourist destination.
Geography
Pine Knoll Shores is located on the southern end of Bogue Banks, a barrier island that stretches along the coast of North Carolina. The town is bordered by the Atlantic Ocean to the east and the Bogue Sound to the west. It is part of the Crystal Coast, a region of the North Carolina coast that is known for its beautiful beaches and abundant wildlife. The town is situated on a narrow strip of land between the ocean and the sound, and is home to a variety of wildlife, including sea turtles, dolphins, and a variety of birds.
Economy
Pine Knoll Shores is a popular tourist destination, and the town’s economy is largely based on tourism. The town is home to a variety of hotels, restaurants, and shops, as well as a number of attractions, such as the North Carolina Aquarium at Pine Knoll Shores and the Pine Knoll Shores Nature Center. The town also has a thriving fishing industry, and is home to a number of charter fishing boats.
Demographics
As of the 2010 census, the population of Pine Knoll Shores was 1,845. The town is predominantly white, with 87.3% of the population identifying as such. The median household income in the town is $50,945, and the median age is 53. The town is home to a variety of religious denominations, with the largest being Baptist (25.3%), Methodist (17.2%), and Catholic (14.2%).
Pine Knoll Shores is a small town with a rich history and a vibrant economy. The town is home to a variety of attractions, including the North Carolina Aquarium at Pine Knoll Shores and the Pine Knoll Shores Nature Center. The town is predominantly white, with a median household income of $50,945 and a median age of 53. The town is home to a variety of religious denominations, with the largest being Baptist, Methodist, and Catholic.
Common Questions
What is Per Capita Income in Pine Knoll Shores?
Per Capita income in Pine Knoll Shores is $69,925.
What is the Median Family Income in Pine Knoll Shores?
Median Family Income in Pine Knoll Shores is $115,000.
What is the Median Household income in Pine Knoll Shores?
Median Household Income in Pine Knoll Shores is $92,656.
What is Income or Wage Gap in Pine Knoll Shores?
Income or Wage Gap in Pine Knoll Shores is 13.8%.
Women in Pine Knoll Shores earn 86.2 cents for every dollar earned by a man.
What is Inequality or Gini Index in Pine Knoll Shores?
Inequality or Gini Index in Pine Knoll Shores is 0.49.
What is the Total Population of Pine Knoll Shores?
Total Population of Pine Knoll Shores is 1,363.
What is the Total Male Population of Pine Knoll Shores?
Total Male Population of Pine Knoll Shores is 673.
What is the Total Female Population of Pine Knoll Shores?
Total Female Population of Pine Knoll Shores is 690.
What is the Ratio of Males per 100 Females in Pine Knoll Shores?
There are 97.54 Males per 100 Females in Pine Knoll Shores.
What is the Ratio of Females per 100 Males in Pine Knoll Shores?
There are 102.53 Females per 100 Males in Pine Knoll Shores.
What is the Median Population Age in Pine Knoll Shores?
Median Population Age in Pine Knoll Shores is 66.0 Years.
What is the Average Family Size in Pine Knoll Shores
Average Family Size in Pine Knoll Shores is 2.3 People.
What is the Average Household Size in Pine Knoll Shores
Average Household Size in Pine Knoll Shores is 2.0 People.
How Large is the Labor Force in Pine Knoll Shores?
There are 466 People in the Labor Forcein in Pine Knoll Shores.
What is the Percentage of People in the Labor Force in Pine Knoll Shores?
37.3% of People are in the Labor Force in Pine Knoll Shores.
What is the Unemployment Rate in Pine Knoll Shores?
Unemployment Rate in Pine Knoll Shores is 3.3%.