Murraysville, NC Map & Demographics
Murraysville Map
Murraysville Overview
$39,695
PER CAPITA INCOME
$89,464
AVG FAMILY INCOME
$76,154
AVG HOUSEHOLD INCOME
17.1%
WAGE / INCOME GAP [ % ]
82.9¢/ $1
WAGE / INCOME GAP [ $ ]
0.36
INEQUALITY / GINI INDEX
16,672
TOTAL POPULATION
7,975
MALE POPULATION
8,697
FEMALE POPULATION
91.70
MALES / 100 FEMALES
109.05
FEMALES / 100 MALES
36.5
MEDIAN AGE
2.9
AVG FAMILY SIZE
2.3
AVG HOUSEHOLD SIZE
10,583
LABOR FORCE [ PEOPLE ]
75.5%
PERCENT IN LABOR FORCE
4.2%
UNEMPLOYMENT RATE
Income in Murraysville
Income Overview in Murraysville
Per Capita Income in Murraysville is $39,695, while median incomes of families and households are $89,464 and $76,154 respectively.
| Characteristic | Number | Measure |
| Per Capita Income | 16,672 | $39,695 |
| Median Family Income | 4,408 | $89,464 |
| Mean Family Income | 4,408 | $100,773 |
| Median Household Income | 7,366 | $76,154 |
| Mean Household Income | 7,366 | $89,692 |
| Income Deficit | 4,408 | $0 |
| Wage / Income Gap (%) | 16,672 | 17.08% |
| Wage / Income Gap ($) | 16,672 | 82.92¢ per $1 |
| Gini / Inequality Index | 16,672 | 0.36 |
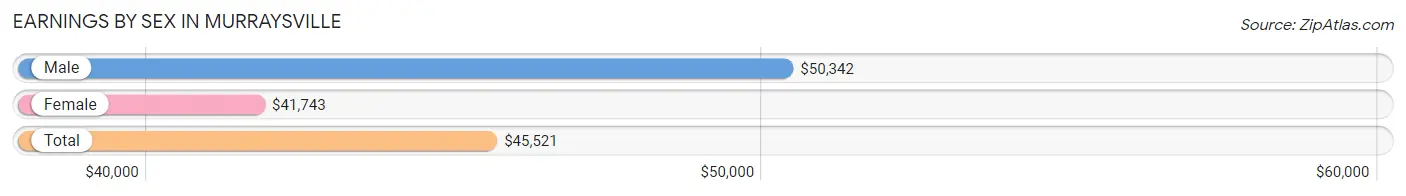
Earnings by Sex in Murraysville
Average Earnings in Murraysville are $45,521, $50,342 for men and $41,743 for women, a difference of 17.1%.
| Sex | Number | Average Earnings |
| Male | 5,216 (49.4%) | $50,342 |
| Female | 5,341 (50.6%) | $41,743 |
| Total | 10,557 (100.0%) | $45,521 |
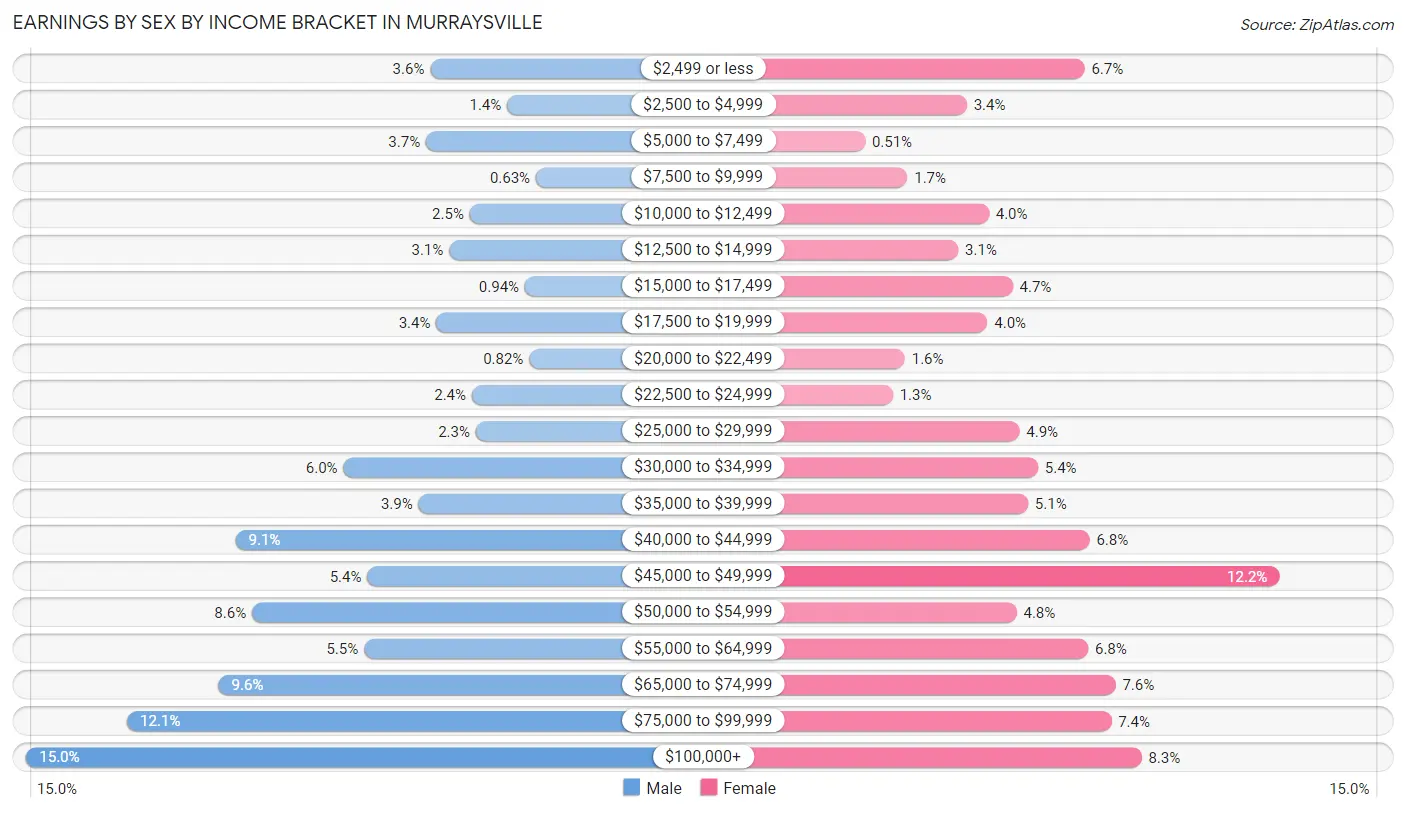
Earnings by Sex by Income Bracket in Murraysville
The most common earnings brackets in Murraysville are $100,000+ for men (780 | 14.9%) and $45,000 to $49,999 for women (649 | 12.1%).
| Income | Male | Female |
| $2,499 or less | 188 (3.6%) | 357 (6.7%) |
| $2,500 to $4,999 | 75 (1.4%) | 180 (3.4%) |
| $5,000 to $7,499 | 194 (3.7%) | 27 (0.5%) |
| $7,500 to $9,999 | 33 (0.6%) | 91 (1.7%) |
| $10,000 to $12,499 | 130 (2.5%) | 213 (4.0%) |
| $12,500 to $14,999 | 160 (3.1%) | 167 (3.1%) |
| $15,000 to $17,499 | 49 (0.9%) | 249 (4.7%) |
| $17,500 to $19,999 | 179 (3.4%) | 211 (4.0%) |
| $20,000 to $22,499 | 43 (0.8%) | 87 (1.6%) |
| $22,500 to $24,999 | 127 (2.4%) | 69 (1.3%) |
| $25,000 to $29,999 | 121 (2.3%) | 259 (4.9%) |
| $30,000 to $34,999 | 315 (6.0%) | 287 (5.4%) |
| $35,000 to $39,999 | 205 (3.9%) | 272 (5.1%) |
| $40,000 to $44,999 | 473 (9.1%) | 364 (6.8%) |
| $45,000 to $49,999 | 280 (5.4%) | 649 (12.1%) |
| $50,000 to $54,999 | 449 (8.6%) | 255 (4.8%) |
| $55,000 to $64,999 | 285 (5.5%) | 362 (6.8%) |
| $65,000 to $74,999 | 498 (9.6%) | 403 (7.5%) |
| $75,000 to $99,999 | 632 (12.1%) | 397 (7.4%) |
| $100,000+ | 780 (14.9%) | 442 (8.3%) |
| Total | 5,216 (100.0%) | 5,341 (100.0%) |
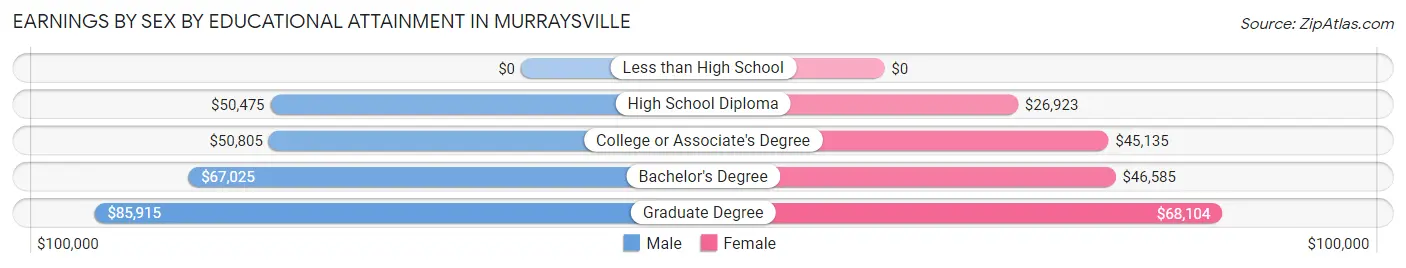
Earnings by Sex by Educational Attainment in Murraysville
Average earnings in Murraysville are $54,304 for men and $45,635 for women, a difference of 16.0%. Men with an educational attainment of graduate degree enjoy the highest average annual earnings of $85,915, while those with high school diploma education earn the least with $50,475. Women with an educational attainment of graduate degree earn the most with the average annual earnings of $68,104, while those with high school diploma education have the smallest earnings of $26,923.
| Educational Attainment | Male Income | Female Income |
| Less than High School | - | - |
| High School Diploma | $50,475 | $26,923 |
| College or Associate's Degree | $50,805 | $45,135 |
| Bachelor's Degree | $67,025 | $46,585 |
| Graduate Degree | $85,915 | $68,104 |
| Total | $54,304 | $45,635 |
Family Income in Murraysville
Family Income Brackets in Murraysville
According to the Murraysville family income data, there are 1,106 families falling into the $100,000 to $149,999 income range, which is the most common income bracket and makes up 25.1% of all families. Conversely, the $10,000 to $14,999 income bracket is the least frequent group with only 26 families (0.6%) belonging to this category.
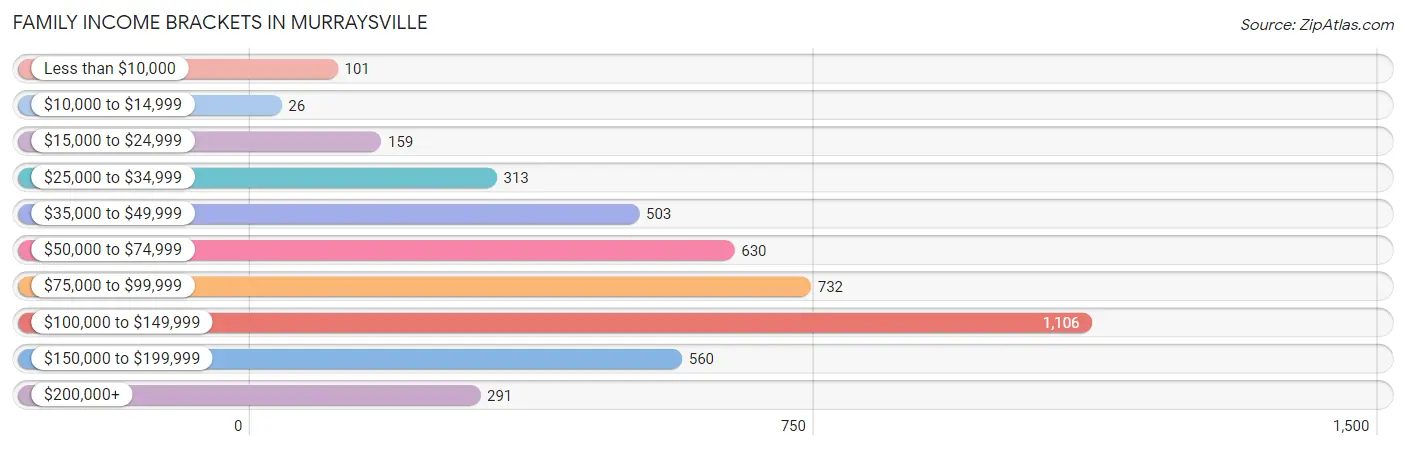
| Income Bracket | # Families | % Families |
| Less than $10,000 | 101 | 2.3% |
| $10,000 to $14,999 | 26 | 0.6% |
| $15,000 to $24,999 | 159 | 3.6% |
| $25,000 to $34,999 | 313 | 7.1% |
| $35,000 to $49,999 | 503 | 11.4% |
| $50,000 to $74,999 | 630 | 14.3% |
| $75,000 to $99,999 | 732 | 16.6% |
| $100,000 to $149,999 | 1,106 | 25.1% |
| $150,000 to $199,999 | 560 | 12.7% |
| $200,000+ | 291 | 6.6% |
Family Income by Famaliy Size in Murraysville
5-person families (159 | 3.6%) account for the highest median family income in Murraysville with $155,972 per family, while 2-person families (2,308 | 52.4%) have the highest median income of $40,986 per family member.
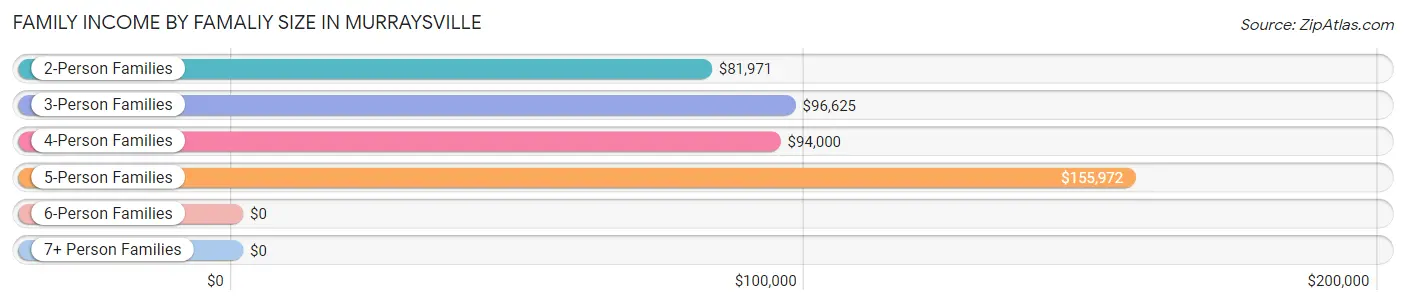
| Income Bracket | # Families | Median Income |
| 2-Person Families | 2,308 (52.4%) | $81,971 |
| 3-Person Families | 1,156 (26.2%) | $96,625 |
| 4-Person Families | 672 (15.2%) | $94,000 |
| 5-Person Families | 159 (3.6%) | $155,972 |
| 6-Person Families | 79 (1.8%) | $0 |
| 7+ Person Families | 34 (0.8%) | $0 |
| Total | 4,408 (100.0%) | $89,464 |
Family Income by Number of Earners in Murraysville
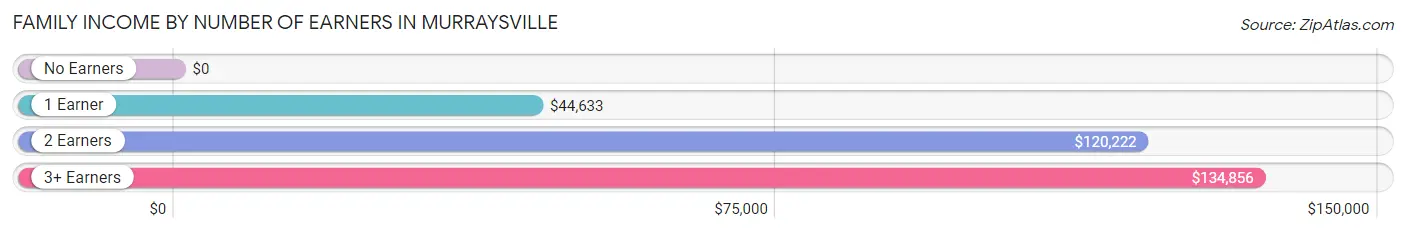
| Number of Earners | # Families | Median Income |
| No Earners | 491 (11.1%) | $0 |
| 1 Earner | 1,287 (29.2%) | $44,633 |
| 2 Earners | 2,213 (50.2%) | $120,222 |
| 3+ Earners | 417 (9.5%) | $134,856 |
| Total | 4,408 (100.0%) | $89,464 |
Household Income in Murraysville
Household Income Brackets in Murraysville
With 1,547 households falling in the category, the $50,000 to $74,999 income range is the most frequent in Murraysville, accounting for 21.0% of all households. In contrast, only 74 households (1.0%) fall into the $10,000 to $14,999 income bracket, making it the least populous group.
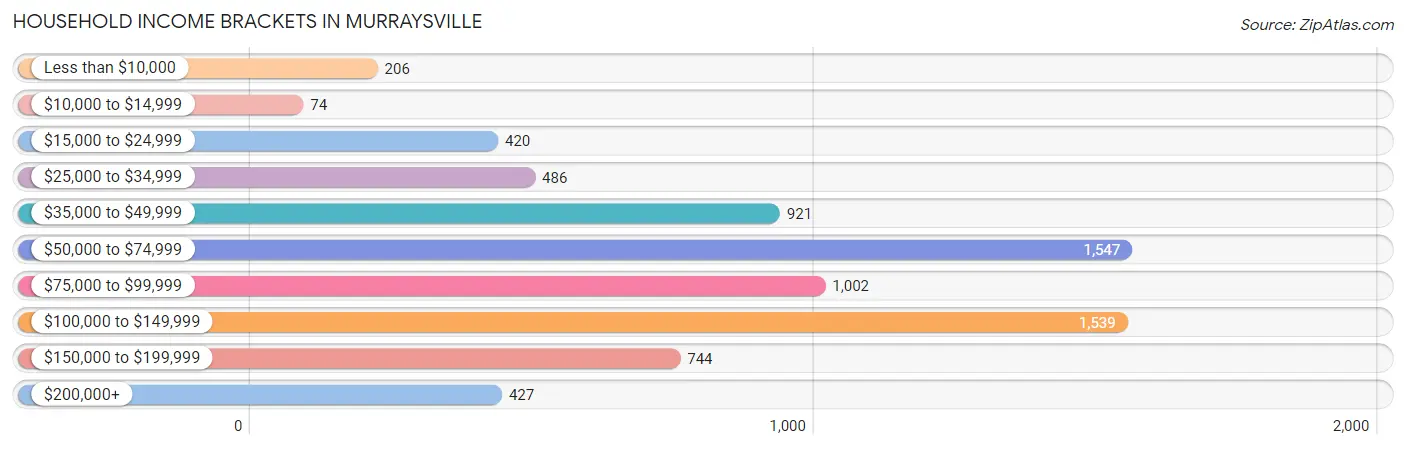
| Income Bracket | # Households | % Households |
| Less than $10,000 | 206 | 2.8% |
| $10,000 to $14,999 | 74 | 1.0% |
| $15,000 to $24,999 | 420 | 5.7% |
| $25,000 to $34,999 | 486 | 6.6% |
| $35,000 to $49,999 | 921 | 12.5% |
| $50,000 to $74,999 | 1,547 | 21.0% |
| $75,000 to $99,999 | 1,002 | 13.6% |
| $100,000 to $149,999 | 1,539 | 20.9% |
| $150,000 to $199,999 | 744 | 10.1% |
| $200,000+ | 427 | 5.8% |
Household Income by Householder Age in Murraysville
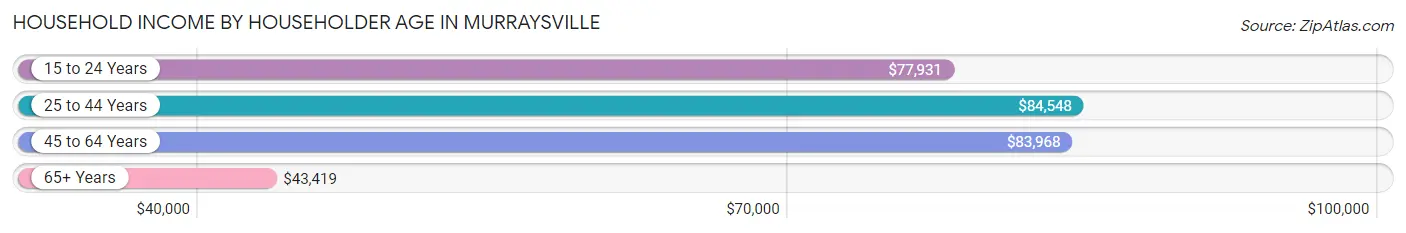
The median household income in Murraysville is $76,154, with the highest median household income of $84,548 found in the 25 to 44 years age bracket for the primary householder. A total of 2,419 households (32.8%) fall into this category. Meanwhile, the 65+ years age bracket for the primary householder has the lowest median household income of $43,419, with 1,413 households (19.2%) in this group.
| Income Bracket | # Households | Median Income |
| 15 to 24 Years | 750 (10.2%) | $77,931 |
| 25 to 44 Years | 2,419 (32.8%) | $84,548 |
| 45 to 64 Years | 2,784 (37.8%) | $83,968 |
| 65+ Years | 1,413 (19.2%) | $43,419 |
| Total | 7,366 (100.0%) | $76,154 |
Poverty in Murraysville
Income Below Poverty by Sex and Age in Murraysville
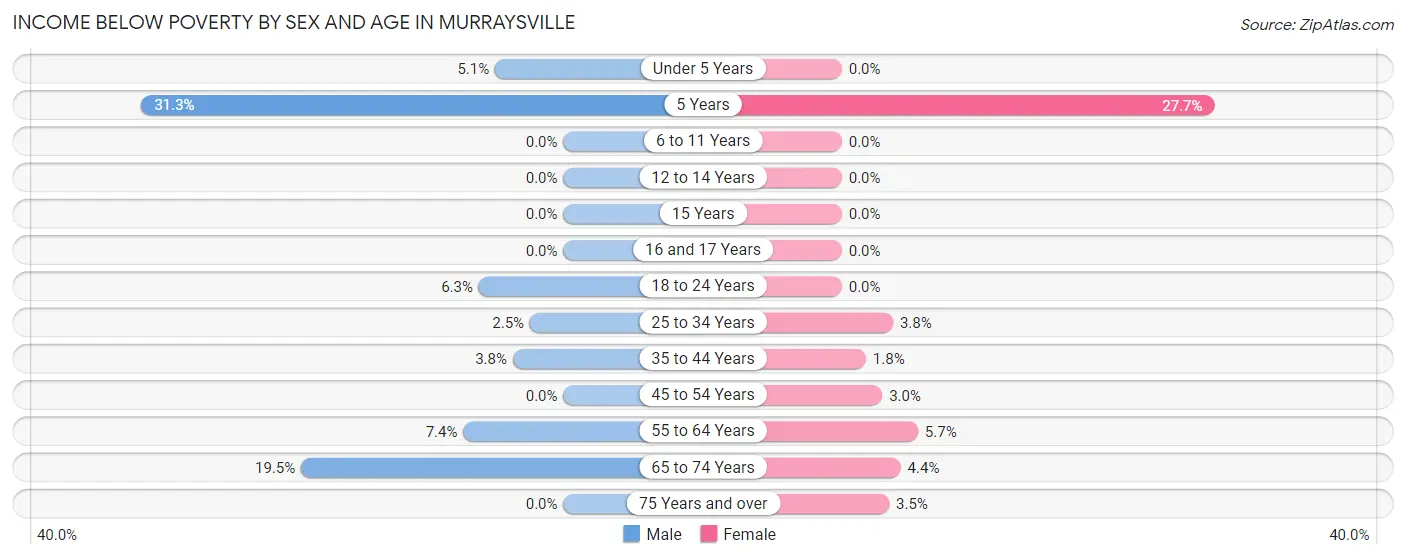
With 4.3% poverty level for males and 3.0% for females among the residents of Murraysville, 5 year old males and 5 year old females are the most vulnerable to poverty, with 21 males (31.3%) and 39 females (27.7%) in their respective age groups living below the poverty level.
| Age Bracket | Male | Female |
| Under 5 Years | 22 (5.1%) | 0 (0.0%) |
| 5 Years | 21 (31.3%) | 39 (27.7%) |
| 6 to 11 Years | 0 (0.0%) | 0 (0.0%) |
| 12 to 14 Years | 0 (0.0%) | 0 (0.0%) |
| 15 Years | 0 (0.0%) | 0 (0.0%) |
| 16 and 17 Years | 0 (0.0%) | 0 (0.0%) |
| 18 to 24 Years | 80 (6.3%) | 0 (0.0%) |
| 25 to 34 Years | 33 (2.5%) | 52 (3.8%) |
| 35 to 44 Years | 33 (3.7%) | 20 (1.8%) |
| 45 to 54 Years | 0 (0.0%) | 42 (3.0%) |
| 55 to 64 Years | 55 (7.4%) | 52 (5.7%) |
| 65 to 74 Years | 95 (19.5%) | 38 (4.4%) |
| 75 Years and over | 0 (0.0%) | 19 (3.5%) |
| Total | 339 (4.3%) | 262 (3.0%) |
Income Above Poverty by Sex and Age in Murraysville
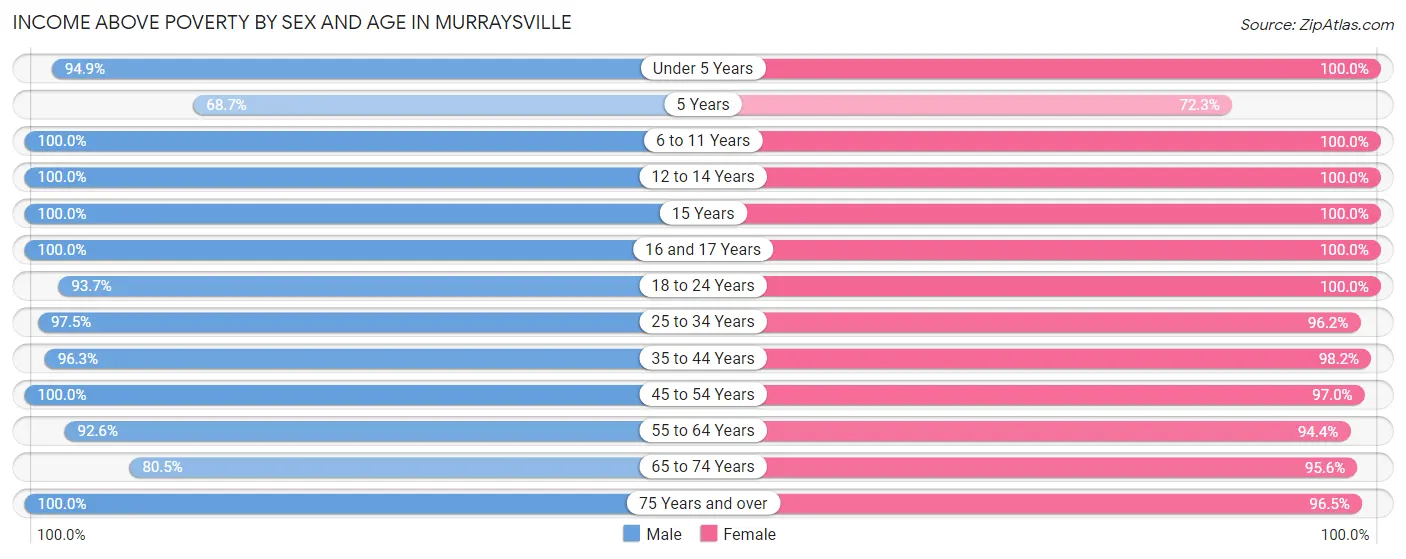
According to the poverty statistics in Murraysville, males aged 6 to 11 years and females aged under 5 years are the age groups that are most secure financially, with 100.0% of males and 100.0% of females in these age groups living above the poverty line.
| Age Bracket | Male | Female |
| Under 5 Years | 412 (94.9%) | 318 (100.0%) |
| 5 Years | 46 (68.7%) | 102 (72.3%) |
| 6 to 11 Years | 353 (100.0%) | 616 (100.0%) |
| 12 to 14 Years | 154 (100.0%) | 230 (100.0%) |
| 15 Years | 314 (100.0%) | 28 (100.0%) |
| 16 and 17 Years | 286 (100.0%) | 203 (100.0%) |
| 18 to 24 Years | 1,194 (93.7%) | 939 (100.0%) |
| 25 to 34 Years | 1,295 (97.5%) | 1,316 (96.2%) |
| 35 to 44 Years | 847 (96.3%) | 1,100 (98.2%) |
| 45 to 54 Years | 1,364 (100.0%) | 1,360 (97.0%) |
| 55 to 64 Years | 685 (92.6%) | 868 (94.4%) |
| 65 to 74 Years | 393 (80.5%) | 832 (95.6%) |
| 75 Years and over | 293 (100.0%) | 523 (96.5%) |
| Total | 7,636 (95.8%) | 8,435 (97.0%) |
Income Below Poverty Among Married-Couple Families in Murraysville
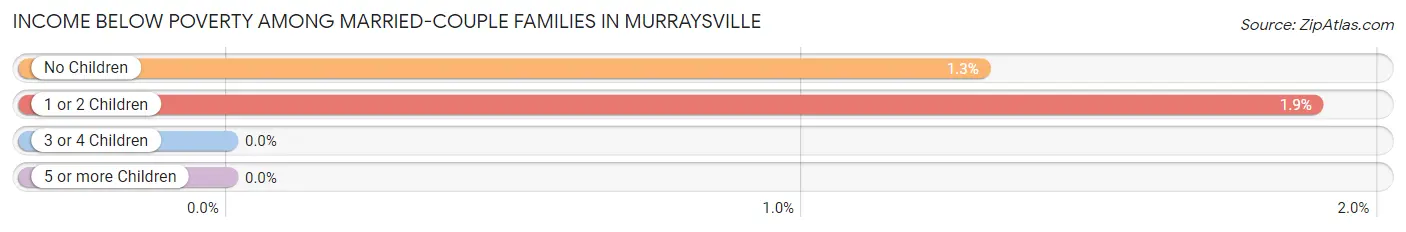
The poverty statistics for married-couple families in Murraysville show that 1.5% or 47 of the total 3,225 families live below the poverty line. Families with 1 or 2 children have the highest poverty rate of 1.9%, comprising of 22 families. On the other hand, families with 3 or 4 children have the lowest poverty rate of 0.0%, which includes 0 families.
| Children | Above Poverty | Below Poverty |
| No Children | 1,884 (98.7%) | 25 (1.3%) |
| 1 or 2 Children | 1,142 (98.1%) | 22 (1.9%) |
| 3 or 4 Children | 152 (100.0%) | 0 (0.0%) |
| 5 or more Children | 0 (0.0%) | 0 (0.0%) |
| Total | 3,178 (98.5%) | 47 (1.5%) |
Income Below Poverty Among Single-Parent Households in Murraysville
According to the poverty data in Murraysville, 14.0% or 66 single-father households and 5.3% or 38 single-mother households are living below the poverty line. Among single-father households, those with no children have the highest poverty rate, with 66 households (21.8%) experiencing poverty. Likewise, among single-mother households, those with 1 or 2 children have the highest poverty rate, with 34 households (7.6%) falling below the poverty line.
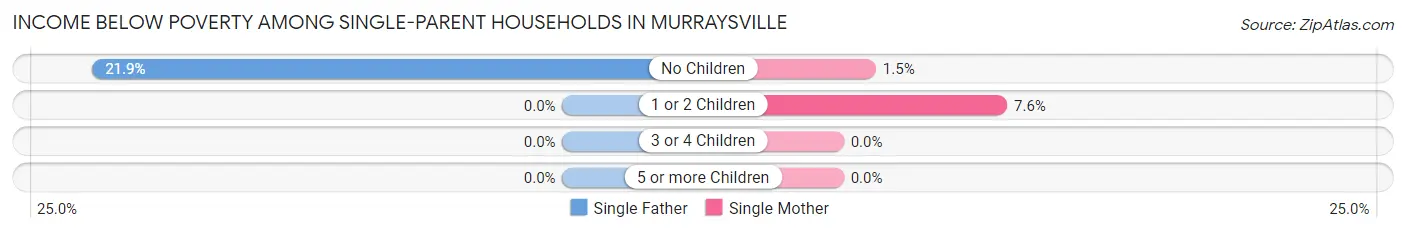
| Children | Single Father | Single Mother |
| No Children | 66 (21.8%) | 4 (1.5%) |
| 1 or 2 Children | 0 (0.0%) | 34 (7.6%) |
| 3 or 4 Children | 0 (0.0%) | 0 (0.0%) |
| 5 or more Children | 0 (0.0%) | 0 (0.0%) |
| Total | 66 (14.0%) | 38 (5.3%) |
Income Below Poverty Among Married-Couple vs Single-Parent Households in Murraysville
The poverty data for Murraysville shows that 47 of the married-couple family households (1.5%) and 104 of the single-parent households (8.8%) are living below the poverty level. Within the married-couple family households, those with 1 or 2 children have the highest poverty rate, with 22 households (1.9%) falling below the poverty line. Among the single-parent households, those with no children have the highest poverty rate, with 70 household (12.3%) living below poverty.
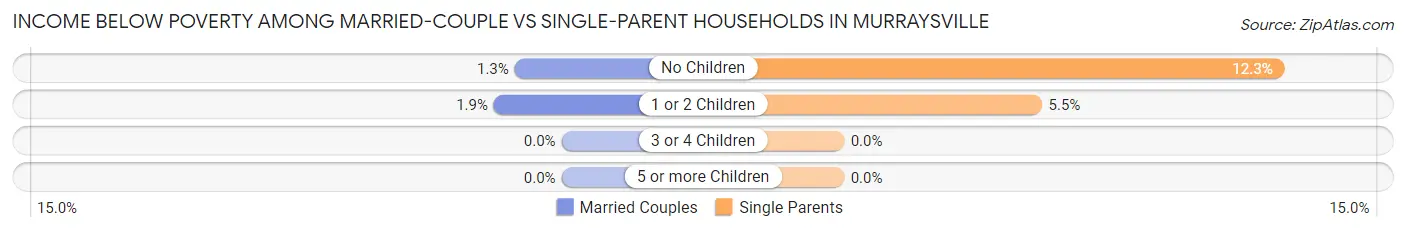
| Children | Married-Couple Families | Single-Parent Households |
| No Children | 25 (1.3%) | 70 (12.3%) |
| 1 or 2 Children | 22 (1.9%) | 34 (5.5%) |
| 3 or 4 Children | 0 (0.0%) | 0 (0.0%) |
| 5 or more Children | 0 (0.0%) | 0 (0.0%) |
| Total | 47 (1.5%) | 104 (8.8%) |
Race in Murraysville
The most populous races in Murraysville are White / Caucasian (13,054 | 78.3%), Black / African American (1,984 | 11.9%), and Hispanic or Latino (1,356 | 8.1%).
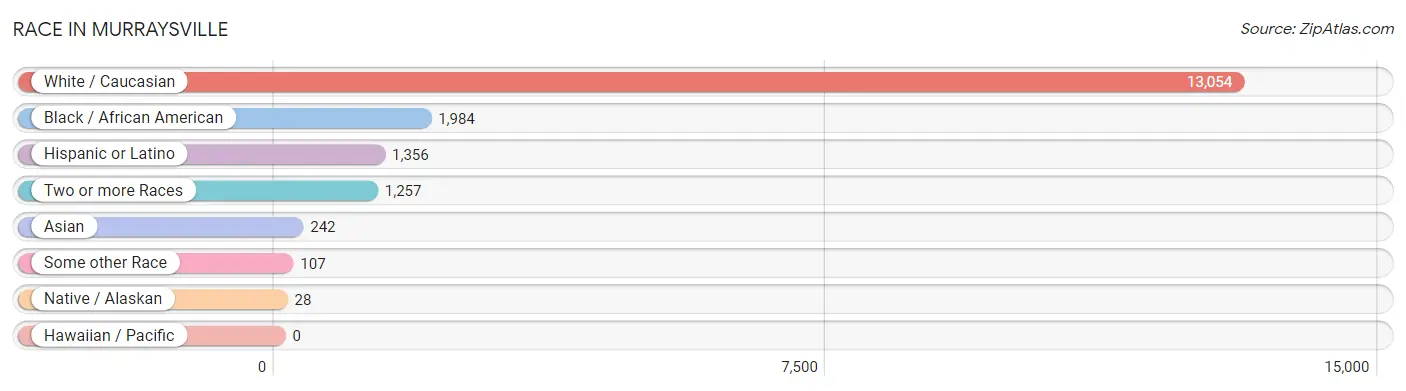
| Race | # Population | % Population |
| Asian | 242 | 1.5% |
| Black / African American | 1,984 | 11.9% |
| Hawaiian / Pacific | 0 | 0.0% |
| Hispanic or Latino | 1,356 | 8.1% |
| Native / Alaskan | 28 | 0.2% |
| White / Caucasian | 13,054 | 78.3% |
| Two or more Races | 1,257 | 7.5% |
| Some other Race | 107 | 0.6% |
| Total | 16,672 | 100.0% |
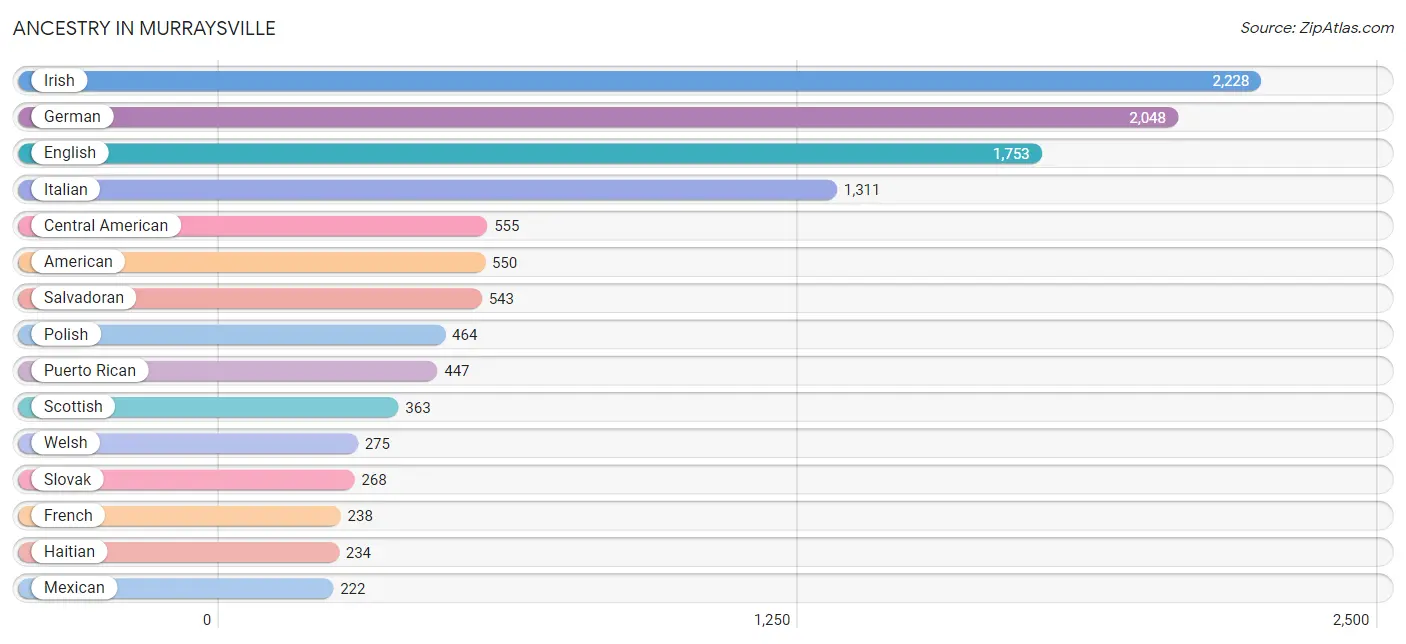
Ancestry in Murraysville
The most populous ancestries reported in Murraysville are Irish (2,228 | 13.4%), German (2,048 | 12.3%), English (1,753 | 10.5%), Italian (1,311 | 7.9%), and Central American (555 | 3.3%), together accounting for 47.3% of all Murraysville residents.
| Ancestry | # Population | % Population |
| African | 145 | 0.9% |
| American | 550 | 3.3% |
| Arab | 191 | 1.1% |
| Austrian | 146 | 0.9% |
| Belgian | 25 | 0.2% |
| Bhutanese | 32 | 0.2% |
| British | 64 | 0.4% |
| Canadian | 46 | 0.3% |
| Central American | 555 | 3.3% |
| Cherokee | 129 | 0.8% |
| Cuban | 65 | 0.4% |
| Dutch | 98 | 0.6% |
| Eastern European | 27 | 0.2% |
| English | 1,753 | 10.5% |
| European | 113 | 0.7% |
| French | 238 | 1.4% |
| French Canadian | 18 | 0.1% |
| German | 2,048 | 12.3% |
| Greek | 106 | 0.6% |
| Haitian | 234 | 1.4% |
| Honduran | 12 | 0.1% |
| Hungarian | 132 | 0.8% |
| Indian (Asian) | 79 | 0.5% |
| Irish | 2,228 | 13.4% |
| Italian | 1,311 | 7.9% |
| Korean | 19 | 0.1% |
| Lithuanian | 18 | 0.1% |
| Lumbee | 29 | 0.2% |
| Mexican | 222 | 1.3% |
| Moroccan | 115 | 0.7% |
| Northern European | 34 | 0.2% |
| Norwegian | 171 | 1.0% |
| Pennsylvania German | 29 | 0.2% |
| Peruvian | 41 | 0.3% |
| Polish | 464 | 2.8% |
| Portuguese | 29 | 0.2% |
| Puerto Rican | 447 | 2.7% |
| Romanian | 67 | 0.4% |
| Russian | 187 | 1.1% |
| Salvadoran | 543 | 3.3% |
| Scandinavian | 7 | 0.0% |
| Scotch-Irish | 196 | 1.2% |
| Scottish | 363 | 2.2% |
| Slovak | 268 | 1.6% |
| Slovene | 79 | 0.5% |
| South American | 67 | 0.4% |
| Sri Lankan | 202 | 1.2% |
| Subsaharan African | 145 | 0.9% |
| Swedish | 109 | 0.6% |
| Swiss | 45 | 0.3% |
| Syrian | 76 | 0.5% |
| Thai | 114 | 0.7% |
| Trinidadian and Tobagonian | 65 | 0.4% |
| Ukrainian | 26 | 0.2% |
| Venezuelan | 26 | 0.2% |
| Welsh | 275 | 1.7% |
| West Indian | 127 | 0.8% | View All 57 Rows |
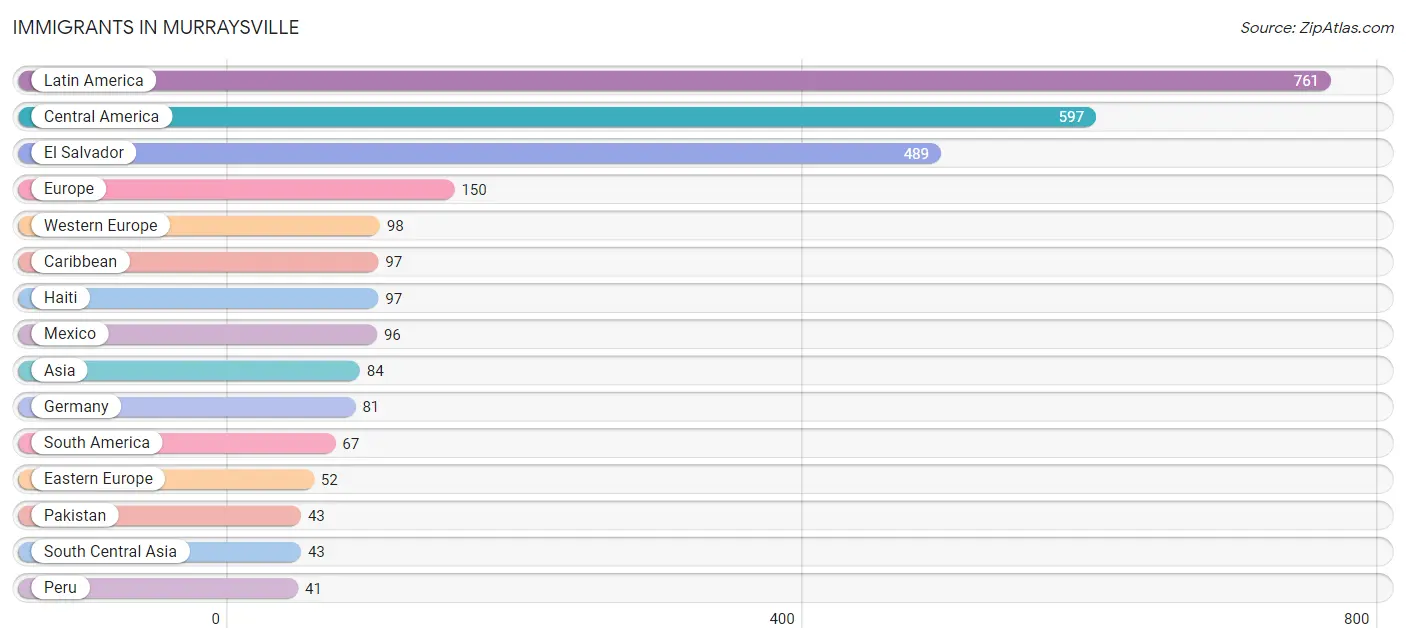
Immigrants in Murraysville
The most numerous immigrant groups reported in Murraysville came from Latin America (761 | 4.6%), Central America (597 | 3.6%), El Salvador (489 | 2.9%), Europe (150 | 0.9%), and Western Europe (98 | 0.6%), together accounting for 12.6% of all Murraysville residents.
| Immigration Origin | # Population | % Population |
| Asia | 84 | 0.5% |
| Austria | 17 | 0.1% |
| Canada | 23 | 0.1% |
| Caribbean | 97 | 0.6% |
| Central America | 597 | 3.6% |
| Eastern Europe | 52 | 0.3% |
| El Salvador | 489 | 2.9% |
| Europe | 150 | 0.9% |
| Germany | 81 | 0.5% |
| Haiti | 97 | 0.6% |
| Honduras | 12 | 0.1% |
| Latin America | 761 | 4.6% |
| Mexico | 96 | 0.6% |
| Pakistan | 43 | 0.3% |
| Peru | 41 | 0.3% |
| Poland | 19 | 0.1% |
| Romania | 33 | 0.2% |
| South America | 67 | 0.4% |
| South Central Asia | 43 | 0.3% |
| South Eastern Asia | 41 | 0.3% |
| Venezuela | 26 | 0.2% |
| Vietnam | 41 | 0.3% |
| Western Europe | 98 | 0.6% | View All 23 Rows |
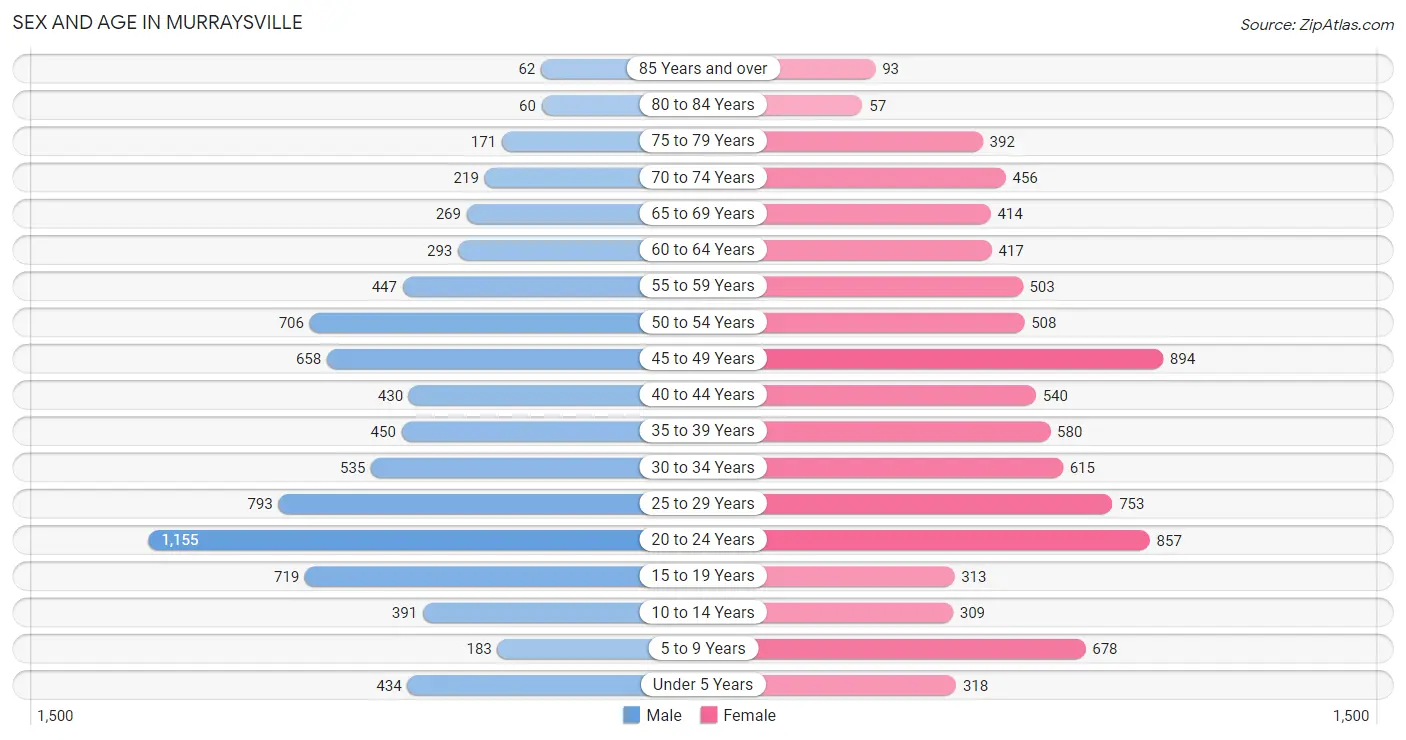
Sex and Age in Murraysville
Sex and Age in Murraysville
The most populous age groups in Murraysville are 20 to 24 Years (1,155 | 14.5%) for men and 45 to 49 Years (894 | 10.3%) for women.
| Age Bracket | Male | Female |
| Under 5 Years | 434 (5.4%) | 318 (3.7%) |
| 5 to 9 Years | 183 (2.3%) | 678 (7.8%) |
| 10 to 14 Years | 391 (4.9%) | 309 (3.5%) |
| 15 to 19 Years | 719 (9.0%) | 313 (3.6%) |
| 20 to 24 Years | 1,155 (14.5%) | 857 (9.9%) |
| 25 to 29 Years | 793 (9.9%) | 753 (8.7%) |
| 30 to 34 Years | 535 (6.7%) | 615 (7.1%) |
| 35 to 39 Years | 450 (5.6%) | 580 (6.7%) |
| 40 to 44 Years | 430 (5.4%) | 540 (6.2%) |
| 45 to 49 Years | 658 (8.3%) | 894 (10.3%) |
| 50 to 54 Years | 706 (8.8%) | 508 (5.8%) |
| 55 to 59 Years | 447 (5.6%) | 503 (5.8%) |
| 60 to 64 Years | 293 (3.7%) | 417 (4.8%) |
| 65 to 69 Years | 269 (3.4%) | 414 (4.8%) |
| 70 to 74 Years | 219 (2.8%) | 456 (5.2%) |
| 75 to 79 Years | 171 (2.1%) | 392 (4.5%) |
| 80 to 84 Years | 60 (0.7%) | 57 (0.7%) |
| 85 Years and over | 62 (0.8%) | 93 (1.1%) |
| Total | 7,975 (100.0%) | 8,697 (100.0%) |
Families and Households in Murraysville
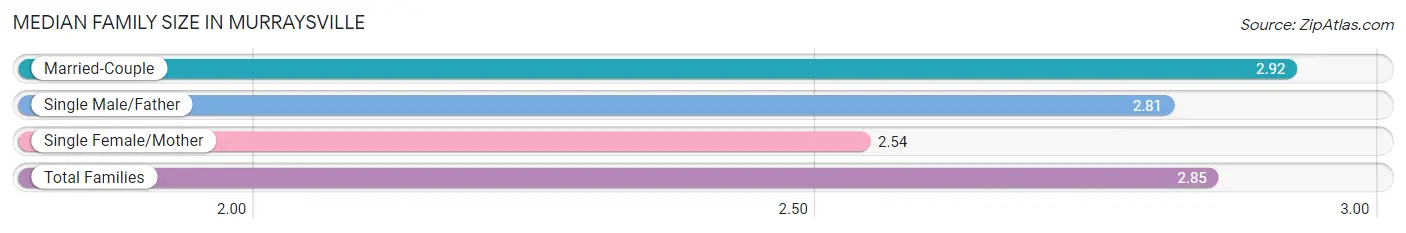
Median Family Size in Murraysville
The median family size in Murraysville is 2.85 persons per family, with married-couple families (3,225 | 73.2%) accounting for the largest median family size of 2.92 persons per family. On the other hand, single female/mother families (713 | 16.2%) represent the smallest median family size with 2.54 persons per family.
| Family Type | # Families | Family Size |
| Married-Couple | 3,225 (73.2%) | 2.92 |
| Single Male/Father | 470 (10.7%) | 2.81 |
| Single Female/Mother | 713 (16.2%) | 2.54 |
| Total Families | 4,408 (100.0%) | 2.85 |
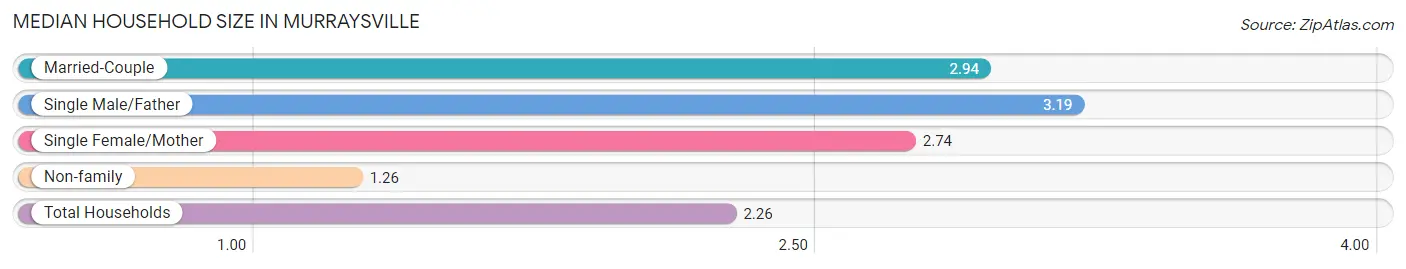
Median Household Size in Murraysville
The median household size in Murraysville is 2.26 persons per household, with single male/father households (470 | 6.4%) accounting for the largest median household size of 3.19 persons per household. non-family households (2,958 | 40.2%) represent the smallest median household size with 1.26 persons per household.
| Household Type | # Households | Household Size |
| Married-Couple | 3,225 (43.8%) | 2.94 |
| Single Male/Father | 470 (6.4%) | 3.19 |
| Single Female/Mother | 713 (9.7%) | 2.74 |
| Non-family | 2,958 (40.2%) | 1.26 |
| Total Households | 7,366 (100.0%) | 2.26 |
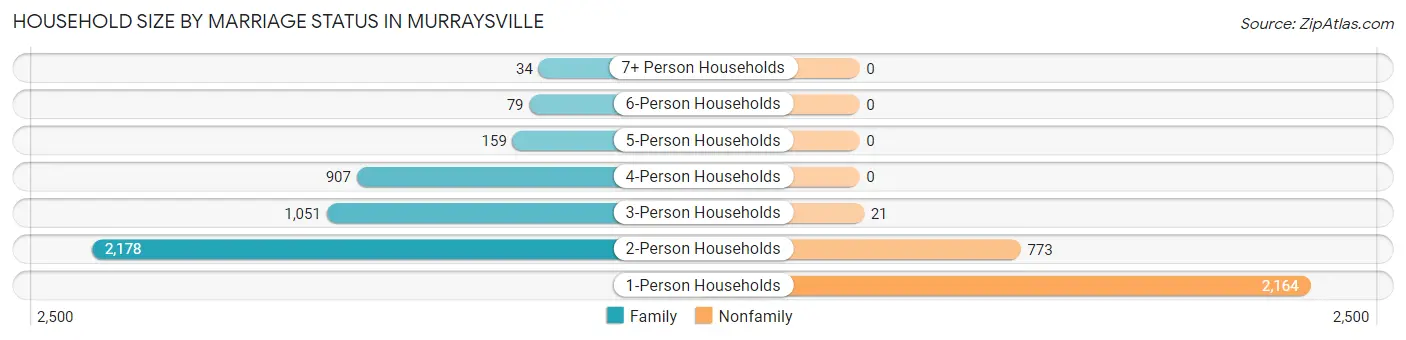
Household Size by Marriage Status in Murraysville
Out of a total of 7,366 households in Murraysville, 4,408 (59.8%) are family households, while 2,958 (40.2%) are nonfamily households. The most numerous type of family households are 2-person households, comprising 2,178, and the most common type of nonfamily households are 1-person households, comprising 2,164.
| Household Size | Family Households | Nonfamily Households |
| 1-Person Households | - | 2,164 (29.4%) |
| 2-Person Households | 2,178 (29.6%) | 773 (10.5%) |
| 3-Person Households | 1,051 (14.3%) | 21 (0.3%) |
| 4-Person Households | 907 (12.3%) | 0 (0.0%) |
| 5-Person Households | 159 (2.2%) | 0 (0.0%) |
| 6-Person Households | 79 (1.1%) | 0 (0.0%) |
| 7+ Person Households | 34 (0.5%) | 0 (0.0%) |
| Total | 4,408 (59.8%) | 2,958 (40.2%) |
Female Fertility in Murraysville
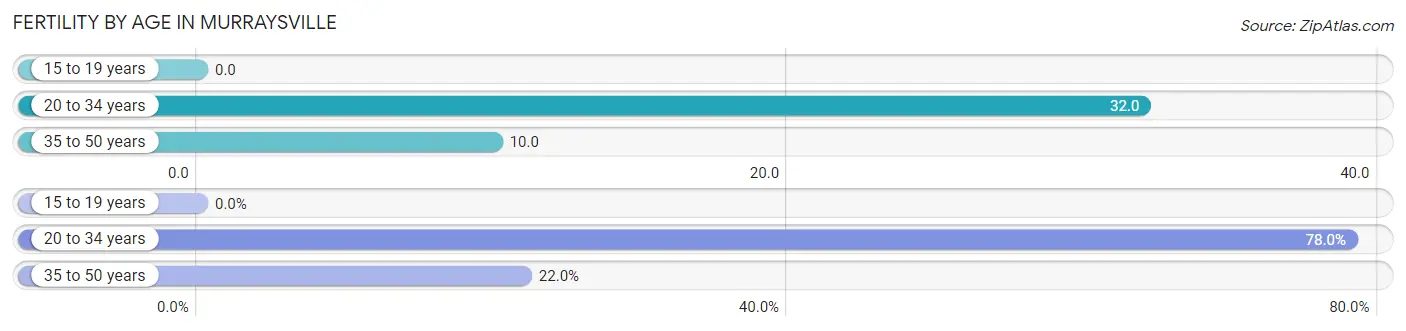
Fertility by Age in Murraysville
Average fertility rate in Murraysville is 20.0 births per 1,000 women. Women in the age bracket of 20 to 34 years have the highest fertility rate with 32.0 births per 1,000 women. Women in the age bracket of 20 to 34 years acount for 78.0% of all women with births.
| Age Bracket | Women with Births | Births / 1,000 Women |
| 15 to 19 years | 0 (0.0%) | 0.0 |
| 20 to 34 years | 71 (78.0%) | 32.0 |
| 35 to 50 years | 20 (22.0%) | 10.0 |
| Total | 91 (100.0%) | 20.0 |
Fertility by Age by Marriage Status in Murraysville
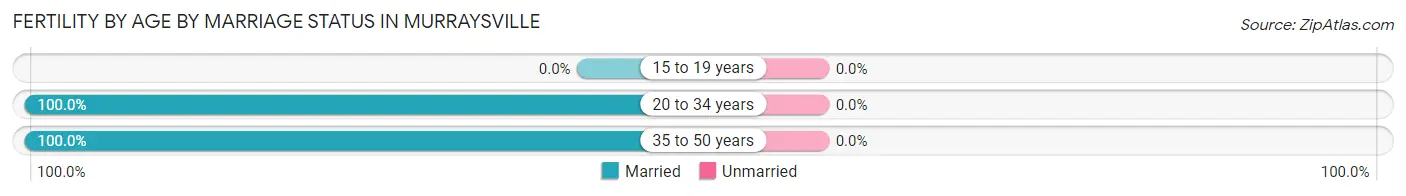
| Age Bracket | Married | Unmarried |
| 15 to 19 years | 0 (0.0%) | 0 (0.0%) |
| 20 to 34 years | 71 (100.0%) | 0 (0.0%) |
| 35 to 50 years | 20 (100.0%) | 0 (0.0%) |
| Total | 91 (100.0%) | 0 (0.0%) |
Fertility by Education in Murraysville
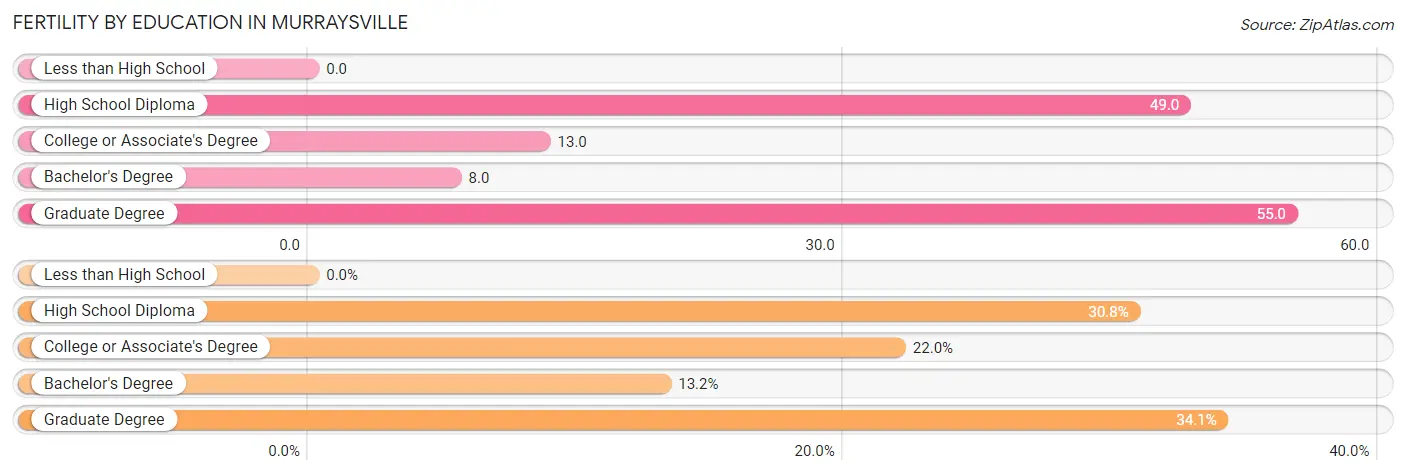
| Educational Attainment | Women with Births | Births / 1,000 Women |
| Less than High School | 0 (0.0%) | 0.0 |
| High School Diploma | 28 (30.8%) | 49.0 |
| College or Associate's Degree | 20 (22.0%) | 13.0 |
| Bachelor's Degree | 12 (13.2%) | 8.0 |
| Graduate Degree | 31 (34.1%) | 55.0 |
| Total | 91 (100.0%) | 20.0 |
Fertility by Education by Marriage Status in Murraysville
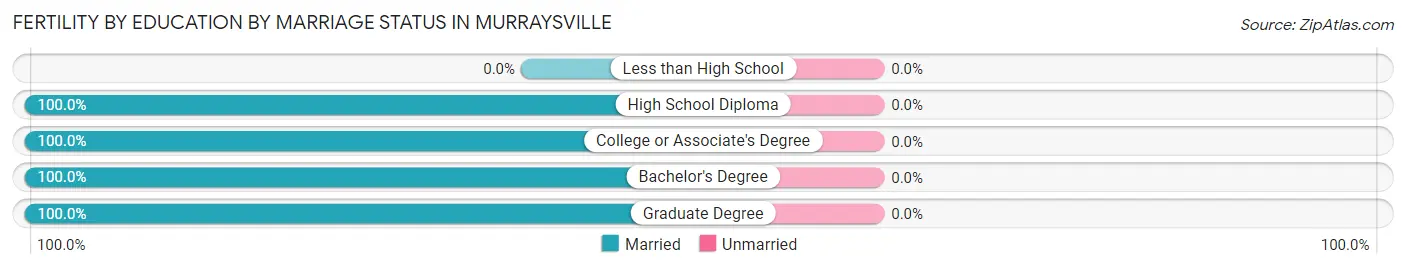
| Educational Attainment | Married | Unmarried |
| Less than High School | 0 (0.0%) | 0 (0.0%) |
| High School Diploma | 28 (100.0%) | 0 (0.0%) |
| College or Associate's Degree | 20 (100.0%) | 0 (0.0%) |
| Bachelor's Degree | 12 (100.0%) | 0 (0.0%) |
| Graduate Degree | 31 (100.0%) | 0 (0.0%) |
| Total | 91 (100.0%) | 0 (0.0%) |
Employment Characteristics in Murraysville
Employment by Class of Employer in Murraysville
Among the 9,947 employed individuals in Murraysville, private company employees (6,870 | 69.1%), not-for-profit organizations (983 | 9.9%), and local government employees (674 | 6.8%) make up the most common classes of employment.
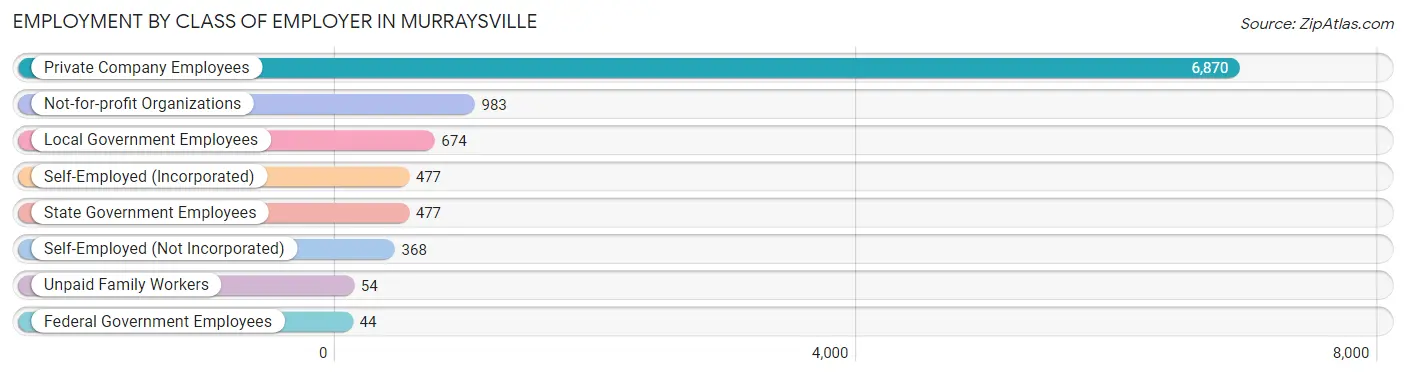
| Employer Class | # Employees | % Employees |
| Private Company Employees | 6,870 | 69.1% |
| Self-Employed (Incorporated) | 477 | 4.8% |
| Self-Employed (Not Incorporated) | 368 | 3.7% |
| Not-for-profit Organizations | 983 | 9.9% |
| Local Government Employees | 674 | 6.8% |
| State Government Employees | 477 | 4.8% |
| Federal Government Employees | 44 | 0.4% |
| Unpaid Family Workers | 54 | 0.5% |
| Total | 9,947 | 100.0% |
Employment Status by Age in Murraysville
According to the labor force statistics for Murraysville, out of the total population over 16 years of age (14,017), 75.5% or 10,583 individuals are in the labor force, with 4.2% or 444 of them unemployed. The age group with the highest labor force participation rate is 20 to 24 years, with 96.3% or 1,938 individuals in the labor force. Within the labor force, the 20 to 24 years age range has the highest percentage of unemployed individuals, with 9.6% or 186 of them being unemployed.
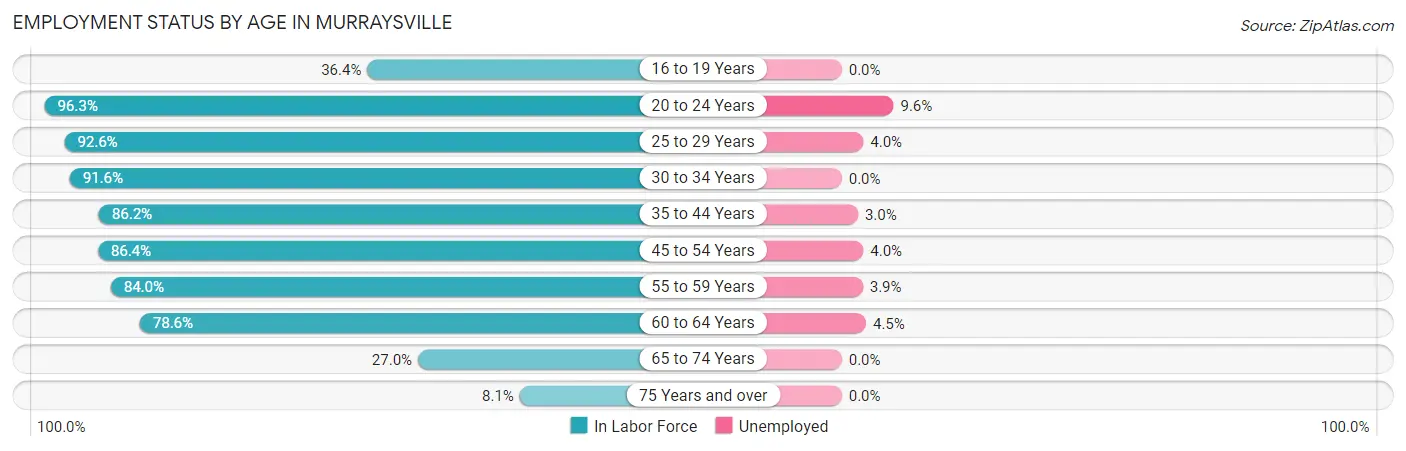
| Age Bracket | In Labor Force | Unemployed |
| 16 to 19 Years | 251 (36.4%) | 0 (0.0%) |
| 20 to 24 Years | 1,938 (96.3%) | 186 (9.6%) |
| 25 to 29 Years | 1,432 (92.6%) | 57 (4.0%) |
| 30 to 34 Years | 1,053 (91.6%) | 0 (0.0%) |
| 35 to 44 Years | 1,724 (86.2%) | 52 (3.0%) |
| 45 to 54 Years | 2,390 (86.4%) | 96 (4.0%) |
| 55 to 59 Years | 798 (84.0%) | 31 (3.9%) |
| 60 to 64 Years | 558 (78.6%) | 25 (4.5%) |
| 65 to 74 Years | 367 (27.0%) | 0 (0.0%) |
| 75 Years and over | 68 (8.1%) | 0 (0.0%) |
| Total | 10,583 (75.5%) | 444 (4.2%) |
Employment Status by Educational Attainment in Murraysville
According to labor force statistics for Murraysville, 87.2% of individuals (7,954) out of the total population between 25 and 64 years of age (9,122) are in the labor force, with 3.3% or 262 of them being unemployed. The group with the highest labor force participation rate are those with the educational attainment of bachelor's degree or higher, with 91.4% or 3,903 individuals in the labor force. Within the labor force, individuals with less than high school education have the highest percentage of unemployment, with 18.7% or 48 of them being unemployed.
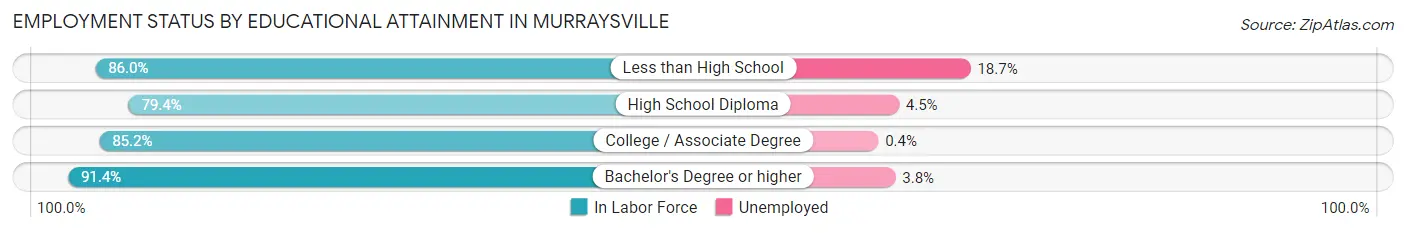
| Educational Attainment | In Labor Force | Unemployed |
| Less than High School | 257 (86.0%) | 56 (18.7%) |
| High School Diploma | 1,151 (79.4%) | 65 (4.5%) |
| College / Associate Degree | 2,644 (85.2%) | 12 (0.4%) |
| Bachelor's Degree or higher | 3,903 (91.4%) | 162 (3.8%) |
| Total | 7,954 (87.2%) | 301 (3.3%) |
Employment Occupations by Sex in Murraysville
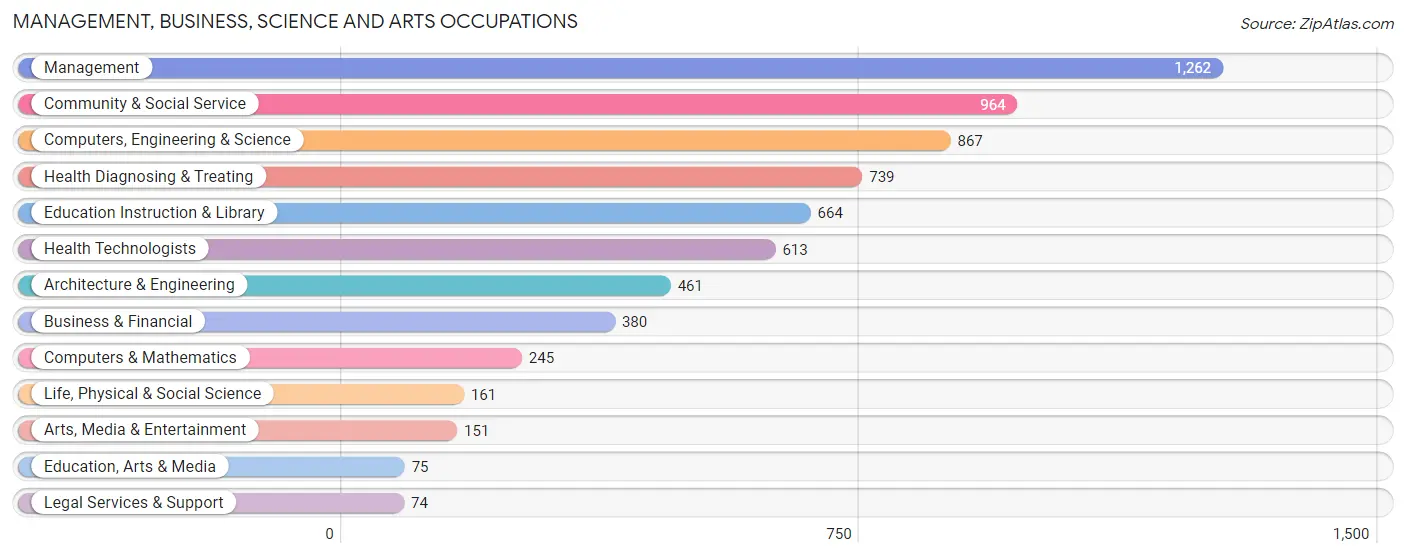
Management, Business, Science and Arts Occupations
The most common Management, Business, Science and Arts occupations in Murraysville are Management (1,262 | 12.5%), Community & Social Service (964 | 9.5%), Computers, Engineering & Science (867 | 8.6%), Health Diagnosing & Treating (739 | 7.3%), and Education Instruction & Library (664 | 6.6%).
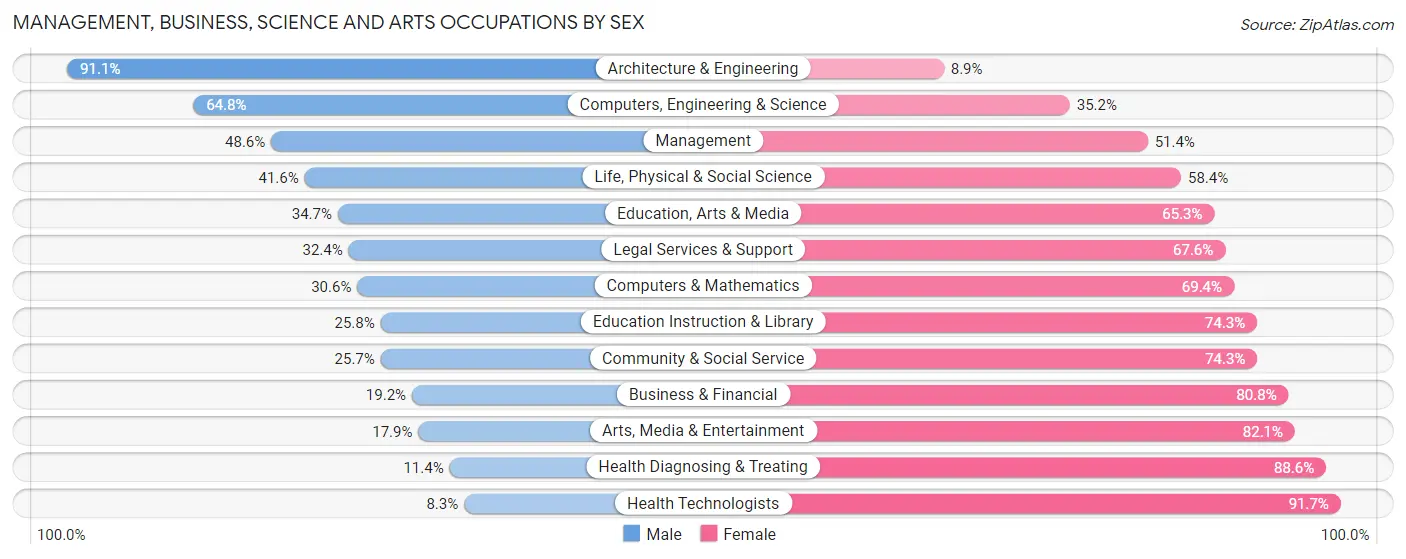
Management, Business, Science and Arts Occupations by Sex
Within the Management, Business, Science and Arts occupations in Murraysville, the most male-oriented occupations are Architecture & Engineering (91.1%), Computers, Engineering & Science (64.8%), and Management (48.6%), while the most female-oriented occupations are Health Technologists (91.7%), Health Diagnosing & Treating (88.6%), and Arts, Media & Entertainment (82.1%).
| Occupation | Male | Female |
| Management | 613 (48.6%) | 649 (51.4%) |
| Business & Financial | 73 (19.2%) | 307 (80.8%) |
| Computers, Engineering & Science | 562 (64.8%) | 305 (35.2%) |
| Computers & Mathematics | 75 (30.6%) | 170 (69.4%) |
| Architecture & Engineering | 420 (91.1%) | 41 (8.9%) |
| Life, Physical & Social Science | 67 (41.6%) | 94 (58.4%) |
| Community & Social Service | 248 (25.7%) | 716 (74.3%) |
| Education, Arts & Media | 26 (34.7%) | 49 (65.3%) |
| Legal Services & Support | 24 (32.4%) | 50 (67.6%) |
| Education Instruction & Library | 171 (25.8%) | 493 (74.3%) |
| Arts, Media & Entertainment | 27 (17.9%) | 124 (82.1%) |
| Health Diagnosing & Treating | 84 (11.4%) | 655 (88.6%) |
| Health Technologists | 51 (8.3%) | 562 (91.7%) |
| Total (Category) | 1,580 (37.5%) | 2,632 (62.5%) |
| Total (Overall) | 5,039 (49.7%) | 5,093 (50.3%) |
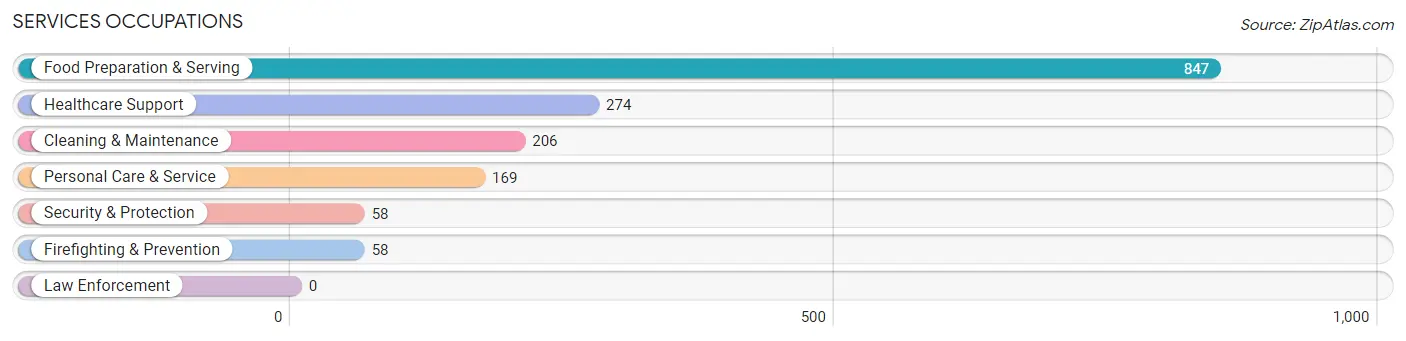
Services Occupations
The most common Services occupations in Murraysville are Food Preparation & Serving (847 | 8.4%), Healthcare Support (274 | 2.7%), Cleaning & Maintenance (206 | 2.0%), Personal Care & Service (169 | 1.7%), and Security & Protection (58 | 0.6%).
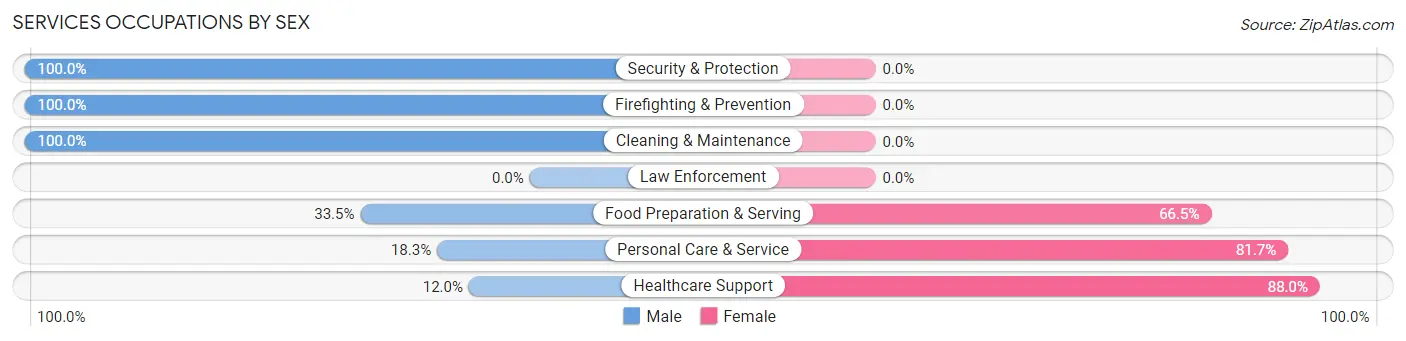
Services Occupations by Sex
Within the Services occupations in Murraysville, the most male-oriented occupations are Security & Protection (100.0%), Firefighting & Prevention (100.0%), and Cleaning & Maintenance (100.0%), while the most female-oriented occupations are Healthcare Support (88.0%), Personal Care & Service (81.7%), and Food Preparation & Serving (66.5%).
| Occupation | Male | Female |
| Healthcare Support | 33 (12.0%) | 241 (88.0%) |
| Security & Protection | 58 (100.0%) | 0 (0.0%) |
| Firefighting & Prevention | 58 (100.0%) | 0 (0.0%) |
| Law Enforcement | 0 (0.0%) | 0 (0.0%) |
| Food Preparation & Serving | 284 (33.5%) | 563 (66.5%) |
| Cleaning & Maintenance | 206 (100.0%) | 0 (0.0%) |
| Personal Care & Service | 31 (18.3%) | 138 (81.7%) |
| Total (Category) | 612 (39.4%) | 942 (60.6%) |
| Total (Overall) | 5,039 (49.7%) | 5,093 (50.3%) |
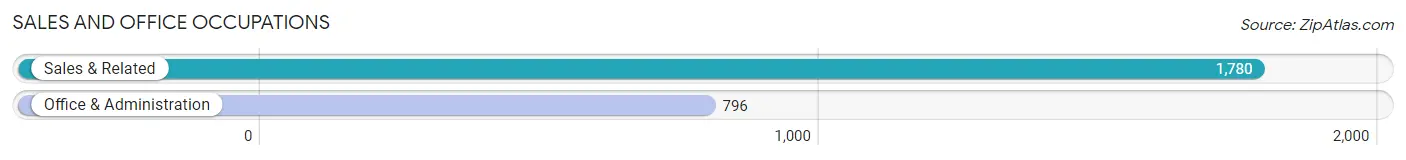
Sales and Office Occupations
The most common Sales and Office occupations in Murraysville are Sales & Related (1,780 | 17.6%), and Office & Administration (796 | 7.9%).
Sales and Office Occupations by Sex
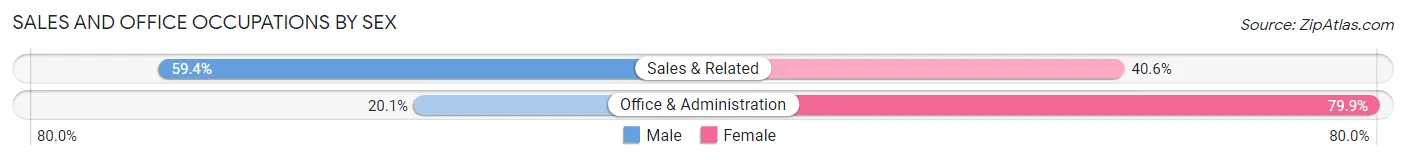
| Occupation | Male | Female |
| Sales & Related | 1,057 (59.4%) | 723 (40.6%) |
| Office & Administration | 160 (20.1%) | 636 (79.9%) |
| Total (Category) | 1,217 (47.2%) | 1,359 (52.8%) |
| Total (Overall) | 5,039 (49.7%) | 5,093 (50.3%) |
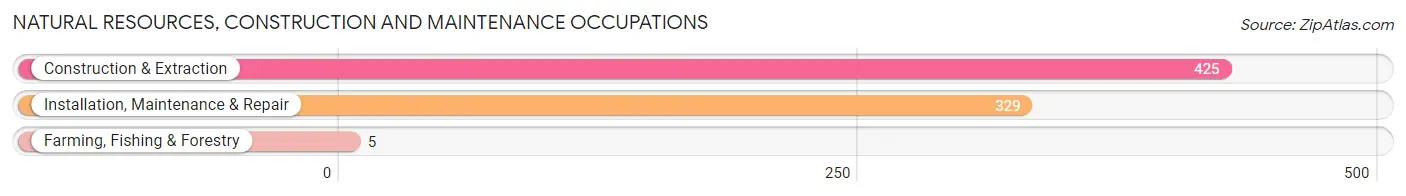
Natural Resources, Construction and Maintenance Occupations
The most common Natural Resources, Construction and Maintenance occupations in Murraysville are Construction & Extraction (425 | 4.2%), Installation, Maintenance & Repair (329 | 3.3%), and Farming, Fishing & Forestry (5 | 0.1%).
Natural Resources, Construction and Maintenance Occupations by Sex
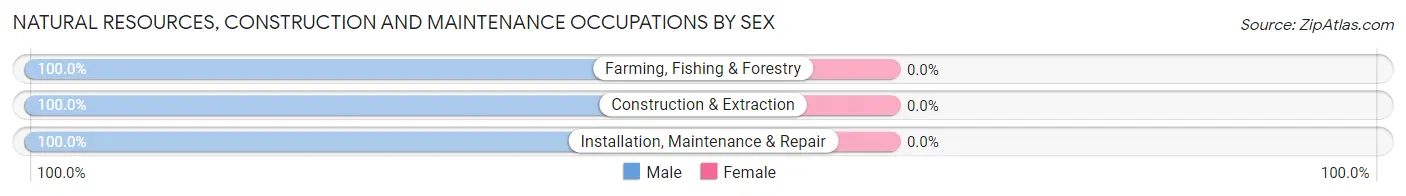
| Occupation | Male | Female |
| Farming, Fishing & Forestry | 5 (100.0%) | 0 (0.0%) |
| Construction & Extraction | 425 (100.0%) | 0 (0.0%) |
| Installation, Maintenance & Repair | 329 (100.0%) | 0 (0.0%) |
| Total (Category) | 759 (100.0%) | 0 (0.0%) |
| Total (Overall) | 5,039 (49.7%) | 5,093 (50.3%) |
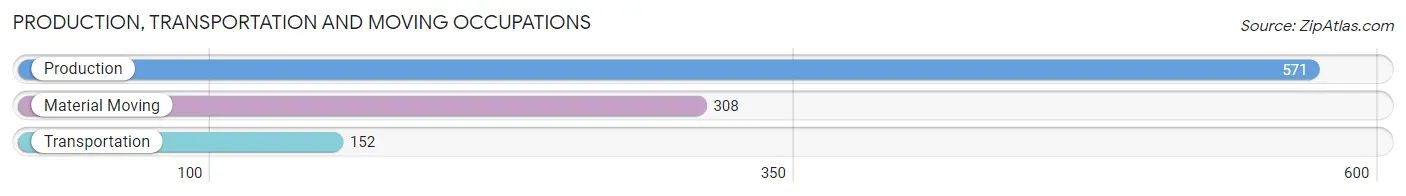
Production, Transportation and Moving Occupations
The most common Production, Transportation and Moving occupations in Murraysville are Production (571 | 5.6%), Material Moving (308 | 3.0%), and Transportation (152 | 1.5%).
Production, Transportation and Moving Occupations by Sex
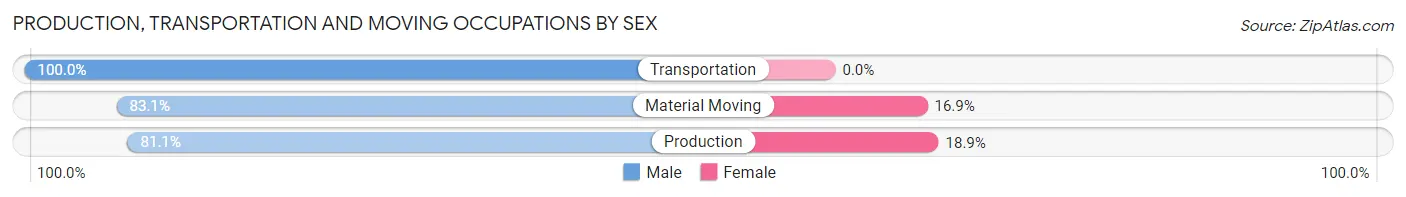
| Occupation | Male | Female |
| Production | 463 (81.1%) | 108 (18.9%) |
| Transportation | 152 (100.0%) | 0 (0.0%) |
| Material Moving | 256 (83.1%) | 52 (16.9%) |
| Total (Category) | 871 (84.5%) | 160 (15.5%) |
| Total (Overall) | 5,039 (49.7%) | 5,093 (50.3%) |
Employment Industries by Sex in Murraysville
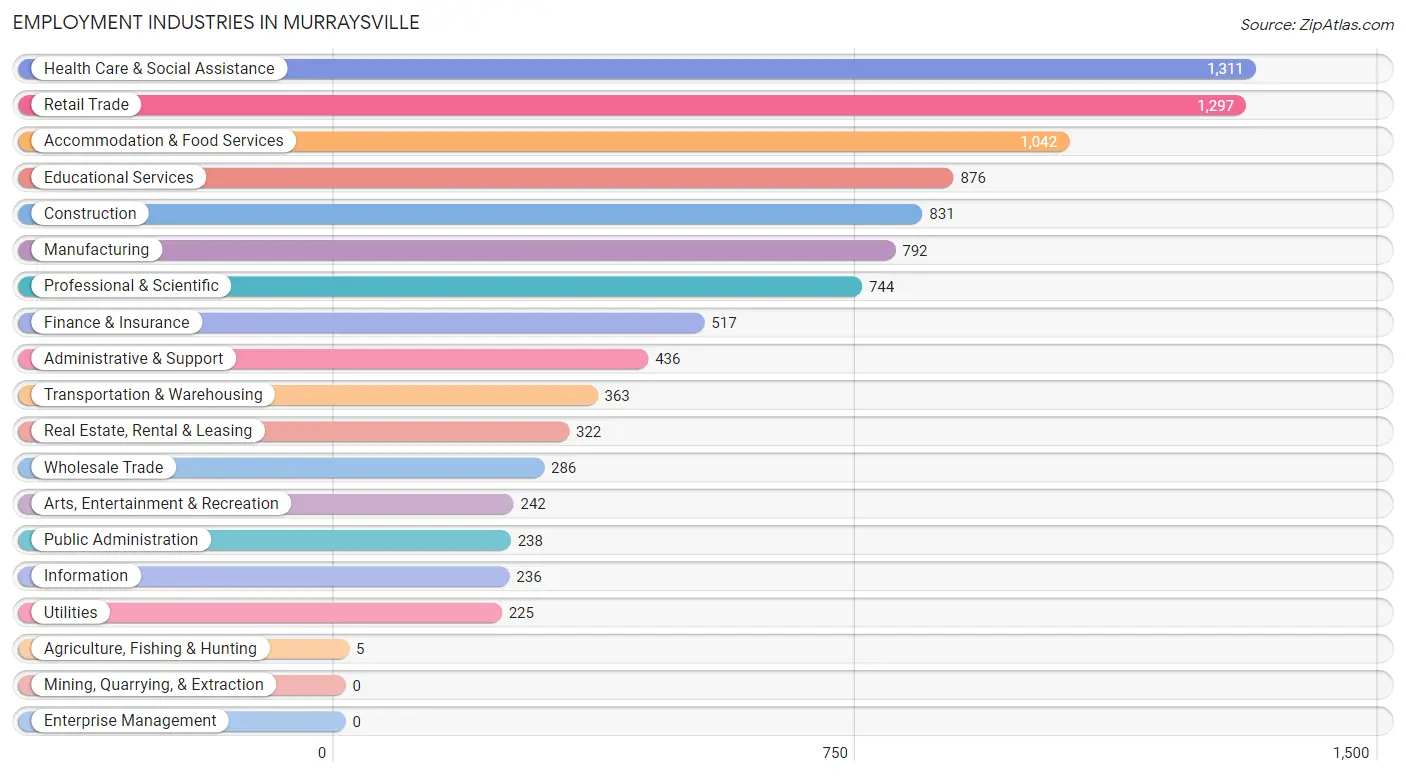
Employment Industries in Murraysville
The major employment industries in Murraysville include Health Care & Social Assistance (1,311 | 12.9%), Retail Trade (1,297 | 12.8%), Accommodation & Food Services (1,042 | 10.3%), Educational Services (876 | 8.6%), and Construction (831 | 8.2%).
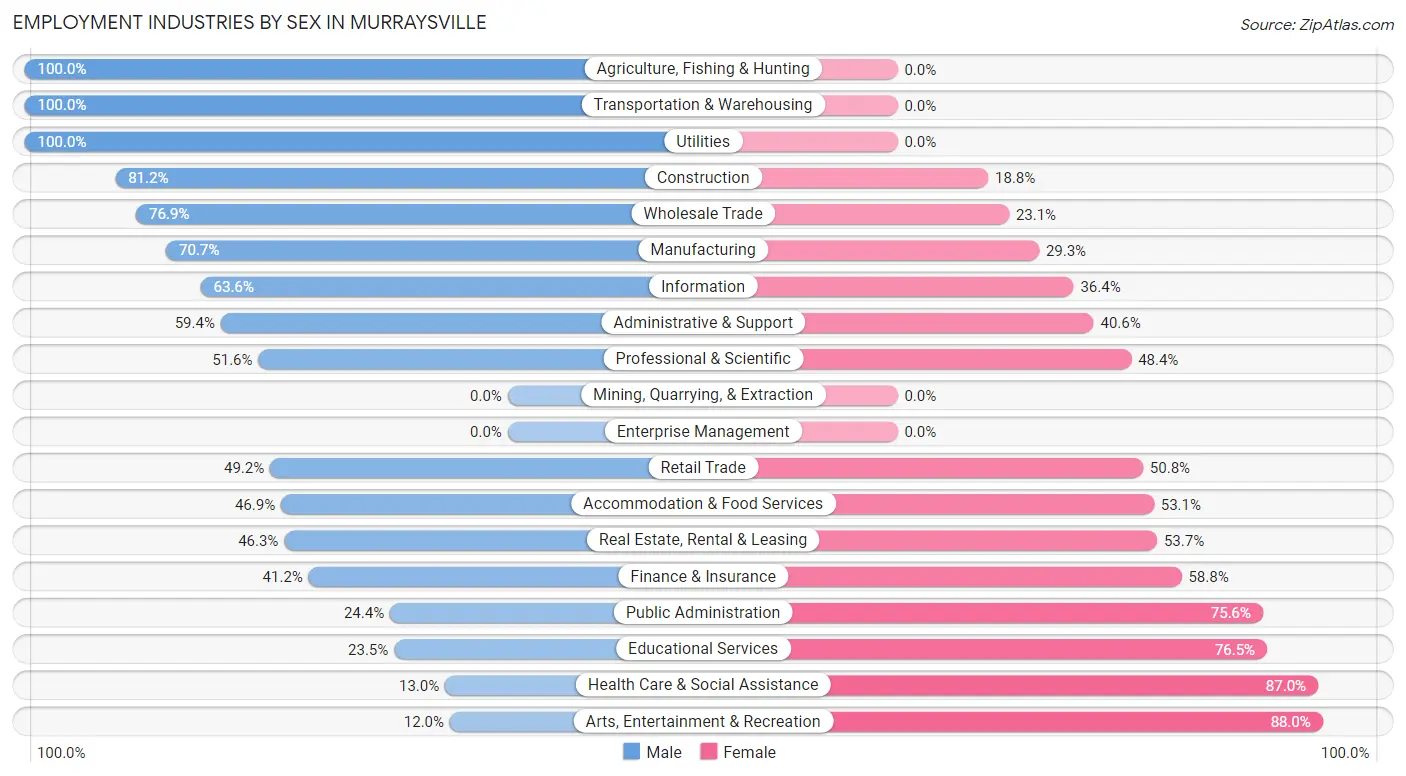
Employment Industries by Sex in Murraysville
The Murraysville industries that see more men than women are Agriculture, Fishing & Hunting (100.0%), Transportation & Warehousing (100.0%), and Utilities (100.0%), whereas the industries that tend to have a higher number of women are Arts, Entertainment & Recreation (88.0%), Health Care & Social Assistance (87.0%), and Educational Services (76.5%).
| Industry | Male | Female |
| Agriculture, Fishing & Hunting | 5 (100.0%) | 0 (0.0%) |
| Mining, Quarrying, & Extraction | 0 (0.0%) | 0 (0.0%) |
| Construction | 675 (81.2%) | 156 (18.8%) |
| Manufacturing | 560 (70.7%) | 232 (29.3%) |
| Wholesale Trade | 220 (76.9%) | 66 (23.1%) |
| Retail Trade | 638 (49.2%) | 659 (50.8%) |
| Transportation & Warehousing | 363 (100.0%) | 0 (0.0%) |
| Utilities | 225 (100.0%) | 0 (0.0%) |
| Information | 150 (63.6%) | 86 (36.4%) |
| Finance & Insurance | 213 (41.2%) | 304 (58.8%) |
| Real Estate, Rental & Leasing | 149 (46.3%) | 173 (53.7%) |
| Professional & Scientific | 384 (51.6%) | 360 (48.4%) |
| Enterprise Management | 0 (0.0%) | 0 (0.0%) |
| Administrative & Support | 259 (59.4%) | 177 (40.6%) |
| Educational Services | 206 (23.5%) | 670 (76.5%) |
| Health Care & Social Assistance | 170 (13.0%) | 1,141 (87.0%) |
| Arts, Entertainment & Recreation | 29 (12.0%) | 213 (88.0%) |
| Accommodation & Food Services | 489 (46.9%) | 553 (53.1%) |
| Public Administration | 58 (24.4%) | 180 (75.6%) |
| Total | 5,039 (49.7%) | 5,093 (50.3%) |
Education in Murraysville
School Enrollment in Murraysville
The most common levels of schooling among the 3,688 students in Murraysville are college / undergraduate (1,050 | 28.5%), high school (952 | 25.8%), and elementary school (617 | 16.7%).
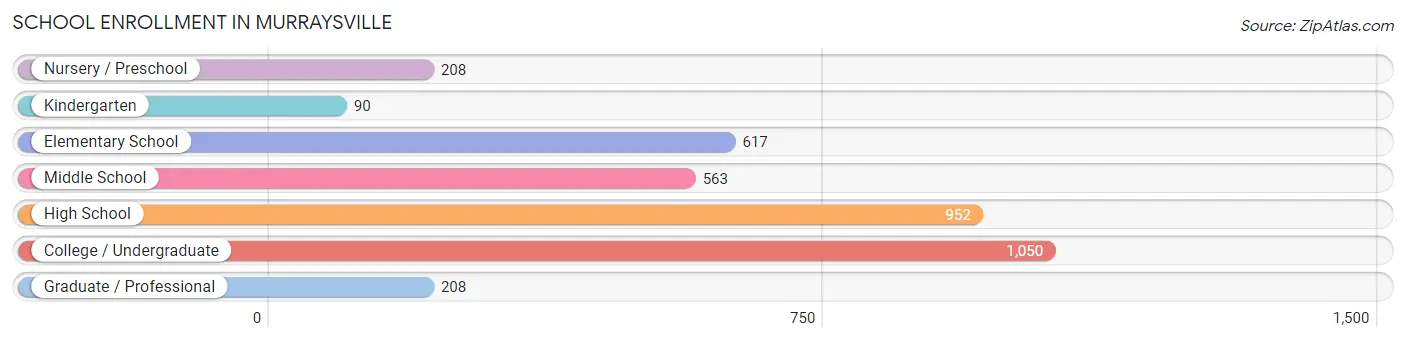
| School Level | # Students | % Students |
| Nursery / Preschool | 208 | 5.6% |
| Kindergarten | 90 | 2.4% |
| Elementary School | 617 | 16.7% |
| Middle School | 563 | 15.3% |
| High School | 952 | 25.8% |
| College / Undergraduate | 1,050 | 28.5% |
| Graduate / Professional | 208 | 5.6% |
| Total | 3,688 | 100.0% |
School Enrollment by Age by Funding Source in Murraysville
Out of a total of 3,688 students who are enrolled in schools in Murraysville, 450 (12.2%) attend a private institution, while the remaining 3,238 (87.8%) are enrolled in public schools. The age group of 35 years and over has the highest likelihood of being enrolled in private schools, with 53 (74.7% in the age bracket) enrolled. Conversely, the age group of 18 to 19 year olds has the lowest likelihood of being enrolled in a private school, with 167 (100.0% in the age bracket) attending a public institution.
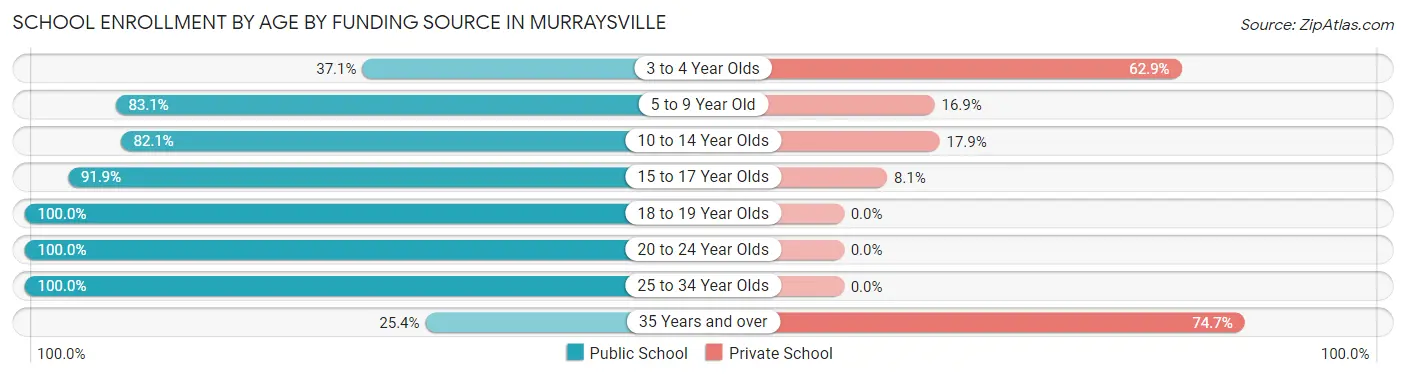
| Age Bracket | Public School | Private School |
| 3 to 4 Year Olds | 46 (37.1%) | 78 (62.9%) |
| 5 to 9 Year Old | 623 (83.1%) | 127 (16.9%) |
| 10 to 14 Year Olds | 575 (82.1%) | 125 (17.9%) |
| 15 to 17 Year Olds | 764 (91.9%) | 67 (8.1%) |
| 18 to 19 Year Olds | 167 (100.0%) | 0 (0.0%) |
| 20 to 24 Year Olds | 911 (100.0%) | 0 (0.0%) |
| 25 to 34 Year Olds | 134 (100.0%) | 0 (0.0%) |
| 35 Years and over | 18 (25.4%) | 53 (74.7%) |
| Total | 3,238 (87.8%) | 450 (12.2%) |
Educational Attainment by Field of Study in Murraysville
Business (1,043 | 18.5%), education (870 | 15.4%), arts & humanities (500 | 8.9%), psychology (483 | 8.6%), and literature & languages (346 | 6.1%) are the most common fields of study among 5,640 individuals in Murraysville who have obtained a bachelor's degree or higher.
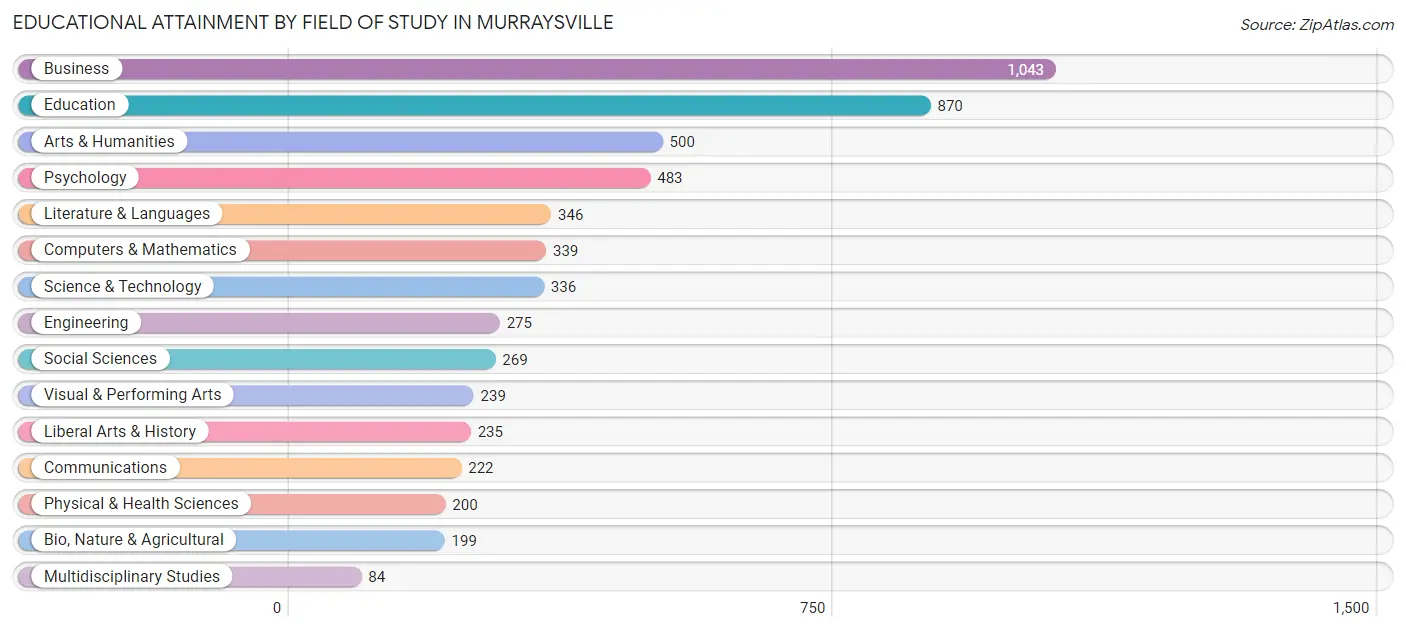
| Field of Study | # Graduates | % Graduates |
| Computers & Mathematics | 339 | 6.0% |
| Bio, Nature & Agricultural | 199 | 3.5% |
| Physical & Health Sciences | 200 | 3.5% |
| Psychology | 483 | 8.6% |
| Social Sciences | 269 | 4.8% |
| Engineering | 275 | 4.9% |
| Multidisciplinary Studies | 84 | 1.5% |
| Science & Technology | 336 | 6.0% |
| Business | 1,043 | 18.5% |
| Education | 870 | 15.4% |
| Literature & Languages | 346 | 6.1% |
| Liberal Arts & History | 235 | 4.2% |
| Visual & Performing Arts | 239 | 4.2% |
| Communications | 222 | 3.9% |
| Arts & Humanities | 500 | 8.9% |
| Total | 5,640 | 100.0% |
Transportation & Commute in Murraysville
Vehicle Availability by Sex in Murraysville
The most prevalent vehicle ownership categories in Murraysville are males with 2 vehicles (2,662, accounting for 53.2%) and females with 2 vehicles (2,532, making up 53.8%).
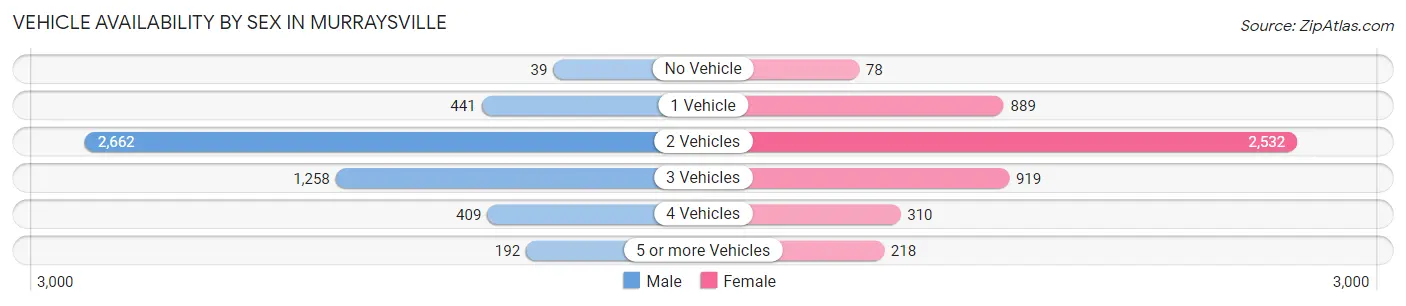
| Vehicles Available | Male | Female |
| No Vehicle | 39 (0.8%) | 78 (1.6%) |
| 1 Vehicle | 441 (8.8%) | 889 (18.0%) |
| 2 Vehicles | 2,662 (53.2%) | 2,532 (51.2%) |
| 3 Vehicles | 1,258 (25.2%) | 919 (18.6%) |
| 4 Vehicles | 409 (8.2%) | 310 (6.3%) |
| 5 or more Vehicles | 192 (3.8%) | 218 (4.4%) |
| Total | 5,001 (100.0%) | 4,946 (100.0%) |
Commute Time in Murraysville
The most frequently occuring commute durations in Murraysville are 15 to 19 minutes (2,281 commuters, 25.4%), 10 to 14 minutes (1,921 commuters, 21.4%), and 20 to 24 minutes (1,791 commuters, 19.9%).
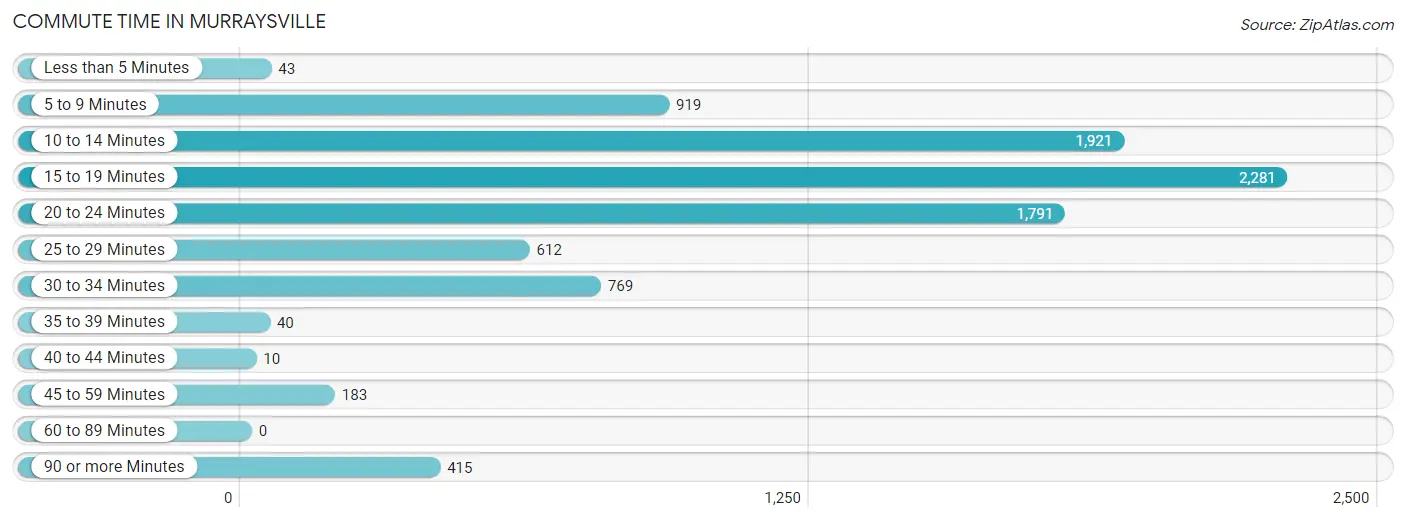
| Commute Time | # Commuters | % Commuters |
| Less than 5 Minutes | 43 | 0.5% |
| 5 to 9 Minutes | 919 | 10.2% |
| 10 to 14 Minutes | 1,921 | 21.4% |
| 15 to 19 Minutes | 2,281 | 25.4% |
| 20 to 24 Minutes | 1,791 | 19.9% |
| 25 to 29 Minutes | 612 | 6.8% |
| 30 to 34 Minutes | 769 | 8.6% |
| 35 to 39 Minutes | 40 | 0.4% |
| 40 to 44 Minutes | 10 | 0.1% |
| 45 to 59 Minutes | 183 | 2.0% |
| 60 to 89 Minutes | 0 | 0.0% |
| 90 or more Minutes | 415 | 4.6% |
Commute Time by Sex in Murraysville
The most common commute times in Murraysville are 10 to 14 minutes (1,105 commuters, 23.2%) for males and 15 to 19 minutes (1,178 commuters, 28.0%) for females.
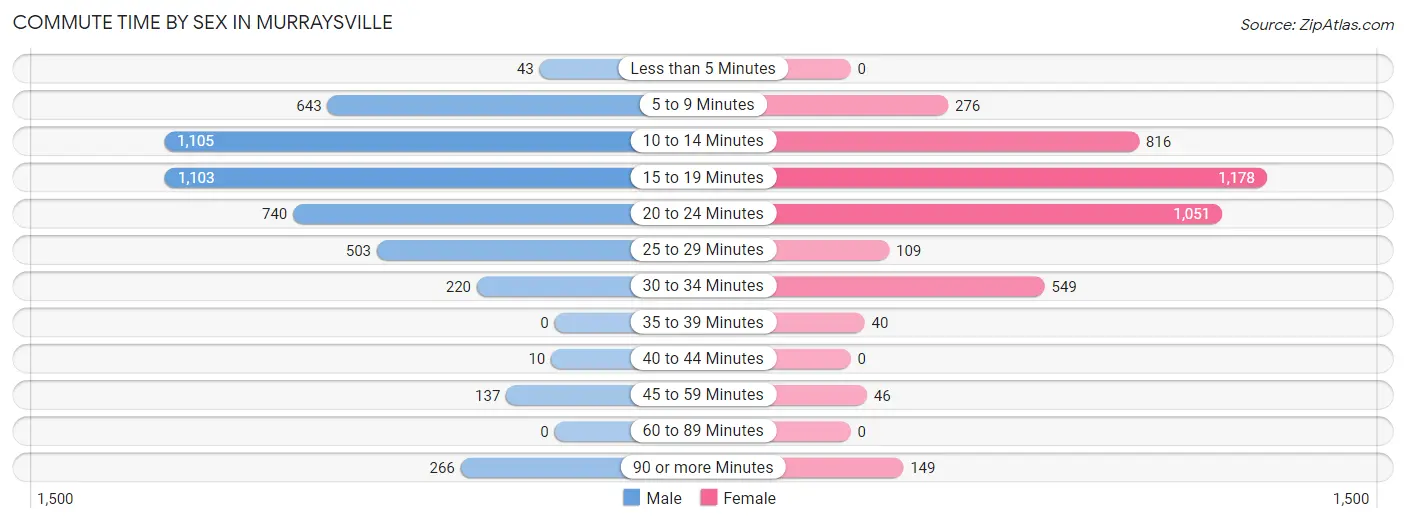
| Commute Time | Male | Female |
| Less than 5 Minutes | 43 (0.9%) | 0 (0.0%) |
| 5 to 9 Minutes | 643 (13.5%) | 276 (6.6%) |
| 10 to 14 Minutes | 1,105 (23.2%) | 816 (19.4%) |
| 15 to 19 Minutes | 1,103 (23.1%) | 1,178 (28.0%) |
| 20 to 24 Minutes | 740 (15.5%) | 1,051 (24.9%) |
| 25 to 29 Minutes | 503 (10.5%) | 109 (2.6%) |
| 30 to 34 Minutes | 220 (4.6%) | 549 (13.0%) |
| 35 to 39 Minutes | 0 (0.0%) | 40 (0.9%) |
| 40 to 44 Minutes | 10 (0.2%) | 0 (0.0%) |
| 45 to 59 Minutes | 137 (2.9%) | 46 (1.1%) |
| 60 to 89 Minutes | 0 (0.0%) | 0 (0.0%) |
| 90 or more Minutes | 266 (5.6%) | 149 (3.5%) |
Time of Departure to Work by Sex in Murraysville
The most frequent times of departure to work in Murraysville are 7:30 AM to 7:59 AM (836, 17.5%) for males and 7:30 AM to 7:59 AM (789, 18.7%) for females.
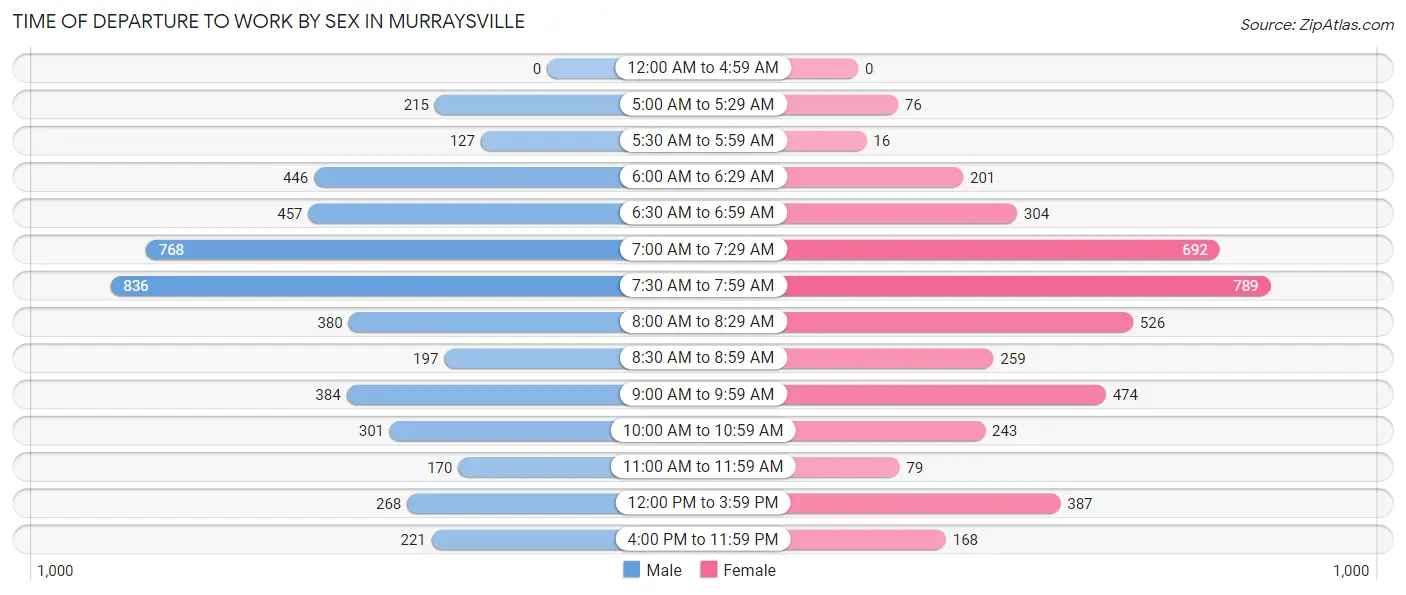
| Time of Departure | Male | Female |
| 12:00 AM to 4:59 AM | 0 (0.0%) | 0 (0.0%) |
| 5:00 AM to 5:29 AM | 215 (4.5%) | 76 (1.8%) |
| 5:30 AM to 5:59 AM | 127 (2.7%) | 16 (0.4%) |
| 6:00 AM to 6:29 AM | 446 (9.3%) | 201 (4.8%) |
| 6:30 AM to 6:59 AM | 457 (9.6%) | 304 (7.2%) |
| 7:00 AM to 7:29 AM | 768 (16.1%) | 692 (16.4%) |
| 7:30 AM to 7:59 AM | 836 (17.5%) | 789 (18.7%) |
| 8:00 AM to 8:29 AM | 380 (8.0%) | 526 (12.5%) |
| 8:30 AM to 8:59 AM | 197 (4.1%) | 259 (6.1%) |
| 9:00 AM to 9:59 AM | 384 (8.1%) | 474 (11.3%) |
| 10:00 AM to 10:59 AM | 301 (6.3%) | 243 (5.8%) |
| 11:00 AM to 11:59 AM | 170 (3.6%) | 79 (1.9%) |
| 12:00 PM to 3:59 PM | 268 (5.6%) | 387 (9.2%) |
| 4:00 PM to 11:59 PM | 221 (4.6%) | 168 (4.0%) |
| Total | 4,770 (100.0%) | 4,214 (100.0%) |
Housing Occupancy in Murraysville
Occupancy by Ownership in Murraysville
Of the total 7,366 dwellings in Murraysville, owner-occupied units account for 5,277 (71.6%), while renter-occupied units make up 2,089 (28.4%).
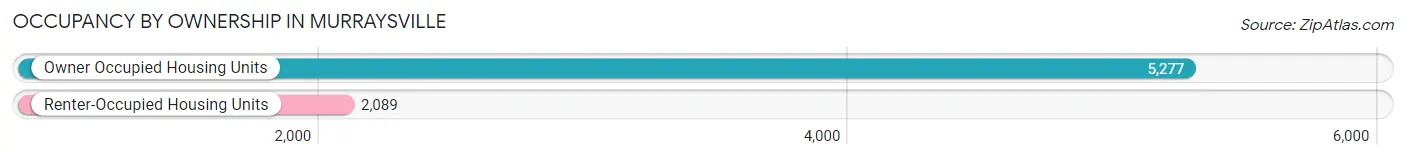
| Occupancy | # Housing Units | % Housing Units |
| Owner Occupied Housing Units | 5,277 | 71.6% |
| Renter-Occupied Housing Units | 2,089 | 28.4% |
| Total Occupied Housing Units | 7,366 | 100.0% |
Occupancy by Household Size in Murraysville
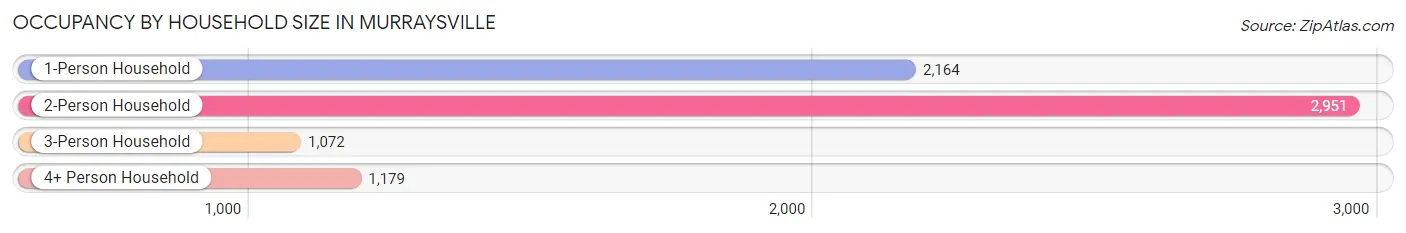
| Household Size | # Housing Units | % Housing Units |
| 1-Person Household | 2,164 | 29.4% |
| 2-Person Household | 2,951 | 40.1% |
| 3-Person Household | 1,072 | 14.5% |
| 4+ Person Household | 1,179 | 16.0% |
| Total Housing Units | 7,366 | 100.0% |
Occupancy by Ownership by Household Size in Murraysville
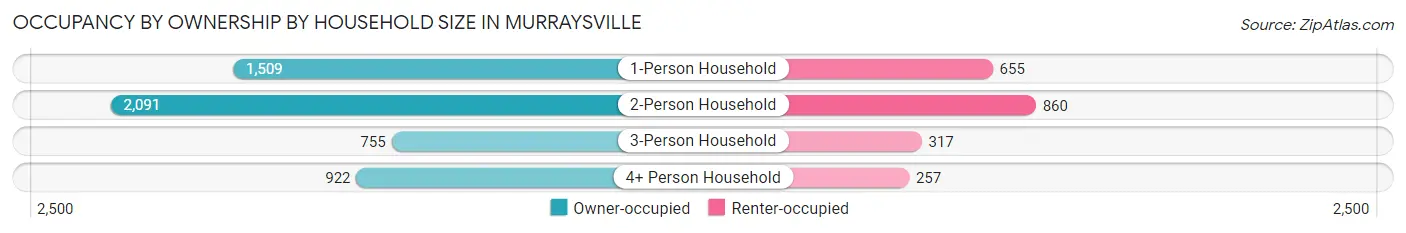
| Household Size | Owner-occupied | Renter-occupied |
| 1-Person Household | 1,509 (69.7%) | 655 (30.3%) |
| 2-Person Household | 2,091 (70.9%) | 860 (29.1%) |
| 3-Person Household | 755 (70.4%) | 317 (29.6%) |
| 4+ Person Household | 922 (78.2%) | 257 (21.8%) |
| Total Housing Units | 5,277 (71.6%) | 2,089 (28.4%) |
Occupancy by Educational Attainment in Murraysville
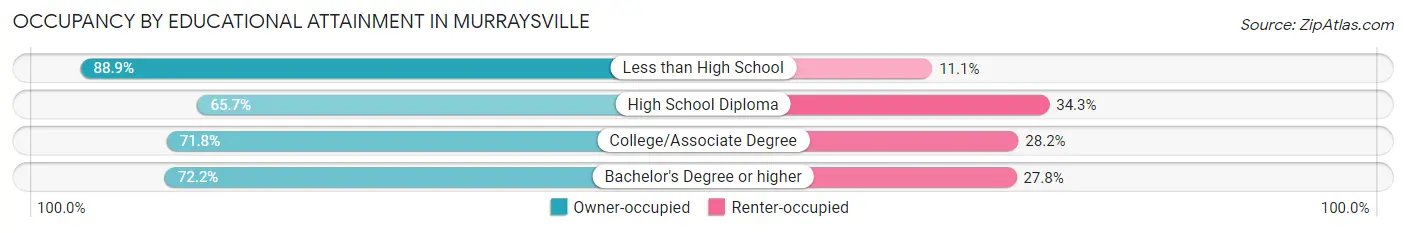
| Household Size | Owner-occupied | Renter-occupied |
| Less than High School | 216 (88.9%) | 27 (11.1%) |
| High School Diploma | 708 (65.7%) | 370 (34.3%) |
| College/Associate Degree | 1,945 (71.8%) | 764 (28.2%) |
| Bachelor's Degree or higher | 2,408 (72.2%) | 928 (27.8%) |
Occupancy by Age of Householder in Murraysville
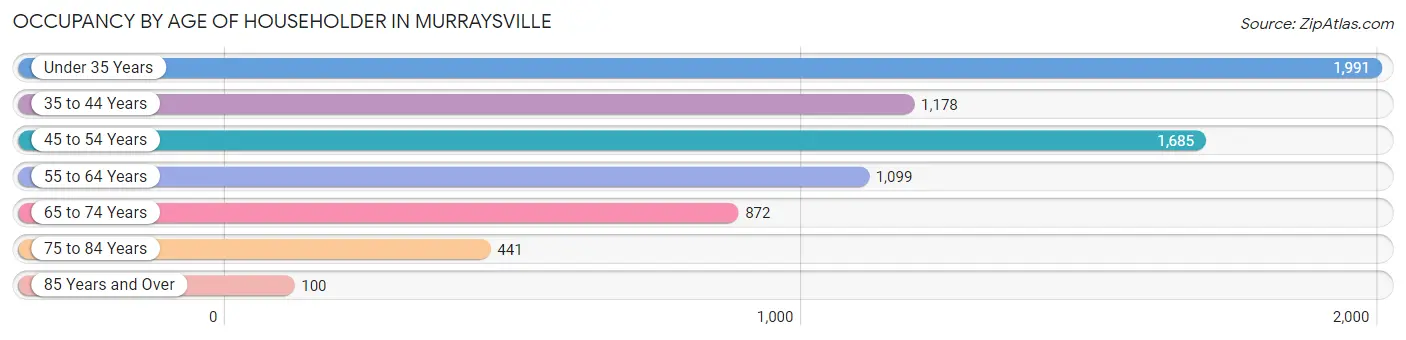
| Age Bracket | # Households | % Households |
| Under 35 Years | 1,991 | 27.0% |
| 35 to 44 Years | 1,178 | 16.0% |
| 45 to 54 Years | 1,685 | 22.9% |
| 55 to 64 Years | 1,099 | 14.9% |
| 65 to 74 Years | 872 | 11.8% |
| 75 to 84 Years | 441 | 6.0% |
| 85 Years and Over | 100 | 1.4% |
| Total | 7,366 | 100.0% |
Housing Finances in Murraysville
Median Income by Occupancy in Murraysville
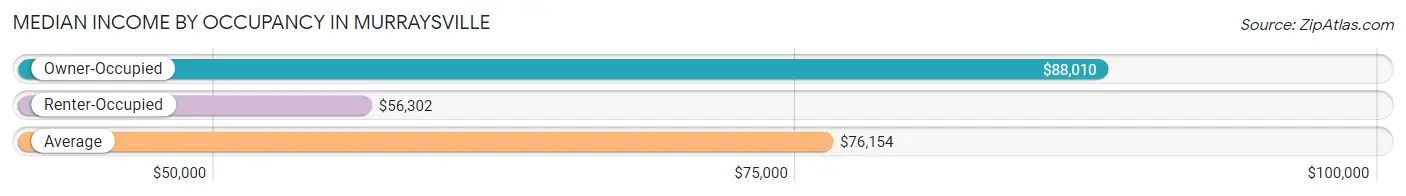
| Occupancy Type | # Households | Median Income |
| Owner-Occupied | 5,277 (71.6%) | $88,010 |
| Renter-Occupied | 2,089 (28.4%) | $56,302 |
| Average | 7,366 (100.0%) | $76,154 |
Occupancy by Householder Income Bracket in Murraysville
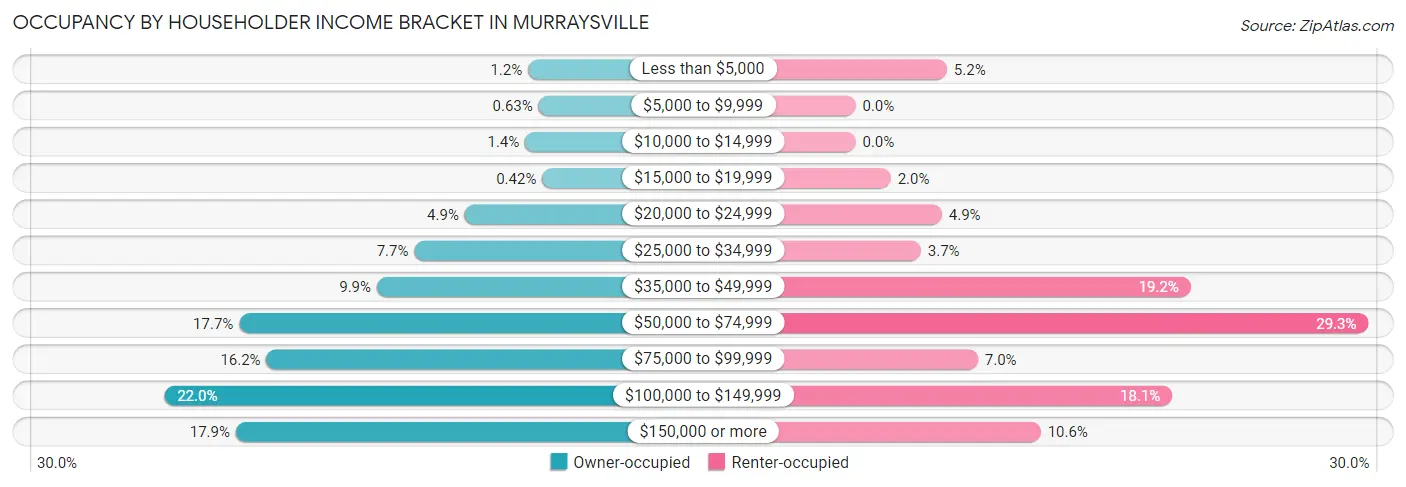
| Income Bracket | Owner-occupied | Renter-occupied |
| Less than $5,000 | 65 (1.2%) | 109 (5.2%) |
| $5,000 to $9,999 | 33 (0.6%) | 0 (0.0%) |
| $10,000 to $14,999 | 74 (1.4%) | 0 (0.0%) |
| $15,000 to $19,999 | 22 (0.4%) | 42 (2.0%) |
| $20,000 to $24,999 | 256 (4.9%) | 103 (4.9%) |
| $25,000 to $34,999 | 408 (7.7%) | 78 (3.7%) |
| $35,000 to $49,999 | 521 (9.9%) | 400 (19.2%) |
| $50,000 to $74,999 | 936 (17.7%) | 612 (29.3%) |
| $75,000 to $99,999 | 854 (16.2%) | 146 (7.0%) |
| $100,000 to $149,999 | 1,162 (22.0%) | 378 (18.1%) |
| $150,000 or more | 946 (17.9%) | 221 (10.6%) |
| Total | 5,277 (100.0%) | 2,089 (100.0%) |
Monthly Housing Cost Tiers in Murraysville
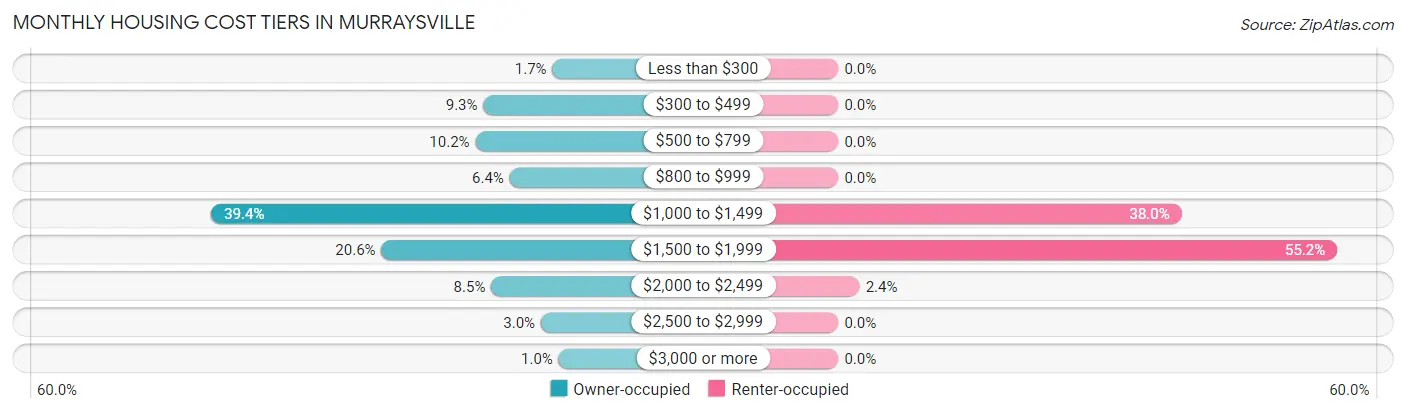
| Monthly Cost | Owner-occupied | Renter-occupied |
| Less than $300 | 89 (1.7%) | 0 (0.0%) |
| $300 to $499 | 492 (9.3%) | 0 (0.0%) |
| $500 to $799 | 538 (10.2%) | 0 (0.0%) |
| $800 to $999 | 338 (6.4%) | 0 (0.0%) |
| $1,000 to $1,499 | 2,079 (39.4%) | 794 (38.0%) |
| $1,500 to $1,999 | 1,086 (20.6%) | 1,153 (55.2%) |
| $2,000 to $2,499 | 446 (8.5%) | 49 (2.4%) |
| $2,500 to $2,999 | 156 (3.0%) | 0 (0.0%) |
| $3,000 or more | 53 (1.0%) | 0 (0.0%) |
| Total | 5,277 (100.0%) | 2,089 (100.0%) |
Physical Housing Characteristics in Murraysville
Housing Structures in Murraysville
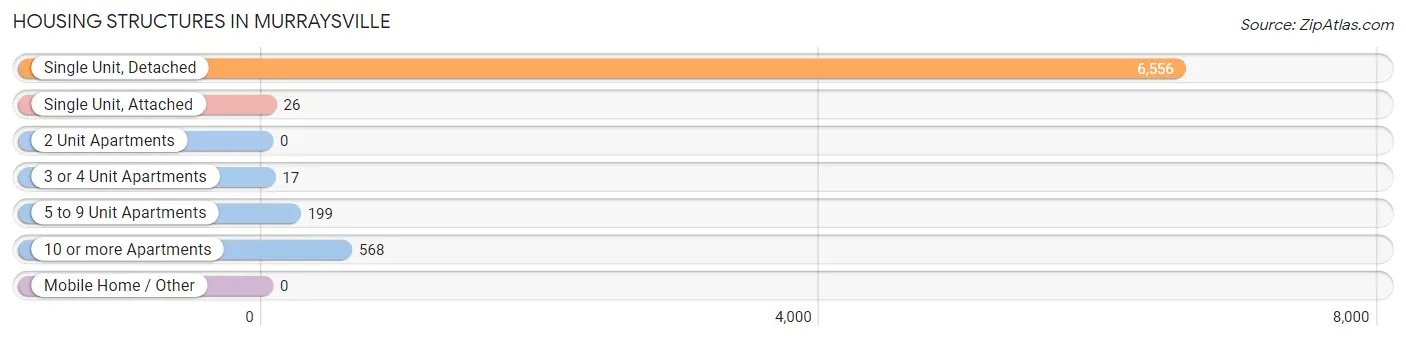
| Structure Type | # Housing Units | % Housing Units |
| Single Unit, Detached | 6,556 | 89.0% |
| Single Unit, Attached | 26 | 0.4% |
| 2 Unit Apartments | 0 | 0.0% |
| 3 or 4 Unit Apartments | 17 | 0.2% |
| 5 to 9 Unit Apartments | 199 | 2.7% |
| 10 or more Apartments | 568 | 7.7% |
| Mobile Home / Other | 0 | 0.0% |
| Total | 7,366 | 100.0% |
Housing Structures by Occupancy in Murraysville
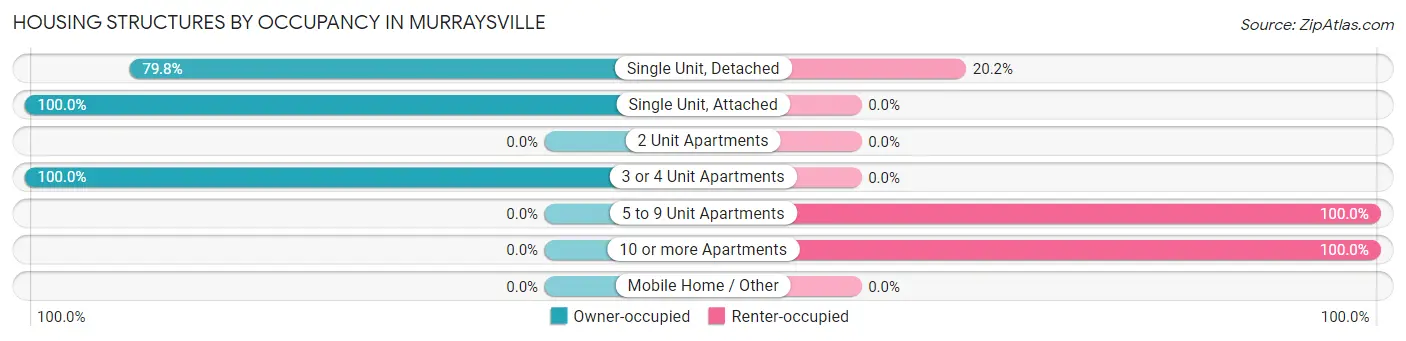
| Structure Type | Owner-occupied | Renter-occupied |
| Single Unit, Detached | 5,234 (79.8%) | 1,322 (20.2%) |
| Single Unit, Attached | 26 (100.0%) | 0 (0.0%) |
| 2 Unit Apartments | 0 (0.0%) | 0 (0.0%) |
| 3 or 4 Unit Apartments | 17 (100.0%) | 0 (0.0%) |
| 5 to 9 Unit Apartments | 0 (0.0%) | 199 (100.0%) |
| 10 or more Apartments | 0 (0.0%) | 568 (100.0%) |
| Mobile Home / Other | 0 (0.0%) | 0 (0.0%) |
| Total | 5,277 (71.6%) | 2,089 (28.4%) |
Housing Structures by Number of Rooms in Murraysville
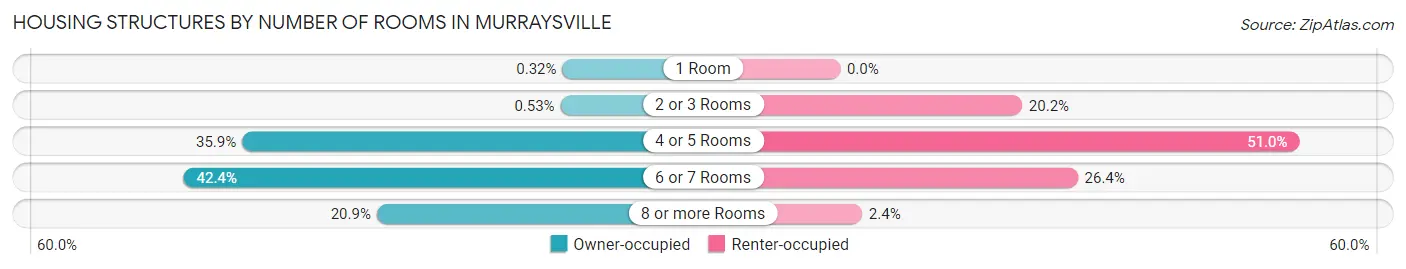
| Number of Rooms | Owner-occupied | Renter-occupied |
| 1 Room | 17 (0.3%) | 0 (0.0%) |
| 2 or 3 Rooms | 28 (0.5%) | 422 (20.2%) |
| 4 or 5 Rooms | 1,893 (35.9%) | 1,065 (51.0%) |
| 6 or 7 Rooms | 2,235 (42.3%) | 551 (26.4%) |
| 8 or more Rooms | 1,104 (20.9%) | 51 (2.4%) |
| Total | 5,277 (100.0%) | 2,089 (100.0%) |
Housing Structure by Heating Type in Murraysville
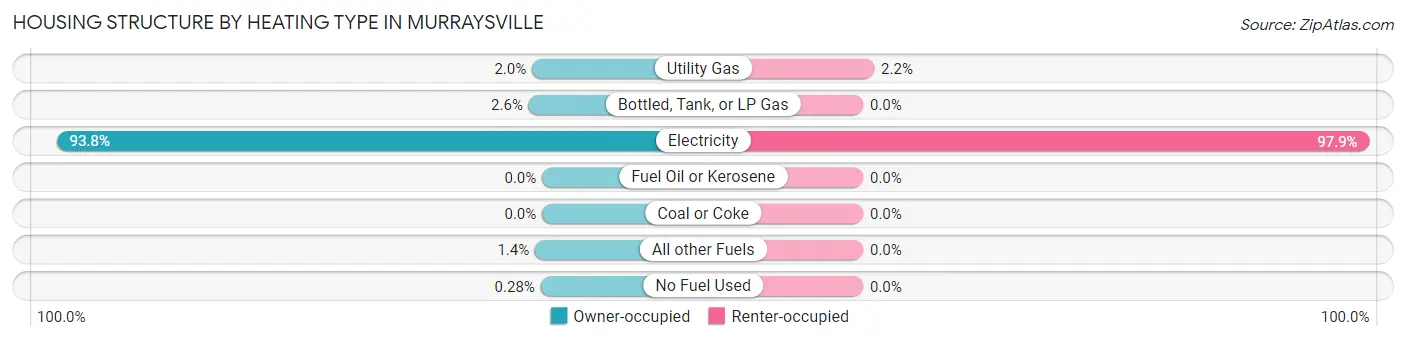
| Heating Type | Owner-occupied | Renter-occupied |
| Utility Gas | 103 (1.9%) | 45 (2.1%) |
| Bottled, Tank, or LP Gas | 136 (2.6%) | 0 (0.0%) |
| Electricity | 4,951 (93.8%) | 2,044 (97.9%) |
| Fuel Oil or Kerosene | 0 (0.0%) | 0 (0.0%) |
| Coal or Coke | 0 (0.0%) | 0 (0.0%) |
| All other Fuels | 72 (1.4%) | 0 (0.0%) |
| No Fuel Used | 15 (0.3%) | 0 (0.0%) |
| Total | 5,277 (100.0%) | 2,089 (100.0%) |
Household Vehicle Usage in Murraysville
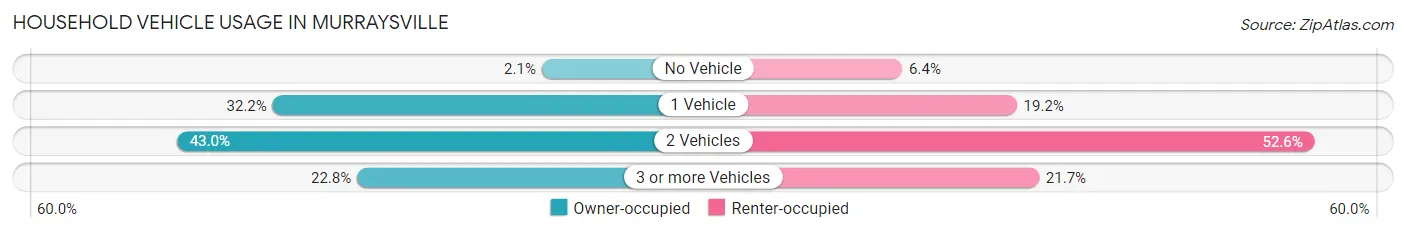
| Vehicles per Household | Owner-occupied | Renter-occupied |
| No Vehicle | 109 (2.1%) | 134 (6.4%) |
| 1 Vehicle | 1,700 (32.2%) | 402 (19.2%) |
| 2 Vehicles | 2,267 (43.0%) | 1,099 (52.6%) |
| 3 or more Vehicles | 1,201 (22.8%) | 454 (21.7%) |
| Total | 5,277 (100.0%) | 2,089 (100.0%) |
Real Estate & Mortgages in Murraysville
Real Estate and Mortgage Overview in Murraysville
| Characteristic | Without Mortgage | With Mortgage |
| Housing Units | 1,061 | 4,216 |
| Median Property Value | $274,100 | $246,600 |
| Median Household Income | $44,105 | $822 |
| Monthly Housing Costs | $469 | $53 |
| Real Estate Taxes | $1,472 | $86 |
Property Value by Mortgage Status in Murraysville
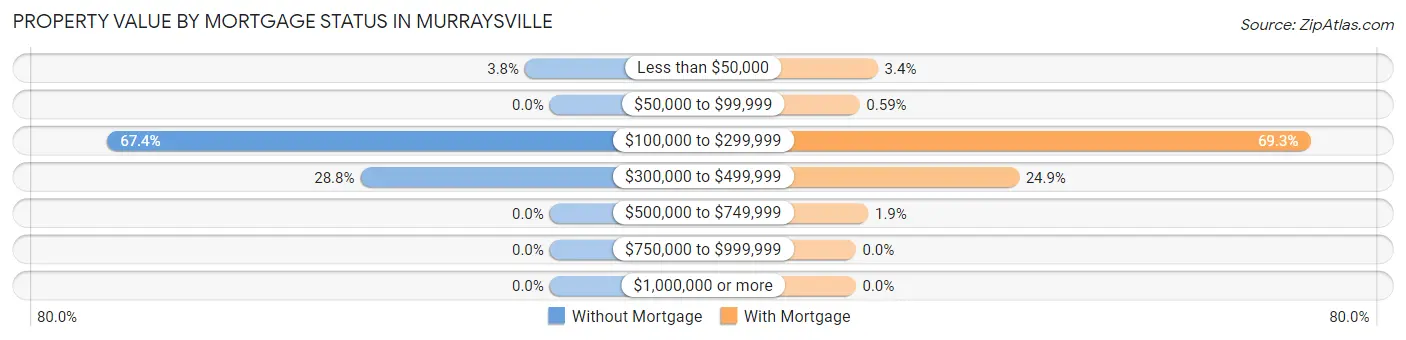
| Property Value | Without Mortgage | With Mortgage |
| Less than $50,000 | 40 (3.8%) | 142 (3.4%) |
| $50,000 to $99,999 | 0 (0.0%) | 25 (0.6%) |
| $100,000 to $299,999 | 715 (67.4%) | 2,921 (69.3%) |
| $300,000 to $499,999 | 306 (28.8%) | 1,048 (24.9%) |
| $500,000 to $749,999 | 0 (0.0%) | 80 (1.9%) |
| $750,000 to $999,999 | 0 (0.0%) | 0 (0.0%) |
| $1,000,000 or more | 0 (0.0%) | 0 (0.0%) |
| Total | 1,061 (100.0%) | 4,216 (100.0%) |
Household Income by Mortgage Status in Murraysville
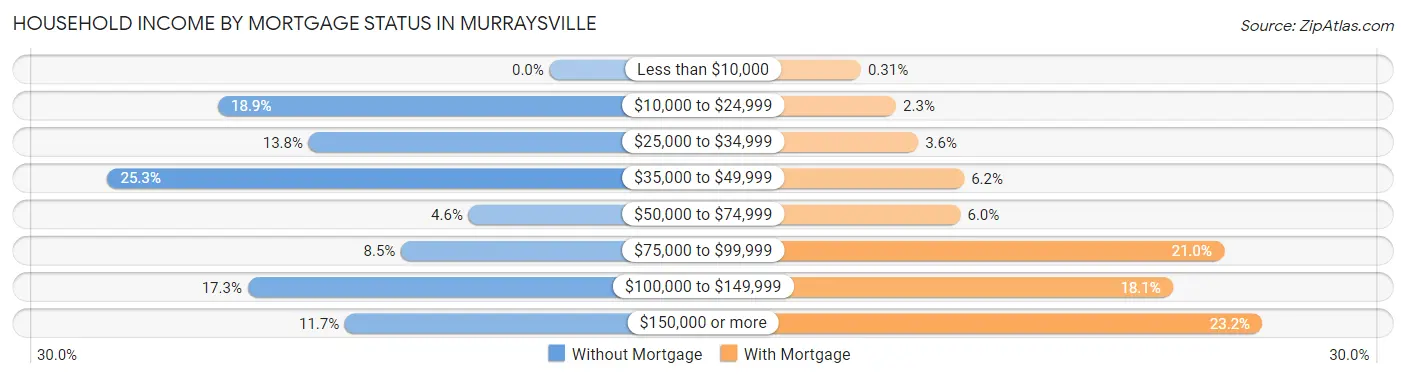
| Household Income | Without Mortgage | With Mortgage |
| Less than $10,000 | 0 (0.0%) | 13 (0.3%) |
| $10,000 to $24,999 | 201 (18.9%) | 98 (2.3%) |
| $25,000 to $34,999 | 146 (13.8%) | 151 (3.6%) |
| $35,000 to $49,999 | 268 (25.3%) | 262 (6.2%) |
| $50,000 to $74,999 | 49 (4.6%) | 253 (6.0%) |
| $75,000 to $99,999 | 90 (8.5%) | 887 (21.0%) |
| $100,000 to $149,999 | 183 (17.2%) | 764 (18.1%) |
| $150,000 or more | 124 (11.7%) | 979 (23.2%) |
| Total | 1,061 (100.0%) | 4,216 (100.0%) |
Property Value to Household Income Ratio in Murraysville
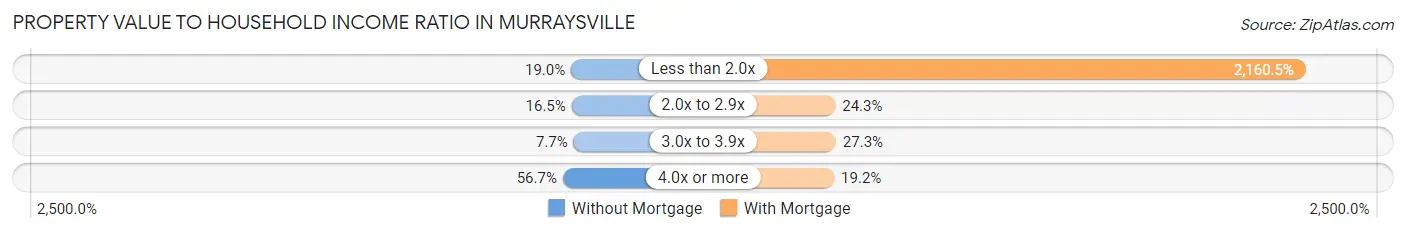
| Value-to-Income Ratio | Without Mortgage | With Mortgage |
| Less than 2.0x | 202 (19.0%) | 91,088 (2,160.5%) |
| 2.0x to 2.9x | 175 (16.5%) | 1,024 (24.3%) |
| 3.0x to 3.9x | 82 (7.7%) | 1,151 (27.3%) |
| 4.0x or more | 602 (56.7%) | 809 (19.2%) |
| Total | 1,061 (100.0%) | 4,216 (100.0%) |
Real Estate Taxes by Mortgage Status in Murraysville
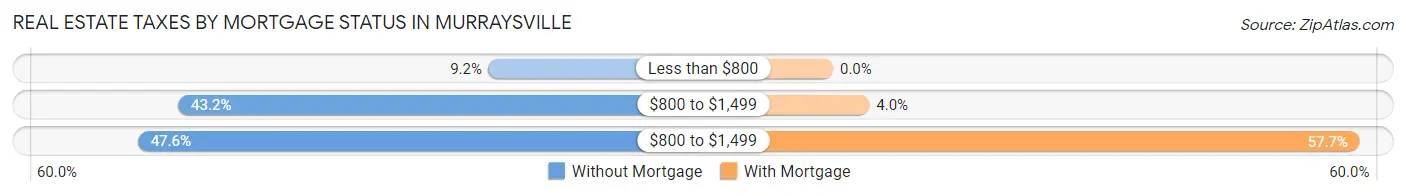
| Property Taxes | Without Mortgage | With Mortgage |
| Less than $800 | 98 (9.2%) | 0 (0.0%) |
| $800 to $1,499 | 458 (43.2%) | 168 (4.0%) |
| $800 to $1,499 | 505 (47.6%) | 2,434 (57.7%) |
| Total | 1,061 (100.0%) | 4,216 (100.0%) |
Health & Disability in Murraysville
Health Insurance Coverage by Age in Murraysville
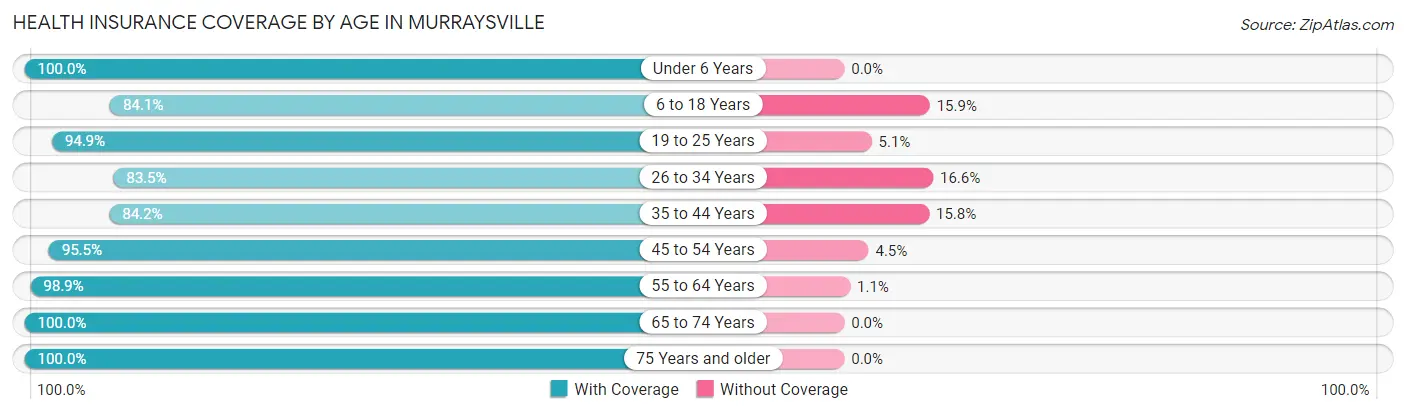
| Age Bracket | With Coverage | Without Coverage |
| Under 6 Years | 960 (100.0%) | 0 (0.0%) |
| 6 to 18 Years | 1,895 (84.1%) | 359 (15.9%) |
| 19 to 25 Years | 2,218 (94.9%) | 119 (5.1%) |
| 26 to 34 Years | 2,088 (83.5%) | 414 (16.6%) |
| 35 to 44 Years | 1,684 (84.2%) | 316 (15.8%) |
| 45 to 54 Years | 2,641 (95.5%) | 125 (4.5%) |
| 55 to 64 Years | 1,642 (98.9%) | 18 (1.1%) |
| 65 to 74 Years | 1,358 (100.0%) | 0 (0.0%) |
| 75 Years and older | 835 (100.0%) | 0 (0.0%) |
| Total | 15,321 (91.9%) | 1,351 (8.1%) |
Health Insurance Coverage by Citizenship Status in Murraysville
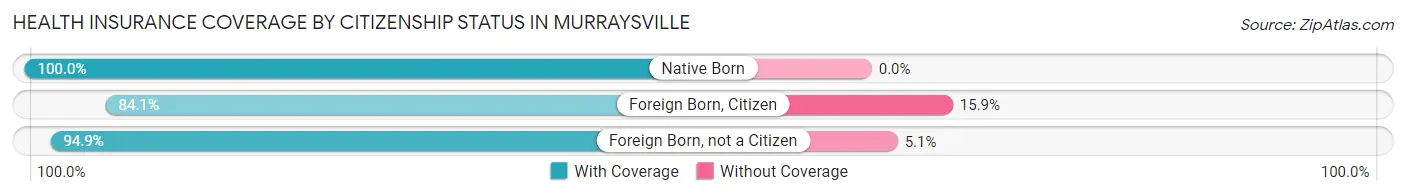
| Citizenship Status | With Coverage | Without Coverage |
| Native Born | 960 (100.0%) | 0 (0.0%) |
| Foreign Born, Citizen | 1,895 (84.1%) | 359 (15.9%) |
| Foreign Born, not a Citizen | 2,218 (94.9%) | 119 (5.1%) |
Health Insurance Coverage by Household Income in Murraysville
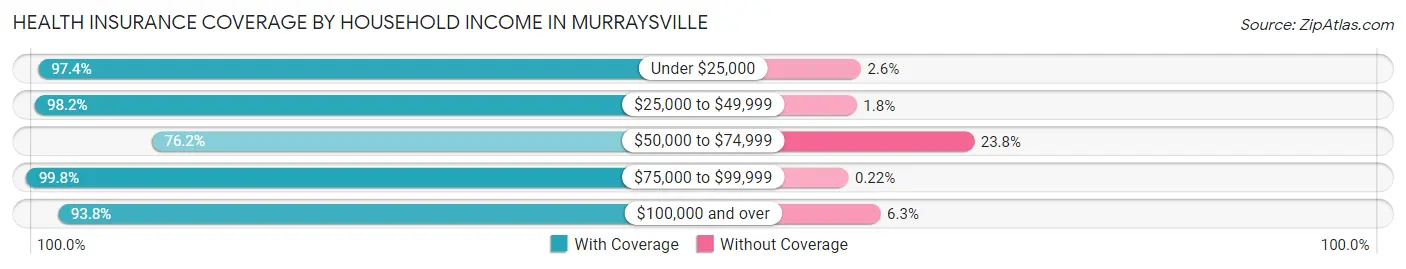
| Household Income | With Coverage | Without Coverage |
| Under $25,000 | 913 (97.4%) | 24 (2.6%) |
| $25,000 to $49,999 | 2,452 (98.2%) | 45 (1.8%) |
| $50,000 to $74,999 | 2,566 (76.2%) | 801 (23.8%) |
| $75,000 to $99,999 | 2,246 (99.8%) | 5 (0.2%) |
| $100,000 and over | 7,144 (93.8%) | 476 (6.2%) |
Public vs Private Health Insurance Coverage by Age in Murraysville
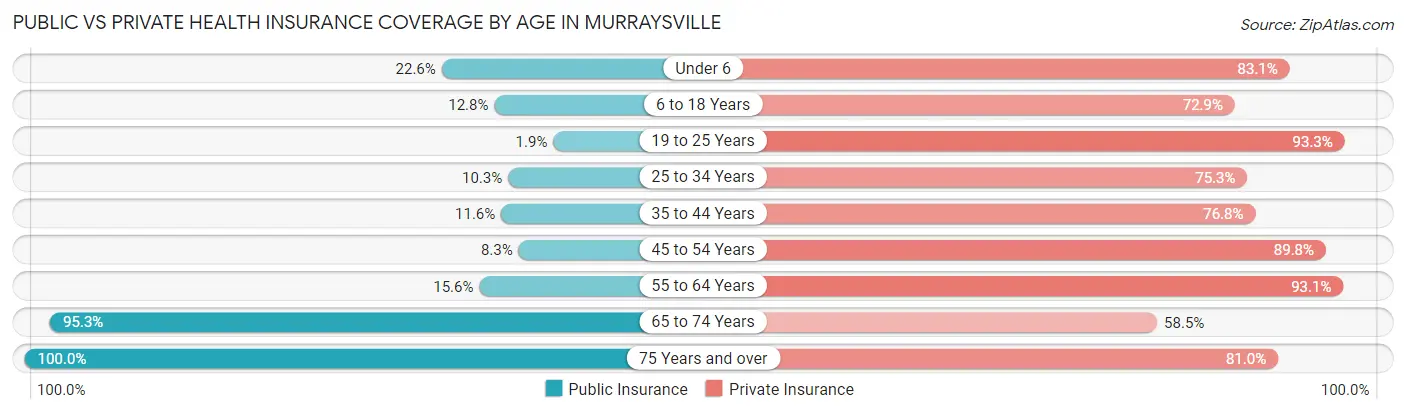
| Age Bracket | Public Insurance | Private Insurance |
| Under 6 | 217 (22.6%) | 798 (83.1%) |
| 6 to 18 Years | 289 (12.8%) | 1,644 (72.9%) |
| 19 to 25 Years | 44 (1.9%) | 2,181 (93.3%) |
| 25 to 34 Years | 257 (10.3%) | 1,883 (75.3%) |
| 35 to 44 Years | 231 (11.6%) | 1,535 (76.7%) |
| 45 to 54 Years | 230 (8.3%) | 2,485 (89.8%) |
| 55 to 64 Years | 259 (15.6%) | 1,545 (93.1%) |
| 65 to 74 Years | 1,294 (95.3%) | 795 (58.5%) |
| 75 Years and over | 835 (100.0%) | 676 (81.0%) |
| Total | 3,656 (21.9%) | 13,542 (81.2%) |
Disability Status by Sex by Age in Murraysville
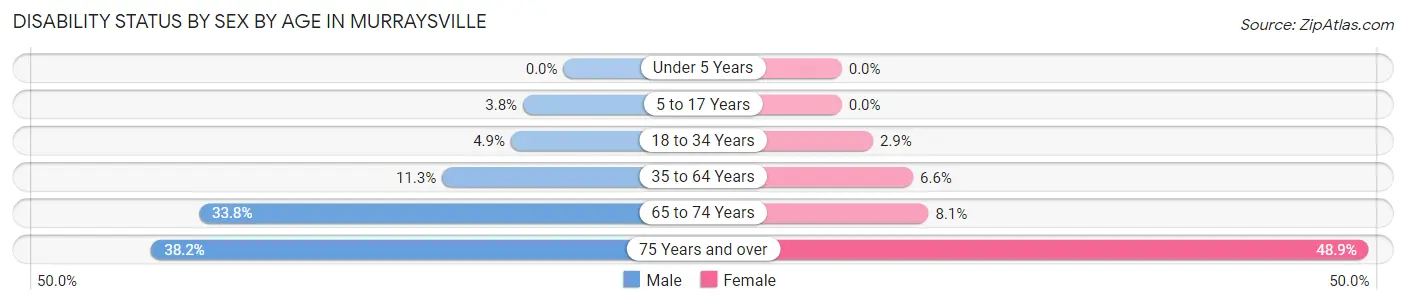
| Age Bracket | Male | Female |
| Under 5 Years | 0 (0.0%) | 0 (0.0%) |
| 5 to 17 Years | 44 (3.7%) | 0 (0.0%) |
| 18 to 34 Years | 127 (4.9%) | 67 (2.9%) |
| 35 to 64 Years | 336 (11.3%) | 228 (6.6%) |
| 65 to 74 Years | 165 (33.8%) | 70 (8.1%) |
| 75 Years and over | 112 (38.2%) | 265 (48.9%) |
Disability Class by Sex by Age in Murraysville
Disability Class: Hearing Difficulty
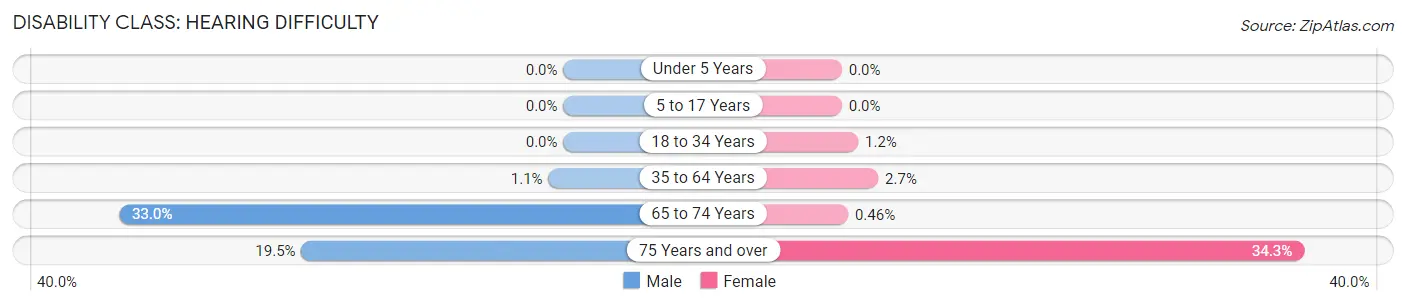
| Age Bracket | Male | Female |
| Under 5 Years | 0 (0.0%) | 0 (0.0%) |
| 5 to 17 Years | 0 (0.0%) | 0 (0.0%) |
| 18 to 34 Years | 0 (0.0%) | 28 (1.2%) |
| 35 to 64 Years | 33 (1.1%) | 93 (2.7%) |
| 65 to 74 Years | 161 (33.0%) | 4 (0.5%) |
| 75 Years and over | 57 (19.5%) | 186 (34.3%) |
Disability Class: Vision Difficulty
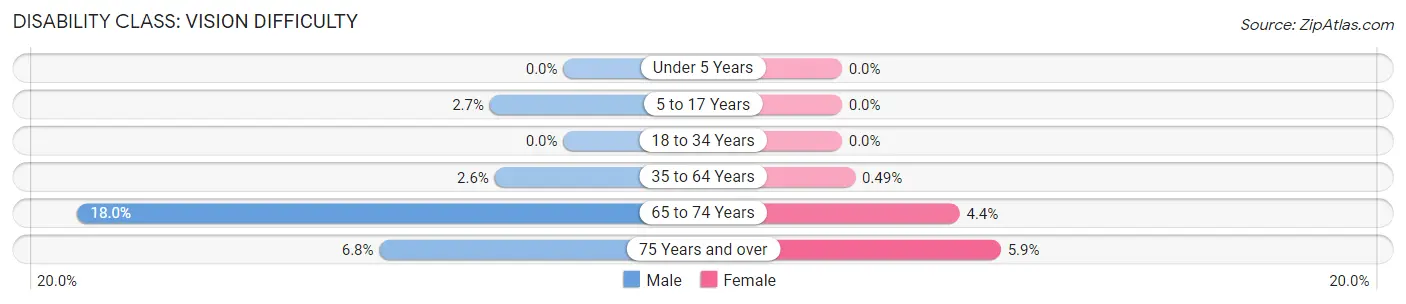
| Age Bracket | Male | Female |
| Under 5 Years | 0 (0.0%) | 0 (0.0%) |
| 5 to 17 Years | 32 (2.7%) | 0 (0.0%) |
| 18 to 34 Years | 0 (0.0%) | 0 (0.0%) |
| 35 to 64 Years | 76 (2.5%) | 17 (0.5%) |
| 65 to 74 Years | 88 (18.0%) | 38 (4.4%) |
| 75 Years and over | 20 (6.8%) | 32 (5.9%) |
Disability Class: Cognitive Difficulty
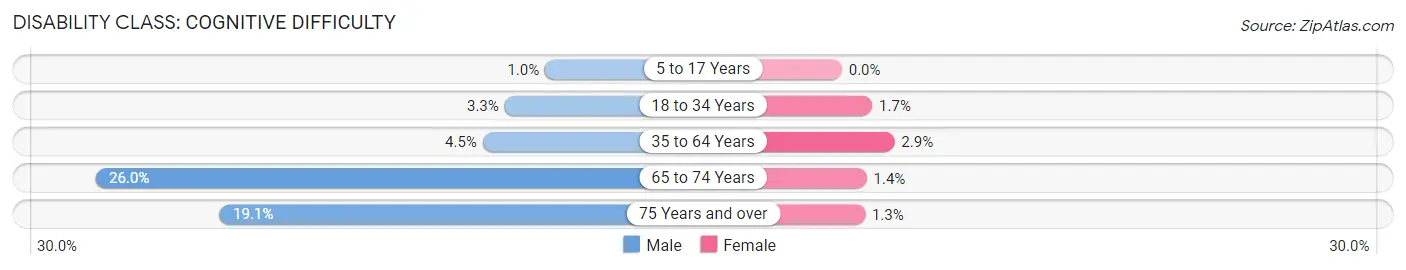
| Age Bracket | Male | Female |
| 5 to 17 Years | 12 (1.0%) | 0 (0.0%) |
| 18 to 34 Years | 85 (3.3%) | 39 (1.7%) |
| 35 to 64 Years | 134 (4.5%) | 101 (2.9%) |
| 65 to 74 Years | 127 (26.0%) | 12 (1.4%) |
| 75 Years and over | 56 (19.1%) | 7 (1.3%) |
Disability Class: Ambulatory Difficulty
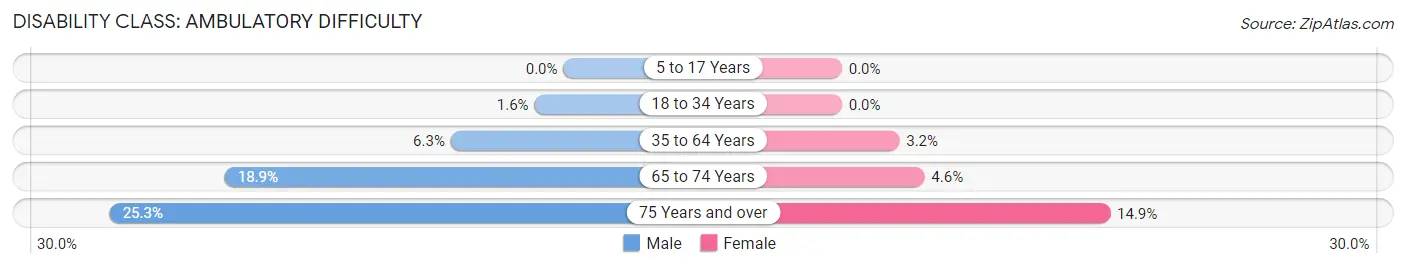
| Age Bracket | Male | Female |
| 5 to 17 Years | 0 (0.0%) | 0 (0.0%) |
| 18 to 34 Years | 42 (1.6%) | 0 (0.0%) |
| 35 to 64 Years | 187 (6.3%) | 110 (3.2%) |
| 65 to 74 Years | 92 (18.9%) | 40 (4.6%) |
| 75 Years and over | 74 (25.3%) | 81 (14.9%) |
Disability Class: Self-Care Difficulty
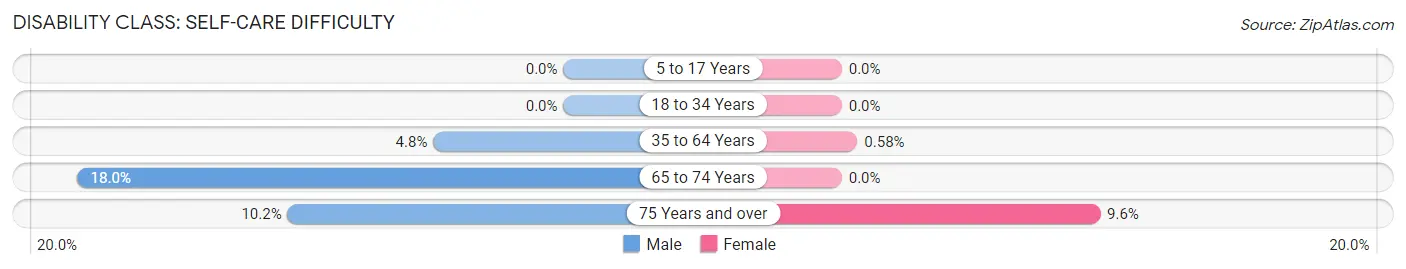
| Age Bracket | Male | Female |
| 5 to 17 Years | 0 (0.0%) | 0 (0.0%) |
| 18 to 34 Years | 0 (0.0%) | 0 (0.0%) |
| 35 to 64 Years | 144 (4.8%) | 20 (0.6%) |
| 65 to 74 Years | 88 (18.0%) | 0 (0.0%) |
| 75 Years and over | 30 (10.2%) | 52 (9.6%) |
Technology Access in Murraysville
Computing Device Access in Murraysville
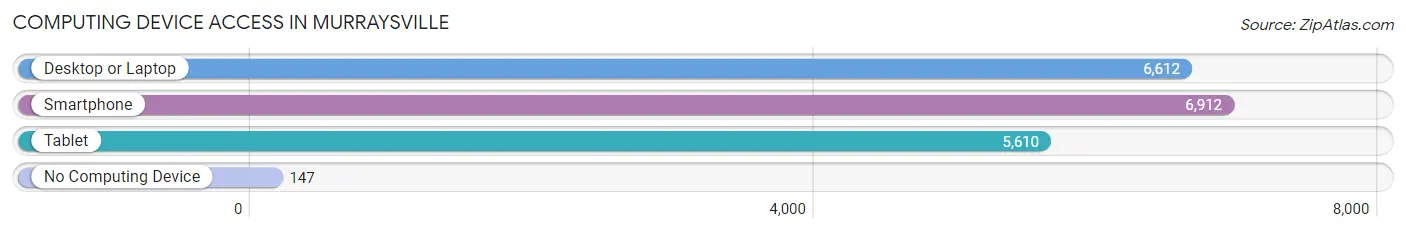
| Device Type | # Households | % Households |
| Desktop or Laptop | 6,612 | 89.8% |
| Smartphone | 6,912 | 93.8% |
| Tablet | 5,610 | 76.2% |
| No Computing Device | 147 | 2.0% |
| Total | 7,366 | 100.0% |
Internet Access in Murraysville
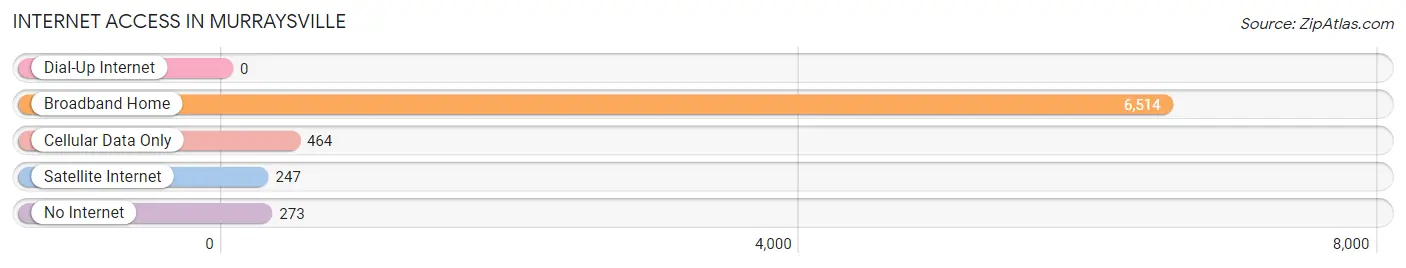
| Internet Type | # Households | % Households |
| Dial-Up Internet | 0 | 0.0% |
| Broadband Home | 6,514 | 88.4% |
| Cellular Data Only | 464 | 6.3% |
| Satellite Internet | 247 | 3.4% |
| No Internet | 273 | 3.7% |
| Total | 7,366 | 100.0% |
Murraysville Summary
Murrayville, NC is a small town located in the western part of North Carolina, in the foothills of the Blue Ridge Mountains. It is situated in the Catawba County, and is part of the Hickory-Lenoir-Morganton Metropolitan Statistical Area. The town has a population of approximately 2,000 people, and is known for its rural charm and small-town atmosphere.
History
The area that is now Murrayville was first settled in the late 1700s by a group of Scots-Irish immigrants. The town was originally known as “Murray’s Crossroads”, named after the first settler, John Murray. The town was officially incorporated in 1891, and was named after Murray.
Geography
Murrayville is located in the foothills of the Blue Ridge Mountains, and is situated in the Catawba River Valley. The town is located at an elevation of 1,000 feet, and is surrounded by rolling hills and lush forests. The town is located approximately 25 miles from Hickory, NC, and is about an hour’s drive from Charlotte, NC.
Economy
The economy of Murrayville is largely based on agriculture and tourism. The town is home to several farms, which produce a variety of crops, including corn, soybeans, and tobacco. The town is also home to several small businesses, including restaurants, shops, and a local winery. Tourism is also an important part of the local economy, as the town is located near several popular attractions, including Lake Hickory, the Catawba River, and the Blue Ridge Parkway.
Demographics
As of the 2010 census, the population of Murrayville was 2,000 people. The racial makeup of the town was 95.2% White, 1.7% African American, 0.7% Native American, 0.3% Asian, and 1.9% from other races. The median household income was $37,500, and the median age was 41.
Murrayville is a small town with a rich history and a unique culture. The town is known for its rural charm and small-town atmosphere, and is a popular destination for tourists and locals alike. The town is home to several farms and businesses, and is a great place to live and work.
Common Questions
What is Per Capita Income in Murraysville?
Per Capita income in Murraysville is $39,695.
What is the Median Family Income in Murraysville?
Median Family Income in Murraysville is $89,464.
What is the Median Household income in Murraysville?
Median Household Income in Murraysville is $76,154.
What is Income or Wage Gap in Murraysville?
Income or Wage Gap in Murraysville is 17.1%.
Women in Murraysville earn 82.9 cents for every dollar earned by a man.
What is Inequality or Gini Index in Murraysville?
Inequality or Gini Index in Murraysville is 0.36.
What is the Total Population of Murraysville?
Total Population of Murraysville is 16,672.
What is the Total Male Population of Murraysville?
Total Male Population of Murraysville is 7,975.
What is the Total Female Population of Murraysville?
Total Female Population of Murraysville is 8,697.
What is the Ratio of Males per 100 Females in Murraysville?
There are 91.70 Males per 100 Females in Murraysville.
What is the Ratio of Females per 100 Males in Murraysville?
There are 109.05 Females per 100 Males in Murraysville.
What is the Median Population Age in Murraysville?
Median Population Age in Murraysville is 36.5 Years.
What is the Average Family Size in Murraysville
Average Family Size in Murraysville is 2.9 People.
What is the Average Household Size in Murraysville
Average Household Size in Murraysville is 2.3 People.
How Large is the Labor Force in Murraysville?
There are 10,583 People in the Labor Forcein in Murraysville.
What is the Percentage of People in the Labor Force in Murraysville?
75.5% of People are in the Labor Force in Murraysville.
What is the Unemployment Rate in Murraysville?
Unemployment Rate in Murraysville is 4.2%.