Hampstead, NC Map & Demographics
Hampstead Map
Hampstead Overview
$45,099
PER CAPITA INCOME
$117,083
AVG FAMILY INCOME
$105,755
AVG HOUSEHOLD INCOME
44.8%
WAGE / INCOME GAP [ % ]
55.2¢/ $1
WAGE / INCOME GAP [ $ ]
$13,654
FAMILY INCOME DEFICIT
0.47
INEQUALITY / GINI INDEX
8,340
TOTAL POPULATION
4,432
MALE POPULATION
3,908
FEMALE POPULATION
113.41
MALES / 100 FEMALES
88.18
FEMALES / 100 MALES
37.5
MEDIAN AGE
3.6
AVG FAMILY SIZE
3.0
AVG HOUSEHOLD SIZE
4,091
LABOR FORCE [ PEOPLE ]
66.3%
PERCENT IN LABOR FORCE
6.4%
UNEMPLOYMENT RATE
Hampstead Zip Codes
Hampstead Area Codes
Income in Hampstead
Income Overview in Hampstead
Per Capita Income in Hampstead is $45,099, while median incomes of families and households are $117,083 and $105,755 respectively.
| Characteristic | Number | Measure |
| Per Capita Income | 8,340 | $45,099 |
| Median Family Income | 2,076 | $117,083 |
| Mean Family Income | 2,076 | $152,897 |
| Median Household Income | 2,779 | $105,755 |
| Mean Household Income | 2,779 | $131,846 |
| Income Deficit | 2,076 | $13,654 |
| Wage / Income Gap (%) | 8,340 | 44.83% |
| Wage / Income Gap ($) | 8,340 | 55.17¢ per $1 |
| Gini / Inequality Index | 8,340 | 0.47 |
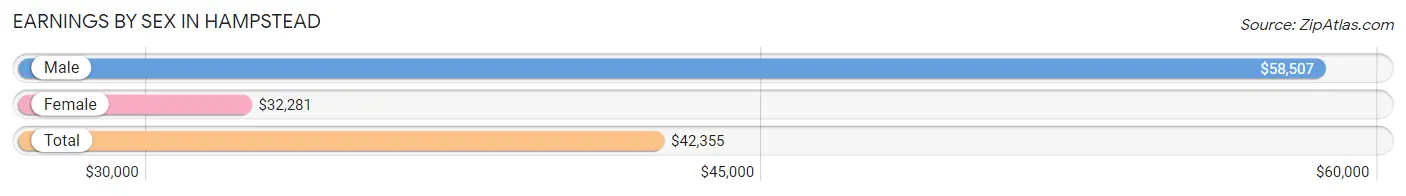
Earnings by Sex in Hampstead
Average Earnings in Hampstead are $42,355, $58,507 for men and $32,281 for women, a difference of 44.8%.
| Sex | Number | Average Earnings |
| Male | 2,247 (54.0%) | $58,507 |
| Female | 1,913 (46.0%) | $32,281 |
| Total | 4,160 (100.0%) | $42,355 |
Earnings by Sex by Income Bracket in Hampstead
The most common earnings brackets in Hampstead are $100,000+ for men (678 | 30.2%) and $2,499 or less for women (249 | 13.0%).
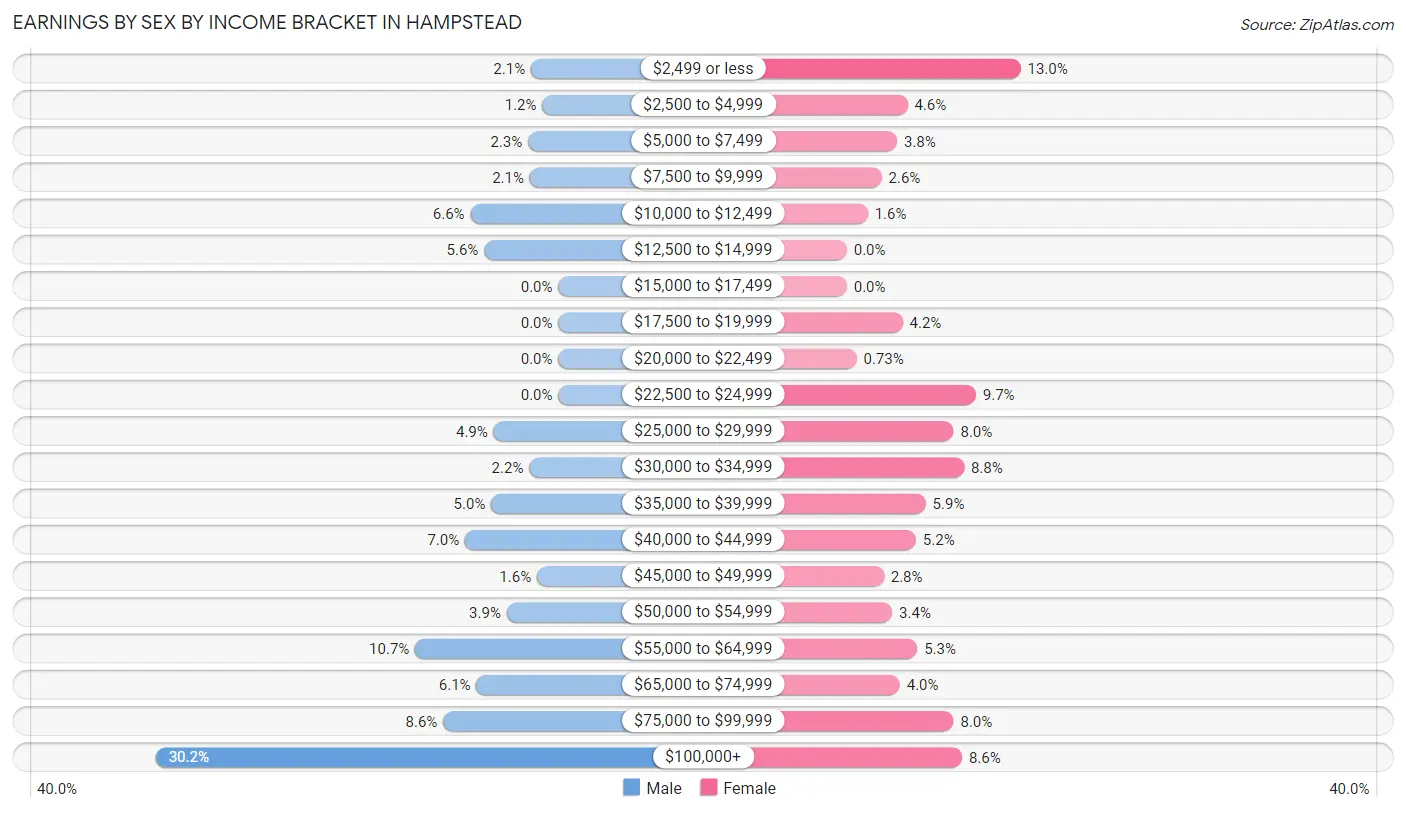
| Income | Male | Female |
| $2,499 or less | 46 (2.1%) | 249 (13.0%) |
| $2,500 to $4,999 | 27 (1.2%) | 87 (4.5%) |
| $5,000 to $7,499 | 51 (2.3%) | 72 (3.8%) |
| $7,500 to $9,999 | 48 (2.1%) | 50 (2.6%) |
| $10,000 to $12,499 | 148 (6.6%) | 30 (1.6%) |
| $12,500 to $14,999 | 125 (5.6%) | 0 (0.0%) |
| $15,000 to $17,499 | 0 (0.0%) | 0 (0.0%) |
| $17,500 to $19,999 | 0 (0.0%) | 80 (4.2%) |
| $20,000 to $22,499 | 0 (0.0%) | 14 (0.7%) |
| $22,500 to $24,999 | 0 (0.0%) | 185 (9.7%) |
| $25,000 to $29,999 | 109 (4.9%) | 153 (8.0%) |
| $30,000 to $34,999 | 49 (2.2%) | 168 (8.8%) |
| $35,000 to $39,999 | 113 (5.0%) | 113 (5.9%) |
| $40,000 to $44,999 | 157 (7.0%) | 99 (5.2%) |
| $45,000 to $49,999 | 36 (1.6%) | 53 (2.8%) |
| $50,000 to $54,999 | 87 (3.9%) | 65 (3.4%) |
| $55,000 to $64,999 | 241 (10.7%) | 101 (5.3%) |
| $65,000 to $74,999 | 138 (6.1%) | 76 (4.0%) |
| $75,000 to $99,999 | 194 (8.6%) | 153 (8.0%) |
| $100,000+ | 678 (30.2%) | 165 (8.6%) |
| Total | 2,247 (100.0%) | 1,913 (100.0%) |
Earnings by Sex by Educational Attainment in Hampstead
Average earnings in Hampstead are $72,826 for men and $34,902 for women, a difference of 52.1%. Men with an educational attainment of graduate degree enjoy the highest average annual earnings of $141,042, while those with high school diploma education earn the least with $44,177. Women with an educational attainment of graduate degree earn the most with the average annual earnings of $67,746, while those with high school diploma education have the smallest earnings of $23,639.
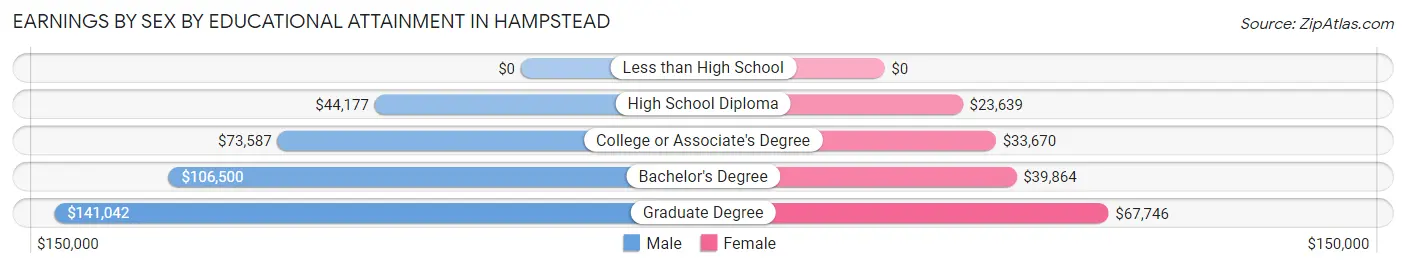
| Educational Attainment | Male Income | Female Income |
| Less than High School | - | - |
| High School Diploma | $44,177 | $23,639 |
| College or Associate's Degree | $73,587 | $33,670 |
| Bachelor's Degree | $106,500 | $39,864 |
| Graduate Degree | $141,042 | $67,746 |
| Total | $72,826 | $34,902 |
Family Income in Hampstead
Family Income Brackets in Hampstead
According to the Hampstead family income data, there are 513 families falling into the $200,000+ income range, which is the most common income bracket and makes up 24.7% of all families. Conversely, the $15,000 to $24,999 income bracket is the least frequent group with only 23 families (1.1%) belonging to this category.
| Income Bracket | # Families | % Families |
| Less than $10,000 | 110 | 5.3% |
| $10,000 to $14,999 | 52 | 2.5% |
| $15,000 to $24,999 | 23 | 1.1% |
| $25,000 to $34,999 | 85 | 4.1% |
| $35,000 to $49,999 | 131 | 6.3% |
| $50,000 to $74,999 | 224 | 10.8% |
| $75,000 to $99,999 | 187 | 9.0% |
| $100,000 to $149,999 | 500 | 24.1% |
| $150,000 to $199,999 | 251 | 12.1% |
| $200,000+ | 513 | 24.7% |
Family Income by Famaliy Size in Hampstead
5-person families (278 | 13.4%) account for the highest median family income in Hampstead with $200,058 per family, while 2-person families (807 | 38.9%) have the highest median income of $52,520 per family member.
| Income Bracket | # Families | Median Income |
| 2-Person Families | 807 (38.9%) | $105,041 |
| 3-Person Families | 453 (21.8%) | $105,592 |
| 4-Person Families | 426 (20.5%) | $157,813 |
| 5-Person Families | 278 (13.4%) | $200,058 |
| 6-Person Families | 70 (3.4%) | $156,538 |
| 7+ Person Families | 42 (2.0%) | $0 |
| Total | 2,076 (100.0%) | $117,083 |
Family Income by Number of Earners in Hampstead
The median family income in Hampstead is $117,083, with families comprising 3+ earners (360) having the highest median family income of $190,652, while families with no earners (224) have the lowest median family income of $30,938, accounting for 17.3% and 10.8% of families, respectively.
| Number of Earners | # Families | Median Income |
| No Earners | 224 (10.8%) | $30,938 |
| 1 Earner | 624 (30.1%) | $73,125 |
| 2 Earners | 868 (41.8%) | $146,184 |
| 3+ Earners | 360 (17.3%) | $190,652 |
| Total | 2,076 (100.0%) | $117,083 |
Household Income in Hampstead
Household Income Brackets in Hampstead
With 670 households falling in the category, the $100,000 to $149,999 income range is the most frequent in Hampstead, accounting for 24.1% of all households. In contrast, only 78 households (2.8%) fall into the $10,000 to $14,999 income bracket, making it the least populous group.
| Income Bracket | # Households | % Households |
| Less than $10,000 | 211 | 7.6% |
| $10,000 to $14,999 | 78 | 2.8% |
| $15,000 to $24,999 | 81 | 2.9% |
| $25,000 to $34,999 | 128 | 4.6% |
| $35,000 to $49,999 | 181 | 6.5% |
| $50,000 to $74,999 | 395 | 14.2% |
| $75,000 to $99,999 | 264 | 9.5% |
| $100,000 to $149,999 | 670 | 24.1% |
| $150,000 to $199,999 | 250 | 9.0% |
| $200,000+ | 520 | 18.7% |
Household Income by Householder Age in Hampstead
The median household income in Hampstead is $105,755, with the highest median household income of $135,032 found in the 45 to 64 years age bracket for the primary householder. A total of 1,041 households (37.5%) fall into this category.
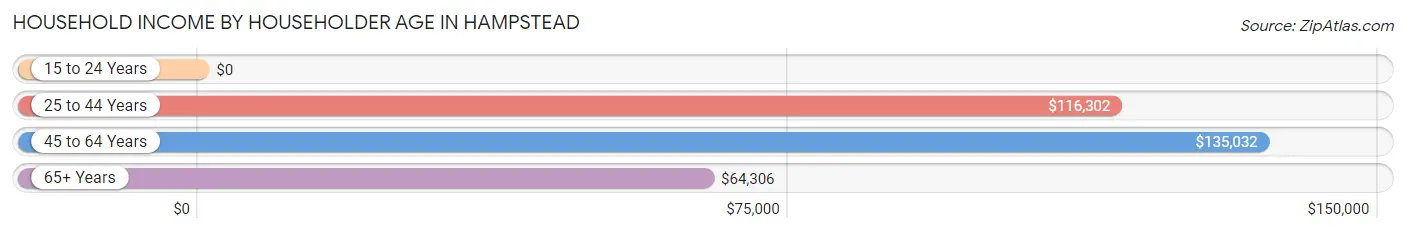
| Income Bracket | # Households | Median Income |
| 15 to 24 Years | 0 (0.0%) | $0 |
| 25 to 44 Years | 1,007 (36.2%) | $116,302 |
| 45 to 64 Years | 1,041 (37.5%) | $135,032 |
| 65+ Years | 731 (26.3%) | $64,306 |
| Total | 2,779 (100.0%) | $105,755 |
Poverty in Hampstead
Income Below Poverty by Sex and Age in Hampstead
With 10.4% poverty level for males and 7.0% for females among the residents of Hampstead, 15 year old males and 6 to 11 year old females are the most vulnerable to poverty, with 22 males (37.9%) and 97 females (18.2%) in their respective age groups living below the poverty level.
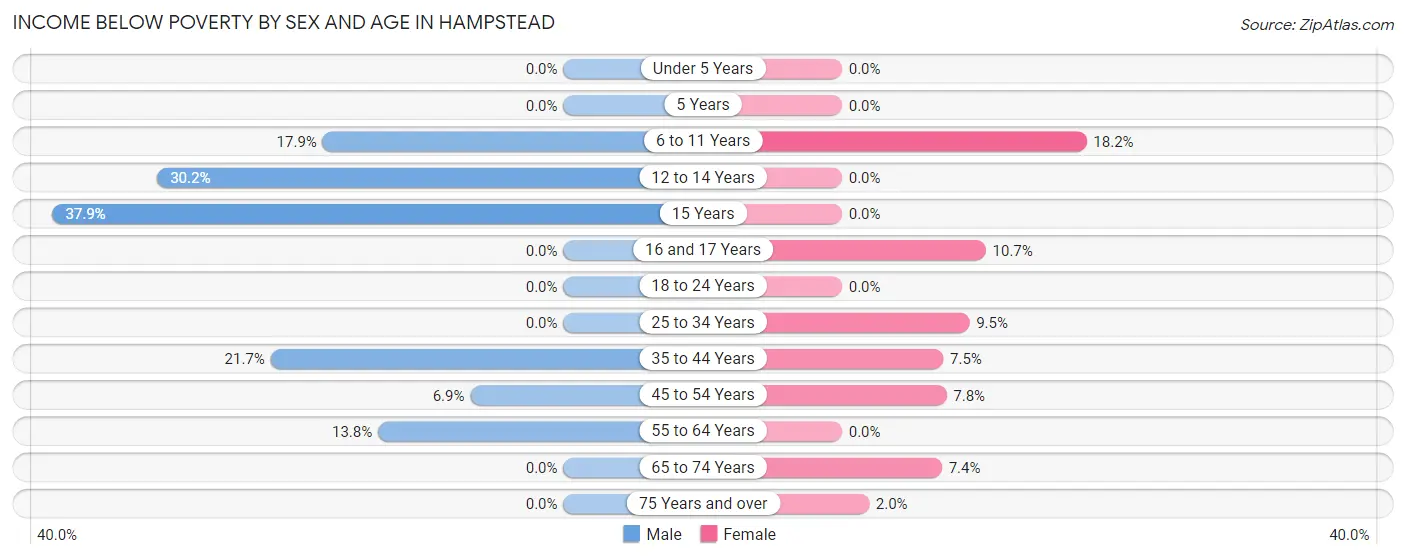
| Age Bracket | Male | Female |
| Under 5 Years | 0 (0.0%) | 0 (0.0%) |
| 5 Years | 0 (0.0%) | 0 (0.0%) |
| 6 to 11 Years | 84 (17.9%) | 97 (18.2%) |
| 12 to 14 Years | 79 (30.1%) | 0 (0.0%) |
| 15 Years | 22 (37.9%) | 0 (0.0%) |
| 16 and 17 Years | 0 (0.0%) | 11 (10.7%) |
| 18 to 24 Years | 0 (0.0%) | 0 (0.0%) |
| 25 to 34 Years | 0 (0.0%) | 47 (9.5%) |
| 35 to 44 Years | 156 (21.7%) | 43 (7.5%) |
| 45 to 54 Years | 40 (6.9%) | 45 (7.8%) |
| 55 to 64 Years | 82 (13.8%) | 0 (0.0%) |
| 65 to 74 Years | 0 (0.0%) | 25 (7.4%) |
| 75 Years and over | 0 (0.0%) | 7 (2.0%) |
| Total | 463 (10.4%) | 275 (7.0%) |
Income Above Poverty by Sex and Age in Hampstead
According to the poverty statistics in Hampstead, males aged under 5 years and females aged under 5 years are the age groups that are most secure financially, with 100.0% of males and 100.0% of females in these age groups living above the poverty line.
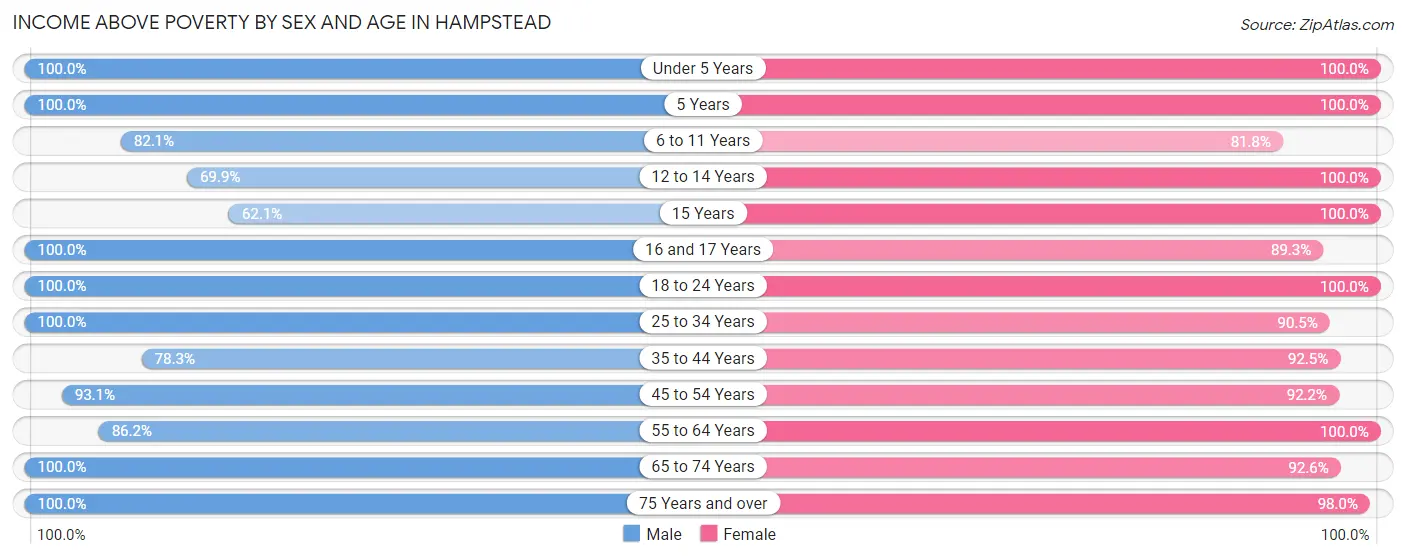
| Age Bracket | Male | Female |
| Under 5 Years | 300 (100.0%) | 180 (100.0%) |
| 5 Years | 71 (100.0%) | 14 (100.0%) |
| 6 to 11 Years | 386 (82.1%) | 437 (81.8%) |
| 12 to 14 Years | 183 (69.9%) | 182 (100.0%) |
| 15 Years | 36 (62.1%) | 99 (100.0%) |
| 16 and 17 Years | 100 (100.0%) | 92 (89.3%) |
| 18 to 24 Years | 416 (100.0%) | 180 (100.0%) |
| 25 to 34 Years | 359 (100.0%) | 450 (90.5%) |
| 35 to 44 Years | 562 (78.3%) | 529 (92.5%) |
| 45 to 54 Years | 539 (93.1%) | 535 (92.2%) |
| 55 to 64 Years | 514 (86.2%) | 281 (100.0%) |
| 65 to 74 Years | 218 (100.0%) | 312 (92.6%) |
| 75 Years and over | 285 (100.0%) | 342 (98.0%) |
| Total | 3,969 (89.5%) | 3,633 (93.0%) |
Income Below Poverty Among Married-Couple Families in Hampstead
The poverty statistics for married-couple families in Hampstead show that 6.7% or 120 of the total 1,781 families live below the poverty line. Families with 1 or 2 children have the highest poverty rate of 14.5%, comprising of 116 families. On the other hand, families with 3 or 4 children have the lowest poverty rate of 0.0%, which includes 0 families.
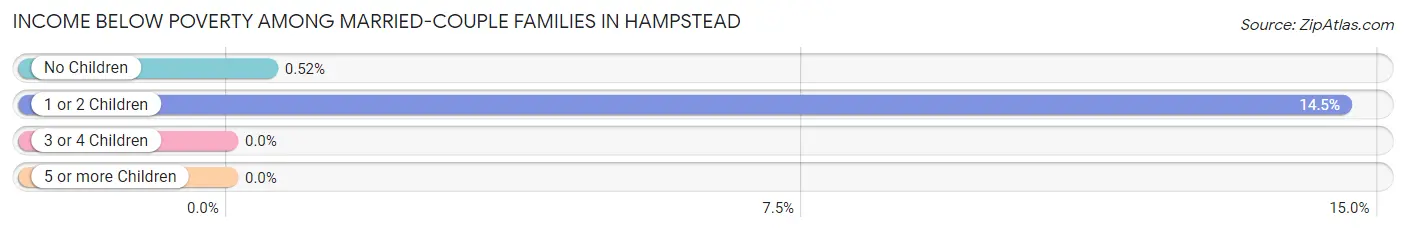
| Children | Above Poverty | Below Poverty |
| No Children | 768 (99.5%) | 4 (0.5%) |
| 1 or 2 Children | 682 (85.5%) | 116 (14.5%) |
| 3 or 4 Children | 187 (100.0%) | 0 (0.0%) |
| 5 or more Children | 24 (100.0%) | 0 (0.0%) |
| Total | 1,661 (93.3%) | 120 (6.7%) |
Income Below Poverty Among Single-Parent Households in Hampstead
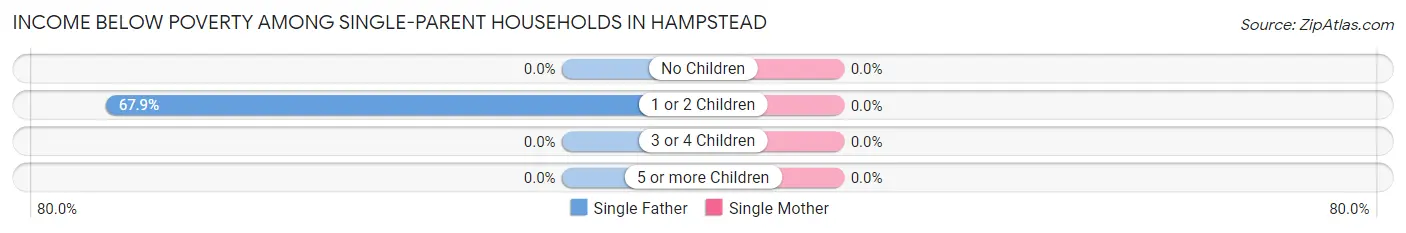
| Children | Single Father | Single Mother |
| No Children | 0 (0.0%) | 0 (0.0%) |
| 1 or 2 Children | 74 (67.9%) | 0 (0.0%) |
| 3 or 4 Children | 0 (0.0%) | 0 (0.0%) |
| 5 or more Children | 0 (0.0%) | 0 (0.0%) |
| Total | 74 (62.7%) | 0 (0.0%) |
Income Below Poverty Among Married-Couple vs Single-Parent Households in Hampstead
The poverty data for Hampstead shows that 120 of the married-couple family households (6.7%) and 74 of the single-parent households (25.1%) are living below the poverty level. Within the married-couple family households, those with 1 or 2 children have the highest poverty rate, with 116 households (14.5%) falling below the poverty line. Among the single-parent households, those with 1 or 2 children have the highest poverty rate, with 74 household (38.3%) living below poverty.
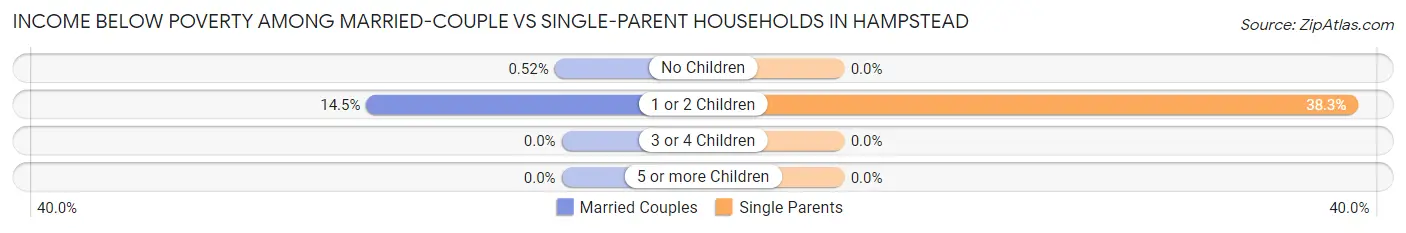
| Children | Married-Couple Families | Single-Parent Households |
| No Children | 4 (0.5%) | 0 (0.0%) |
| 1 or 2 Children | 116 (14.5%) | 74 (38.3%) |
| 3 or 4 Children | 0 (0.0%) | 0 (0.0%) |
| 5 or more Children | 0 (0.0%) | 0 (0.0%) |
| Total | 120 (6.7%) | 74 (25.1%) |
Race in Hampstead
The most populous races in Hampstead are White / Caucasian (6,997 | 83.9%), Two or more Races (930 | 11.2%), and Hispanic or Latino (476 | 5.7%).
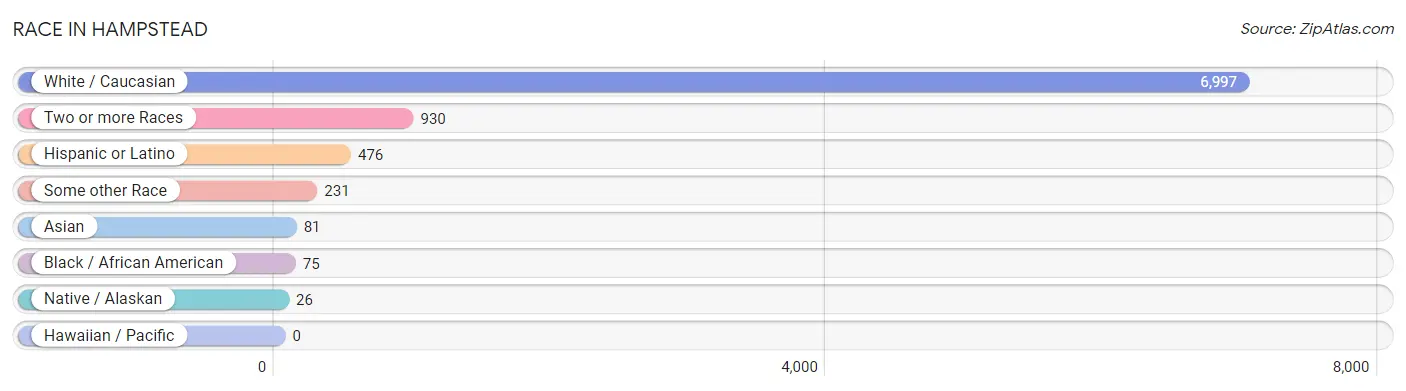
| Race | # Population | % Population |
| Asian | 81 | 1.0% |
| Black / African American | 75 | 0.9% |
| Hawaiian / Pacific | 0 | 0.0% |
| Hispanic or Latino | 476 | 5.7% |
| Native / Alaskan | 26 | 0.3% |
| White / Caucasian | 6,997 | 83.9% |
| Two or more Races | 930 | 11.2% |
| Some other Race | 231 | 2.8% |
| Total | 8,340 | 100.0% |
Ancestry in Hampstead
The most populous ancestries reported in Hampstead are German (1,200 | 14.4%), Irish (1,166 | 14.0%), English (1,104 | 13.2%), Mexican (442 | 5.3%), and American (375 | 4.5%), together accounting for 51.4% of all Hampstead residents.
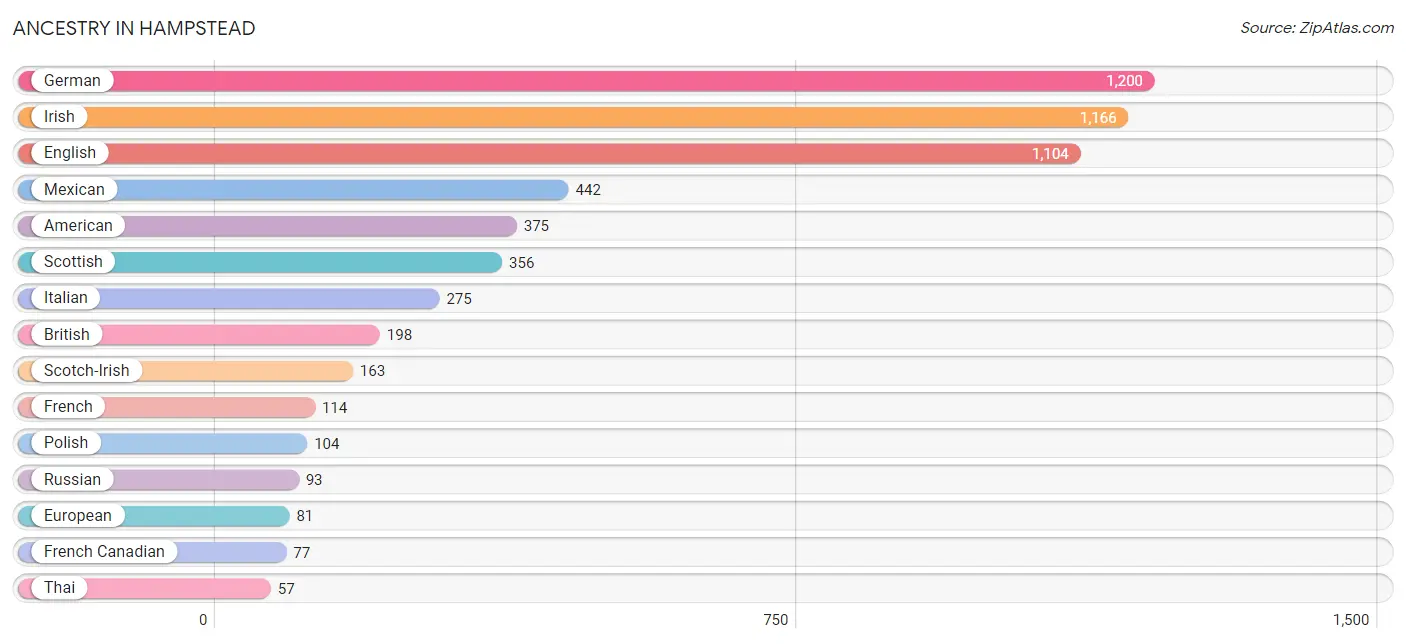
| Ancestry | # Population | % Population |
| American | 375 | 4.5% |
| Arab | 18 | 0.2% |
| British | 198 | 2.4% |
| Cherokee | 10 | 0.1% |
| Choctaw | 14 | 0.2% |
| Czech | 15 | 0.2% |
| Dutch | 22 | 0.3% |
| Eastern European | 41 | 0.5% |
| English | 1,104 | 13.2% |
| European | 81 | 1.0% |
| Finnish | 35 | 0.4% |
| French | 114 | 1.4% |
| French Canadian | 77 | 0.9% |
| German | 1,200 | 14.4% |
| Greek | 14 | 0.2% |
| Indian (Asian) | 55 | 0.7% |
| Irish | 1,166 | 14.0% |
| Italian | 275 | 3.3% |
| Jamaican | 15 | 0.2% |
| Korean | 39 | 0.5% |
| Lithuanian | 41 | 0.5% |
| Lumbee | 36 | 0.4% |
| Mexican | 442 | 5.3% |
| Norwegian | 45 | 0.5% |
| Polish | 104 | 1.3% |
| Portuguese | 11 | 0.1% |
| Puerto Rican | 34 | 0.4% |
| Romanian | 27 | 0.3% |
| Russian | 93 | 1.1% |
| Scandinavian | 36 | 0.4% |
| Scotch-Irish | 163 | 1.9% |
| Scottish | 356 | 4.3% |
| South African | 37 | 0.4% |
| Subsaharan African | 37 | 0.4% |
| Swedish | 10 | 0.1% |
| Syrian | 18 | 0.2% |
| Thai | 57 | 0.7% |
| Welsh | 36 | 0.4% | View All 38 Rows |
Immigrants in Hampstead
The most numerous immigrant groups reported in Hampstead came from Africa (183 | 2.2%), South Africa (183 | 2.2%), Latin America (142 | 1.7%), Central America (130 | 1.6%), and Mexico (130 | 1.6%), together accounting for 9.2% of all Hampstead residents.
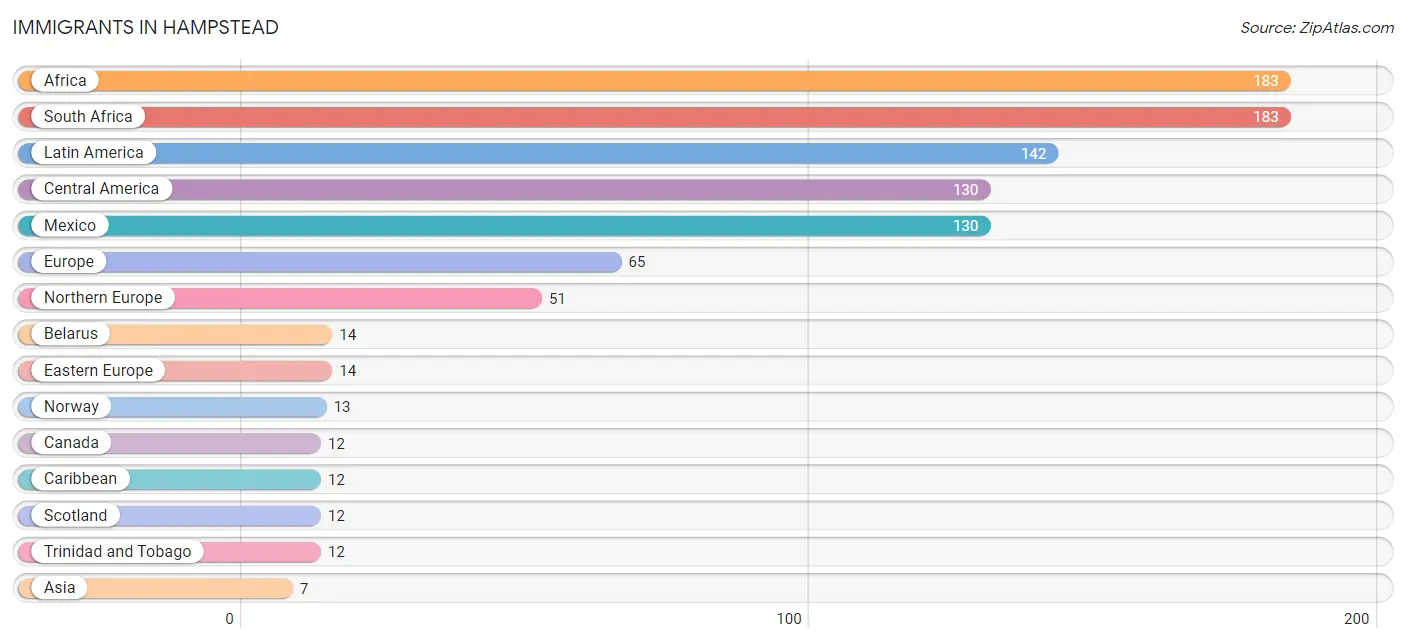
| Immigration Origin | # Population | % Population |
| Africa | 183 | 2.2% |
| Asia | 7 | 0.1% |
| Belarus | 14 | 0.2% |
| Canada | 12 | 0.1% |
| Caribbean | 12 | 0.1% |
| Central America | 130 | 1.6% |
| Eastern Europe | 14 | 0.2% |
| Europe | 65 | 0.8% |
| Latin America | 142 | 1.7% |
| Mexico | 130 | 1.6% |
| Northern Europe | 51 | 0.6% |
| Norway | 13 | 0.2% |
| Philippines | 7 | 0.1% |
| Scotland | 12 | 0.1% |
| South Africa | 183 | 2.2% |
| South Eastern Asia | 7 | 0.1% |
| Trinidad and Tobago | 12 | 0.1% | View All 17 Rows |
Sex and Age in Hampstead
Sex and Age in Hampstead
The most populous age groups in Hampstead are 10 to 14 Years (525 | 11.8%) for men and 10 to 14 Years (382 | 9.8%) for women.
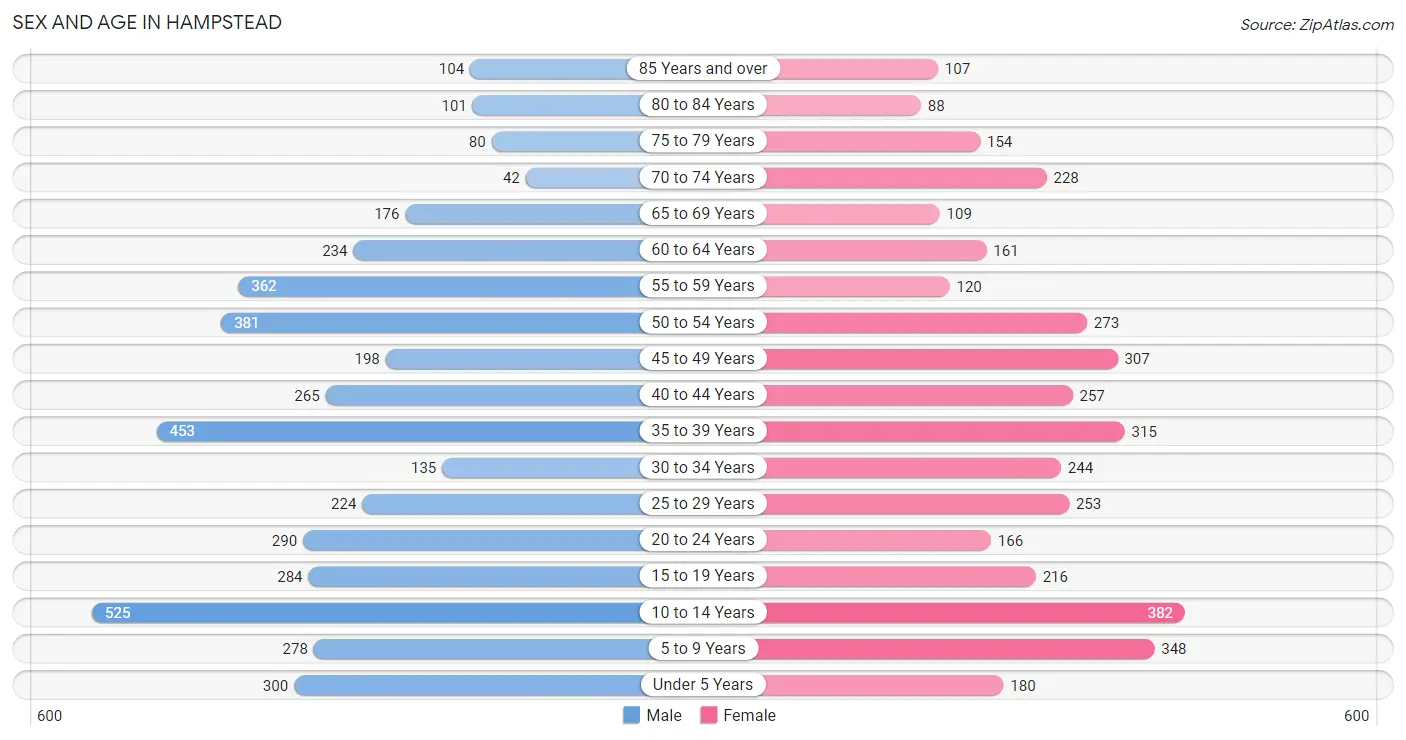
| Age Bracket | Male | Female |
| Under 5 Years | 300 (6.8%) | 180 (4.6%) |
| 5 to 9 Years | 278 (6.3%) | 348 (8.9%) |
| 10 to 14 Years | 525 (11.8%) | 382 (9.8%) |
| 15 to 19 Years | 284 (6.4%) | 216 (5.5%) |
| 20 to 24 Years | 290 (6.5%) | 166 (4.3%) |
| 25 to 29 Years | 224 (5.1%) | 253 (6.5%) |
| 30 to 34 Years | 135 (3.0%) | 244 (6.2%) |
| 35 to 39 Years | 453 (10.2%) | 315 (8.1%) |
| 40 to 44 Years | 265 (6.0%) | 257 (6.6%) |
| 45 to 49 Years | 198 (4.5%) | 307 (7.9%) |
| 50 to 54 Years | 381 (8.6%) | 273 (7.0%) |
| 55 to 59 Years | 362 (8.2%) | 120 (3.1%) |
| 60 to 64 Years | 234 (5.3%) | 161 (4.1%) |
| 65 to 69 Years | 176 (4.0%) | 109 (2.8%) |
| 70 to 74 Years | 42 (0.9%) | 228 (5.8%) |
| 75 to 79 Years | 80 (1.8%) | 154 (3.9%) |
| 80 to 84 Years | 101 (2.3%) | 88 (2.2%) |
| 85 Years and over | 104 (2.4%) | 107 (2.7%) |
| Total | 4,432 (100.0%) | 3,908 (100.0%) |
Families and Households in Hampstead
Median Family Size in Hampstead
The median family size in Hampstead is 3.64 persons per family, with married-couple families (1,781 | 85.8%) accounting for the largest median family size of 3.74 persons per family. On the other hand, single female/mother families (177 | 8.5%) represent the smallest median family size with 2.97 persons per family.
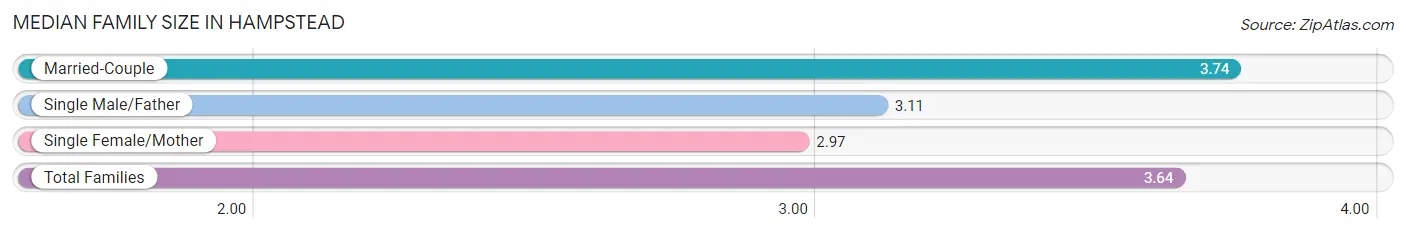
| Family Type | # Families | Family Size |
| Married-Couple | 1,781 (85.8%) | 3.74 |
| Single Male/Father | 118 (5.7%) | 3.11 |
| Single Female/Mother | 177 (8.5%) | 2.97 |
| Total Families | 2,076 (100.0%) | 3.64 |
Median Household Size in Hampstead
The median household size in Hampstead is 3.00 persons per household, with married-couple households (1,781 | 64.1%) accounting for the largest median household size of 3.74 persons per household. non-family households (703 | 25.3%) represent the smallest median household size with 1.03 persons per household.
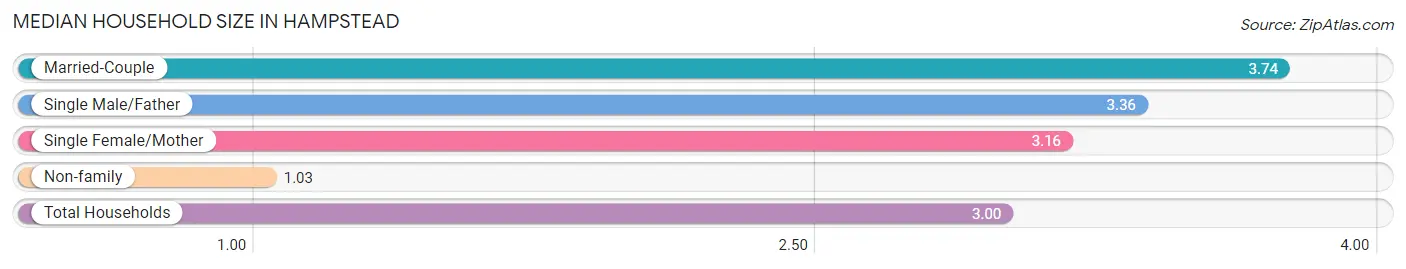
| Household Type | # Households | Household Size |
| Married-Couple | 1,781 (64.1%) | 3.74 |
| Single Male/Father | 118 (4.3%) | 3.36 |
| Single Female/Mother | 177 (6.4%) | 3.16 |
| Non-family | 703 (25.3%) | 1.03 |
| Total Households | 2,779 (100.0%) | 3.00 |
Household Size by Marriage Status in Hampstead
Out of a total of 2,779 households in Hampstead, 2,076 (74.7%) are family households, while 703 (25.3%) are nonfamily households. The most numerous type of family households are 2-person households, comprising 736, and the most common type of nonfamily households are 1-person households, comprising 680.
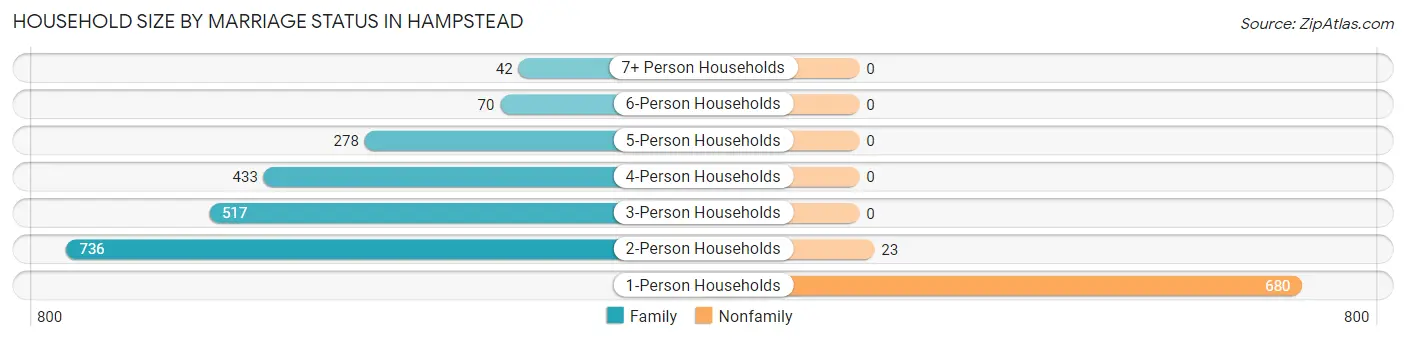
| Household Size | Family Households | Nonfamily Households |
| 1-Person Households | - | 680 (24.5%) |
| 2-Person Households | 736 (26.5%) | 23 (0.8%) |
| 3-Person Households | 517 (18.6%) | 0 (0.0%) |
| 4-Person Households | 433 (15.6%) | 0 (0.0%) |
| 5-Person Households | 278 (10.0%) | 0 (0.0%) |
| 6-Person Households | 70 (2.5%) | 0 (0.0%) |
| 7+ Person Households | 42 (1.5%) | 0 (0.0%) |
| Total | 2,076 (74.7%) | 703 (25.3%) |
Female Fertility in Hampstead
Fertility by Age in Hampstead
Average fertility rate in Hampstead is 66.0 births per 1,000 women. Women in the age bracket of 20 to 34 years have the highest fertility rate with 118.0 births per 1,000 women. Women in the age bracket of 20 to 34 years acount for 61.9% of all women with births.
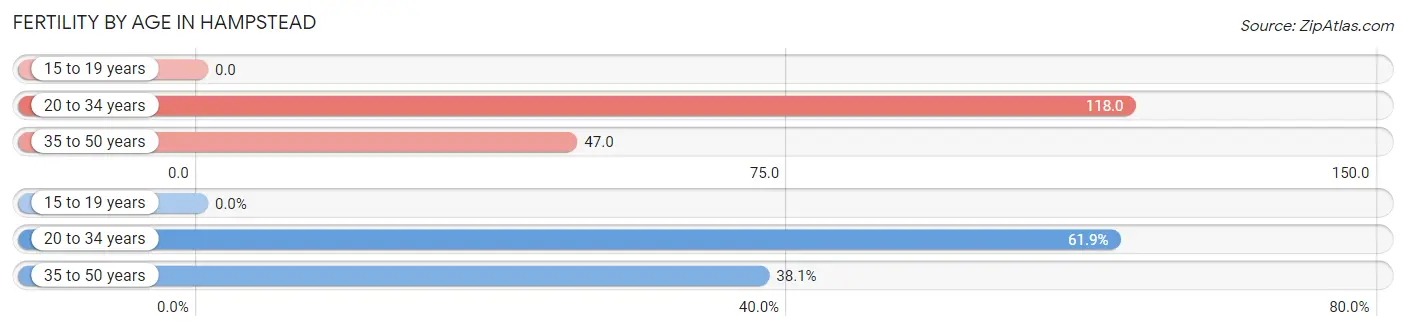
| Age Bracket | Women with Births | Births / 1,000 Women |
| 15 to 19 years | 0 (0.0%) | 0.0 |
| 20 to 34 years | 78 (61.9%) | 118.0 |
| 35 to 50 years | 48 (38.1%) | 47.0 |
| Total | 126 (100.0%) | 66.0 |
Fertility by Age by Marriage Status in Hampstead
95.2% of women with births (126) in Hampstead are married. The highest percentage of unmarried women with births falls into 20 to 34 years age bracket with 7.7% of them unmarried at the time of birth, while the lowest percentage of unmarried women with births belong to 35 to 50 years age bracket with 0.0% of them unmarried.
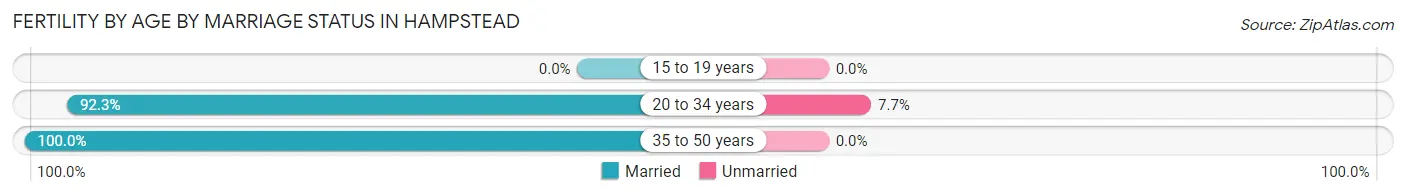
| Age Bracket | Married | Unmarried |
| 15 to 19 years | 0 (0.0%) | 0 (0.0%) |
| 20 to 34 years | 72 (92.3%) | 6 (7.7%) |
| 35 to 50 years | 48 (100.0%) | 0 (0.0%) |
| Total | 120 (95.2%) | 6 (4.8%) |
Fertility by Education in Hampstead
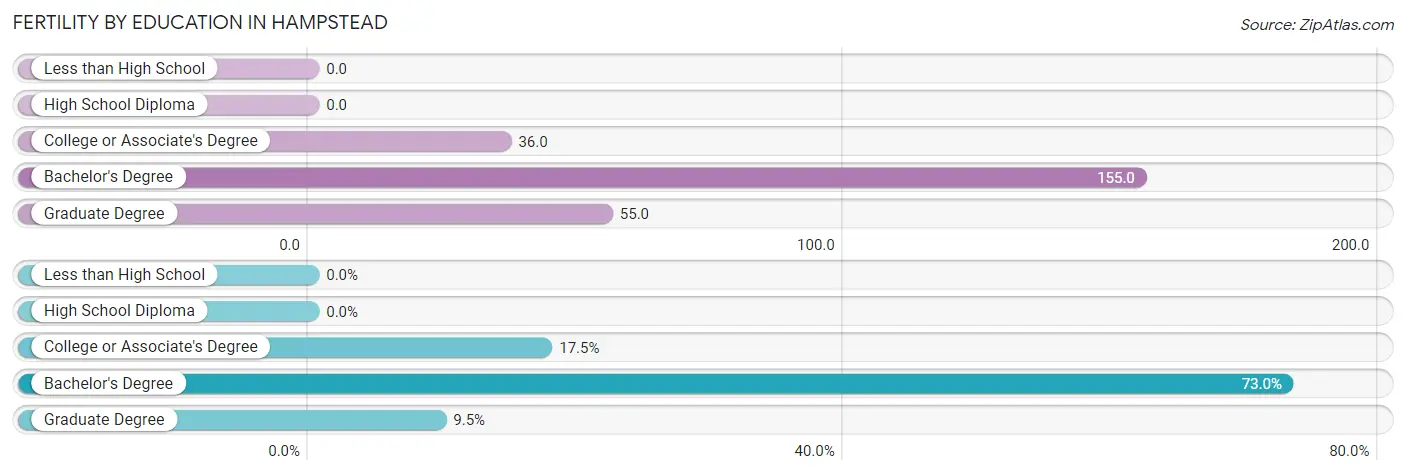
| Educational Attainment | Women with Births | Births / 1,000 Women |
| Less than High School | 0 (0.0%) | 0.0 |
| High School Diploma | 0 (0.0%) | 0.0 |
| College or Associate's Degree | 22 (17.5%) | 36.0 |
| Bachelor's Degree | 92 (73.0%) | 155.0 |
| Graduate Degree | 12 (9.5%) | 55.0 |
| Total | 126 (100.0%) | 66.0 |
Fertility by Education by Marriage Status in Hampstead
4.8% of women with births in Hampstead are unmarried. Women with the educational attainment of bachelor's degree are most likely to be married with 100.0% of them married at childbirth, while women with the educational attainment of college or associate's degree are least likely to be married with 27.3% of them unmarried at childbirth.
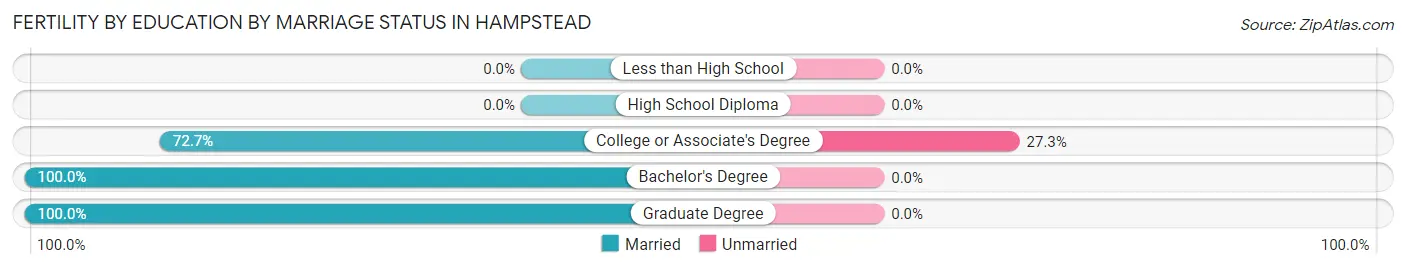
| Educational Attainment | Married | Unmarried |
| Less than High School | 0 (0.0%) | 0 (0.0%) |
| High School Diploma | 0 (0.0%) | 0 (0.0%) |
| College or Associate's Degree | 16 (72.7%) | 6 (27.3%) |
| Bachelor's Degree | 92 (100.0%) | 0 (0.0%) |
| Graduate Degree | 12 (100.0%) | 0 (0.0%) |
| Total | 120 (95.2%) | 6 (4.8%) |
Employment Characteristics in Hampstead
Employment by Class of Employer in Hampstead
Among the 3,799 employed individuals in Hampstead, private company employees (2,487 | 65.5%), self-employed (not incorporated) (352 | 9.3%), and self-employed (incorporated) (290 | 7.6%) make up the most common classes of employment.
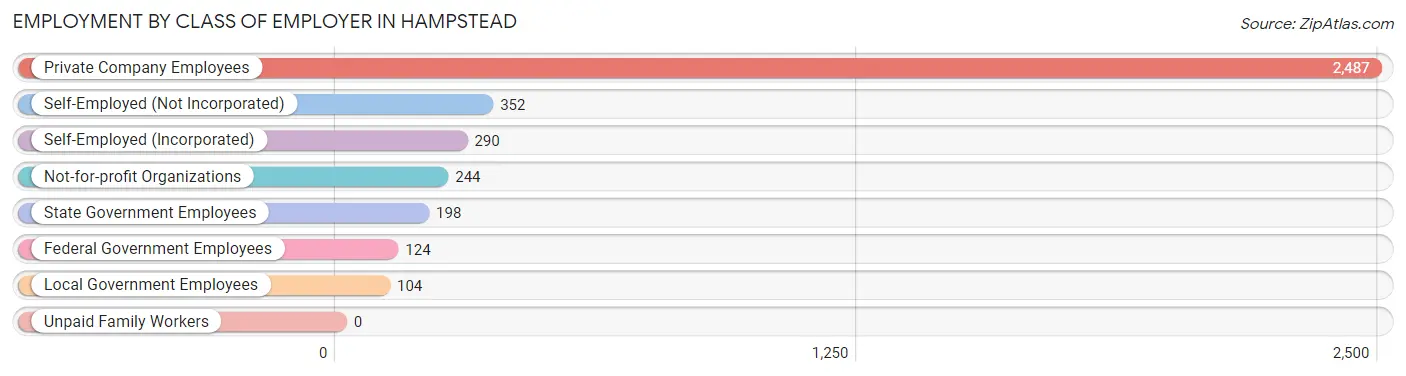
| Employer Class | # Employees | % Employees |
| Private Company Employees | 2,487 | 65.5% |
| Self-Employed (Incorporated) | 290 | 7.6% |
| Self-Employed (Not Incorporated) | 352 | 9.3% |
| Not-for-profit Organizations | 244 | 6.4% |
| Local Government Employees | 104 | 2.7% |
| State Government Employees | 198 | 5.2% |
| Federal Government Employees | 124 | 3.3% |
| Unpaid Family Workers | 0 | 0.0% |
| Total | 3,799 | 100.0% |
Employment Status by Age in Hampstead
According to the labor force statistics for Hampstead, out of the total population over 16 years of age (6,170), 66.3% or 4,091 individuals are in the labor force, with 6.4% or 262 of them unemployed. The age group with the highest labor force participation rate is 20 to 24 years, with 96.5% or 440 individuals in the labor force. Within the labor force, the 20 to 24 years age range has the highest percentage of unemployed individuals, with 25.0% or 110 of them being unemployed.
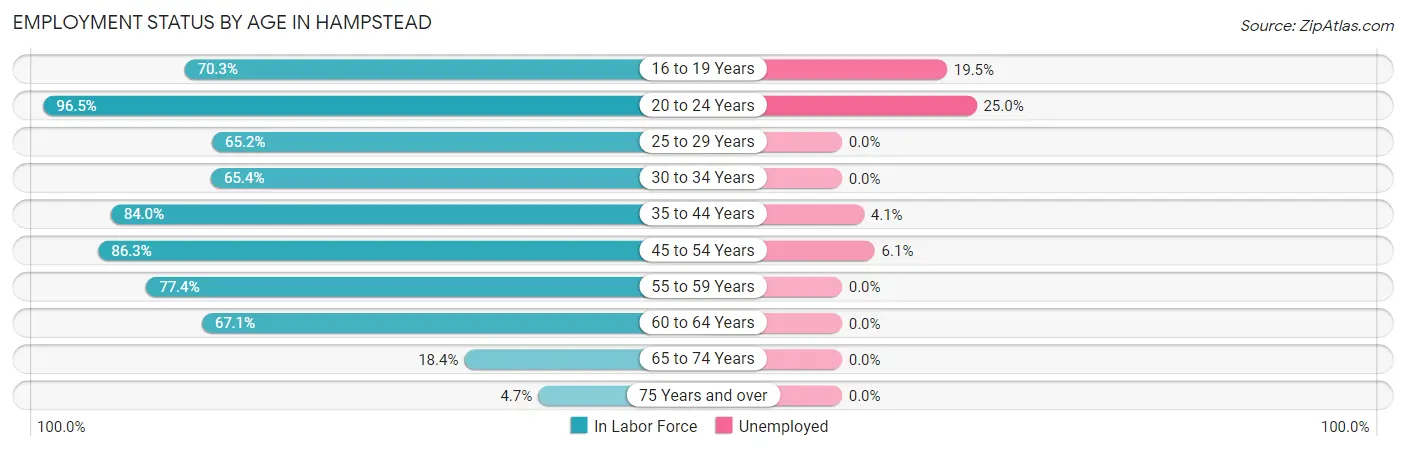
| Age Bracket | In Labor Force | Unemployed |
| 16 to 19 Years | 241 (70.3%) | 47 (19.5%) |
| 20 to 24 Years | 440 (96.5%) | 110 (25.0%) |
| 25 to 29 Years | 311 (65.2%) | 0 (0.0%) |
| 30 to 34 Years | 248 (65.4%) | 0 (0.0%) |
| 35 to 44 Years | 1,084 (84.0%) | 44 (4.1%) |
| 45 to 54 Years | 1,000 (86.3%) | 61 (6.1%) |
| 55 to 59 Years | 373 (77.4%) | 0 (0.0%) |
| 60 to 64 Years | 265 (67.1%) | 0 (0.0%) |
| 65 to 74 Years | 102 (18.4%) | 0 (0.0%) |
| 75 Years and over | 30 (4.7%) | 0 (0.0%) |
| Total | 4,091 (66.3%) | 262 (6.4%) |
Employment Status by Educational Attainment in Hampstead
According to labor force statistics for Hampstead, 78.4% of individuals (3,279) out of the total population between 25 and 64 years of age (4,182) are in the labor force, with 3.2% or 105 of them being unemployed. The group with the highest labor force participation rate are those with the educational attainment of bachelor's degree or higher, with 80.4% or 1,443 individuals in the labor force. Within the labor force, individuals with bachelor's degree or higher education have the highest percentage of unemployment, with 6.2% or 89 of them being unemployed.
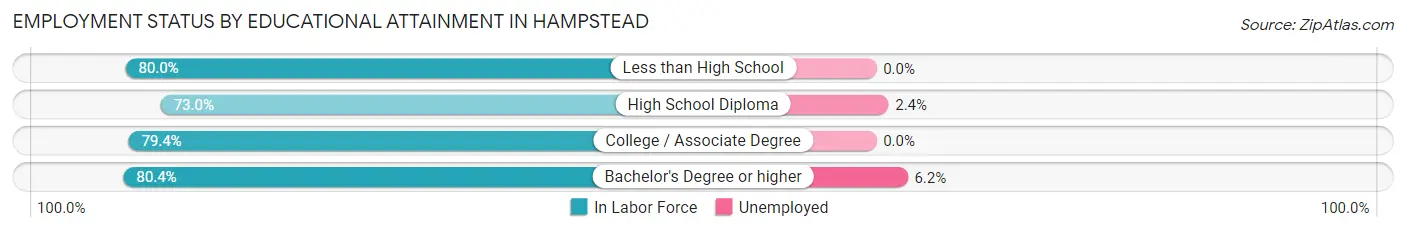
| Educational Attainment | In Labor Force | Unemployed |
| Less than High School | 100 (80.0%) | 0 (0.0%) |
| High School Diploma | 675 (73.0%) | 22 (2.4%) |
| College / Associate Degree | 1,062 (79.4%) | 0 (0.0%) |
| Bachelor's Degree or higher | 1,443 (80.4%) | 111 (6.2%) |
| Total | 3,279 (78.4%) | 134 (3.2%) |
Employment Occupations by Sex in Hampstead
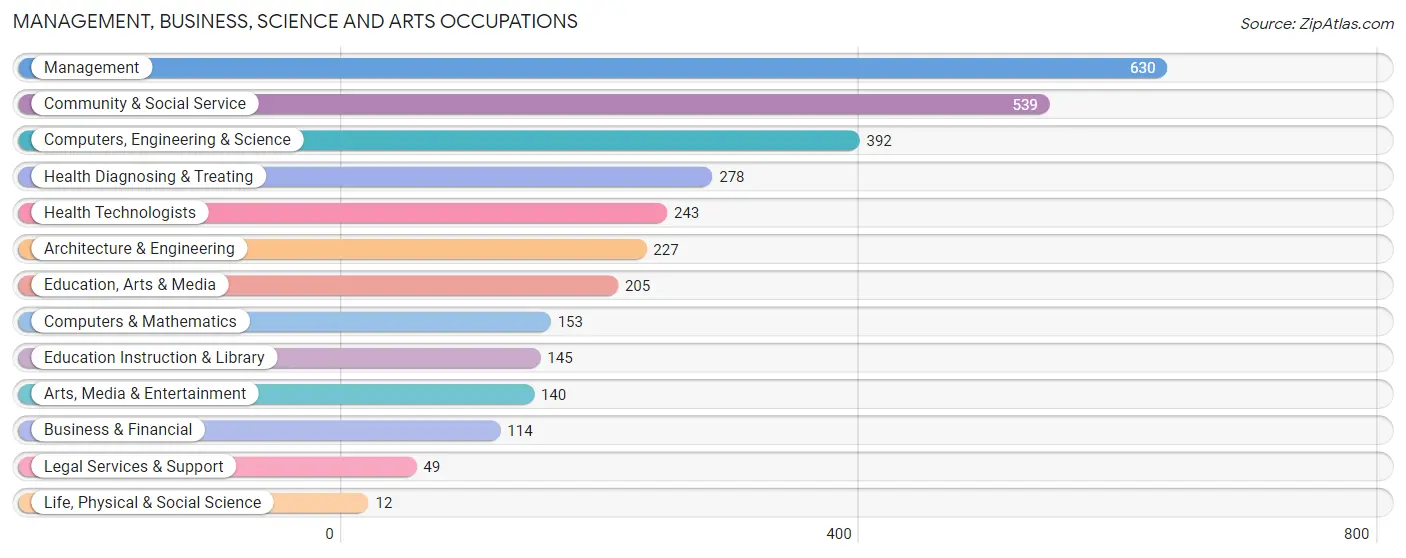
Management, Business, Science and Arts Occupations
The most common Management, Business, Science and Arts occupations in Hampstead are Management (630 | 16.5%), Community & Social Service (539 | 14.1%), Computers, Engineering & Science (392 | 10.3%), Health Diagnosing & Treating (278 | 7.3%), and Health Technologists (243 | 6.4%).
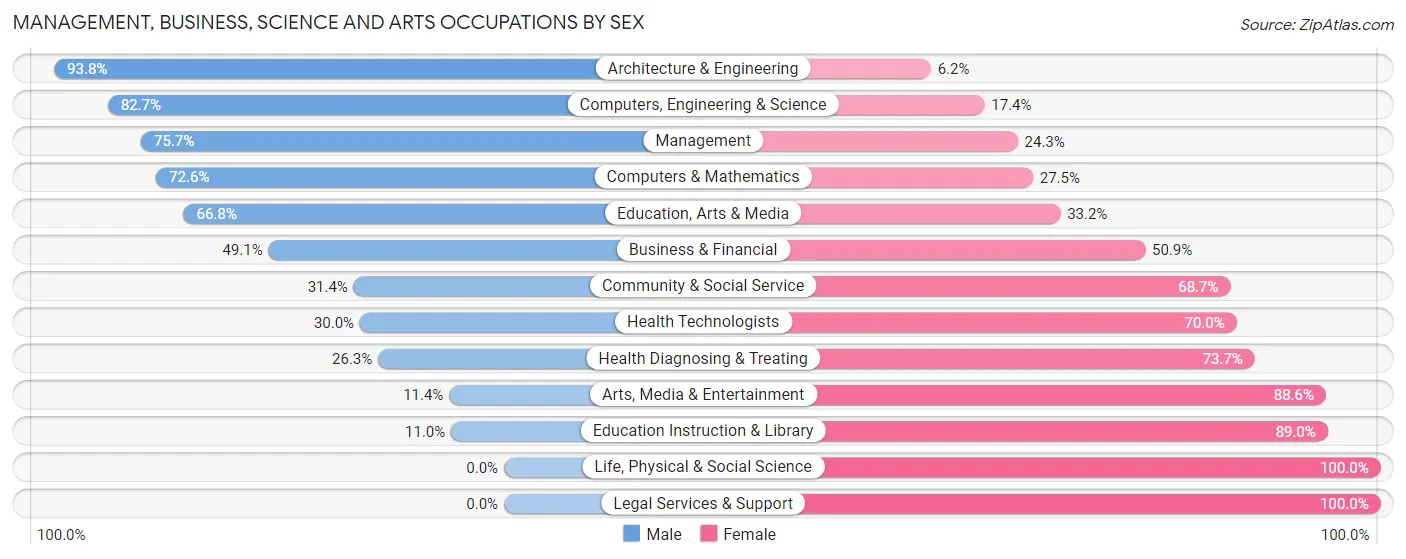
Management, Business, Science and Arts Occupations by Sex
Within the Management, Business, Science and Arts occupations in Hampstead, the most male-oriented occupations are Architecture & Engineering (93.8%), Computers, Engineering & Science (82.7%), and Management (75.7%), while the most female-oriented occupations are Life, Physical & Social Science (100.0%), Legal Services & Support (100.0%), and Education Instruction & Library (89.0%).
| Occupation | Male | Female |
| Management | 477 (75.7%) | 153 (24.3%) |
| Business & Financial | 56 (49.1%) | 58 (50.9%) |
| Computers, Engineering & Science | 324 (82.7%) | 68 (17.3%) |
| Computers & Mathematics | 111 (72.6%) | 42 (27.5%) |
| Architecture & Engineering | 213 (93.8%) | 14 (6.2%) |
| Life, Physical & Social Science | 0 (0.0%) | 12 (100.0%) |
| Community & Social Service | 169 (31.4%) | 370 (68.6%) |
| Education, Arts & Media | 137 (66.8%) | 68 (33.2%) |
| Legal Services & Support | 0 (0.0%) | 49 (100.0%) |
| Education Instruction & Library | 16 (11.0%) | 129 (89.0%) |
| Arts, Media & Entertainment | 16 (11.4%) | 124 (88.6%) |
| Health Diagnosing & Treating | 73 (26.3%) | 205 (73.7%) |
| Health Technologists | 73 (30.0%) | 170 (70.0%) |
| Total (Category) | 1,099 (56.3%) | 854 (43.7%) |
| Total (Overall) | 2,183 (57.3%) | 1,629 (42.7%) |
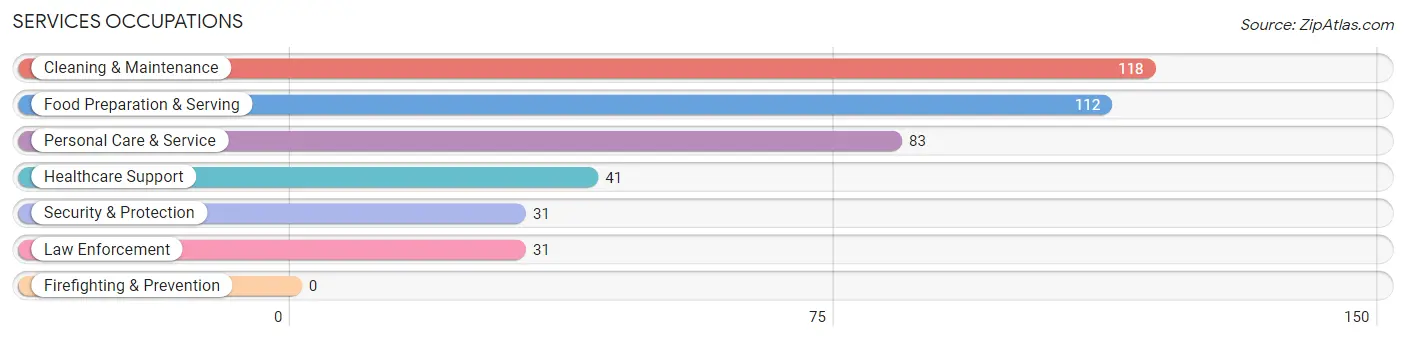
Services Occupations
The most common Services occupations in Hampstead are Cleaning & Maintenance (118 | 3.1%), Food Preparation & Serving (112 | 2.9%), Personal Care & Service (83 | 2.2%), Healthcare Support (41 | 1.1%), and Security & Protection (31 | 0.8%).
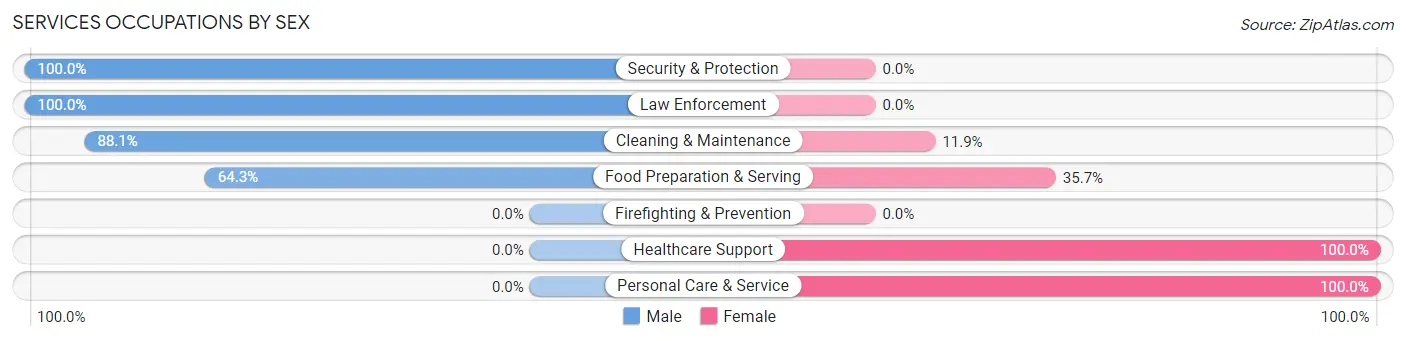
Services Occupations by Sex
Within the Services occupations in Hampstead, the most male-oriented occupations are Security & Protection (100.0%), Law Enforcement (100.0%), and Cleaning & Maintenance (88.1%), while the most female-oriented occupations are Healthcare Support (100.0%), Personal Care & Service (100.0%), and Food Preparation & Serving (35.7%).
| Occupation | Male | Female |
| Healthcare Support | 0 (0.0%) | 41 (100.0%) |
| Security & Protection | 31 (100.0%) | 0 (0.0%) |
| Firefighting & Prevention | 0 (0.0%) | 0 (0.0%) |
| Law Enforcement | 31 (100.0%) | 0 (0.0%) |
| Food Preparation & Serving | 72 (64.3%) | 40 (35.7%) |
| Cleaning & Maintenance | 104 (88.1%) | 14 (11.9%) |
| Personal Care & Service | 0 (0.0%) | 83 (100.0%) |
| Total (Category) | 207 (53.8%) | 178 (46.2%) |
| Total (Overall) | 2,183 (57.3%) | 1,629 (42.7%) |
Sales and Office Occupations
The most common Sales and Office occupations in Hampstead are Office & Administration (416 | 10.9%), and Sales & Related (301 | 7.9%).
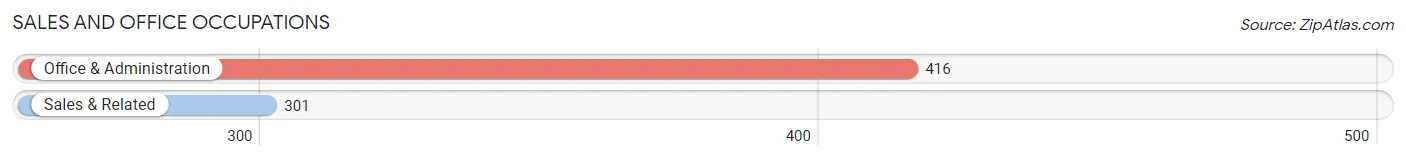
Sales and Office Occupations by Sex
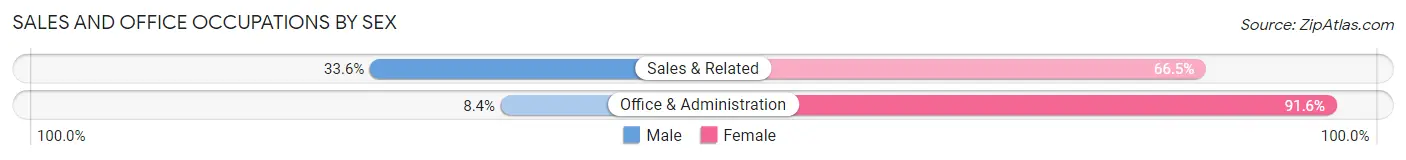
| Occupation | Male | Female |
| Sales & Related | 101 (33.6%) | 200 (66.4%) |
| Office & Administration | 35 (8.4%) | 381 (91.6%) |
| Total (Category) | 136 (19.0%) | 581 (81.0%) |
| Total (Overall) | 2,183 (57.3%) | 1,629 (42.7%) |
Natural Resources, Construction and Maintenance Occupations
The most common Natural Resources, Construction and Maintenance occupations in Hampstead are Installation, Maintenance & Repair (283 | 7.4%), and Construction & Extraction (116 | 3.0%).
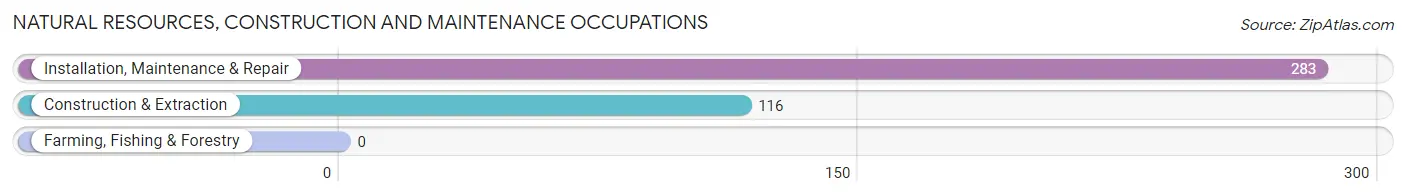
Natural Resources, Construction and Maintenance Occupations by Sex
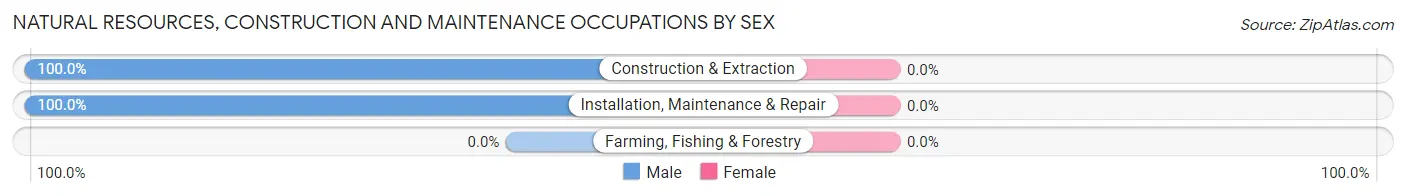
| Occupation | Male | Female |
| Farming, Fishing & Forestry | 0 (0.0%) | 0 (0.0%) |
| Construction & Extraction | 116 (100.0%) | 0 (0.0%) |
| Installation, Maintenance & Repair | 283 (100.0%) | 0 (0.0%) |
| Total (Category) | 399 (100.0%) | 0 (0.0%) |
| Total (Overall) | 2,183 (57.3%) | 1,629 (42.7%) |
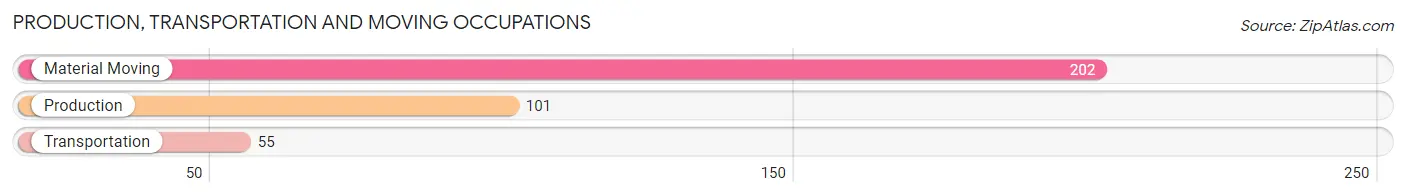
Production, Transportation and Moving Occupations
The most common Production, Transportation and Moving occupations in Hampstead are Material Moving (202 | 5.3%), Production (101 | 2.6%), and Transportation (55 | 1.4%).
Production, Transportation and Moving Occupations by Sex
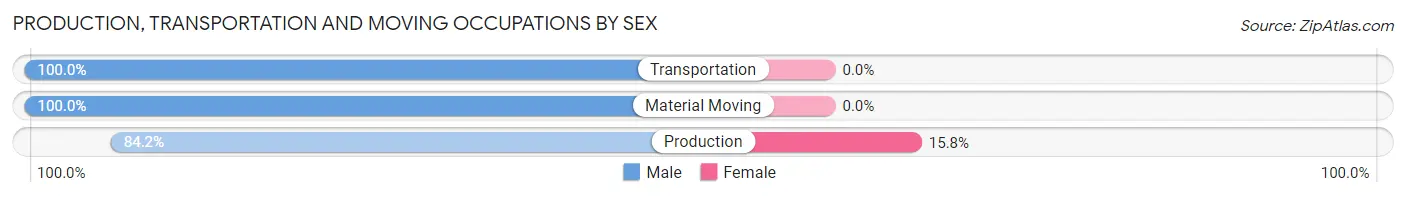
| Occupation | Male | Female |
| Production | 85 (84.2%) | 16 (15.8%) |
| Transportation | 55 (100.0%) | 0 (0.0%) |
| Material Moving | 202 (100.0%) | 0 (0.0%) |
| Total (Category) | 342 (95.5%) | 16 (4.5%) |
| Total (Overall) | 2,183 (57.3%) | 1,629 (42.7%) |
Employment Industries by Sex in Hampstead
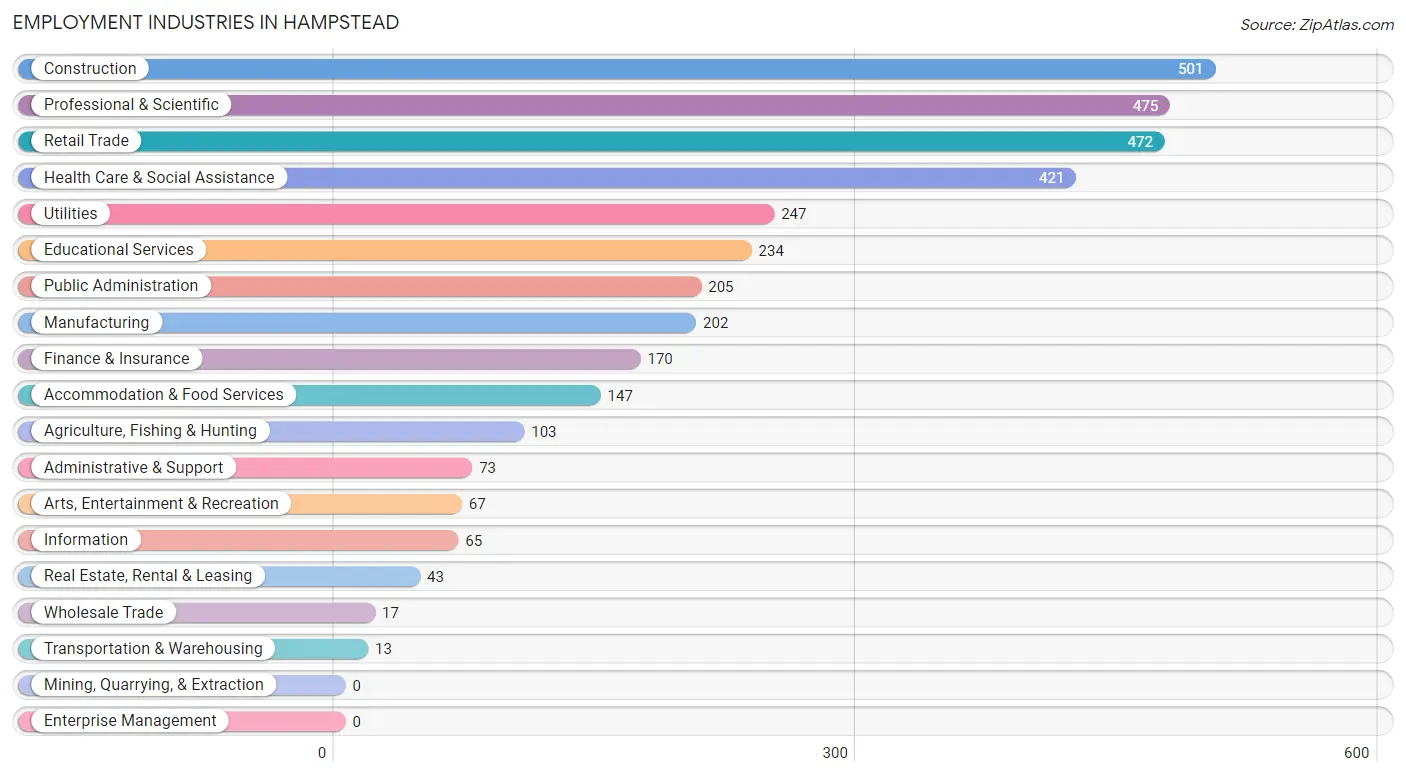
Employment Industries in Hampstead
The major employment industries in Hampstead include Construction (501 | 13.1%), Professional & Scientific (475 | 12.5%), Retail Trade (472 | 12.4%), Health Care & Social Assistance (421 | 11.0%), and Utilities (247 | 6.5%).
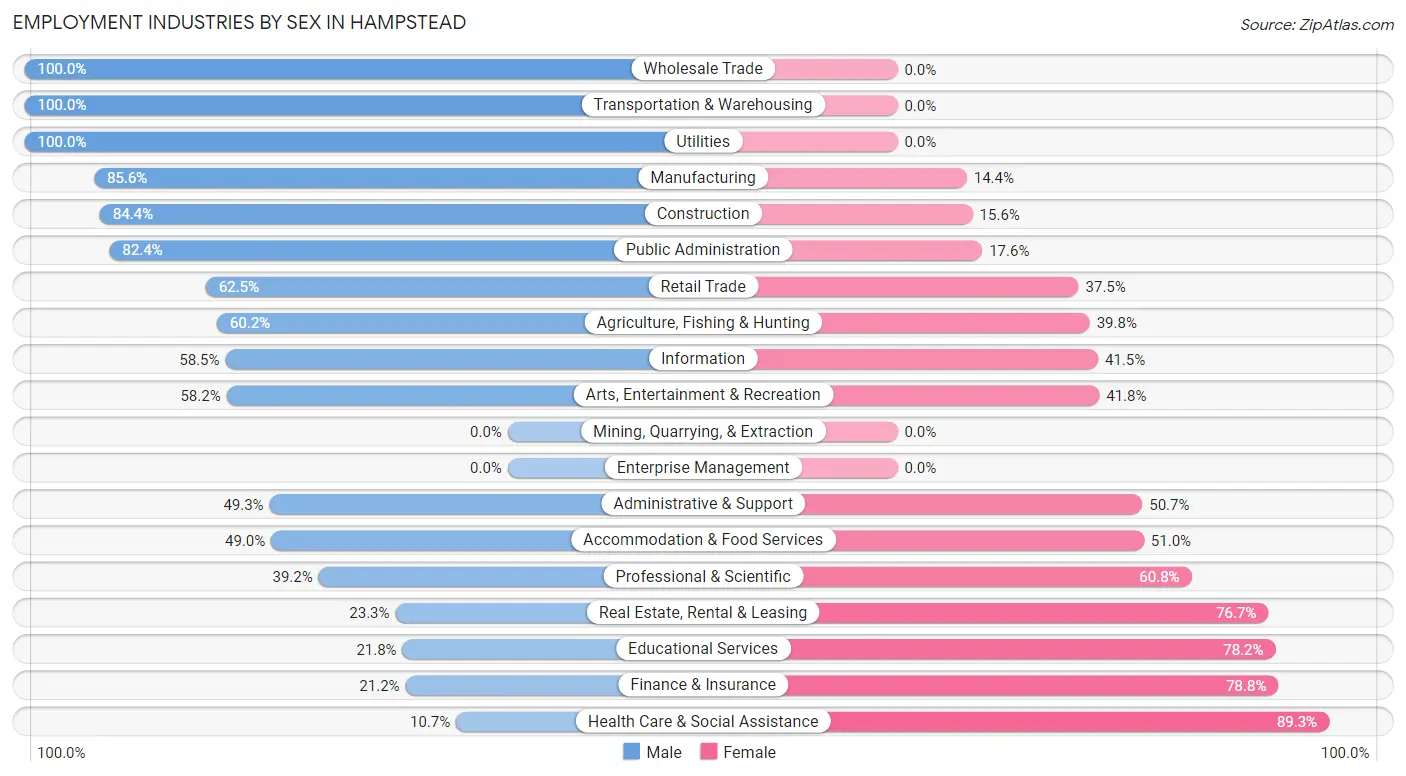
Employment Industries by Sex in Hampstead
The Hampstead industries that see more men than women are Wholesale Trade (100.0%), Transportation & Warehousing (100.0%), and Utilities (100.0%), whereas the industries that tend to have a higher number of women are Health Care & Social Assistance (89.3%), Finance & Insurance (78.8%), and Educational Services (78.2%).
| Industry | Male | Female |
| Agriculture, Fishing & Hunting | 62 (60.2%) | 41 (39.8%) |
| Mining, Quarrying, & Extraction | 0 (0.0%) | 0 (0.0%) |
| Construction | 423 (84.4%) | 78 (15.6%) |
| Manufacturing | 173 (85.6%) | 29 (14.4%) |
| Wholesale Trade | 17 (100.0%) | 0 (0.0%) |
| Retail Trade | 295 (62.5%) | 177 (37.5%) |
| Transportation & Warehousing | 13 (100.0%) | 0 (0.0%) |
| Utilities | 247 (100.0%) | 0 (0.0%) |
| Information | 38 (58.5%) | 27 (41.5%) |
| Finance & Insurance | 36 (21.2%) | 134 (78.8%) |
| Real Estate, Rental & Leasing | 10 (23.3%) | 33 (76.7%) |
| Professional & Scientific | 186 (39.2%) | 289 (60.8%) |
| Enterprise Management | 0 (0.0%) | 0 (0.0%) |
| Administrative & Support | 36 (49.3%) | 37 (50.7%) |
| Educational Services | 51 (21.8%) | 183 (78.2%) |
| Health Care & Social Assistance | 45 (10.7%) | 376 (89.3%) |
| Arts, Entertainment & Recreation | 39 (58.2%) | 28 (41.8%) |
| Accommodation & Food Services | 72 (49.0%) | 75 (51.0%) |
| Public Administration | 169 (82.4%) | 36 (17.6%) |
| Total | 2,183 (57.3%) | 1,629 (42.7%) |
Education in Hampstead
School Enrollment in Hampstead
The most common levels of schooling among the 2,237 students in Hampstead are middle school (783 | 35.0%), elementary school (555 | 24.8%), and high school (456 | 20.4%).
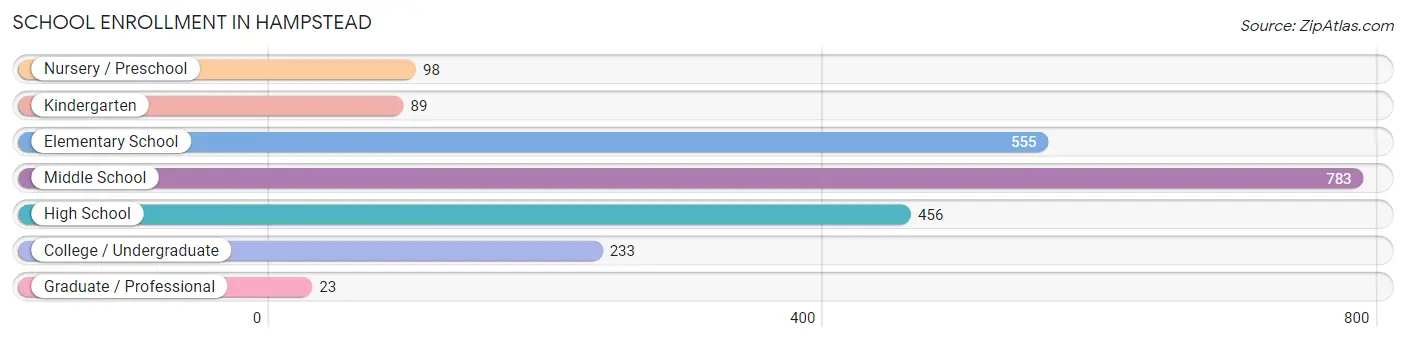
| School Level | # Students | % Students |
| Nursery / Preschool | 98 | 4.4% |
| Kindergarten | 89 | 4.0% |
| Elementary School | 555 | 24.8% |
| Middle School | 783 | 35.0% |
| High School | 456 | 20.4% |
| College / Undergraduate | 233 | 10.4% |
| Graduate / Professional | 23 | 1.0% |
| Total | 2,237 | 100.0% |
School Enrollment by Age by Funding Source in Hampstead
Out of a total of 2,237 students who are enrolled in schools in Hampstead, 152 (6.8%) attend a private institution, while the remaining 2,085 (93.2%) are enrolled in public schools. The age group of 3 to 4 year olds has the highest likelihood of being enrolled in private schools, with 57 (58.2% in the age bracket) enrolled. Conversely, the age group of 5 to 9 year old has the lowest likelihood of being enrolled in a private school, with 595 (100.0% in the age bracket) attending a public institution.
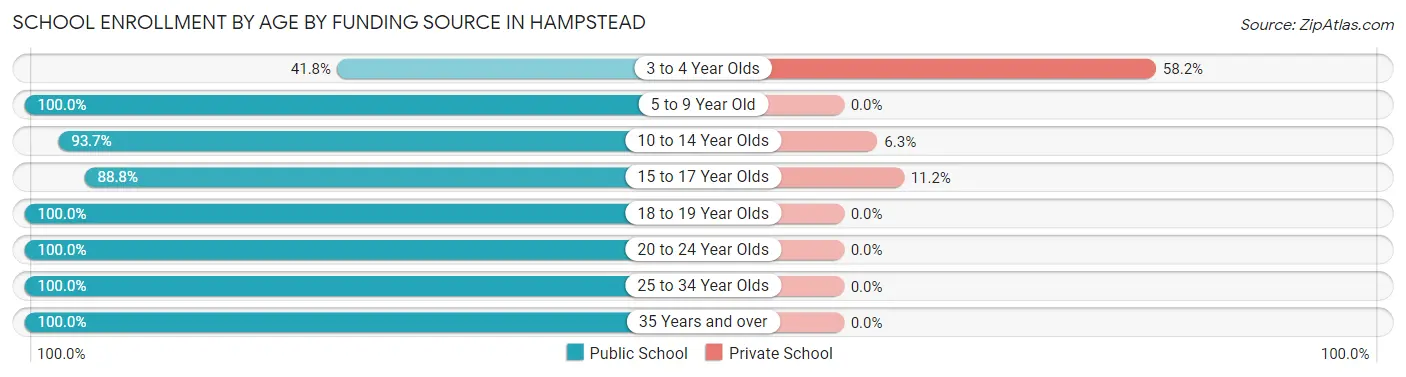
| Age Bracket | Public School | Private School |
| 3 to 4 Year Olds | 41 (41.8%) | 57 (58.2%) |
| 5 to 9 Year Old | 595 (100.0%) | 0 (0.0%) |
| 10 to 14 Year Olds | 850 (93.7%) | 57 (6.3%) |
| 15 to 17 Year Olds | 302 (88.8%) | 38 (11.2%) |
| 18 to 19 Year Olds | 62 (100.0%) | 0 (0.0%) |
| 20 to 24 Year Olds | 110 (100.0%) | 0 (0.0%) |
| 25 to 34 Year Olds | 21 (100.0%) | 0 (0.0%) |
| 35 Years and over | 104 (100.0%) | 0 (0.0%) |
| Total | 2,085 (93.2%) | 152 (6.8%) |
Educational Attainment by Field of Study in Hampstead
Business (343 | 14.1%), engineering (297 | 12.2%), physical & health sciences (290 | 11.9%), science & technology (278 | 11.5%), and bio, nature & agricultural (238 | 9.8%) are the most common fields of study among 2,427 individuals in Hampstead who have obtained a bachelor's degree or higher.
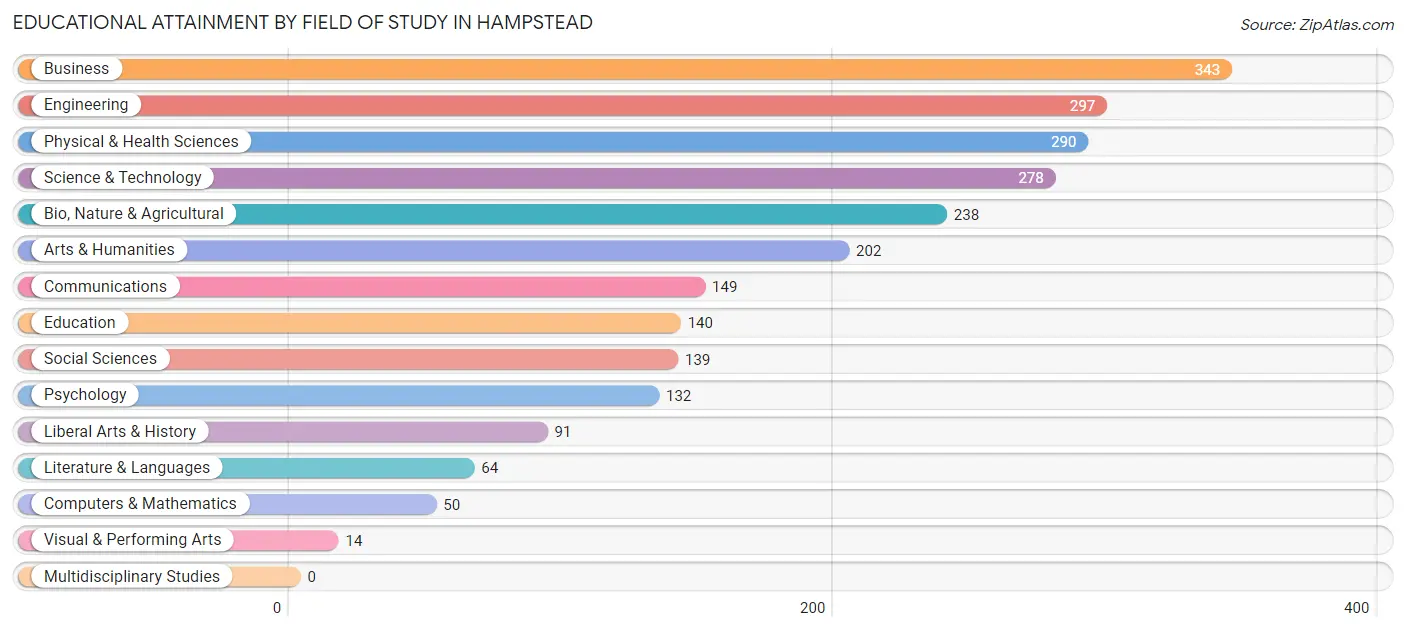
| Field of Study | # Graduates | % Graduates |
| Computers & Mathematics | 50 | 2.1% |
| Bio, Nature & Agricultural | 238 | 9.8% |
| Physical & Health Sciences | 290 | 11.9% |
| Psychology | 132 | 5.4% |
| Social Sciences | 139 | 5.7% |
| Engineering | 297 | 12.2% |
| Multidisciplinary Studies | 0 | 0.0% |
| Science & Technology | 278 | 11.5% |
| Business | 343 | 14.1% |
| Education | 140 | 5.8% |
| Literature & Languages | 64 | 2.6% |
| Liberal Arts & History | 91 | 3.7% |
| Visual & Performing Arts | 14 | 0.6% |
| Communications | 149 | 6.1% |
| Arts & Humanities | 202 | 8.3% |
| Total | 2,427 | 100.0% |
Transportation & Commute in Hampstead
Vehicle Availability by Sex in Hampstead
The most prevalent vehicle ownership categories in Hampstead are males with 2 vehicles (775, accounting for 35.2%) and females with 2 vehicles (709, making up 48.5%).
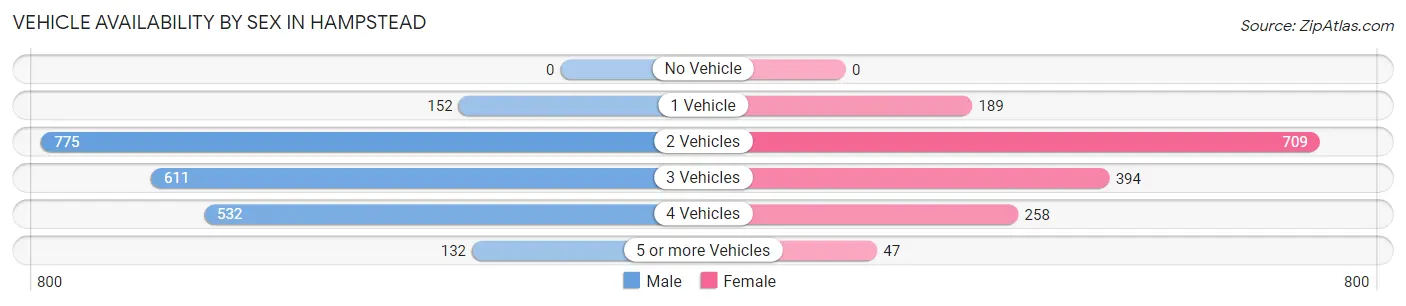
| Vehicles Available | Male | Female |
| No Vehicle | 0 (0.0%) | 0 (0.0%) |
| 1 Vehicle | 152 (6.9%) | 189 (11.8%) |
| 2 Vehicles | 775 (35.2%) | 709 (44.4%) |
| 3 Vehicles | 611 (27.8%) | 394 (24.7%) |
| 4 Vehicles | 532 (24.2%) | 258 (16.2%) |
| 5 or more Vehicles | 132 (6.0%) | 47 (2.9%) |
| Total | 2,202 (100.0%) | 1,597 (100.0%) |
Commute Time in Hampstead
The most frequently occuring commute durations in Hampstead are 30 to 34 minutes (633 commuters, 20.5%), 20 to 24 minutes (533 commuters, 17.2%), and 10 to 14 minutes (312 commuters, 10.1%).
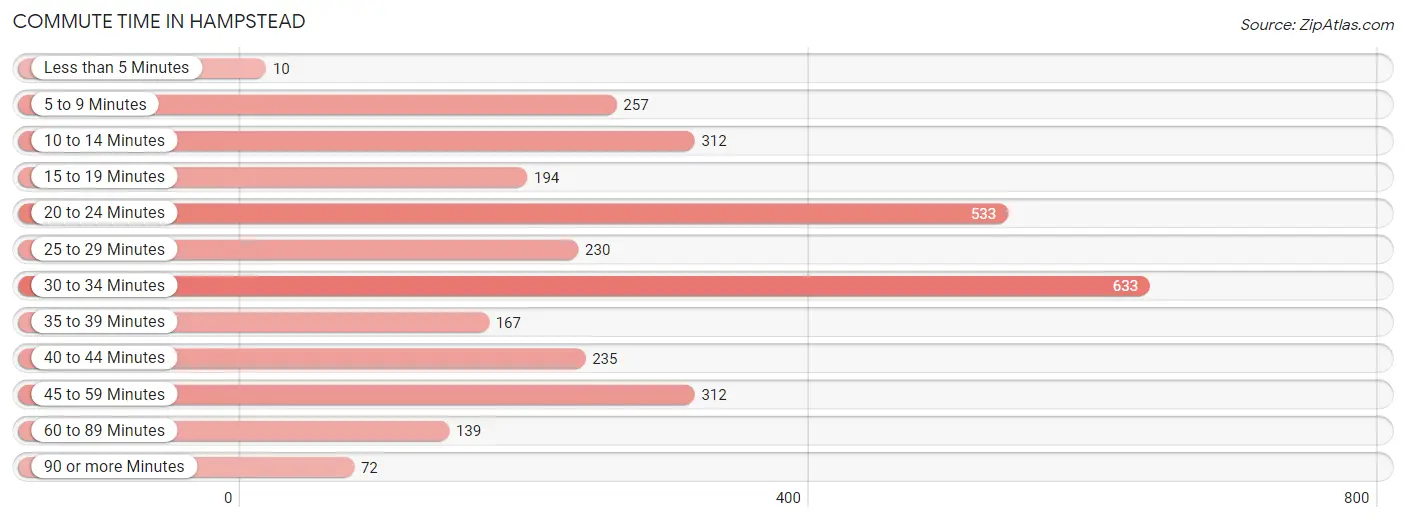
| Commute Time | # Commuters | % Commuters |
| Less than 5 Minutes | 10 | 0.3% |
| 5 to 9 Minutes | 257 | 8.3% |
| 10 to 14 Minutes | 312 | 10.1% |
| 15 to 19 Minutes | 194 | 6.3% |
| 20 to 24 Minutes | 533 | 17.2% |
| 25 to 29 Minutes | 230 | 7.4% |
| 30 to 34 Minutes | 633 | 20.5% |
| 35 to 39 Minutes | 167 | 5.4% |
| 40 to 44 Minutes | 235 | 7.6% |
| 45 to 59 Minutes | 312 | 10.1% |
| 60 to 89 Minutes | 139 | 4.5% |
| 90 or more Minutes | 72 | 2.3% |
Commute Time by Sex in Hampstead
The most common commute times in Hampstead are 20 to 24 minutes (489 commuters, 25.9%) for males and 30 to 34 minutes (317 commuters, 26.2%) for females.
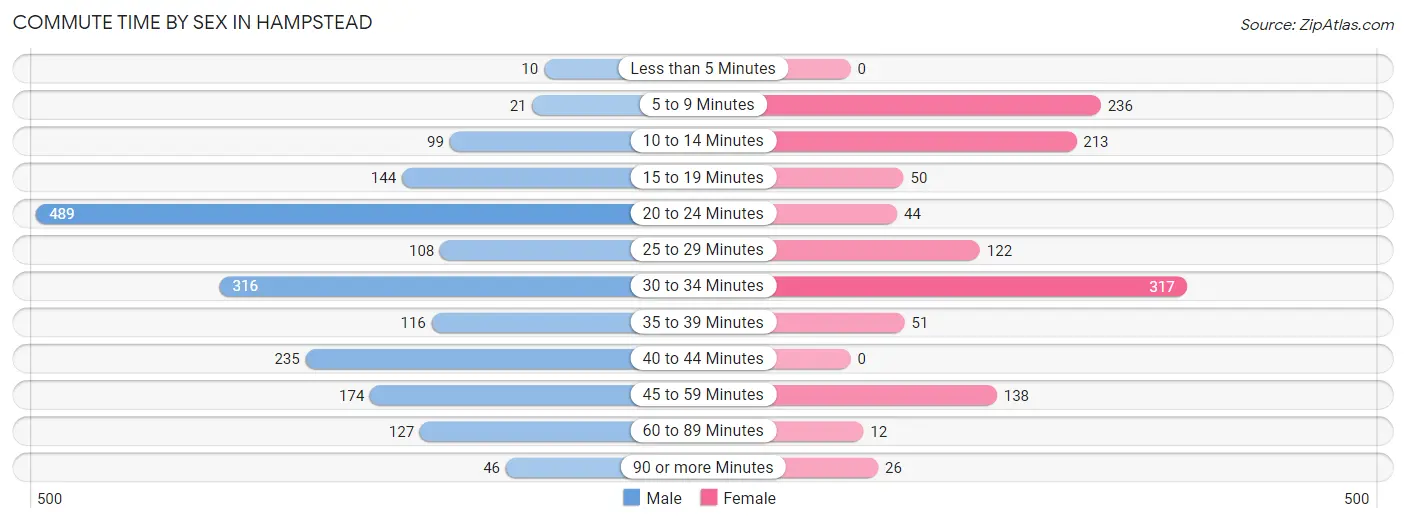
| Commute Time | Male | Female |
| Less than 5 Minutes | 10 (0.5%) | 0 (0.0%) |
| 5 to 9 Minutes | 21 (1.1%) | 236 (19.5%) |
| 10 to 14 Minutes | 99 (5.2%) | 213 (17.6%) |
| 15 to 19 Minutes | 144 (7.6%) | 50 (4.1%) |
| 20 to 24 Minutes | 489 (25.9%) | 44 (3.6%) |
| 25 to 29 Minutes | 108 (5.7%) | 122 (10.1%) |
| 30 to 34 Minutes | 316 (16.8%) | 317 (26.2%) |
| 35 to 39 Minutes | 116 (6.1%) | 51 (4.2%) |
| 40 to 44 Minutes | 235 (12.5%) | 0 (0.0%) |
| 45 to 59 Minutes | 174 (9.2%) | 138 (11.4%) |
| 60 to 89 Minutes | 127 (6.7%) | 12 (1.0%) |
| 90 or more Minutes | 46 (2.4%) | 26 (2.1%) |
Time of Departure to Work by Sex in Hampstead
The most frequent times of departure to work in Hampstead are 6:30 AM to 6:59 AM (407, 21.6%) for males and 8:00 AM to 8:29 AM (288, 23.8%) for females.
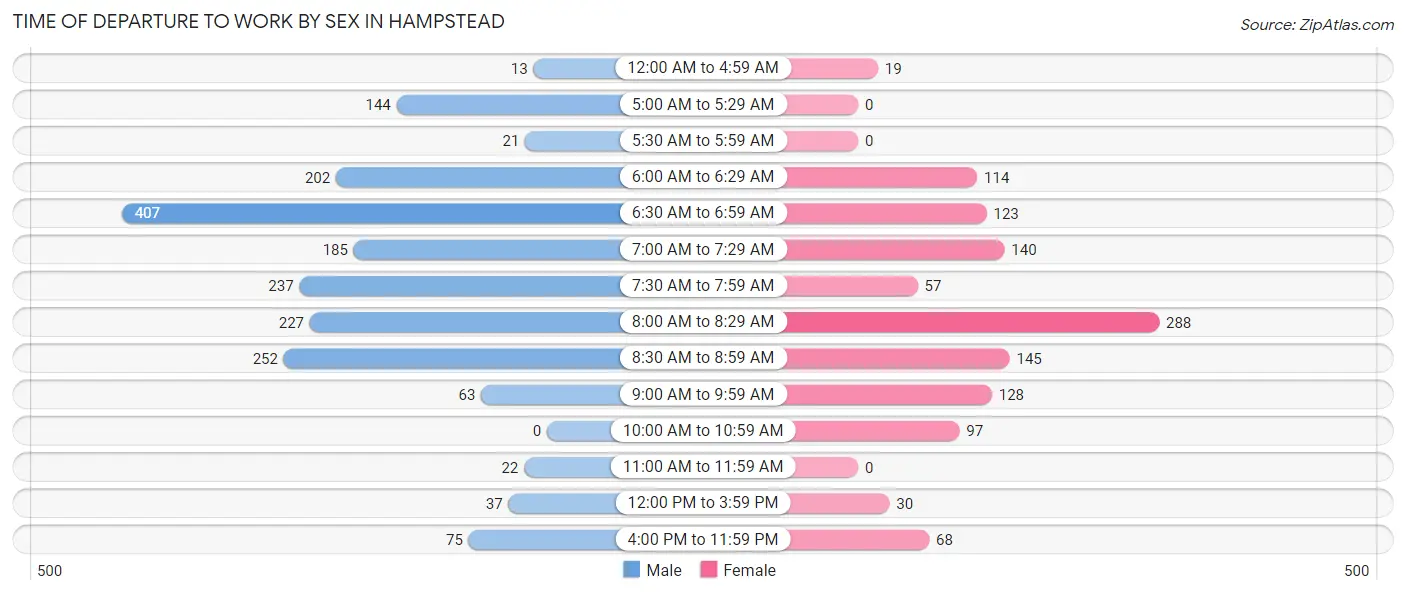
| Time of Departure | Male | Female |
| 12:00 AM to 4:59 AM | 13 (0.7%) | 19 (1.6%) |
| 5:00 AM to 5:29 AM | 144 (7.6%) | 0 (0.0%) |
| 5:30 AM to 5:59 AM | 21 (1.1%) | 0 (0.0%) |
| 6:00 AM to 6:29 AM | 202 (10.7%) | 114 (9.4%) |
| 6:30 AM to 6:59 AM | 407 (21.6%) | 123 (10.2%) |
| 7:00 AM to 7:29 AM | 185 (9.8%) | 140 (11.6%) |
| 7:30 AM to 7:59 AM | 237 (12.6%) | 57 (4.7%) |
| 8:00 AM to 8:29 AM | 227 (12.0%) | 288 (23.8%) |
| 8:30 AM to 8:59 AM | 252 (13.4%) | 145 (12.0%) |
| 9:00 AM to 9:59 AM | 63 (3.3%) | 128 (10.6%) |
| 10:00 AM to 10:59 AM | 0 (0.0%) | 97 (8.0%) |
| 11:00 AM to 11:59 AM | 22 (1.2%) | 0 (0.0%) |
| 12:00 PM to 3:59 PM | 37 (2.0%) | 30 (2.5%) |
| 4:00 PM to 11:59 PM | 75 (4.0%) | 68 (5.6%) |
| Total | 1,885 (100.0%) | 1,209 (100.0%) |
Housing Occupancy in Hampstead
Occupancy by Ownership in Hampstead
Of the total 2,779 dwellings in Hampstead, owner-occupied units account for 2,063 (74.2%), while renter-occupied units make up 716 (25.8%).
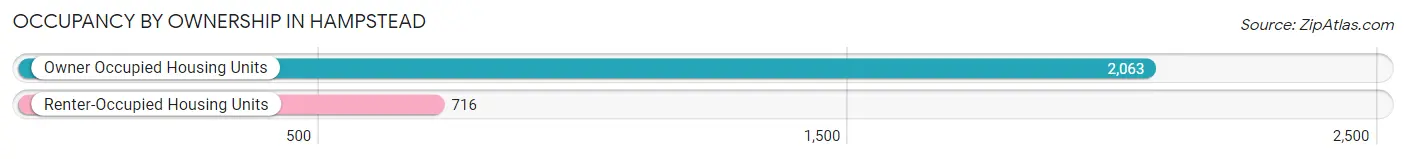
| Occupancy | # Housing Units | % Housing Units |
| Owner Occupied Housing Units | 2,063 | 74.2% |
| Renter-Occupied Housing Units | 716 | 25.8% |
| Total Occupied Housing Units | 2,779 | 100.0% |
Occupancy by Household Size in Hampstead
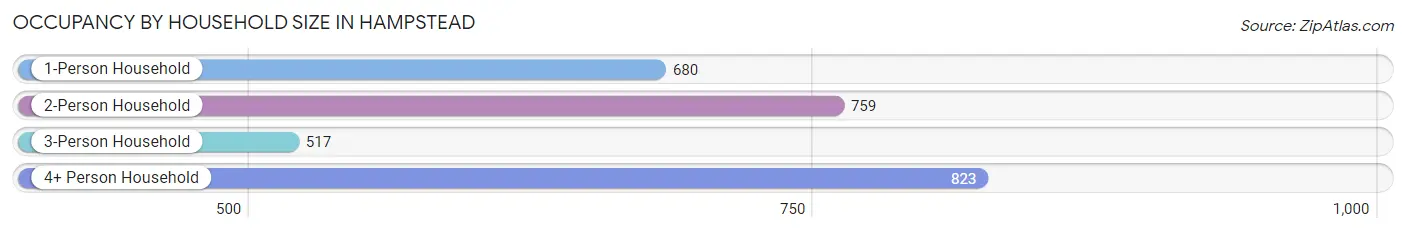
| Household Size | # Housing Units | % Housing Units |
| 1-Person Household | 680 | 24.5% |
| 2-Person Household | 759 | 27.3% |
| 3-Person Household | 517 | 18.6% |
| 4+ Person Household | 823 | 29.6% |
| Total Housing Units | 2,779 | 100.0% |
Occupancy by Ownership by Household Size in Hampstead
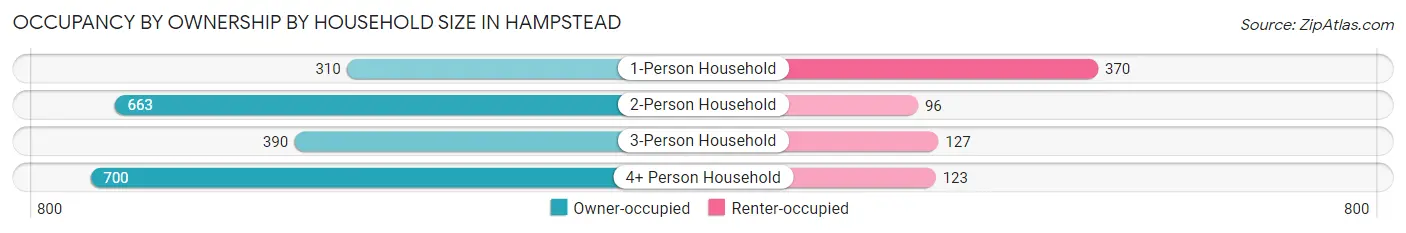
| Household Size | Owner-occupied | Renter-occupied |
| 1-Person Household | 310 (45.6%) | 370 (54.4%) |
| 2-Person Household | 663 (87.4%) | 96 (12.7%) |
| 3-Person Household | 390 (75.4%) | 127 (24.6%) |
| 4+ Person Household | 700 (85.1%) | 123 (14.9%) |
| Total Housing Units | 2,063 (74.2%) | 716 (25.8%) |
Occupancy by Educational Attainment in Hampstead
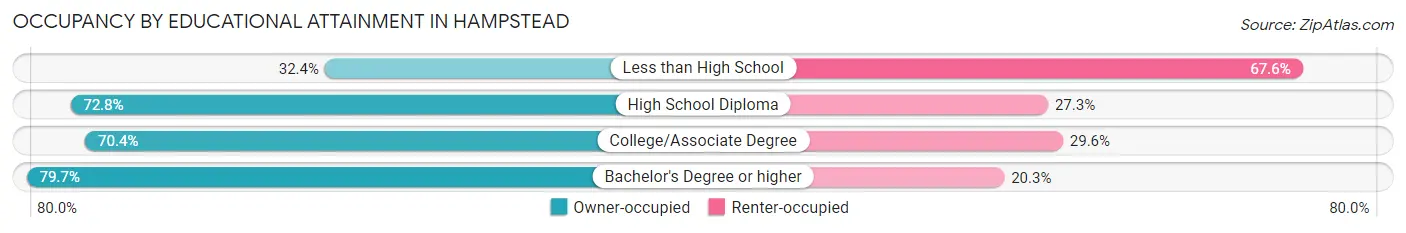
| Household Size | Owner-occupied | Renter-occupied |
| Less than High School | 23 (32.4%) | 48 (67.6%) |
| High School Diploma | 259 (72.8%) | 97 (27.3%) |
| College/Associate Degree | 706 (70.4%) | 297 (29.6%) |
| Bachelor's Degree or higher | 1,075 (79.7%) | 274 (20.3%) |
Occupancy by Age of Householder in Hampstead
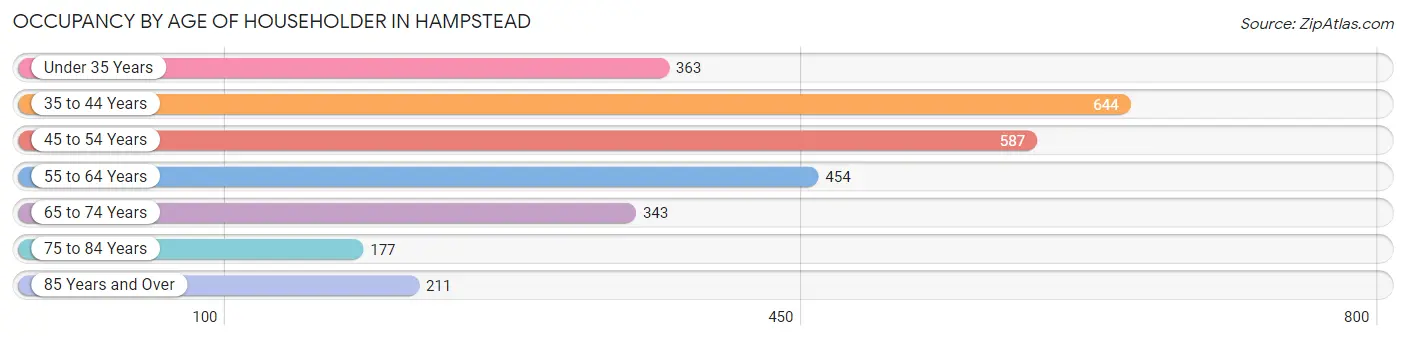
| Age Bracket | # Households | % Households |
| Under 35 Years | 363 | 13.1% |
| 35 to 44 Years | 644 | 23.2% |
| 45 to 54 Years | 587 | 21.1% |
| 55 to 64 Years | 454 | 16.3% |
| 65 to 74 Years | 343 | 12.3% |
| 75 to 84 Years | 177 | 6.4% |
| 85 Years and Over | 211 | 7.6% |
| Total | 2,779 | 100.0% |
Housing Finances in Hampstead
Median Income by Occupancy in Hampstead
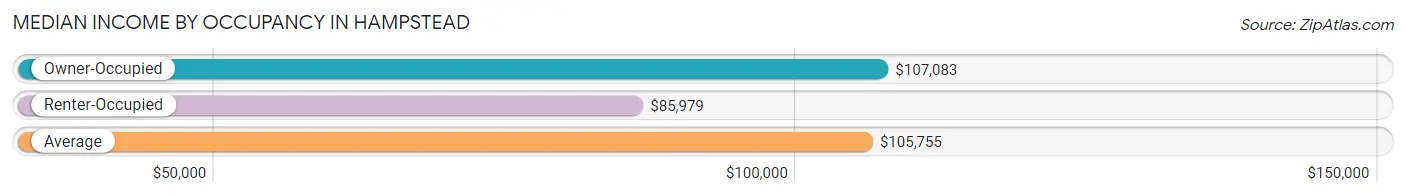
| Occupancy Type | # Households | Median Income |
| Owner-Occupied | 2,063 (74.2%) | $107,083 |
| Renter-Occupied | 716 (25.8%) | $85,979 |
| Average | 2,779 (100.0%) | $105,755 |
Occupancy by Householder Income Bracket in Hampstead
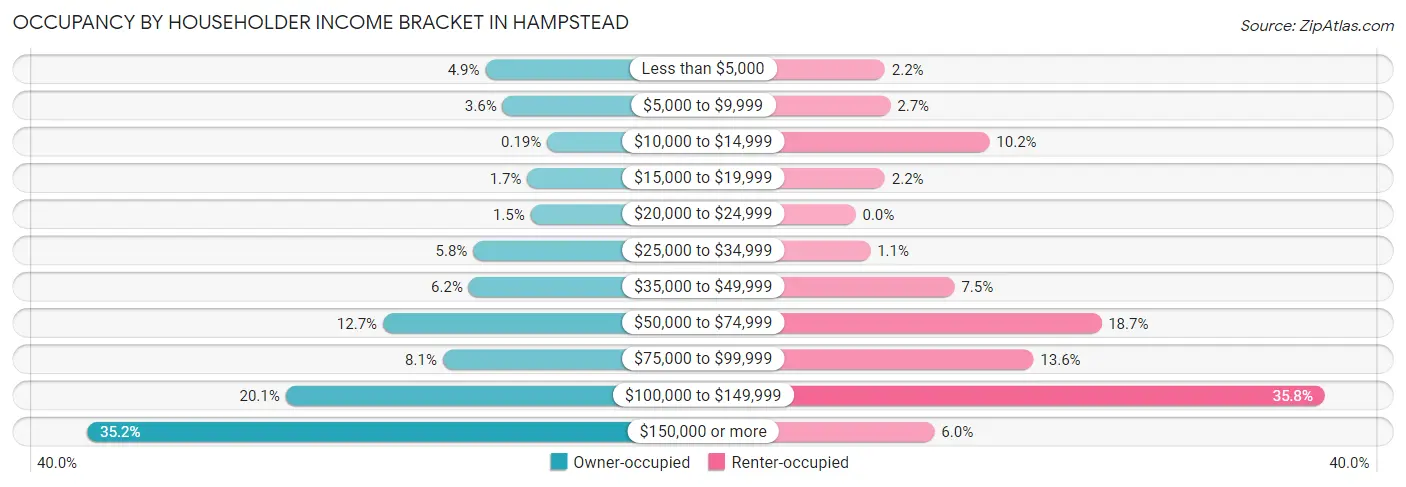
| Income Bracket | Owner-occupied | Renter-occupied |
| Less than $5,000 | 101 (4.9%) | 16 (2.2%) |
| $5,000 to $9,999 | 74 (3.6%) | 19 (2.6%) |
| $10,000 to $14,999 | 4 (0.2%) | 73 (10.2%) |
| $15,000 to $19,999 | 35 (1.7%) | 16 (2.2%) |
| $20,000 to $24,999 | 30 (1.5%) | 0 (0.0%) |
| $25,000 to $34,999 | 120 (5.8%) | 8 (1.1%) |
| $35,000 to $49,999 | 127 (6.2%) | 54 (7.5%) |
| $50,000 to $74,999 | 262 (12.7%) | 134 (18.7%) |
| $75,000 to $99,999 | 168 (8.1%) | 97 (13.6%) |
| $100,000 to $149,999 | 415 (20.1%) | 256 (35.7%) |
| $150,000 or more | 727 (35.2%) | 43 (6.0%) |
| Total | 2,063 (100.0%) | 716 (100.0%) |
Monthly Housing Cost Tiers in Hampstead
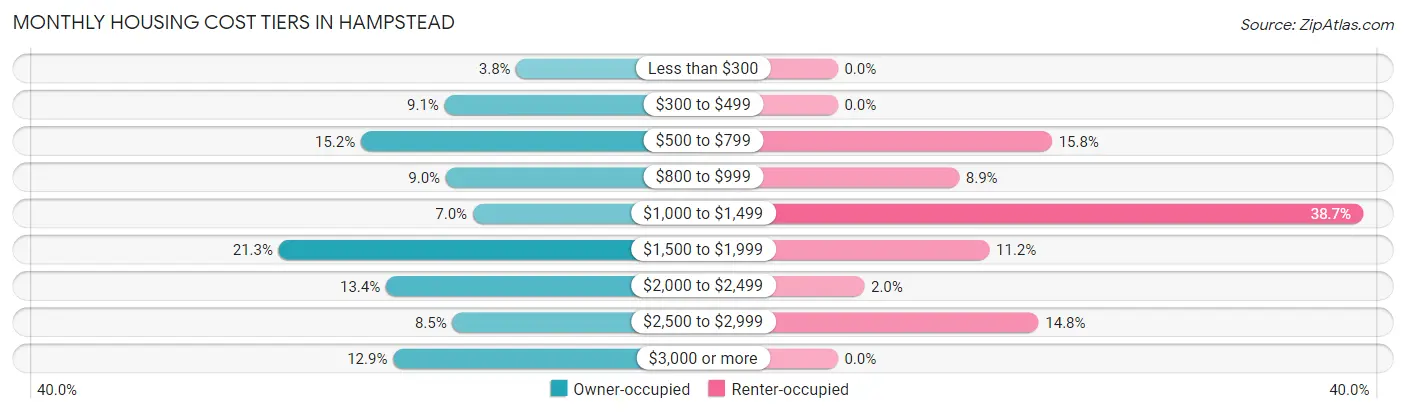
| Monthly Cost | Owner-occupied | Renter-occupied |
| Less than $300 | 78 (3.8%) | 0 (0.0%) |
| $300 to $499 | 187 (9.1%) | 0 (0.0%) |
| $500 to $799 | 314 (15.2%) | 113 (15.8%) |
| $800 to $999 | 185 (9.0%) | 64 (8.9%) |
| $1,000 to $1,499 | 144 (7.0%) | 277 (38.7%) |
| $1,500 to $1,999 | 439 (21.3%) | 80 (11.2%) |
| $2,000 to $2,499 | 276 (13.4%) | 14 (2.0%) |
| $2,500 to $2,999 | 175 (8.5%) | 106 (14.8%) |
| $3,000 or more | 265 (12.9%) | 0 (0.0%) |
| Total | 2,063 (100.0%) | 716 (100.0%) |
Physical Housing Characteristics in Hampstead
Housing Structures in Hampstead
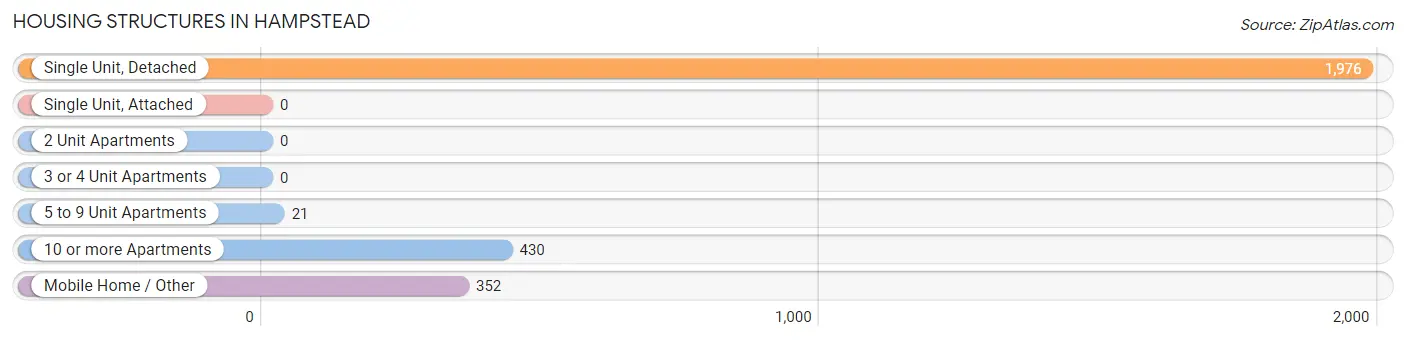
| Structure Type | # Housing Units | % Housing Units |
| Single Unit, Detached | 1,976 | 71.1% |
| Single Unit, Attached | 0 | 0.0% |
| 2 Unit Apartments | 0 | 0.0% |
| 3 or 4 Unit Apartments | 0 | 0.0% |
| 5 to 9 Unit Apartments | 21 | 0.8% |
| 10 or more Apartments | 430 | 15.5% |
| Mobile Home / Other | 352 | 12.7% |
| Total | 2,779 | 100.0% |
Housing Structures by Occupancy in Hampstead
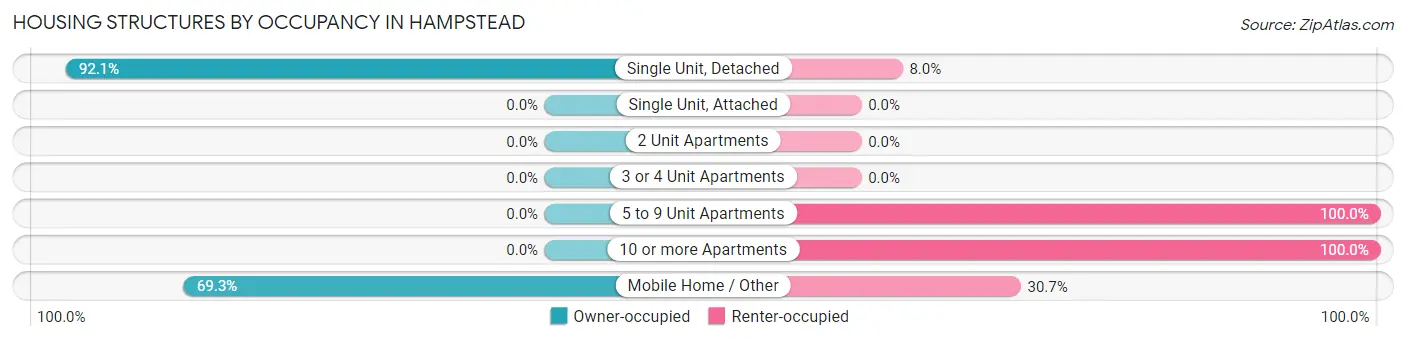
| Structure Type | Owner-occupied | Renter-occupied |
| Single Unit, Detached | 1,819 (92.0%) | 157 (8.0%) |
| Single Unit, Attached | 0 (0.0%) | 0 (0.0%) |
| 2 Unit Apartments | 0 (0.0%) | 0 (0.0%) |
| 3 or 4 Unit Apartments | 0 (0.0%) | 0 (0.0%) |
| 5 to 9 Unit Apartments | 0 (0.0%) | 21 (100.0%) |
| 10 or more Apartments | 0 (0.0%) | 430 (100.0%) |
| Mobile Home / Other | 244 (69.3%) | 108 (30.7%) |
| Total | 2,063 (74.2%) | 716 (25.8%) |
Housing Structures by Number of Rooms in Hampstead
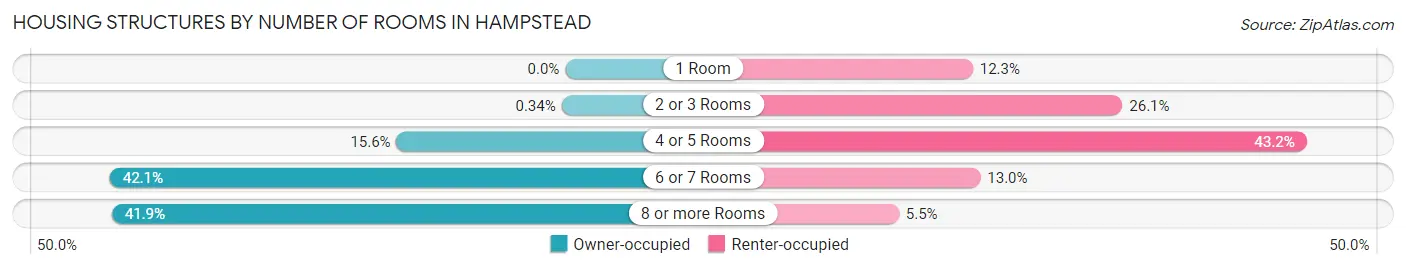
| Number of Rooms | Owner-occupied | Renter-occupied |
| 1 Room | 0 (0.0%) | 88 (12.3%) |
| 2 or 3 Rooms | 7 (0.3%) | 187 (26.1%) |
| 4 or 5 Rooms | 322 (15.6%) | 309 (43.2%) |
| 6 or 7 Rooms | 869 (42.1%) | 93 (13.0%) |
| 8 or more Rooms | 865 (41.9%) | 39 (5.4%) |
| Total | 2,063 (100.0%) | 716 (100.0%) |
Housing Structure by Heating Type in Hampstead
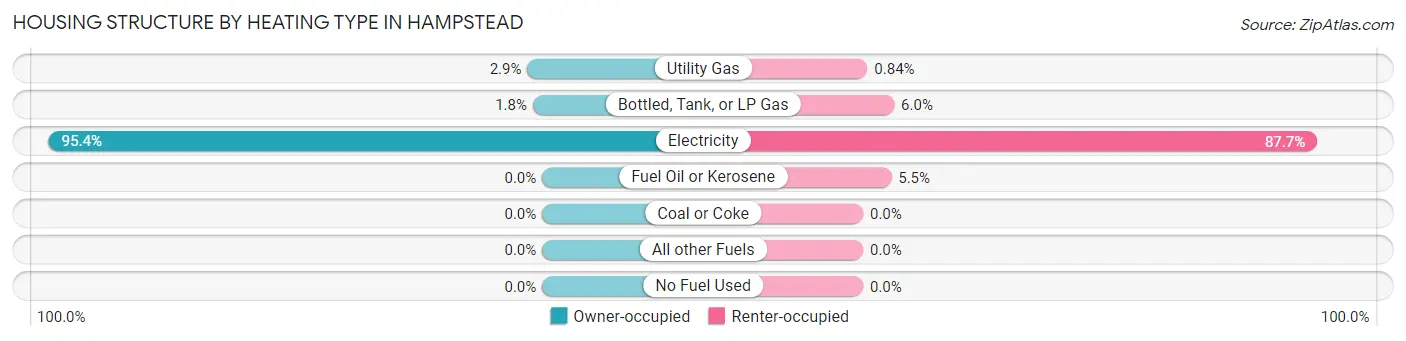
| Heating Type | Owner-occupied | Renter-occupied |
| Utility Gas | 59 (2.9%) | 6 (0.8%) |
| Bottled, Tank, or LP Gas | 37 (1.8%) | 43 (6.0%) |
| Electricity | 1,967 (95.4%) | 628 (87.7%) |
| Fuel Oil or Kerosene | 0 (0.0%) | 39 (5.4%) |
| Coal or Coke | 0 (0.0%) | 0 (0.0%) |
| All other Fuels | 0 (0.0%) | 0 (0.0%) |
| No Fuel Used | 0 (0.0%) | 0 (0.0%) |
| Total | 2,063 (100.0%) | 716 (100.0%) |
Household Vehicle Usage in Hampstead
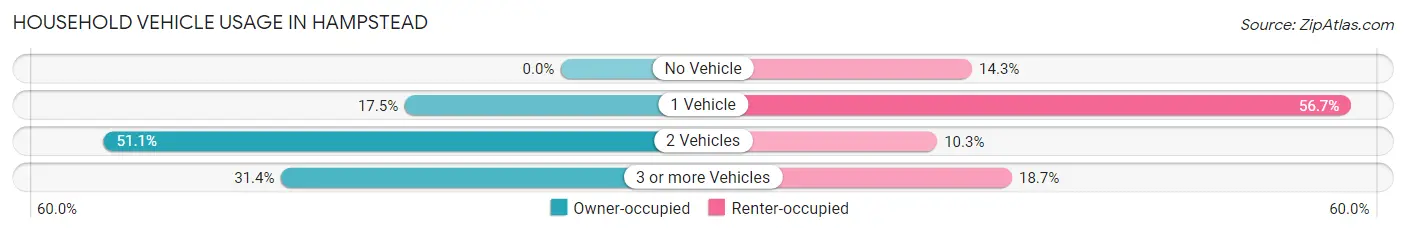
| Vehicles per Household | Owner-occupied | Renter-occupied |
| No Vehicle | 0 (0.0%) | 102 (14.2%) |
| 1 Vehicle | 361 (17.5%) | 406 (56.7%) |
| 2 Vehicles | 1,055 (51.1%) | 74 (10.3%) |
| 3 or more Vehicles | 647 (31.4%) | 134 (18.7%) |
| Total | 2,063 (100.0%) | 716 (100.0%) |
Real Estate & Mortgages in Hampstead
Real Estate and Mortgage Overview in Hampstead
| Characteristic | Without Mortgage | With Mortgage |
| Housing Units | 774 | 1,289 |
| Median Property Value | $288,900 | $408,000 |
| Median Household Income | $59,100 | $586 |
| Monthly Housing Costs | $596 | $265 |
| Real Estate Taxes | $2,146 | $0 |
Property Value by Mortgage Status in Hampstead
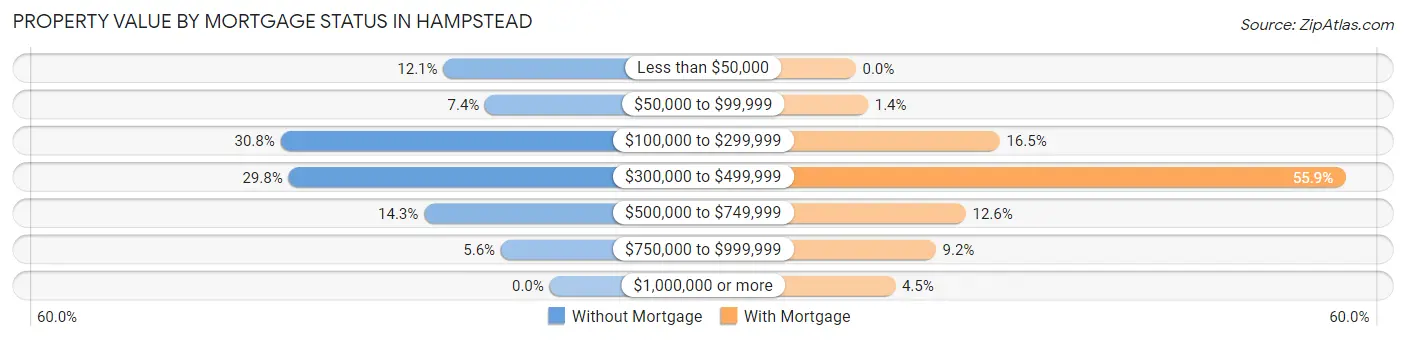
| Property Value | Without Mortgage | With Mortgage |
| Less than $50,000 | 94 (12.1%) | 0 (0.0%) |
| $50,000 to $99,999 | 57 (7.4%) | 18 (1.4%) |
| $100,000 to $299,999 | 238 (30.7%) | 212 (16.5%) |
| $300,000 to $499,999 | 231 (29.8%) | 721 (55.9%) |
| $500,000 to $749,999 | 111 (14.3%) | 162 (12.6%) |
| $750,000 to $999,999 | 43 (5.6%) | 118 (9.1%) |
| $1,000,000 or more | 0 (0.0%) | 58 (4.5%) |
| Total | 774 (100.0%) | 1,289 (100.0%) |
Household Income by Mortgage Status in Hampstead
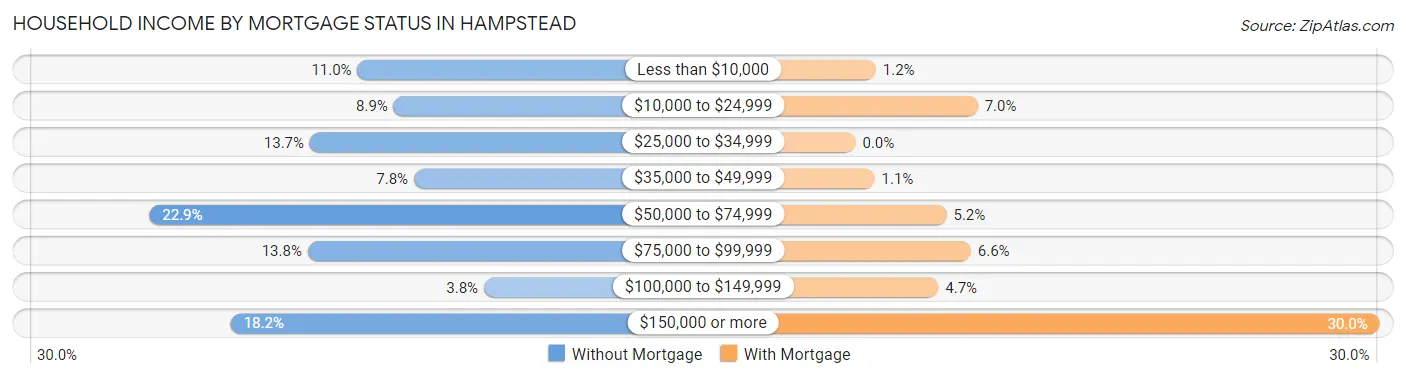
| Household Income | Without Mortgage | With Mortgage |
| Less than $10,000 | 85 (11.0%) | 15 (1.2%) |
| $10,000 to $24,999 | 69 (8.9%) | 90 (7.0%) |
| $25,000 to $34,999 | 106 (13.7%) | 0 (0.0%) |
| $35,000 to $49,999 | 60 (7.7%) | 14 (1.1%) |
| $50,000 to $74,999 | 177 (22.9%) | 67 (5.2%) |
| $75,000 to $99,999 | 107 (13.8%) | 85 (6.6%) |
| $100,000 to $149,999 | 29 (3.7%) | 61 (4.7%) |
| $150,000 or more | 141 (18.2%) | 386 (29.9%) |
| Total | 774 (100.0%) | 1,289 (100.0%) |
Property Value to Household Income Ratio in Hampstead
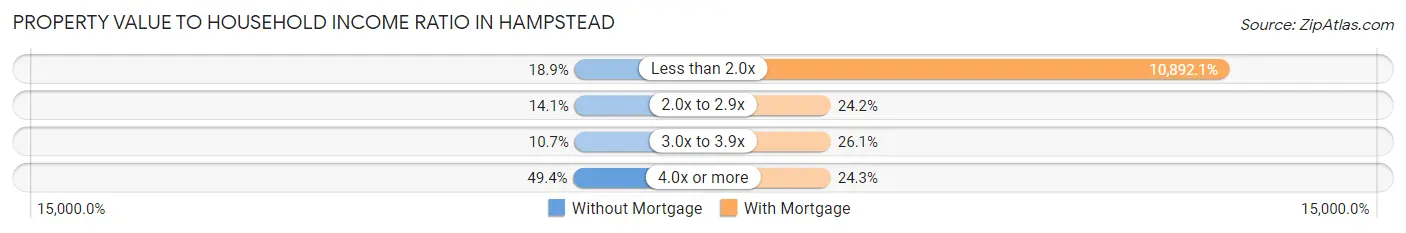
| Value-to-Income Ratio | Without Mortgage | With Mortgage |
| Less than 2.0x | 146 (18.9%) | 140,399 (10,892.1%) |
| 2.0x to 2.9x | 109 (14.1%) | 312 (24.2%) |
| 3.0x to 3.9x | 83 (10.7%) | 336 (26.1%) |
| 4.0x or more | 382 (49.3%) | 313 (24.3%) |
| Total | 774 (100.0%) | 1,289 (100.0%) |
Real Estate Taxes by Mortgage Status in Hampstead
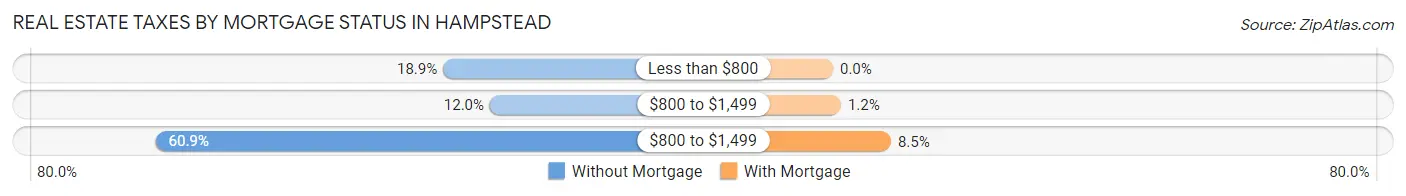
| Property Taxes | Without Mortgage | With Mortgage |
| Less than $800 | 146 (18.9%) | 0 (0.0%) |
| $800 to $1,499 | 93 (12.0%) | 15 (1.2%) |
| $800 to $1,499 | 471 (60.9%) | 109 (8.5%) |
| Total | 774 (100.0%) | 1,289 (100.0%) |
Health & Disability in Hampstead
Health Insurance Coverage by Age in Hampstead
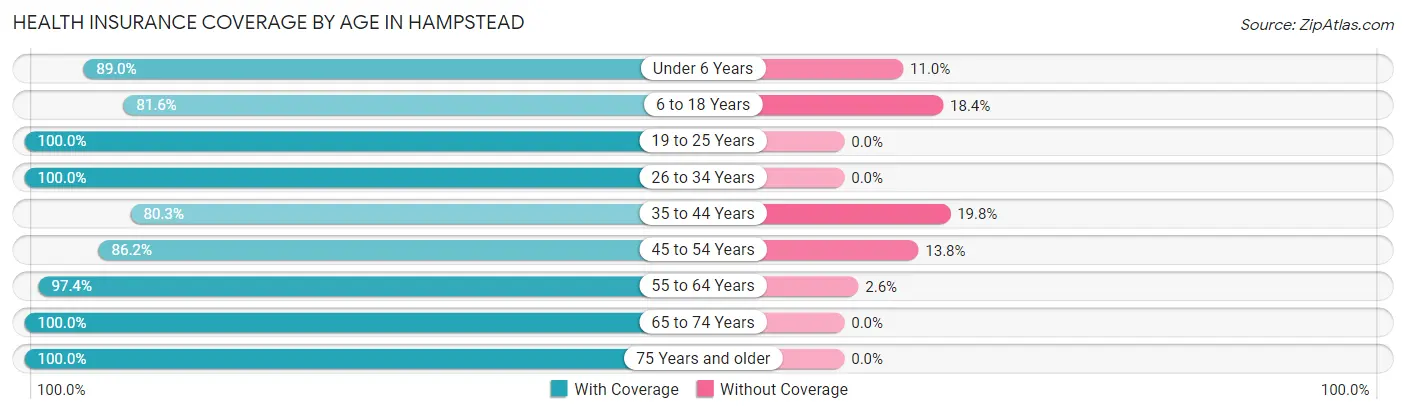
| Age Bracket | With Coverage | Without Coverage |
| Under 6 Years | 503 (89.0%) | 62 (11.0%) |
| 6 to 18 Years | 1,553 (81.6%) | 351 (18.4%) |
| 19 to 25 Years | 541 (100.0%) | 0 (0.0%) |
| 26 to 34 Years | 815 (100.0%) | 0 (0.0%) |
| 35 to 44 Years | 1,020 (80.2%) | 251 (19.8%) |
| 45 to 54 Years | 999 (86.2%) | 160 (13.8%) |
| 55 to 64 Years | 854 (97.4%) | 23 (2.6%) |
| 65 to 74 Years | 555 (100.0%) | 0 (0.0%) |
| 75 Years and older | 634 (100.0%) | 0 (0.0%) |
| Total | 7,474 (89.8%) | 847 (10.2%) |
Health Insurance Coverage by Citizenship Status in Hampstead
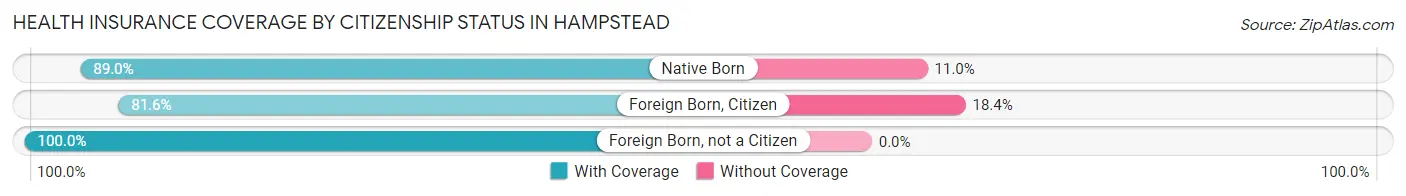
| Citizenship Status | With Coverage | Without Coverage |
| Native Born | 503 (89.0%) | 62 (11.0%) |
| Foreign Born, Citizen | 1,553 (81.6%) | 351 (18.4%) |
| Foreign Born, not a Citizen | 541 (100.0%) | 0 (0.0%) |
Health Insurance Coverage by Household Income in Hampstead
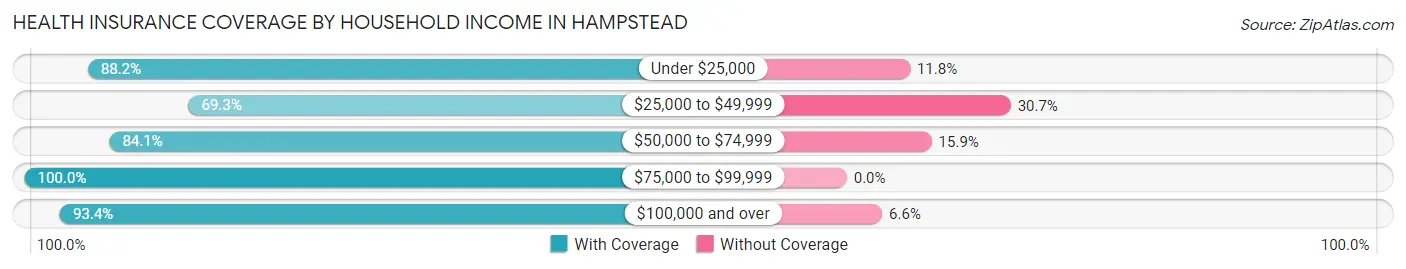
| Household Income | With Coverage | Without Coverage |
| Under $25,000 | 648 (88.2%) | 87 (11.8%) |
| $25,000 to $49,999 | 564 (69.3%) | 250 (30.7%) |
| $50,000 to $74,999 | 841 (84.1%) | 159 (15.9%) |
| $75,000 to $99,999 | 510 (100.0%) | 0 (0.0%) |
| $100,000 and over | 4,911 (93.4%) | 349 (6.6%) |
Public vs Private Health Insurance Coverage by Age in Hampstead
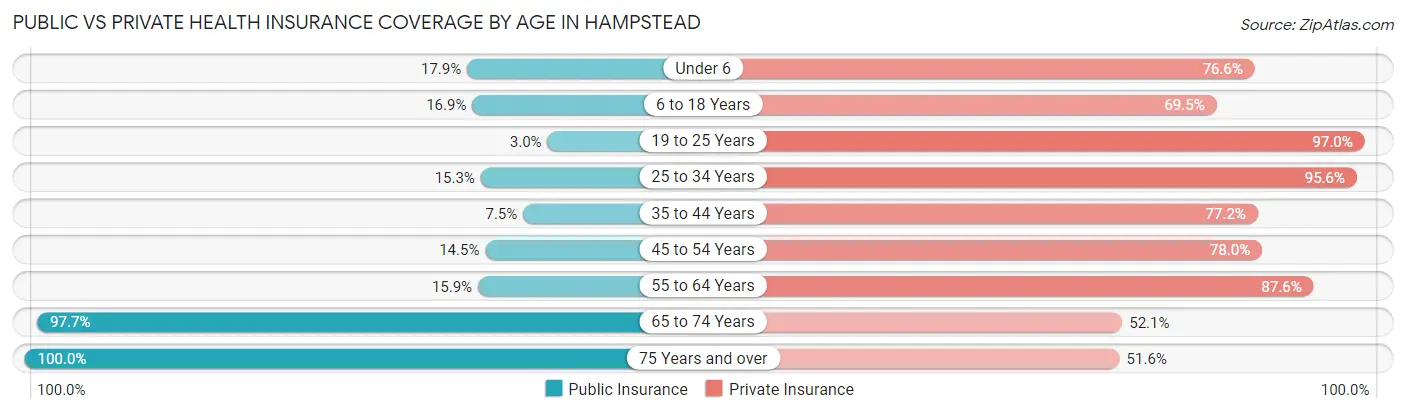
| Age Bracket | Public Insurance | Private Insurance |
| Under 6 | 101 (17.9%) | 433 (76.6%) |
| 6 to 18 Years | 322 (16.9%) | 1,324 (69.5%) |
| 19 to 25 Years | 16 (3.0%) | 525 (97.0%) |
| 25 to 34 Years | 125 (15.3%) | 779 (95.6%) |
| 35 to 44 Years | 95 (7.5%) | 981 (77.2%) |
| 45 to 54 Years | 168 (14.5%) | 904 (78.0%) |
| 55 to 64 Years | 139 (15.9%) | 768 (87.6%) |
| 65 to 74 Years | 542 (97.7%) | 289 (52.1%) |
| 75 Years and over | 634 (100.0%) | 327 (51.6%) |
| Total | 2,142 (25.7%) | 6,330 (76.1%) |
Disability Status by Sex by Age in Hampstead
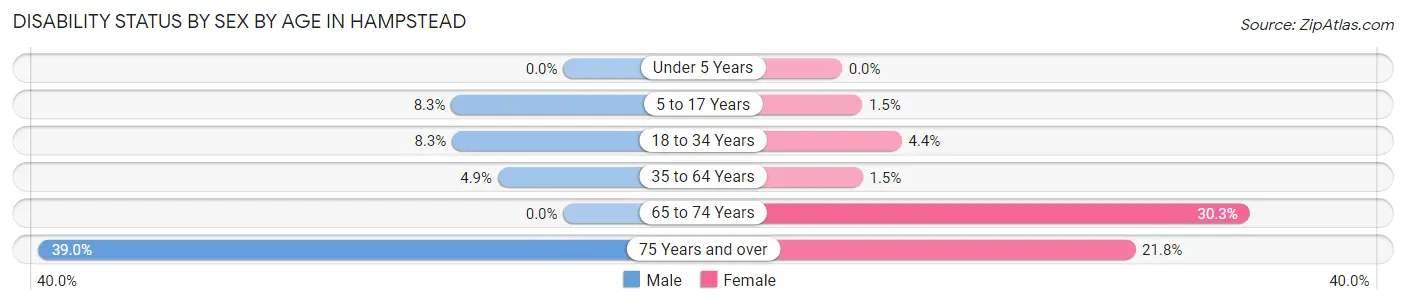
| Age Bracket | Male | Female |
| Under 5 Years | 0 (0.0%) | 0 (0.0%) |
| 5 to 17 Years | 80 (8.3%) | 14 (1.5%) |
| 18 to 34 Years | 64 (8.3%) | 30 (4.4%) |
| 35 to 64 Years | 91 (4.9%) | 22 (1.5%) |
| 65 to 74 Years | 0 (0.0%) | 102 (30.3%) |
| 75 Years and over | 111 (39.0%) | 76 (21.8%) |
Disability Class by Sex by Age in Hampstead
Disability Class: Hearing Difficulty
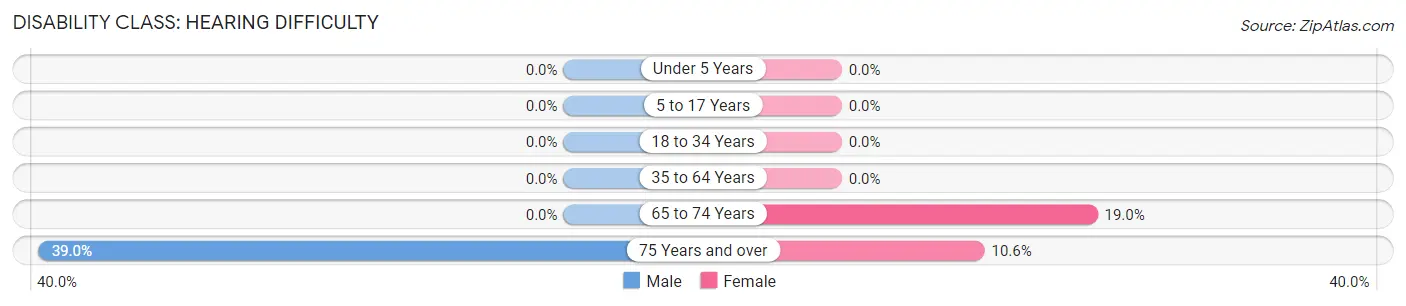
| Age Bracket | Male | Female |
| Under 5 Years | 0 (0.0%) | 0 (0.0%) |
| 5 to 17 Years | 0 (0.0%) | 0 (0.0%) |
| 18 to 34 Years | 0 (0.0%) | 0 (0.0%) |
| 35 to 64 Years | 0 (0.0%) | 0 (0.0%) |
| 65 to 74 Years | 0 (0.0%) | 64 (19.0%) |
| 75 Years and over | 111 (39.0%) | 37 (10.6%) |
Disability Class: Vision Difficulty
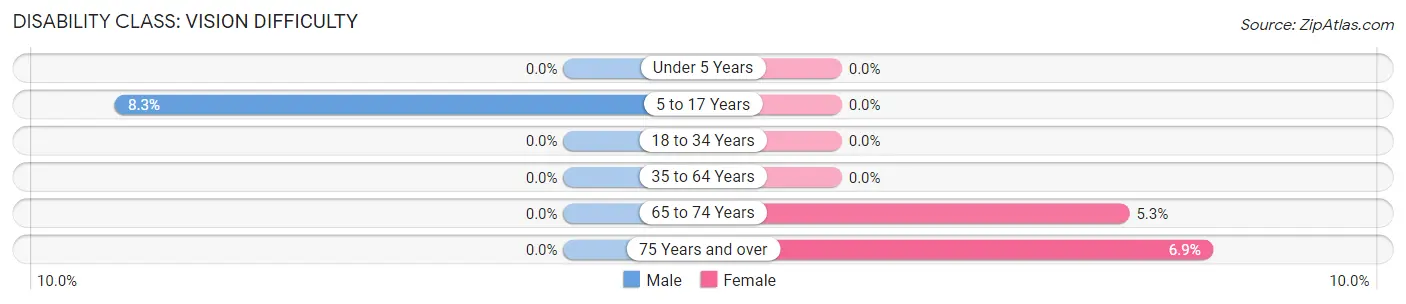
| Age Bracket | Male | Female |
| Under 5 Years | 0 (0.0%) | 0 (0.0%) |
| 5 to 17 Years | 80 (8.3%) | 0 (0.0%) |
| 18 to 34 Years | 0 (0.0%) | 0 (0.0%) |
| 35 to 64 Years | 0 (0.0%) | 0 (0.0%) |
| 65 to 74 Years | 0 (0.0%) | 18 (5.3%) |
| 75 Years and over | 0 (0.0%) | 24 (6.9%) |
Disability Class: Cognitive Difficulty
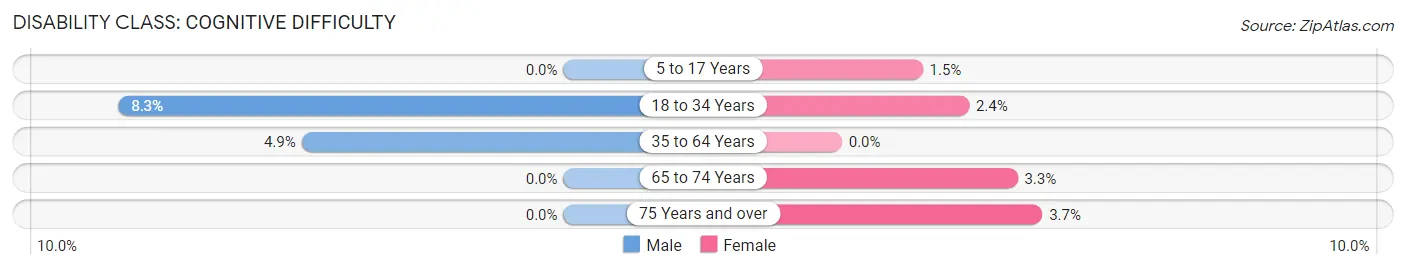
| Age Bracket | Male | Female |
| 5 to 17 Years | 0 (0.0%) | 14 (1.5%) |
| 18 to 34 Years | 64 (8.3%) | 16 (2.4%) |
| 35 to 64 Years | 91 (4.9%) | 0 (0.0%) |
| 65 to 74 Years | 0 (0.0%) | 11 (3.3%) |
| 75 Years and over | 0 (0.0%) | 13 (3.7%) |
Disability Class: Ambulatory Difficulty
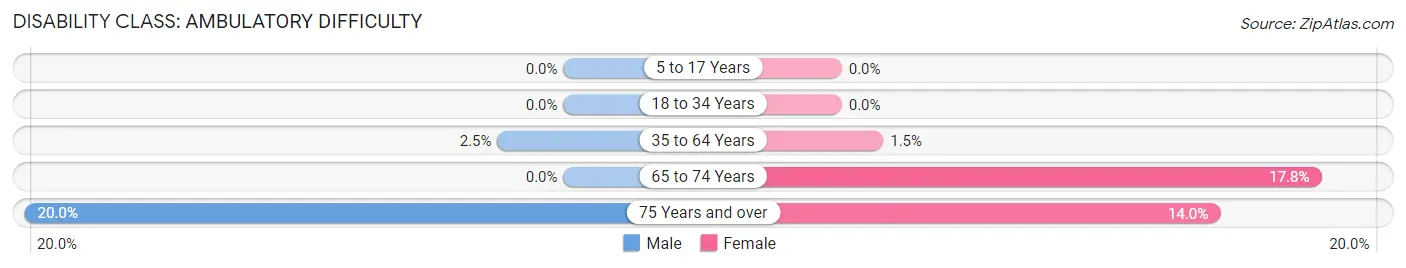
| Age Bracket | Male | Female |
| 5 to 17 Years | 0 (0.0%) | 0 (0.0%) |
| 18 to 34 Years | 0 (0.0%) | 0 (0.0%) |
| 35 to 64 Years | 46 (2.5%) | 22 (1.5%) |
| 65 to 74 Years | 0 (0.0%) | 60 (17.8%) |
| 75 Years and over | 57 (20.0%) | 49 (14.0%) |
Disability Class: Self-Care Difficulty
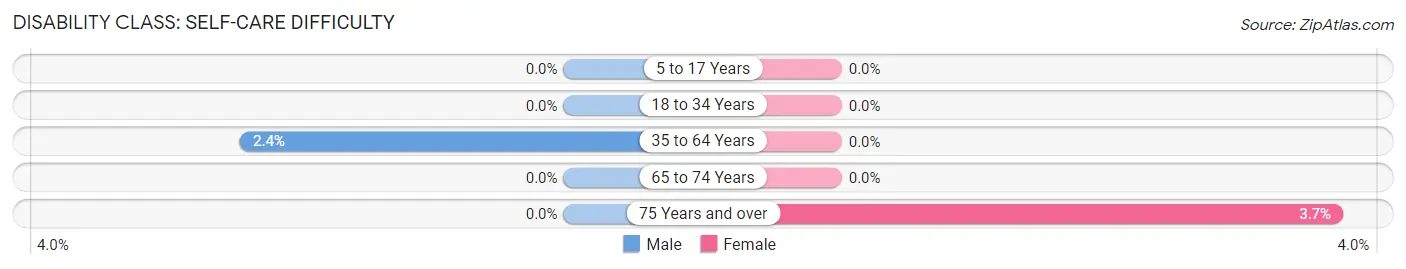
| Age Bracket | Male | Female |
| 5 to 17 Years | 0 (0.0%) | 0 (0.0%) |
| 18 to 34 Years | 0 (0.0%) | 0 (0.0%) |
| 35 to 64 Years | 45 (2.4%) | 0 (0.0%) |
| 65 to 74 Years | 0 (0.0%) | 0 (0.0%) |
| 75 Years and over | 0 (0.0%) | 13 (3.7%) |
Technology Access in Hampstead
Computing Device Access in Hampstead
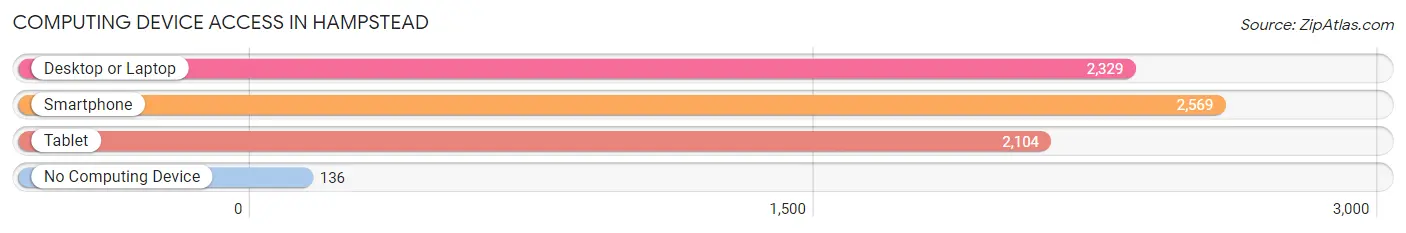
| Device Type | # Households | % Households |
| Desktop or Laptop | 2,329 | 83.8% |
| Smartphone | 2,569 | 92.4% |
| Tablet | 2,104 | 75.7% |
| No Computing Device | 136 | 4.9% |
| Total | 2,779 | 100.0% |
Internet Access in Hampstead
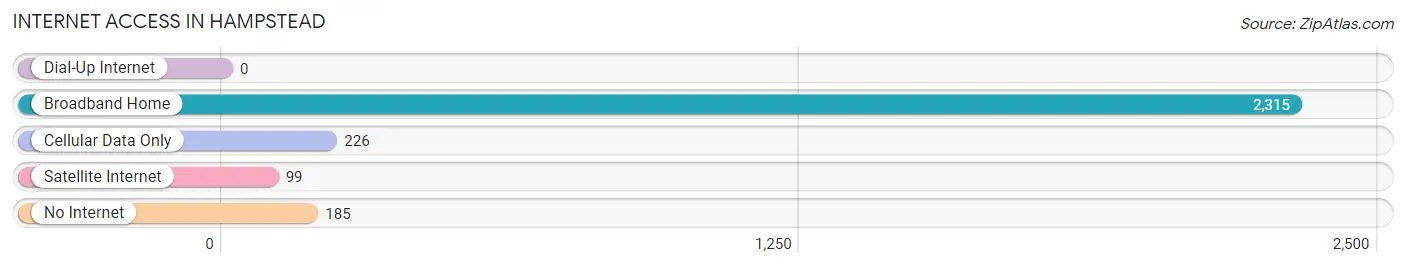
| Internet Type | # Households | % Households |
| Dial-Up Internet | 0 | 0.0% |
| Broadband Home | 2,315 | 83.3% |
| Cellular Data Only | 226 | 8.1% |
| Satellite Internet | 99 | 3.6% |
| No Internet | 185 | 6.7% |
| Total | 2,779 | 100.0% |
Hampstead Summary
Hampstead is a small town located in Pender County, North Carolina. It is situated on the banks of the Northeast Cape Fear River, approximately 25 miles north of Wilmington. The town has a population of approximately 4,000 people and is part of the Wilmington Metropolitan Statistical Area.
Geography
Hampstead is located in the southeastern corner of Pender County, North Carolina. It is situated on the banks of the Northeast Cape Fear River, approximately 25 miles north of Wilmington. The town is bordered by the towns of Burgaw to the north, Rocky Point to the east, and Surf City to the south. The town is located in the Coastal Plain region of North Carolina, and is characterized by flat terrain and sandy soils. The town is located in the USDA Plant Hardiness Zone 8a, which has an average annual minimum temperature of 10-15 degrees Fahrenheit.
Economy
Hampstead’s economy is largely based on agriculture and tourism. The town is home to several farms, which produce a variety of crops, including corn, soybeans, wheat, and hay. The town is also home to several seafood processing plants, which process and package seafood for local and regional markets. In addition, the town is home to several small businesses, including restaurants, retail stores, and service providers.
Demographics
As of the 2010 census, the population of Hampstead was 4,079. The racial makeup of the town was 91.3% White, 4.2% African American, 0.7% Native American, 0.7% Asian, 0.1% Pacific Islander, 1.2% from other races, and 1.8% from two or more races. Hispanic or Latino of any race were 3.3% of the population.
The median income for a household in the town was $45,938, and the median income for a family was $51,938. The per capita income for the town was $20,938. About 8.3% of families and 10.2% of the population were below the poverty line, including 14.2% of those under age 18 and 8.2% of those age 65 or over.
Education
Hampstead is served by the Pender County Schools system. The town is home to two public schools: Hampstead Elementary School and Topsail High School. The town is also home to several private schools, including St. Mary’s Catholic School and Hampstead Academy.
Conclusion
Hampstead is a small town located in Pender County, North Carolina. It is situated on the banks of the Northeast Cape Fear River, approximately 25 miles north of Wilmington. The town has a population of approximately 4,000 people and is part of the Wilmington Metropolitan Statistical Area. The town’s economy is largely based on agriculture and tourism, and the town is served by the Pender County Schools system. The town is home to several farms, seafood processing plants, small businesses, and private schools.
Common Questions
What is Per Capita Income in Hampstead?
Per Capita income in Hampstead is $45,099.
What is the Median Family Income in Hampstead?
Median Family Income in Hampstead is $117,083.
What is the Median Household income in Hampstead?
Median Household Income in Hampstead is $105,755.
What is Income or Wage Gap in Hampstead?
Income or Wage Gap in Hampstead is 44.8%.
Women in Hampstead earn 55.2 cents for every dollar earned by a man.
What is Family Income Deficit in Hampstead?
Family Income Deficit in Hampstead is $13,654.
Families that are below poverty line in Hampstead earn $13,654 less on average than the poverty threshold level.
What is Inequality or Gini Index in Hampstead?
Inequality or Gini Index in Hampstead is 0.47.
What is the Total Population of Hampstead?
Total Population of Hampstead is 8,340.
What is the Total Male Population of Hampstead?
Total Male Population of Hampstead is 4,432.
What is the Total Female Population of Hampstead?
Total Female Population of Hampstead is 3,908.
What is the Ratio of Males per 100 Females in Hampstead?
There are 113.41 Males per 100 Females in Hampstead.
What is the Ratio of Females per 100 Males in Hampstead?
There are 88.18 Females per 100 Males in Hampstead.
What is the Median Population Age in Hampstead?
Median Population Age in Hampstead is 37.5 Years.
What is the Average Family Size in Hampstead
Average Family Size in Hampstead is 3.6 People.
What is the Average Household Size in Hampstead
Average Household Size in Hampstead is 3.0 People.
How Large is the Labor Force in Hampstead?
There are 4,091 People in the Labor Forcein in Hampstead.
What is the Percentage of People in the Labor Force in Hampstead?
66.3% of People are in the Labor Force in Hampstead.
What is the Unemployment Rate in Hampstead?
Unemployment Rate in Hampstead is 6.4%.