Black Mountain, NC Map & Demographics
Black Mountain Map
Black Mountain Overview
$42,791
PER CAPITA INCOME
$93,526
AVG FAMILY INCOME
$75,310
AVG HOUSEHOLD INCOME
15.9%
WAGE / INCOME GAP [ % ]
84.1¢/ $1
WAGE / INCOME GAP [ $ ]
0.45
INEQUALITY / GINI INDEX
8,430
TOTAL POPULATION
3,521
MALE POPULATION
4,909
FEMALE POPULATION
71.73
MALES / 100 FEMALES
139.42
FEMALES / 100 MALES
60.4
MEDIAN AGE
2.6
AVG FAMILY SIZE
2.1
AVG HOUSEHOLD SIZE
3,329
LABOR FORCE [ PEOPLE ]
45.1%
PERCENT IN LABOR FORCE
1.1%
UNEMPLOYMENT RATE
Black Mountain Zip Codes
Black Mountain Area Codes
Income in Black Mountain
Income Overview in Black Mountain
Per Capita Income in Black Mountain is $42,791, while median incomes of families and households are $93,526 and $75,310 respectively.
| Characteristic | Number | Measure |
| Per Capita Income | 8,430 | $42,791 |
| Median Family Income | 2,144 | $93,526 |
| Mean Family Income | 2,144 | $115,009 |
| Median Household Income | 3,867 | $75,310 |
| Mean Household Income | 3,867 | $89,007 |
| Income Deficit | 2,144 | $0 |
| Wage / Income Gap (%) | 8,430 | 15.90% |
| Wage / Income Gap ($) | 8,430 | 84.10¢ per $1 |
| Gini / Inequality Index | 8,430 | 0.45 |
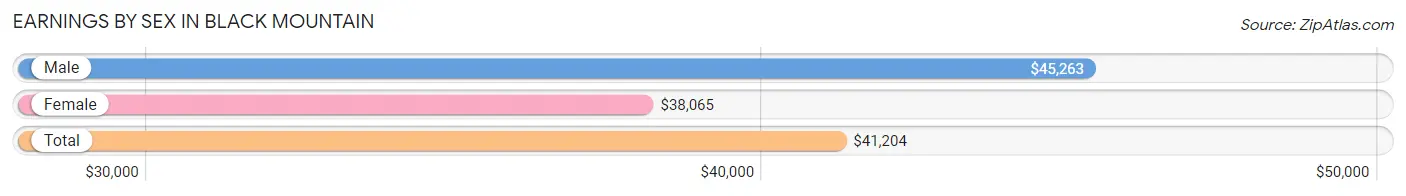
Earnings by Sex in Black Mountain
Average Earnings in Black Mountain are $41,204, $45,263 for men and $38,065 for women, a difference of 15.9%.
| Sex | Number | Average Earnings |
| Male | 1,660 (47.2%) | $45,263 |
| Female | 1,858 (52.8%) | $38,065 |
| Total | 3,518 (100.0%) | $41,204 |
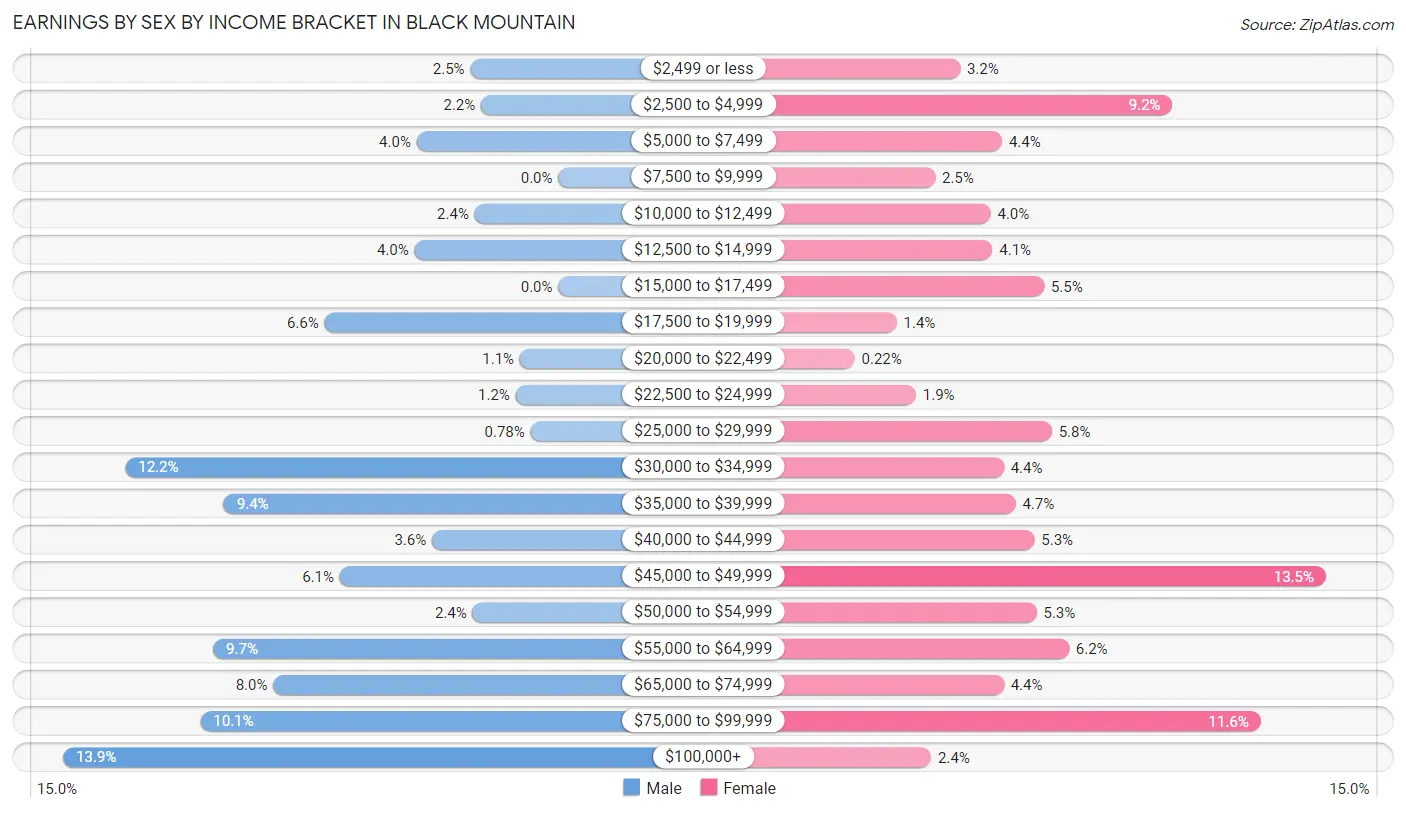
Earnings by Sex by Income Bracket in Black Mountain
The most common earnings brackets in Black Mountain are $100,000+ for men (231 | 13.9%) and $45,000 to $49,999 for women (250 | 13.5%).
| Income | Male | Female |
| $2,499 or less | 41 (2.5%) | 59 (3.2%) |
| $2,500 to $4,999 | 36 (2.2%) | 170 (9.1%) |
| $5,000 to $7,499 | 66 (4.0%) | 81 (4.4%) |
| $7,500 to $9,999 | 0 (0.0%) | 46 (2.5%) |
| $10,000 to $12,499 | 39 (2.4%) | 75 (4.0%) |
| $12,500 to $14,999 | 67 (4.0%) | 76 (4.1%) |
| $15,000 to $17,499 | 0 (0.0%) | 103 (5.5%) |
| $17,500 to $19,999 | 109 (6.6%) | 26 (1.4%) |
| $20,000 to $22,499 | 18 (1.1%) | 4 (0.2%) |
| $22,500 to $24,999 | 20 (1.2%) | 36 (1.9%) |
| $25,000 to $29,999 | 13 (0.8%) | 107 (5.8%) |
| $30,000 to $34,999 | 202 (12.2%) | 82 (4.4%) |
| $35,000 to $39,999 | 156 (9.4%) | 88 (4.7%) |
| $40,000 to $44,999 | 59 (3.5%) | 98 (5.3%) |
| $45,000 to $49,999 | 102 (6.1%) | 250 (13.5%) |
| $50,000 to $54,999 | 40 (2.4%) | 99 (5.3%) |
| $55,000 to $64,999 | 161 (9.7%) | 116 (6.2%) |
| $65,000 to $74,999 | 133 (8.0%) | 82 (4.4%) |
| $75,000 to $99,999 | 167 (10.1%) | 216 (11.6%) |
| $100,000+ | 231 (13.9%) | 44 (2.4%) |
| Total | 1,660 (100.0%) | 1,858 (100.0%) |
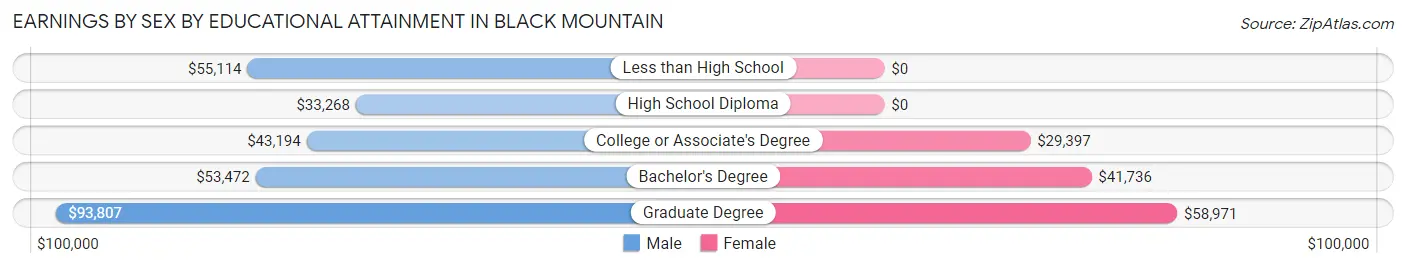
Earnings by Sex by Educational Attainment in Black Mountain
Average earnings in Black Mountain are $46,612 for men and $41,188 for women, a difference of 11.6%. Men with an educational attainment of graduate degree enjoy the highest average annual earnings of $93,807, while those with high school diploma education earn the least with $33,268. Women with an educational attainment of graduate degree earn the most with the average annual earnings of $58,971, while those with college or associate's degree education have the smallest earnings of $29,397.
| Educational Attainment | Male Income | Female Income |
| Less than High School | $55,114 | $0 |
| High School Diploma | $33,268 | $0 |
| College or Associate's Degree | $43,194 | $29,397 |
| Bachelor's Degree | $53,472 | $41,736 |
| Graduate Degree | $93,807 | $58,971 |
| Total | $46,612 | $41,188 |
Family Income in Black Mountain
Family Income Brackets in Black Mountain
According to the Black Mountain family income data, there are 617 families falling into the $100,000 to $149,999 income range, which is the most common income bracket and makes up 28.8% of all families. Conversely, the $15,000 to $24,999 income bracket is the least frequent group with only 9 families (0.4%) belonging to this category.
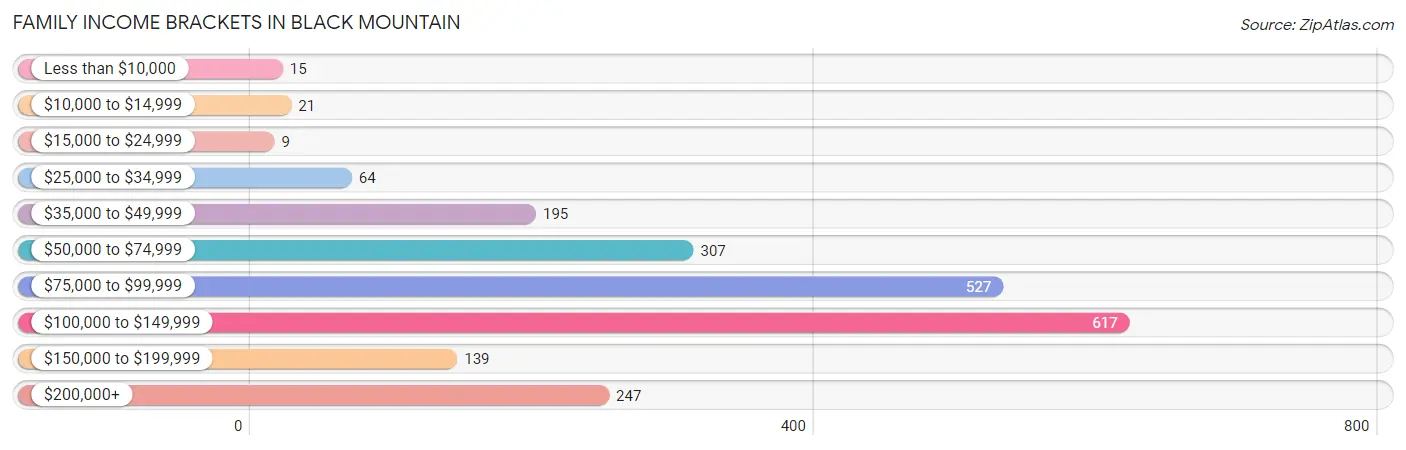
| Income Bracket | # Families | % Families |
| Less than $10,000 | 15 | 0.7% |
| $10,000 to $14,999 | 21 | 1.0% |
| $15,000 to $24,999 | 9 | 0.4% |
| $25,000 to $34,999 | 64 | 3.0% |
| $35,000 to $49,999 | 195 | 9.1% |
| $50,000 to $74,999 | 307 | 14.3% |
| $75,000 to $99,999 | 527 | 24.6% |
| $100,000 to $149,999 | 617 | 28.8% |
| $150,000 to $199,999 | 139 | 6.5% |
| $200,000+ | 247 | 11.5% |
Family Income by Famaliy Size in Black Mountain
4-person families (325 | 15.2%) account for the highest median family income in Black Mountain with $106,250 per family, while 2-person families (1,498 | 69.9%) have the highest median income of $48,660 per family member.
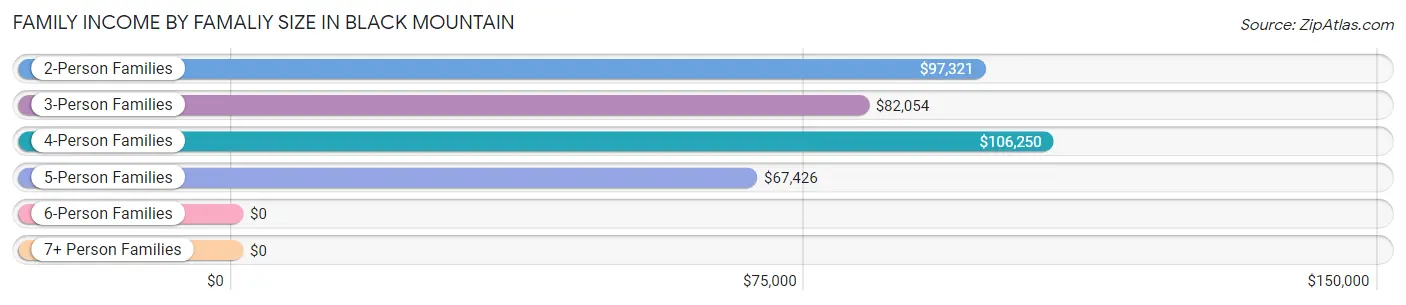
| Income Bracket | # Families | Median Income |
| 2-Person Families | 1,498 (69.9%) | $97,321 |
| 3-Person Families | 288 (13.4%) | $82,054 |
| 4-Person Families | 325 (15.2%) | $106,250 |
| 5-Person Families | 33 (1.5%) | $67,426 |
| 6-Person Families | 0 (0.0%) | $0 |
| 7+ Person Families | 0 (0.0%) | $0 |
| Total | 2,144 (100.0%) | $93,526 |
Family Income by Number of Earners in Black Mountain
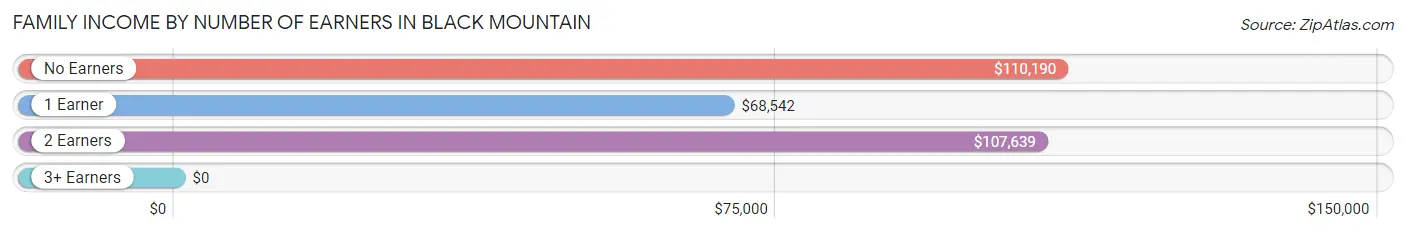
| Number of Earners | # Families | Median Income |
| No Earners | 848 (39.6%) | $110,190 |
| 1 Earner | 420 (19.6%) | $68,542 |
| 2 Earners | 770 (35.9%) | $107,639 |
| 3+ Earners | 106 (4.9%) | $0 |
| Total | 2,144 (100.0%) | $93,526 |
Household Income in Black Mountain
Household Income Brackets in Black Mountain
With 777 households falling in the category, the $75,000 to $99,999 income range is the most frequent in Black Mountain, accounting for 20.1% of all households. In contrast, only 93 households (2.4%) fall into the less than $10,000 income bracket, making it the least populous group.
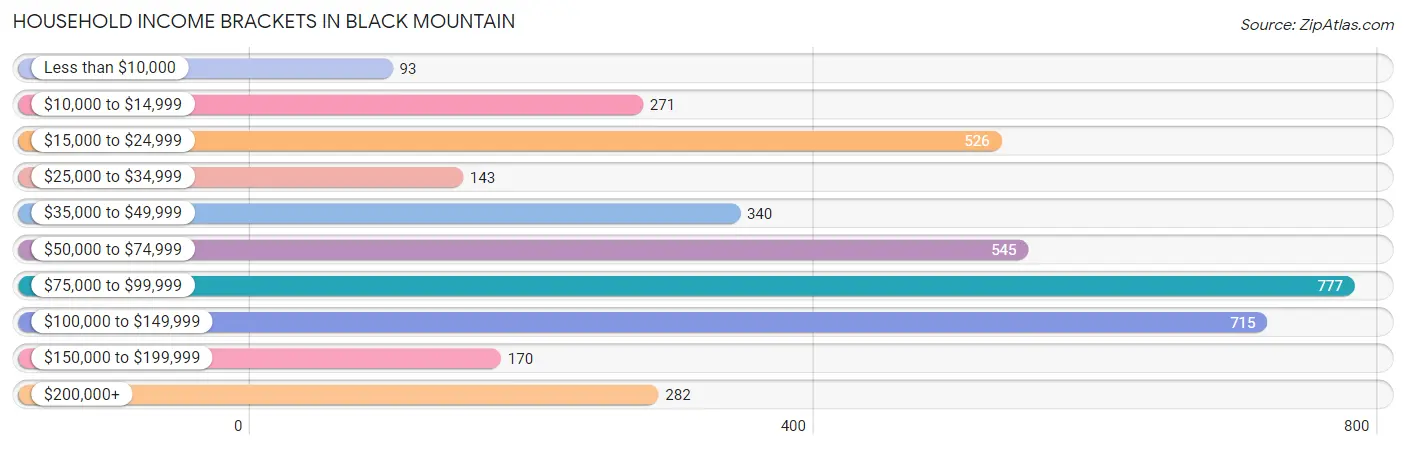
| Income Bracket | # Households | % Households |
| Less than $10,000 | 93 | 2.4% |
| $10,000 to $14,999 | 271 | 7.0% |
| $15,000 to $24,999 | 526 | 13.6% |
| $25,000 to $34,999 | 143 | 3.7% |
| $35,000 to $49,999 | 340 | 8.8% |
| $50,000 to $74,999 | 545 | 14.1% |
| $75,000 to $99,999 | 777 | 20.1% |
| $100,000 to $149,999 | 715 | 18.5% |
| $150,000 to $199,999 | 170 | 4.4% |
| $200,000+ | 282 | 7.3% |
Household Income by Householder Age in Black Mountain
The median household income in Black Mountain is $75,310, with the highest median household income of $88,730 found in the 45 to 64 years age bracket for the primary householder. A total of 861 households (22.3%) fall into this category. Meanwhile, the 15 to 24 years age bracket for the primary householder has the lowest median household income of $0, with 22 households (0.6%) in this group.
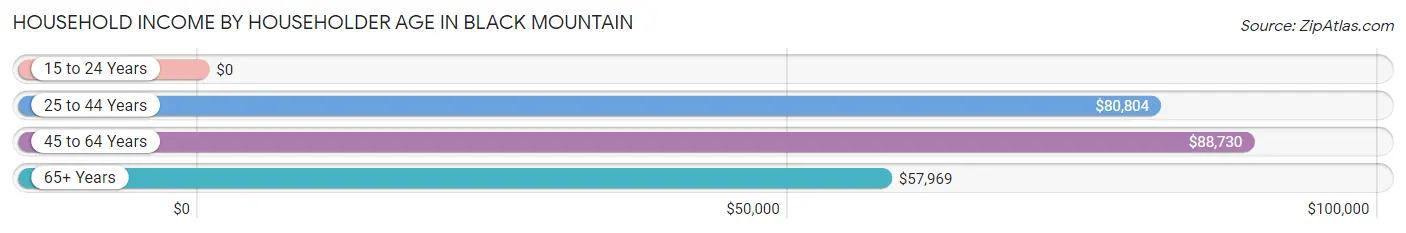
| Income Bracket | # Households | Median Income |
| 15 to 24 Years | 22 (0.6%) | $0 |
| 25 to 44 Years | 828 (21.4%) | $80,804 |
| 45 to 64 Years | 861 (22.3%) | $88,730 |
| 65+ Years | 2,156 (55.7%) | $57,969 |
| Total | 3,867 (100.0%) | $75,310 |
Poverty in Black Mountain
Income Below Poverty by Sex and Age in Black Mountain
With 6.6% poverty level for males and 5.7% for females among the residents of Black Mountain, 25 to 34 year old males and 15 year old females are the most vulnerable to poverty, with 75 males (21.8%) and 5 females (18.5%) in their respective age groups living below the poverty level.
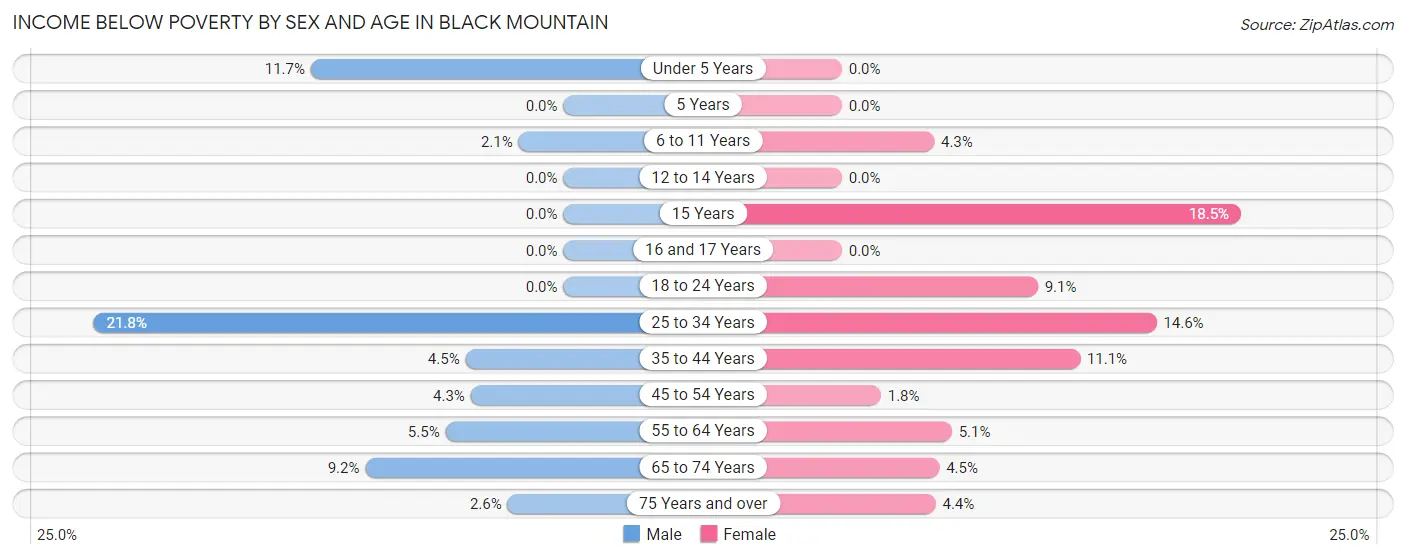
| Age Bracket | Male | Female |
| Under 5 Years | 15 (11.7%) | 0 (0.0%) |
| 5 Years | 0 (0.0%) | 0 (0.0%) |
| 6 to 11 Years | 6 (2.1%) | 11 (4.3%) |
| 12 to 14 Years | 0 (0.0%) | 0 (0.0%) |
| 15 Years | 0 (0.0%) | 5 (18.5%) |
| 16 and 17 Years | 0 (0.0%) | 0 (0.0%) |
| 18 to 24 Years | 0 (0.0%) | 14 (9.1%) |
| 25 to 34 Years | 75 (21.8%) | 47 (14.6%) |
| 35 to 44 Years | 20 (4.5%) | 56 (11.1%) |
| 45 to 54 Years | 15 (4.3%) | 9 (1.8%) |
| 55 to 64 Years | 32 (5.5%) | 39 (5.1%) |
| 65 to 74 Years | 43 (9.2%) | 43 (4.5%) |
| 75 Years and over | 15 (2.6%) | 47 (4.3%) |
| Total | 221 (6.6%) | 271 (5.7%) |
Income Above Poverty by Sex and Age in Black Mountain
According to the poverty statistics in Black Mountain, males aged 5 years and females aged under 5 years are the age groups that are most secure financially, with 100.0% of males and 100.0% of females in these age groups living above the poverty line.
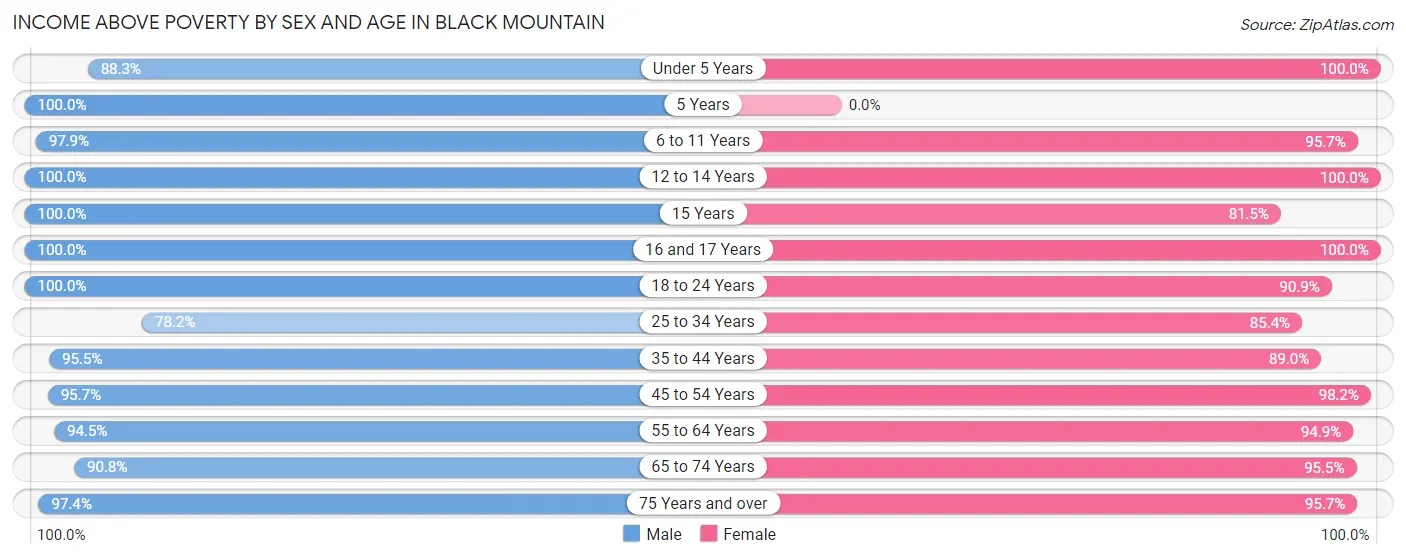
| Age Bracket | Male | Female |
| Under 5 Years | 113 (88.3%) | 156 (100.0%) |
| 5 Years | 38 (100.0%) | 0 (0.0%) |
| 6 to 11 Years | 282 (97.9%) | 246 (95.7%) |
| 12 to 14 Years | 37 (100.0%) | 33 (100.0%) |
| 15 Years | 21 (100.0%) | 22 (81.5%) |
| 16 and 17 Years | 45 (100.0%) | 15 (100.0%) |
| 18 to 24 Years | 41 (100.0%) | 140 (90.9%) |
| 25 to 34 Years | 269 (78.2%) | 275 (85.4%) |
| 35 to 44 Years | 421 (95.5%) | 451 (88.9%) |
| 45 to 54 Years | 334 (95.7%) | 488 (98.2%) |
| 55 to 64 Years | 553 (94.5%) | 726 (94.9%) |
| 65 to 74 Years | 425 (90.8%) | 908 (95.5%) |
| 75 Years and over | 564 (97.4%) | 1,034 (95.7%) |
| Total | 3,143 (93.4%) | 4,494 (94.3%) |
Income Below Poverty Among Married-Couple Families in Black Mountain
The poverty statistics for married-couple families in Black Mountain show that 1.3% or 25 of the total 1,936 families live below the poverty line. Families with 1 or 2 children have the highest poverty rate of 3.1%, comprising of 15 families. On the other hand, families with 3 or 4 children have the lowest poverty rate of 0.0%, which includes 0 families.
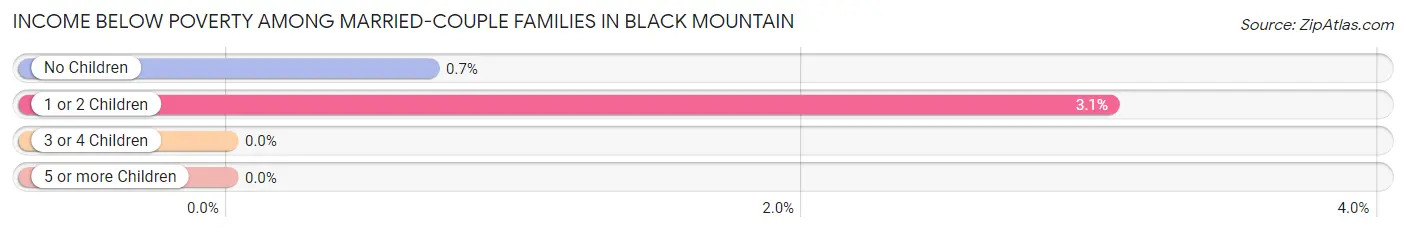
| Children | Above Poverty | Below Poverty |
| No Children | 1,416 (99.3%) | 10 (0.7%) |
| 1 or 2 Children | 473 (96.9%) | 15 (3.1%) |
| 3 or 4 Children | 22 (100.0%) | 0 (0.0%) |
| 5 or more Children | 0 (0.0%) | 0 (0.0%) |
| Total | 1,911 (98.7%) | 25 (1.3%) |
Income Below Poverty Among Single-Parent Households in Black Mountain
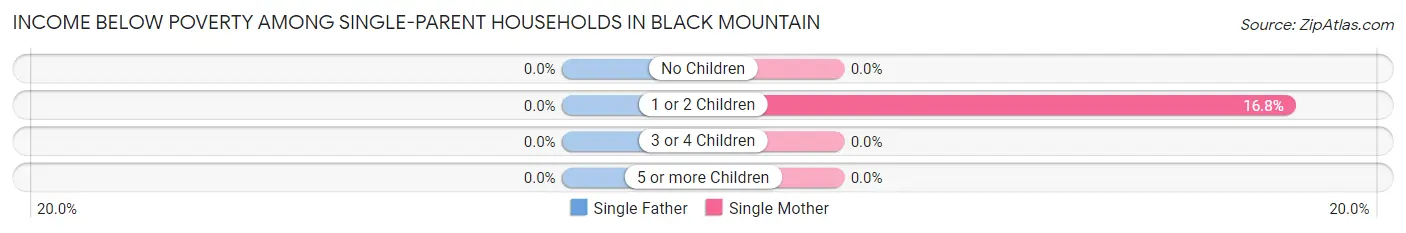
| Children | Single Father | Single Mother |
| No Children | 0 (0.0%) | 0 (0.0%) |
| 1 or 2 Children | 0 (0.0%) | 17 (16.8%) |
| 3 or 4 Children | 0 (0.0%) | 0 (0.0%) |
| 5 or more Children | 0 (0.0%) | 0 (0.0%) |
| Total | 0 (0.0%) | 17 (10.1%) |
Income Below Poverty Among Married-Couple vs Single-Parent Households in Black Mountain
The poverty data for Black Mountain shows that 25 of the married-couple family households (1.3%) and 17 of the single-parent households (8.2%) are living below the poverty level. Within the married-couple family households, those with 1 or 2 children have the highest poverty rate, with 15 households (3.1%) falling below the poverty line. Among the single-parent households, those with 1 or 2 children have the highest poverty rate, with 17 household (16.2%) living below poverty.
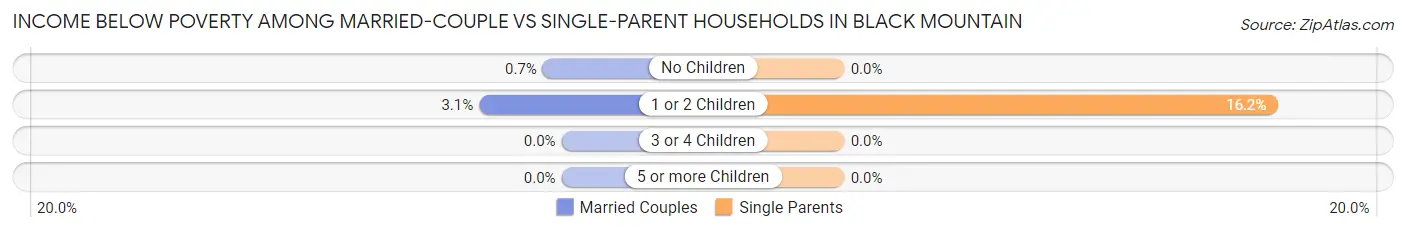
| Children | Married-Couple Families | Single-Parent Households |
| No Children | 10 (0.7%) | 0 (0.0%) |
| 1 or 2 Children | 15 (3.1%) | 17 (16.2%) |
| 3 or 4 Children | 0 (0.0%) | 0 (0.0%) |
| 5 or more Children | 0 (0.0%) | 0 (0.0%) |
| Total | 25 (1.3%) | 17 (8.2%) |
Race in Black Mountain
The most populous races in Black Mountain are White / Caucasian (7,879 | 93.5%), Two or more Races (293 | 3.5%), and Some other Race (127 | 1.5%).
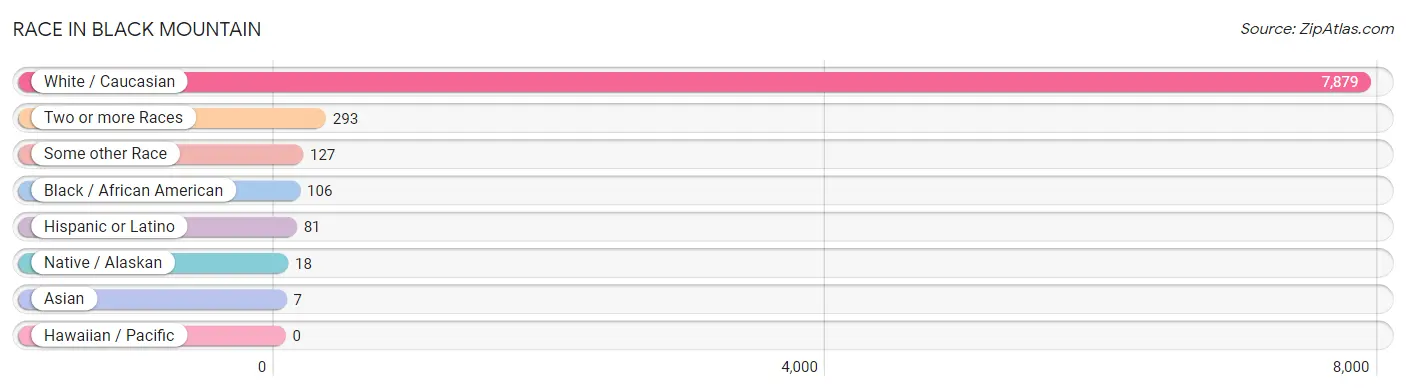
| Race | # Population | % Population |
| Asian | 7 | 0.1% |
| Black / African American | 106 | 1.3% |
| Hawaiian / Pacific | 0 | 0.0% |
| Hispanic or Latino | 81 | 1.0% |
| Native / Alaskan | 18 | 0.2% |
| White / Caucasian | 7,879 | 93.5% |
| Two or more Races | 293 | 3.5% |
| Some other Race | 127 | 1.5% |
| Total | 8,430 | 100.0% |
Ancestry in Black Mountain
The most populous ancestries reported in Black Mountain are English (3,548 | 42.1%), German (1,079 | 12.8%), Irish (831 | 9.9%), Scottish (469 | 5.6%), and Scotch-Irish (401 | 4.8%), together accounting for 75.1% of all Black Mountain residents.
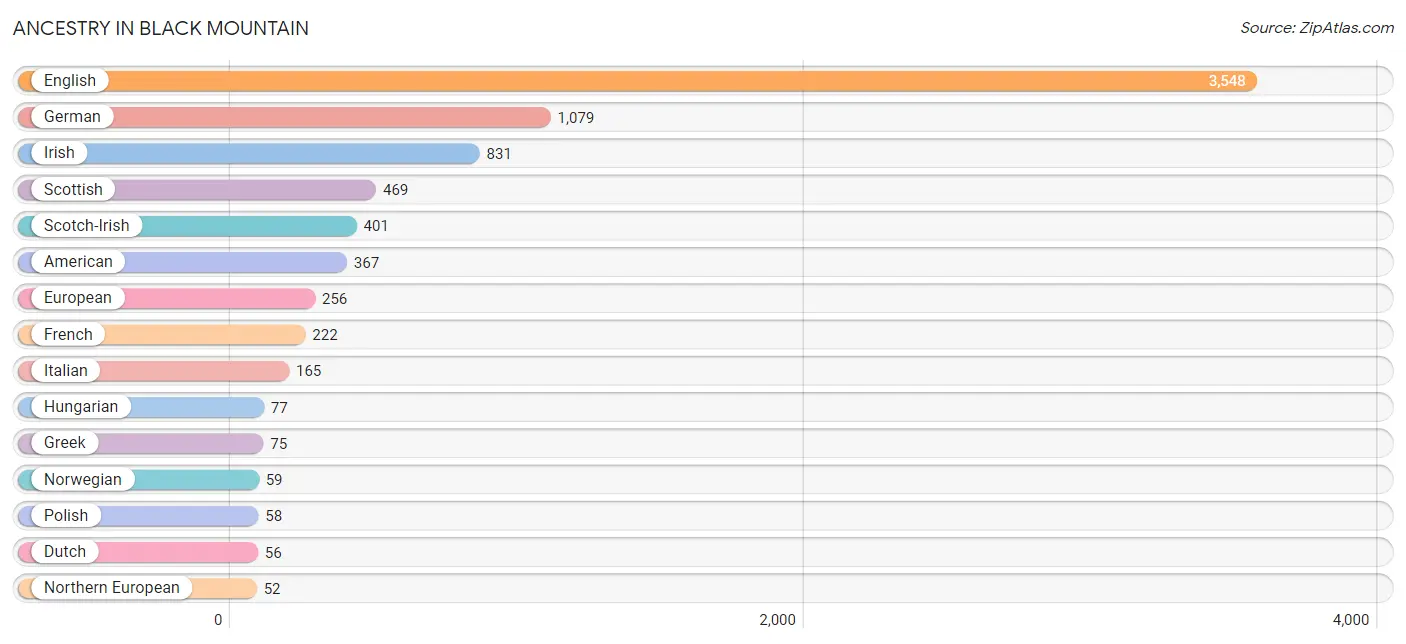
| Ancestry | # Population | % Population |
| American | 367 | 4.3% |
| Arab | 14 | 0.2% |
| Austrian | 6 | 0.1% |
| Bhutanese | 10 | 0.1% |
| British | 46 | 0.5% |
| Canadian | 11 | 0.1% |
| Central American | 35 | 0.4% |
| Croatian | 16 | 0.2% |
| Czech | 23 | 0.3% |
| Czechoslovakian | 40 | 0.5% |
| Danish | 14 | 0.2% |
| Dutch | 56 | 0.7% |
| Eastern European | 32 | 0.4% |
| Egyptian | 14 | 0.2% |
| English | 3,548 | 42.1% |
| European | 256 | 3.0% |
| Finnish | 10 | 0.1% |
| French | 222 | 2.6% |
| German | 1,079 | 12.8% |
| Greek | 75 | 0.9% |
| Guatemalan | 33 | 0.4% |
| Haitian | 8 | 0.1% |
| Honduran | 2 | 0.0% |
| Hungarian | 77 | 0.9% |
| Irish | 831 | 9.9% |
| Italian | 165 | 2.0% |
| Japanese | 7 | 0.1% |
| Kiowa | 18 | 0.2% |
| Latvian | 12 | 0.1% |
| Mexican | 35 | 0.4% |
| Mexican American Indian | 10 | 0.1% |
| Northern European | 52 | 0.6% |
| Norwegian | 59 | 0.7% |
| Polish | 58 | 0.7% |
| Russian | 10 | 0.1% |
| Scandinavian | 15 | 0.2% |
| Scotch-Irish | 401 | 4.8% |
| Scottish | 469 | 5.6% |
| Spaniard | 11 | 0.1% |
| Swedish | 21 | 0.3% |
| Swiss | 50 | 0.6% |
| Thai | 16 | 0.2% |
| Turkish | 31 | 0.4% |
| Welsh | 38 | 0.4% |
| Yugoslavian | 20 | 0.2% | View All 45 Rows |
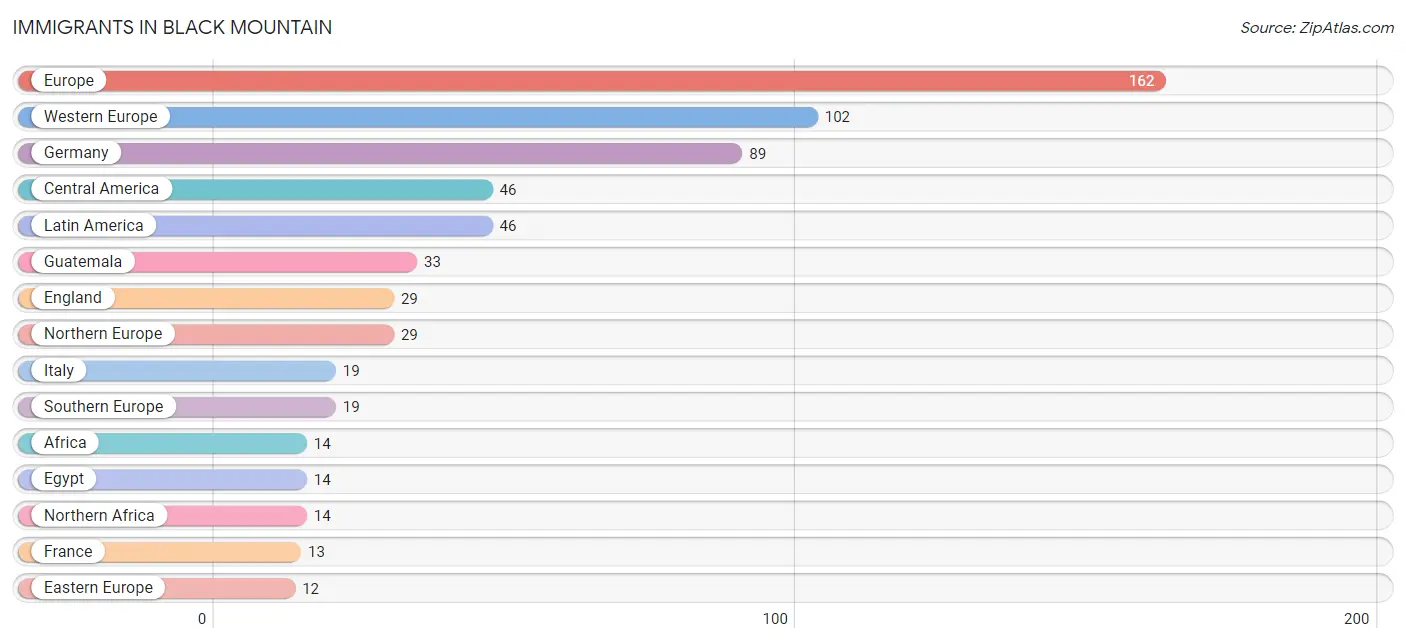
Immigrants in Black Mountain
The most numerous immigrant groups reported in Black Mountain came from Europe (162 | 1.9%), Western Europe (102 | 1.2%), Germany (89 | 1.1%), Central America (46 | 0.5%), and Latin America (46 | 0.5%), together accounting for 5.3% of all Black Mountain residents.
| Immigration Origin | # Population | % Population |
| Africa | 14 | 0.2% |
| Asia | 7 | 0.1% |
| Cambodia | 7 | 0.1% |
| Central America | 46 | 0.5% |
| Eastern Europe | 12 | 0.1% |
| Egypt | 14 | 0.2% |
| England | 29 | 0.3% |
| Europe | 162 | 1.9% |
| France | 13 | 0.2% |
| Germany | 89 | 1.1% |
| Guatemala | 33 | 0.4% |
| Honduras | 2 | 0.0% |
| Italy | 19 | 0.2% |
| Latin America | 46 | 0.5% |
| Latvia | 12 | 0.1% |
| Mexico | 11 | 0.1% |
| Northern Africa | 14 | 0.2% |
| Northern Europe | 29 | 0.3% |
| South Eastern Asia | 7 | 0.1% |
| Southern Europe | 19 | 0.2% |
| Western Europe | 102 | 1.2% | View All 21 Rows |
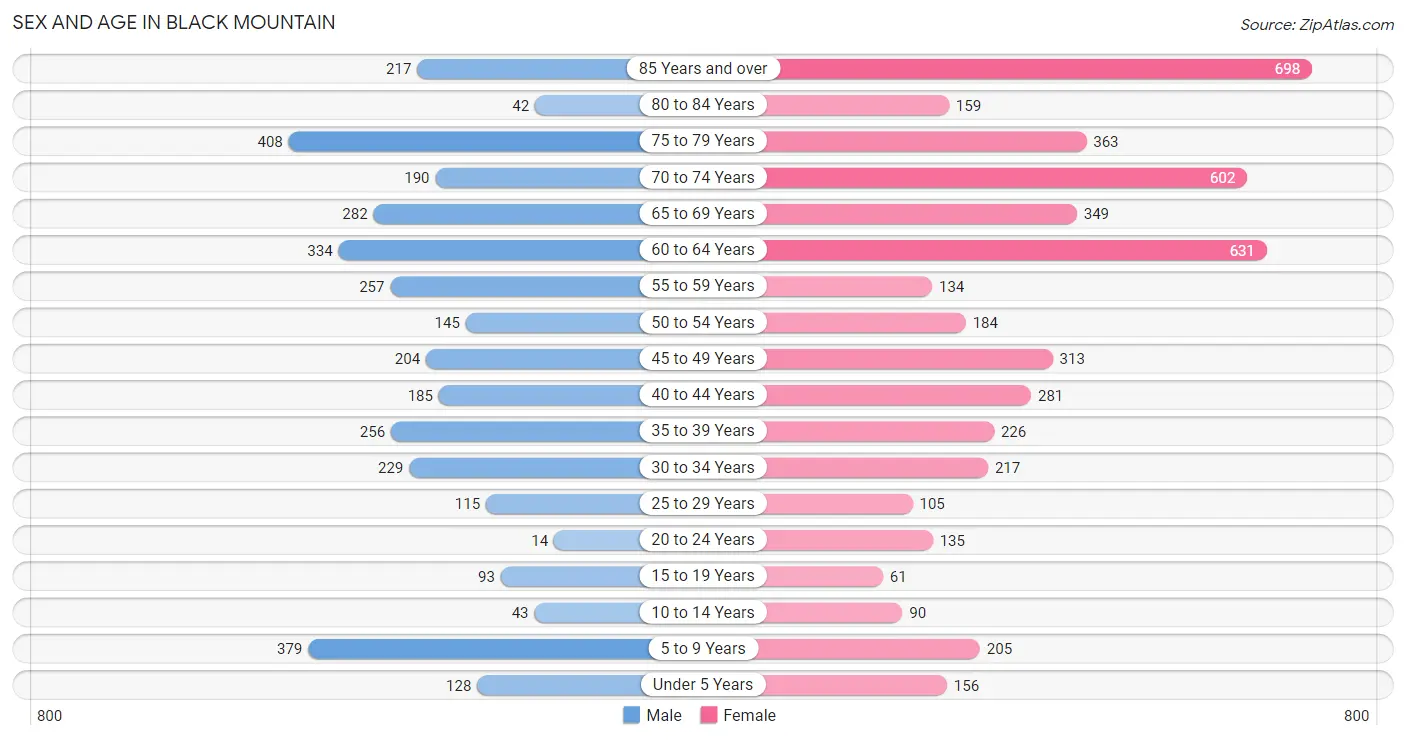
Sex and Age in Black Mountain
Sex and Age in Black Mountain
The most populous age groups in Black Mountain are 75 to 79 Years (408 | 11.6%) for men and 85 Years and over (698 | 14.2%) for women.
| Age Bracket | Male | Female |
| Under 5 Years | 128 (3.6%) | 156 (3.2%) |
| 5 to 9 Years | 379 (10.8%) | 205 (4.2%) |
| 10 to 14 Years | 43 (1.2%) | 90 (1.8%) |
| 15 to 19 Years | 93 (2.6%) | 61 (1.2%) |
| 20 to 24 Years | 14 (0.4%) | 135 (2.8%) |
| 25 to 29 Years | 115 (3.3%) | 105 (2.1%) |
| 30 to 34 Years | 229 (6.5%) | 217 (4.4%) |
| 35 to 39 Years | 256 (7.3%) | 226 (4.6%) |
| 40 to 44 Years | 185 (5.2%) | 281 (5.7%) |
| 45 to 49 Years | 204 (5.8%) | 313 (6.4%) |
| 50 to 54 Years | 145 (4.1%) | 184 (3.7%) |
| 55 to 59 Years | 257 (7.3%) | 134 (2.7%) |
| 60 to 64 Years | 334 (9.5%) | 631 (12.9%) |
| 65 to 69 Years | 282 (8.0%) | 349 (7.1%) |
| 70 to 74 Years | 190 (5.4%) | 602 (12.3%) |
| 75 to 79 Years | 408 (11.6%) | 363 (7.4%) |
| 80 to 84 Years | 42 (1.2%) | 159 (3.2%) |
| 85 Years and over | 217 (6.2%) | 698 (14.2%) |
| Total | 3,521 (100.0%) | 4,909 (100.0%) |
Families and Households in Black Mountain
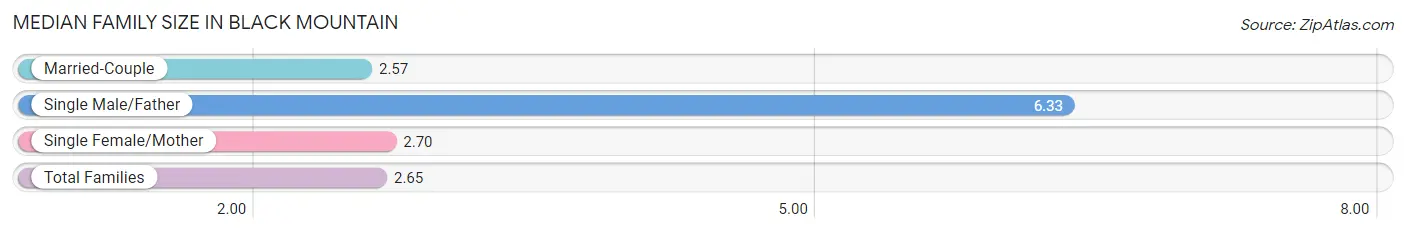
Median Family Size in Black Mountain
The median family size in Black Mountain is 2.65 persons per family, with single male/father families (40 | 1.9%) accounting for the largest median family size of 6.33 persons per family. On the other hand, married-couple families (1,936 | 90.3%) represent the smallest median family size with 2.57 persons per family.
| Family Type | # Families | Family Size |
| Married-Couple | 1,936 (90.3%) | 2.57 |
| Single Male/Father | 40 (1.9%) | 6.33 |
| Single Female/Mother | 168 (7.8%) | 2.70 |
| Total Families | 2,144 (100.0%) | 2.65 |
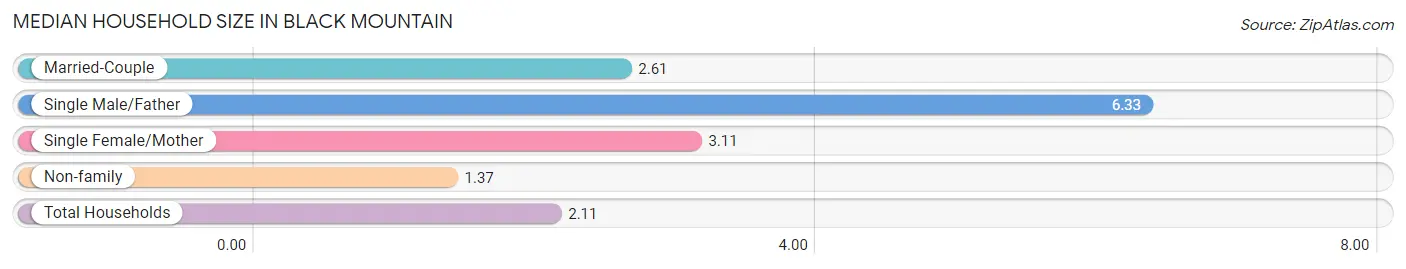
Median Household Size in Black Mountain
The median household size in Black Mountain is 2.11 persons per household, with single male/father households (40 | 1.0%) accounting for the largest median household size of 6.33 persons per household. non-family households (1,723 | 44.6%) represent the smallest median household size with 1.37 persons per household.
| Household Type | # Households | Household Size |
| Married-Couple | 1,936 (50.1%) | 2.61 |
| Single Male/Father | 40 (1.0%) | 6.33 |
| Single Female/Mother | 168 (4.3%) | 3.11 |
| Non-family | 1,723 (44.6%) | 1.37 |
| Total Households | 3,867 (100.0%) | 2.11 |
Household Size by Marriage Status in Black Mountain
Out of a total of 3,867 households in Black Mountain, 2,144 (55.4%) are family households, while 1,723 (44.6%) are nonfamily households. The most numerous type of family households are 2-person households, comprising 1,428, and the most common type of nonfamily households are 1-person households, comprising 1,445.
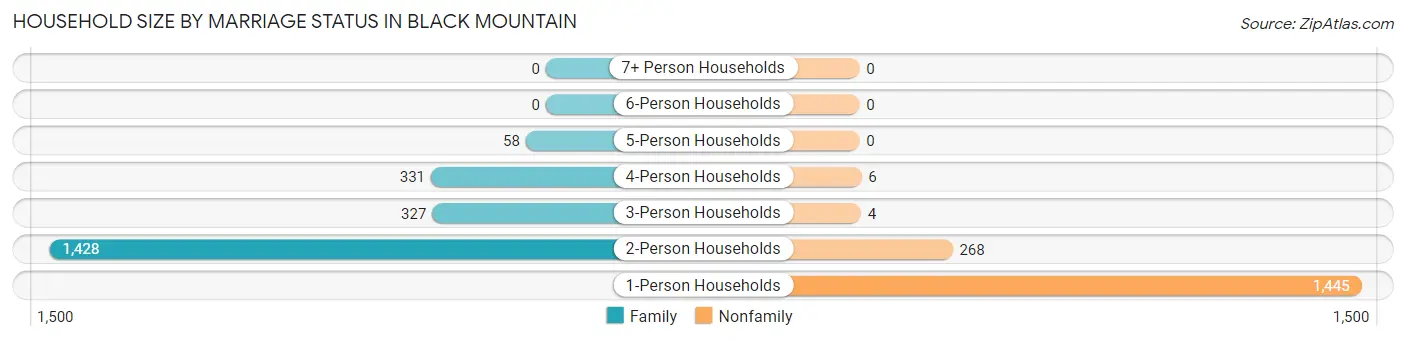
| Household Size | Family Households | Nonfamily Households |
| 1-Person Households | - | 1,445 (37.4%) |
| 2-Person Households | 1,428 (36.9%) | 268 (6.9%) |
| 3-Person Households | 327 (8.5%) | 4 (0.1%) |
| 4-Person Households | 331 (8.6%) | 6 (0.2%) |
| 5-Person Households | 58 (1.5%) | 0 (0.0%) |
| 6-Person Households | 0 (0.0%) | 0 (0.0%) |
| 7+ Person Households | 0 (0.0%) | 0 (0.0%) |
| Total | 2,144 (55.4%) | 1,723 (44.6%) |
Female Fertility in Black Mountain
Fertility by Age in Black Mountain
Average fertility rate in Black Mountain is 49.0 births per 1,000 women. Women in the age bracket of 20 to 34 years have the highest fertility rate with 118.0 births per 1,000 women. Women in the age bracket of 20 to 34 years acount for 77.1% of all women with births.
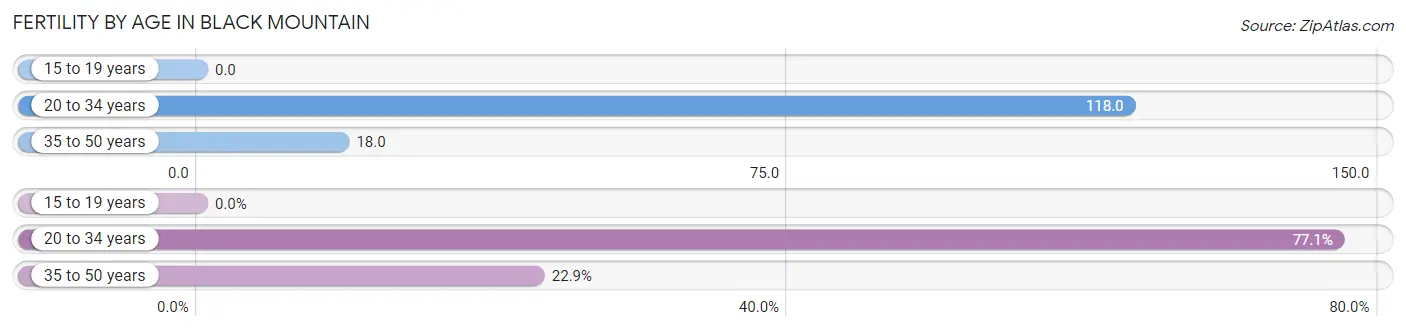
| Age Bracket | Women with Births | Births / 1,000 Women |
| 15 to 19 years | 0 (0.0%) | 0.0 |
| 20 to 34 years | 54 (77.1%) | 118.0 |
| 35 to 50 years | 16 (22.9%) | 18.0 |
| Total | 70 (100.0%) | 49.0 |
Fertility by Age by Marriage Status in Black Mountain
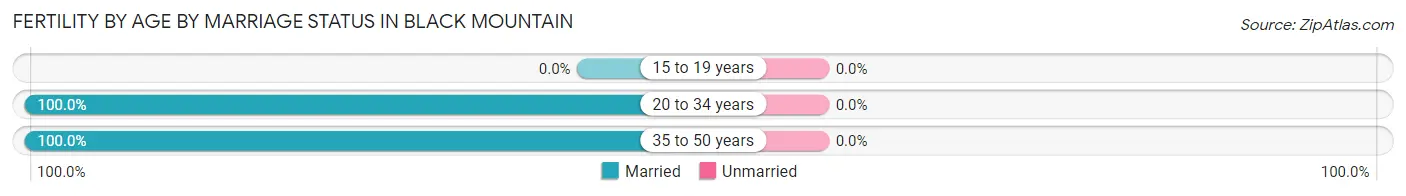
| Age Bracket | Married | Unmarried |
| 15 to 19 years | 0 (0.0%) | 0 (0.0%) |
| 20 to 34 years | 54 (100.0%) | 0 (0.0%) |
| 35 to 50 years | 16 (100.0%) | 0 (0.0%) |
| Total | 70 (100.0%) | 0 (0.0%) |
Fertility by Education in Black Mountain
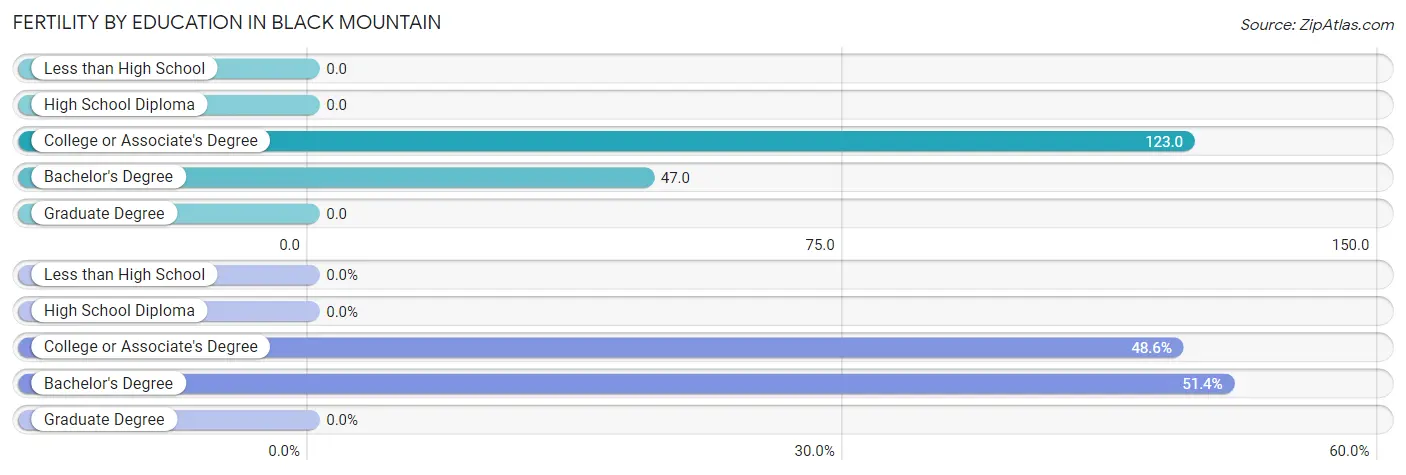
| Educational Attainment | Women with Births | Births / 1,000 Women |
| Less than High School | 0 (0.0%) | 0.0 |
| High School Diploma | 0 (0.0%) | 0.0 |
| College or Associate's Degree | 34 (48.6%) | 123.0 |
| Bachelor's Degree | 36 (51.4%) | 47.0 |
| Graduate Degree | 0 (0.0%) | 0.0 |
| Total | 70 (100.0%) | 49.0 |
Fertility by Education by Marriage Status in Black Mountain
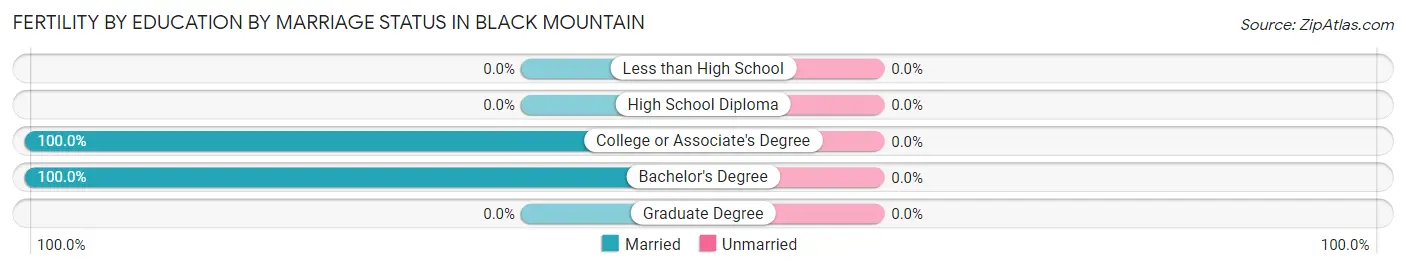
| Educational Attainment | Married | Unmarried |
| Less than High School | 0 (0.0%) | 0 (0.0%) |
| High School Diploma | 0 (0.0%) | 0 (0.0%) |
| College or Associate's Degree | 34 (100.0%) | 0 (0.0%) |
| Bachelor's Degree | 36 (100.0%) | 0 (0.0%) |
| Graduate Degree | 0 (0.0%) | 0 (0.0%) |
| Total | 70 (100.0%) | 0 (0.0%) |
Employment Characteristics in Black Mountain
Employment by Class of Employer in Black Mountain
Among the 3,268 employed individuals in Black Mountain, private company employees (1,908 | 58.4%), not-for-profit organizations (471 | 14.4%), and self-employed (not incorporated) (276 | 8.5%) make up the most common classes of employment.
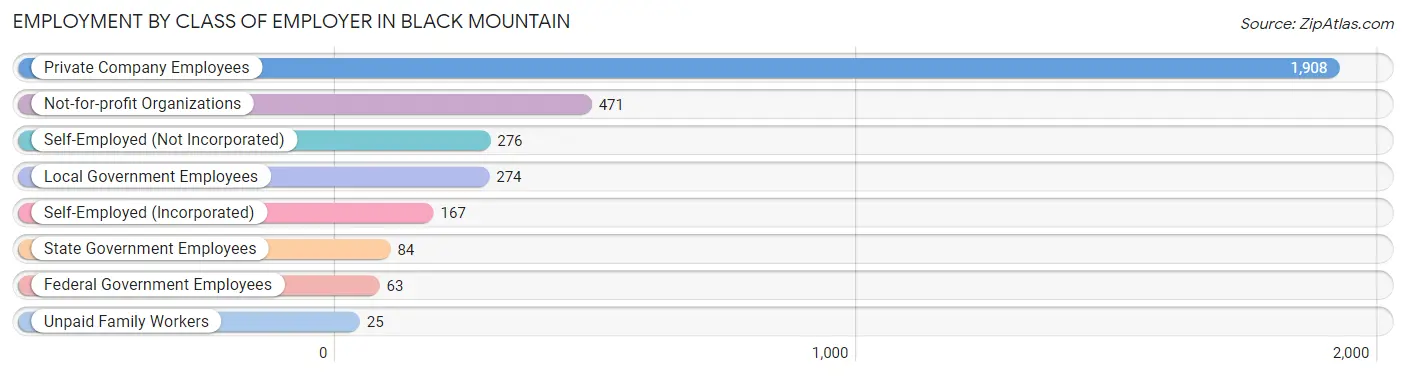
| Employer Class | # Employees | % Employees |
| Private Company Employees | 1,908 | 58.4% |
| Self-Employed (Incorporated) | 167 | 5.1% |
| Self-Employed (Not Incorporated) | 276 | 8.5% |
| Not-for-profit Organizations | 471 | 14.4% |
| Local Government Employees | 274 | 8.4% |
| State Government Employees | 84 | 2.6% |
| Federal Government Employees | 63 | 1.9% |
| Unpaid Family Workers | 25 | 0.8% |
| Total | 3,268 | 100.0% |
Employment Status by Age in Black Mountain
According to the labor force statistics for Black Mountain, out of the total population over 16 years of age (7,381), 45.1% or 3,329 individuals are in the labor force, with 1.1% or 37 of them unemployed. The age group with the highest labor force participation rate is 25 to 29 years, with 91.8% or 202 individuals in the labor force. Within the labor force, the 16 to 19 years age range has the highest percentage of unemployed individuals, with 17.4% or 8 of them being unemployed.
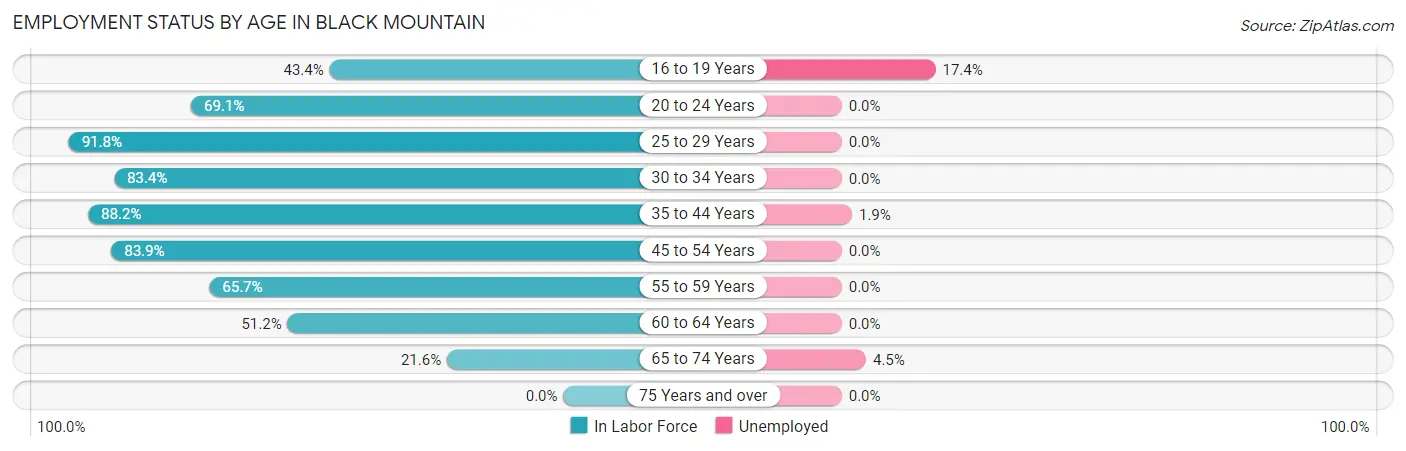
| Age Bracket | In Labor Force | Unemployed |
| 16 to 19 Years | 46 (43.4%) | 8 (17.4%) |
| 20 to 24 Years | 103 (69.1%) | 0 (0.0%) |
| 25 to 29 Years | 202 (91.8%) | 0 (0.0%) |
| 30 to 34 Years | 372 (83.4%) | 0 (0.0%) |
| 35 to 44 Years | 836 (88.2%) | 16 (1.9%) |
| 45 to 54 Years | 710 (83.9%) | 0 (0.0%) |
| 55 to 59 Years | 257 (65.7%) | 0 (0.0%) |
| 60 to 64 Years | 494 (51.2%) | 0 (0.0%) |
| 65 to 74 Years | 307 (21.6%) | 14 (4.5%) |
| 75 Years and over | 0 (0.0%) | 0 (0.0%) |
| Total | 3,329 (45.1%) | 37 (1.1%) |
Employment Status by Educational Attainment in Black Mountain
According to labor force statistics for Black Mountain, 75.2% of individuals (2,870) out of the total population between 25 and 64 years of age (3,816) are in the labor force, with 0.6% or 17 of them being unemployed. The group with the highest labor force participation rate are those with the educational attainment of college / associate degree, with 82.6% or 593 individuals in the labor force. Within the labor force, individuals with bachelor's degree or higher education have the highest percentage of unemployment, with 0.9% or 16 of them being unemployed.
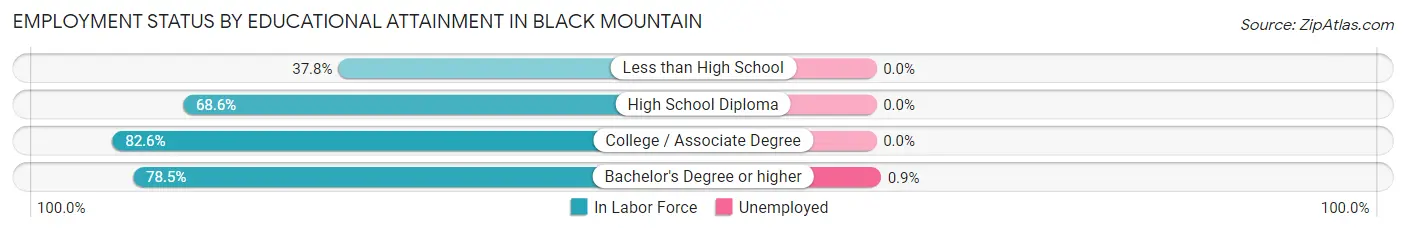
| Educational Attainment | In Labor Force | Unemployed |
| Less than High School | 88 (37.8%) | 0 (0.0%) |
| High School Diploma | 418 (68.6%) | 0 (0.0%) |
| College / Associate Degree | 593 (82.6%) | 0 (0.0%) |
| Bachelor's Degree or higher | 1,771 (78.5%) | 20 (0.9%) |
| Total | 2,870 (75.2%) | 23 (0.6%) |
Employment Occupations by Sex in Black Mountain
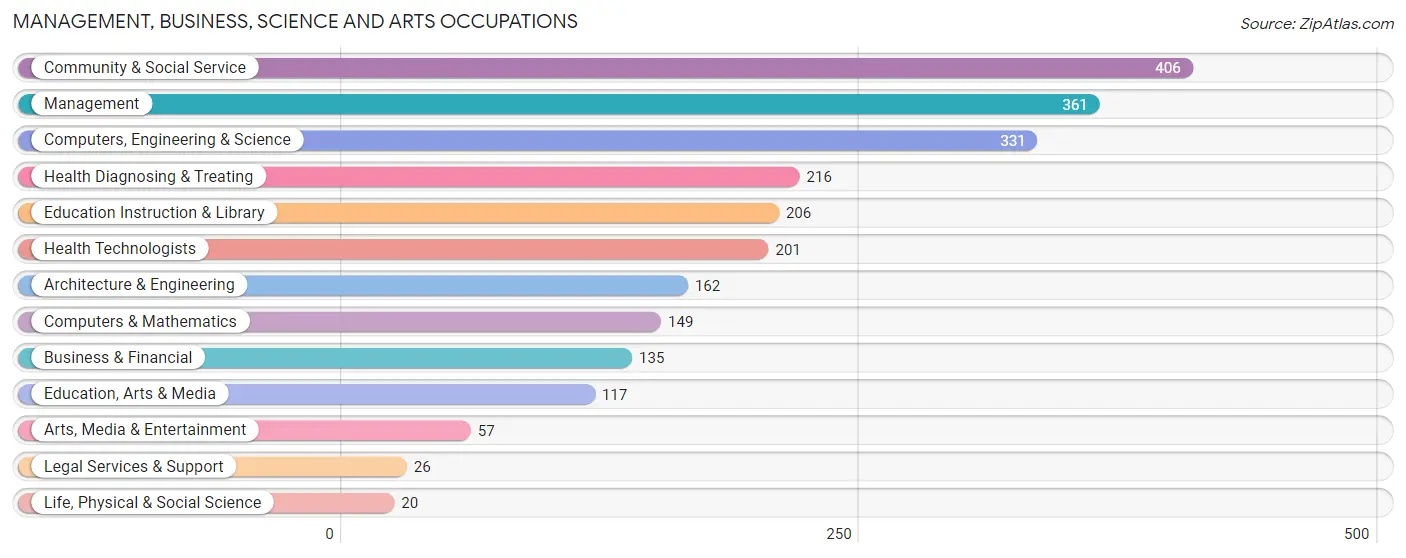
Management, Business, Science and Arts Occupations
The most common Management, Business, Science and Arts occupations in Black Mountain are Community & Social Service (406 | 12.3%), Management (361 | 11.0%), Computers, Engineering & Science (331 | 10.1%), Health Diagnosing & Treating (216 | 6.6%), and Education Instruction & Library (206 | 6.3%).
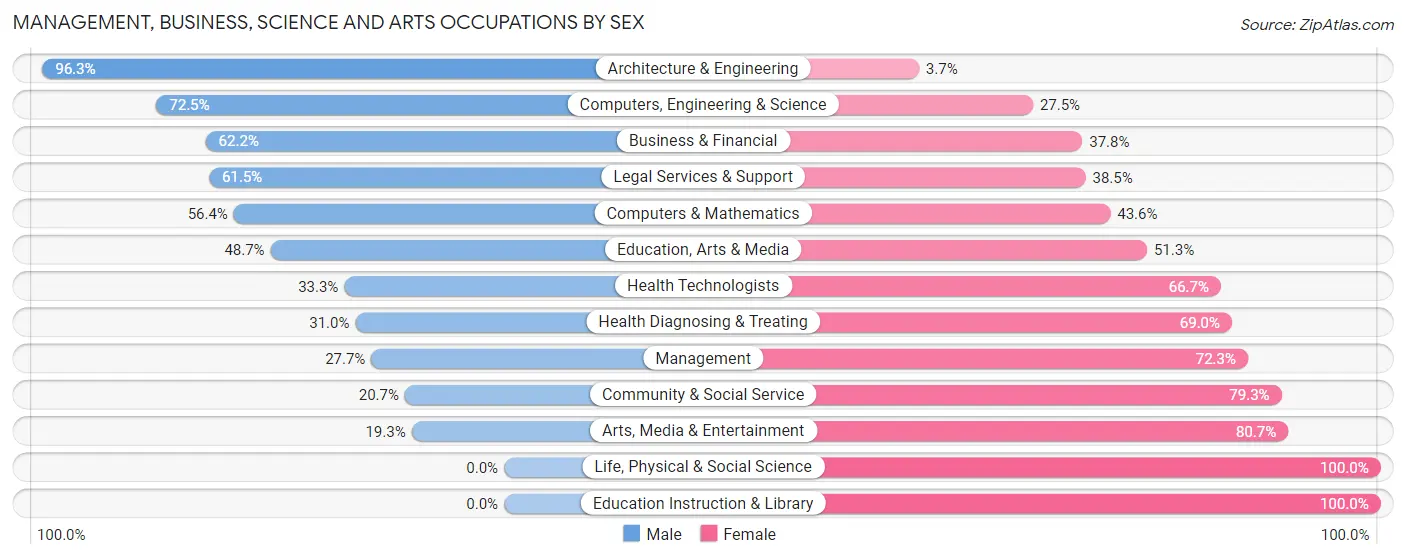
Management, Business, Science and Arts Occupations by Sex
Within the Management, Business, Science and Arts occupations in Black Mountain, the most male-oriented occupations are Architecture & Engineering (96.3%), Computers, Engineering & Science (72.5%), and Business & Financial (62.2%), while the most female-oriented occupations are Life, Physical & Social Science (100.0%), Education Instruction & Library (100.0%), and Arts, Media & Entertainment (80.7%).
| Occupation | Male | Female |
| Management | 100 (27.7%) | 261 (72.3%) |
| Business & Financial | 84 (62.2%) | 51 (37.8%) |
| Computers, Engineering & Science | 240 (72.5%) | 91 (27.5%) |
| Computers & Mathematics | 84 (56.4%) | 65 (43.6%) |
| Architecture & Engineering | 156 (96.3%) | 6 (3.7%) |
| Life, Physical & Social Science | 0 (0.0%) | 20 (100.0%) |
| Community & Social Service | 84 (20.7%) | 322 (79.3%) |
| Education, Arts & Media | 57 (48.7%) | 60 (51.3%) |
| Legal Services & Support | 16 (61.5%) | 10 (38.5%) |
| Education Instruction & Library | 0 (0.0%) | 206 (100.0%) |
| Arts, Media & Entertainment | 11 (19.3%) | 46 (80.7%) |
| Health Diagnosing & Treating | 67 (31.0%) | 149 (69.0%) |
| Health Technologists | 67 (33.3%) | 134 (66.7%) |
| Total (Category) | 575 (39.7%) | 874 (60.3%) |
| Total (Overall) | 1,601 (48.7%) | 1,689 (51.3%) |
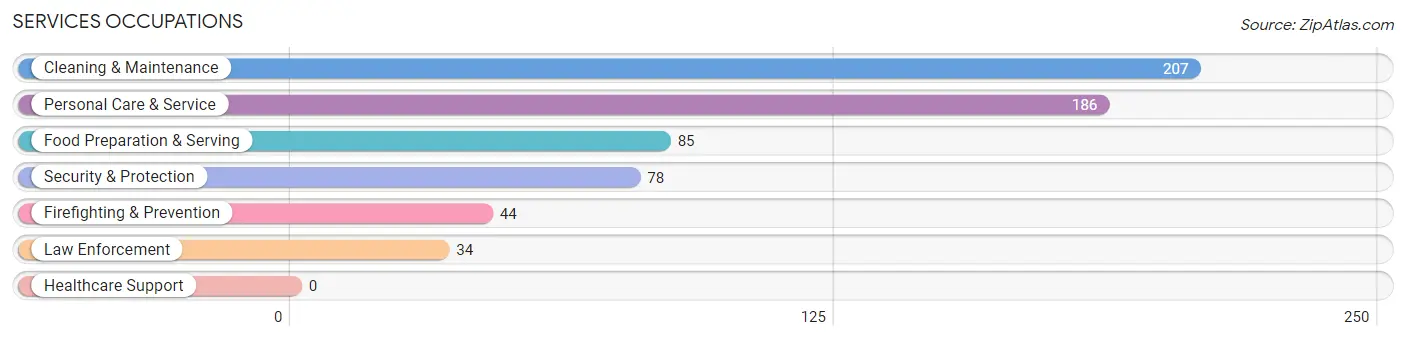
Services Occupations
The most common Services occupations in Black Mountain are Cleaning & Maintenance (207 | 6.3%), Personal Care & Service (186 | 5.7%), Food Preparation & Serving (85 | 2.6%), Security & Protection (78 | 2.4%), and Firefighting & Prevention (44 | 1.3%).
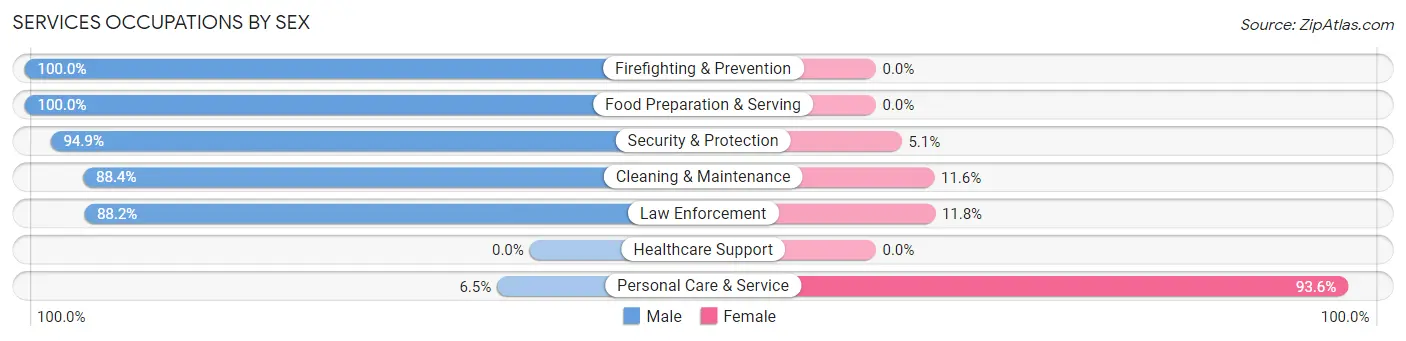
Services Occupations by Sex
Within the Services occupations in Black Mountain, the most male-oriented occupations are Firefighting & Prevention (100.0%), Food Preparation & Serving (100.0%), and Security & Protection (94.9%), while the most female-oriented occupations are Personal Care & Service (93.5%), Law Enforcement (11.8%), and Cleaning & Maintenance (11.6%).
| Occupation | Male | Female |
| Healthcare Support | 0 (0.0%) | 0 (0.0%) |
| Security & Protection | 74 (94.9%) | 4 (5.1%) |
| Firefighting & Prevention | 44 (100.0%) | 0 (0.0%) |
| Law Enforcement | 30 (88.2%) | 4 (11.8%) |
| Food Preparation & Serving | 85 (100.0%) | 0 (0.0%) |
| Cleaning & Maintenance | 183 (88.4%) | 24 (11.6%) |
| Personal Care & Service | 12 (6.5%) | 174 (93.5%) |
| Total (Category) | 354 (63.7%) | 202 (36.3%) |
| Total (Overall) | 1,601 (48.7%) | 1,689 (51.3%) |
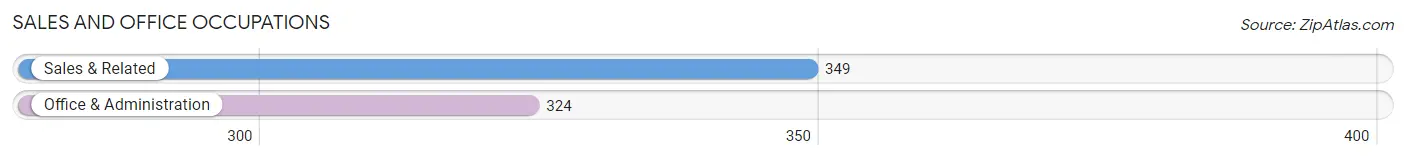
Sales and Office Occupations
The most common Sales and Office occupations in Black Mountain are Sales & Related (349 | 10.6%), and Office & Administration (324 | 9.9%).
Sales and Office Occupations by Sex
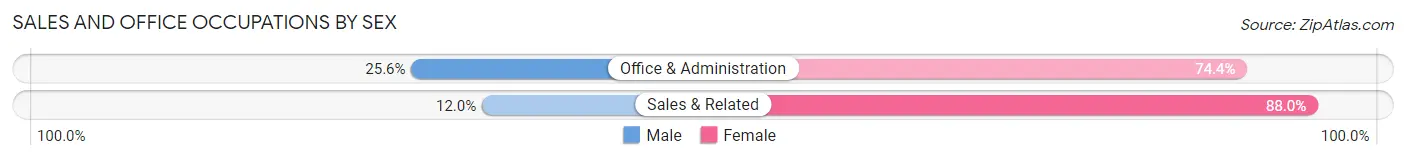
| Occupation | Male | Female |
| Sales & Related | 42 (12.0%) | 307 (88.0%) |
| Office & Administration | 83 (25.6%) | 241 (74.4%) |
| Total (Category) | 125 (18.6%) | 548 (81.4%) |
| Total (Overall) | 1,601 (48.7%) | 1,689 (51.3%) |
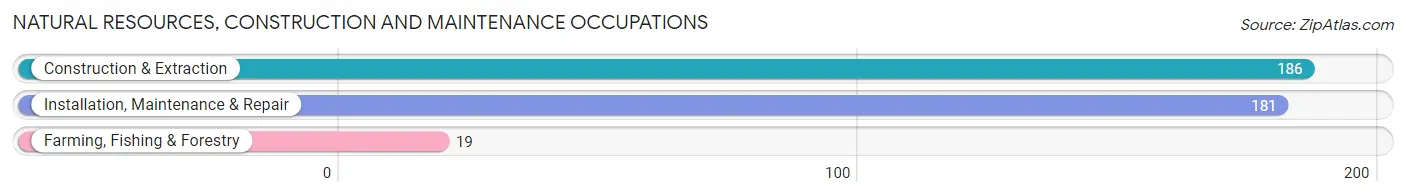
Natural Resources, Construction and Maintenance Occupations
The most common Natural Resources, Construction and Maintenance occupations in Black Mountain are Construction & Extraction (186 | 5.7%), Installation, Maintenance & Repair (181 | 5.5%), and Farming, Fishing & Forestry (19 | 0.6%).
Natural Resources, Construction and Maintenance Occupations by Sex
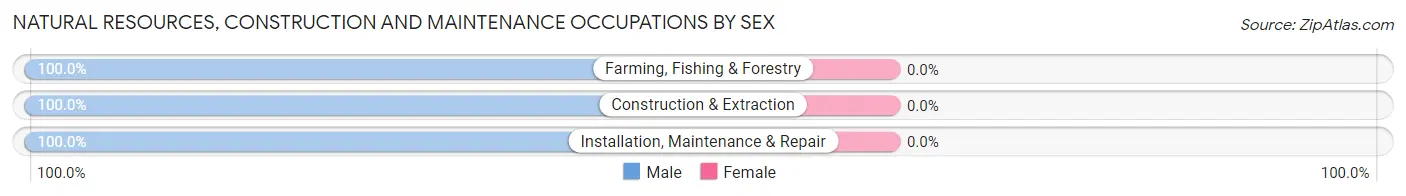
| Occupation | Male | Female |
| Farming, Fishing & Forestry | 19 (100.0%) | 0 (0.0%) |
| Construction & Extraction | 186 (100.0%) | 0 (0.0%) |
| Installation, Maintenance & Repair | 181 (100.0%) | 0 (0.0%) |
| Total (Category) | 386 (100.0%) | 0 (0.0%) |
| Total (Overall) | 1,601 (48.7%) | 1,689 (51.3%) |
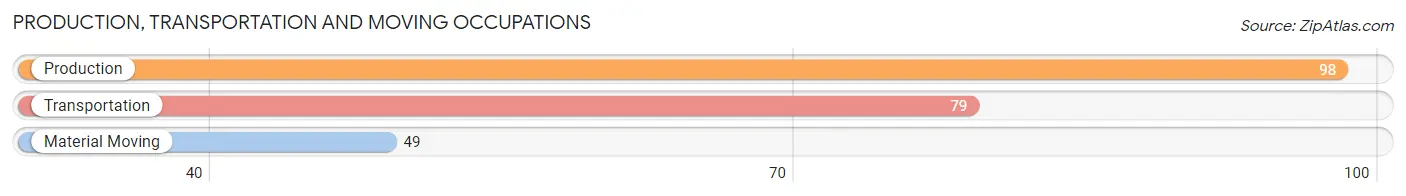
Production, Transportation and Moving Occupations
The most common Production, Transportation and Moving occupations in Black Mountain are Production (98 | 3.0%), Transportation (79 | 2.4%), and Material Moving (49 | 1.5%).
Production, Transportation and Moving Occupations by Sex
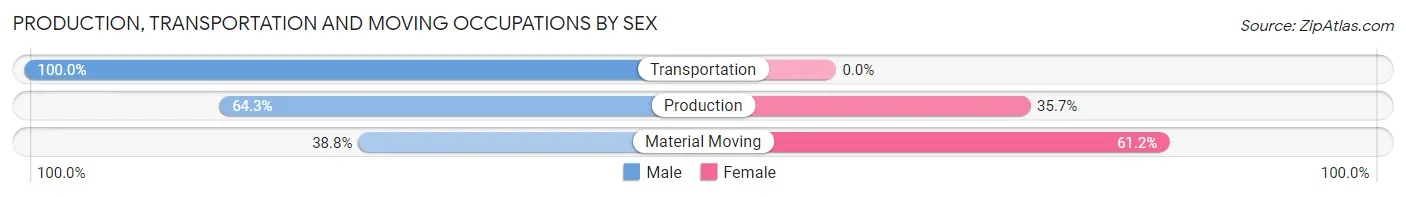
| Occupation | Male | Female |
| Production | 63 (64.3%) | 35 (35.7%) |
| Transportation | 79 (100.0%) | 0 (0.0%) |
| Material Moving | 19 (38.8%) | 30 (61.2%) |
| Total (Category) | 161 (71.2%) | 65 (28.8%) |
| Total (Overall) | 1,601 (48.7%) | 1,689 (51.3%) |
Employment Industries by Sex in Black Mountain
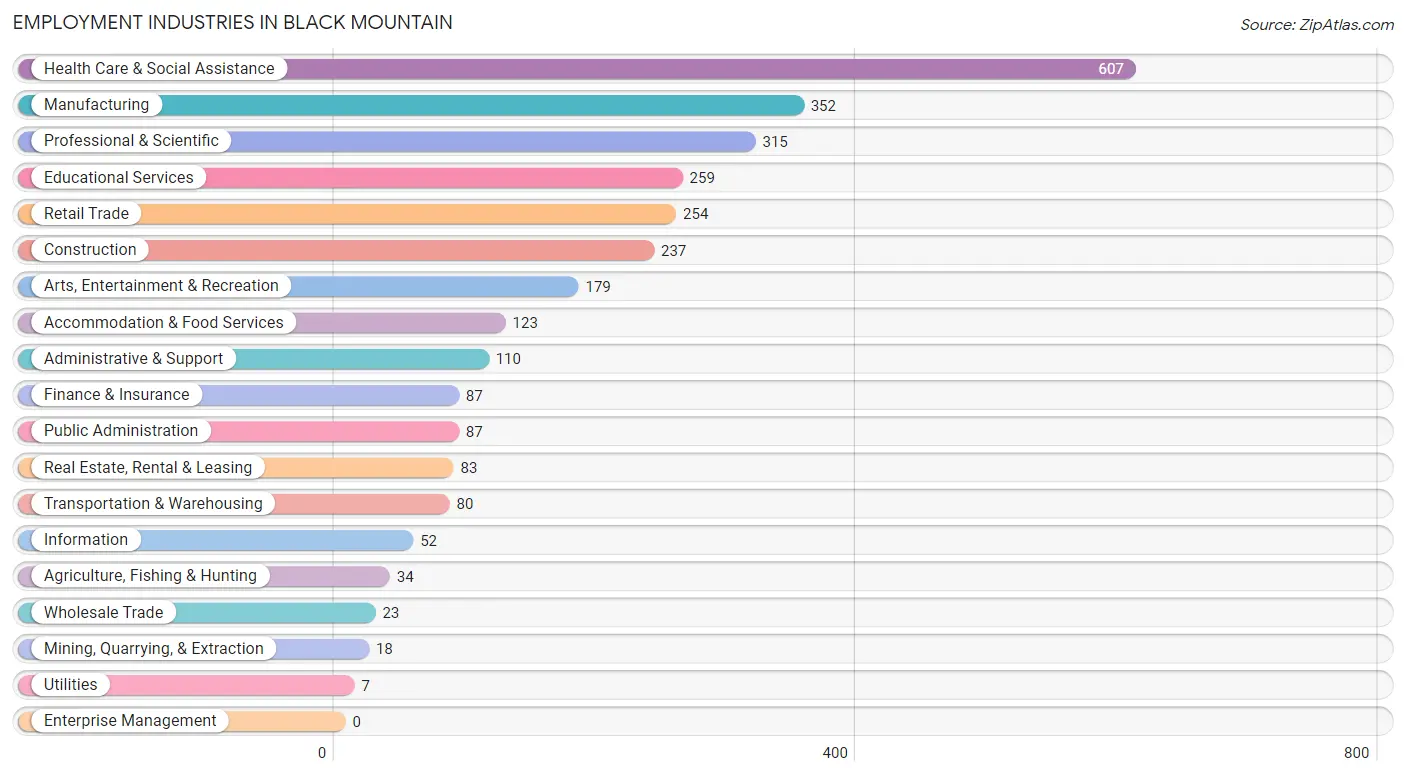
Employment Industries in Black Mountain
The major employment industries in Black Mountain include Health Care & Social Assistance (607 | 18.4%), Manufacturing (352 | 10.7%), Professional & Scientific (315 | 9.6%), Educational Services (259 | 7.9%), and Retail Trade (254 | 7.7%).
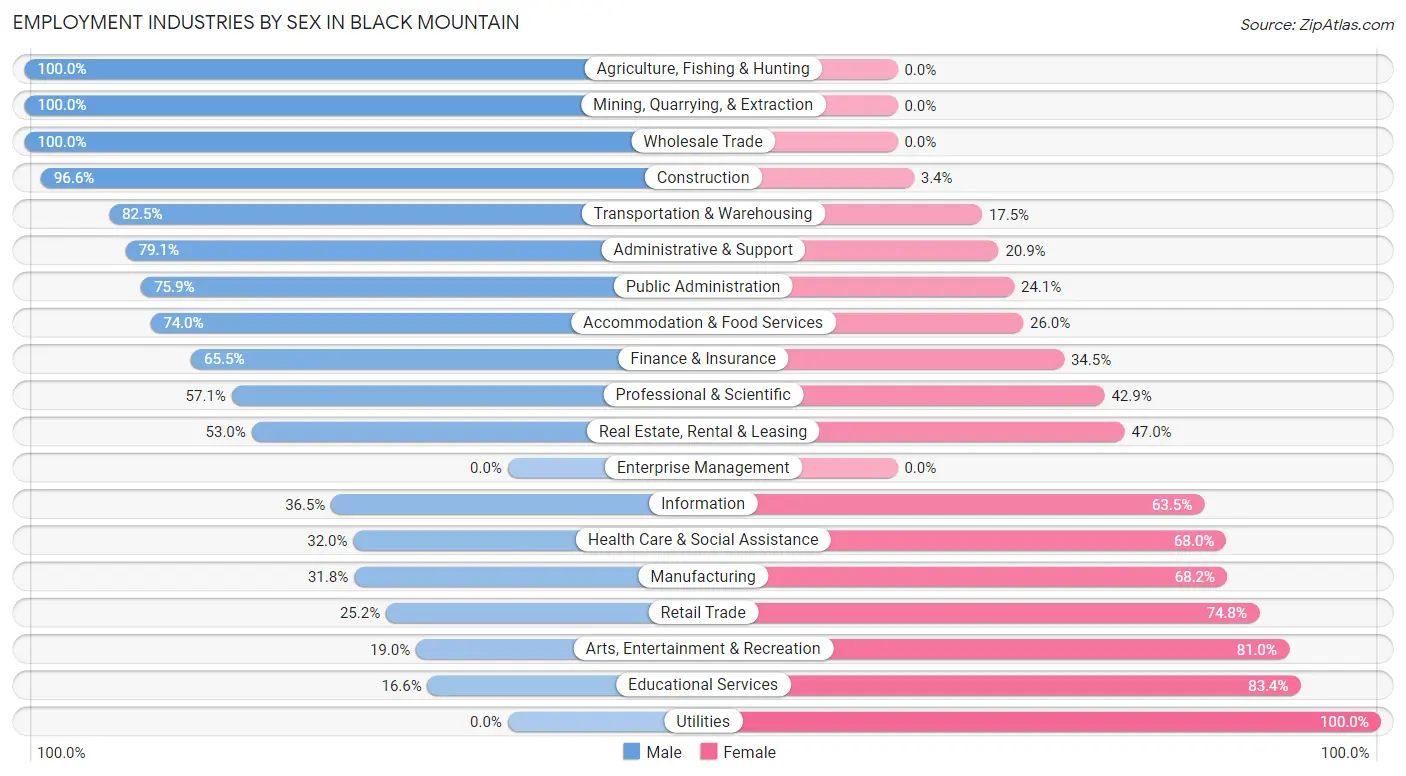
Employment Industries by Sex in Black Mountain
The Black Mountain industries that see more men than women are Agriculture, Fishing & Hunting (100.0%), Mining, Quarrying, & Extraction (100.0%), and Wholesale Trade (100.0%), whereas the industries that tend to have a higher number of women are Utilities (100.0%), Educational Services (83.4%), and Arts, Entertainment & Recreation (81.0%).
| Industry | Male | Female |
| Agriculture, Fishing & Hunting | 34 (100.0%) | 0 (0.0%) |
| Mining, Quarrying, & Extraction | 18 (100.0%) | 0 (0.0%) |
| Construction | 229 (96.6%) | 8 (3.4%) |
| Manufacturing | 112 (31.8%) | 240 (68.2%) |
| Wholesale Trade | 23 (100.0%) | 0 (0.0%) |
| Retail Trade | 64 (25.2%) | 190 (74.8%) |
| Transportation & Warehousing | 66 (82.5%) | 14 (17.5%) |
| Utilities | 0 (0.0%) | 7 (100.0%) |
| Information | 19 (36.5%) | 33 (63.5%) |
| Finance & Insurance | 57 (65.5%) | 30 (34.5%) |
| Real Estate, Rental & Leasing | 44 (53.0%) | 39 (47.0%) |
| Professional & Scientific | 180 (57.1%) | 135 (42.9%) |
| Enterprise Management | 0 (0.0%) | 0 (0.0%) |
| Administrative & Support | 87 (79.1%) | 23 (20.9%) |
| Educational Services | 43 (16.6%) | 216 (83.4%) |
| Health Care & Social Assistance | 194 (32.0%) | 413 (68.0%) |
| Arts, Entertainment & Recreation | 34 (19.0%) | 145 (81.0%) |
| Accommodation & Food Services | 91 (74.0%) | 32 (26.0%) |
| Public Administration | 66 (75.9%) | 21 (24.1%) |
| Total | 1,601 (48.7%) | 1,689 (51.3%) |
Education in Black Mountain
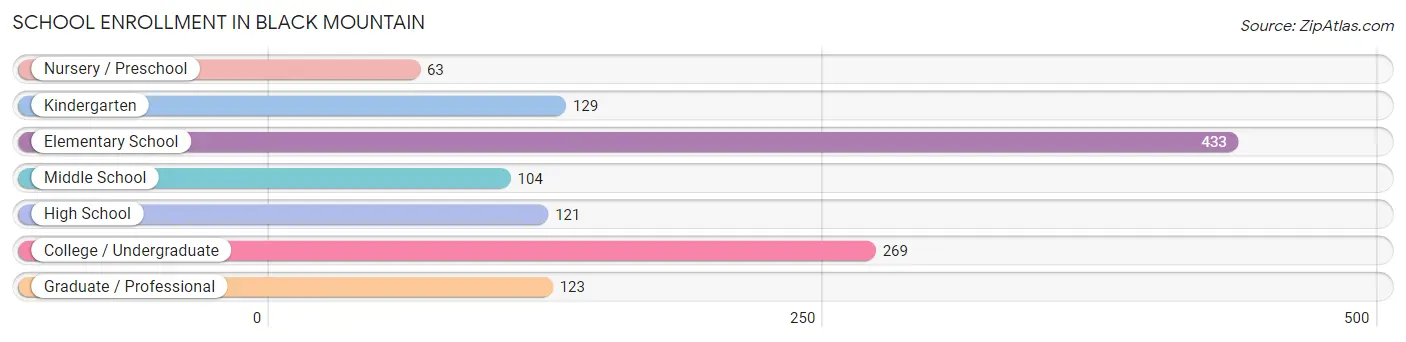
School Enrollment in Black Mountain
The most common levels of schooling among the 1,242 students in Black Mountain are elementary school (433 | 34.9%), college / undergraduate (269 | 21.7%), and kindergarten (129 | 10.4%).
| School Level | # Students | % Students |
| Nursery / Preschool | 63 | 5.1% |
| Kindergarten | 129 | 10.4% |
| Elementary School | 433 | 34.9% |
| Middle School | 104 | 8.4% |
| High School | 121 | 9.7% |
| College / Undergraduate | 269 | 21.7% |
| Graduate / Professional | 123 | 9.9% |
| Total | 1,242 | 100.0% |
School Enrollment by Age by Funding Source in Black Mountain
Out of a total of 1,242 students who are enrolled in schools in Black Mountain, 159 (12.8%) attend a private institution, while the remaining 1,083 (87.2%) are enrolled in public schools. The age group of 3 to 4 year olds has the highest likelihood of being enrolled in private schools, with 32 (100.0% in the age bracket) enrolled. Conversely, the age group of 20 to 24 year olds has the lowest likelihood of being enrolled in a private school, with 85 (100.0% in the age bracket) attending a public institution.
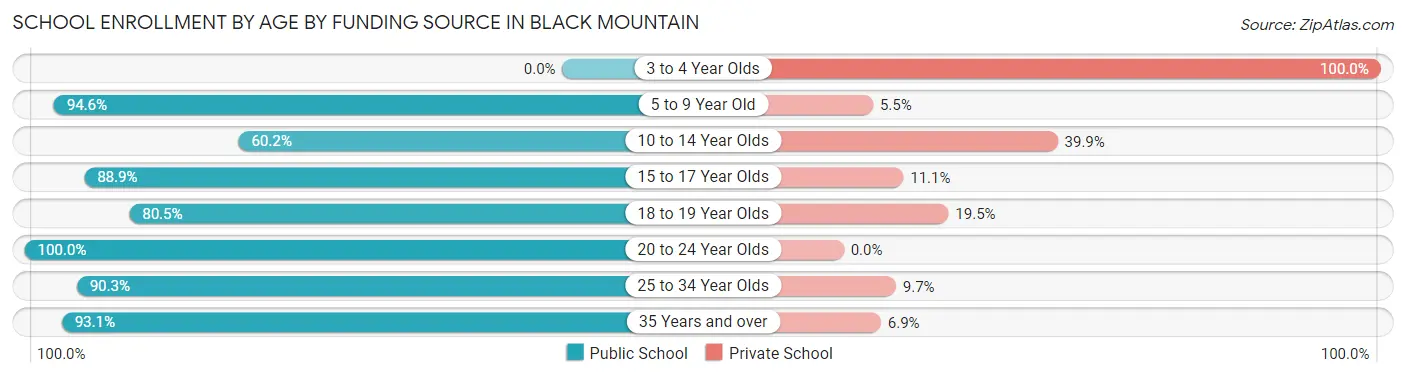
| Age Bracket | Public School | Private School |
| 3 to 4 Year Olds | 0 (0.0%) | 32 (100.0%) |
| 5 to 9 Year Old | 538 (94.6%) | 31 (5.4%) |
| 10 to 14 Year Olds | 80 (60.2%) | 53 (39.9%) |
| 15 to 17 Year Olds | 96 (88.9%) | 12 (11.1%) |
| 18 to 19 Year Olds | 33 (80.5%) | 8 (19.5%) |
| 20 to 24 Year Olds | 85 (100.0%) | 0 (0.0%) |
| 25 to 34 Year Olds | 130 (90.3%) | 14 (9.7%) |
| 35 Years and over | 121 (93.1%) | 9 (6.9%) |
| Total | 1,083 (87.2%) | 159 (12.8%) |
Educational Attainment by Field of Study in Black Mountain
Education (843 | 18.7%), business (779 | 17.3%), psychology (569 | 12.7%), visual & performing arts (386 | 8.6%), and liberal arts & history (288 | 6.4%) are the most common fields of study among 4,498 individuals in Black Mountain who have obtained a bachelor's degree or higher.
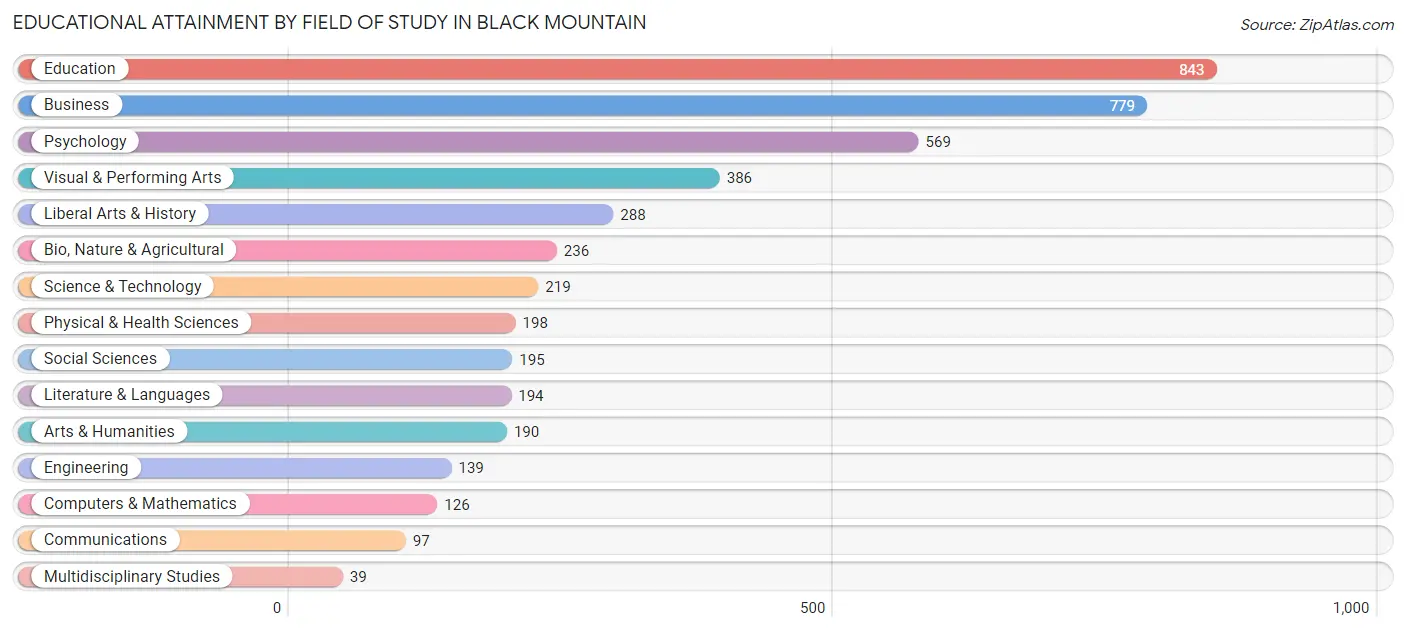
| Field of Study | # Graduates | % Graduates |
| Computers & Mathematics | 126 | 2.8% |
| Bio, Nature & Agricultural | 236 | 5.2% |
| Physical & Health Sciences | 198 | 4.4% |
| Psychology | 569 | 12.7% |
| Social Sciences | 195 | 4.3% |
| Engineering | 139 | 3.1% |
| Multidisciplinary Studies | 39 | 0.9% |
| Science & Technology | 219 | 4.9% |
| Business | 779 | 17.3% |
| Education | 843 | 18.7% |
| Literature & Languages | 194 | 4.3% |
| Liberal Arts & History | 288 | 6.4% |
| Visual & Performing Arts | 386 | 8.6% |
| Communications | 97 | 2.2% |
| Arts & Humanities | 190 | 4.2% |
| Total | 4,498 | 100.0% |
Transportation & Commute in Black Mountain
Vehicle Availability by Sex in Black Mountain
The most prevalent vehicle ownership categories in Black Mountain are males with 2 vehicles (1,105, accounting for 69.5%) and females with 2 vehicles (951, making up 65.8%).
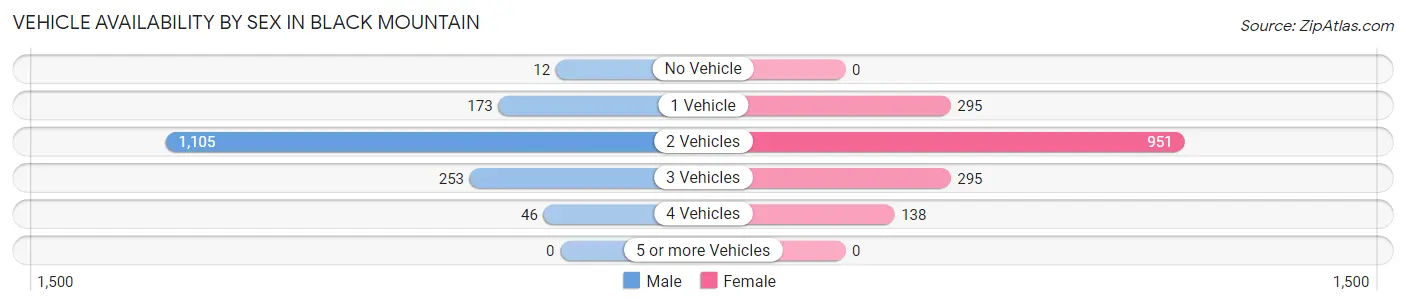
| Vehicles Available | Male | Female |
| No Vehicle | 12 (0.8%) | 0 (0.0%) |
| 1 Vehicle | 173 (10.9%) | 295 (17.6%) |
| 2 Vehicles | 1,105 (69.5%) | 951 (56.6%) |
| 3 Vehicles | 253 (15.9%) | 295 (17.6%) |
| 4 Vehicles | 46 (2.9%) | 138 (8.2%) |
| 5 or more Vehicles | 0 (0.0%) | 0 (0.0%) |
| Total | 1,589 (100.0%) | 1,679 (100.0%) |
Commute Time in Black Mountain
The most frequently occuring commute durations in Black Mountain are 5 to 9 minutes (565 commuters, 20.2%), 10 to 14 minutes (518 commuters, 18.5%), and 15 to 19 minutes (426 commuters, 15.2%).
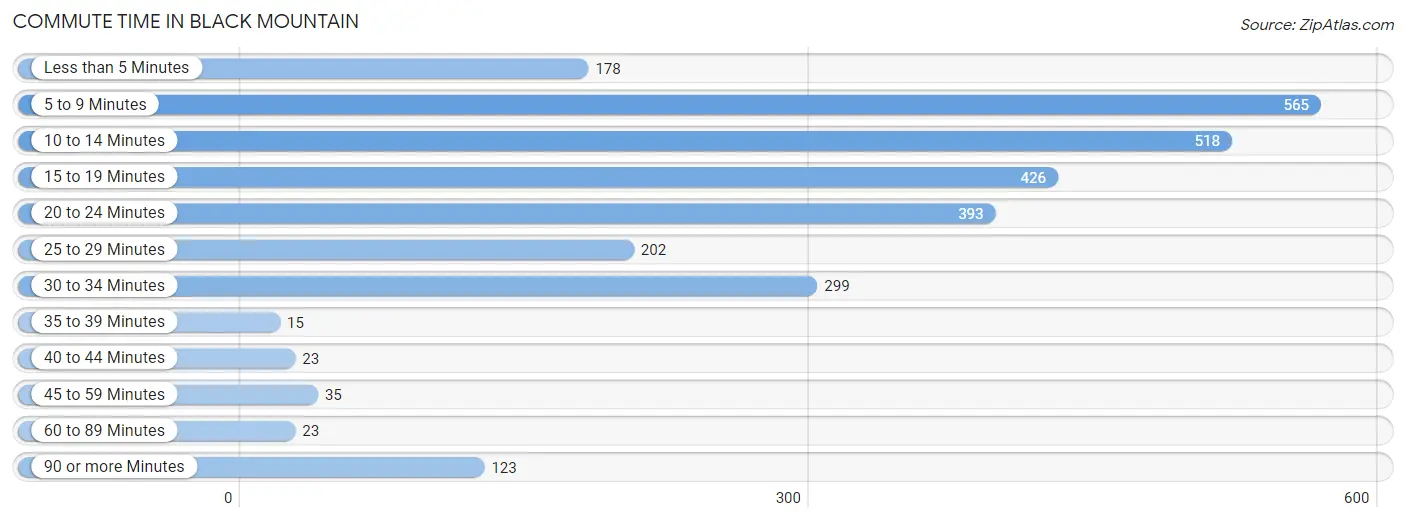
| Commute Time | # Commuters | % Commuters |
| Less than 5 Minutes | 178 | 6.4% |
| 5 to 9 Minutes | 565 | 20.2% |
| 10 to 14 Minutes | 518 | 18.5% |
| 15 to 19 Minutes | 426 | 15.2% |
| 20 to 24 Minutes | 393 | 14.0% |
| 25 to 29 Minutes | 202 | 7.2% |
| 30 to 34 Minutes | 299 | 10.7% |
| 35 to 39 Minutes | 15 | 0.5% |
| 40 to 44 Minutes | 23 | 0.8% |
| 45 to 59 Minutes | 35 | 1.3% |
| 60 to 89 Minutes | 23 | 0.8% |
| 90 or more Minutes | 123 | 4.4% |
Commute Time by Sex in Black Mountain
The most common commute times in Black Mountain are 20 to 24 minutes (256 commuters, 19.0%) for males and 5 to 9 minutes (324 commuters, 22.3%) for females.
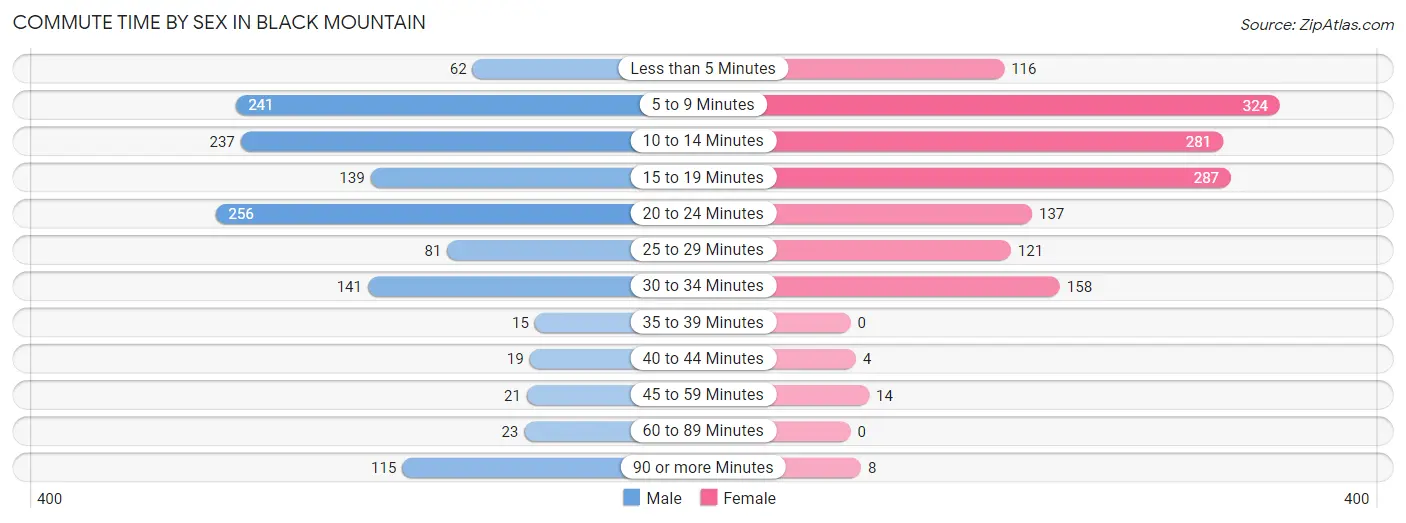
| Commute Time | Male | Female |
| Less than 5 Minutes | 62 (4.6%) | 116 (8.0%) |
| 5 to 9 Minutes | 241 (17.8%) | 324 (22.3%) |
| 10 to 14 Minutes | 237 (17.6%) | 281 (19.4%) |
| 15 to 19 Minutes | 139 (10.3%) | 287 (19.8%) |
| 20 to 24 Minutes | 256 (19.0%) | 137 (9.5%) |
| 25 to 29 Minutes | 81 (6.0%) | 121 (8.3%) |
| 30 to 34 Minutes | 141 (10.4%) | 158 (10.9%) |
| 35 to 39 Minutes | 15 (1.1%) | 0 (0.0%) |
| 40 to 44 Minutes | 19 (1.4%) | 4 (0.3%) |
| 45 to 59 Minutes | 21 (1.6%) | 14 (1.0%) |
| 60 to 89 Minutes | 23 (1.7%) | 0 (0.0%) |
| 90 or more Minutes | 115 (8.5%) | 8 (0.5%) |
Time of Departure to Work by Sex in Black Mountain
The most frequent times of departure to work in Black Mountain are 8:00 AM to 8:29 AM (277, 20.5%) for males and 7:30 AM to 7:59 AM (346, 23.9%) for females.
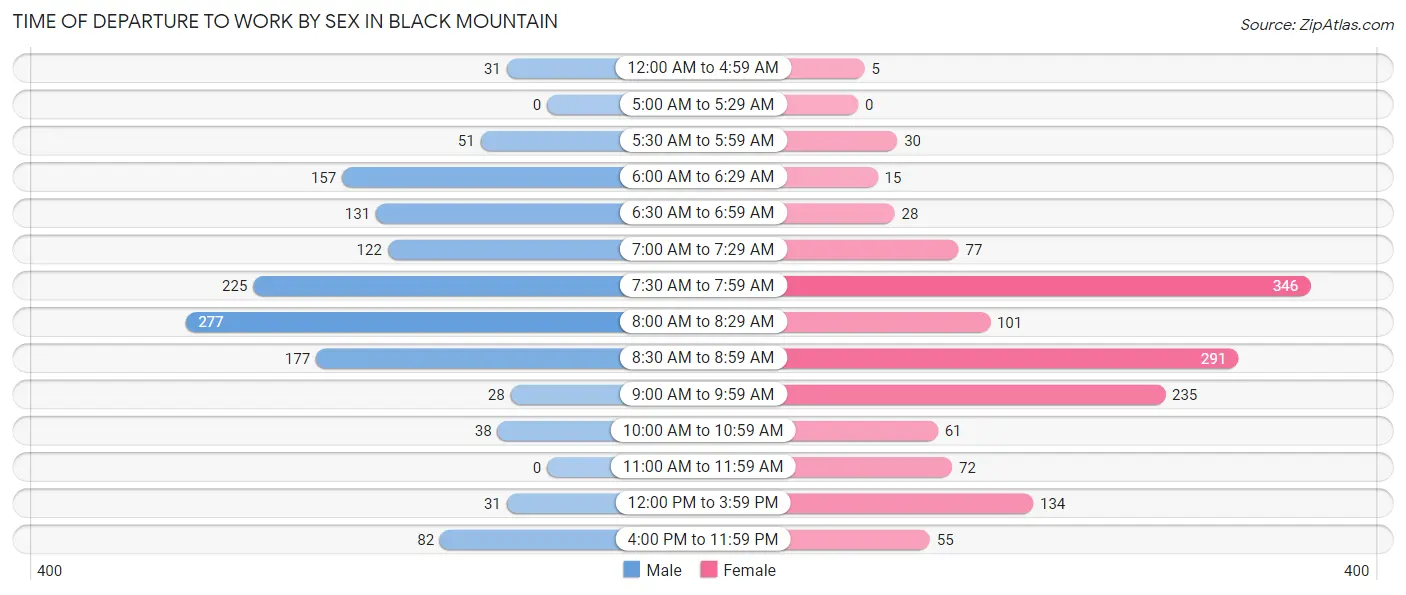
| Time of Departure | Male | Female |
| 12:00 AM to 4:59 AM | 31 (2.3%) | 5 (0.3%) |
| 5:00 AM to 5:29 AM | 0 (0.0%) | 0 (0.0%) |
| 5:30 AM to 5:59 AM | 51 (3.8%) | 30 (2.1%) |
| 6:00 AM to 6:29 AM | 157 (11.6%) | 15 (1.0%) |
| 6:30 AM to 6:59 AM | 131 (9.7%) | 28 (1.9%) |
| 7:00 AM to 7:29 AM | 122 (9.0%) | 77 (5.3%) |
| 7:30 AM to 7:59 AM | 225 (16.7%) | 346 (23.9%) |
| 8:00 AM to 8:29 AM | 277 (20.5%) | 101 (7.0%) |
| 8:30 AM to 8:59 AM | 177 (13.1%) | 291 (20.1%) |
| 9:00 AM to 9:59 AM | 28 (2.1%) | 235 (16.2%) |
| 10:00 AM to 10:59 AM | 38 (2.8%) | 61 (4.2%) |
| 11:00 AM to 11:59 AM | 0 (0.0%) | 72 (5.0%) |
| 12:00 PM to 3:59 PM | 31 (2.3%) | 134 (9.2%) |
| 4:00 PM to 11:59 PM | 82 (6.1%) | 55 (3.8%) |
| Total | 1,350 (100.0%) | 1,450 (100.0%) |
Housing Occupancy in Black Mountain
Occupancy by Ownership in Black Mountain
Of the total 3,867 dwellings in Black Mountain, owner-occupied units account for 2,444 (63.2%), while renter-occupied units make up 1,423 (36.8%).
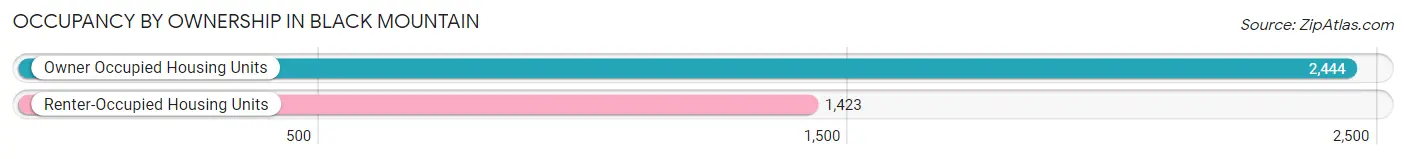
| Occupancy | # Housing Units | % Housing Units |
| Owner Occupied Housing Units | 2,444 | 63.2% |
| Renter-Occupied Housing Units | 1,423 | 36.8% |
| Total Occupied Housing Units | 3,867 | 100.0% |
Occupancy by Household Size in Black Mountain
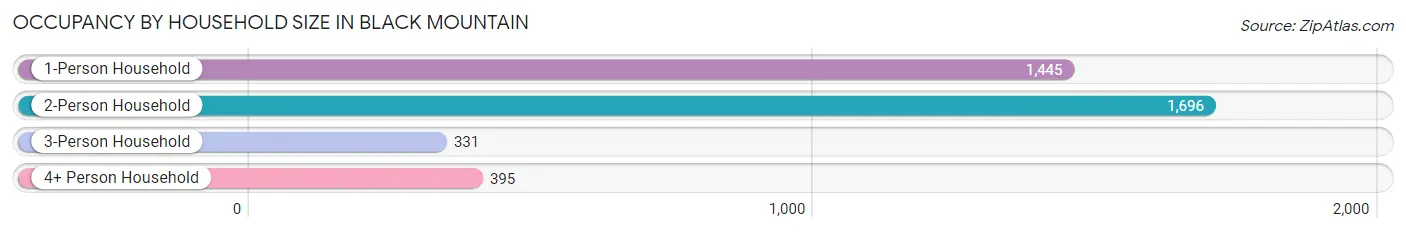
| Household Size | # Housing Units | % Housing Units |
| 1-Person Household | 1,445 | 37.4% |
| 2-Person Household | 1,696 | 43.9% |
| 3-Person Household | 331 | 8.6% |
| 4+ Person Household | 395 | 10.2% |
| Total Housing Units | 3,867 | 100.0% |
Occupancy by Ownership by Household Size in Black Mountain
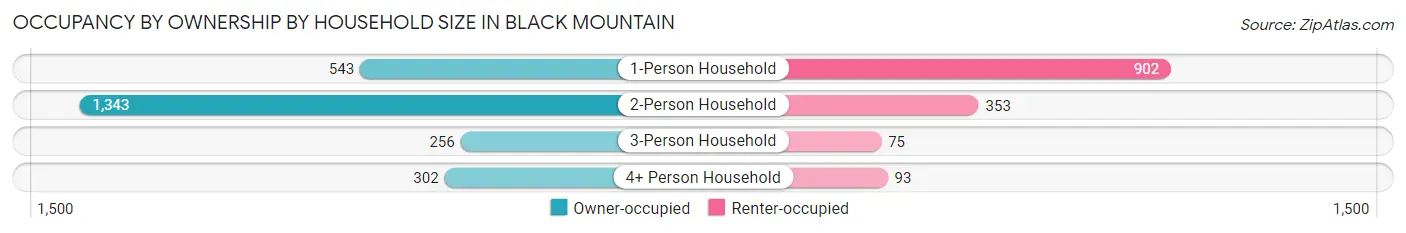
| Household Size | Owner-occupied | Renter-occupied |
| 1-Person Household | 543 (37.6%) | 902 (62.4%) |
| 2-Person Household | 1,343 (79.2%) | 353 (20.8%) |
| 3-Person Household | 256 (77.3%) | 75 (22.7%) |
| 4+ Person Household | 302 (76.5%) | 93 (23.5%) |
| Total Housing Units | 2,444 (63.2%) | 1,423 (36.8%) |
Occupancy by Educational Attainment in Black Mountain
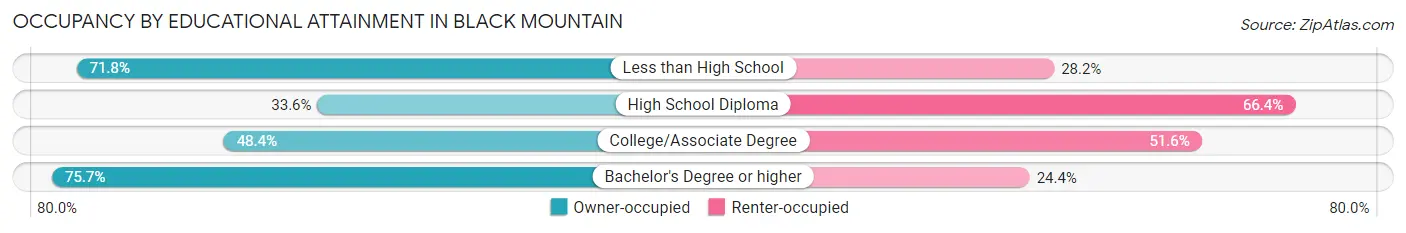
| Household Size | Owner-occupied | Renter-occupied |
| Less than High School | 155 (71.8%) | 61 (28.2%) |
| High School Diploma | 247 (33.6%) | 489 (66.4%) |
| College/Associate Degree | 290 (48.4%) | 309 (51.6%) |
| Bachelor's Degree or higher | 1,752 (75.6%) | 564 (24.3%) |
Occupancy by Age of Householder in Black Mountain
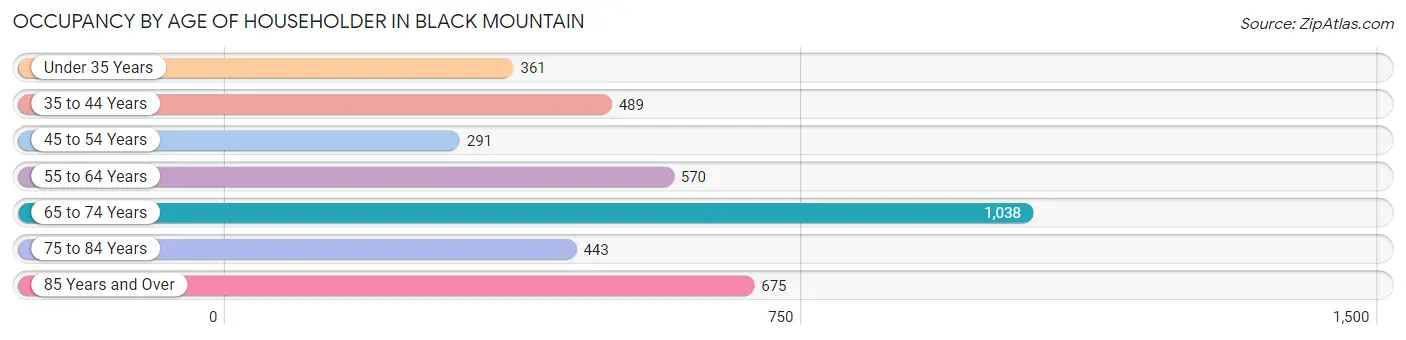
| Age Bracket | # Households | % Households |
| Under 35 Years | 361 | 9.3% |
| 35 to 44 Years | 489 | 12.7% |
| 45 to 54 Years | 291 | 7.5% |
| 55 to 64 Years | 570 | 14.7% |
| 65 to 74 Years | 1,038 | 26.8% |
| 75 to 84 Years | 443 | 11.5% |
| 85 Years and Over | 675 | 17.5% |
| Total | 3,867 | 100.0% |
Housing Finances in Black Mountain
Median Income by Occupancy in Black Mountain
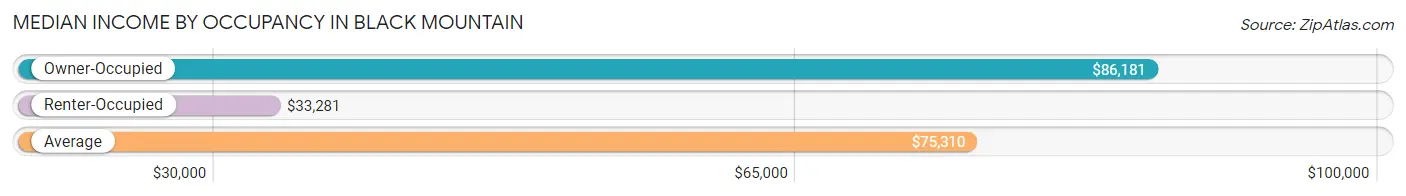
| Occupancy Type | # Households | Median Income |
| Owner-Occupied | 2,444 (63.2%) | $86,181 |
| Renter-Occupied | 1,423 (36.8%) | $33,281 |
| Average | 3,867 (100.0%) | $75,310 |
Occupancy by Householder Income Bracket in Black Mountain
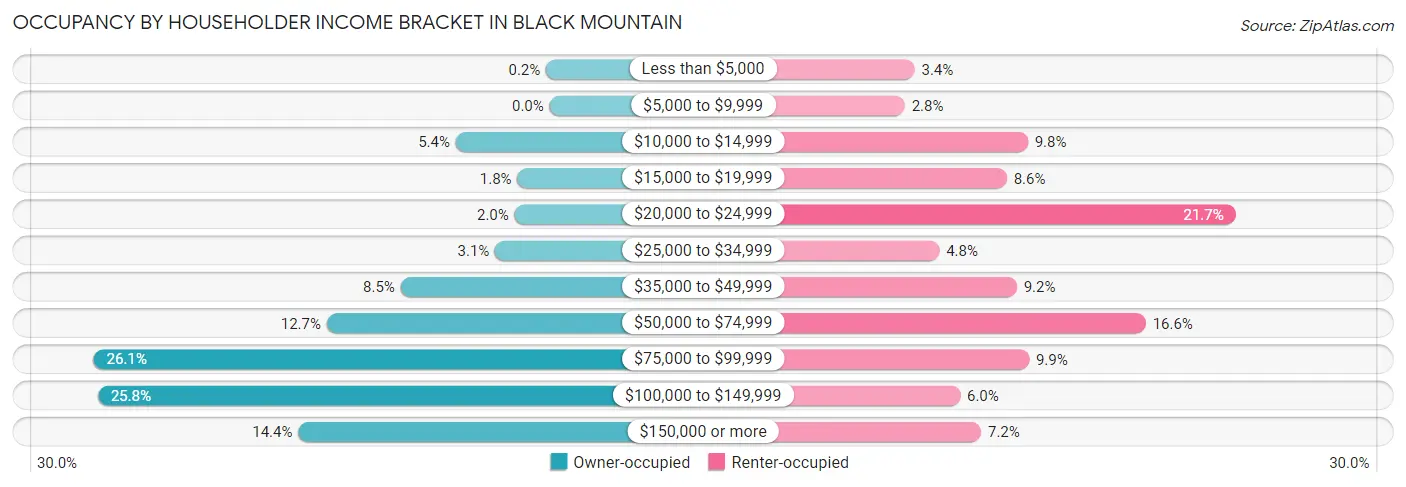
| Income Bracket | Owner-occupied | Renter-occupied |
| Less than $5,000 | 5 (0.2%) | 48 (3.4%) |
| $5,000 to $9,999 | 0 (0.0%) | 40 (2.8%) |
| $10,000 to $14,999 | 131 (5.4%) | 140 (9.8%) |
| $15,000 to $19,999 | 45 (1.8%) | 123 (8.6%) |
| $20,000 to $24,999 | 49 (2.0%) | 309 (21.7%) |
| $25,000 to $34,999 | 76 (3.1%) | 68 (4.8%) |
| $35,000 to $49,999 | 208 (8.5%) | 131 (9.2%) |
| $50,000 to $74,999 | 311 (12.7%) | 236 (16.6%) |
| $75,000 to $99,999 | 637 (26.1%) | 141 (9.9%) |
| $100,000 to $149,999 | 631 (25.8%) | 85 (6.0%) |
| $150,000 or more | 351 (14.4%) | 102 (7.2%) |
| Total | 2,444 (100.0%) | 1,423 (100.0%) |
Monthly Housing Cost Tiers in Black Mountain
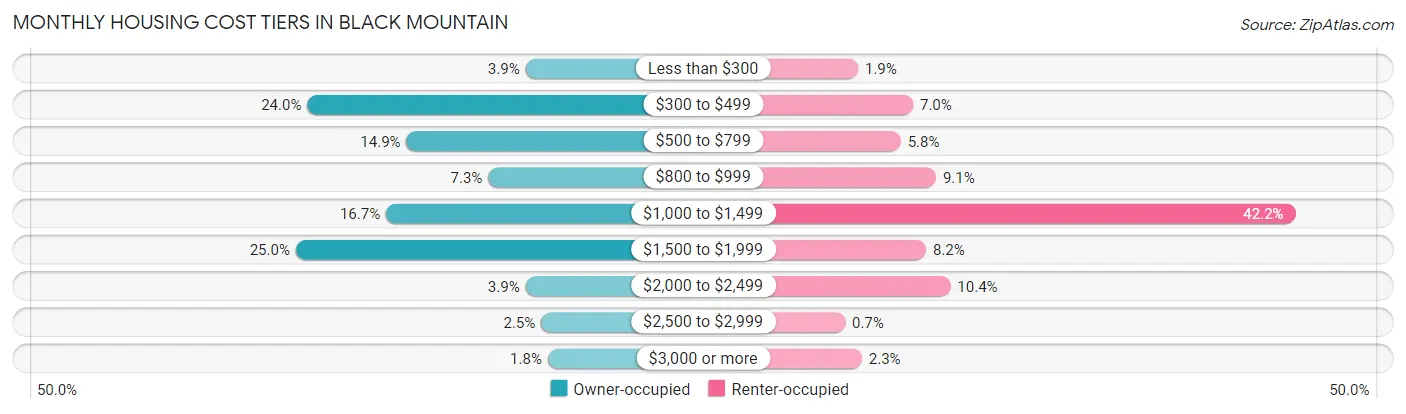
| Monthly Cost | Owner-occupied | Renter-occupied |
| Less than $300 | 95 (3.9%) | 27 (1.9%) |
| $300 to $499 | 586 (24.0%) | 99 (7.0%) |
| $500 to $799 | 363 (14.8%) | 83 (5.8%) |
| $800 to $999 | 179 (7.3%) | 129 (9.1%) |
| $1,000 to $1,499 | 409 (16.7%) | 600 (42.2%) |
| $1,500 to $1,999 | 612 (25.0%) | 116 (8.2%) |
| $2,000 to $2,499 | 95 (3.9%) | 148 (10.4%) |
| $2,500 to $2,999 | 60 (2.5%) | 10 (0.7%) |
| $3,000 or more | 45 (1.8%) | 32 (2.2%) |
| Total | 2,444 (100.0%) | 1,423 (100.0%) |
Physical Housing Characteristics in Black Mountain
Housing Structures in Black Mountain
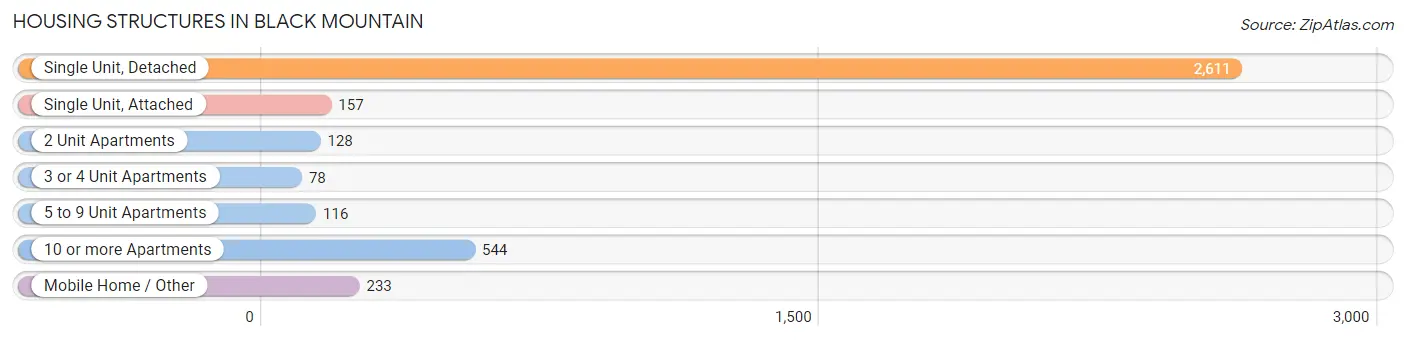
| Structure Type | # Housing Units | % Housing Units |
| Single Unit, Detached | 2,611 | 67.5% |
| Single Unit, Attached | 157 | 4.1% |
| 2 Unit Apartments | 128 | 3.3% |
| 3 or 4 Unit Apartments | 78 | 2.0% |
| 5 to 9 Unit Apartments | 116 | 3.0% |
| 10 or more Apartments | 544 | 14.1% |
| Mobile Home / Other | 233 | 6.0% |
| Total | 3,867 | 100.0% |
Housing Structures by Occupancy in Black Mountain
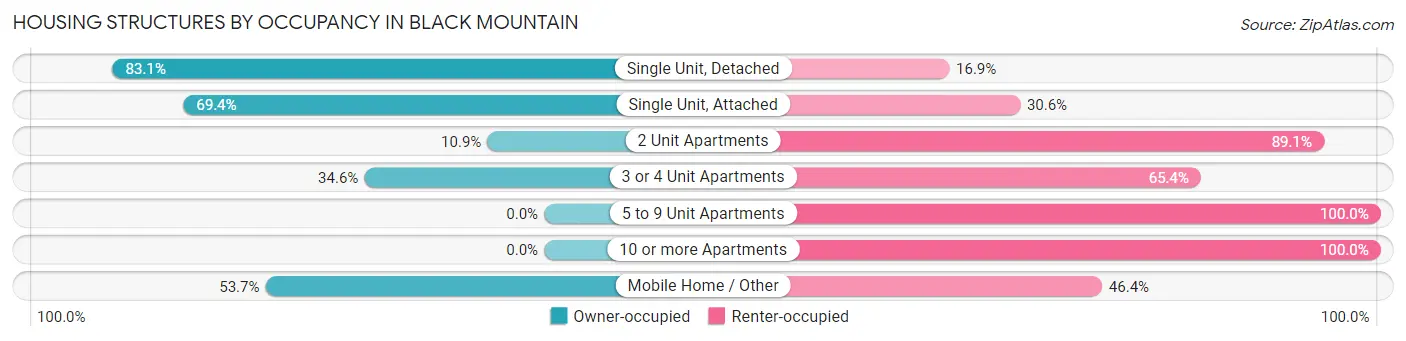
| Structure Type | Owner-occupied | Renter-occupied |
| Single Unit, Detached | 2,169 (83.1%) | 442 (16.9%) |
| Single Unit, Attached | 109 (69.4%) | 48 (30.6%) |
| 2 Unit Apartments | 14 (10.9%) | 114 (89.1%) |
| 3 or 4 Unit Apartments | 27 (34.6%) | 51 (65.4%) |
| 5 to 9 Unit Apartments | 0 (0.0%) | 116 (100.0%) |
| 10 or more Apartments | 0 (0.0%) | 544 (100.0%) |
| Mobile Home / Other | 125 (53.6%) | 108 (46.4%) |
| Total | 2,444 (63.2%) | 1,423 (36.8%) |
Housing Structures by Number of Rooms in Black Mountain
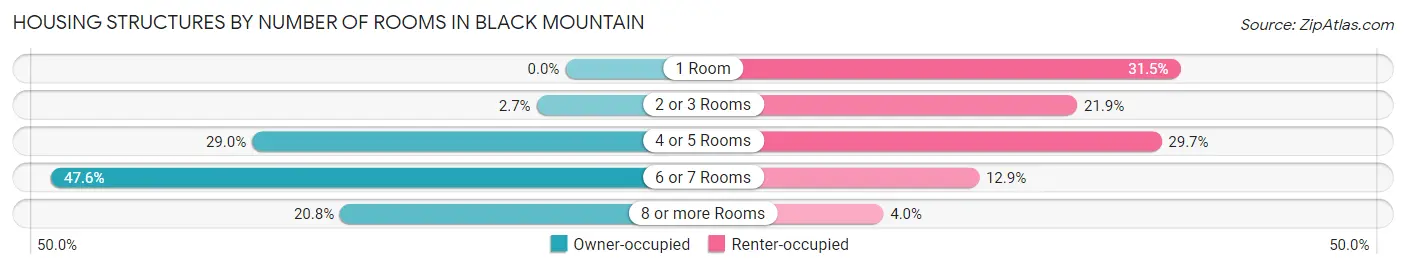
| Number of Rooms | Owner-occupied | Renter-occupied |
| 1 Room | 0 (0.0%) | 448 (31.5%) |
| 2 or 3 Rooms | 65 (2.7%) | 312 (21.9%) |
| 4 or 5 Rooms | 708 (29.0%) | 423 (29.7%) |
| 6 or 7 Rooms | 1,162 (47.5%) | 183 (12.9%) |
| 8 or more Rooms | 509 (20.8%) | 57 (4.0%) |
| Total | 2,444 (100.0%) | 1,423 (100.0%) |
Housing Structure by Heating Type in Black Mountain
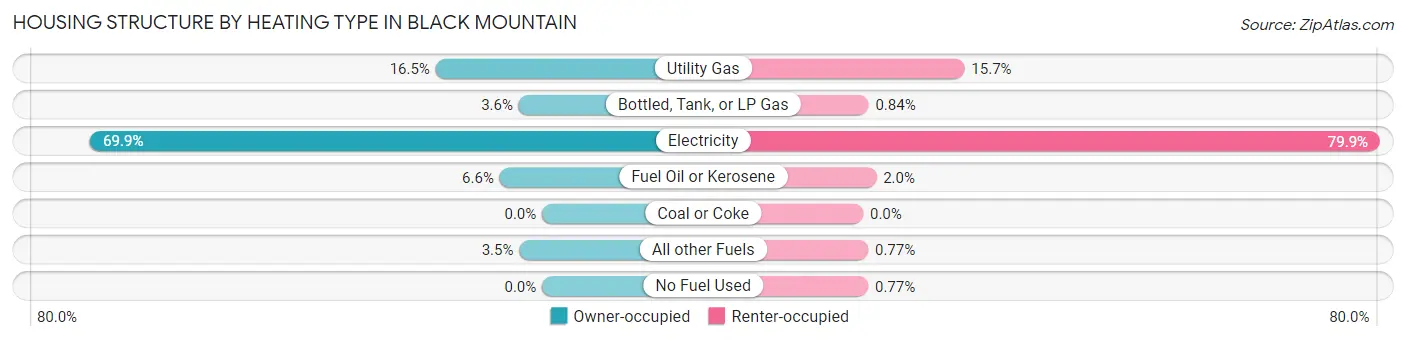
| Heating Type | Owner-occupied | Renter-occupied |
| Utility Gas | 402 (16.5%) | 223 (15.7%) |
| Bottled, Tank, or LP Gas | 88 (3.6%) | 12 (0.8%) |
| Electricity | 1,708 (69.9%) | 1,137 (79.9%) |
| Fuel Oil or Kerosene | 160 (6.6%) | 29 (2.0%) |
| Coal or Coke | 0 (0.0%) | 0 (0.0%) |
| All other Fuels | 86 (3.5%) | 11 (0.8%) |
| No Fuel Used | 0 (0.0%) | 11 (0.8%) |
| Total | 2,444 (100.0%) | 1,423 (100.0%) |
Household Vehicle Usage in Black Mountain
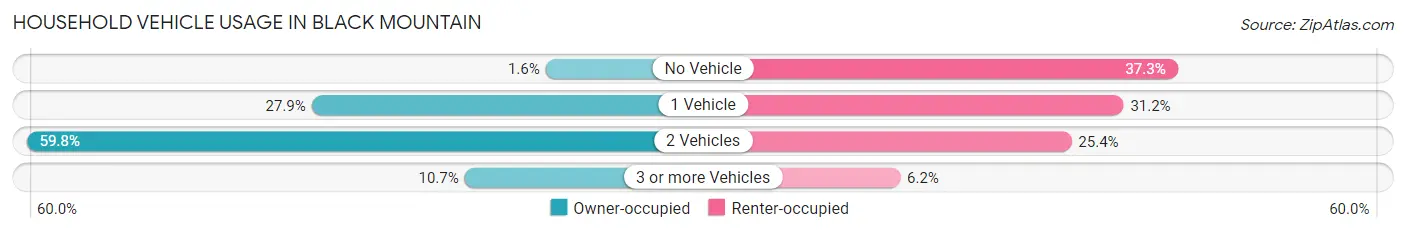
| Vehicles per Household | Owner-occupied | Renter-occupied |
| No Vehicle | 40 (1.6%) | 530 (37.2%) |
| 1 Vehicle | 681 (27.9%) | 444 (31.2%) |
| 2 Vehicles | 1,461 (59.8%) | 361 (25.4%) |
| 3 or more Vehicles | 262 (10.7%) | 88 (6.2%) |
| Total | 2,444 (100.0%) | 1,423 (100.0%) |
Real Estate & Mortgages in Black Mountain
Real Estate and Mortgage Overview in Black Mountain
| Characteristic | Without Mortgage | With Mortgage |
| Housing Units | 1,086 | 1,358 |
| Median Property Value | $350,000 | $291,300 |
| Median Household Income | $82,766 | $150 |
| Monthly Housing Costs | $454 | $45 |
| Real Estate Taxes | $2,404 | $12 |
Property Value by Mortgage Status in Black Mountain
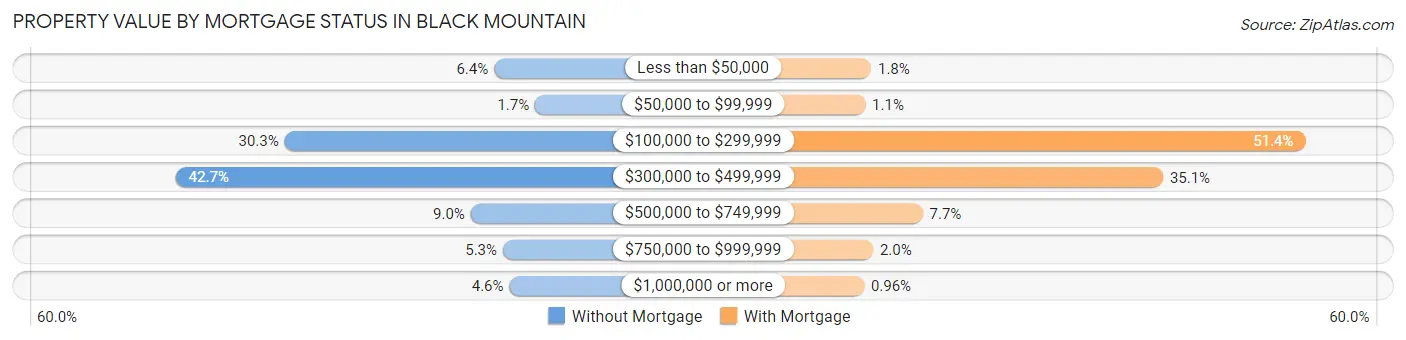
| Property Value | Without Mortgage | With Mortgage |
| Less than $50,000 | 69 (6.4%) | 24 (1.8%) |
| $50,000 to $99,999 | 18 (1.7%) | 15 (1.1%) |
| $100,000 to $299,999 | 329 (30.3%) | 698 (51.4%) |
| $300,000 to $499,999 | 464 (42.7%) | 477 (35.1%) |
| $500,000 to $749,999 | 98 (9.0%) | 104 (7.7%) |
| $750,000 to $999,999 | 58 (5.3%) | 27 (2.0%) |
| $1,000,000 or more | 50 (4.6%) | 13 (1.0%) |
| Total | 1,086 (100.0%) | 1,358 (100.0%) |
Household Income by Mortgage Status in Black Mountain
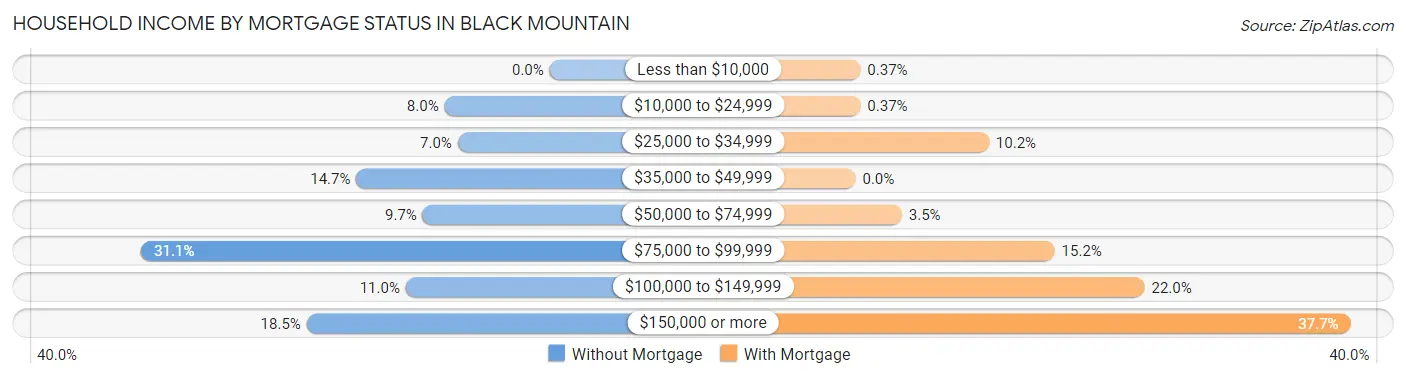
| Household Income | Without Mortgage | With Mortgage |
| Less than $10,000 | 0 (0.0%) | 5 (0.4%) |
| $10,000 to $24,999 | 87 (8.0%) | 5 (0.4%) |
| $25,000 to $34,999 | 76 (7.0%) | 138 (10.2%) |
| $35,000 to $49,999 | 160 (14.7%) | 0 (0.0%) |
| $50,000 to $74,999 | 105 (9.7%) | 48 (3.5%) |
| $75,000 to $99,999 | 338 (31.1%) | 206 (15.2%) |
| $100,000 to $149,999 | 119 (11.0%) | 299 (22.0%) |
| $150,000 or more | 201 (18.5%) | 512 (37.7%) |
| Total | 1,086 (100.0%) | 1,358 (100.0%) |
Property Value to Household Income Ratio in Black Mountain
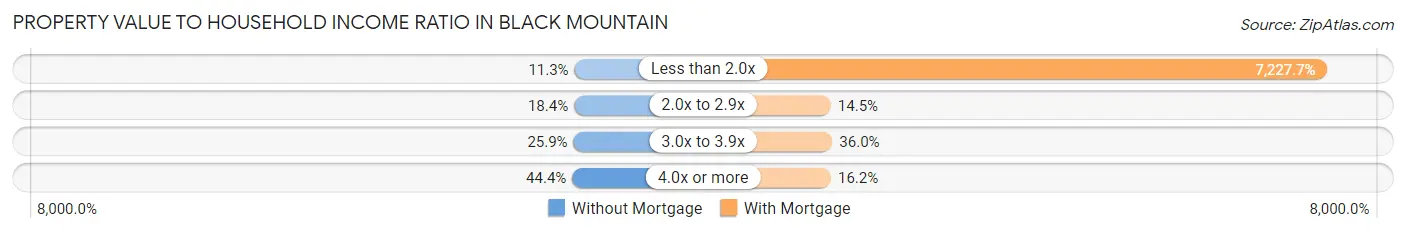
| Value-to-Income Ratio | Without Mortgage | With Mortgage |
| Less than 2.0x | 123 (11.3%) | 98,152 (7,227.7%) |
| 2.0x to 2.9x | 200 (18.4%) | 197 (14.5%) |
| 3.0x to 3.9x | 281 (25.9%) | 489 (36.0%) |
| 4.0x or more | 482 (44.4%) | 220 (16.2%) |
| Total | 1,086 (100.0%) | 1,358 (100.0%) |
Real Estate Taxes by Mortgage Status in Black Mountain
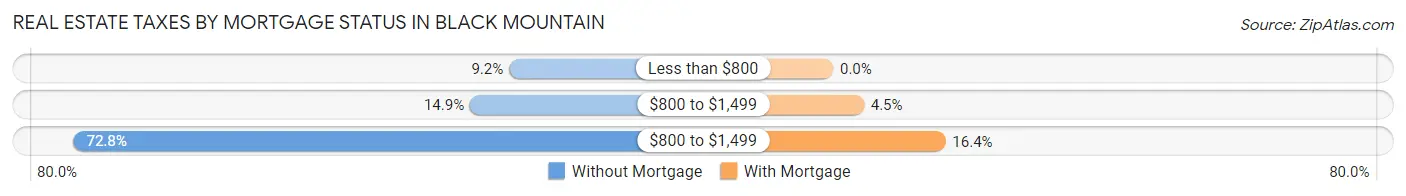
| Property Taxes | Without Mortgage | With Mortgage |
| Less than $800 | 100 (9.2%) | 0 (0.0%) |
| $800 to $1,499 | 162 (14.9%) | 61 (4.5%) |
| $800 to $1,499 | 791 (72.8%) | 223 (16.4%) |
| Total | 1,086 (100.0%) | 1,358 (100.0%) |
Health & Disability in Black Mountain
Health Insurance Coverage by Age in Black Mountain
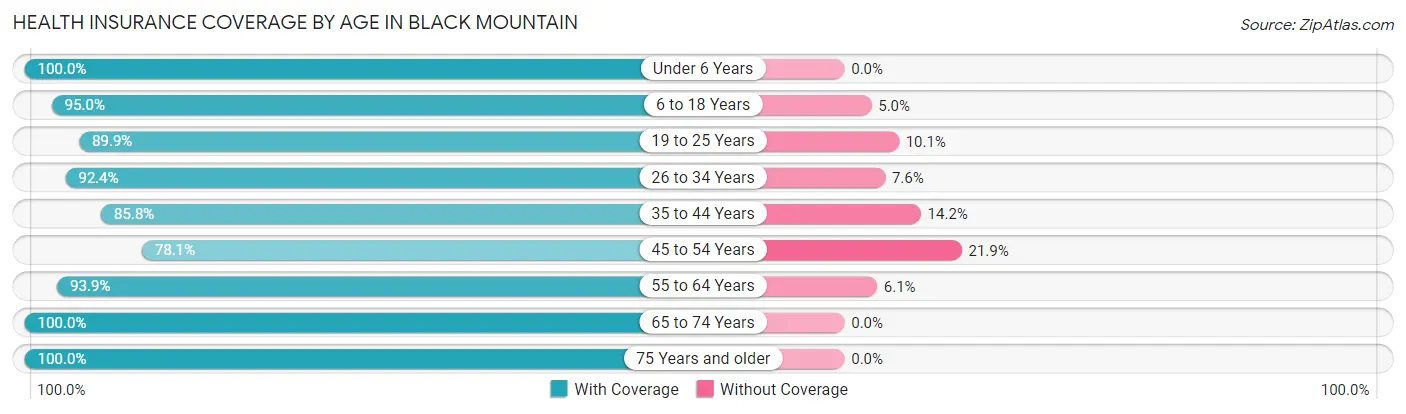
| Age Bracket | With Coverage | Without Coverage |
| Under 6 Years | 322 (100.0%) | 0 (0.0%) |
| 6 to 18 Years | 755 (95.0%) | 40 (5.0%) |
| 19 to 25 Years | 186 (89.9%) | 21 (10.1%) |
| 26 to 34 Years | 597 (92.4%) | 49 (7.6%) |
| 35 to 44 Years | 813 (85.8%) | 135 (14.2%) |
| 45 to 54 Years | 661 (78.1%) | 185 (21.9%) |
| 55 to 64 Years | 1,268 (93.9%) | 82 (6.1%) |
| 65 to 74 Years | 1,419 (100.0%) | 0 (0.0%) |
| 75 Years and older | 1,660 (100.0%) | 0 (0.0%) |
| Total | 7,681 (93.8%) | 512 (6.2%) |
Health Insurance Coverage by Citizenship Status in Black Mountain
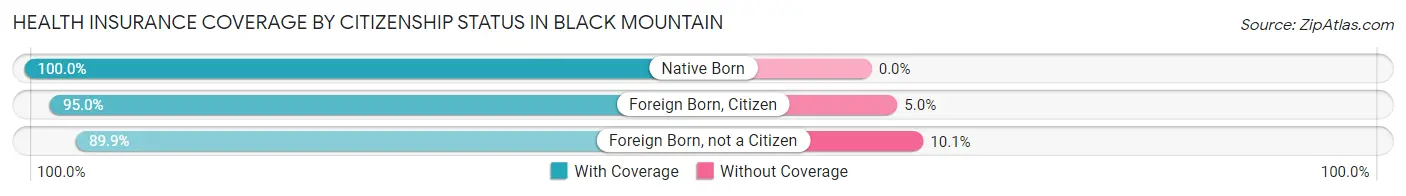
| Citizenship Status | With Coverage | Without Coverage |
| Native Born | 322 (100.0%) | 0 (0.0%) |
| Foreign Born, Citizen | 755 (95.0%) | 40 (5.0%) |
| Foreign Born, not a Citizen | 186 (89.9%) | 21 (10.1%) |
Health Insurance Coverage by Household Income in Black Mountain
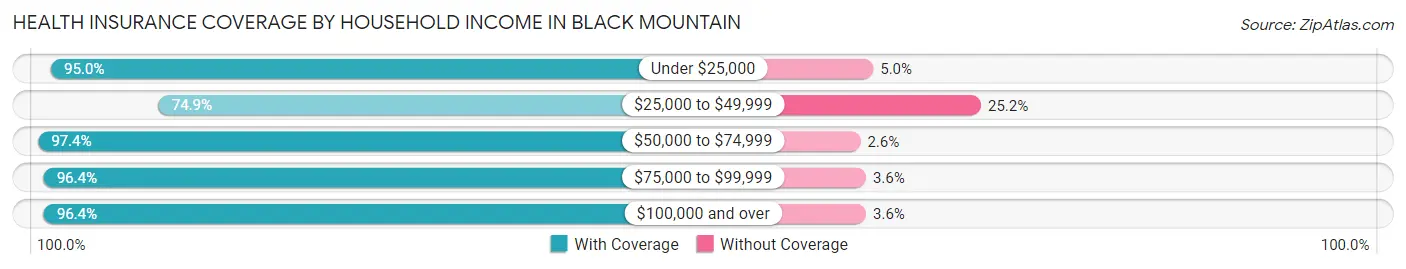
| Household Income | With Coverage | Without Coverage |
| Under $25,000 | 958 (95.0%) | 50 (5.0%) |
| $25,000 to $49,999 | 726 (74.9%) | 244 (25.2%) |
| $50,000 to $74,999 | 1,143 (97.4%) | 30 (2.6%) |
| $75,000 to $99,999 | 2,310 (96.4%) | 86 (3.6%) |
| $100,000 and over | 2,533 (96.4%) | 95 (3.6%) |
Public vs Private Health Insurance Coverage by Age in Black Mountain
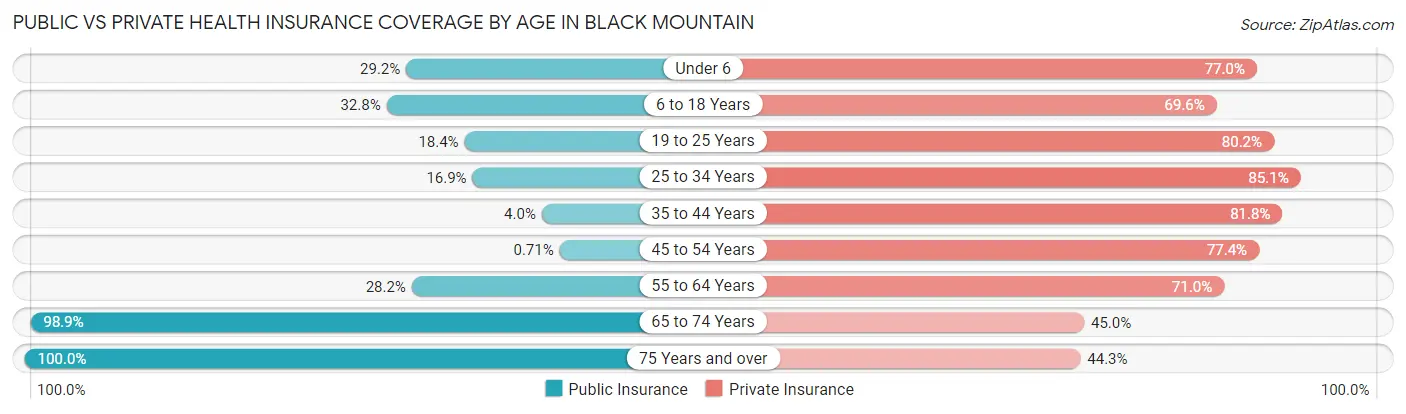
| Age Bracket | Public Insurance | Private Insurance |
| Under 6 | 94 (29.2%) | 248 (77.0%) |
| 6 to 18 Years | 261 (32.8%) | 553 (69.6%) |
| 19 to 25 Years | 38 (18.4%) | 166 (80.2%) |
| 25 to 34 Years | 109 (16.9%) | 550 (85.1%) |
| 35 to 44 Years | 38 (4.0%) | 775 (81.8%) |
| 45 to 54 Years | 6 (0.7%) | 655 (77.4%) |
| 55 to 64 Years | 380 (28.1%) | 958 (71.0%) |
| 65 to 74 Years | 1,404 (98.9%) | 638 (45.0%) |
| 75 Years and over | 1,660 (100.0%) | 735 (44.3%) |
| Total | 3,990 (48.7%) | 5,278 (64.4%) |
Disability Status by Sex by Age in Black Mountain
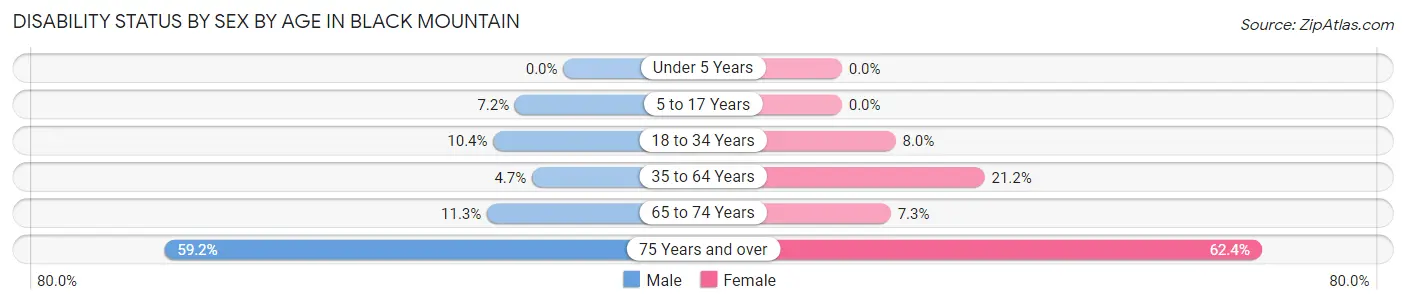
| Age Bracket | Male | Female |
| Under 5 Years | 0 (0.0%) | 0 (0.0%) |
| 5 to 17 Years | 35 (7.2%) | 0 (0.0%) |
| 18 to 34 Years | 40 (10.4%) | 38 (8.0%) |
| 35 to 64 Years | 64 (4.6%) | 375 (21.2%) |
| 65 to 74 Years | 53 (11.3%) | 69 (7.3%) |
| 75 Years and over | 343 (59.2%) | 674 (62.4%) |
Disability Class by Sex by Age in Black Mountain
Disability Class: Hearing Difficulty
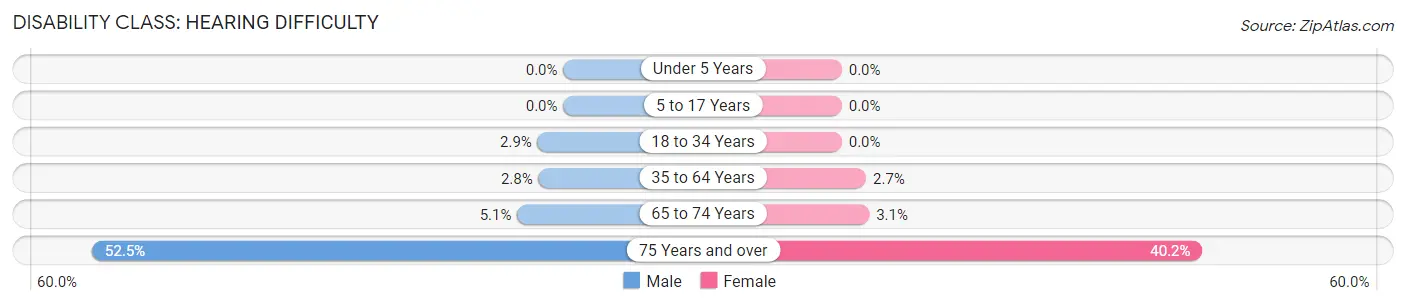
| Age Bracket | Male | Female |
| Under 5 Years | 0 (0.0%) | 0 (0.0%) |
| 5 to 17 Years | 0 (0.0%) | 0 (0.0%) |
| 18 to 34 Years | 11 (2.9%) | 0 (0.0%) |
| 35 to 64 Years | 38 (2.8%) | 48 (2.7%) |
| 65 to 74 Years | 24 (5.1%) | 29 (3.0%) |
| 75 Years and over | 304 (52.5%) | 434 (40.2%) |
Disability Class: Vision Difficulty
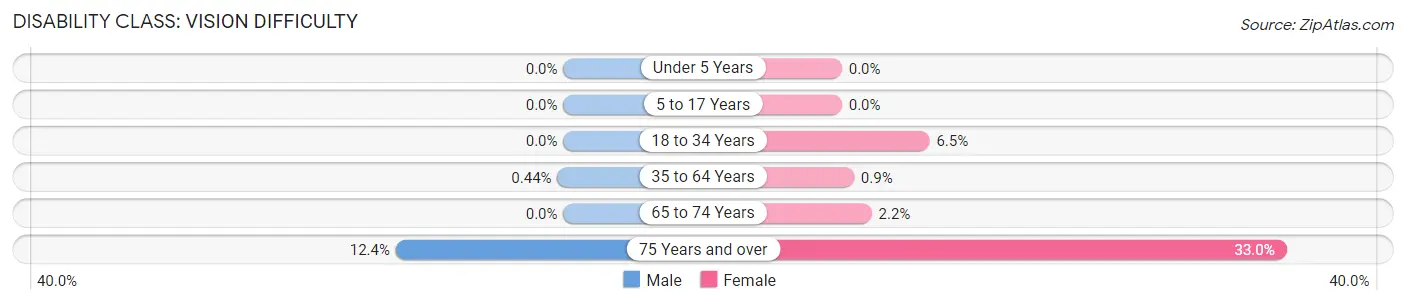
| Age Bracket | Male | Female |
| Under 5 Years | 0 (0.0%) | 0 (0.0%) |
| 5 to 17 Years | 0 (0.0%) | 0 (0.0%) |
| 18 to 34 Years | 0 (0.0%) | 31 (6.5%) |
| 35 to 64 Years | 6 (0.4%) | 16 (0.9%) |
| 65 to 74 Years | 0 (0.0%) | 21 (2.2%) |
| 75 Years and over | 72 (12.4%) | 357 (33.0%) |
Disability Class: Cognitive Difficulty
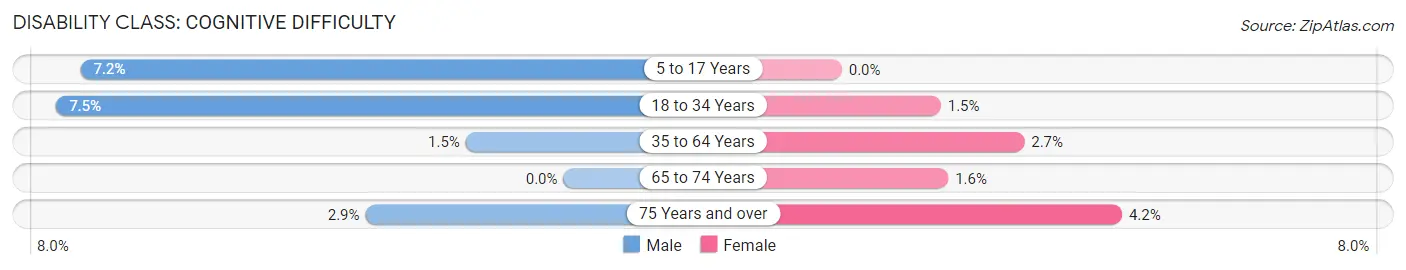
| Age Bracket | Male | Female |
| 5 to 17 Years | 35 (7.2%) | 0 (0.0%) |
| 18 to 34 Years | 29 (7.5%) | 7 (1.5%) |
| 35 to 64 Years | 20 (1.5%) | 48 (2.7%) |
| 65 to 74 Years | 0 (0.0%) | 15 (1.6%) |
| 75 Years and over | 17 (2.9%) | 45 (4.2%) |
Disability Class: Ambulatory Difficulty
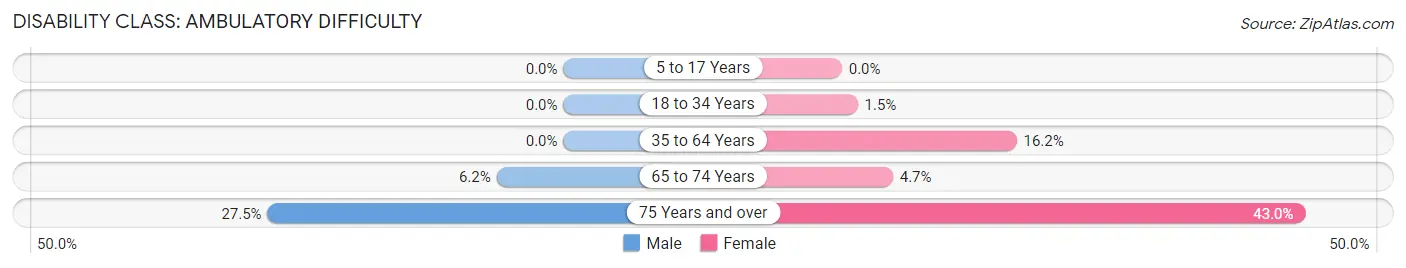
| Age Bracket | Male | Female |
| 5 to 17 Years | 0 (0.0%) | 0 (0.0%) |
| 18 to 34 Years | 0 (0.0%) | 7 (1.5%) |
| 35 to 64 Years | 0 (0.0%) | 287 (16.2%) |
| 65 to 74 Years | 29 (6.2%) | 45 (4.7%) |
| 75 Years and over | 159 (27.5%) | 465 (43.0%) |
Disability Class: Self-Care Difficulty
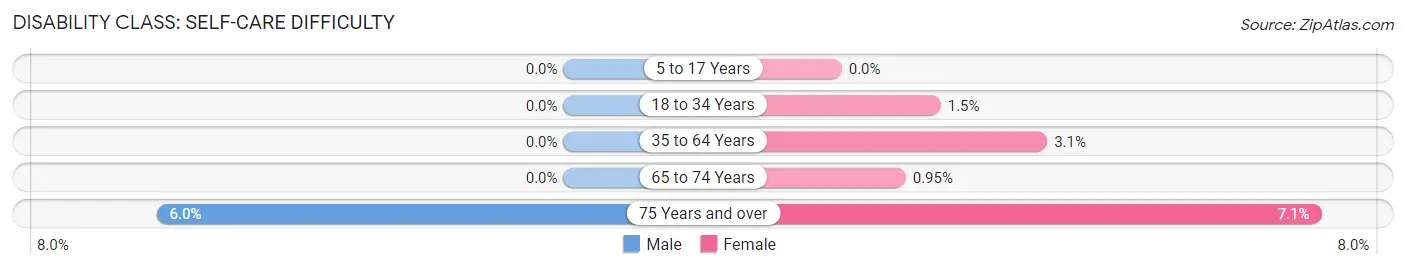
| Age Bracket | Male | Female |
| 5 to 17 Years | 0 (0.0%) | 0 (0.0%) |
| 18 to 34 Years | 0 (0.0%) | 7 (1.5%) |
| 35 to 64 Years | 0 (0.0%) | 54 (3.0%) |
| 65 to 74 Years | 0 (0.0%) | 9 (0.9%) |
| 75 Years and over | 35 (6.0%) | 77 (7.1%) |
Technology Access in Black Mountain
Computing Device Access in Black Mountain
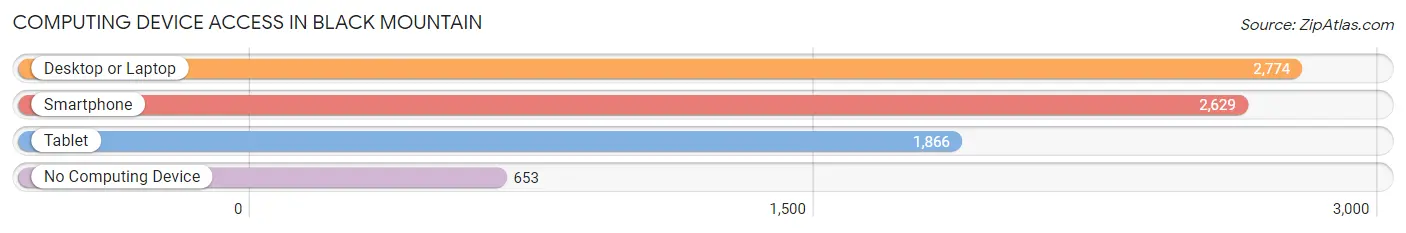
| Device Type | # Households | % Households |
| Desktop or Laptop | 2,774 | 71.7% |
| Smartphone | 2,629 | 68.0% |
| Tablet | 1,866 | 48.2% |
| No Computing Device | 653 | 16.9% |
| Total | 3,867 | 100.0% |
Internet Access in Black Mountain
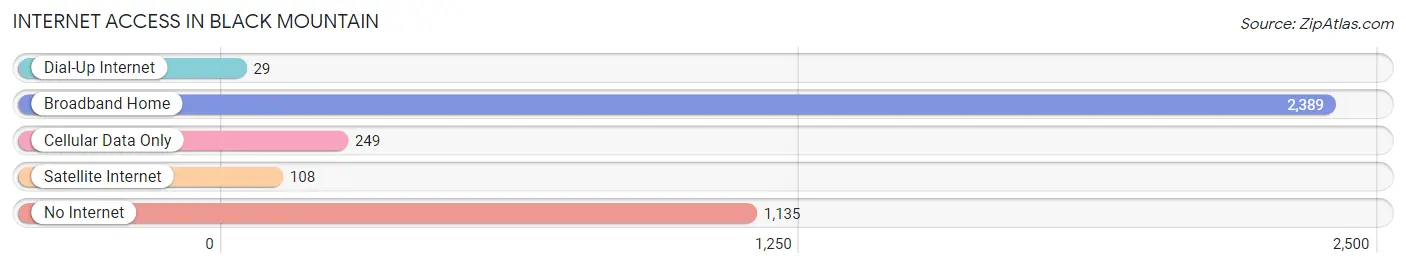
| Internet Type | # Households | % Households |
| Dial-Up Internet | 29 | 0.7% |
| Broadband Home | 2,389 | 61.8% |
| Cellular Data Only | 249 | 6.4% |
| Satellite Internet | 108 | 2.8% |
| No Internet | 1,135 | 29.3% |
| Total | 3,867 | 100.0% |
Black Mountain Summary
Black Mountain is a small town located in the Blue Ridge Mountains of western North Carolina. It is situated in Buncombe County, about 20 miles east of Asheville. The town has a population of 8,000 and is known for its scenic beauty, outdoor recreation, and vibrant arts and culture.
History
The area that is now Black Mountain was first settled in the late 1700s by the Cherokee Indians. The town was officially founded in 1887 and was named after the nearby Black Mountain range. The town was originally a farming community, but in the early 1900s, it began to develop into a tourist destination. The town was home to several resorts, including the famous Grove Park Inn, which opened in 1913.
In the 1920s, the town began to attract artists and writers, including Thomas Wolfe, who wrote his famous novel Look Homeward, Angel while living in Black Mountain. The town also became a center for the arts, with the Black Mountain College opening in 1933. The college was a progressive school that attracted many of the leading artists and intellectuals of the time, including Willem de Kooning, Buckminster Fuller, and John Cage.
Geography
Black Mountain is located in the Blue Ridge Mountains of western North Carolina. The town is situated in Buncombe County, about 20 miles east of Asheville. The town is surrounded by the Pisgah National Forest and is close to the Great Smoky Mountains National Park. The town is situated at an elevation of 2,400 feet and has a humid subtropical climate.
Economy
The economy of Black Mountain is largely based on tourism. The town is home to several resorts, including the Grove Park Inn, which attracts visitors from around the world. The town is also home to several art galleries, antique stores, and craft shops. The town is also home to several manufacturing companies, including a paper mill and a furniture factory.
Demographics
As of the 2010 census, the population of Black Mountain was 8,000. The town is predominantly white, with about 85% of the population identifying as white. The town also has a small African American population, with about 5% of the population identifying as African American. The town also has a small Hispanic population, with about 4% of the population identifying as Hispanic or Latino. The median household income in Black Mountain is $41,000, and the median home value is $175,000.
Common Questions
What is Per Capita Income in Black Mountain?
Per Capita income in Black Mountain is $42,791.
What is the Median Family Income in Black Mountain?
Median Family Income in Black Mountain is $93,526.
What is the Median Household income in Black Mountain?
Median Household Income in Black Mountain is $75,310.
What is Income or Wage Gap in Black Mountain?
Income or Wage Gap in Black Mountain is 15.9%.
Women in Black Mountain earn 84.1 cents for every dollar earned by a man.
What is Inequality or Gini Index in Black Mountain?
Inequality or Gini Index in Black Mountain is 0.45.
What is the Total Population of Black Mountain?
Total Population of Black Mountain is 8,430.
What is the Total Male Population of Black Mountain?
Total Male Population of Black Mountain is 3,521.
What is the Total Female Population of Black Mountain?
Total Female Population of Black Mountain is 4,909.
What is the Ratio of Males per 100 Females in Black Mountain?
There are 71.73 Males per 100 Females in Black Mountain.
What is the Ratio of Females per 100 Males in Black Mountain?
There are 139.42 Females per 100 Males in Black Mountain.
What is the Median Population Age in Black Mountain?
Median Population Age in Black Mountain is 60.4 Years.
What is the Average Family Size in Black Mountain
Average Family Size in Black Mountain is 2.6 People.
What is the Average Household Size in Black Mountain
Average Household Size in Black Mountain is 2.1 People.
How Large is the Labor Force in Black Mountain?
There are 3,329 People in the Labor Forcein in Black Mountain.
What is the Percentage of People in the Labor Force in Black Mountain?
45.1% of People are in the Labor Force in Black Mountain.
What is the Unemployment Rate in Black Mountain?
Unemployment Rate in Black Mountain is 1.1%.