Carrboro, NC Map & Demographics
Carrboro Map
Carrboro Overview
$48,088
PER CAPITA INCOME
$114,323
AVG FAMILY INCOME
$76,933
AVG HOUSEHOLD INCOME
35.2%
WAGE / INCOME GAP [ % ]
64.8¢/ $1
WAGE / INCOME GAP [ $ ]
$7,804
FAMILY INCOME DEFICIT
0.49
INEQUALITY / GINI INDEX
21,242
TOTAL POPULATION
10,184
MALE POPULATION
11,058
FEMALE POPULATION
92.10
MALES / 100 FEMALES
108.58
FEMALES / 100 MALES
33.1
MEDIAN AGE
3.1
AVG FAMILY SIZE
2.3
AVG HOUSEHOLD SIZE
12,473
LABOR FORCE [ PEOPLE ]
72.7%
PERCENT IN LABOR FORCE
3.6%
UNEMPLOYMENT RATE
Carrboro Zip Codes
Carrboro Area Codes
Income in Carrboro
Income Overview in Carrboro
Per Capita Income in Carrboro is $48,088, while median incomes of families and households are $114,323 and $76,933 respectively.
| Characteristic | Number | Measure |
| Per Capita Income | 21,242 | $48,088 |
| Median Family Income | 4,707 | $114,323 |
| Mean Family Income | 4,707 | $160,122 |
| Median Household Income | 9,182 | $76,933 |
| Mean Household Income | 9,182 | $109,556 |
| Income Deficit | 4,707 | $7,804 |
| Wage / Income Gap (%) | 21,242 | 35.17% |
| Wage / Income Gap ($) | 21,242 | 64.83¢ per $1 |
| Gini / Inequality Index | 21,242 | 0.49 |
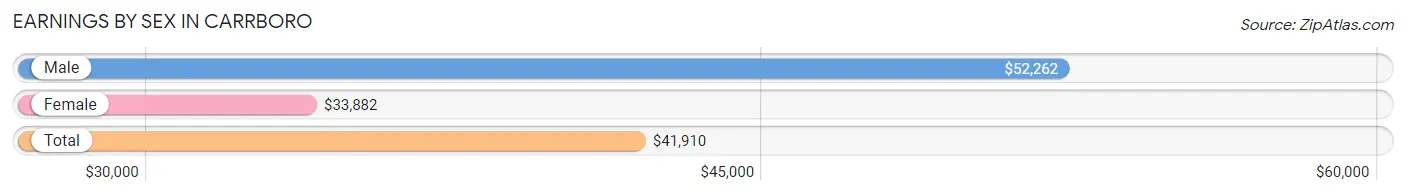
Earnings by Sex in Carrboro
Average Earnings in Carrboro are $41,910, $52,262 for men and $33,882 for women, a difference of 35.2%.
| Sex | Number | Average Earnings |
| Male | 6,861 (51.3%) | $52,262 |
| Female | 6,504 (48.7%) | $33,882 |
| Total | 13,365 (100.0%) | $41,910 |
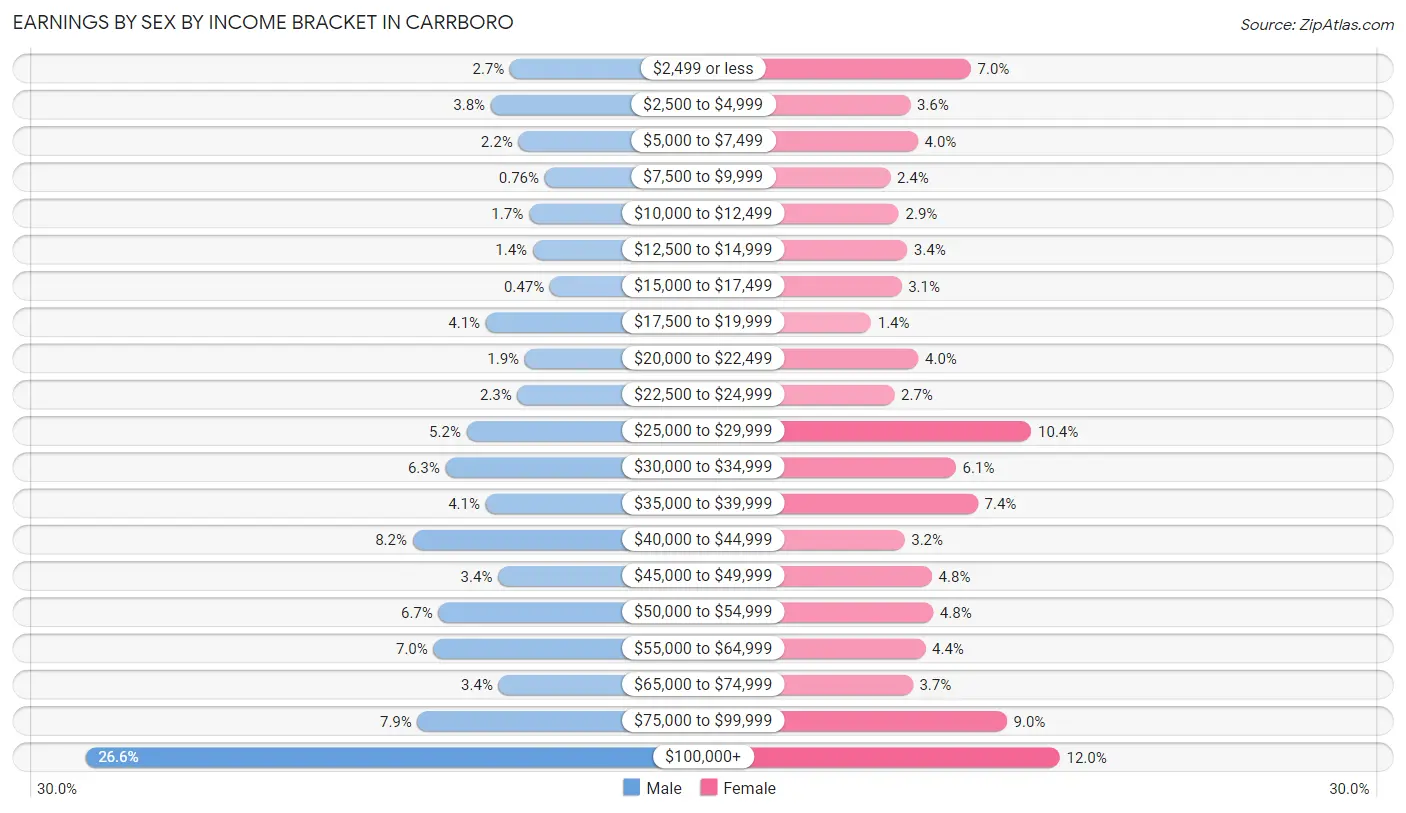
Earnings by Sex by Income Bracket in Carrboro
The most common earnings brackets in Carrboro are $100,000+ for men (1,824 | 26.6%) and $100,000+ for women (778 | 12.0%).
| Income | Male | Female |
| $2,499 or less | 186 (2.7%) | 453 (7.0%) |
| $2,500 to $4,999 | 260 (3.8%) | 231 (3.5%) |
| $5,000 to $7,499 | 154 (2.2%) | 259 (4.0%) |
| $7,500 to $9,999 | 52 (0.8%) | 158 (2.4%) |
| $10,000 to $12,499 | 113 (1.7%) | 189 (2.9%) |
| $12,500 to $14,999 | 98 (1.4%) | 220 (3.4%) |
| $15,000 to $17,499 | 32 (0.5%) | 199 (3.1%) |
| $17,500 to $19,999 | 279 (4.1%) | 88 (1.3%) |
| $20,000 to $22,499 | 129 (1.9%) | 261 (4.0%) |
| $22,500 to $24,999 | 157 (2.3%) | 173 (2.7%) |
| $25,000 to $29,999 | 353 (5.1%) | 674 (10.4%) |
| $30,000 to $34,999 | 435 (6.3%) | 398 (6.1%) |
| $35,000 to $39,999 | 280 (4.1%) | 478 (7.3%) |
| $40,000 to $44,999 | 561 (8.2%) | 210 (3.2%) |
| $45,000 to $49,999 | 232 (3.4%) | 310 (4.8%) |
| $50,000 to $54,999 | 462 (6.7%) | 315 (4.8%) |
| $55,000 to $64,999 | 481 (7.0%) | 286 (4.4%) |
| $65,000 to $74,999 | 230 (3.4%) | 240 (3.7%) |
| $75,000 to $99,999 | 543 (7.9%) | 584 (9.0%) |
| $100,000+ | 1,824 (26.6%) | 778 (12.0%) |
| Total | 6,861 (100.0%) | 6,504 (100.0%) |
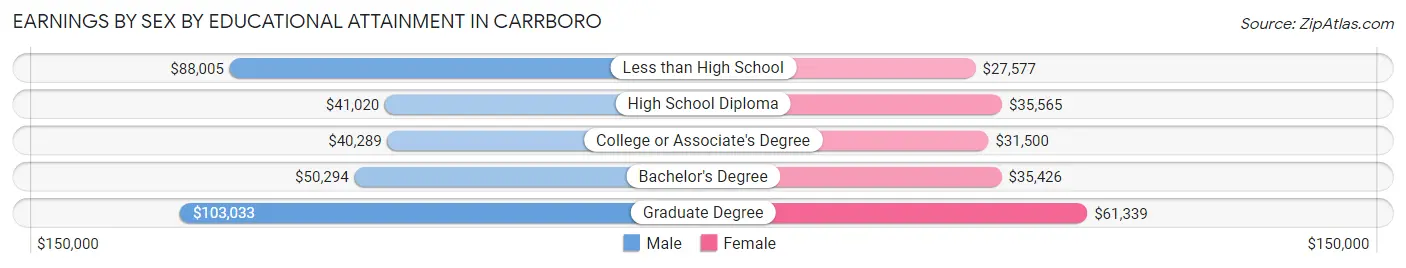
Earnings by Sex by Educational Attainment in Carrboro
Average earnings in Carrboro are $55,990 for men and $37,446 for women, a difference of 33.1%. Men with an educational attainment of graduate degree enjoy the highest average annual earnings of $103,033, while those with college or associate's degree education earn the least with $40,289. Women with an educational attainment of graduate degree earn the most with the average annual earnings of $61,339, while those with less than high school education have the smallest earnings of $27,577.
| Educational Attainment | Male Income | Female Income |
| Less than High School | $88,005 | $27,577 |
| High School Diploma | $41,020 | $35,565 |
| College or Associate's Degree | $40,289 | $31,500 |
| Bachelor's Degree | $50,294 | $35,426 |
| Graduate Degree | $103,033 | $61,339 |
| Total | $55,990 | $37,446 |
Family Income in Carrboro
Family Income Brackets in Carrboro
According to the Carrboro family income data, there are 1,327 families falling into the $200,000+ income range, which is the most common income bracket and makes up 28.2% of all families. Conversely, the $10,000 to $14,999 income bracket is the least frequent group with only 38 families (0.8%) belonging to this category.
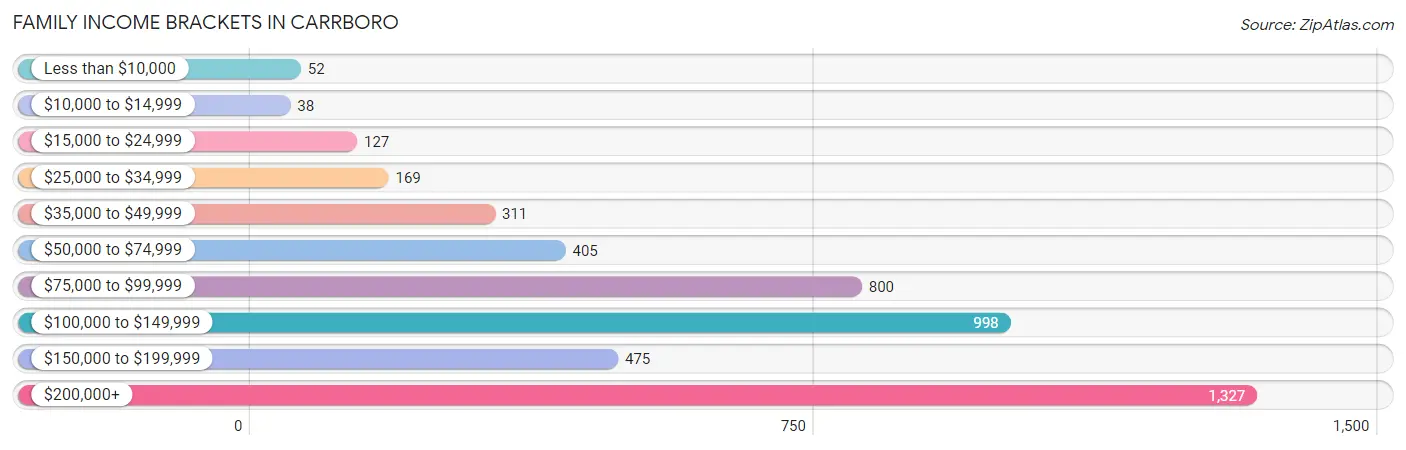
| Income Bracket | # Families | % Families |
| Less than $10,000 | 52 | 1.1% |
| $10,000 to $14,999 | 38 | 0.8% |
| $15,000 to $24,999 | 127 | 2.7% |
| $25,000 to $34,999 | 169 | 3.6% |
| $35,000 to $49,999 | 311 | 6.6% |
| $50,000 to $74,999 | 405 | 8.6% |
| $75,000 to $99,999 | 800 | 17.0% |
| $100,000 to $149,999 | 998 | 21.2% |
| $150,000 to $199,999 | 475 | 10.1% |
| $200,000+ | 1,327 | 28.2% |
Family Income by Famaliy Size in Carrboro
4-person families (753 | 16.0%) account for the highest median family income in Carrboro with $182,125 per family, while 2-person families (2,088 | 44.4%) have the highest median income of $51,648 per family member.
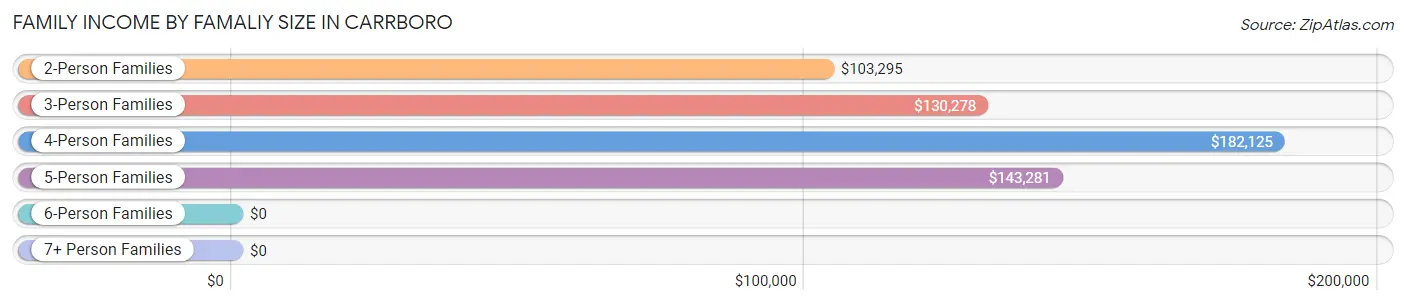
| Income Bracket | # Families | Median Income |
| 2-Person Families | 2,088 (44.4%) | $103,295 |
| 3-Person Families | 1,182 (25.1%) | $130,278 |
| 4-Person Families | 753 (16.0%) | $182,125 |
| 5-Person Families | 433 (9.2%) | $143,281 |
| 6-Person Families | 251 (5.3%) | $0 |
| 7+ Person Families | 0 (0.0%) | $0 |
| Total | 4,707 (100.0%) | $114,323 |
Family Income by Number of Earners in Carrboro
The median family income in Carrboro is $114,323, with families comprising 2 earners (2,862) having the highest median family income of $131,771, while families with 1 earner (1,116) have the lowest median family income of $83,333, accounting for 60.8% and 23.7% of families, respectively.
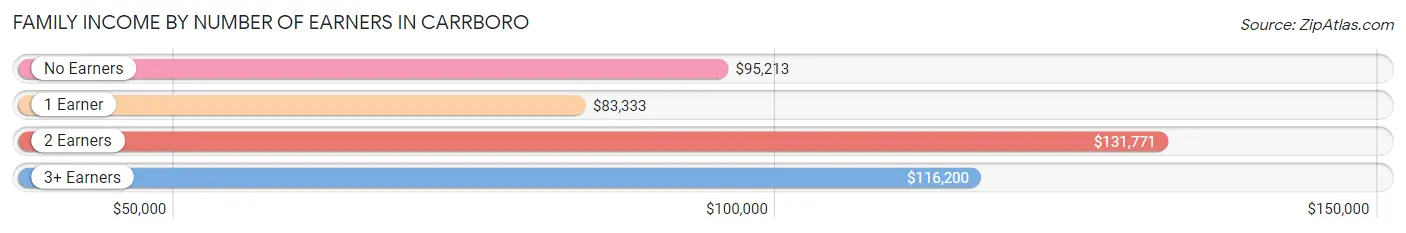
| Number of Earners | # Families | Median Income |
| No Earners | 331 (7.0%) | $95,213 |
| 1 Earner | 1,116 (23.7%) | $83,333 |
| 2 Earners | 2,862 (60.8%) | $131,771 |
| 3+ Earners | 398 (8.5%) | $116,200 |
| Total | 4,707 (100.0%) | $114,323 |
Household Income in Carrboro
Household Income Brackets in Carrboro
With 1,414 households falling in the category, the $50,000 to $74,999 income range is the most frequent in Carrboro, accounting for 15.4% of all households. In contrast, only 321 households (3.5%) fall into the $10,000 to $14,999 income bracket, making it the least populous group.
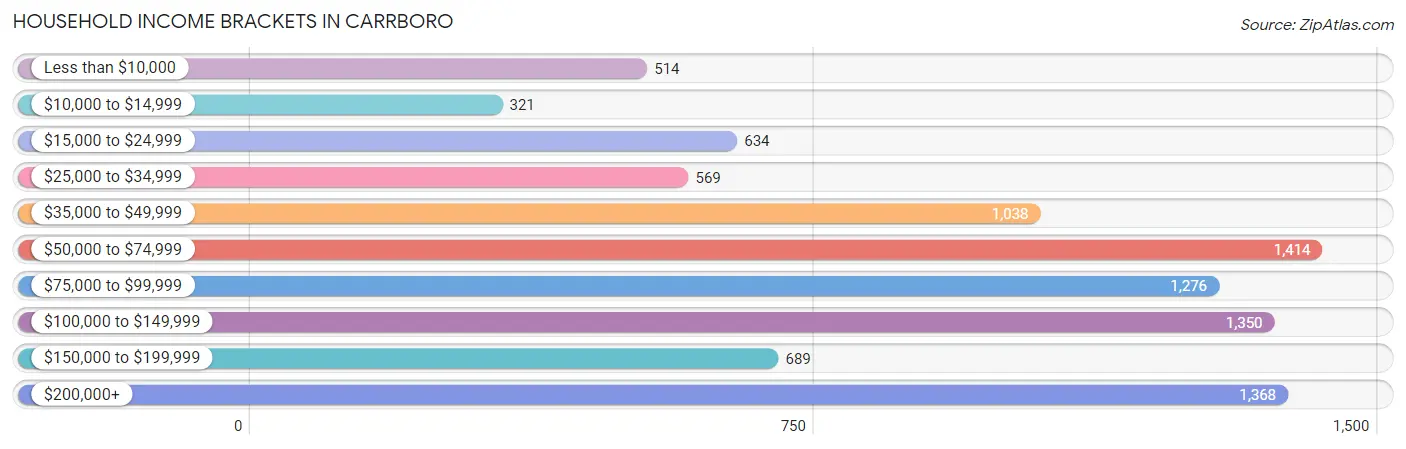
| Income Bracket | # Households | % Households |
| Less than $10,000 | 514 | 5.6% |
| $10,000 to $14,999 | 321 | 3.5% |
| $15,000 to $24,999 | 634 | 6.9% |
| $25,000 to $34,999 | 569 | 6.2% |
| $35,000 to $49,999 | 1,038 | 11.3% |
| $50,000 to $74,999 | 1,414 | 15.4% |
| $75,000 to $99,999 | 1,276 | 13.9% |
| $100,000 to $149,999 | 1,350 | 14.7% |
| $150,000 to $199,999 | 689 | 7.5% |
| $200,000+ | 1,368 | 14.9% |
Household Income by Householder Age in Carrboro
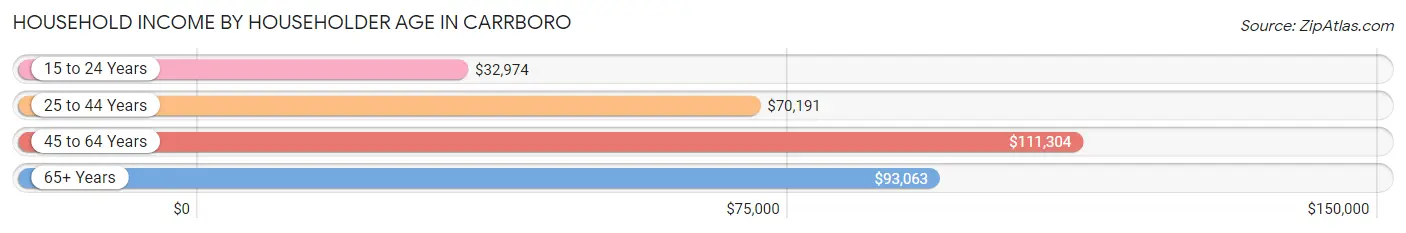
The median household income in Carrboro is $76,933, with the highest median household income of $111,304 found in the 45 to 64 years age bracket for the primary householder. A total of 2,817 households (30.7%) fall into this category. Meanwhile, the 15 to 24 years age bracket for the primary householder has the lowest median household income of $32,974, with 1,051 households (11.5%) in this group.
| Income Bracket | # Households | Median Income |
| 15 to 24 Years | 1,051 (11.5%) | $32,974 |
| 25 to 44 Years | 4,107 (44.7%) | $70,191 |
| 45 to 64 Years | 2,817 (30.7%) | $111,304 |
| 65+ Years | 1,207 (13.2%) | $93,063 |
| Total | 9,182 (100.0%) | $76,933 |
Poverty in Carrboro
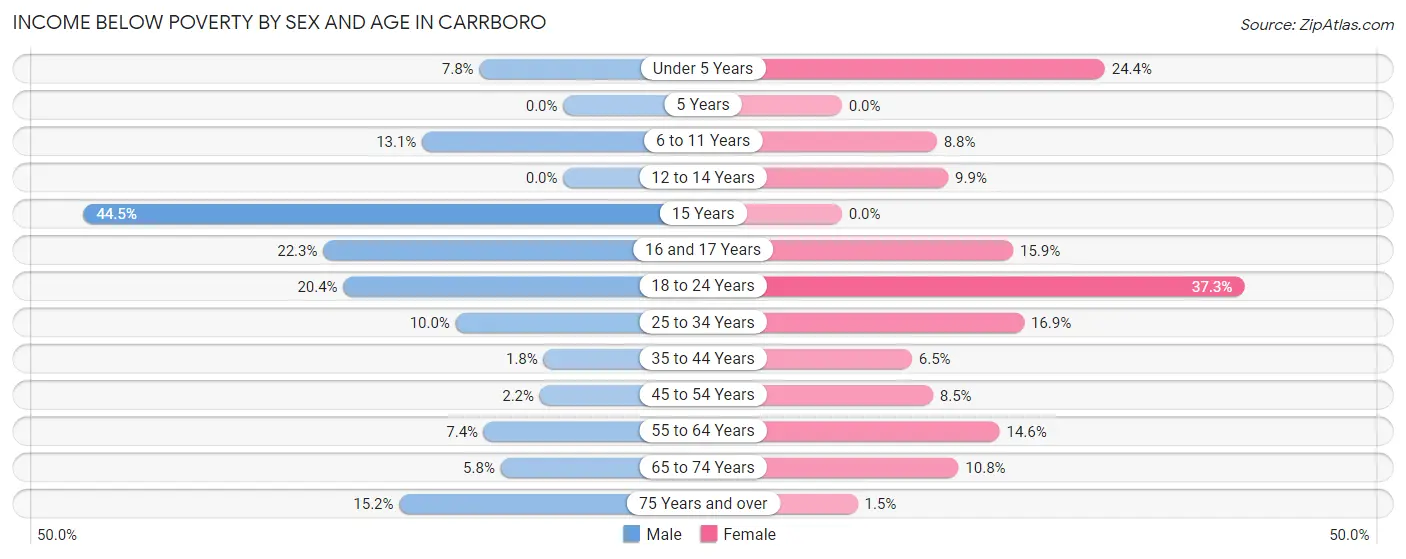
Income Below Poverty by Sex and Age in Carrboro
With 8.9% poverty level for males and 14.3% for females among the residents of Carrboro, 15 year old males and 18 to 24 year old females are the most vulnerable to poverty, with 57 males (44.5%) and 497 females (37.3%) in their respective age groups living below the poverty level.
| Age Bracket | Male | Female |
| Under 5 Years | 36 (7.8%) | 124 (24.4%) |
| 5 Years | 0 (0.0%) | 0 (0.0%) |
| 6 to 11 Years | 96 (13.1%) | 99 (8.8%) |
| 12 to 14 Years | 0 (0.0%) | 44 (9.9%) |
| 15 Years | 57 (44.5%) | 0 (0.0%) |
| 16 and 17 Years | 41 (22.3%) | 34 (15.9%) |
| 18 to 24 Years | 268 (20.4%) | 497 (37.3%) |
| 25 to 34 Years | 214 (10.0%) | 332 (16.9%) |
| 35 to 44 Years | 28 (1.8%) | 99 (6.5%) |
| 45 to 54 Years | 30 (2.2%) | 118 (8.5%) |
| 55 to 64 Years | 67 (7.4%) | 149 (14.6%) |
| 65 to 74 Years | 36 (5.8%) | 74 (10.8%) |
| 75 Years and over | 35 (15.2%) | 10 (1.5%) |
| Total | 908 (8.9%) | 1,580 (14.3%) |
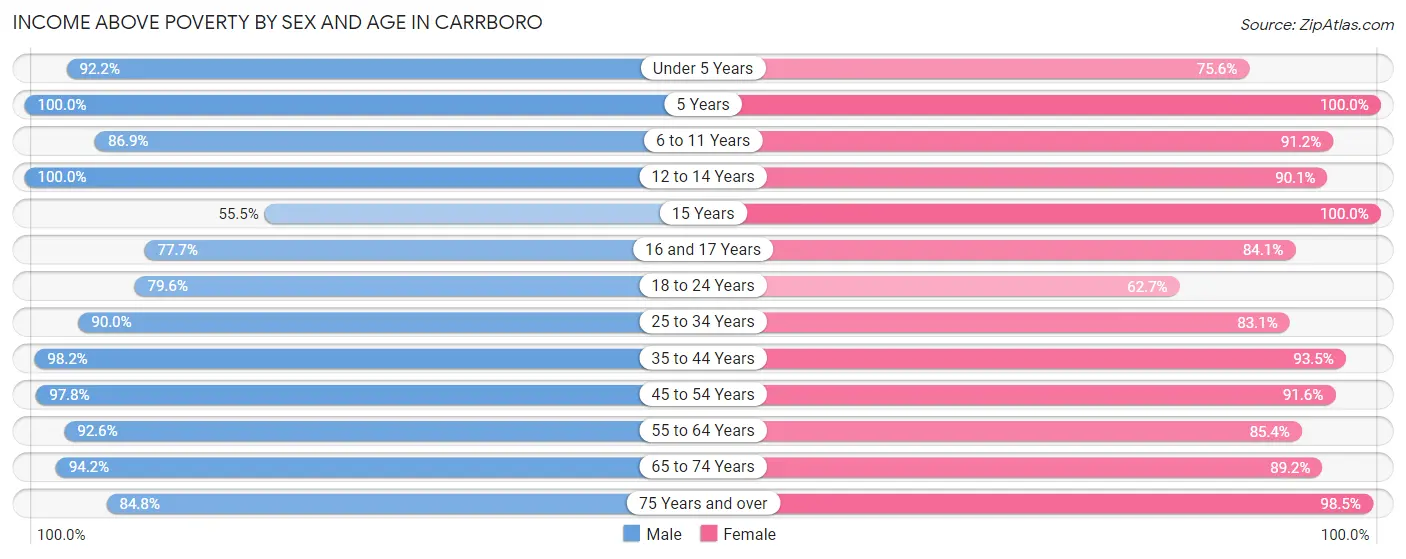
Income Above Poverty by Sex and Age in Carrboro
According to the poverty statistics in Carrboro, males aged 5 years and females aged 5 years are the age groups that are most secure financially, with 100.0% of males and 100.0% of females in these age groups living above the poverty line.
| Age Bracket | Male | Female |
| Under 5 Years | 426 (92.2%) | 384 (75.6%) |
| 5 Years | 24 (100.0%) | 17 (100.0%) |
| 6 to 11 Years | 637 (86.9%) | 1,025 (91.2%) |
| 12 to 14 Years | 506 (100.0%) | 402 (90.1%) |
| 15 Years | 71 (55.5%) | 126 (100.0%) |
| 16 and 17 Years | 143 (77.7%) | 180 (84.1%) |
| 18 to 24 Years | 1,045 (79.6%) | 834 (62.7%) |
| 25 to 34 Years | 1,928 (90.0%) | 1,631 (83.1%) |
| 35 to 44 Years | 1,505 (98.2%) | 1,423 (93.5%) |
| 45 to 54 Years | 1,343 (97.8%) | 1,279 (91.5%) |
| 55 to 64 Years | 842 (92.6%) | 869 (85.4%) |
| 65 to 74 Years | 584 (94.2%) | 610 (89.2%) |
| 75 Years and over | 195 (84.8%) | 669 (98.5%) |
| Total | 9,249 (91.1%) | 9,449 (85.7%) |
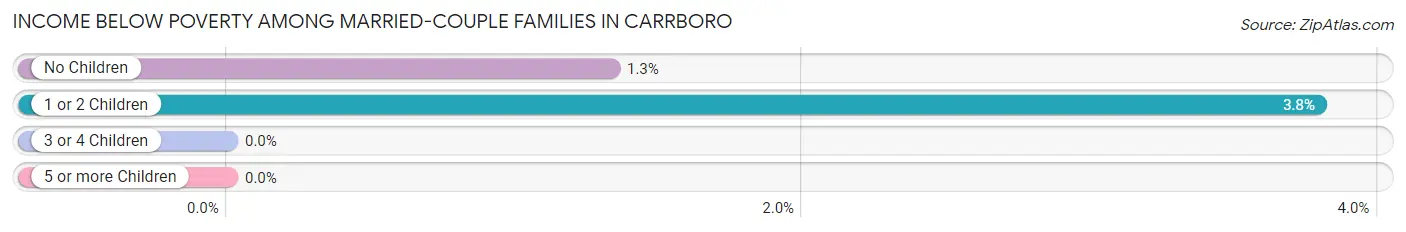
Income Below Poverty Among Married-Couple Families in Carrboro
The poverty statistics for married-couple families in Carrboro show that 2.1% or 79 of the total 3,808 families live below the poverty line. Families with 1 or 2 children have the highest poverty rate of 3.8%, comprising of 53 families. On the other hand, families with 3 or 4 children have the lowest poverty rate of 0.0%, which includes 0 families.
| Children | Above Poverty | Below Poverty |
| No Children | 1,927 (98.7%) | 26 (1.3%) |
| 1 or 2 Children | 1,345 (96.2%) | 53 (3.8%) |
| 3 or 4 Children | 457 (100.0%) | 0 (0.0%) |
| 5 or more Children | 0 (0.0%) | 0 (0.0%) |
| Total | 3,729 (97.9%) | 79 (2.1%) |
Income Below Poverty Among Single-Parent Households in Carrboro
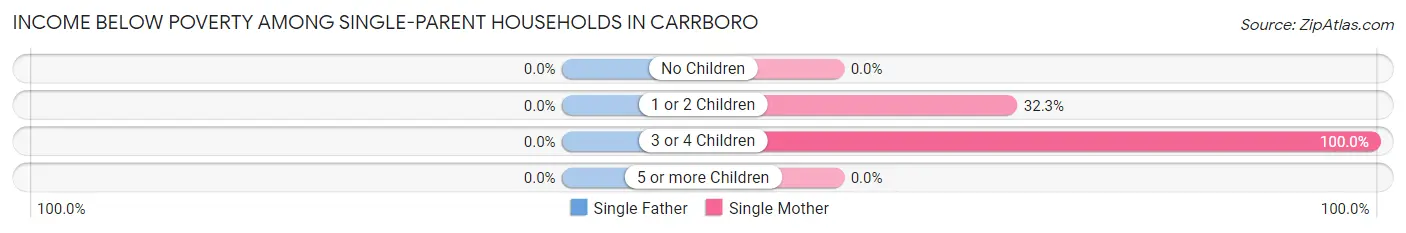
| Children | Single Father | Single Mother |
| No Children | 0 (0.0%) | 0 (0.0%) |
| 1 or 2 Children | 0 (0.0%) | 100 (32.3%) |
| 3 or 4 Children | 0 (0.0%) | 57 (100.0%) |
| 5 or more Children | 0 (0.0%) | 0 (0.0%) |
| Total | 0 (0.0%) | 157 (23.4%) |
Income Below Poverty Among Married-Couple vs Single-Parent Households in Carrboro
The poverty data for Carrboro shows that 79 of the married-couple family households (2.1%) and 157 of the single-parent households (17.5%) are living below the poverty level. Within the married-couple family households, those with 1 or 2 children have the highest poverty rate, with 53 households (3.8%) falling below the poverty line. Among the single-parent households, those with 3 or 4 children have the highest poverty rate, with 57 household (100.0%) living below poverty.
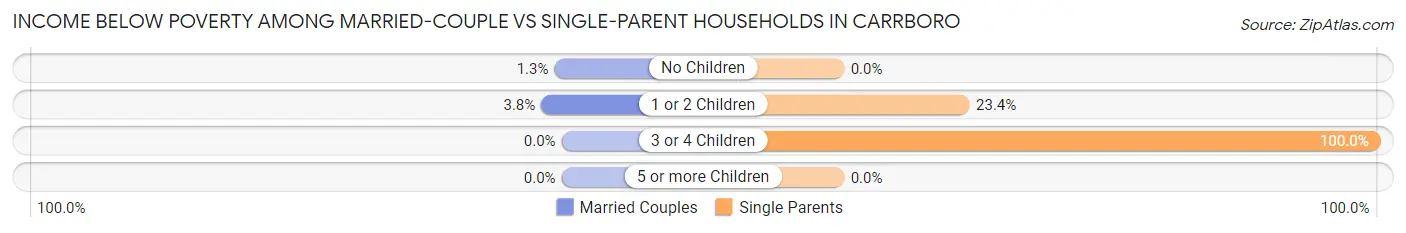
| Children | Married-Couple Families | Single-Parent Households |
| No Children | 26 (1.3%) | 0 (0.0%) |
| 1 or 2 Children | 53 (3.8%) | 100 (23.4%) |
| 3 or 4 Children | 0 (0.0%) | 57 (100.0%) |
| 5 or more Children | 0 (0.0%) | 0 (0.0%) |
| Total | 79 (2.1%) | 157 (17.5%) |
Race in Carrboro
The most populous races in Carrboro are White / Caucasian (14,440 | 68.0%), Black / African American (2,891 | 13.6%), and Asian (1,922 | 9.0%).
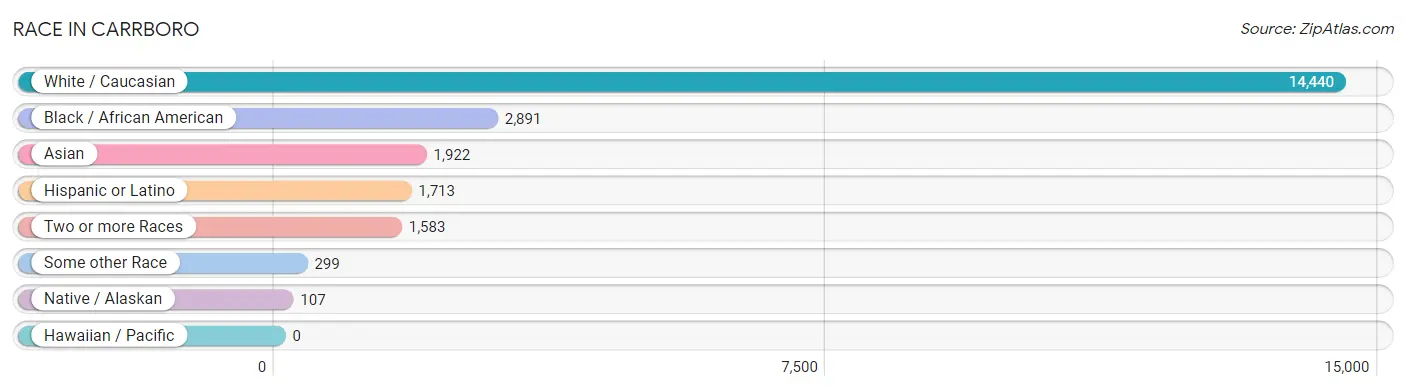
| Race | # Population | % Population |
| Asian | 1,922 | 9.0% |
| Black / African American | 2,891 | 13.6% |
| Hawaiian / Pacific | 0 | 0.0% |
| Hispanic or Latino | 1,713 | 8.1% |
| Native / Alaskan | 107 | 0.5% |
| White / Caucasian | 14,440 | 68.0% |
| Two or more Races | 1,583 | 7.4% |
| Some other Race | 299 | 1.4% |
| Total | 21,242 | 100.0% |
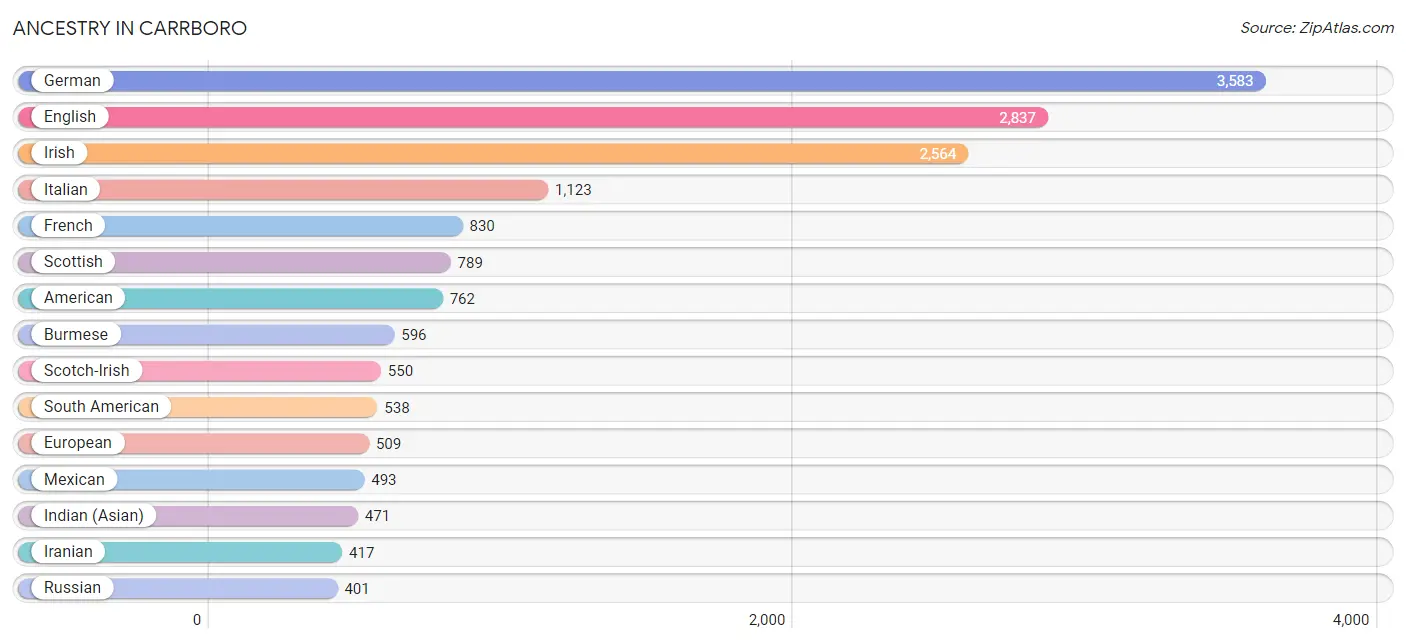
Ancestry in Carrboro
The most populous ancestries reported in Carrboro are German (3,583 | 16.9%), English (2,837 | 13.4%), Irish (2,564 | 12.1%), Italian (1,123 | 5.3%), and French (830 | 3.9%), together accounting for 51.5% of all Carrboro residents.
| Ancestry | # Population | % Population |
| African | 78 | 0.4% |
| American | 762 | 3.6% |
| Arab | 76 | 0.4% |
| Argentinean | 107 | 0.5% |
| Austrian | 243 | 1.1% |
| Bahamian | 14 | 0.1% |
| Bangladeshi | 75 | 0.4% |
| Basque | 28 | 0.1% |
| Belgian | 23 | 0.1% |
| Bhutanese | 116 | 0.5% |
| British | 327 | 1.5% |
| Burmese | 596 | 2.8% |
| Cajun | 49 | 0.2% |
| Canadian | 16 | 0.1% |
| Central American | 310 | 1.5% |
| Central American Indian | 57 | 0.3% |
| Cherokee | 159 | 0.7% |
| Chilean | 48 | 0.2% |
| Choctaw | 16 | 0.1% |
| Colombian | 187 | 0.9% |
| Costa Rican | 30 | 0.1% |
| Croatian | 58 | 0.3% |
| Czech | 82 | 0.4% |
| Czechoslovakian | 7 | 0.0% |
| Danish | 245 | 1.1% |
| Dutch | 200 | 0.9% |
| Eastern European | 225 | 1.1% |
| Ecuadorian | 32 | 0.2% |
| Egyptian | 7 | 0.0% |
| English | 2,837 | 13.4% |
| Ethiopian | 34 | 0.2% |
| European | 509 | 2.4% |
| Filipino | 136 | 0.6% |
| Finnish | 26 | 0.1% |
| French | 830 | 3.9% |
| French Canadian | 157 | 0.7% |
| German | 3,583 | 16.9% |
| Greek | 113 | 0.5% |
| Guamanian / Chamorro | 33 | 0.2% |
| Guatemalan | 115 | 0.5% |
| Haitian | 43 | 0.2% |
| Hungarian | 115 | 0.5% |
| Indian (Asian) | 471 | 2.2% |
| Indonesian | 39 | 0.2% |
| Iranian | 417 | 2.0% |
| Irish | 2,564 | 12.1% |
| Italian | 1,123 | 5.3% |
| Jamaican | 14 | 0.1% |
| Korean | 147 | 0.7% |
| Latvian | 28 | 0.1% |
| Lebanese | 6 | 0.0% |
| Lithuanian | 59 | 0.3% |
| Mexican | 493 | 2.3% |
| Moroccan | 49 | 0.2% |
| Nigerian | 121 | 0.6% |
| Northern European | 102 | 0.5% |
| Norwegian | 265 | 1.3% |
| Pakistani | 7 | 0.0% |
| Paraguayan | 35 | 0.2% |
| Pennsylvania German | 5 | 0.0% |
| Peruvian | 100 | 0.5% |
| Polish | 265 | 1.3% |
| Portuguese | 180 | 0.9% |
| Puerto Rican | 283 | 1.3% |
| Romanian | 22 | 0.1% |
| Russian | 401 | 1.9% |
| Salvadoran | 165 | 0.8% |
| Scandinavian | 37 | 0.2% |
| Scotch-Irish | 550 | 2.6% |
| Scottish | 789 | 3.7% |
| Serbian | 17 | 0.1% |
| Slavic | 15 | 0.1% |
| Slovak | 71 | 0.3% |
| Slovene | 135 | 0.6% |
| South American | 538 | 2.5% |
| South American Indian | 48 | 0.2% |
| Spaniard | 11 | 0.1% |
| Spanish | 58 | 0.3% |
| Sri Lankan | 113 | 0.5% |
| Subsaharan African | 323 | 1.5% |
| Swedish | 327 | 1.5% |
| Swiss | 91 | 0.4% |
| Syrian | 14 | 0.1% |
| Thai | 325 | 1.5% |
| Trinidadian and Tobagonian | 14 | 0.1% |
| Turkish | 42 | 0.2% |
| Ukrainian | 49 | 0.2% |
| Uruguayan | 19 | 0.1% |
| Venezuelan | 10 | 0.1% |
| Welsh | 214 | 1.0% |
| West Indian | 48 | 0.2% | View All 91 Rows |
Immigrants in Carrboro
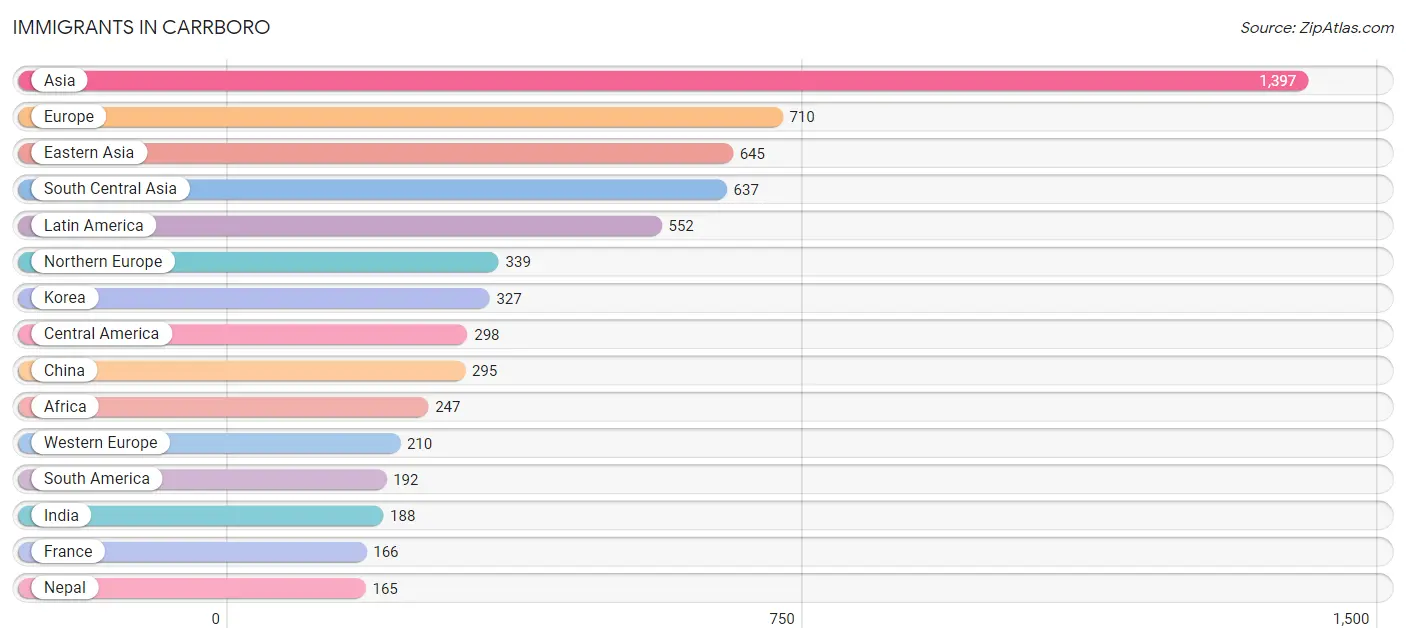
The most numerous immigrant groups reported in Carrboro came from Asia (1,397 | 6.6%), Europe (710 | 3.3%), Eastern Asia (645 | 3.0%), South Central Asia (637 | 3.0%), and Latin America (552 | 2.6%), together accounting for 18.6% of all Carrboro residents.
| Immigration Origin | # Population | % Population |
| Africa | 247 | 1.2% |
| Albania | 15 | 0.1% |
| Argentina | 26 | 0.1% |
| Asia | 1,397 | 6.6% |
| Australia | 33 | 0.2% |
| Bahamas | 14 | 0.1% |
| Belarus | 42 | 0.2% |
| Canada | 75 | 0.4% |
| Caribbean | 62 | 0.3% |
| Central America | 298 | 1.4% |
| China | 295 | 1.4% |
| Colombia | 54 | 0.3% |
| Costa Rica | 30 | 0.1% |
| Denmark | 126 | 0.6% |
| Eastern Africa | 118 | 0.6% |
| Eastern Asia | 645 | 3.0% |
| Eastern Europe | 127 | 0.6% |
| Ecuador | 32 | 0.2% |
| El Salvador | 157 | 0.7% |
| Ethiopia | 34 | 0.2% |
| Europe | 710 | 3.3% |
| France | 166 | 0.8% |
| Germany | 18 | 0.1% |
| Guatemala | 27 | 0.1% |
| India | 188 | 0.9% |
| Iran | 74 | 0.4% |
| Ireland | 4 | 0.0% |
| Israel | 11 | 0.1% |
| Italy | 34 | 0.2% |
| Jamaica | 14 | 0.1% |
| Japan | 23 | 0.1% |
| Kenya | 84 | 0.4% |
| Korea | 327 | 1.5% |
| Latin America | 552 | 2.6% |
| Latvia | 28 | 0.1% |
| Malaysia | 13 | 0.1% |
| Mexico | 84 | 0.4% |
| Middle Africa | 12 | 0.1% |
| Morocco | 39 | 0.2% |
| Nepal | 165 | 0.8% |
| Netherlands | 7 | 0.0% |
| Northern Africa | 50 | 0.2% |
| Northern Europe | 339 | 1.6% |
| Oceania | 77 | 0.4% |
| Pakistan | 93 | 0.4% |
| Peru | 45 | 0.2% |
| Philippines | 28 | 0.1% |
| Russia | 28 | 0.1% |
| South America | 192 | 0.9% |
| South Central Asia | 637 | 3.0% |
| South Eastern Asia | 72 | 0.3% |
| Southern Europe | 34 | 0.2% |
| Sri Lanka | 117 | 0.5% |
| St. Vincent and the Grenadines | 20 | 0.1% |
| Sudan | 11 | 0.1% |
| Switzerland | 19 | 0.1% |
| Taiwan | 74 | 0.4% |
| Trinidad and Tobago | 14 | 0.1% |
| Turkey | 32 | 0.2% |
| Vietnam | 18 | 0.1% |
| Western Africa | 67 | 0.3% |
| Western Asia | 43 | 0.2% |
| Western Europe | 210 | 1.0% | View All 63 Rows |
Sex and Age in Carrboro
Sex and Age in Carrboro
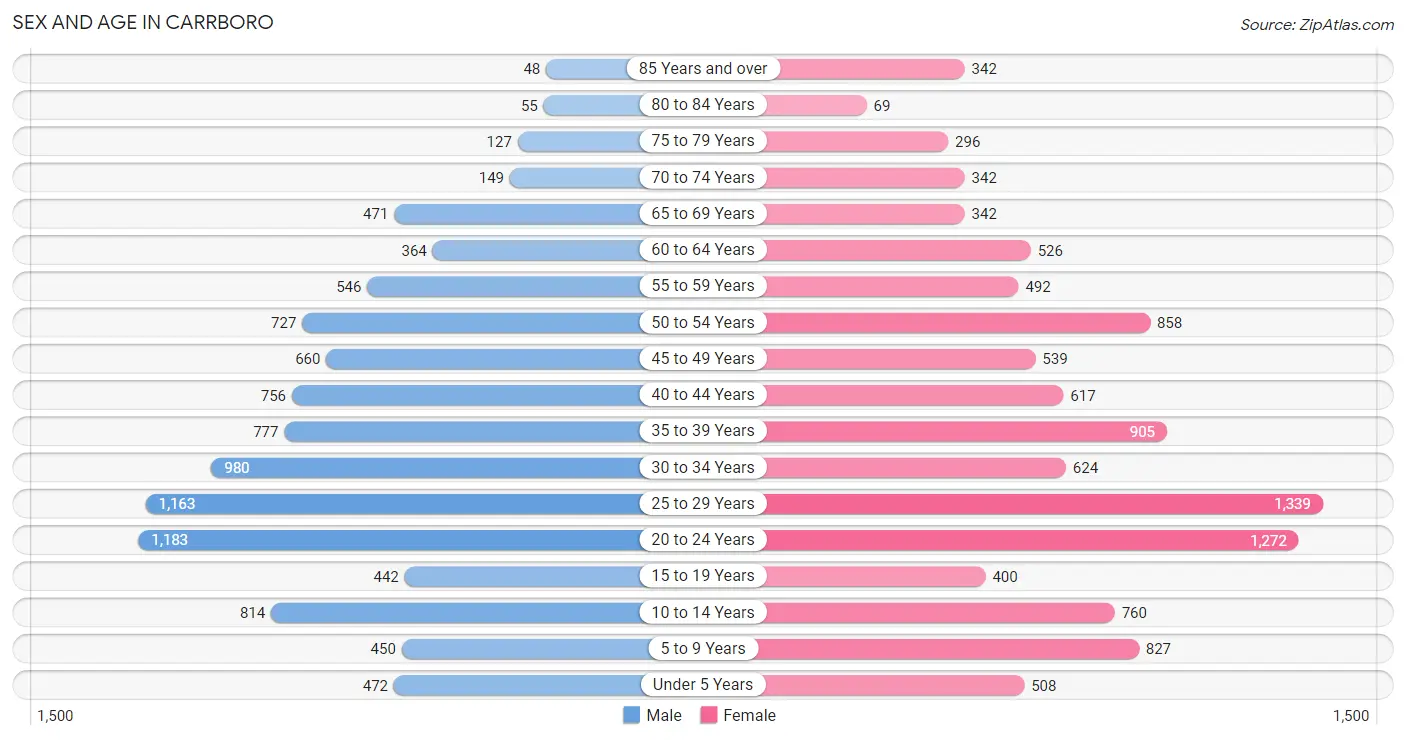
The most populous age groups in Carrboro are 20 to 24 Years (1,183 | 11.6%) for men and 25 to 29 Years (1,339 | 12.1%) for women.
| Age Bracket | Male | Female |
| Under 5 Years | 472 (4.6%) | 508 (4.6%) |
| 5 to 9 Years | 450 (4.4%) | 827 (7.5%) |
| 10 to 14 Years | 814 (8.0%) | 760 (6.9%) |
| 15 to 19 Years | 442 (4.3%) | 400 (3.6%) |
| 20 to 24 Years | 1,183 (11.6%) | 1,272 (11.5%) |
| 25 to 29 Years | 1,163 (11.4%) | 1,339 (12.1%) |
| 30 to 34 Years | 980 (9.6%) | 624 (5.6%) |
| 35 to 39 Years | 777 (7.6%) | 905 (8.2%) |
| 40 to 44 Years | 756 (7.4%) | 617 (5.6%) |
| 45 to 49 Years | 660 (6.5%) | 539 (4.9%) |
| 50 to 54 Years | 727 (7.1%) | 858 (7.8%) |
| 55 to 59 Years | 546 (5.4%) | 492 (4.4%) |
| 60 to 64 Years | 364 (3.6%) | 526 (4.8%) |
| 65 to 69 Years | 471 (4.6%) | 342 (3.1%) |
| 70 to 74 Years | 149 (1.5%) | 342 (3.1%) |
| 75 to 79 Years | 127 (1.3%) | 296 (2.7%) |
| 80 to 84 Years | 55 (0.5%) | 69 (0.6%) |
| 85 Years and over | 48 (0.5%) | 342 (3.1%) |
| Total | 10,184 (100.0%) | 11,058 (100.0%) |
Families and Households in Carrboro
Median Family Size in Carrboro
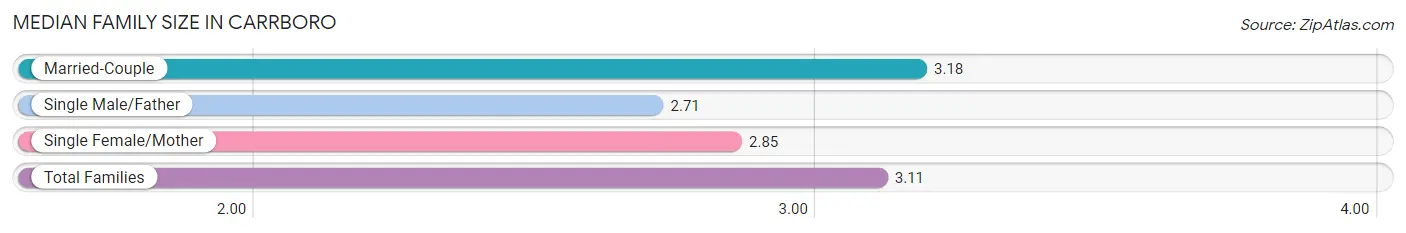
The median family size in Carrboro is 3.11 persons per family, with married-couple families (3,808 | 80.9%) accounting for the largest median family size of 3.18 persons per family. On the other hand, single male/father families (229 | 4.9%) represent the smallest median family size with 2.71 persons per family.
| Family Type | # Families | Family Size |
| Married-Couple | 3,808 (80.9%) | 3.18 |
| Single Male/Father | 229 (4.9%) | 2.71 |
| Single Female/Mother | 670 (14.2%) | 2.85 |
| Total Families | 4,707 (100.0%) | 3.11 |
Median Household Size in Carrboro
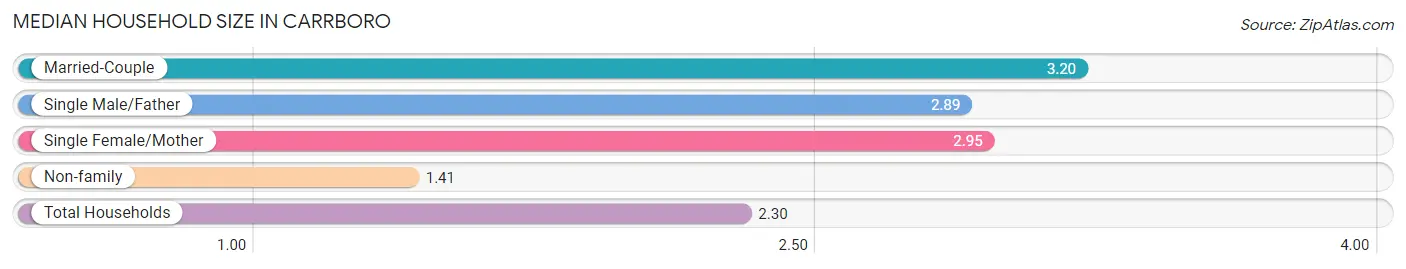
The median household size in Carrboro is 2.30 persons per household, with married-couple households (3,808 | 41.5%) accounting for the largest median household size of 3.2 persons per household. non-family households (4,475 | 48.7%) represent the smallest median household size with 1.41 persons per household.
| Household Type | # Households | Household Size |
| Married-Couple | 3,808 (41.5%) | 3.20 |
| Single Male/Father | 229 (2.5%) | 2.89 |
| Single Female/Mother | 670 (7.3%) | 2.95 |
| Non-family | 4,475 (48.7%) | 1.41 |
| Total Households | 9,182 (100.0%) | 2.30 |
Household Size by Marriage Status in Carrboro
Out of a total of 9,182 households in Carrboro, 4,707 (51.3%) are family households, while 4,475 (48.7%) are nonfamily households. The most numerous type of family households are 2-person households, comprising 1,995, and the most common type of nonfamily households are 1-person households, comprising 3,106.
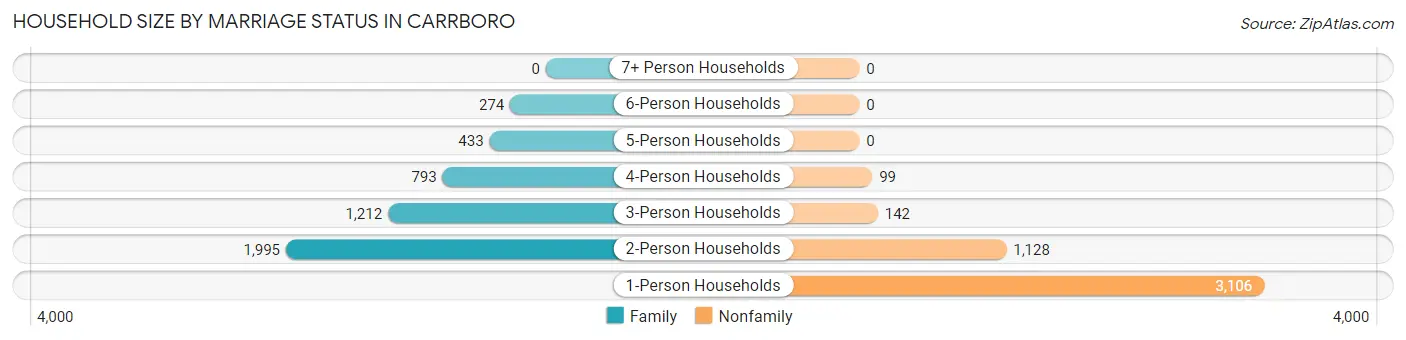
| Household Size | Family Households | Nonfamily Households |
| 1-Person Households | - | 3,106 (33.8%) |
| 2-Person Households | 1,995 (21.7%) | 1,128 (12.3%) |
| 3-Person Households | 1,212 (13.2%) | 142 (1.5%) |
| 4-Person Households | 793 (8.6%) | 99 (1.1%) |
| 5-Person Households | 433 (4.7%) | 0 (0.0%) |
| 6-Person Households | 274 (3.0%) | 0 (0.0%) |
| 7+ Person Households | 0 (0.0%) | 0 (0.0%) |
| Total | 4,707 (51.3%) | 4,475 (48.7%) |
Female Fertility in Carrboro
Fertility by Age in Carrboro
Average fertility rate in Carrboro is 27.0 births per 1,000 women. Women in the age bracket of 35 to 50 years have the highest fertility rate with 41.0 births per 1,000 women. Women in the age bracket of 35 to 50 years acount for 57.1% of all women with births.
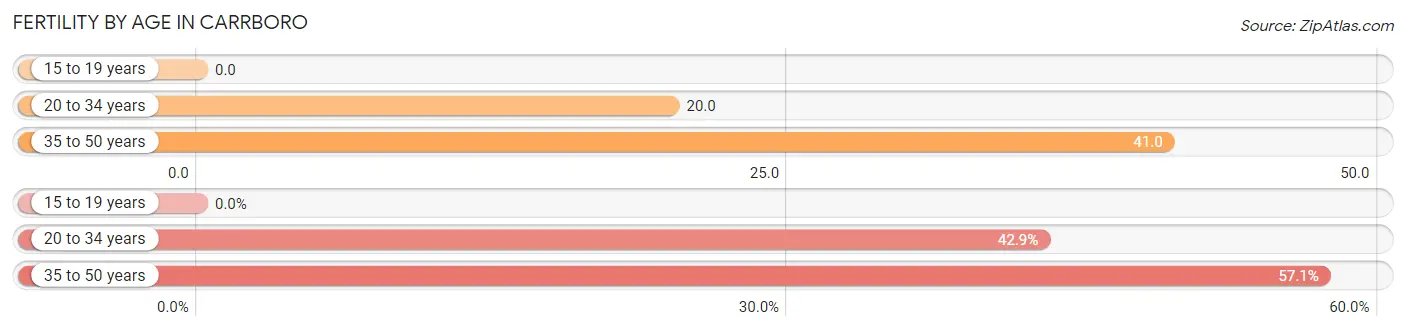
| Age Bracket | Women with Births | Births / 1,000 Women |
| 15 to 19 years | 0 (0.0%) | 0.0 |
| 20 to 34 years | 66 (42.9%) | 20.0 |
| 35 to 50 years | 88 (57.1%) | 41.0 |
| Total | 154 (100.0%) | 27.0 |
Fertility by Age by Marriage Status in Carrboro
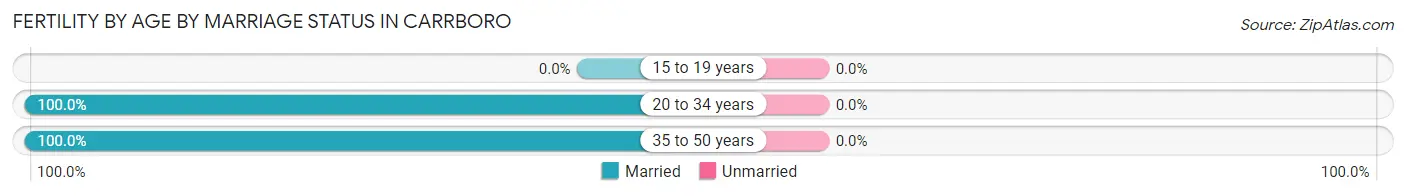
| Age Bracket | Married | Unmarried |
| 15 to 19 years | 0 (0.0%) | 0 (0.0%) |
| 20 to 34 years | 66 (100.0%) | 0 (0.0%) |
| 35 to 50 years | 88 (100.0%) | 0 (0.0%) |
| Total | 154 (100.0%) | 0 (0.0%) |
Fertility by Education in Carrboro
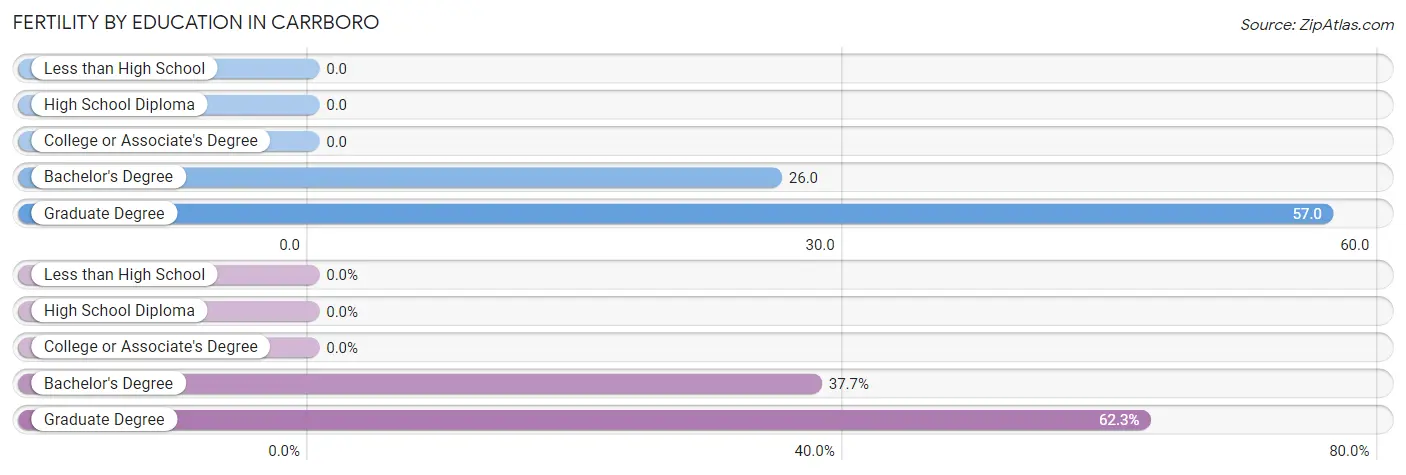
| Educational Attainment | Women with Births | Births / 1,000 Women |
| Less than High School | 0 (0.0%) | 0.0 |
| High School Diploma | 0 (0.0%) | 0.0 |
| College or Associate's Degree | 0 (0.0%) | 0.0 |
| Bachelor's Degree | 58 (37.7%) | 26.0 |
| Graduate Degree | 96 (62.3%) | 57.0 |
| Total | 154 (100.0%) | 27.0 |
Fertility by Education by Marriage Status in Carrboro
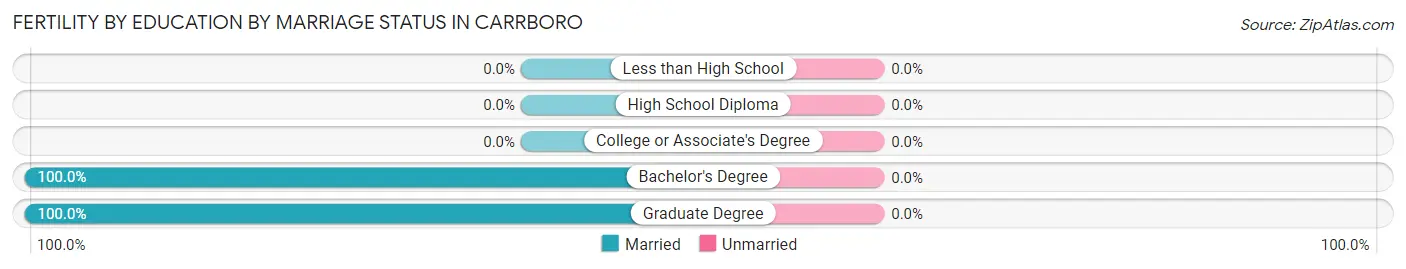
| Educational Attainment | Married | Unmarried |
| Less than High School | 0 (0.0%) | 0 (0.0%) |
| High School Diploma | 0 (0.0%) | 0 (0.0%) |
| College or Associate's Degree | 0 (0.0%) | 0 (0.0%) |
| Bachelor's Degree | 58 (100.0%) | 0 (0.0%) |
| Graduate Degree | 96 (100.0%) | 0 (0.0%) |
| Total | 154 (100.0%) | 0 (0.0%) |
Employment Characteristics in Carrboro
Employment by Class of Employer in Carrboro
Among the 11,818 employed individuals in Carrboro, private company employees (5,473 | 46.3%), state government employees (3,209 | 27.2%), and not-for-profit organizations (1,482 | 12.5%) make up the most common classes of employment.
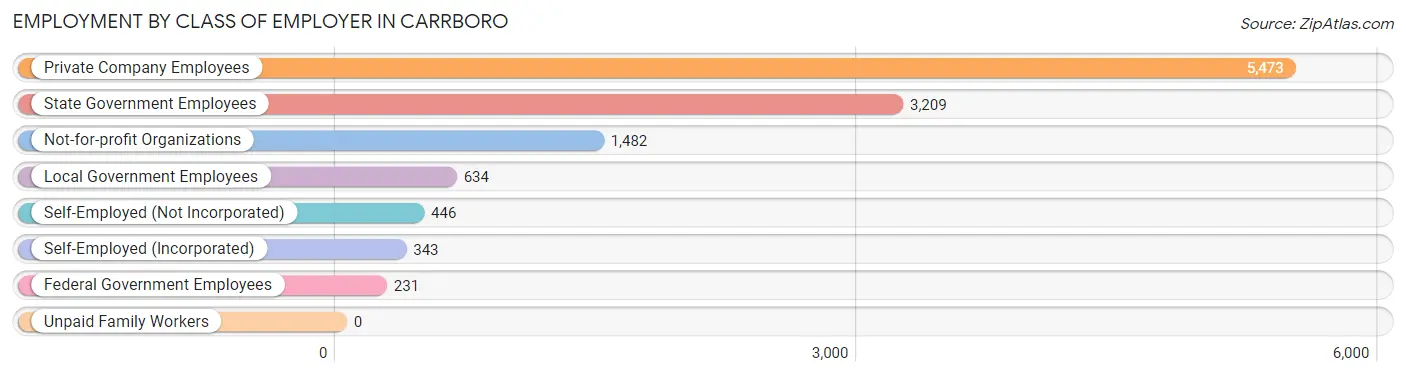
| Employer Class | # Employees | % Employees |
| Private Company Employees | 5,473 | 46.3% |
| Self-Employed (Incorporated) | 343 | 2.9% |
| Self-Employed (Not Incorporated) | 446 | 3.8% |
| Not-for-profit Organizations | 1,482 | 12.5% |
| Local Government Employees | 634 | 5.4% |
| State Government Employees | 3,209 | 27.2% |
| Federal Government Employees | 231 | 1.9% |
| Unpaid Family Workers | 0 | 0.0% |
| Total | 11,818 | 100.0% |
Employment Status by Age in Carrboro
According to the labor force statistics for Carrboro, out of the total population over 16 years of age (17,157), 72.7% or 12,473 individuals are in the labor force, with 3.6% or 449 of them unemployed. The age group with the highest labor force participation rate is 35 to 44 years, with 93.4% or 2,853 individuals in the labor force. Within the labor force, the 16 to 19 years age range has the highest percentage of unemployed individuals, with 28.1% or 56 of them being unemployed.
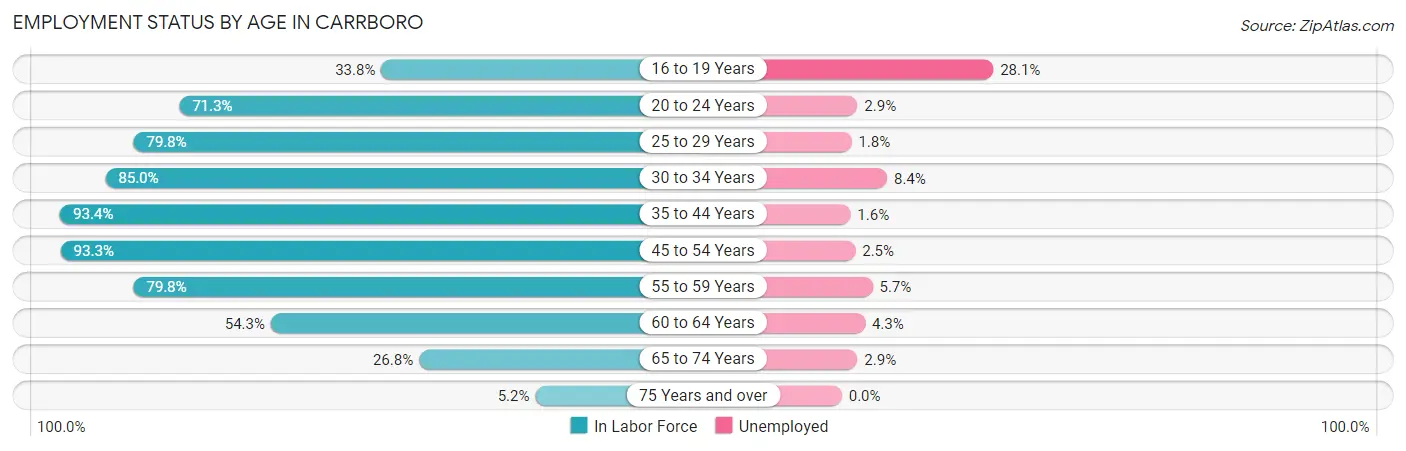
| Age Bracket | In Labor Force | Unemployed |
| 16 to 19 Years | 199 (33.8%) | 56 (28.1%) |
| 20 to 24 Years | 1,750 (71.3%) | 51 (2.9%) |
| 25 to 29 Years | 1,997 (79.8%) | 36 (1.8%) |
| 30 to 34 Years | 1,363 (85.0%) | 114 (8.4%) |
| 35 to 44 Years | 2,853 (93.4%) | 46 (1.6%) |
| 45 to 54 Years | 2,597 (93.3%) | 65 (2.5%) |
| 55 to 59 Years | 828 (79.8%) | 47 (5.7%) |
| 60 to 64 Years | 483 (54.3%) | 21 (4.3%) |
| 65 to 74 Years | 349 (26.8%) | 10 (2.9%) |
| 75 Years and over | 49 (5.2%) | 0 (0.0%) |
| Total | 12,473 (72.7%) | 449 (3.6%) |
Employment Status by Educational Attainment in Carrboro
According to labor force statistics for Carrboro, 85.3% of individuals (10,128) out of the total population between 25 and 64 years of age (11,873) are in the labor force, with 3.2% or 324 of them being unemployed. The group with the highest labor force participation rate are those with the educational attainment of bachelor's degree or higher, with 88.2% or 7,652 individuals in the labor force. Within the labor force, individuals with college / associate degree education have the highest percentage of unemployment, with 6.6% or 119 of them being unemployed.
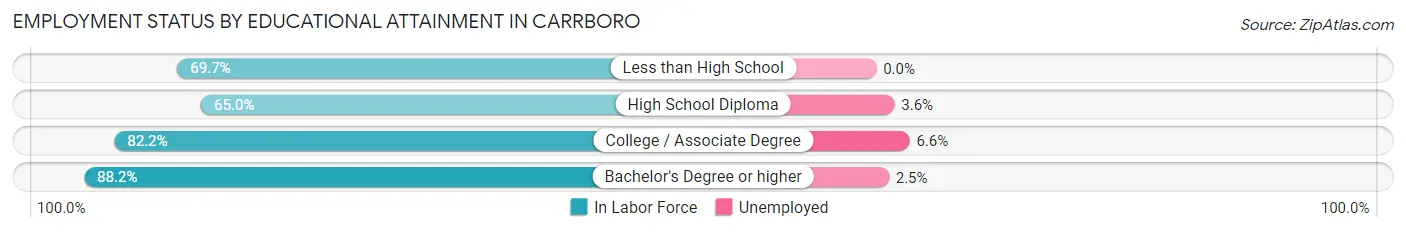
| Educational Attainment | In Labor Force | Unemployed |
| Less than High School | 214 (69.7%) | 0 (0.0%) |
| High School Diploma | 448 (65.0%) | 25 (3.6%) |
| College / Associate Degree | 1,809 (82.2%) | 145 (6.6%) |
| Bachelor's Degree or higher | 7,652 (88.2%) | 217 (2.5%) |
| Total | 10,128 (85.3%) | 380 (3.2%) |
Employment Occupations by Sex in Carrboro
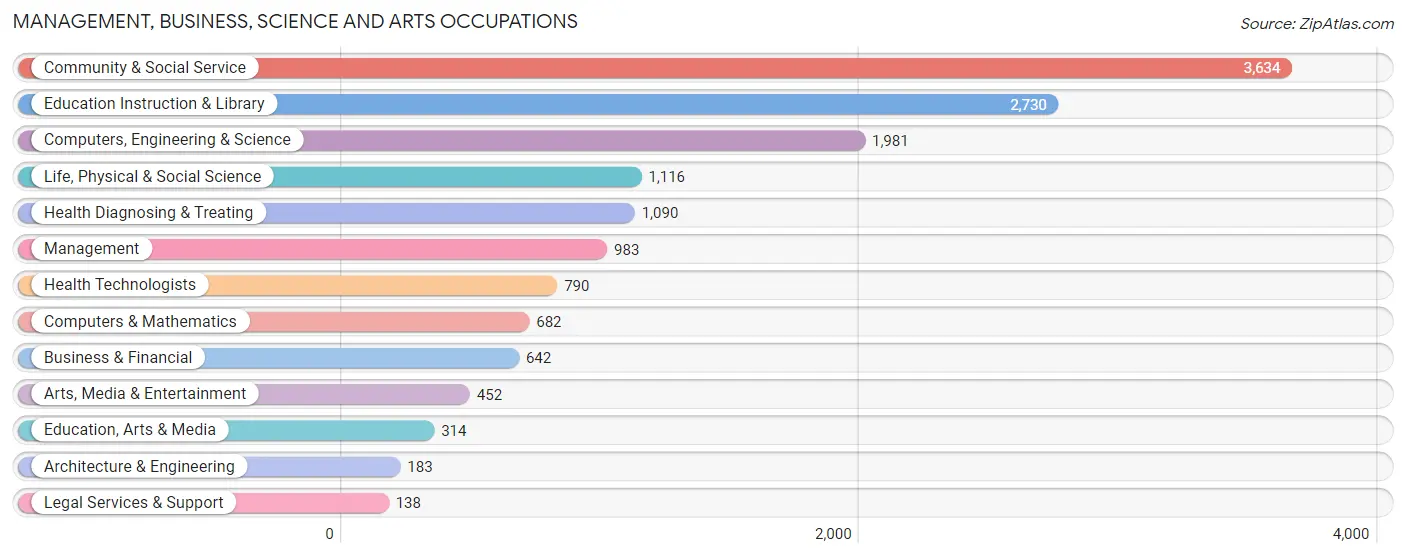
Management, Business, Science and Arts Occupations
The most common Management, Business, Science and Arts occupations in Carrboro are Community & Social Service (3,634 | 30.2%), Education Instruction & Library (2,730 | 22.7%), Computers, Engineering & Science (1,981 | 16.5%), Life, Physical & Social Science (1,116 | 9.3%), and Health Diagnosing & Treating (1,090 | 9.1%).
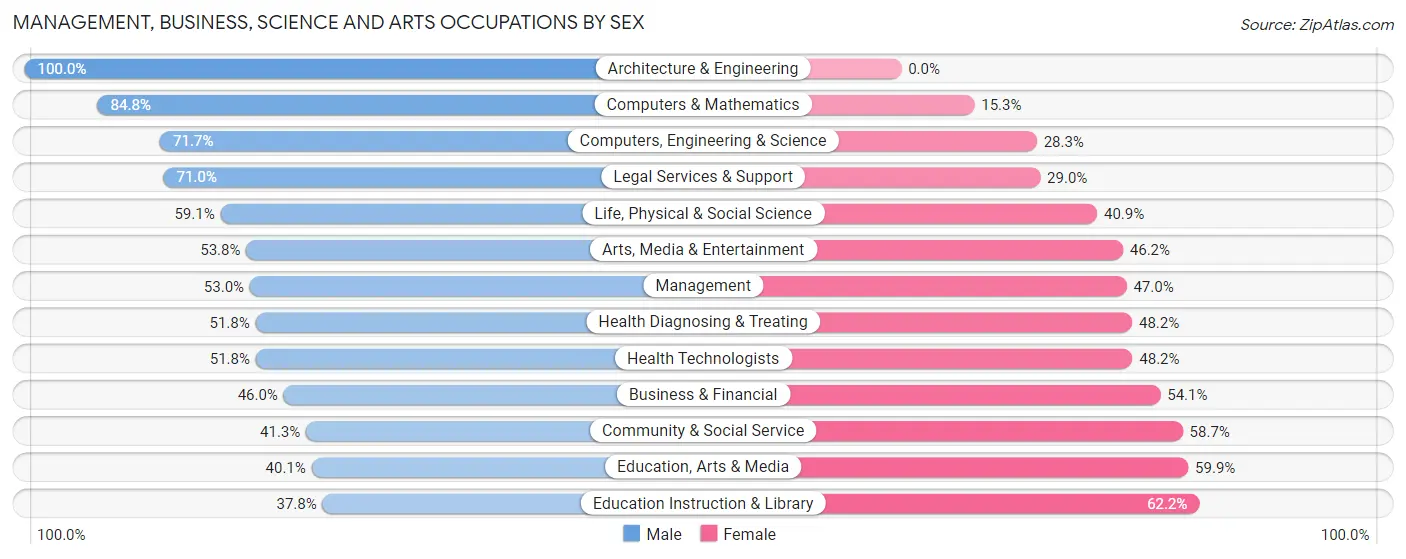
Management, Business, Science and Arts Occupations by Sex
Within the Management, Business, Science and Arts occupations in Carrboro, the most male-oriented occupations are Architecture & Engineering (100.0%), Computers & Mathematics (84.8%), and Computers, Engineering & Science (71.7%), while the most female-oriented occupations are Education Instruction & Library (62.2%), Education, Arts & Media (59.9%), and Community & Social Service (58.7%).
| Occupation | Male | Female |
| Management | 521 (53.0%) | 462 (47.0%) |
| Business & Financial | 295 (46.0%) | 347 (54.0%) |
| Computers, Engineering & Science | 1,421 (71.7%) | 560 (28.3%) |
| Computers & Mathematics | 578 (84.8%) | 104 (15.2%) |
| Architecture & Engineering | 183 (100.0%) | 0 (0.0%) |
| Life, Physical & Social Science | 660 (59.1%) | 456 (40.9%) |
| Community & Social Service | 1,500 (41.3%) | 2,134 (58.7%) |
| Education, Arts & Media | 126 (40.1%) | 188 (59.9%) |
| Legal Services & Support | 98 (71.0%) | 40 (29.0%) |
| Education Instruction & Library | 1,033 (37.8%) | 1,697 (62.2%) |
| Arts, Media & Entertainment | 243 (53.8%) | 209 (46.2%) |
| Health Diagnosing & Treating | 565 (51.8%) | 525 (48.2%) |
| Health Technologists | 409 (51.8%) | 381 (48.2%) |
| Total (Category) | 4,302 (51.6%) | 4,028 (48.4%) |
| Total (Overall) | 6,224 (51.7%) | 5,802 (48.2%) |
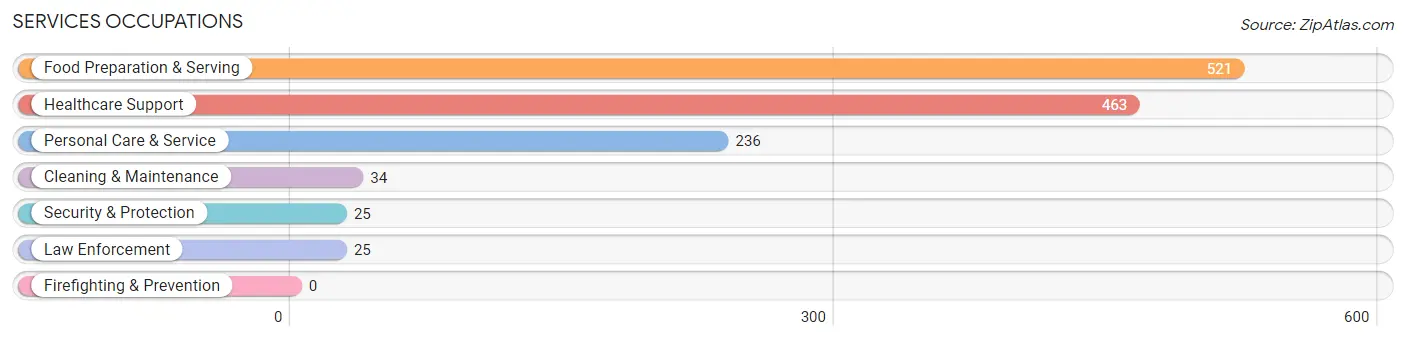
Services Occupations
The most common Services occupations in Carrboro are Food Preparation & Serving (521 | 4.3%), Healthcare Support (463 | 3.8%), Personal Care & Service (236 | 2.0%), Cleaning & Maintenance (34 | 0.3%), and Security & Protection (25 | 0.2%).
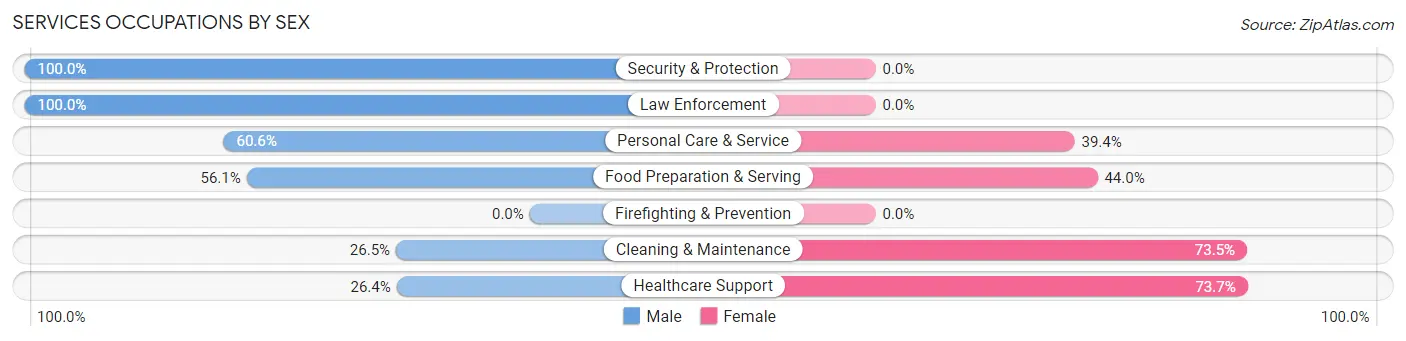
Services Occupations by Sex
Within the Services occupations in Carrboro, the most male-oriented occupations are Security & Protection (100.0%), Law Enforcement (100.0%), and Personal Care & Service (60.6%), while the most female-oriented occupations are Healthcare Support (73.7%), Cleaning & Maintenance (73.5%), and Food Preparation & Serving (44.0%).
| Occupation | Male | Female |
| Healthcare Support | 122 (26.4%) | 341 (73.7%) |
| Security & Protection | 25 (100.0%) | 0 (0.0%) |
| Firefighting & Prevention | 0 (0.0%) | 0 (0.0%) |
| Law Enforcement | 25 (100.0%) | 0 (0.0%) |
| Food Preparation & Serving | 292 (56.0%) | 229 (44.0%) |
| Cleaning & Maintenance | 9 (26.5%) | 25 (73.5%) |
| Personal Care & Service | 143 (60.6%) | 93 (39.4%) |
| Total (Category) | 591 (46.2%) | 688 (53.8%) |
| Total (Overall) | 6,224 (51.7%) | 5,802 (48.2%) |
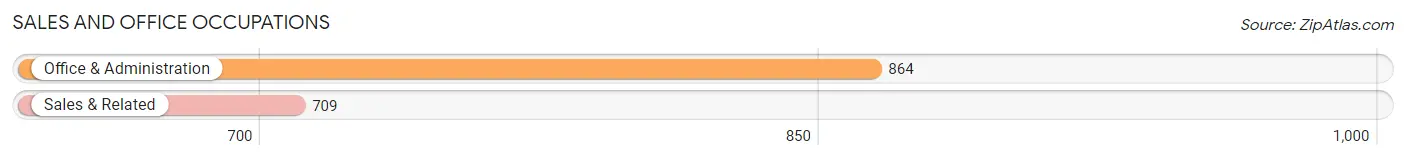
Sales and Office Occupations
The most common Sales and Office occupations in Carrboro are Office & Administration (864 | 7.2%), and Sales & Related (709 | 5.9%).
Sales and Office Occupations by Sex
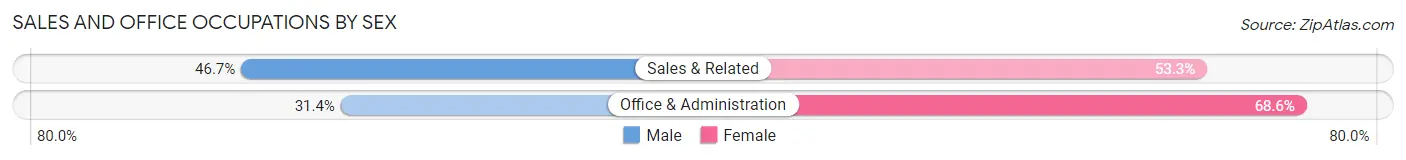
| Occupation | Male | Female |
| Sales & Related | 331 (46.7%) | 378 (53.3%) |
| Office & Administration | 271 (31.4%) | 593 (68.6%) |
| Total (Category) | 602 (38.3%) | 971 (61.7%) |
| Total (Overall) | 6,224 (51.7%) | 5,802 (48.2%) |
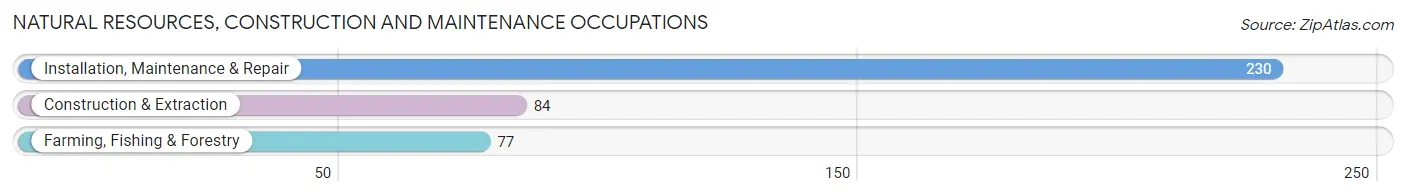
Natural Resources, Construction and Maintenance Occupations
The most common Natural Resources, Construction and Maintenance occupations in Carrboro are Installation, Maintenance & Repair (230 | 1.9%), Construction & Extraction (84 | 0.7%), and Farming, Fishing & Forestry (77 | 0.6%).
Natural Resources, Construction and Maintenance Occupations by Sex
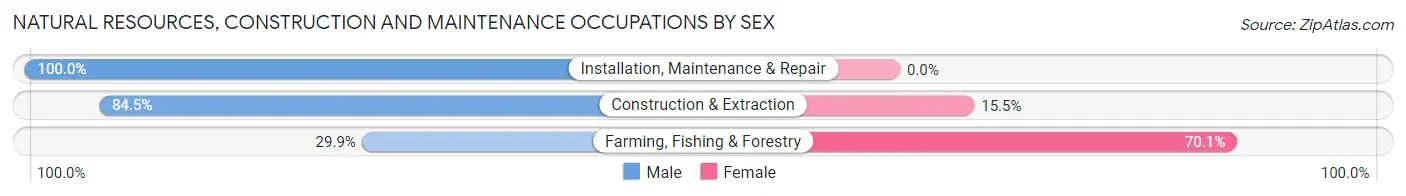
| Occupation | Male | Female |
| Farming, Fishing & Forestry | 23 (29.9%) | 54 (70.1%) |
| Construction & Extraction | 71 (84.5%) | 13 (15.5%) |
| Installation, Maintenance & Repair | 230 (100.0%) | 0 (0.0%) |
| Total (Category) | 324 (82.9%) | 67 (17.1%) |
| Total (Overall) | 6,224 (51.7%) | 5,802 (48.2%) |
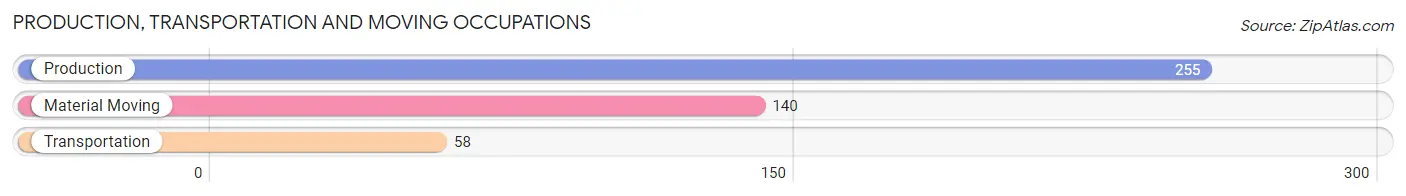
Production, Transportation and Moving Occupations
The most common Production, Transportation and Moving occupations in Carrboro are Production (255 | 2.1%), Material Moving (140 | 1.2%), and Transportation (58 | 0.5%).
Production, Transportation and Moving Occupations by Sex
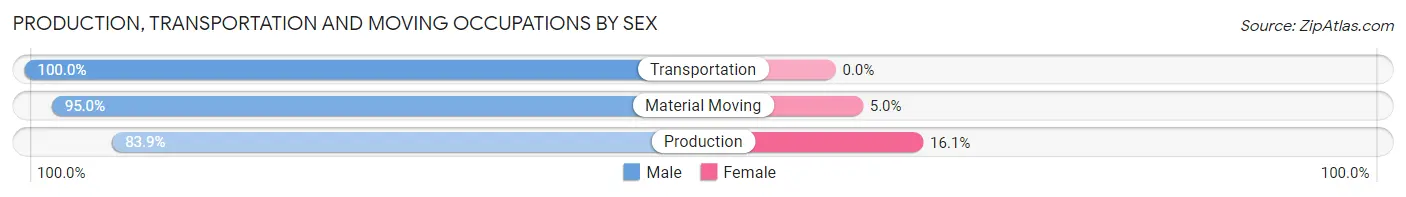
| Occupation | Male | Female |
| Production | 214 (83.9%) | 41 (16.1%) |
| Transportation | 58 (100.0%) | 0 (0.0%) |
| Material Moving | 133 (95.0%) | 7 (5.0%) |
| Total (Category) | 405 (89.4%) | 48 (10.6%) |
| Total (Overall) | 6,224 (51.7%) | 5,802 (48.2%) |
Employment Industries by Sex in Carrboro
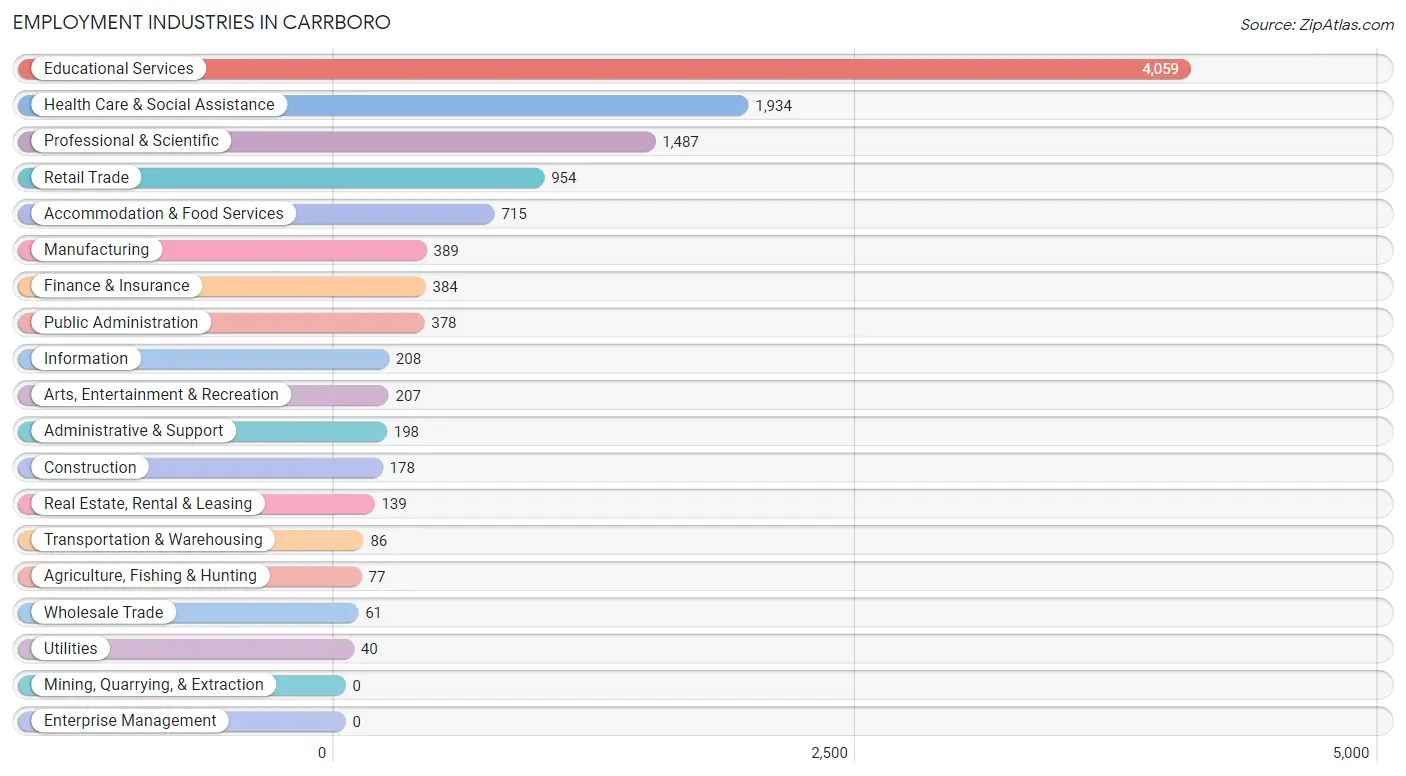
Employment Industries in Carrboro
The major employment industries in Carrboro include Educational Services (4,059 | 33.8%), Health Care & Social Assistance (1,934 | 16.1%), Professional & Scientific (1,487 | 12.4%), Retail Trade (954 | 7.9%), and Accommodation & Food Services (715 | 5.9%).
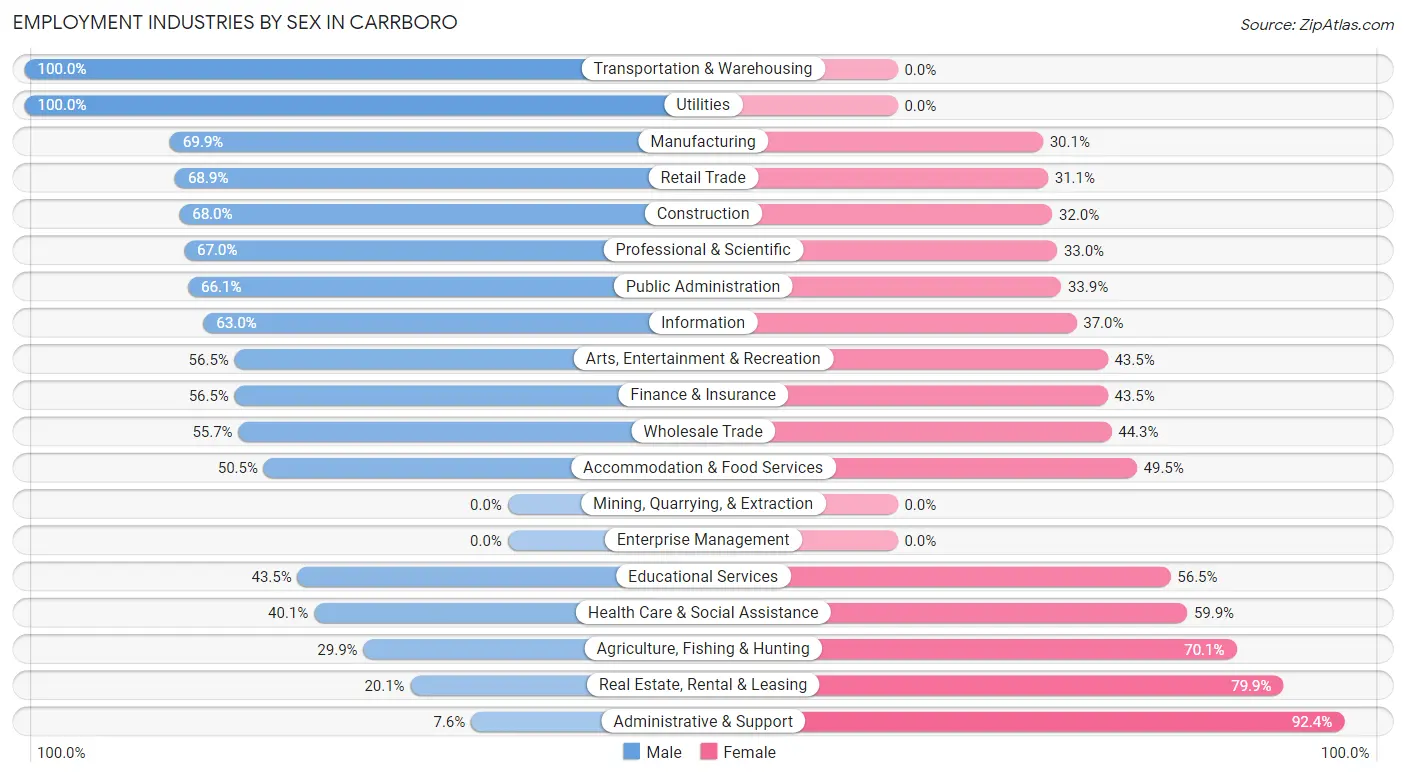
Employment Industries by Sex in Carrboro
The Carrboro industries that see more men than women are Transportation & Warehousing (100.0%), Utilities (100.0%), and Manufacturing (69.9%), whereas the industries that tend to have a higher number of women are Administrative & Support (92.4%), Real Estate, Rental & Leasing (79.9%), and Agriculture, Fishing & Hunting (70.1%).
| Industry | Male | Female |
| Agriculture, Fishing & Hunting | 23 (29.9%) | 54 (70.1%) |
| Mining, Quarrying, & Extraction | 0 (0.0%) | 0 (0.0%) |
| Construction | 121 (68.0%) | 57 (32.0%) |
| Manufacturing | 272 (69.9%) | 117 (30.1%) |
| Wholesale Trade | 34 (55.7%) | 27 (44.3%) |
| Retail Trade | 657 (68.9%) | 297 (31.1%) |
| Transportation & Warehousing | 86 (100.0%) | 0 (0.0%) |
| Utilities | 40 (100.0%) | 0 (0.0%) |
| Information | 131 (63.0%) | 77 (37.0%) |
| Finance & Insurance | 217 (56.5%) | 167 (43.5%) |
| Real Estate, Rental & Leasing | 28 (20.1%) | 111 (79.9%) |
| Professional & Scientific | 996 (67.0%) | 491 (33.0%) |
| Enterprise Management | 0 (0.0%) | 0 (0.0%) |
| Administrative & Support | 15 (7.6%) | 183 (92.4%) |
| Educational Services | 1,766 (43.5%) | 2,293 (56.5%) |
| Health Care & Social Assistance | 775 (40.1%) | 1,159 (59.9%) |
| Arts, Entertainment & Recreation | 117 (56.5%) | 90 (43.5%) |
| Accommodation & Food Services | 361 (50.5%) | 354 (49.5%) |
| Public Administration | 250 (66.1%) | 128 (33.9%) |
| Total | 6,224 (51.7%) | 5,802 (48.2%) |
Education in Carrboro
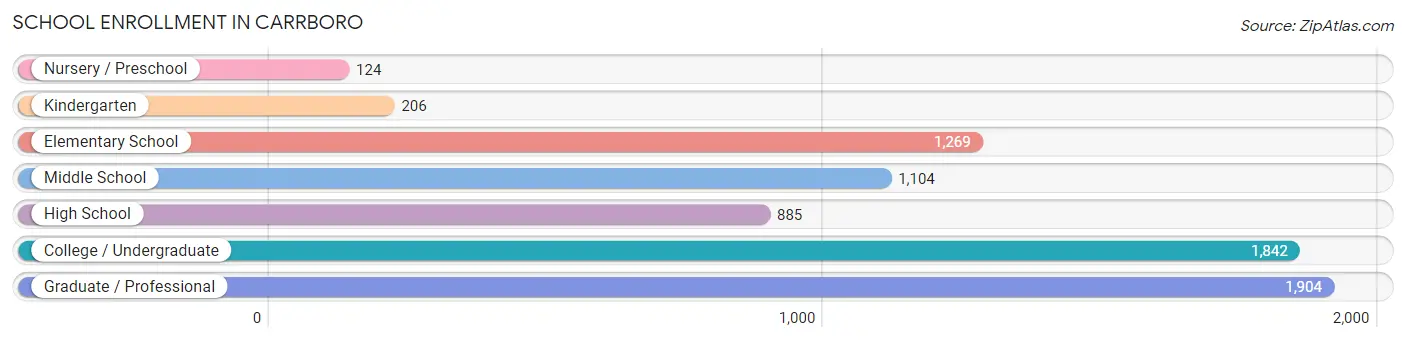
School Enrollment in Carrboro
The most common levels of schooling among the 7,334 students in Carrboro are graduate / professional (1,904 | 26.0%), college / undergraduate (1,842 | 25.1%), and elementary school (1,269 | 17.3%).
| School Level | # Students | % Students |
| Nursery / Preschool | 124 | 1.7% |
| Kindergarten | 206 | 2.8% |
| Elementary School | 1,269 | 17.3% |
| Middle School | 1,104 | 15.0% |
| High School | 885 | 12.1% |
| College / Undergraduate | 1,842 | 25.1% |
| Graduate / Professional | 1,904 | 26.0% |
| Total | 7,334 | 100.0% |
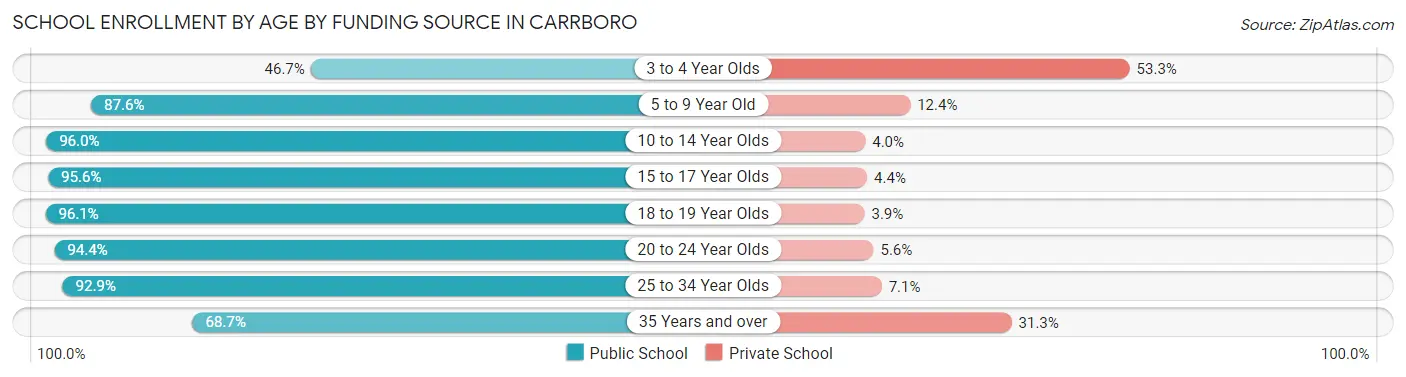
School Enrollment by Age by Funding Source in Carrboro
Out of a total of 7,334 students who are enrolled in schools in Carrboro, 763 (10.4%) attend a private institution, while the remaining 6,571 (89.6%) are enrolled in public schools. The age group of 3 to 4 year olds has the highest likelihood of being enrolled in private schools, with 57 (53.3% in the age bracket) enrolled. Conversely, the age group of 18 to 19 year olds has the lowest likelihood of being enrolled in a private school, with 173 (96.1% in the age bracket) attending a public institution.
| Age Bracket | Public School | Private School |
| 3 to 4 Year Olds | 50 (46.7%) | 57 (53.3%) |
| 5 to 9 Year Old | 1,109 (87.6%) | 157 (12.4%) |
| 10 to 14 Year Olds | 1,428 (96.0%) | 60 (4.0%) |
| 15 to 17 Year Olds | 612 (95.6%) | 28 (4.4%) |
| 18 to 19 Year Olds | 173 (96.1%) | 7 (3.9%) |
| 20 to 24 Year Olds | 1,206 (94.4%) | 71 (5.6%) |
| 25 to 34 Year Olds | 1,376 (92.9%) | 105 (7.1%) |
| 35 Years and over | 615 (68.7%) | 280 (31.3%) |
| Total | 6,571 (89.6%) | 763 (10.4%) |
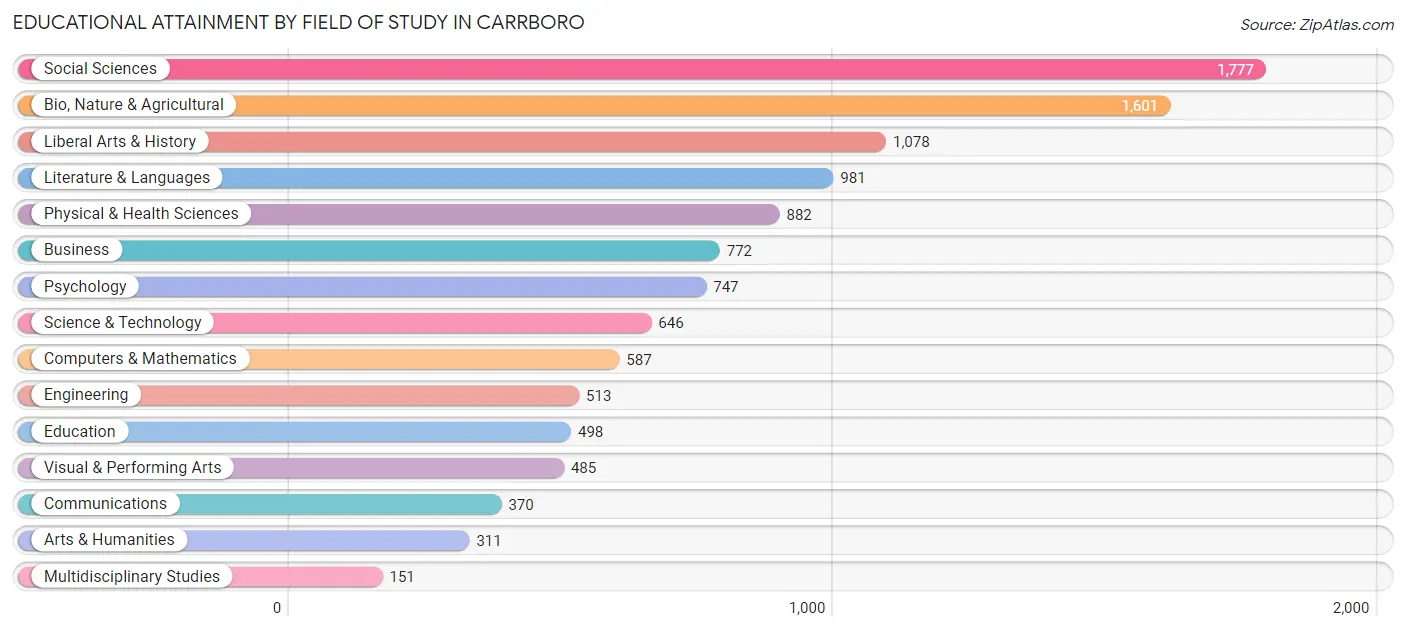
Educational Attainment by Field of Study in Carrboro
Social sciences (1,777 | 15.6%), bio, nature & agricultural (1,601 | 14.1%), liberal arts & history (1,078 | 9.5%), literature & languages (981 | 8.6%), and physical & health sciences (882 | 7.7%) are the most common fields of study among 11,399 individuals in Carrboro who have obtained a bachelor's degree or higher.
| Field of Study | # Graduates | % Graduates |
| Computers & Mathematics | 587 | 5.1% |
| Bio, Nature & Agricultural | 1,601 | 14.1% |
| Physical & Health Sciences | 882 | 7.7% |
| Psychology | 747 | 6.6% |
| Social Sciences | 1,777 | 15.6% |
| Engineering | 513 | 4.5% |
| Multidisciplinary Studies | 151 | 1.3% |
| Science & Technology | 646 | 5.7% |
| Business | 772 | 6.8% |
| Education | 498 | 4.4% |
| Literature & Languages | 981 | 8.6% |
| Liberal Arts & History | 1,078 | 9.5% |
| Visual & Performing Arts | 485 | 4.3% |
| Communications | 370 | 3.3% |
| Arts & Humanities | 311 | 2.7% |
| Total | 11,399 | 100.0% |
Transportation & Commute in Carrboro
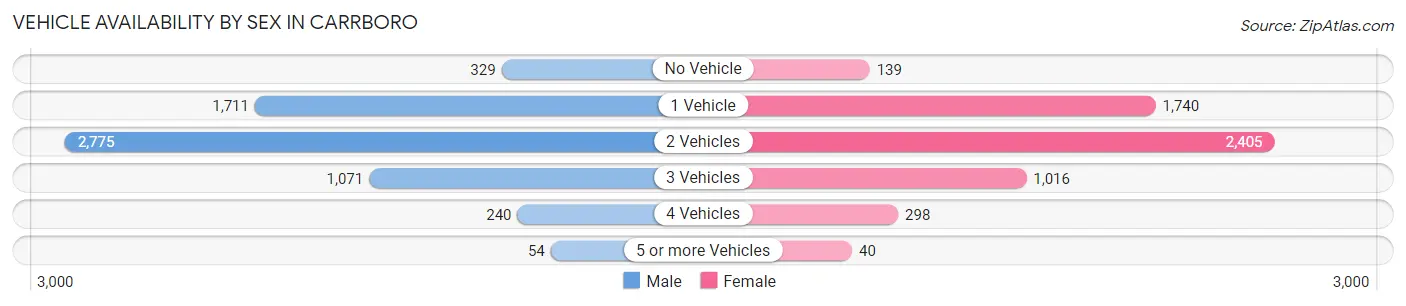
Vehicle Availability by Sex in Carrboro
The most prevalent vehicle ownership categories in Carrboro are males with 2 vehicles (2,775, accounting for 44.9%) and females with 2 vehicles (2,405, making up 49.2%).
| Vehicles Available | Male | Female |
| No Vehicle | 329 (5.3%) | 139 (2.5%) |
| 1 Vehicle | 1,711 (27.7%) | 1,740 (30.9%) |
| 2 Vehicles | 2,775 (44.9%) | 2,405 (42.7%) |
| 3 Vehicles | 1,071 (17.3%) | 1,016 (18.0%) |
| 4 Vehicles | 240 (3.9%) | 298 (5.3%) |
| 5 or more Vehicles | 54 (0.9%) | 40 (0.7%) |
| Total | 6,180 (100.0%) | 5,638 (100.0%) |
Commute Time in Carrboro
The most frequently occuring commute durations in Carrboro are 20 to 24 minutes (1,488 commuters, 16.1%), 15 to 19 minutes (1,476 commuters, 16.0%), and 10 to 14 minutes (1,397 commuters, 15.1%).
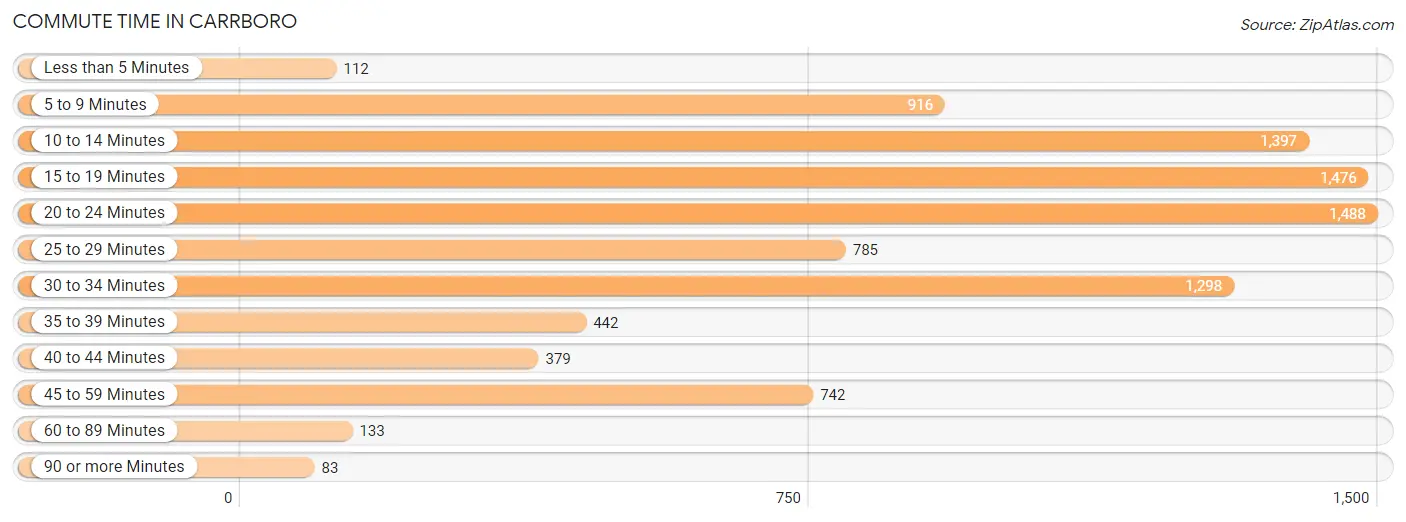
| Commute Time | # Commuters | % Commuters |
| Less than 5 Minutes | 112 | 1.2% |
| 5 to 9 Minutes | 916 | 9.9% |
| 10 to 14 Minutes | 1,397 | 15.1% |
| 15 to 19 Minutes | 1,476 | 16.0% |
| 20 to 24 Minutes | 1,488 | 16.1% |
| 25 to 29 Minutes | 785 | 8.5% |
| 30 to 34 Minutes | 1,298 | 14.0% |
| 35 to 39 Minutes | 442 | 4.8% |
| 40 to 44 Minutes | 379 | 4.1% |
| 45 to 59 Minutes | 742 | 8.0% |
| 60 to 89 Minutes | 133 | 1.4% |
| 90 or more Minutes | 83 | 0.9% |
Commute Time by Sex in Carrboro
The most common commute times in Carrboro are 20 to 24 minutes (899 commuters, 17.8%) for males and 15 to 19 minutes (771 commuters, 18.4%) for females.

| Commute Time | Male | Female |
| Less than 5 Minutes | 19 (0.4%) | 93 (2.2%) |
| 5 to 9 Minutes | 496 (9.8%) | 420 (10.0%) |
| 10 to 14 Minutes | 687 (13.6%) | 710 (16.9%) |
| 15 to 19 Minutes | 705 (14.0%) | 771 (18.4%) |
| 20 to 24 Minutes | 899 (17.8%) | 589 (14.0%) |
| 25 to 29 Minutes | 385 (7.6%) | 400 (9.5%) |
| 30 to 34 Minutes | 826 (16.3%) | 472 (11.3%) |
| 35 to 39 Minutes | 214 (4.2%) | 228 (5.4%) |
| 40 to 44 Minutes | 223 (4.4%) | 156 (3.7%) |
| 45 to 59 Minutes | 453 (9.0%) | 289 (6.9%) |
| 60 to 89 Minutes | 65 (1.3%) | 68 (1.6%) |
| 90 or more Minutes | 83 (1.6%) | 0 (0.0%) |
Time of Departure to Work by Sex in Carrboro
The most frequent times of departure to work in Carrboro are 7:30 AM to 7:59 AM (976, 19.3%) for males and 7:30 AM to 7:59 AM (884, 21.1%) for females.
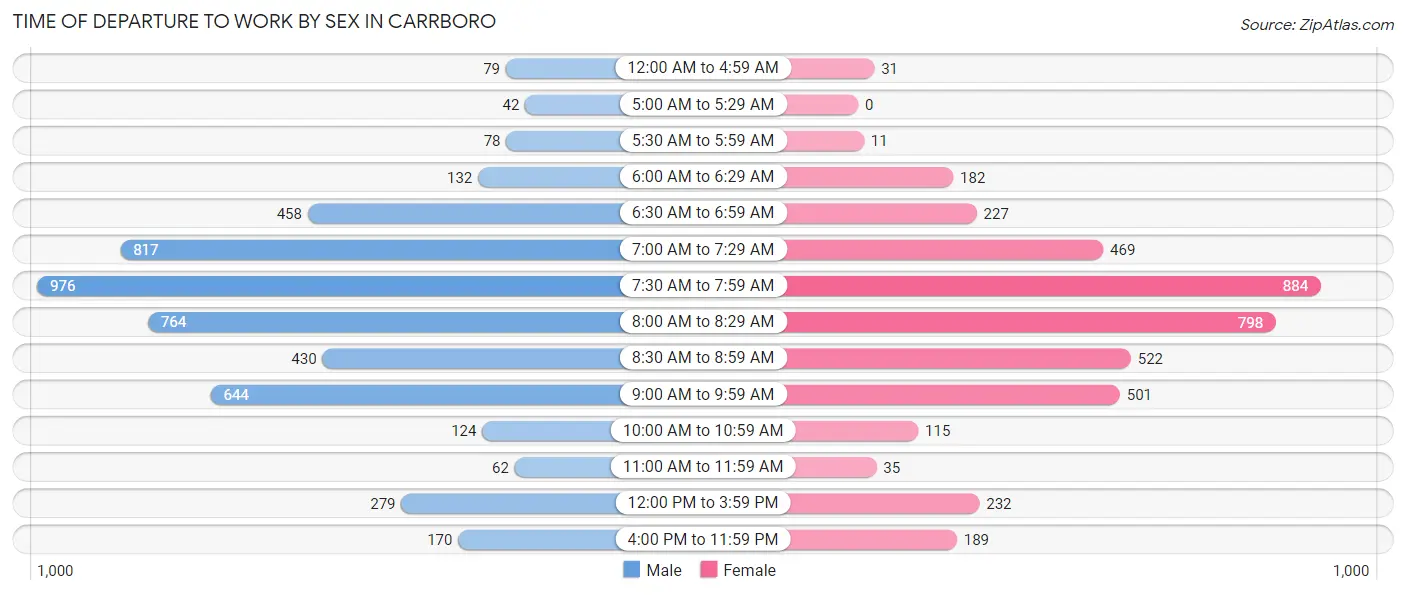
| Time of Departure | Male | Female |
| 12:00 AM to 4:59 AM | 79 (1.6%) | 31 (0.7%) |
| 5:00 AM to 5:29 AM | 42 (0.8%) | 0 (0.0%) |
| 5:30 AM to 5:59 AM | 78 (1.5%) | 11 (0.3%) |
| 6:00 AM to 6:29 AM | 132 (2.6%) | 182 (4.3%) |
| 6:30 AM to 6:59 AM | 458 (9.1%) | 227 (5.4%) |
| 7:00 AM to 7:29 AM | 817 (16.2%) | 469 (11.2%) |
| 7:30 AM to 7:59 AM | 976 (19.3%) | 884 (21.1%) |
| 8:00 AM to 8:29 AM | 764 (15.1%) | 798 (19.0%) |
| 8:30 AM to 8:59 AM | 430 (8.5%) | 522 (12.4%) |
| 9:00 AM to 9:59 AM | 644 (12.7%) | 501 (11.9%) |
| 10:00 AM to 10:59 AM | 124 (2.5%) | 115 (2.7%) |
| 11:00 AM to 11:59 AM | 62 (1.2%) | 35 (0.8%) |
| 12:00 PM to 3:59 PM | 279 (5.5%) | 232 (5.5%) |
| 4:00 PM to 11:59 PM | 170 (3.4%) | 189 (4.5%) |
| Total | 5,055 (100.0%) | 4,196 (100.0%) |
Housing Occupancy in Carrboro
Occupancy by Ownership in Carrboro
Of the total 9,182 dwellings in Carrboro, owner-occupied units account for 3,994 (43.5%), while renter-occupied units make up 5,188 (56.5%).
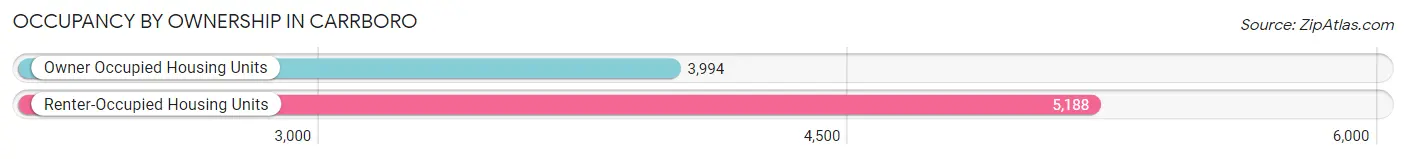
| Occupancy | # Housing Units | % Housing Units |
| Owner Occupied Housing Units | 3,994 | 43.5% |
| Renter-Occupied Housing Units | 5,188 | 56.5% |
| Total Occupied Housing Units | 9,182 | 100.0% |
Occupancy by Household Size in Carrboro
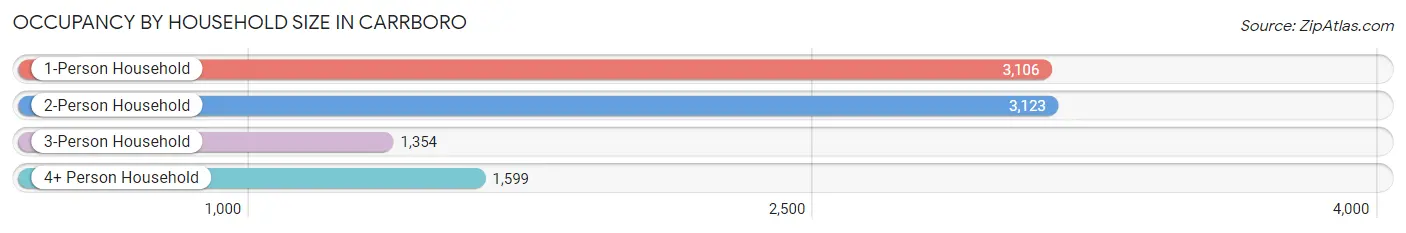
| Household Size | # Housing Units | % Housing Units |
| 1-Person Household | 3,106 | 33.8% |
| 2-Person Household | 3,123 | 34.0% |
| 3-Person Household | 1,354 | 14.7% |
| 4+ Person Household | 1,599 | 17.4% |
| Total Housing Units | 9,182 | 100.0% |
Occupancy by Ownership by Household Size in Carrboro
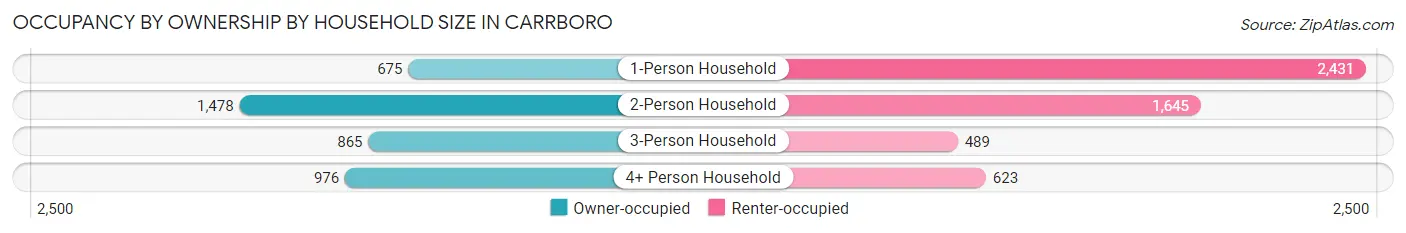
| Household Size | Owner-occupied | Renter-occupied |
| 1-Person Household | 675 (21.7%) | 2,431 (78.3%) |
| 2-Person Household | 1,478 (47.3%) | 1,645 (52.7%) |
| 3-Person Household | 865 (63.9%) | 489 (36.1%) |
| 4+ Person Household | 976 (61.0%) | 623 (39.0%) |
| Total Housing Units | 3,994 (43.5%) | 5,188 (56.5%) |
Occupancy by Educational Attainment in Carrboro
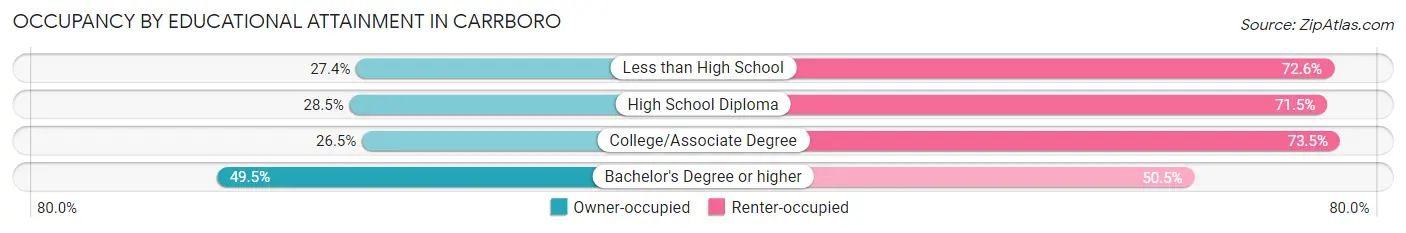
| Household Size | Owner-occupied | Renter-occupied |
| Less than High School | 60 (27.4%) | 159 (72.6%) |
| High School Diploma | 146 (28.5%) | 367 (71.5%) |
| College/Associate Degree | 455 (26.5%) | 1,264 (73.5%) |
| Bachelor's Degree or higher | 3,333 (49.5%) | 3,398 (50.5%) |
Occupancy by Age of Householder in Carrboro
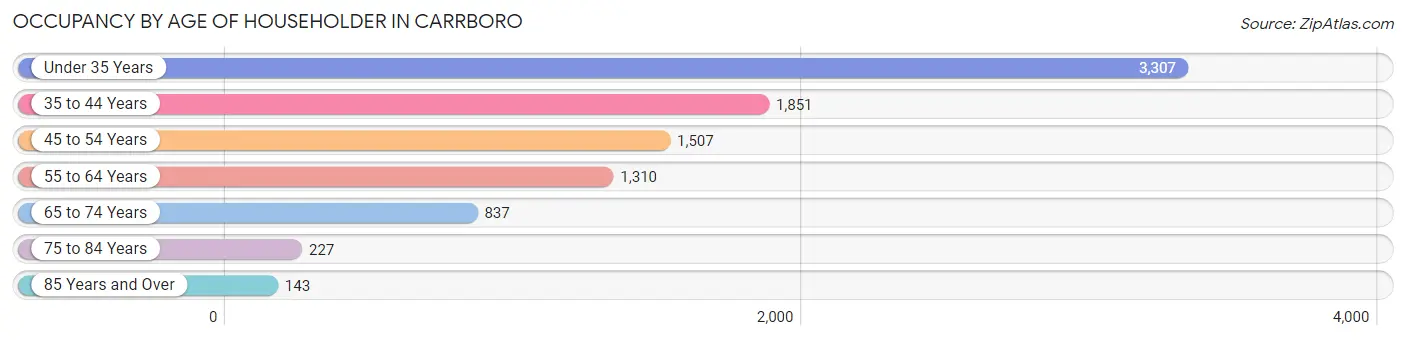
| Age Bracket | # Households | % Households |
| Under 35 Years | 3,307 | 36.0% |
| 35 to 44 Years | 1,851 | 20.2% |
| 45 to 54 Years | 1,507 | 16.4% |
| 55 to 64 Years | 1,310 | 14.3% |
| 65 to 74 Years | 837 | 9.1% |
| 75 to 84 Years | 227 | 2.5% |
| 85 Years and Over | 143 | 1.6% |
| Total | 9,182 | 100.0% |
Housing Finances in Carrboro
Median Income by Occupancy in Carrboro
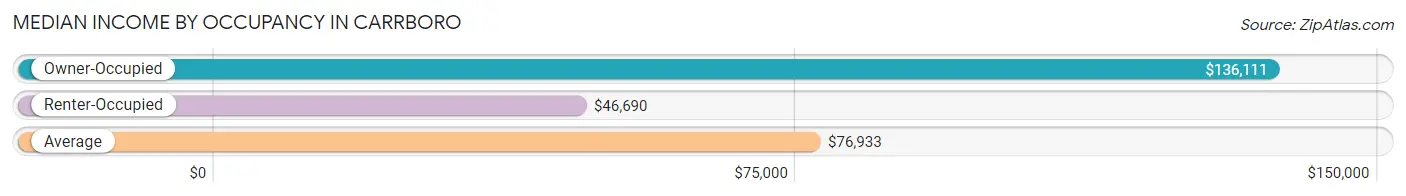
| Occupancy Type | # Households | Median Income |
| Owner-Occupied | 3,994 (43.5%) | $136,111 |
| Renter-Occupied | 5,188 (56.5%) | $46,690 |
| Average | 9,182 (100.0%) | $76,933 |
Occupancy by Householder Income Bracket in Carrboro
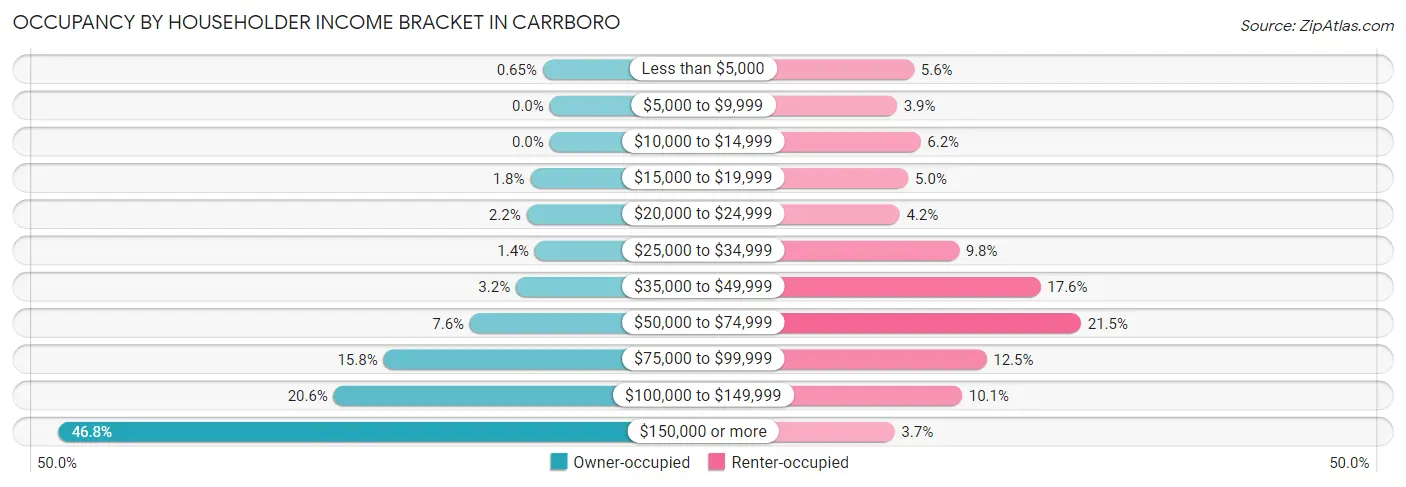
| Income Bracket | Owner-occupied | Renter-occupied |
| Less than $5,000 | 26 (0.6%) | 288 (5.6%) |
| $5,000 to $9,999 | 0 (0.0%) | 204 (3.9%) |
| $10,000 to $14,999 | 0 (0.0%) | 320 (6.2%) |
| $15,000 to $19,999 | 73 (1.8%) | 260 (5.0%) |
| $20,000 to $24,999 | 88 (2.2%) | 217 (4.2%) |
| $25,000 to $34,999 | 56 (1.4%) | 510 (9.8%) |
| $35,000 to $49,999 | 128 (3.2%) | 913 (17.6%) |
| $50,000 to $74,999 | 303 (7.6%) | 1,113 (21.4%) |
| $75,000 to $99,999 | 632 (15.8%) | 646 (12.4%) |
| $100,000 to $149,999 | 821 (20.6%) | 525 (10.1%) |
| $150,000 or more | 1,867 (46.8%) | 192 (3.7%) |
| Total | 3,994 (100.0%) | 5,188 (100.0%) |
Monthly Housing Cost Tiers in Carrboro
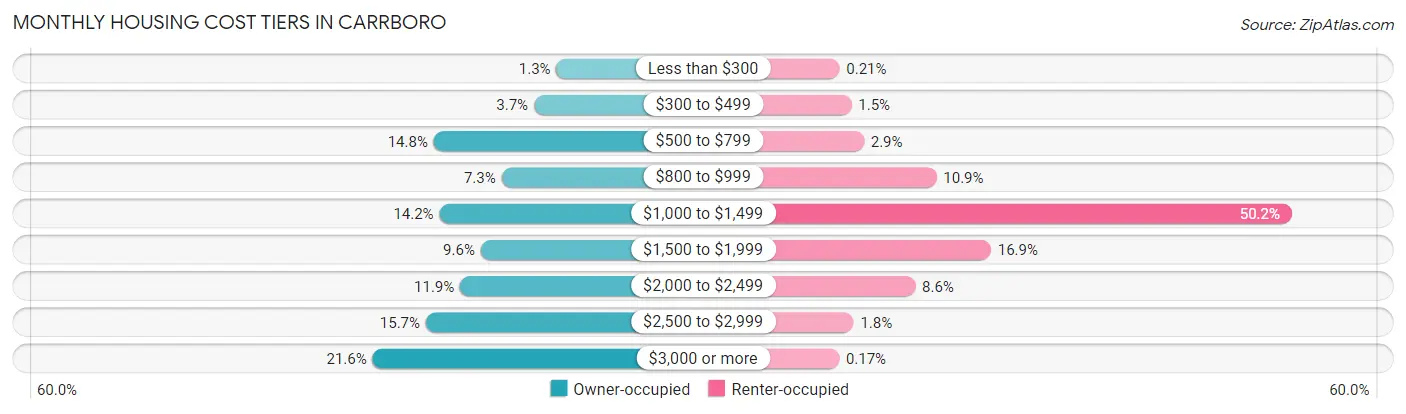
| Monthly Cost | Owner-occupied | Renter-occupied |
| Less than $300 | 50 (1.3%) | 11 (0.2%) |
| $300 to $499 | 149 (3.7%) | 80 (1.5%) |
| $500 to $799 | 591 (14.8%) | 151 (2.9%) |
| $800 to $999 | 292 (7.3%) | 567 (10.9%) |
| $1,000 to $1,499 | 566 (14.2%) | 2,604 (50.2%) |
| $1,500 to $1,999 | 384 (9.6%) | 879 (16.9%) |
| $2,000 to $2,499 | 475 (11.9%) | 445 (8.6%) |
| $2,500 to $2,999 | 626 (15.7%) | 92 (1.8%) |
| $3,000 or more | 861 (21.6%) | 9 (0.2%) |
| Total | 3,994 (100.0%) | 5,188 (100.0%) |
Physical Housing Characteristics in Carrboro
Housing Structures in Carrboro
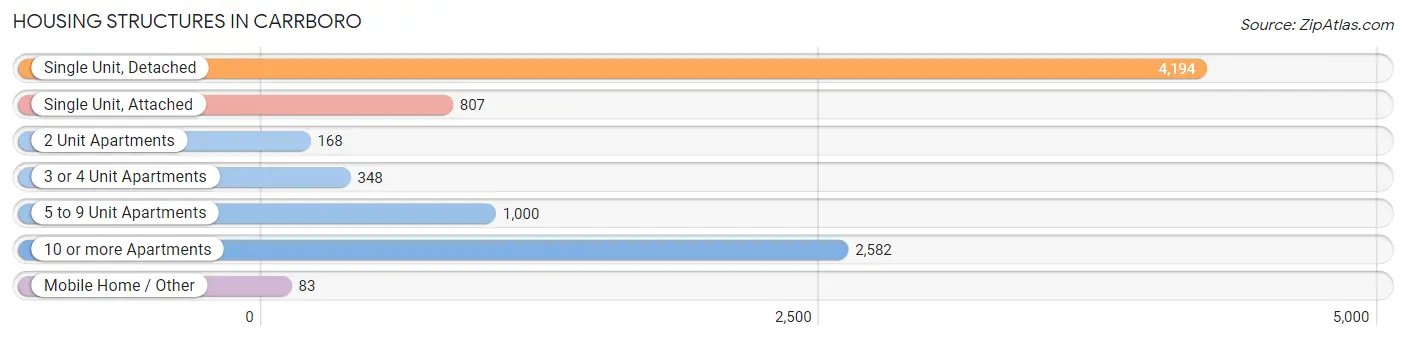
| Structure Type | # Housing Units | % Housing Units |
| Single Unit, Detached | 4,194 | 45.7% |
| Single Unit, Attached | 807 | 8.8% |
| 2 Unit Apartments | 168 | 1.8% |
| 3 or 4 Unit Apartments | 348 | 3.8% |
| 5 to 9 Unit Apartments | 1,000 | 10.9% |
| 10 or more Apartments | 2,582 | 28.1% |
| Mobile Home / Other | 83 | 0.9% |
| Total | 9,182 | 100.0% |
Housing Structures by Occupancy in Carrboro
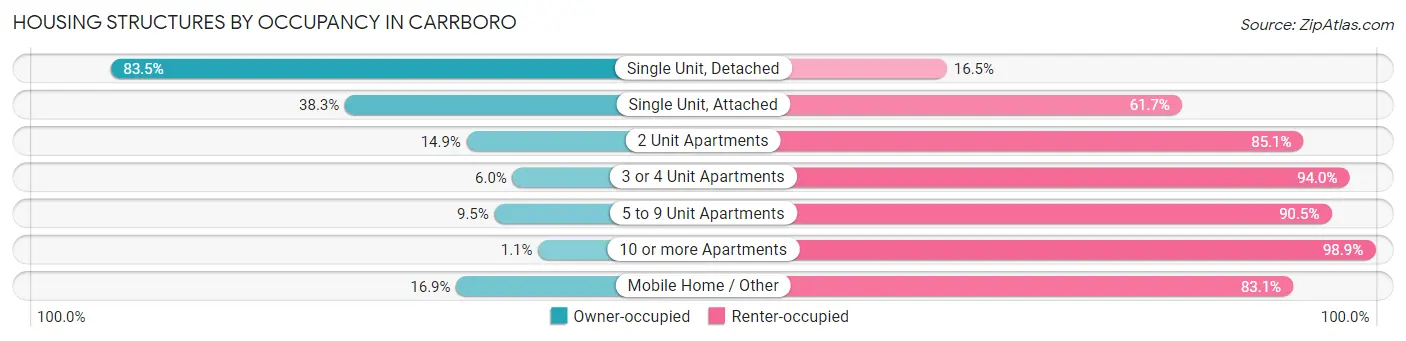
| Structure Type | Owner-occupied | Renter-occupied |
| Single Unit, Detached | 3,502 (83.5%) | 692 (16.5%) |
| Single Unit, Attached | 309 (38.3%) | 498 (61.7%) |
| 2 Unit Apartments | 25 (14.9%) | 143 (85.1%) |
| 3 or 4 Unit Apartments | 21 (6.0%) | 327 (94.0%) |
| 5 to 9 Unit Apartments | 95 (9.5%) | 905 (90.5%) |
| 10 or more Apartments | 28 (1.1%) | 2,554 (98.9%) |
| Mobile Home / Other | 14 (16.9%) | 69 (83.1%) |
| Total | 3,994 (43.5%) | 5,188 (56.5%) |
Housing Structures by Number of Rooms in Carrboro
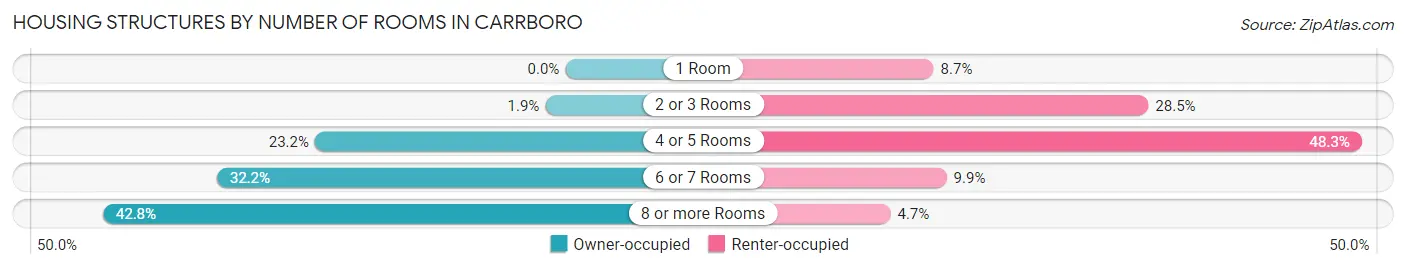
| Number of Rooms | Owner-occupied | Renter-occupied |
| 1 Room | 0 (0.0%) | 450 (8.7%) |
| 2 or 3 Rooms | 74 (1.8%) | 1,480 (28.5%) |
| 4 or 5 Rooms | 925 (23.2%) | 2,503 (48.2%) |
| 6 or 7 Rooms | 1,287 (32.2%) | 512 (9.9%) |
| 8 or more Rooms | 1,708 (42.8%) | 243 (4.7%) |
| Total | 3,994 (100.0%) | 5,188 (100.0%) |
Housing Structure by Heating Type in Carrboro
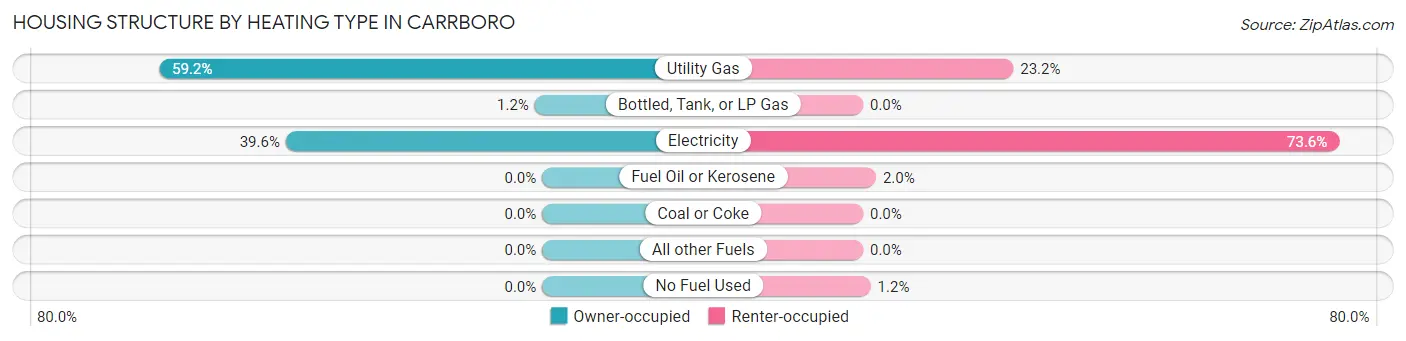
| Heating Type | Owner-occupied | Renter-occupied |
| Utility Gas | 2,365 (59.2%) | 1,205 (23.2%) |
| Bottled, Tank, or LP Gas | 46 (1.1%) | 0 (0.0%) |
| Electricity | 1,583 (39.6%) | 3,818 (73.6%) |
| Fuel Oil or Kerosene | 0 (0.0%) | 104 (2.0%) |
| Coal or Coke | 0 (0.0%) | 0 (0.0%) |
| All other Fuels | 0 (0.0%) | 0 (0.0%) |
| No Fuel Used | 0 (0.0%) | 61 (1.2%) |
| Total | 3,994 (100.0%) | 5,188 (100.0%) |
Household Vehicle Usage in Carrboro
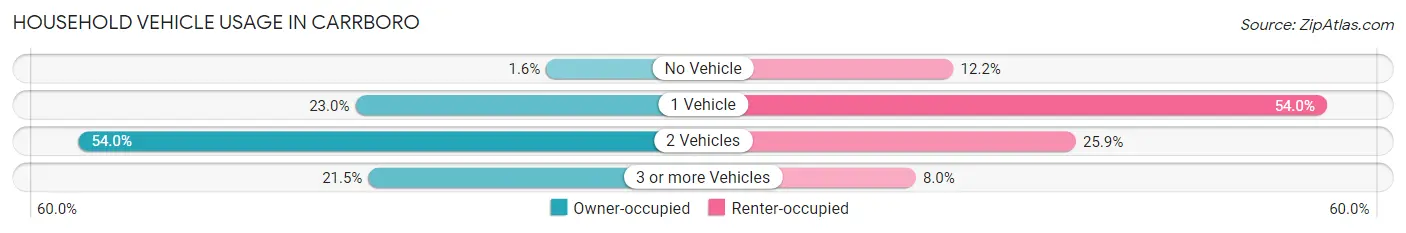
| Vehicles per Household | Owner-occupied | Renter-occupied |
| No Vehicle | 63 (1.6%) | 632 (12.2%) |
| 1 Vehicle | 917 (23.0%) | 2,800 (54.0%) |
| 2 Vehicles | 2,155 (54.0%) | 1,343 (25.9%) |
| 3 or more Vehicles | 859 (21.5%) | 413 (8.0%) |
| Total | 3,994 (100.0%) | 5,188 (100.0%) |
Real Estate & Mortgages in Carrboro
Real Estate and Mortgage Overview in Carrboro
| Characteristic | Without Mortgage | With Mortgage |
| Housing Units | 1,390 | 2,604 |
| Median Property Value | $390,800 | $478,100 |
| Median Household Income | $103,017 | $1,512 |
| Monthly Housing Costs | $723 | $861 |
| Real Estate Taxes | $6,092 | $0 |
Property Value by Mortgage Status in Carrboro
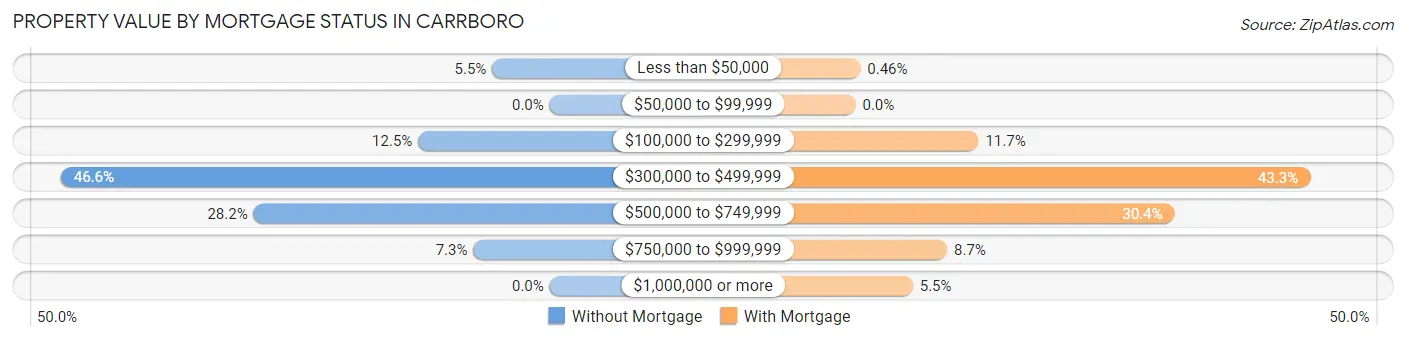
| Property Value | Without Mortgage | With Mortgage |
| Less than $50,000 | 76 (5.5%) | 12 (0.5%) |
| $50,000 to $99,999 | 0 (0.0%) | 0 (0.0%) |
| $100,000 to $299,999 | 174 (12.5%) | 305 (11.7%) |
| $300,000 to $499,999 | 647 (46.6%) | 1,127 (43.3%) |
| $500,000 to $749,999 | 392 (28.2%) | 791 (30.4%) |
| $750,000 to $999,999 | 101 (7.3%) | 227 (8.7%) |
| $1,000,000 or more | 0 (0.0%) | 142 (5.4%) |
| Total | 1,390 (100.0%) | 2,604 (100.0%) |
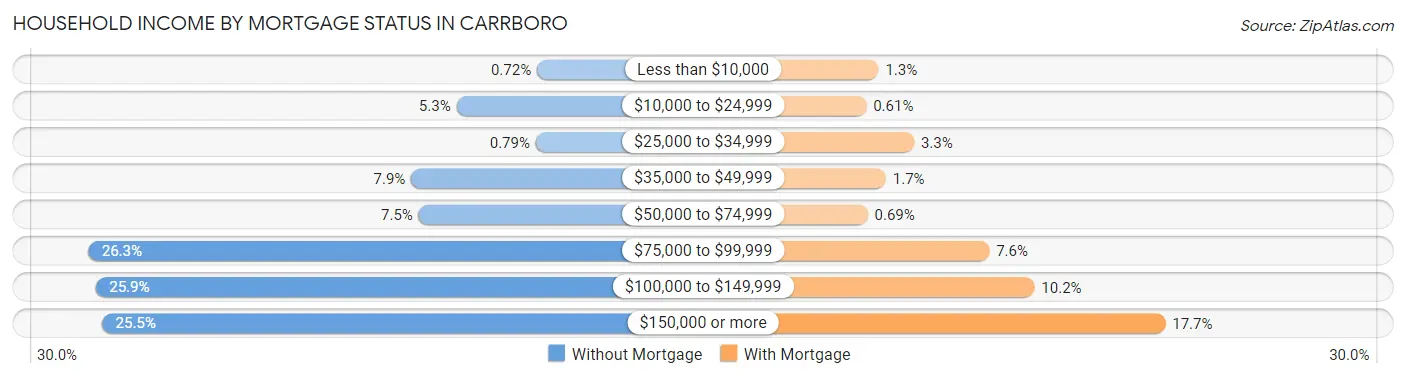
Household Income by Mortgage Status in Carrboro
| Household Income | Without Mortgage | With Mortgage |
| Less than $10,000 | 10 (0.7%) | 34 (1.3%) |
| $10,000 to $24,999 | 74 (5.3%) | 16 (0.6%) |
| $25,000 to $34,999 | 11 (0.8%) | 87 (3.3%) |
| $35,000 to $49,999 | 110 (7.9%) | 45 (1.7%) |
| $50,000 to $74,999 | 104 (7.5%) | 18 (0.7%) |
| $75,000 to $99,999 | 366 (26.3%) | 199 (7.6%) |
| $100,000 to $149,999 | 360 (25.9%) | 266 (10.2%) |
| $150,000 or more | 355 (25.5%) | 461 (17.7%) |
| Total | 1,390 (100.0%) | 2,604 (100.0%) |
Property Value to Household Income Ratio in Carrboro
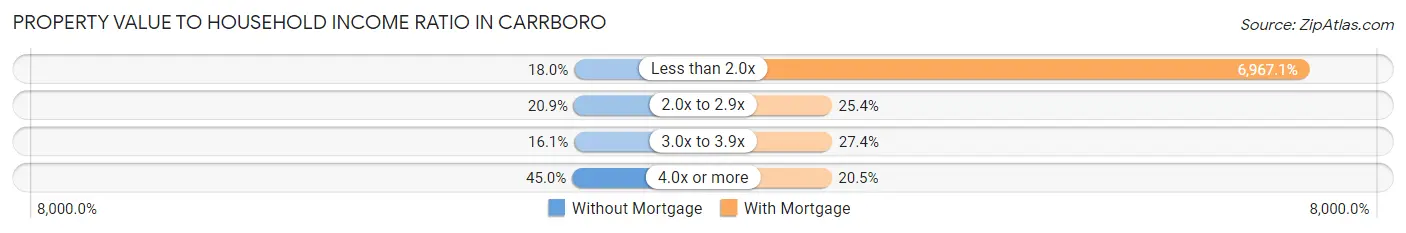
| Value-to-Income Ratio | Without Mortgage | With Mortgage |
| Less than 2.0x | 250 (18.0%) | 181,422 (6,967.1%) |
| 2.0x to 2.9x | 291 (20.9%) | 661 (25.4%) |
| 3.0x to 3.9x | 224 (16.1%) | 713 (27.4%) |
| 4.0x or more | 625 (45.0%) | 534 (20.5%) |
| Total | 1,390 (100.0%) | 2,604 (100.0%) |
Real Estate Taxes by Mortgage Status in Carrboro
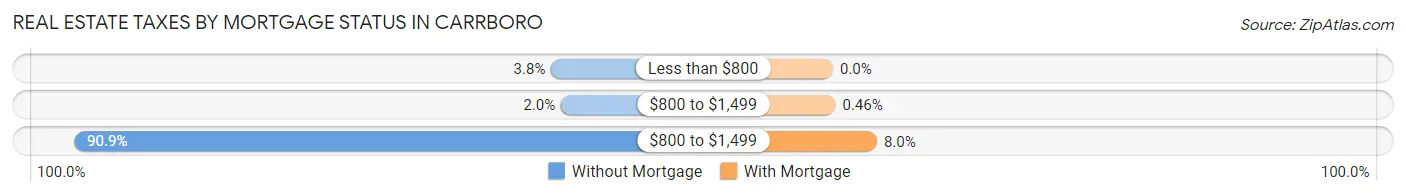
| Property Taxes | Without Mortgage | With Mortgage |
| Less than $800 | 53 (3.8%) | 0 (0.0%) |
| $800 to $1,499 | 28 (2.0%) | 12 (0.5%) |
| $800 to $1,499 | 1,264 (90.9%) | 209 (8.0%) |
| Total | 1,390 (100.0%) | 2,604 (100.0%) |
Health & Disability in Carrboro
Health Insurance Coverage by Age in Carrboro
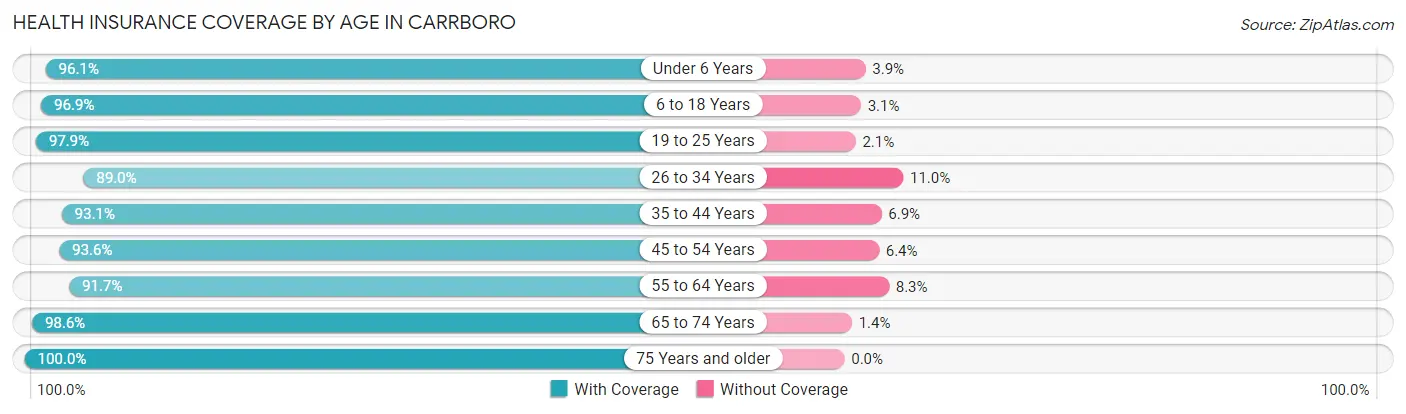
| Age Bracket | With Coverage | Without Coverage |
| Under 6 Years | 981 (96.1%) | 40 (3.9%) |
| 6 to 18 Years | 3,468 (96.9%) | 110 (3.1%) |
| 19 to 25 Years | 3,135 (97.9%) | 67 (2.1%) |
| 26 to 34 Years | 3,054 (89.0%) | 376 (11.0%) |
| 35 to 44 Years | 2,844 (93.1%) | 211 (6.9%) |
| 45 to 54 Years | 2,592 (93.6%) | 178 (6.4%) |
| 55 to 64 Years | 1,767 (91.7%) | 160 (8.3%) |
| 65 to 74 Years | 1,286 (98.6%) | 18 (1.4%) |
| 75 Years and older | 909 (100.0%) | 0 (0.0%) |
| Total | 20,036 (94.5%) | 1,160 (5.5%) |
Health Insurance Coverage by Citizenship Status in Carrboro
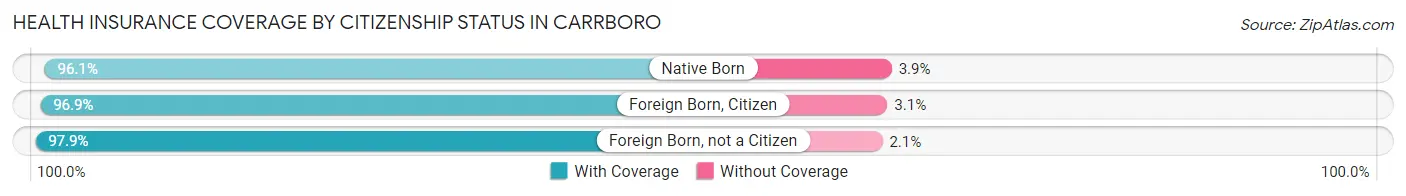
| Citizenship Status | With Coverage | Without Coverage |
| Native Born | 981 (96.1%) | 40 (3.9%) |
| Foreign Born, Citizen | 3,468 (96.9%) | 110 (3.1%) |
| Foreign Born, not a Citizen | 3,135 (97.9%) | 67 (2.1%) |
Health Insurance Coverage by Household Income in Carrboro
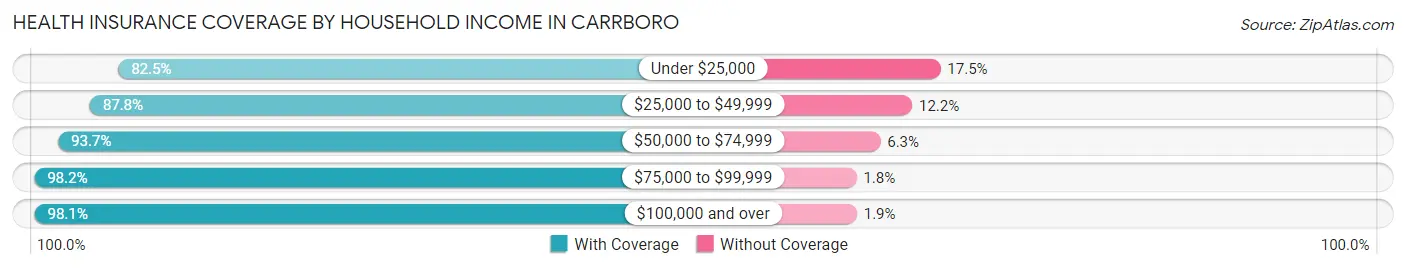
| Household Income | With Coverage | Without Coverage |
| Under $25,000 | 1,801 (82.5%) | 383 (17.5%) |
| $25,000 to $49,999 | 2,449 (87.8%) | 341 (12.2%) |
| $50,000 to $74,999 | 2,678 (93.7%) | 179 (6.3%) |
| $75,000 to $99,999 | 3,426 (98.2%) | 63 (1.8%) |
| $100,000 and over | 9,643 (98.1%) | 184 (1.9%) |
Public vs Private Health Insurance Coverage by Age in Carrboro
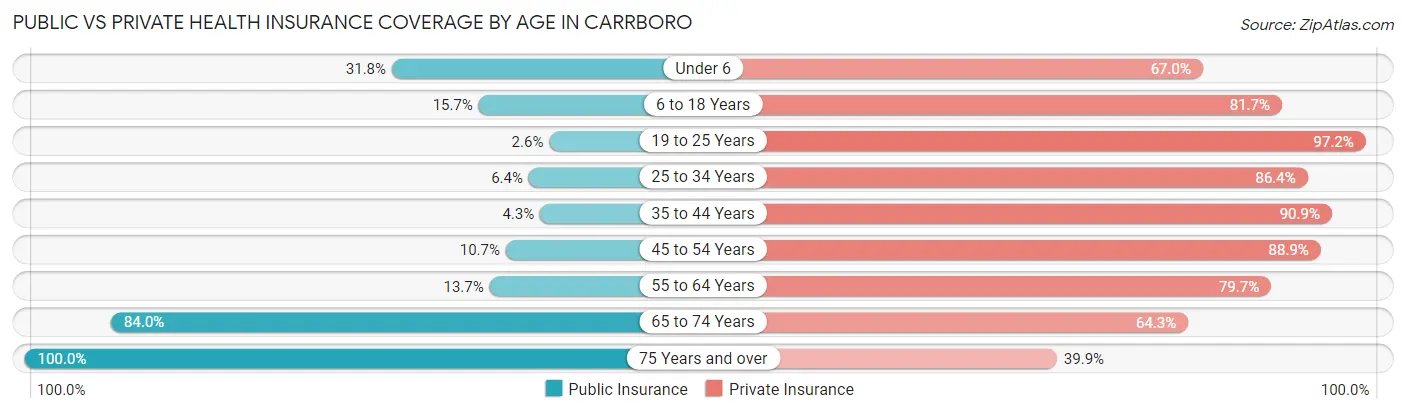
| Age Bracket | Public Insurance | Private Insurance |
| Under 6 | 325 (31.8%) | 684 (67.0%) |
| 6 to 18 Years | 562 (15.7%) | 2,922 (81.7%) |
| 19 to 25 Years | 84 (2.6%) | 3,113 (97.2%) |
| 25 to 34 Years | 220 (6.4%) | 2,965 (86.4%) |
| 35 to 44 Years | 132 (4.3%) | 2,778 (90.9%) |
| 45 to 54 Years | 296 (10.7%) | 2,462 (88.9%) |
| 55 to 64 Years | 264 (13.7%) | 1,535 (79.7%) |
| 65 to 74 Years | 1,095 (84.0%) | 838 (64.3%) |
| 75 Years and over | 909 (100.0%) | 363 (39.9%) |
| Total | 3,887 (18.3%) | 17,660 (83.3%) |
Disability Status by Sex by Age in Carrboro
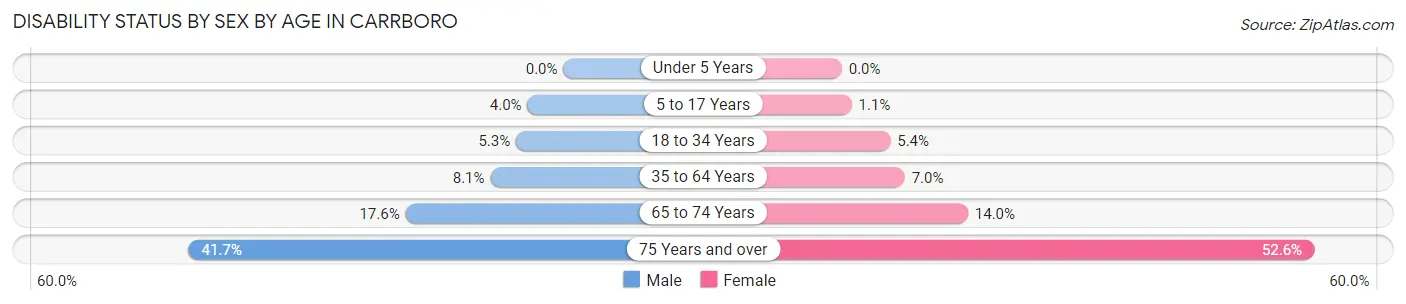
| Age Bracket | Male | Female |
| Under 5 Years | 0 (0.0%) | 0 (0.0%) |
| 5 to 17 Years | 63 (4.0%) | 21 (1.1%) |
| 18 to 34 Years | 182 (5.3%) | 178 (5.4%) |
| 35 to 64 Years | 310 (8.1%) | 276 (7.0%) |
| 65 to 74 Years | 109 (17.6%) | 96 (14.0%) |
| 75 Years and over | 96 (41.7%) | 357 (52.6%) |
Disability Class by Sex by Age in Carrboro
Disability Class: Hearing Difficulty
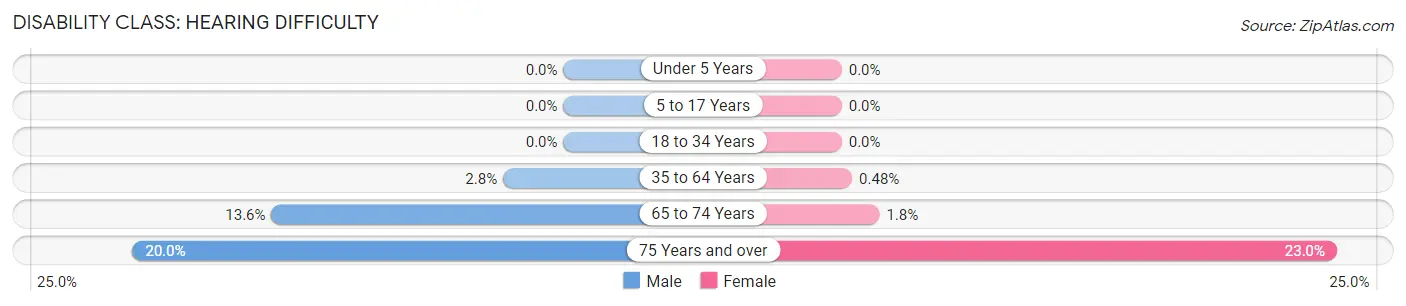
| Age Bracket | Male | Female |
| Under 5 Years | 0 (0.0%) | 0 (0.0%) |
| 5 to 17 Years | 0 (0.0%) | 0 (0.0%) |
| 18 to 34 Years | 0 (0.0%) | 0 (0.0%) |
| 35 to 64 Years | 107 (2.8%) | 19 (0.5%) |
| 65 to 74 Years | 84 (13.6%) | 12 (1.8%) |
| 75 Years and over | 46 (20.0%) | 156 (23.0%) |
Disability Class: Vision Difficulty
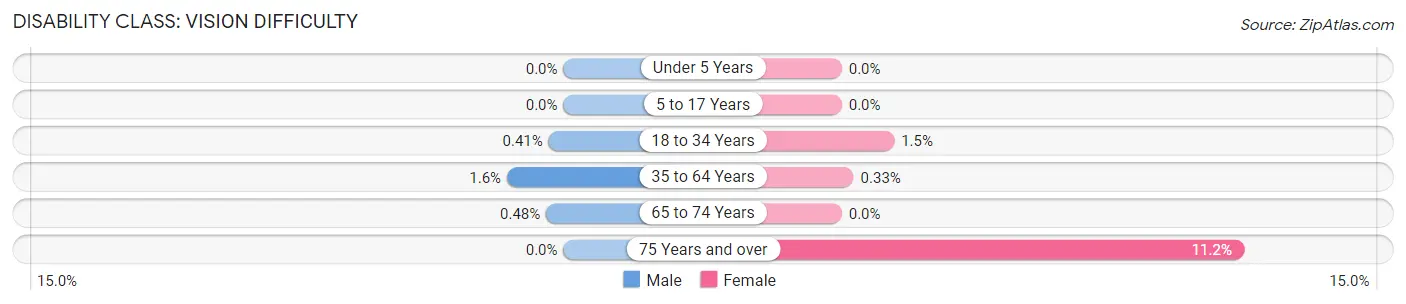
| Age Bracket | Male | Female |
| Under 5 Years | 0 (0.0%) | 0 (0.0%) |
| 5 to 17 Years | 0 (0.0%) | 0 (0.0%) |
| 18 to 34 Years | 14 (0.4%) | 48 (1.5%) |
| 35 to 64 Years | 60 (1.6%) | 13 (0.3%) |
| 65 to 74 Years | 3 (0.5%) | 0 (0.0%) |
| 75 Years and over | 0 (0.0%) | 76 (11.2%) |
Disability Class: Cognitive Difficulty
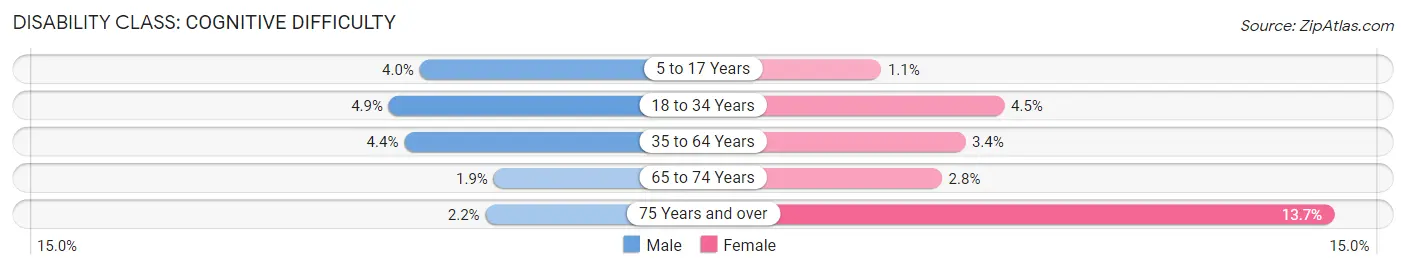
| Age Bracket | Male | Female |
| 5 to 17 Years | 63 (4.0%) | 21 (1.1%) |
| 18 to 34 Years | 168 (4.9%) | 149 (4.5%) |
| 35 to 64 Years | 169 (4.4%) | 135 (3.4%) |
| 65 to 74 Years | 12 (1.9%) | 19 (2.8%) |
| 75 Years and over | 5 (2.2%) | 93 (13.7%) |
Disability Class: Ambulatory Difficulty
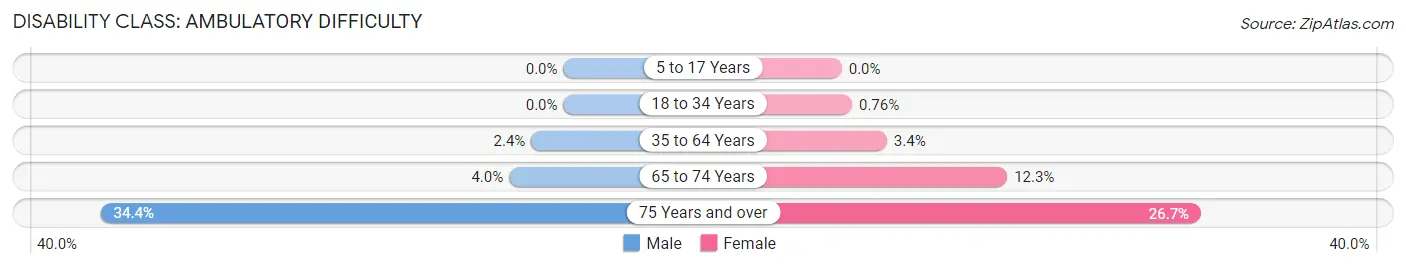
| Age Bracket | Male | Female |
| 5 to 17 Years | 0 (0.0%) | 0 (0.0%) |
| 18 to 34 Years | 0 (0.0%) | 25 (0.8%) |
| 35 to 64 Years | 91 (2.4%) | 132 (3.4%) |
| 65 to 74 Years | 25 (4.0%) | 84 (12.3%) |
| 75 Years and over | 79 (34.4%) | 181 (26.7%) |
Disability Class: Self-Care Difficulty
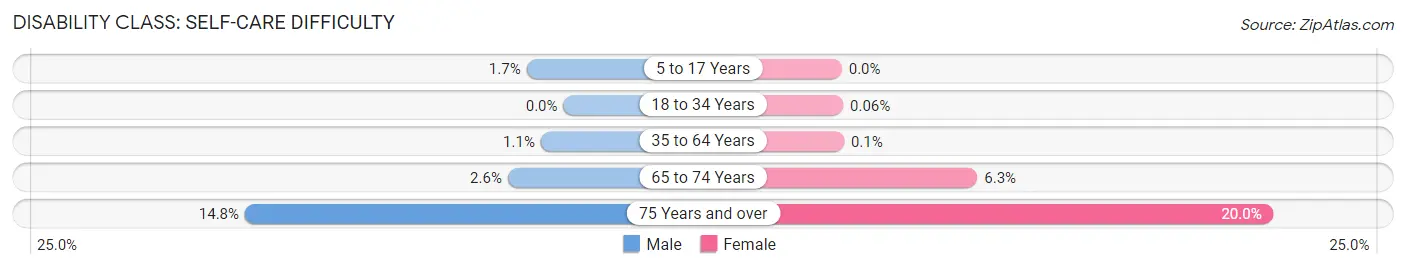
| Age Bracket | Male | Female |
| 5 to 17 Years | 27 (1.7%) | 0 (0.0%) |
| 18 to 34 Years | 0 (0.0%) | 2 (0.1%) |
| 35 to 64 Years | 40 (1.1%) | 4 (0.1%) |
| 65 to 74 Years | 16 (2.6%) | 43 (6.3%) |
| 75 Years and over | 34 (14.8%) | 136 (20.0%) |
Technology Access in Carrboro
Computing Device Access in Carrboro
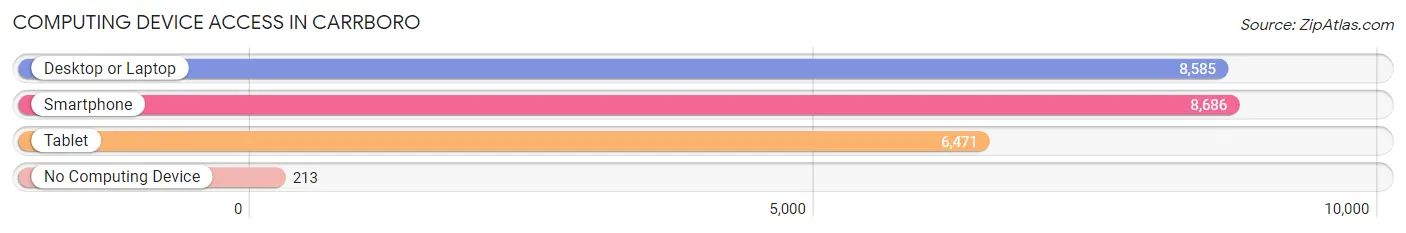
| Device Type | # Households | % Households |
| Desktop or Laptop | 8,585 | 93.5% |
| Smartphone | 8,686 | 94.6% |
| Tablet | 6,471 | 70.5% |
| No Computing Device | 213 | 2.3% |
| Total | 9,182 | 100.0% |
Internet Access in Carrboro
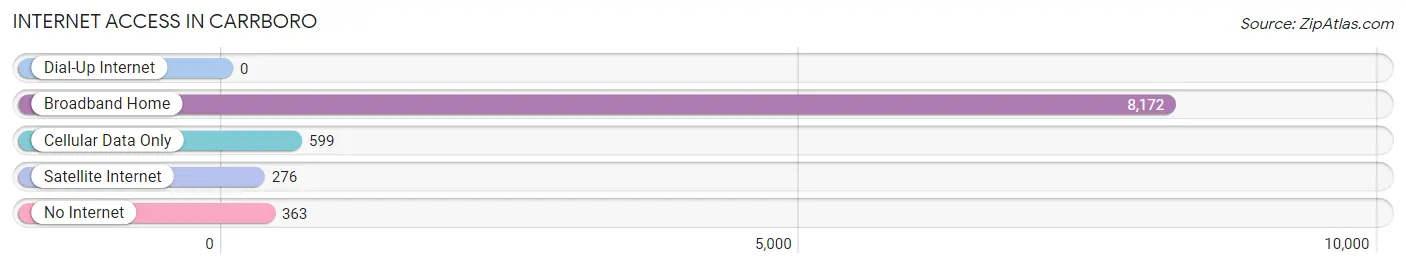
| Internet Type | # Households | % Households |
| Dial-Up Internet | 0 | 0.0% |
| Broadband Home | 8,172 | 89.0% |
| Cellular Data Only | 599 | 6.5% |
| Satellite Internet | 276 | 3.0% |
| No Internet | 363 | 4.0% |
| Total | 9,182 | 100.0% |
Carrboro Summary
Carrboro, North Carolina is a small town located in Orange County, North Carolina. It is situated just west of Chapel Hill and is part of the Research Triangle metropolitan area. The town was founded in 1882 and has a population of approximately 20,000 people.
Geography
Carrboro is located in the Piedmont region of North Carolina, which is characterized by rolling hills and flat plains. The town is situated on the banks of the Eno River, which flows through the town and provides a scenic backdrop. The town is also located near the Haw River, which is a tributary of the Eno. The town is located at an elevation of approximately 500 feet above sea level.
The town is located in a humid subtropical climate zone, which is characterized by hot, humid summers and mild winters. The average annual temperature is around 60 degrees Fahrenheit, with the average high temperature in the summer months reaching around 90 degrees Fahrenheit. The average low temperature in the winter months is around 30 degrees Fahrenheit.
Demographics
As of the 2010 census, the population of Carrboro was 19,582. The racial makeup of the town was 79.3% White, 11.2% African American, 0.3% Native American, 4.2% Asian, 0.1% Pacific Islander, and 4.9% from other races. Hispanic or Latino of any race were 8.3% of the population.
The median household income in Carrboro was $50,945 in 2019, and the median family income was $63,945. The per capita income for the town was $30,945. About 11.2% of families and 15.2% of the population were below the poverty line, including 22.2% of those under age 18 and 8.2% of those age 65 or over.
Economy
Carrboro is home to a variety of businesses, including retail stores, restaurants, and professional services. The town is also home to several technology companies, including IBM, SAS Institute, and Red Hat. The town is also home to the University of North Carolina at Chapel Hill, which is one of the largest employers in the area.
The town is also home to a variety of cultural attractions, including the Carrboro ArtsCenter, the Carrboro Farmers' Market, and the Carrboro Music Festival. The town is also home to a variety of parks and recreational facilities, including the Bolin Creek Trail, the Bolin Creek Greenway, and the Bolin Creek Park.
History
Carrboro was founded in 1882 by Julian Carr, a local businessman and philanthropist. The town was originally named West End, but was later changed to Carrboro in honor of its founder. The town was incorporated in 1911 and has since grown to become a vibrant and diverse community.
In the early 20th century, Carrboro was a small farming community, but it began to grow in the 1950s and 1960s as the Research Triangle Park was developed nearby. The town has since become a popular destination for students, professionals, and families alike.
Conclusion
Carrboro, North Carolina is a small town located in Orange County, North Carolina. It is situated just west of Chapel Hill and is part of the Research Triangle metropolitan area. The town was founded in 1882 and has a population of approximately 20,000 people. The town is located in a humid subtropical climate zone and is home to a variety of businesses, including retail stores, restaurants, and professional services. The town is also home to several technology companies, including IBM, SAS Institute, and Red Hat. The town is also home to a variety of cultural attractions, including the Carrboro ArtsCenter, the Carrboro Farmers' Market, and the Carrboro Music Festival. The town is also home to a variety of parks and recreational facilities, including the Bolin Creek Trail, the Bolin Creek Greenway, and the Bolin Creek Park. The median household income in Carrboro was $50,945 in 2019, and the median family income was $63,945. The per capita income for the town was $30,945.
Common Questions
What is Per Capita Income in Carrboro?
Per Capita income in Carrboro is $48,088.
What is the Median Family Income in Carrboro?
Median Family Income in Carrboro is $114,323.
What is the Median Household income in Carrboro?
Median Household Income in Carrboro is $76,933.
What is Income or Wage Gap in Carrboro?
Income or Wage Gap in Carrboro is 35.2%.
Women in Carrboro earn 64.8 cents for every dollar earned by a man.
What is Family Income Deficit in Carrboro?
Family Income Deficit in Carrboro is $7,804.
Families that are below poverty line in Carrboro earn $7,804 less on average than the poverty threshold level.
What is Inequality or Gini Index in Carrboro?
Inequality or Gini Index in Carrboro is 0.49.
What is the Total Population of Carrboro?
Total Population of Carrboro is 21,242.
What is the Total Male Population of Carrboro?
Total Male Population of Carrboro is 10,184.
What is the Total Female Population of Carrboro?
Total Female Population of Carrboro is 11,058.
What is the Ratio of Males per 100 Females in Carrboro?
There are 92.10 Males per 100 Females in Carrboro.
What is the Ratio of Females per 100 Males in Carrboro?
There are 108.58 Females per 100 Males in Carrboro.
What is the Median Population Age in Carrboro?
Median Population Age in Carrboro is 33.1 Years.
What is the Average Family Size in Carrboro
Average Family Size in Carrboro is 3.1 People.
What is the Average Household Size in Carrboro
Average Household Size in Carrboro is 2.3 People.
How Large is the Labor Force in Carrboro?
There are 12,473 People in the Labor Forcein in Carrboro.
What is the Percentage of People in the Labor Force in Carrboro?
72.7% of People are in the Labor Force in Carrboro.
What is the Unemployment Rate in Carrboro?
Unemployment Rate in Carrboro is 3.6%.