Beech Mountain, NC Map & Demographics
Beech Mountain Map
Beech Mountain Overview
$72,390
PER CAPITA INCOME
$118,542
AVG FAMILY INCOME
$85,250
AVG HOUSEHOLD INCOME
22.0%
WAGE / INCOME GAP [ % ]
78.0¢/ $1
WAGE / INCOME GAP [ $ ]
0.52
INEQUALITY / GINI INDEX
798
TOTAL POPULATION
416
MALE POPULATION
382
FEMALE POPULATION
108.90
MALES / 100 FEMALES
91.83
FEMALES / 100 MALES
61.5
MEDIAN AGE
2.5
AVG FAMILY SIZE
2.1
AVG HOUSEHOLD SIZE
320
LABOR FORCE [ PEOPLE ]
45.6%
PERCENT IN LABOR FORCE
9.1%
UNEMPLOYMENT RATE
Beech Mountain Area Codes
Income in Beech Mountain
Income Overview in Beech Mountain
Per Capita Income in Beech Mountain is $72,390, while median incomes of families and households are $118,542 and $85,250 respectively.
| Characteristic | Number | Measure |
| Per Capita Income | 798 | $72,390 |
| Median Family Income | 269 | $118,542 |
| Mean Family Income | 269 | $183,189 |
| Median Household Income | 375 | $85,250 |
| Mean Household Income | 375 | $145,392 |
| Income Deficit | 269 | $0 |
| Wage / Income Gap (%) | 798 | 22.04% |
| Wage / Income Gap ($) | 798 | 77.96¢ per $1 |
| Gini / Inequality Index | 798 | 0.52 |
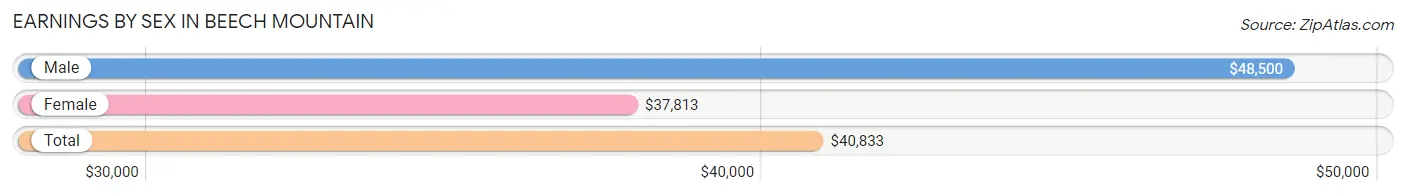
Earnings by Sex in Beech Mountain
Average Earnings in Beech Mountain are $40,833, $48,500 for men and $37,813 for women, a difference of 22.0%.
| Sex | Number | Average Earnings |
| Male | 220 (58.2%) | $48,500 |
| Female | 158 (41.8%) | $37,813 |
| Total | 378 (100.0%) | $40,833 |
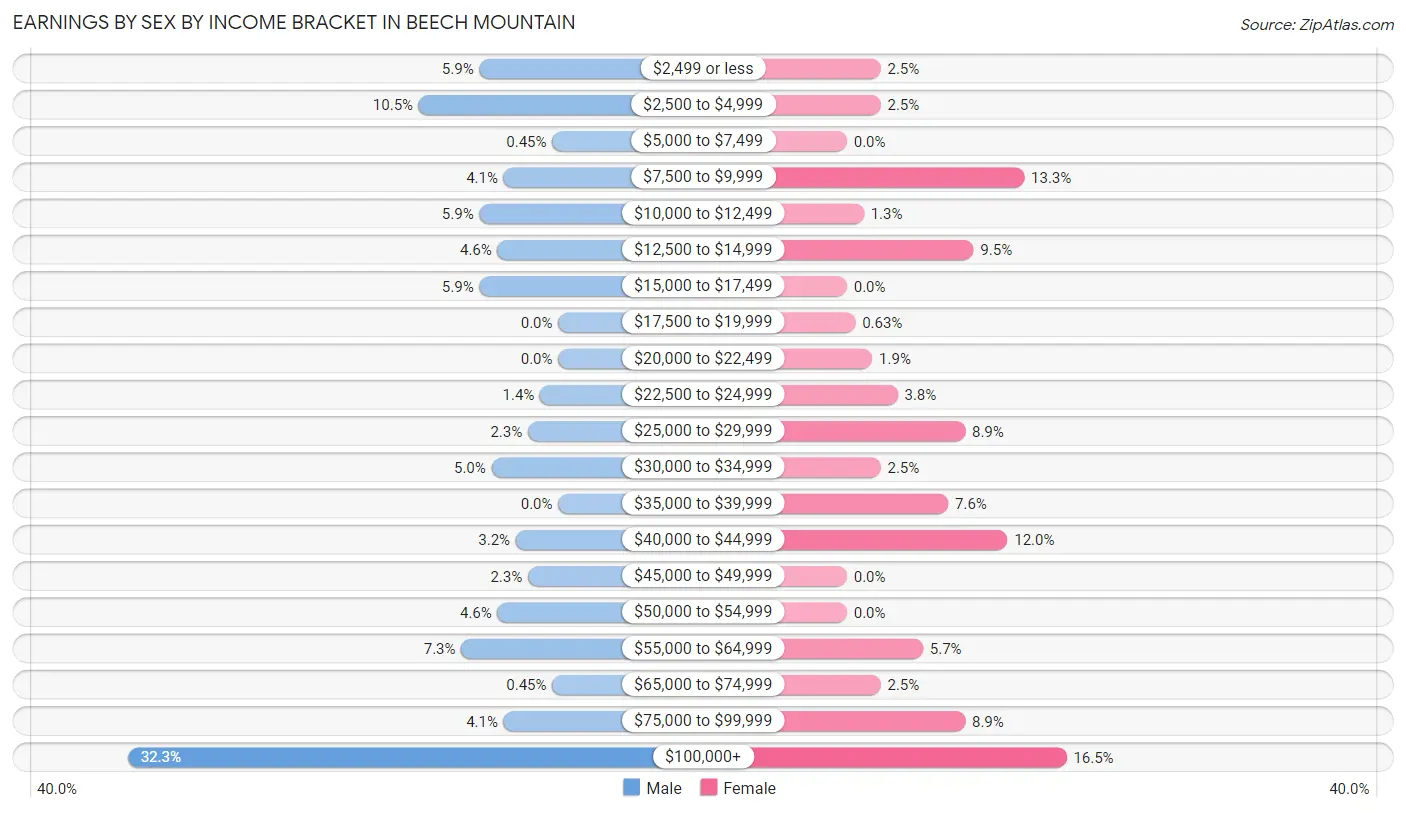
Earnings by Sex by Income Bracket in Beech Mountain
The most common earnings brackets in Beech Mountain are $100,000+ for men (71 | 32.3%) and $100,000+ for women (26 | 16.5%).
| Income | Male | Female |
| $2,499 or less | 13 (5.9%) | 4 (2.5%) |
| $2,500 to $4,999 | 23 (10.4%) | 4 (2.5%) |
| $5,000 to $7,499 | 1 (0.4%) | 0 (0.0%) |
| $7,500 to $9,999 | 9 (4.1%) | 21 (13.3%) |
| $10,000 to $12,499 | 13 (5.9%) | 2 (1.3%) |
| $12,500 to $14,999 | 10 (4.5%) | 15 (9.5%) |
| $15,000 to $17,499 | 13 (5.9%) | 0 (0.0%) |
| $17,500 to $19,999 | 0 (0.0%) | 1 (0.6%) |
| $20,000 to $22,499 | 0 (0.0%) | 3 (1.9%) |
| $22,500 to $24,999 | 3 (1.4%) | 6 (3.8%) |
| $25,000 to $29,999 | 5 (2.3%) | 14 (8.9%) |
| $30,000 to $34,999 | 11 (5.0%) | 4 (2.5%) |
| $35,000 to $39,999 | 0 (0.0%) | 12 (7.6%) |
| $40,000 to $44,999 | 7 (3.2%) | 19 (12.0%) |
| $45,000 to $49,999 | 5 (2.3%) | 0 (0.0%) |
| $50,000 to $54,999 | 10 (4.5%) | 0 (0.0%) |
| $55,000 to $64,999 | 16 (7.3%) | 9 (5.7%) |
| $65,000 to $74,999 | 1 (0.4%) | 4 (2.5%) |
| $75,000 to $99,999 | 9 (4.1%) | 14 (8.9%) |
| $100,000+ | 71 (32.3%) | 26 (16.5%) |
| Total | 220 (100.0%) | 158 (100.0%) |
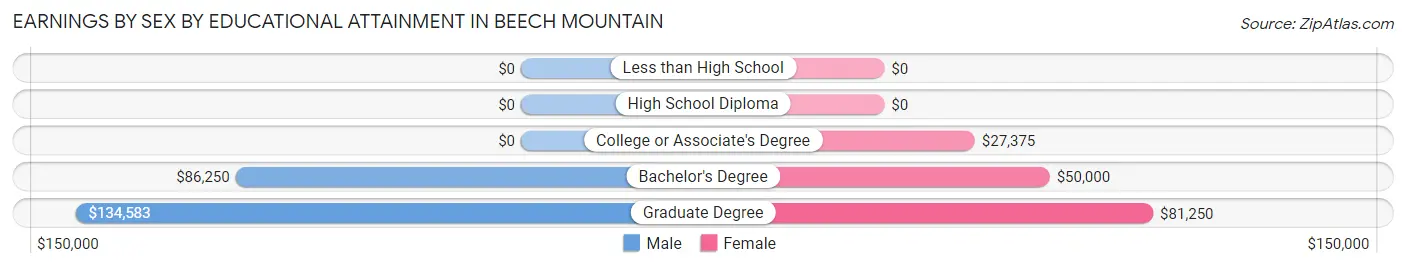
Earnings by Sex by Educational Attainment in Beech Mountain
Average earnings in Beech Mountain are $50,250 for men and $38,594 for women, a difference of 23.2%. Men with an educational attainment of graduate degree enjoy the highest average annual earnings of $134,583, while those with bachelor's degree education earn the least with $86,250. Women with an educational attainment of graduate degree earn the most with the average annual earnings of $81,250, while those with college or associate's degree education have the smallest earnings of $27,375.
| Educational Attainment | Male Income | Female Income |
| Less than High School | - | - |
| High School Diploma | - | - |
| College or Associate's Degree | - | - |
| Bachelor's Degree | $86,250 | $50,000 |
| Graduate Degree | $134,583 | $81,250 |
| Total | $50,250 | $38,594 |
Family Income in Beech Mountain
Family Income Brackets in Beech Mountain
According to the Beech Mountain family income data, there are 74 families falling into the $200,000+ income range, which is the most common income bracket and makes up 27.5% of all families.
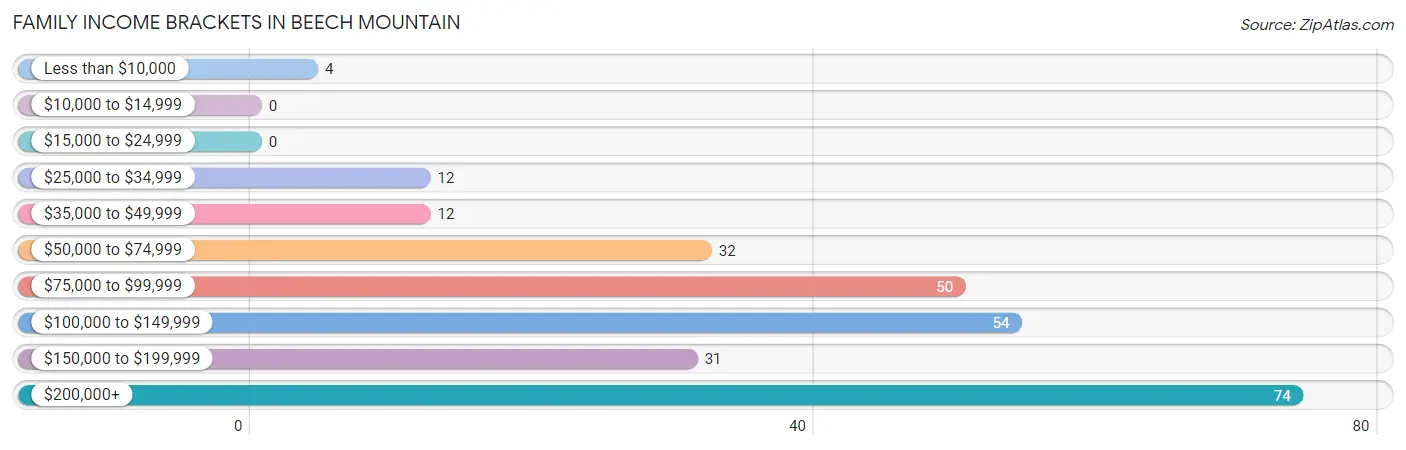
| Income Bracket | # Families | % Families |
| Less than $10,000 | 4 | 1.5% |
| $10,000 to $14,999 | 0 | 0.0% |
| $15,000 to $24,999 | 0 | 0.0% |
| $25,000 to $34,999 | 12 | 4.5% |
| $35,000 to $49,999 | 12 | 4.5% |
| $50,000 to $74,999 | 32 | 11.9% |
| $75,000 to $99,999 | 50 | 18.6% |
| $100,000 to $149,999 | 54 | 20.1% |
| $150,000 to $199,999 | 31 | 11.5% |
| $200,000+ | 74 | 27.5% |
Family Income by Famaliy Size in Beech Mountain
3-person families (19 | 7.1%) account for the highest median family income in Beech Mountain with $136,250 per family, while 2-person families (220 | 81.8%) have the highest median income of $59,584 per family member.
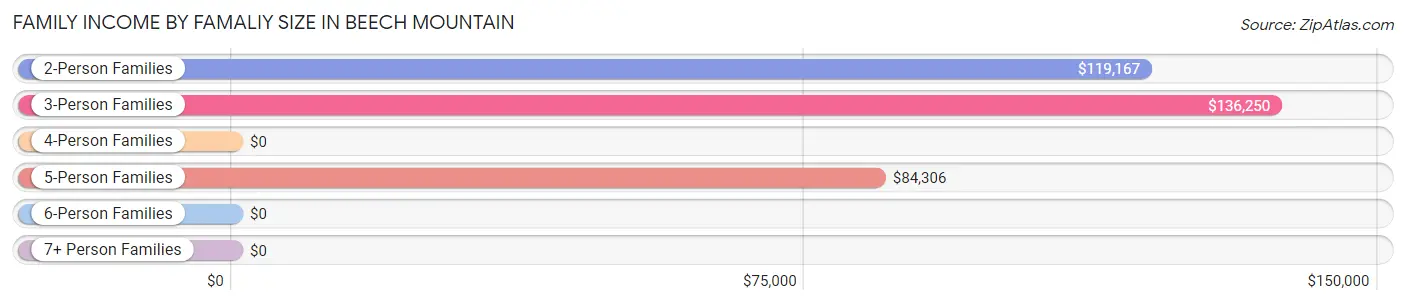
| Income Bracket | # Families | Median Income |
| 2-Person Families | 220 (81.8%) | $119,167 |
| 3-Person Families | 19 (7.1%) | $136,250 |
| 4-Person Families | 15 (5.6%) | $0 |
| 5-Person Families | 13 (4.8%) | $84,306 |
| 6-Person Families | 2 (0.7%) | $0 |
| 7+ Person Families | 0 (0.0%) | $0 |
| Total | 269 (100.0%) | $118,542 |
Family Income by Number of Earners in Beech Mountain
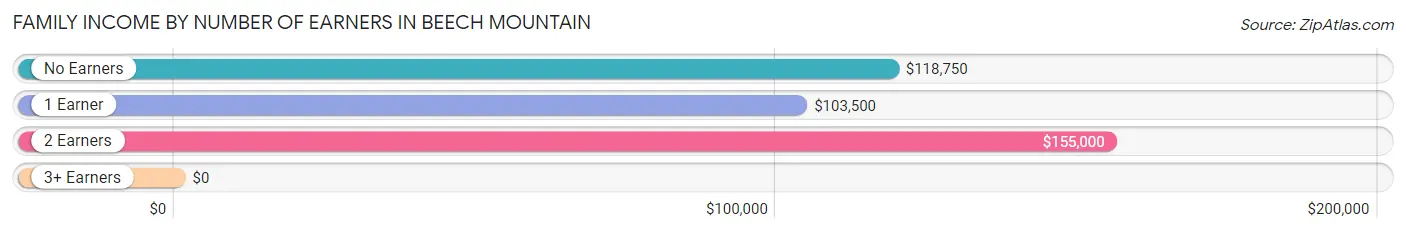
| Number of Earners | # Families | Median Income |
| No Earners | 84 (31.2%) | $118,750 |
| 1 Earner | 98 (36.4%) | $103,500 |
| 2 Earners | 76 (28.2%) | $155,000 |
| 3+ Earners | 11 (4.1%) | $0 |
| Total | 269 (100.0%) | $118,542 |
Household Income in Beech Mountain
Household Income Brackets in Beech Mountain
With 75 households falling in the category, the $200,000+ income range is the most frequent in Beech Mountain, accounting for 20.0% of all households.
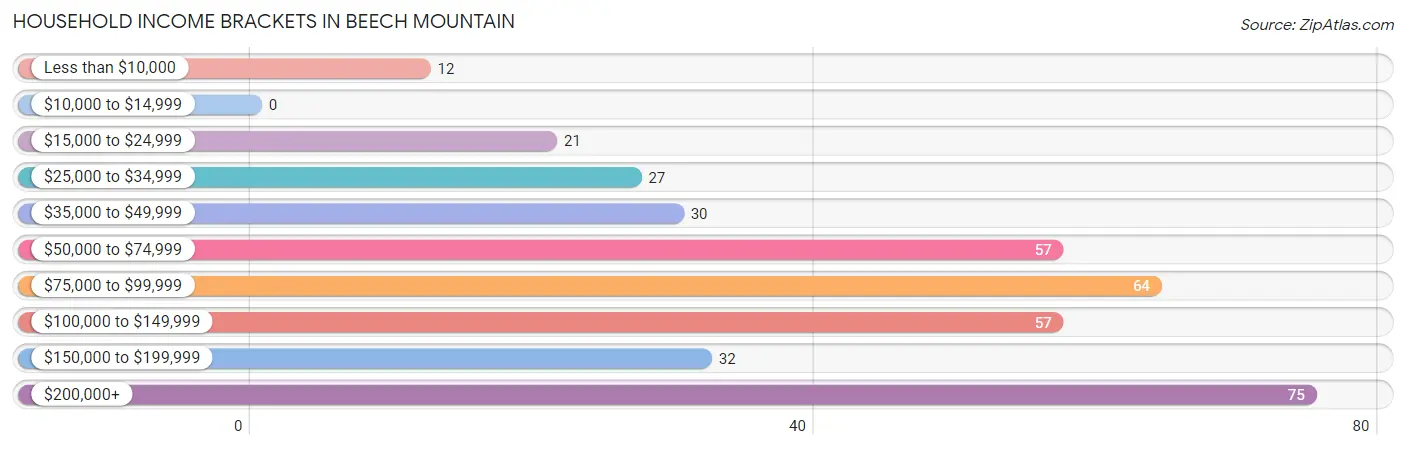
| Income Bracket | # Households | % Households |
| Less than $10,000 | 12 | 3.2% |
| $10,000 to $14,999 | 0 | 0.0% |
| $15,000 to $24,999 | 21 | 5.6% |
| $25,000 to $34,999 | 27 | 7.2% |
| $35,000 to $49,999 | 30 | 8.0% |
| $50,000 to $74,999 | 57 | 15.2% |
| $75,000 to $99,999 | 64 | 17.1% |
| $100,000 to $149,999 | 57 | 15.2% |
| $150,000 to $199,999 | 32 | 8.5% |
| $200,000+ | 75 | 20.0% |
Household Income by Householder Age in Beech Mountain
The median household income in Beech Mountain is $85,250, with the highest median household income of $93,750 found in the 65+ years age bracket for the primary householder. A total of 202 households (53.9%) fall into this category. Meanwhile, the 15 to 24 years age bracket for the primary householder has the lowest median household income of $47,917, with 7 households (1.9%) in this group.
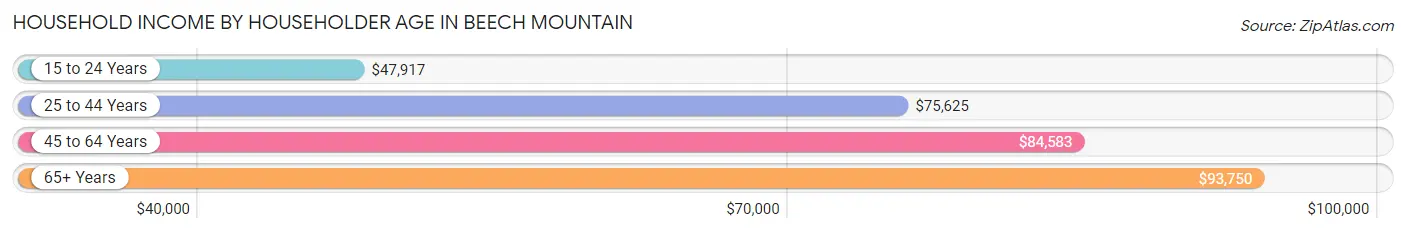
| Income Bracket | # Households | Median Income |
| 15 to 24 Years | 7 (1.9%) | $47,917 |
| 25 to 44 Years | 44 (11.7%) | $75,625 |
| 45 to 64 Years | 122 (32.5%) | $84,583 |
| 65+ Years | 202 (53.9%) | $93,750 |
| Total | 375 (100.0%) | $85,250 |
Poverty in Beech Mountain
Income Below Poverty by Sex and Age in Beech Mountain
With 2.2% poverty level for males and 11.5% for females among the residents of Beech Mountain, 75 year old and over males and under 5 year old females are the most vulnerable to poverty, with 4 males (4.5%) and 3 females (42.9%) in their respective age groups living below the poverty level.
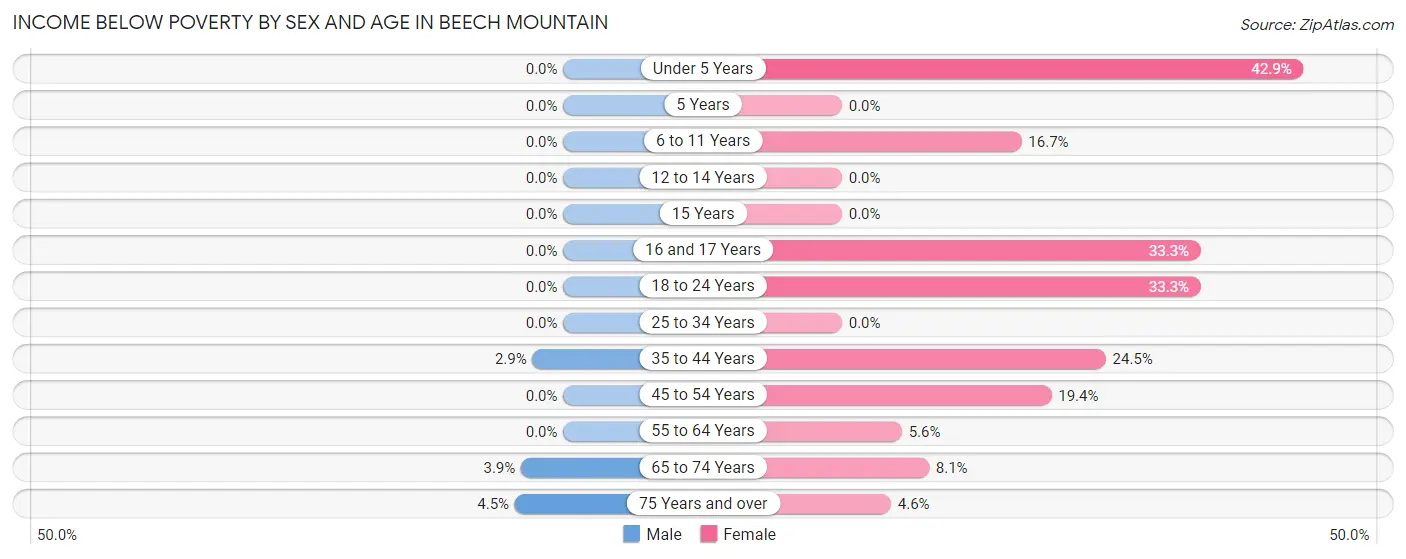
| Age Bracket | Male | Female |
| Under 5 Years | 0 (0.0%) | 3 (42.9%) |
| 5 Years | 0 (0.0%) | 0 (0.0%) |
| 6 to 11 Years | 0 (0.0%) | 5 (16.7%) |
| 12 to 14 Years | 0 (0.0%) | 0 (0.0%) |
| 15 Years | 0 (0.0%) | 0 (0.0%) |
| 16 and 17 Years | 0 (0.0%) | 1 (33.3%) |
| 18 to 24 Years | 0 (0.0%) | 1 (33.3%) |
| 25 to 34 Years | 0 (0.0%) | 0 (0.0%) |
| 35 to 44 Years | 1 (2.9%) | 12 (24.5%) |
| 45 to 54 Years | 0 (0.0%) | 7 (19.4%) |
| 55 to 64 Years | 0 (0.0%) | 5 (5.6%) |
| 65 to 74 Years | 4 (3.9%) | 8 (8.1%) |
| 75 Years and over | 4 (4.5%) | 2 (4.5%) |
| Total | 9 (2.2%) | 44 (11.5%) |
Income Above Poverty by Sex and Age in Beech Mountain
According to the poverty statistics in Beech Mountain, males aged under 5 years and females aged 5 years are the age groups that are most secure financially, with 100.0% of males and 100.0% of females in these age groups living above the poverty line.
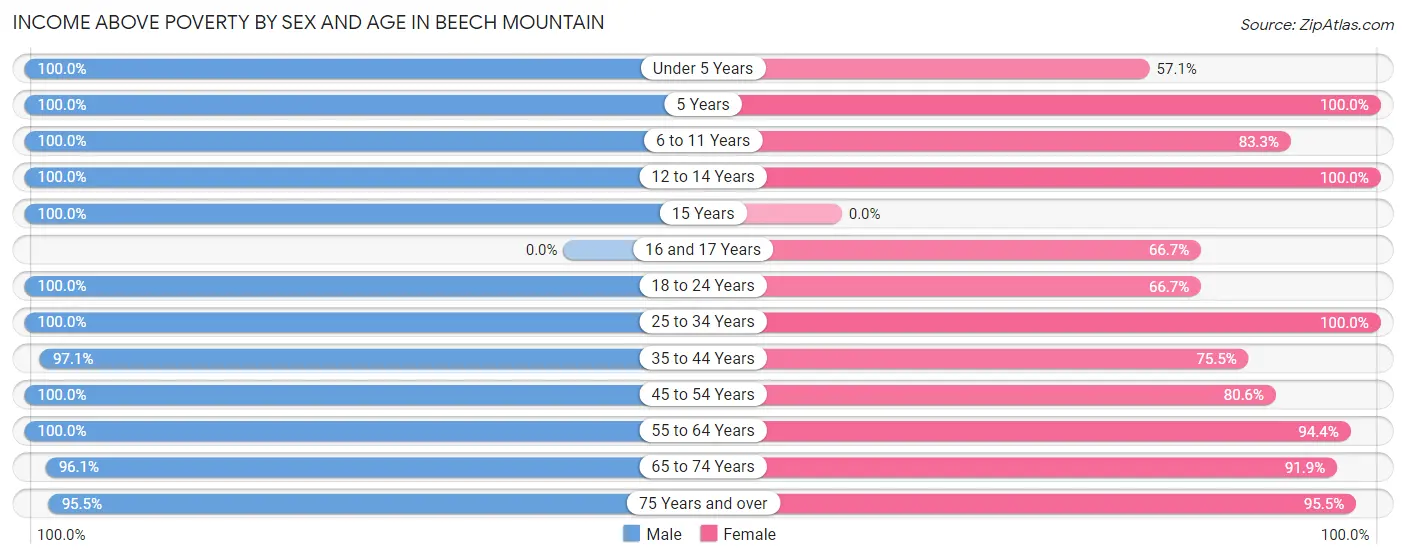
| Age Bracket | Male | Female |
| Under 5 Years | 12 (100.0%) | 4 (57.1%) |
| 5 Years | 3 (100.0%) | 8 (100.0%) |
| 6 to 11 Years | 6 (100.0%) | 25 (83.3%) |
| 12 to 14 Years | 24 (100.0%) | 3 (100.0%) |
| 15 Years | 3 (100.0%) | 0 (0.0%) |
| 16 and 17 Years | 0 (0.0%) | 2 (66.7%) |
| 18 to 24 Years | 8 (100.0%) | 2 (66.7%) |
| 25 to 34 Years | 28 (100.0%) | 10 (100.0%) |
| 35 to 44 Years | 34 (97.1%) | 37 (75.5%) |
| 45 to 54 Years | 28 (100.0%) | 29 (80.6%) |
| 55 to 64 Years | 78 (100.0%) | 85 (94.4%) |
| 65 to 74 Years | 98 (96.1%) | 91 (91.9%) |
| 75 Years and over | 85 (95.5%) | 42 (95.5%) |
| Total | 407 (97.8%) | 338 (88.5%) |
Income Below Poverty Among Married-Couple Families in Beech Mountain
The poverty statistics for married-couple families in Beech Mountain show that 0.8% or 2 of the total 243 families live below the poverty line. Families with 1 or 2 children have the highest poverty rate of 4.2%, comprising of 1 families. On the other hand, families with 3 or 4 children have the lowest poverty rate of 0.0%, which includes 0 families.
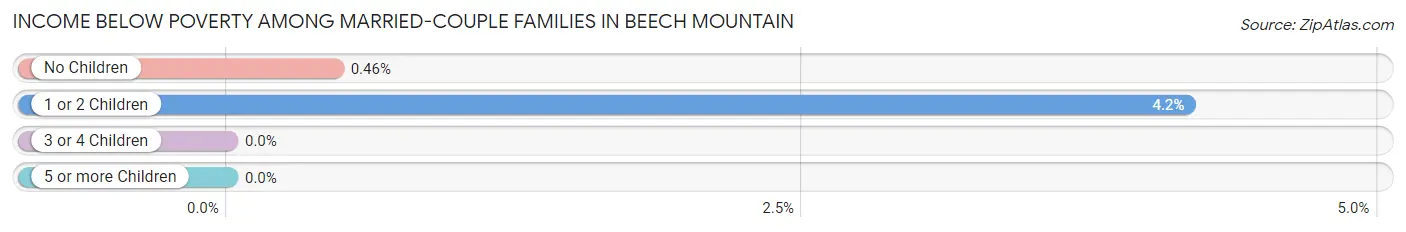
| Children | Above Poverty | Below Poverty |
| No Children | 215 (99.5%) | 1 (0.5%) |
| 1 or 2 Children | 23 (95.8%) | 1 (4.2%) |
| 3 or 4 Children | 3 (100.0%) | 0 (0.0%) |
| 5 or more Children | 0 (0.0%) | 0 (0.0%) |
| Total | 241 (99.2%) | 2 (0.8%) |
Income Below Poverty Among Single-Parent Households in Beech Mountain
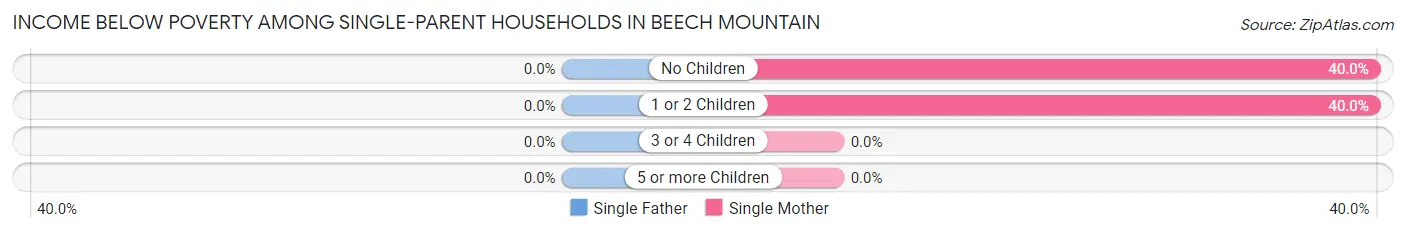
| Children | Single Father | Single Mother |
| No Children | 0 (0.0%) | 2 (40.0%) |
| 1 or 2 Children | 0 (0.0%) | 6 (40.0%) |
| 3 or 4 Children | 0 (0.0%) | 0 (0.0%) |
| 5 or more Children | 0 (0.0%) | 0 (0.0%) |
| Total | 0 (0.0%) | 8 (40.0%) |
Income Below Poverty Among Married-Couple vs Single-Parent Households in Beech Mountain
The poverty data for Beech Mountain shows that 2 of the married-couple family households (0.8%) and 8 of the single-parent households (30.8%) are living below the poverty level. Within the married-couple family households, those with 1 or 2 children have the highest poverty rate, with 1 households (4.2%) falling below the poverty line. Among the single-parent households, those with no children have the highest poverty rate, with 2 household (40.0%) living below poverty.
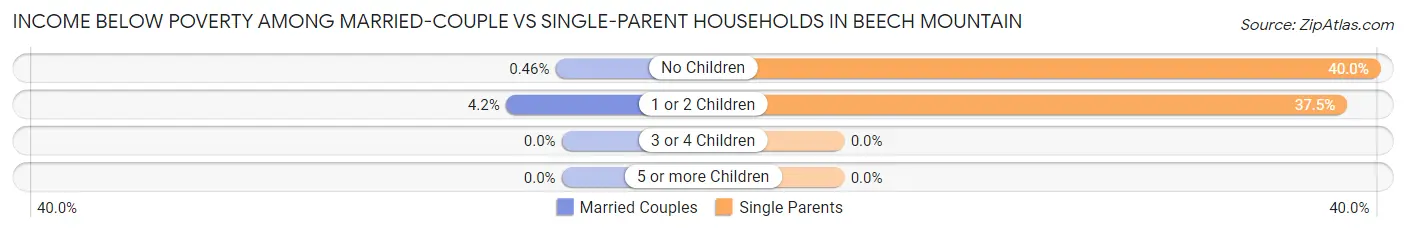
| Children | Married-Couple Families | Single-Parent Households |
| No Children | 1 (0.5%) | 2 (40.0%) |
| 1 or 2 Children | 1 (4.2%) | 6 (37.5%) |
| 3 or 4 Children | 0 (0.0%) | 0 (0.0%) |
| 5 or more Children | 0 (0.0%) | 0 (0.0%) |
| Total | 2 (0.8%) | 8 (30.8%) |
Race in Beech Mountain
The most populous races in Beech Mountain are White / Caucasian (738 | 92.5%), Two or more Races (29 | 3.6%), and Hispanic or Latino (24 | 3.0%).
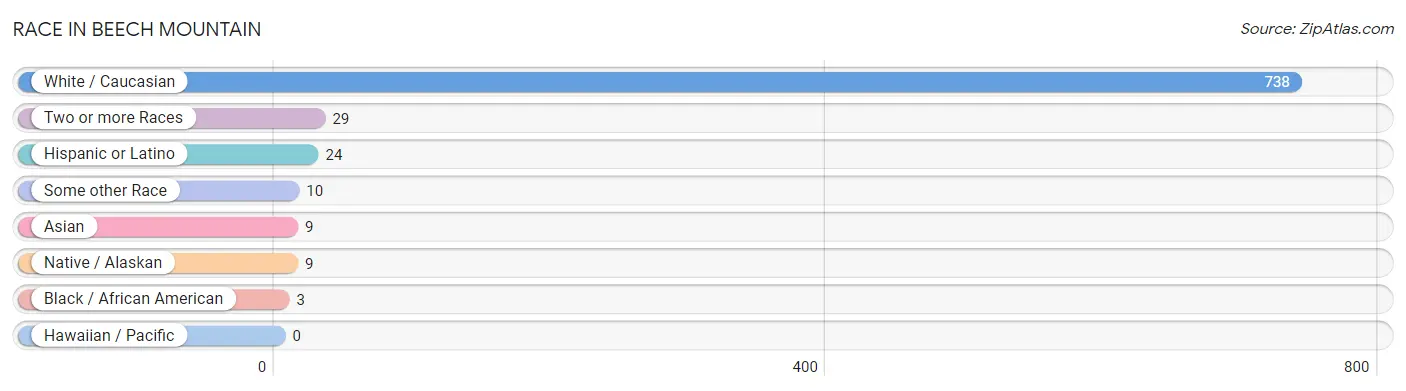
| Race | # Population | % Population |
| Asian | 9 | 1.1% |
| Black / African American | 3 | 0.4% |
| Hawaiian / Pacific | 0 | 0.0% |
| Hispanic or Latino | 24 | 3.0% |
| Native / Alaskan | 9 | 1.1% |
| White / Caucasian | 738 | 92.5% |
| Two or more Races | 29 | 3.6% |
| Some other Race | 10 | 1.3% |
| Total | 798 | 100.0% |
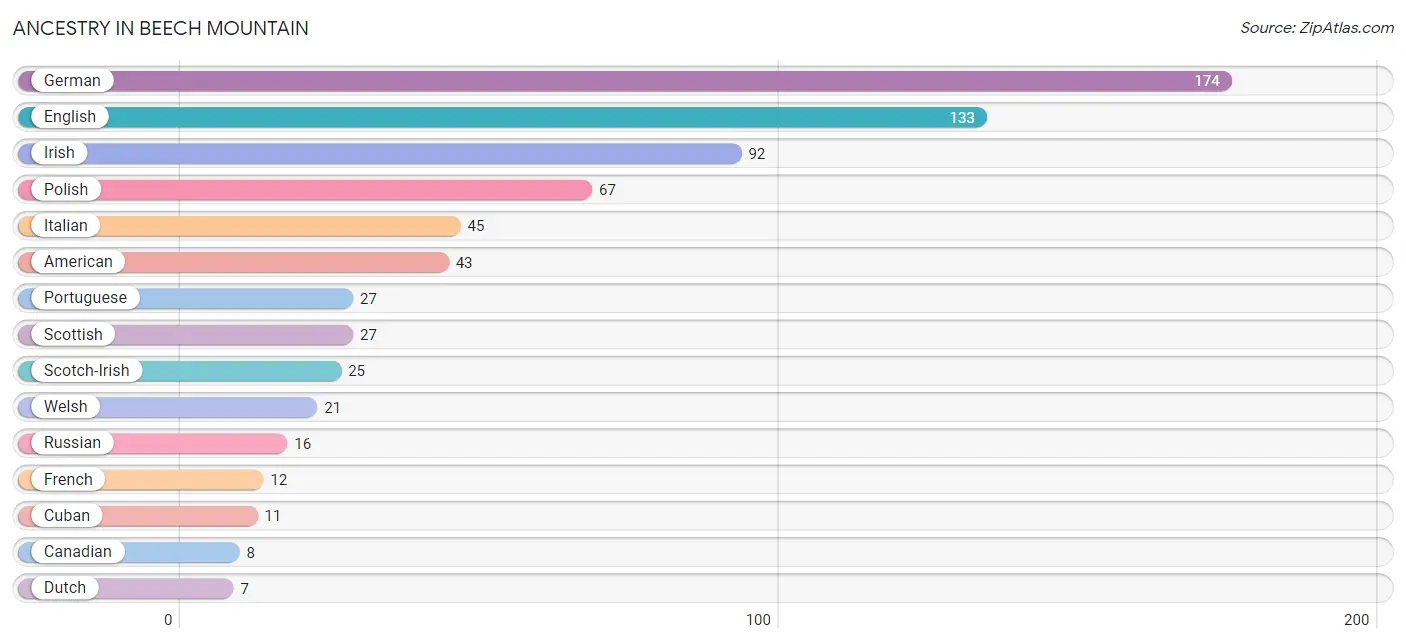
Ancestry in Beech Mountain
The most populous ancestries reported in Beech Mountain are German (174 | 21.8%), English (133 | 16.7%), Irish (92 | 11.5%), Polish (67 | 8.4%), and Italian (45 | 5.6%), together accounting for 64.0% of all Beech Mountain residents.
| Ancestry | # Population | % Population |
| American | 43 | 5.4% |
| Armenian | 1 | 0.1% |
| Austrian | 6 | 0.7% |
| British | 4 | 0.5% |
| British West Indian | 5 | 0.6% |
| Canadian | 8 | 1.0% |
| Cherokee | 3 | 0.4% |
| Cuban | 11 | 1.4% |
| Czech | 1 | 0.1% |
| Danish | 2 | 0.3% |
| Dutch | 7 | 0.9% |
| Eastern European | 6 | 0.7% |
| English | 133 | 16.7% |
| European | 7 | 0.9% |
| French | 12 | 1.5% |
| French Canadian | 7 | 0.9% |
| German | 174 | 21.8% |
| Greek | 6 | 0.7% |
| Hungarian | 5 | 0.6% |
| Indian (Asian) | 1 | 0.1% |
| Iranian | 1 | 0.1% |
| Irish | 92 | 11.5% |
| Italian | 45 | 5.6% |
| Latvian | 4 | 0.5% |
| Lithuanian | 1 | 0.1% |
| Mexican | 6 | 0.7% |
| Navajo | 3 | 0.4% |
| Norwegian | 4 | 0.5% |
| Pakistani | 2 | 0.3% |
| Polish | 67 | 8.4% |
| Portuguese | 27 | 3.4% |
| Puerto Rican | 4 | 0.5% |
| Romanian | 1 | 0.1% |
| Russian | 16 | 2.0% |
| Scandinavian | 6 | 0.7% |
| Scotch-Irish | 25 | 3.1% |
| Scottish | 27 | 3.4% |
| Sioux | 2 | 0.3% |
| Slavic | 4 | 0.5% |
| Slovene | 3 | 0.4% |
| South American | 3 | 0.4% |
| Sri Lankan | 1 | 0.1% |
| Swedish | 3 | 0.4% |
| Thai | 6 | 0.7% |
| Ukrainian | 4 | 0.5% |
| Venezuelan | 3 | 0.4% |
| Welsh | 21 | 2.6% | View All 47 Rows |
Immigrants in Beech Mountain
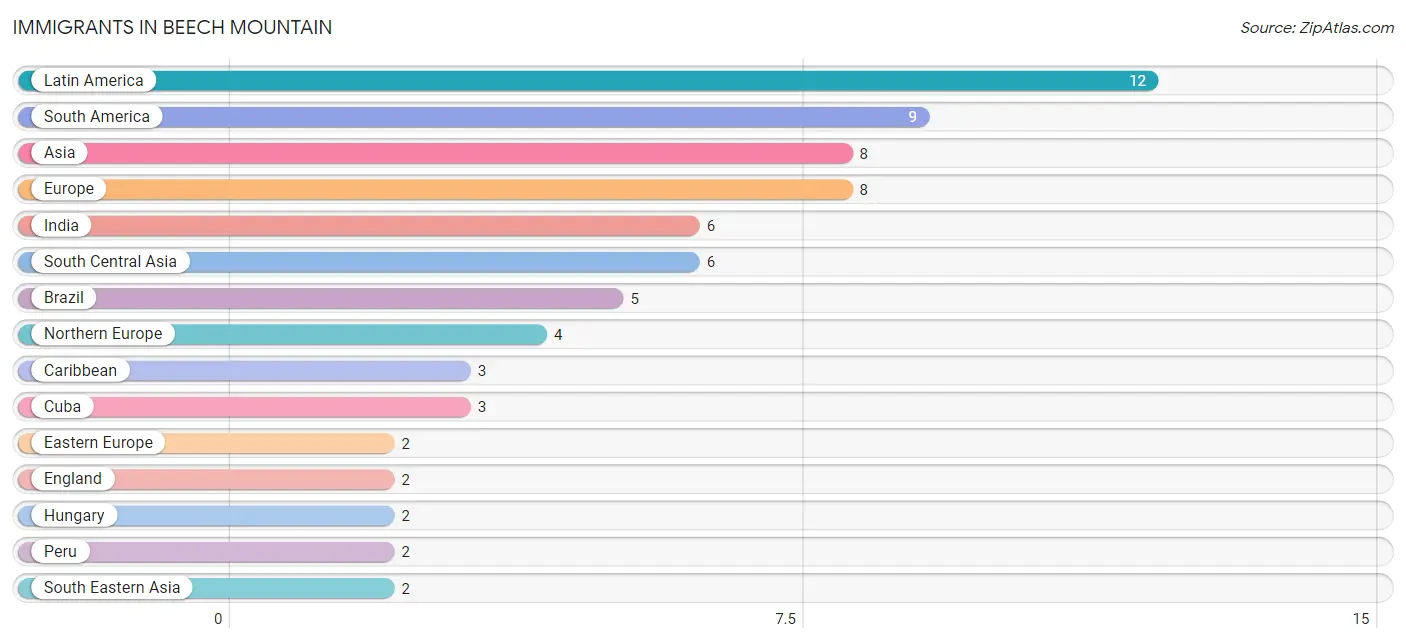
The most numerous immigrant groups reported in Beech Mountain came from Latin America (12 | 1.5%), South America (9 | 1.1%), Asia (8 | 1.0%), Europe (8 | 1.0%), and India (6 | 0.7%), together accounting for 5.4% of all Beech Mountain residents.
| Immigration Origin | # Population | % Population |
| Africa | 1 | 0.1% |
| Asia | 8 | 1.0% |
| Austria | 1 | 0.1% |
| Brazil | 5 | 0.6% |
| Canada | 1 | 0.1% |
| Caribbean | 3 | 0.4% |
| Colombia | 1 | 0.1% |
| Cuba | 3 | 0.4% |
| Eastern Europe | 2 | 0.3% |
| England | 2 | 0.3% |
| Europe | 8 | 1.0% |
| Greece | 1 | 0.1% |
| Hungary | 2 | 0.3% |
| India | 6 | 0.7% |
| Latin America | 12 | 1.5% |
| Northern Europe | 4 | 0.5% |
| Peru | 2 | 0.3% |
| South Africa | 1 | 0.1% |
| South America | 9 | 1.1% |
| South Central Asia | 6 | 0.7% |
| South Eastern Asia | 2 | 0.3% |
| Southern Europe | 1 | 0.1% |
| Thailand | 2 | 0.3% |
| Venezuela | 1 | 0.1% |
| Western Europe | 1 | 0.1% | View All 25 Rows |
Sex and Age in Beech Mountain
Sex and Age in Beech Mountain
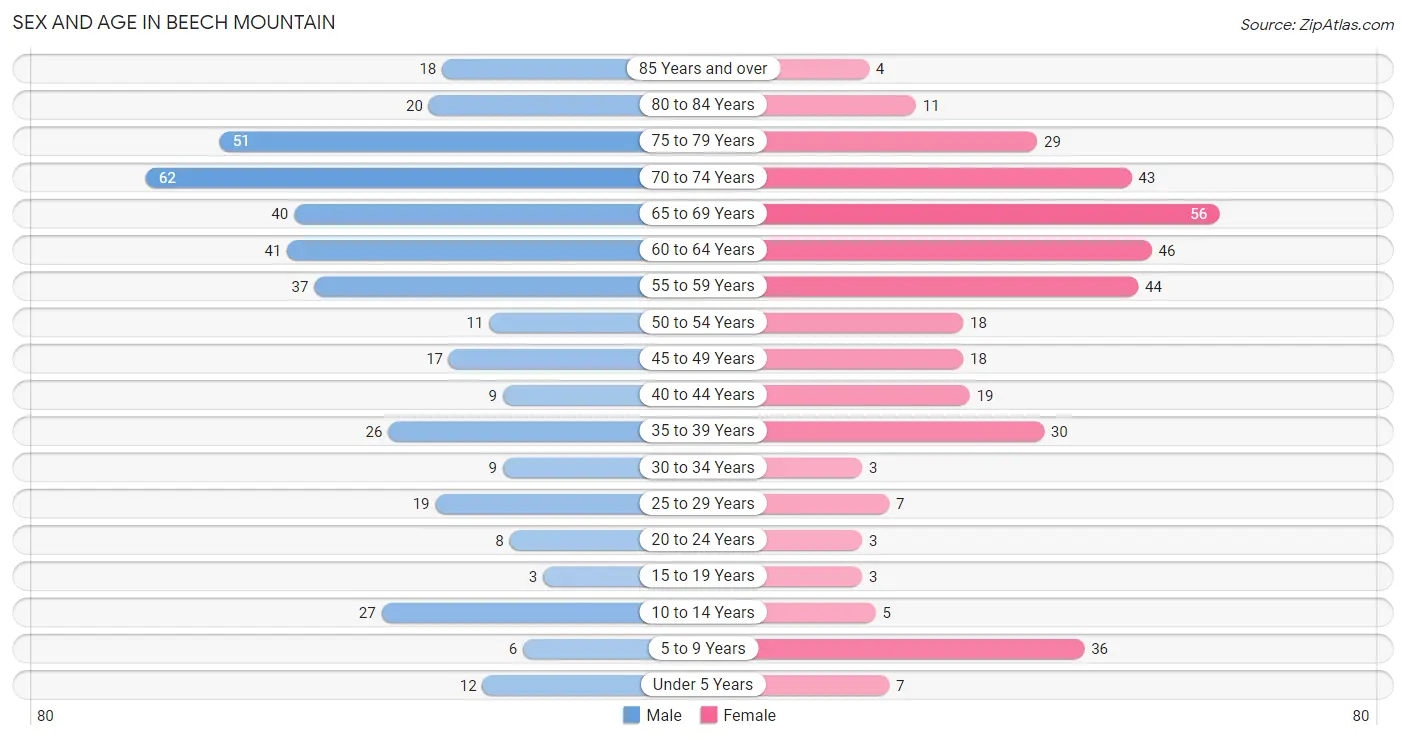
The most populous age groups in Beech Mountain are 70 to 74 Years (62 | 14.9%) for men and 65 to 69 Years (56 | 14.7%) for women.
| Age Bracket | Male | Female |
| Under 5 Years | 12 (2.9%) | 7 (1.8%) |
| 5 to 9 Years | 6 (1.4%) | 36 (9.4%) |
| 10 to 14 Years | 27 (6.5%) | 5 (1.3%) |
| 15 to 19 Years | 3 (0.7%) | 3 (0.8%) |
| 20 to 24 Years | 8 (1.9%) | 3 (0.8%) |
| 25 to 29 Years | 19 (4.6%) | 7 (1.8%) |
| 30 to 34 Years | 9 (2.2%) | 3 (0.8%) |
| 35 to 39 Years | 26 (6.2%) | 30 (7.9%) |
| 40 to 44 Years | 9 (2.2%) | 19 (5.0%) |
| 45 to 49 Years | 17 (4.1%) | 18 (4.7%) |
| 50 to 54 Years | 11 (2.6%) | 18 (4.7%) |
| 55 to 59 Years | 37 (8.9%) | 44 (11.5%) |
| 60 to 64 Years | 41 (9.9%) | 46 (12.0%) |
| 65 to 69 Years | 40 (9.6%) | 56 (14.7%) |
| 70 to 74 Years | 62 (14.9%) | 43 (11.3%) |
| 75 to 79 Years | 51 (12.3%) | 29 (7.6%) |
| 80 to 84 Years | 20 (4.8%) | 11 (2.9%) |
| 85 Years and over | 18 (4.3%) | 4 (1.1%) |
| Total | 416 (100.0%) | 382 (100.0%) |
Families and Households in Beech Mountain
Median Family Size in Beech Mountain
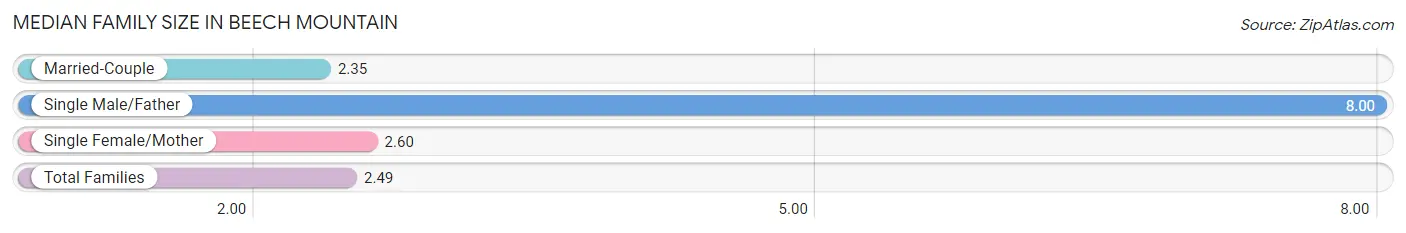
The median family size in Beech Mountain is 2.49 persons per family, with single male/father families (6 | 2.2%) accounting for the largest median family size of 8 persons per family. On the other hand, married-couple families (243 | 90.3%) represent the smallest median family size with 2.35 persons per family.
| Family Type | # Families | Family Size |
| Married-Couple | 243 (90.3%) | 2.35 |
| Single Male/Father | 6 (2.2%) | 8.00 |
| Single Female/Mother | 20 (7.4%) | 2.60 |
| Total Families | 269 (100.0%) | 2.49 |
Median Household Size in Beech Mountain
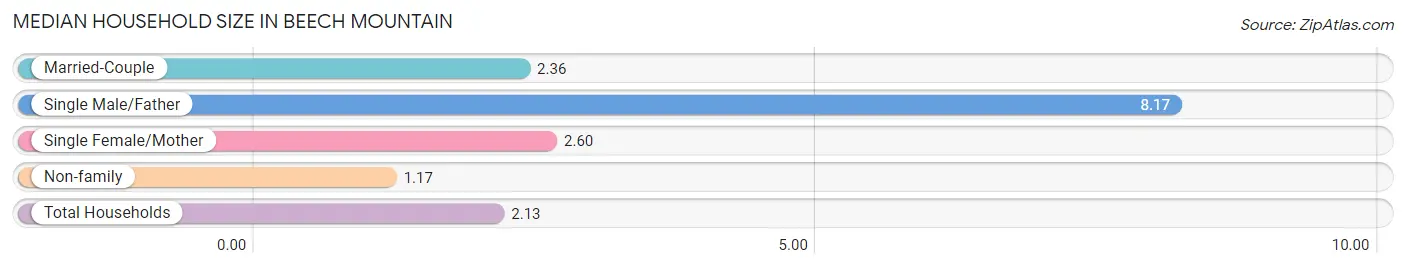
The median household size in Beech Mountain is 2.13 persons per household, with single male/father households (6 | 1.6%) accounting for the largest median household size of 8.17 persons per household. non-family households (106 | 28.3%) represent the smallest median household size with 1.17 persons per household.
| Household Type | # Households | Household Size |
| Married-Couple | 243 (64.8%) | 2.36 |
| Single Male/Father | 6 (1.6%) | 8.17 |
| Single Female/Mother | 20 (5.3%) | 2.60 |
| Non-family | 106 (28.3%) | 1.17 |
| Total Households | 375 (100.0%) | 2.13 |
Household Size by Marriage Status in Beech Mountain
Out of a total of 375 households in Beech Mountain, 269 (71.7%) are family households, while 106 (28.3%) are nonfamily households. The most numerous type of family households are 2-person households, comprising 220, and the most common type of nonfamily households are 1-person households, comprising 91.
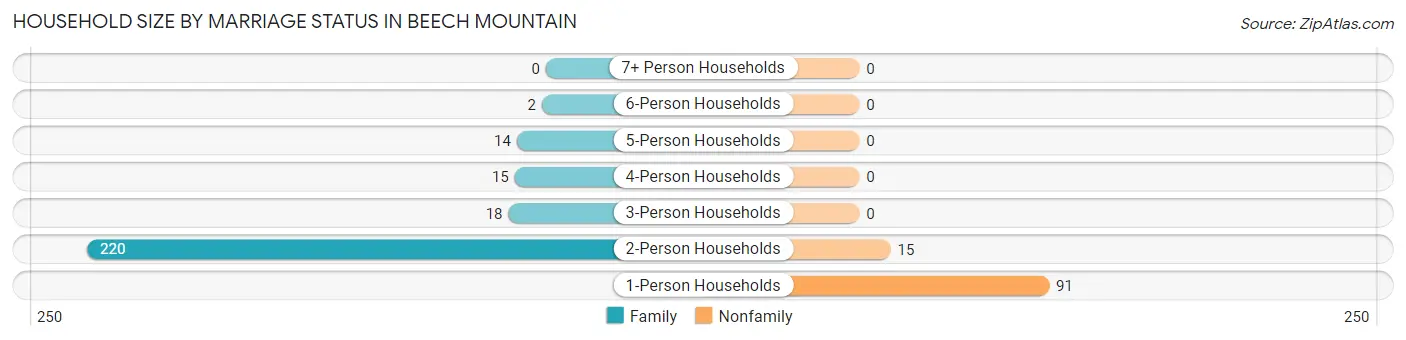
| Household Size | Family Households | Nonfamily Households |
| 1-Person Households | - | 91 (24.3%) |
| 2-Person Households | 220 (58.7%) | 15 (4.0%) |
| 3-Person Households | 18 (4.8%) | 0 (0.0%) |
| 4-Person Households | 15 (4.0%) | 0 (0.0%) |
| 5-Person Households | 14 (3.7%) | 0 (0.0%) |
| 6-Person Households | 2 (0.5%) | 0 (0.0%) |
| 7+ Person Households | 0 (0.0%) | 0 (0.0%) |
| Total | 269 (71.7%) | 106 (28.3%) |
Female Fertility in Beech Mountain
Fertility by Age in Beech Mountain
Average fertility rate in Beech Mountain is 129.0 births per 1,000 women. Women in the age bracket of 20 to 34 years have the highest fertility rate with 231.0 births per 1,000 women. Women in the age bracket of 35 to 50 years acount for 72.7% of all women with births.
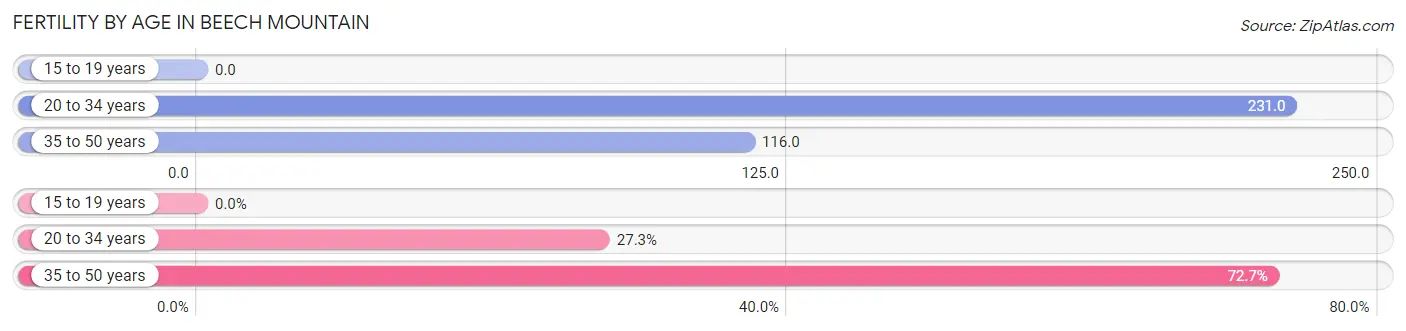
| Age Bracket | Women with Births | Births / 1,000 Women |
| 15 to 19 years | 0 (0.0%) | 0.0 |
| 20 to 34 years | 3 (27.3%) | 231.0 |
| 35 to 50 years | 8 (72.7%) | 116.0 |
| Total | 11 (100.0%) | 129.0 |
Fertility by Age by Marriage Status in Beech Mountain
18.2% of women with births (11) in Beech Mountain are married. The highest percentage of unmarried women with births falls into 35 to 50 years age bracket with 100.0% of them unmarried at the time of birth, while the lowest percentage of unmarried women with births belong to 20 to 34 years age bracket with 33.3% of them unmarried.
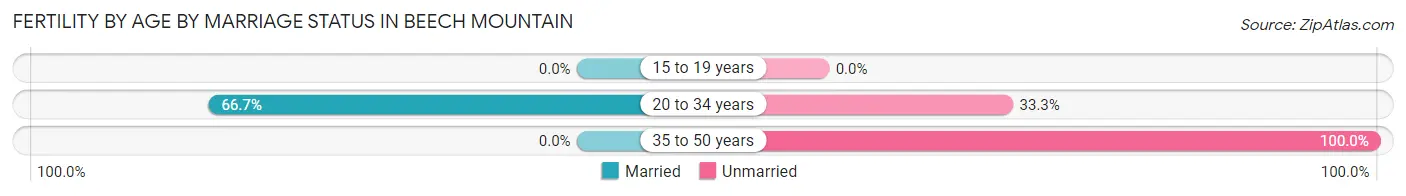
| Age Bracket | Married | Unmarried |
| 15 to 19 years | 0 (0.0%) | 0 (0.0%) |
| 20 to 34 years | 2 (66.7%) | 1 (33.3%) |
| 35 to 50 years | 0 (0.0%) | 8 (100.0%) |
| Total | 2 (18.2%) | 9 (81.8%) |
Fertility by Education in Beech Mountain
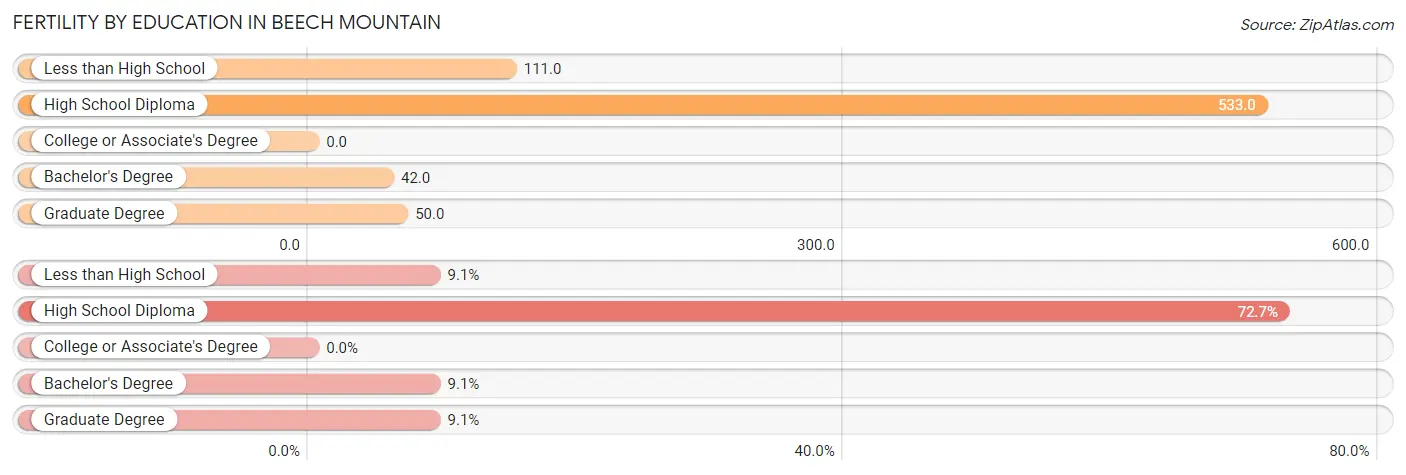
| Educational Attainment | Women with Births | Births / 1,000 Women |
| Less than High School | 1 (9.1%) | 111.0 |
| High School Diploma | 8 (72.7%) | 533.0 |
| College or Associate's Degree | 0 (0.0%) | 0.0 |
| Bachelor's Degree | 1 (9.1%) | 42.0 |
| Graduate Degree | 1 (9.1%) | 50.0 |
| Total | 11 (100.0%) | 129.0 |
Fertility by Education by Marriage Status in Beech Mountain
81.8% of women with births in Beech Mountain are unmarried. Women with the educational attainment of bachelor's degree are most likely to be married with 100.0% of them married at childbirth, while women with the educational attainment of less than high school are least likely to be married with 100.0% of them unmarried at childbirth.
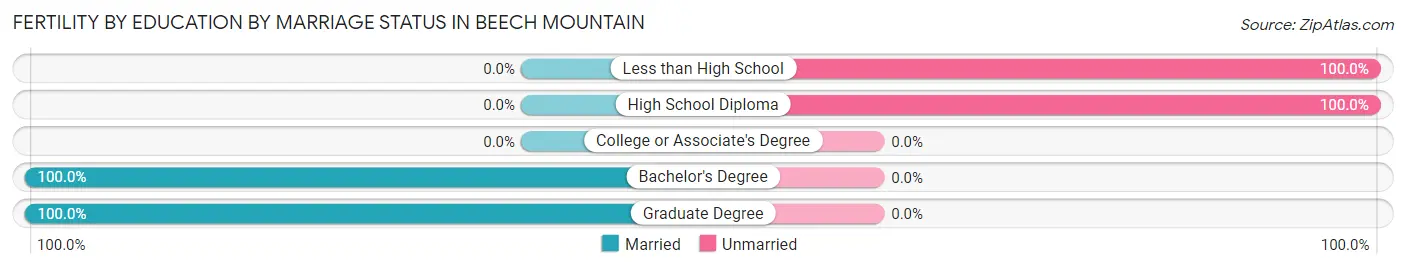
| Educational Attainment | Married | Unmarried |
| Less than High School | 0 (0.0%) | 1 (100.0%) |
| High School Diploma | 0 (0.0%) | 8 (100.0%) |
| College or Associate's Degree | 0 (0.0%) | 0 (0.0%) |
| Bachelor's Degree | 1 (100.0%) | 0 (0.0%) |
| Graduate Degree | 1 (100.0%) | 0 (0.0%) |
| Total | 2 (18.2%) | 9 (81.8%) |
Employment Characteristics in Beech Mountain
Employment by Class of Employer in Beech Mountain
Among the 283 employed individuals in Beech Mountain, private company employees (122 | 43.1%), self-employed (not incorporated) (72 | 25.4%), and not-for-profit organizations (28 | 9.9%) make up the most common classes of employment.
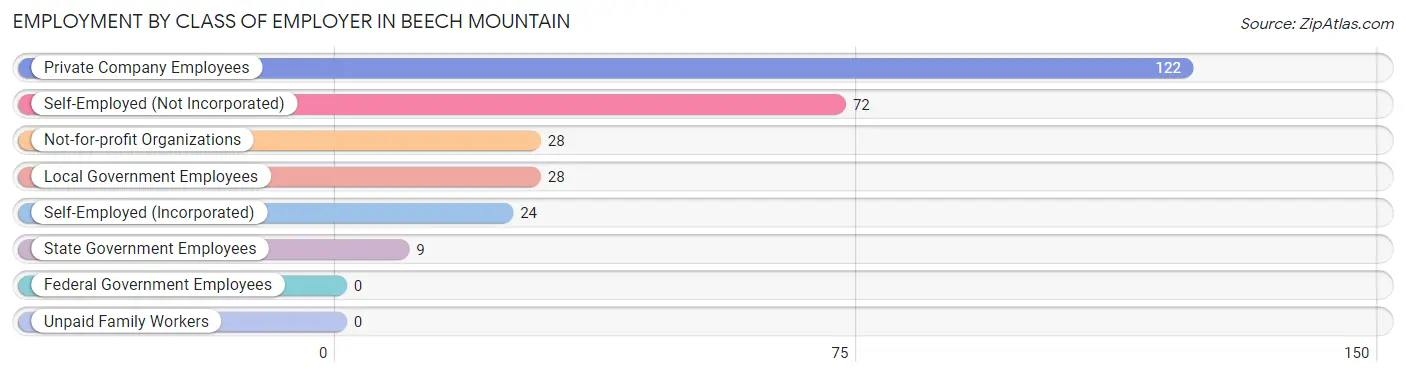
| Employer Class | # Employees | % Employees |
| Private Company Employees | 122 | 43.1% |
| Self-Employed (Incorporated) | 24 | 8.5% |
| Self-Employed (Not Incorporated) | 72 | 25.4% |
| Not-for-profit Organizations | 28 | 9.9% |
| Local Government Employees | 28 | 9.9% |
| State Government Employees | 9 | 3.2% |
| Federal Government Employees | 0 | 0.0% |
| Unpaid Family Workers | 0 | 0.0% |
| Total | 283 | 100.0% |
Employment Status by Age in Beech Mountain
According to the labor force statistics for Beech Mountain, out of the total population over 16 years of age (702), 45.6% or 320 individuals are in the labor force, with 9.1% or 29 of them unemployed. The age group with the highest labor force participation rate is 20 to 24 years, with 100.0% or 11 individuals in the labor force. Within the labor force, the 25 to 29 years age range has the highest percentage of unemployed individuals, with 59.1% or 13 of them being unemployed.
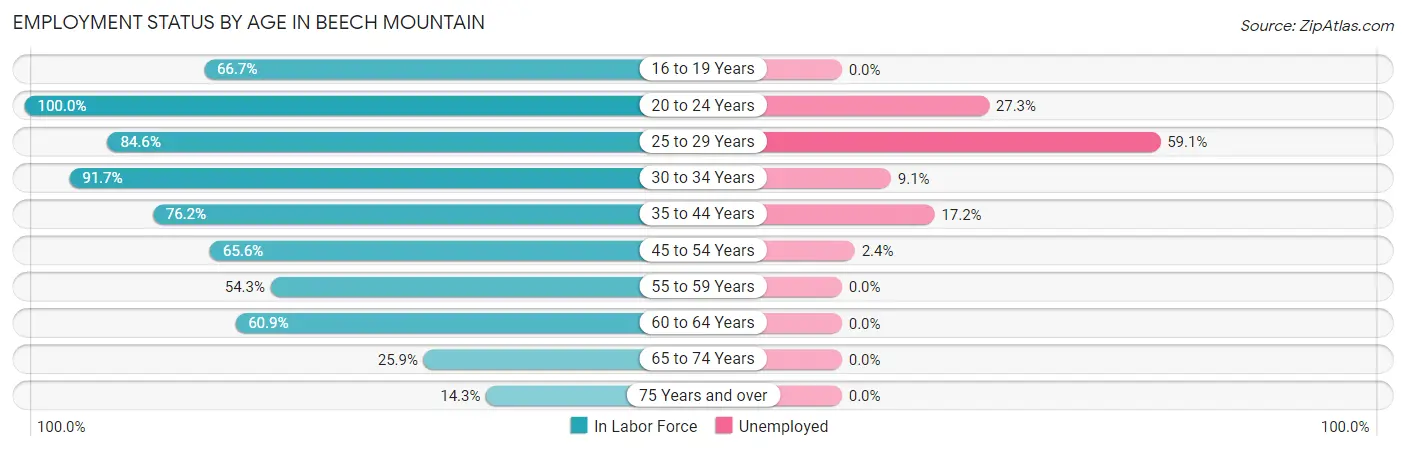
| Age Bracket | In Labor Force | Unemployed |
| 16 to 19 Years | 2 (66.7%) | 0 (0.0%) |
| 20 to 24 Years | 11 (100.0%) | 3 (27.3%) |
| 25 to 29 Years | 22 (84.6%) | 13 (59.1%) |
| 30 to 34 Years | 11 (91.7%) | 1 (9.1%) |
| 35 to 44 Years | 64 (76.2%) | 11 (17.2%) |
| 45 to 54 Years | 42 (65.6%) | 1 (2.4%) |
| 55 to 59 Years | 44 (54.3%) | 0 (0.0%) |
| 60 to 64 Years | 53 (60.9%) | 0 (0.0%) |
| 65 to 74 Years | 52 (25.9%) | 0 (0.0%) |
| 75 Years and over | 19 (14.3%) | 0 (0.0%) |
| Total | 320 (45.6%) | 29 (9.1%) |
Employment Status by Educational Attainment in Beech Mountain
According to labor force statistics for Beech Mountain, 66.7% of individuals (236) out of the total population between 25 and 64 years of age (354) are in the labor force, with 11.0% or 26 of them being unemployed. The group with the highest labor force participation rate are those with the educational attainment of bachelor's degree or higher, with 78.7% or 111 individuals in the labor force. Within the labor force, individuals with high school diploma education have the highest percentage of unemployment, with 42.1% or 8 of them being unemployed.
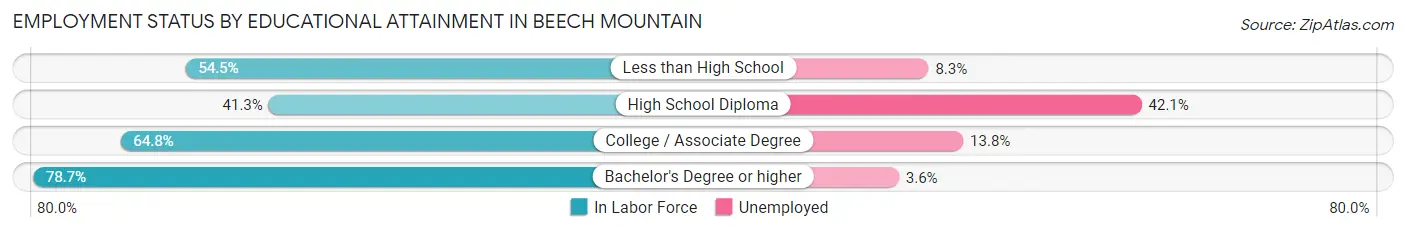
| Educational Attainment | In Labor Force | Unemployed |
| Less than High School | 12 (54.5%) | 2 (8.3%) |
| High School Diploma | 19 (41.3%) | 19 (42.1%) |
| College / Associate Degree | 94 (64.8%) | 20 (13.8%) |
| Bachelor's Degree or higher | 111 (78.7%) | 5 (3.6%) |
| Total | 236 (66.7%) | 39 (11.0%) |
Employment Occupations by Sex in Beech Mountain
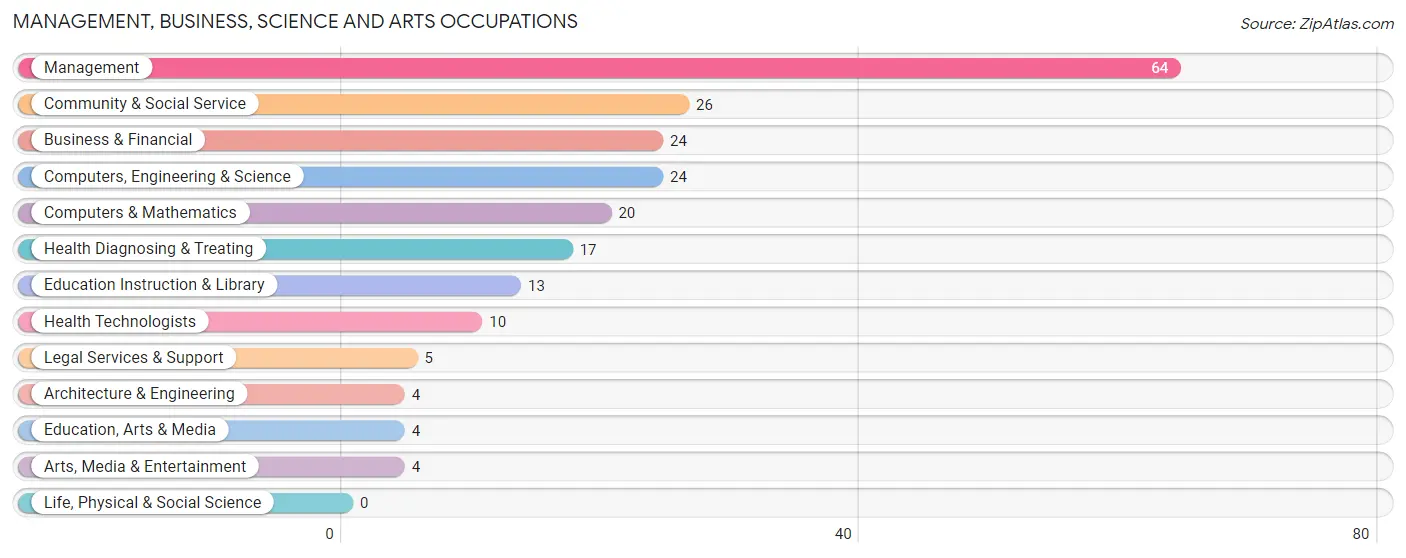
Management, Business, Science and Arts Occupations
The most common Management, Business, Science and Arts occupations in Beech Mountain are Management (64 | 22.0%), Community & Social Service (26 | 8.9%), Business & Financial (24 | 8.3%), Computers, Engineering & Science (24 | 8.3%), and Computers & Mathematics (20 | 6.9%).
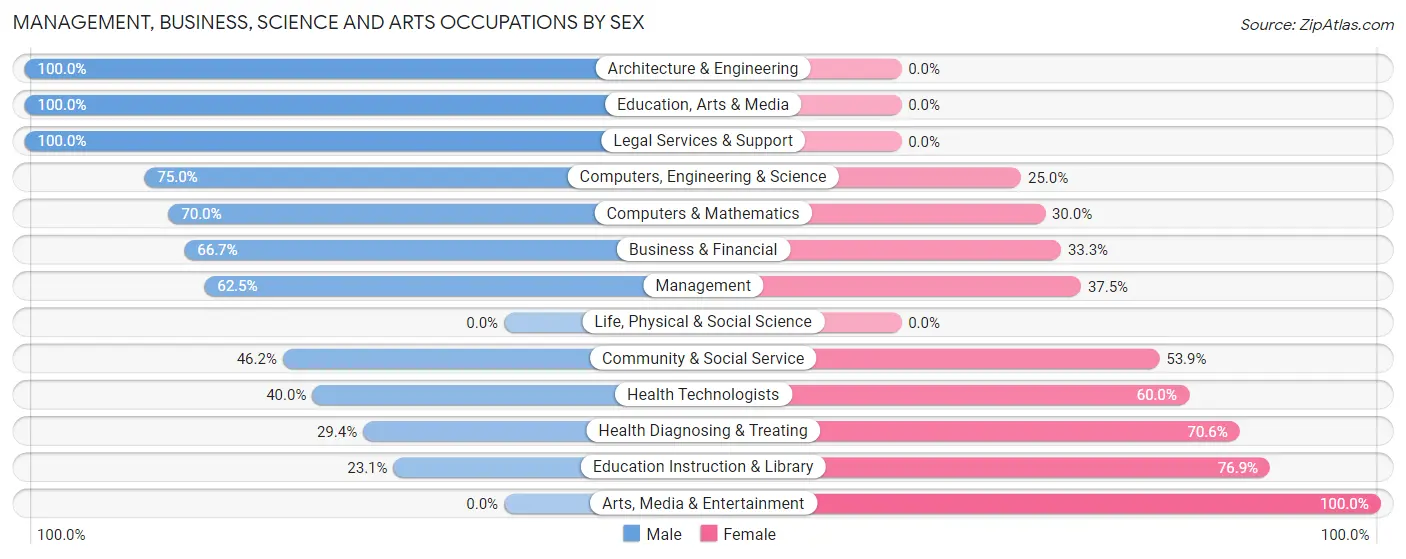
Management, Business, Science and Arts Occupations by Sex
Within the Management, Business, Science and Arts occupations in Beech Mountain, the most male-oriented occupations are Architecture & Engineering (100.0%), Education, Arts & Media (100.0%), and Legal Services & Support (100.0%), while the most female-oriented occupations are Arts, Media & Entertainment (100.0%), Education Instruction & Library (76.9%), and Health Diagnosing & Treating (70.6%).
| Occupation | Male | Female |
| Management | 40 (62.5%) | 24 (37.5%) |
| Business & Financial | 16 (66.7%) | 8 (33.3%) |
| Computers, Engineering & Science | 18 (75.0%) | 6 (25.0%) |
| Computers & Mathematics | 14 (70.0%) | 6 (30.0%) |
| Architecture & Engineering | 4 (100.0%) | 0 (0.0%) |
| Life, Physical & Social Science | 0 (0.0%) | 0 (0.0%) |
| Community & Social Service | 12 (46.2%) | 14 (53.8%) |
| Education, Arts & Media | 4 (100.0%) | 0 (0.0%) |
| Legal Services & Support | 5 (100.0%) | 0 (0.0%) |
| Education Instruction & Library | 3 (23.1%) | 10 (76.9%) |
| Arts, Media & Entertainment | 0 (0.0%) | 4 (100.0%) |
| Health Diagnosing & Treating | 5 (29.4%) | 12 (70.6%) |
| Health Technologists | 4 (40.0%) | 6 (60.0%) |
| Total (Category) | 91 (58.7%) | 64 (41.3%) |
| Total (Overall) | 163 (56.0%) | 128 (44.0%) |
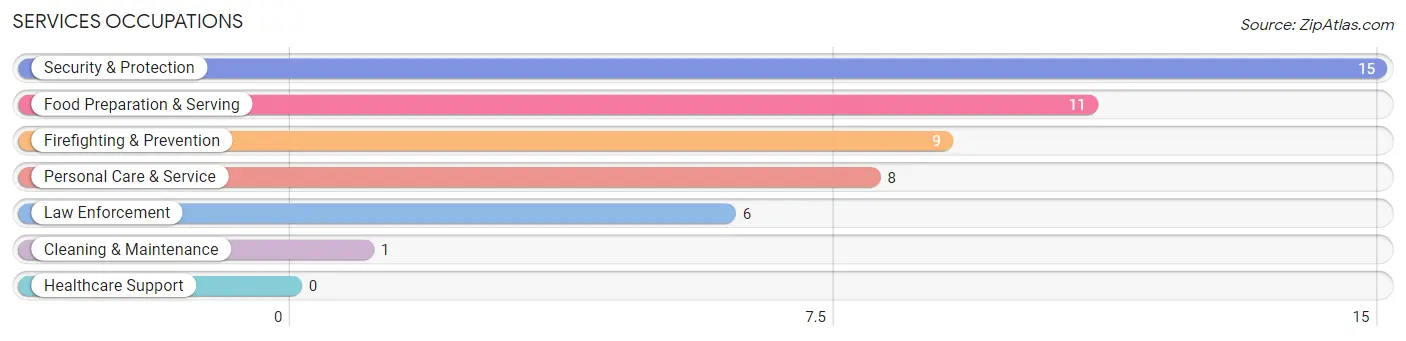
Services Occupations
The most common Services occupations in Beech Mountain are Security & Protection (15 | 5.1%), Food Preparation & Serving (11 | 3.8%), Firefighting & Prevention (9 | 3.1%), Personal Care & Service (8 | 2.8%), and Law Enforcement (6 | 2.1%).
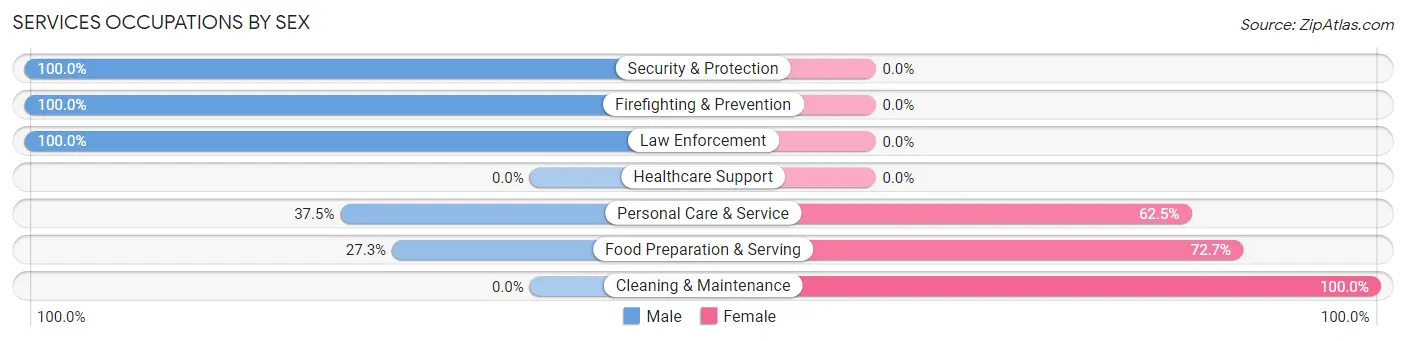
Services Occupations by Sex
Within the Services occupations in Beech Mountain, the most male-oriented occupations are Security & Protection (100.0%), Firefighting & Prevention (100.0%), and Law Enforcement (100.0%), while the most female-oriented occupations are Cleaning & Maintenance (100.0%), Food Preparation & Serving (72.7%), and Personal Care & Service (62.5%).
| Occupation | Male | Female |
| Healthcare Support | 0 (0.0%) | 0 (0.0%) |
| Security & Protection | 15 (100.0%) | 0 (0.0%) |
| Firefighting & Prevention | 9 (100.0%) | 0 (0.0%) |
| Law Enforcement | 6 (100.0%) | 0 (0.0%) |
| Food Preparation & Serving | 3 (27.3%) | 8 (72.7%) |
| Cleaning & Maintenance | 0 (0.0%) | 1 (100.0%) |
| Personal Care & Service | 3 (37.5%) | 5 (62.5%) |
| Total (Category) | 21 (60.0%) | 14 (40.0%) |
| Total (Overall) | 163 (56.0%) | 128 (44.0%) |
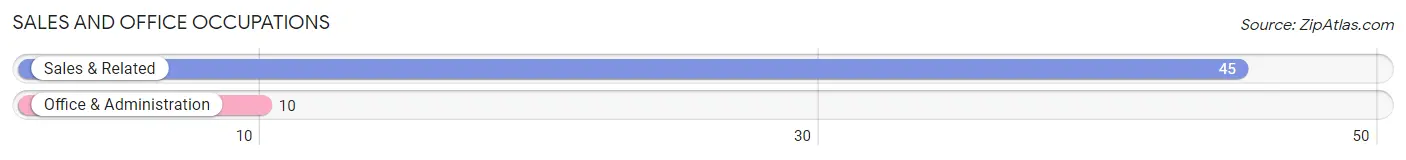
Sales and Office Occupations
The most common Sales and Office occupations in Beech Mountain are Sales & Related (45 | 15.5%), and Office & Administration (10 | 3.4%).
Sales and Office Occupations by Sex
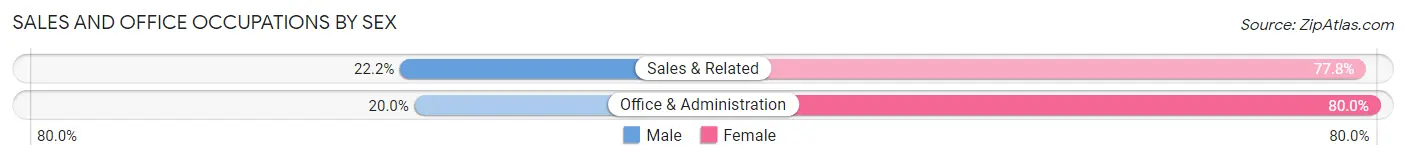
| Occupation | Male | Female |
| Sales & Related | 10 (22.2%) | 35 (77.8%) |
| Office & Administration | 2 (20.0%) | 8 (80.0%) |
| Total (Category) | 12 (21.8%) | 43 (78.2%) |
| Total (Overall) | 163 (56.0%) | 128 (44.0%) |
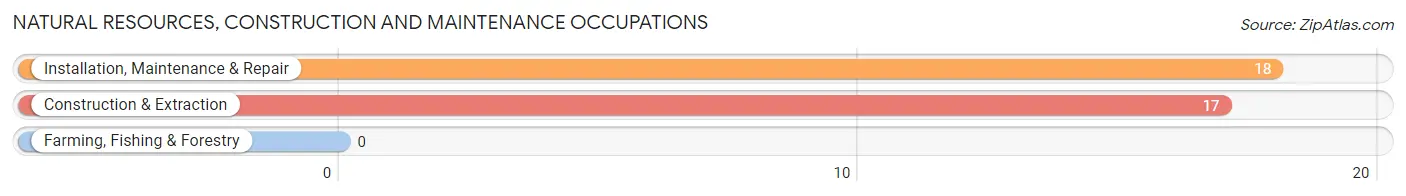
Natural Resources, Construction and Maintenance Occupations
The most common Natural Resources, Construction and Maintenance occupations in Beech Mountain are Installation, Maintenance & Repair (18 | 6.2%), and Construction & Extraction (17 | 5.8%).
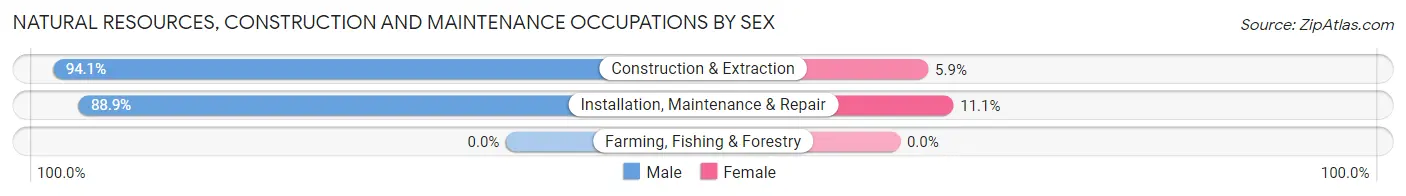
Natural Resources, Construction and Maintenance Occupations by Sex
| Occupation | Male | Female |
| Farming, Fishing & Forestry | 0 (0.0%) | 0 (0.0%) |
| Construction & Extraction | 16 (94.1%) | 1 (5.9%) |
| Installation, Maintenance & Repair | 16 (88.9%) | 2 (11.1%) |
| Total (Category) | 32 (91.4%) | 3 (8.6%) |
| Total (Overall) | 163 (56.0%) | 128 (44.0%) |
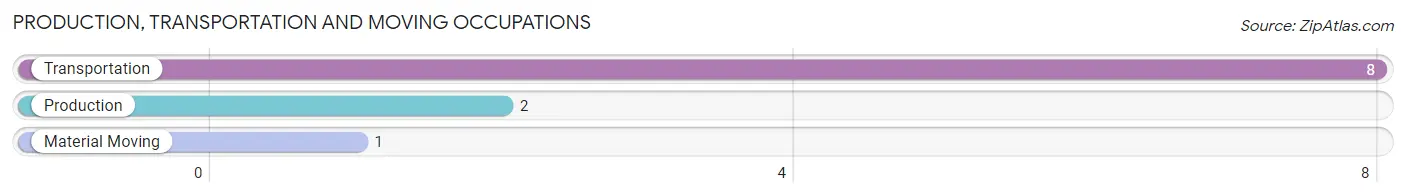
Production, Transportation and Moving Occupations
The most common Production, Transportation and Moving occupations in Beech Mountain are Transportation (8 | 2.8%), Production (2 | 0.7%), and Material Moving (1 | 0.3%).
Production, Transportation and Moving Occupations by Sex
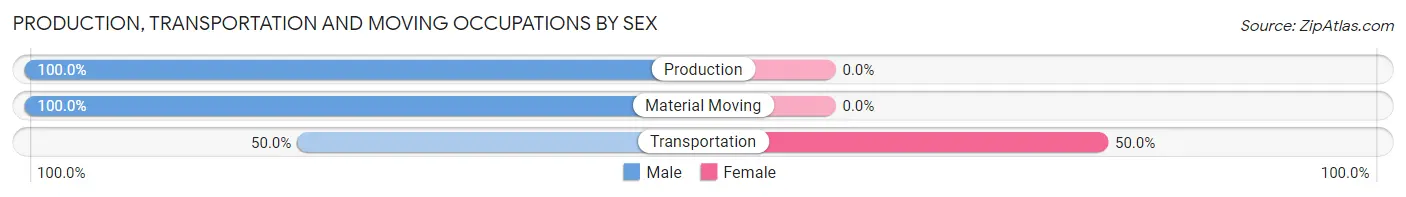
| Occupation | Male | Female |
| Production | 2 (100.0%) | 0 (0.0%) |
| Transportation | 4 (50.0%) | 4 (50.0%) |
| Material Moving | 1 (100.0%) | 0 (0.0%) |
| Total (Category) | 7 (63.6%) | 4 (36.4%) |
| Total (Overall) | 163 (56.0%) | 128 (44.0%) |
Employment Industries by Sex in Beech Mountain
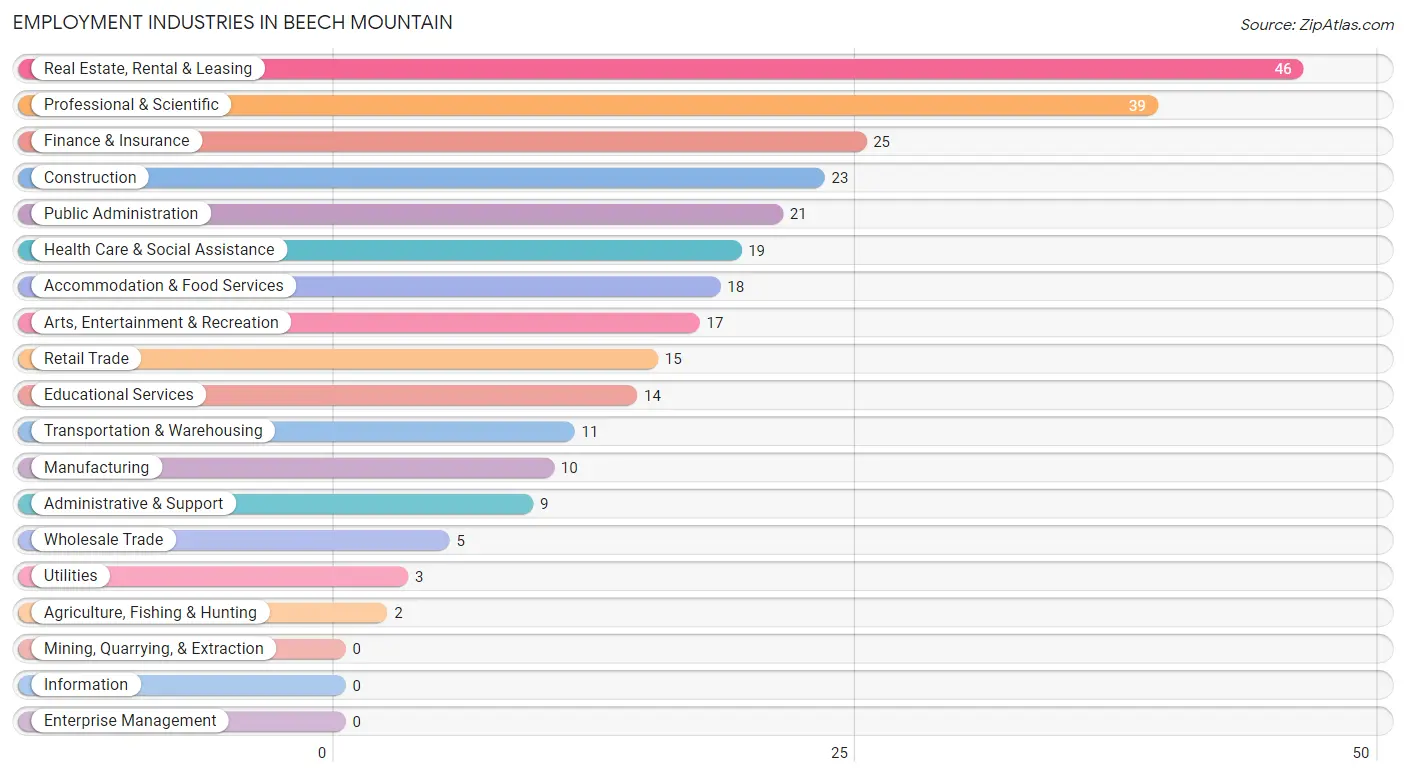
Employment Industries in Beech Mountain
The major employment industries in Beech Mountain include Real Estate, Rental & Leasing (46 | 15.8%), Professional & Scientific (39 | 13.4%), Finance & Insurance (25 | 8.6%), Construction (23 | 7.9%), and Public Administration (21 | 7.2%).
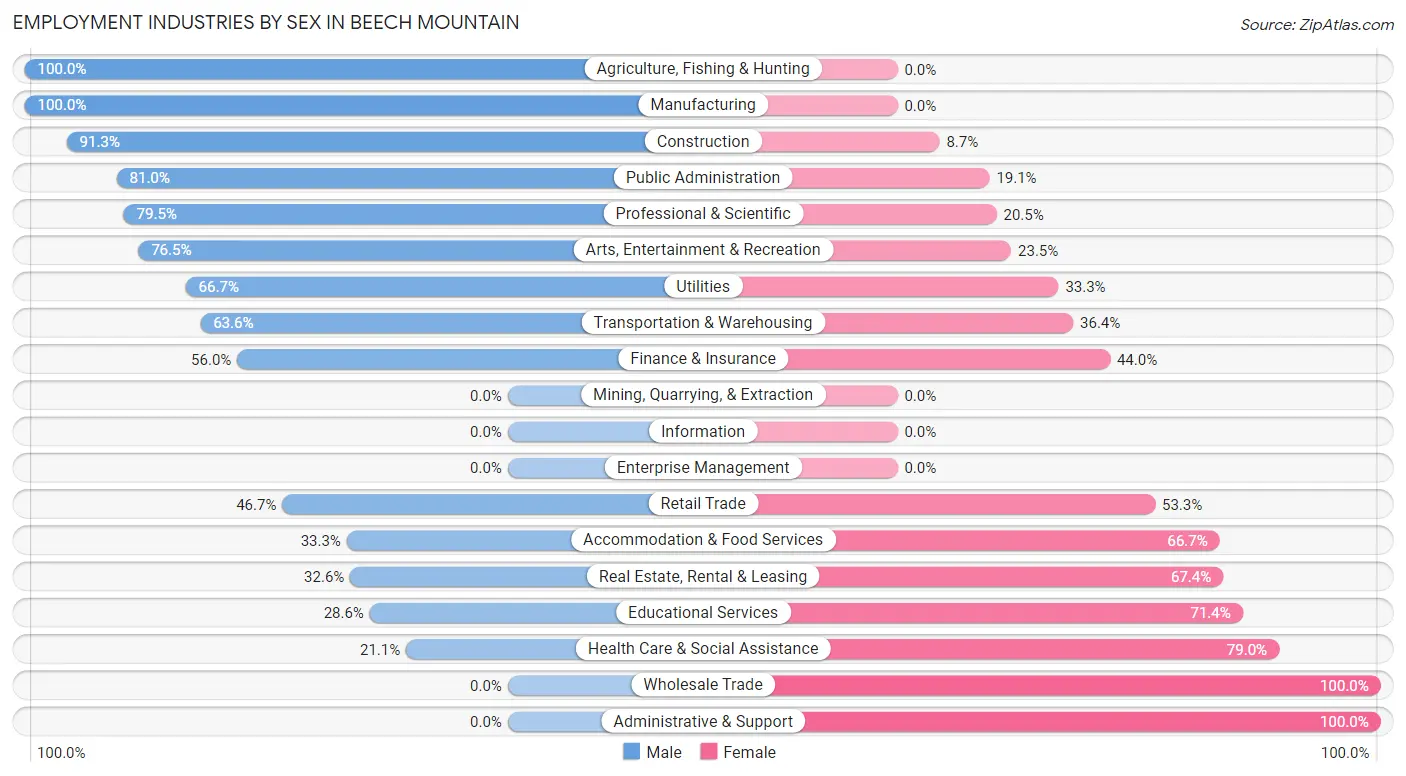
Employment Industries by Sex in Beech Mountain
The Beech Mountain industries that see more men than women are Agriculture, Fishing & Hunting (100.0%), Manufacturing (100.0%), and Construction (91.3%), whereas the industries that tend to have a higher number of women are Wholesale Trade (100.0%), Administrative & Support (100.0%), and Health Care & Social Assistance (78.9%).
| Industry | Male | Female |
| Agriculture, Fishing & Hunting | 2 (100.0%) | 0 (0.0%) |
| Mining, Quarrying, & Extraction | 0 (0.0%) | 0 (0.0%) |
| Construction | 21 (91.3%) | 2 (8.7%) |
| Manufacturing | 10 (100.0%) | 0 (0.0%) |
| Wholesale Trade | 0 (0.0%) | 5 (100.0%) |
| Retail Trade | 7 (46.7%) | 8 (53.3%) |
| Transportation & Warehousing | 7 (63.6%) | 4 (36.4%) |
| Utilities | 2 (66.7%) | 1 (33.3%) |
| Information | 0 (0.0%) | 0 (0.0%) |
| Finance & Insurance | 14 (56.0%) | 11 (44.0%) |
| Real Estate, Rental & Leasing | 15 (32.6%) | 31 (67.4%) |
| Professional & Scientific | 31 (79.5%) | 8 (20.5%) |
| Enterprise Management | 0 (0.0%) | 0 (0.0%) |
| Administrative & Support | 0 (0.0%) | 9 (100.0%) |
| Educational Services | 4 (28.6%) | 10 (71.4%) |
| Health Care & Social Assistance | 4 (21.0%) | 15 (78.9%) |
| Arts, Entertainment & Recreation | 13 (76.5%) | 4 (23.5%) |
| Accommodation & Food Services | 6 (33.3%) | 12 (66.7%) |
| Public Administration | 17 (80.9%) | 4 (19.1%) |
| Total | 163 (56.0%) | 128 (44.0%) |
Education in Beech Mountain
School Enrollment in Beech Mountain
The most common levels of schooling among the 90 students in Beech Mountain are middle school (29 | 32.2%), elementary school (26 | 28.9%), and kindergarten (13 | 14.4%).
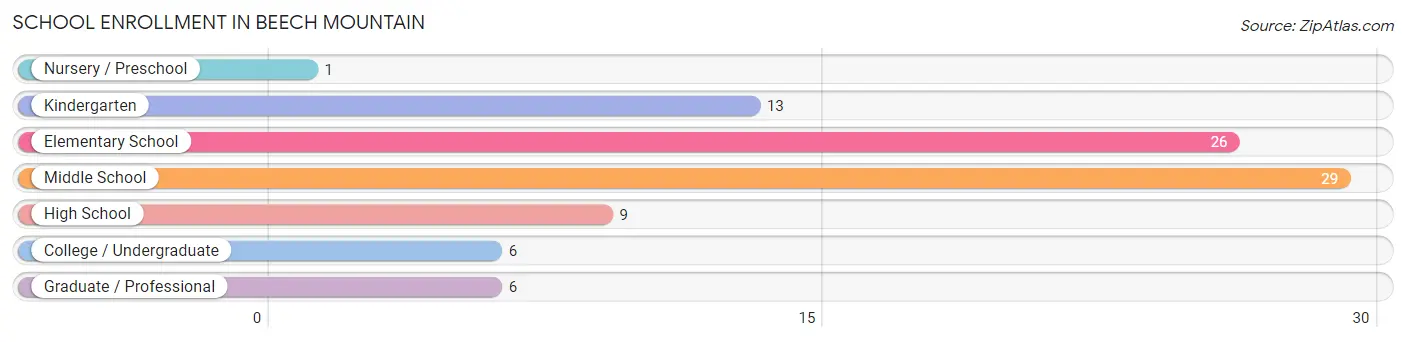
| School Level | # Students | % Students |
| Nursery / Preschool | 1 | 1.1% |
| Kindergarten | 13 | 14.4% |
| Elementary School | 26 | 28.9% |
| Middle School | 29 | 32.2% |
| High School | 9 | 10.0% |
| College / Undergraduate | 6 | 6.7% |
| Graduate / Professional | 6 | 6.7% |
| Total | 90 | 100.0% |
School Enrollment by Age by Funding Source in Beech Mountain
Out of a total of 90 students who are enrolled in schools in Beech Mountain, 12 (13.3%) attend a private institution, while the remaining 78 (86.7%) are enrolled in public schools. The age group of 15 to 17 year olds has the highest likelihood of being enrolled in private schools, with 5 (83.3% in the age bracket) enrolled. Conversely, the age group of 5 to 9 year old has the lowest likelihood of being enrolled in a private school, with 40 (100.0% in the age bracket) attending a public institution.
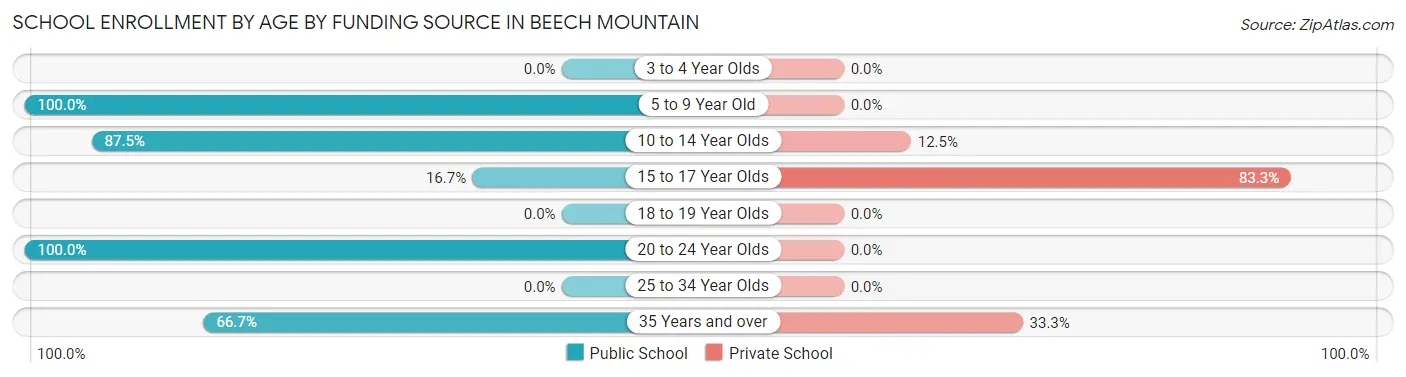
| Age Bracket | Public School | Private School |
| 3 to 4 Year Olds | 0 (0.0%) | 0 (0.0%) |
| 5 to 9 Year Old | 40 (100.0%) | 0 (0.0%) |
| 10 to 14 Year Olds | 28 (87.5%) | 4 (12.5%) |
| 15 to 17 Year Olds | 1 (16.7%) | 5 (83.3%) |
| 18 to 19 Year Olds | 0 (0.0%) | 0 (0.0%) |
| 20 to 24 Year Olds | 3 (100.0%) | 0 (0.0%) |
| 25 to 34 Year Olds | 0 (0.0%) | 0 (0.0%) |
| 35 Years and over | 6 (66.7%) | 3 (33.3%) |
| Total | 78 (86.7%) | 12 (13.3%) |
Educational Attainment by Field of Study in Beech Mountain
Education (69 | 18.5%), business (51 | 13.7%), social sciences (36 | 9.7%), science & technology (26 | 7.0%), and engineering (25 | 6.7%) are the most common fields of study among 373 individuals in Beech Mountain who have obtained a bachelor's degree or higher.
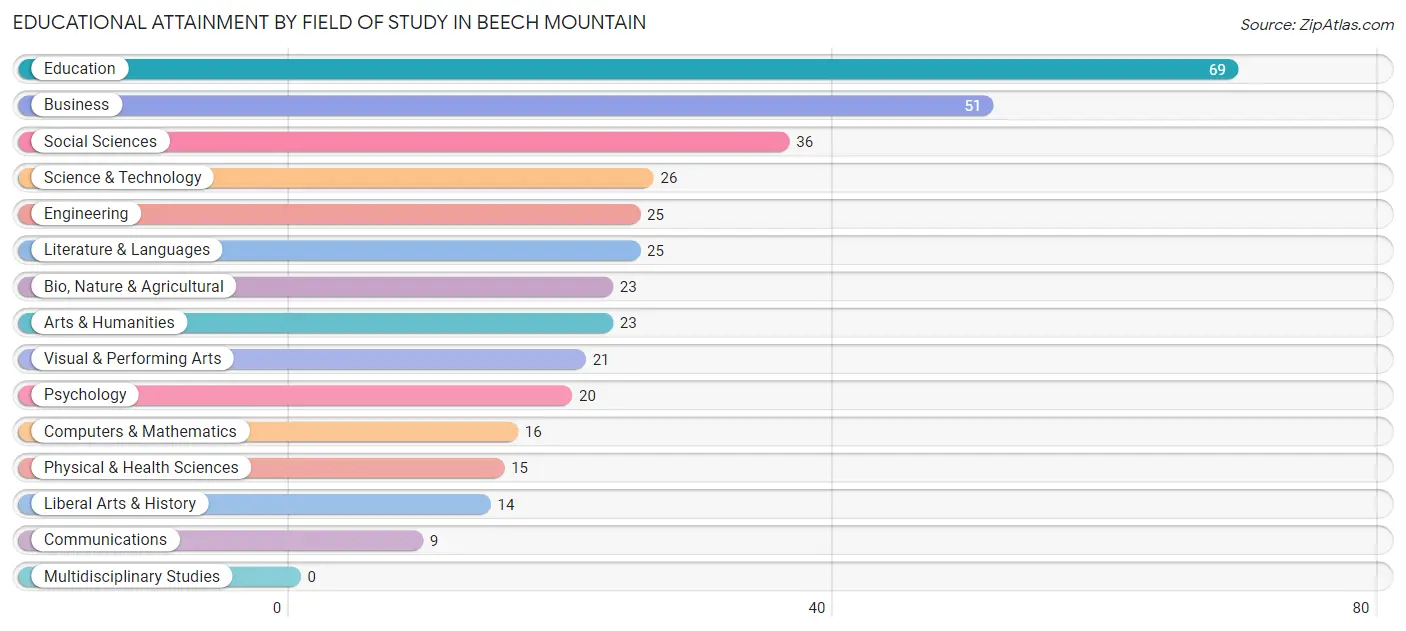
| Field of Study | # Graduates | % Graduates |
| Computers & Mathematics | 16 | 4.3% |
| Bio, Nature & Agricultural | 23 | 6.2% |
| Physical & Health Sciences | 15 | 4.0% |
| Psychology | 20 | 5.4% |
| Social Sciences | 36 | 9.7% |
| Engineering | 25 | 6.7% |
| Multidisciplinary Studies | 0 | 0.0% |
| Science & Technology | 26 | 7.0% |
| Business | 51 | 13.7% |
| Education | 69 | 18.5% |
| Literature & Languages | 25 | 6.7% |
| Liberal Arts & History | 14 | 3.7% |
| Visual & Performing Arts | 21 | 5.6% |
| Communications | 9 | 2.4% |
| Arts & Humanities | 23 | 6.2% |
| Total | 373 | 100.0% |
Transportation & Commute in Beech Mountain
Vehicle Availability by Sex in Beech Mountain
The most prevalent vehicle ownership categories in Beech Mountain are males with 2 vehicles (87, accounting for 55.4%) and females with 2 vehicles (53, making up 69.1%).
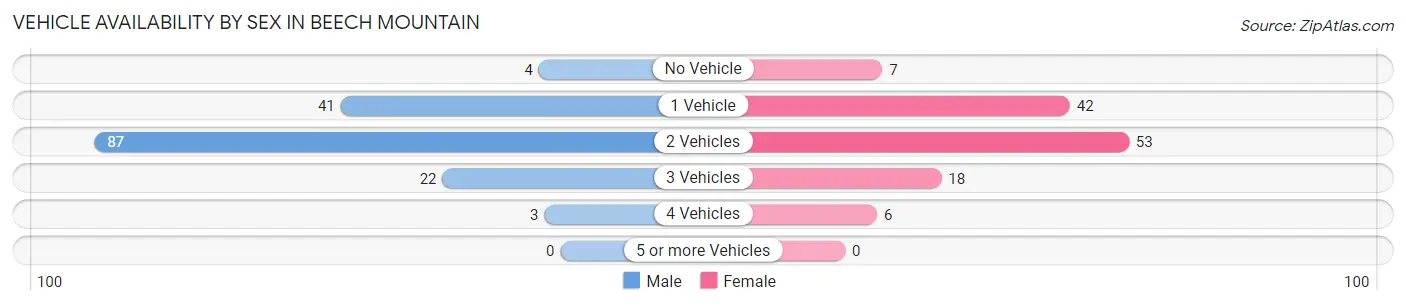
| Vehicles Available | Male | Female |
| No Vehicle | 4 (2.5%) | 7 (5.6%) |
| 1 Vehicle | 41 (26.1%) | 42 (33.3%) |
| 2 Vehicles | 87 (55.4%) | 53 (42.1%) |
| 3 Vehicles | 22 (14.0%) | 18 (14.3%) |
| 4 Vehicles | 3 (1.9%) | 6 (4.8%) |
| 5 or more Vehicles | 0 (0.0%) | 0 (0.0%) |
| Total | 157 (100.0%) | 126 (100.0%) |
Commute Time in Beech Mountain
The most frequently occuring commute durations in Beech Mountain are 30 to 34 minutes (39 commuters, 19.4%), 10 to 14 minutes (35 commuters, 17.4%), and 5 to 9 minutes (26 commuters, 12.9%).
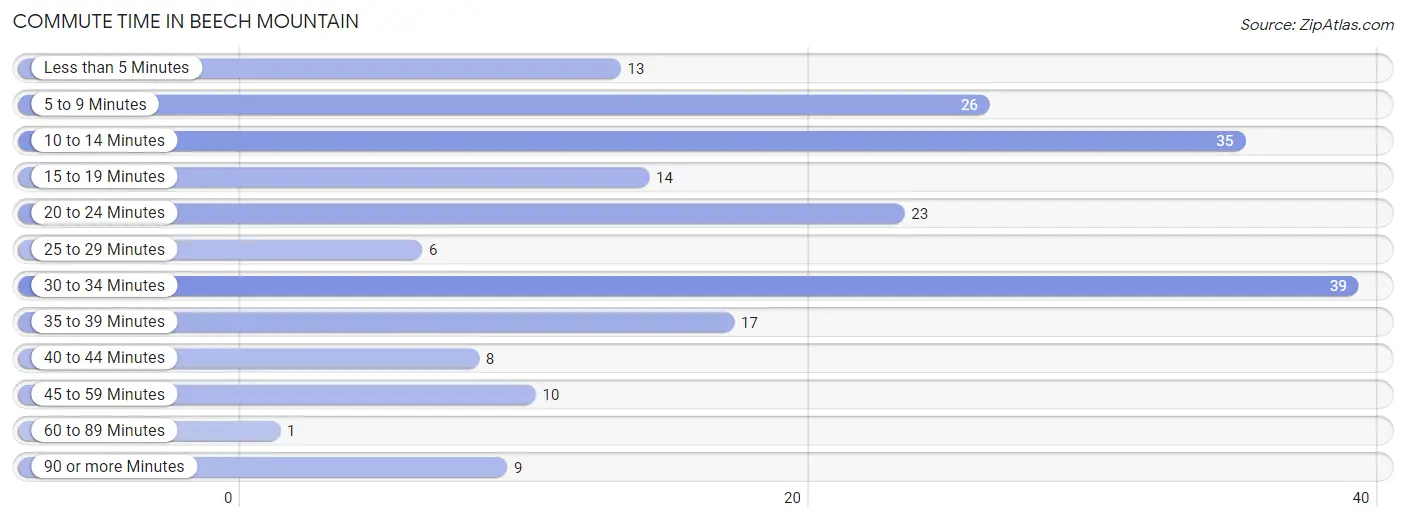
| Commute Time | # Commuters | % Commuters |
| Less than 5 Minutes | 13 | 6.5% |
| 5 to 9 Minutes | 26 | 12.9% |
| 10 to 14 Minutes | 35 | 17.4% |
| 15 to 19 Minutes | 14 | 7.0% |
| 20 to 24 Minutes | 23 | 11.4% |
| 25 to 29 Minutes | 6 | 3.0% |
| 30 to 34 Minutes | 39 | 19.4% |
| 35 to 39 Minutes | 17 | 8.5% |
| 40 to 44 Minutes | 8 | 4.0% |
| 45 to 59 Minutes | 10 | 5.0% |
| 60 to 89 Minutes | 1 | 0.5% |
| 90 or more Minutes | 9 | 4.5% |
Commute Time by Sex in Beech Mountain
The most common commute times in Beech Mountain are 30 to 34 minutes (27 commuters, 25.7%) for males and 20 to 24 minutes (18 commuters, 18.8%) for females.
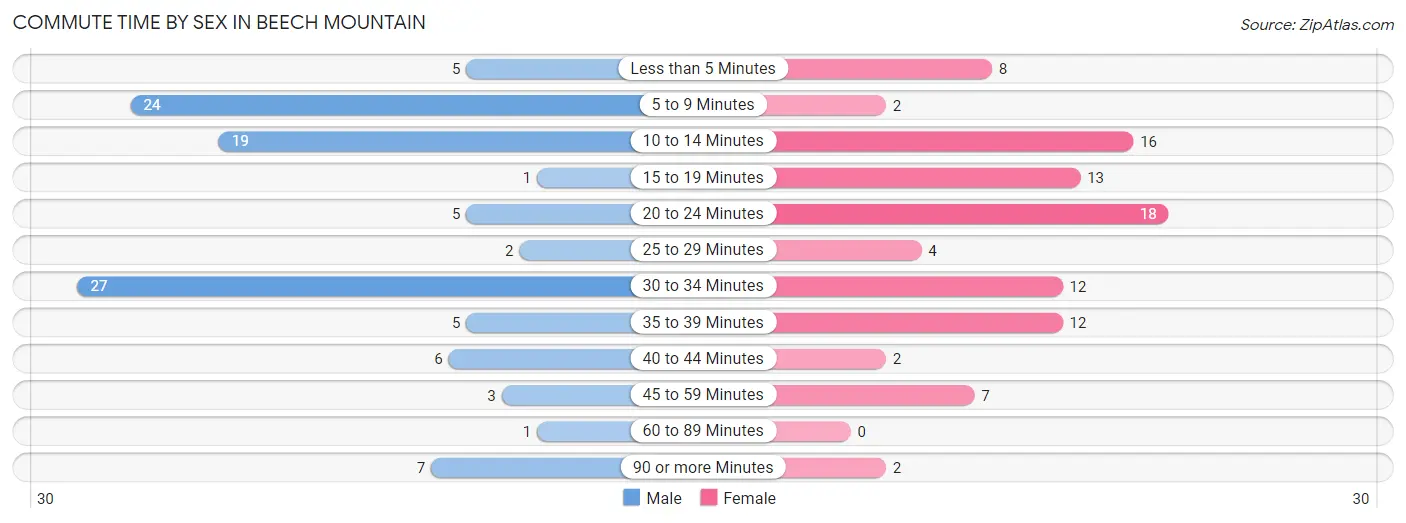
| Commute Time | Male | Female |
| Less than 5 Minutes | 5 (4.8%) | 8 (8.3%) |
| 5 to 9 Minutes | 24 (22.9%) | 2 (2.1%) |
| 10 to 14 Minutes | 19 (18.1%) | 16 (16.7%) |
| 15 to 19 Minutes | 1 (0.9%) | 13 (13.5%) |
| 20 to 24 Minutes | 5 (4.8%) | 18 (18.8%) |
| 25 to 29 Minutes | 2 (1.9%) | 4 (4.2%) |
| 30 to 34 Minutes | 27 (25.7%) | 12 (12.5%) |
| 35 to 39 Minutes | 5 (4.8%) | 12 (12.5%) |
| 40 to 44 Minutes | 6 (5.7%) | 2 (2.1%) |
| 45 to 59 Minutes | 3 (2.9%) | 7 (7.3%) |
| 60 to 89 Minutes | 1 (0.9%) | 0 (0.0%) |
| 90 or more Minutes | 7 (6.7%) | 2 (2.1%) |
Time of Departure to Work by Sex in Beech Mountain
The most frequent times of departure to work in Beech Mountain are 7:00 AM to 7:29 AM (26, 24.8%) for males and 6:30 AM to 6:59 AM (22, 22.9%) for females.
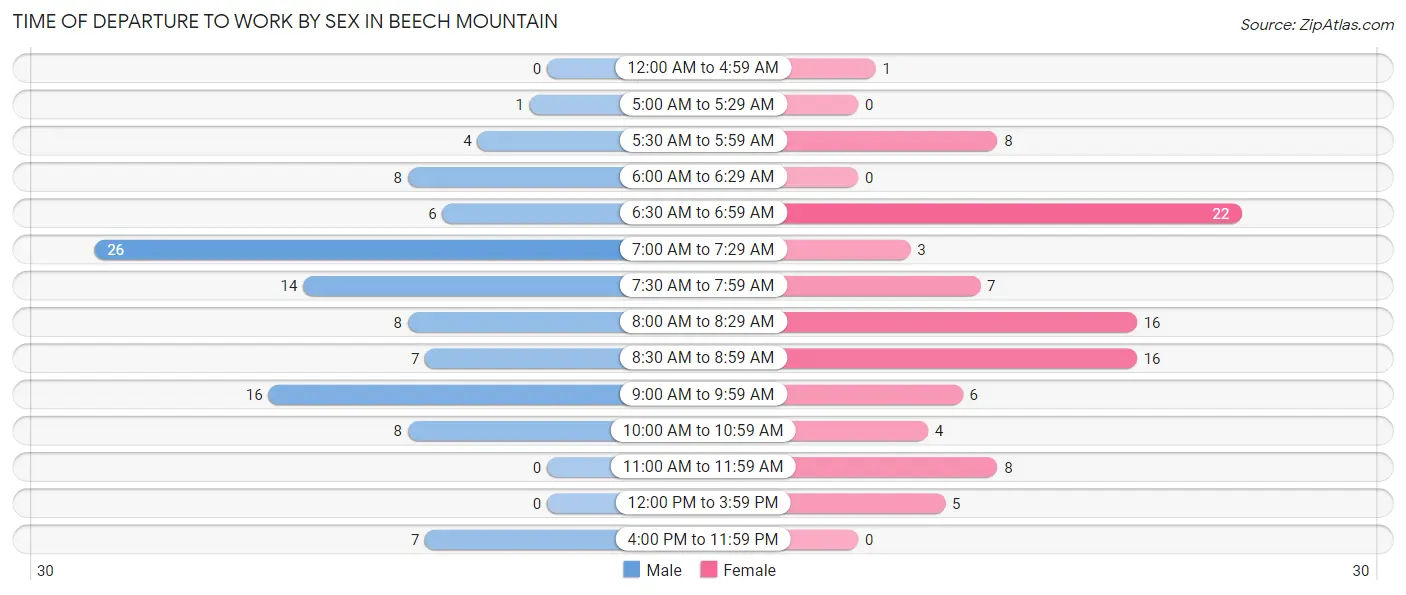
| Time of Departure | Male | Female |
| 12:00 AM to 4:59 AM | 0 (0.0%) | 1 (1.0%) |
| 5:00 AM to 5:29 AM | 1 (0.9%) | 0 (0.0%) |
| 5:30 AM to 5:59 AM | 4 (3.8%) | 8 (8.3%) |
| 6:00 AM to 6:29 AM | 8 (7.6%) | 0 (0.0%) |
| 6:30 AM to 6:59 AM | 6 (5.7%) | 22 (22.9%) |
| 7:00 AM to 7:29 AM | 26 (24.8%) | 3 (3.1%) |
| 7:30 AM to 7:59 AM | 14 (13.3%) | 7 (7.3%) |
| 8:00 AM to 8:29 AM | 8 (7.6%) | 16 (16.7%) |
| 8:30 AM to 8:59 AM | 7 (6.7%) | 16 (16.7%) |
| 9:00 AM to 9:59 AM | 16 (15.2%) | 6 (6.2%) |
| 10:00 AM to 10:59 AM | 8 (7.6%) | 4 (4.2%) |
| 11:00 AM to 11:59 AM | 0 (0.0%) | 8 (8.3%) |
| 12:00 PM to 3:59 PM | 0 (0.0%) | 5 (5.2%) |
| 4:00 PM to 11:59 PM | 7 (6.7%) | 0 (0.0%) |
| Total | 105 (100.0%) | 96 (100.0%) |
Housing Occupancy in Beech Mountain
Occupancy by Ownership in Beech Mountain
Of the total 375 dwellings in Beech Mountain, owner-occupied units account for 331 (88.3%), while renter-occupied units make up 44 (11.7%).
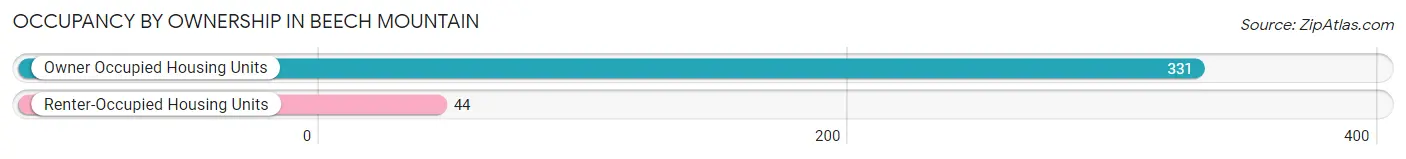
| Occupancy | # Housing Units | % Housing Units |
| Owner Occupied Housing Units | 331 | 88.3% |
| Renter-Occupied Housing Units | 44 | 11.7% |
| Total Occupied Housing Units | 375 | 100.0% |
Occupancy by Household Size in Beech Mountain
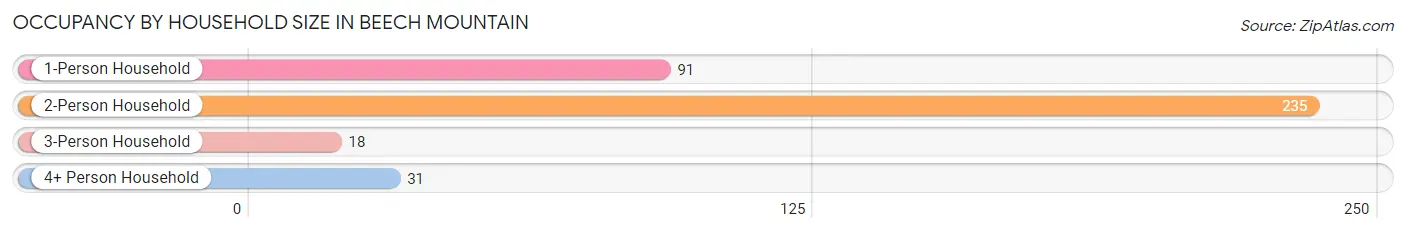
| Household Size | # Housing Units | % Housing Units |
| 1-Person Household | 91 | 24.3% |
| 2-Person Household | 235 | 62.7% |
| 3-Person Household | 18 | 4.8% |
| 4+ Person Household | 31 | 8.3% |
| Total Housing Units | 375 | 100.0% |
Occupancy by Ownership by Household Size in Beech Mountain
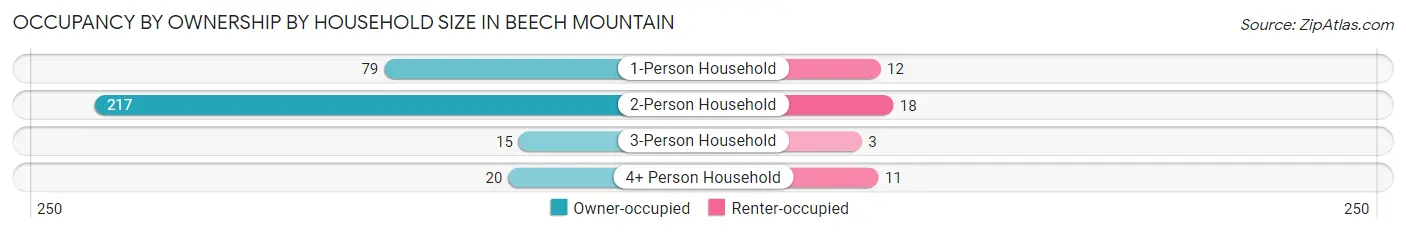
| Household Size | Owner-occupied | Renter-occupied |
| 1-Person Household | 79 (86.8%) | 12 (13.2%) |
| 2-Person Household | 217 (92.3%) | 18 (7.7%) |
| 3-Person Household | 15 (83.3%) | 3 (16.7%) |
| 4+ Person Household | 20 (64.5%) | 11 (35.5%) |
| Total Housing Units | 331 (88.3%) | 44 (11.7%) |
Occupancy by Educational Attainment in Beech Mountain
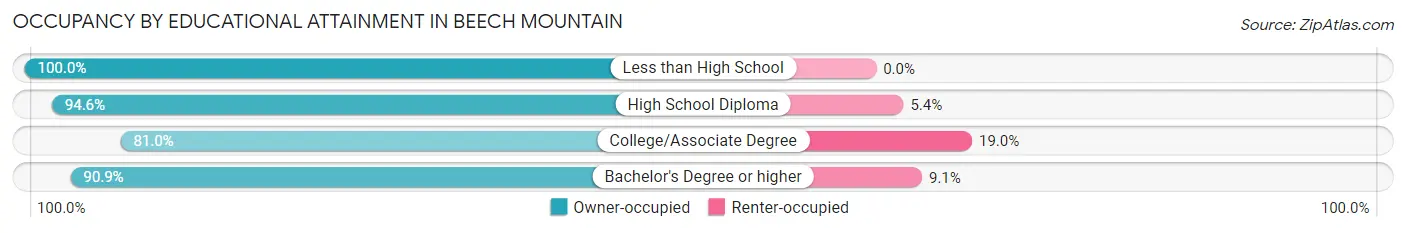
| Household Size | Owner-occupied | Renter-occupied |
| Less than High School | 8 (100.0%) | 0 (0.0%) |
| High School Diploma | 35 (94.6%) | 2 (5.4%) |
| College/Associate Degree | 98 (81.0%) | 23 (19.0%) |
| Bachelor's Degree or higher | 190 (90.9%) | 19 (9.1%) |
Occupancy by Age of Householder in Beech Mountain
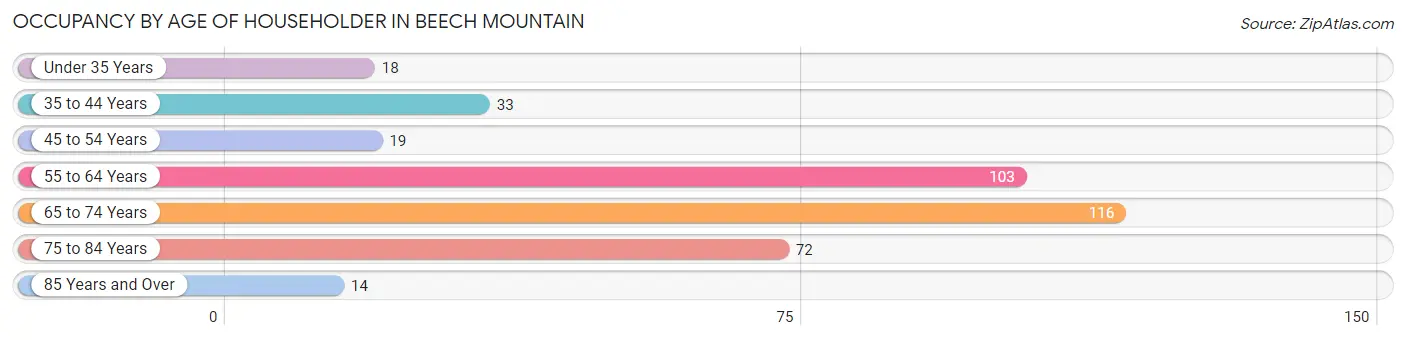
| Age Bracket | # Households | % Households |
| Under 35 Years | 18 | 4.8% |
| 35 to 44 Years | 33 | 8.8% |
| 45 to 54 Years | 19 | 5.1% |
| 55 to 64 Years | 103 | 27.5% |
| 65 to 74 Years | 116 | 30.9% |
| 75 to 84 Years | 72 | 19.2% |
| 85 Years and Over | 14 | 3.7% |
| Total | 375 | 100.0% |
Housing Finances in Beech Mountain
Median Income by Occupancy in Beech Mountain
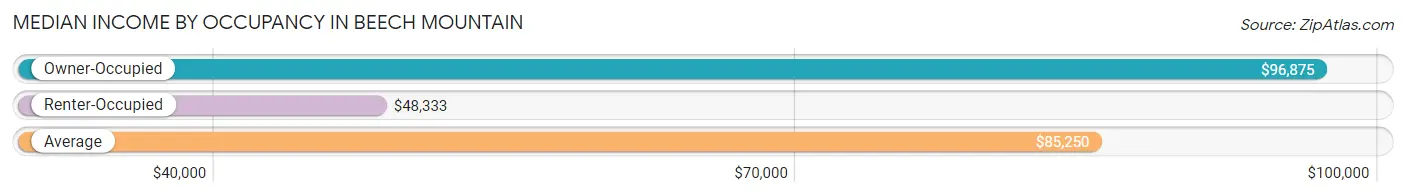
| Occupancy Type | # Households | Median Income |
| Owner-Occupied | 331 (88.3%) | $96,875 |
| Renter-Occupied | 44 (11.7%) | $48,333 |
| Average | 375 (100.0%) | $85,250 |
Occupancy by Householder Income Bracket in Beech Mountain
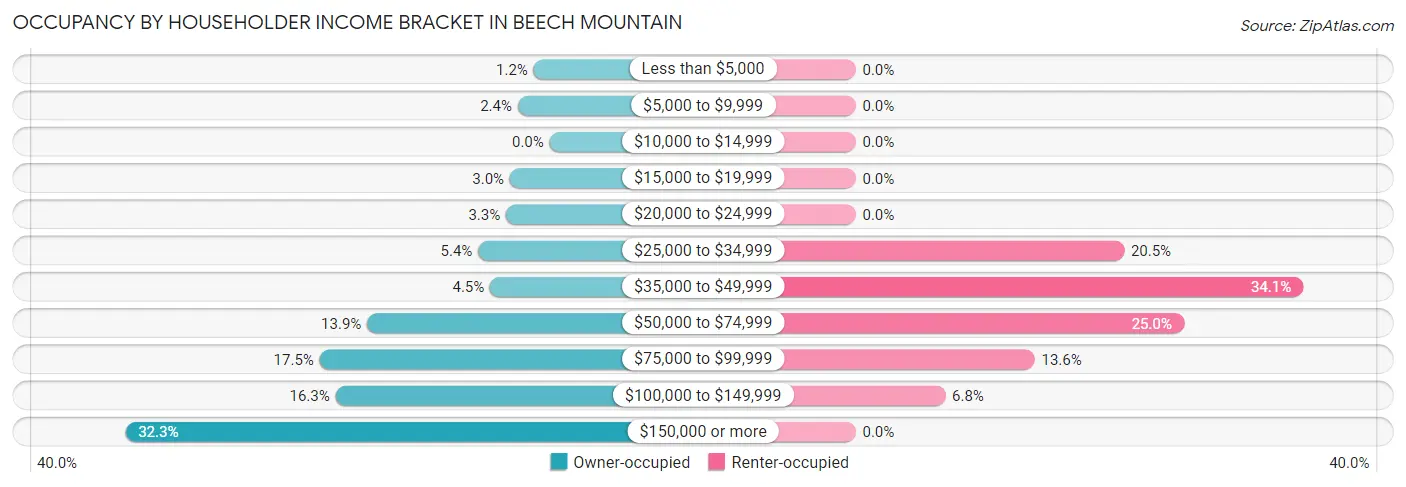
| Income Bracket | Owner-occupied | Renter-occupied |
| Less than $5,000 | 4 (1.2%) | 0 (0.0%) |
| $5,000 to $9,999 | 8 (2.4%) | 0 (0.0%) |
| $10,000 to $14,999 | 0 (0.0%) | 0 (0.0%) |
| $15,000 to $19,999 | 10 (3.0%) | 0 (0.0%) |
| $20,000 to $24,999 | 11 (3.3%) | 0 (0.0%) |
| $25,000 to $34,999 | 18 (5.4%) | 9 (20.4%) |
| $35,000 to $49,999 | 15 (4.5%) | 15 (34.1%) |
| $50,000 to $74,999 | 46 (13.9%) | 11 (25.0%) |
| $75,000 to $99,999 | 58 (17.5%) | 6 (13.6%) |
| $100,000 to $149,999 | 54 (16.3%) | 3 (6.8%) |
| $150,000 or more | 107 (32.3%) | 0 (0.0%) |
| Total | 331 (100.0%) | 44 (100.0%) |
Monthly Housing Cost Tiers in Beech Mountain
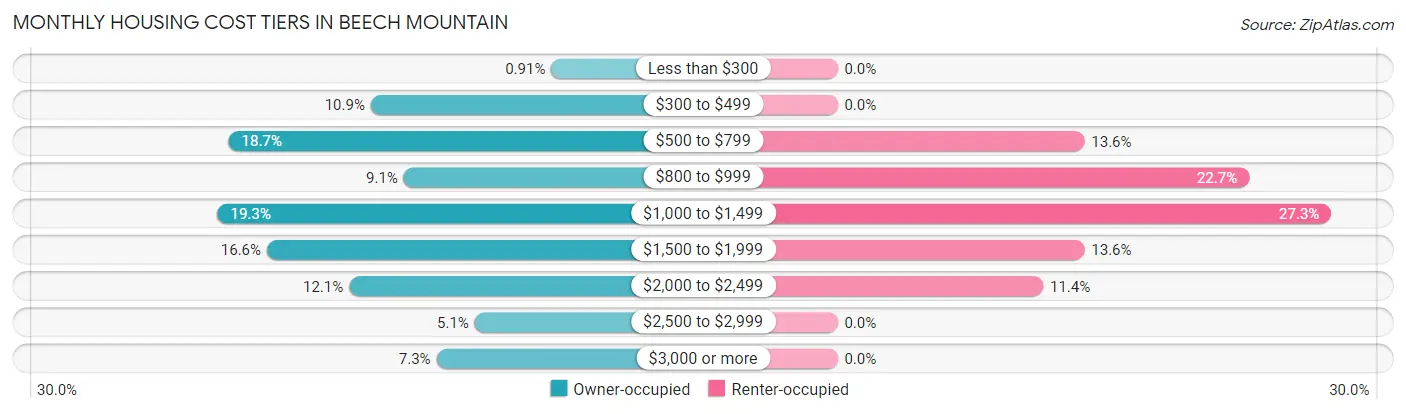
| Monthly Cost | Owner-occupied | Renter-occupied |
| Less than $300 | 3 (0.9%) | 0 (0.0%) |
| $300 to $499 | 36 (10.9%) | 0 (0.0%) |
| $500 to $799 | 62 (18.7%) | 6 (13.6%) |
| $800 to $999 | 30 (9.1%) | 10 (22.7%) |
| $1,000 to $1,499 | 64 (19.3%) | 12 (27.3%) |
| $1,500 to $1,999 | 55 (16.6%) | 6 (13.6%) |
| $2,000 to $2,499 | 40 (12.1%) | 5 (11.4%) |
| $2,500 to $2,999 | 17 (5.1%) | 0 (0.0%) |
| $3,000 or more | 24 (7.2%) | 0 (0.0%) |
| Total | 331 (100.0%) | 44 (100.0%) |
Physical Housing Characteristics in Beech Mountain
Housing Structures in Beech Mountain
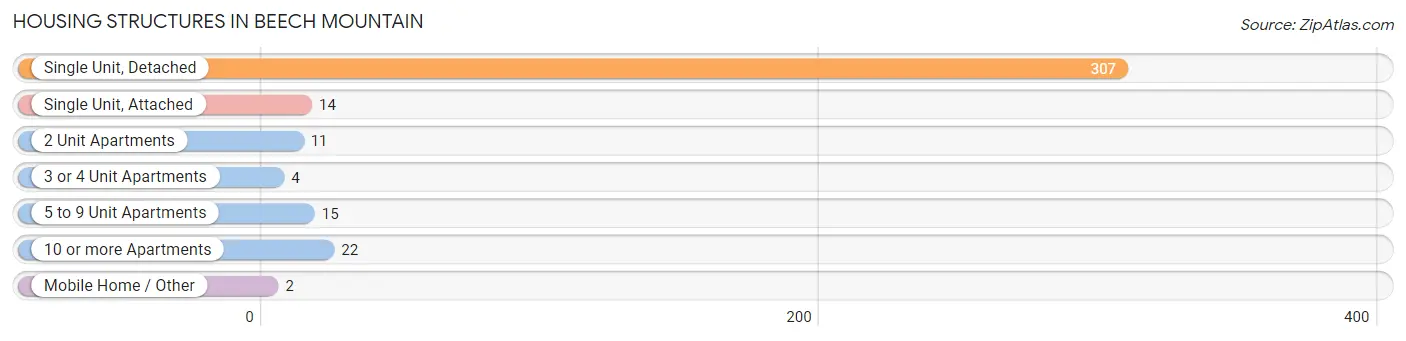
| Structure Type | # Housing Units | % Housing Units |
| Single Unit, Detached | 307 | 81.9% |
| Single Unit, Attached | 14 | 3.7% |
| 2 Unit Apartments | 11 | 2.9% |
| 3 or 4 Unit Apartments | 4 | 1.1% |
| 5 to 9 Unit Apartments | 15 | 4.0% |
| 10 or more Apartments | 22 | 5.9% |
| Mobile Home / Other | 2 | 0.5% |
| Total | 375 | 100.0% |
Housing Structures by Occupancy in Beech Mountain
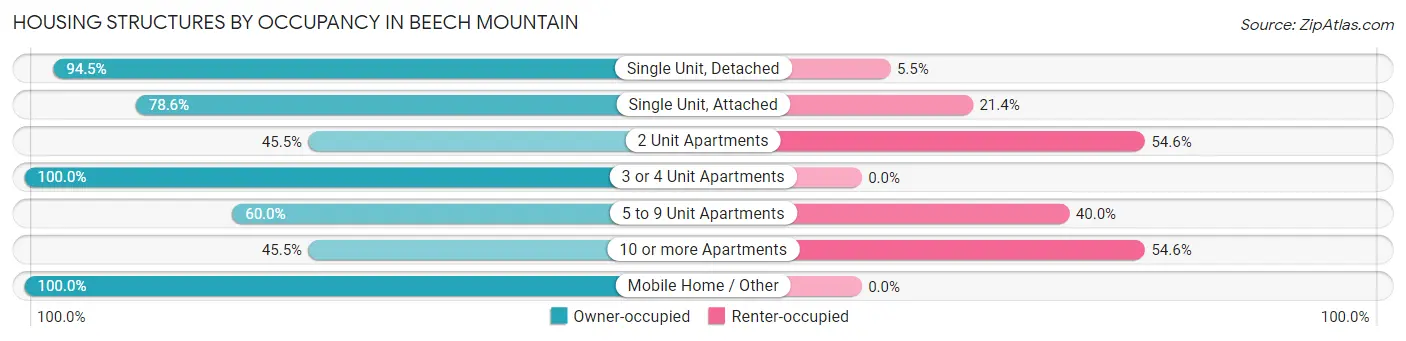
| Structure Type | Owner-occupied | Renter-occupied |
| Single Unit, Detached | 290 (94.5%) | 17 (5.5%) |
| Single Unit, Attached | 11 (78.6%) | 3 (21.4%) |
| 2 Unit Apartments | 5 (45.5%) | 6 (54.5%) |
| 3 or 4 Unit Apartments | 4 (100.0%) | 0 (0.0%) |
| 5 to 9 Unit Apartments | 9 (60.0%) | 6 (40.0%) |
| 10 or more Apartments | 10 (45.5%) | 12 (54.5%) |
| Mobile Home / Other | 2 (100.0%) | 0 (0.0%) |
| Total | 331 (88.3%) | 44 (11.7%) |
Housing Structures by Number of Rooms in Beech Mountain
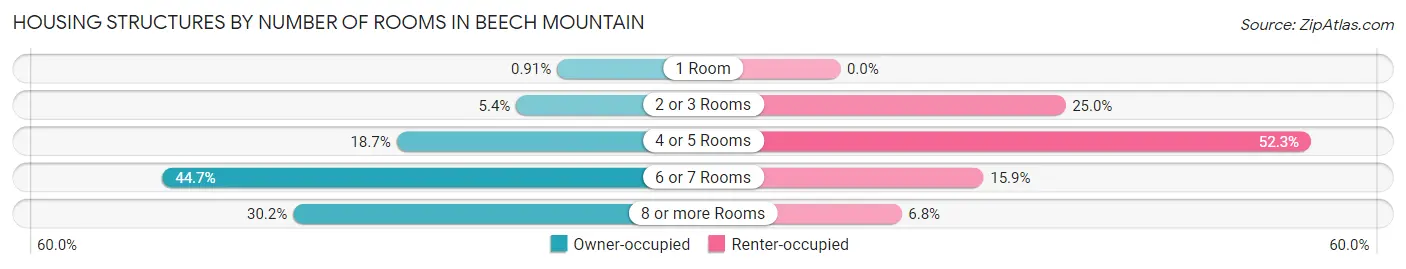
| Number of Rooms | Owner-occupied | Renter-occupied |
| 1 Room | 3 (0.9%) | 0 (0.0%) |
| 2 or 3 Rooms | 18 (5.4%) | 11 (25.0%) |
| 4 or 5 Rooms | 62 (18.7%) | 23 (52.3%) |
| 6 or 7 Rooms | 148 (44.7%) | 7 (15.9%) |
| 8 or more Rooms | 100 (30.2%) | 3 (6.8%) |
| Total | 331 (100.0%) | 44 (100.0%) |
Housing Structure by Heating Type in Beech Mountain
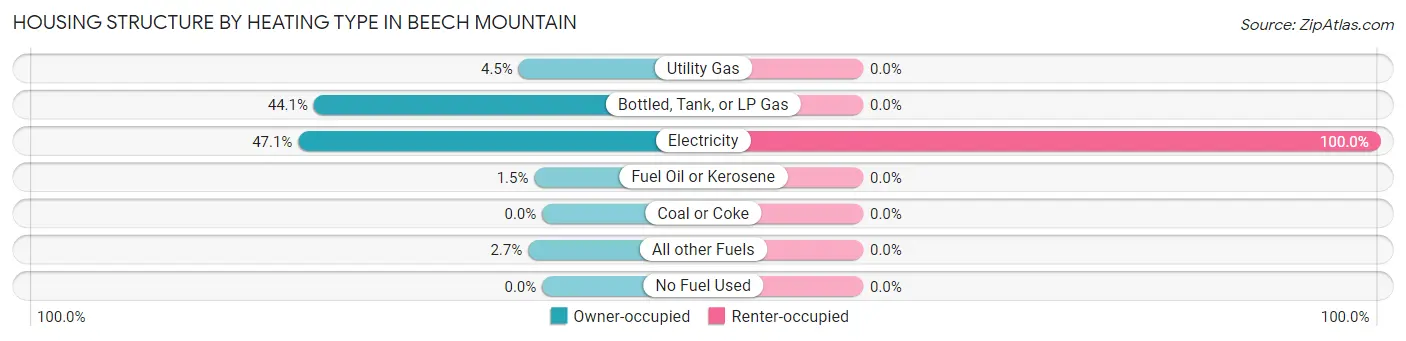
| Heating Type | Owner-occupied | Renter-occupied |
| Utility Gas | 15 (4.5%) | 0 (0.0%) |
| Bottled, Tank, or LP Gas | 146 (44.1%) | 0 (0.0%) |
| Electricity | 156 (47.1%) | 44 (100.0%) |
| Fuel Oil or Kerosene | 5 (1.5%) | 0 (0.0%) |
| Coal or Coke | 0 (0.0%) | 0 (0.0%) |
| All other Fuels | 9 (2.7%) | 0 (0.0%) |
| No Fuel Used | 0 (0.0%) | 0 (0.0%) |
| Total | 331 (100.0%) | 44 (100.0%) |
Household Vehicle Usage in Beech Mountain
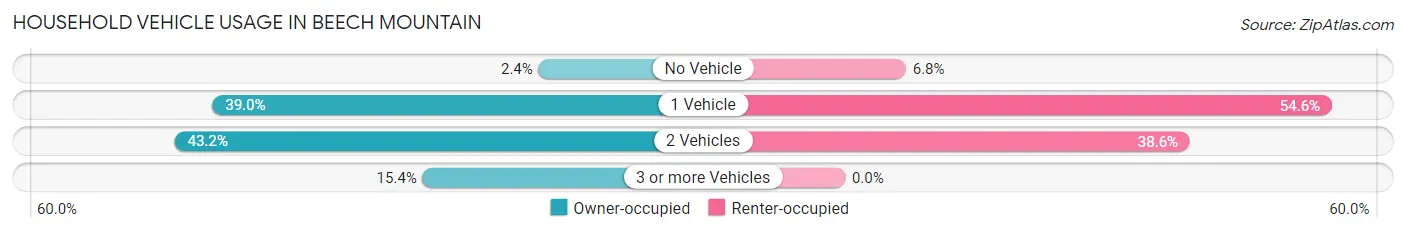
| Vehicles per Household | Owner-occupied | Renter-occupied |
| No Vehicle | 8 (2.4%) | 3 (6.8%) |
| 1 Vehicle | 129 (39.0%) | 24 (54.5%) |
| 2 Vehicles | 143 (43.2%) | 17 (38.6%) |
| 3 or more Vehicles | 51 (15.4%) | 0 (0.0%) |
| Total | 331 (100.0%) | 44 (100.0%) |
Real Estate & Mortgages in Beech Mountain
Real Estate and Mortgage Overview in Beech Mountain
| Characteristic | Without Mortgage | With Mortgage |
| Housing Units | 136 | 195 |
| Median Property Value | $382,900 | $311,200 |
| Median Household Income | $106,500 | $58 |
| Monthly Housing Costs | $605 | $24 |
| Real Estate Taxes | $2,588 | $1 |
Property Value by Mortgage Status in Beech Mountain
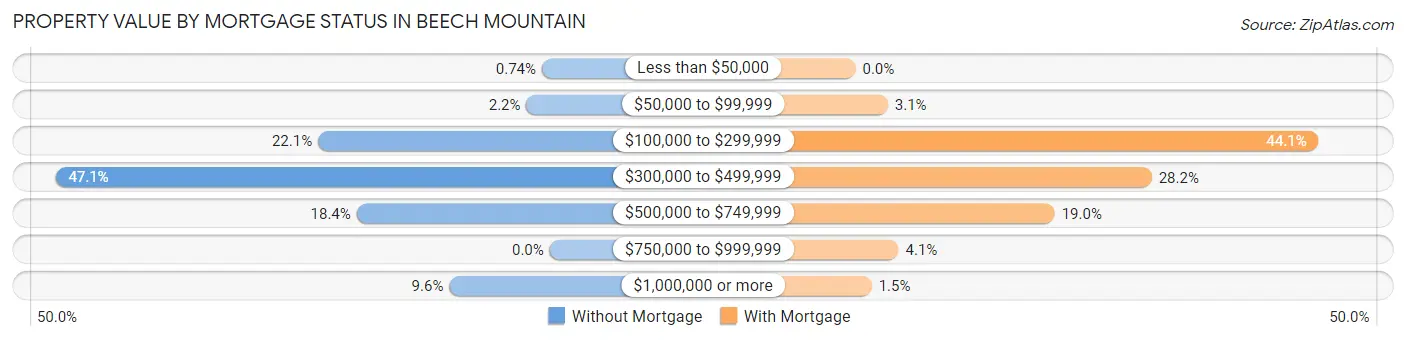
| Property Value | Without Mortgage | With Mortgage |
| Less than $50,000 | 1 (0.7%) | 0 (0.0%) |
| $50,000 to $99,999 | 3 (2.2%) | 6 (3.1%) |
| $100,000 to $299,999 | 30 (22.1%) | 86 (44.1%) |
| $300,000 to $499,999 | 64 (47.1%) | 55 (28.2%) |
| $500,000 to $749,999 | 25 (18.4%) | 37 (19.0%) |
| $750,000 to $999,999 | 0 (0.0%) | 8 (4.1%) |
| $1,000,000 or more | 13 (9.6%) | 3 (1.5%) |
| Total | 136 (100.0%) | 195 (100.0%) |
Household Income by Mortgage Status in Beech Mountain
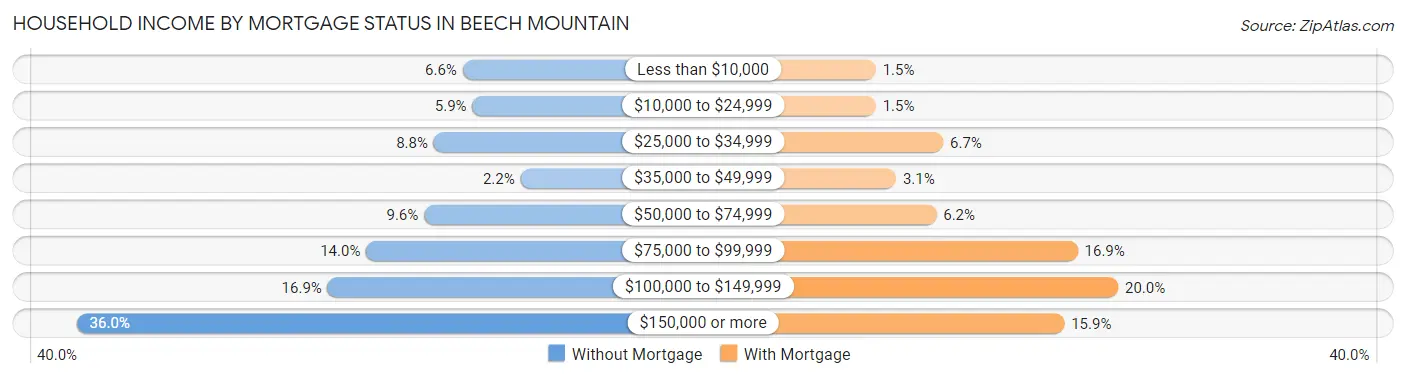
| Household Income | Without Mortgage | With Mortgage |
| Less than $10,000 | 9 (6.6%) | 3 (1.5%) |
| $10,000 to $24,999 | 8 (5.9%) | 3 (1.5%) |
| $25,000 to $34,999 | 12 (8.8%) | 13 (6.7%) |
| $35,000 to $49,999 | 3 (2.2%) | 6 (3.1%) |
| $50,000 to $74,999 | 13 (9.6%) | 12 (6.1%) |
| $75,000 to $99,999 | 19 (14.0%) | 33 (16.9%) |
| $100,000 to $149,999 | 23 (16.9%) | 39 (20.0%) |
| $150,000 or more | 49 (36.0%) | 31 (15.9%) |
| Total | 136 (100.0%) | 195 (100.0%) |
Property Value to Household Income Ratio in Beech Mountain
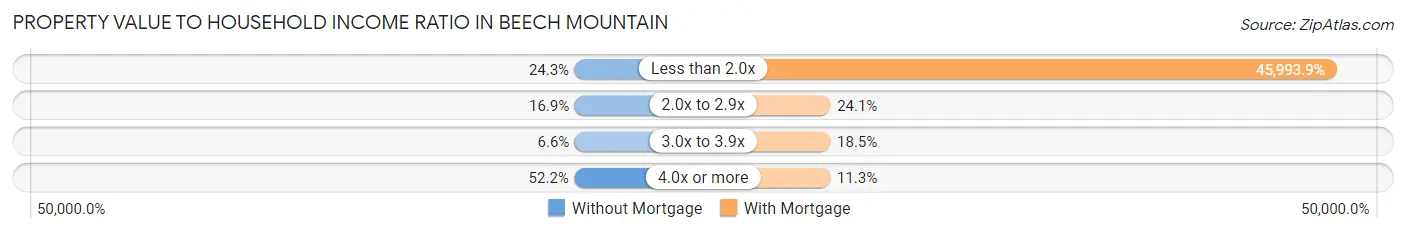
| Value-to-Income Ratio | Without Mortgage | With Mortgage |
| Less than 2.0x | 33 (24.3%) | 89,688 (45,993.8%) |
| 2.0x to 2.9x | 23 (16.9%) | 47 (24.1%) |
| 3.0x to 3.9x | 9 (6.6%) | 36 (18.5%) |
| 4.0x or more | 71 (52.2%) | 22 (11.3%) |
| Total | 136 (100.0%) | 195 (100.0%) |
Real Estate Taxes by Mortgage Status in Beech Mountain
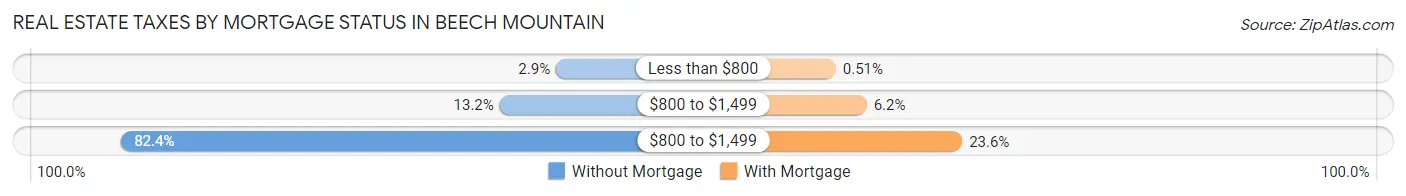
| Property Taxes | Without Mortgage | With Mortgage |
| Less than $800 | 4 (2.9%) | 1 (0.5%) |
| $800 to $1,499 | 18 (13.2%) | 12 (6.1%) |
| $800 to $1,499 | 112 (82.4%) | 46 (23.6%) |
| Total | 136 (100.0%) | 195 (100.0%) |
Health & Disability in Beech Mountain
Health Insurance Coverage by Age in Beech Mountain
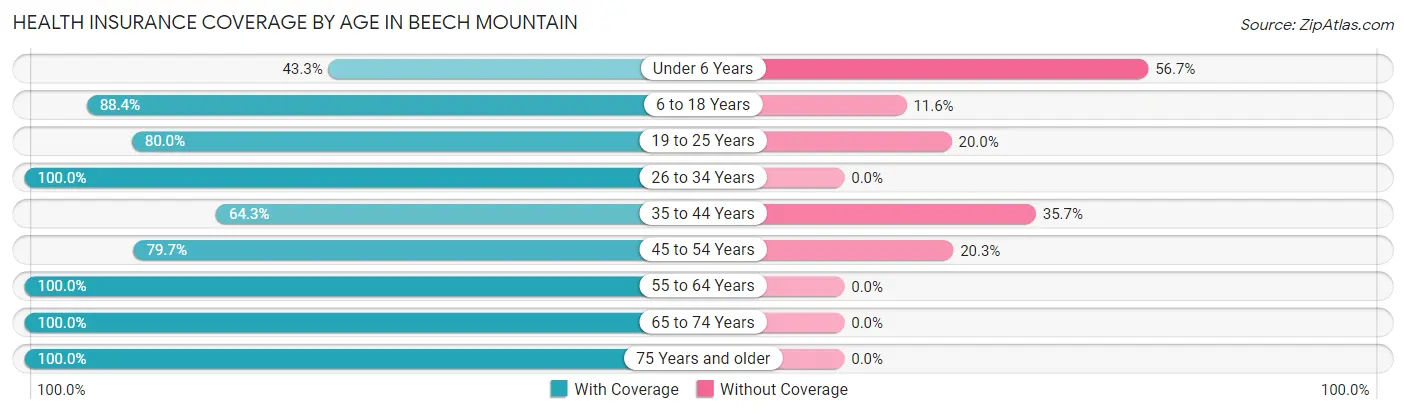
| Age Bracket | With Coverage | Without Coverage |
| Under 6 Years | 13 (43.3%) | 17 (56.7%) |
| 6 to 18 Years | 61 (88.4%) | 8 (11.6%) |
| 19 to 25 Years | 12 (80.0%) | 3 (20.0%) |
| 26 to 34 Years | 34 (100.0%) | 0 (0.0%) |
| 35 to 44 Years | 54 (64.3%) | 30 (35.7%) |
| 45 to 54 Years | 51 (79.7%) | 13 (20.3%) |
| 55 to 64 Years | 168 (100.0%) | 0 (0.0%) |
| 65 to 74 Years | 201 (100.0%) | 0 (0.0%) |
| 75 Years and older | 133 (100.0%) | 0 (0.0%) |
| Total | 727 (91.1%) | 71 (8.9%) |
Health Insurance Coverage by Citizenship Status in Beech Mountain
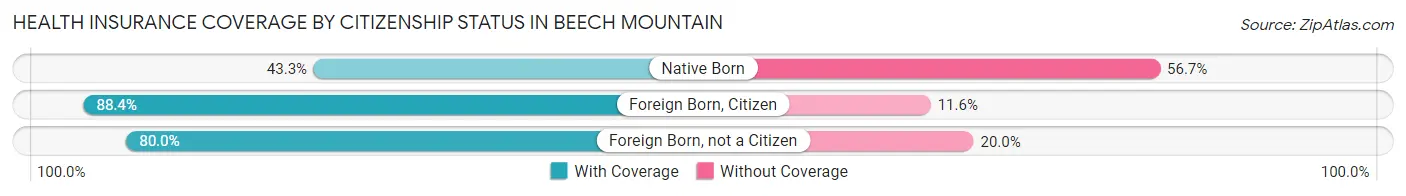
| Citizenship Status | With Coverage | Without Coverage |
| Native Born | 13 (43.3%) | 17 (56.7%) |
| Foreign Born, Citizen | 61 (88.4%) | 8 (11.6%) |
| Foreign Born, not a Citizen | 12 (80.0%) | 3 (20.0%) |
Health Insurance Coverage by Household Income in Beech Mountain
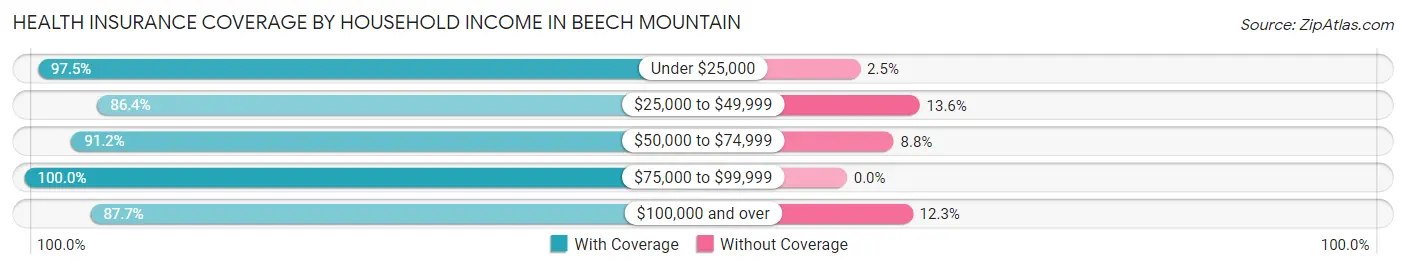
| Household Income | With Coverage | Without Coverage |
| Under $25,000 | 39 (97.5%) | 1 (2.5%) |
| $25,000 to $49,999 | 76 (86.4%) | 12 (13.6%) |
| $50,000 to $74,999 | 104 (91.2%) | 10 (8.8%) |
| $75,000 to $99,999 | 167 (100.0%) | 0 (0.0%) |
| $100,000 and over | 341 (87.7%) | 48 (12.3%) |
Public vs Private Health Insurance Coverage by Age in Beech Mountain
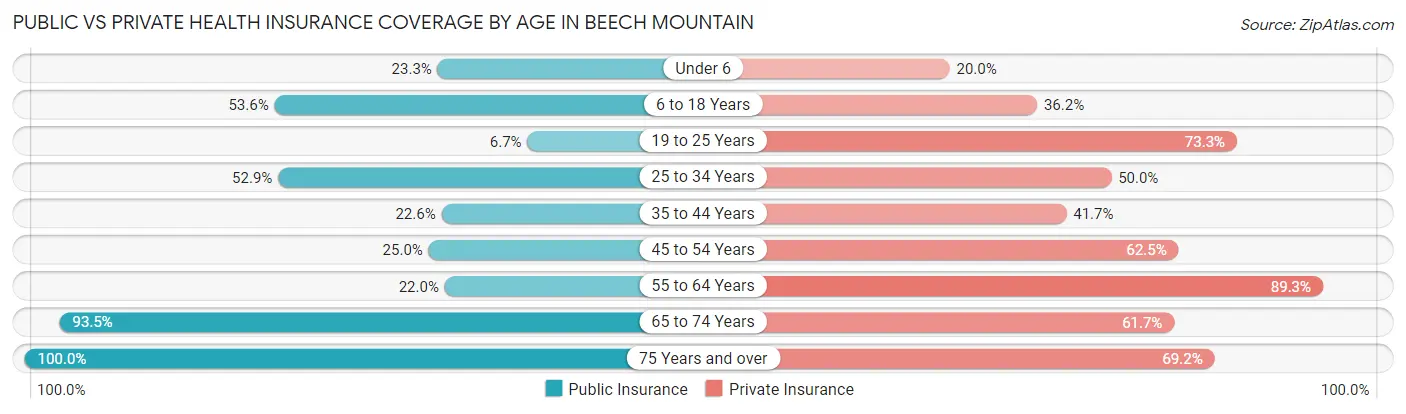
| Age Bracket | Public Insurance | Private Insurance |
| Under 6 | 7 (23.3%) | 6 (20.0%) |
| 6 to 18 Years | 37 (53.6%) | 25 (36.2%) |
| 19 to 25 Years | 1 (6.7%) | 11 (73.3%) |
| 25 to 34 Years | 18 (52.9%) | 17 (50.0%) |
| 35 to 44 Years | 19 (22.6%) | 35 (41.7%) |
| 45 to 54 Years | 16 (25.0%) | 40 (62.5%) |
| 55 to 64 Years | 37 (22.0%) | 150 (89.3%) |
| 65 to 74 Years | 188 (93.5%) | 124 (61.7%) |
| 75 Years and over | 133 (100.0%) | 92 (69.2%) |
| Total | 456 (57.1%) | 500 (62.7%) |
Disability Status by Sex by Age in Beech Mountain
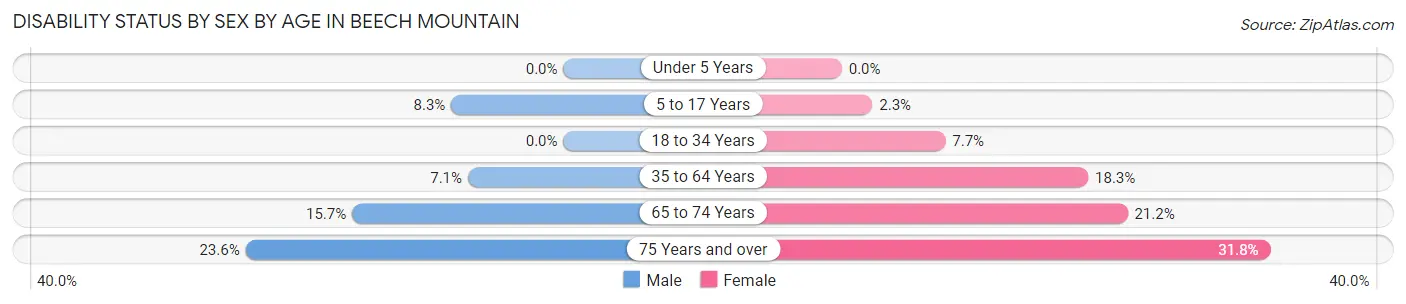
| Age Bracket | Male | Female |
| Under 5 Years | 0 (0.0%) | 0 (0.0%) |
| 5 to 17 Years | 3 (8.3%) | 1 (2.3%) |
| 18 to 34 Years | 0 (0.0%) | 1 (7.7%) |
| 35 to 64 Years | 10 (7.1%) | 32 (18.3%) |
| 65 to 74 Years | 16 (15.7%) | 21 (21.2%) |
| 75 Years and over | 21 (23.6%) | 14 (31.8%) |
Disability Class by Sex by Age in Beech Mountain
Disability Class: Hearing Difficulty
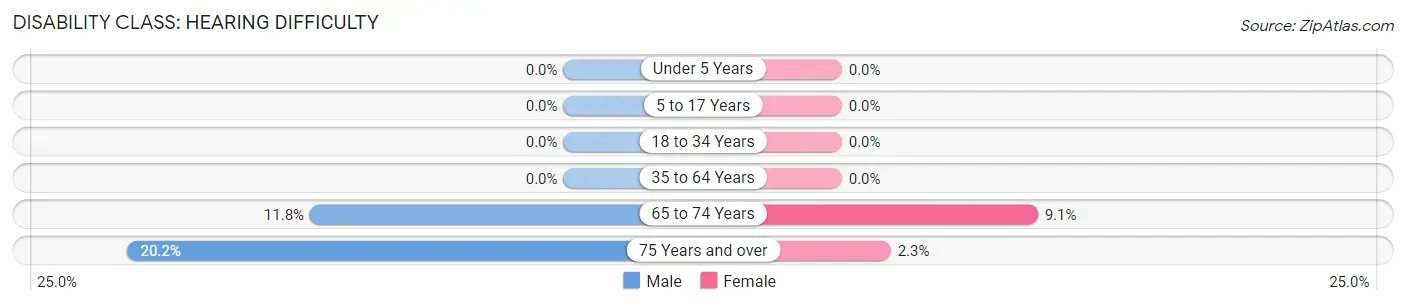
| Age Bracket | Male | Female |
| Under 5 Years | 0 (0.0%) | 0 (0.0%) |
| 5 to 17 Years | 0 (0.0%) | 0 (0.0%) |
| 18 to 34 Years | 0 (0.0%) | 0 (0.0%) |
| 35 to 64 Years | 0 (0.0%) | 0 (0.0%) |
| 65 to 74 Years | 12 (11.8%) | 9 (9.1%) |
| 75 Years and over | 18 (20.2%) | 1 (2.3%) |
Disability Class: Vision Difficulty
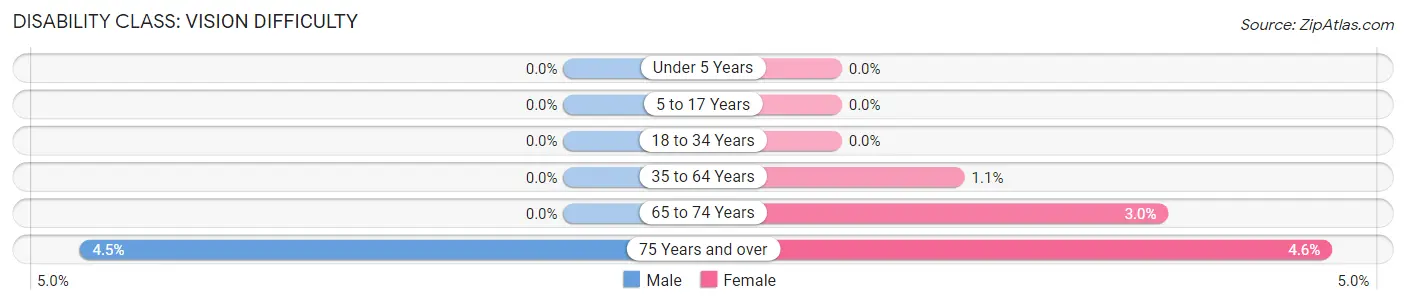
| Age Bracket | Male | Female |
| Under 5 Years | 0 (0.0%) | 0 (0.0%) |
| 5 to 17 Years | 0 (0.0%) | 0 (0.0%) |
| 18 to 34 Years | 0 (0.0%) | 0 (0.0%) |
| 35 to 64 Years | 0 (0.0%) | 2 (1.1%) |
| 65 to 74 Years | 0 (0.0%) | 3 (3.0%) |
| 75 Years and over | 4 (4.5%) | 2 (4.5%) |
Disability Class: Cognitive Difficulty
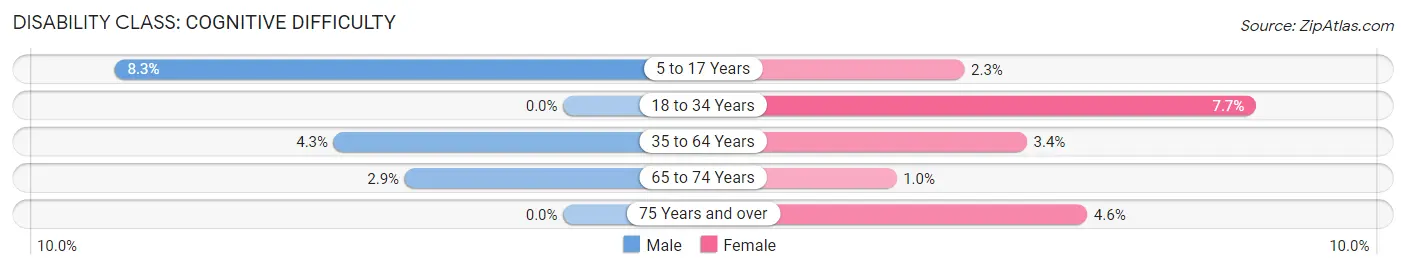
| Age Bracket | Male | Female |
| 5 to 17 Years | 3 (8.3%) | 1 (2.3%) |
| 18 to 34 Years | 0 (0.0%) | 1 (7.7%) |
| 35 to 64 Years | 6 (4.3%) | 6 (3.4%) |
| 65 to 74 Years | 3 (2.9%) | 1 (1.0%) |
| 75 Years and over | 0 (0.0%) | 2 (4.5%) |
Disability Class: Ambulatory Difficulty
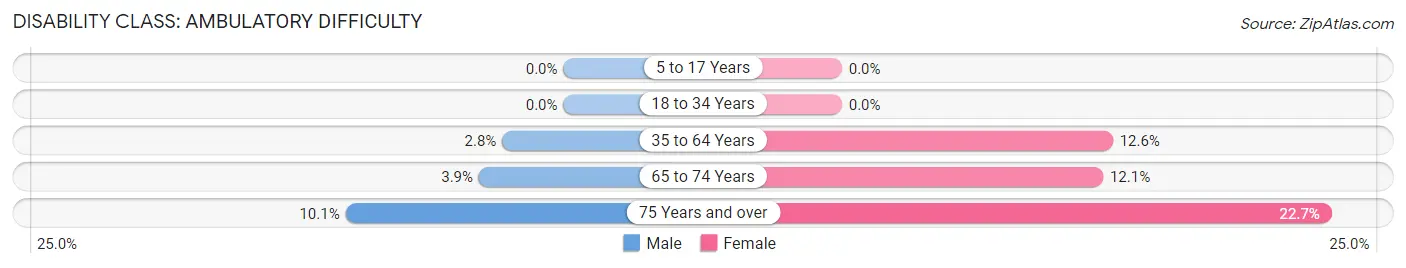
| Age Bracket | Male | Female |
| 5 to 17 Years | 0 (0.0%) | 0 (0.0%) |
| 18 to 34 Years | 0 (0.0%) | 0 (0.0%) |
| 35 to 64 Years | 4 (2.8%) | 22 (12.6%) |
| 65 to 74 Years | 4 (3.9%) | 12 (12.1%) |
| 75 Years and over | 9 (10.1%) | 10 (22.7%) |
Disability Class: Self-Care Difficulty
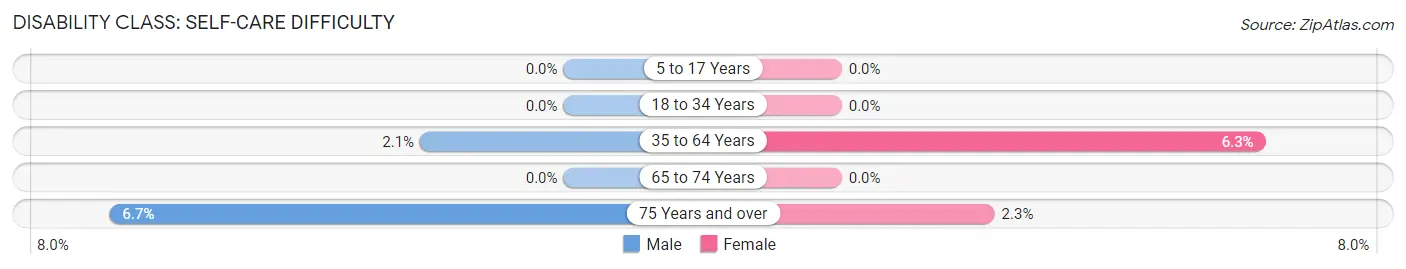
| Age Bracket | Male | Female |
| 5 to 17 Years | 0 (0.0%) | 0 (0.0%) |
| 18 to 34 Years | 0 (0.0%) | 0 (0.0%) |
| 35 to 64 Years | 3 (2.1%) | 11 (6.3%) |
| 65 to 74 Years | 0 (0.0%) | 0 (0.0%) |
| 75 Years and over | 6 (6.7%) | 1 (2.3%) |
Technology Access in Beech Mountain
Computing Device Access in Beech Mountain
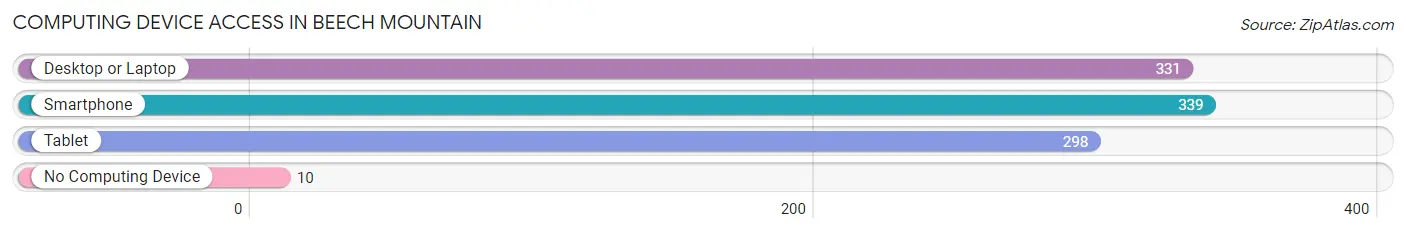
| Device Type | # Households | % Households |
| Desktop or Laptop | 331 | 88.3% |
| Smartphone | 339 | 90.4% |
| Tablet | 298 | 79.5% |
| No Computing Device | 10 | 2.7% |
| Total | 375 | 100.0% |
Internet Access in Beech Mountain
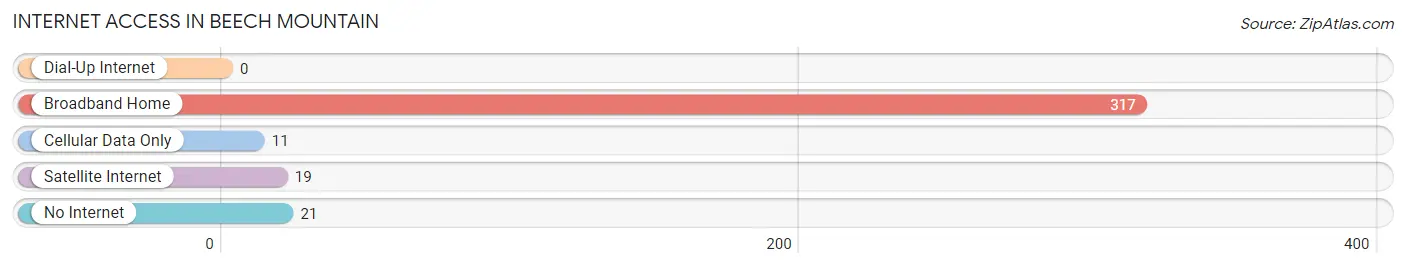
| Internet Type | # Households | % Households |
| Dial-Up Internet | 0 | 0.0% |
| Broadband Home | 317 | 84.5% |
| Cellular Data Only | 11 | 2.9% |
| Satellite Internet | 19 | 5.1% |
| No Internet | 21 | 5.6% |
| Total | 375 | 100.0% |
Beech Mountain Summary
Beech Mountain is a town located in the Blue Ridge Mountains of North Carolina. It is the highest town in the eastern United States, with an elevation of 5,506 feet. The town is located in Watauga County, and is part of the Boone, North Carolina Metropolitan Statistical Area.
History
Beech Mountain was first settled in the late 1800s by a group of settlers from the nearby town of Valle Crucis. The settlers were attracted to the area by its cool climate and beautiful views of the surrounding mountains. The town was originally named Beech Mountain after the abundance of beech trees in the area.
In the early 1900s, the town began to grow as a popular summer resort destination. The town was home to several hotels, including the Beech Mountain Inn, which was built in 1910. The inn was a popular destination for wealthy families from the nearby cities of Charlotte and Asheville.
In the 1950s, the town began to develop as a ski resort. The Beech Mountain Ski Resort opened in 1967 and has since become one of the most popular ski resorts in the Southeast.
Geography
Beech Mountain is located in the Blue Ridge Mountains of North Carolina. The town is situated at an elevation of 5,506 feet, making it the highest town in the eastern United States. The town is located in Watauga County, and is part of the Boone, North Carolina Metropolitan Statistical Area.
The town is surrounded by the Pisgah National Forest, which provides a variety of outdoor activities such as hiking, camping, and fishing. The town is also home to several ski resorts, including the Beech Mountain Ski Resort.
Economy
The economy of Beech Mountain is largely based on tourism. The town is a popular destination for skiing, hiking, and other outdoor activities. The Beech Mountain Ski Resort is the largest employer in the town, providing jobs for hundreds of people.
The town is also home to several small businesses, including restaurants, shops, and lodging. The town is also home to several art galleries, which showcase the work of local artists.
Demographics
As of the 2010 census, the population of Beech Mountain was 517. The racial makeup of the town was 95.3% White, 0.6% African American, 0.2% Native American, 0.4% Asian, 0.2% Pacific Islander, and 3.3% from other races.
The median household income in Beech Mountain was $41,250, and the median family income was $50,000. The per capita income in the town was $22,857. About 8.3% of the population was below the poverty line.
Conclusion
Beech Mountain is a small town located in the Blue Ridge Mountains of North Carolina. The town is the highest town in the eastern United States, with an elevation of 5,506 feet. The town is a popular destination for skiing, hiking, and other outdoor activities. The economy of Beech Mountain is largely based on tourism, with the Beech Mountain Ski Resort being the largest employer in the town. As of the 2010 census, the population of Beech Mountain was 517. The median household income in Beech Mountain was $41,250, and the median family income was $50,000.
Common Questions
What is Per Capita Income in Beech Mountain?
Per Capita income in Beech Mountain is $72,390.
What is the Median Family Income in Beech Mountain?
Median Family Income in Beech Mountain is $118,542.
What is the Median Household income in Beech Mountain?
Median Household Income in Beech Mountain is $85,250.
What is Income or Wage Gap in Beech Mountain?
Income or Wage Gap in Beech Mountain is 22.0%.
Women in Beech Mountain earn 78.0 cents for every dollar earned by a man.
What is Inequality or Gini Index in Beech Mountain?
Inequality or Gini Index in Beech Mountain is 0.52.
What is the Total Population of Beech Mountain?
Total Population of Beech Mountain is 798.
What is the Total Male Population of Beech Mountain?
Total Male Population of Beech Mountain is 416.
What is the Total Female Population of Beech Mountain?
Total Female Population of Beech Mountain is 382.
What is the Ratio of Males per 100 Females in Beech Mountain?
There are 108.90 Males per 100 Females in Beech Mountain.
What is the Ratio of Females per 100 Males in Beech Mountain?
There are 91.83 Females per 100 Males in Beech Mountain.
What is the Median Population Age in Beech Mountain?
Median Population Age in Beech Mountain is 61.5 Years.
What is the Average Family Size in Beech Mountain
Average Family Size in Beech Mountain is 2.5 People.
What is the Average Household Size in Beech Mountain
Average Household Size in Beech Mountain is 2.1 People.
How Large is the Labor Force in Beech Mountain?
There are 320 People in the Labor Forcein in Beech Mountain.
What is the Percentage of People in the Labor Force in Beech Mountain?
45.6% of People are in the Labor Force in Beech Mountain.
What is the Unemployment Rate in Beech Mountain?
Unemployment Rate in Beech Mountain is 9.1%.