Bethania, NC Map & Demographics
Bethania Map
Bethania Overview
$52,850
PER CAPITA INCOME
$72,500
AVG FAMILY INCOME
$80,227
AVG HOUSEHOLD INCOME
0.50
INEQUALITY / GINI INDEX
335
TOTAL POPULATION
183
MALE POPULATION
152
FEMALE POPULATION
120.39
MALES / 100 FEMALES
83.06
FEMALES / 100 MALES
58.4
MEDIAN AGE
2.7
AVG FAMILY SIZE
2.2
AVG HOUSEHOLD SIZE
134
LABOR FORCE [ PEOPLE ]
43.1%
PERCENT IN LABOR FORCE
3.7%
UNEMPLOYMENT RATE
Bethania Area Codes
Income in Bethania
Income Overview in Bethania
Per Capita Income in Bethania is $52,850, while median incomes of families and households are $72,500 and $80,227 respectively.
| Characteristic | Number | Measure |
| Per Capita Income | 335 | $52,850 |
| Median Family Income | 96 | $72,500 |
| Mean Family Income | 96 | $132,536 |
| Median Household Income | 150 | $80,227 |
| Mean Household Income | 150 | $112,023 |
| Income Deficit | 96 | $0 |
| Wage / Income Gap (%) | 335 | 0.00% |
| Wage / Income Gap ($) | 335 | 100.00¢ per $1 |
| Gini / Inequality Index | 335 | 0.50 |
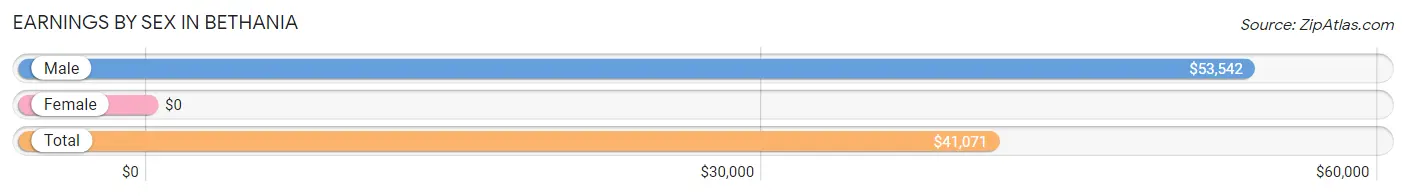
Earnings by Sex in Bethania
| Sex | Number | Average Earnings |
| Male | 91 (65.9%) | $53,542 |
| Female | 47 (34.1%) | $0 |
| Total | 138 (100.0%) | $41,071 |
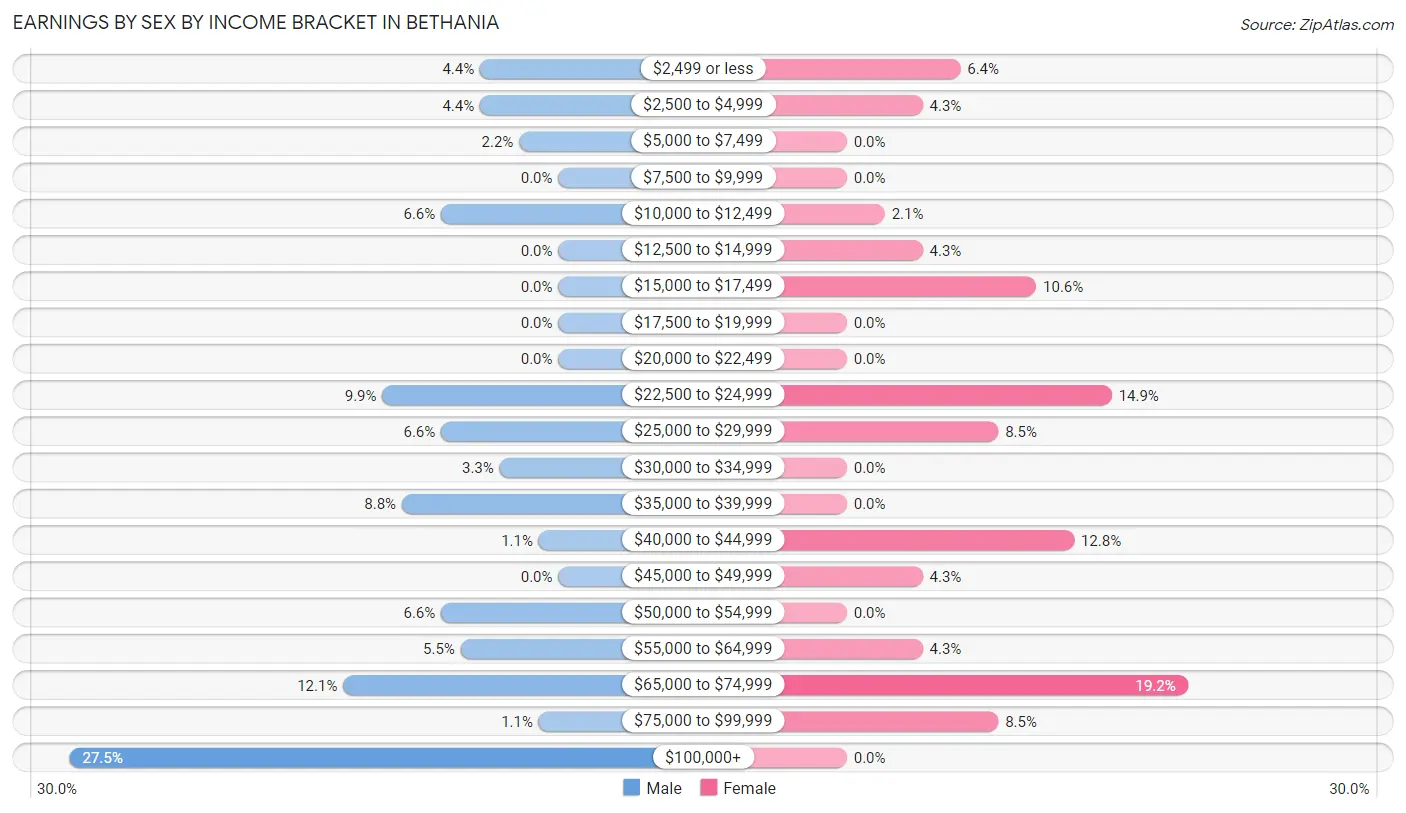
Earnings by Sex by Income Bracket in Bethania
The most common earnings brackets in Bethania are $100,000+ for men (25 | 27.5%) and $65,000 to $74,999 for women (9 | 19.2%).
| Income | Male | Female |
| $2,499 or less | 4 (4.4%) | 3 (6.4%) |
| $2,500 to $4,999 | 4 (4.4%) | 2 (4.3%) |
| $5,000 to $7,499 | 2 (2.2%) | 0 (0.0%) |
| $7,500 to $9,999 | 0 (0.0%) | 0 (0.0%) |
| $10,000 to $12,499 | 6 (6.6%) | 1 (2.1%) |
| $12,500 to $14,999 | 0 (0.0%) | 2 (4.3%) |
| $15,000 to $17,499 | 0 (0.0%) | 5 (10.6%) |
| $17,500 to $19,999 | 0 (0.0%) | 0 (0.0%) |
| $20,000 to $22,499 | 0 (0.0%) | 0 (0.0%) |
| $22,500 to $24,999 | 9 (9.9%) | 7 (14.9%) |
| $25,000 to $29,999 | 6 (6.6%) | 4 (8.5%) |
| $30,000 to $34,999 | 3 (3.3%) | 0 (0.0%) |
| $35,000 to $39,999 | 8 (8.8%) | 0 (0.0%) |
| $40,000 to $44,999 | 1 (1.1%) | 6 (12.8%) |
| $45,000 to $49,999 | 0 (0.0%) | 2 (4.3%) |
| $50,000 to $54,999 | 6 (6.6%) | 0 (0.0%) |
| $55,000 to $64,999 | 5 (5.5%) | 2 (4.3%) |
| $65,000 to $74,999 | 11 (12.1%) | 9 (19.2%) |
| $75,000 to $99,999 | 1 (1.1%) | 4 (8.5%) |
| $100,000+ | 25 (27.5%) | 0 (0.0%) |
| Total | 91 (100.0%) | 47 (100.0%) |
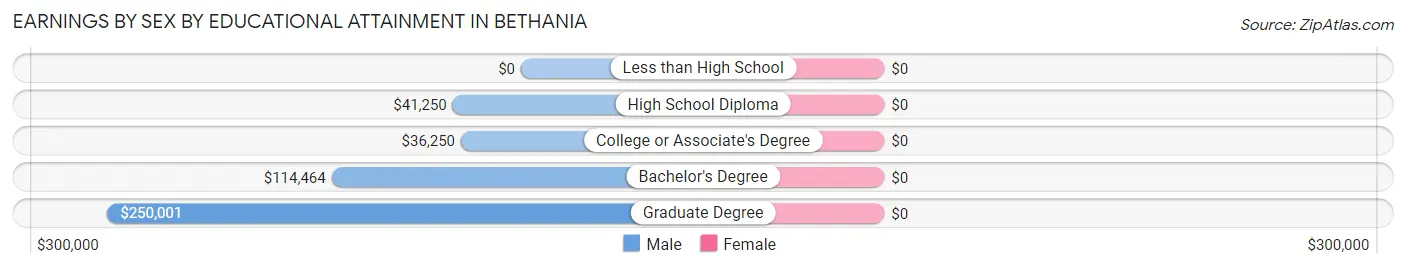
Earnings by Sex by Educational Attainment in Bethania
| Educational Attainment | Male Income | Female Income |
| Less than High School | - | - |
| High School Diploma | $41,250 | $0 |
| College or Associate's Degree | $36,250 | $0 |
| Bachelor's Degree | $114,464 | $0 |
| Graduate Degree | $250,001 | $0 |
| Total | $54,792 | $0 |
Family Income in Bethania
Family Income Brackets in Bethania
According to the Bethania family income data, there are 20 families falling into the $50,000 to $74,999 income range, which is the most common income bracket and makes up 20.8% of all families.
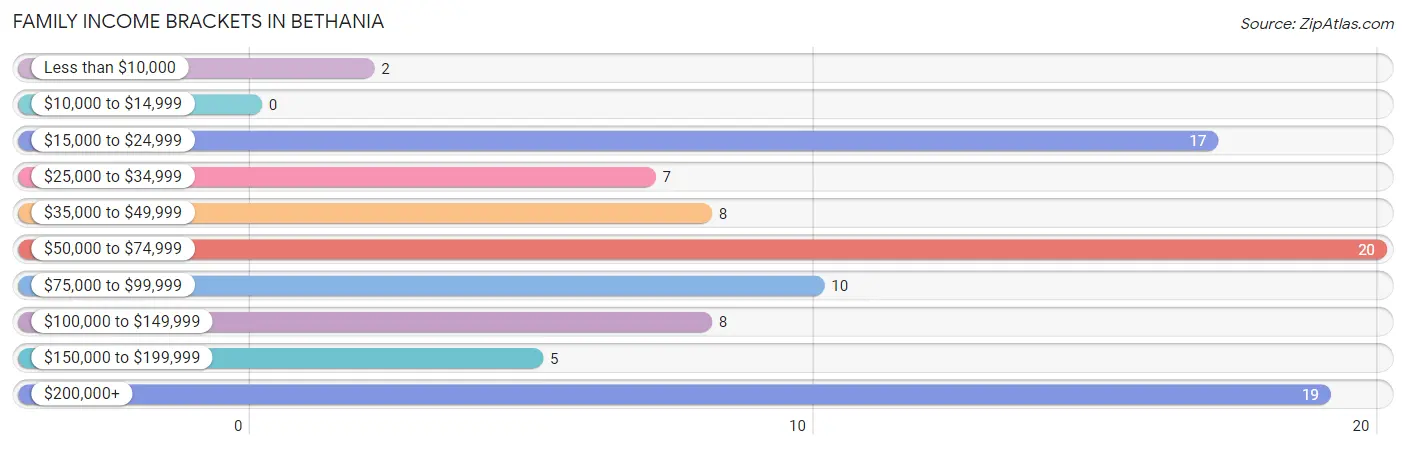
| Income Bracket | # Families | % Families |
| Less than $10,000 | 2 | 2.1% |
| $10,000 to $14,999 | 0 | 0.0% |
| $15,000 to $24,999 | 17 | 17.7% |
| $25,000 to $34,999 | 7 | 7.3% |
| $35,000 to $49,999 | 8 | 8.3% |
| $50,000 to $74,999 | 20 | 20.8% |
| $75,000 to $99,999 | 10 | 10.4% |
| $100,000 to $149,999 | 8 | 8.3% |
| $150,000 to $199,999 | 5 | 5.2% |
| $200,000+ | 19 | 19.8% |
Family Income by Famaliy Size in Bethania
2-person families (60 | 62.5%) account for the highest median family income in Bethania with $70,000 per family, while 2-person families (60 | 62.5%) have the highest median income of $35,000 per family member.
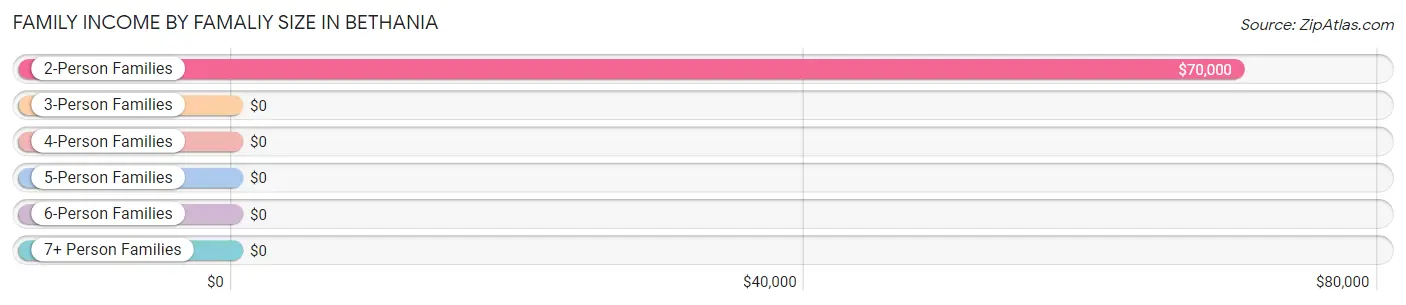
| Income Bracket | # Families | Median Income |
| 2-Person Families | 60 (62.5%) | $70,000 |
| 3-Person Families | 26 (27.1%) | $0 |
| 4-Person Families | 5 (5.2%) | $0 |
| 5-Person Families | 5 (5.2%) | $0 |
| 6-Person Families | 0 (0.0%) | $0 |
| 7+ Person Families | 0 (0.0%) | $0 |
| Total | 96 (100.0%) | $72,500 |
Family Income by Number of Earners in Bethania
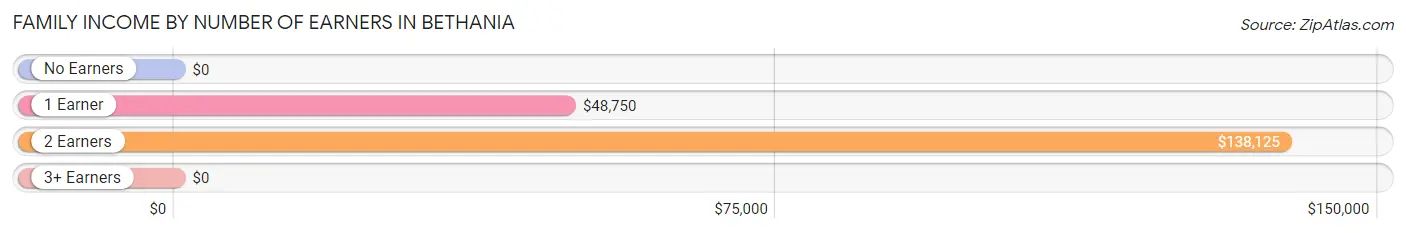
| Number of Earners | # Families | Median Income |
| No Earners | 21 (21.9%) | $0 |
| 1 Earner | 41 (42.7%) | $48,750 |
| 2 Earners | 29 (30.2%) | $138,125 |
| 3+ Earners | 5 (5.2%) | $0 |
| Total | 96 (100.0%) | $72,500 |
Household Income in Bethania
Household Income Brackets in Bethania
With 45 households falling in the category, the $75,000 to $99,999 income range is the most frequent in Bethania, accounting for 30.0% of all households. In contrast, only 4 households (2.7%) fall into the less than $10,000 income bracket, making it the least populous group.
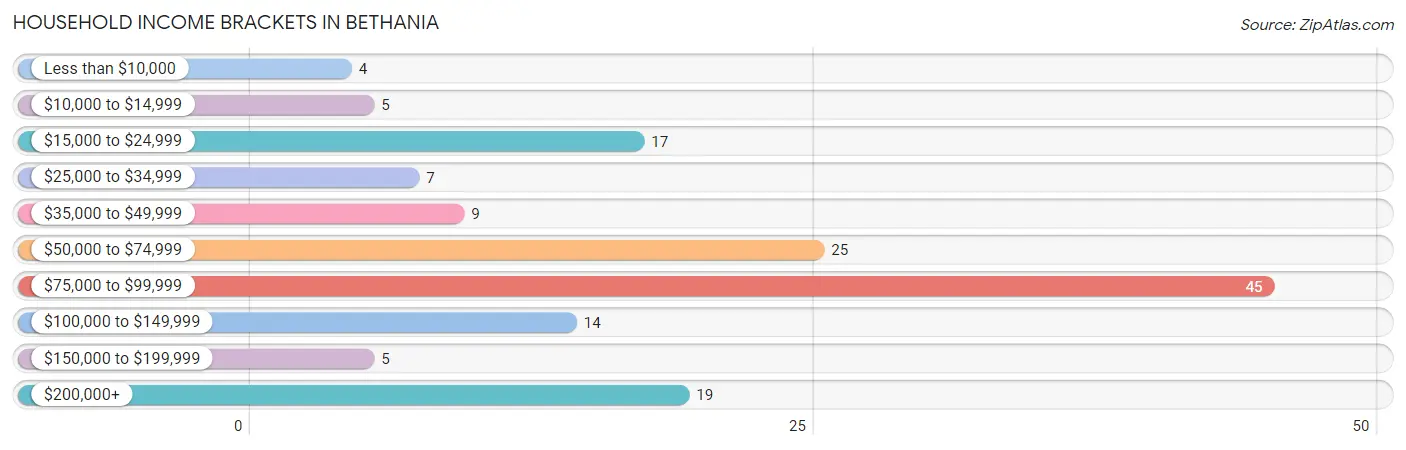
| Income Bracket | # Households | % Households |
| Less than $10,000 | 4 | 2.7% |
| $10,000 to $14,999 | 5 | 3.3% |
| $15,000 to $24,999 | 17 | 11.3% |
| $25,000 to $34,999 | 7 | 4.7% |
| $35,000 to $49,999 | 9 | 6.0% |
| $50,000 to $74,999 | 25 | 16.7% |
| $75,000 to $99,999 | 45 | 30.0% |
| $100,000 to $149,999 | 14 | 9.3% |
| $150,000 to $199,999 | 5 | 3.3% |
| $200,000+ | 19 | 12.7% |
Household Income by Householder Age in Bethania
The median household income in Bethania is $80,227, with the highest median household income of $80,909 found in the 65+ years age bracket for the primary householder. A total of 76 households (50.7%) fall into this category.
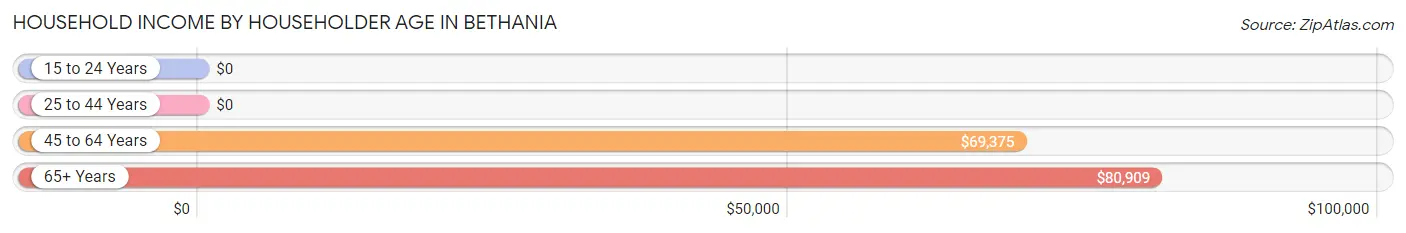
| Income Bracket | # Households | Median Income |
| 15 to 24 Years | 0 (0.0%) | $0 |
| 25 to 44 Years | 17 (11.3%) | $0 |
| 45 to 64 Years | 57 (38.0%) | $69,375 |
| 65+ Years | 76 (50.7%) | $80,909 |
| Total | 150 (100.0%) | $80,227 |
Poverty in Bethania
Income Below Poverty by Sex and Age in Bethania
With 5.5% poverty level for males and 17.8% for females among the residents of Bethania, under 5 year old males and under 5 year old females are the most vulnerable to poverty, with 2 males (100.0%) and 2 females (100.0%) in their respective age groups living below the poverty level.
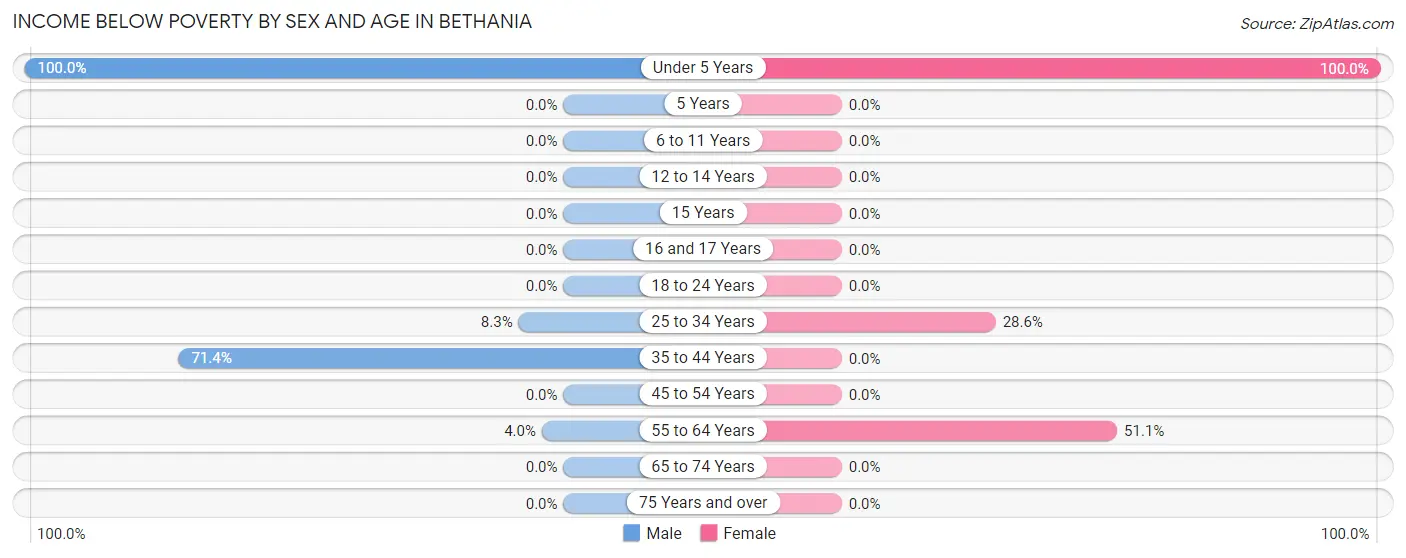
| Age Bracket | Male | Female |
| Under 5 Years | 2 (100.0%) | 2 (100.0%) |
| 5 Years | 0 (0.0%) | 0 (0.0%) |
| 6 to 11 Years | 0 (0.0%) | 0 (0.0%) |
| 12 to 14 Years | 0 (0.0%) | 0 (0.0%) |
| 15 Years | 0 (0.0%) | 0 (0.0%) |
| 16 and 17 Years | 0 (0.0%) | 0 (0.0%) |
| 18 to 24 Years | 0 (0.0%) | 0 (0.0%) |
| 25 to 34 Years | 1 (8.3%) | 2 (28.6%) |
| 35 to 44 Years | 5 (71.4%) | 0 (0.0%) |
| 45 to 54 Years | 0 (0.0%) | 0 (0.0%) |
| 55 to 64 Years | 2 (4.0%) | 23 (51.1%) |
| 65 to 74 Years | 0 (0.0%) | 0 (0.0%) |
| 75 Years and over | 0 (0.0%) | 0 (0.0%) |
| Total | 10 (5.5%) | 27 (17.8%) |
Income Above Poverty by Sex and Age in Bethania
According to the poverty statistics in Bethania, males aged 6 to 11 years and females aged 6 to 11 years are the age groups that are most secure financially, with 100.0% of males and 100.0% of females in these age groups living above the poverty line.
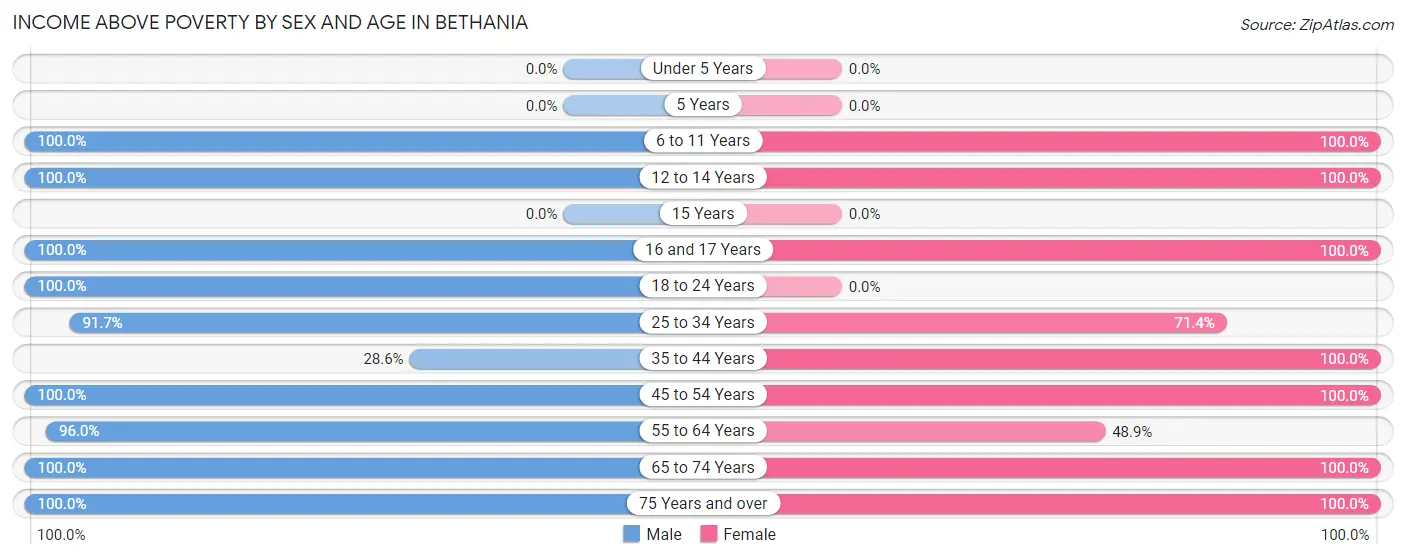
| Age Bracket | Male | Female |
| Under 5 Years | 0 (0.0%) | 0 (0.0%) |
| 5 Years | 0 (0.0%) | 0 (0.0%) |
| 6 to 11 Years | 11 (100.0%) | 2 (100.0%) |
| 12 to 14 Years | 2 (100.0%) | 5 (100.0%) |
| 15 Years | 0 (0.0%) | 0 (0.0%) |
| 16 and 17 Years | 2 (100.0%) | 4 (100.0%) |
| 18 to 24 Years | 6 (100.0%) | 0 (0.0%) |
| 25 to 34 Years | 11 (91.7%) | 5 (71.4%) |
| 35 to 44 Years | 2 (28.6%) | 10 (100.0%) |
| 45 to 54 Years | 17 (100.0%) | 39 (100.0%) |
| 55 to 64 Years | 48 (96.0%) | 22 (48.9%) |
| 65 to 74 Years | 36 (100.0%) | 24 (100.0%) |
| 75 Years and over | 38 (100.0%) | 14 (100.0%) |
| Total | 173 (94.5%) | 125 (82.2%) |
Income Below Poverty Among Married-Couple Families in Bethania
The poverty statistics for married-couple families in Bethania show that 2.6% or 2 of the total 78 families live below the poverty line. Families with 1 or 2 children have the highest poverty rate of 11.1%, comprising of 2 families. On the other hand, families with no children have the lowest poverty rate of 0.0%, which includes 0 families.
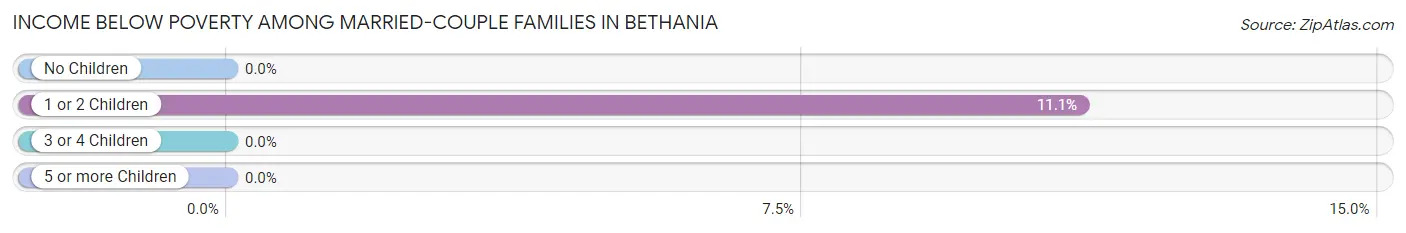
| Children | Above Poverty | Below Poverty |
| No Children | 60 (100.0%) | 0 (0.0%) |
| 1 or 2 Children | 16 (88.9%) | 2 (11.1%) |
| 3 or 4 Children | 0 (0.0%) | 0 (0.0%) |
| 5 or more Children | 0 (0.0%) | 0 (0.0%) |
| Total | 76 (97.4%) | 2 (2.6%) |
Income Below Poverty Among Single-Parent Households in Bethania
| Children | Single Father | Single Mother |
| No Children | 0 (0.0%) | 0 (0.0%) |
| 1 or 2 Children | 0 (0.0%) | 0 (0.0%) |
| 3 or 4 Children | 0 (0.0%) | 0 (0.0%) |
| 5 or more Children | 0 (0.0%) | 0 (0.0%) |
| Total | 0 (0.0%) | 0 (0.0%) |
Income Below Poverty Among Married-Couple vs Single-Parent Households in Bethania
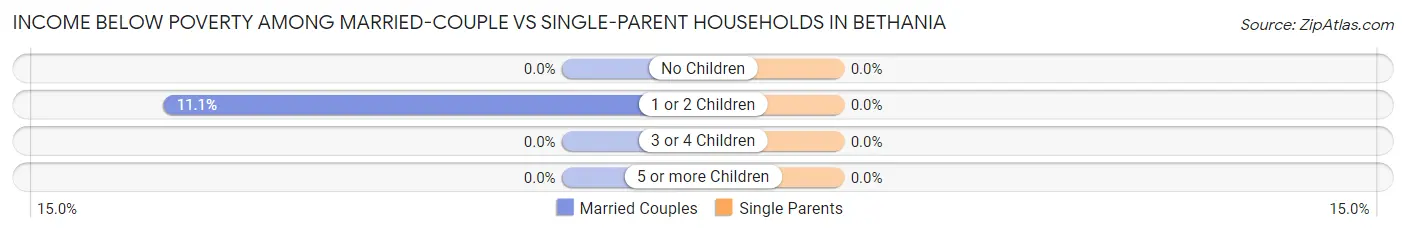
| Children | Married-Couple Families | Single-Parent Households |
| No Children | 0 (0.0%) | 0 (0.0%) |
| 1 or 2 Children | 2 (11.1%) | 0 (0.0%) |
| 3 or 4 Children | 0 (0.0%) | 0 (0.0%) |
| 5 or more Children | 0 (0.0%) | 0 (0.0%) |
| Total | 2 (2.6%) | 0 (0.0%) |
Race in Bethania
The most populous races in Bethania are White / Caucasian (217 | 64.8%), Black / African American (67 | 20.0%), and Hispanic or Latino (31 | 9.2%).
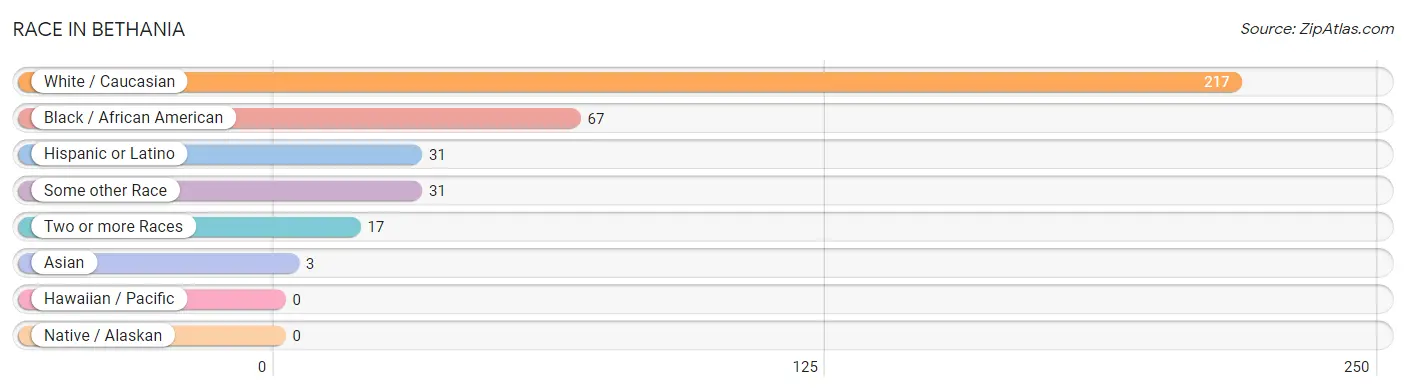
| Race | # Population | % Population |
| Asian | 3 | 0.9% |
| Black / African American | 67 | 20.0% |
| Hawaiian / Pacific | 0 | 0.0% |
| Hispanic or Latino | 31 | 9.2% |
| Native / Alaskan | 0 | 0.0% |
| White / Caucasian | 217 | 64.8% |
| Two or more Races | 17 | 5.1% |
| Some other Race | 31 | 9.2% |
| Total | 335 | 100.0% |
Ancestry in Bethania
The most populous ancestries reported in Bethania are English (80 | 23.9%), German (46 | 13.7%), Mexican (25 | 7.5%), Irish (17 | 5.1%), and American (14 | 4.2%), together accounting for 54.3% of all Bethania residents.
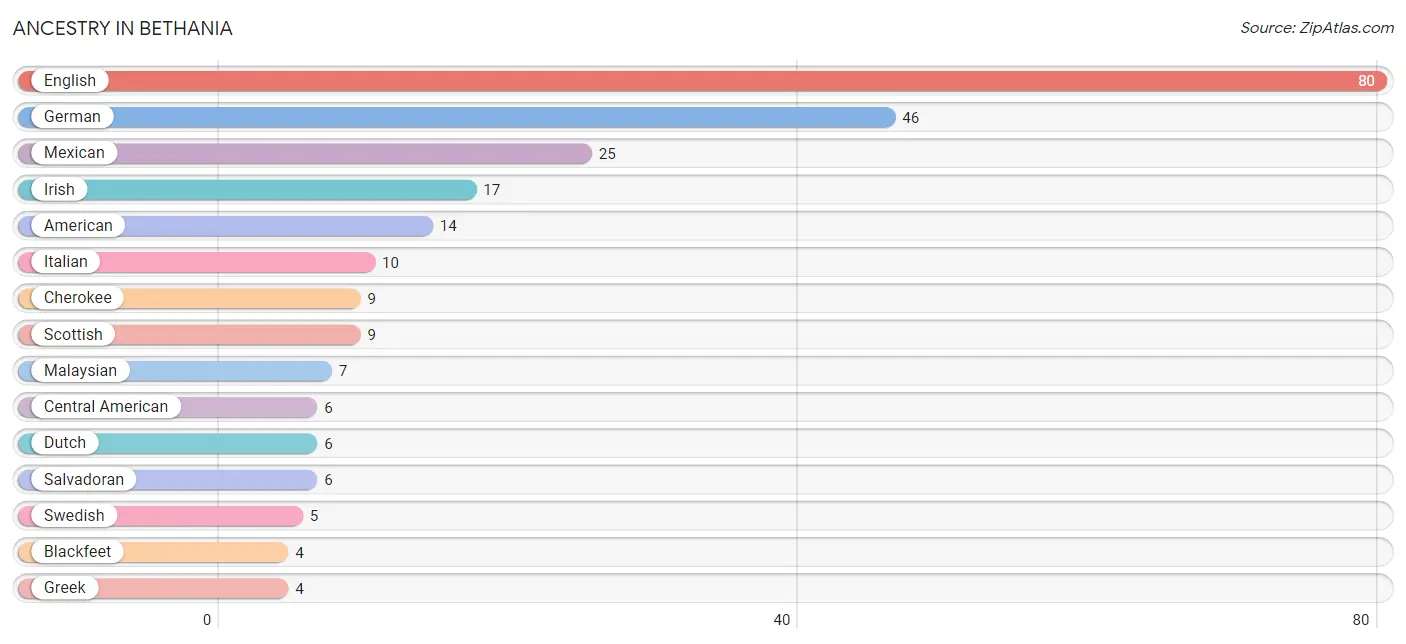
| Ancestry | # Population | % Population |
| American | 14 | 4.2% |
| Blackfeet | 4 | 1.2% |
| British | 2 | 0.6% |
| Canadian | 2 | 0.6% |
| Central American | 6 | 1.8% |
| Cherokee | 9 | 2.7% |
| Czech | 1 | 0.3% |
| Dutch | 6 | 1.8% |
| English | 80 | 23.9% |
| Finnish | 1 | 0.3% |
| German | 46 | 13.7% |
| Greek | 4 | 1.2% |
| Irish | 17 | 5.1% |
| Italian | 10 | 3.0% |
| Lithuanian | 1 | 0.3% |
| Malaysian | 7 | 2.1% |
| Mexican | 25 | 7.5% |
| Polish | 2 | 0.6% |
| Portuguese | 2 | 0.6% |
| Salvadoran | 6 | 1.8% |
| Scotch-Irish | 2 | 0.6% |
| Scottish | 9 | 2.7% |
| Swedish | 5 | 1.5% | View All 23 Rows |
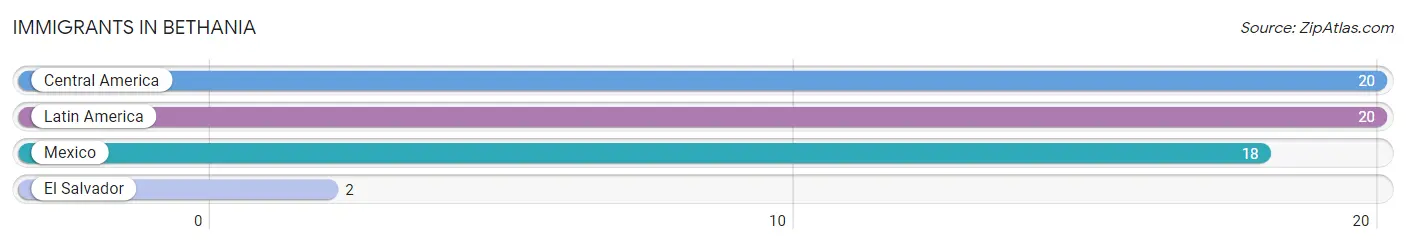
Immigrants in Bethania
The most numerous immigrant groups reported in Bethania came from Central America (20 | 6.0%), Latin America (20 | 6.0%), Mexico (18 | 5.4%), and El Salvador (2 | 0.6%), together accounting for 17.9% of all Bethania residents.
| Immigration Origin | # Population | % Population |
| Central America | 20 | 6.0% |
| El Salvador | 2 | 0.6% |
| Latin America | 20 | 6.0% |
| Mexico | 18 | 5.4% | View All 4 Rows |
Sex and Age in Bethania
Sex and Age in Bethania
The most populous age groups in Bethania are 75 to 79 Years (38 | 20.8%) for men and 55 to 59 Years (34 | 22.4%) for women.
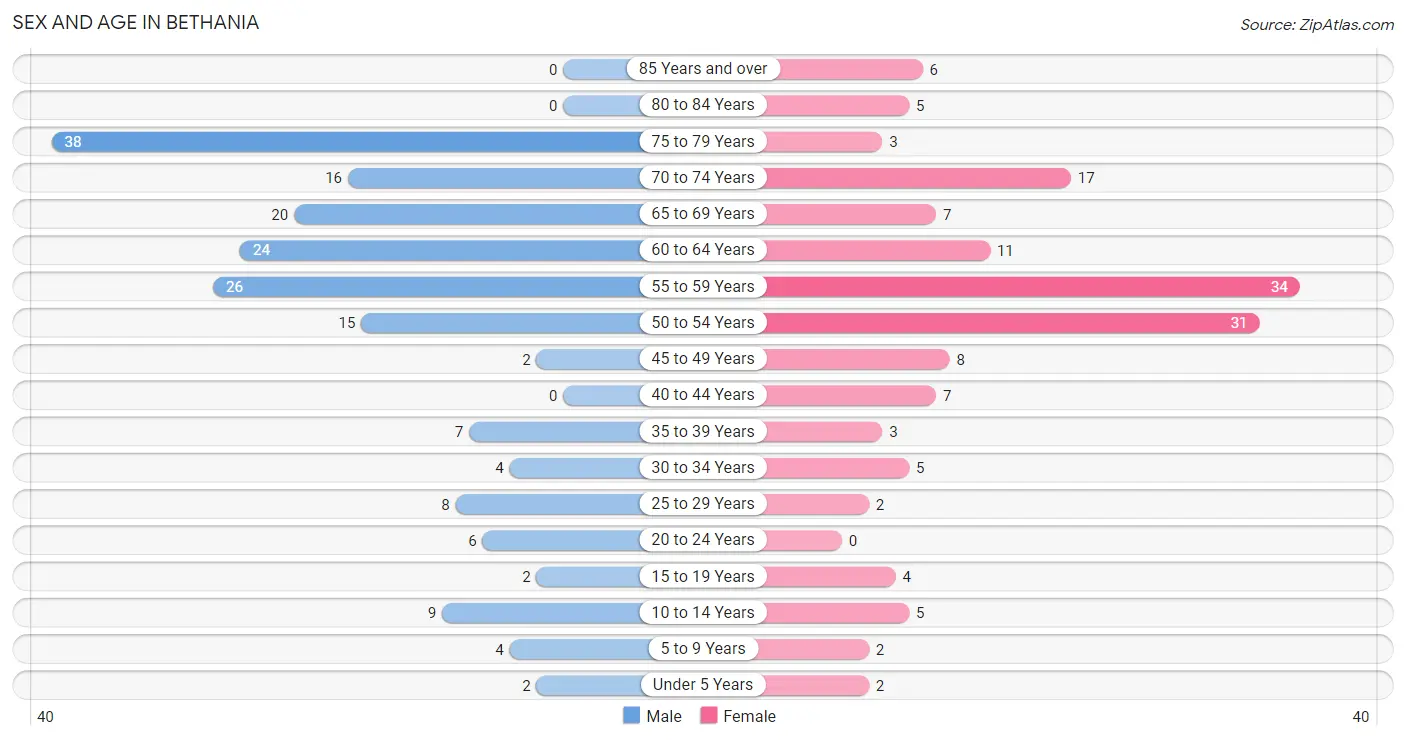
| Age Bracket | Male | Female |
| Under 5 Years | 2 (1.1%) | 2 (1.3%) |
| 5 to 9 Years | 4 (2.2%) | 2 (1.3%) |
| 10 to 14 Years | 9 (4.9%) | 5 (3.3%) |
| 15 to 19 Years | 2 (1.1%) | 4 (2.6%) |
| 20 to 24 Years | 6 (3.3%) | 0 (0.0%) |
| 25 to 29 Years | 8 (4.4%) | 2 (1.3%) |
| 30 to 34 Years | 4 (2.2%) | 5 (3.3%) |
| 35 to 39 Years | 7 (3.8%) | 3 (2.0%) |
| 40 to 44 Years | 0 (0.0%) | 7 (4.6%) |
| 45 to 49 Years | 2 (1.1%) | 8 (5.3%) |
| 50 to 54 Years | 15 (8.2%) | 31 (20.4%) |
| 55 to 59 Years | 26 (14.2%) | 34 (22.4%) |
| 60 to 64 Years | 24 (13.1%) | 11 (7.2%) |
| 65 to 69 Years | 20 (10.9%) | 7 (4.6%) |
| 70 to 74 Years | 16 (8.7%) | 17 (11.2%) |
| 75 to 79 Years | 38 (20.8%) | 3 (2.0%) |
| 80 to 84 Years | 0 (0.0%) | 5 (3.3%) |
| 85 Years and over | 0 (0.0%) | 6 (4.0%) |
| Total | 183 (100.0%) | 152 (100.0%) |
Families and Households in Bethania
Median Family Size in Bethania
The median family size in Bethania is 2.69 persons per family, with married-couple families (78 | 81.2%) accounting for the largest median family size of 2.77 persons per family. On the other hand, single male/father families (2 | 2.1%) represent the smallest median family size with 2.00 persons per family.
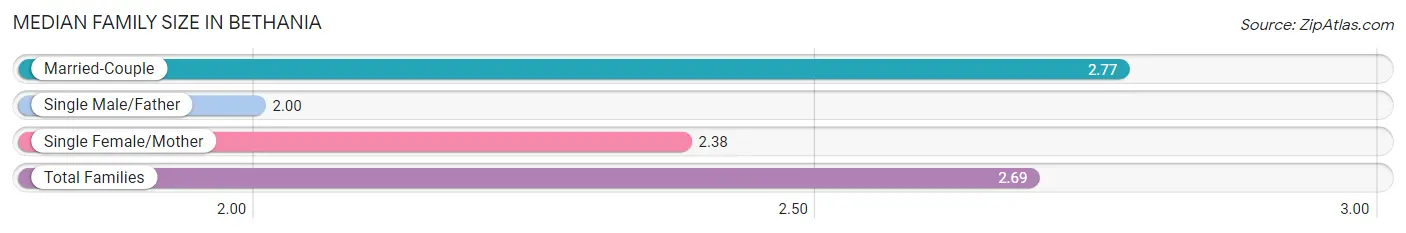
| Family Type | # Families | Family Size |
| Married-Couple | 78 (81.2%) | 2.77 |
| Single Male/Father | 2 (2.1%) | 2.00 |
| Single Female/Mother | 16 (16.7%) | 2.38 |
| Total Families | 96 (100.0%) | 2.69 |
Median Household Size in Bethania
The median household size in Bethania is 2.23 persons per household, with married-couple households (78 | 52.0%) accounting for the largest median household size of 2.77 persons per household. non-family households (54 | 36.0%) represent the smallest median household size with 1.43 persons per household.
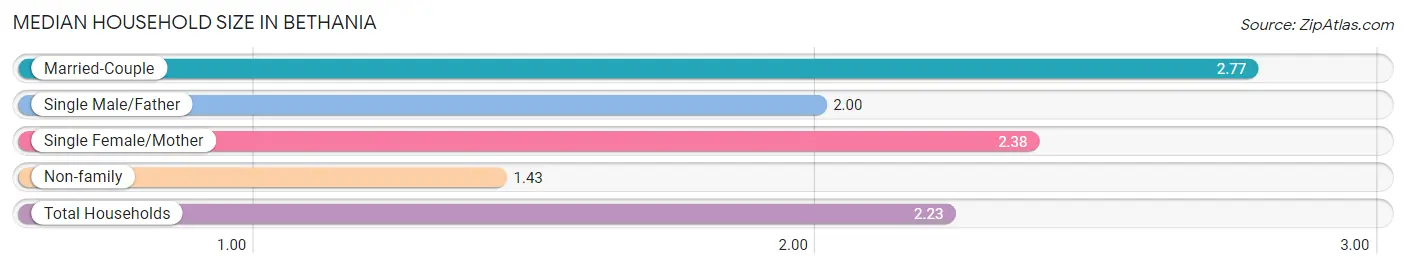
| Household Type | # Households | Household Size |
| Married-Couple | 78 (52.0%) | 2.77 |
| Single Male/Father | 2 (1.3%) | 2.00 |
| Single Female/Mother | 16 (10.7%) | 2.38 |
| Non-family | 54 (36.0%) | 1.43 |
| Total Households | 150 (100.0%) | 2.23 |
Household Size by Marriage Status in Bethania
Out of a total of 150 households in Bethania, 96 (64.0%) are family households, while 54 (36.0%) are nonfamily households. The most numerous type of family households are 2-person households, comprising 60, and the most common type of nonfamily households are 2-person households, comprising 33.
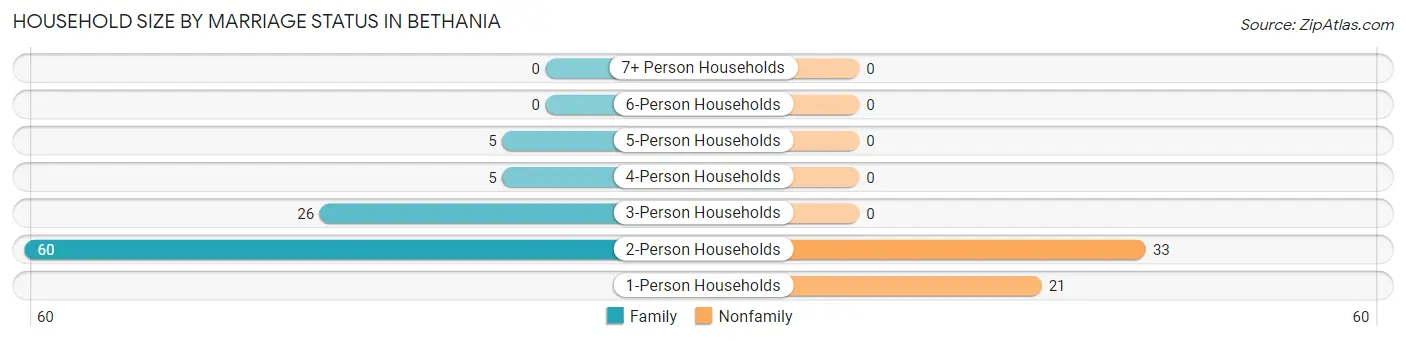
| Household Size | Family Households | Nonfamily Households |
| 1-Person Households | - | 21 (14.0%) |
| 2-Person Households | 60 (40.0%) | 33 (22.0%) |
| 3-Person Households | 26 (17.3%) | 0 (0.0%) |
| 4-Person Households | 5 (3.3%) | 0 (0.0%) |
| 5-Person Households | 5 (3.3%) | 0 (0.0%) |
| 6-Person Households | 0 (0.0%) | 0 (0.0%) |
| 7+ Person Households | 0 (0.0%) | 0 (0.0%) |
| Total | 96 (64.0%) | 54 (36.0%) |
Female Fertility in Bethania
Fertility by Age in Bethania
Average fertility rate in Bethania is 50.0 births per 1,000 women. Women in the age bracket of 20 to 34 years have the highest fertility rate with 286.0 births per 1,000 women. Women in the age bracket of 20 to 34 years acount for 100.0% of all women with births.
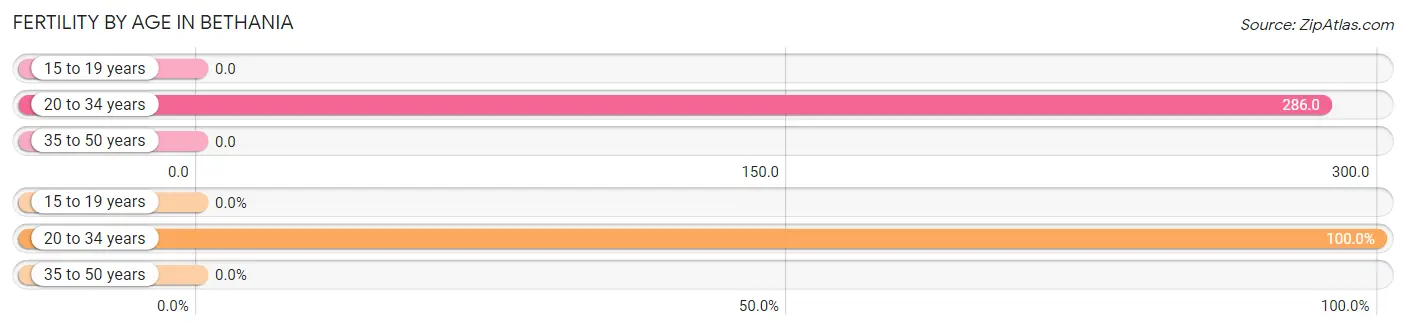
| Age Bracket | Women with Births | Births / 1,000 Women |
| 15 to 19 years | 0 (0.0%) | 0.0 |
| 20 to 34 years | 2 (100.0%) | 286.0 |
| 35 to 50 years | 0 (0.0%) | 0.0 |
| Total | 2 (100.0%) | 50.0 |
Fertility by Age by Marriage Status in Bethania
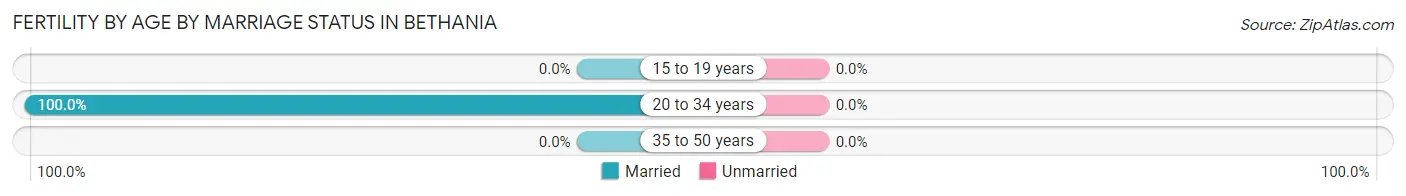
| Age Bracket | Married | Unmarried |
| 15 to 19 years | 0 (0.0%) | 0 (0.0%) |
| 20 to 34 years | 2 (100.0%) | 0 (0.0%) |
| 35 to 50 years | 0 (0.0%) | 0 (0.0%) |
| Total | 2 (100.0%) | 0 (0.0%) |
Fertility by Education in Bethania
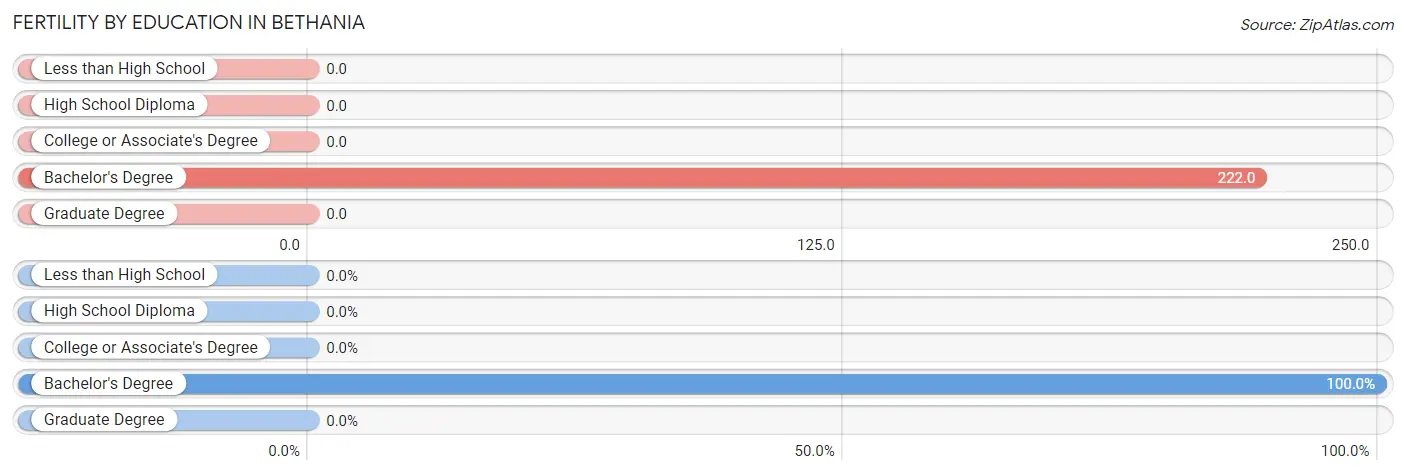
| Educational Attainment | Women with Births | Births / 1,000 Women |
| Less than High School | 0 (0.0%) | 0.0 |
| High School Diploma | 0 (0.0%) | 0.0 |
| College or Associate's Degree | 0 (0.0%) | 0.0 |
| Bachelor's Degree | 2 (100.0%) | 222.0 |
| Graduate Degree | 0 (0.0%) | 0.0 |
| Total | 2 (100.0%) | 50.0 |
Fertility by Education by Marriage Status in Bethania
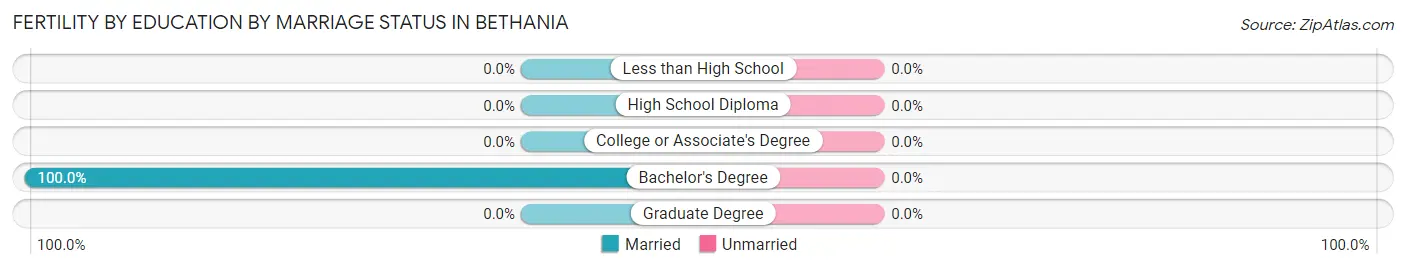
| Educational Attainment | Married | Unmarried |
| Less than High School | 0 (0.0%) | 0 (0.0%) |
| High School Diploma | 0 (0.0%) | 0 (0.0%) |
| College or Associate's Degree | 0 (0.0%) | 0 (0.0%) |
| Bachelor's Degree | 2 (100.0%) | 0 (0.0%) |
| Graduate Degree | 0 (0.0%) | 0 (0.0%) |
| Total | 2 (100.0%) | 0 (0.0%) |
Employment Characteristics in Bethania
Employment by Class of Employer in Bethania
Among the 129 employed individuals in Bethania, private company employees (73 | 56.6%), self-employed (incorporated) (21 | 16.3%), and self-employed (not incorporated) (13 | 10.1%) make up the most common classes of employment.
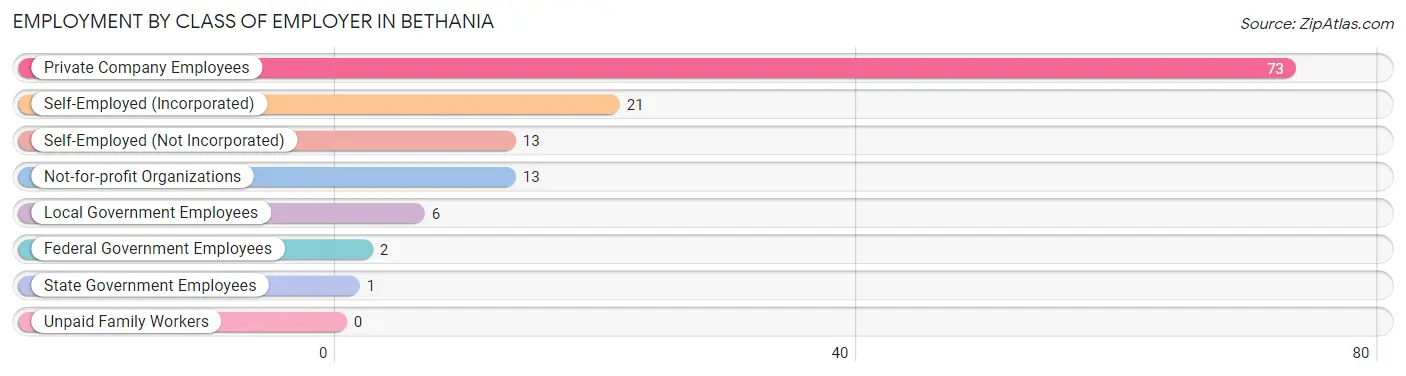
| Employer Class | # Employees | % Employees |
| Private Company Employees | 73 | 56.6% |
| Self-Employed (Incorporated) | 21 | 16.3% |
| Self-Employed (Not Incorporated) | 13 | 10.1% |
| Not-for-profit Organizations | 13 | 10.1% |
| Local Government Employees | 6 | 4.6% |
| State Government Employees | 1 | 0.8% |
| Federal Government Employees | 2 | 1.5% |
| Unpaid Family Workers | 0 | 0.0% |
| Total | 129 | 100.0% |
Employment Status by Age in Bethania
According to the labor force statistics for Bethania, out of the total population over 16 years of age (311), 43.1% or 134 individuals are in the labor force, with 3.7% or 5 of them unemployed. The age group with the highest labor force participation rate is 20 to 24 years, with 100.0% or 6 individuals in the labor force. Within the labor force, the 16 to 19 years age range has the highest percentage of unemployed individuals, with 100.0% or 4 of them being unemployed.
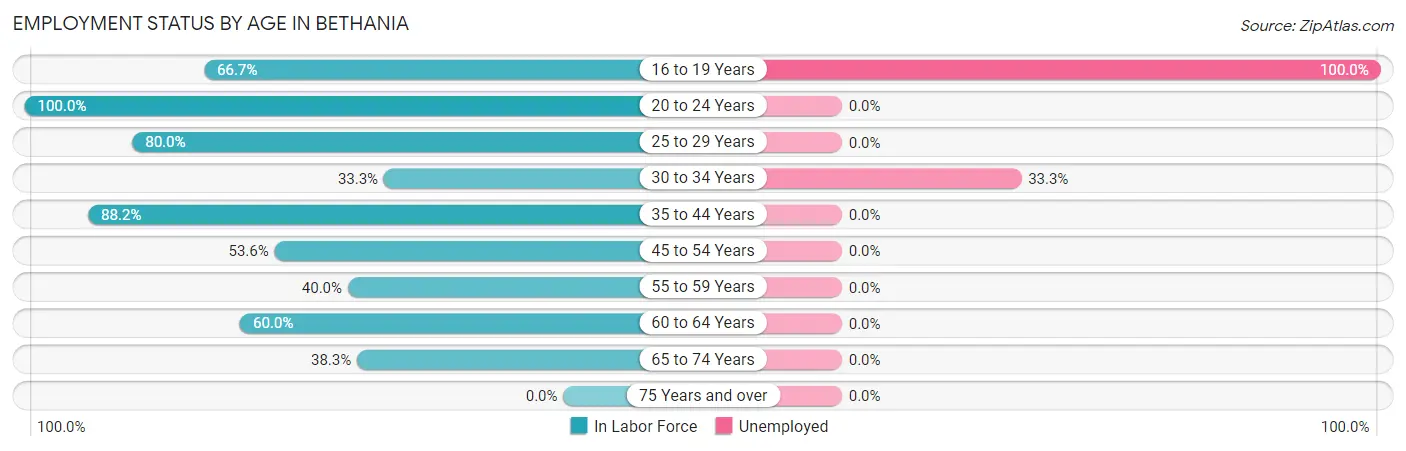
| Age Bracket | In Labor Force | Unemployed |
| 16 to 19 Years | 4 (66.7%) | 4 (100.0%) |
| 20 to 24 Years | 6 (100.0%) | 0 (0.0%) |
| 25 to 29 Years | 8 (80.0%) | 0 (0.0%) |
| 30 to 34 Years | 3 (33.3%) | 1 (33.3%) |
| 35 to 44 Years | 15 (88.2%) | 0 (0.0%) |
| 45 to 54 Years | 30 (53.6%) | 0 (0.0%) |
| 55 to 59 Years | 24 (40.0%) | 0 (0.0%) |
| 60 to 64 Years | 21 (60.0%) | 0 (0.0%) |
| 65 to 74 Years | 23 (38.3%) | 0 (0.0%) |
| 75 Years and over | 0 (0.0%) | 0 (0.0%) |
| Total | 134 (43.1%) | 5 (3.7%) |
Employment Status by Educational Attainment in Bethania
According to labor force statistics for Bethania, 54.0% of individuals (101) out of the total population between 25 and 64 years of age (187) are in the labor force, with 1.0% or 1 of them being unemployed. The group with the highest labor force participation rate are those with the educational attainment of bachelor's degree or higher, with 73.1% or 19 individuals in the labor force. Within the labor force, individuals with bachelor's degree or higher education have the highest percentage of unemployment, with 5.3% or 1 of them being unemployed.
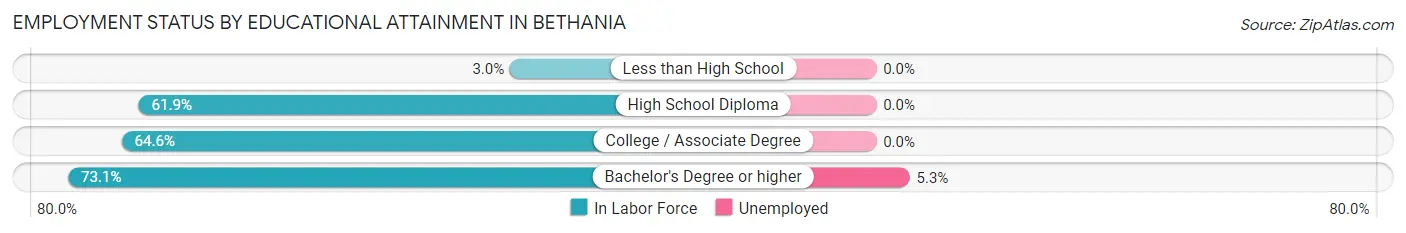
| Educational Attainment | In Labor Force | Unemployed |
| Less than High School | 1 (3.0%) | 0 (0.0%) |
| High School Diploma | 39 (61.9%) | 0 (0.0%) |
| College / Associate Degree | 42 (64.6%) | 0 (0.0%) |
| Bachelor's Degree or higher | 19 (73.1%) | 1 (5.3%) |
| Total | 101 (54.0%) | 2 (1.0%) |
Employment Occupations by Sex in Bethania
Management, Business, Science and Arts Occupations
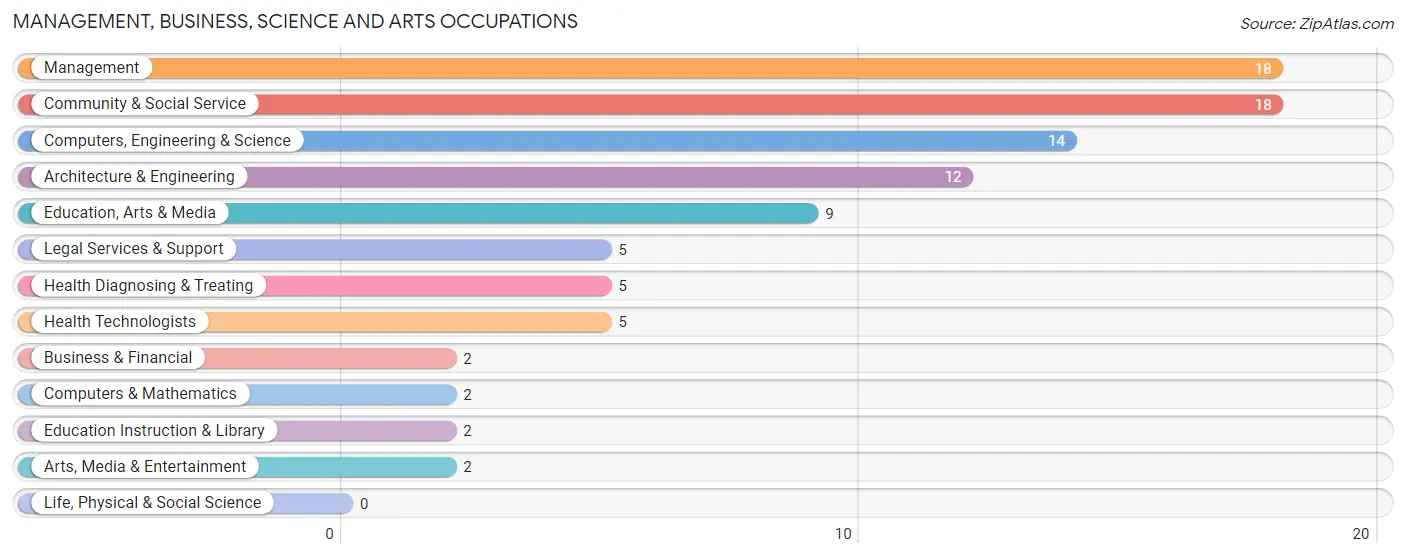
The most common Management, Business, Science and Arts occupations in Bethania are Management (18 | 14.0%), Community & Social Service (18 | 14.0%), Computers, Engineering & Science (14 | 10.8%), Architecture & Engineering (12 | 9.3%), and Education, Arts & Media (9 | 7.0%).
Management, Business, Science and Arts Occupations by Sex
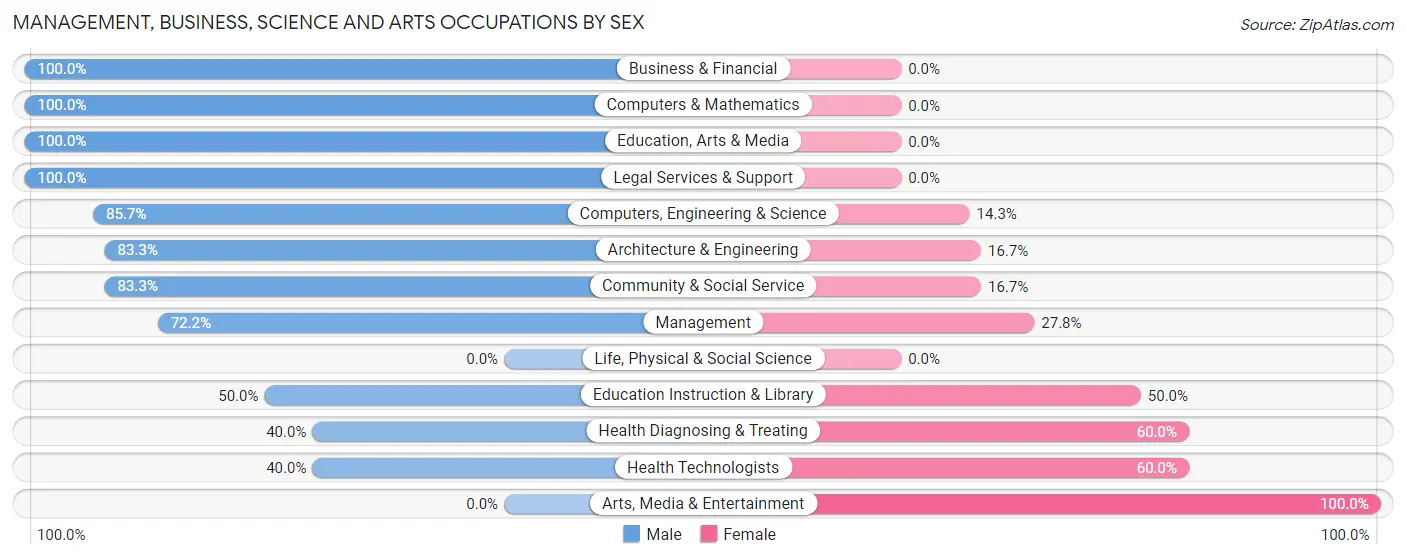
Within the Management, Business, Science and Arts occupations in Bethania, the most male-oriented occupations are Business & Financial (100.0%), Computers & Mathematics (100.0%), and Education, Arts & Media (100.0%), while the most female-oriented occupations are Arts, Media & Entertainment (100.0%), Health Diagnosing & Treating (60.0%), and Health Technologists (60.0%).
| Occupation | Male | Female |
| Management | 13 (72.2%) | 5 (27.8%) |
| Business & Financial | 2 (100.0%) | 0 (0.0%) |
| Computers, Engineering & Science | 12 (85.7%) | 2 (14.3%) |
| Computers & Mathematics | 2 (100.0%) | 0 (0.0%) |
| Architecture & Engineering | 10 (83.3%) | 2 (16.7%) |
| Life, Physical & Social Science | 0 (0.0%) | 0 (0.0%) |
| Community & Social Service | 15 (83.3%) | 3 (16.7%) |
| Education, Arts & Media | 9 (100.0%) | 0 (0.0%) |
| Legal Services & Support | 5 (100.0%) | 0 (0.0%) |
| Education Instruction & Library | 1 (50.0%) | 1 (50.0%) |
| Arts, Media & Entertainment | 0 (0.0%) | 2 (100.0%) |
| Health Diagnosing & Treating | 2 (40.0%) | 3 (60.0%) |
| Health Technologists | 2 (40.0%) | 3 (60.0%) |
| Total (Category) | 44 (77.2%) | 13 (22.8%) |
| Total (Overall) | 89 (69.0%) | 40 (31.0%) |
Services Occupations
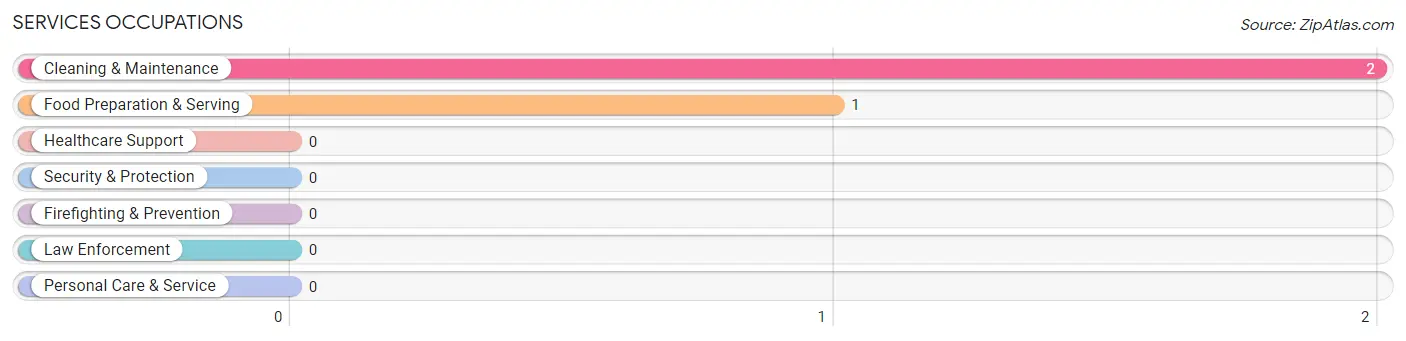
The most common Services occupations in Bethania are Cleaning & Maintenance (2 | 1.5%), and Food Preparation & Serving (1 | 0.8%).
Services Occupations by Sex
| Occupation | Male | Female |
| Healthcare Support | 0 (0.0%) | 0 (0.0%) |
| Security & Protection | 0 (0.0%) | 0 (0.0%) |
| Firefighting & Prevention | 0 (0.0%) | 0 (0.0%) |
| Law Enforcement | 0 (0.0%) | 0 (0.0%) |
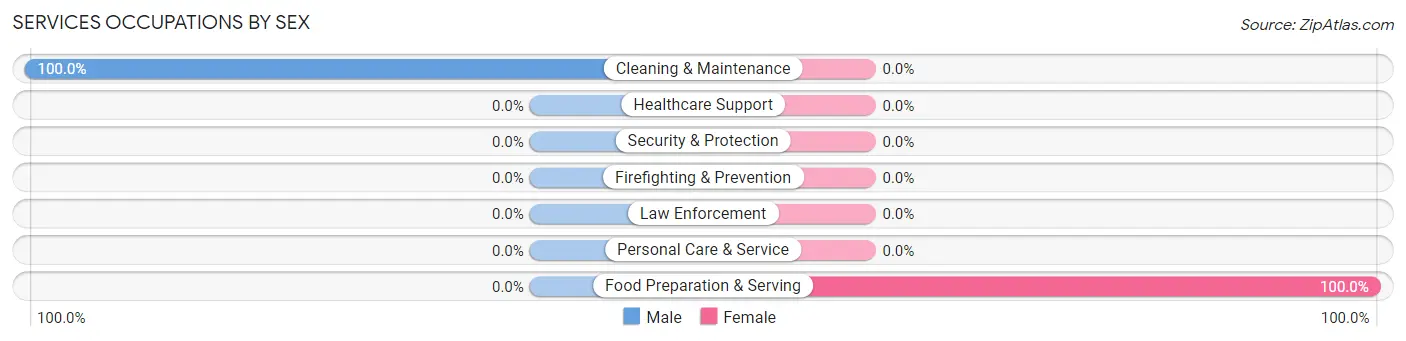
| Food Preparation & Serving | 0 (0.0%) | 1 (100.0%) |
| Cleaning & Maintenance | 2 (100.0%) | 0 (0.0%) |
| Personal Care & Service | 0 (0.0%) | 0 (0.0%) |
| Total (Category) | 2 (66.7%) | 1 (33.3%) |
| Total (Overall) | 89 (69.0%) | 40 (31.0%) |
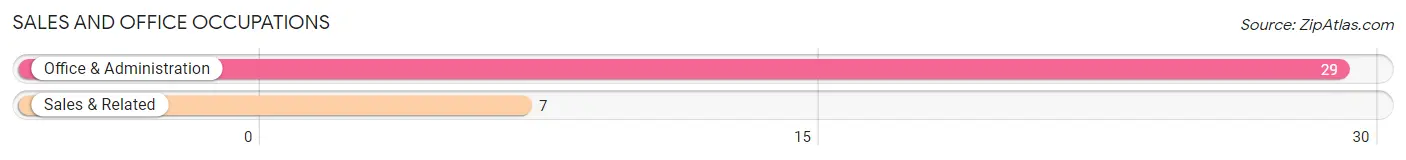
Sales and Office Occupations
The most common Sales and Office occupations in Bethania are Office & Administration (29 | 22.5%), and Sales & Related (7 | 5.4%).
Sales and Office Occupations by Sex
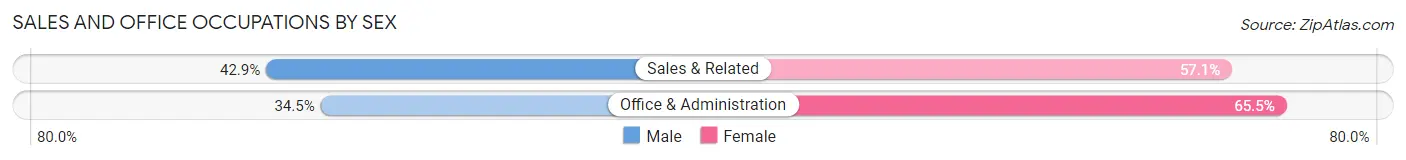
| Occupation | Male | Female |
| Sales & Related | 3 (42.9%) | 4 (57.1%) |
| Office & Administration | 10 (34.5%) | 19 (65.5%) |
| Total (Category) | 13 (36.1%) | 23 (63.9%) |
| Total (Overall) | 89 (69.0%) | 40 (31.0%) |
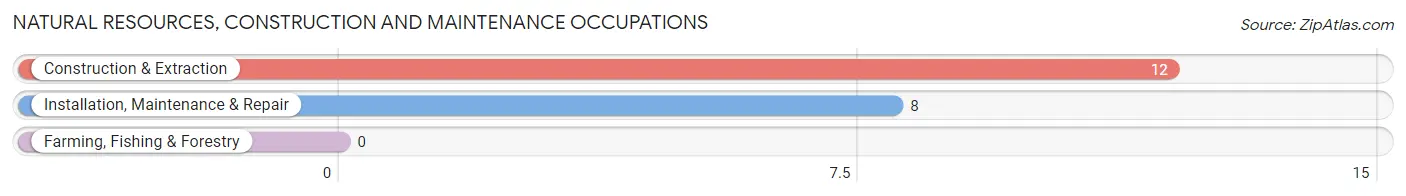
Natural Resources, Construction and Maintenance Occupations
The most common Natural Resources, Construction and Maintenance occupations in Bethania are Construction & Extraction (12 | 9.3%), and Installation, Maintenance & Repair (8 | 6.2%).
Natural Resources, Construction and Maintenance Occupations by Sex
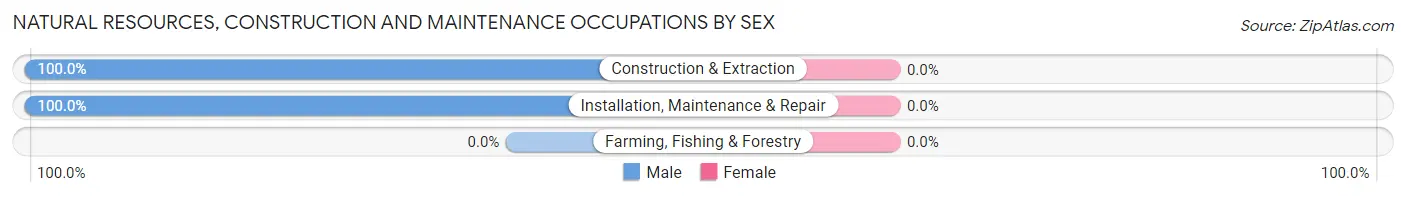
| Occupation | Male | Female |
| Farming, Fishing & Forestry | 0 (0.0%) | 0 (0.0%) |
| Construction & Extraction | 12 (100.0%) | 0 (0.0%) |
| Installation, Maintenance & Repair | 8 (100.0%) | 0 (0.0%) |
| Total (Category) | 20 (100.0%) | 0 (0.0%) |
| Total (Overall) | 89 (69.0%) | 40 (31.0%) |
Production, Transportation and Moving Occupations
The most common Production, Transportation and Moving occupations in Bethania are Transportation (5 | 3.9%), Material Moving (5 | 3.9%), and Production (3 | 2.3%).
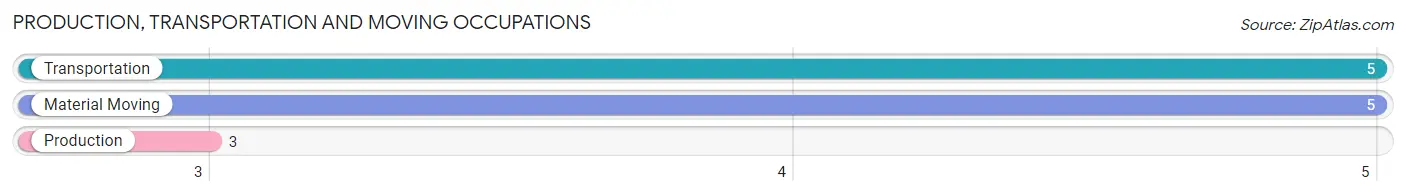
Production, Transportation and Moving Occupations by Sex
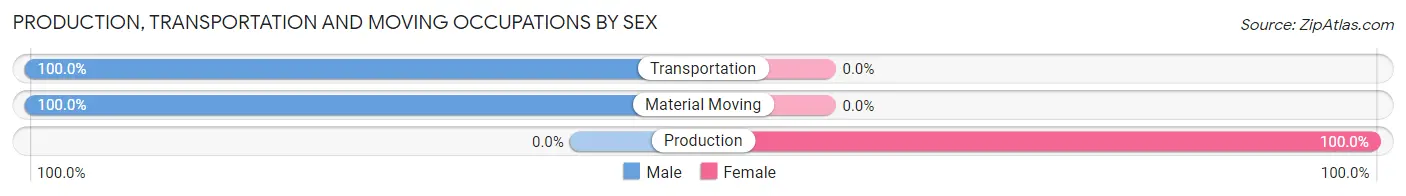
| Occupation | Male | Female |
| Production | 0 (0.0%) | 3 (100.0%) |
| Transportation | 5 (100.0%) | 0 (0.0%) |
| Material Moving | 5 (100.0%) | 0 (0.0%) |
| Total (Category) | 10 (76.9%) | 3 (23.1%) |
| Total (Overall) | 89 (69.0%) | 40 (31.0%) |
Employment Industries by Sex in Bethania
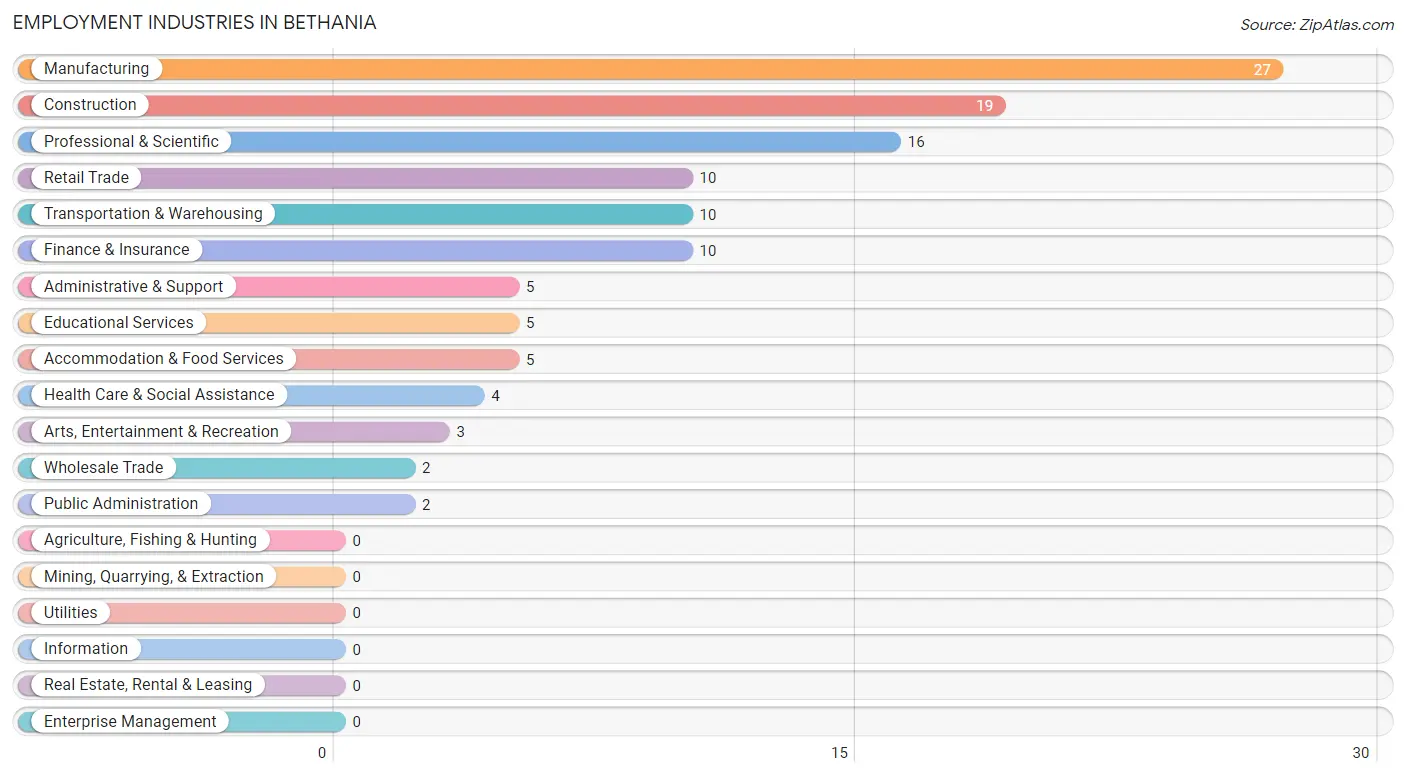
Employment Industries in Bethania
The major employment industries in Bethania include Manufacturing (27 | 20.9%), Construction (19 | 14.7%), Professional & Scientific (16 | 12.4%), Retail Trade (10 | 7.7%), and Transportation & Warehousing (10 | 7.7%).
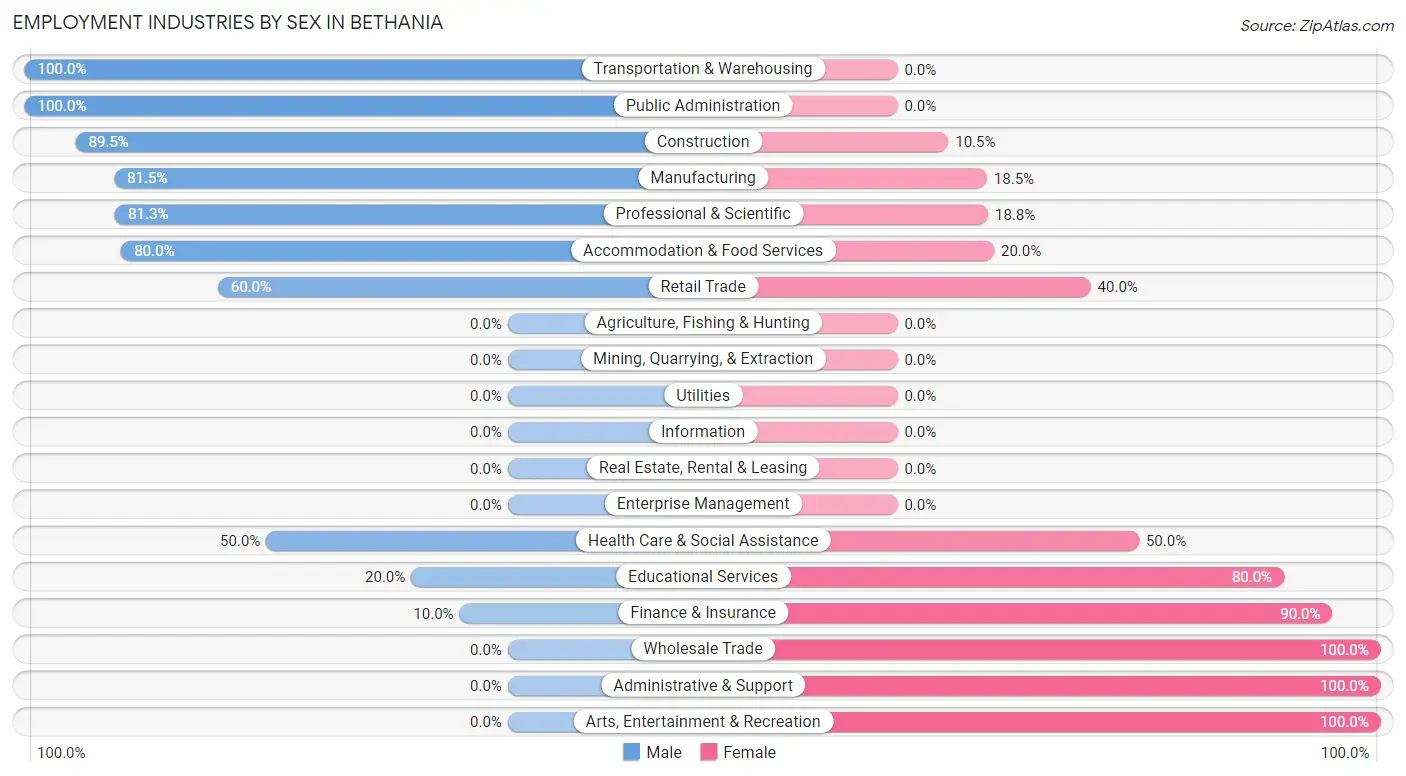
Employment Industries by Sex in Bethania
The Bethania industries that see more men than women are Transportation & Warehousing (100.0%), Public Administration (100.0%), and Construction (89.5%), whereas the industries that tend to have a higher number of women are Wholesale Trade (100.0%), Administrative & Support (100.0%), and Arts, Entertainment & Recreation (100.0%).
| Industry | Male | Female |
| Agriculture, Fishing & Hunting | 0 (0.0%) | 0 (0.0%) |
| Mining, Quarrying, & Extraction | 0 (0.0%) | 0 (0.0%) |
| Construction | 17 (89.5%) | 2 (10.5%) |
| Manufacturing | 22 (81.5%) | 5 (18.5%) |
| Wholesale Trade | 0 (0.0%) | 2 (100.0%) |
| Retail Trade | 6 (60.0%) | 4 (40.0%) |
| Transportation & Warehousing | 10 (100.0%) | 0 (0.0%) |
| Utilities | 0 (0.0%) | 0 (0.0%) |
| Information | 0 (0.0%) | 0 (0.0%) |
| Finance & Insurance | 1 (10.0%) | 9 (90.0%) |
| Real Estate, Rental & Leasing | 0 (0.0%) | 0 (0.0%) |
| Professional & Scientific | 13 (81.2%) | 3 (18.8%) |
| Enterprise Management | 0 (0.0%) | 0 (0.0%) |
| Administrative & Support | 0 (0.0%) | 5 (100.0%) |
| Educational Services | 1 (20.0%) | 4 (80.0%) |
| Health Care & Social Assistance | 2 (50.0%) | 2 (50.0%) |
| Arts, Entertainment & Recreation | 0 (0.0%) | 3 (100.0%) |
| Accommodation & Food Services | 4 (80.0%) | 1 (20.0%) |
| Public Administration | 2 (100.0%) | 0 (0.0%) |
| Total | 89 (69.0%) | 40 (31.0%) |
Education in Bethania
School Enrollment in Bethania
The most common levels of schooling among the 38 students in Bethania are middle school (14 | 36.8%), college / undergraduate (9 | 23.7%), and elementary school (6 | 15.8%).
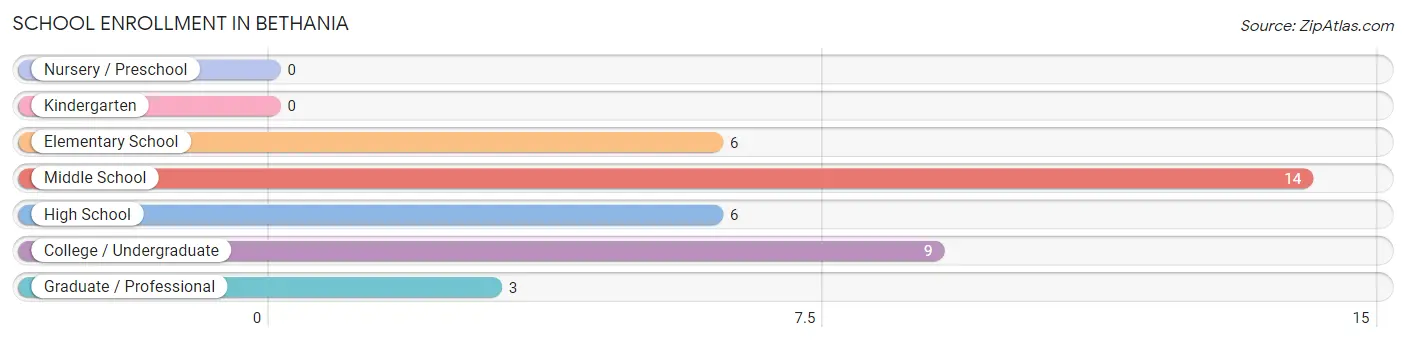
| School Level | # Students | % Students |
| Nursery / Preschool | 0 | 0.0% |
| Kindergarten | 0 | 0.0% |
| Elementary School | 6 | 15.8% |
| Middle School | 14 | 36.8% |
| High School | 6 | 15.8% |
| College / Undergraduate | 9 | 23.7% |
| Graduate / Professional | 3 | 7.9% |
| Total | 38 | 100.0% |
School Enrollment by Age by Funding Source in Bethania
Out of a total of 38 students who are enrolled in schools in Bethania, 7 (18.4%) attend a private institution, while the remaining 31 (81.6%) are enrolled in public schools. The age group of 35 years and over has the highest likelihood of being enrolled in private schools, with 1 (100.0% in the age bracket) enrolled. Conversely, the age group of 5 to 9 year old has the lowest likelihood of being enrolled in a private school, with 6 (100.0% in the age bracket) attending a public institution.
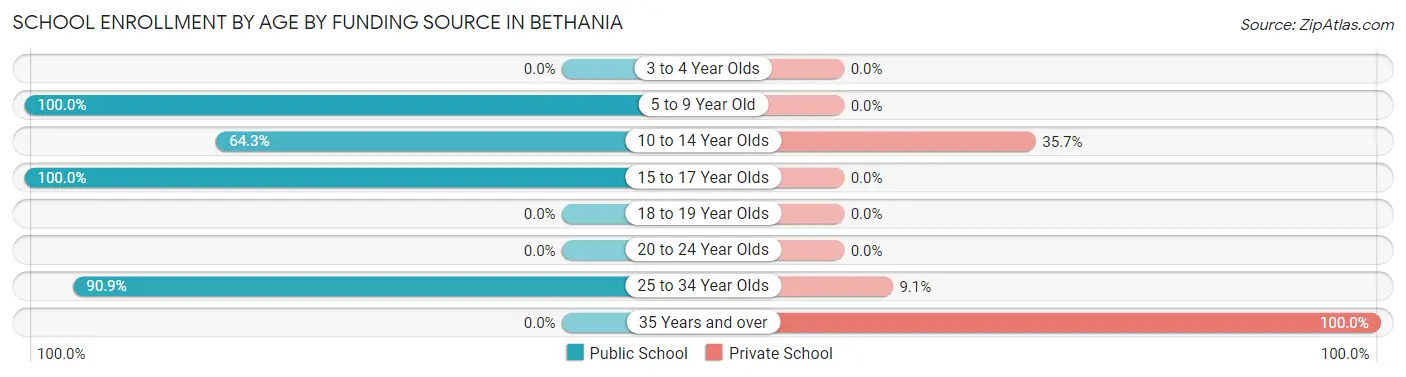
| Age Bracket | Public School | Private School |
| 3 to 4 Year Olds | 0 (0.0%) | 0 (0.0%) |
| 5 to 9 Year Old | 6 (100.0%) | 0 (0.0%) |
| 10 to 14 Year Olds | 9 (64.3%) | 5 (35.7%) |
| 15 to 17 Year Olds | 6 (100.0%) | 0 (0.0%) |
| 18 to 19 Year Olds | 0 (0.0%) | 0 (0.0%) |
| 20 to 24 Year Olds | 0 (0.0%) | 0 (0.0%) |
| 25 to 34 Year Olds | 10 (90.9%) | 1 (9.1%) |
| 35 Years and over | 0 (0.0%) | 1 (100.0%) |
| Total | 31 (81.6%) | 7 (18.4%) |
Educational Attainment by Field of Study in Bethania
Business (18 | 26.9%), liberal arts & history (10 | 14.9%), engineering (9 | 13.4%), education (8 | 11.9%), and social sciences (7 | 10.4%) are the most common fields of study among 67 individuals in Bethania who have obtained a bachelor's degree or higher.
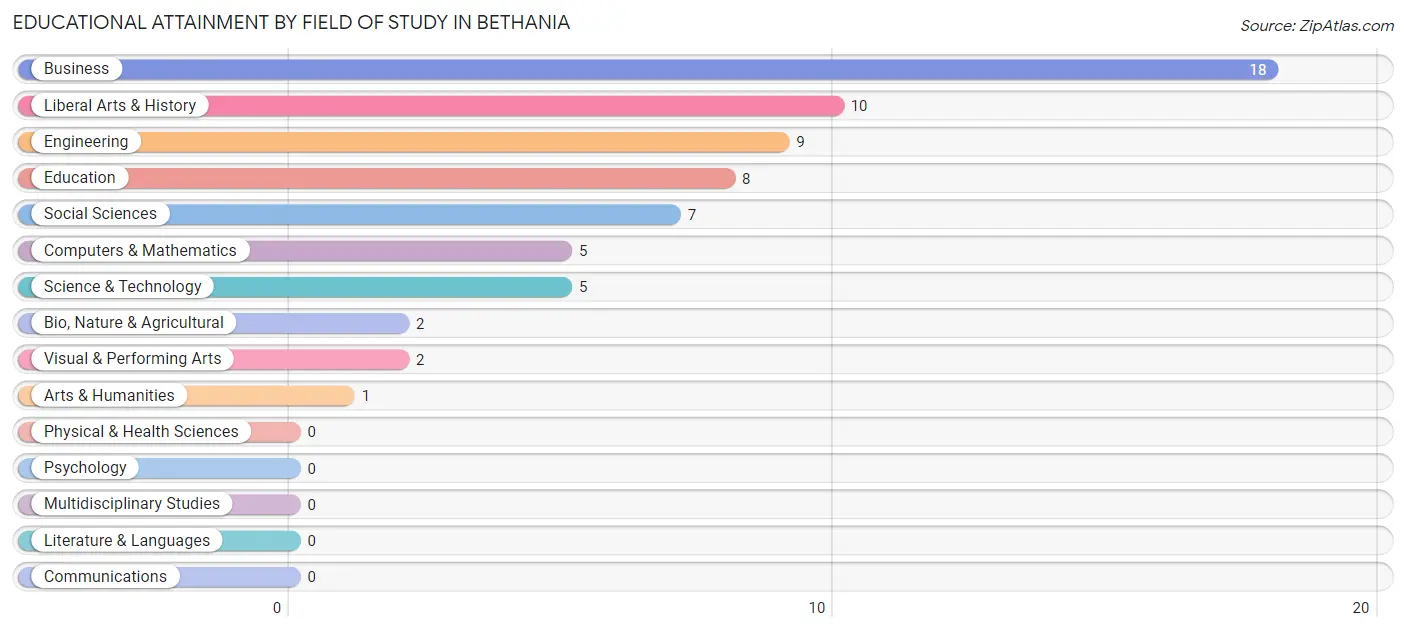
| Field of Study | # Graduates | % Graduates |
| Computers & Mathematics | 5 | 7.5% |
| Bio, Nature & Agricultural | 2 | 3.0% |
| Physical & Health Sciences | 0 | 0.0% |
| Psychology | 0 | 0.0% |
| Social Sciences | 7 | 10.4% |
| Engineering | 9 | 13.4% |
| Multidisciplinary Studies | 0 | 0.0% |
| Science & Technology | 5 | 7.5% |
| Business | 18 | 26.9% |
| Education | 8 | 11.9% |
| Literature & Languages | 0 | 0.0% |
| Liberal Arts & History | 10 | 14.9% |
| Visual & Performing Arts | 2 | 3.0% |
| Communications | 0 | 0.0% |
| Arts & Humanities | 1 | 1.5% |
| Total | 67 | 100.0% |
Transportation & Commute in Bethania
Vehicle Availability by Sex in Bethania
The most prevalent vehicle ownership categories in Bethania are males with 2 vehicles (32, accounting for 36.0%) and females with 2 vehicles (8, making up 80.0%).
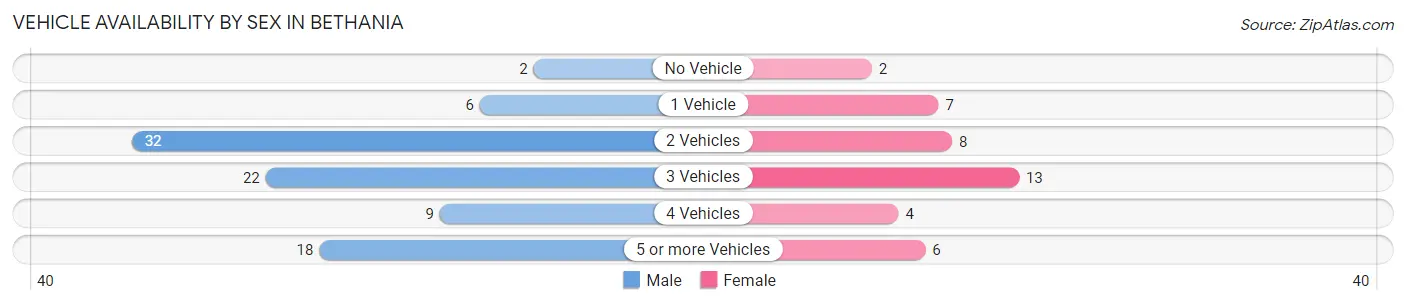
| Vehicles Available | Male | Female |
| No Vehicle | 2 (2.2%) | 2 (5.0%) |
| 1 Vehicle | 6 (6.7%) | 7 (17.5%) |
| 2 Vehicles | 32 (36.0%) | 8 (20.0%) |
| 3 Vehicles | 22 (24.7%) | 13 (32.5%) |
| 4 Vehicles | 9 (10.1%) | 4 (10.0%) |
| 5 or more Vehicles | 18 (20.2%) | 6 (15.0%) |
| Total | 89 (100.0%) | 40 (100.0%) |
Commute Time in Bethania
The most frequently occuring commute durations in Bethania are 15 to 19 minutes (29 commuters, 26.6%), 45 to 59 minutes (20 commuters, 18.3%), and 30 to 34 minutes (17 commuters, 15.6%).
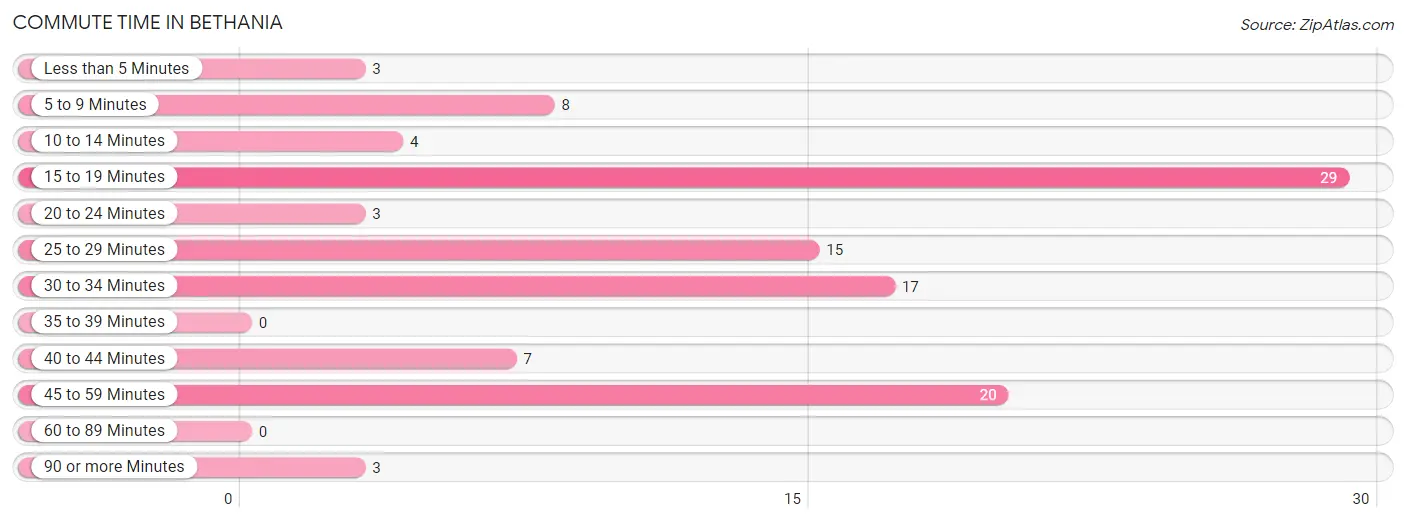
| Commute Time | # Commuters | % Commuters |
| Less than 5 Minutes | 3 | 2.8% |
| 5 to 9 Minutes | 8 | 7.3% |
| 10 to 14 Minutes | 4 | 3.7% |
| 15 to 19 Minutes | 29 | 26.6% |
| 20 to 24 Minutes | 3 | 2.8% |
| 25 to 29 Minutes | 15 | 13.8% |
| 30 to 34 Minutes | 17 | 15.6% |
| 35 to 39 Minutes | 0 | 0.0% |
| 40 to 44 Minutes | 7 | 6.4% |
| 45 to 59 Minutes | 20 | 18.3% |
| 60 to 89 Minutes | 0 | 0.0% |
| 90 or more Minutes | 3 | 2.8% |
Commute Time by Sex in Bethania
The most common commute times in Bethania are 45 to 59 minutes (20 commuters, 26.0%) for males and 15 to 19 minutes (17 commuters, 53.1%) for females.
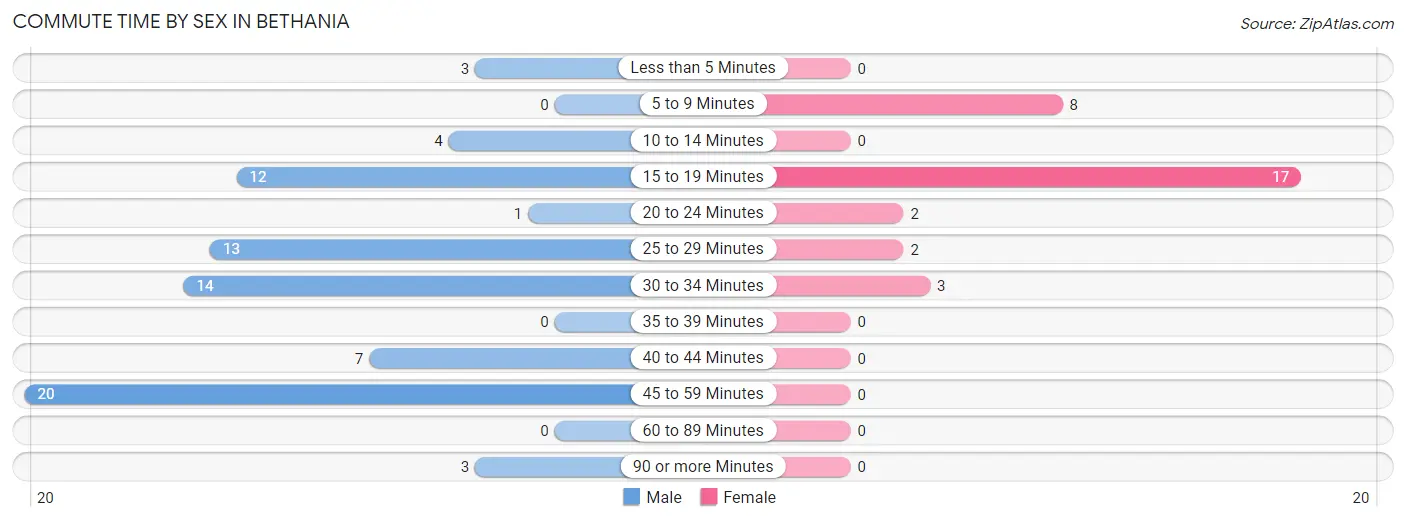
| Commute Time | Male | Female |
| Less than 5 Minutes | 3 (3.9%) | 0 (0.0%) |
| 5 to 9 Minutes | 0 (0.0%) | 8 (25.0%) |
| 10 to 14 Minutes | 4 (5.2%) | 0 (0.0%) |
| 15 to 19 Minutes | 12 (15.6%) | 17 (53.1%) |
| 20 to 24 Minutes | 1 (1.3%) | 2 (6.2%) |
| 25 to 29 Minutes | 13 (16.9%) | 2 (6.2%) |
| 30 to 34 Minutes | 14 (18.2%) | 3 (9.4%) |
| 35 to 39 Minutes | 0 (0.0%) | 0 (0.0%) |
| 40 to 44 Minutes | 7 (9.1%) | 0 (0.0%) |
| 45 to 59 Minutes | 20 (26.0%) | 0 (0.0%) |
| 60 to 89 Minutes | 0 (0.0%) | 0 (0.0%) |
| 90 or more Minutes | 3 (3.9%) | 0 (0.0%) |
Time of Departure to Work by Sex in Bethania
The most frequent times of departure to work in Bethania are 6:30 AM to 6:59 AM (27, 35.1%) for males and 8:00 AM to 8:29 AM (11, 34.4%) for females.
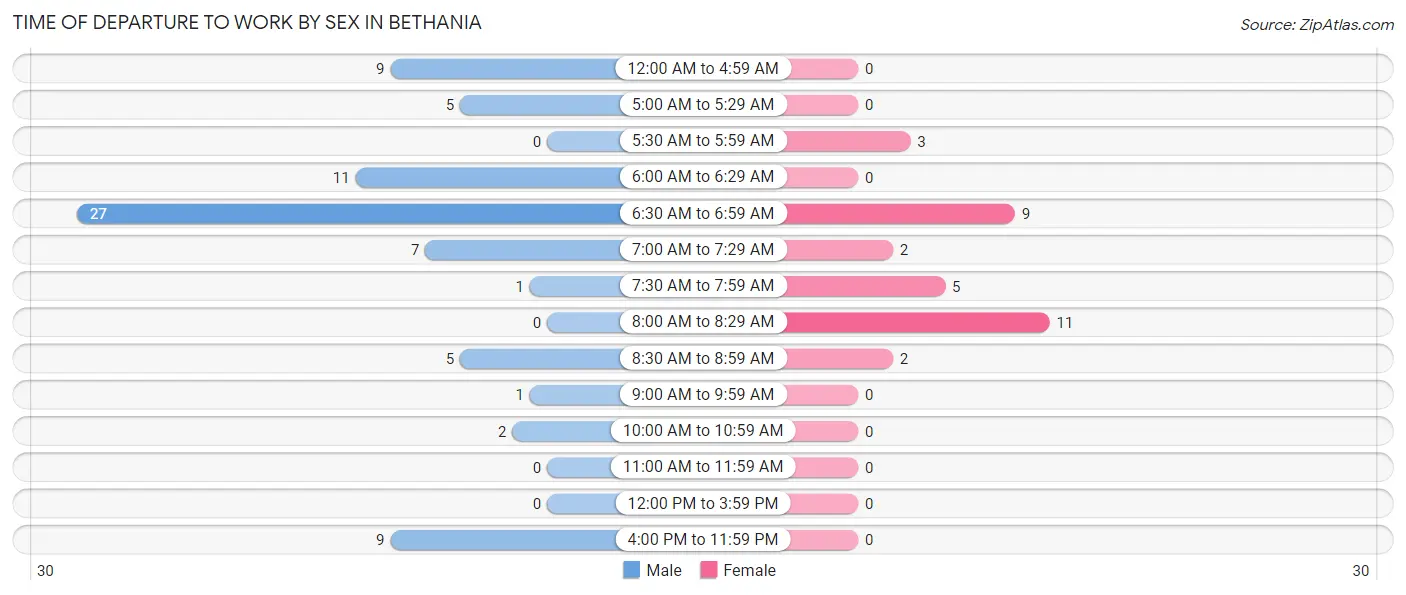
| Time of Departure | Male | Female |
| 12:00 AM to 4:59 AM | 9 (11.7%) | 0 (0.0%) |
| 5:00 AM to 5:29 AM | 5 (6.5%) | 0 (0.0%) |
| 5:30 AM to 5:59 AM | 0 (0.0%) | 3 (9.4%) |
| 6:00 AM to 6:29 AM | 11 (14.3%) | 0 (0.0%) |
| 6:30 AM to 6:59 AM | 27 (35.1%) | 9 (28.1%) |
| 7:00 AM to 7:29 AM | 7 (9.1%) | 2 (6.2%) |
| 7:30 AM to 7:59 AM | 1 (1.3%) | 5 (15.6%) |
| 8:00 AM to 8:29 AM | 0 (0.0%) | 11 (34.4%) |
| 8:30 AM to 8:59 AM | 5 (6.5%) | 2 (6.2%) |
| 9:00 AM to 9:59 AM | 1 (1.3%) | 0 (0.0%) |
| 10:00 AM to 10:59 AM | 2 (2.6%) | 0 (0.0%) |
| 11:00 AM to 11:59 AM | 0 (0.0%) | 0 (0.0%) |
| 12:00 PM to 3:59 PM | 0 (0.0%) | 0 (0.0%) |
| 4:00 PM to 11:59 PM | 9 (11.7%) | 0 (0.0%) |
| Total | 77 (100.0%) | 32 (100.0%) |
Housing Occupancy in Bethania
Occupancy by Ownership in Bethania
Of the total 150 dwellings in Bethania, owner-occupied units account for 122 (81.3%), while renter-occupied units make up 28 (18.7%).
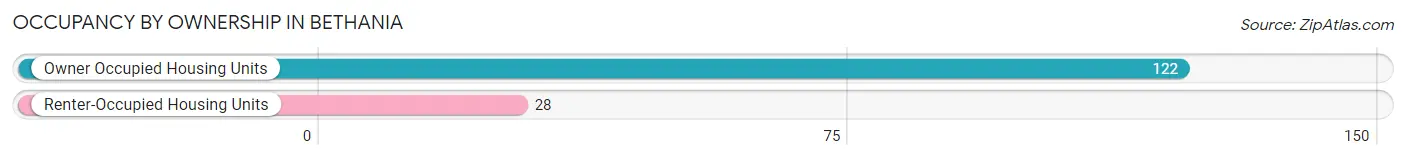
| Occupancy | # Housing Units | % Housing Units |
| Owner Occupied Housing Units | 122 | 81.3% |
| Renter-Occupied Housing Units | 28 | 18.7% |
| Total Occupied Housing Units | 150 | 100.0% |
Occupancy by Household Size in Bethania
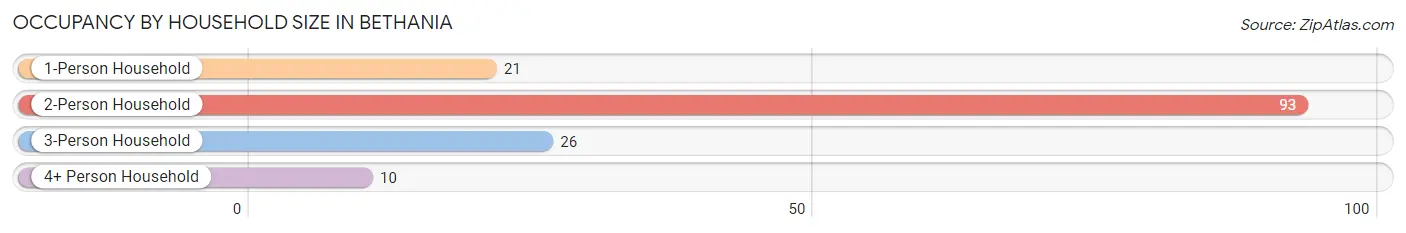
| Household Size | # Housing Units | % Housing Units |
| 1-Person Household | 21 | 14.0% |
| 2-Person Household | 93 | 62.0% |
| 3-Person Household | 26 | 17.3% |
| 4+ Person Household | 10 | 6.7% |
| Total Housing Units | 150 | 100.0% |
Occupancy by Ownership by Household Size in Bethania
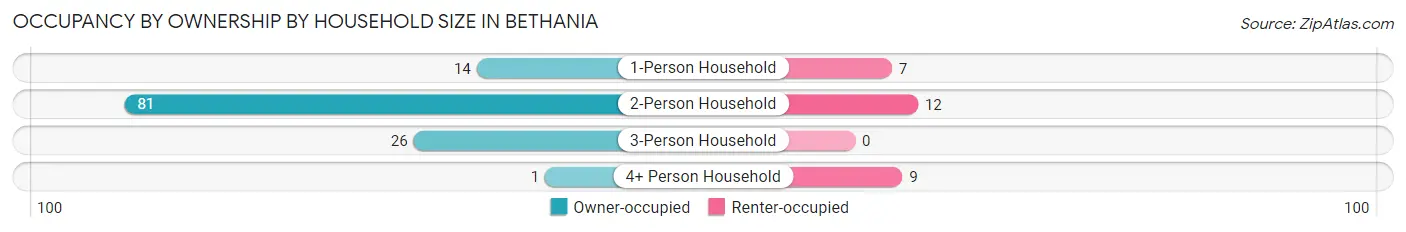
| Household Size | Owner-occupied | Renter-occupied |
| 1-Person Household | 14 (66.7%) | 7 (33.3%) |
| 2-Person Household | 81 (87.1%) | 12 (12.9%) |
| 3-Person Household | 26 (100.0%) | 0 (0.0%) |
| 4+ Person Household | 1 (10.0%) | 9 (90.0%) |
| Total Housing Units | 122 (81.3%) | 28 (18.7%) |
Occupancy by Educational Attainment in Bethania
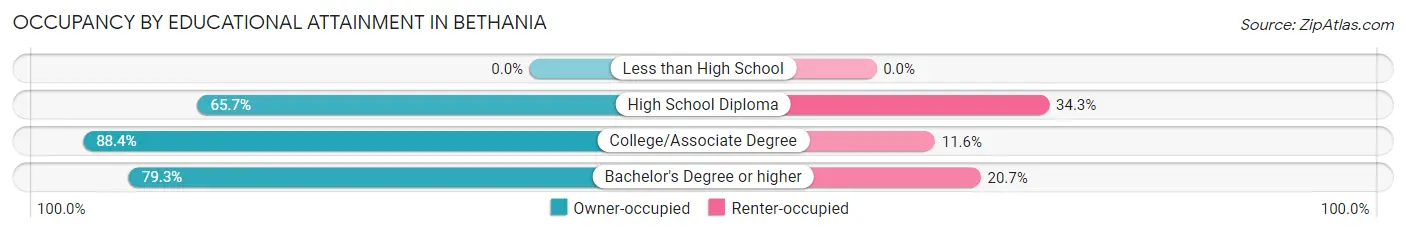
| Household Size | Owner-occupied | Renter-occupied |
| Less than High School | 0 (0.0%) | 0 (0.0%) |
| High School Diploma | 23 (65.7%) | 12 (34.3%) |
| College/Associate Degree | 76 (88.4%) | 10 (11.6%) |
| Bachelor's Degree or higher | 23 (79.3%) | 6 (20.7%) |
Occupancy by Age of Householder in Bethania
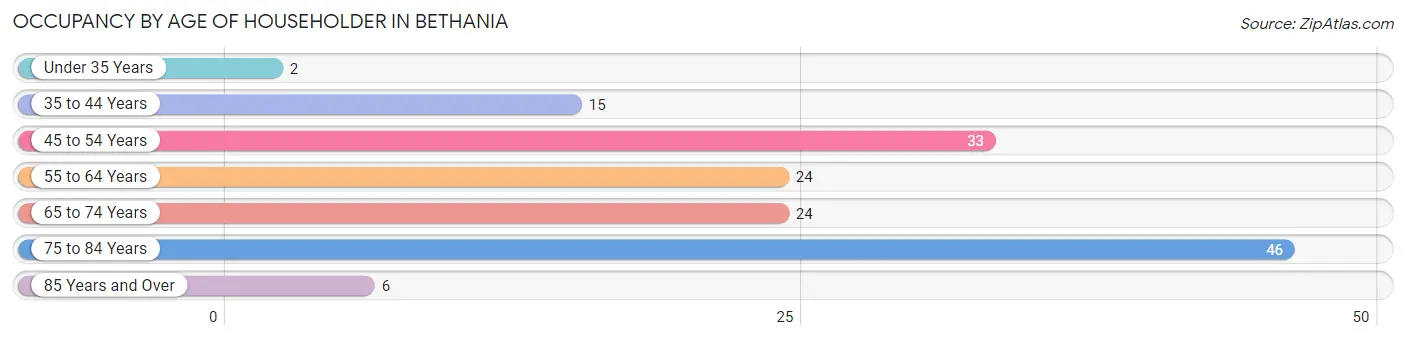
| Age Bracket | # Households | % Households |
| Under 35 Years | 2 | 1.3% |
| 35 to 44 Years | 15 | 10.0% |
| 45 to 54 Years | 33 | 22.0% |
| 55 to 64 Years | 24 | 16.0% |
| 65 to 74 Years | 24 | 16.0% |
| 75 to 84 Years | 46 | 30.7% |
| 85 Years and Over | 6 | 4.0% |
| Total | 150 | 100.0% |
Housing Finances in Bethania
Median Income by Occupancy in Bethania
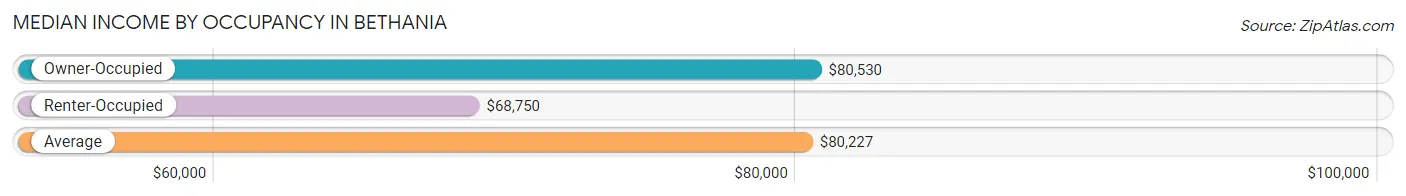
| Occupancy Type | # Households | Median Income |
| Owner-Occupied | 122 (81.3%) | $80,530 |
| Renter-Occupied | 28 (18.7%) | $68,750 |
| Average | 150 (100.0%) | $80,227 |
Occupancy by Householder Income Bracket in Bethania
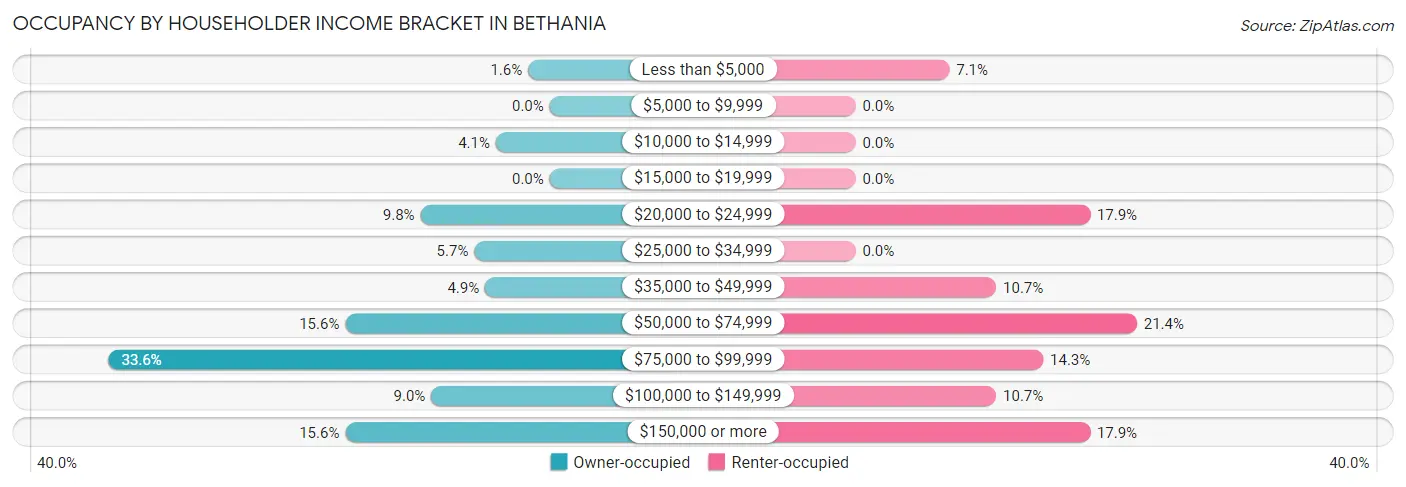
| Income Bracket | Owner-occupied | Renter-occupied |
| Less than $5,000 | 2 (1.6%) | 2 (7.1%) |
| $5,000 to $9,999 | 0 (0.0%) | 0 (0.0%) |
| $10,000 to $14,999 | 5 (4.1%) | 0 (0.0%) |
| $15,000 to $19,999 | 0 (0.0%) | 0 (0.0%) |
| $20,000 to $24,999 | 12 (9.8%) | 5 (17.9%) |
| $25,000 to $34,999 | 7 (5.7%) | 0 (0.0%) |
| $35,000 to $49,999 | 6 (4.9%) | 3 (10.7%) |
| $50,000 to $74,999 | 19 (15.6%) | 6 (21.4%) |
| $75,000 to $99,999 | 41 (33.6%) | 4 (14.3%) |
| $100,000 to $149,999 | 11 (9.0%) | 3 (10.7%) |
| $150,000 or more | 19 (15.6%) | 5 (17.9%) |
| Total | 122 (100.0%) | 28 (100.0%) |
Monthly Housing Cost Tiers in Bethania
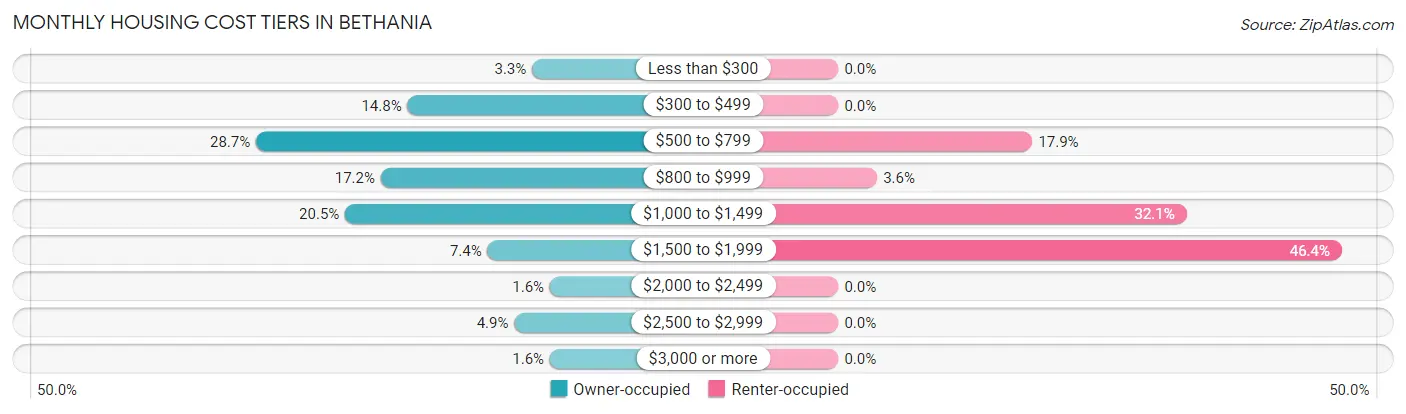
| Monthly Cost | Owner-occupied | Renter-occupied |
| Less than $300 | 4 (3.3%) | 0 (0.0%) |
| $300 to $499 | 18 (14.7%) | 0 (0.0%) |
| $500 to $799 | 35 (28.7%) | 5 (17.9%) |
| $800 to $999 | 21 (17.2%) | 1 (3.6%) |
| $1,000 to $1,499 | 25 (20.5%) | 9 (32.1%) |
| $1,500 to $1,999 | 9 (7.4%) | 13 (46.4%) |
| $2,000 to $2,499 | 2 (1.6%) | 0 (0.0%) |
| $2,500 to $2,999 | 6 (4.9%) | 0 (0.0%) |
| $3,000 or more | 2 (1.6%) | 0 (0.0%) |
| Total | 122 (100.0%) | 28 (100.0%) |
Physical Housing Characteristics in Bethania
Housing Structures in Bethania
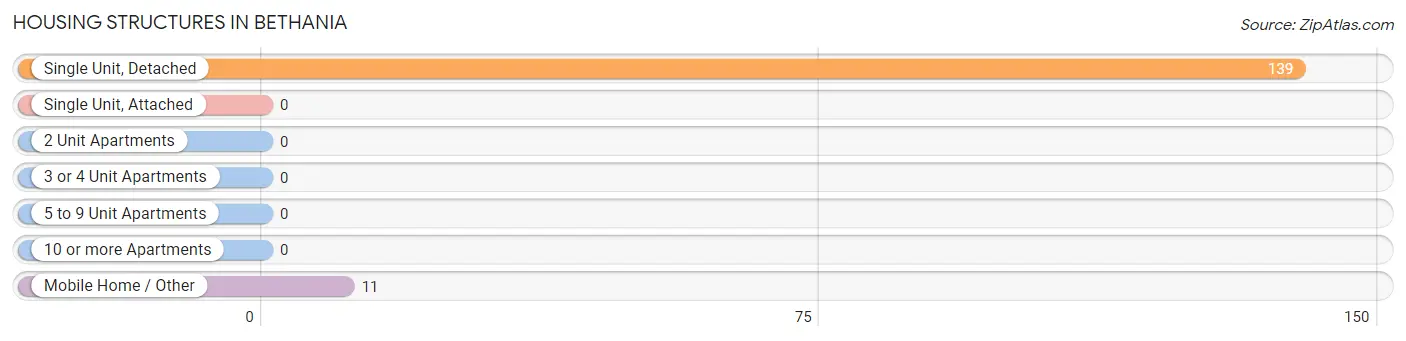
| Structure Type | # Housing Units | % Housing Units |
| Single Unit, Detached | 139 | 92.7% |
| Single Unit, Attached | 0 | 0.0% |
| 2 Unit Apartments | 0 | 0.0% |
| 3 or 4 Unit Apartments | 0 | 0.0% |
| 5 to 9 Unit Apartments | 0 | 0.0% |
| 10 or more Apartments | 0 | 0.0% |
| Mobile Home / Other | 11 | 7.3% |
| Total | 150 | 100.0% |
Housing Structures by Occupancy in Bethania
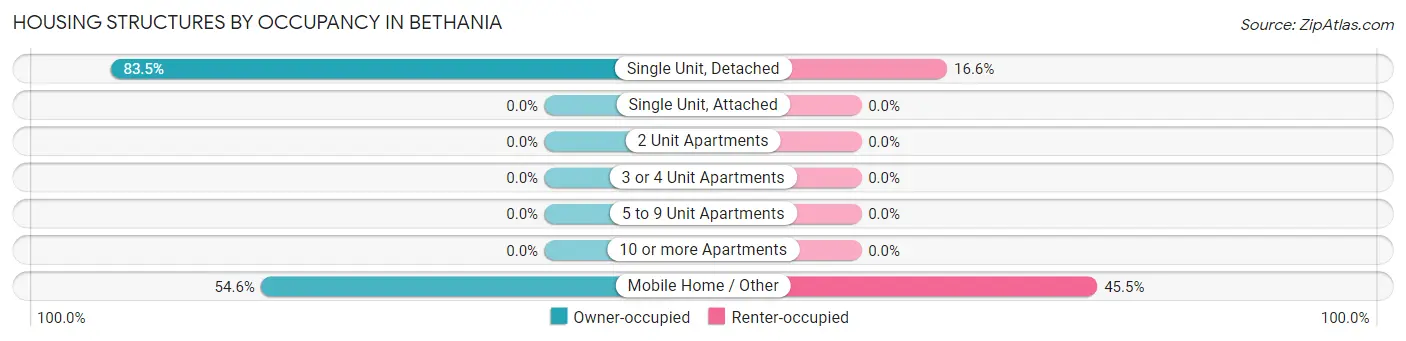
| Structure Type | Owner-occupied | Renter-occupied |
| Single Unit, Detached | 116 (83.5%) | 23 (16.6%) |
| Single Unit, Attached | 0 (0.0%) | 0 (0.0%) |
| 2 Unit Apartments | 0 (0.0%) | 0 (0.0%) |
| 3 or 4 Unit Apartments | 0 (0.0%) | 0 (0.0%) |
| 5 to 9 Unit Apartments | 0 (0.0%) | 0 (0.0%) |
| 10 or more Apartments | 0 (0.0%) | 0 (0.0%) |
| Mobile Home / Other | 6 (54.5%) | 5 (45.5%) |
| Total | 122 (81.3%) | 28 (18.7%) |
Housing Structures by Number of Rooms in Bethania
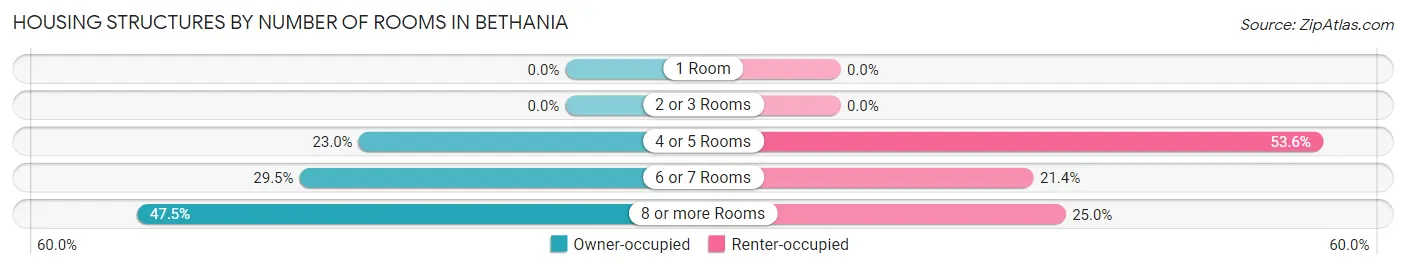
| Number of Rooms | Owner-occupied | Renter-occupied |
| 1 Room | 0 (0.0%) | 0 (0.0%) |
| 2 or 3 Rooms | 0 (0.0%) | 0 (0.0%) |
| 4 or 5 Rooms | 28 (23.0%) | 15 (53.6%) |
| 6 or 7 Rooms | 36 (29.5%) | 6 (21.4%) |
| 8 or more Rooms | 58 (47.5%) | 7 (25.0%) |
| Total | 122 (100.0%) | 28 (100.0%) |
Housing Structure by Heating Type in Bethania
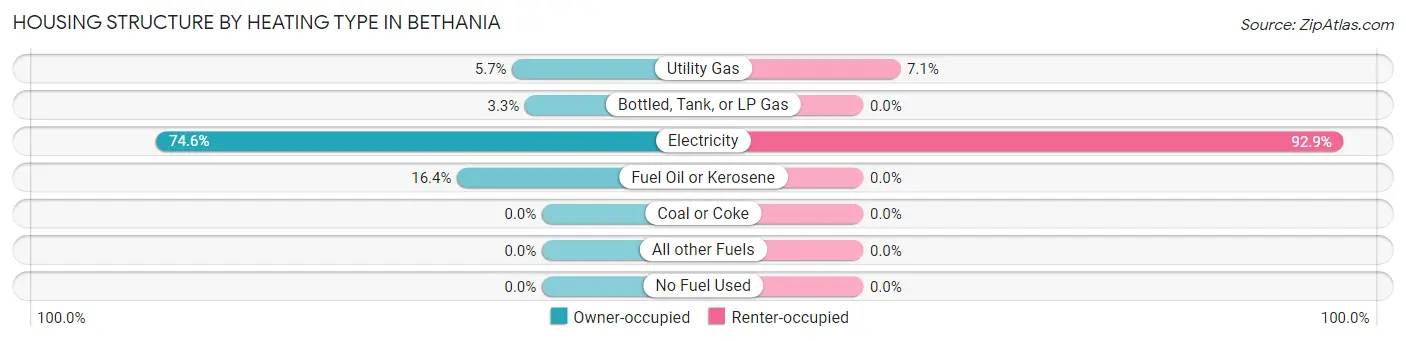
| Heating Type | Owner-occupied | Renter-occupied |
| Utility Gas | 7 (5.7%) | 2 (7.1%) |
| Bottled, Tank, or LP Gas | 4 (3.3%) | 0 (0.0%) |
| Electricity | 91 (74.6%) | 26 (92.9%) |
| Fuel Oil or Kerosene | 20 (16.4%) | 0 (0.0%) |
| Coal or Coke | 0 (0.0%) | 0 (0.0%) |
| All other Fuels | 0 (0.0%) | 0 (0.0%) |
| No Fuel Used | 0 (0.0%) | 0 (0.0%) |
| Total | 122 (100.0%) | 28 (100.0%) |
Household Vehicle Usage in Bethania
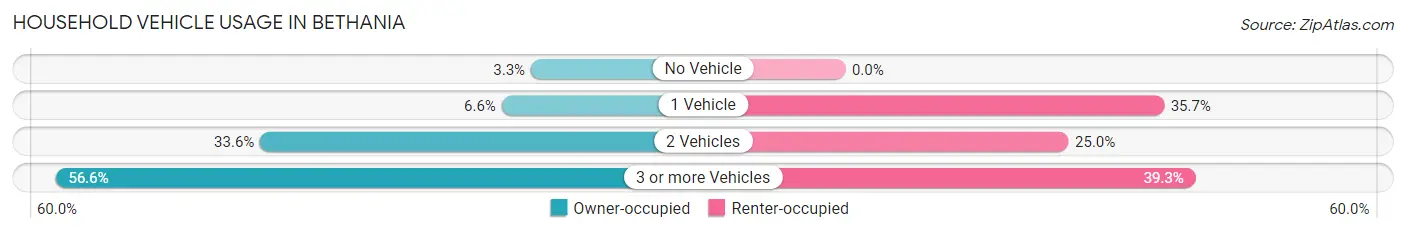
| Vehicles per Household | Owner-occupied | Renter-occupied |
| No Vehicle | 4 (3.3%) | 0 (0.0%) |
| 1 Vehicle | 8 (6.6%) | 10 (35.7%) |
| 2 Vehicles | 41 (33.6%) | 7 (25.0%) |
| 3 or more Vehicles | 69 (56.6%) | 11 (39.3%) |
| Total | 122 (100.0%) | 28 (100.0%) |
Real Estate & Mortgages in Bethania
Real Estate and Mortgage Overview in Bethania
| Characteristic | Without Mortgage | With Mortgage |
| Housing Units | 63 | 59 |
| Median Property Value | $261,500 | $231,900 |
| Median Household Income | $80,947 | $10 |
| Monthly Housing Costs | $529 | $2 |
| Real Estate Taxes | $2,197 | $0 |
Property Value by Mortgage Status in Bethania
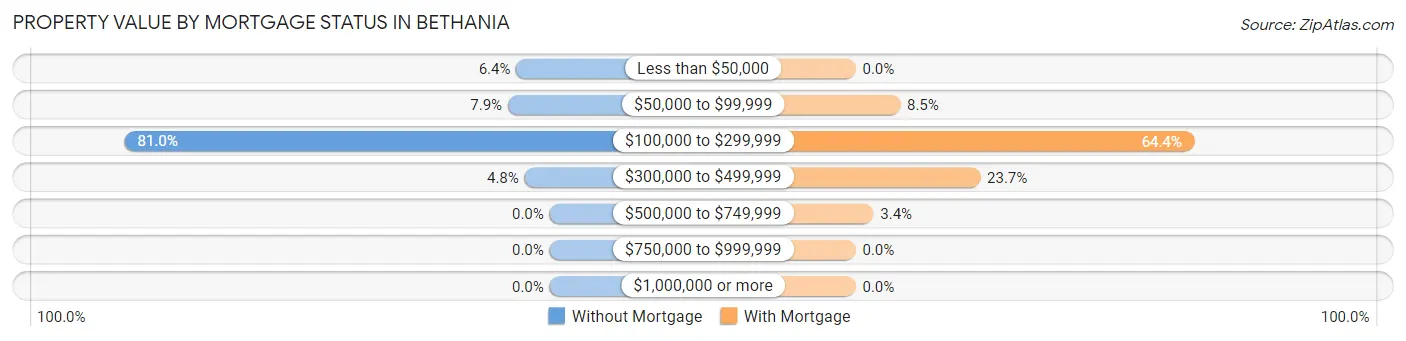
| Property Value | Without Mortgage | With Mortgage |
| Less than $50,000 | 4 (6.4%) | 0 (0.0%) |
| $50,000 to $99,999 | 5 (7.9%) | 5 (8.5%) |
| $100,000 to $299,999 | 51 (80.9%) | 38 (64.4%) |
| $300,000 to $499,999 | 3 (4.8%) | 14 (23.7%) |
| $500,000 to $749,999 | 0 (0.0%) | 2 (3.4%) |
| $750,000 to $999,999 | 0 (0.0%) | 0 (0.0%) |
| $1,000,000 or more | 0 (0.0%) | 0 (0.0%) |
| Total | 63 (100.0%) | 59 (100.0%) |
Household Income by Mortgage Status in Bethania
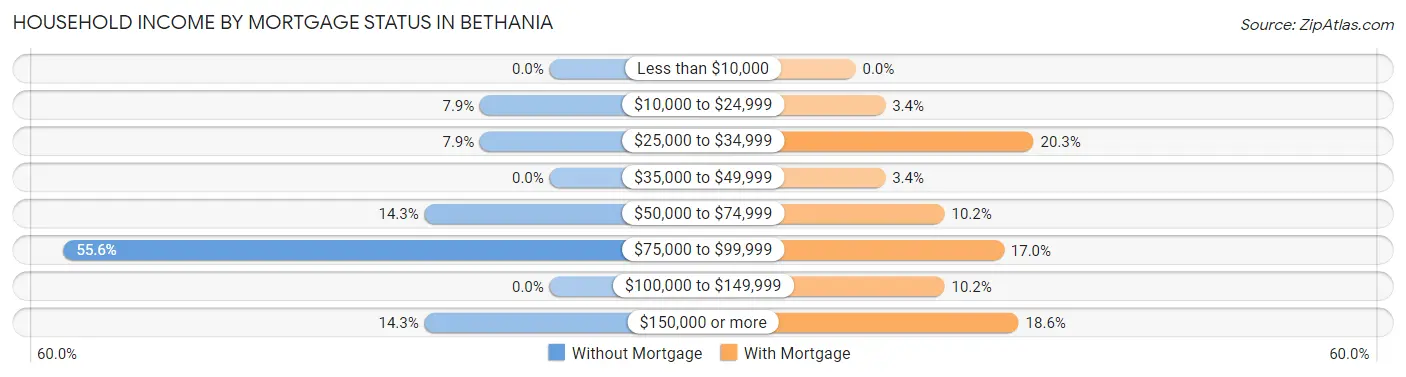
| Household Income | Without Mortgage | With Mortgage |
| Less than $10,000 | 0 (0.0%) | 0 (0.0%) |
| $10,000 to $24,999 | 5 (7.9%) | 2 (3.4%) |
| $25,000 to $34,999 | 5 (7.9%) | 12 (20.3%) |
| $35,000 to $49,999 | 0 (0.0%) | 2 (3.4%) |
| $50,000 to $74,999 | 9 (14.3%) | 6 (10.2%) |
| $75,000 to $99,999 | 35 (55.6%) | 10 (17.0%) |
| $100,000 to $149,999 | 0 (0.0%) | 6 (10.2%) |
| $150,000 or more | 9 (14.3%) | 11 (18.6%) |
| Total | 63 (100.0%) | 59 (100.0%) |
Property Value to Household Income Ratio in Bethania
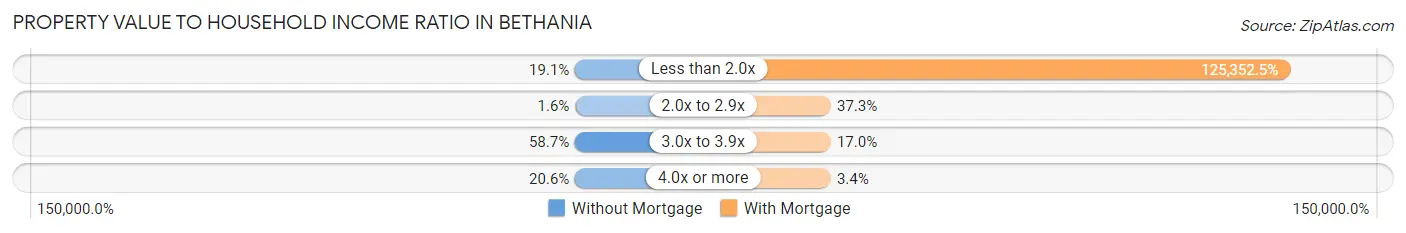
| Value-to-Income Ratio | Without Mortgage | With Mortgage |
| Less than 2.0x | 12 (19.1%) | 73,958 (125,352.5%) |
| 2.0x to 2.9x | 1 (1.6%) | 22 (37.3%) |
| 3.0x to 3.9x | 37 (58.7%) | 10 (17.0%) |
| 4.0x or more | 13 (20.6%) | 2 (3.4%) |
| Total | 63 (100.0%) | 59 (100.0%) |
Real Estate Taxes by Mortgage Status in Bethania
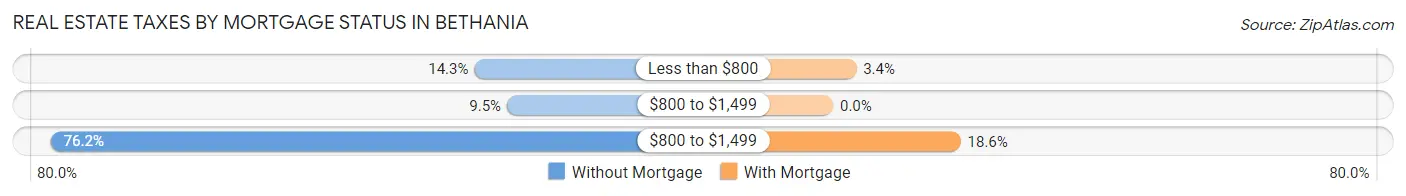
| Property Taxes | Without Mortgage | With Mortgage |
| Less than $800 | 9 (14.3%) | 2 (3.4%) |
| $800 to $1,499 | 6 (9.5%) | 0 (0.0%) |
| $800 to $1,499 | 48 (76.2%) | 11 (18.6%) |
| Total | 63 (100.0%) | 59 (100.0%) |
Health & Disability in Bethania
Health Insurance Coverage by Age in Bethania
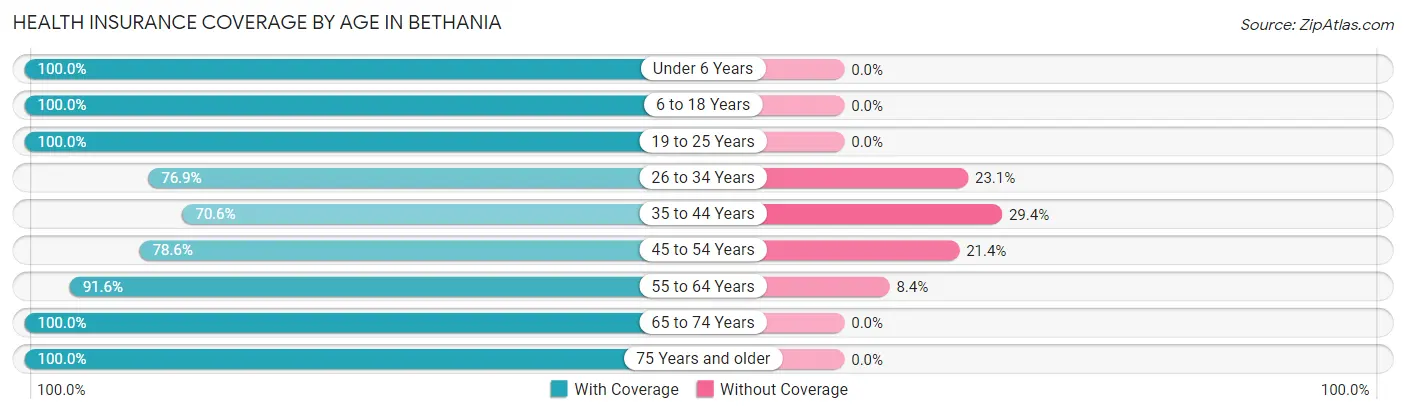
| Age Bracket | With Coverage | Without Coverage |
| Under 6 Years | 4 (100.0%) | 0 (0.0%) |
| 6 to 18 Years | 26 (100.0%) | 0 (0.0%) |
| 19 to 25 Years | 12 (100.0%) | 0 (0.0%) |
| 26 to 34 Years | 10 (76.9%) | 3 (23.1%) |
| 35 to 44 Years | 12 (70.6%) | 5 (29.4%) |
| 45 to 54 Years | 44 (78.6%) | 12 (21.4%) |
| 55 to 64 Years | 87 (91.6%) | 8 (8.4%) |
| 65 to 74 Years | 60 (100.0%) | 0 (0.0%) |
| 75 Years and older | 52 (100.0%) | 0 (0.0%) |
| Total | 307 (91.6%) | 28 (8.4%) |
Health Insurance Coverage by Citizenship Status in Bethania
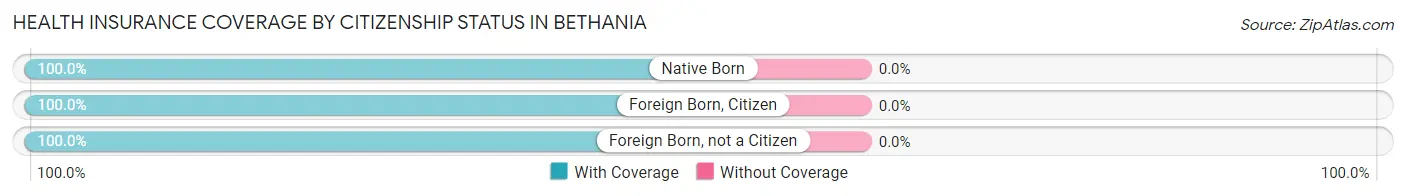
| Citizenship Status | With Coverage | Without Coverage |
| Native Born | 4 (100.0%) | 0 (0.0%) |
| Foreign Born, Citizen | 26 (100.0%) | 0 (0.0%) |
| Foreign Born, not a Citizen | 12 (100.0%) | 0 (0.0%) |
Health Insurance Coverage by Household Income in Bethania
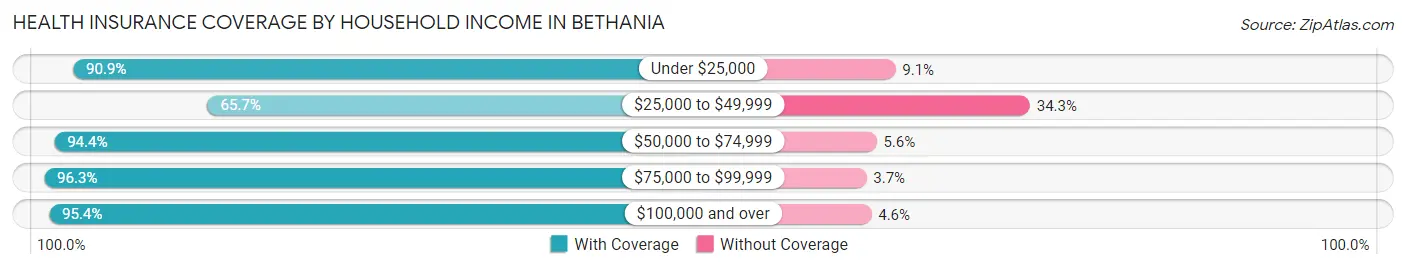
| Household Income | With Coverage | Without Coverage |
| Under $25,000 | 50 (90.9%) | 5 (9.1%) |
| $25,000 to $49,999 | 23 (65.7%) | 12 (34.3%) |
| $50,000 to $74,999 | 51 (94.4%) | 3 (5.6%) |
| $75,000 to $99,999 | 79 (96.3%) | 3 (3.7%) |
| $100,000 and over | 104 (95.4%) | 5 (4.6%) |
Public vs Private Health Insurance Coverage by Age in Bethania
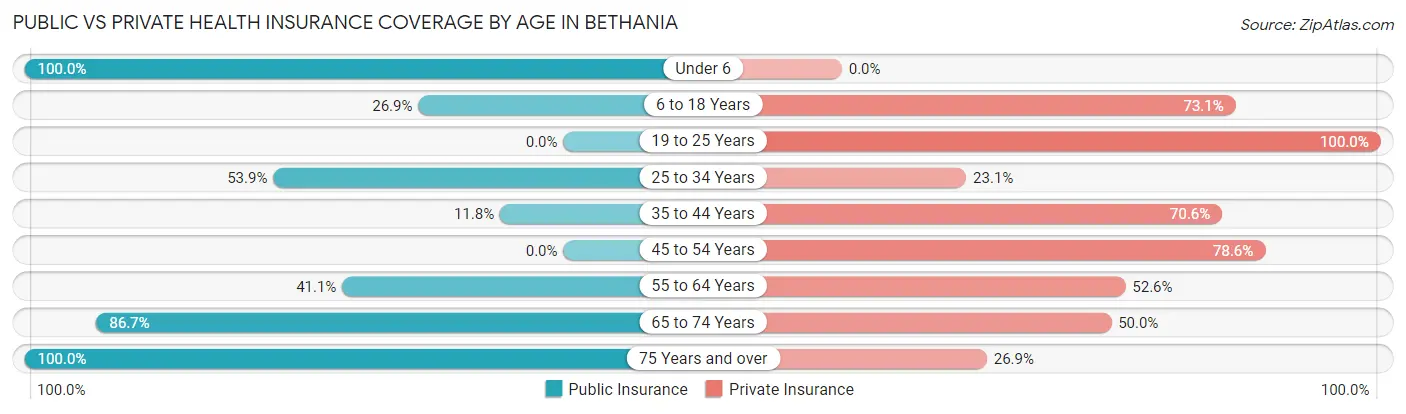
| Age Bracket | Public Insurance | Private Insurance |
| Under 6 | 4 (100.0%) | 0 (0.0%) |
| 6 to 18 Years | 7 (26.9%) | 19 (73.1%) |
| 19 to 25 Years | 0 (0.0%) | 12 (100.0%) |
| 25 to 34 Years | 7 (53.8%) | 3 (23.1%) |
| 35 to 44 Years | 2 (11.8%) | 12 (70.6%) |
| 45 to 54 Years | 0 (0.0%) | 44 (78.6%) |
| 55 to 64 Years | 39 (41.0%) | 50 (52.6%) |
| 65 to 74 Years | 52 (86.7%) | 30 (50.0%) |
| 75 Years and over | 52 (100.0%) | 14 (26.9%) |
| Total | 163 (48.7%) | 184 (54.9%) |
Disability Status by Sex by Age in Bethania
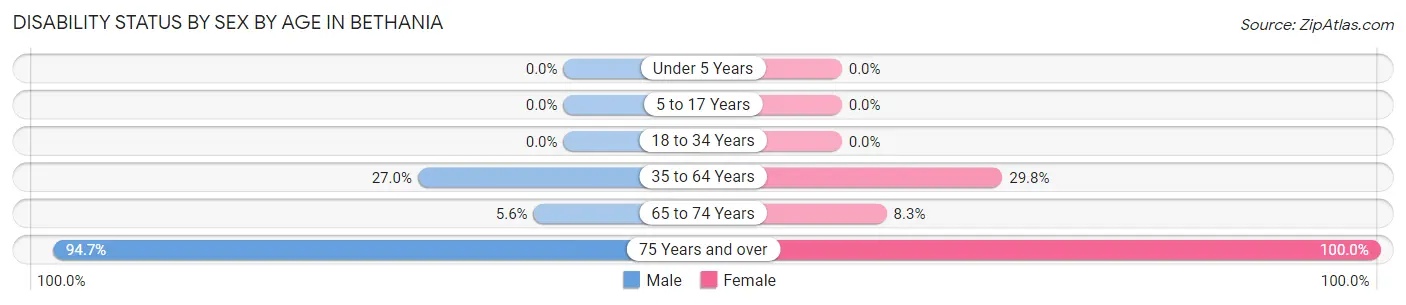
| Age Bracket | Male | Female |
| Under 5 Years | 0 (0.0%) | 0 (0.0%) |
| 5 to 17 Years | 0 (0.0%) | 0 (0.0%) |
| 18 to 34 Years | 0 (0.0%) | 0 (0.0%) |
| 35 to 64 Years | 20 (27.0%) | 28 (29.8%) |
| 65 to 74 Years | 2 (5.6%) | 2 (8.3%) |
| 75 Years and over | 36 (94.7%) | 14 (100.0%) |
Disability Class by Sex by Age in Bethania
Disability Class: Hearing Difficulty
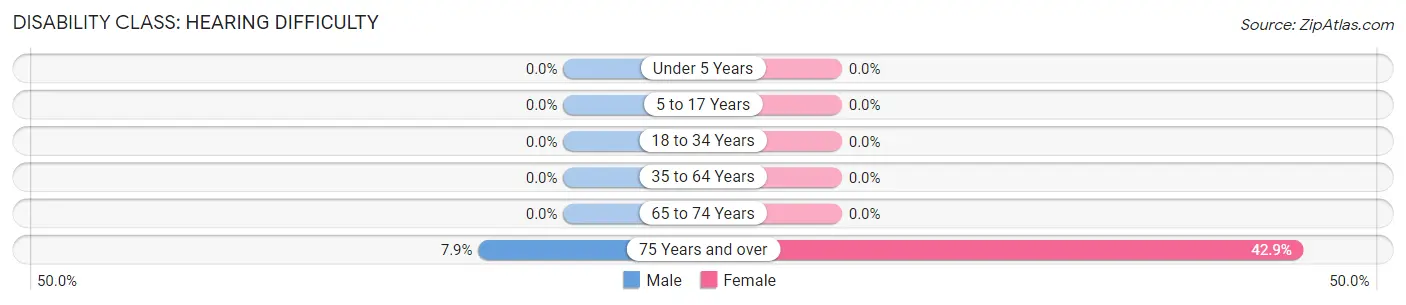
| Age Bracket | Male | Female |
| Under 5 Years | 0 (0.0%) | 0 (0.0%) |
| 5 to 17 Years | 0 (0.0%) | 0 (0.0%) |
| 18 to 34 Years | 0 (0.0%) | 0 (0.0%) |
| 35 to 64 Years | 0 (0.0%) | 0 (0.0%) |
| 65 to 74 Years | 0 (0.0%) | 0 (0.0%) |
| 75 Years and over | 3 (7.9%) | 6 (42.9%) |
Disability Class: Vision Difficulty
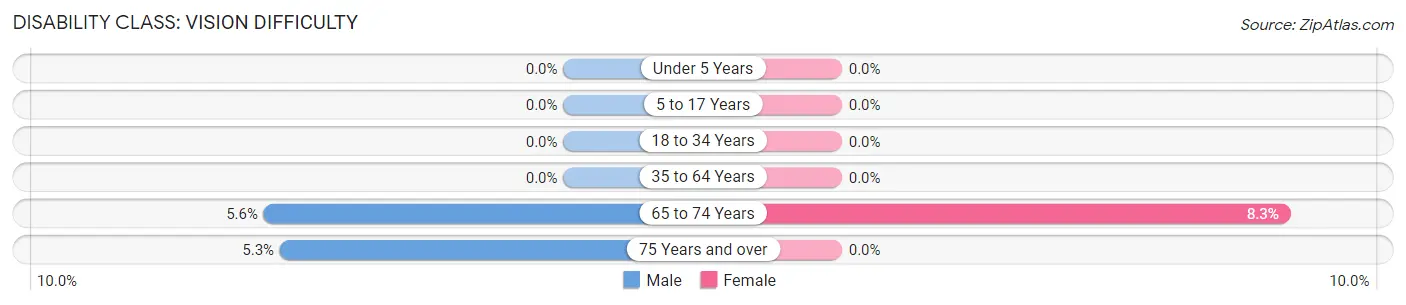
| Age Bracket | Male | Female |
| Under 5 Years | 0 (0.0%) | 0 (0.0%) |
| 5 to 17 Years | 0 (0.0%) | 0 (0.0%) |
| 18 to 34 Years | 0 (0.0%) | 0 (0.0%) |
| 35 to 64 Years | 0 (0.0%) | 0 (0.0%) |
| 65 to 74 Years | 2 (5.6%) | 2 (8.3%) |
| 75 Years and over | 2 (5.3%) | 0 (0.0%) |
Disability Class: Cognitive Difficulty
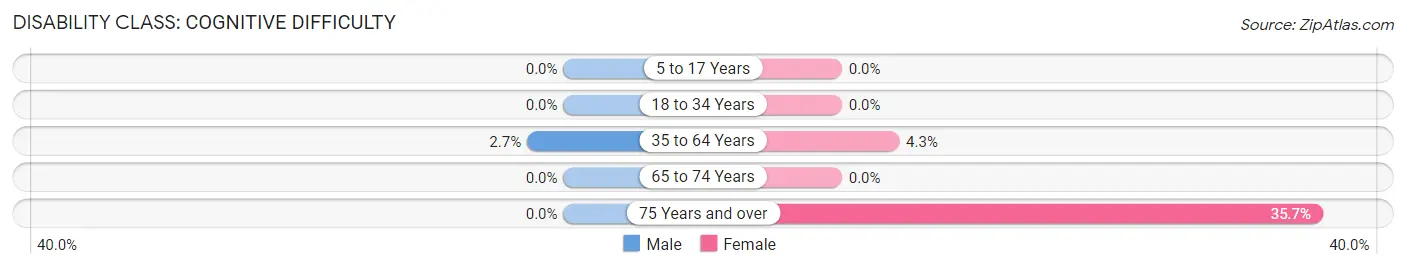
| Age Bracket | Male | Female |
| 5 to 17 Years | 0 (0.0%) | 0 (0.0%) |
| 18 to 34 Years | 0 (0.0%) | 0 (0.0%) |
| 35 to 64 Years | 2 (2.7%) | 4 (4.3%) |
| 65 to 74 Years | 0 (0.0%) | 0 (0.0%) |
| 75 Years and over | 0 (0.0%) | 5 (35.7%) |
Disability Class: Ambulatory Difficulty
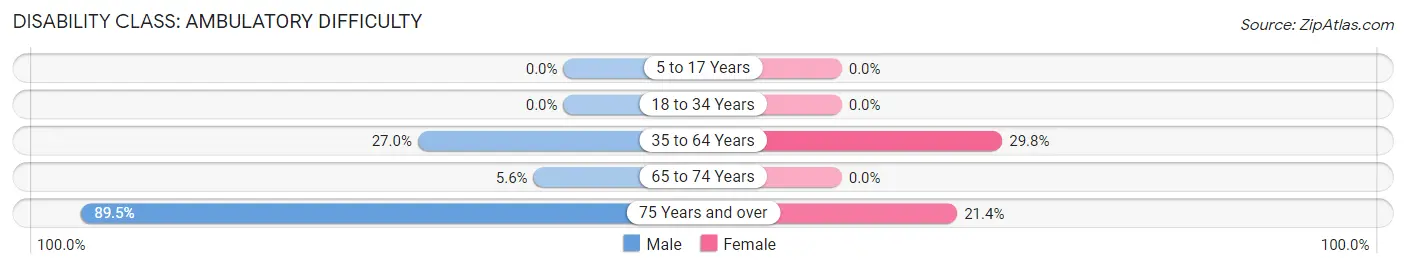
| Age Bracket | Male | Female |
| 5 to 17 Years | 0 (0.0%) | 0 (0.0%) |
| 18 to 34 Years | 0 (0.0%) | 0 (0.0%) |
| 35 to 64 Years | 20 (27.0%) | 28 (29.8%) |
| 65 to 74 Years | 2 (5.6%) | 0 (0.0%) |
| 75 Years and over | 34 (89.5%) | 3 (21.4%) |
Disability Class: Self-Care Difficulty
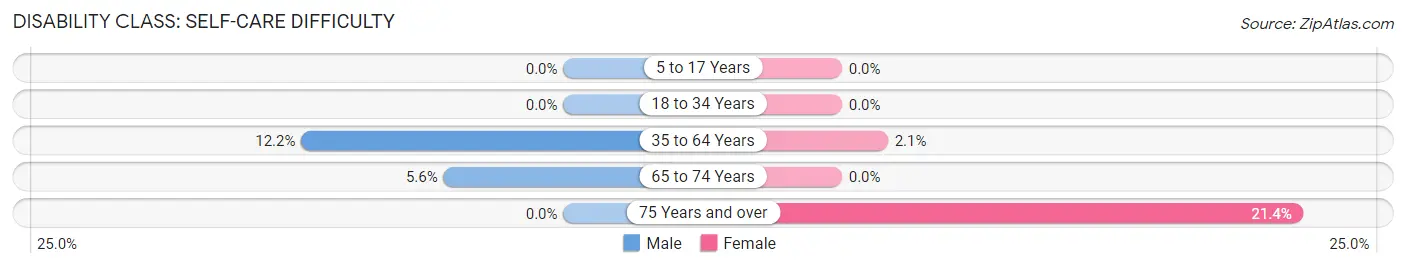
| Age Bracket | Male | Female |
| 5 to 17 Years | 0 (0.0%) | 0 (0.0%) |
| 18 to 34 Years | 0 (0.0%) | 0 (0.0%) |
| 35 to 64 Years | 9 (12.2%) | 2 (2.1%) |
| 65 to 74 Years | 2 (5.6%) | 0 (0.0%) |
| 75 Years and over | 0 (0.0%) | 3 (21.4%) |
Technology Access in Bethania
Computing Device Access in Bethania
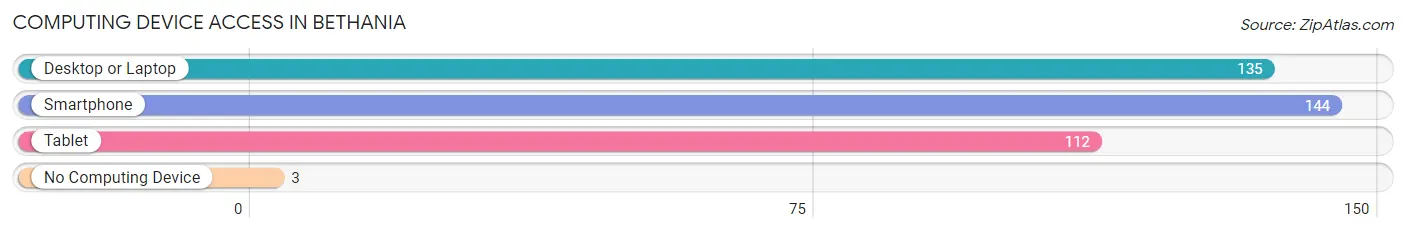
| Device Type | # Households | % Households |
| Desktop or Laptop | 135 | 90.0% |
| Smartphone | 144 | 96.0% |
| Tablet | 112 | 74.7% |
| No Computing Device | 3 | 2.0% |
| Total | 150 | 100.0% |
Internet Access in Bethania
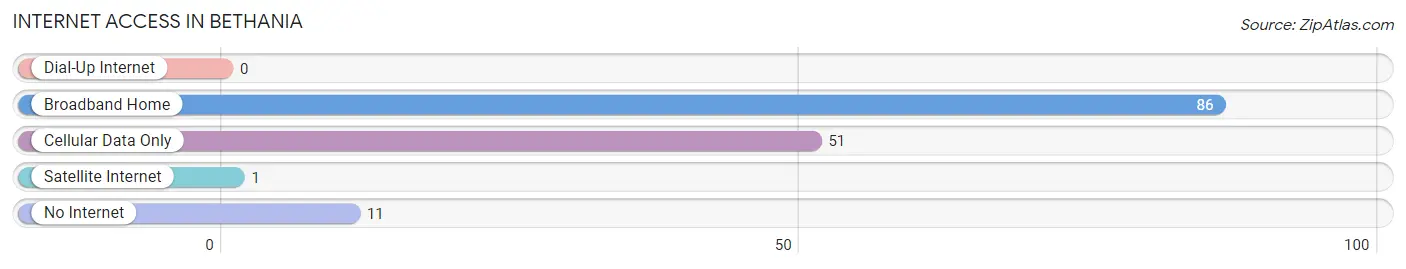
| Internet Type | # Households | % Households |
| Dial-Up Internet | 0 | 0.0% |
| Broadband Home | 86 | 57.3% |
| Cellular Data Only | 51 | 34.0% |
| Satellite Internet | 1 | 0.7% |
| No Internet | 11 | 7.3% |
| Total | 150 | 100.0% |
Bethania Summary
Bethania is a small town located in Forsyth County, North Carolina. It is situated in the foothills of the Blue Ridge Mountains, approximately 20 miles north of Winston-Salem. The town was founded in 1759 by Moravian settlers and is one of the oldest towns in the state.
Geography
Bethania is located in the Piedmont region of North Carolina, in the foothills of the Blue Ridge Mountains. The town is situated on the banks of the Yadkin River, which flows through the town and provides a source of recreation for the locals. The town is surrounded by rolling hills and forests, providing a picturesque backdrop for the town. The town is located approximately 20 miles north of Winston-Salem, and is easily accessible by car or public transportation.
Economy
Bethania has a small but vibrant economy. The town is home to several small businesses, including a grocery store, a hardware store, a restaurant, and a few other small shops. The town also has a few larger employers, such as a manufacturing plant and a medical center. The town is also home to a few wineries, which attract tourists from all over the region.
Demographics
As of the 2010 census, the population of Bethania was 1,845. The town is predominantly white, with a small African American population. The median household income is $45,000, and the median age is 44. The town is home to a large number of retirees, as well as a growing number of young professionals.
History
Bethania was founded in 1759 by Moravian settlers. The town was named after the biblical town of Bethany, and was intended to be a place of refuge for the Moravian settlers. The town quickly grew and became a center of commerce and industry in the region. The town was home to several mills, a tannery, and a distillery. The town was also home to a number of churches, schools, and other institutions.
In the late 19th century, the town began to decline as the railroad bypassed the town and the local industry began to decline. The town was revitalized in the early 20th century, when the town was designated as a historic district. The town has since become a popular tourist destination, with its historic buildings and quaint atmosphere.
Today, Bethania is a small but vibrant town. The town is home to a number of small businesses, as well as a few larger employers. The town is also home to a number of wineries, which attract tourists from all over the region. The town is also home to a number of historic buildings and sites, which attract visitors from all over the world.
Common Questions
What is Per Capita Income in Bethania?
Per Capita income in Bethania is $52,850.
What is the Median Family Income in Bethania?
Median Family Income in Bethania is $72,500.
What is the Median Household income in Bethania?
Median Household Income in Bethania is $80,227.
What is Inequality or Gini Index in Bethania?
Inequality or Gini Index in Bethania is 0.50.
What is the Total Population of Bethania?
Total Population of Bethania is 335.
What is the Total Male Population of Bethania?
Total Male Population of Bethania is 183.
What is the Total Female Population of Bethania?
Total Female Population of Bethania is 152.
What is the Ratio of Males per 100 Females in Bethania?
There are 120.39 Males per 100 Females in Bethania.
What is the Ratio of Females per 100 Males in Bethania?
There are 83.06 Females per 100 Males in Bethania.
What is the Median Population Age in Bethania?
Median Population Age in Bethania is 58.4 Years.
What is the Average Family Size in Bethania
Average Family Size in Bethania is 2.7 People.
What is the Average Household Size in Bethania
Average Household Size in Bethania is 2.2 People.
How Large is the Labor Force in Bethania?
There are 134 People in the Labor Forcein in Bethania.
What is the Percentage of People in the Labor Force in Bethania?
43.1% of People are in the Labor Force in Bethania.
What is the Unemployment Rate in Bethania?
Unemployment Rate in Bethania is 3.7%.