Zip Codes with the Highest Percentage of Population Employed in Legal Services & Support in O Fallon, MO
RELATED REPORTS & OPTIONS
Legal Services & Support
O Fallon
Compare Zip Codes
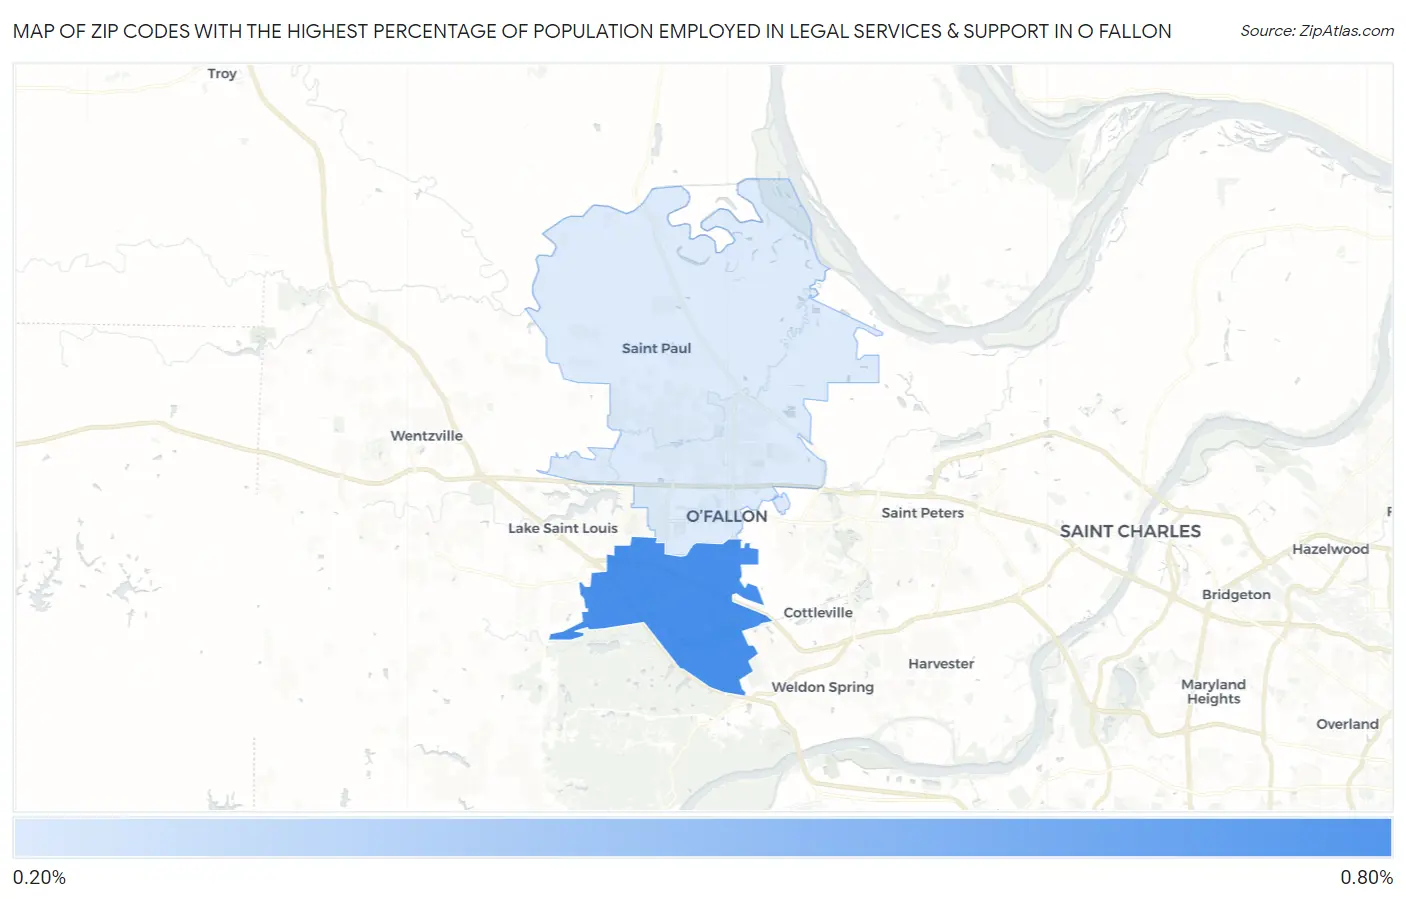
Map of Zip Codes with the Highest Percentage of Population Employed in Legal Services & Support in O Fallon
0.25%
0.78%
Zip Codes with the Highest Percentage of Population Employed in Legal Services & Support in O Fallon, MO
| Zip Code | % Employed | vs State | vs National | |
| 1. | 63368 | 0.78% | 0.99%(-0.210)#208 | 1.2%(-0.404)#9,639 |
| 2. | 63366 | 0.25% | 0.99%(-0.736)#356 | 1.2%(-0.930)#15,580 |
1
Common Questions
What are the Top Zip Codes with the Highest Percentage of Population Employed in Legal Services & Support in O Fallon, MO?
Top Zip Codes with the Highest Percentage of Population Employed in Legal Services & Support in O Fallon, MO are:
What zip code has the Highest Percentage of Population Employed in Legal Services & Support in O Fallon, MO?
63368 has the Highest Percentage of Population Employed in Legal Services & Support in O Fallon, MO with 0.78%.
What is the Percentage of Population Employed in Legal Services & Support in O Fallon, MO?
Percentage of Population Employed in Legal Services & Support in O Fallon is 0.48%.
What is the Percentage of Population Employed in Legal Services & Support in Missouri?
Percentage of Population Employed in Legal Services & Support in Missouri is 0.99%.
What is the Percentage of Population Employed in Legal Services & Support in the United States?
Percentage of Population Employed in Legal Services & Support in the United States is 1.2%.