St James, MO Map & Demographics
St James Map
St James Overview
$23,646
PER CAPITA INCOME
$53,148
AVG FAMILY INCOME
$50,730
AVG HOUSEHOLD INCOME
34.5%
WAGE / INCOME GAP [ % ]
65.5¢/ $1
WAGE / INCOME GAP [ $ ]
0.42
INEQUALITY / GINI INDEX
3,942
TOTAL POPULATION
1,921
MALE POPULATION
2,021
FEMALE POPULATION
95.05
MALES / 100 FEMALES
105.21
FEMALES / 100 MALES
37.2
MEDIAN AGE
2.8
AVG FAMILY SIZE
2.3
AVG HOUSEHOLD SIZE
1,683
LABOR FORCE [ PEOPLE ]
56.3%
PERCENT IN LABOR FORCE
6.4%
UNEMPLOYMENT RATE
Income in St James
Income Overview in St James
Per Capita Income in St James is $23,646, while median incomes of families and households are $53,148 and $50,730 respectively.
| Characteristic | Number | Measure |
| Per Capita Income | 3,942 | $23,646 |
| Median Family Income | 1,116 | $53,148 |
| Mean Family Income | 1,116 | $67,983 |
| Median Household Income | 1,602 | $50,730 |
| Mean Household Income | 1,602 | $56,700 |
| Income Deficit | 1,116 | $0 |
| Wage / Income Gap (%) | 3,942 | 34.50% |
| Wage / Income Gap ($) | 3,942 | 65.50¢ per $1 |
| Gini / Inequality Index | 3,942 | 0.42 |
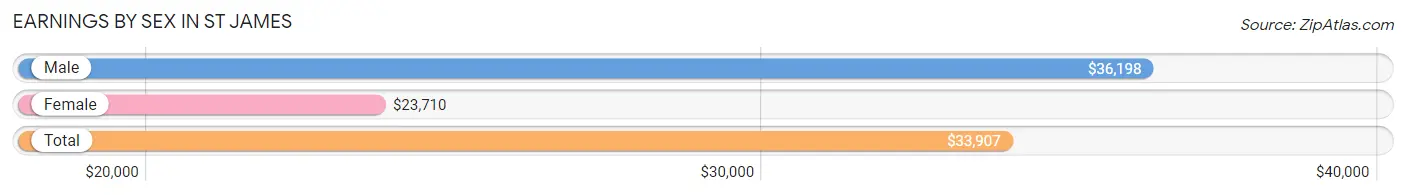
Earnings by Sex in St James
Average Earnings in St James are $33,907, $36,198 for men and $23,710 for women, a difference of 34.5%.
| Sex | Number | Average Earnings |
| Male | 934 (54.7%) | $36,198 |
| Female | 774 (45.3%) | $23,710 |
| Total | 1,708 (100.0%) | $33,907 |
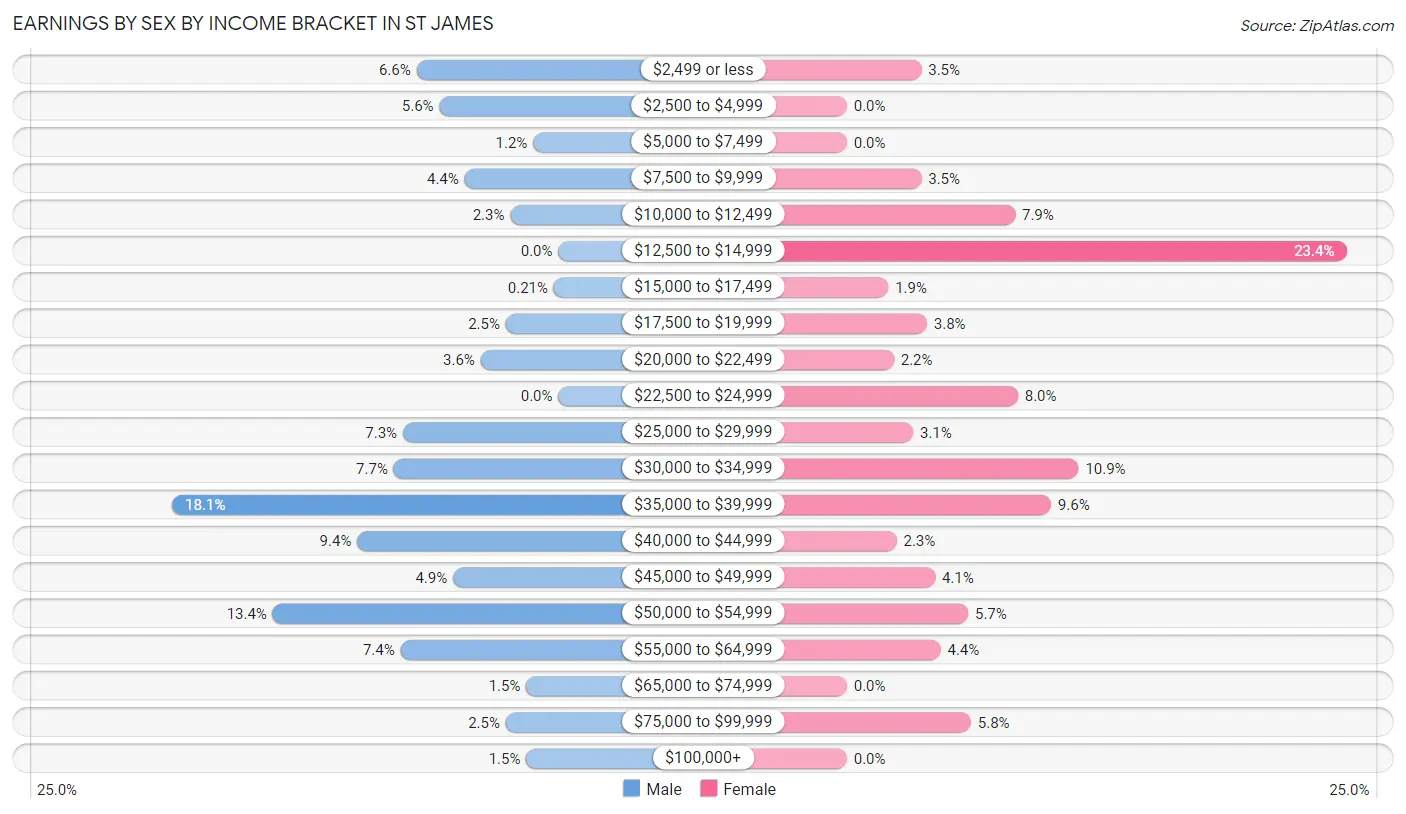
Earnings by Sex by Income Bracket in St James
The most common earnings brackets in St James are $35,000 to $39,999 for men (169 | 18.1%) and $12,500 to $14,999 for women (181 | 23.4%).
| Income | Male | Female |
| $2,499 or less | 62 (6.6%) | 27 (3.5%) |
| $2,500 to $4,999 | 52 (5.6%) | 0 (0.0%) |
| $5,000 to $7,499 | 11 (1.2%) | 0 (0.0%) |
| $7,500 to $9,999 | 41 (4.4%) | 27 (3.5%) |
| $10,000 to $12,499 | 21 (2.2%) | 61 (7.9%) |
| $12,500 to $14,999 | 0 (0.0%) | 181 (23.4%) |
| $15,000 to $17,499 | 2 (0.2%) | 15 (1.9%) |
| $17,500 to $19,999 | 23 (2.5%) | 29 (3.7%) |
| $20,000 to $22,499 | 34 (3.6%) | 17 (2.2%) |
| $22,500 to $24,999 | 0 (0.0%) | 62 (8.0%) |
| $25,000 to $29,999 | 68 (7.3%) | 24 (3.1%) |
| $30,000 to $34,999 | 72 (7.7%) | 84 (10.8%) |
| $35,000 to $39,999 | 169 (18.1%) | 74 (9.6%) |
| $40,000 to $44,999 | 88 (9.4%) | 18 (2.3%) |
| $45,000 to $49,999 | 46 (4.9%) | 32 (4.1%) |
| $50,000 to $54,999 | 125 (13.4%) | 44 (5.7%) |
| $55,000 to $64,999 | 69 (7.4%) | 34 (4.4%) |
| $65,000 to $74,999 | 14 (1.5%) | 0 (0.0%) |
| $75,000 to $99,999 | 23 (2.5%) | 45 (5.8%) |
| $100,000+ | 14 (1.5%) | 0 (0.0%) |
| Total | 934 (100.0%) | 774 (100.0%) |
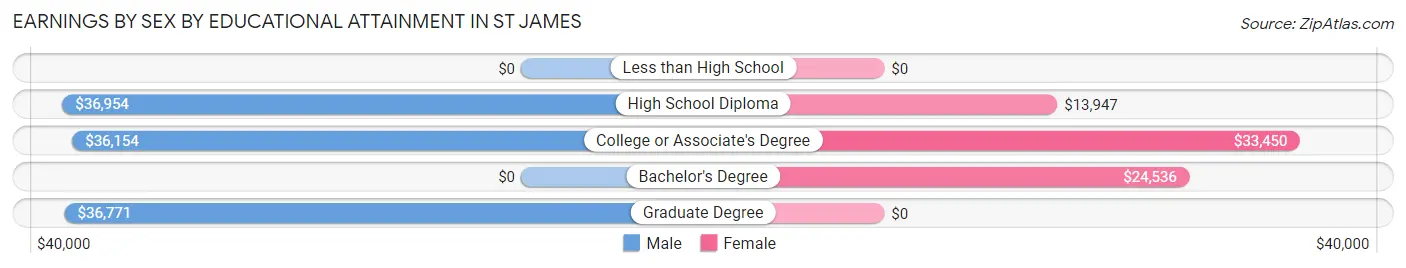
Earnings by Sex by Educational Attainment in St James
Average earnings in St James are $36,975 for men and $24,617 for women, a difference of 33.4%. Men with an educational attainment of high school diploma enjoy the highest average annual earnings of $36,954, while those with college or associate's degree education earn the least with $36,154. Women with an educational attainment of college or associate's degree earn the most with the average annual earnings of $33,450, while those with high school diploma education have the smallest earnings of $13,947.
| Educational Attainment | Male Income | Female Income |
| Less than High School | - | - |
| High School Diploma | $36,954 | $13,947 |
| College or Associate's Degree | $36,154 | $33,450 |
| Bachelor's Degree | - | - |
| Graduate Degree | $36,771 | $0 |
| Total | $36,975 | $24,617 |
Family Income in St James
Family Income Brackets in St James
According to the St James family income data, there are 396 families falling into the $50,000 to $74,999 income range, which is the most common income bracket and makes up 35.5% of all families.
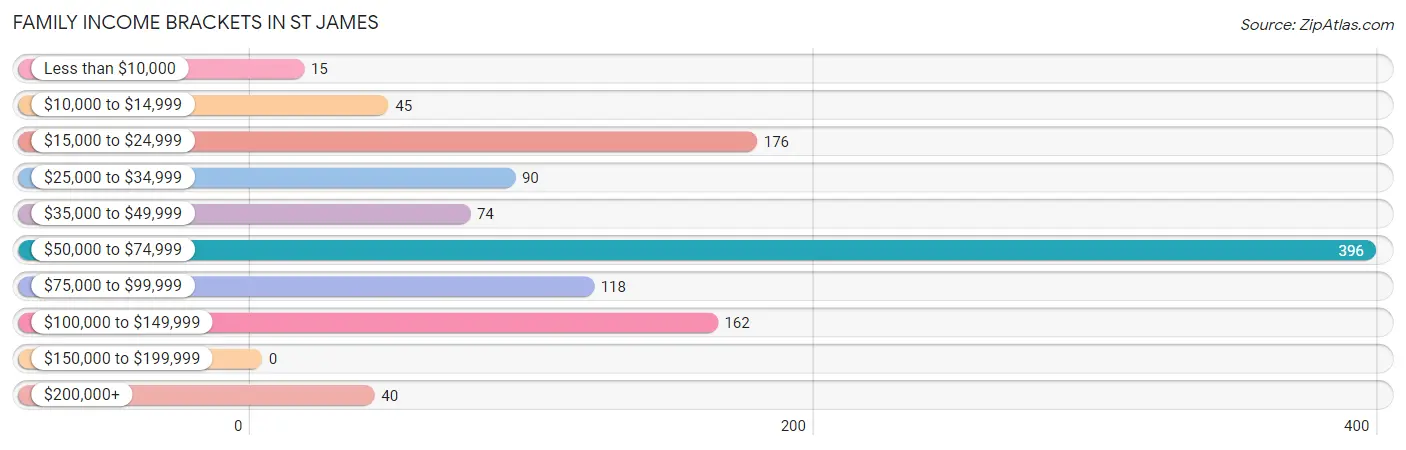
| Income Bracket | # Families | % Families |
| Less than $10,000 | 15 | 1.3% |
| $10,000 to $14,999 | 45 | 4.0% |
| $15,000 to $24,999 | 176 | 15.8% |
| $25,000 to $34,999 | 90 | 8.1% |
| $35,000 to $49,999 | 74 | 6.6% |
| $50,000 to $74,999 | 396 | 35.5% |
| $75,000 to $99,999 | 118 | 10.6% |
| $100,000 to $149,999 | 162 | 14.5% |
| $150,000 to $199,999 | 0 | 0.0% |
| $200,000+ | 40 | 3.6% |
Family Income by Famaliy Size in St James
4-person families (182 | 16.3%) account for the highest median family income in St James with $79,412 per family, while 2-person families (657 | 58.9%) have the highest median income of $25,656 per family member.
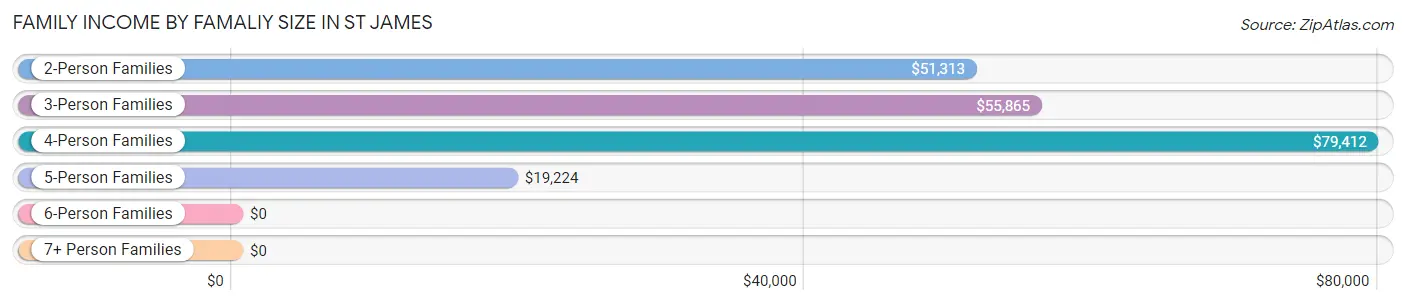
| Income Bracket | # Families | Median Income |
| 2-Person Families | 657 (58.9%) | $51,313 |
| 3-Person Families | 206 (18.5%) | $55,865 |
| 4-Person Families | 182 (16.3%) | $79,412 |
| 5-Person Families | 40 (3.6%) | $19,224 |
| 6-Person Families | 14 (1.3%) | $0 |
| 7+ Person Families | 17 (1.5%) | $0 |
| Total | 1,116 (100.0%) | $53,148 |
Family Income by Number of Earners in St James
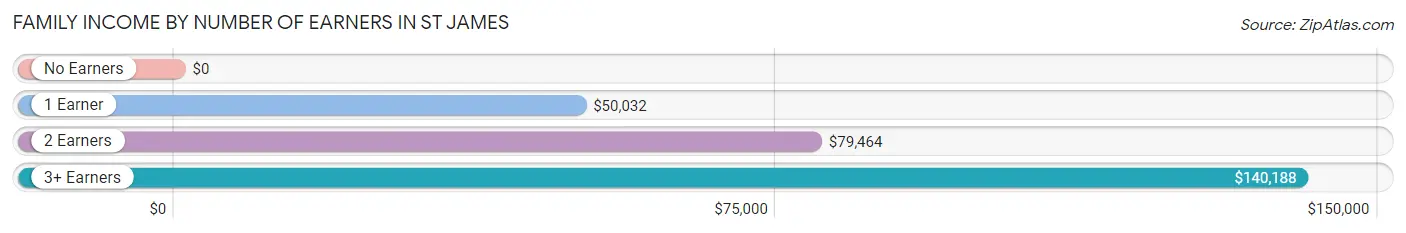
| Number of Earners | # Families | Median Income |
| No Earners | 197 (17.6%) | $0 |
| 1 Earner | 537 (48.1%) | $50,032 |
| 2 Earners | 345 (30.9%) | $79,464 |
| 3+ Earners | 37 (3.3%) | $140,188 |
| Total | 1,116 (100.0%) | $53,148 |
Household Income in St James
Household Income Brackets in St James
With 501 households falling in the category, the $50,000 to $74,999 income range is the most frequent in St James, accounting for 31.3% of all households.
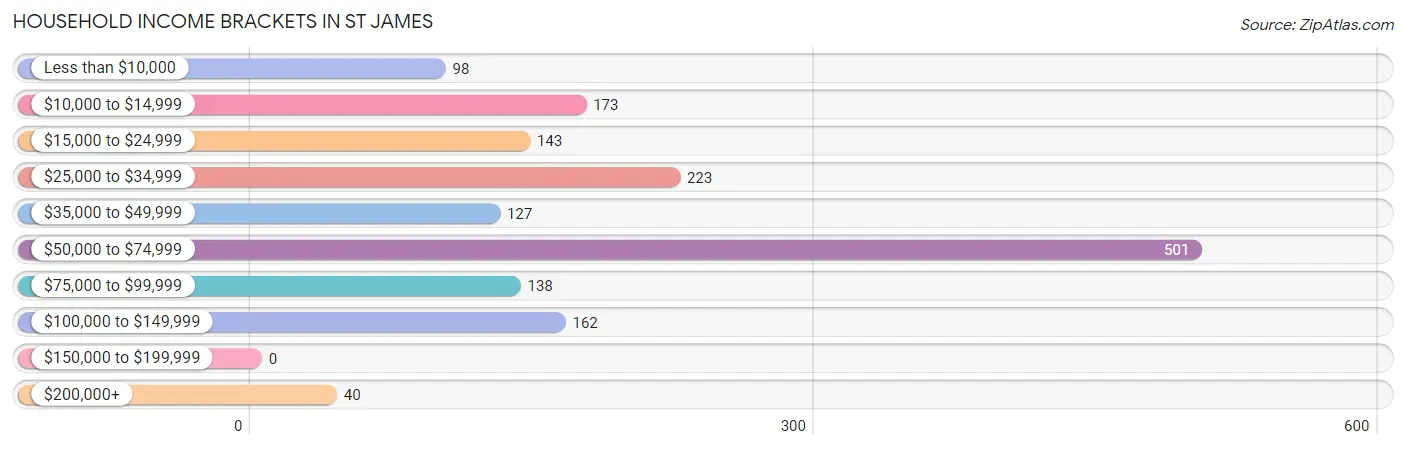
| Income Bracket | # Households | % Households |
| Less than $10,000 | 98 | 6.1% |
| $10,000 to $14,999 | 173 | 10.8% |
| $15,000 to $24,999 | 143 | 8.9% |
| $25,000 to $34,999 | 223 | 13.9% |
| $35,000 to $49,999 | 127 | 7.9% |
| $50,000 to $74,999 | 501 | 31.3% |
| $75,000 to $99,999 | 138 | 8.6% |
| $100,000 to $149,999 | 162 | 10.1% |
| $150,000 to $199,999 | 0 | 0.0% |
| $200,000+ | 40 | 2.5% |
Household Income by Householder Age in St James
The median household income in St James is $50,730, with the highest median household income of $52,535 found in the 45 to 64 years age bracket for the primary householder. A total of 424 households (26.5%) fall into this category. Meanwhile, the 15 to 24 years age bracket for the primary householder has the lowest median household income of $0, with 136 households (8.5%) in this group.
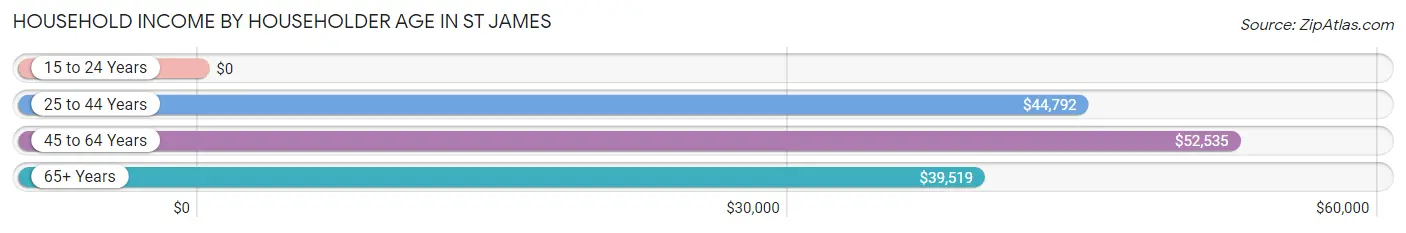
| Income Bracket | # Households | Median Income |
| 15 to 24 Years | 136 (8.5%) | $0 |
| 25 to 44 Years | 561 (35.0%) | $44,792 |
| 45 to 64 Years | 424 (26.5%) | $52,535 |
| 65+ Years | 481 (30.0%) | $39,519 |
| Total | 1,602 (100.0%) | $50,730 |
Poverty in St James
Income Below Poverty by Sex and Age in St James
With 13.1% poverty level for males and 25.8% for females among the residents of St James, 25 to 34 year old males and 6 to 11 year old females are the most vulnerable to poverty, with 69 males (34.5%) and 68 females (57.6%) in their respective age groups living below the poverty level.
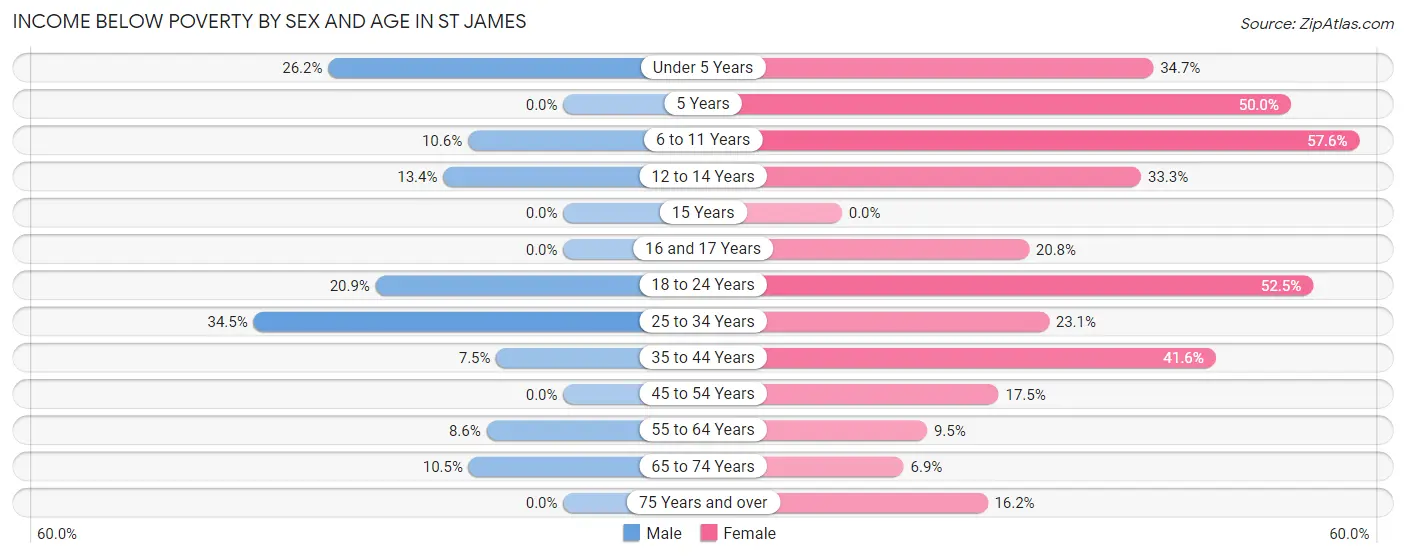
| Age Bracket | Male | Female |
| Under 5 Years | 61 (26.2%) | 43 (34.7%) |
| 5 Years | 0 (0.0%) | 11 (50.0%) |
| 6 to 11 Years | 17 (10.6%) | 68 (57.6%) |
| 12 to 14 Years | 23 (13.4%) | 20 (33.3%) |
| 15 Years | 0 (0.0%) | 0 (0.0%) |
| 16 and 17 Years | 0 (0.0%) | 5 (20.8%) |
| 18 to 24 Years | 28 (20.9%) | 74 (52.5%) |
| 25 to 34 Years | 69 (34.5%) | 74 (23.1%) |
| 35 to 44 Years | 10 (7.5%) | 102 (41.6%) |
| 45 to 54 Years | 0 (0.0%) | 22 (17.5%) |
| 55 to 64 Years | 10 (8.6%) | 26 (9.5%) |
| 65 to 74 Years | 12 (10.5%) | 15 (6.9%) |
| 75 Years and over | 0 (0.0%) | 36 (16.2%) |
| Total | 230 (13.1%) | 496 (25.8%) |
Income Above Poverty by Sex and Age in St James
According to the poverty statistics in St James, males aged 16 and 17 years and females aged 15 years are the age groups that are most secure financially, with 100.0% of males and 100.0% of females in these age groups living above the poverty line.
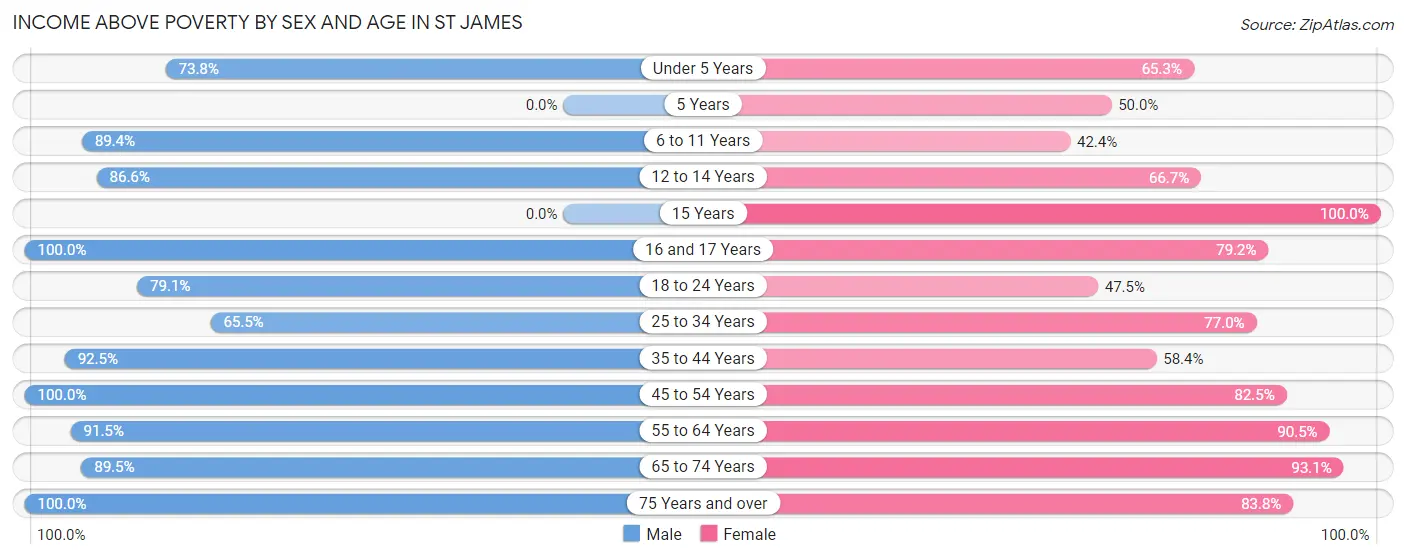
| Age Bracket | Male | Female |
| Under 5 Years | 172 (73.8%) | 81 (65.3%) |
| 5 Years | 0 (0.0%) | 11 (50.0%) |
| 6 to 11 Years | 143 (89.4%) | 50 (42.4%) |
| 12 to 14 Years | 149 (86.6%) | 40 (66.7%) |
| 15 Years | 0 (0.0%) | 29 (100.0%) |
| 16 and 17 Years | 57 (100.0%) | 19 (79.2%) |
| 18 to 24 Years | 106 (79.1%) | 67 (47.5%) |
| 25 to 34 Years | 131 (65.5%) | 247 (76.9%) |
| 35 to 44 Years | 124 (92.5%) | 143 (58.4%) |
| 45 to 54 Years | 274 (100.0%) | 104 (82.5%) |
| 55 to 64 Years | 107 (91.4%) | 248 (90.5%) |
| 65 to 74 Years | 102 (89.5%) | 203 (93.1%) |
| 75 Years and over | 164 (100.0%) | 186 (83.8%) |
| Total | 1,529 (86.9%) | 1,428 (74.2%) |
Income Below Poverty Among Married-Couple Families in St James
The poverty statistics for married-couple families in St James show that 9.4% or 67 of the total 712 families live below the poverty line. Families with 5 or more children have the highest poverty rate of 100.0%, comprising of 15 families. On the other hand, families with no children have the lowest poverty rate of 0.0%, which includes 0 families.
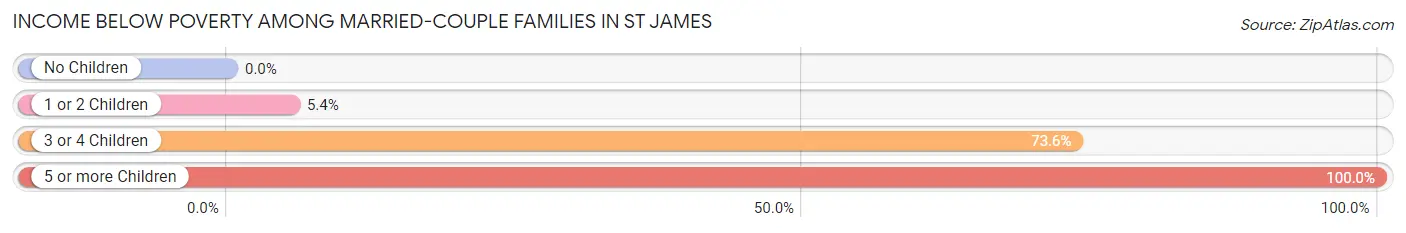
| Children | Above Poverty | Below Poverty |
| No Children | 403 (100.0%) | 0 (0.0%) |
| 1 or 2 Children | 228 (94.6%) | 13 (5.4%) |
| 3 or 4 Children | 14 (26.4%) | 39 (73.6%) |
| 5 or more Children | 0 (0.0%) | 15 (100.0%) |
| Total | 645 (90.6%) | 67 (9.4%) |
Income Below Poverty Among Single-Parent Households in St James
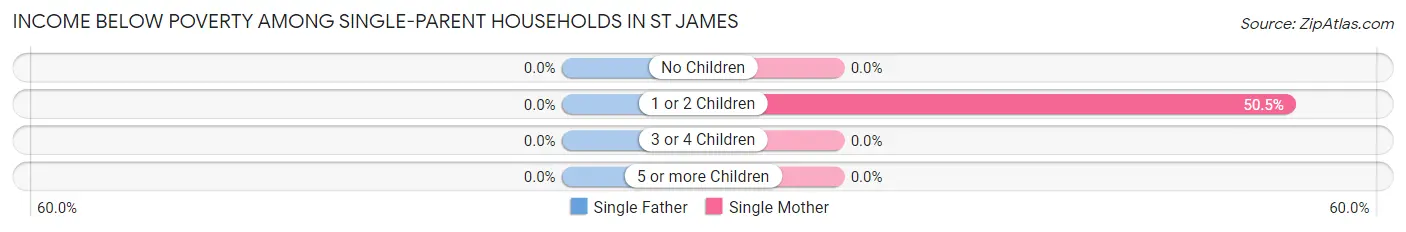
| Children | Single Father | Single Mother |
| No Children | 0 (0.0%) | 0 (0.0%) |
| 1 or 2 Children | 0 (0.0%) | 100 (50.5%) |
| 3 or 4 Children | 0 (0.0%) | 0 (0.0%) |
| 5 or more Children | 0 (0.0%) | 0 (0.0%) |
| Total | 0 (0.0%) | 100 (33.8%) |
Income Below Poverty Among Married-Couple vs Single-Parent Households in St James
The poverty data for St James shows that 67 of the married-couple family households (9.4%) and 100 of the single-parent households (24.7%) are living below the poverty level. Within the married-couple family households, those with 5 or more children have the highest poverty rate, with 15 households (100.0%) falling below the poverty line. Among the single-parent households, those with 1 or 2 children have the highest poverty rate, with 100 household (42.9%) living below poverty.
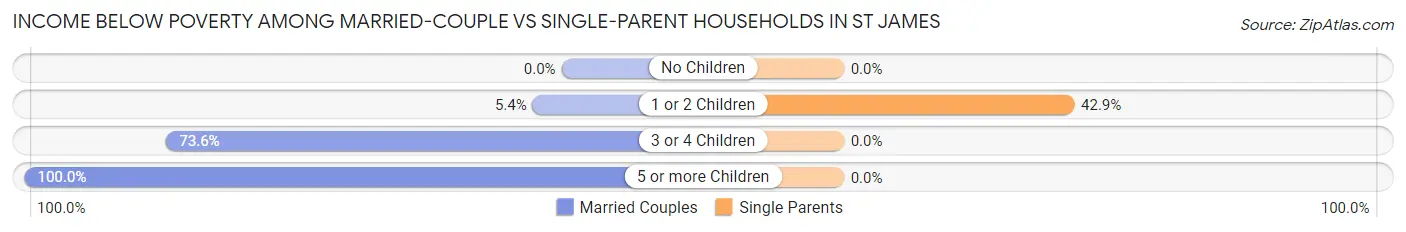
| Children | Married-Couple Families | Single-Parent Households |
| No Children | 0 (0.0%) | 0 (0.0%) |
| 1 or 2 Children | 13 (5.4%) | 100 (42.9%) |
| 3 or 4 Children | 39 (73.6%) | 0 (0.0%) |
| 5 or more Children | 15 (100.0%) | 0 (0.0%) |
| Total | 67 (9.4%) | 100 (24.7%) |
Race in St James
The most populous races in St James are White / Caucasian (3,713 | 94.2%), Hispanic or Latino (200 | 5.1%), and Two or more Races (137 | 3.5%).
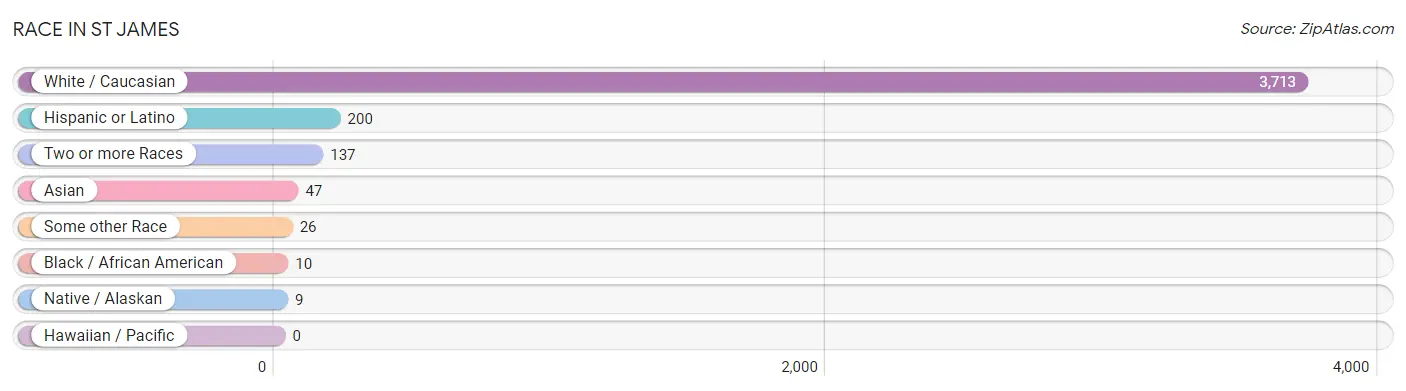
| Race | # Population | % Population |
| Asian | 47 | 1.2% |
| Black / African American | 10 | 0.3% |
| Hawaiian / Pacific | 0 | 0.0% |
| Hispanic or Latino | 200 | 5.1% |
| Native / Alaskan | 9 | 0.2% |
| White / Caucasian | 3,713 | 94.2% |
| Two or more Races | 137 | 3.5% |
| Some other Race | 26 | 0.7% |
| Total | 3,942 | 100.0% |
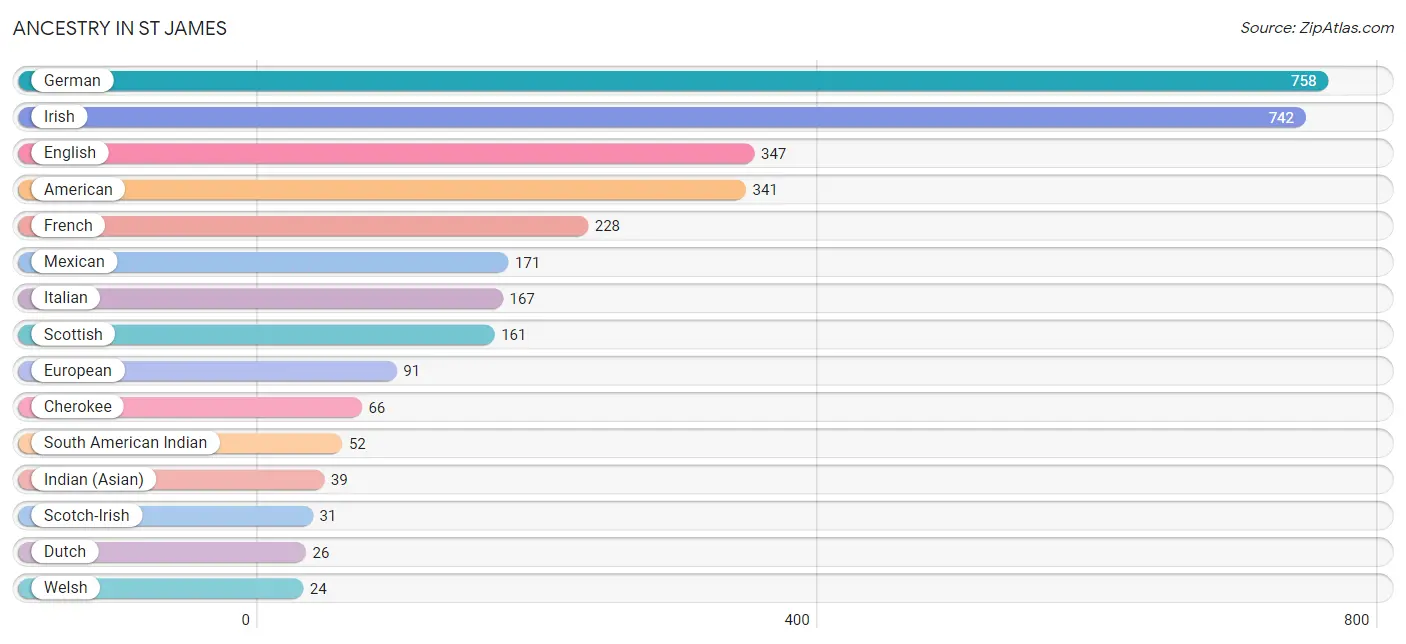
Ancestry in St James
The most populous ancestries reported in St James are German (758 | 19.2%), Irish (742 | 18.8%), English (347 | 8.8%), American (341 | 8.6%), and French (228 | 5.8%), together accounting for 61.3% of all St James residents.
| Ancestry | # Population | % Population |
| African | 6 | 0.2% |
| American | 341 | 8.6% |
| Arab | 10 | 0.3% |
| Austrian | 7 | 0.2% |
| British | 22 | 0.6% |
| Burmese | 8 | 0.2% |
| Cherokee | 66 | 1.7% |
| Cuban | 10 | 0.3% |
| Czech | 17 | 0.4% |
| Dutch | 26 | 0.7% |
| English | 347 | 8.8% |
| European | 91 | 2.3% |
| French | 228 | 5.8% |
| German | 758 | 19.2% |
| Indian (Asian) | 39 | 1.0% |
| Irish | 742 | 18.8% |
| Italian | 167 | 4.2% |
| Mexican | 171 | 4.3% |
| Norwegian | 9 | 0.2% |
| Puerto Rican | 19 | 0.5% |
| Scotch-Irish | 31 | 0.8% |
| Scottish | 161 | 4.1% |
| South American Indian | 52 | 1.3% |
| Subsaharan African | 6 | 0.2% |
| Syrian | 10 | 0.3% |
| Welsh | 24 | 0.6% | View All 26 Rows |
Immigrants in St James
The most numerous immigrant groups reported in St James came from Asia (47 | 1.2%), Eastern Asia (47 | 1.2%), China (39 | 1.0%), Europe (26 | 0.7%), and Western Europe (26 | 0.7%), together accounting for 4.7% of all St James residents.
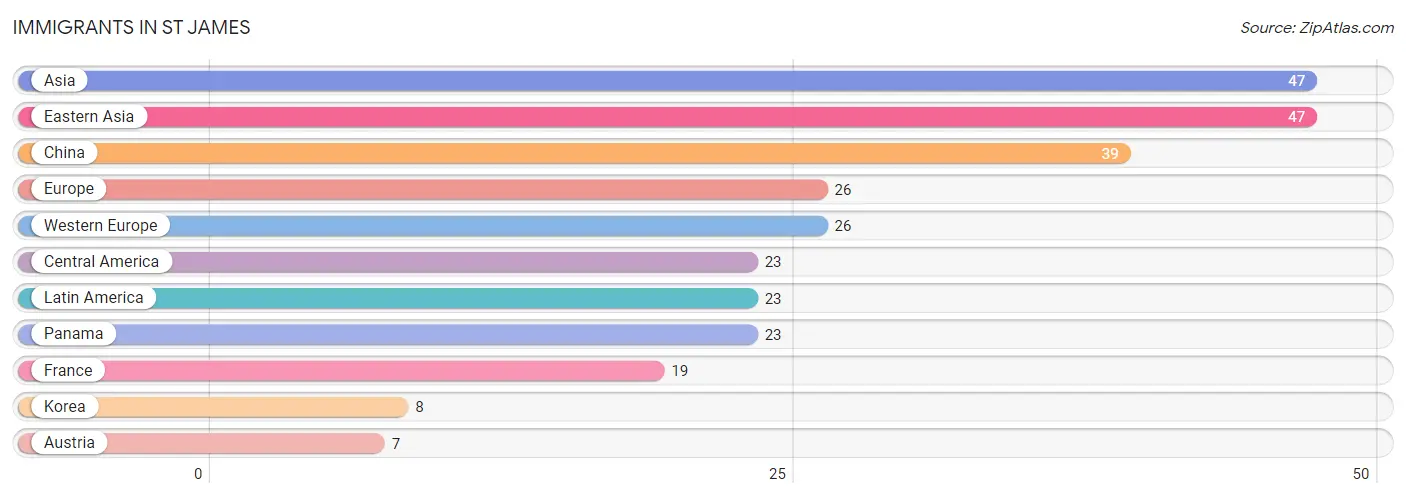
| Immigration Origin | # Population | % Population |
| Asia | 47 | 1.2% |
| Austria | 7 | 0.2% |
| Central America | 23 | 0.6% |
| China | 39 | 1.0% |
| Eastern Asia | 47 | 1.2% |
| Europe | 26 | 0.7% |
| France | 19 | 0.5% |
| Korea | 8 | 0.2% |
| Latin America | 23 | 0.6% |
| Panama | 23 | 0.6% |
| Western Europe | 26 | 0.7% | View All 11 Rows |
Sex and Age in St James
Sex and Age in St James
The most populous age groups in St James are Under 5 Years (233 | 12.1%) for men and 55 to 59 Years (227 | 11.2%) for women.
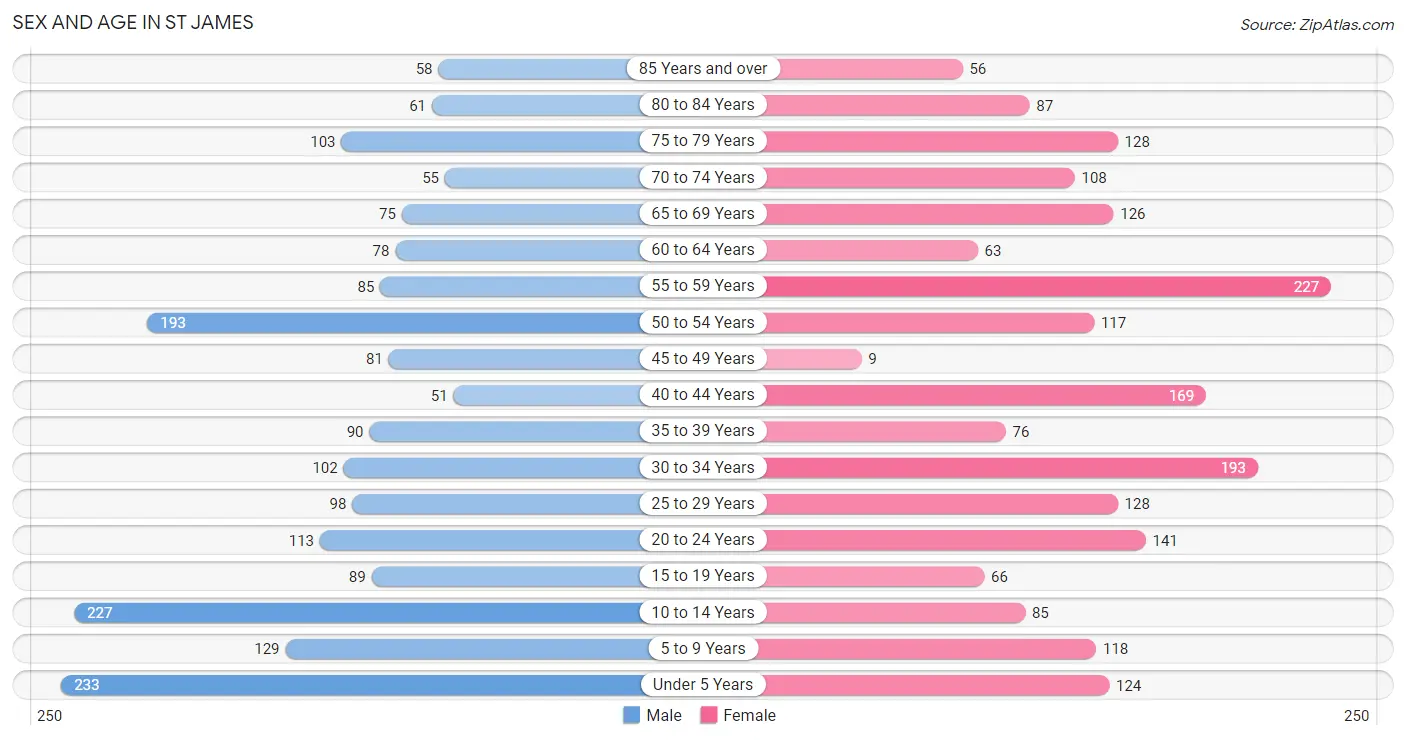
| Age Bracket | Male | Female |
| Under 5 Years | 233 (12.1%) | 124 (6.1%) |
| 5 to 9 Years | 129 (6.7%) | 118 (5.8%) |
| 10 to 14 Years | 227 (11.8%) | 85 (4.2%) |
| 15 to 19 Years | 89 (4.6%) | 66 (3.3%) |
| 20 to 24 Years | 113 (5.9%) | 141 (7.0%) |
| 25 to 29 Years | 98 (5.1%) | 128 (6.3%) |
| 30 to 34 Years | 102 (5.3%) | 193 (9.6%) |
| 35 to 39 Years | 90 (4.7%) | 76 (3.8%) |
| 40 to 44 Years | 51 (2.6%) | 169 (8.4%) |
| 45 to 49 Years | 81 (4.2%) | 9 (0.4%) |
| 50 to 54 Years | 193 (10.1%) | 117 (5.8%) |
| 55 to 59 Years | 85 (4.4%) | 227 (11.2%) |
| 60 to 64 Years | 78 (4.1%) | 63 (3.1%) |
| 65 to 69 Years | 75 (3.9%) | 126 (6.2%) |
| 70 to 74 Years | 55 (2.9%) | 108 (5.3%) |
| 75 to 79 Years | 103 (5.4%) | 128 (6.3%) |
| 80 to 84 Years | 61 (3.2%) | 87 (4.3%) |
| 85 Years and over | 58 (3.0%) | 56 (2.8%) |
| Total | 1,921 (100.0%) | 2,021 (100.0%) |
Families and Households in St James
Median Family Size in St James
The median family size in St James is 2.79 persons per family, with married-couple families (712 | 63.8%) accounting for the largest median family size of 3.14 persons per family. On the other hand, single male/father families (108 | 9.7%) represent the smallest median family size with 1.93 persons per family.
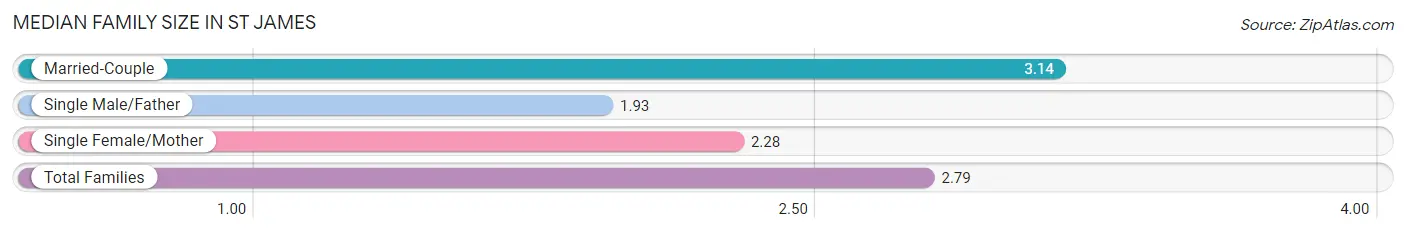
| Family Type | # Families | Family Size |
| Married-Couple | 712 (63.8%) | 3.14 |
| Single Male/Father | 108 (9.7%) | 1.93 |
| Single Female/Mother | 296 (26.5%) | 2.28 |
| Total Families | 1,116 (100.0%) | 2.79 |
Median Household Size in St James
The median household size in St James is 2.30 persons per household, with married-couple households (712 | 44.4%) accounting for the largest median household size of 3.14 persons per household. non-family households (486 | 30.3%) represent the smallest median household size with 1.02 persons per household.
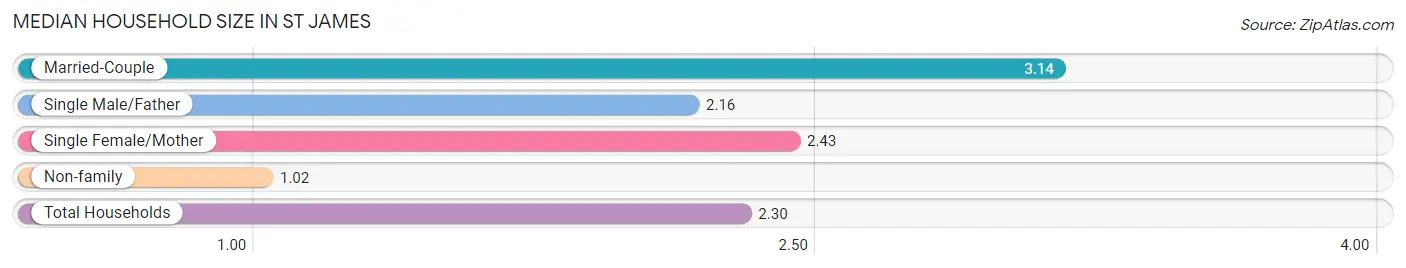
| Household Type | # Households | Household Size |
| Married-Couple | 712 (44.4%) | 3.14 |
| Single Male/Father | 108 (6.7%) | 2.16 |
| Single Female/Mother | 296 (18.5%) | 2.43 |
| Non-family | 486 (30.3%) | 1.02 |
| Total Households | 1,602 (100.0%) | 2.30 |
Household Size by Marriage Status in St James
Out of a total of 1,602 households in St James, 1,116 (69.7%) are family households, while 486 (30.3%) are nonfamily households. The most numerous type of family households are 2-person households, comprising 583, and the most common type of nonfamily households are 1-person households, comprising 470.
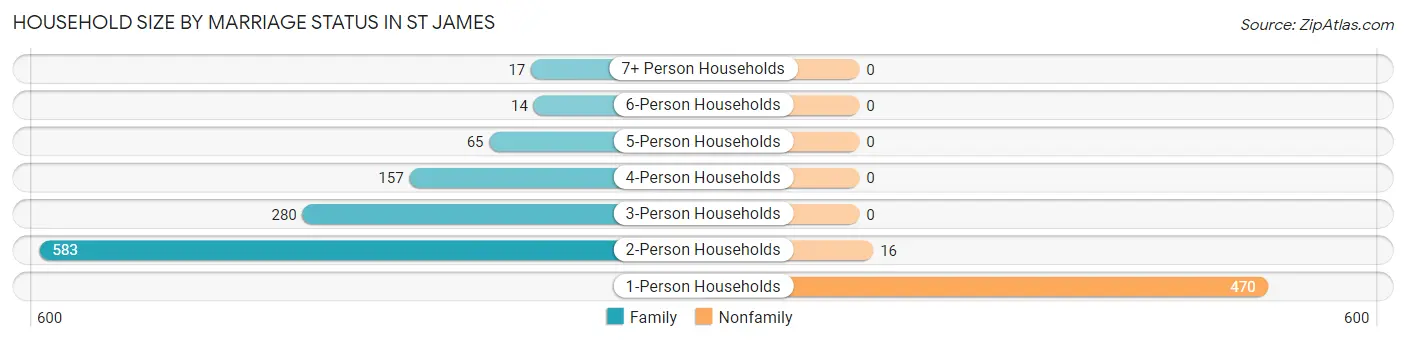
| Household Size | Family Households | Nonfamily Households |
| 1-Person Households | - | 470 (29.3%) |
| 2-Person Households | 583 (36.4%) | 16 (1.0%) |
| 3-Person Households | 280 (17.5%) | 0 (0.0%) |
| 4-Person Households | 157 (9.8%) | 0 (0.0%) |
| 5-Person Households | 65 (4.1%) | 0 (0.0%) |
| 6-Person Households | 14 (0.9%) | 0 (0.0%) |
| 7+ Person Households | 17 (1.1%) | 0 (0.0%) |
| Total | 1,116 (69.7%) | 486 (30.3%) |
Female Fertility in St James
Fertility by Age in St James
Average fertility rate in St James is 111.0 births per 1,000 women. Women in the age bracket of 35 to 50 years have the highest fertility rate with 206.0 births per 1,000 women. Women in the age bracket of 35 to 50 years acount for 68.8% of all women with births.
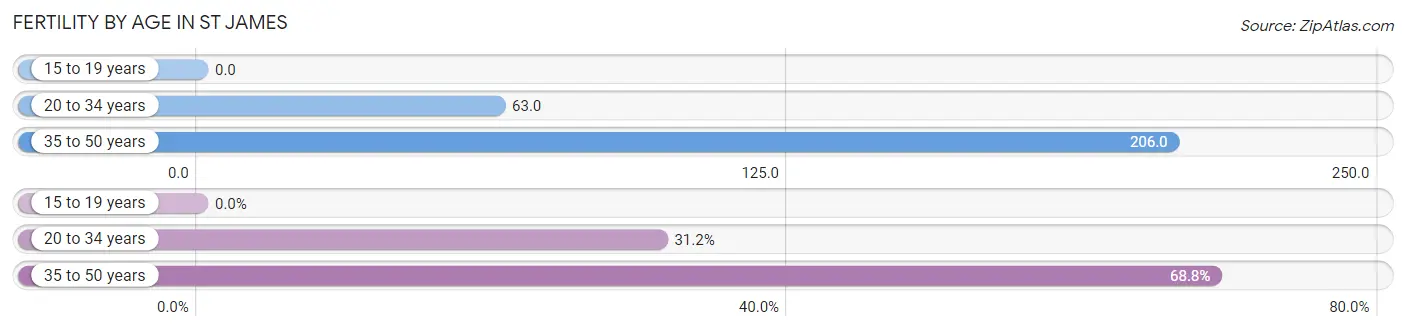
| Age Bracket | Women with Births | Births / 1,000 Women |
| 15 to 19 years | 0 (0.0%) | 0.0 |
| 20 to 34 years | 29 (31.2%) | 63.0 |
| 35 to 50 years | 64 (68.8%) | 206.0 |
| Total | 93 (100.0%) | 111.0 |
Fertility by Age by Marriage Status in St James
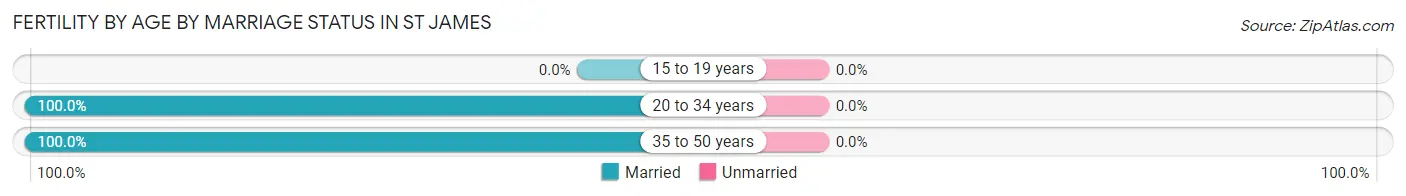
| Age Bracket | Married | Unmarried |
| 15 to 19 years | 0 (0.0%) | 0 (0.0%) |
| 20 to 34 years | 29 (100.0%) | 0 (0.0%) |
| 35 to 50 years | 64 (100.0%) | 0 (0.0%) |
| Total | 93 (100.0%) | 0 (0.0%) |
Fertility by Education in St James
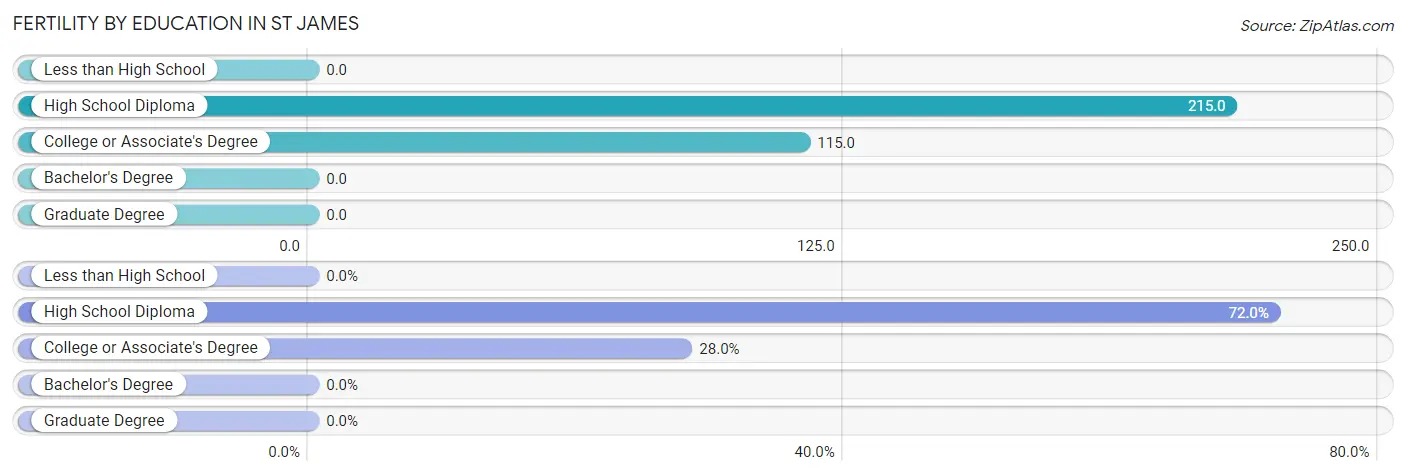
| Educational Attainment | Women with Births | Births / 1,000 Women |
| Less than High School | 0 (0.0%) | 0.0 |
| High School Diploma | 67 (72.0%) | 215.0 |
| College or Associate's Degree | 26 (28.0%) | 115.0 |
| Bachelor's Degree | 0 (0.0%) | 0.0 |
| Graduate Degree | 0 (0.0%) | 0.0 |
| Total | 93 (100.0%) | 111.0 |
Fertility by Education by Marriage Status in St James
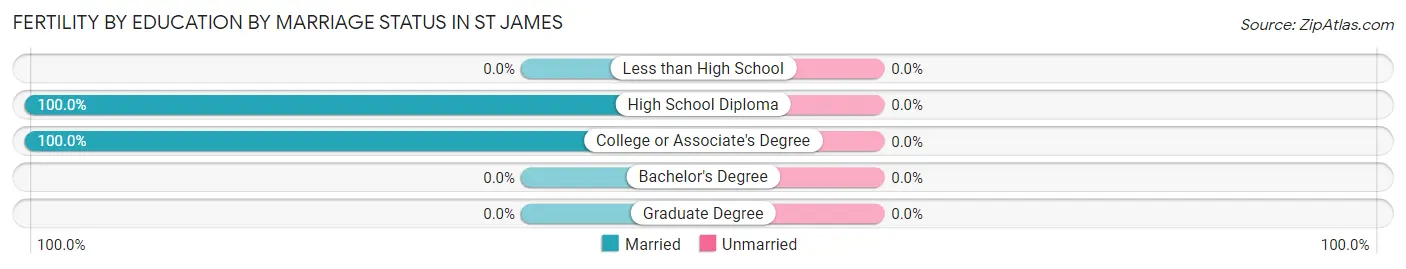
| Educational Attainment | Married | Unmarried |
| Less than High School | 0 (0.0%) | 0 (0.0%) |
| High School Diploma | 67 (100.0%) | 0 (0.0%) |
| College or Associate's Degree | 26 (100.0%) | 0 (0.0%) |
| Bachelor's Degree | 0 (0.0%) | 0 (0.0%) |
| Graduate Degree | 0 (0.0%) | 0 (0.0%) |
| Total | 93 (100.0%) | 0 (0.0%) |
Employment Characteristics in St James
Employment by Class of Employer in St James
Among the 1,577 employed individuals in St James, private company employees (910 | 57.7%), local government employees (247 | 15.7%), and not-for-profit organizations (181 | 11.5%) make up the most common classes of employment.
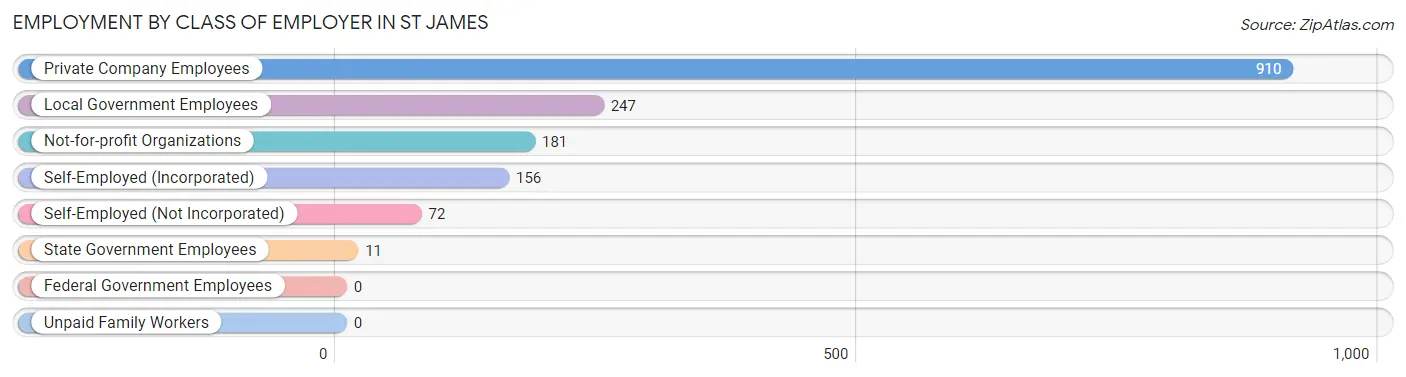
| Employer Class | # Employees | % Employees |
| Private Company Employees | 910 | 57.7% |
| Self-Employed (Incorporated) | 156 | 9.9% |
| Self-Employed (Not Incorporated) | 72 | 4.6% |
| Not-for-profit Organizations | 181 | 11.5% |
| Local Government Employees | 247 | 15.7% |
| State Government Employees | 11 | 0.7% |
| Federal Government Employees | 0 | 0.0% |
| Unpaid Family Workers | 0 | 0.0% |
| Total | 1,577 | 100.0% |
Employment Status by Age in St James
According to the labor force statistics for St James, out of the total population over 16 years of age (2,989), 56.3% or 1,683 individuals are in the labor force, with 6.4% or 108 of them unemployed. The age group with the highest labor force participation rate is 20 to 24 years, with 100.0% or 254 individuals in the labor force. Within the labor force, the 20 to 24 years age range has the highest percentage of unemployed individuals, with 26.0% or 66 of them being unemployed.
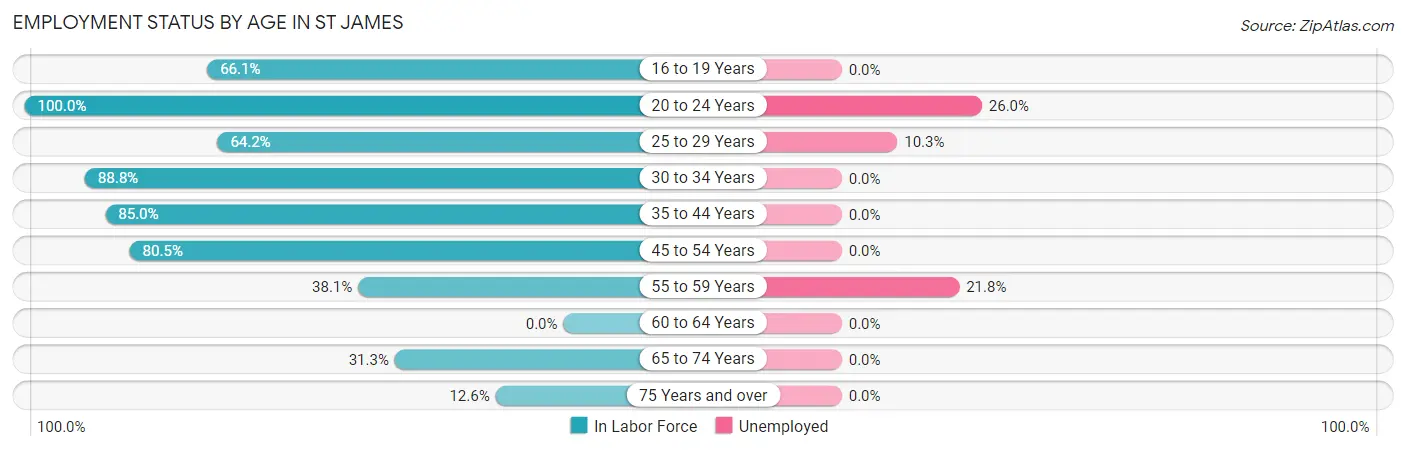
| Age Bracket | In Labor Force | Unemployed |
| 16 to 19 Years | 78 (66.1%) | 0 (0.0%) |
| 20 to 24 Years | 254 (100.0%) | 66 (26.0%) |
| 25 to 29 Years | 145 (64.2%) | 15 (10.3%) |
| 30 to 34 Years | 262 (88.8%) | 0 (0.0%) |
| 35 to 44 Years | 328 (85.0%) | 0 (0.0%) |
| 45 to 54 Years | 322 (80.5%) | 0 (0.0%) |
| 55 to 59 Years | 119 (38.1%) | 26 (21.8%) |
| 60 to 64 Years | 0 (0.0%) | 0 (0.0%) |
| 65 to 74 Years | 114 (31.3%) | 0 (0.0%) |
| 75 Years and over | 62 (12.6%) | 0 (0.0%) |
| Total | 1,683 (56.3%) | 108 (6.4%) |
Employment Status by Educational Attainment in St James
According to labor force statistics for St James, 66.8% of individuals (1,176) out of the total population between 25 and 64 years of age (1,760) are in the labor force, with 3.5% or 41 of them being unemployed. The group with the highest labor force participation rate are those with the educational attainment of college / associate degree, with 86.3% or 433 individuals in the labor force. Within the labor force, individuals with less than high school education have the highest percentage of unemployment, with 23.0% or 17 of them being unemployed.
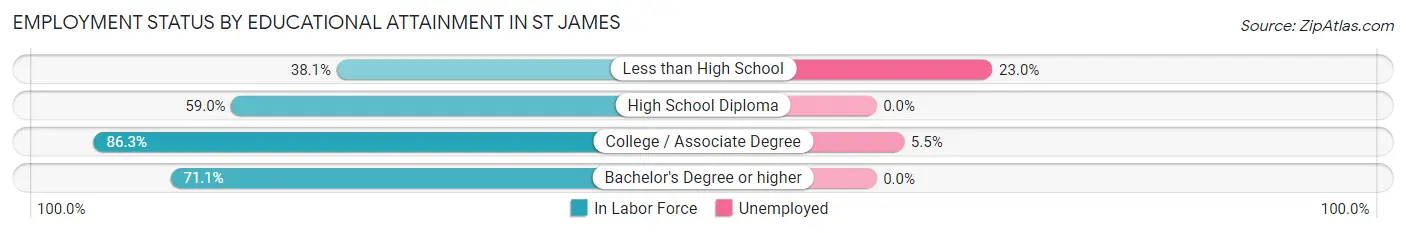
| Educational Attainment | In Labor Force | Unemployed |
| Less than High School | 74 (38.1%) | 45 (23.0%) |
| High School Diploma | 428 (59.0%) | 0 (0.0%) |
| College / Associate Degree | 433 (86.3%) | 28 (5.5%) |
| Bachelor's Degree or higher | 241 (71.1%) | 0 (0.0%) |
| Total | 1,176 (66.8%) | 62 (3.5%) |
Employment Occupations by Sex in St James
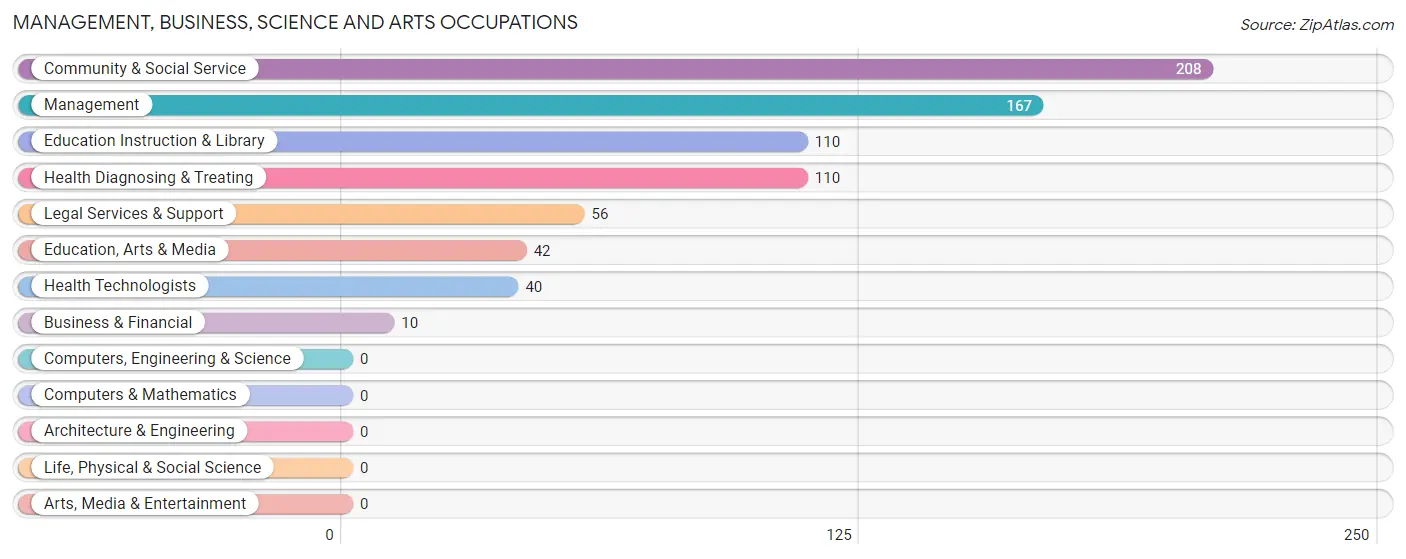
Management, Business, Science and Arts Occupations
The most common Management, Business, Science and Arts occupations in St James are Community & Social Service (208 | 13.2%), Management (167 | 10.6%), Education Instruction & Library (110 | 7.0%), Health Diagnosing & Treating (110 | 7.0%), and Legal Services & Support (56 | 3.5%).
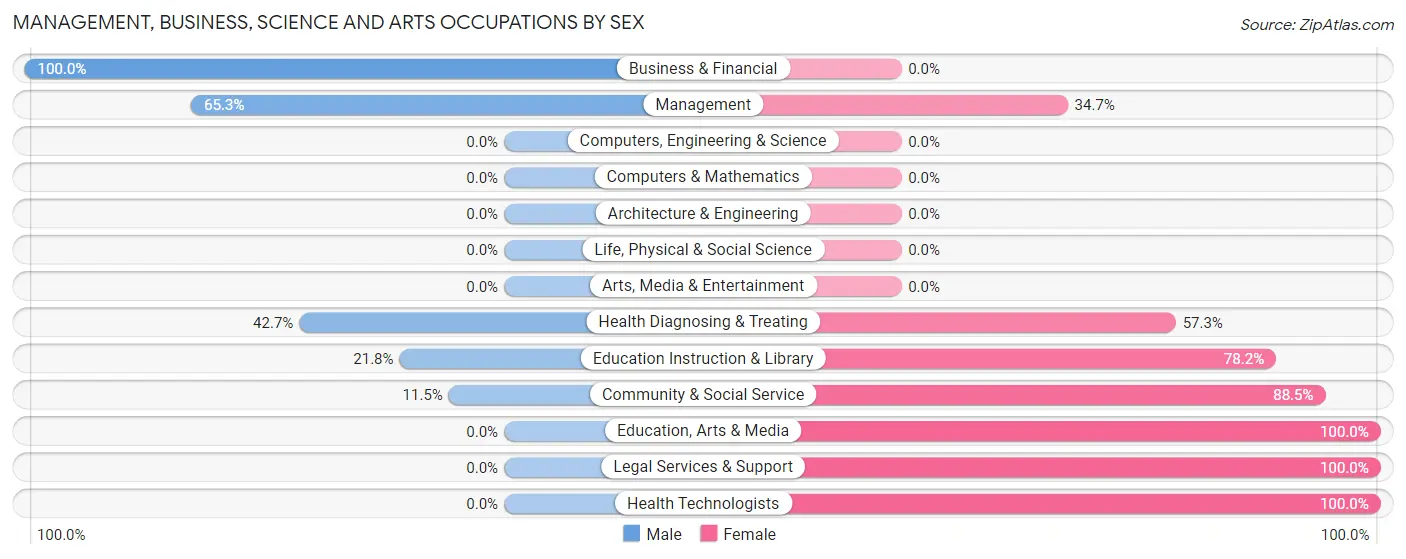
Management, Business, Science and Arts Occupations by Sex
Within the Management, Business, Science and Arts occupations in St James, the most male-oriented occupations are Business & Financial (100.0%), Management (65.3%), and Health Diagnosing & Treating (42.7%), while the most female-oriented occupations are Education, Arts & Media (100.0%), Legal Services & Support (100.0%), and Health Technologists (100.0%).
| Occupation | Male | Female |
| Management | 109 (65.3%) | 58 (34.7%) |
| Business & Financial | 10 (100.0%) | 0 (0.0%) |
| Computers, Engineering & Science | 0 (0.0%) | 0 (0.0%) |
| Computers & Mathematics | 0 (0.0%) | 0 (0.0%) |
| Architecture & Engineering | 0 (0.0%) | 0 (0.0%) |
| Life, Physical & Social Science | 0 (0.0%) | 0 (0.0%) |
| Community & Social Service | 24 (11.5%) | 184 (88.5%) |
| Education, Arts & Media | 0 (0.0%) | 42 (100.0%) |
| Legal Services & Support | 0 (0.0%) | 56 (100.0%) |
| Education Instruction & Library | 24 (21.8%) | 86 (78.2%) |
| Arts, Media & Entertainment | 0 (0.0%) | 0 (0.0%) |
| Health Diagnosing & Treating | 47 (42.7%) | 63 (57.3%) |
| Health Technologists | 0 (0.0%) | 40 (100.0%) |
| Total (Category) | 190 (38.4%) | 305 (61.6%) |
| Total (Overall) | 856 (54.3%) | 721 (45.7%) |
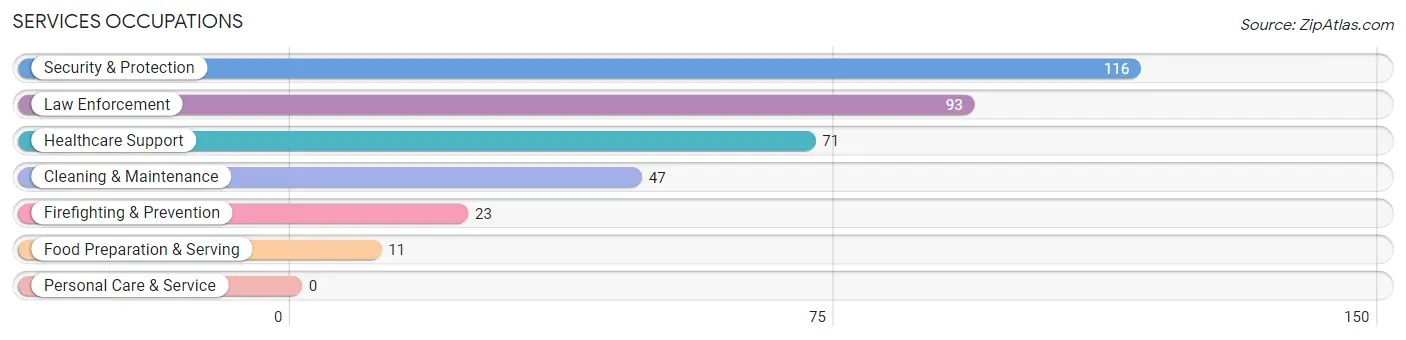
Services Occupations
The most common Services occupations in St James are Security & Protection (116 | 7.4%), Law Enforcement (93 | 5.9%), Healthcare Support (71 | 4.5%), Cleaning & Maintenance (47 | 3.0%), and Firefighting & Prevention (23 | 1.5%).
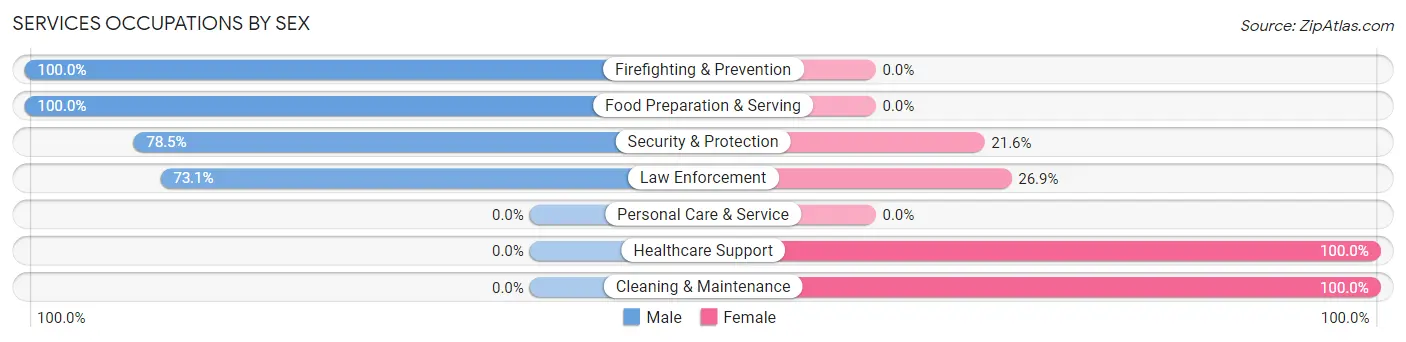
Services Occupations by Sex
Within the Services occupations in St James, the most male-oriented occupations are Firefighting & Prevention (100.0%), Food Preparation & Serving (100.0%), and Security & Protection (78.4%), while the most female-oriented occupations are Healthcare Support (100.0%), Cleaning & Maintenance (100.0%), and Law Enforcement (26.9%).
| Occupation | Male | Female |
| Healthcare Support | 0 (0.0%) | 71 (100.0%) |
| Security & Protection | 91 (78.4%) | 25 (21.5%) |
| Firefighting & Prevention | 23 (100.0%) | 0 (0.0%) |
| Law Enforcement | 68 (73.1%) | 25 (26.9%) |
| Food Preparation & Serving | 11 (100.0%) | 0 (0.0%) |
| Cleaning & Maintenance | 0 (0.0%) | 47 (100.0%) |
| Personal Care & Service | 0 (0.0%) | 0 (0.0%) |
| Total (Category) | 102 (41.6%) | 143 (58.4%) |
| Total (Overall) | 856 (54.3%) | 721 (45.7%) |
Sales and Office Occupations
The most common Sales and Office occupations in St James are Sales & Related (220 | 14.0%), and Office & Administration (148 | 9.4%).
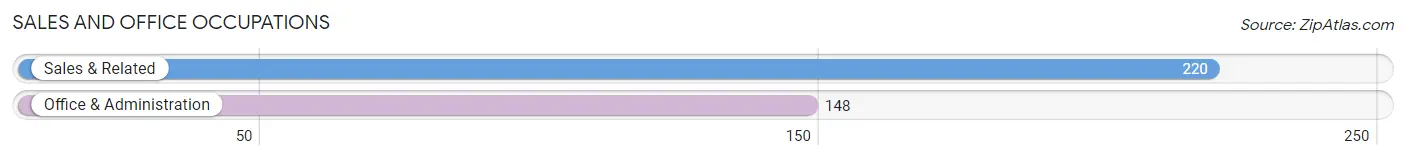
Sales and Office Occupations by Sex
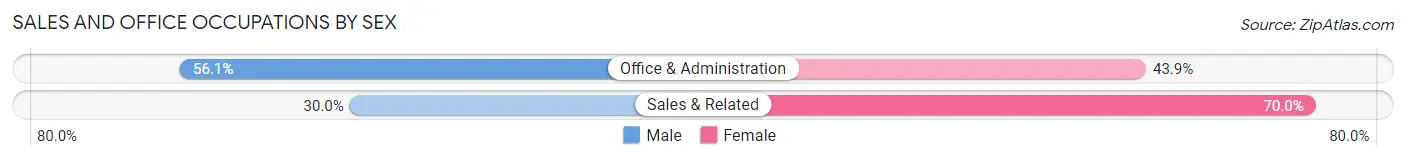
| Occupation | Male | Female |
| Sales & Related | 66 (30.0%) | 154 (70.0%) |
| Office & Administration | 83 (56.1%) | 65 (43.9%) |
| Total (Category) | 149 (40.5%) | 219 (59.5%) |
| Total (Overall) | 856 (54.3%) | 721 (45.7%) |
Natural Resources, Construction and Maintenance Occupations
The most common Natural Resources, Construction and Maintenance occupations in St James are Construction & Extraction (64 | 4.1%), Installation, Maintenance & Repair (21 | 1.3%), and Farming, Fishing & Forestry (20 | 1.3%).
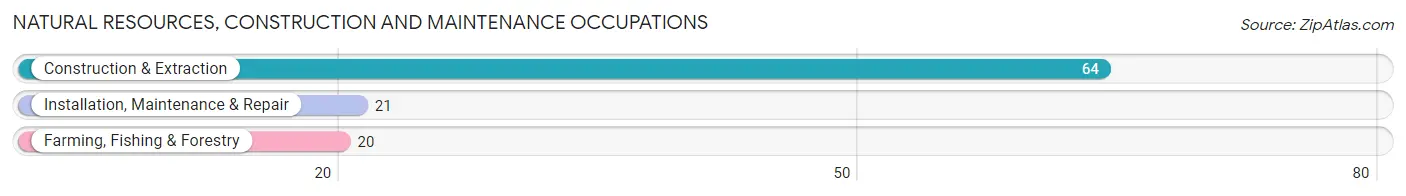
Natural Resources, Construction and Maintenance Occupations by Sex
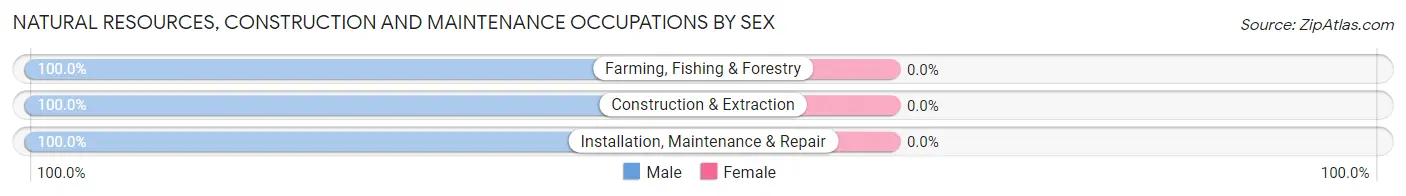
| Occupation | Male | Female |
| Farming, Fishing & Forestry | 20 (100.0%) | 0 (0.0%) |
| Construction & Extraction | 64 (100.0%) | 0 (0.0%) |
| Installation, Maintenance & Repair | 21 (100.0%) | 0 (0.0%) |
| Total (Category) | 105 (100.0%) | 0 (0.0%) |
| Total (Overall) | 856 (54.3%) | 721 (45.7%) |
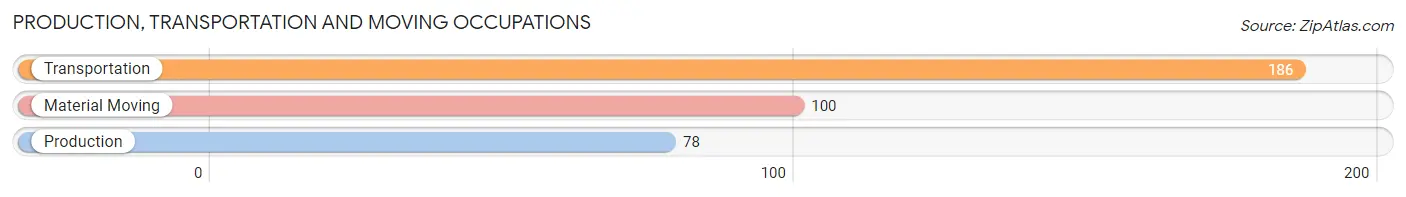
Production, Transportation and Moving Occupations
The most common Production, Transportation and Moving occupations in St James are Transportation (186 | 11.8%), Material Moving (100 | 6.3%), and Production (78 | 5.0%).
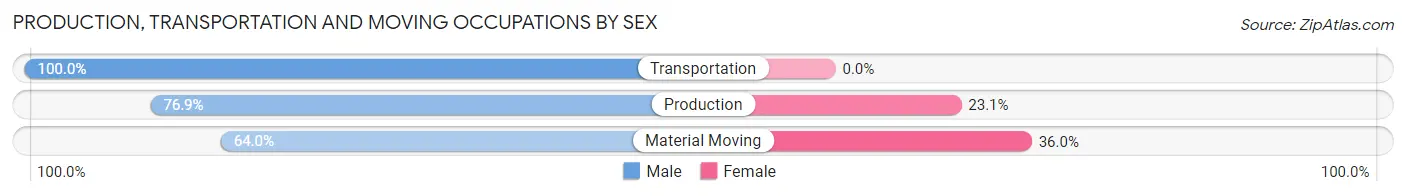
Production, Transportation and Moving Occupations by Sex
| Occupation | Male | Female |
| Production | 60 (76.9%) | 18 (23.1%) |
| Transportation | 186 (100.0%) | 0 (0.0%) |
| Material Moving | 64 (64.0%) | 36 (36.0%) |
| Total (Category) | 310 (85.2%) | 54 (14.8%) |
| Total (Overall) | 856 (54.3%) | 721 (45.7%) |
Employment Industries by Sex in St James
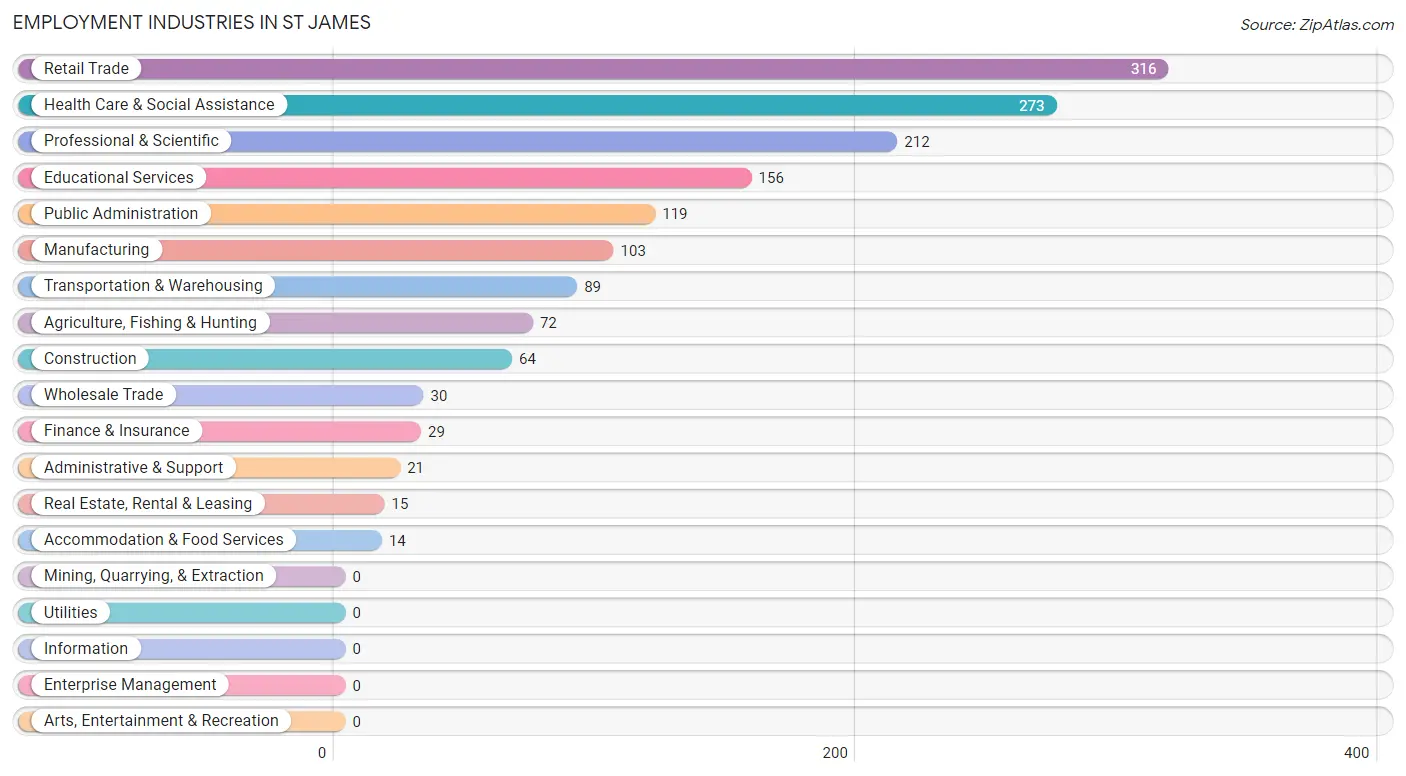
Employment Industries in St James
The major employment industries in St James include Retail Trade (316 | 20.0%), Health Care & Social Assistance (273 | 17.3%), Professional & Scientific (212 | 13.4%), Educational Services (156 | 9.9%), and Public Administration (119 | 7.5%).
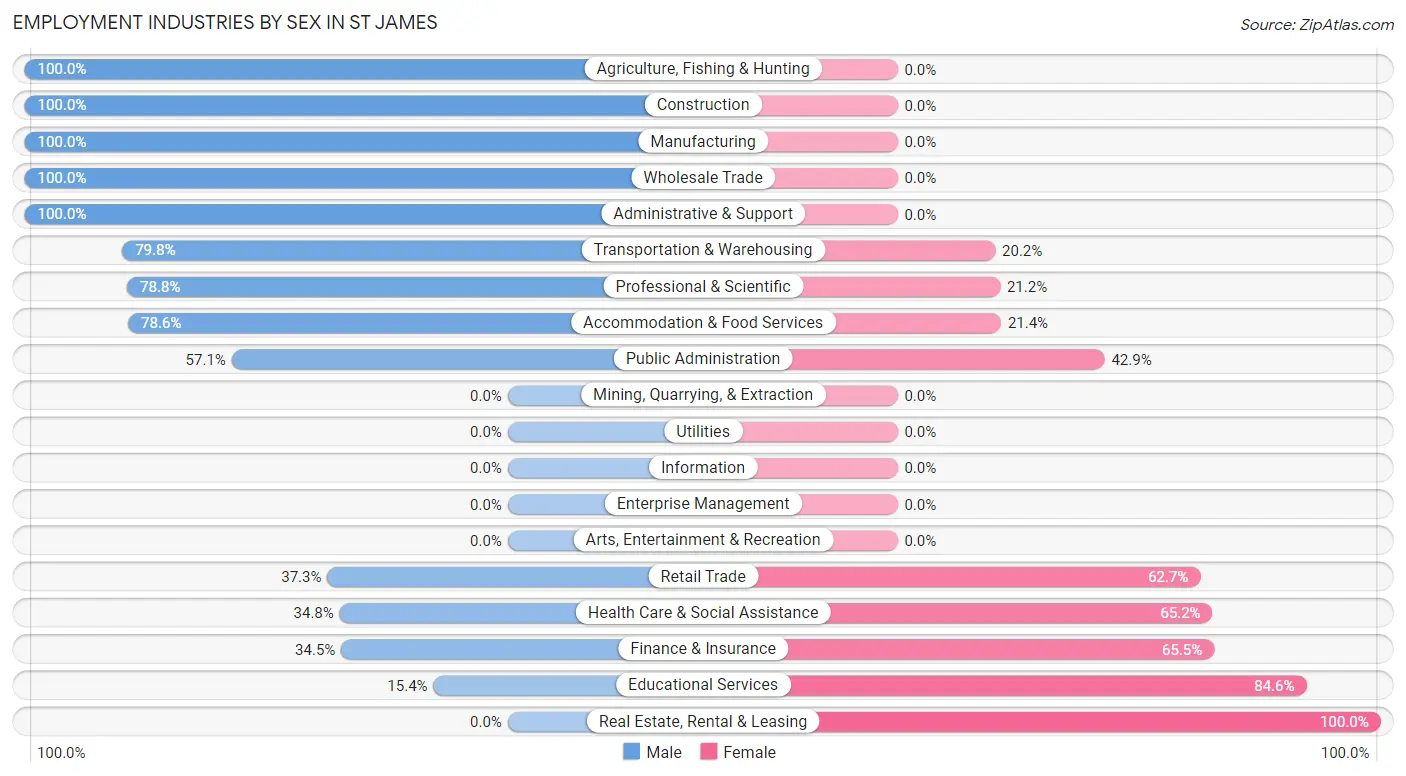
Employment Industries by Sex in St James
The St James industries that see more men than women are Agriculture, Fishing & Hunting (100.0%), Construction (100.0%), and Manufacturing (100.0%), whereas the industries that tend to have a higher number of women are Real Estate, Rental & Leasing (100.0%), Educational Services (84.6%), and Finance & Insurance (65.5%).
| Industry | Male | Female |
| Agriculture, Fishing & Hunting | 72 (100.0%) | 0 (0.0%) |
| Mining, Quarrying, & Extraction | 0 (0.0%) | 0 (0.0%) |
| Construction | 64 (100.0%) | 0 (0.0%) |
| Manufacturing | 103 (100.0%) | 0 (0.0%) |
| Wholesale Trade | 30 (100.0%) | 0 (0.0%) |
| Retail Trade | 118 (37.3%) | 198 (62.7%) |
| Transportation & Warehousing | 71 (79.8%) | 18 (20.2%) |
| Utilities | 0 (0.0%) | 0 (0.0%) |
| Information | 0 (0.0%) | 0 (0.0%) |
| Finance & Insurance | 10 (34.5%) | 19 (65.5%) |
| Real Estate, Rental & Leasing | 0 (0.0%) | 15 (100.0%) |
| Professional & Scientific | 167 (78.8%) | 45 (21.2%) |
| Enterprise Management | 0 (0.0%) | 0 (0.0%) |
| Administrative & Support | 21 (100.0%) | 0 (0.0%) |
| Educational Services | 24 (15.4%) | 132 (84.6%) |
| Health Care & Social Assistance | 95 (34.8%) | 178 (65.2%) |
| Arts, Entertainment & Recreation | 0 (0.0%) | 0 (0.0%) |
| Accommodation & Food Services | 11 (78.6%) | 3 (21.4%) |
| Public Administration | 68 (57.1%) | 51 (42.9%) |
| Total | 856 (54.3%) | 721 (45.7%) |
Education in St James
School Enrollment in St James
The most common levels of schooling among the 920 students in St James are middle school (227 | 24.7%), elementary school (222 | 24.1%), and high school (168 | 18.3%).
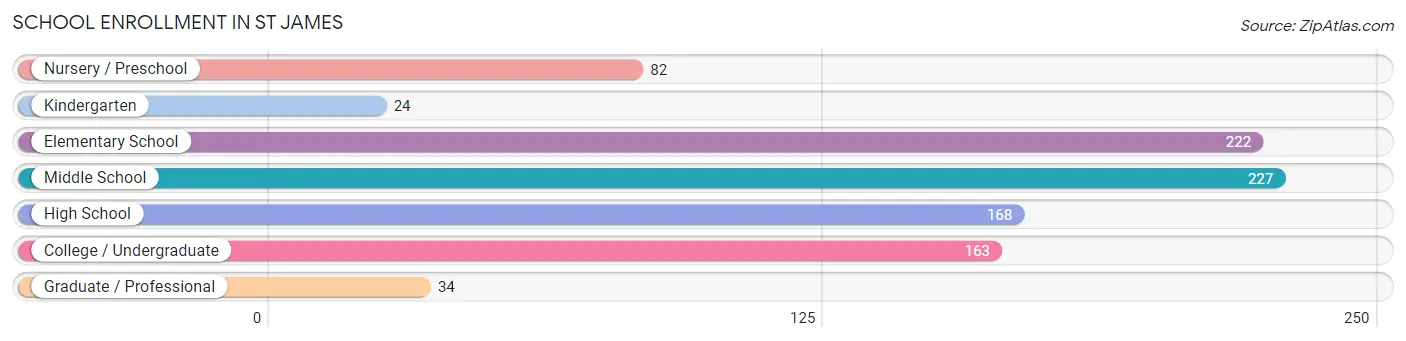
| School Level | # Students | % Students |
| Nursery / Preschool | 82 | 8.9% |
| Kindergarten | 24 | 2.6% |
| Elementary School | 222 | 24.1% |
| Middle School | 227 | 24.7% |
| High School | 168 | 18.3% |
| College / Undergraduate | 163 | 17.7% |
| Graduate / Professional | 34 | 3.7% |
| Total | 920 | 100.0% |
School Enrollment by Age by Funding Source in St James
Out of a total of 920 students who are enrolled in schools in St James, 134 (14.6%) attend a private institution, while the remaining 786 (85.4%) are enrolled in public schools. The age group of 20 to 24 year olds has the highest likelihood of being enrolled in private schools, with 45 (54.2% in the age bracket) enrolled. Conversely, the age group of 18 to 19 year olds has the lowest likelihood of being enrolled in a private school, with 21 (100.0% in the age bracket) attending a public institution.
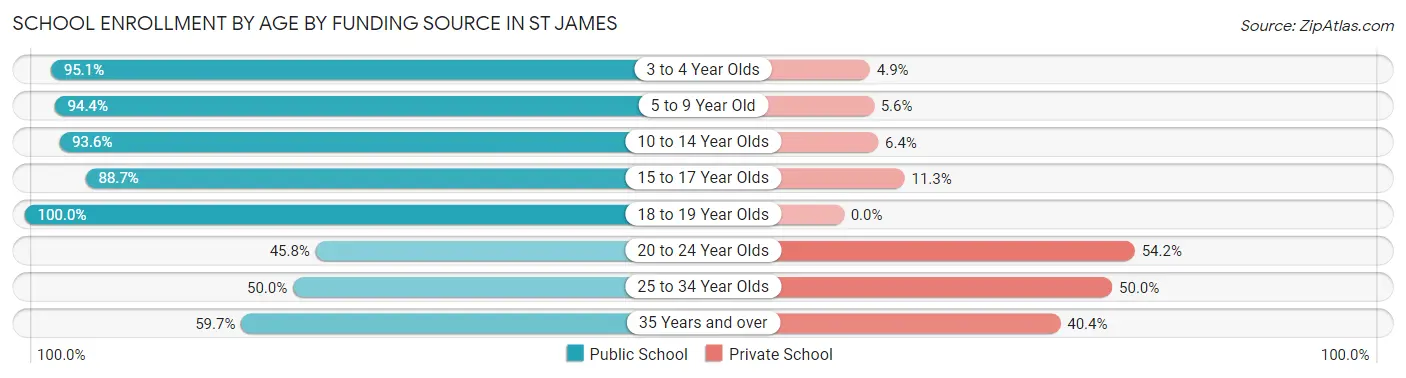
| Age Bracket | Public School | Private School |
| 3 to 4 Year Olds | 78 (95.1%) | 4 (4.9%) |
| 5 to 9 Year Old | 219 (94.4%) | 13 (5.6%) |
| 10 to 14 Year Olds | 292 (93.6%) | 20 (6.4%) |
| 15 to 17 Year Olds | 86 (88.7%) | 11 (11.3%) |
| 18 to 19 Year Olds | 21 (100.0%) | 0 (0.0%) |
| 20 to 24 Year Olds | 38 (45.8%) | 45 (54.2%) |
| 25 to 34 Year Olds | 18 (50.0%) | 18 (50.0%) |
| 35 Years and over | 34 (59.7%) | 23 (40.4%) |
| Total | 786 (85.4%) | 134 (14.6%) |
Educational Attainment by Field of Study in St James
Education (210 | 33.2%), arts & humanities (115 | 18.2%), psychology (93 | 14.7%), business (40 | 6.3%), and bio, nature & agricultural (39 | 6.2%) are the most common fields of study among 633 individuals in St James who have obtained a bachelor's degree or higher.
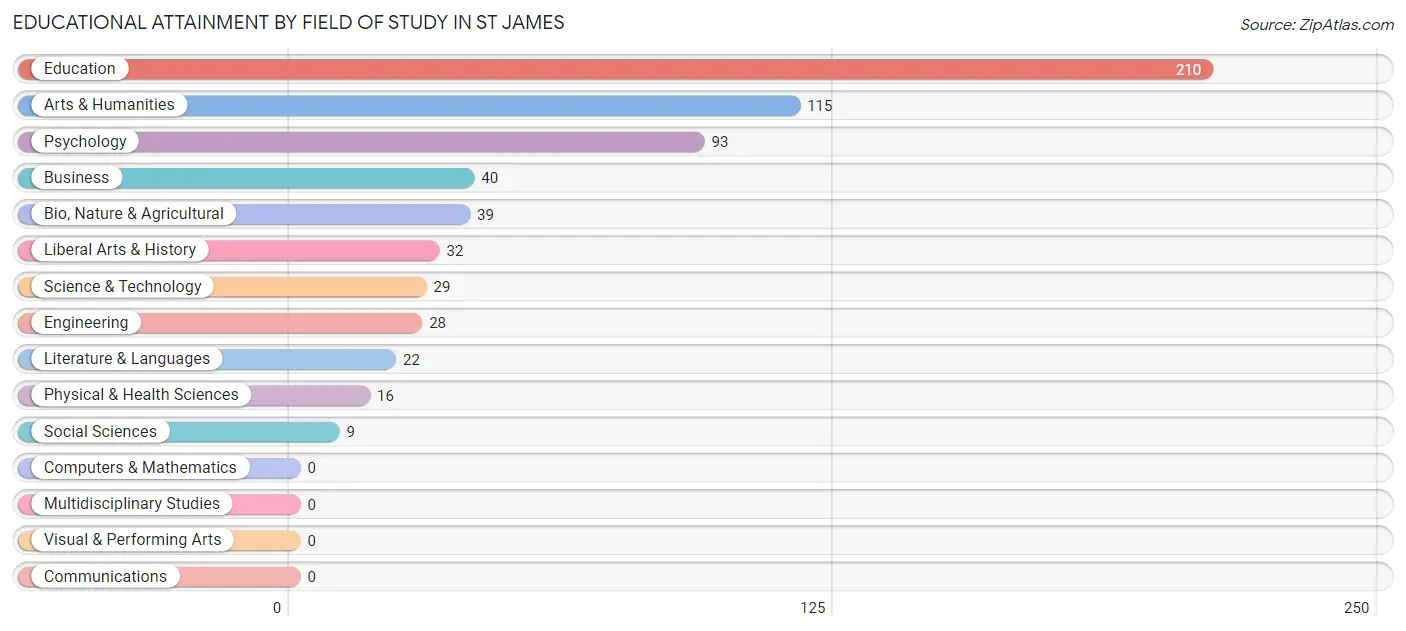
| Field of Study | # Graduates | % Graduates |
| Computers & Mathematics | 0 | 0.0% |
| Bio, Nature & Agricultural | 39 | 6.2% |
| Physical & Health Sciences | 16 | 2.5% |
| Psychology | 93 | 14.7% |
| Social Sciences | 9 | 1.4% |
| Engineering | 28 | 4.4% |
| Multidisciplinary Studies | 0 | 0.0% |
| Science & Technology | 29 | 4.6% |
| Business | 40 | 6.3% |
| Education | 210 | 33.2% |
| Literature & Languages | 22 | 3.5% |
| Liberal Arts & History | 32 | 5.1% |
| Visual & Performing Arts | 0 | 0.0% |
| Communications | 0 | 0.0% |
| Arts & Humanities | 115 | 18.2% |
| Total | 633 | 100.0% |
Transportation & Commute in St James
Vehicle Availability by Sex in St James
The most prevalent vehicle ownership categories in St James are males with 2 vehicles (691, accounting for 80.7%) and females with 2 vehicles (447, making up 95.8%).
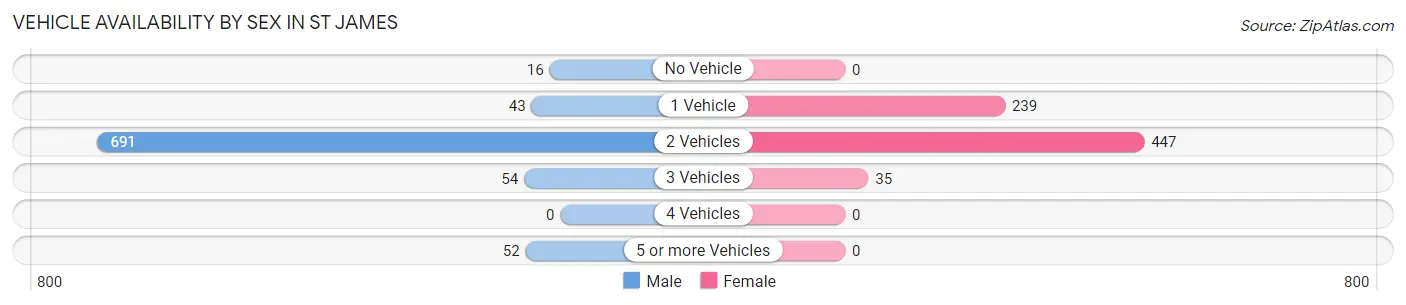
| Vehicles Available | Male | Female |
| No Vehicle | 16 (1.9%) | 0 (0.0%) |
| 1 Vehicle | 43 (5.0%) | 239 (33.2%) |
| 2 Vehicles | 691 (80.7%) | 447 (62.0%) |
| 3 Vehicles | 54 (6.3%) | 35 (4.9%) |
| 4 Vehicles | 0 (0.0%) | 0 (0.0%) |
| 5 or more Vehicles | 52 (6.1%) | 0 (0.0%) |
| Total | 856 (100.0%) | 721 (100.0%) |
Commute Time in St James
The most frequently occuring commute durations in St James are 15 to 19 minutes (513 commuters, 35.4%), 10 to 14 minutes (210 commuters, 14.5%), and 20 to 24 minutes (189 commuters, 13.0%).
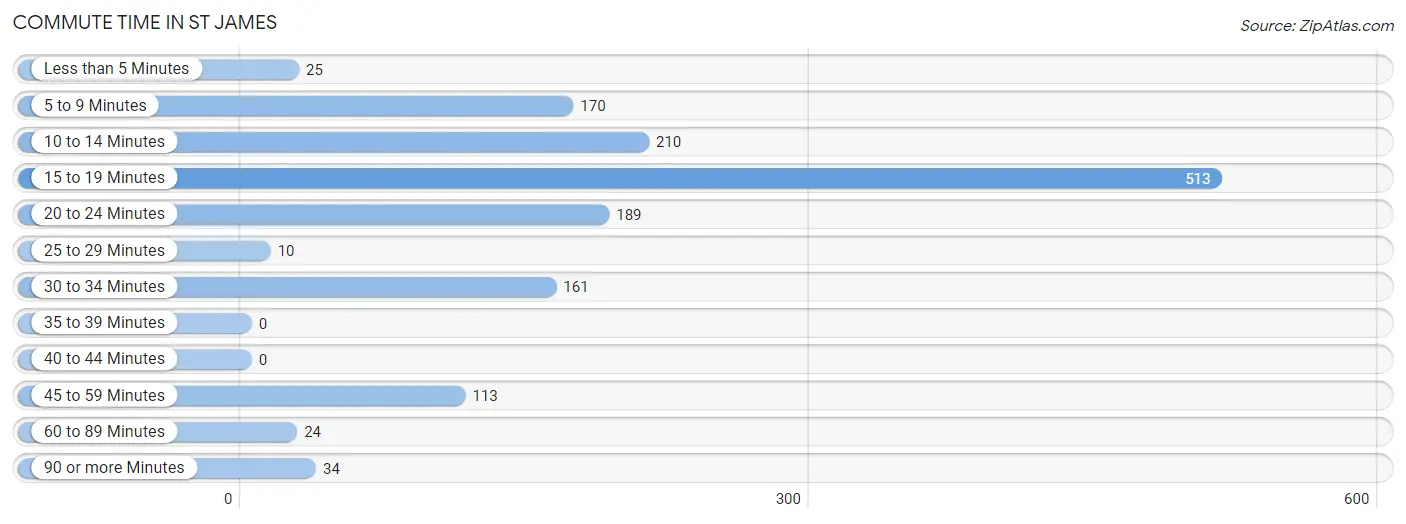
| Commute Time | # Commuters | % Commuters |
| Less than 5 Minutes | 25 | 1.7% |
| 5 to 9 Minutes | 170 | 11.7% |
| 10 to 14 Minutes | 210 | 14.5% |
| 15 to 19 Minutes | 513 | 35.4% |
| 20 to 24 Minutes | 189 | 13.0% |
| 25 to 29 Minutes | 10 | 0.7% |
| 30 to 34 Minutes | 161 | 11.1% |
| 35 to 39 Minutes | 0 | 0.0% |
| 40 to 44 Minutes | 0 | 0.0% |
| 45 to 59 Minutes | 113 | 7.8% |
| 60 to 89 Minutes | 24 | 1.7% |
| 90 or more Minutes | 34 | 2.4% |
Commute Time by Sex in St James
The most common commute times in St James are 15 to 19 minutes (304 commuters, 41.8%) for males and 15 to 19 minutes (209 commuters, 29.0%) for females.
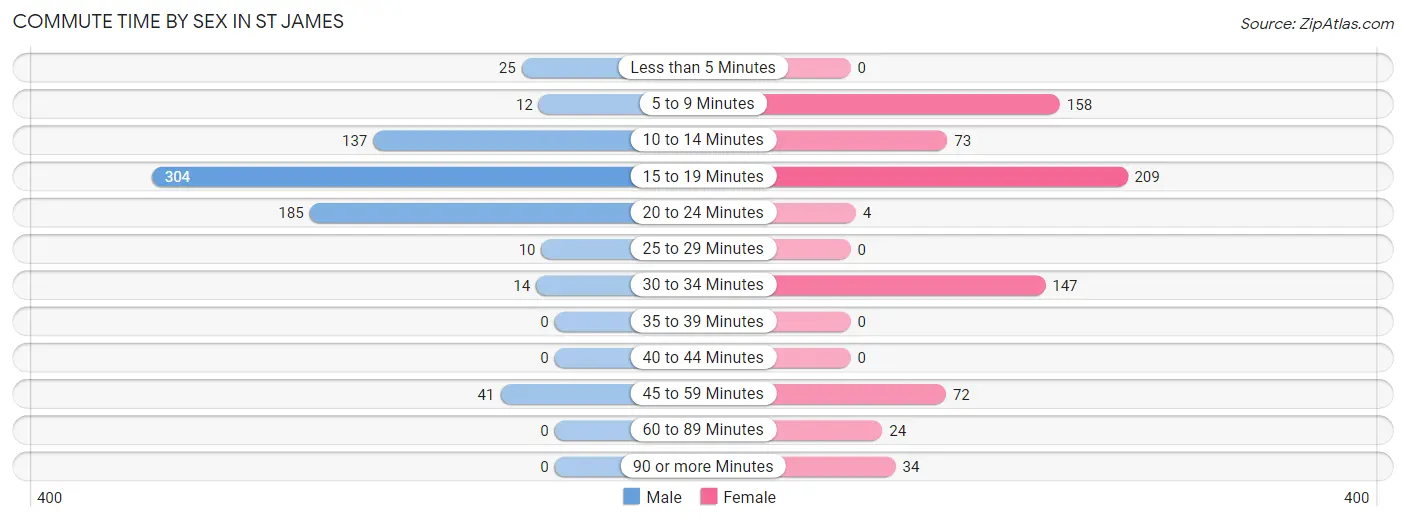
| Commute Time | Male | Female |
| Less than 5 Minutes | 25 (3.4%) | 0 (0.0%) |
| 5 to 9 Minutes | 12 (1.7%) | 158 (21.9%) |
| 10 to 14 Minutes | 137 (18.8%) | 73 (10.1%) |
| 15 to 19 Minutes | 304 (41.8%) | 209 (29.0%) |
| 20 to 24 Minutes | 185 (25.4%) | 4 (0.5%) |
| 25 to 29 Minutes | 10 (1.4%) | 0 (0.0%) |
| 30 to 34 Minutes | 14 (1.9%) | 147 (20.4%) |
| 35 to 39 Minutes | 0 (0.0%) | 0 (0.0%) |
| 40 to 44 Minutes | 0 (0.0%) | 0 (0.0%) |
| 45 to 59 Minutes | 41 (5.6%) | 72 (10.0%) |
| 60 to 89 Minutes | 0 (0.0%) | 24 (3.3%) |
| 90 or more Minutes | 0 (0.0%) | 34 (4.7%) |
Time of Departure to Work by Sex in St James
The most frequent times of departure to work in St James are 8:00 AM to 8:29 AM (158, 21.7%) for males and 7:30 AM to 7:59 AM (157, 21.8%) for females.
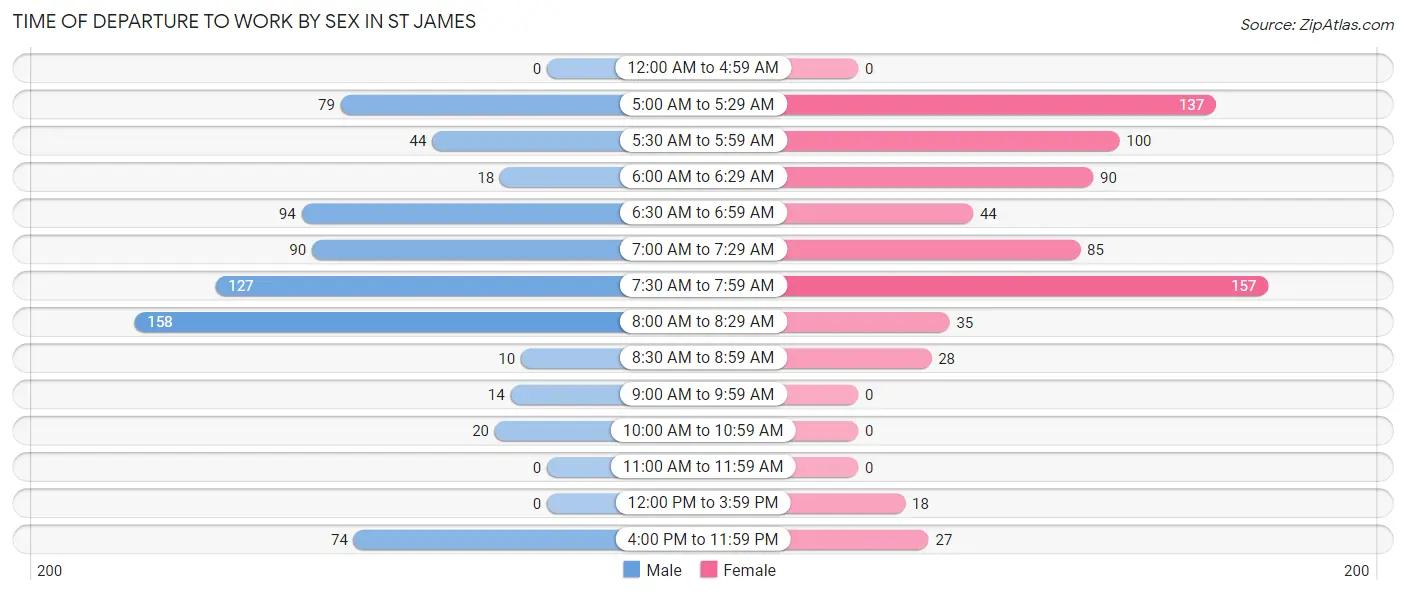
| Time of Departure | Male | Female |
| 12:00 AM to 4:59 AM | 0 (0.0%) | 0 (0.0%) |
| 5:00 AM to 5:29 AM | 79 (10.8%) | 137 (19.0%) |
| 5:30 AM to 5:59 AM | 44 (6.0%) | 100 (13.9%) |
| 6:00 AM to 6:29 AM | 18 (2.5%) | 90 (12.5%) |
| 6:30 AM to 6:59 AM | 94 (12.9%) | 44 (6.1%) |
| 7:00 AM to 7:29 AM | 90 (12.4%) | 85 (11.8%) |
| 7:30 AM to 7:59 AM | 127 (17.4%) | 157 (21.8%) |
| 8:00 AM to 8:29 AM | 158 (21.7%) | 35 (4.9%) |
| 8:30 AM to 8:59 AM | 10 (1.4%) | 28 (3.9%) |
| 9:00 AM to 9:59 AM | 14 (1.9%) | 0 (0.0%) |
| 10:00 AM to 10:59 AM | 20 (2.8%) | 0 (0.0%) |
| 11:00 AM to 11:59 AM | 0 (0.0%) | 0 (0.0%) |
| 12:00 PM to 3:59 PM | 0 (0.0%) | 18 (2.5%) |
| 4:00 PM to 11:59 PM | 74 (10.2%) | 27 (3.7%) |
| Total | 728 (100.0%) | 721 (100.0%) |
Housing Occupancy in St James
Occupancy by Ownership in St James
Of the total 1,602 dwellings in St James, owner-occupied units account for 810 (50.6%), while renter-occupied units make up 792 (49.4%).
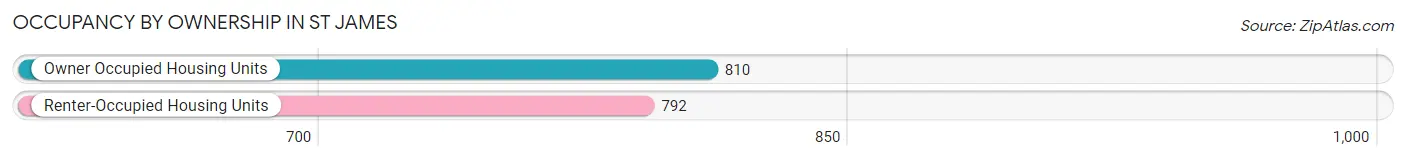
| Occupancy | # Housing Units | % Housing Units |
| Owner Occupied Housing Units | 810 | 50.6% |
| Renter-Occupied Housing Units | 792 | 49.4% |
| Total Occupied Housing Units | 1,602 | 100.0% |
Occupancy by Household Size in St James
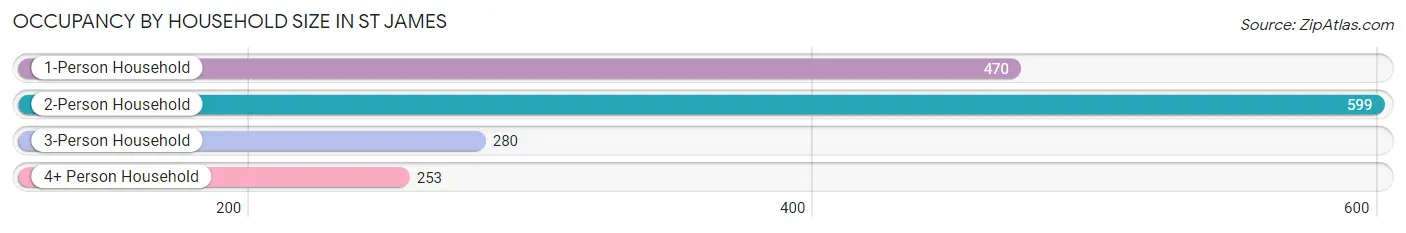
| Household Size | # Housing Units | % Housing Units |
| 1-Person Household | 470 | 29.3% |
| 2-Person Household | 599 | 37.4% |
| 3-Person Household | 280 | 17.5% |
| 4+ Person Household | 253 | 15.8% |
| Total Housing Units | 1,602 | 100.0% |
Occupancy by Ownership by Household Size in St James
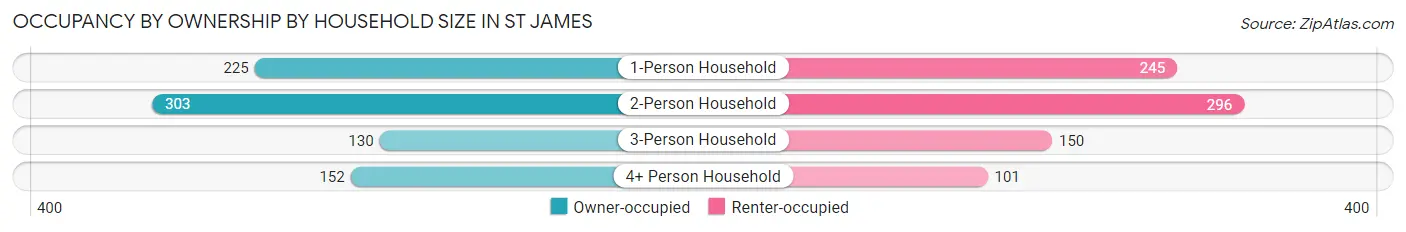
| Household Size | Owner-occupied | Renter-occupied |
| 1-Person Household | 225 (47.9%) | 245 (52.1%) |
| 2-Person Household | 303 (50.6%) | 296 (49.4%) |
| 3-Person Household | 130 (46.4%) | 150 (53.6%) |
| 4+ Person Household | 152 (60.1%) | 101 (39.9%) |
| Total Housing Units | 810 (50.6%) | 792 (49.4%) |
Occupancy by Educational Attainment in St James
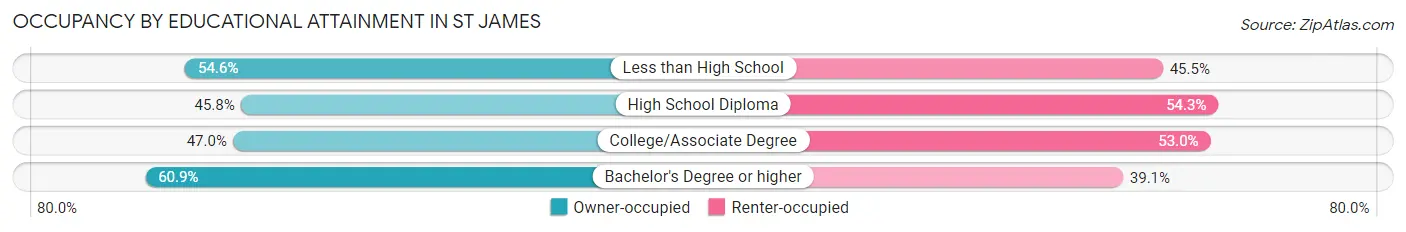
| Household Size | Owner-occupied | Renter-occupied |
| Less than High School | 96 (54.5%) | 80 (45.5%) |
| High School Diploma | 264 (45.8%) | 313 (54.2%) |
| College/Associate Degree | 226 (47.0%) | 255 (53.0%) |
| Bachelor's Degree or higher | 224 (60.9%) | 144 (39.1%) |
Occupancy by Age of Householder in St James
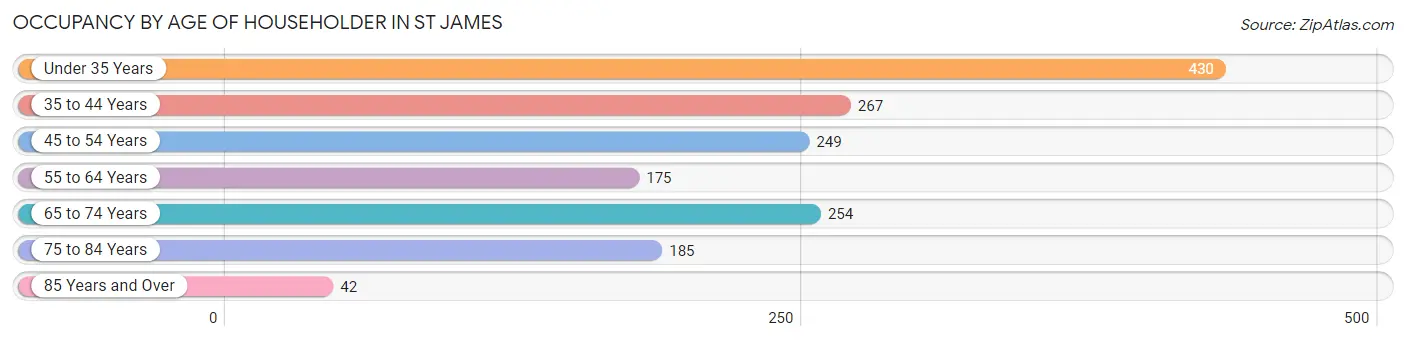
| Age Bracket | # Households | % Households |
| Under 35 Years | 430 | 26.8% |
| 35 to 44 Years | 267 | 16.7% |
| 45 to 54 Years | 249 | 15.5% |
| 55 to 64 Years | 175 | 10.9% |
| 65 to 74 Years | 254 | 15.9% |
| 75 to 84 Years | 185 | 11.6% |
| 85 Years and Over | 42 | 2.6% |
| Total | 1,602 | 100.0% |
Housing Finances in St James
Median Income by Occupancy in St James
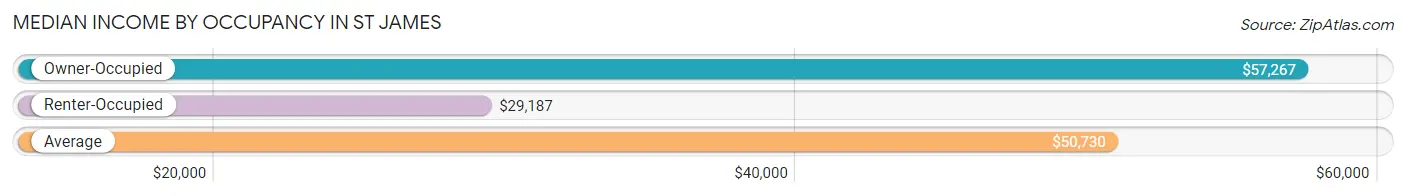
| Occupancy Type | # Households | Median Income |
| Owner-Occupied | 810 (50.6%) | $57,267 |
| Renter-Occupied | 792 (49.4%) | $29,187 |
| Average | 1,602 (100.0%) | $50,730 |
Occupancy by Householder Income Bracket in St James
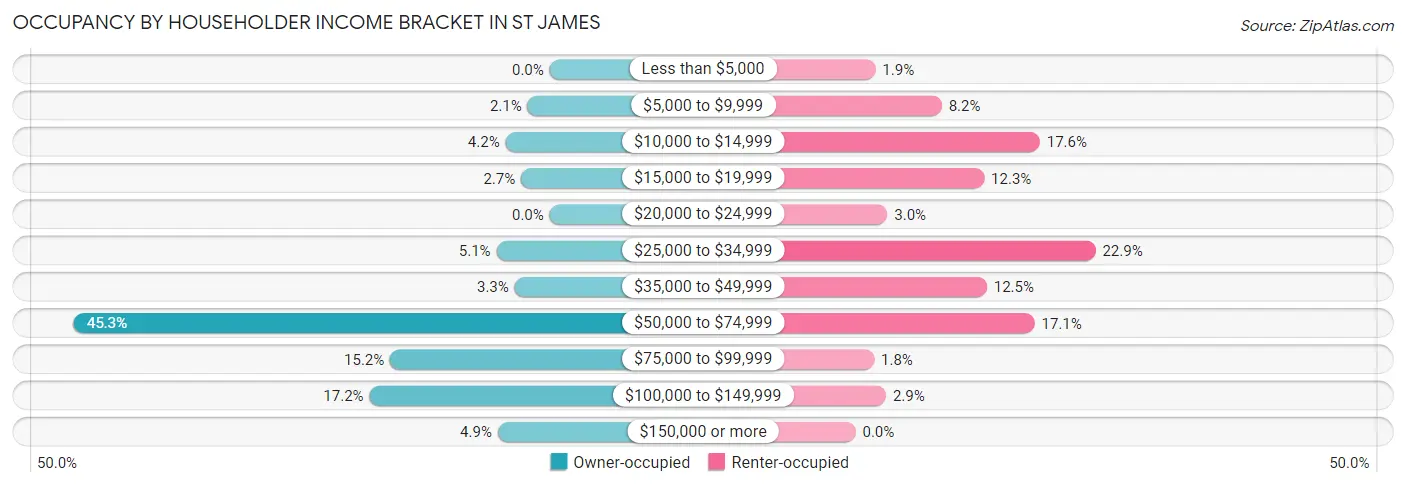
| Income Bracket | Owner-occupied | Renter-occupied |
| Less than $5,000 | 0 (0.0%) | 15 (1.9%) |
| $5,000 to $9,999 | 17 (2.1%) | 65 (8.2%) |
| $10,000 to $14,999 | 34 (4.2%) | 139 (17.5%) |
| $15,000 to $19,999 | 22 (2.7%) | 97 (12.2%) |
| $20,000 to $24,999 | 0 (0.0%) | 24 (3.0%) |
| $25,000 to $34,999 | 41 (5.1%) | 181 (22.9%) |
| $35,000 to $49,999 | 27 (3.3%) | 99 (12.5%) |
| $50,000 to $74,999 | 367 (45.3%) | 135 (17.1%) |
| $75,000 to $99,999 | 123 (15.2%) | 14 (1.8%) |
| $100,000 to $149,999 | 139 (17.2%) | 23 (2.9%) |
| $150,000 or more | 40 (4.9%) | 0 (0.0%) |
| Total | 810 (100.0%) | 792 (100.0%) |
Monthly Housing Cost Tiers in St James
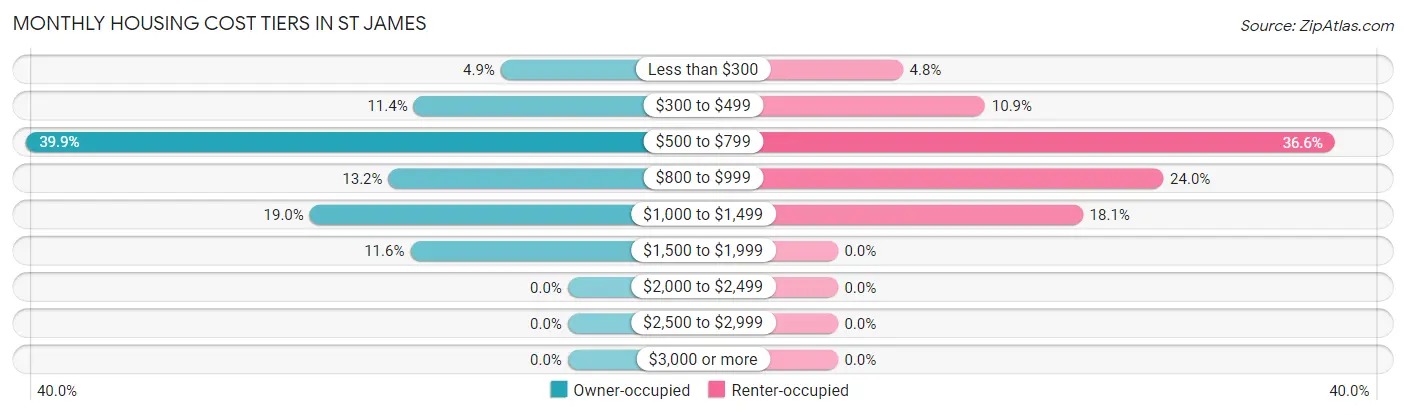
| Monthly Cost | Owner-occupied | Renter-occupied |
| Less than $300 | 40 (4.9%) | 38 (4.8%) |
| $300 to $499 | 92 (11.4%) | 86 (10.9%) |
| $500 to $799 | 323 (39.9%) | 290 (36.6%) |
| $800 to $999 | 107 (13.2%) | 190 (24.0%) |
| $1,000 to $1,499 | 154 (19.0%) | 143 (18.1%) |
| $1,500 to $1,999 | 94 (11.6%) | 0 (0.0%) |
| $2,000 to $2,499 | 0 (0.0%) | 0 (0.0%) |
| $2,500 to $2,999 | 0 (0.0%) | 0 (0.0%) |
| $3,000 or more | 0 (0.0%) | 0 (0.0%) |
| Total | 810 (100.0%) | 792 (100.0%) |
Physical Housing Characteristics in St James
Housing Structures in St James
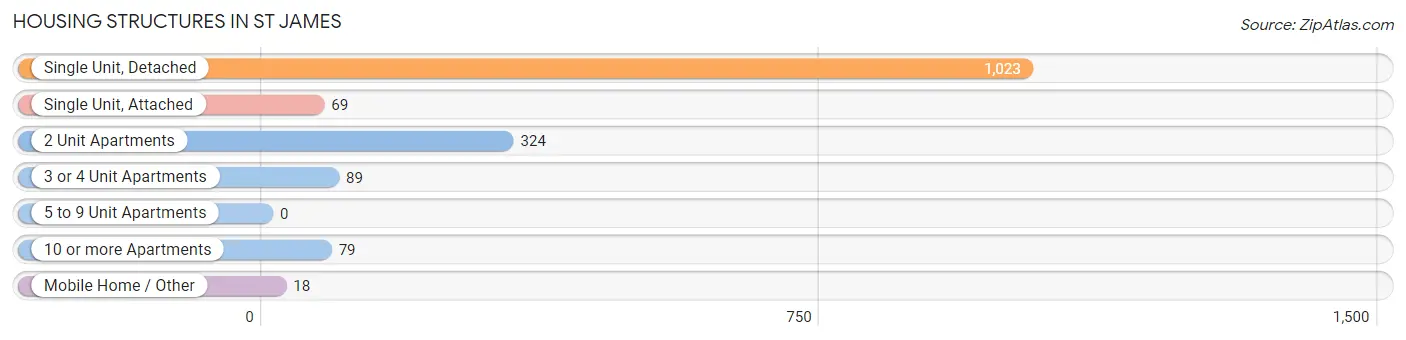
| Structure Type | # Housing Units | % Housing Units |
| Single Unit, Detached | 1,023 | 63.9% |
| Single Unit, Attached | 69 | 4.3% |
| 2 Unit Apartments | 324 | 20.2% |
| 3 or 4 Unit Apartments | 89 | 5.6% |
| 5 to 9 Unit Apartments | 0 | 0.0% |
| 10 or more Apartments | 79 | 4.9% |
| Mobile Home / Other | 18 | 1.1% |
| Total | 1,602 | 100.0% |
Housing Structures by Occupancy in St James
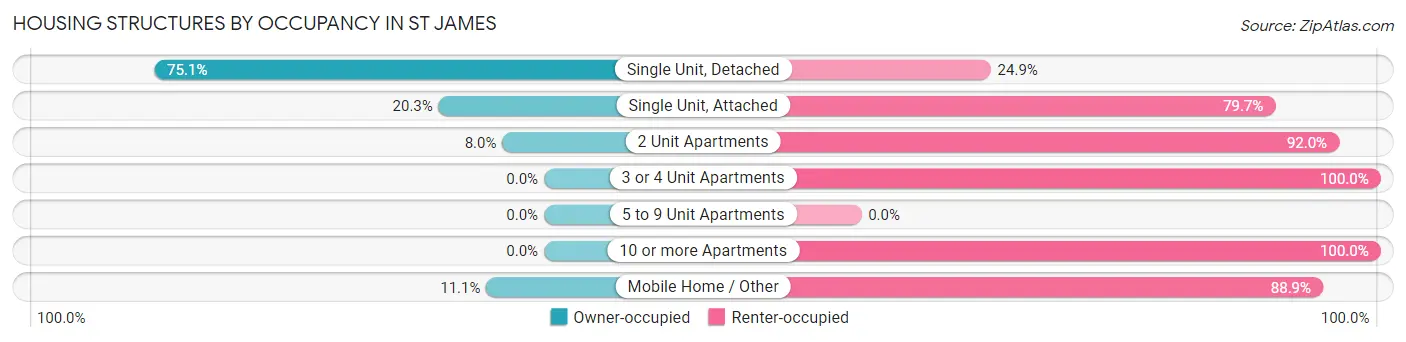
| Structure Type | Owner-occupied | Renter-occupied |
| Single Unit, Detached | 768 (75.1%) | 255 (24.9%) |
| Single Unit, Attached | 14 (20.3%) | 55 (79.7%) |
| 2 Unit Apartments | 26 (8.0%) | 298 (92.0%) |
| 3 or 4 Unit Apartments | 0 (0.0%) | 89 (100.0%) |
| 5 to 9 Unit Apartments | 0 (0.0%) | 0 (0.0%) |
| 10 or more Apartments | 0 (0.0%) | 79 (100.0%) |
| Mobile Home / Other | 2 (11.1%) | 16 (88.9%) |
| Total | 810 (50.6%) | 792 (49.4%) |
Housing Structures by Number of Rooms in St James
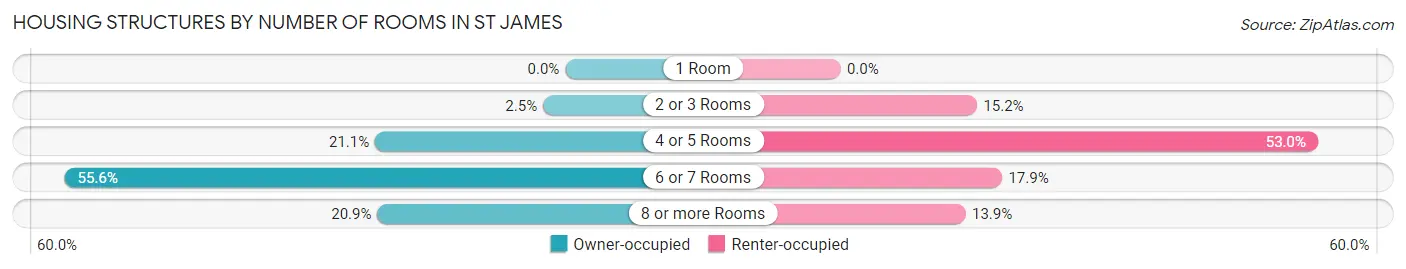
| Number of Rooms | Owner-occupied | Renter-occupied |
| 1 Room | 0 (0.0%) | 0 (0.0%) |
| 2 or 3 Rooms | 20 (2.5%) | 120 (15.1%) |
| 4 or 5 Rooms | 171 (21.1%) | 420 (53.0%) |
| 6 or 7 Rooms | 450 (55.6%) | 142 (17.9%) |
| 8 or more Rooms | 169 (20.9%) | 110 (13.9%) |
| Total | 810 (100.0%) | 792 (100.0%) |
Housing Structure by Heating Type in St James
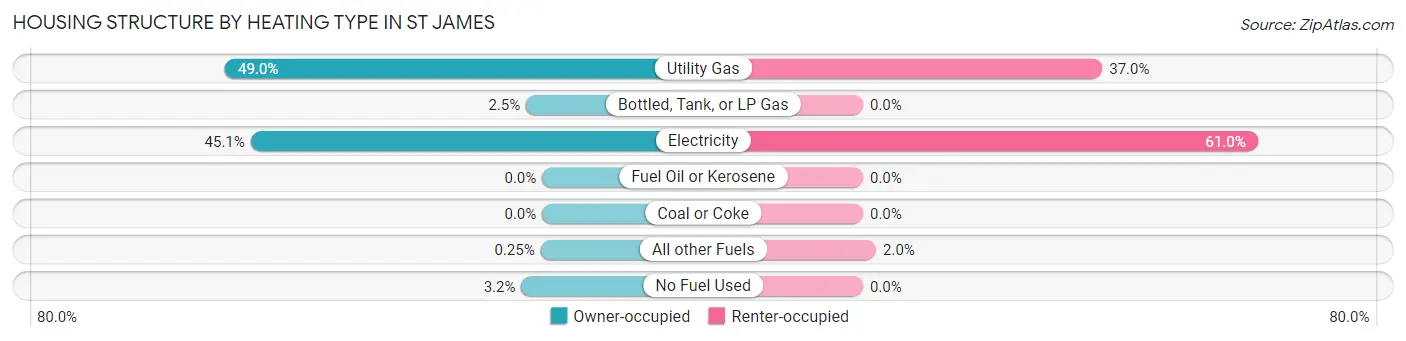
| Heating Type | Owner-occupied | Renter-occupied |
| Utility Gas | 397 (49.0%) | 293 (37.0%) |
| Bottled, Tank, or LP Gas | 20 (2.5%) | 0 (0.0%) |
| Electricity | 365 (45.1%) | 483 (61.0%) |
| Fuel Oil or Kerosene | 0 (0.0%) | 0 (0.0%) |
| Coal or Coke | 0 (0.0%) | 0 (0.0%) |
| All other Fuels | 2 (0.3%) | 16 (2.0%) |
| No Fuel Used | 26 (3.2%) | 0 (0.0%) |
| Total | 810 (100.0%) | 792 (100.0%) |
Household Vehicle Usage in St James
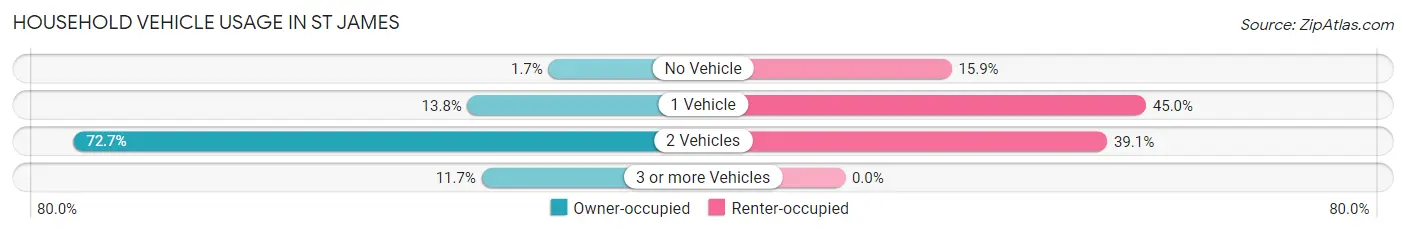
| Vehicles per Household | Owner-occupied | Renter-occupied |
| No Vehicle | 14 (1.7%) | 126 (15.9%) |
| 1 Vehicle | 112 (13.8%) | 356 (45.0%) |
| 2 Vehicles | 589 (72.7%) | 310 (39.1%) |
| 3 or more Vehicles | 95 (11.7%) | 0 (0.0%) |
| Total | 810 (100.0%) | 792 (100.0%) |
Real Estate & Mortgages in St James
Real Estate and Mortgage Overview in St James
| Characteristic | Without Mortgage | With Mortgage |
| Housing Units | 338 | 472 |
| Median Property Value | $116,200 | $111,800 |
| Median Household Income | $51,168 | $26 |
| Monthly Housing Costs | $584 | $0 |
| Real Estate Taxes | $900 | $0 |
Property Value by Mortgage Status in St James
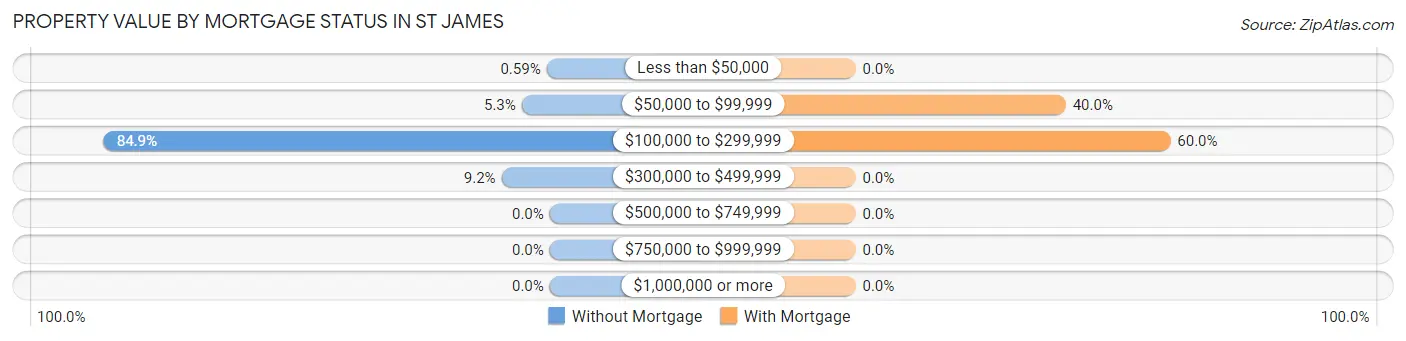
| Property Value | Without Mortgage | With Mortgage |
| Less than $50,000 | 2 (0.6%) | 0 (0.0%) |
| $50,000 to $99,999 | 18 (5.3%) | 189 (40.0%) |
| $100,000 to $299,999 | 287 (84.9%) | 283 (60.0%) |
| $300,000 to $499,999 | 31 (9.2%) | 0 (0.0%) |
| $500,000 to $749,999 | 0 (0.0%) | 0 (0.0%) |
| $750,000 to $999,999 | 0 (0.0%) | 0 (0.0%) |
| $1,000,000 or more | 0 (0.0%) | 0 (0.0%) |
| Total | 338 (100.0%) | 472 (100.0%) |
Household Income by Mortgage Status in St James
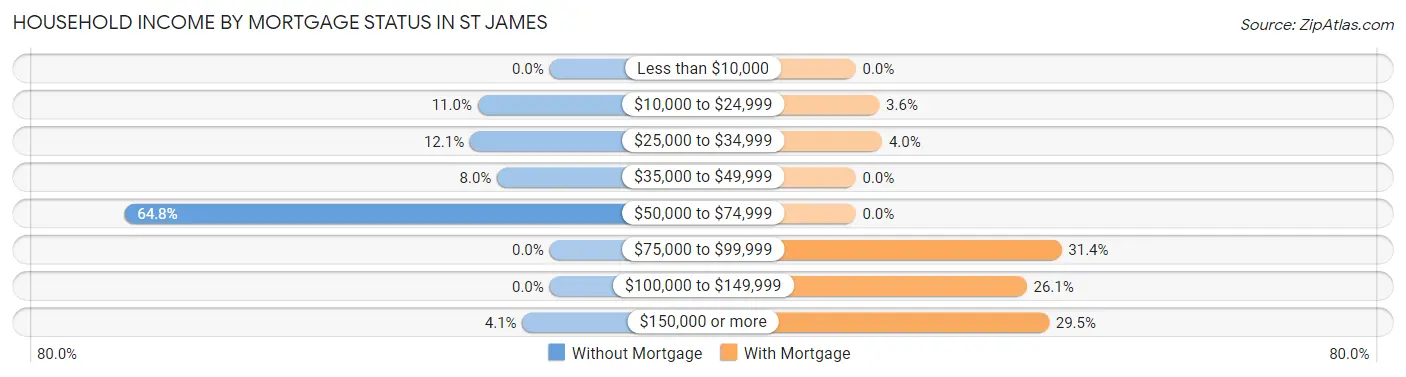
| Household Income | Without Mortgage | With Mortgage |
| Less than $10,000 | 0 (0.0%) | 0 (0.0%) |
| $10,000 to $24,999 | 37 (11.0%) | 17 (3.6%) |
| $25,000 to $34,999 | 41 (12.1%) | 19 (4.0%) |
| $35,000 to $49,999 | 27 (8.0%) | 0 (0.0%) |
| $50,000 to $74,999 | 219 (64.8%) | 0 (0.0%) |
| $75,000 to $99,999 | 0 (0.0%) | 148 (31.4%) |
| $100,000 to $149,999 | 0 (0.0%) | 123 (26.1%) |
| $150,000 or more | 14 (4.1%) | 139 (29.4%) |
| Total | 338 (100.0%) | 472 (100.0%) |
Property Value to Household Income Ratio in St James
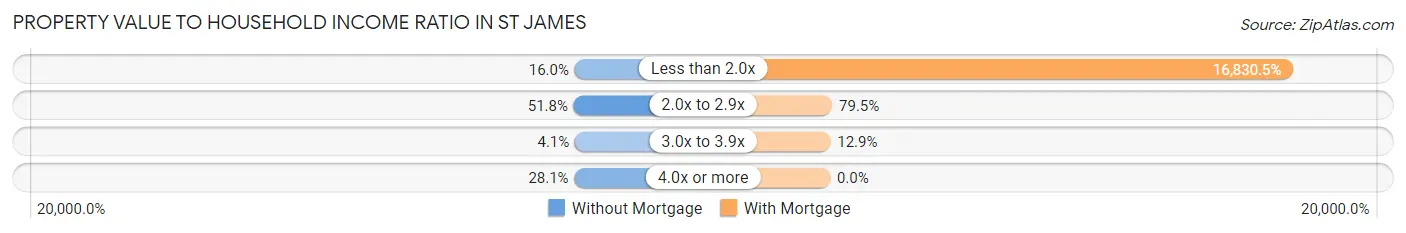
| Value-to-Income Ratio | Without Mortgage | With Mortgage |
| Less than 2.0x | 54 (16.0%) | 79,440 (16,830.5%) |
| 2.0x to 2.9x | 175 (51.8%) | 375 (79.4%) |
| 3.0x to 3.9x | 14 (4.1%) | 61 (12.9%) |
| 4.0x or more | 95 (28.1%) | 0 (0.0%) |
| Total | 338 (100.0%) | 472 (100.0%) |
Real Estate Taxes by Mortgage Status in St James
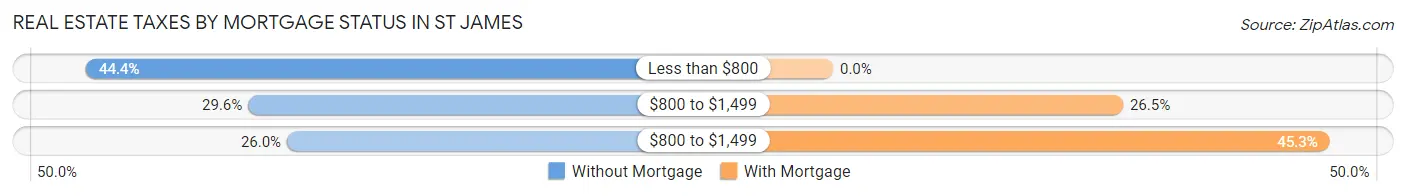
| Property Taxes | Without Mortgage | With Mortgage |
| Less than $800 | 150 (44.4%) | 0 (0.0%) |
| $800 to $1,499 | 100 (29.6%) | 125 (26.5%) |
| $800 to $1,499 | 88 (26.0%) | 214 (45.3%) |
| Total | 338 (100.0%) | 472 (100.0%) |
Health & Disability in St James
Health Insurance Coverage by Age in St James
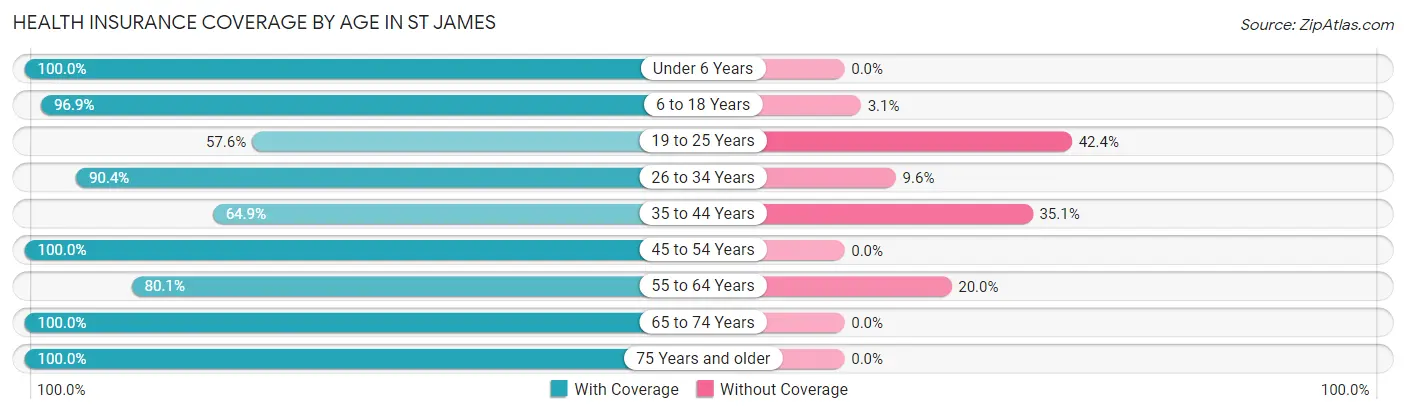
| Age Bracket | With Coverage | Without Coverage |
| Under 6 Years | 379 (100.0%) | 0 (0.0%) |
| 6 to 18 Years | 601 (96.9%) | 19 (3.1%) |
| 19 to 25 Years | 182 (57.6%) | 134 (42.4%) |
| 26 to 34 Years | 434 (90.4%) | 46 (9.6%) |
| 35 to 44 Years | 246 (64.9%) | 133 (35.1%) |
| 45 to 54 Years | 400 (100.0%) | 0 (0.0%) |
| 55 to 64 Years | 313 (80.0%) | 78 (20.0%) |
| 65 to 74 Years | 332 (100.0%) | 0 (0.0%) |
| 75 Years and older | 386 (100.0%) | 0 (0.0%) |
| Total | 3,273 (88.9%) | 410 (11.1%) |
Health Insurance Coverage by Citizenship Status in St James
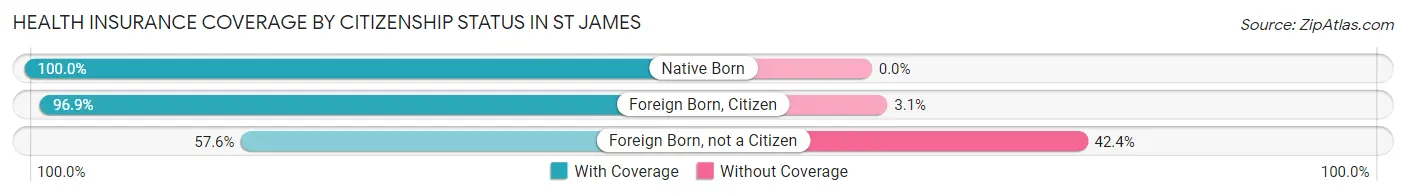
| Citizenship Status | With Coverage | Without Coverage |
| Native Born | 379 (100.0%) | 0 (0.0%) |
| Foreign Born, Citizen | 601 (96.9%) | 19 (3.1%) |
| Foreign Born, not a Citizen | 182 (57.6%) | 134 (42.4%) |
Health Insurance Coverage by Household Income in St James
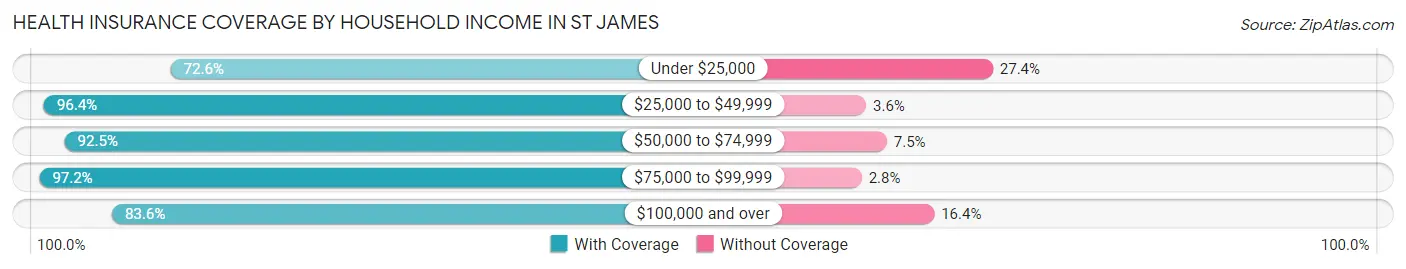
| Household Income | With Coverage | Without Coverage |
| Under $25,000 | 520 (72.6%) | 196 (27.4%) |
| $25,000 to $49,999 | 745 (96.4%) | 28 (3.6%) |
| $50,000 to $74,999 | 1,047 (92.5%) | 85 (7.5%) |
| $75,000 to $99,999 | 522 (97.2%) | 15 (2.8%) |
| $100,000 and over | 439 (83.6%) | 86 (16.4%) |
Public vs Private Health Insurance Coverage by Age in St James
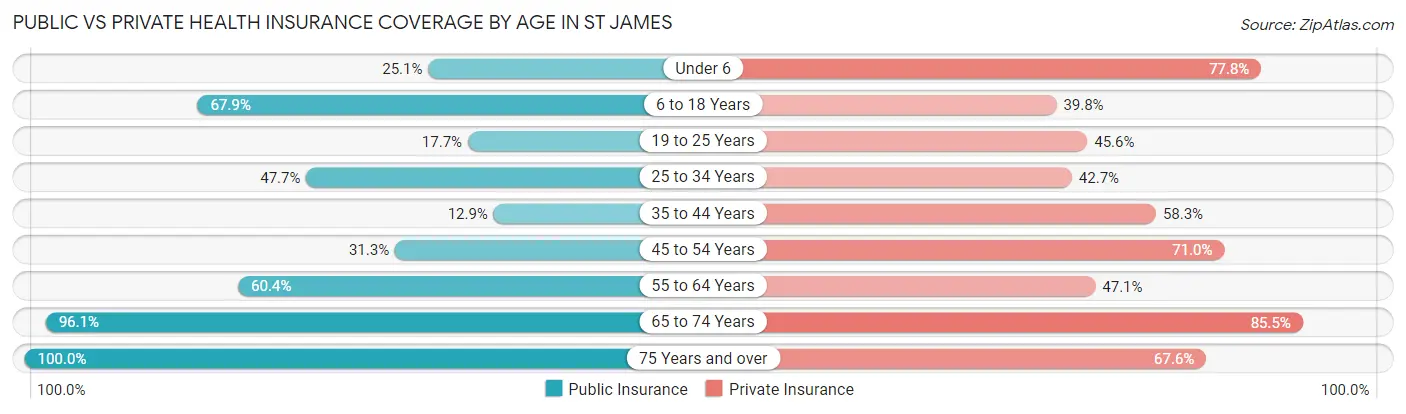
| Age Bracket | Public Insurance | Private Insurance |
| Under 6 | 95 (25.1%) | 295 (77.8%) |
| 6 to 18 Years | 421 (67.9%) | 247 (39.8%) |
| 19 to 25 Years | 56 (17.7%) | 144 (45.6%) |
| 25 to 34 Years | 229 (47.7%) | 205 (42.7%) |
| 35 to 44 Years | 49 (12.9%) | 221 (58.3%) |
| 45 to 54 Years | 125 (31.2%) | 284 (71.0%) |
| 55 to 64 Years | 236 (60.4%) | 184 (47.1%) |
| 65 to 74 Years | 319 (96.1%) | 284 (85.5%) |
| 75 Years and over | 386 (100.0%) | 261 (67.6%) |
| Total | 1,916 (52.0%) | 2,125 (57.7%) |
Disability Status by Sex by Age in St James
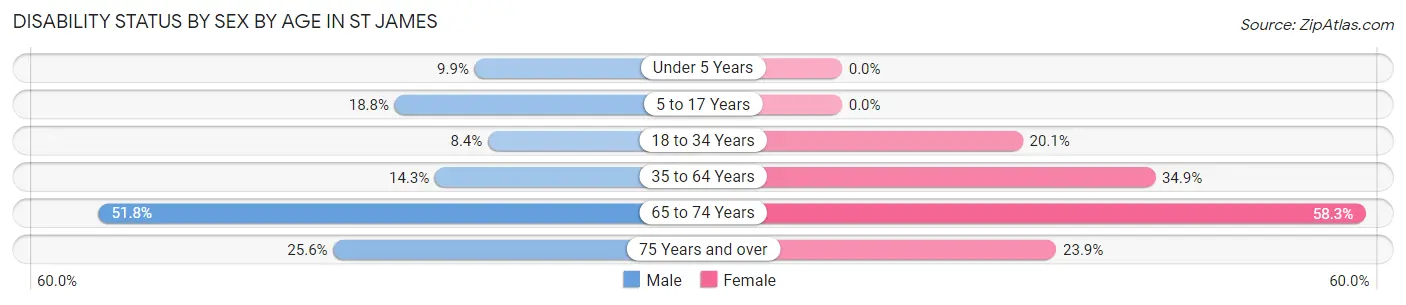
| Age Bracket | Male | Female |
| Under 5 Years | 23 (9.9%) | 0 (0.0%) |
| 5 to 17 Years | 73 (18.8%) | 0 (0.0%) |
| 18 to 34 Years | 28 (8.4%) | 93 (20.1%) |
| 35 to 64 Years | 75 (14.3%) | 225 (34.9%) |
| 65 to 74 Years | 59 (51.7%) | 127 (58.3%) |
| 75 Years and over | 42 (25.6%) | 53 (23.9%) |
Disability Class by Sex by Age in St James
Disability Class: Hearing Difficulty
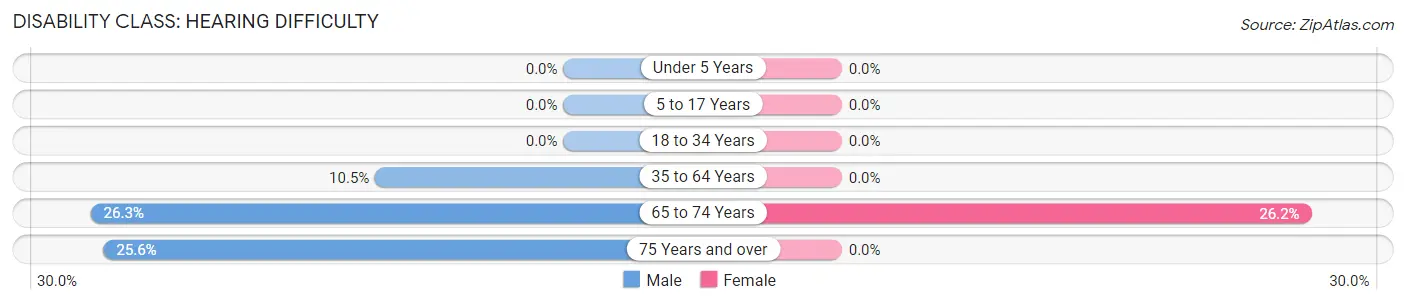
| Age Bracket | Male | Female |
| Under 5 Years | 0 (0.0%) | 0 (0.0%) |
| 5 to 17 Years | 0 (0.0%) | 0 (0.0%) |
| 18 to 34 Years | 0 (0.0%) | 0 (0.0%) |
| 35 to 64 Years | 55 (10.5%) | 0 (0.0%) |
| 65 to 74 Years | 30 (26.3%) | 57 (26.2%) |
| 75 Years and over | 42 (25.6%) | 0 (0.0%) |
Disability Class: Vision Difficulty
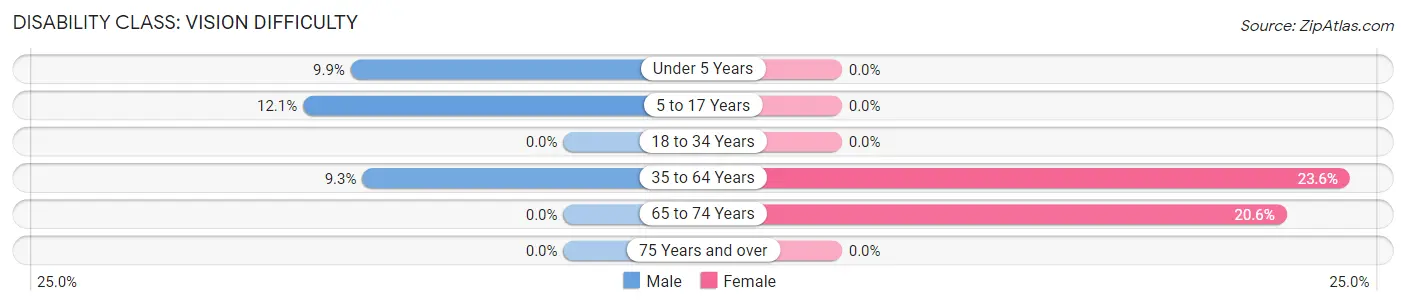
| Age Bracket | Male | Female |
| Under 5 Years | 23 (9.9%) | 0 (0.0%) |
| 5 to 17 Years | 47 (12.1%) | 0 (0.0%) |
| 18 to 34 Years | 0 (0.0%) | 0 (0.0%) |
| 35 to 64 Years | 49 (9.3%) | 152 (23.6%) |
| 65 to 74 Years | 0 (0.0%) | 45 (20.6%) |
| 75 Years and over | 0 (0.0%) | 0 (0.0%) |
Disability Class: Cognitive Difficulty
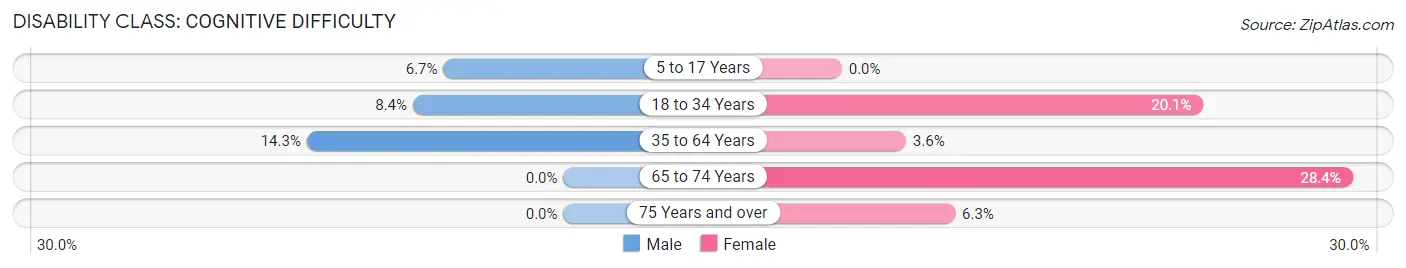
| Age Bracket | Male | Female |
| 5 to 17 Years | 26 (6.7%) | 0 (0.0%) |
| 18 to 34 Years | 28 (8.4%) | 93 (20.1%) |
| 35 to 64 Years | 75 (14.3%) | 23 (3.6%) |
| 65 to 74 Years | 0 (0.0%) | 62 (28.4%) |
| 75 Years and over | 0 (0.0%) | 14 (6.3%) |
Disability Class: Ambulatory Difficulty
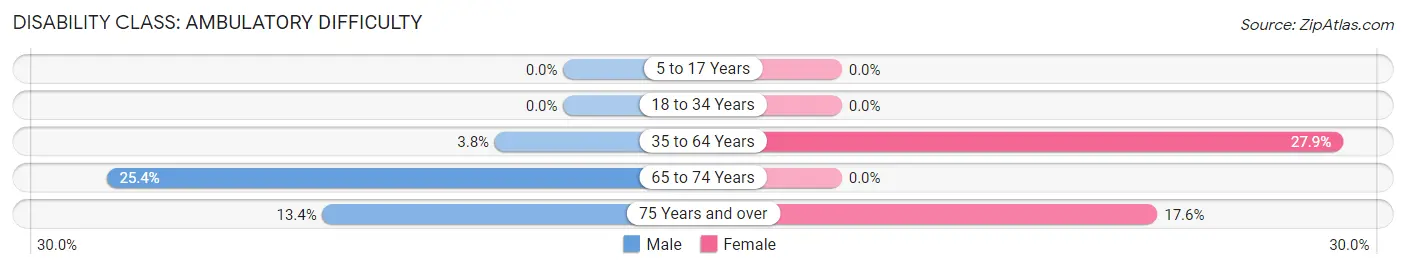
| Age Bracket | Male | Female |
| 5 to 17 Years | 0 (0.0%) | 0 (0.0%) |
| 18 to 34 Years | 0 (0.0%) | 0 (0.0%) |
| 35 to 64 Years | 20 (3.8%) | 180 (27.9%) |
| 65 to 74 Years | 29 (25.4%) | 0 (0.0%) |
| 75 Years and over | 22 (13.4%) | 39 (17.6%) |
Disability Class: Self-Care Difficulty
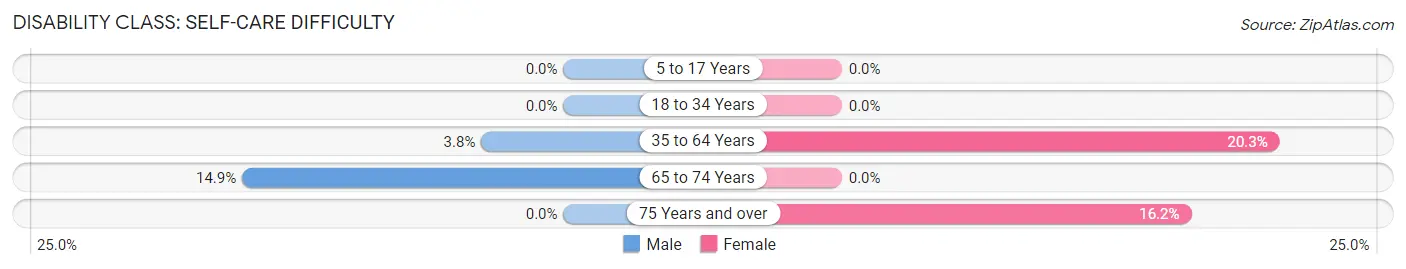
| Age Bracket | Male | Female |
| 5 to 17 Years | 0 (0.0%) | 0 (0.0%) |
| 18 to 34 Years | 0 (0.0%) | 0 (0.0%) |
| 35 to 64 Years | 20 (3.8%) | 131 (20.3%) |
| 65 to 74 Years | 17 (14.9%) | 0 (0.0%) |
| 75 Years and over | 0 (0.0%) | 36 (16.2%) |
Technology Access in St James
Computing Device Access in St James
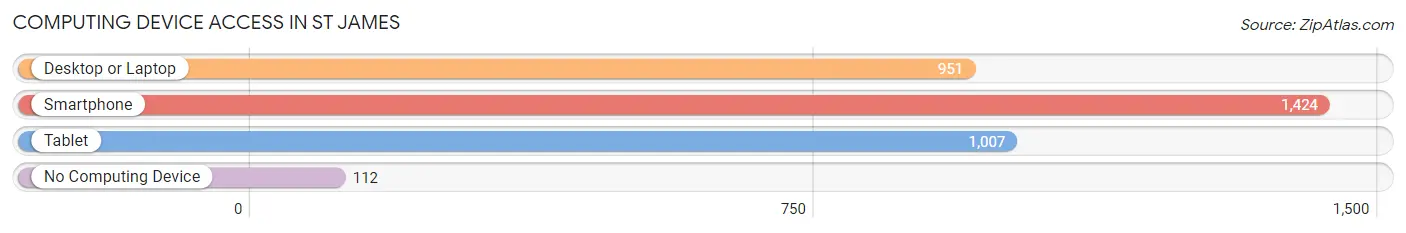
| Device Type | # Households | % Households |
| Desktop or Laptop | 951 | 59.4% |
| Smartphone | 1,424 | 88.9% |
| Tablet | 1,007 | 62.9% |
| No Computing Device | 112 | 7.0% |
| Total | 1,602 | 100.0% |
Internet Access in St James
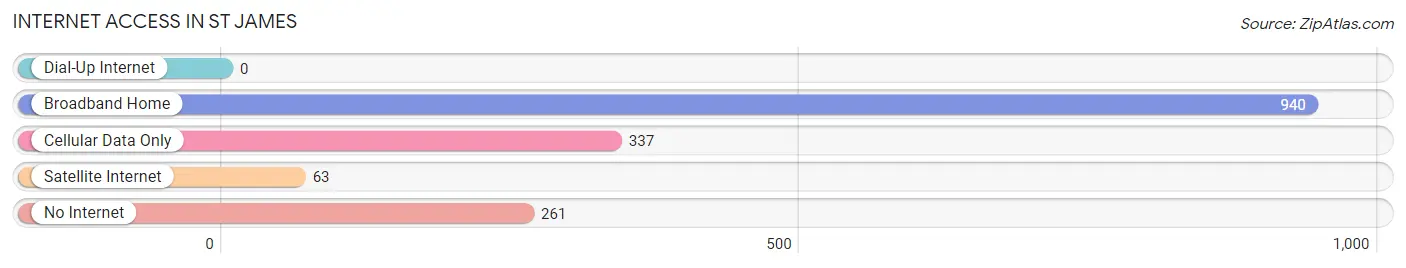
| Internet Type | # Households | % Households |
| Dial-Up Internet | 0 | 0.0% |
| Broadband Home | 940 | 58.7% |
| Cellular Data Only | 337 | 21.0% |
| Satellite Internet | 63 | 3.9% |
| No Internet | 261 | 16.3% |
| Total | 1,602 | 100.0% |
St James Summary
St. James, Missouri is a small town located in the heart of the Ozarks in Phelps County. It is situated on the banks of the Meramec River and is surrounded by rolling hills and lush forests. The town has a population of approximately 2,500 people and is known for its rural charm and friendly atmosphere.
History
St. James was founded in 1859 by a group of settlers from Kentucky and Tennessee. The town was named after the nearby St. James Church, which was built in 1858. The town quickly grew and by the late 1800s, it had become a thriving community with a variety of businesses, including a sawmill, a gristmill, a blacksmith shop, and a general store.
In the early 1900s, St. James was a popular destination for tourists, who came to enjoy the area’s natural beauty and outdoor activities. The town was also home to a number of resorts, including the St. James Hotel, which was built in 1910.
Geography
St. James is located in the Ozark Mountains of Missouri, about 50 miles south of St. Louis. The town is situated on the banks of the Meramec River and is surrounded by rolling hills and lush forests. The town is located at an elevation of 890 feet and has a total area of 1.2 square miles.
Economy
St. James is a small, rural town with a limited economy. The town’s main industries are tourism and agriculture. The town is home to several small businesses, including a grocery store, a hardware store, and a few restaurants.
The town is also home to a number of tourist attractions, including the St. James Hotel, the St. James Museum, and the St. James State Park. The town is also home to a number of outdoor activities, including fishing, hunting, and camping.
Demographics
As of the 2010 census, St. James had a population of 2,500 people. The town is predominantly white, with a small African American population. The median household income is $37,000 and the median home value is $90,000.
St. James is a small, rural town with a friendly atmosphere and a strong sense of community. The town is known for its natural beauty and outdoor activities, and is a popular destination for tourists and outdoor enthusiasts.
Common Questions
What is Per Capita Income in St James?
Per Capita income in St James is $23,646.
What is the Median Family Income in St James?
Median Family Income in St James is $53,148.
What is the Median Household income in St James?
Median Household Income in St James is $50,730.
What is Income or Wage Gap in St James?
Income or Wage Gap in St James is 34.5%.
Women in St James earn 65.5 cents for every dollar earned by a man.
What is Inequality or Gini Index in St James?
Inequality or Gini Index in St James is 0.42.
What is the Total Population of St James?
Total Population of St James is 3,942.
What is the Total Male Population of St James?
Total Male Population of St James is 1,921.
What is the Total Female Population of St James?
Total Female Population of St James is 2,021.
What is the Ratio of Males per 100 Females in St James?
There are 95.05 Males per 100 Females in St James.
What is the Ratio of Females per 100 Males in St James?
There are 105.21 Females per 100 Males in St James.
What is the Median Population Age in St James?
Median Population Age in St James is 37.2 Years.
What is the Average Family Size in St James
Average Family Size in St James is 2.8 People.
What is the Average Household Size in St James
Average Household Size in St James is 2.3 People.
How Large is the Labor Force in St James?
There are 1,683 People in the Labor Forcein in St James.
What is the Percentage of People in the Labor Force in St James?
56.3% of People are in the Labor Force in St James.
What is the Unemployment Rate in St James?
Unemployment Rate in St James is 6.4%.