Zip Codes with the Highest Percentage of Population Employed in Legal Services & Support in Independence, MO
RELATED REPORTS & OPTIONS
Legal Services & Support
Independence
Compare Zip Codes
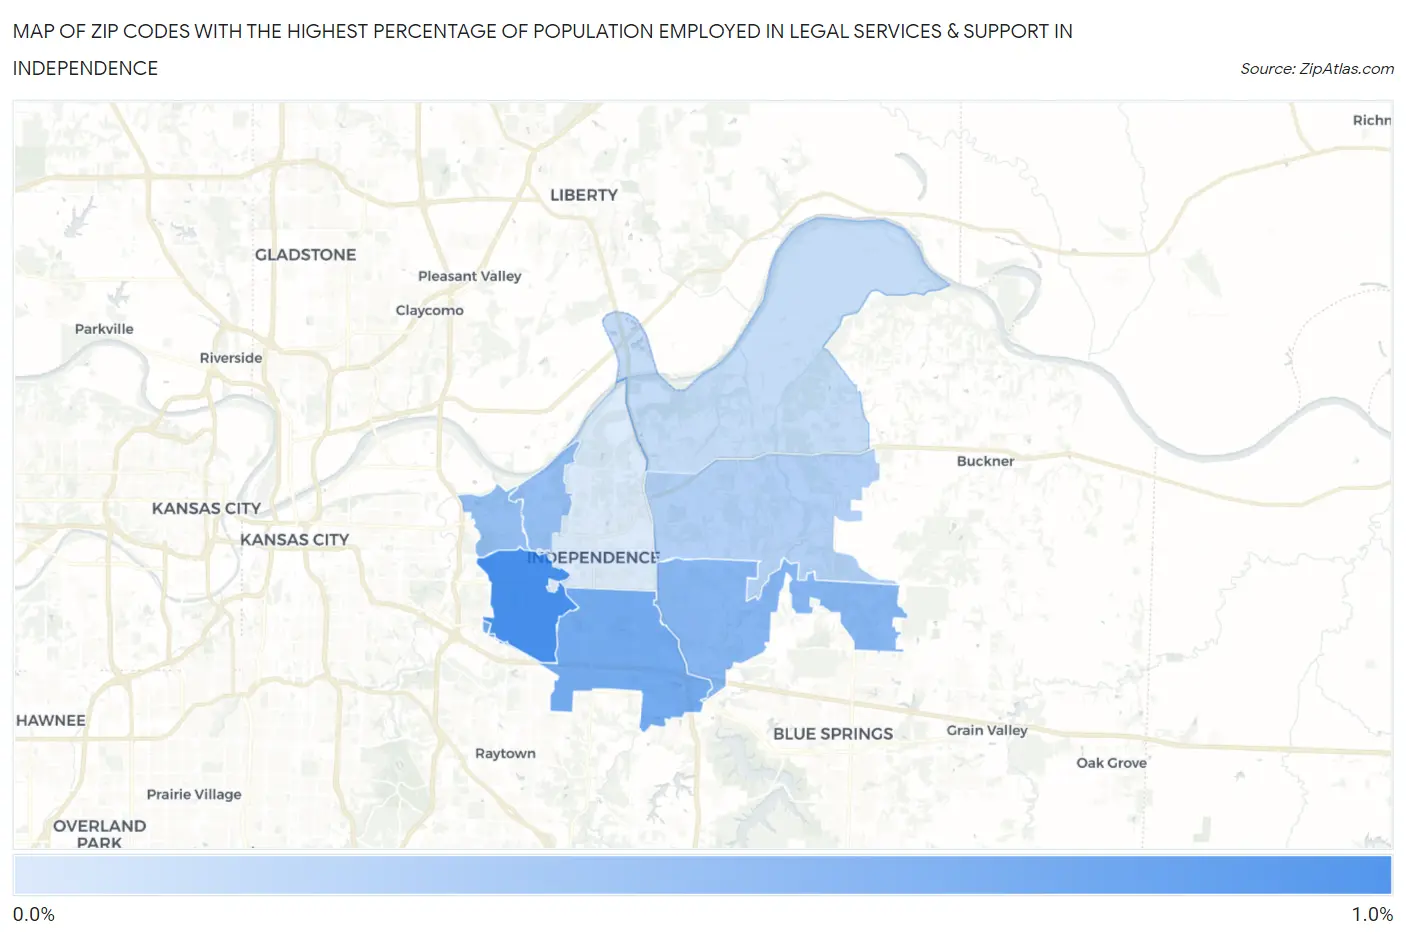
Map of Zip Codes with the Highest Percentage of Population Employed in Legal Services & Support in Independence
0.13%
0.91%
Zip Codes with the Highest Percentage of Population Employed in Legal Services & Support in Independence, MO
| Zip Code | % Employed | vs State | vs National | |
| 1. | 64052 | 0.91% | 0.99%(-0.083)#182 | 1.2%(-0.277)#8,540 |
| 2. | 64055 | 0.67% | 0.99%(-0.324)#235 | 1.2%(-0.517)#10,763 |
| 3. | 64057 | 0.58% | 0.99%(-0.412)#250 | 1.2%(-0.606)#11,712 |
| 4. | 64054 | 0.50% | 0.99%(-0.488)#274 | 1.2%(-0.681)#12,592 |
| 5. | 64053 | 0.50% | 0.99%(-0.494)#277 | 1.2%(-0.687)#12,679 |
| 6. | 64056 | 0.34% | 0.99%(-0.646)#329 | 1.2%(-0.839)#14,535 |
| 7. | 64058 | 0.26% | 0.99%(-0.732)#355 | 1.2%(-0.926)#15,547 |
| 8. | 64050 | 0.13% | 0.99%(-0.856)#393 | 1.2%(-1.05)#16,836 |
1
Common Questions
What are the Top 5 Zip Codes with the Highest Percentage of Population Employed in Legal Services & Support in Independence, MO?
Top 5 Zip Codes with the Highest Percentage of Population Employed in Legal Services & Support in Independence, MO are:
What zip code has the Highest Percentage of Population Employed in Legal Services & Support in Independence, MO?
64052 has the Highest Percentage of Population Employed in Legal Services & Support in Independence, MO with 0.91%.
What is the Percentage of Population Employed in Legal Services & Support in Independence, MO?
Percentage of Population Employed in Legal Services & Support in Independence is 0.57%.
What is the Percentage of Population Employed in Legal Services & Support in Missouri?
Percentage of Population Employed in Legal Services & Support in Missouri is 0.99%.
What is the Percentage of Population Employed in Legal Services & Support in the United States?
Percentage of Population Employed in Legal Services & Support in the United States is 1.2%.