St Elizabeth, MO Map & Demographics
St Elizabeth Map
St Elizabeth Overview
$28,947
PER CAPITA INCOME
$98,438
AVG FAMILY INCOME
$90,000
AVG HOUSEHOLD INCOME
2.8%
WAGE / INCOME GAP [ % ]
97.2¢/ $1
WAGE / INCOME GAP [ $ ]
0.33
INEQUALITY / GINI INDEX
527
TOTAL POPULATION
244
MALE POPULATION
283
FEMALE POPULATION
86.22
MALES / 100 FEMALES
115.98
FEMALES / 100 MALES
28.2
MEDIAN AGE
3.7
AVG FAMILY SIZE
3.3
AVG HOUSEHOLD SIZE
217
LABOR FORCE [ PEOPLE ]
63.3%
PERCENT IN LABOR FORCE
1.9%
UNEMPLOYMENT RATE
St Elizabeth Area Codes
Income in St Elizabeth
Income Overview in St Elizabeth
Per Capita Income in St Elizabeth is $28,947, while median incomes of families and households are $98,438 and $90,000 respectively.
| Characteristic | Number | Measure |
| Per Capita Income | 527 | $28,947 |
| Median Family Income | 117 | $98,438 |
| Mean Family Income | 117 | $107,856 |
| Median Household Income | 146 | $90,000 |
| Mean Household Income | 146 | $98,842 |
| Income Deficit | 117 | $0 |
| Wage / Income Gap (%) | 527 | 2.78% |
| Wage / Income Gap ($) | 527 | 97.22¢ per $1 |
| Gini / Inequality Index | 527 | 0.33 |
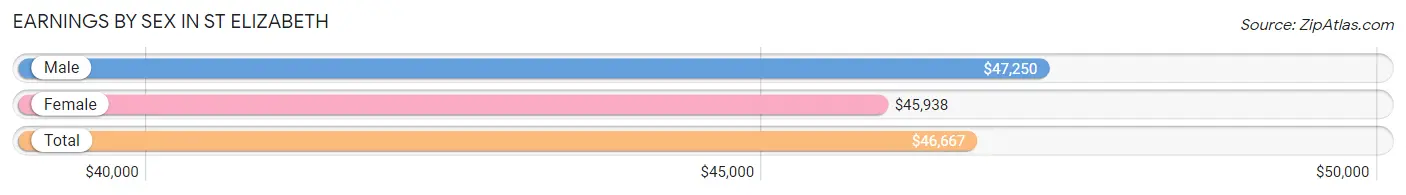
Earnings by Sex in St Elizabeth
Average Earnings in St Elizabeth are $46,667, $47,250 for men and $45,938 for women, a difference of 2.8%.
| Sex | Number | Average Earnings |
| Male | 117 (50.0%) | $47,250 |
| Female | 117 (50.0%) | $45,938 |
| Total | 234 (100.0%) | $46,667 |
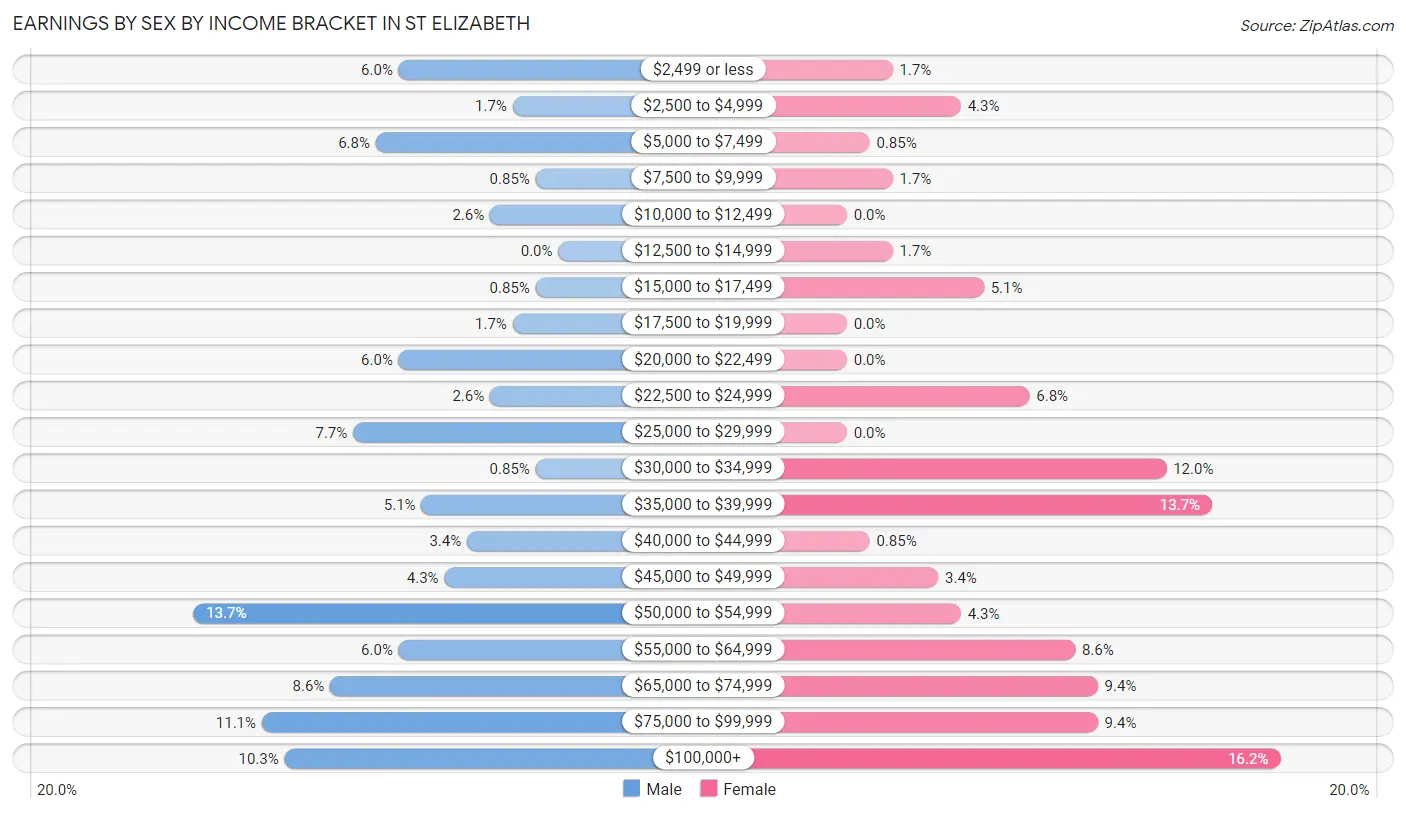
Earnings by Sex by Income Bracket in St Elizabeth
The most common earnings brackets in St Elizabeth are $50,000 to $54,999 for men (16 | 13.7%) and $100,000+ for women (19 | 16.2%).
| Income | Male | Female |
| $2,499 or less | 7 (6.0%) | 2 (1.7%) |
| $2,500 to $4,999 | 2 (1.7%) | 5 (4.3%) |
| $5,000 to $7,499 | 8 (6.8%) | 1 (0.9%) |
| $7,500 to $9,999 | 1 (0.9%) | 2 (1.7%) |
| $10,000 to $12,499 | 3 (2.6%) | 0 (0.0%) |
| $12,500 to $14,999 | 0 (0.0%) | 2 (1.7%) |
| $15,000 to $17,499 | 1 (0.9%) | 6 (5.1%) |
| $17,500 to $19,999 | 2 (1.7%) | 0 (0.0%) |
| $20,000 to $22,499 | 7 (6.0%) | 0 (0.0%) |
| $22,500 to $24,999 | 3 (2.6%) | 8 (6.8%) |
| $25,000 to $29,999 | 9 (7.7%) | 0 (0.0%) |
| $30,000 to $34,999 | 1 (0.9%) | 14 (12.0%) |
| $35,000 to $39,999 | 6 (5.1%) | 16 (13.7%) |
| $40,000 to $44,999 | 4 (3.4%) | 1 (0.9%) |
| $45,000 to $49,999 | 5 (4.3%) | 4 (3.4%) |
| $50,000 to $54,999 | 16 (13.7%) | 5 (4.3%) |
| $55,000 to $64,999 | 7 (6.0%) | 10 (8.6%) |
| $65,000 to $74,999 | 10 (8.6%) | 11 (9.4%) |
| $75,000 to $99,999 | 13 (11.1%) | 11 (9.4%) |
| $100,000+ | 12 (10.3%) | 19 (16.2%) |
| Total | 117 (100.0%) | 117 (100.0%) |
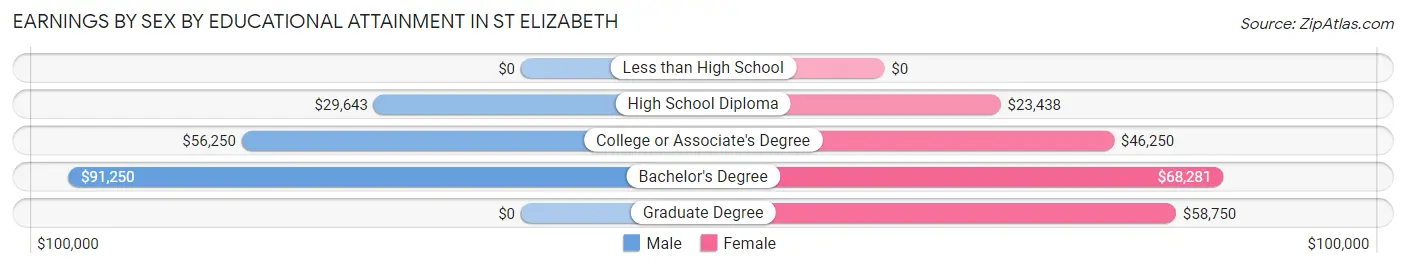
Earnings by Sex by Educational Attainment in St Elizabeth
Average earnings in St Elizabeth are $56,750 for men and $56,250 for women, a difference of 0.9%. Men with an educational attainment of bachelor's degree enjoy the highest average annual earnings of $91,250, while those with high school diploma education earn the least with $29,643. Women with an educational attainment of bachelor's degree earn the most with the average annual earnings of $68,281, while those with high school diploma education have the smallest earnings of $23,438.
| Educational Attainment | Male Income | Female Income |
| Less than High School | - | - |
| High School Diploma | $29,643 | $23,438 |
| College or Associate's Degree | $56,250 | $46,250 |
| Bachelor's Degree | $91,250 | $68,281 |
| Graduate Degree | - | - |
| Total | $56,750 | $56,250 |
Family Income in St Elizabeth
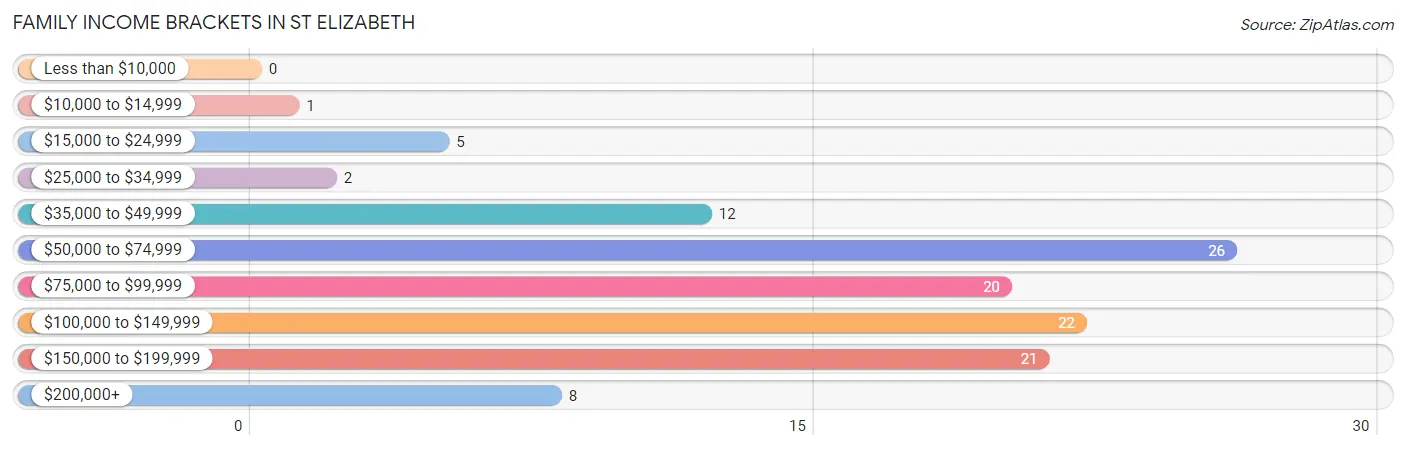
Family Income Brackets in St Elizabeth
According to the St Elizabeth family income data, there are 26 families falling into the $50,000 to $74,999 income range, which is the most common income bracket and makes up 22.2% of all families.
| Income Bracket | # Families | % Families |
| Less than $10,000 | 0 | 0.0% |
| $10,000 to $14,999 | 1 | 0.9% |
| $15,000 to $24,999 | 5 | 4.3% |
| $25,000 to $34,999 | 2 | 1.7% |
| $35,000 to $49,999 | 12 | 10.3% |
| $50,000 to $74,999 | 26 | 22.2% |
| $75,000 to $99,999 | 20 | 17.1% |
| $100,000 to $149,999 | 22 | 18.8% |
| $150,000 to $199,999 | 21 | 17.9% |
| $200,000+ | 8 | 6.8% |
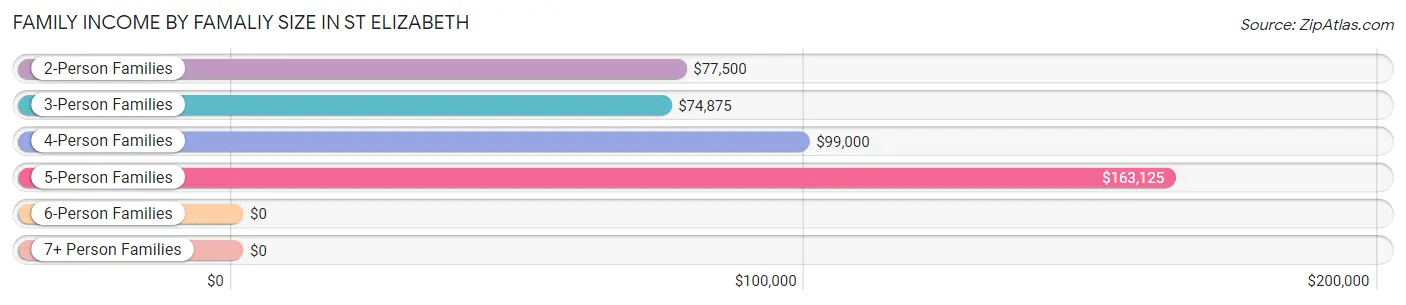
Family Income by Famaliy Size in St Elizabeth
5-person families (11 | 9.4%) account for the highest median family income in St Elizabeth with $163,125 per family, while 2-person families (52 | 44.4%) have the highest median income of $38,750 per family member.
| Income Bracket | # Families | Median Income |
| 2-Person Families | 52 (44.4%) | $77,500 |
| 3-Person Families | 23 (19.7%) | $74,875 |
| 4-Person Families | 26 (22.2%) | $99,000 |
| 5-Person Families | 11 (9.4%) | $163,125 |
| 6-Person Families | 4 (3.4%) | $0 |
| 7+ Person Families | 1 (0.9%) | $0 |
| Total | 117 (100.0%) | $98,438 |
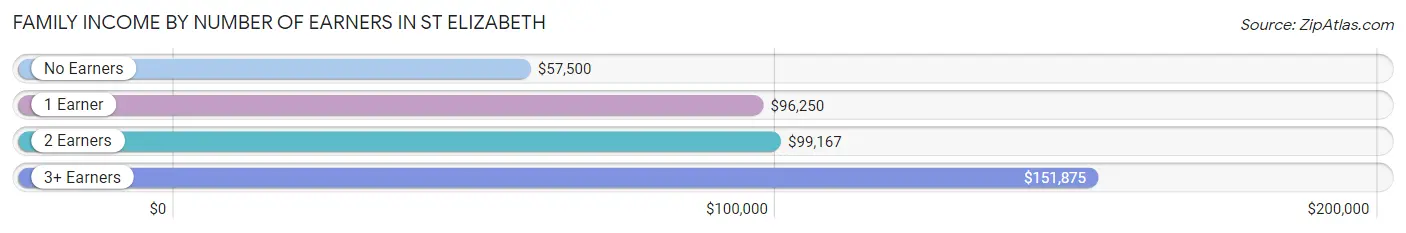
Family Income by Number of Earners in St Elizabeth
The median family income in St Elizabeth is $98,438, with families comprising 3+ earners (5) having the highest median family income of $151,875, while families with no earners (12) have the lowest median family income of $57,500, accounting for 4.3% and 10.3% of families, respectively.
| Number of Earners | # Families | Median Income |
| No Earners | 12 (10.3%) | $57,500 |
| 1 Earner | 30 (25.6%) | $96,250 |
| 2 Earners | 70 (59.8%) | $99,167 |
| 3+ Earners | 5 (4.3%) | $151,875 |
| Total | 117 (100.0%) | $98,438 |
Household Income in St Elizabeth
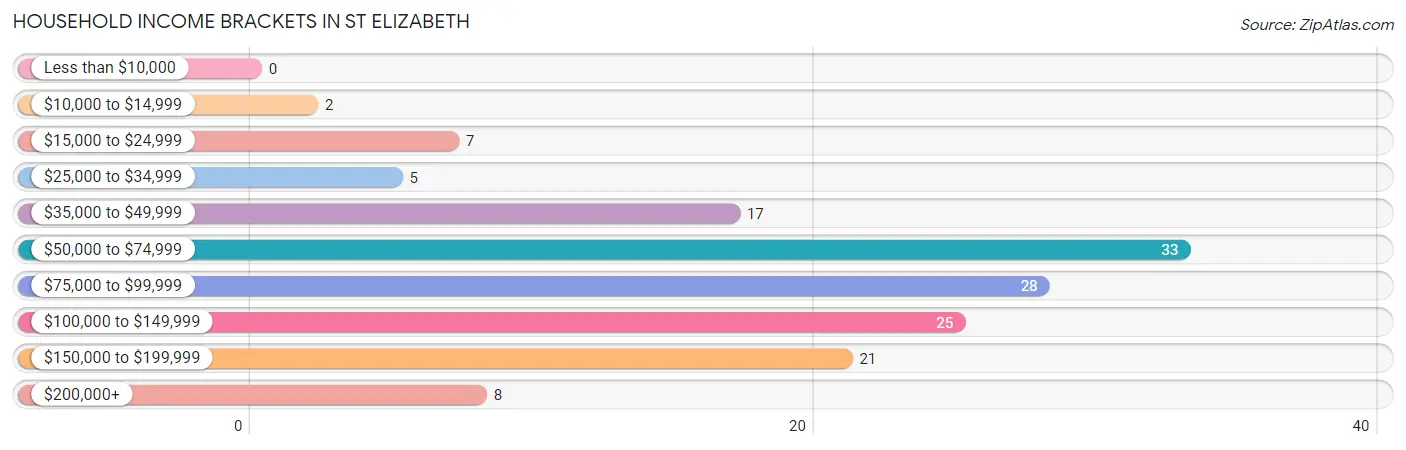
Household Income Brackets in St Elizabeth
With 33 households falling in the category, the $50,000 to $74,999 income range is the most frequent in St Elizabeth, accounting for 22.6% of all households.
| Income Bracket | # Households | % Households |
| Less than $10,000 | 0 | 0.0% |
| $10,000 to $14,999 | 2 | 1.4% |
| $15,000 to $24,999 | 7 | 4.8% |
| $25,000 to $34,999 | 5 | 3.4% |
| $35,000 to $49,999 | 17 | 11.6% |
| $50,000 to $74,999 | 33 | 22.6% |
| $75,000 to $99,999 | 28 | 19.2% |
| $100,000 to $149,999 | 25 | 17.1% |
| $150,000 to $199,999 | 21 | 14.4% |
| $200,000+ | 8 | 5.5% |
Household Income by Householder Age in St Elizabeth
The median household income in St Elizabeth is $90,000, with the highest median household income of $143,750 found in the 45 to 64 years age bracket for the primary householder. A total of 31 households (21.2%) fall into this category. Meanwhile, the 15 to 24 years age bracket for the primary householder has the lowest median household income of $51,667, with 22 households (15.1%) in this group.
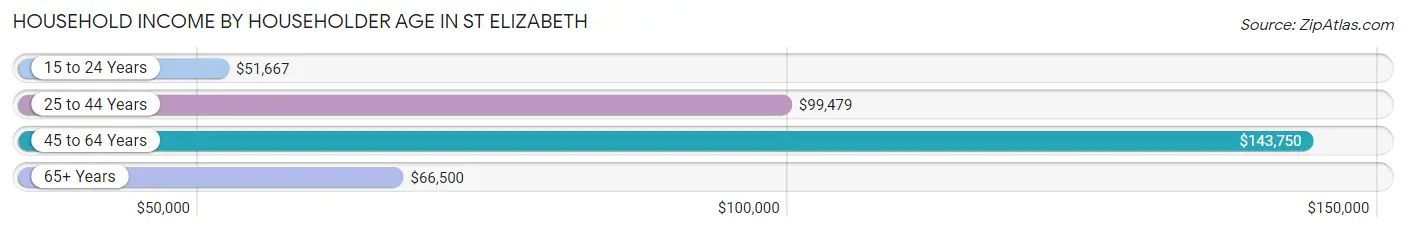
| Income Bracket | # Households | Median Income |
| 15 to 24 Years | 22 (15.1%) | $51,667 |
| 25 to 44 Years | 63 (43.1%) | $99,479 |
| 45 to 64 Years | 31 (21.2%) | $143,750 |
| 65+ Years | 30 (20.5%) | $66,500 |
| Total | 146 (100.0%) | $90,000 |
Poverty in St Elizabeth
Income Below Poverty by Sex and Age in St Elizabeth
With 2.1% poverty level for males and 2.4% for females among the residents of St Elizabeth, 12 to 14 year old males and 18 to 24 year old females are the most vulnerable to poverty, with 1 males (20.0%) and 4 females (25.0%) in their respective age groups living below the poverty level.
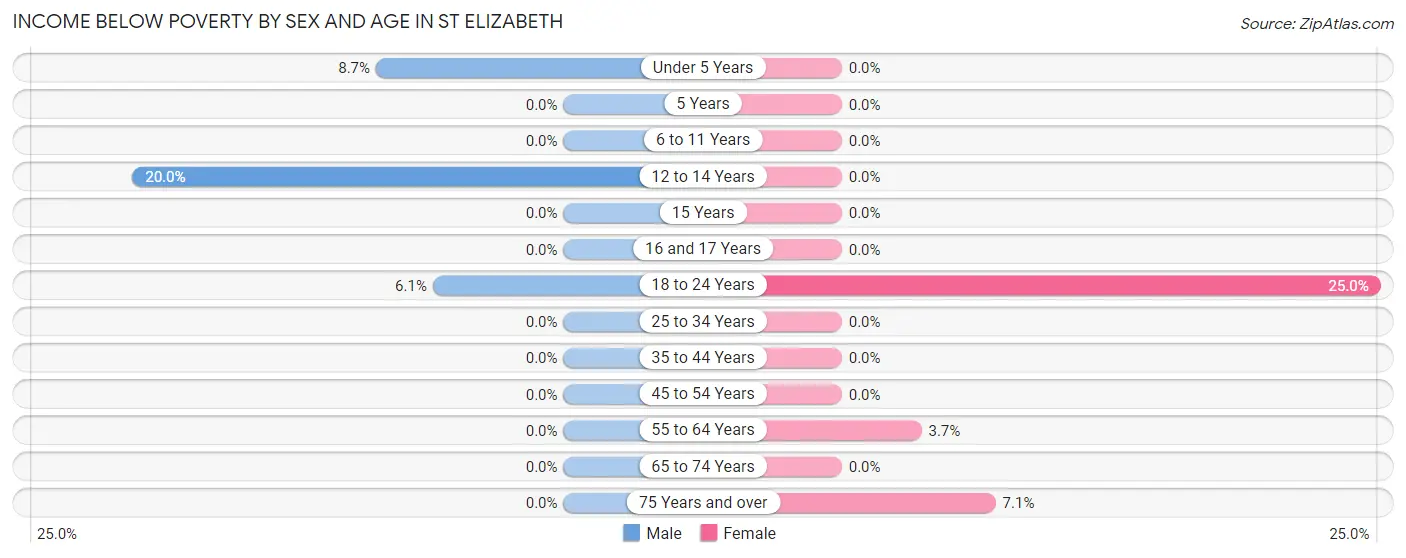
| Age Bracket | Male | Female |
| Under 5 Years | 2 (8.7%) | 0 (0.0%) |
| 5 Years | 0 (0.0%) | 0 (0.0%) |
| 6 to 11 Years | 0 (0.0%) | 0 (0.0%) |
| 12 to 14 Years | 1 (20.0%) | 0 (0.0%) |
| 15 Years | 0 (0.0%) | 0 (0.0%) |
| 16 and 17 Years | 0 (0.0%) | 0 (0.0%) |
| 18 to 24 Years | 2 (6.1%) | 4 (25.0%) |
| 25 to 34 Years | 0 (0.0%) | 0 (0.0%) |
| 35 to 44 Years | 0 (0.0%) | 0 (0.0%) |
| 45 to 54 Years | 0 (0.0%) | 0 (0.0%) |
| 55 to 64 Years | 0 (0.0%) | 1 (3.7%) |
| 65 to 74 Years | 0 (0.0%) | 0 (0.0%) |
| 75 Years and over | 0 (0.0%) | 1 (7.1%) |
| Total | 5 (2.1%) | 6 (2.4%) |
Income Above Poverty by Sex and Age in St Elizabeth
According to the poverty statistics in St Elizabeth, males aged 5 years and females aged under 5 years are the age groups that are most secure financially, with 100.0% of males and 100.0% of females in these age groups living above the poverty line.
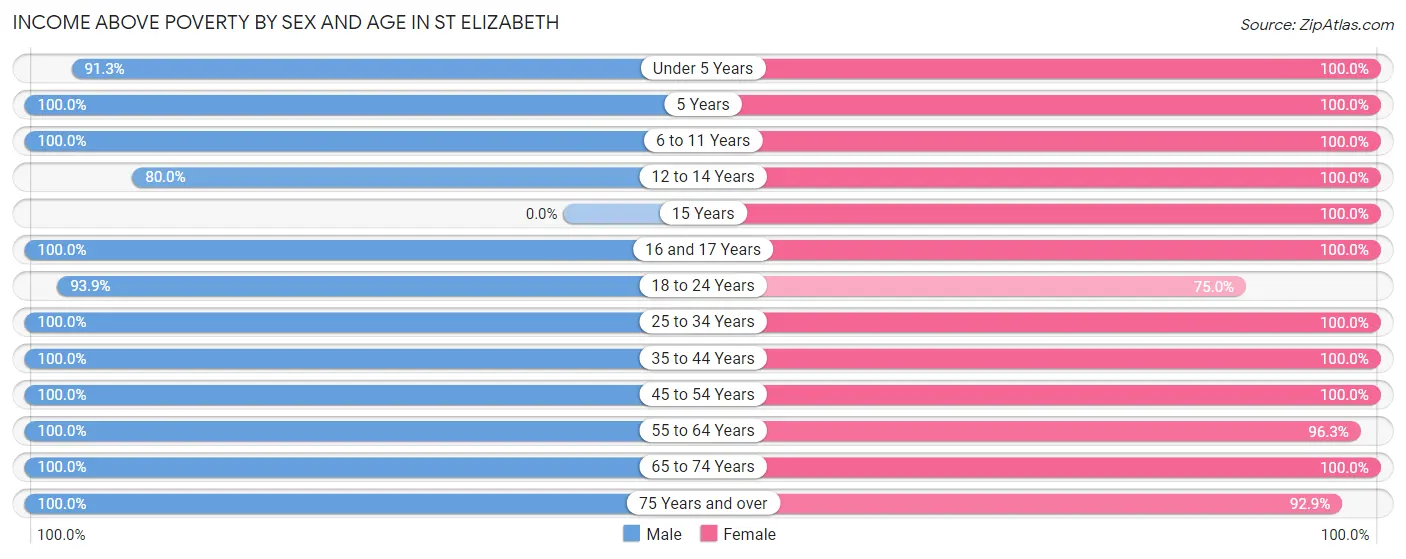
| Age Bracket | Male | Female |
| Under 5 Years | 21 (91.3%) | 36 (100.0%) |
| 5 Years | 4 (100.0%) | 5 (100.0%) |
| 6 to 11 Years | 55 (100.0%) | 14 (100.0%) |
| 12 to 14 Years | 4 (80.0%) | 23 (100.0%) |
| 15 Years | 0 (0.0%) | 19 (100.0%) |
| 16 and 17 Years | 11 (100.0%) | 4 (100.0%) |
| 18 to 24 Years | 31 (93.9%) | 12 (75.0%) |
| 25 to 34 Years | 24 (100.0%) | 35 (100.0%) |
| 35 to 44 Years | 18 (100.0%) | 36 (100.0%) |
| 45 to 54 Years | 20 (100.0%) | 9 (100.0%) |
| 55 to 64 Years | 12 (100.0%) | 26 (96.3%) |
| 65 to 74 Years | 20 (100.0%) | 11 (100.0%) |
| 75 Years and over | 8 (100.0%) | 13 (92.9%) |
| Total | 228 (97.9%) | 243 (97.6%) |
Income Below Poverty Among Married-Couple Families in St Elizabeth
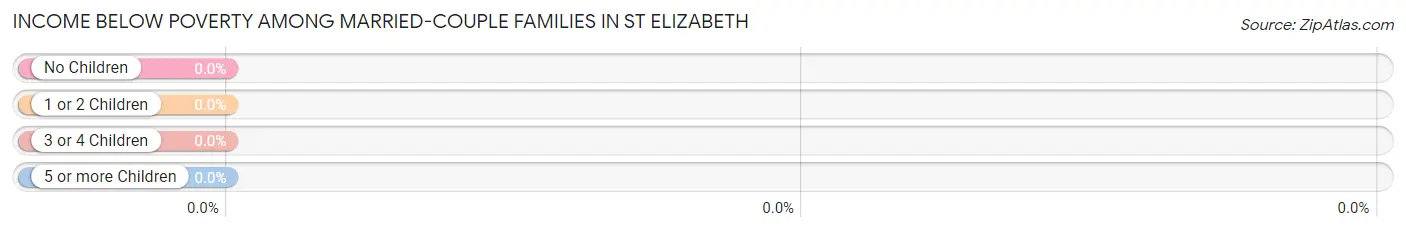
| Children | Above Poverty | Below Poverty |
| No Children | 45 (100.0%) | 0 (0.0%) |
| 1 or 2 Children | 43 (100.0%) | 0 (0.0%) |
| 3 or 4 Children | 14 (100.0%) | 0 (0.0%) |
| 5 or more Children | 1 (100.0%) | 0 (0.0%) |
| Total | 103 (100.0%) | 0 (0.0%) |
Income Below Poverty Among Single-Parent Households in St Elizabeth
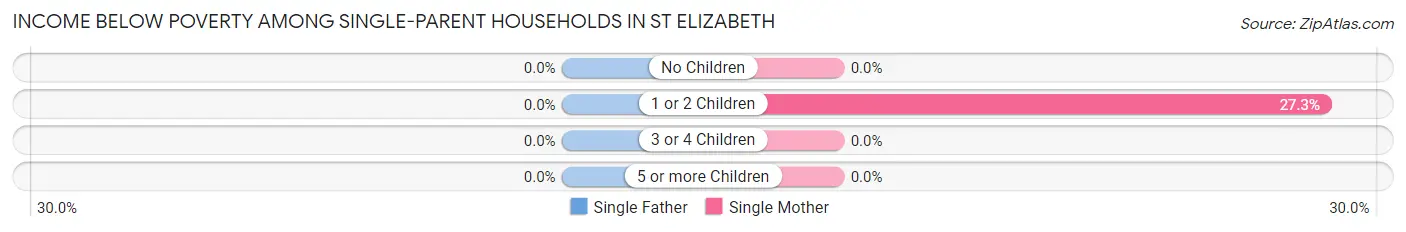
| Children | Single Father | Single Mother |
| No Children | 0 (0.0%) | 0 (0.0%) |
| 1 or 2 Children | 0 (0.0%) | 3 (27.3%) |
| 3 or 4 Children | 0 (0.0%) | 0 (0.0%) |
| 5 or more Children | 0 (0.0%) | 0 (0.0%) |
| Total | 0 (0.0%) | 3 (27.3%) |
Income Below Poverty Among Married-Couple vs Single-Parent Households in St Elizabeth
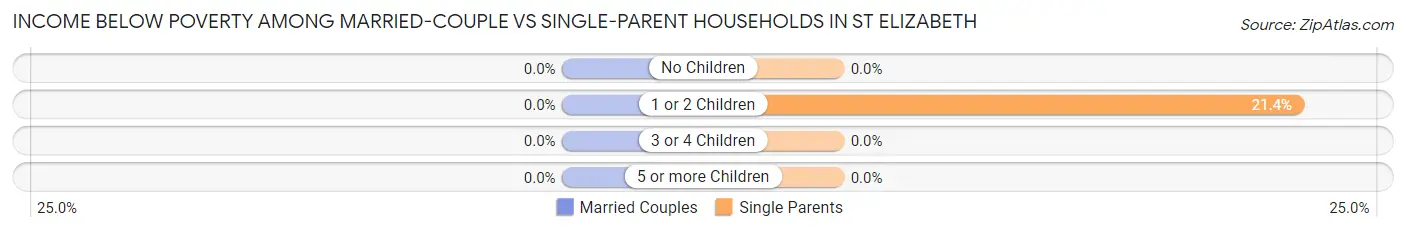
| Children | Married-Couple Families | Single-Parent Households |
| No Children | 0 (0.0%) | 0 (0.0%) |
| 1 or 2 Children | 0 (0.0%) | 3 (21.4%) |
| 3 or 4 Children | 0 (0.0%) | 0 (0.0%) |
| 5 or more Children | 0 (0.0%) | 0 (0.0%) |
| Total | 0 (0.0%) | 3 (21.4%) |
Race in St Elizabeth
The most populous races in St Elizabeth are White / Caucasian (506 | 96.0%), Black / African American (9 | 1.7%), and Two or more Races (7 | 1.3%).
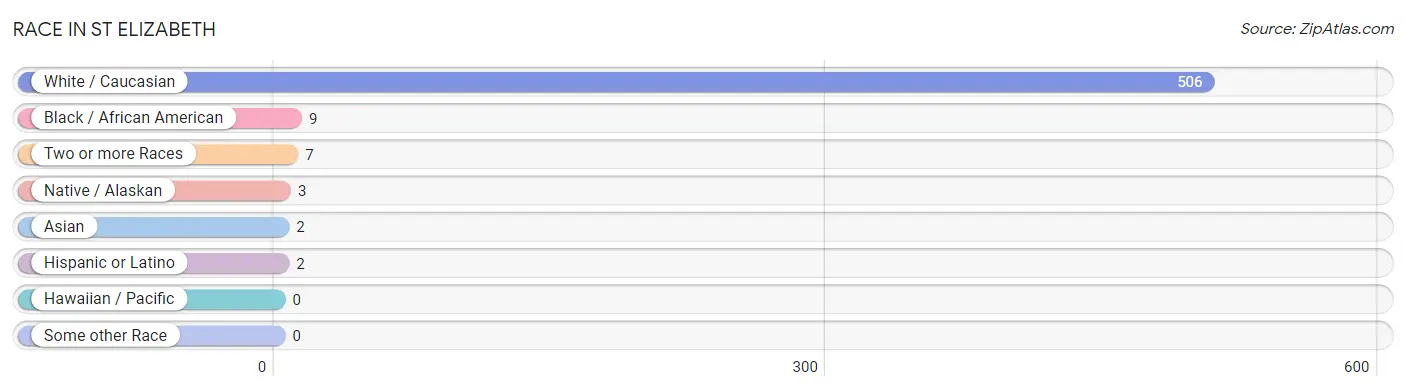
| Race | # Population | % Population |
| Asian | 2 | 0.4% |
| Black / African American | 9 | 1.7% |
| Hawaiian / Pacific | 0 | 0.0% |
| Hispanic or Latino | 2 | 0.4% |
| Native / Alaskan | 3 | 0.6% |
| White / Caucasian | 506 | 96.0% |
| Two or more Races | 7 | 1.3% |
| Some other Race | 0 | 0.0% |
| Total | 527 | 100.0% |
Ancestry in St Elizabeth
The most populous ancestries reported in St Elizabeth are German (324 | 61.5%), Irish (101 | 19.2%), American (24 | 4.5%), English (8 | 1.5%), and Czech (5 | 0.9%), together accounting for 87.7% of all St Elizabeth residents.
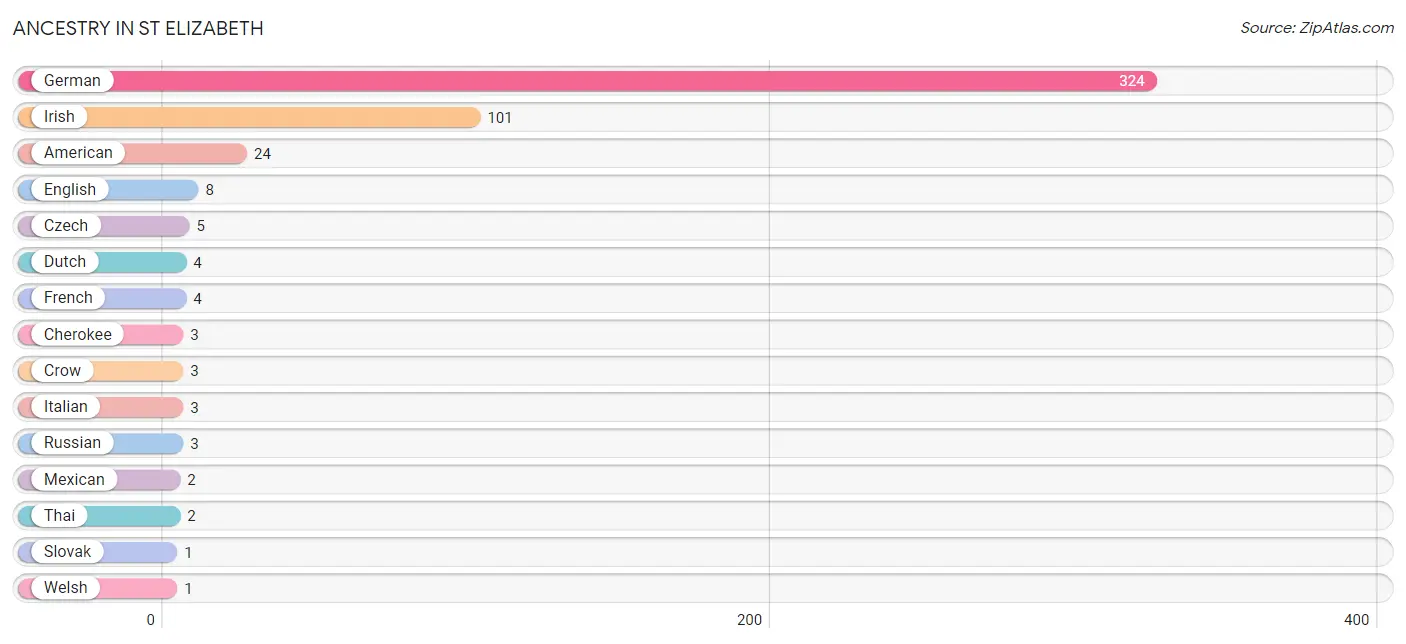
| Ancestry | # Population | % Population |
| American | 24 | 4.5% |
| Cherokee | 3 | 0.6% |
| Crow | 3 | 0.6% |
| Czech | 5 | 0.9% |
| Dutch | 4 | 0.8% |
| English | 8 | 1.5% |
| French | 4 | 0.8% |
| German | 324 | 61.5% |
| Irish | 101 | 19.2% |
| Italian | 3 | 0.6% |
| Mexican | 2 | 0.4% |
| Russian | 3 | 0.6% |
| Slovak | 1 | 0.2% |
| Thai | 2 | 0.4% |
| Welsh | 1 | 0.2% | View All 15 Rows |
Immigrants in St Elizabeth
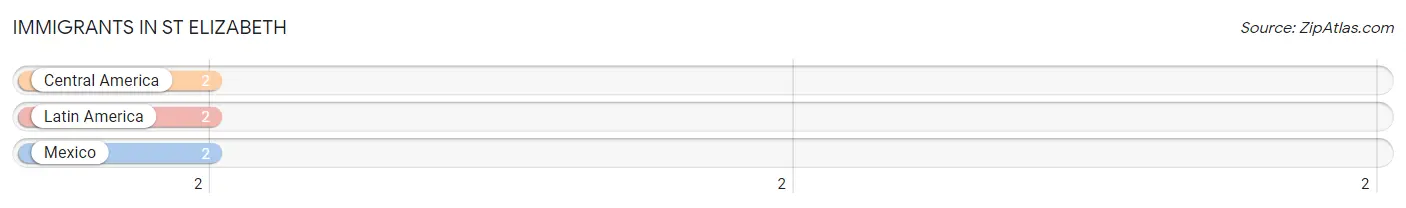
The most numerous immigrant groups reported in St Elizabeth came from Central America (2 | 0.4%), Latin America (2 | 0.4%), and Mexico (2 | 0.4%), together accounting for 1.1% of all St Elizabeth residents.
| Immigration Origin | # Population | % Population |
| Central America | 2 | 0.4% |
| Latin America | 2 | 0.4% |
| Mexico | 2 | 0.4% | View All 3 Rows |
Sex and Age in St Elizabeth
Sex and Age in St Elizabeth
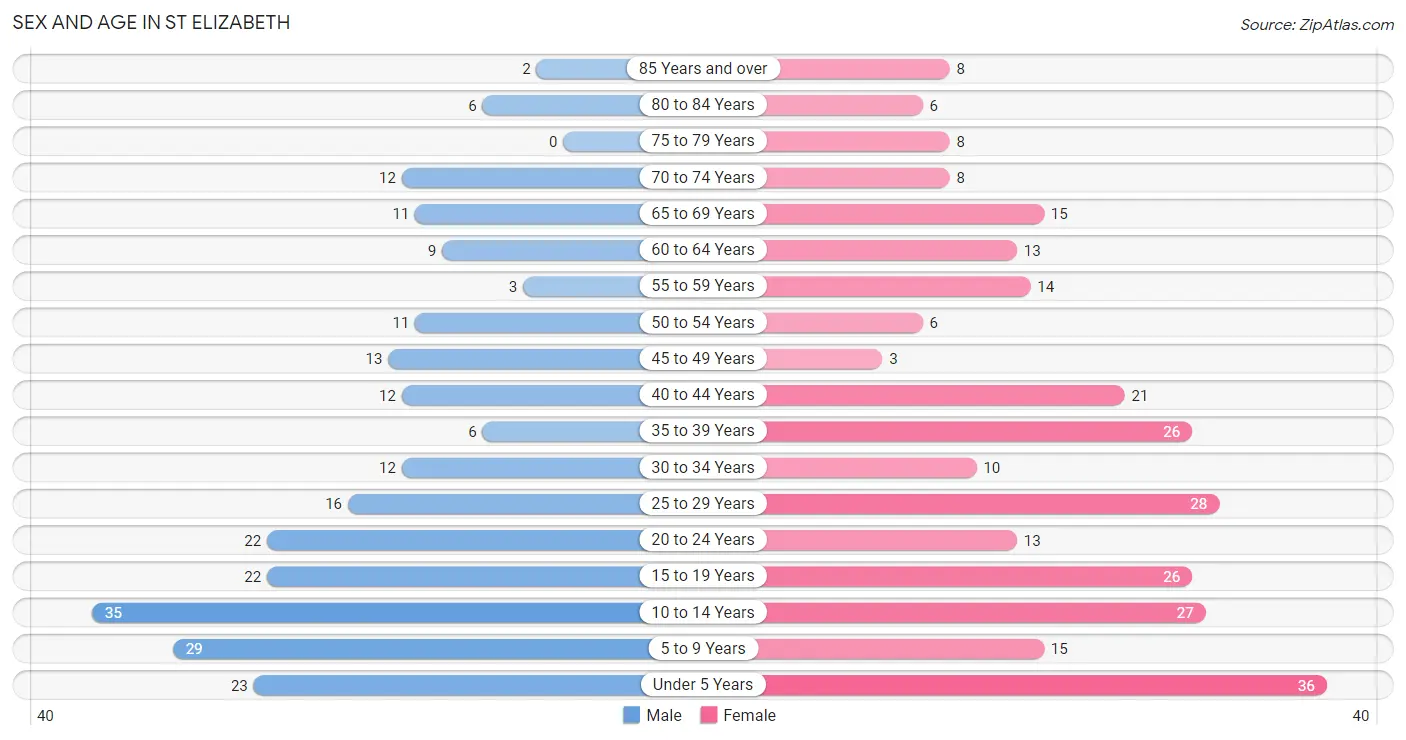
The most populous age groups in St Elizabeth are 10 to 14 Years (35 | 14.3%) for men and Under 5 Years (36 | 12.7%) for women.
| Age Bracket | Male | Female |
| Under 5 Years | 23 (9.4%) | 36 (12.7%) |
| 5 to 9 Years | 29 (11.9%) | 15 (5.3%) |
| 10 to 14 Years | 35 (14.3%) | 27 (9.5%) |
| 15 to 19 Years | 22 (9.0%) | 26 (9.2%) |
| 20 to 24 Years | 22 (9.0%) | 13 (4.6%) |
| 25 to 29 Years | 16 (6.6%) | 28 (9.9%) |
| 30 to 34 Years | 12 (4.9%) | 10 (3.5%) |
| 35 to 39 Years | 6 (2.5%) | 26 (9.2%) |
| 40 to 44 Years | 12 (4.9%) | 21 (7.4%) |
| 45 to 49 Years | 13 (5.3%) | 3 (1.1%) |
| 50 to 54 Years | 11 (4.5%) | 6 (2.1%) |
| 55 to 59 Years | 3 (1.2%) | 14 (5.0%) |
| 60 to 64 Years | 9 (3.7%) | 13 (4.6%) |
| 65 to 69 Years | 11 (4.5%) | 15 (5.3%) |
| 70 to 74 Years | 12 (4.9%) | 8 (2.8%) |
| 75 to 79 Years | 0 (0.0%) | 8 (2.8%) |
| 80 to 84 Years | 6 (2.5%) | 6 (2.1%) |
| 85 Years and over | 2 (0.8%) | 8 (2.8%) |
| Total | 244 (100.0%) | 283 (100.0%) |
Families and Households in St Elizabeth
Median Family Size in St Elizabeth
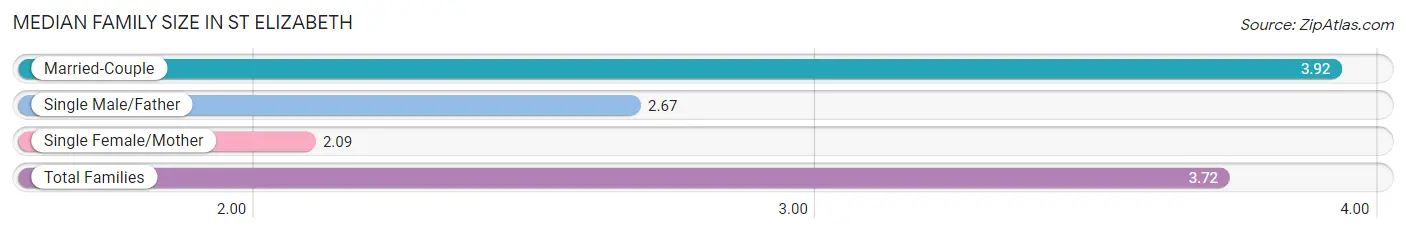
The median family size in St Elizabeth is 3.72 persons per family, with married-couple families (103 | 88.0%) accounting for the largest median family size of 3.92 persons per family. On the other hand, single female/mother families (11 | 9.4%) represent the smallest median family size with 2.09 persons per family.
| Family Type | # Families | Family Size |
| Married-Couple | 103 (88.0%) | 3.92 |
| Single Male/Father | 3 (2.6%) | 2.67 |
| Single Female/Mother | 11 (9.4%) | 2.09 |
| Total Families | 117 (100.0%) | 3.72 |
Median Household Size in St Elizabeth
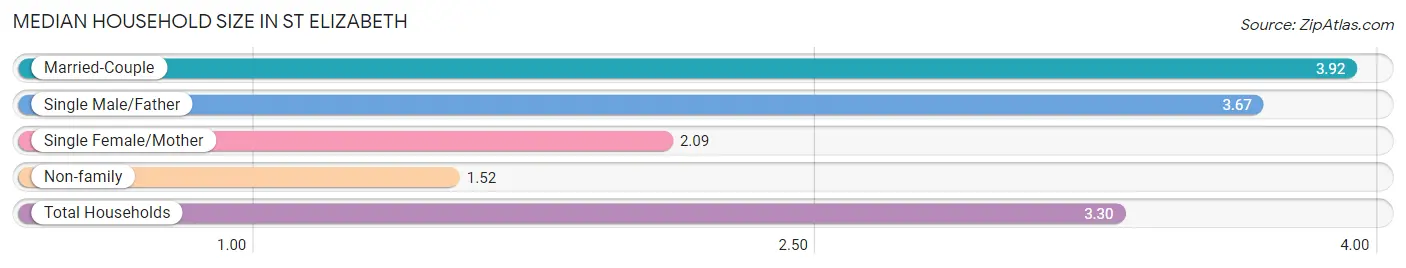
The median household size in St Elizabeth is 3.30 persons per household, with married-couple households (103 | 70.6%) accounting for the largest median household size of 3.92 persons per household. non-family households (29 | 19.9%) represent the smallest median household size with 1.52 persons per household.
| Household Type | # Households | Household Size |
| Married-Couple | 103 (70.6%) | 3.92 |
| Single Male/Father | 3 (2.1%) | 3.67 |
| Single Female/Mother | 11 (7.5%) | 2.09 |
| Non-family | 29 (19.9%) | 1.52 |
| Total Households | 146 (100.0%) | 3.30 |
Household Size by Marriage Status in St Elizabeth
Out of a total of 146 households in St Elizabeth, 117 (80.1%) are family households, while 29 (19.9%) are nonfamily households. The most numerous type of family households are 2-person households, comprising 50, and the most common type of nonfamily households are 1-person households, comprising 15.
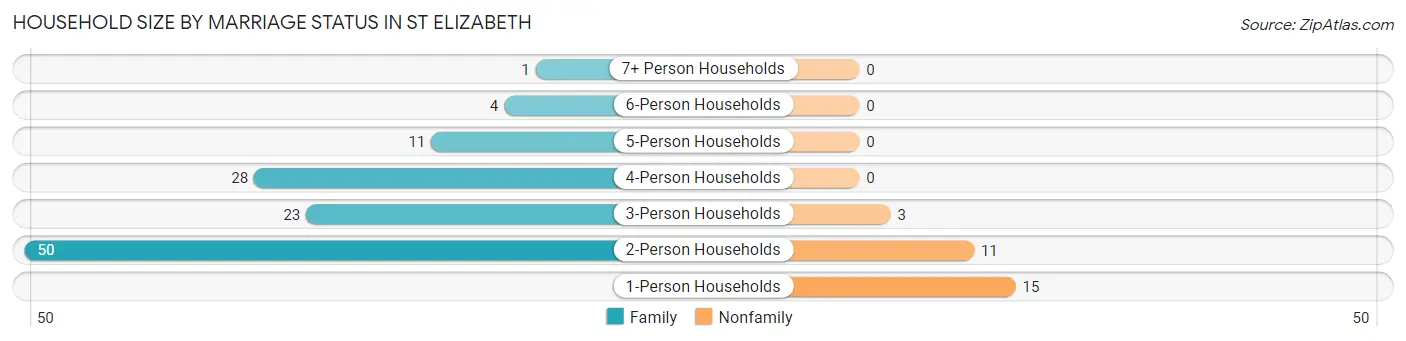
| Household Size | Family Households | Nonfamily Households |
| 1-Person Households | - | 15 (10.3%) |
| 2-Person Households | 50 (34.3%) | 11 (7.5%) |
| 3-Person Households | 23 (15.8%) | 3 (2.1%) |
| 4-Person Households | 28 (19.2%) | 0 (0.0%) |
| 5-Person Households | 11 (7.5%) | 0 (0.0%) |
| 6-Person Households | 4 (2.7%) | 0 (0.0%) |
| 7+ Person Households | 1 (0.7%) | 0 (0.0%) |
| Total | 117 (80.1%) | 29 (19.9%) |
Female Fertility in St Elizabeth
Fertility by Age in St Elizabeth
Average fertility rate in St Elizabeth is 213.0 births per 1,000 women. Women in the age bracket of 20 to 34 years have the highest fertility rate with 431.0 births per 1,000 women. Women in the age bracket of 20 to 34 years acount for 81.5% of all women with births.
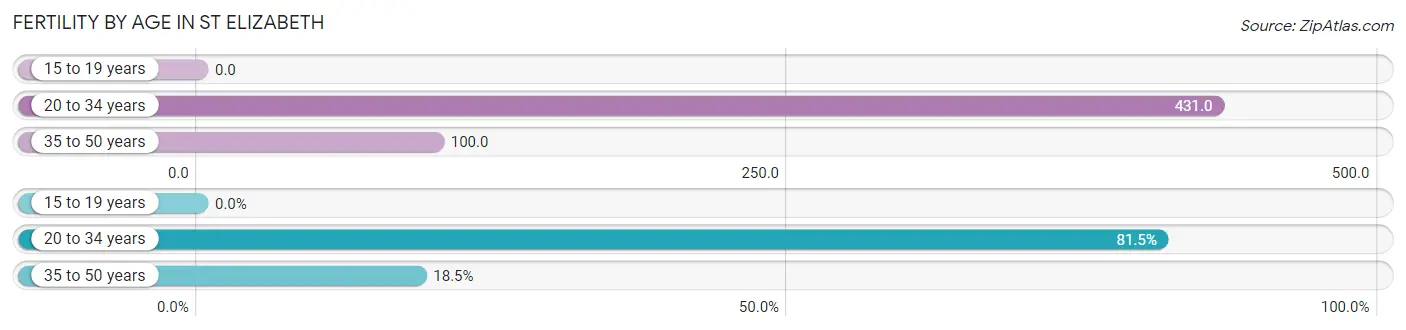
| Age Bracket | Women with Births | Births / 1,000 Women |
| 15 to 19 years | 0 (0.0%) | 0.0 |
| 20 to 34 years | 22 (81.5%) | 431.0 |
| 35 to 50 years | 5 (18.5%) | 100.0 |
| Total | 27 (100.0%) | 213.0 |
Fertility by Age by Marriage Status in St Elizabeth
92.6% of women with births (27) in St Elizabeth are married. The highest percentage of unmarried women with births falls into 20 to 34 years age bracket with 9.1% of them unmarried at the time of birth, while the lowest percentage of unmarried women with births belong to 35 to 50 years age bracket with 0.0% of them unmarried.
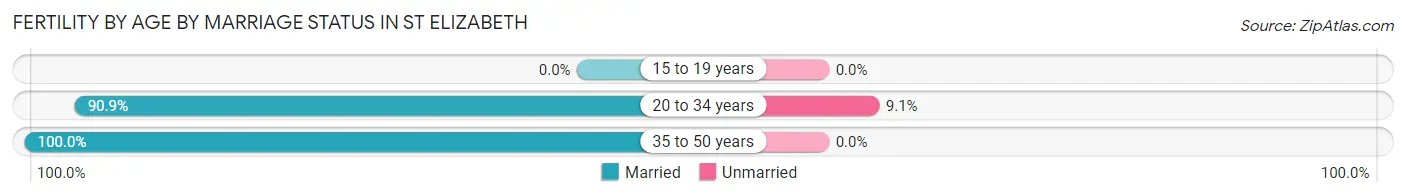
| Age Bracket | Married | Unmarried |
| 15 to 19 years | 0 (0.0%) | 0 (0.0%) |
| 20 to 34 years | 20 (90.9%) | 2 (9.1%) |
| 35 to 50 years | 5 (100.0%) | 0 (0.0%) |
| Total | 25 (92.6%) | 2 (7.4%) |
Fertility by Education in St Elizabeth
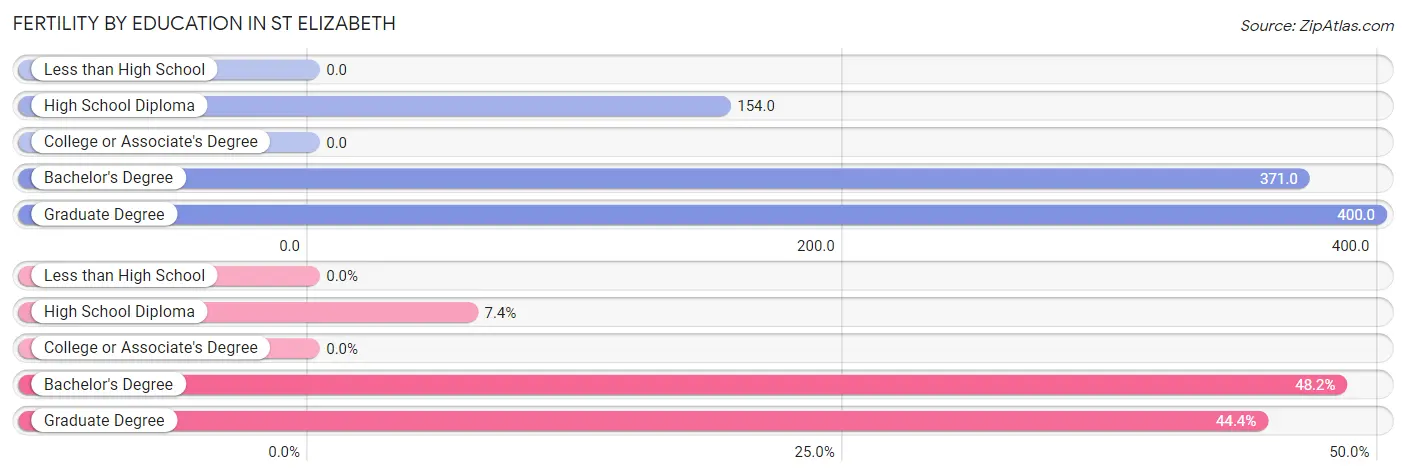
| Educational Attainment | Women with Births | Births / 1,000 Women |
| Less than High School | 0 (0.0%) | 0.0 |
| High School Diploma | 2 (7.4%) | 154.0 |
| College or Associate's Degree | 0 (0.0%) | 0.0 |
| Bachelor's Degree | 13 (48.1%) | 371.0 |
| Graduate Degree | 12 (44.4%) | 400.0 |
| Total | 27 (100.0%) | 213.0 |
Fertility by Education by Marriage Status in St Elizabeth
7.4% of women with births in St Elizabeth are unmarried. Women with the educational attainment of bachelor's degree are most likely to be married with 100.0% of them married at childbirth, while women with the educational attainment of high school diploma are least likely to be married with 100.0% of them unmarried at childbirth.
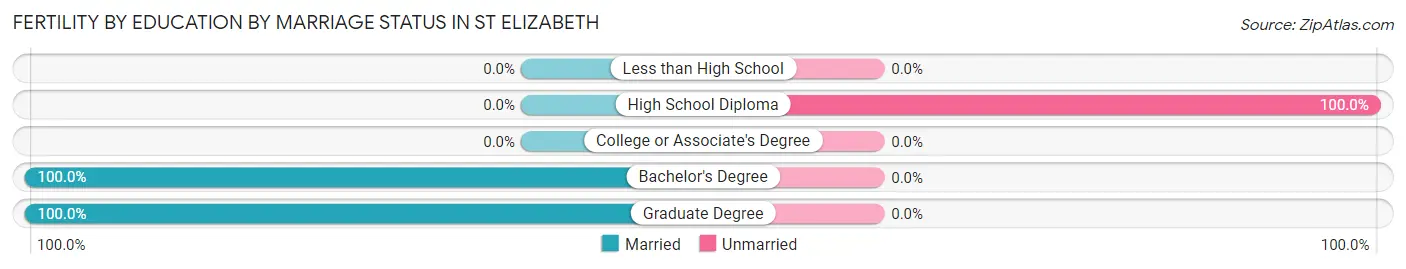
| Educational Attainment | Married | Unmarried |
| Less than High School | 0 (0.0%) | 0 (0.0%) |
| High School Diploma | 0 (0.0%) | 2 (100.0%) |
| College or Associate's Degree | 0 (0.0%) | 0 (0.0%) |
| Bachelor's Degree | 13 (100.0%) | 0 (0.0%) |
| Graduate Degree | 12 (100.0%) | 0 (0.0%) |
| Total | 25 (92.6%) | 2 (7.4%) |
Employment Characteristics in St Elizabeth
Employment by Class of Employer in St Elizabeth
Among the 207 employed individuals in St Elizabeth, private company employees (131 | 63.3%), state government employees (29 | 14.0%), and not-for-profit organizations (21 | 10.1%) make up the most common classes of employment.
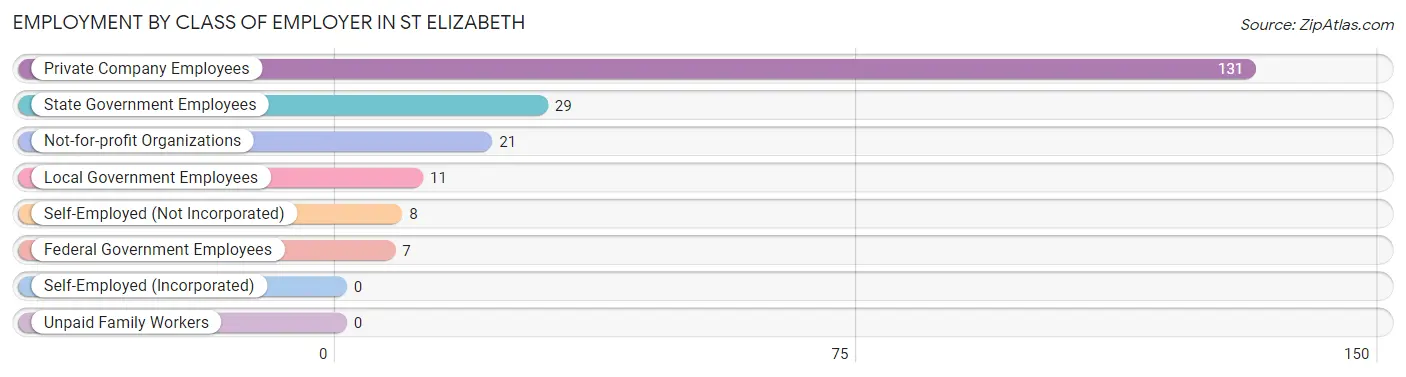
| Employer Class | # Employees | % Employees |
| Private Company Employees | 131 | 63.3% |
| Self-Employed (Incorporated) | 0 | 0.0% |
| Self-Employed (Not Incorporated) | 8 | 3.9% |
| Not-for-profit Organizations | 21 | 10.1% |
| Local Government Employees | 11 | 5.3% |
| State Government Employees | 29 | 14.0% |
| Federal Government Employees | 7 | 3.4% |
| Unpaid Family Workers | 0 | 0.0% |
| Total | 207 | 100.0% |
Employment Status by Age in St Elizabeth
According to the labor force statistics for St Elizabeth, out of the total population over 16 years of age (343), 63.3% or 217 individuals are in the labor force, with 1.9% or 4 of them unemployed. The age group with the highest labor force participation rate is 20 to 24 years, with 100.0% or 35 individuals in the labor force. Within the labor force, the 65 to 74 years age range has the highest percentage of unemployed individuals, with 25.0% or 2 of them being unemployed.
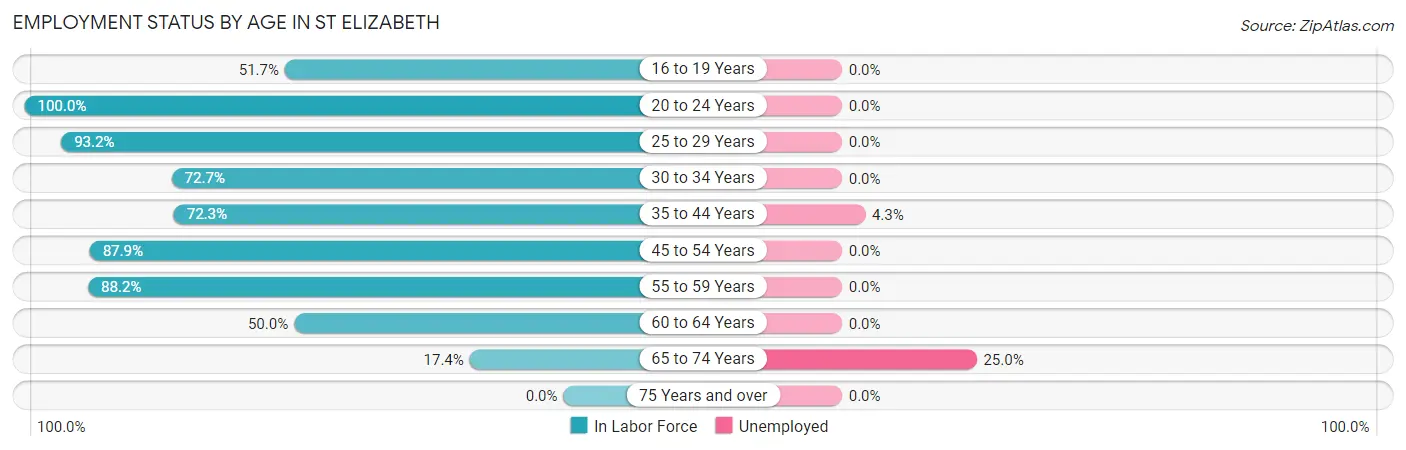
| Age Bracket | In Labor Force | Unemployed |
| 16 to 19 Years | 15 (51.7%) | 0 (0.0%) |
| 20 to 24 Years | 35 (100.0%) | 0 (0.0%) |
| 25 to 29 Years | 41 (93.2%) | 0 (0.0%) |
| 30 to 34 Years | 16 (72.7%) | 0 (0.0%) |
| 35 to 44 Years | 47 (72.3%) | 2 (4.3%) |
| 45 to 54 Years | 29 (87.9%) | 0 (0.0%) |
| 55 to 59 Years | 15 (88.2%) | 0 (0.0%) |
| 60 to 64 Years | 11 (50.0%) | 0 (0.0%) |
| 65 to 74 Years | 8 (17.4%) | 2 (25.0%) |
| 75 Years and over | 0 (0.0%) | 0 (0.0%) |
| Total | 217 (63.3%) | 4 (1.9%) |
Employment Status by Educational Attainment in St Elizabeth
According to labor force statistics for St Elizabeth, 78.3% of individuals (159) out of the total population between 25 and 64 years of age (203) are in the labor force, with 1.3% or 2 of them being unemployed. The group with the highest labor force participation rate are those with the educational attainment of bachelor's degree or higher, with 94.7% or 89 individuals in the labor force. Within the labor force, individuals with college / associate degree education have the highest percentage of unemployment, with 5.0% or 2 of them being unemployed.
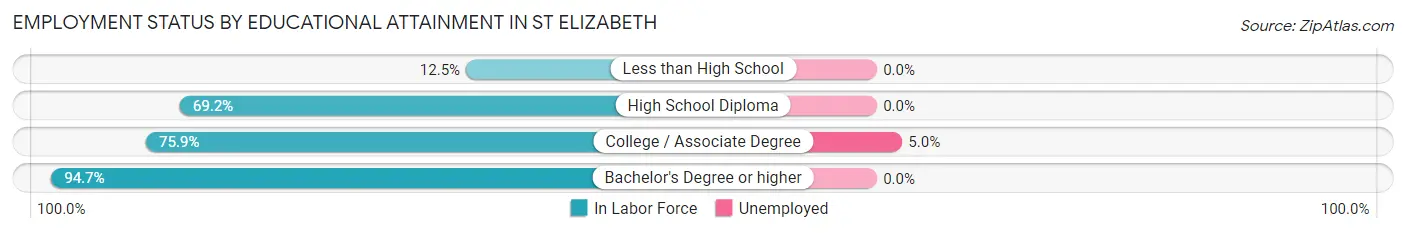
| Educational Attainment | In Labor Force | Unemployed |
| Less than High School | 2 (12.5%) | 0 (0.0%) |
| High School Diploma | 27 (69.2%) | 0 (0.0%) |
| College / Associate Degree | 41 (75.9%) | 3 (5.0%) |
| Bachelor's Degree or higher | 89 (94.7%) | 0 (0.0%) |
| Total | 159 (78.3%) | 3 (1.3%) |
Employment Occupations by Sex in St Elizabeth
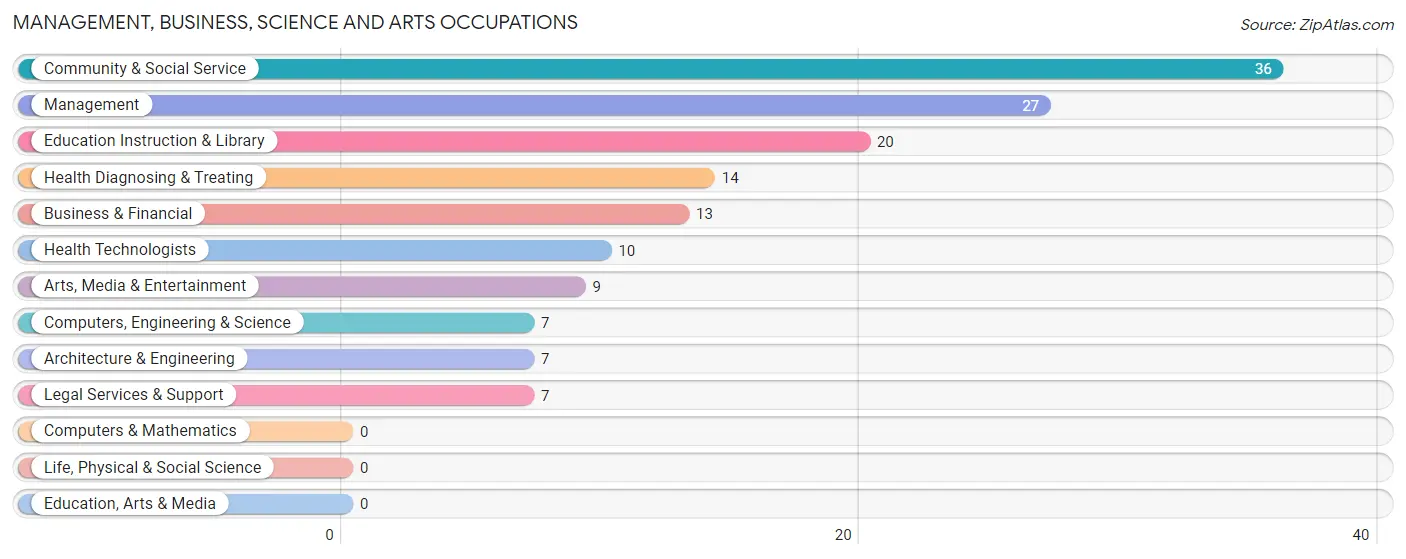
Management, Business, Science and Arts Occupations
The most common Management, Business, Science and Arts occupations in St Elizabeth are Community & Social Service (36 | 17.0%), Management (27 | 12.7%), Education Instruction & Library (20 | 9.4%), Health Diagnosing & Treating (14 | 6.6%), and Business & Financial (13 | 6.1%).
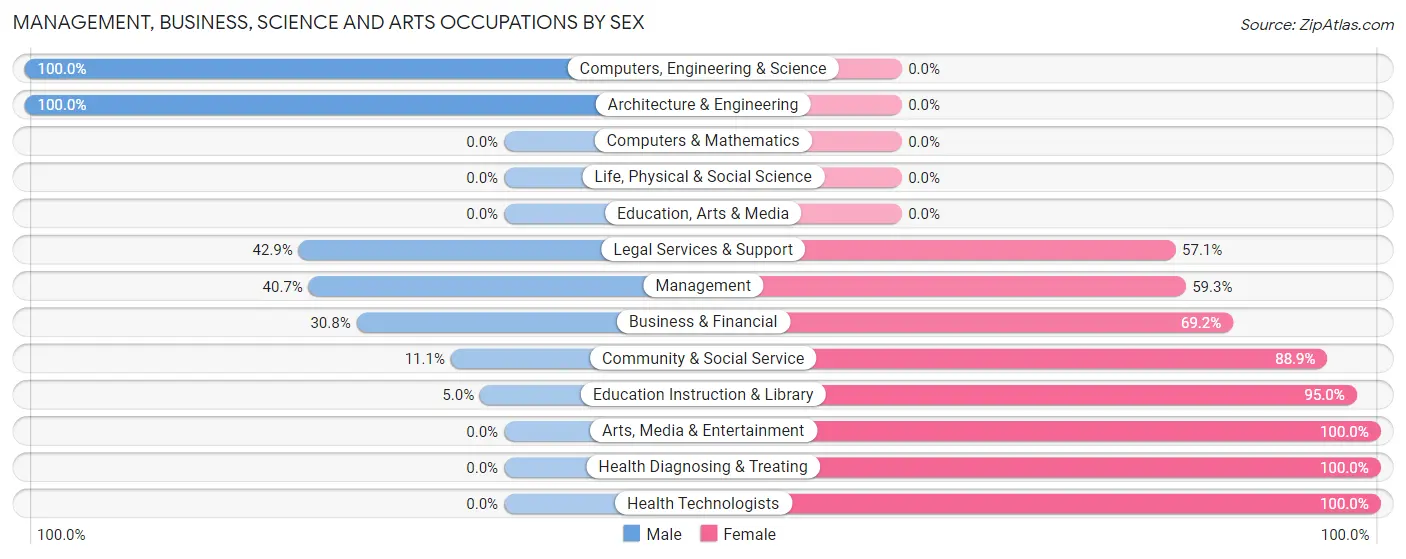
Management, Business, Science and Arts Occupations by Sex
Within the Management, Business, Science and Arts occupations in St Elizabeth, the most male-oriented occupations are Computers, Engineering & Science (100.0%), Architecture & Engineering (100.0%), and Legal Services & Support (42.9%), while the most female-oriented occupations are Arts, Media & Entertainment (100.0%), Health Diagnosing & Treating (100.0%), and Health Technologists (100.0%).
| Occupation | Male | Female |
| Management | 11 (40.7%) | 16 (59.3%) |
| Business & Financial | 4 (30.8%) | 9 (69.2%) |
| Computers, Engineering & Science | 7 (100.0%) | 0 (0.0%) |
| Computers & Mathematics | 0 (0.0%) | 0 (0.0%) |
| Architecture & Engineering | 7 (100.0%) | 0 (0.0%) |
| Life, Physical & Social Science | 0 (0.0%) | 0 (0.0%) |
| Community & Social Service | 4 (11.1%) | 32 (88.9%) |
| Education, Arts & Media | 0 (0.0%) | 0 (0.0%) |
| Legal Services & Support | 3 (42.9%) | 4 (57.1%) |
| Education Instruction & Library | 1 (5.0%) | 19 (95.0%) |
| Arts, Media & Entertainment | 0 (0.0%) | 9 (100.0%) |
| Health Diagnosing & Treating | 0 (0.0%) | 14 (100.0%) |
| Health Technologists | 0 (0.0%) | 10 (100.0%) |
| Total (Category) | 26 (26.8%) | 71 (73.2%) |
| Total (Overall) | 102 (48.1%) | 110 (51.9%) |
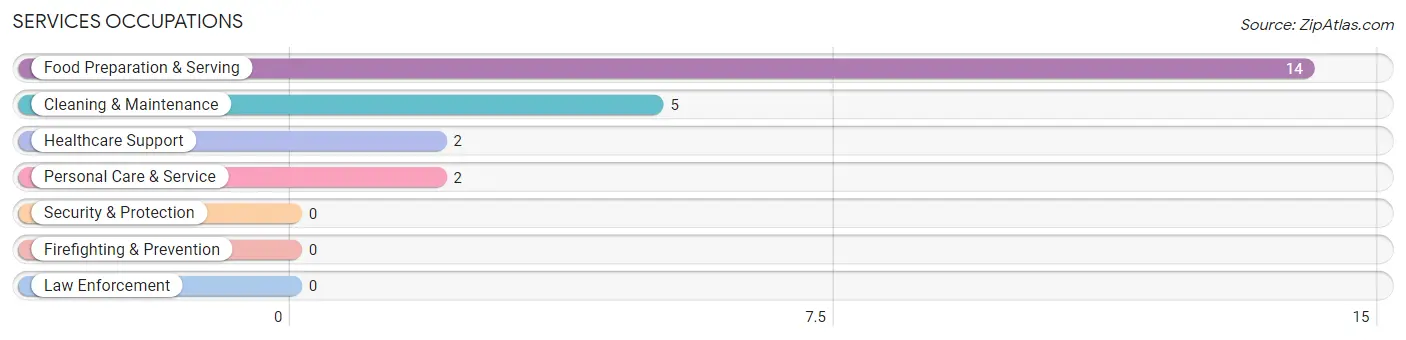
Services Occupations
The most common Services occupations in St Elizabeth are Food Preparation & Serving (14 | 6.6%), Cleaning & Maintenance (5 | 2.4%), Healthcare Support (2 | 0.9%), and Personal Care & Service (2 | 0.9%).
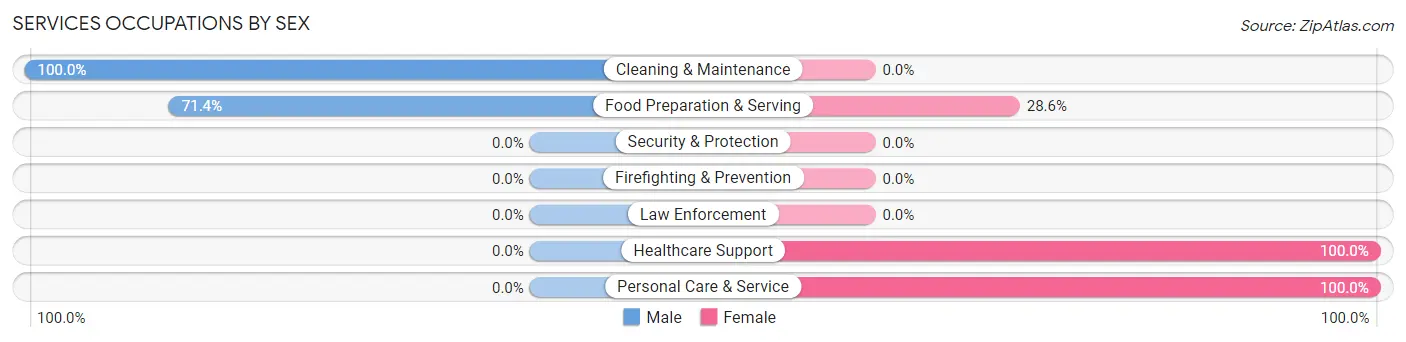
Services Occupations by Sex
Within the Services occupations in St Elizabeth, the most male-oriented occupations are Cleaning & Maintenance (100.0%), and Food Preparation & Serving (71.4%), while the most female-oriented occupations are Healthcare Support (100.0%), Personal Care & Service (100.0%), and Food Preparation & Serving (28.6%).
| Occupation | Male | Female |
| Healthcare Support | 0 (0.0%) | 2 (100.0%) |
| Security & Protection | 0 (0.0%) | 0 (0.0%) |
| Firefighting & Prevention | 0 (0.0%) | 0 (0.0%) |
| Law Enforcement | 0 (0.0%) | 0 (0.0%) |
| Food Preparation & Serving | 10 (71.4%) | 4 (28.6%) |
| Cleaning & Maintenance | 5 (100.0%) | 0 (0.0%) |
| Personal Care & Service | 0 (0.0%) | 2 (100.0%) |
| Total (Category) | 15 (65.2%) | 8 (34.8%) |
| Total (Overall) | 102 (48.1%) | 110 (51.9%) |
Sales and Office Occupations
The most common Sales and Office occupations in St Elizabeth are Office & Administration (23 | 10.8%), and Sales & Related (16 | 7.5%).
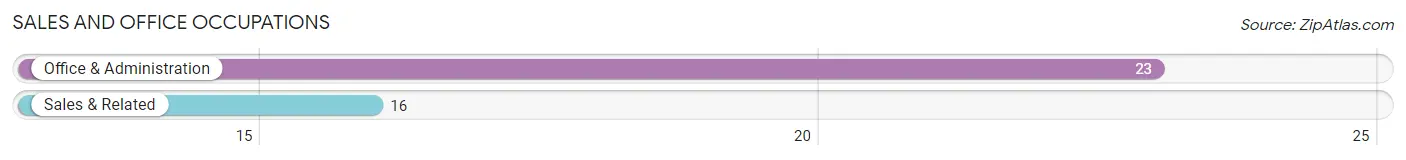
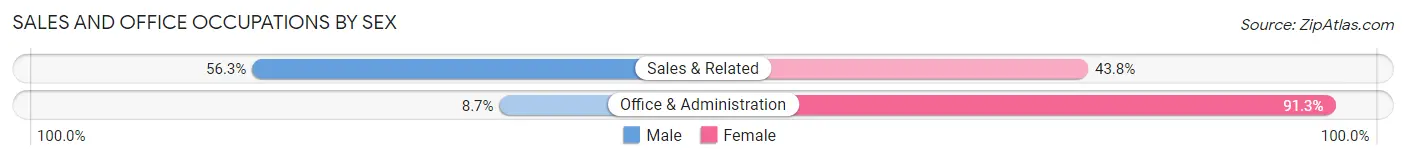
Sales and Office Occupations by Sex
| Occupation | Male | Female |
| Sales & Related | 9 (56.2%) | 7 (43.8%) |
| Office & Administration | 2 (8.7%) | 21 (91.3%) |
| Total (Category) | 11 (28.2%) | 28 (71.8%) |
| Total (Overall) | 102 (48.1%) | 110 (51.9%) |
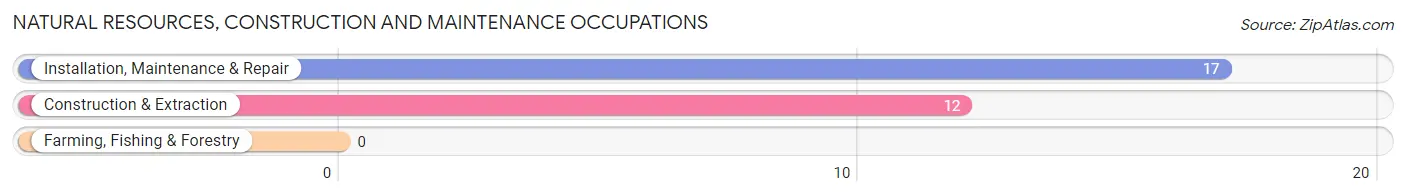
Natural Resources, Construction and Maintenance Occupations
The most common Natural Resources, Construction and Maintenance occupations in St Elizabeth are Installation, Maintenance & Repair (17 | 8.0%), and Construction & Extraction (12 | 5.7%).
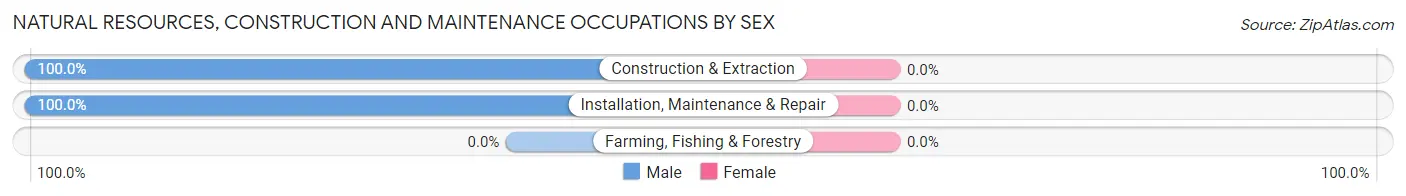
Natural Resources, Construction and Maintenance Occupations by Sex
| Occupation | Male | Female |
| Farming, Fishing & Forestry | 0 (0.0%) | 0 (0.0%) |
| Construction & Extraction | 12 (100.0%) | 0 (0.0%) |
| Installation, Maintenance & Repair | 17 (100.0%) | 0 (0.0%) |
| Total (Category) | 29 (100.0%) | 0 (0.0%) |
| Total (Overall) | 102 (48.1%) | 110 (51.9%) |
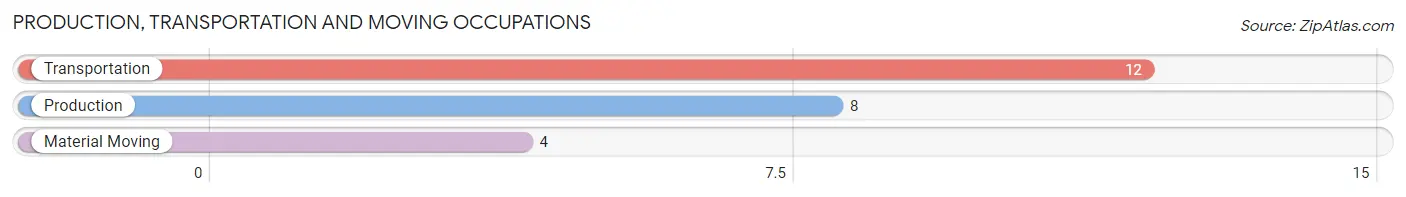
Production, Transportation and Moving Occupations
The most common Production, Transportation and Moving occupations in St Elizabeth are Transportation (12 | 5.7%), Production (8 | 3.8%), and Material Moving (4 | 1.9%).
Production, Transportation and Moving Occupations by Sex
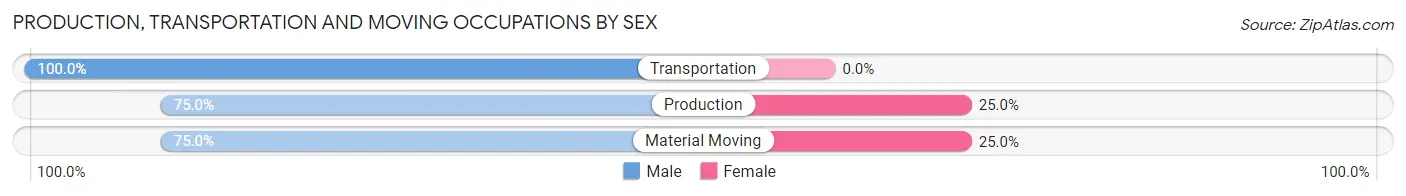
| Occupation | Male | Female |
| Production | 6 (75.0%) | 2 (25.0%) |
| Transportation | 12 (100.0%) | 0 (0.0%) |
| Material Moving | 3 (75.0%) | 1 (25.0%) |
| Total (Category) | 21 (87.5%) | 3 (12.5%) |
| Total (Overall) | 102 (48.1%) | 110 (51.9%) |
Employment Industries by Sex in St Elizabeth
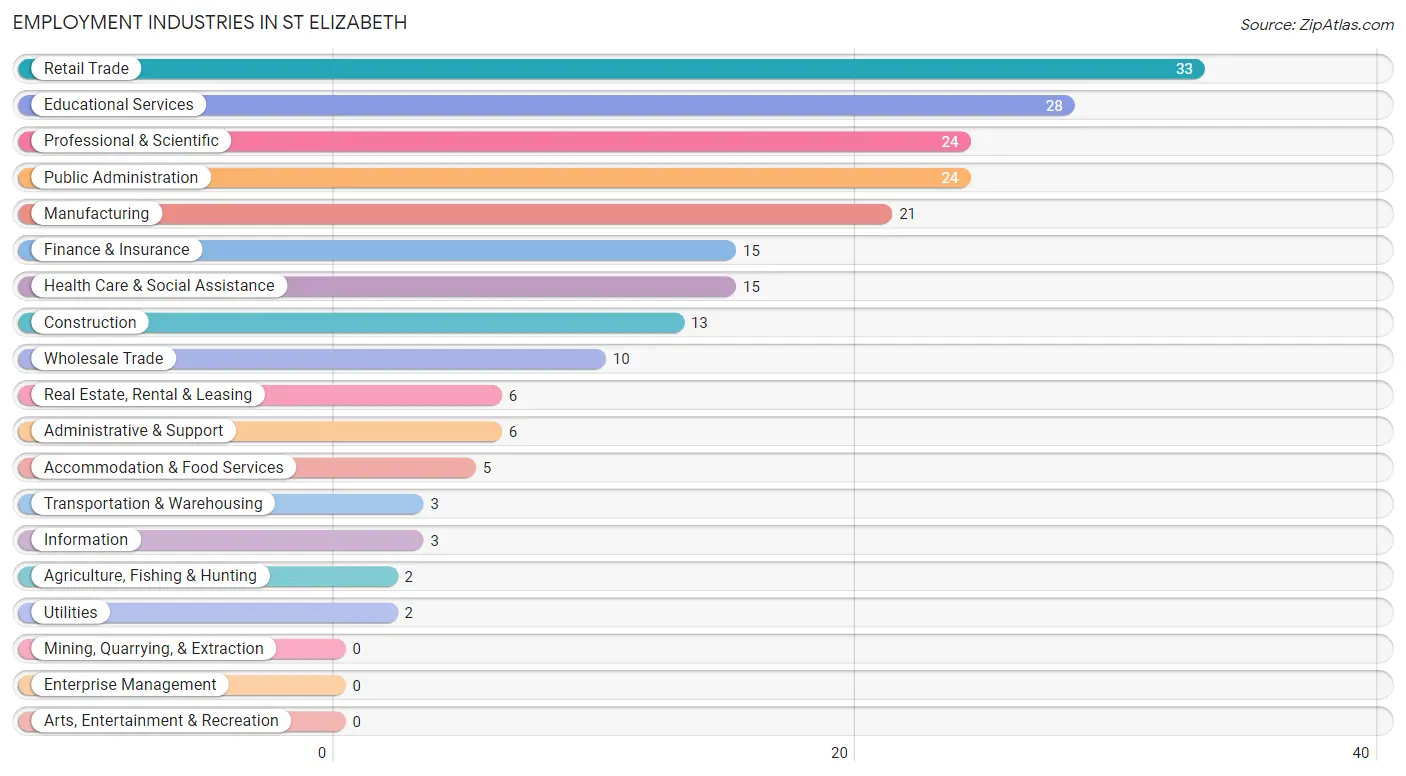
Employment Industries in St Elizabeth
The major employment industries in St Elizabeth include Retail Trade (33 | 15.6%), Educational Services (28 | 13.2%), Professional & Scientific (24 | 11.3%), Public Administration (24 | 11.3%), and Manufacturing (21 | 9.9%).
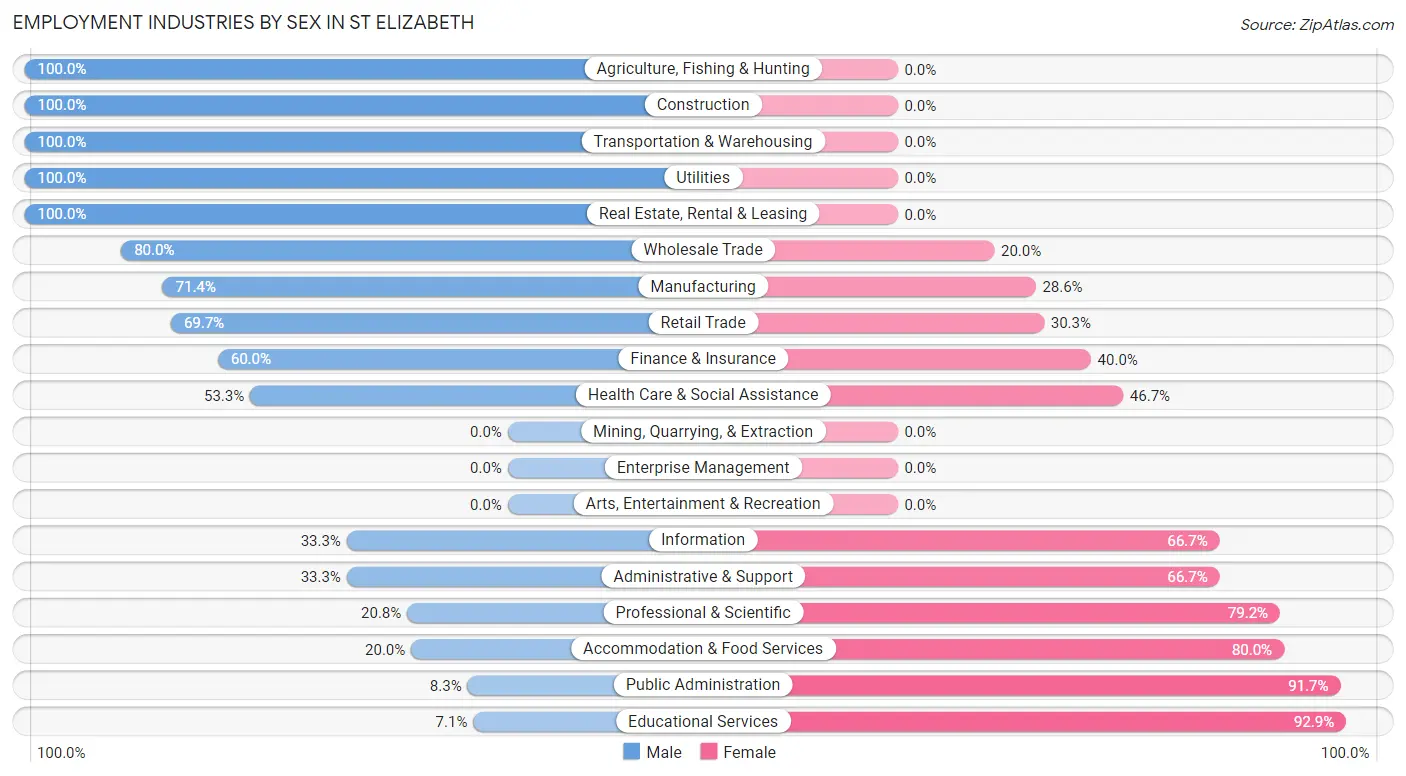
Employment Industries by Sex in St Elizabeth
The St Elizabeth industries that see more men than women are Agriculture, Fishing & Hunting (100.0%), Construction (100.0%), and Transportation & Warehousing (100.0%), whereas the industries that tend to have a higher number of women are Educational Services (92.9%), Public Administration (91.7%), and Accommodation & Food Services (80.0%).
| Industry | Male | Female |
| Agriculture, Fishing & Hunting | 2 (100.0%) | 0 (0.0%) |
| Mining, Quarrying, & Extraction | 0 (0.0%) | 0 (0.0%) |
| Construction | 13 (100.0%) | 0 (0.0%) |
| Manufacturing | 15 (71.4%) | 6 (28.6%) |
| Wholesale Trade | 8 (80.0%) | 2 (20.0%) |
| Retail Trade | 23 (69.7%) | 10 (30.3%) |
| Transportation & Warehousing | 3 (100.0%) | 0 (0.0%) |
| Utilities | 2 (100.0%) | 0 (0.0%) |
| Information | 1 (33.3%) | 2 (66.7%) |
| Finance & Insurance | 9 (60.0%) | 6 (40.0%) |
| Real Estate, Rental & Leasing | 6 (100.0%) | 0 (0.0%) |
| Professional & Scientific | 5 (20.8%) | 19 (79.2%) |
| Enterprise Management | 0 (0.0%) | 0 (0.0%) |
| Administrative & Support | 2 (33.3%) | 4 (66.7%) |
| Educational Services | 2 (7.1%) | 26 (92.9%) |
| Health Care & Social Assistance | 8 (53.3%) | 7 (46.7%) |
| Arts, Entertainment & Recreation | 0 (0.0%) | 0 (0.0%) |
| Accommodation & Food Services | 1 (20.0%) | 4 (80.0%) |
| Public Administration | 2 (8.3%) | 22 (91.7%) |
| Total | 102 (48.1%) | 110 (51.9%) |
Education in St Elizabeth
School Enrollment in St Elizabeth
The most common levels of schooling among the 157 students in St Elizabeth are middle school (57 | 36.3%), high school (35 | 22.3%), and elementary school (33 | 21.0%).
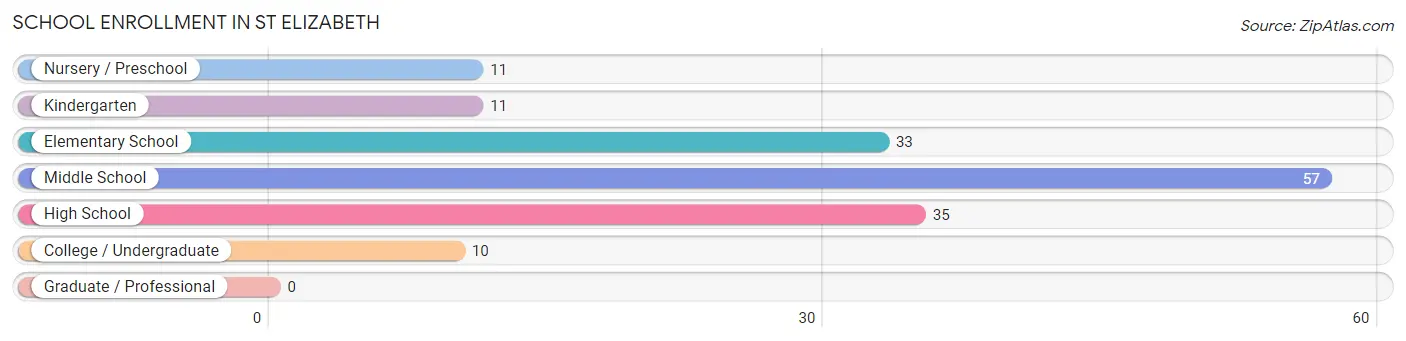
| School Level | # Students | % Students |
| Nursery / Preschool | 11 | 7.0% |
| Kindergarten | 11 | 7.0% |
| Elementary School | 33 | 21.0% |
| Middle School | 57 | 36.3% |
| High School | 35 | 22.3% |
| College / Undergraduate | 10 | 6.4% |
| Graduate / Professional | 0 | 0.0% |
| Total | 157 | 100.0% |
School Enrollment by Age by Funding Source in St Elizabeth
Out of a total of 157 students who are enrolled in schools in St Elizabeth, 1 (0.6%) attend a private institution, while the remaining 156 (99.4%) are enrolled in public schools. The age group of 5 to 9 year old has the highest likelihood of being enrolled in private schools, with 1 (2.3% in the age bracket) enrolled. Conversely, the age group of 3 to 4 year olds has the lowest likelihood of being enrolled in a private school, with 6 (100.0% in the age bracket) attending a public institution.
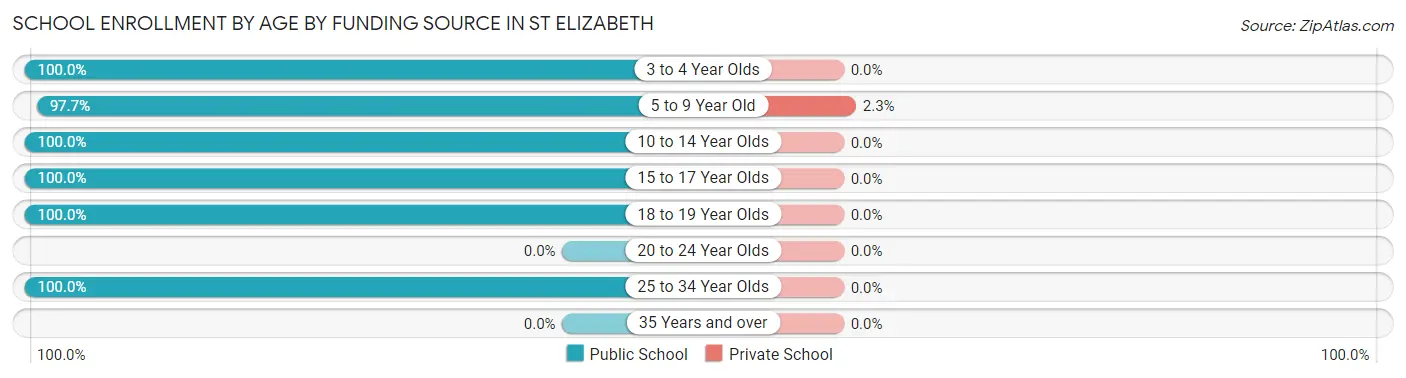
| Age Bracket | Public School | Private School |
| 3 to 4 Year Olds | 6 (100.0%) | 0 (0.0%) |
| 5 to 9 Year Old | 43 (97.7%) | 1 (2.3%) |
| 10 to 14 Year Olds | 62 (100.0%) | 0 (0.0%) |
| 15 to 17 Year Olds | 34 (100.0%) | 0 (0.0%) |
| 18 to 19 Year Olds | 9 (100.0%) | 0 (0.0%) |
| 20 to 24 Year Olds | 0 (0.0%) | 0 (0.0%) |
| 25 to 34 Year Olds | 2 (100.0%) | 0 (0.0%) |
| 35 Years and over | 0 (0.0%) | 0 (0.0%) |
| Total | 156 (99.4%) | 1 (0.6%) |
Educational Attainment by Field of Study in St Elizabeth
Business (35 | 33.0%), education (31 | 29.2%), science & technology (14 | 13.2%), engineering (11 | 10.4%), and arts & humanities (6 | 5.7%) are the most common fields of study among 106 individuals in St Elizabeth who have obtained a bachelor's degree or higher.
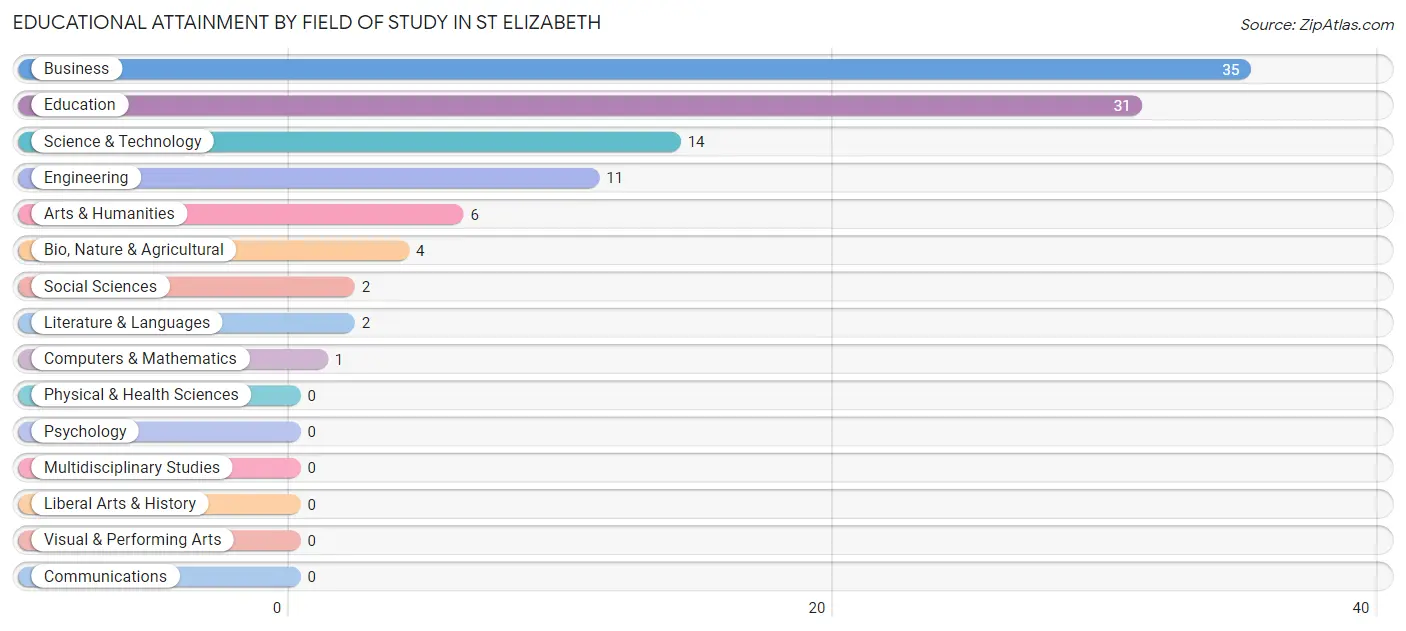
| Field of Study | # Graduates | % Graduates |
| Computers & Mathematics | 1 | 0.9% |
| Bio, Nature & Agricultural | 4 | 3.8% |
| Physical & Health Sciences | 0 | 0.0% |
| Psychology | 0 | 0.0% |
| Social Sciences | 2 | 1.9% |
| Engineering | 11 | 10.4% |
| Multidisciplinary Studies | 0 | 0.0% |
| Science & Technology | 14 | 13.2% |
| Business | 35 | 33.0% |
| Education | 31 | 29.2% |
| Literature & Languages | 2 | 1.9% |
| Liberal Arts & History | 0 | 0.0% |
| Visual & Performing Arts | 0 | 0.0% |
| Communications | 0 | 0.0% |
| Arts & Humanities | 6 | 5.7% |
| Total | 106 | 100.0% |
Transportation & Commute in St Elizabeth
Vehicle Availability by Sex in St Elizabeth
The most prevalent vehicle ownership categories in St Elizabeth are males with 3 vehicles (43, accounting for 41.7%) and females with 3 vehicles (44, making up 41.3%).
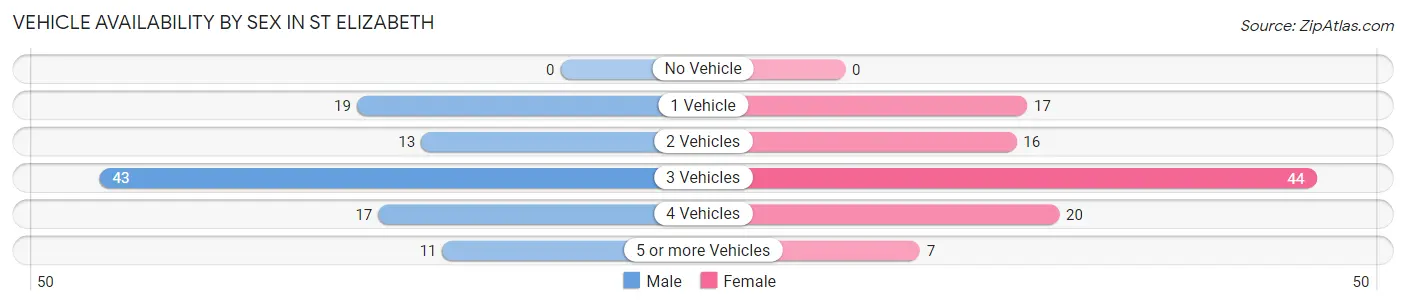
| Vehicles Available | Male | Female |
| No Vehicle | 0 (0.0%) | 0 (0.0%) |
| 1 Vehicle | 19 (18.4%) | 17 (16.4%) |
| 2 Vehicles | 13 (12.6%) | 16 (15.4%) |
| 3 Vehicles | 43 (41.7%) | 44 (42.3%) |
| 4 Vehicles | 17 (16.5%) | 20 (19.2%) |
| 5 or more Vehicles | 11 (10.7%) | 7 (6.7%) |
| Total | 103 (100.0%) | 104 (100.0%) |
Commute Time in St Elizabeth
The most frequently occuring commute durations in St Elizabeth are 45 to 59 minutes (44 commuters, 21.8%), 30 to 34 minutes (39 commuters, 19.3%), and 40 to 44 minutes (30 commuters, 14.8%).
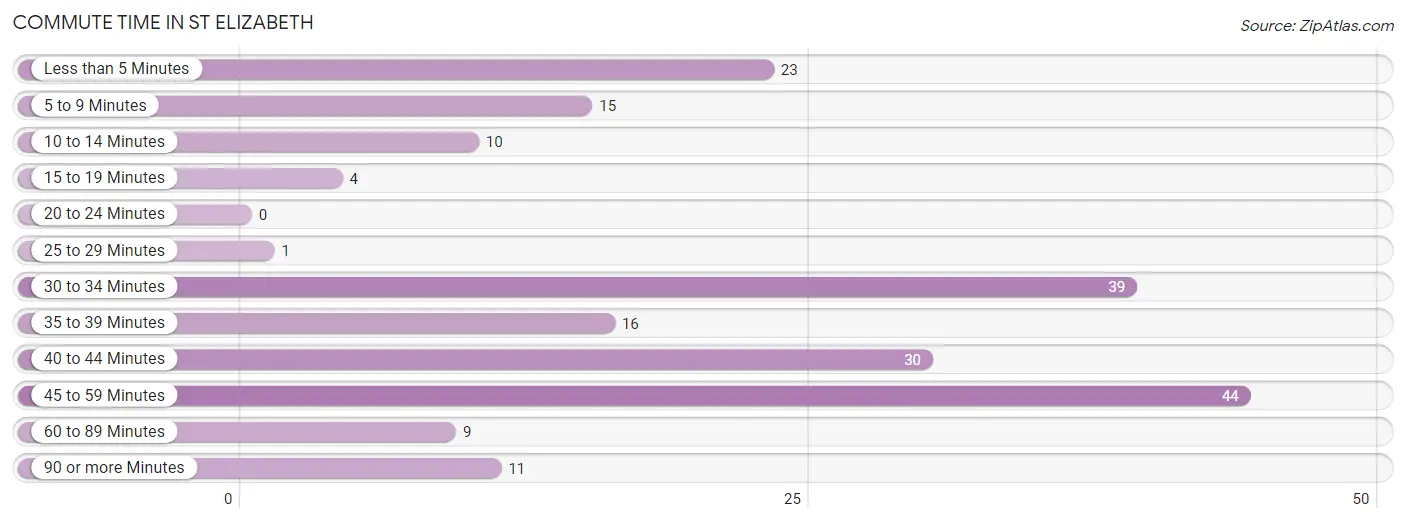
| Commute Time | # Commuters | % Commuters |
| Less than 5 Minutes | 23 | 11.4% |
| 5 to 9 Minutes | 15 | 7.4% |
| 10 to 14 Minutes | 10 | 5.0% |
| 15 to 19 Minutes | 4 | 2.0% |
| 20 to 24 Minutes | 0 | 0.0% |
| 25 to 29 Minutes | 1 | 0.5% |
| 30 to 34 Minutes | 39 | 19.3% |
| 35 to 39 Minutes | 16 | 7.9% |
| 40 to 44 Minutes | 30 | 14.8% |
| 45 to 59 Minutes | 44 | 21.8% |
| 60 to 89 Minutes | 9 | 4.5% |
| 90 or more Minutes | 11 | 5.4% |
Commute Time by Sex in St Elizabeth
The most common commute times in St Elizabeth are 30 to 34 minutes (28 commuters, 27.2%) for males and 45 to 59 minutes (24 commuters, 24.2%) for females.
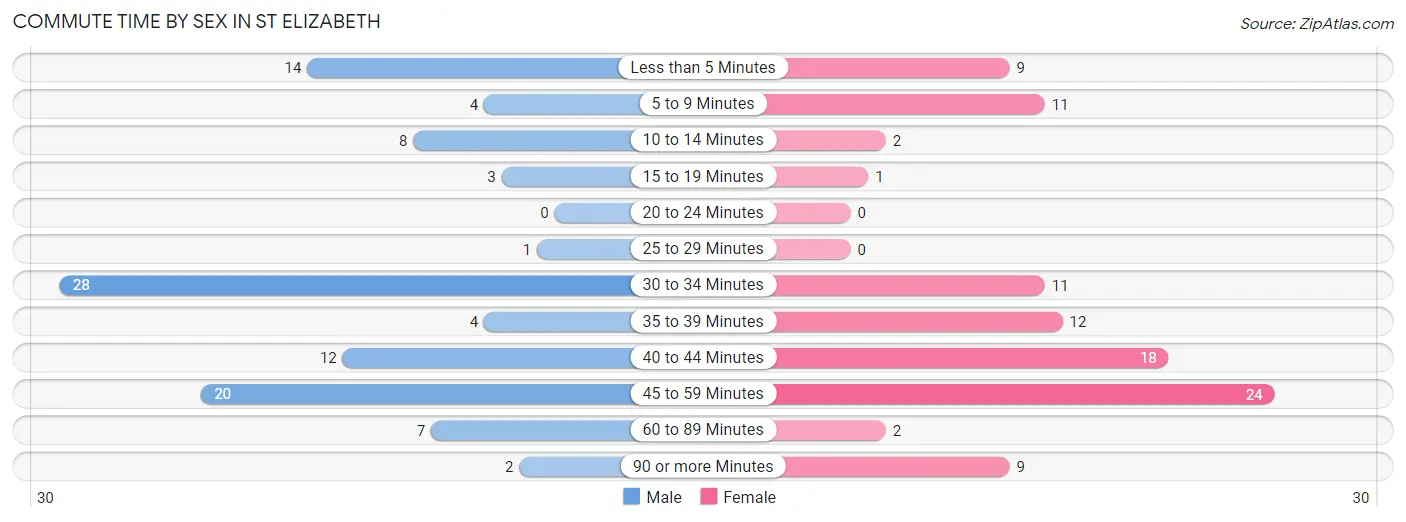
| Commute Time | Male | Female |
| Less than 5 Minutes | 14 (13.6%) | 9 (9.1%) |
| 5 to 9 Minutes | 4 (3.9%) | 11 (11.1%) |
| 10 to 14 Minutes | 8 (7.8%) | 2 (2.0%) |
| 15 to 19 Minutes | 3 (2.9%) | 1 (1.0%) |
| 20 to 24 Minutes | 0 (0.0%) | 0 (0.0%) |
| 25 to 29 Minutes | 1 (1.0%) | 0 (0.0%) |
| 30 to 34 Minutes | 28 (27.2%) | 11 (11.1%) |
| 35 to 39 Minutes | 4 (3.9%) | 12 (12.1%) |
| 40 to 44 Minutes | 12 (11.7%) | 18 (18.2%) |
| 45 to 59 Minutes | 20 (19.4%) | 24 (24.2%) |
| 60 to 89 Minutes | 7 (6.8%) | 2 (2.0%) |
| 90 or more Minutes | 2 (1.9%) | 9 (9.1%) |
Time of Departure to Work by Sex in St Elizabeth
The most frequent times of departure to work in St Elizabeth are 6:00 AM to 6:29 AM (16, 15.5%) for males and 7:00 AM to 7:29 AM (30, 30.3%) for females.
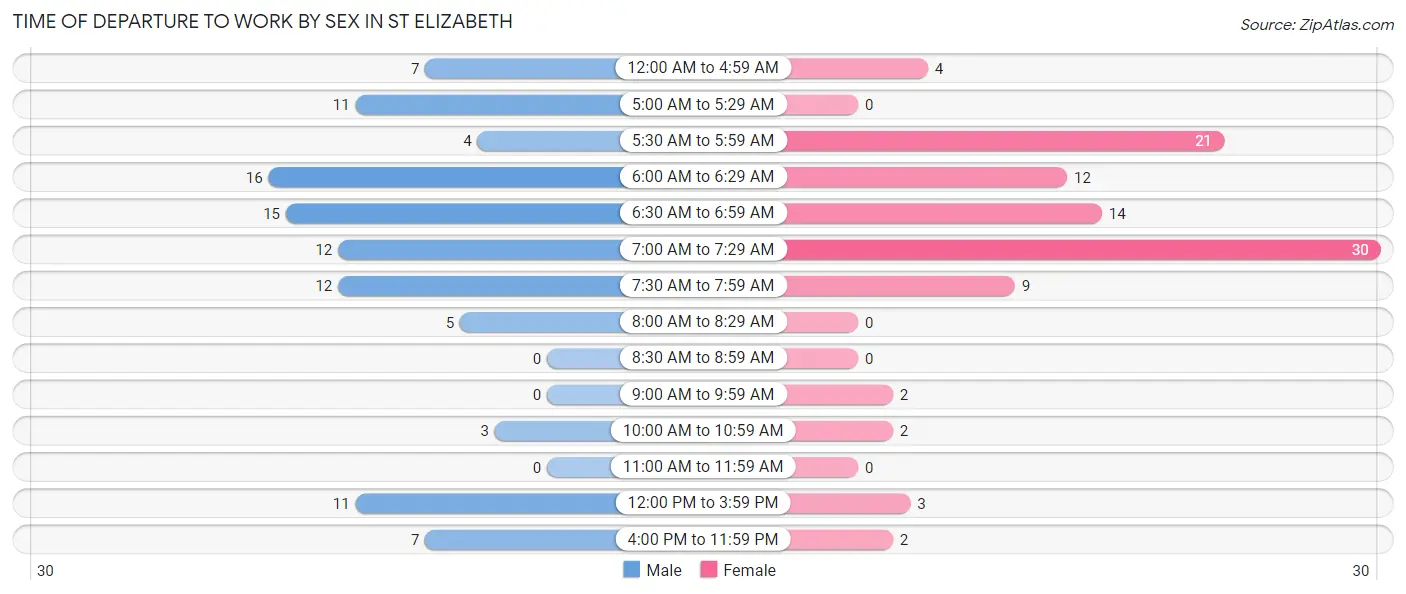
| Time of Departure | Male | Female |
| 12:00 AM to 4:59 AM | 7 (6.8%) | 4 (4.0%) |
| 5:00 AM to 5:29 AM | 11 (10.7%) | 0 (0.0%) |
| 5:30 AM to 5:59 AM | 4 (3.9%) | 21 (21.2%) |
| 6:00 AM to 6:29 AM | 16 (15.5%) | 12 (12.1%) |
| 6:30 AM to 6:59 AM | 15 (14.6%) | 14 (14.1%) |
| 7:00 AM to 7:29 AM | 12 (11.7%) | 30 (30.3%) |
| 7:30 AM to 7:59 AM | 12 (11.7%) | 9 (9.1%) |
| 8:00 AM to 8:29 AM | 5 (4.9%) | 0 (0.0%) |
| 8:30 AM to 8:59 AM | 0 (0.0%) | 0 (0.0%) |
| 9:00 AM to 9:59 AM | 0 (0.0%) | 2 (2.0%) |
| 10:00 AM to 10:59 AM | 3 (2.9%) | 2 (2.0%) |
| 11:00 AM to 11:59 AM | 0 (0.0%) | 0 (0.0%) |
| 12:00 PM to 3:59 PM | 11 (10.7%) | 3 (3.0%) |
| 4:00 PM to 11:59 PM | 7 (6.8%) | 2 (2.0%) |
| Total | 103 (100.0%) | 99 (100.0%) |
Housing Occupancy in St Elizabeth
Occupancy by Ownership in St Elizabeth
Of the total 146 dwellings in St Elizabeth, owner-occupied units account for 122 (83.6%), while renter-occupied units make up 24 (16.4%).
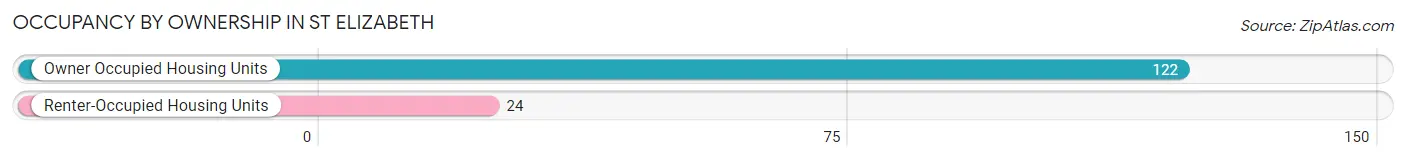
| Occupancy | # Housing Units | % Housing Units |
| Owner Occupied Housing Units | 122 | 83.6% |
| Renter-Occupied Housing Units | 24 | 16.4% |
| Total Occupied Housing Units | 146 | 100.0% |
Occupancy by Household Size in St Elizabeth
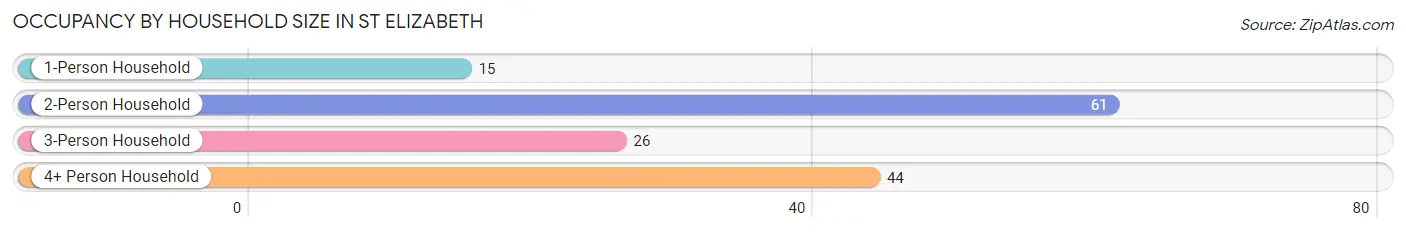
| Household Size | # Housing Units | % Housing Units |
| 1-Person Household | 15 | 10.3% |
| 2-Person Household | 61 | 41.8% |
| 3-Person Household | 26 | 17.8% |
| 4+ Person Household | 44 | 30.1% |
| Total Housing Units | 146 | 100.0% |
Occupancy by Ownership by Household Size in St Elizabeth
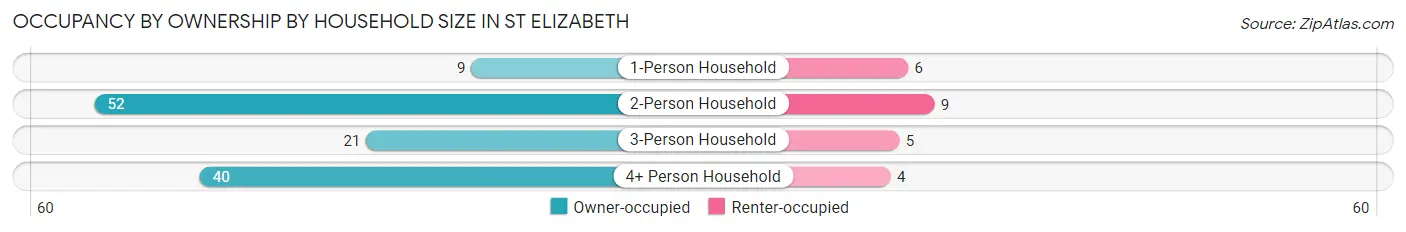
| Household Size | Owner-occupied | Renter-occupied |
| 1-Person Household | 9 (60.0%) | 6 (40.0%) |
| 2-Person Household | 52 (85.3%) | 9 (14.7%) |
| 3-Person Household | 21 (80.8%) | 5 (19.2%) |
| 4+ Person Household | 40 (90.9%) | 4 (9.1%) |
| Total Housing Units | 122 (83.6%) | 24 (16.4%) |
Occupancy by Educational Attainment in St Elizabeth
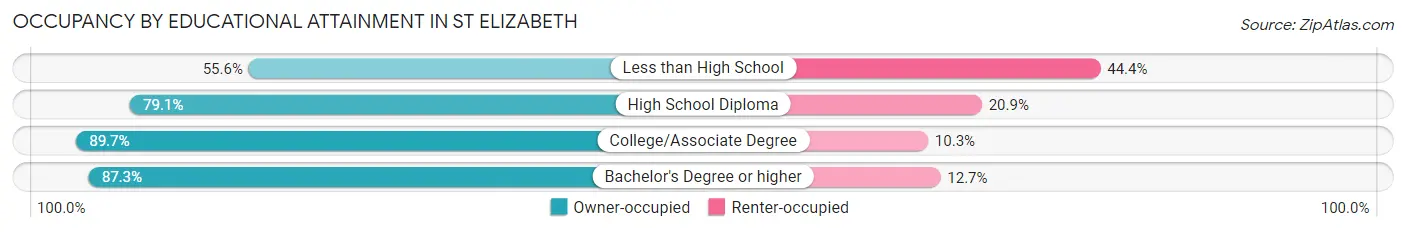
| Household Size | Owner-occupied | Renter-occupied |
| Less than High School | 5 (55.6%) | 4 (44.4%) |
| High School Diploma | 34 (79.1%) | 9 (20.9%) |
| College/Associate Degree | 35 (89.7%) | 4 (10.3%) |
| Bachelor's Degree or higher | 48 (87.3%) | 7 (12.7%) |
Occupancy by Age of Householder in St Elizabeth
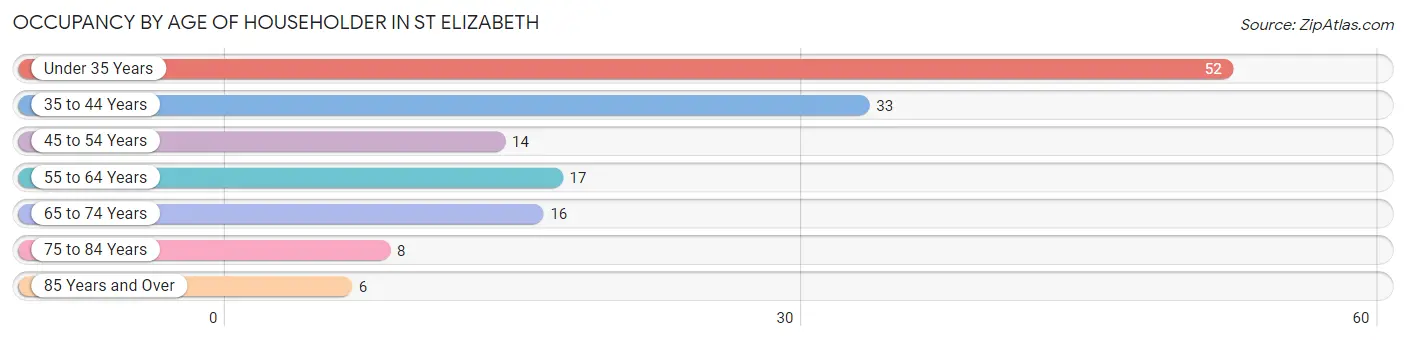
| Age Bracket | # Households | % Households |
| Under 35 Years | 52 | 35.6% |
| 35 to 44 Years | 33 | 22.6% |
| 45 to 54 Years | 14 | 9.6% |
| 55 to 64 Years | 17 | 11.6% |
| 65 to 74 Years | 16 | 11.0% |
| 75 to 84 Years | 8 | 5.5% |
| 85 Years and Over | 6 | 4.1% |
| Total | 146 | 100.0% |
Housing Finances in St Elizabeth
Median Income by Occupancy in St Elizabeth
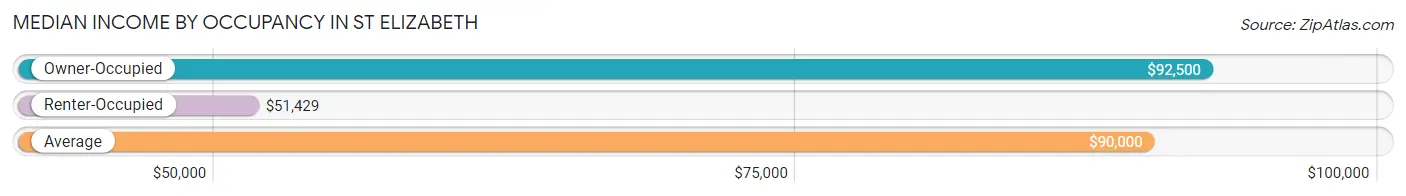
| Occupancy Type | # Households | Median Income |
| Owner-Occupied | 122 (83.6%) | $92,500 |
| Renter-Occupied | 24 (16.4%) | $51,429 |
| Average | 146 (100.0%) | $90,000 |
Occupancy by Householder Income Bracket in St Elizabeth
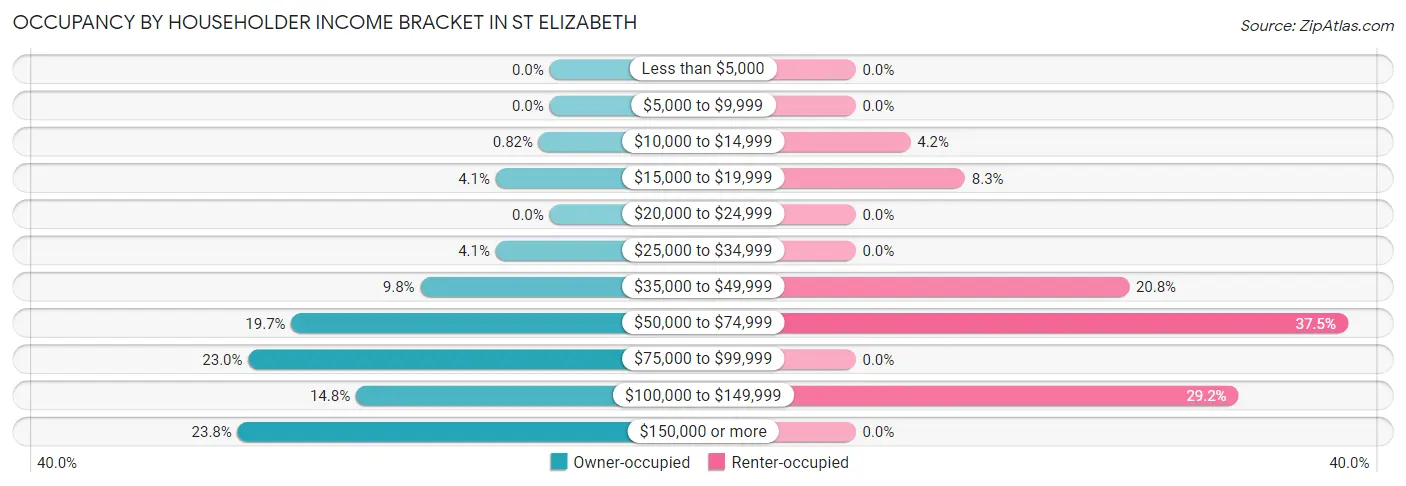
| Income Bracket | Owner-occupied | Renter-occupied |
| Less than $5,000 | 0 (0.0%) | 0 (0.0%) |
| $5,000 to $9,999 | 0 (0.0%) | 0 (0.0%) |
| $10,000 to $14,999 | 1 (0.8%) | 1 (4.2%) |
| $15,000 to $19,999 | 5 (4.1%) | 2 (8.3%) |
| $20,000 to $24,999 | 0 (0.0%) | 0 (0.0%) |
| $25,000 to $34,999 | 5 (4.1%) | 0 (0.0%) |
| $35,000 to $49,999 | 12 (9.8%) | 5 (20.8%) |
| $50,000 to $74,999 | 24 (19.7%) | 9 (37.5%) |
| $75,000 to $99,999 | 28 (23.0%) | 0 (0.0%) |
| $100,000 to $149,999 | 18 (14.7%) | 7 (29.2%) |
| $150,000 or more | 29 (23.8%) | 0 (0.0%) |
| Total | 122 (100.0%) | 24 (100.0%) |
Monthly Housing Cost Tiers in St Elizabeth
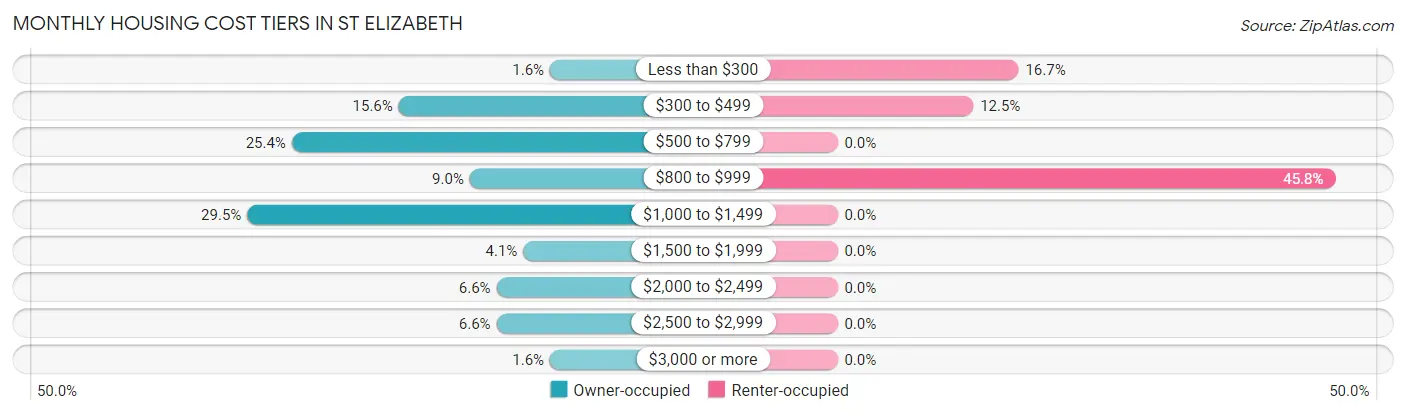
| Monthly Cost | Owner-occupied | Renter-occupied |
| Less than $300 | 2 (1.6%) | 4 (16.7%) |
| $300 to $499 | 19 (15.6%) | 3 (12.5%) |
| $500 to $799 | 31 (25.4%) | 0 (0.0%) |
| $800 to $999 | 11 (9.0%) | 11 (45.8%) |
| $1,000 to $1,499 | 36 (29.5%) | 0 (0.0%) |
| $1,500 to $1,999 | 5 (4.1%) | 0 (0.0%) |
| $2,000 to $2,499 | 8 (6.6%) | 0 (0.0%) |
| $2,500 to $2,999 | 8 (6.6%) | 0 (0.0%) |
| $3,000 or more | 2 (1.6%) | 0 (0.0%) |
| Total | 122 (100.0%) | 24 (100.0%) |
Physical Housing Characteristics in St Elizabeth
Housing Structures in St Elizabeth
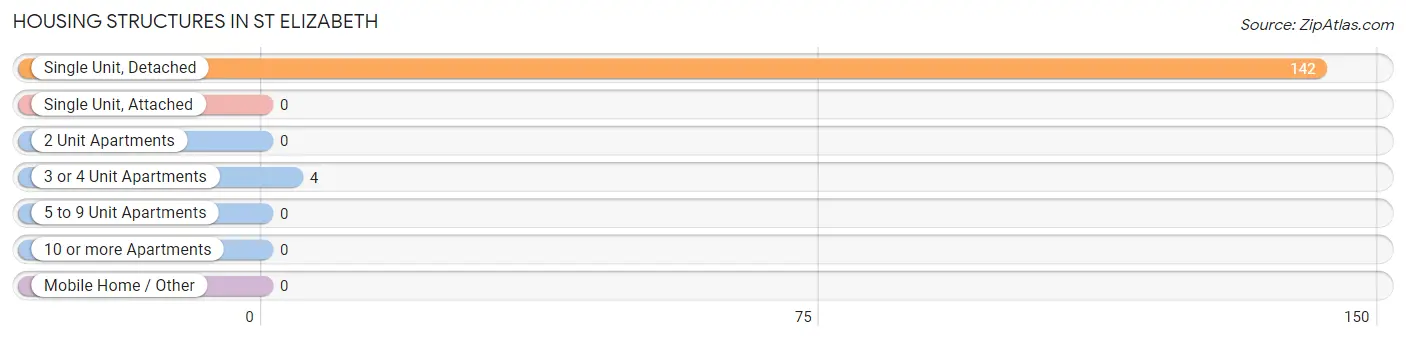
| Structure Type | # Housing Units | % Housing Units |
| Single Unit, Detached | 142 | 97.3% |
| Single Unit, Attached | 0 | 0.0% |
| 2 Unit Apartments | 0 | 0.0% |
| 3 or 4 Unit Apartments | 4 | 2.7% |
| 5 to 9 Unit Apartments | 0 | 0.0% |
| 10 or more Apartments | 0 | 0.0% |
| Mobile Home / Other | 0 | 0.0% |
| Total | 146 | 100.0% |
Housing Structures by Occupancy in St Elizabeth
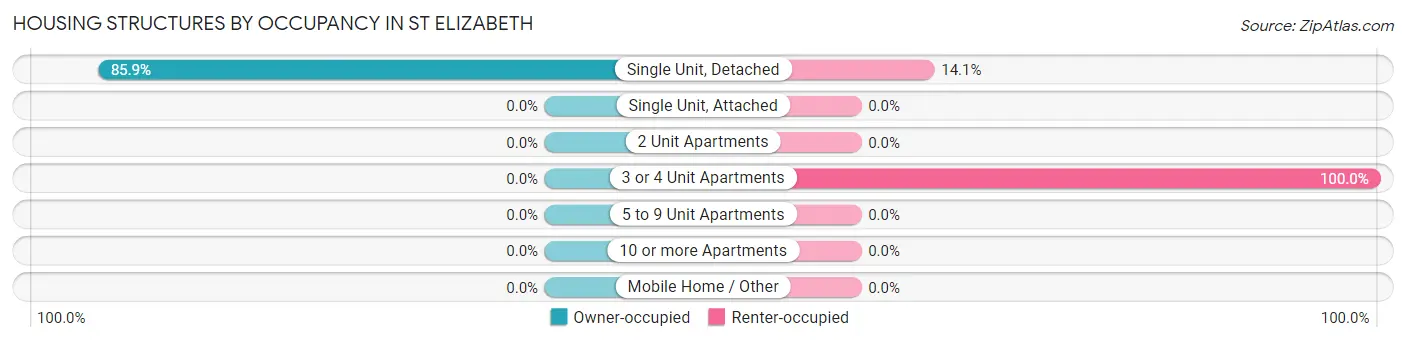
| Structure Type | Owner-occupied | Renter-occupied |
| Single Unit, Detached | 122 (85.9%) | 20 (14.1%) |
| Single Unit, Attached | 0 (0.0%) | 0 (0.0%) |
| 2 Unit Apartments | 0 (0.0%) | 0 (0.0%) |
| 3 or 4 Unit Apartments | 0 (0.0%) | 4 (100.0%) |
| 5 to 9 Unit Apartments | 0 (0.0%) | 0 (0.0%) |
| 10 or more Apartments | 0 (0.0%) | 0 (0.0%) |
| Mobile Home / Other | 0 (0.0%) | 0 (0.0%) |
| Total | 122 (83.6%) | 24 (16.4%) |
Housing Structures by Number of Rooms in St Elizabeth
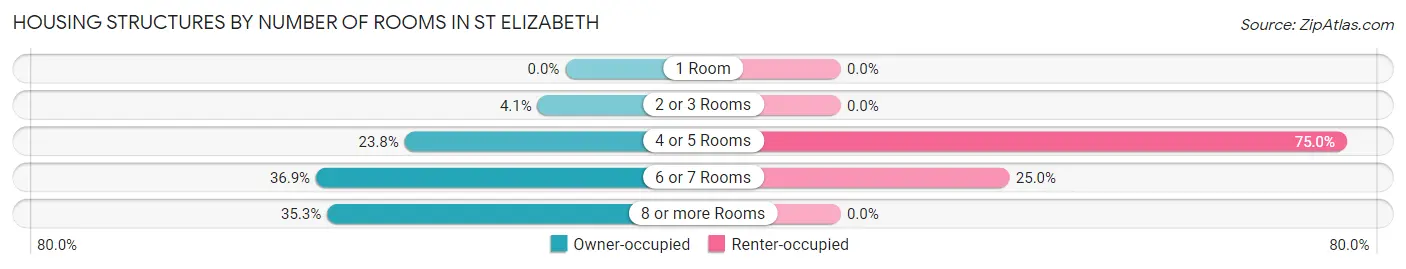
| Number of Rooms | Owner-occupied | Renter-occupied |
| 1 Room | 0 (0.0%) | 0 (0.0%) |
| 2 or 3 Rooms | 5 (4.1%) | 0 (0.0%) |
| 4 or 5 Rooms | 29 (23.8%) | 18 (75.0%) |
| 6 or 7 Rooms | 45 (36.9%) | 6 (25.0%) |
| 8 or more Rooms | 43 (35.2%) | 0 (0.0%) |
| Total | 122 (100.0%) | 24 (100.0%) |
Housing Structure by Heating Type in St Elizabeth
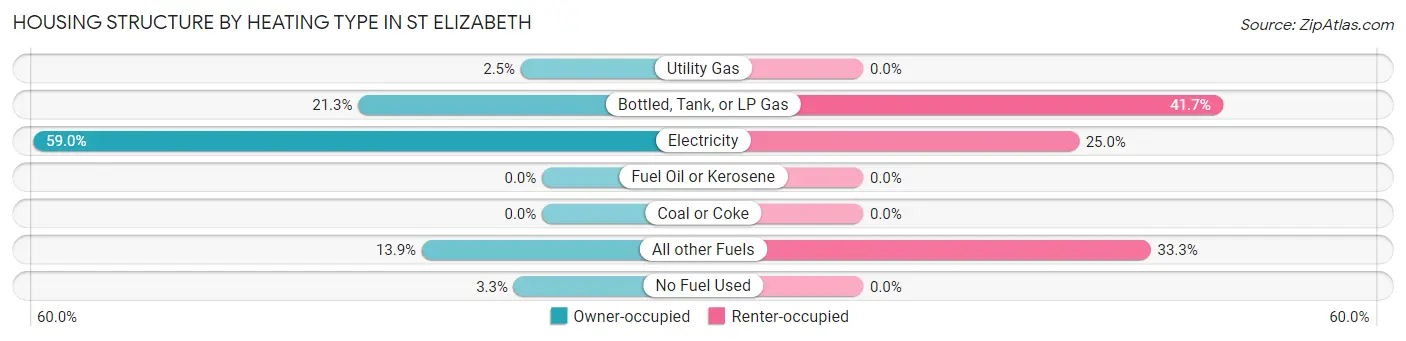
| Heating Type | Owner-occupied | Renter-occupied |
| Utility Gas | 3 (2.5%) | 0 (0.0%) |
| Bottled, Tank, or LP Gas | 26 (21.3%) | 10 (41.7%) |
| Electricity | 72 (59.0%) | 6 (25.0%) |
| Fuel Oil or Kerosene | 0 (0.0%) | 0 (0.0%) |
| Coal or Coke | 0 (0.0%) | 0 (0.0%) |
| All other Fuels | 17 (13.9%) | 8 (33.3%) |
| No Fuel Used | 4 (3.3%) | 0 (0.0%) |
| Total | 122 (100.0%) | 24 (100.0%) |
Household Vehicle Usage in St Elizabeth
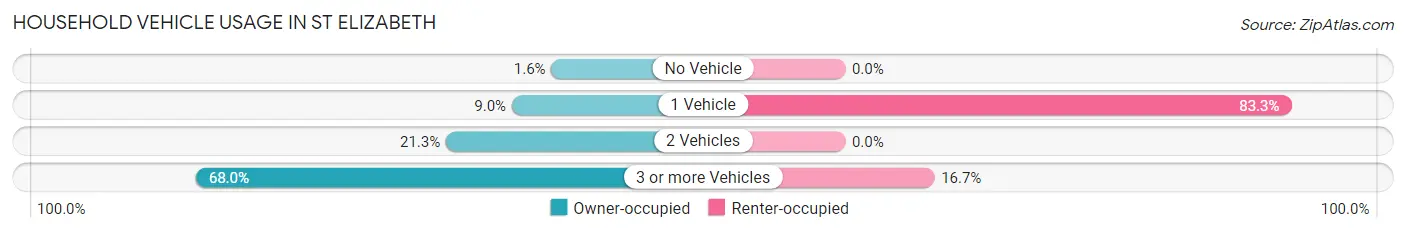
| Vehicles per Household | Owner-occupied | Renter-occupied |
| No Vehicle | 2 (1.6%) | 0 (0.0%) |
| 1 Vehicle | 11 (9.0%) | 20 (83.3%) |
| 2 Vehicles | 26 (21.3%) | 0 (0.0%) |
| 3 or more Vehicles | 83 (68.0%) | 4 (16.7%) |
| Total | 122 (100.0%) | 24 (100.0%) |
Real Estate & Mortgages in St Elizabeth
Real Estate and Mortgage Overview in St Elizabeth
| Characteristic | Without Mortgage | With Mortgage |
| Housing Units | 43 | 79 |
| Median Property Value | $267,900 | $242,500 |
| Median Household Income | $73,750 | $14 |
| Monthly Housing Costs | $515 | $2 |
| Real Estate Taxes | $1,219 | $7 |
Property Value by Mortgage Status in St Elizabeth
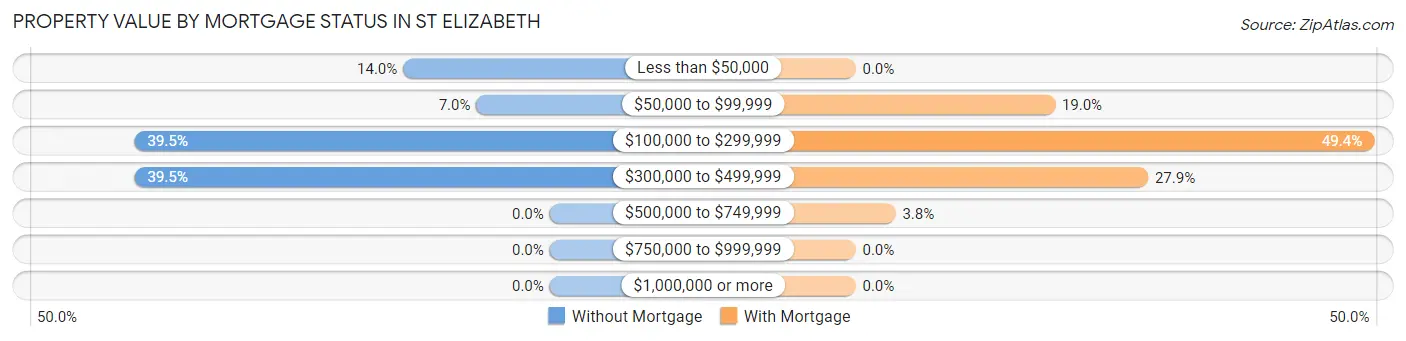
| Property Value | Without Mortgage | With Mortgage |
| Less than $50,000 | 6 (14.0%) | 0 (0.0%) |
| $50,000 to $99,999 | 3 (7.0%) | 15 (19.0%) |
| $100,000 to $299,999 | 17 (39.5%) | 39 (49.4%) |
| $300,000 to $499,999 | 17 (39.5%) | 22 (27.9%) |
| $500,000 to $749,999 | 0 (0.0%) | 3 (3.8%) |
| $750,000 to $999,999 | 0 (0.0%) | 0 (0.0%) |
| $1,000,000 or more | 0 (0.0%) | 0 (0.0%) |
| Total | 43 (100.0%) | 79 (100.0%) |
Household Income by Mortgage Status in St Elizabeth
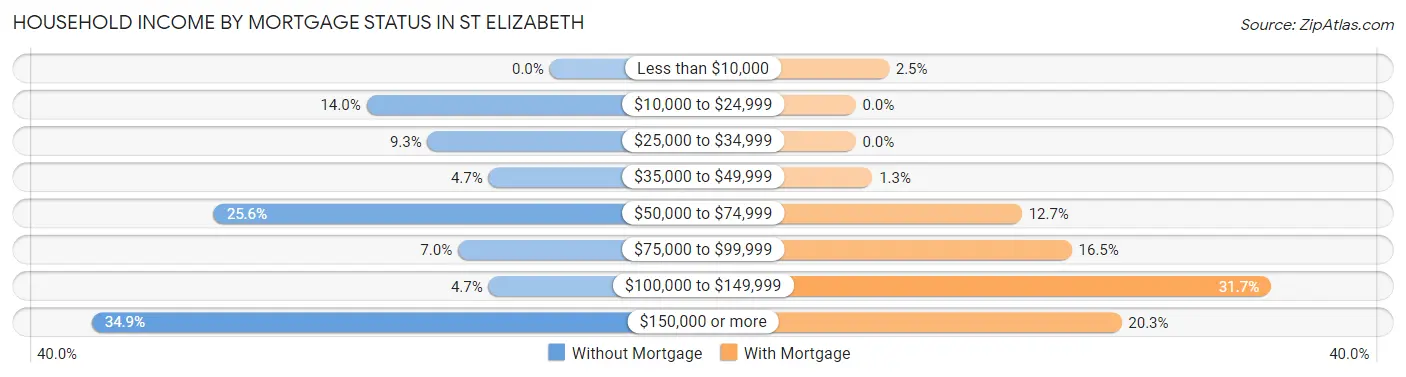
| Household Income | Without Mortgage | With Mortgage |
| Less than $10,000 | 0 (0.0%) | 2 (2.5%) |
| $10,000 to $24,999 | 6 (14.0%) | 0 (0.0%) |
| $25,000 to $34,999 | 4 (9.3%) | 0 (0.0%) |
| $35,000 to $49,999 | 2 (4.6%) | 1 (1.3%) |
| $50,000 to $74,999 | 11 (25.6%) | 10 (12.7%) |
| $75,000 to $99,999 | 3 (7.0%) | 13 (16.5%) |
| $100,000 to $149,999 | 2 (4.6%) | 25 (31.7%) |
| $150,000 or more | 15 (34.9%) | 16 (20.3%) |
| Total | 43 (100.0%) | 79 (100.0%) |
Property Value to Household Income Ratio in St Elizabeth
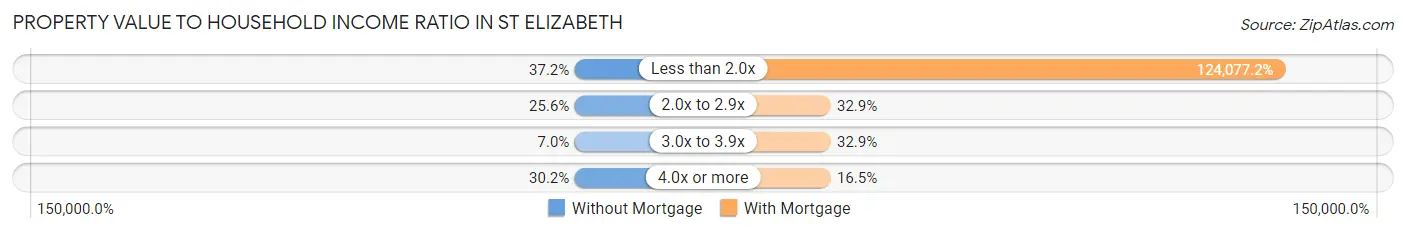
| Value-to-Income Ratio | Without Mortgage | With Mortgage |
| Less than 2.0x | 16 (37.2%) | 98,021 (124,077.2%) |
| 2.0x to 2.9x | 11 (25.6%) | 26 (32.9%) |
| 3.0x to 3.9x | 3 (7.0%) | 26 (32.9%) |
| 4.0x or more | 13 (30.2%) | 13 (16.5%) |
| Total | 43 (100.0%) | 79 (100.0%) |
Real Estate Taxes by Mortgage Status in St Elizabeth
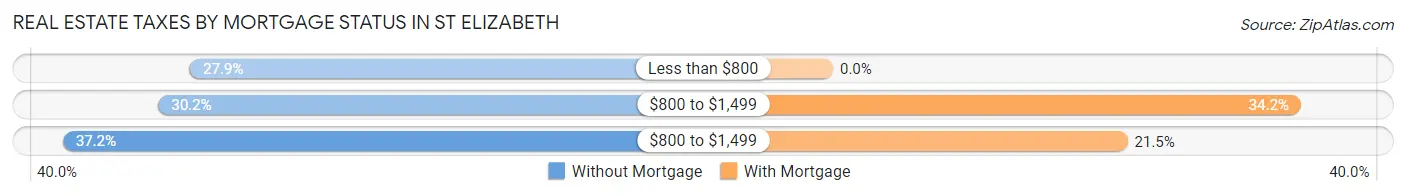
| Property Taxes | Without Mortgage | With Mortgage |
| Less than $800 | 12 (27.9%) | 0 (0.0%) |
| $800 to $1,499 | 13 (30.2%) | 27 (34.2%) |
| $800 to $1,499 | 16 (37.2%) | 17 (21.5%) |
| Total | 43 (100.0%) | 79 (100.0%) |
Health & Disability in St Elizabeth
Health Insurance Coverage by Age in St Elizabeth
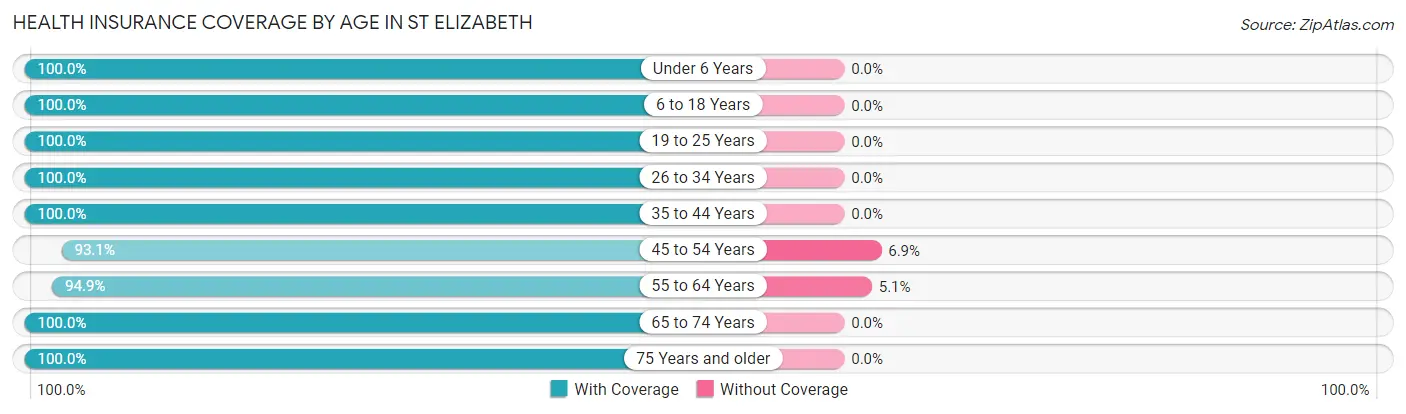
| Age Bracket | With Coverage | Without Coverage |
| Under 6 Years | 68 (100.0%) | 0 (0.0%) |
| 6 to 18 Years | 140 (100.0%) | 0 (0.0%) |
| 19 to 25 Years | 40 (100.0%) | 0 (0.0%) |
| 26 to 34 Years | 59 (100.0%) | 0 (0.0%) |
| 35 to 44 Years | 53 (100.0%) | 0 (0.0%) |
| 45 to 54 Years | 27 (93.1%) | 2 (6.9%) |
| 55 to 64 Years | 37 (94.9%) | 2 (5.1%) |
| 65 to 74 Years | 31 (100.0%) | 0 (0.0%) |
| 75 Years and older | 22 (100.0%) | 0 (0.0%) |
| Total | 477 (99.2%) | 4 (0.8%) |
Health Insurance Coverage by Citizenship Status in St Elizabeth
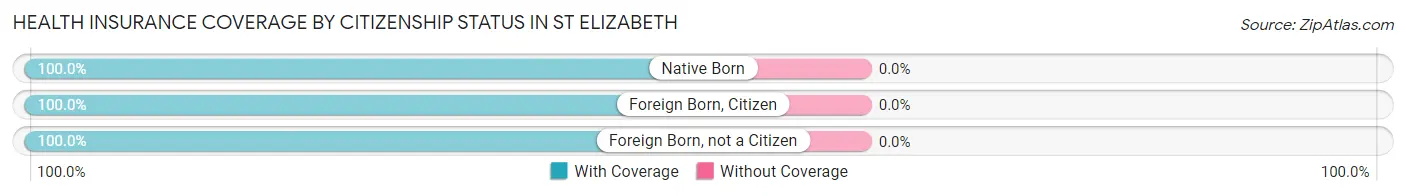
| Citizenship Status | With Coverage | Without Coverage |
| Native Born | 68 (100.0%) | 0 (0.0%) |
| Foreign Born, Citizen | 140 (100.0%) | 0 (0.0%) |
| Foreign Born, not a Citizen | 40 (100.0%) | 0 (0.0%) |
Health Insurance Coverage by Household Income in St Elizabeth
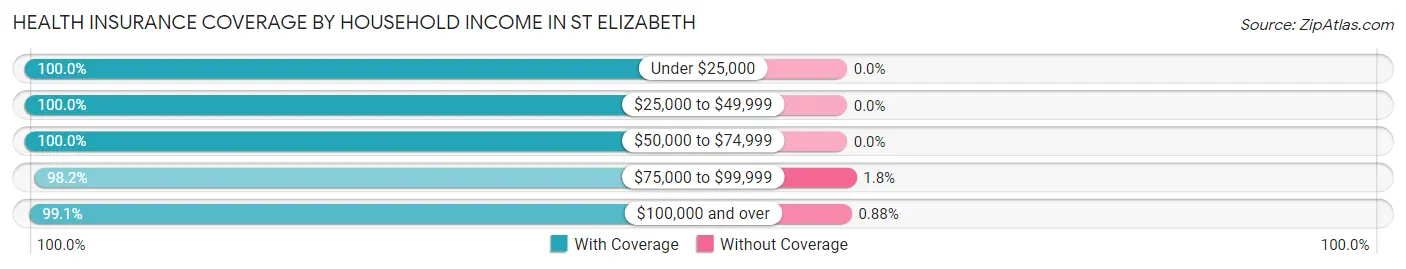
| Household Income | With Coverage | Without Coverage |
| Under $25,000 | 14 (100.0%) | 0 (0.0%) |
| $25,000 to $49,999 | 40 (100.0%) | 0 (0.0%) |
| $50,000 to $74,999 | 88 (100.0%) | 0 (0.0%) |
| $75,000 to $99,999 | 110 (98.2%) | 2 (1.8%) |
| $100,000 and over | 225 (99.1%) | 2 (0.9%) |
Public vs Private Health Insurance Coverage by Age in St Elizabeth
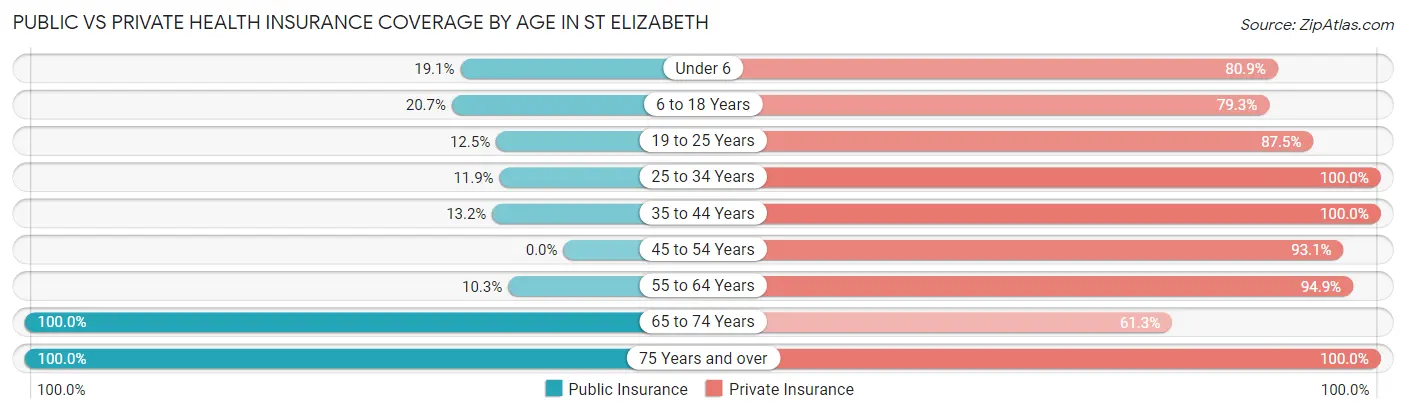
| Age Bracket | Public Insurance | Private Insurance |
| Under 6 | 13 (19.1%) | 55 (80.9%) |
| 6 to 18 Years | 29 (20.7%) | 111 (79.3%) |
| 19 to 25 Years | 5 (12.5%) | 35 (87.5%) |
| 25 to 34 Years | 7 (11.9%) | 59 (100.0%) |
| 35 to 44 Years | 7 (13.2%) | 53 (100.0%) |
| 45 to 54 Years | 0 (0.0%) | 27 (93.1%) |
| 55 to 64 Years | 4 (10.3%) | 37 (94.9%) |
| 65 to 74 Years | 31 (100.0%) | 19 (61.3%) |
| 75 Years and over | 22 (100.0%) | 22 (100.0%) |
| Total | 118 (24.5%) | 418 (86.9%) |
Disability Status by Sex by Age in St Elizabeth
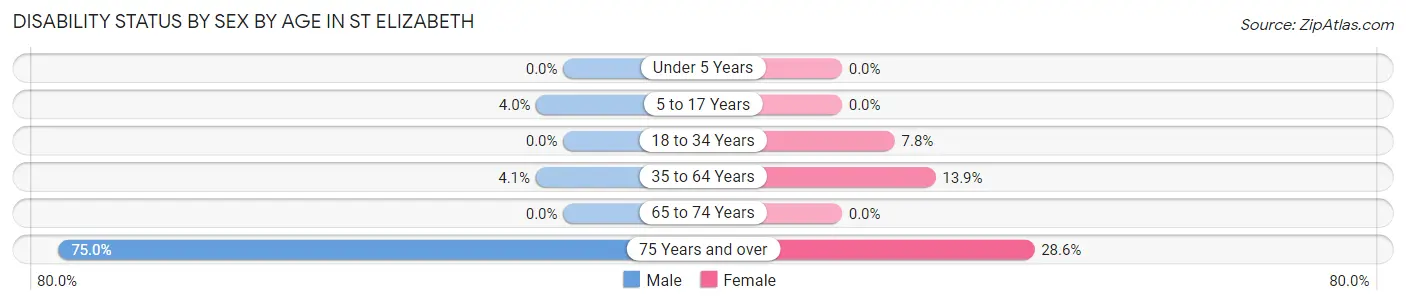
| Age Bracket | Male | Female |
| Under 5 Years | 0 (0.0%) | 0 (0.0%) |
| 5 to 17 Years | 3 (4.0%) | 0 (0.0%) |
| 18 to 34 Years | 0 (0.0%) | 4 (7.8%) |
| 35 to 64 Years | 2 (4.1%) | 10 (13.9%) |
| 65 to 74 Years | 0 (0.0%) | 0 (0.0%) |
| 75 Years and over | 6 (75.0%) | 4 (28.6%) |
Disability Class by Sex by Age in St Elizabeth
Disability Class: Hearing Difficulty
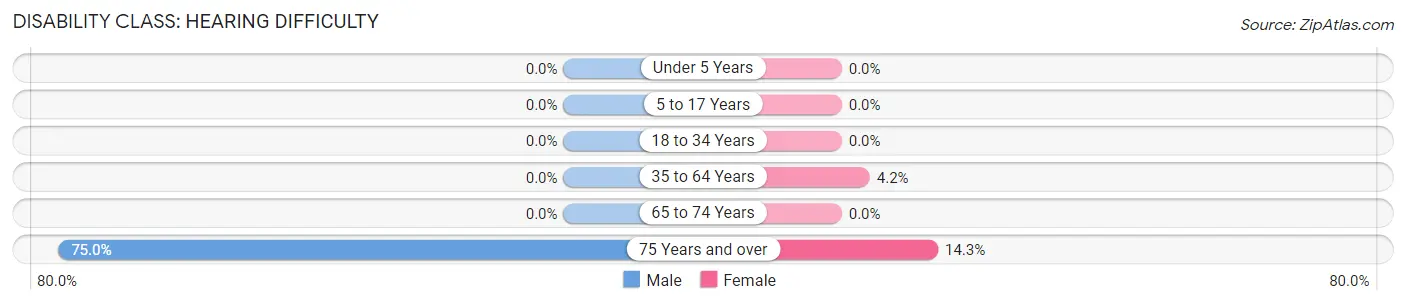
| Age Bracket | Male | Female |
| Under 5 Years | 0 (0.0%) | 0 (0.0%) |
| 5 to 17 Years | 0 (0.0%) | 0 (0.0%) |
| 18 to 34 Years | 0 (0.0%) | 0 (0.0%) |
| 35 to 64 Years | 0 (0.0%) | 3 (4.2%) |
| 65 to 74 Years | 0 (0.0%) | 0 (0.0%) |
| 75 Years and over | 6 (75.0%) | 2 (14.3%) |
Disability Class: Vision Difficulty
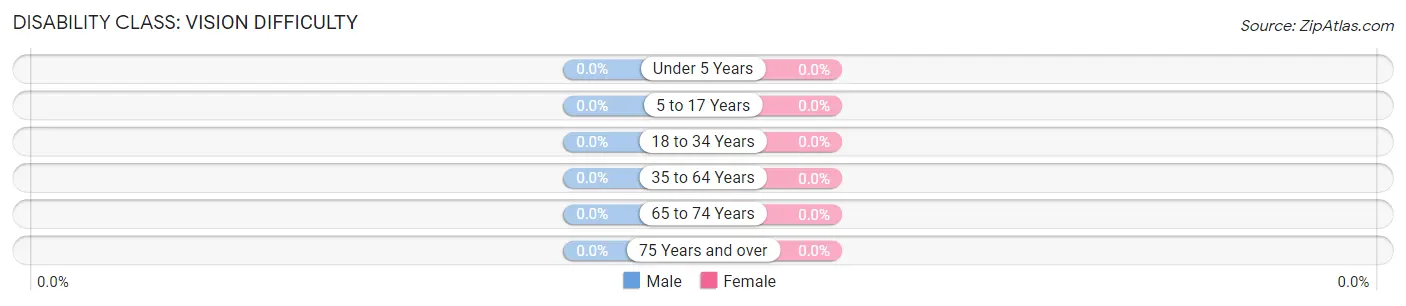
| Age Bracket | Male | Female |
| Under 5 Years | 0 (0.0%) | 0 (0.0%) |
| 5 to 17 Years | 0 (0.0%) | 0 (0.0%) |
| 18 to 34 Years | 0 (0.0%) | 0 (0.0%) |
| 35 to 64 Years | 0 (0.0%) | 0 (0.0%) |
| 65 to 74 Years | 0 (0.0%) | 0 (0.0%) |
| 75 Years and over | 0 (0.0%) | 0 (0.0%) |
Disability Class: Cognitive Difficulty
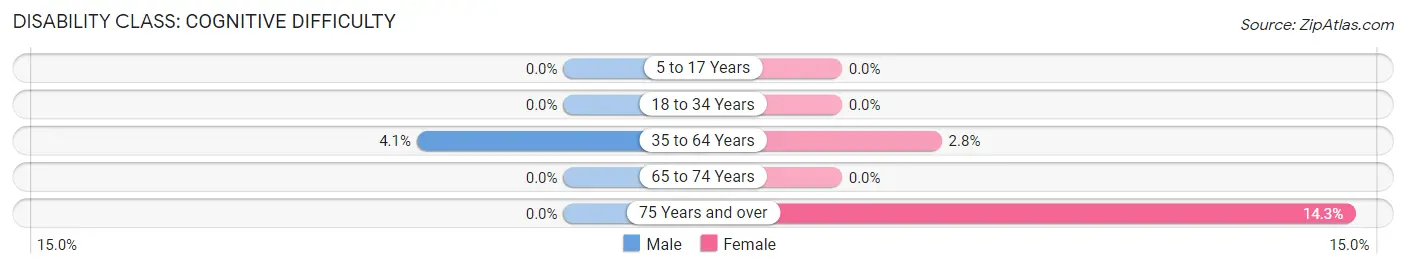
| Age Bracket | Male | Female |
| 5 to 17 Years | 0 (0.0%) | 0 (0.0%) |
| 18 to 34 Years | 0 (0.0%) | 0 (0.0%) |
| 35 to 64 Years | 2 (4.1%) | 2 (2.8%) |
| 65 to 74 Years | 0 (0.0%) | 0 (0.0%) |
| 75 Years and over | 0 (0.0%) | 2 (14.3%) |
Disability Class: Ambulatory Difficulty
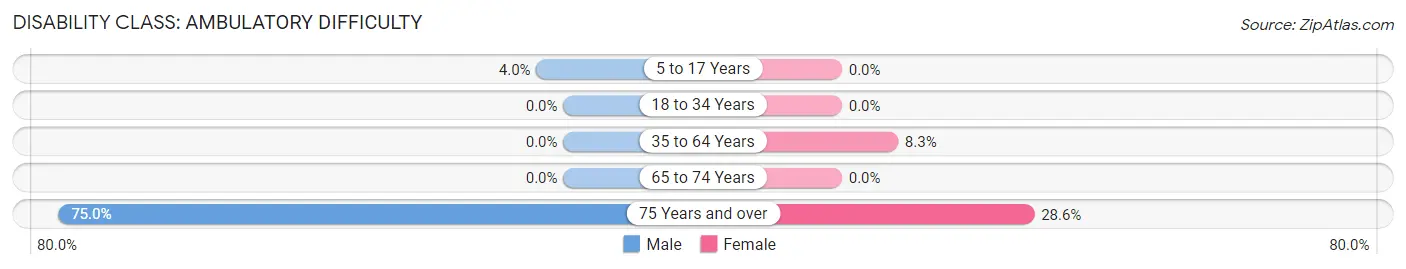
| Age Bracket | Male | Female |
| 5 to 17 Years | 3 (4.0%) | 0 (0.0%) |
| 18 to 34 Years | 0 (0.0%) | 0 (0.0%) |
| 35 to 64 Years | 0 (0.0%) | 6 (8.3%) |
| 65 to 74 Years | 0 (0.0%) | 0 (0.0%) |
| 75 Years and over | 6 (75.0%) | 4 (28.6%) |
Disability Class: Self-Care Difficulty
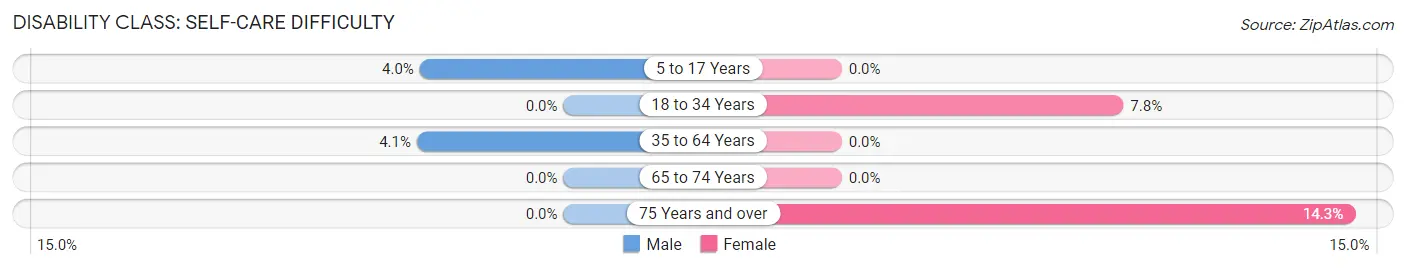
| Age Bracket | Male | Female |
| 5 to 17 Years | 3 (4.0%) | 0 (0.0%) |
| 18 to 34 Years | 0 (0.0%) | 4 (7.8%) |
| 35 to 64 Years | 2 (4.1%) | 0 (0.0%) |
| 65 to 74 Years | 0 (0.0%) | 0 (0.0%) |
| 75 Years and over | 0 (0.0%) | 2 (14.3%) |
Technology Access in St Elizabeth
Computing Device Access in St Elizabeth
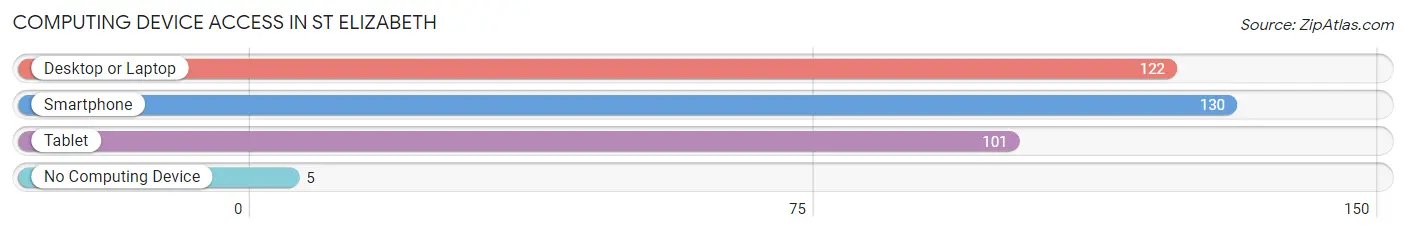
| Device Type | # Households | % Households |
| Desktop or Laptop | 122 | 83.6% |
| Smartphone | 130 | 89.0% |
| Tablet | 101 | 69.2% |
| No Computing Device | 5 | 3.4% |
| Total | 146 | 100.0% |
Internet Access in St Elizabeth
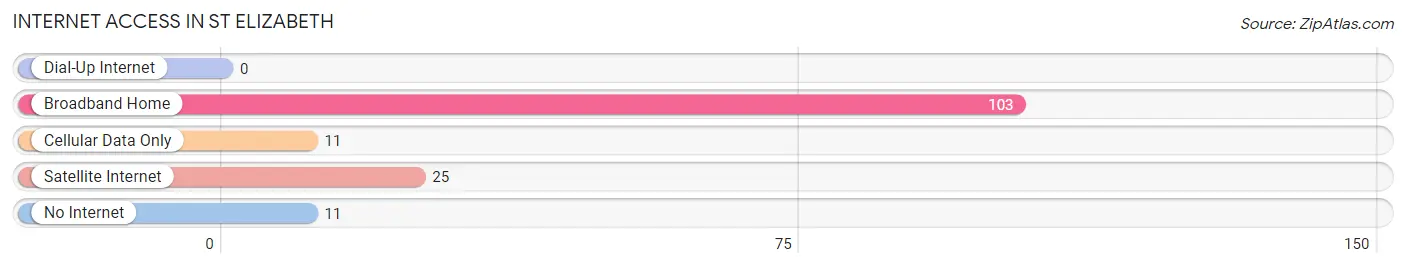
| Internet Type | # Households | % Households |
| Dial-Up Internet | 0 | 0.0% |
| Broadband Home | 103 | 70.6% |
| Cellular Data Only | 11 | 7.5% |
| Satellite Internet | 25 | 17.1% |
| No Internet | 11 | 7.5% |
| Total | 146 | 100.0% |
St Elizabeth Summary
History
St. Elizabeth, Missouri is a small town located in Miller County, Missouri. It is situated on the banks of the Osage River, and is part of the Lake of the Ozarks region. The town was founded in 1837 by a group of German immigrants, and was named after the patron saint of their homeland, St. Elizabeth of Hungary. The town was originally a farming community, and the main crops grown were corn, wheat, and hay.
In the late 1800s, the town began to grow and develop. The first post office was established in 1883, and the first school was built in 1885. The town also had a blacksmith shop, a general store, and a hotel.
In the early 1900s, the town began to experience a period of growth and prosperity. The population increased from just over 200 in 1900 to over 500 in 1910. The town also had a number of businesses, including a bank, a newspaper, a lumber yard, and a flour mill.
In the 1920s, the town experienced a period of decline. The population decreased from over 500 in 1910 to just over 300 in 1930. The Great Depression also had a negative impact on the town, and many businesses closed.
In the 1940s, the town began to experience a period of growth and development. The population increased from just over 300 in 1930 to over 500 in 1950. The town also had a number of businesses, including a grocery store, a hardware store, a drug store, and a movie theater.
In the 1950s, the town experienced a period of decline. The population decreased from over 500 in 1950 to just over 300 in 1960. The town also had a number of businesses, including a grocery store, a hardware store, a drug store, and a movie theater.
In the 1960s, the town experienced a period of growth and development. The population increased from just over 300 in 1960 to over 500 in 1970. The town also had a number of businesses, including a grocery store, a hardware store, a drug store, and a movie theater.
In the 1970s, the town experienced a period of decline. The population decreased from over 500 in 1970 to just over 300 in 1980. The town also had a number of businesses, including a grocery store, a hardware store, a drug store, and a movie theater.
In the 1980s, the town experienced a period of growth and development. The population increased from just over 300 in 1980 to over 500 in 1990. The town also had a number of businesses, including a grocery store, a hardware store, a drug store, and a movie theater.
In the 1990s, the town experienced a period of decline. The population decreased from over 500 in 1990 to just over 300 in 2000. The town also had a number of businesses, including a grocery store, a hardware store, a drug store, and a movie theater.
Geography
St. Elizabeth is located in Miller County, Missouri. It is situated on the banks of the Osage River, and is part of the Lake of the Ozarks region. The town is located in the Ozark Mountains, and is surrounded by rolling hills and forests. The climate is humid and subtropical, with hot summers and mild winters.
Economy
The economy of St. Elizabeth is largely based on agriculture and tourism. The town is home to a number of farms, which produce corn, wheat, hay, and other crops. The town also has a number of businesses, including a grocery store, a hardware store, a drug store, and a movie theater.
Tourism is also an important part of the economy. The town is home to a number of attractions, including the St. Elizabeth Historical Museum, the St. Elizabeth State Park, and the St. Elizabeth Wildlife Refuge. The town also hosts a number of festivals and events throughout the year, including the St. Elizabeth Summer Festival and the St. Elizabeth Fall Festival.
Demographics
As of the 2010 census, the population of St. Elizabeth was 437. The racial makeup of the town was 97.3% White, 0.2% African American, 0.2% Native American, 0.2% Asian, 0.2% from other races, and 1.9% from two or more races. Hispanic or Latino of any race were 0.7% of the population.
The median income for a household in the town was $35,625, and the median income for a family was $41,250. The per capita income for the town was $17,845. About 11.2% of families and 14.2% of the population were below the poverty line, including 18.2% of those under age 18 and 8.3% of those age 65 or over.
Common Questions
What is Per Capita Income in St Elizabeth?
Per Capita income in St Elizabeth is $28,947.
What is the Median Family Income in St Elizabeth?
Median Family Income in St Elizabeth is $98,438.
What is the Median Household income in St Elizabeth?
Median Household Income in St Elizabeth is $90,000.
What is Income or Wage Gap in St Elizabeth?
Income or Wage Gap in St Elizabeth is 2.8%.
Women in St Elizabeth earn 97.2 cents for every dollar earned by a man.
What is Inequality or Gini Index in St Elizabeth?
Inequality or Gini Index in St Elizabeth is 0.33.
What is the Total Population of St Elizabeth?
Total Population of St Elizabeth is 527.
What is the Total Male Population of St Elizabeth?
Total Male Population of St Elizabeth is 244.
What is the Total Female Population of St Elizabeth?
Total Female Population of St Elizabeth is 283.
What is the Ratio of Males per 100 Females in St Elizabeth?
There are 86.22 Males per 100 Females in St Elizabeth.
What is the Ratio of Females per 100 Males in St Elizabeth?
There are 115.98 Females per 100 Males in St Elizabeth.
What is the Median Population Age in St Elizabeth?
Median Population Age in St Elizabeth is 28.2 Years.
What is the Average Family Size in St Elizabeth
Average Family Size in St Elizabeth is 3.7 People.
What is the Average Household Size in St Elizabeth
Average Household Size in St Elizabeth is 3.3 People.
How Large is the Labor Force in St Elizabeth?
There are 217 People in the Labor Forcein in St Elizabeth.
What is the Percentage of People in the Labor Force in St Elizabeth?
63.3% of People are in the Labor Force in St Elizabeth.
What is the Unemployment Rate in St Elizabeth?
Unemployment Rate in St Elizabeth is 1.9%.