Zip Codes with the Highest Percentage of Population Employed in Legal Services & Support in Blue Springs, MO
RELATED REPORTS & OPTIONS
Legal Services & Support
Blue Springs
Compare Zip Codes
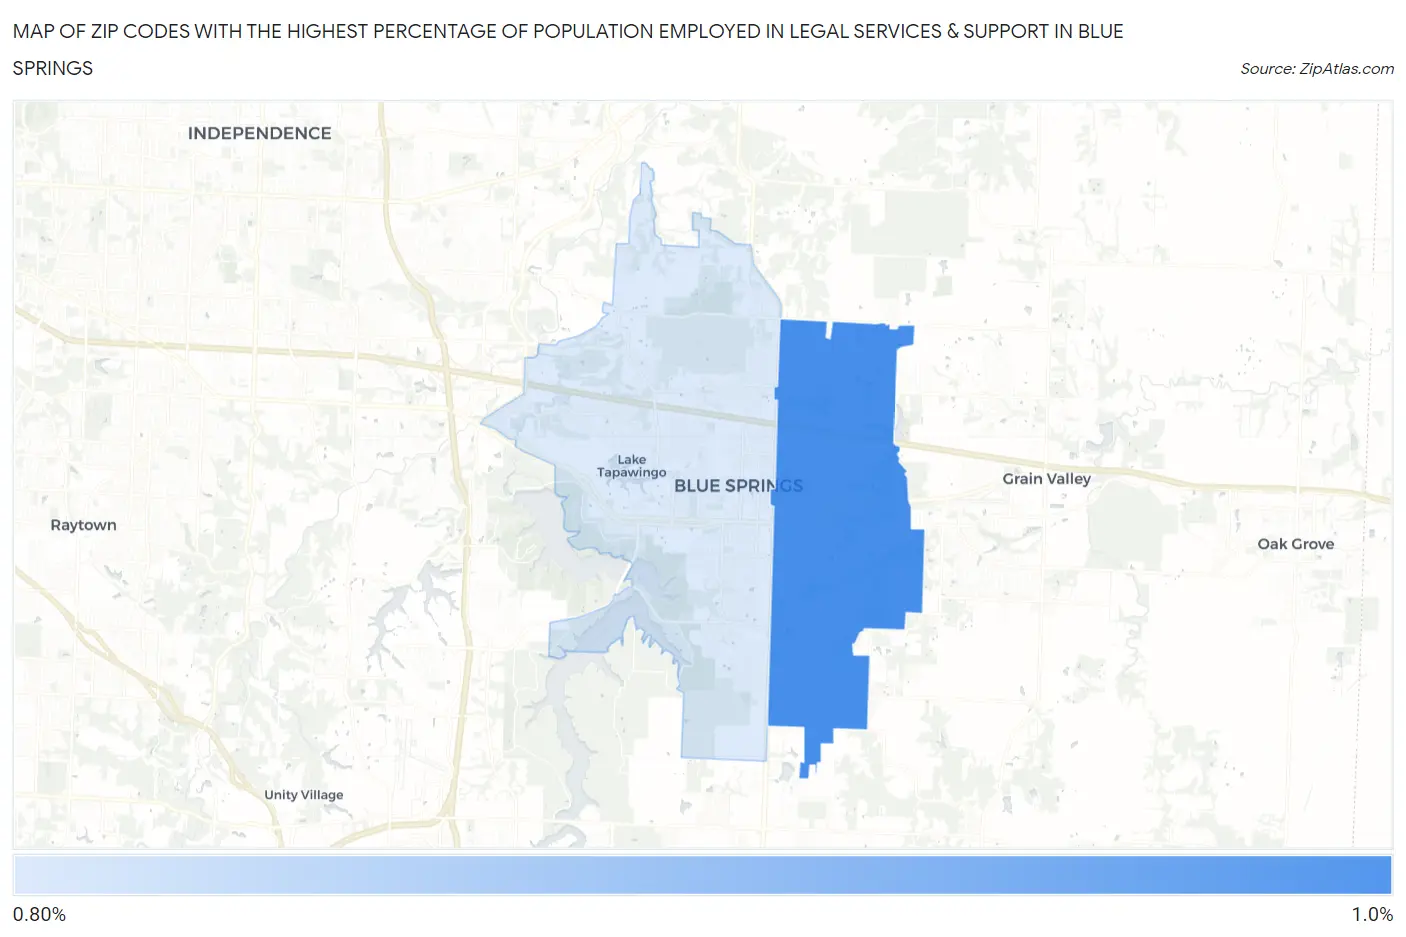
Map of Zip Codes with the Highest Percentage of Population Employed in Legal Services & Support in Blue Springs
0.87%
0.99%
Zip Codes with the Highest Percentage of Population Employed in Legal Services & Support in Blue Springs, MO
| Zip Code | % Employed | vs State | vs National | |
| 1. | 64014 | 0.99% | 0.99%(-0.003)#169 | 1.2%(-0.196)#7,910 |
| 2. | 64015 | 0.87% | 0.99%(-0.117)#188 | 1.2%(-0.311)#8,831 |
1
Common Questions
What are the Top Zip Codes with the Highest Percentage of Population Employed in Legal Services & Support in Blue Springs, MO?
Top Zip Codes with the Highest Percentage of Population Employed in Legal Services & Support in Blue Springs, MO are:
What zip code has the Highest Percentage of Population Employed in Legal Services & Support in Blue Springs, MO?
64014 has the Highest Percentage of Population Employed in Legal Services & Support in Blue Springs, MO with 0.99%.
What is the Percentage of Population Employed in Legal Services & Support in Blue Springs, MO?
Percentage of Population Employed in Legal Services & Support in Blue Springs is 0.91%.
What is the Percentage of Population Employed in Legal Services & Support in Missouri?
Percentage of Population Employed in Legal Services & Support in Missouri is 0.99%.
What is the Percentage of Population Employed in Legal Services & Support in the United States?
Percentage of Population Employed in Legal Services & Support in the United States is 1.2%.