Cool Valley, MO Map & Demographics
Cool Valley Map
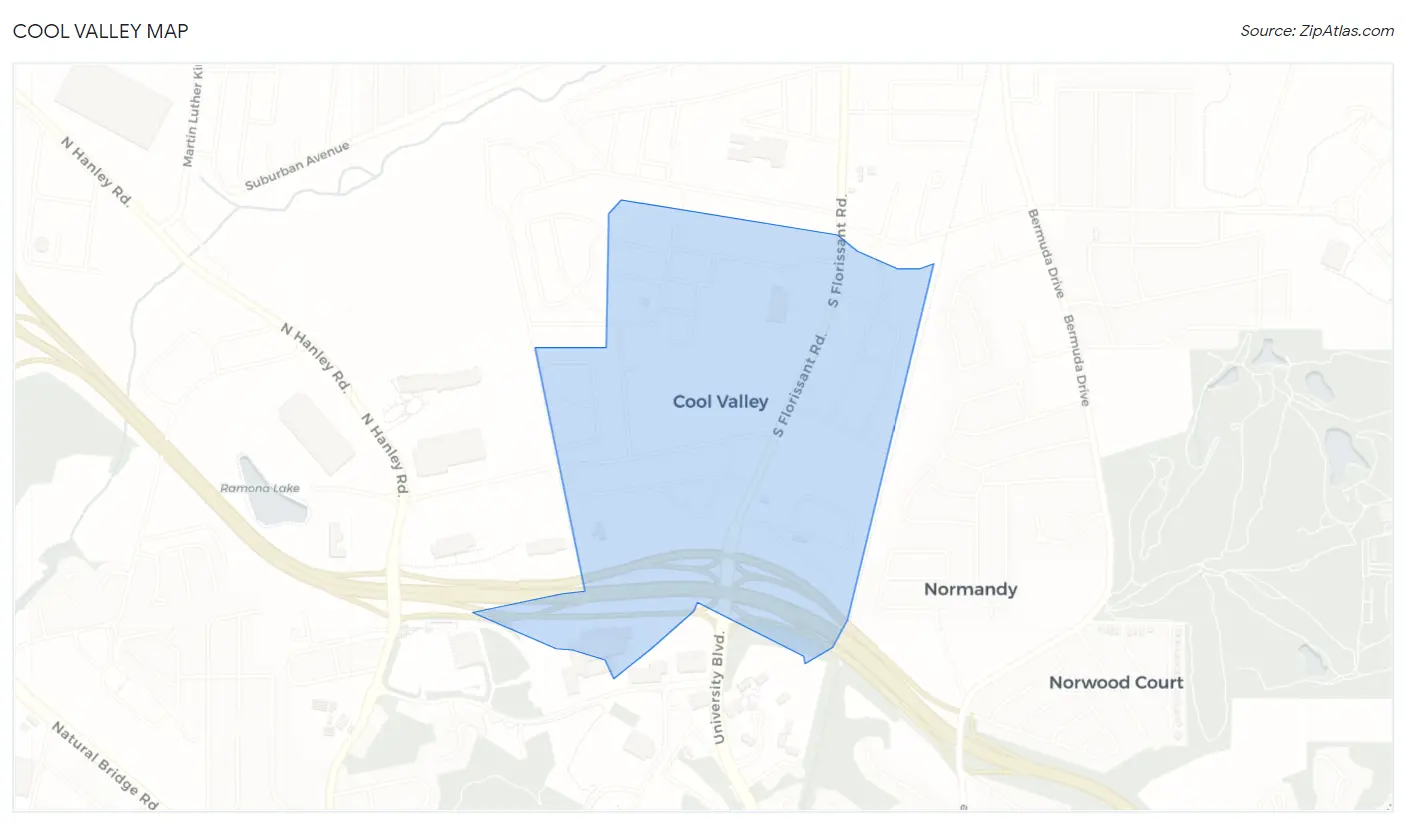
Cool Valley Overview
$22,273
PER CAPITA INCOME
$56,818
AVG FAMILY INCOME
$49,792
AVG HOUSEHOLD INCOME
34.7%
WAGE / INCOME GAP [ % ]
65.3¢/ $1
WAGE / INCOME GAP [ $ ]
0.44
INEQUALITY / GINI INDEX
1,175
TOTAL POPULATION
507
MALE POPULATION
668
FEMALE POPULATION
75.90
MALES / 100 FEMALES
131.76
FEMALES / 100 MALES
29.0
MEDIAN AGE
3.6
AVG FAMILY SIZE
2.9
AVG HOUSEHOLD SIZE
478
LABOR FORCE [ PEOPLE ]
59.5%
PERCENT IN LABOR FORCE
4.2%
UNEMPLOYMENT RATE
Cool Valley Area Codes
Income in Cool Valley
Income Overview in Cool Valley
Per Capita Income in Cool Valley is $22,273, while median incomes of families and households are $56,818 and $49,792 respectively.
| Characteristic | Number | Measure |
| Per Capita Income | 1,175 | $22,273 |
| Median Family Income | 280 | $56,818 |
| Mean Family Income | 280 | $65,508 |
| Median Household Income | 404 | $49,792 |
| Mean Household Income | 404 | $65,817 |
| Income Deficit | 280 | $0 |
| Wage / Income Gap (%) | 1,175 | 34.74% |
| Wage / Income Gap ($) | 1,175 | 65.26¢ per $1 |
| Gini / Inequality Index | 1,175 | 0.44 |
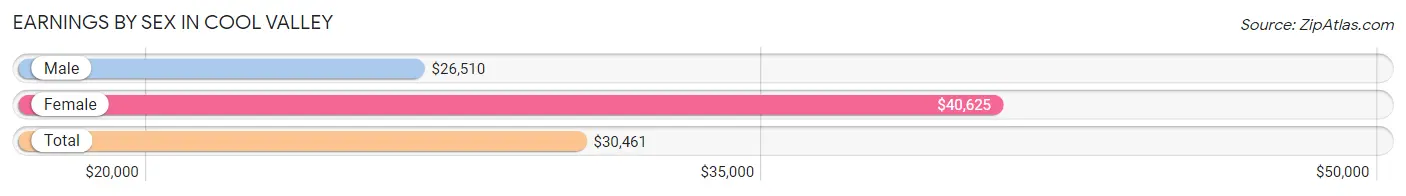
Earnings by Sex in Cool Valley
Average Earnings in Cool Valley are $30,461, $26,510 for men and $40,625 for women, a difference of 34.7%.
| Sex | Number | Average Earnings |
| Male | 251 (50.5%) | $26,510 |
| Female | 246 (49.5%) | $40,625 |
| Total | 497 (100.0%) | $30,461 |
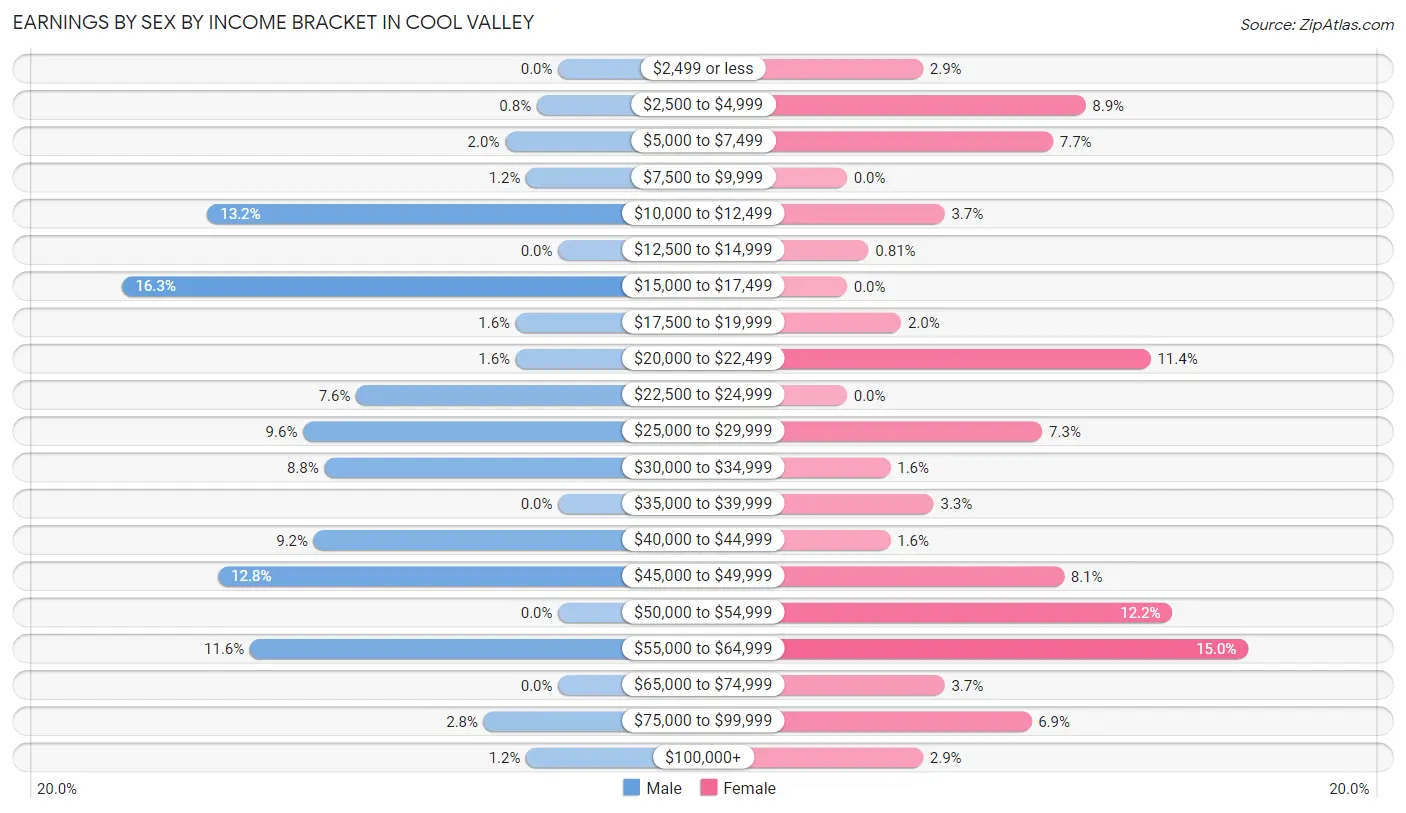
Earnings by Sex by Income Bracket in Cool Valley
The most common earnings brackets in Cool Valley are $15,000 to $17,499 for men (41 | 16.3%) and $55,000 to $64,999 for women (37 | 15.0%).
| Income | Male | Female |
| $2,499 or less | 0 (0.0%) | 7 (2.9%) |
| $2,500 to $4,999 | 2 (0.8%) | 22 (8.9%) |
| $5,000 to $7,499 | 5 (2.0%) | 19 (7.7%) |
| $7,500 to $9,999 | 3 (1.2%) | 0 (0.0%) |
| $10,000 to $12,499 | 33 (13.2%) | 9 (3.7%) |
| $12,500 to $14,999 | 0 (0.0%) | 2 (0.8%) |
| $15,000 to $17,499 | 41 (16.3%) | 0 (0.0%) |
| $17,500 to $19,999 | 4 (1.6%) | 5 (2.0%) |
| $20,000 to $22,499 | 4 (1.6%) | 28 (11.4%) |
| $22,500 to $24,999 | 19 (7.6%) | 0 (0.0%) |
| $25,000 to $29,999 | 24 (9.6%) | 18 (7.3%) |
| $30,000 to $34,999 | 22 (8.8%) | 4 (1.6%) |
| $35,000 to $39,999 | 0 (0.0%) | 8 (3.3%) |
| $40,000 to $44,999 | 23 (9.2%) | 4 (1.6%) |
| $45,000 to $49,999 | 32 (12.8%) | 20 (8.1%) |
| $50,000 to $54,999 | 0 (0.0%) | 30 (12.2%) |
| $55,000 to $64,999 | 29 (11.6%) | 37 (15.0%) |
| $65,000 to $74,999 | 0 (0.0%) | 9 (3.7%) |
| $75,000 to $99,999 | 7 (2.8%) | 17 (6.9%) |
| $100,000+ | 3 (1.2%) | 7 (2.9%) |
| Total | 251 (100.0%) | 246 (100.0%) |
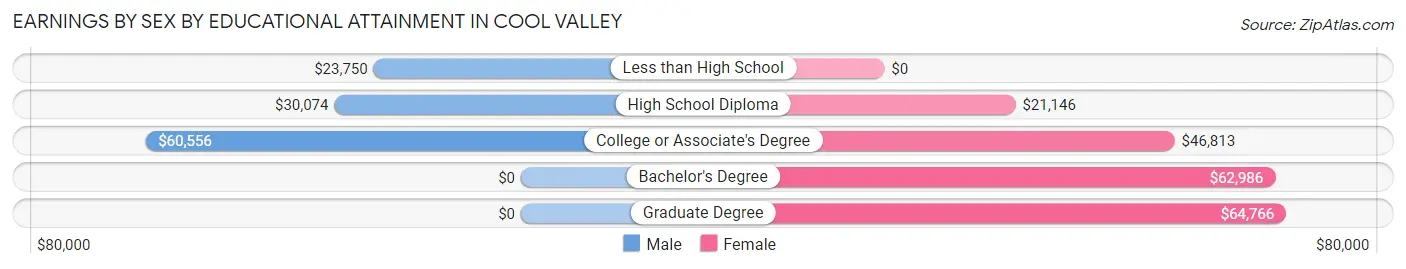
Earnings by Sex by Educational Attainment in Cool Valley
Average earnings in Cool Valley are $32,153 for men and $46,188 for women, a difference of 30.4%. Men with an educational attainment of college or associate's degree enjoy the highest average annual earnings of $60,556, while those with less than high school education earn the least with $23,750. Women with an educational attainment of graduate degree earn the most with the average annual earnings of $64,766, while those with high school diploma education have the smallest earnings of $21,146.
| Educational Attainment | Male Income | Female Income |
| Less than High School | $23,750 | $0 |
| High School Diploma | $30,074 | $21,146 |
| College or Associate's Degree | $60,556 | $46,813 |
| Bachelor's Degree | - | - |
| Graduate Degree | - | - |
| Total | $32,153 | $46,188 |
Family Income in Cool Valley
Family Income Brackets in Cool Valley
According to the Cool Valley family income data, there are 53 families falling into the $75,000 to $99,999 income range, which is the most common income bracket and makes up 18.9% of all families. Conversely, the $10,000 to $14,999 income bracket is the least frequent group with only 2 families (0.7%) belonging to this category.
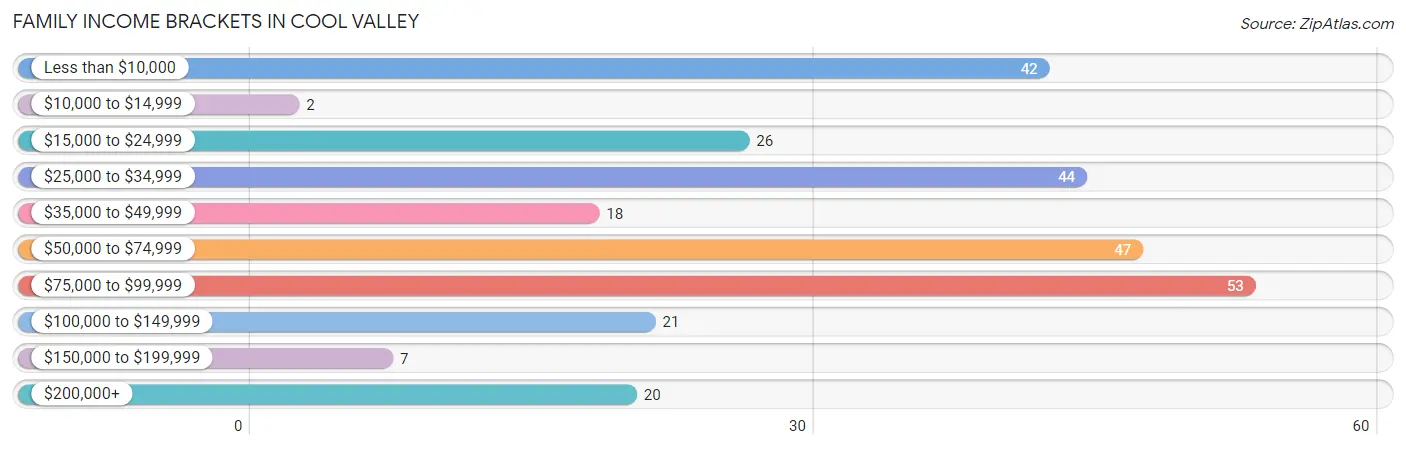
| Income Bracket | # Families | % Families |
| Less than $10,000 | 42 | 15.0% |
| $10,000 to $14,999 | 2 | 0.7% |
| $15,000 to $24,999 | 26 | 9.3% |
| $25,000 to $34,999 | 44 | 15.7% |
| $35,000 to $49,999 | 18 | 6.4% |
| $50,000 to $74,999 | 47 | 16.8% |
| $75,000 to $99,999 | 53 | 18.9% |
| $100,000 to $149,999 | 21 | 7.5% |
| $150,000 to $199,999 | 7 | 2.5% |
| $200,000+ | 20 | 7.1% |
Family Income by Famaliy Size in Cool Valley
2-person families (102 | 36.4%) account for the highest median family income in Cool Valley with $67,143 per family, while 2-person families (102 | 36.4%) have the highest median income of $33,572 per family member.
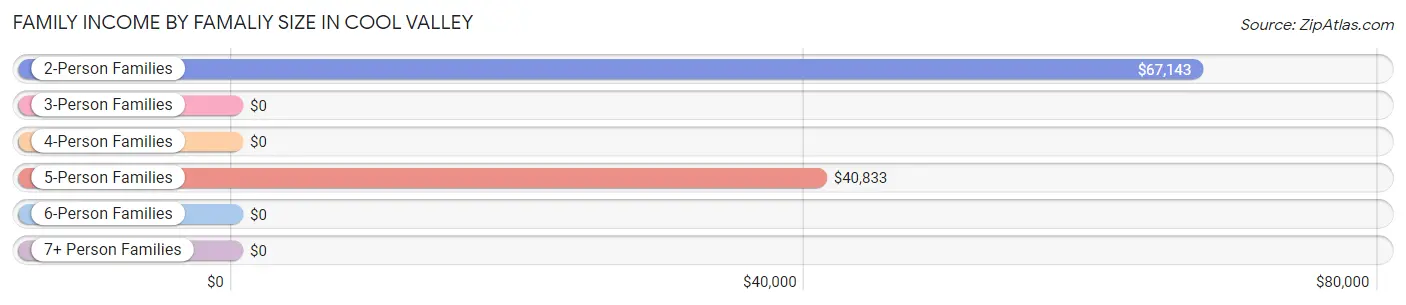
| Income Bracket | # Families | Median Income |
| 2-Person Families | 102 (36.4%) | $67,143 |
| 3-Person Families | 70 (25.0%) | $0 |
| 4-Person Families | 43 (15.4%) | $0 |
| 5-Person Families | 50 (17.9%) | $40,833 |
| 6-Person Families | 0 (0.0%) | $0 |
| 7+ Person Families | 15 (5.4%) | $0 |
| Total | 280 (100.0%) | $56,818 |
Family Income by Number of Earners in Cool Valley
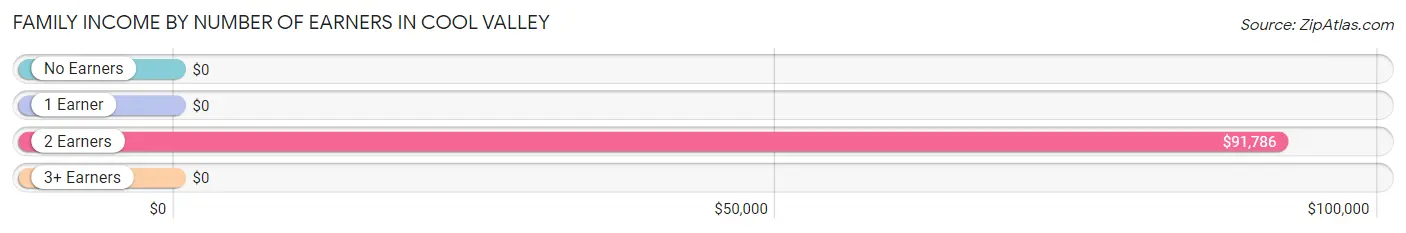
| Number of Earners | # Families | Median Income |
| No Earners | 85 (30.4%) | $0 |
| 1 Earner | 100 (35.7%) | $0 |
| 2 Earners | 88 (31.4%) | $91,786 |
| 3+ Earners | 7 (2.5%) | $0 |
| Total | 280 (100.0%) | $56,818 |
Household Income in Cool Valley
Household Income Brackets in Cool Valley
With 80 households falling in the category, the $75,000 to $99,999 income range is the most frequent in Cool Valley, accounting for 19.8% of all households. In contrast, only 7 households (1.7%) fall into the $10,000 to $14,999 income bracket, making it the least populous group.
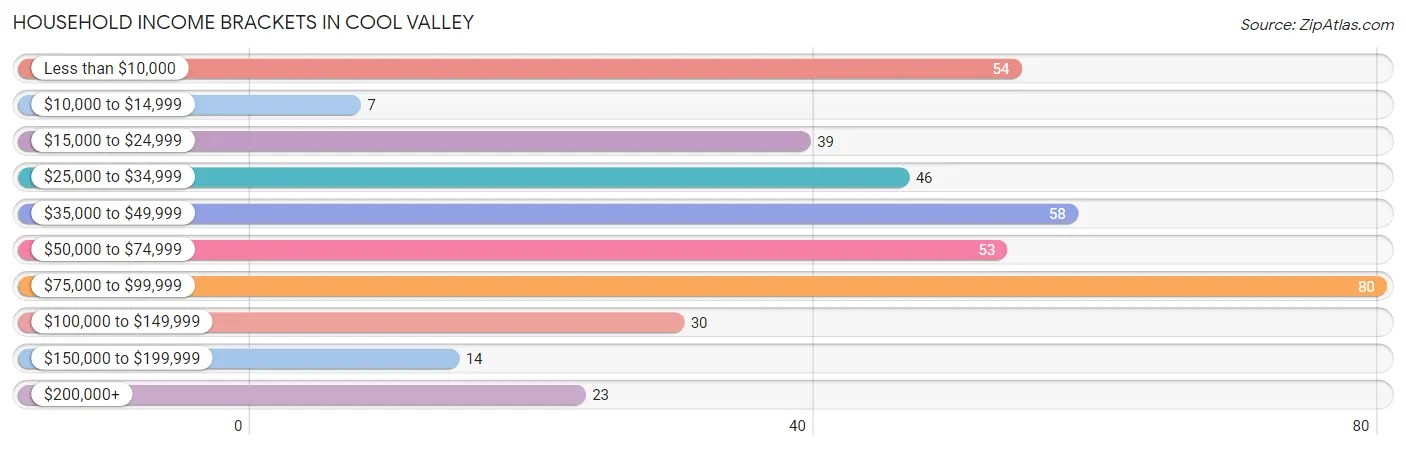
| Income Bracket | # Households | % Households |
| Less than $10,000 | 54 | 13.4% |
| $10,000 to $14,999 | 7 | 1.7% |
| $15,000 to $24,999 | 39 | 9.7% |
| $25,000 to $34,999 | 46 | 11.4% |
| $35,000 to $49,999 | 58 | 14.4% |
| $50,000 to $74,999 | 53 | 13.1% |
| $75,000 to $99,999 | 80 | 19.8% |
| $100,000 to $149,999 | 30 | 7.4% |
| $150,000 to $199,999 | 14 | 3.5% |
| $200,000+ | 23 | 5.7% |
Household Income by Householder Age in Cool Valley
The median household income in Cool Valley is $49,792, with the highest median household income of $66,667 found in the 45 to 64 years age bracket for the primary householder. A total of 128 households (31.7%) fall into this category.
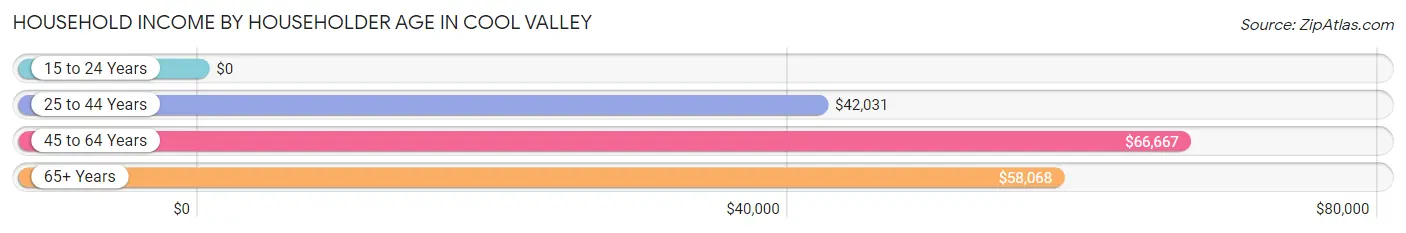
| Income Bracket | # Households | Median Income |
| 15 to 24 Years | 0 (0.0%) | $0 |
| 25 to 44 Years | 149 (36.9%) | $42,031 |
| 45 to 64 Years | 128 (31.7%) | $66,667 |
| 65+ Years | 127 (31.4%) | $58,068 |
| Total | 404 (100.0%) | $49,792 |
Poverty in Cool Valley
Income Below Poverty by Sex and Age in Cool Valley
With 26.8% poverty level for males and 41.0% for females among the residents of Cool Valley, 6 to 11 year old males and 15 year old females are the most vulnerable to poverty, with 57 males (91.9%) and 17 females (100.0%) in their respective age groups living below the poverty level.
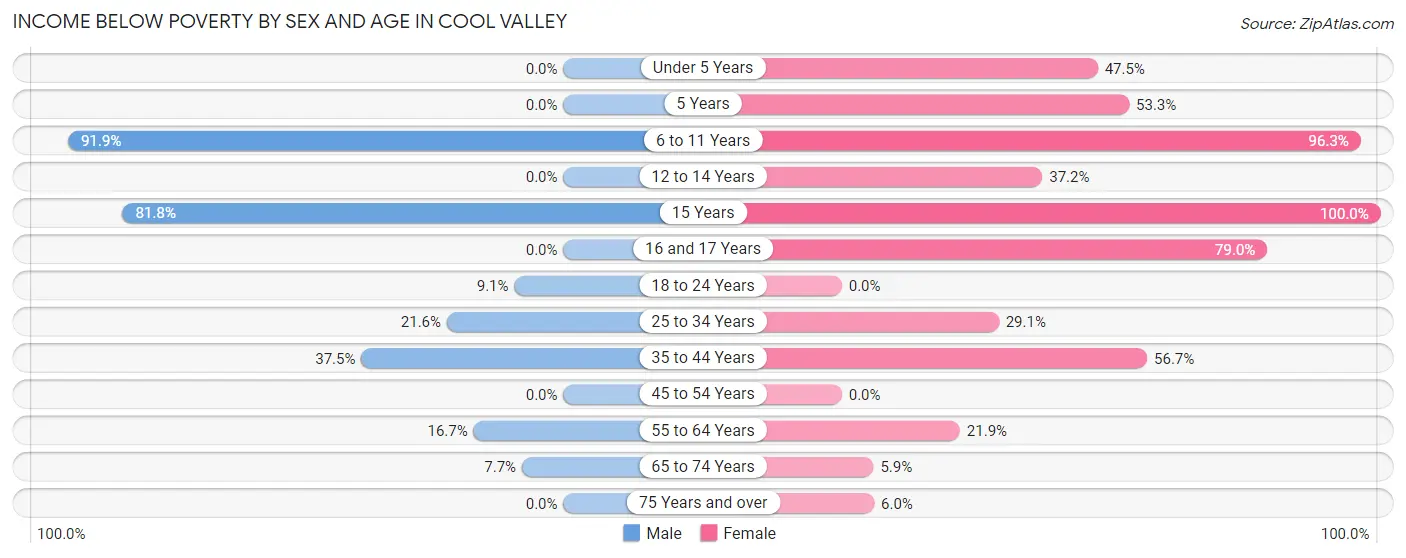
| Age Bracket | Male | Female |
| Under 5 Years | 0 (0.0%) | 19 (47.5%) |
| 5 Years | 0 (0.0%) | 16 (53.3%) |
| 6 to 11 Years | 57 (91.9%) | 104 (96.3%) |
| 12 to 14 Years | 0 (0.0%) | 16 (37.2%) |
| 15 Years | 18 (81.8%) | 17 (100.0%) |
| 16 and 17 Years | 0 (0.0%) | 15 (78.9%) |
| 18 to 24 Years | 5 (9.1%) | 0 (0.0%) |
| 25 to 34 Years | 24 (21.6%) | 30 (29.1%) |
| 35 to 44 Years | 15 (37.5%) | 34 (56.7%) |
| 45 to 54 Years | 0 (0.0%) | 0 (0.0%) |
| 55 to 64 Years | 15 (16.7%) | 16 (21.9%) |
| 65 to 74 Years | 2 (7.7%) | 4 (5.9%) |
| 75 Years and over | 0 (0.0%) | 3 (6.0%) |
| Total | 136 (26.8%) | 274 (41.0%) |
Income Above Poverty by Sex and Age in Cool Valley
According to the poverty statistics in Cool Valley, males aged under 5 years and females aged 18 to 24 years are the age groups that are most secure financially, with 100.0% of males and 100.0% of females in these age groups living above the poverty line.
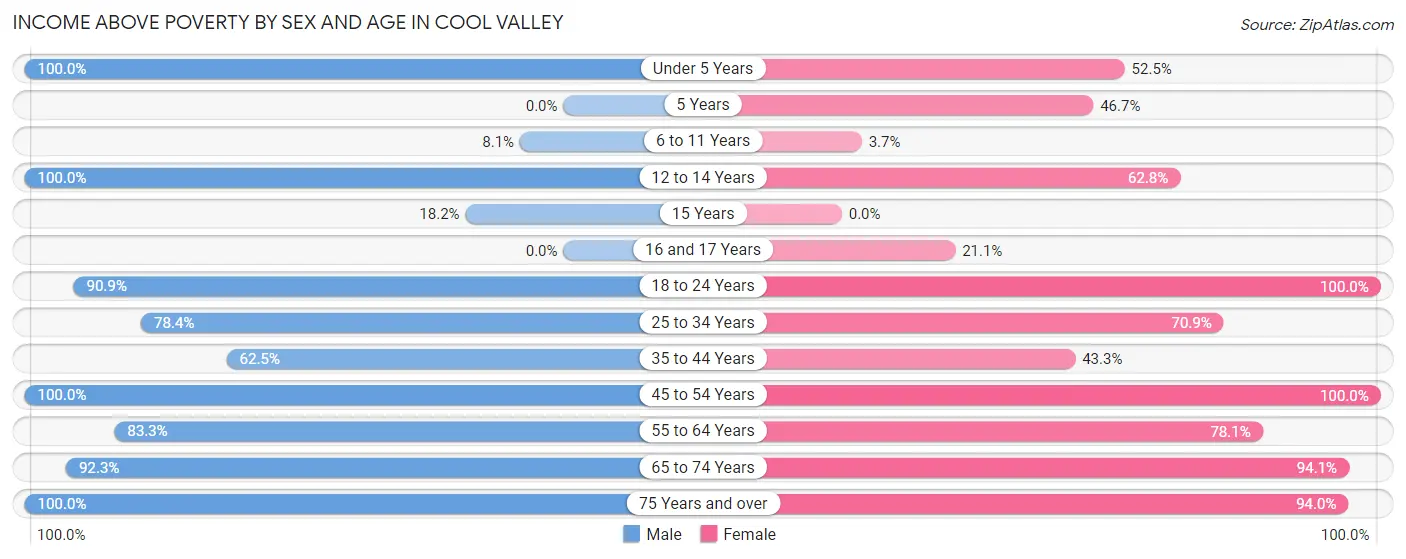
| Age Bracket | Male | Female |
| Under 5 Years | 40 (100.0%) | 21 (52.5%) |
| 5 Years | 0 (0.0%) | 14 (46.7%) |
| 6 to 11 Years | 5 (8.1%) | 4 (3.7%) |
| 12 to 14 Years | 9 (100.0%) | 27 (62.8%) |
| 15 Years | 4 (18.2%) | 0 (0.0%) |
| 16 and 17 Years | 0 (0.0%) | 4 (21.0%) |
| 18 to 24 Years | 50 (90.9%) | 21 (100.0%) |
| 25 to 34 Years | 87 (78.4%) | 73 (70.9%) |
| 35 to 44 Years | 25 (62.5%) | 26 (43.3%) |
| 45 to 54 Years | 32 (100.0%) | 36 (100.0%) |
| 55 to 64 Years | 75 (83.3%) | 57 (78.1%) |
| 65 to 74 Years | 24 (92.3%) | 64 (94.1%) |
| 75 Years and over | 20 (100.0%) | 47 (94.0%) |
| Total | 371 (73.2%) | 394 (59.0%) |
Income Below Poverty Among Married-Couple Families in Cool Valley
The poverty statistics for married-couple families in Cool Valley show that 19.1% or 26 of the total 136 families live below the poverty line. Families with 5 or more children have the highest poverty rate of 100.0%, comprising of 15 families. On the other hand, families with 1 or 2 children have the lowest poverty rate of 0.0%, which includes 0 families.
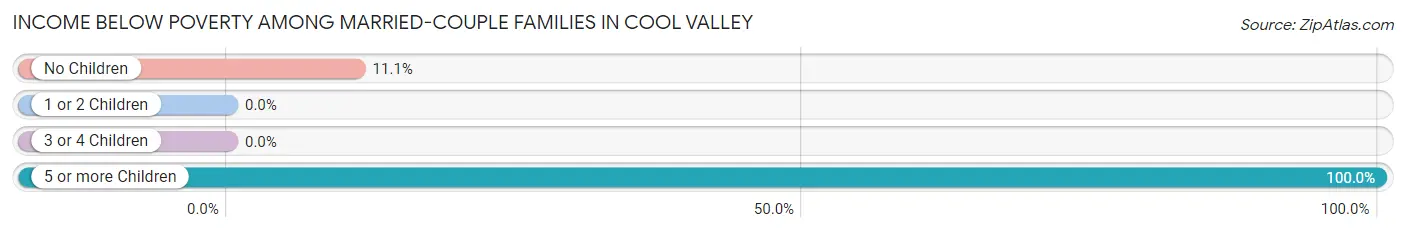
| Children | Above Poverty | Below Poverty |
| No Children | 88 (88.9%) | 11 (11.1%) |
| 1 or 2 Children | 22 (100.0%) | 0 (0.0%) |
| 3 or 4 Children | 0 (0.0%) | 0 (0.0%) |
| 5 or more Children | 0 (0.0%) | 15 (100.0%) |
| Total | 110 (80.9%) | 26 (19.1%) |
Income Below Poverty Among Single-Parent Households in Cool Valley
According to the poverty data in Cool Valley, 75.0% or 24 single-father households and 33.0% or 37 single-mother households are living below the poverty line. Among single-father households, those with 3 or 4 children have the highest poverty rate, with 24 households (100.0%) experiencing poverty. Likewise, among single-mother households, those with 3 or 4 children have the highest poverty rate, with 33 households (89.2%) falling below the poverty line.
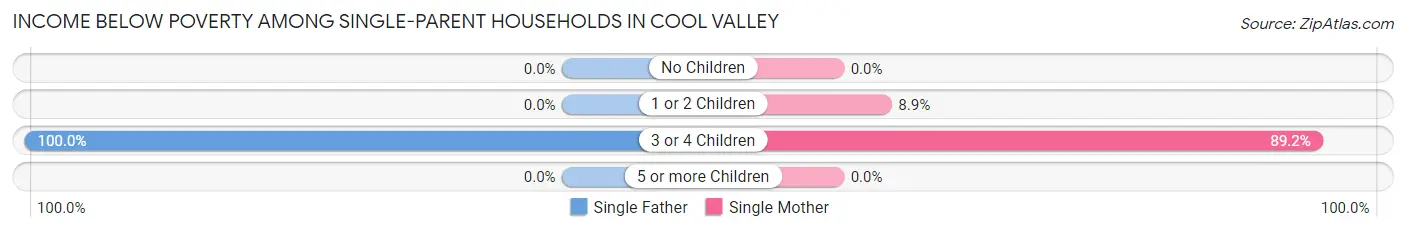
| Children | Single Father | Single Mother |
| No Children | 0 (0.0%) | 0 (0.0%) |
| 1 or 2 Children | 0 (0.0%) | 4 (8.9%) |
| 3 or 4 Children | 24 (100.0%) | 33 (89.2%) |
| 5 or more Children | 0 (0.0%) | 0 (0.0%) |
| Total | 24 (75.0%) | 37 (33.0%) |
Income Below Poverty Among Married-Couple vs Single-Parent Households in Cool Valley
The poverty data for Cool Valley shows that 26 of the married-couple family households (19.1%) and 61 of the single-parent households (42.4%) are living below the poverty level. Within the married-couple family households, those with 5 or more children have the highest poverty rate, with 15 households (100.0%) falling below the poverty line. Among the single-parent households, those with 3 or 4 children have the highest poverty rate, with 57 household (93.4%) living below poverty.
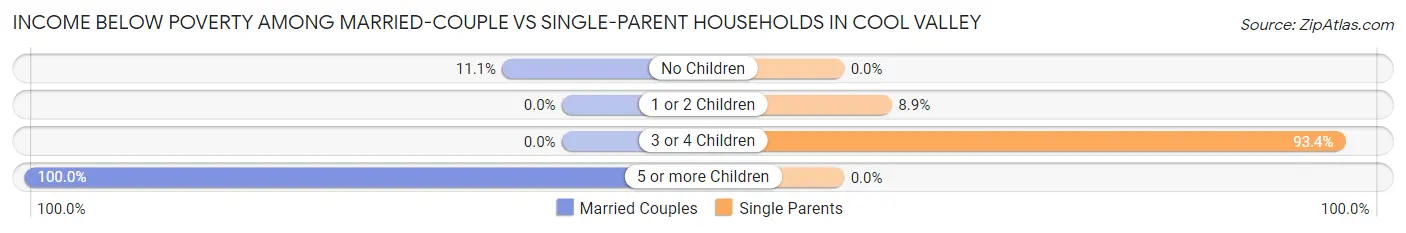
| Children | Married-Couple Families | Single-Parent Households |
| No Children | 11 (11.1%) | 0 (0.0%) |
| 1 or 2 Children | 0 (0.0%) | 4 (8.9%) |
| 3 or 4 Children | 0 (0.0%) | 57 (93.4%) |
| 5 or more Children | 15 (100.0%) | 0 (0.0%) |
| Total | 26 (19.1%) | 61 (42.4%) |
Race in Cool Valley
The most populous races in Cool Valley are Black / African American (1,048 | 89.2%), White / Caucasian (91 | 7.7%), and Asian (25 | 2.1%).
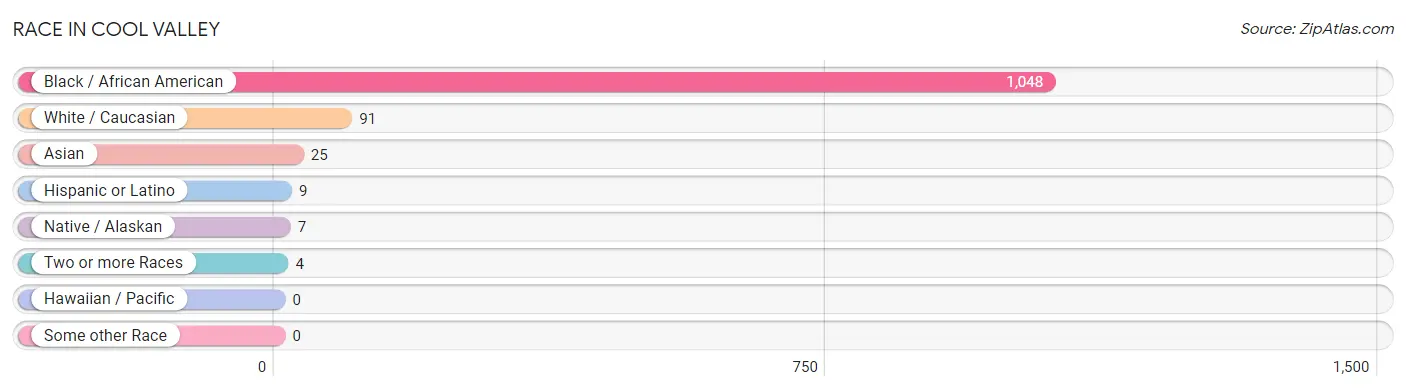
| Race | # Population | % Population |
| Asian | 25 | 2.1% |
| Black / African American | 1,048 | 89.2% |
| Hawaiian / Pacific | 0 | 0.0% |
| Hispanic or Latino | 9 | 0.8% |
| Native / Alaskan | 7 | 0.6% |
| White / Caucasian | 91 | 7.7% |
| Two or more Races | 4 | 0.3% |
| Some other Race | 0 | 0.0% |
| Total | 1,175 | 100.0% |
Ancestry in Cool Valley
The most populous ancestries reported in Cool Valley are American (66 | 5.6%), English (39 | 3.3%), Irish (30 | 2.5%), Malaysian (25 | 2.1%), and African (24 | 2.0%), together accounting for 15.7% of all Cool Valley residents.
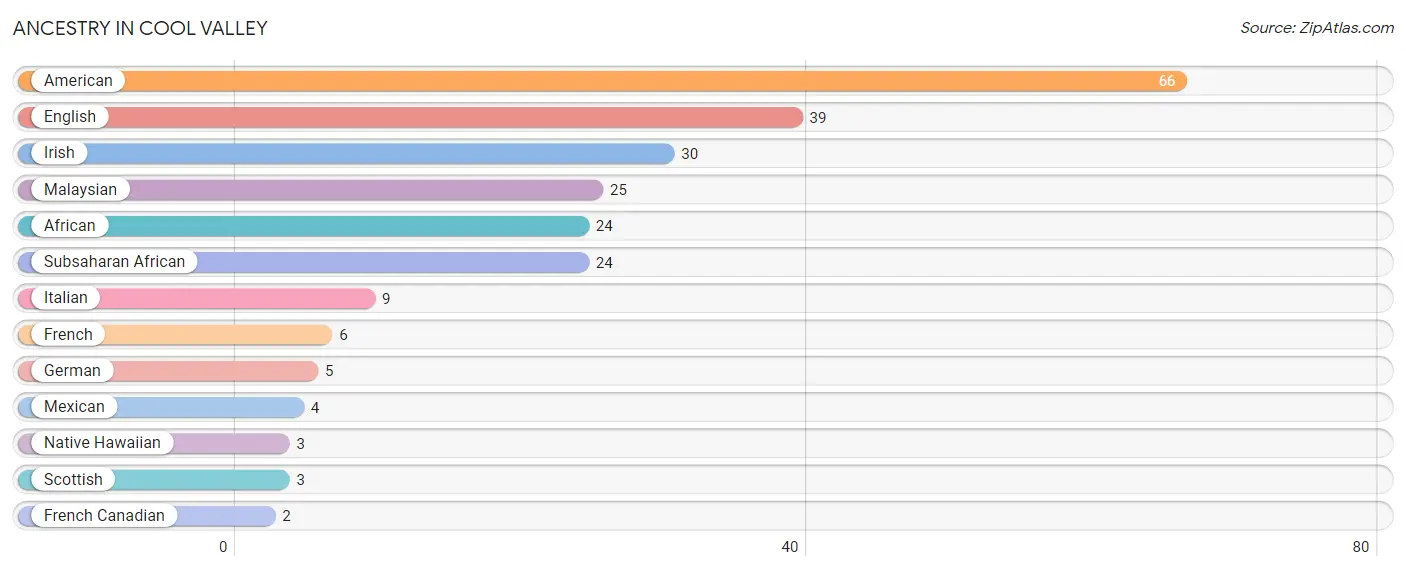
| Ancestry | # Population | % Population |
| African | 24 | 2.0% |
| American | 66 | 5.6% |
| English | 39 | 3.3% |
| French | 6 | 0.5% |
| French Canadian | 2 | 0.2% |
| German | 5 | 0.4% |
| Irish | 30 | 2.5% |
| Italian | 9 | 0.8% |
| Malaysian | 25 | 2.1% |
| Mexican | 4 | 0.3% |
| Native Hawaiian | 3 | 0.3% |
| Scottish | 3 | 0.3% |
| Subsaharan African | 24 | 2.0% | View All 13 Rows |
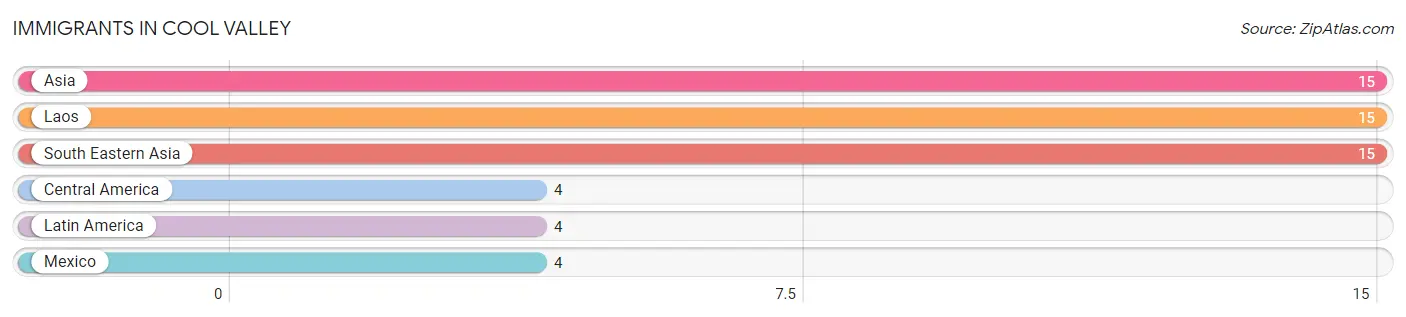
Immigrants in Cool Valley
The most numerous immigrant groups reported in Cool Valley came from Asia (15 | 1.3%), Laos (15 | 1.3%), South Eastern Asia (15 | 1.3%), Central America (4 | 0.3%), and Latin America (4 | 0.3%), together accounting for 4.5% of all Cool Valley residents.
| Immigration Origin | # Population | % Population |
| Asia | 15 | 1.3% |
| Central America | 4 | 0.3% |
| Laos | 15 | 1.3% |
| Latin America | 4 | 0.3% |
| Mexico | 4 | 0.3% |
| South Eastern Asia | 15 | 1.3% | View All 6 Rows |
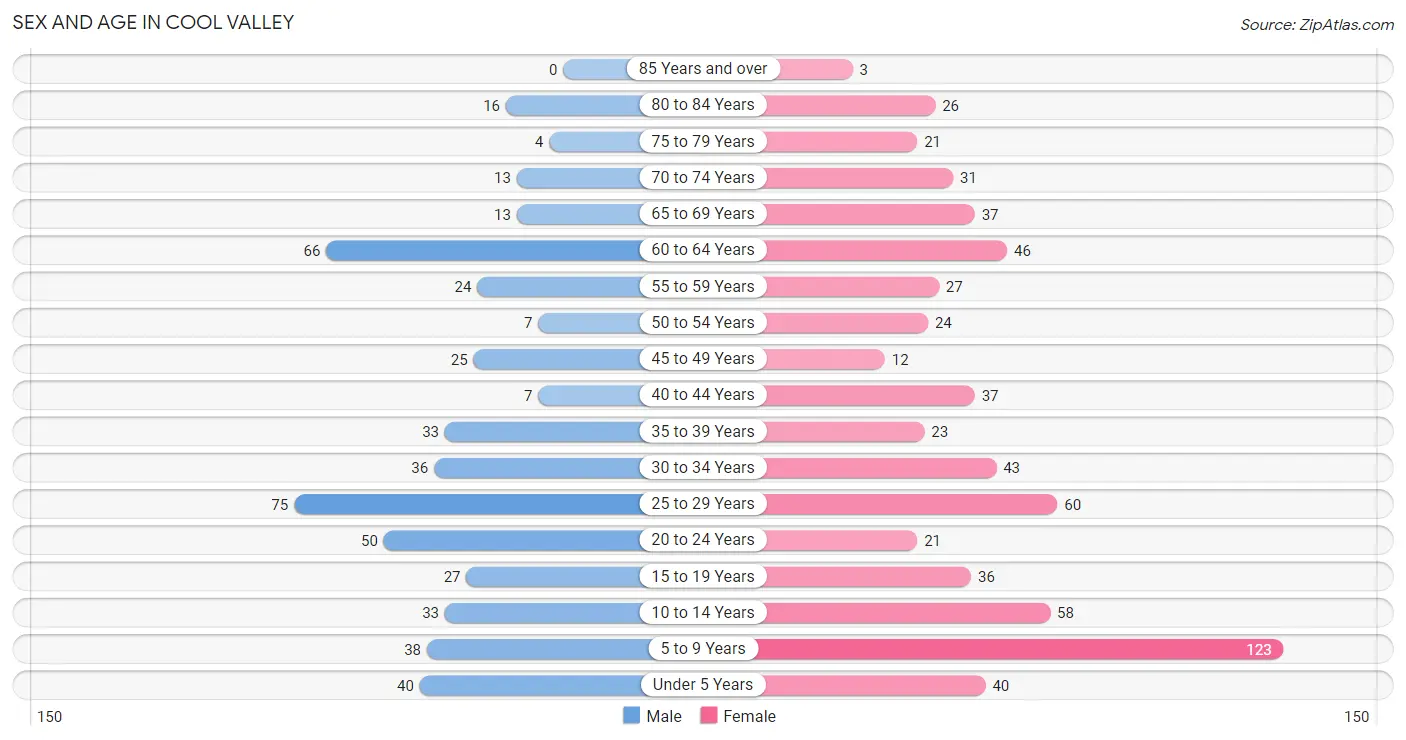
Sex and Age in Cool Valley
Sex and Age in Cool Valley
The most populous age groups in Cool Valley are 25 to 29 Years (75 | 14.8%) for men and 5 to 9 Years (123 | 18.4%) for women.
| Age Bracket | Male | Female |
| Under 5 Years | 40 (7.9%) | 40 (6.0%) |
| 5 to 9 Years | 38 (7.5%) | 123 (18.4%) |
| 10 to 14 Years | 33 (6.5%) | 58 (8.7%) |
| 15 to 19 Years | 27 (5.3%) | 36 (5.4%) |
| 20 to 24 Years | 50 (9.9%) | 21 (3.1%) |
| 25 to 29 Years | 75 (14.8%) | 60 (9.0%) |
| 30 to 34 Years | 36 (7.1%) | 43 (6.4%) |
| 35 to 39 Years | 33 (6.5%) | 23 (3.4%) |
| 40 to 44 Years | 7 (1.4%) | 37 (5.5%) |
| 45 to 49 Years | 25 (4.9%) | 12 (1.8%) |
| 50 to 54 Years | 7 (1.4%) | 24 (3.6%) |
| 55 to 59 Years | 24 (4.7%) | 27 (4.0%) |
| 60 to 64 Years | 66 (13.0%) | 46 (6.9%) |
| 65 to 69 Years | 13 (2.6%) | 37 (5.5%) |
| 70 to 74 Years | 13 (2.6%) | 31 (4.6%) |
| 75 to 79 Years | 4 (0.8%) | 21 (3.1%) |
| 80 to 84 Years | 16 (3.2%) | 26 (3.9%) |
| 85 Years and over | 0 (0.0%) | 3 (0.4%) |
| Total | 507 (100.0%) | 668 (100.0%) |
Families and Households in Cool Valley
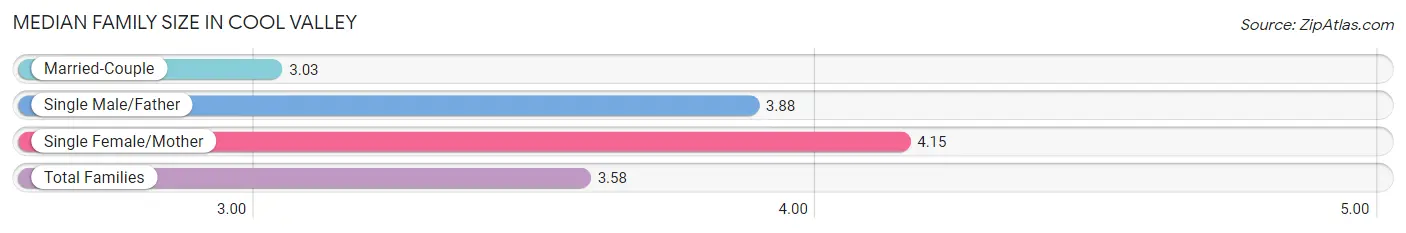
Median Family Size in Cool Valley
The median family size in Cool Valley is 3.58 persons per family, with single female/mother families (112 | 40.0%) accounting for the largest median family size of 4.15 persons per family. On the other hand, married-couple families (136 | 48.6%) represent the smallest median family size with 3.03 persons per family.
| Family Type | # Families | Family Size |
| Married-Couple | 136 (48.6%) | 3.03 |
| Single Male/Father | 32 (11.4%) | 3.88 |
| Single Female/Mother | 112 (40.0%) | 4.15 |
| Total Families | 280 (100.0%) | 3.58 |
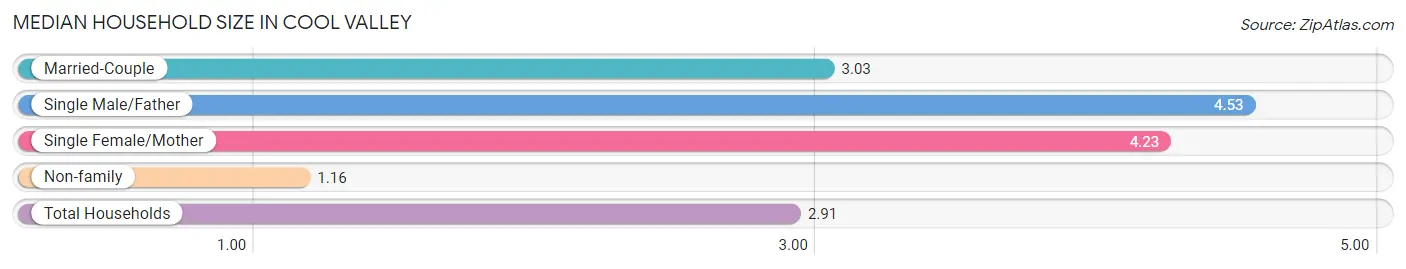
Median Household Size in Cool Valley
The median household size in Cool Valley is 2.91 persons per household, with single male/father households (32 | 7.9%) accounting for the largest median household size of 4.53 persons per household. non-family households (124 | 30.7%) represent the smallest median household size with 1.16 persons per household.
| Household Type | # Households | Household Size |
| Married-Couple | 136 (33.7%) | 3.03 |
| Single Male/Father | 32 (7.9%) | 4.53 |
| Single Female/Mother | 112 (27.7%) | 4.23 |
| Non-family | 124 (30.7%) | 1.16 |
| Total Households | 404 (100.0%) | 2.91 |
Household Size by Marriage Status in Cool Valley
Out of a total of 404 households in Cool Valley, 280 (69.3%) are family households, while 124 (30.7%) are nonfamily households. The most numerous type of family households are 2-person households, comprising 93, and the most common type of nonfamily households are 1-person households, comprising 102.
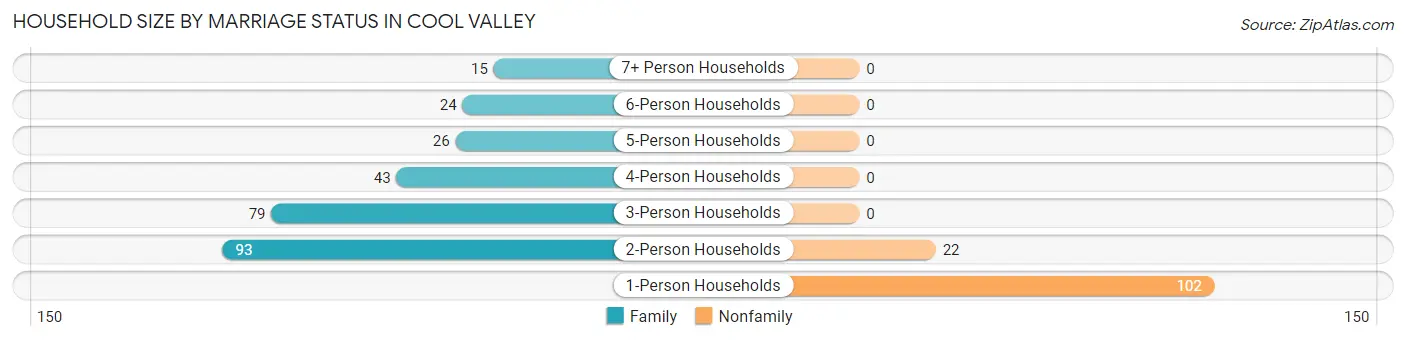
| Household Size | Family Households | Nonfamily Households |
| 1-Person Households | - | 102 (25.3%) |
| 2-Person Households | 93 (23.0%) | 22 (5.4%) |
| 3-Person Households | 79 (19.6%) | 0 (0.0%) |
| 4-Person Households | 43 (10.6%) | 0 (0.0%) |
| 5-Person Households | 26 (6.4%) | 0 (0.0%) |
| 6-Person Households | 24 (5.9%) | 0 (0.0%) |
| 7+ Person Households | 15 (3.7%) | 0 (0.0%) |
| Total | 280 (69.3%) | 124 (30.7%) |
Female Fertility in Cool Valley
Fertility by Age in Cool Valley
Average fertility rate in Cool Valley is 69.0 births per 1,000 women. Women in the age bracket of 20 to 34 years have the highest fertility rate with 129.0 births per 1,000 women. Women in the age bracket of 20 to 34 years acount for 100.0% of all women with births.
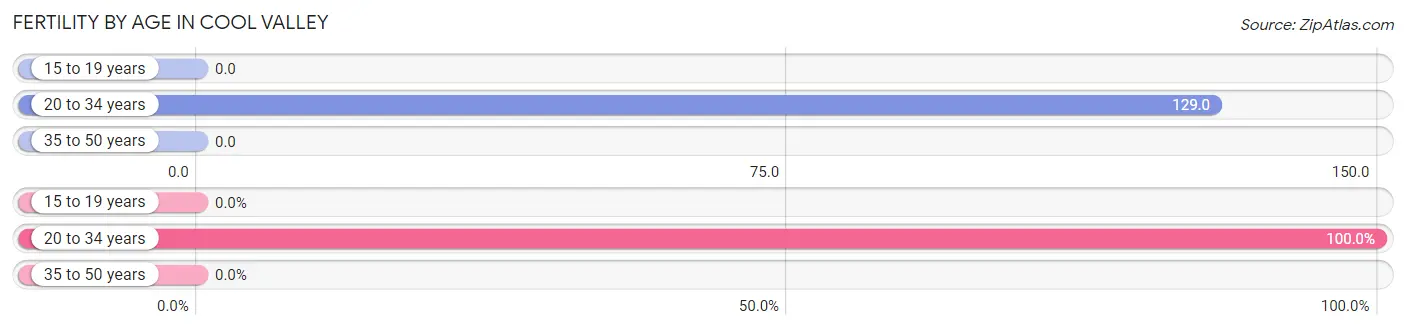
| Age Bracket | Women with Births | Births / 1,000 Women |
| 15 to 19 years | 0 (0.0%) | 0.0 |
| 20 to 34 years | 16 (100.0%) | 129.0 |
| 35 to 50 years | 0 (0.0%) | 0.0 |
| Total | 16 (100.0%) | 69.0 |
Fertility by Age by Marriage Status in Cool Valley
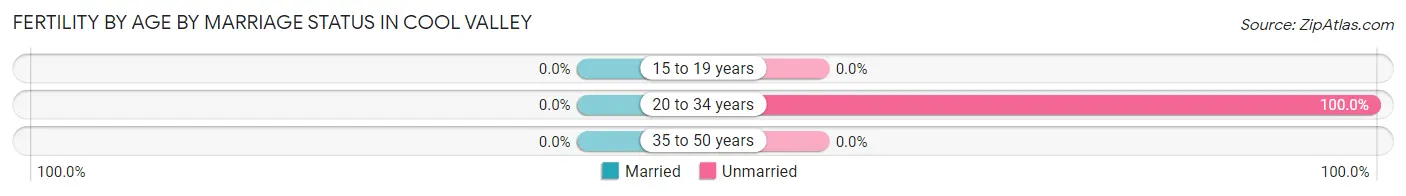
| Age Bracket | Married | Unmarried |
| 15 to 19 years | 0 (0.0%) | 0 (0.0%) |
| 20 to 34 years | 0 (0.0%) | 16 (100.0%) |
| 35 to 50 years | 0 (0.0%) | 0 (0.0%) |
| Total | 0 (0.0%) | 16 (100.0%) |
Fertility by Education in Cool Valley
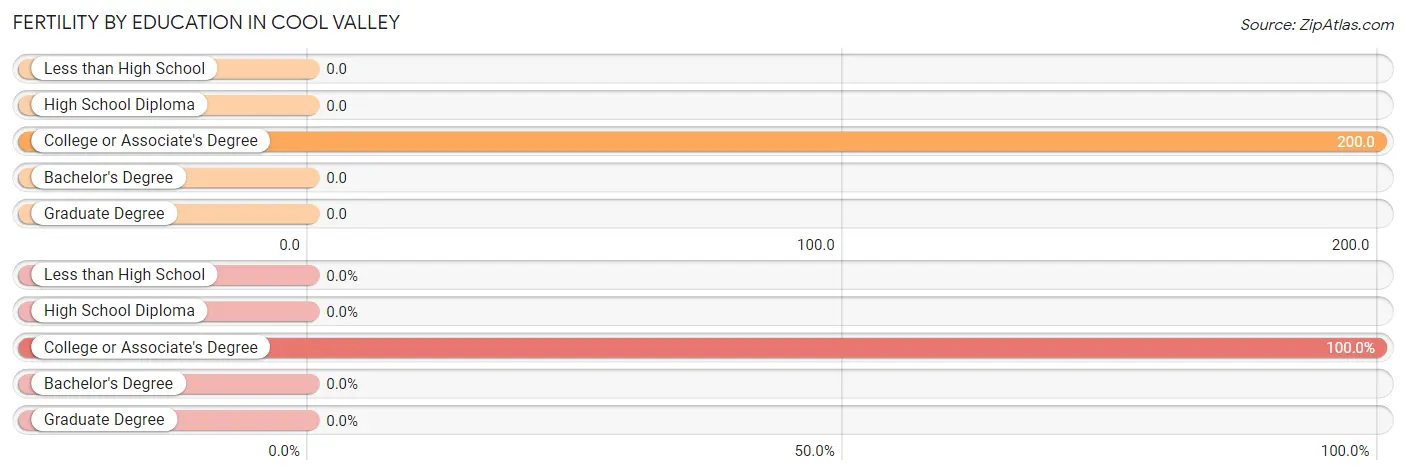
| Educational Attainment | Women with Births | Births / 1,000 Women |
| Less than High School | 0 (0.0%) | 0.0 |
| High School Diploma | 0 (0.0%) | 0.0 |
| College or Associate's Degree | 16 (100.0%) | 200.0 |
| Bachelor's Degree | 0 (0.0%) | 0.0 |
| Graduate Degree | 0 (0.0%) | 0.0 |
| Total | 16 (100.0%) | 69.0 |
Fertility by Education by Marriage Status in Cool Valley
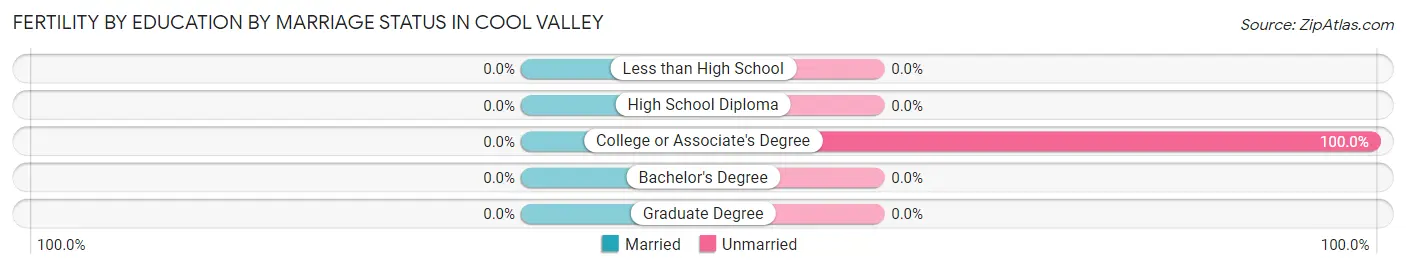
| Educational Attainment | Married | Unmarried |
| Less than High School | 0 (0.0%) | 0 (0.0%) |
| High School Diploma | 0 (0.0%) | 0 (0.0%) |
| College or Associate's Degree | 0 (0.0%) | 16 (100.0%) |
| Bachelor's Degree | 0 (0.0%) | 0 (0.0%) |
| Graduate Degree | 0 (0.0%) | 0 (0.0%) |
| Total | 0 (0.0%) | 16 (100.0%) |
Employment Characteristics in Cool Valley
Employment by Class of Employer in Cool Valley
Among the 458 employed individuals in Cool Valley, private company employees (357 | 77.9%), federal government employees (33 | 7.2%), and not-for-profit organizations (25 | 5.5%) make up the most common classes of employment.
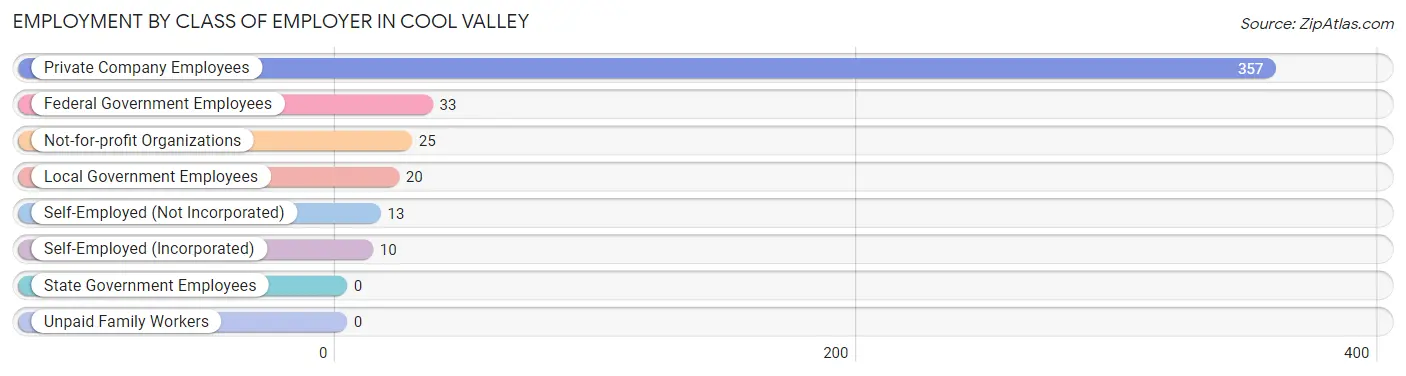
| Employer Class | # Employees | % Employees |
| Private Company Employees | 357 | 77.9% |
| Self-Employed (Incorporated) | 10 | 2.2% |
| Self-Employed (Not Incorporated) | 13 | 2.8% |
| Not-for-profit Organizations | 25 | 5.5% |
| Local Government Employees | 20 | 4.4% |
| State Government Employees | 0 | 0.0% |
| Federal Government Employees | 33 | 7.2% |
| Unpaid Family Workers | 0 | 0.0% |
| Total | 458 | 100.0% |
Employment Status by Age in Cool Valley
According to the labor force statistics for Cool Valley, out of the total population over 16 years of age (804), 59.5% or 478 individuals are in the labor force, with 4.2% or 20 of them unemployed. The age group with the highest labor force participation rate is 20 to 24 years, with 100.0% or 71 individuals in the labor force. Within the labor force, the 45 to 54 years age range has the highest percentage of unemployed individuals, with 15.4% or 10 of them being unemployed.
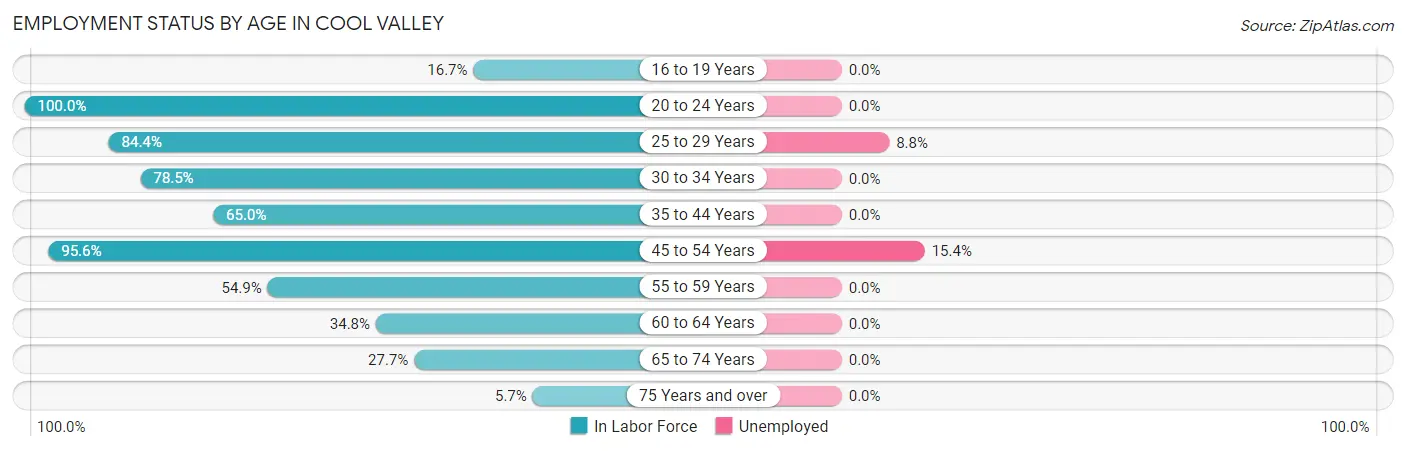
| Age Bracket | In Labor Force | Unemployed |
| 16 to 19 Years | 4 (16.7%) | 0 (0.0%) |
| 20 to 24 Years | 71 (100.0%) | 0 (0.0%) |
| 25 to 29 Years | 114 (84.4%) | 10 (8.8%) |
| 30 to 34 Years | 62 (78.5%) | 0 (0.0%) |
| 35 to 44 Years | 65 (65.0%) | 0 (0.0%) |
| 45 to 54 Years | 65 (95.6%) | 10 (15.4%) |
| 55 to 59 Years | 28 (54.9%) | 0 (0.0%) |
| 60 to 64 Years | 39 (34.8%) | 0 (0.0%) |
| 65 to 74 Years | 26 (27.7%) | 0 (0.0%) |
| 75 Years and over | 4 (5.7%) | 0 (0.0%) |
| Total | 478 (59.5%) | 20 (4.2%) |
Employment Status by Educational Attainment in Cool Valley
According to labor force statistics for Cool Valley, 68.4% of individuals (373) out of the total population between 25 and 64 years of age (545) are in the labor force, with 5.4% or 20 of them being unemployed. The group with the highest labor force participation rate are those with the educational attainment of bachelor's degree or higher, with 80.8% or 59 individuals in the labor force. Within the labor force, individuals with less than high school education have the highest percentage of unemployment, with 23.7% or 9 of them being unemployed.
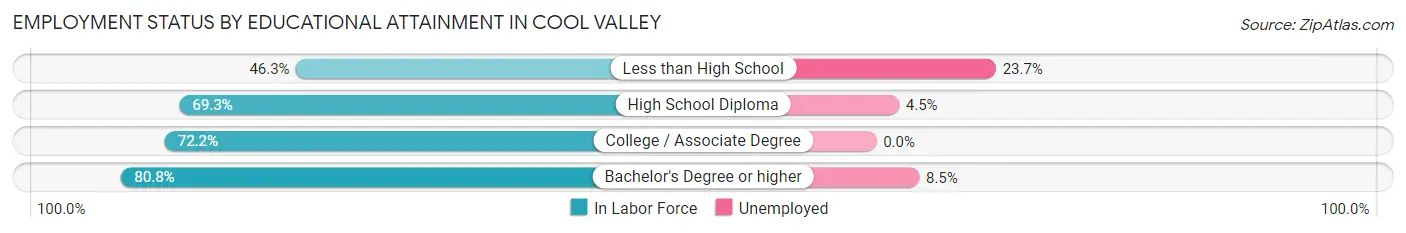
| Educational Attainment | In Labor Force | Unemployed |
| Less than High School | 38 (46.3%) | 19 (23.7%) |
| High School Diploma | 133 (69.3%) | 9 (4.5%) |
| College / Associate Degree | 143 (72.2%) | 0 (0.0%) |
| Bachelor's Degree or higher | 59 (80.8%) | 6 (8.5%) |
| Total | 373 (68.4%) | 29 (5.4%) |
Employment Occupations by Sex in Cool Valley
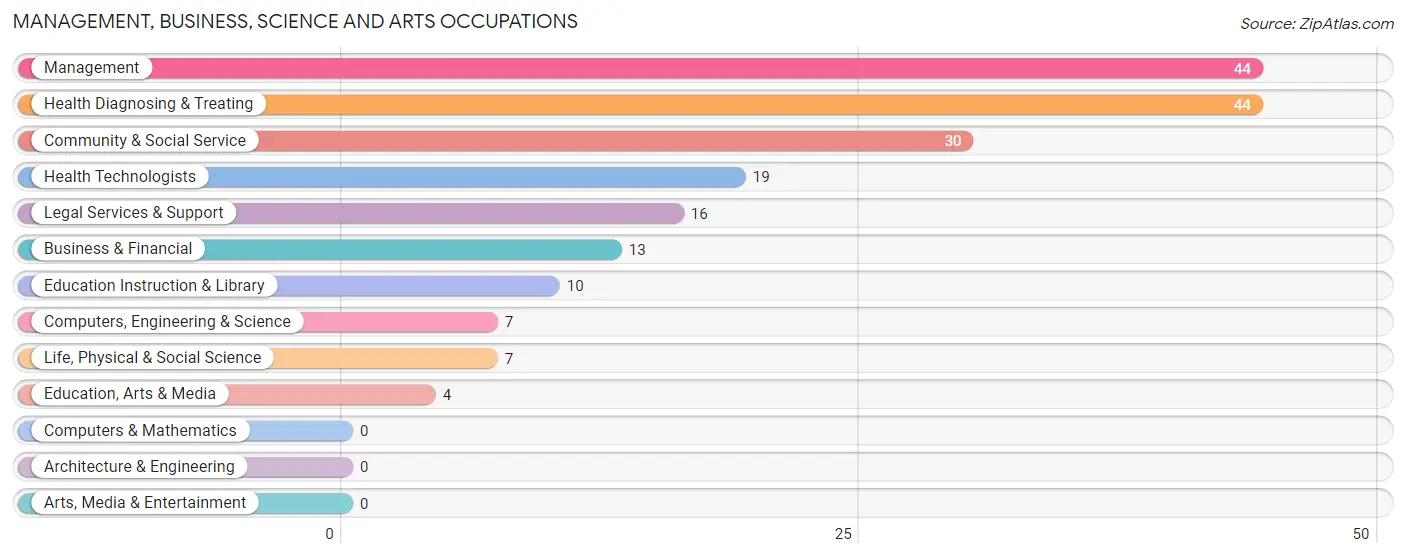
Management, Business, Science and Arts Occupations
The most common Management, Business, Science and Arts occupations in Cool Valley are Management (44 | 9.6%), Health Diagnosing & Treating (44 | 9.6%), Community & Social Service (30 | 6.6%), Health Technologists (19 | 4.2%), and Legal Services & Support (16 | 3.5%).
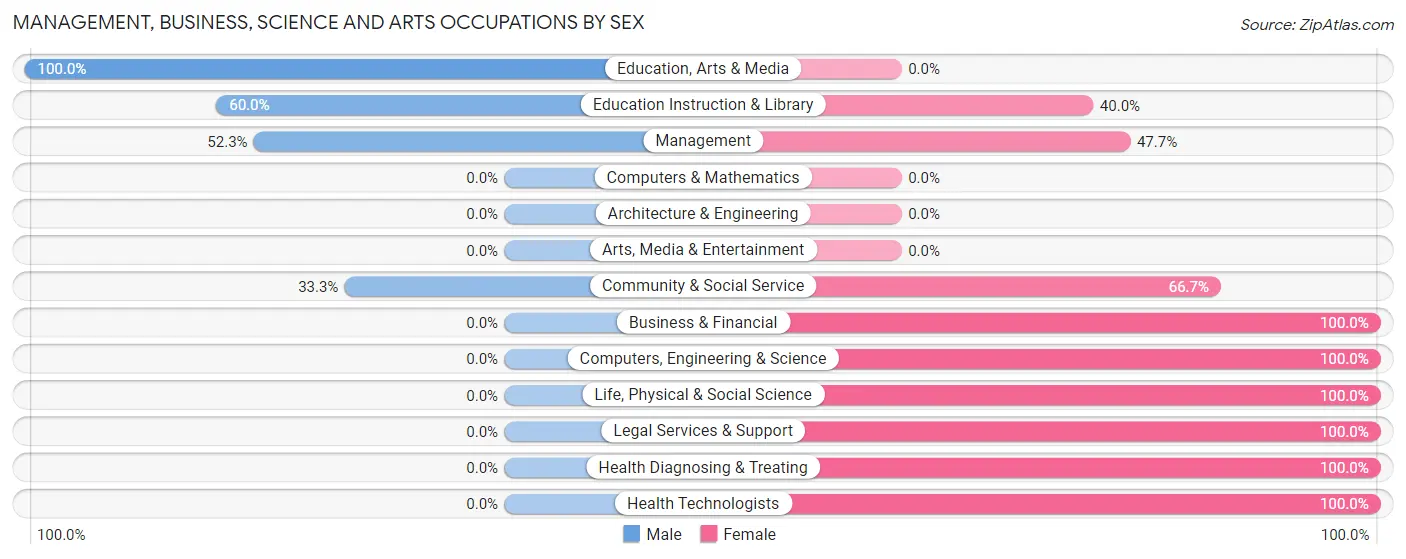
Management, Business, Science and Arts Occupations by Sex
Within the Management, Business, Science and Arts occupations in Cool Valley, the most male-oriented occupations are Education, Arts & Media (100.0%), Education Instruction & Library (60.0%), and Management (52.3%), while the most female-oriented occupations are Business & Financial (100.0%), Computers, Engineering & Science (100.0%), and Life, Physical & Social Science (100.0%).
| Occupation | Male | Female |
| Management | 23 (52.3%) | 21 (47.7%) |
| Business & Financial | 0 (0.0%) | 13 (100.0%) |
| Computers, Engineering & Science | 0 (0.0%) | 7 (100.0%) |
| Computers & Mathematics | 0 (0.0%) | 0 (0.0%) |
| Architecture & Engineering | 0 (0.0%) | 0 (0.0%) |
| Life, Physical & Social Science | 0 (0.0%) | 7 (100.0%) |
| Community & Social Service | 10 (33.3%) | 20 (66.7%) |
| Education, Arts & Media | 4 (100.0%) | 0 (0.0%) |
| Legal Services & Support | 0 (0.0%) | 16 (100.0%) |
| Education Instruction & Library | 6 (60.0%) | 4 (40.0%) |
| Arts, Media & Entertainment | 0 (0.0%) | 0 (0.0%) |
| Health Diagnosing & Treating | 0 (0.0%) | 44 (100.0%) |
| Health Technologists | 0 (0.0%) | 19 (100.0%) |
| Total (Category) | 33 (23.9%) | 105 (76.1%) |
| Total (Overall) | 244 (53.3%) | 214 (46.7%) |
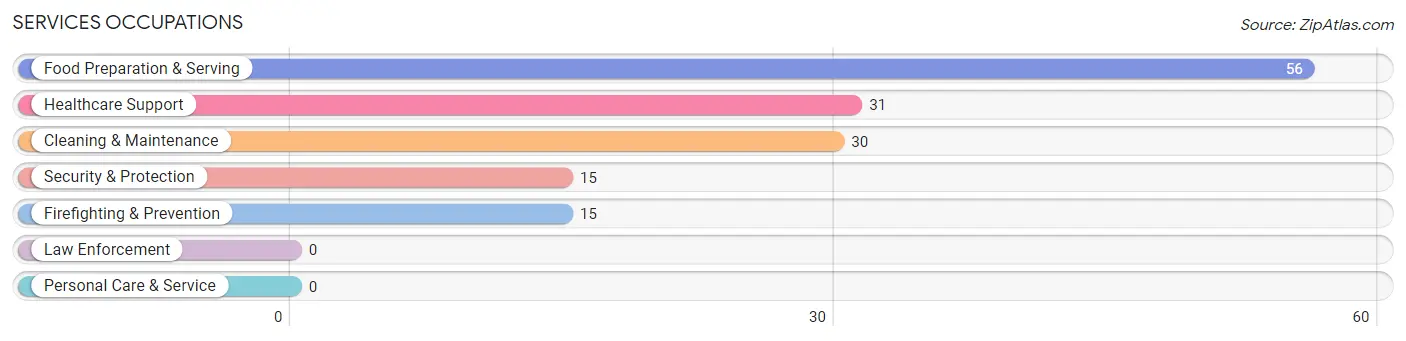
Services Occupations
The most common Services occupations in Cool Valley are Food Preparation & Serving (56 | 12.2%), Healthcare Support (31 | 6.8%), Cleaning & Maintenance (30 | 6.6%), Security & Protection (15 | 3.3%), and Firefighting & Prevention (15 | 3.3%).
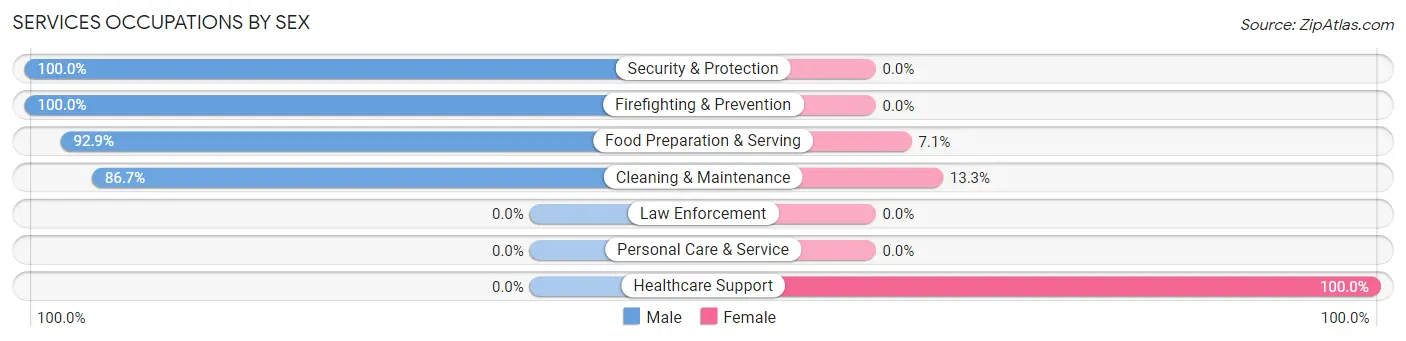
Services Occupations by Sex
Within the Services occupations in Cool Valley, the most male-oriented occupations are Security & Protection (100.0%), Firefighting & Prevention (100.0%), and Food Preparation & Serving (92.9%), while the most female-oriented occupations are Healthcare Support (100.0%), Cleaning & Maintenance (13.3%), and Food Preparation & Serving (7.1%).
| Occupation | Male | Female |
| Healthcare Support | 0 (0.0%) | 31 (100.0%) |
| Security & Protection | 15 (100.0%) | 0 (0.0%) |
| Firefighting & Prevention | 15 (100.0%) | 0 (0.0%) |
| Law Enforcement | 0 (0.0%) | 0 (0.0%) |
| Food Preparation & Serving | 52 (92.9%) | 4 (7.1%) |
| Cleaning & Maintenance | 26 (86.7%) | 4 (13.3%) |
| Personal Care & Service | 0 (0.0%) | 0 (0.0%) |
| Total (Category) | 93 (70.5%) | 39 (29.5%) |
| Total (Overall) | 244 (53.3%) | 214 (46.7%) |
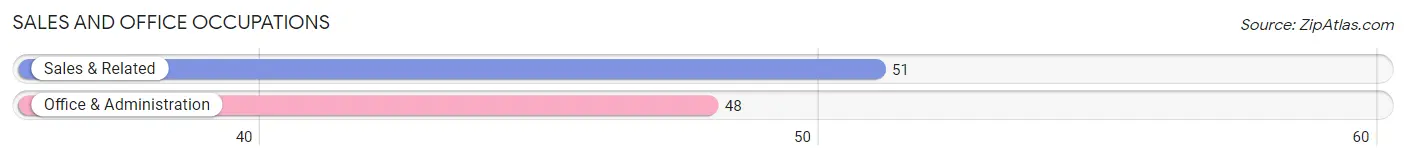
Sales and Office Occupations
The most common Sales and Office occupations in Cool Valley are Sales & Related (51 | 11.1%), and Office & Administration (48 | 10.5%).
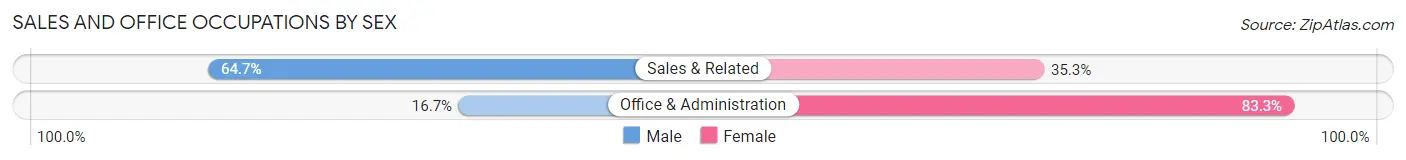
Sales and Office Occupations by Sex
| Occupation | Male | Female |
| Sales & Related | 33 (64.7%) | 18 (35.3%) |
| Office & Administration | 8 (16.7%) | 40 (83.3%) |
| Total (Category) | 41 (41.4%) | 58 (58.6%) |
| Total (Overall) | 244 (53.3%) | 214 (46.7%) |
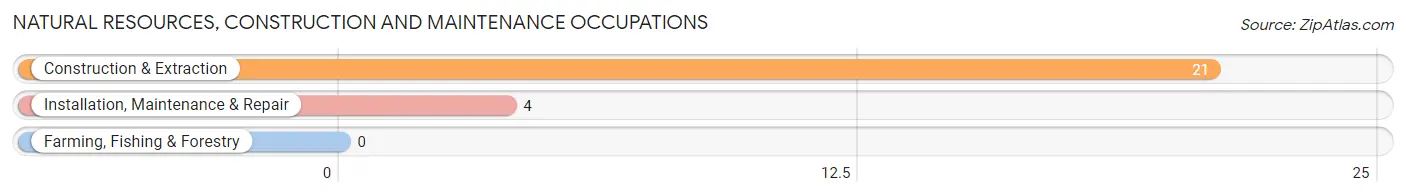
Natural Resources, Construction and Maintenance Occupations
The most common Natural Resources, Construction and Maintenance occupations in Cool Valley are Construction & Extraction (21 | 4.6%), and Installation, Maintenance & Repair (4 | 0.9%).
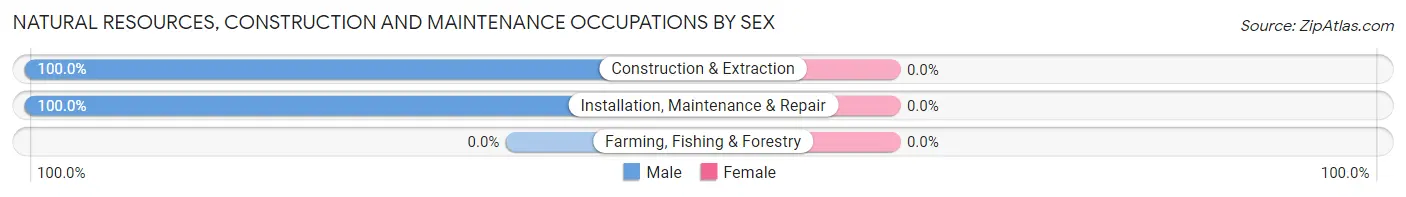
Natural Resources, Construction and Maintenance Occupations by Sex
| Occupation | Male | Female |
| Farming, Fishing & Forestry | 0 (0.0%) | 0 (0.0%) |
| Construction & Extraction | 21 (100.0%) | 0 (0.0%) |
| Installation, Maintenance & Repair | 4 (100.0%) | 0 (0.0%) |
| Total (Category) | 25 (100.0%) | 0 (0.0%) |
| Total (Overall) | 244 (53.3%) | 214 (46.7%) |
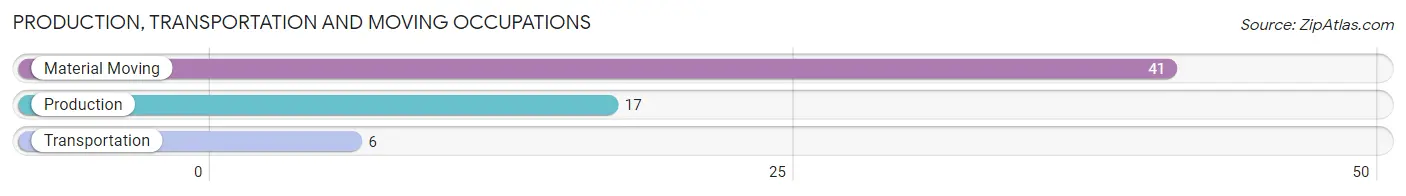
Production, Transportation and Moving Occupations
The most common Production, Transportation and Moving occupations in Cool Valley are Material Moving (41 | 8.9%), Production (17 | 3.7%), and Transportation (6 | 1.3%).
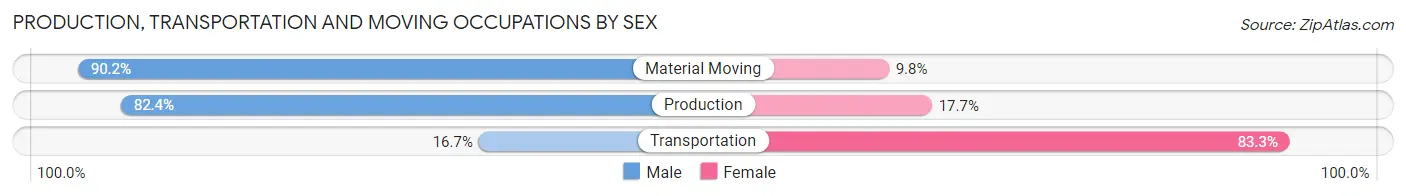
Production, Transportation and Moving Occupations by Sex
| Occupation | Male | Female |
| Production | 14 (82.4%) | 3 (17.6%) |
| Transportation | 1 (16.7%) | 5 (83.3%) |
| Material Moving | 37 (90.2%) | 4 (9.8%) |
| Total (Category) | 52 (81.2%) | 12 (18.8%) |
| Total (Overall) | 244 (53.3%) | 214 (46.7%) |
Employment Industries by Sex in Cool Valley
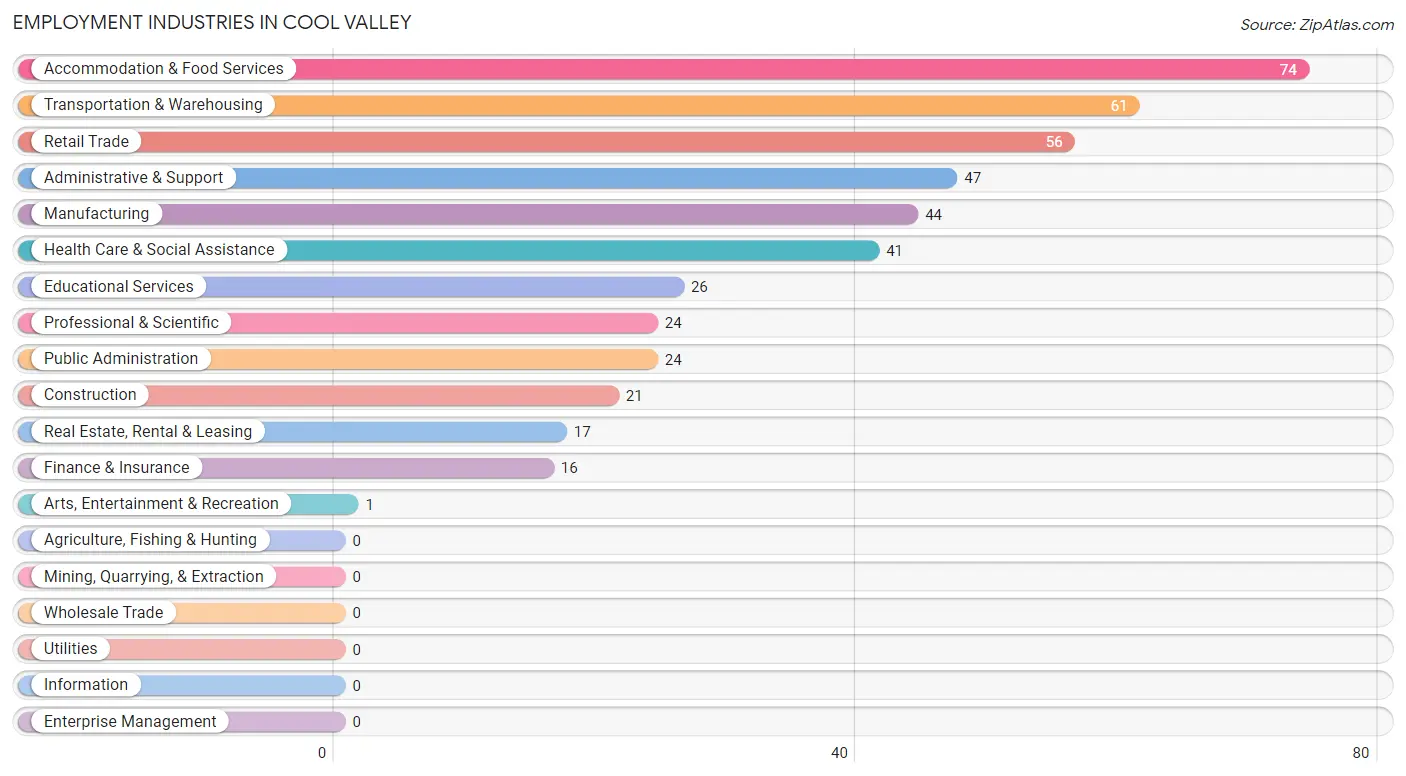
Employment Industries in Cool Valley
The major employment industries in Cool Valley include Accommodation & Food Services (74 | 16.2%), Transportation & Warehousing (61 | 13.3%), Retail Trade (56 | 12.2%), Administrative & Support (47 | 10.3%), and Manufacturing (44 | 9.6%).
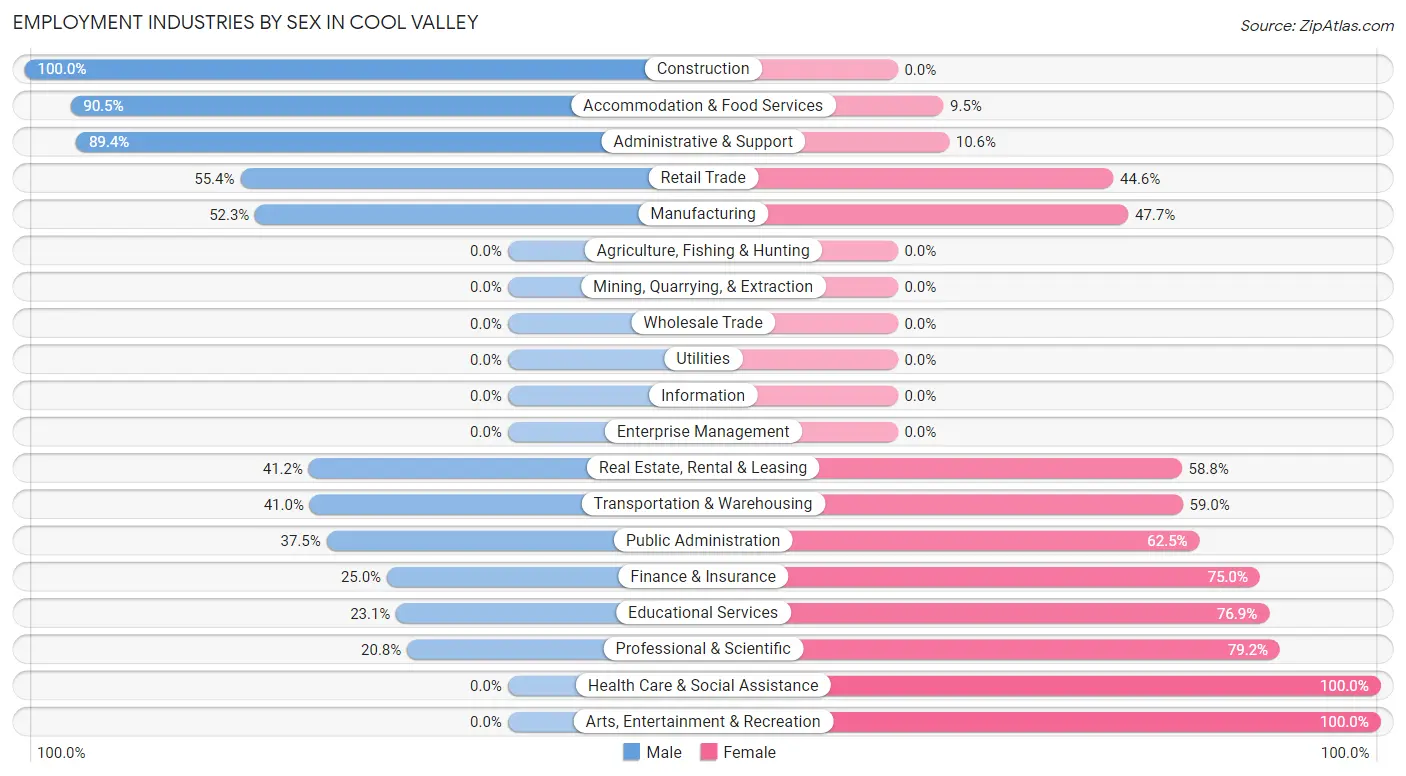
Employment Industries by Sex in Cool Valley
The Cool Valley industries that see more men than women are Construction (100.0%), Accommodation & Food Services (90.5%), and Administrative & Support (89.4%), whereas the industries that tend to have a higher number of women are Health Care & Social Assistance (100.0%), Arts, Entertainment & Recreation (100.0%), and Professional & Scientific (79.2%).
| Industry | Male | Female |
| Agriculture, Fishing & Hunting | 0 (0.0%) | 0 (0.0%) |
| Mining, Quarrying, & Extraction | 0 (0.0%) | 0 (0.0%) |
| Construction | 21 (100.0%) | 0 (0.0%) |
| Manufacturing | 23 (52.3%) | 21 (47.7%) |
| Wholesale Trade | 0 (0.0%) | 0 (0.0%) |
| Retail Trade | 31 (55.4%) | 25 (44.6%) |
| Transportation & Warehousing | 25 (41.0%) | 36 (59.0%) |
| Utilities | 0 (0.0%) | 0 (0.0%) |
| Information | 0 (0.0%) | 0 (0.0%) |
| Finance & Insurance | 4 (25.0%) | 12 (75.0%) |
| Real Estate, Rental & Leasing | 7 (41.2%) | 10 (58.8%) |
| Professional & Scientific | 5 (20.8%) | 19 (79.2%) |
| Enterprise Management | 0 (0.0%) | 0 (0.0%) |
| Administrative & Support | 42 (89.4%) | 5 (10.6%) |
| Educational Services | 6 (23.1%) | 20 (76.9%) |
| Health Care & Social Assistance | 0 (0.0%) | 41 (100.0%) |
| Arts, Entertainment & Recreation | 0 (0.0%) | 1 (100.0%) |
| Accommodation & Food Services | 67 (90.5%) | 7 (9.5%) |
| Public Administration | 9 (37.5%) | 15 (62.5%) |
| Total | 244 (53.3%) | 214 (46.7%) |
Education in Cool Valley
School Enrollment in Cool Valley
The most common levels of schooling among the 355 students in Cool Valley are elementary school (124 | 34.9%), middle school (87 | 24.5%), and high school (80 | 22.5%).
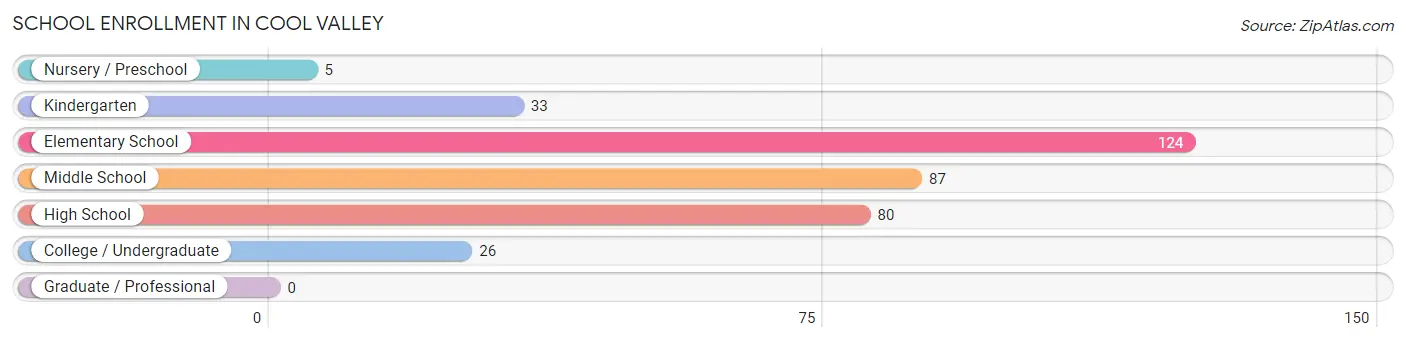
| School Level | # Students | % Students |
| Nursery / Preschool | 5 | 1.4% |
| Kindergarten | 33 | 9.3% |
| Elementary School | 124 | 34.9% |
| Middle School | 87 | 24.5% |
| High School | 80 | 22.5% |
| College / Undergraduate | 26 | 7.3% |
| Graduate / Professional | 0 | 0.0% |
| Total | 355 | 100.0% |
School Enrollment by Age by Funding Source in Cool Valley
Out of a total of 355 students who are enrolled in schools in Cool Valley, 37 (10.4%) attend a private institution, while the remaining 318 (89.6%) are enrolled in public schools. The age group of 18 to 19 year olds has the highest likelihood of being enrolled in private schools, with 5 (100.0% in the age bracket) enrolled. Conversely, the age group of 3 to 4 year olds has the lowest likelihood of being enrolled in a private school, with 5 (100.0% in the age bracket) attending a public institution.
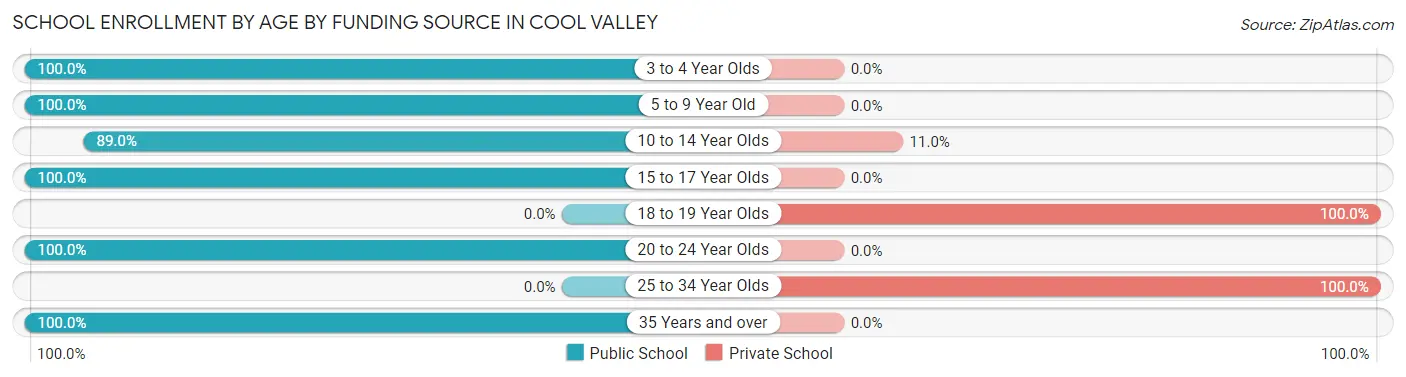
| Age Bracket | Public School | Private School |
| 3 to 4 Year Olds | 5 (100.0%) | 0 (0.0%) |
| 5 to 9 Year Old | 157 (100.0%) | 0 (0.0%) |
| 10 to 14 Year Olds | 81 (89.0%) | 10 (11.0%) |
| 15 to 17 Year Olds | 58 (100.0%) | 0 (0.0%) |
| 18 to 19 Year Olds | 0 (0.0%) | 5 (100.0%) |
| 20 to 24 Year Olds | 5 (100.0%) | 0 (0.0%) |
| 25 to 34 Year Olds | 0 (0.0%) | 22 (100.0%) |
| 35 Years and over | 12 (100.0%) | 0 (0.0%) |
| Total | 318 (89.6%) | 37 (10.4%) |
Educational Attainment by Field of Study in Cool Valley
Business (39 | 33.6%), science & technology (21 | 18.1%), education (21 | 18.1%), liberal arts & history (13 | 11.2%), and arts & humanities (8 | 6.9%) are the most common fields of study among 116 individuals in Cool Valley who have obtained a bachelor's degree or higher.
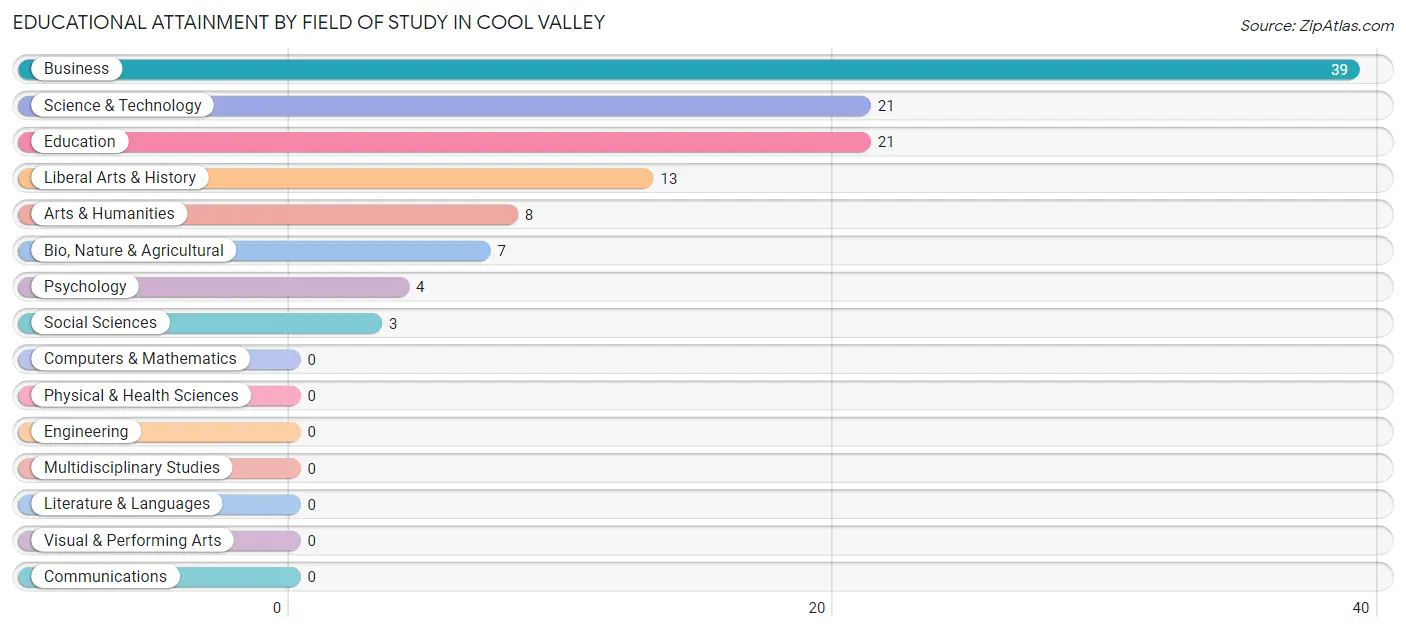
| Field of Study | # Graduates | % Graduates |
| Computers & Mathematics | 0 | 0.0% |
| Bio, Nature & Agricultural | 7 | 6.0% |
| Physical & Health Sciences | 0 | 0.0% |
| Psychology | 4 | 3.5% |
| Social Sciences | 3 | 2.6% |
| Engineering | 0 | 0.0% |
| Multidisciplinary Studies | 0 | 0.0% |
| Science & Technology | 21 | 18.1% |
| Business | 39 | 33.6% |
| Education | 21 | 18.1% |
| Literature & Languages | 0 | 0.0% |
| Liberal Arts & History | 13 | 11.2% |
| Visual & Performing Arts | 0 | 0.0% |
| Communications | 0 | 0.0% |
| Arts & Humanities | 8 | 6.9% |
| Total | 116 | 100.0% |
Transportation & Commute in Cool Valley
Vehicle Availability by Sex in Cool Valley
The most prevalent vehicle ownership categories in Cool Valley are males with 2 vehicles (140, accounting for 57.4%) and females with 2 vehicles (132, making up 65.4%).
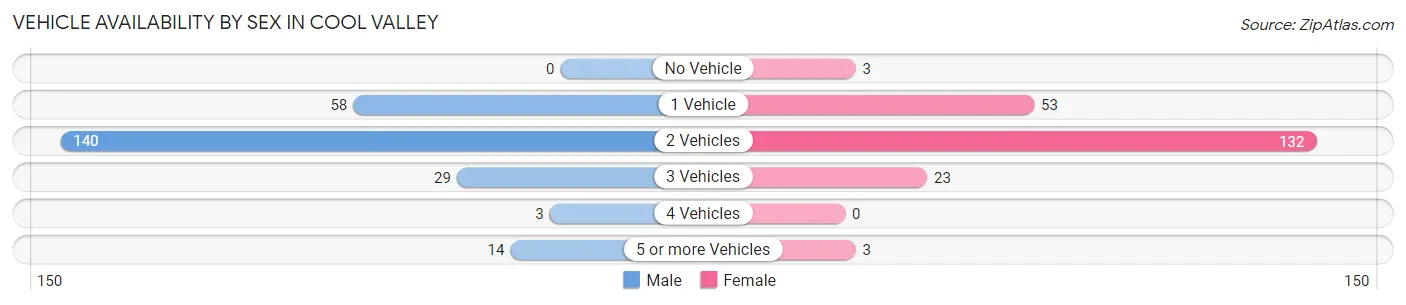
| Vehicles Available | Male | Female |
| No Vehicle | 0 (0.0%) | 3 (1.4%) |
| 1 Vehicle | 58 (23.8%) | 53 (24.8%) |
| 2 Vehicles | 140 (57.4%) | 132 (61.7%) |
| 3 Vehicles | 29 (11.9%) | 23 (10.7%) |
| 4 Vehicles | 3 (1.2%) | 0 (0.0%) |
| 5 or more Vehicles | 14 (5.7%) | 3 (1.4%) |
| Total | 244 (100.0%) | 214 (100.0%) |
Commute Time in Cool Valley
The most frequently occuring commute durations in Cool Valley are 15 to 19 minutes (163 commuters, 37.9%), 20 to 24 minutes (91 commuters, 21.2%), and 30 to 34 minutes (53 commuters, 12.3%).
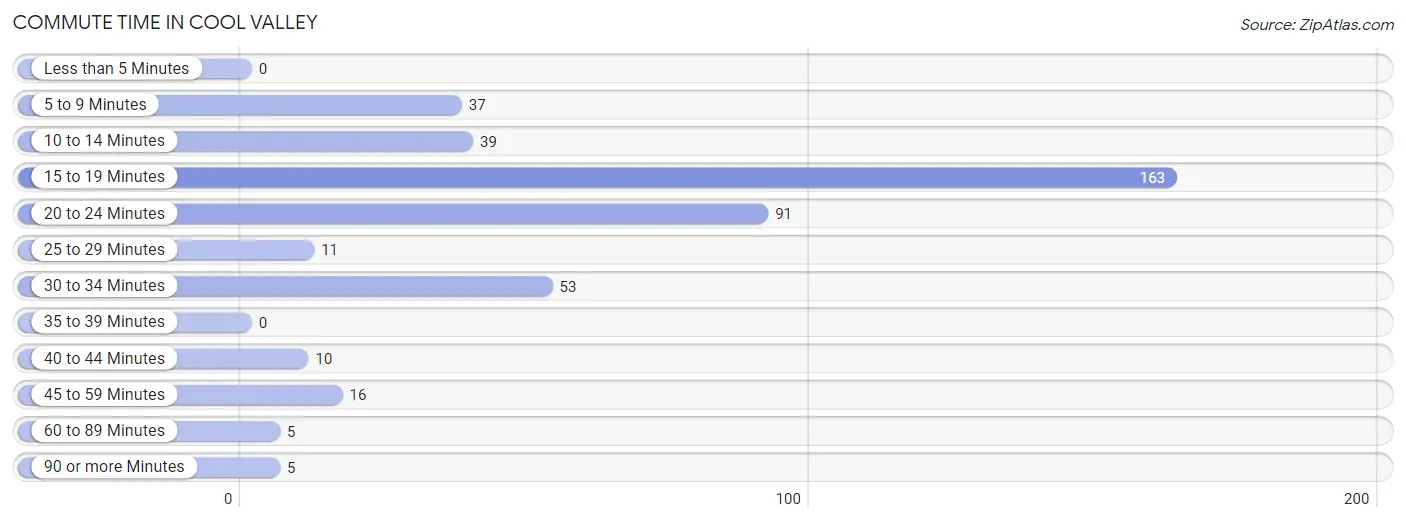
| Commute Time | # Commuters | % Commuters |
| Less than 5 Minutes | 0 | 0.0% |
| 5 to 9 Minutes | 37 | 8.6% |
| 10 to 14 Minutes | 39 | 9.1% |
| 15 to 19 Minutes | 163 | 37.9% |
| 20 to 24 Minutes | 91 | 21.2% |
| 25 to 29 Minutes | 11 | 2.6% |
| 30 to 34 Minutes | 53 | 12.3% |
| 35 to 39 Minutes | 0 | 0.0% |
| 40 to 44 Minutes | 10 | 2.3% |
| 45 to 59 Minutes | 16 | 3.7% |
| 60 to 89 Minutes | 5 | 1.2% |
| 90 or more Minutes | 5 | 1.2% |
Commute Time by Sex in Cool Valley
The most common commute times in Cool Valley are 15 to 19 minutes (111 commuters, 46.1%) for males and 20 to 24 minutes (61 commuters, 32.3%) for females.
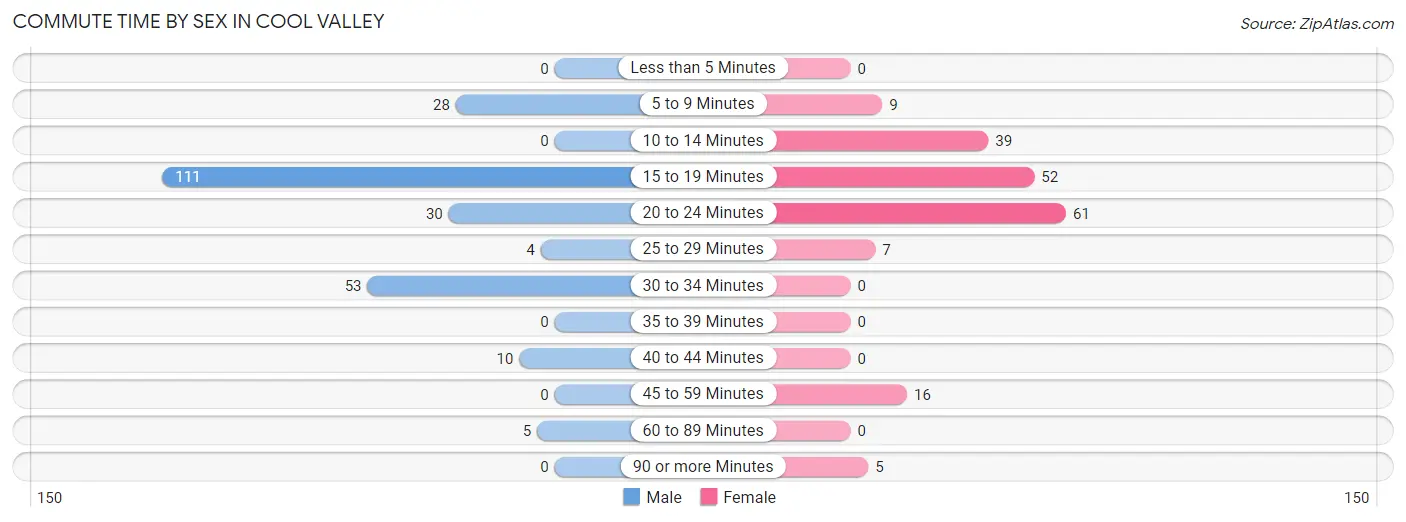
| Commute Time | Male | Female |
| Less than 5 Minutes | 0 (0.0%) | 0 (0.0%) |
| 5 to 9 Minutes | 28 (11.6%) | 9 (4.8%) |
| 10 to 14 Minutes | 0 (0.0%) | 39 (20.6%) |
| 15 to 19 Minutes | 111 (46.1%) | 52 (27.5%) |
| 20 to 24 Minutes | 30 (12.4%) | 61 (32.3%) |
| 25 to 29 Minutes | 4 (1.7%) | 7 (3.7%) |
| 30 to 34 Minutes | 53 (22.0%) | 0 (0.0%) |
| 35 to 39 Minutes | 0 (0.0%) | 0 (0.0%) |
| 40 to 44 Minutes | 10 (4.2%) | 0 (0.0%) |
| 45 to 59 Minutes | 0 (0.0%) | 16 (8.5%) |
| 60 to 89 Minutes | 5 (2.1%) | 0 (0.0%) |
| 90 or more Minutes | 0 (0.0%) | 5 (2.6%) |
Time of Departure to Work by Sex in Cool Valley
The most frequent times of departure to work in Cool Valley are 12:00 PM to 3:59 PM (82, 34.0%) for males and 7:30 AM to 7:59 AM (37, 19.6%) for females.
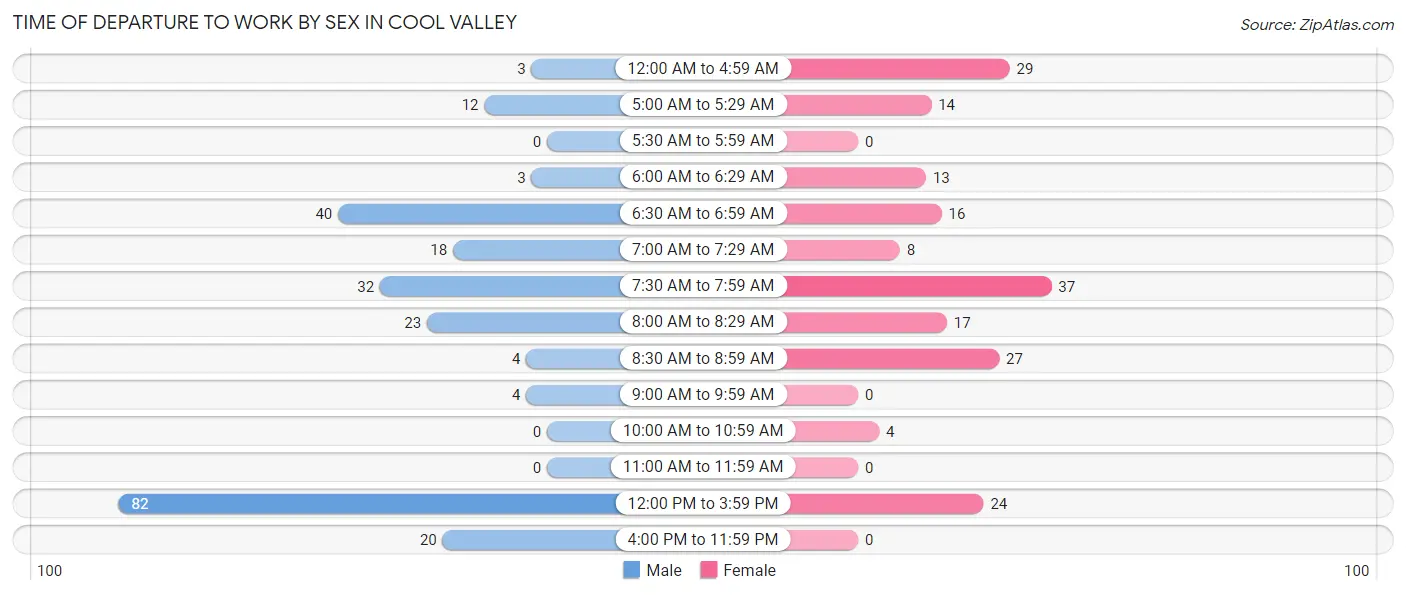
| Time of Departure | Male | Female |
| 12:00 AM to 4:59 AM | 3 (1.2%) | 29 (15.3%) |
| 5:00 AM to 5:29 AM | 12 (5.0%) | 14 (7.4%) |
| 5:30 AM to 5:59 AM | 0 (0.0%) | 0 (0.0%) |
| 6:00 AM to 6:29 AM | 3 (1.2%) | 13 (6.9%) |
| 6:30 AM to 6:59 AM | 40 (16.6%) | 16 (8.5%) |
| 7:00 AM to 7:29 AM | 18 (7.5%) | 8 (4.2%) |
| 7:30 AM to 7:59 AM | 32 (13.3%) | 37 (19.6%) |
| 8:00 AM to 8:29 AM | 23 (9.5%) | 17 (9.0%) |
| 8:30 AM to 8:59 AM | 4 (1.7%) | 27 (14.3%) |
| 9:00 AM to 9:59 AM | 4 (1.7%) | 0 (0.0%) |
| 10:00 AM to 10:59 AM | 0 (0.0%) | 4 (2.1%) |
| 11:00 AM to 11:59 AM | 0 (0.0%) | 0 (0.0%) |
| 12:00 PM to 3:59 PM | 82 (34.0%) | 24 (12.7%) |
| 4:00 PM to 11:59 PM | 20 (8.3%) | 0 (0.0%) |
| Total | 241 (100.0%) | 189 (100.0%) |
Housing Occupancy in Cool Valley
Occupancy by Ownership in Cool Valley
Of the total 404 dwellings in Cool Valley, owner-occupied units account for 274 (67.8%), while renter-occupied units make up 130 (32.2%).
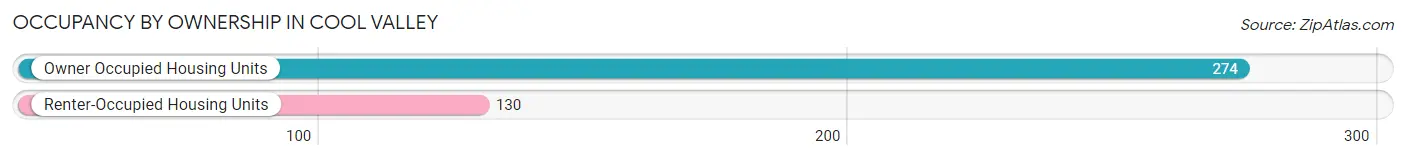
| Occupancy | # Housing Units | % Housing Units |
| Owner Occupied Housing Units | 274 | 67.8% |
| Renter-Occupied Housing Units | 130 | 32.2% |
| Total Occupied Housing Units | 404 | 100.0% |
Occupancy by Household Size in Cool Valley
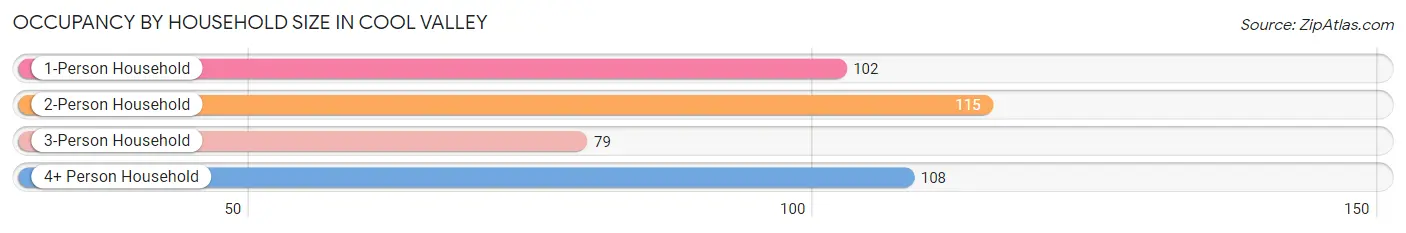
| Household Size | # Housing Units | % Housing Units |
| 1-Person Household | 102 | 25.3% |
| 2-Person Household | 115 | 28.5% |
| 3-Person Household | 79 | 19.6% |
| 4+ Person Household | 108 | 26.7% |
| Total Housing Units | 404 | 100.0% |
Occupancy by Ownership by Household Size in Cool Valley
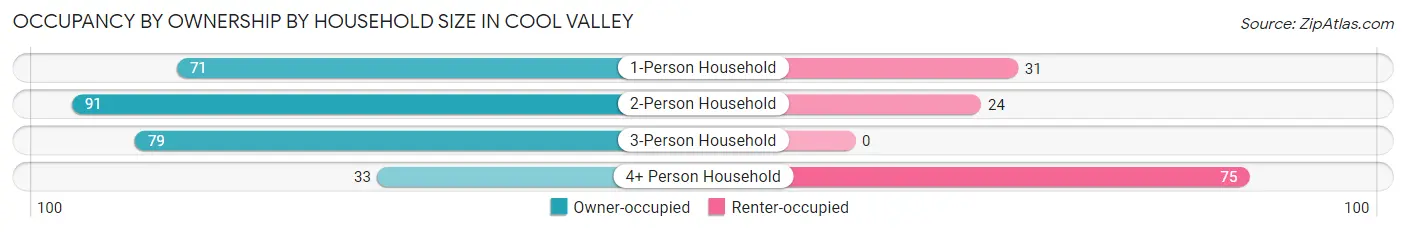
| Household Size | Owner-occupied | Renter-occupied |
| 1-Person Household | 71 (69.6%) | 31 (30.4%) |
| 2-Person Household | 91 (79.1%) | 24 (20.9%) |
| 3-Person Household | 79 (100.0%) | 0 (0.0%) |
| 4+ Person Household | 33 (30.6%) | 75 (69.4%) |
| Total Housing Units | 274 (67.8%) | 130 (32.2%) |
Occupancy by Educational Attainment in Cool Valley
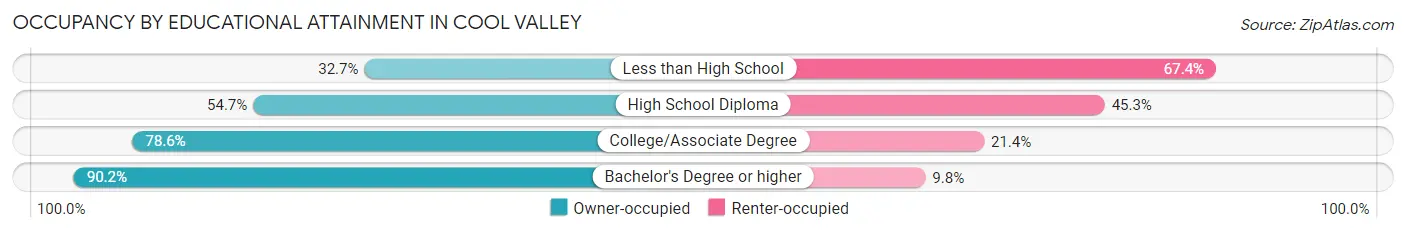
| Household Size | Owner-occupied | Renter-occupied |
| Less than High School | 16 (32.7%) | 33 (67.3%) |
| High School Diploma | 70 (54.7%) | 58 (45.3%) |
| College/Associate Degree | 114 (78.6%) | 31 (21.4%) |
| Bachelor's Degree or higher | 74 (90.2%) | 8 (9.8%) |
Occupancy by Age of Householder in Cool Valley
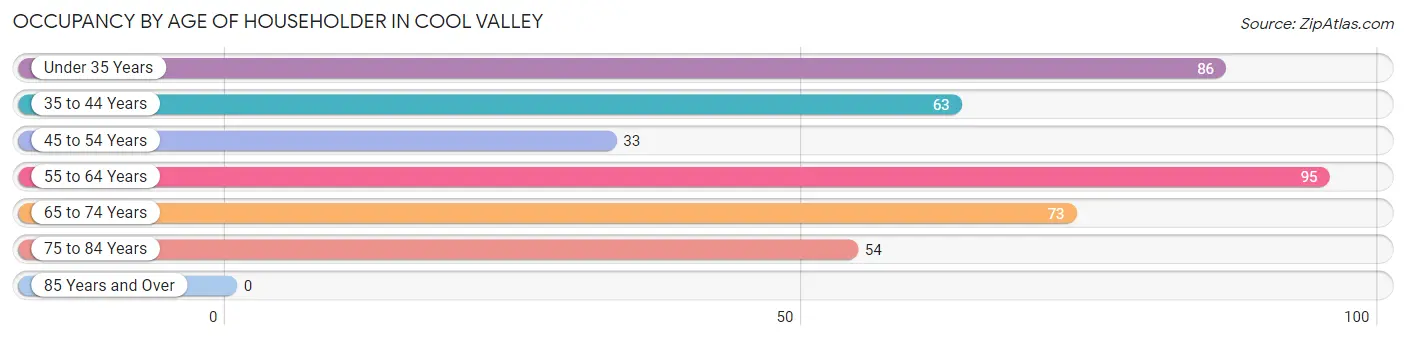
| Age Bracket | # Households | % Households |
| Under 35 Years | 86 | 21.3% |
| 35 to 44 Years | 63 | 15.6% |
| 45 to 54 Years | 33 | 8.2% |
| 55 to 64 Years | 95 | 23.5% |
| 65 to 74 Years | 73 | 18.1% |
| 75 to 84 Years | 54 | 13.4% |
| 85 Years and Over | 0 | 0.0% |
| Total | 404 | 100.0% |
Housing Finances in Cool Valley
Median Income by Occupancy in Cool Valley
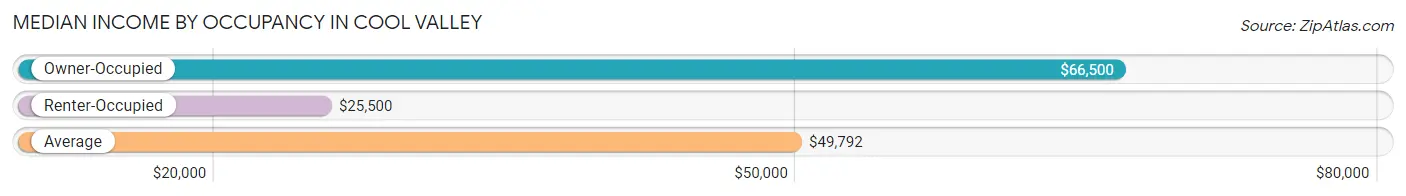
| Occupancy Type | # Households | Median Income |
| Owner-Occupied | 274 (67.8%) | $66,500 |
| Renter-Occupied | 130 (32.2%) | $25,500 |
| Average | 404 (100.0%) | $49,792 |
Occupancy by Householder Income Bracket in Cool Valley
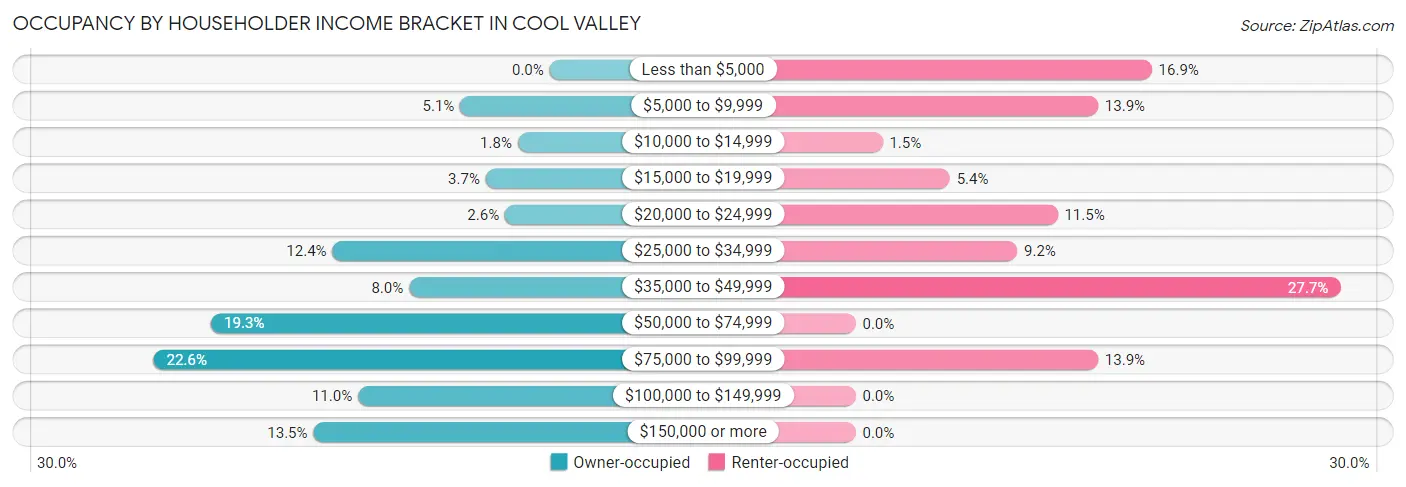
| Income Bracket | Owner-occupied | Renter-occupied |
| Less than $5,000 | 0 (0.0%) | 22 (16.9%) |
| $5,000 to $9,999 | 14 (5.1%) | 18 (13.9%) |
| $10,000 to $14,999 | 5 (1.8%) | 2 (1.5%) |
| $15,000 to $19,999 | 10 (3.6%) | 7 (5.4%) |
| $20,000 to $24,999 | 7 (2.5%) | 15 (11.5%) |
| $25,000 to $34,999 | 34 (12.4%) | 12 (9.2%) |
| $35,000 to $49,999 | 22 (8.0%) | 36 (27.7%) |
| $50,000 to $74,999 | 53 (19.3%) | 0 (0.0%) |
| $75,000 to $99,999 | 62 (22.6%) | 18 (13.9%) |
| $100,000 to $149,999 | 30 (11.0%) | 0 (0.0%) |
| $150,000 or more | 37 (13.5%) | 0 (0.0%) |
| Total | 274 (100.0%) | 130 (100.0%) |
Monthly Housing Cost Tiers in Cool Valley
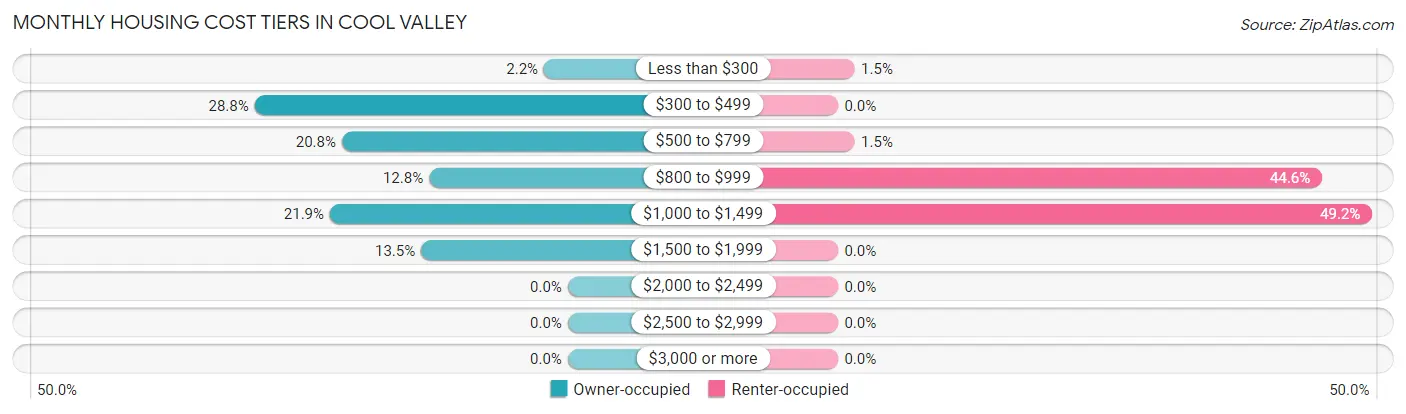
| Monthly Cost | Owner-occupied | Renter-occupied |
| Less than $300 | 6 (2.2%) | 2 (1.5%) |
| $300 to $499 | 79 (28.8%) | 0 (0.0%) |
| $500 to $799 | 57 (20.8%) | 2 (1.5%) |
| $800 to $999 | 35 (12.8%) | 58 (44.6%) |
| $1,000 to $1,499 | 60 (21.9%) | 64 (49.2%) |
| $1,500 to $1,999 | 37 (13.5%) | 0 (0.0%) |
| $2,000 to $2,499 | 0 (0.0%) | 0 (0.0%) |
| $2,500 to $2,999 | 0 (0.0%) | 0 (0.0%) |
| $3,000 or more | 0 (0.0%) | 0 (0.0%) |
| Total | 274 (100.0%) | 130 (100.0%) |
Physical Housing Characteristics in Cool Valley
Housing Structures in Cool Valley
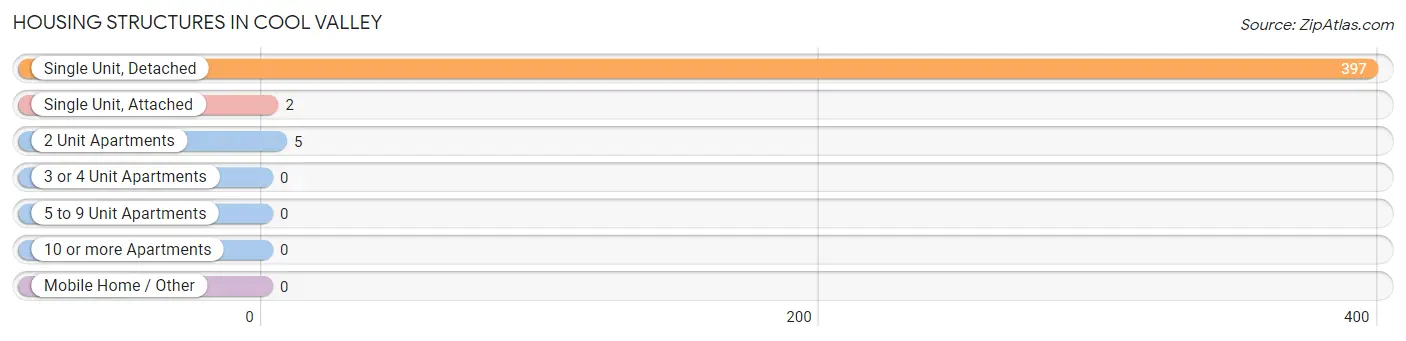
| Structure Type | # Housing Units | % Housing Units |
| Single Unit, Detached | 397 | 98.3% |
| Single Unit, Attached | 2 | 0.5% |
| 2 Unit Apartments | 5 | 1.2% |
| 3 or 4 Unit Apartments | 0 | 0.0% |
| 5 to 9 Unit Apartments | 0 | 0.0% |
| 10 or more Apartments | 0 | 0.0% |
| Mobile Home / Other | 0 | 0.0% |
| Total | 404 | 100.0% |
Housing Structures by Occupancy in Cool Valley
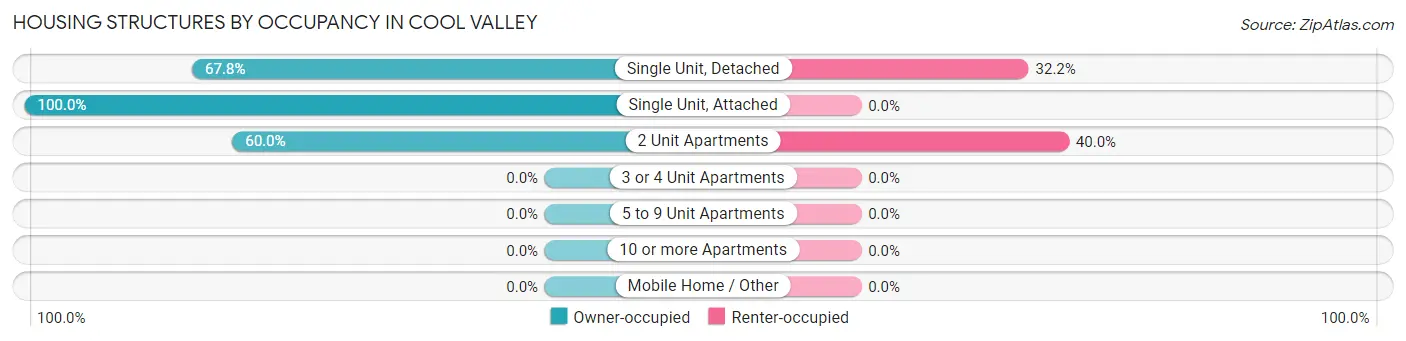
| Structure Type | Owner-occupied | Renter-occupied |
| Single Unit, Detached | 269 (67.8%) | 128 (32.2%) |
| Single Unit, Attached | 2 (100.0%) | 0 (0.0%) |
| 2 Unit Apartments | 3 (60.0%) | 2 (40.0%) |
| 3 or 4 Unit Apartments | 0 (0.0%) | 0 (0.0%) |
| 5 to 9 Unit Apartments | 0 (0.0%) | 0 (0.0%) |
| 10 or more Apartments | 0 (0.0%) | 0 (0.0%) |
| Mobile Home / Other | 0 (0.0%) | 0 (0.0%) |
| Total | 274 (67.8%) | 130 (32.2%) |
Housing Structures by Number of Rooms in Cool Valley
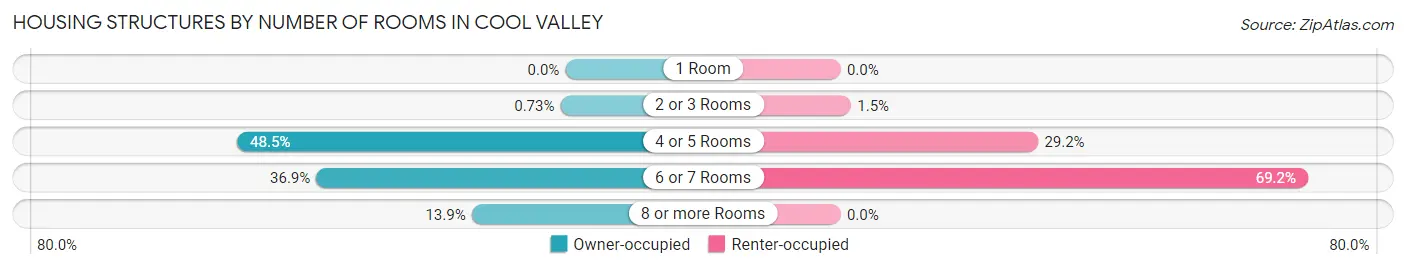
| Number of Rooms | Owner-occupied | Renter-occupied |
| 1 Room | 0 (0.0%) | 0 (0.0%) |
| 2 or 3 Rooms | 2 (0.7%) | 2 (1.5%) |
| 4 or 5 Rooms | 133 (48.5%) | 38 (29.2%) |
| 6 or 7 Rooms | 101 (36.9%) | 90 (69.2%) |
| 8 or more Rooms | 38 (13.9%) | 0 (0.0%) |
| Total | 274 (100.0%) | 130 (100.0%) |
Housing Structure by Heating Type in Cool Valley
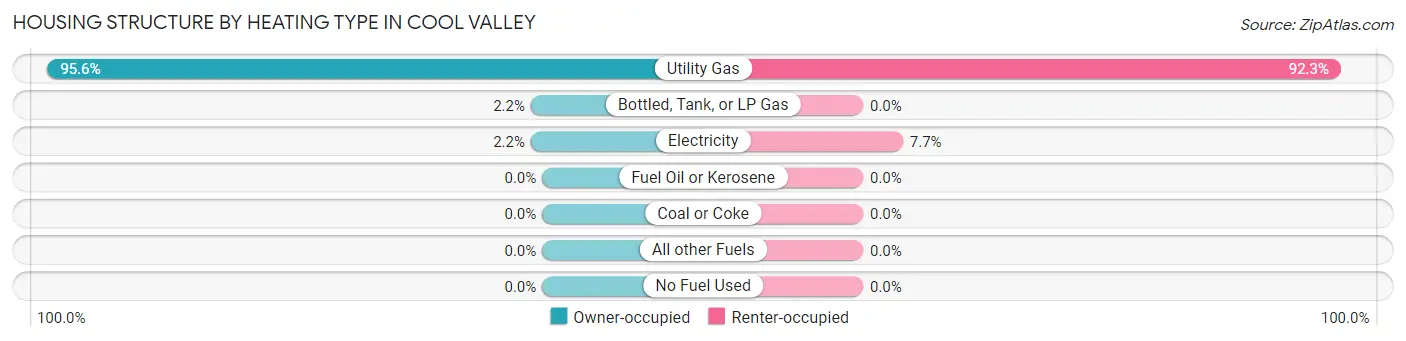
| Heating Type | Owner-occupied | Renter-occupied |
| Utility Gas | 262 (95.6%) | 120 (92.3%) |
| Bottled, Tank, or LP Gas | 6 (2.2%) | 0 (0.0%) |
| Electricity | 6 (2.2%) | 10 (7.7%) |
| Fuel Oil or Kerosene | 0 (0.0%) | 0 (0.0%) |
| Coal or Coke | 0 (0.0%) | 0 (0.0%) |
| All other Fuels | 0 (0.0%) | 0 (0.0%) |
| No Fuel Used | 0 (0.0%) | 0 (0.0%) |
| Total | 274 (100.0%) | 130 (100.0%) |
Household Vehicle Usage in Cool Valley
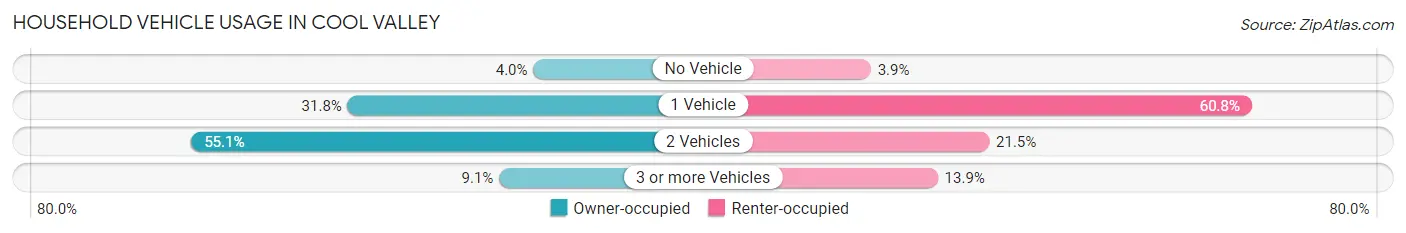
| Vehicles per Household | Owner-occupied | Renter-occupied |
| No Vehicle | 11 (4.0%) | 5 (3.8%) |
| 1 Vehicle | 87 (31.8%) | 79 (60.8%) |
| 2 Vehicles | 151 (55.1%) | 28 (21.5%) |
| 3 or more Vehicles | 25 (9.1%) | 18 (13.9%) |
| Total | 274 (100.0%) | 130 (100.0%) |
Real Estate & Mortgages in Cool Valley
Real Estate and Mortgage Overview in Cool Valley
| Characteristic | Without Mortgage | With Mortgage |
| Housing Units | 133 | 141 |
| Median Property Value | $79,000 | $99,600 |
| Median Household Income | $64,750 | $19 |
| Monthly Housing Costs | $447 | $0 |
| Real Estate Taxes | $1,487 | $17 |
Property Value by Mortgage Status in Cool Valley
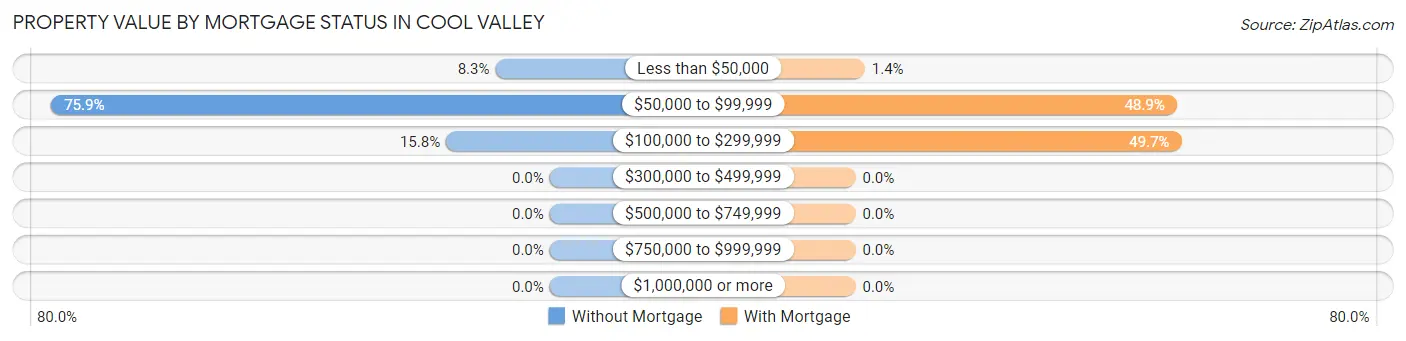
| Property Value | Without Mortgage | With Mortgage |
| Less than $50,000 | 11 (8.3%) | 2 (1.4%) |
| $50,000 to $99,999 | 101 (75.9%) | 69 (48.9%) |
| $100,000 to $299,999 | 21 (15.8%) | 70 (49.6%) |
| $300,000 to $499,999 | 0 (0.0%) | 0 (0.0%) |
| $500,000 to $749,999 | 0 (0.0%) | 0 (0.0%) |
| $750,000 to $999,999 | 0 (0.0%) | 0 (0.0%) |
| $1,000,000 or more | 0 (0.0%) | 0 (0.0%) |
| Total | 133 (100.0%) | 141 (100.0%) |
Household Income by Mortgage Status in Cool Valley
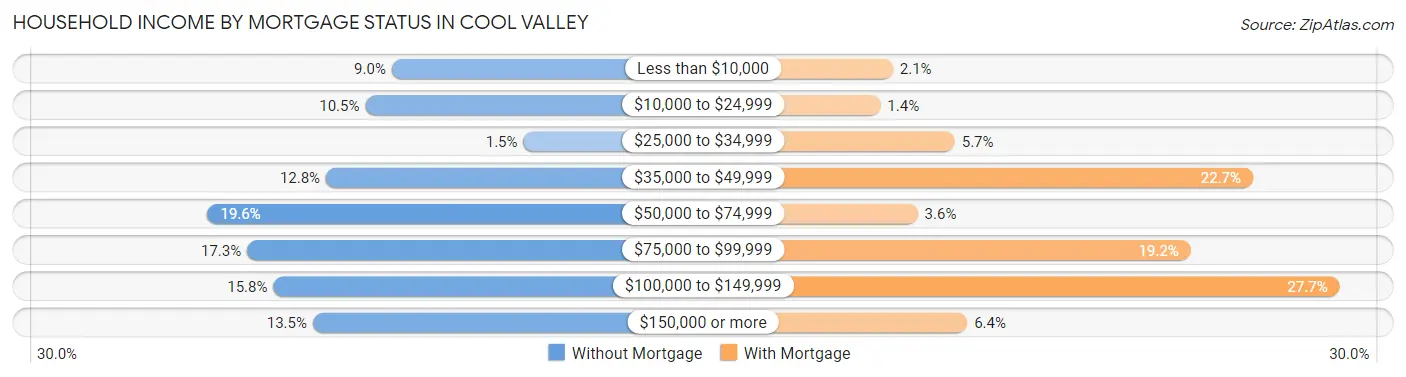
| Household Income | Without Mortgage | With Mortgage |
| Less than $10,000 | 12 (9.0%) | 3 (2.1%) |
| $10,000 to $24,999 | 14 (10.5%) | 2 (1.4%) |
| $25,000 to $34,999 | 2 (1.5%) | 8 (5.7%) |
| $35,000 to $49,999 | 17 (12.8%) | 32 (22.7%) |
| $50,000 to $74,999 | 26 (19.6%) | 5 (3.5%) |
| $75,000 to $99,999 | 23 (17.3%) | 27 (19.2%) |
| $100,000 to $149,999 | 21 (15.8%) | 39 (27.7%) |
| $150,000 or more | 18 (13.5%) | 9 (6.4%) |
| Total | 133 (100.0%) | 141 (100.0%) |
Property Value to Household Income Ratio in Cool Valley
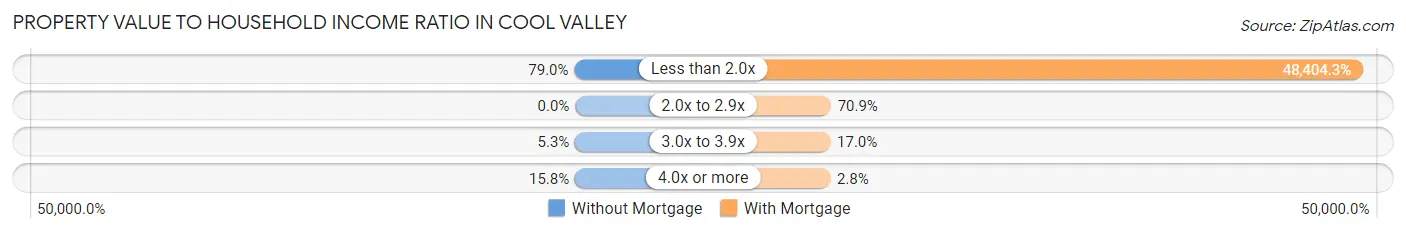
| Value-to-Income Ratio | Without Mortgage | With Mortgage |
| Less than 2.0x | 105 (78.9%) | 68,250 (48,404.3%) |
| 2.0x to 2.9x | 0 (0.0%) | 100 (70.9%) |
| 3.0x to 3.9x | 7 (5.3%) | 24 (17.0%) |
| 4.0x or more | 21 (15.8%) | 4 (2.8%) |
| Total | 133 (100.0%) | 141 (100.0%) |
Real Estate Taxes by Mortgage Status in Cool Valley
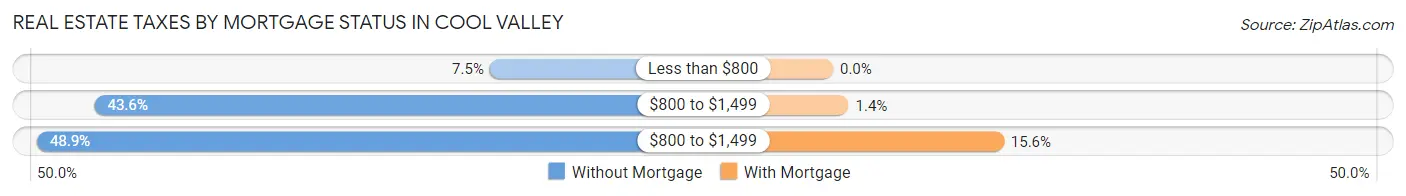
| Property Taxes | Without Mortgage | With Mortgage |
| Less than $800 | 10 (7.5%) | 0 (0.0%) |
| $800 to $1,499 | 58 (43.6%) | 2 (1.4%) |
| $800 to $1,499 | 65 (48.9%) | 22 (15.6%) |
| Total | 133 (100.0%) | 141 (100.0%) |
Health & Disability in Cool Valley
Health Insurance Coverage by Age in Cool Valley
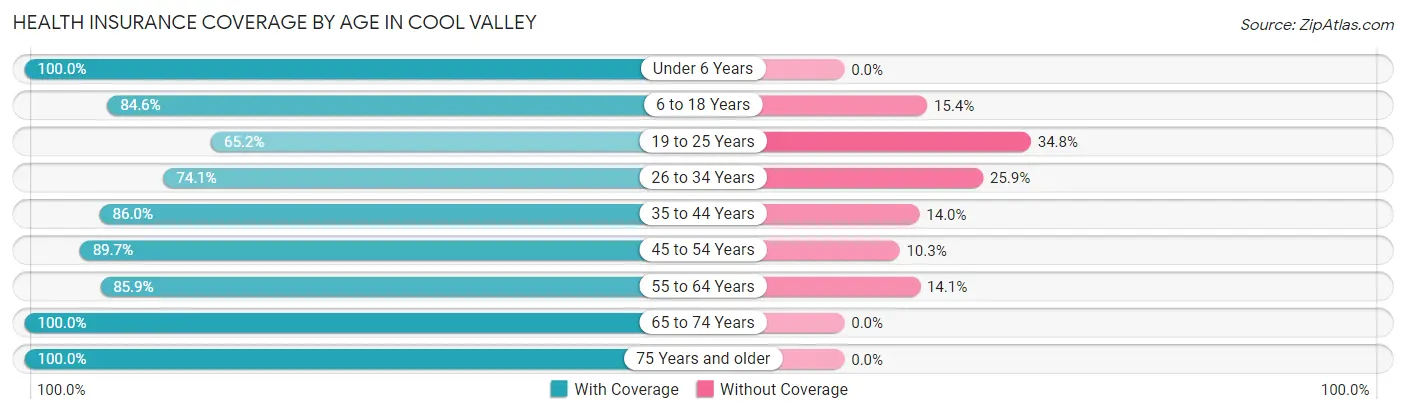
| Age Bracket | With Coverage | Without Coverage |
| Under 6 Years | 110 (100.0%) | 0 (0.0%) |
| 6 to 18 Years | 241 (84.6%) | 44 (15.4%) |
| 19 to 25 Years | 75 (65.2%) | 40 (34.8%) |
| 26 to 34 Years | 126 (74.1%) | 44 (25.9%) |
| 35 to 44 Years | 86 (86.0%) | 14 (14.0%) |
| 45 to 54 Years | 61 (89.7%) | 7 (10.3%) |
| 55 to 64 Years | 140 (85.9%) | 23 (14.1%) |
| 65 to 74 Years | 94 (100.0%) | 0 (0.0%) |
| 75 Years and older | 70 (100.0%) | 0 (0.0%) |
| Total | 1,003 (85.4%) | 172 (14.6%) |
Health Insurance Coverage by Citizenship Status in Cool Valley
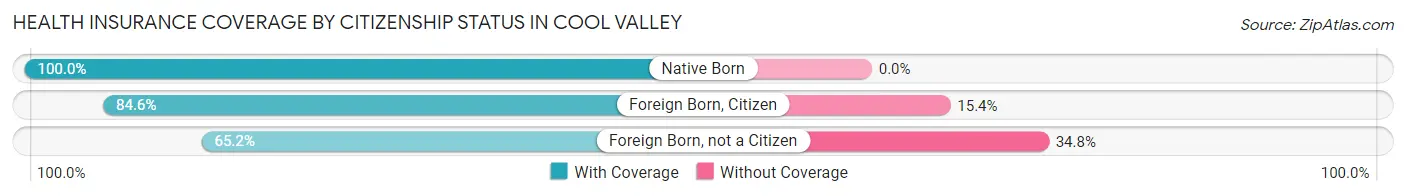
| Citizenship Status | With Coverage | Without Coverage |
| Native Born | 110 (100.0%) | 0 (0.0%) |
| Foreign Born, Citizen | 241 (84.6%) | 44 (15.4%) |
| Foreign Born, not a Citizen | 75 (65.2%) | 40 (34.8%) |
Health Insurance Coverage by Household Income in Cool Valley
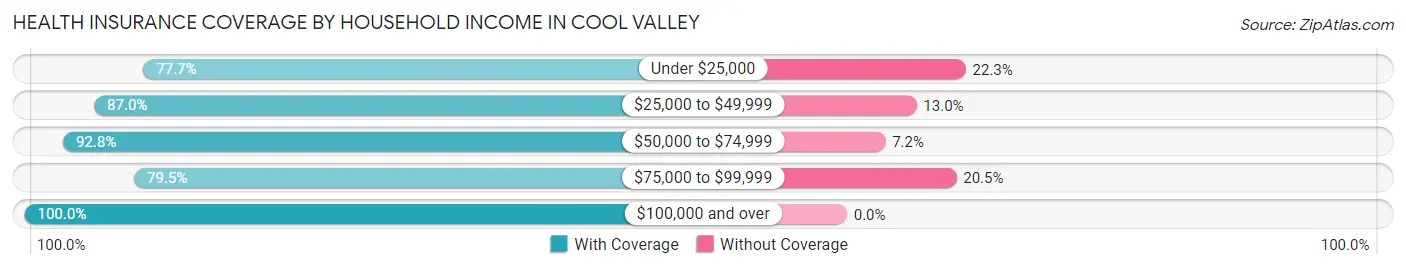
| Household Income | With Coverage | Without Coverage |
| Under $25,000 | 262 (77.7%) | 75 (22.3%) |
| $25,000 to $49,999 | 320 (87.0%) | 48 (13.0%) |
| $50,000 to $74,999 | 116 (92.8%) | 9 (7.2%) |
| $75,000 to $99,999 | 155 (79.5%) | 40 (20.5%) |
| $100,000 and over | 150 (100.0%) | 0 (0.0%) |
Public vs Private Health Insurance Coverage by Age in Cool Valley
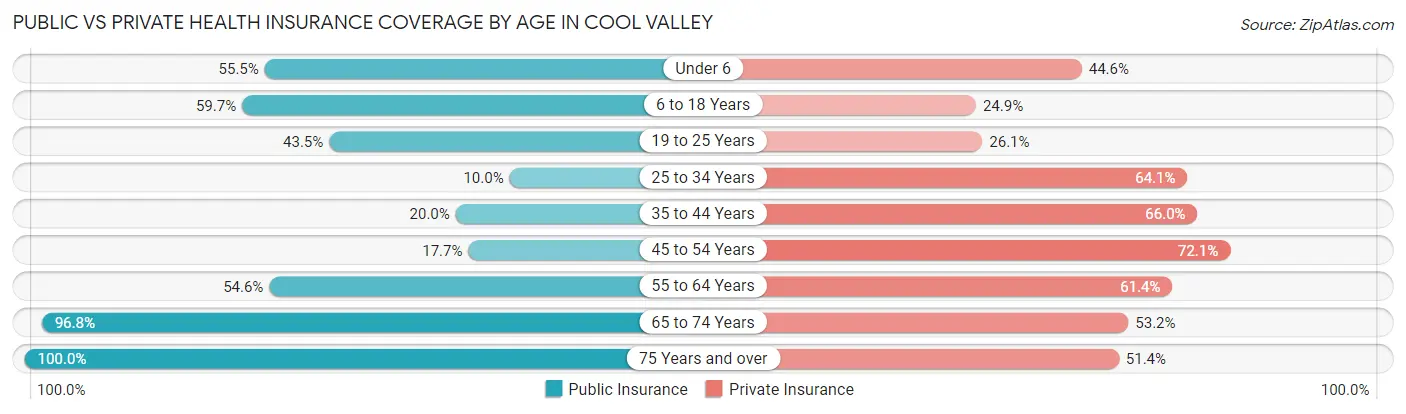
| Age Bracket | Public Insurance | Private Insurance |
| Under 6 | 61 (55.4%) | 49 (44.6%) |
| 6 to 18 Years | 170 (59.7%) | 71 (24.9%) |
| 19 to 25 Years | 50 (43.5%) | 30 (26.1%) |
| 25 to 34 Years | 17 (10.0%) | 109 (64.1%) |
| 35 to 44 Years | 20 (20.0%) | 66 (66.0%) |
| 45 to 54 Years | 12 (17.6%) | 49 (72.1%) |
| 55 to 64 Years | 89 (54.6%) | 100 (61.4%) |
| 65 to 74 Years | 91 (96.8%) | 50 (53.2%) |
| 75 Years and over | 70 (100.0%) | 36 (51.4%) |
| Total | 580 (49.4%) | 560 (47.7%) |
Disability Status by Sex by Age in Cool Valley
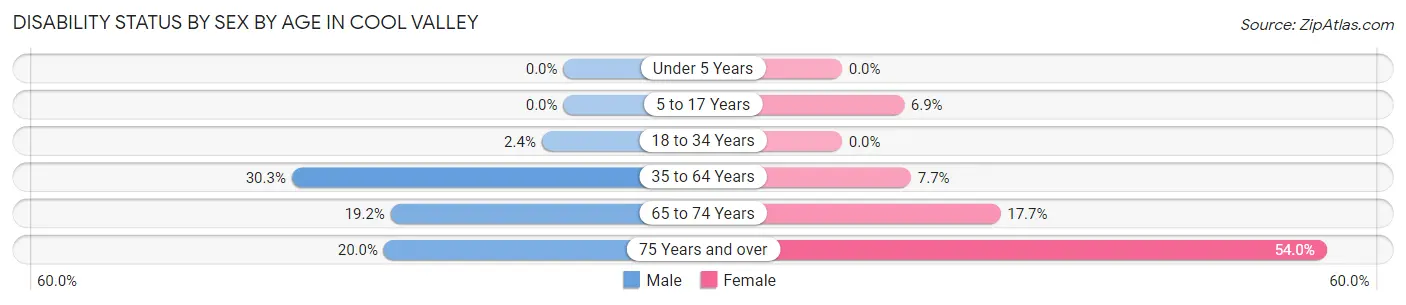
| Age Bracket | Male | Female |
| Under 5 Years | 0 (0.0%) | 0 (0.0%) |
| 5 to 17 Years | 0 (0.0%) | 15 (6.9%) |
| 18 to 34 Years | 4 (2.4%) | 0 (0.0%) |
| 35 to 64 Years | 49 (30.2%) | 13 (7.7%) |
| 65 to 74 Years | 5 (19.2%) | 12 (17.6%) |
| 75 Years and over | 4 (20.0%) | 27 (54.0%) |
Disability Class by Sex by Age in Cool Valley
Disability Class: Hearing Difficulty
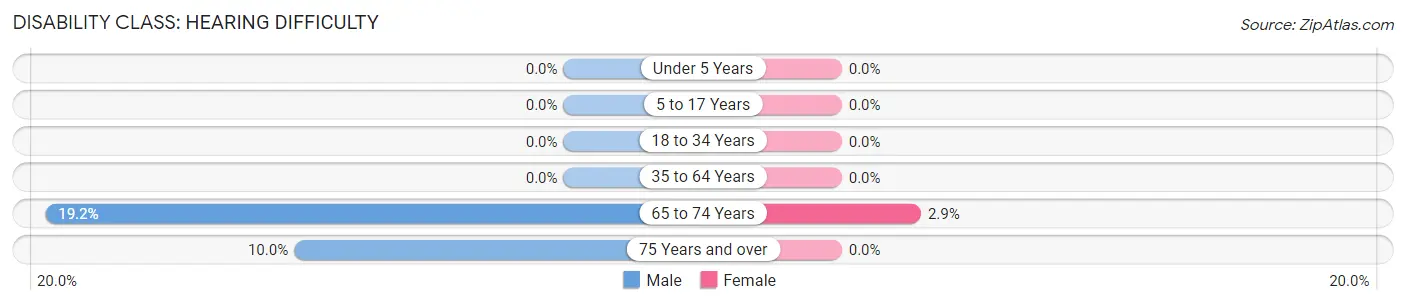
| Age Bracket | Male | Female |
| Under 5 Years | 0 (0.0%) | 0 (0.0%) |
| 5 to 17 Years | 0 (0.0%) | 0 (0.0%) |
| 18 to 34 Years | 0 (0.0%) | 0 (0.0%) |
| 35 to 64 Years | 0 (0.0%) | 0 (0.0%) |
| 65 to 74 Years | 5 (19.2%) | 2 (2.9%) |
| 75 Years and over | 2 (10.0%) | 0 (0.0%) |
Disability Class: Vision Difficulty
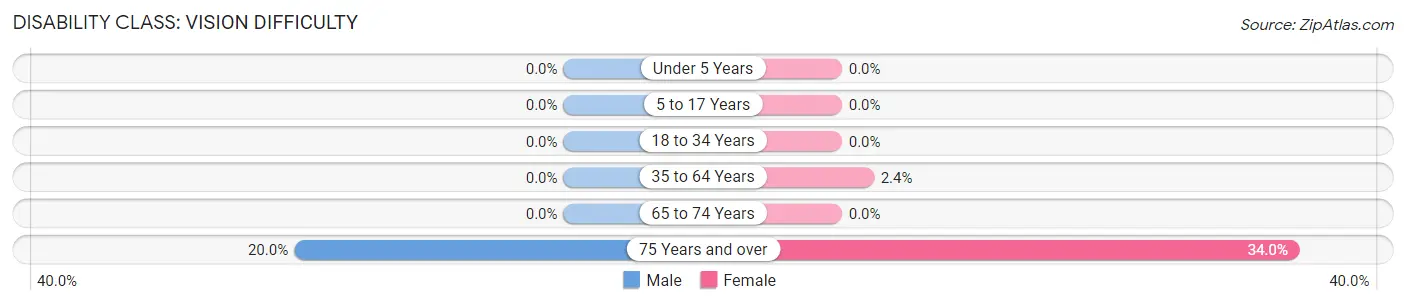
| Age Bracket | Male | Female |
| Under 5 Years | 0 (0.0%) | 0 (0.0%) |
| 5 to 17 Years | 0 (0.0%) | 0 (0.0%) |
| 18 to 34 Years | 0 (0.0%) | 0 (0.0%) |
| 35 to 64 Years | 0 (0.0%) | 4 (2.4%) |
| 65 to 74 Years | 0 (0.0%) | 0 (0.0%) |
| 75 Years and over | 4 (20.0%) | 17 (34.0%) |
Disability Class: Cognitive Difficulty
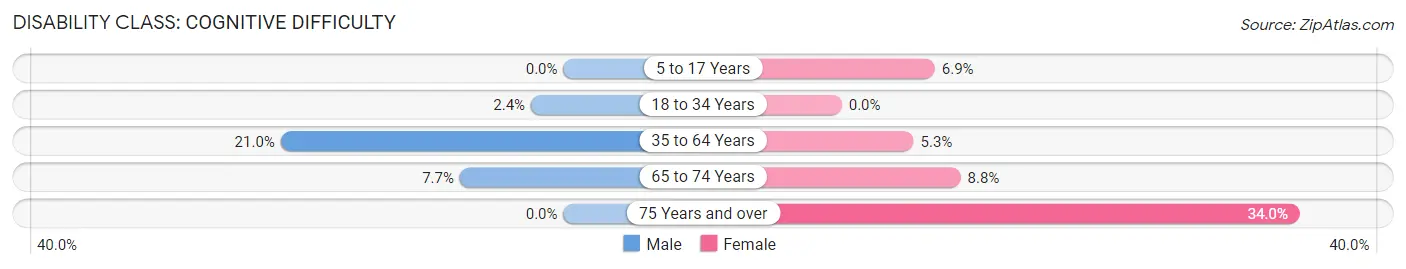
| Age Bracket | Male | Female |
| 5 to 17 Years | 0 (0.0%) | 15 (6.9%) |
| 18 to 34 Years | 4 (2.4%) | 0 (0.0%) |
| 35 to 64 Years | 34 (21.0%) | 9 (5.3%) |
| 65 to 74 Years | 2 (7.7%) | 6 (8.8%) |
| 75 Years and over | 0 (0.0%) | 17 (34.0%) |
Disability Class: Ambulatory Difficulty
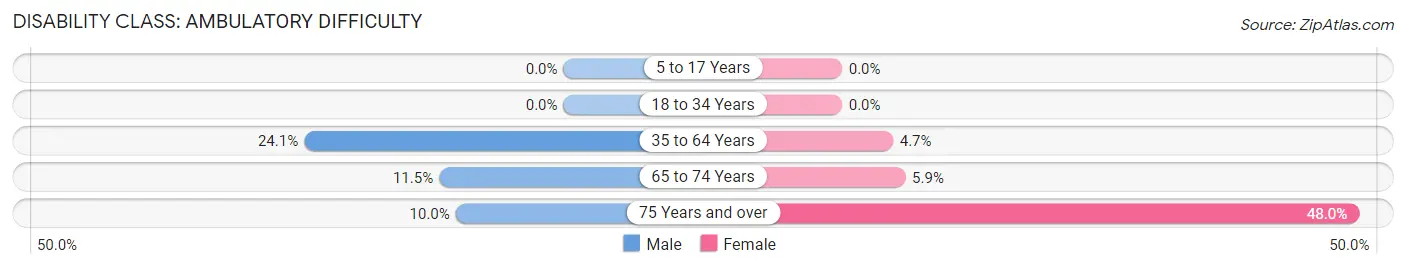
| Age Bracket | Male | Female |
| 5 to 17 Years | 0 (0.0%) | 0 (0.0%) |
| 18 to 34 Years | 0 (0.0%) | 0 (0.0%) |
| 35 to 64 Years | 39 (24.1%) | 8 (4.7%) |
| 65 to 74 Years | 3 (11.5%) | 4 (5.9%) |
| 75 Years and over | 2 (10.0%) | 24 (48.0%) |
Disability Class: Self-Care Difficulty
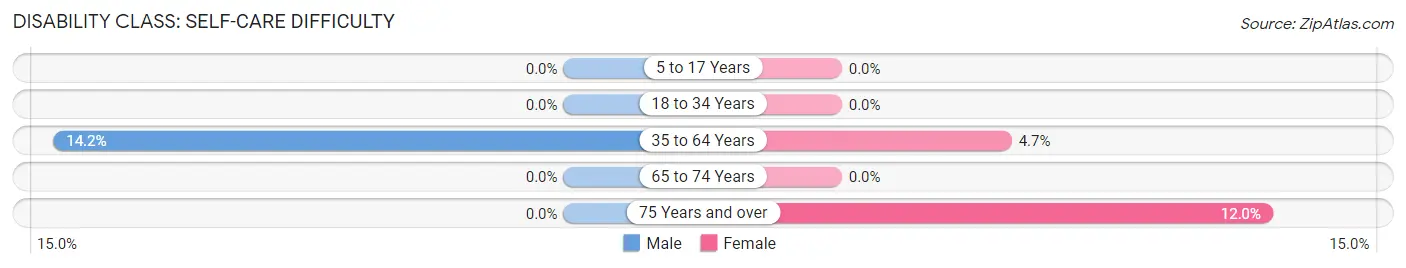
| Age Bracket | Male | Female |
| 5 to 17 Years | 0 (0.0%) | 0 (0.0%) |
| 18 to 34 Years | 0 (0.0%) | 0 (0.0%) |
| 35 to 64 Years | 23 (14.2%) | 8 (4.7%) |
| 65 to 74 Years | 0 (0.0%) | 0 (0.0%) |
| 75 Years and over | 0 (0.0%) | 6 (12.0%) |
Technology Access in Cool Valley
Computing Device Access in Cool Valley
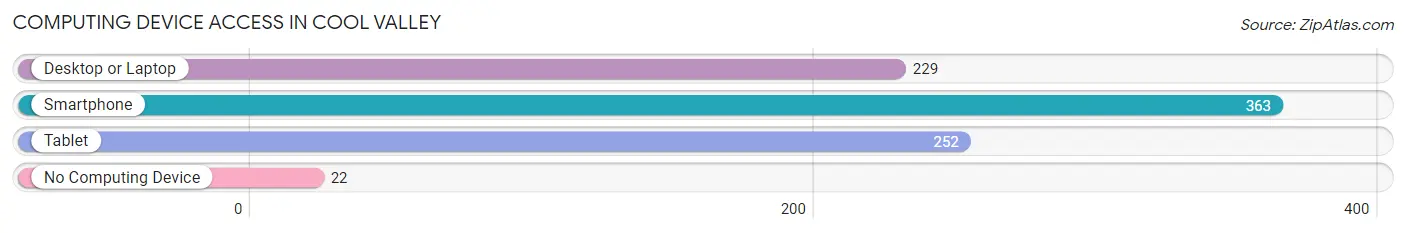
| Device Type | # Households | % Households |
| Desktop or Laptop | 229 | 56.7% |
| Smartphone | 363 | 89.8% |
| Tablet | 252 | 62.4% |
| No Computing Device | 22 | 5.4% |
| Total | 404 | 100.0% |
Internet Access in Cool Valley
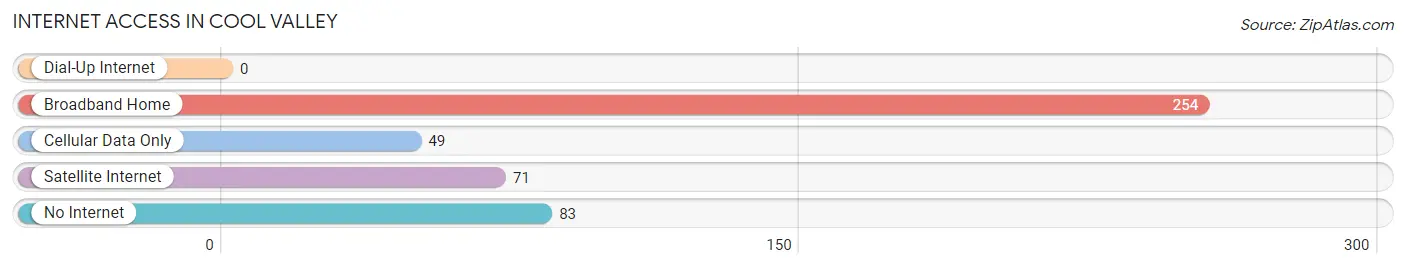
| Internet Type | # Households | % Households |
| Dial-Up Internet | 0 | 0.0% |
| Broadband Home | 254 | 62.9% |
| Cellular Data Only | 49 | 12.1% |
| Satellite Internet | 71 | 17.6% |
| No Internet | 83 | 20.5% |
| Total | 404 | 100.0% |
Cool Valley Summary
Valley, Missouri is a small town located in St. Louis County, Missouri. It is situated in the northern part of the county, just south of the city of St. Louis. The population of Valley was 2,845 at the 2010 census.
History
Valley was founded in 1876 by a group of German immigrants who had come to the area to work in the coal mines. The town was originally called “New Valley”, but the name was changed to “Valley” in 1883. The town was incorporated in 1887.
The town was originally a farming community, but the coal mines brought in a large influx of people and businesses. The coal mines were the main source of employment for the town until the 1950s, when the mines began to close.
Geography
Valley is located in the northern part of St. Louis County, just south of the city of St. Louis. The town is situated on the banks of the Missouri River, and is surrounded by rolling hills and farmland. The town is located at an elevation of 645 feet above sea level.
Economy
Valley’s economy is largely based on agriculture and tourism. The town is home to several small businesses, including a grocery store, a hardware store, and a few restaurants. The town also has a few small manufacturing plants.
The town is also home to a number of tourist attractions, including the Valley Historical Museum, the Valley Railroad, and the Valley Country Club.
Demographics
As of the 2010 census, the population of Valley was 2,845. The racial makeup of the town was 95.3% White, 1.2% African American, 0.3% Native American, 0.3% Asian, 0.1% Pacific Islander, 0.7% from other races, and 2.1% from two or more races. Hispanic or Latino of any race were 2.2% of the population.
The median income for a household in Valley was $45,938, and the median income for a family was $51,938. The per capita income for the town was $20,938. About 8.3% of families and 10.2% of the population were below the poverty line, including 14.2% of those under age 18 and 8.3% of those age 65 or over.
Valley is a small town with a rich history and a diverse population. The town is home to a number of businesses and tourist attractions, and is a great place to live and work.
Common Questions
What is Per Capita Income in Cool Valley?
Per Capita income in Cool Valley is $22,273.
What is the Median Family Income in Cool Valley?
Median Family Income in Cool Valley is $56,818.
What is the Median Household income in Cool Valley?
Median Household Income in Cool Valley is $49,792.
What is Income or Wage Gap in Cool Valley?
Income or Wage Gap in Cool Valley is 34.7%.
Women in Cool Valley earn 65.3 cents for every dollar earned by a man.
What is Inequality or Gini Index in Cool Valley?
Inequality or Gini Index in Cool Valley is 0.44.
What is the Total Population of Cool Valley?
Total Population of Cool Valley is 1,175.
What is the Total Male Population of Cool Valley?
Total Male Population of Cool Valley is 507.
What is the Total Female Population of Cool Valley?
Total Female Population of Cool Valley is 668.
What is the Ratio of Males per 100 Females in Cool Valley?
There are 75.90 Males per 100 Females in Cool Valley.
What is the Ratio of Females per 100 Males in Cool Valley?
There are 131.76 Females per 100 Males in Cool Valley.
What is the Median Population Age in Cool Valley?
Median Population Age in Cool Valley is 29.0 Years.
What is the Average Family Size in Cool Valley
Average Family Size in Cool Valley is 3.6 People.
What is the Average Household Size in Cool Valley
Average Household Size in Cool Valley is 2.9 People.
How Large is the Labor Force in Cool Valley?
There are 478 People in the Labor Forcein in Cool Valley.
What is the Percentage of People in the Labor Force in Cool Valley?
59.5% of People are in the Labor Force in Cool Valley.
What is the Unemployment Rate in Cool Valley?
Unemployment Rate in Cool Valley is 4.2%.