Marshfield, MO Map & Demographics
Marshfield Map
Marshfield Overview
$25,230
PER CAPITA INCOME
$75,321
AVG FAMILY INCOME
$63,842
AVG HOUSEHOLD INCOME
41.5%
WAGE / INCOME GAP [ % ]
58.5¢/ $1
WAGE / INCOME GAP [ $ ]
$12,199
FAMILY INCOME DEFICIT
0.34
INEQUALITY / GINI INDEX
7,501
TOTAL POPULATION
3,582
MALE POPULATION
3,919
FEMALE POPULATION
91.40
MALES / 100 FEMALES
109.41
FEMALES / 100 MALES
32.8
MEDIAN AGE
3.2
AVG FAMILY SIZE
2.8
AVG HOUSEHOLD SIZE
3,161
LABOR FORCE [ PEOPLE ]
58.4%
PERCENT IN LABOR FORCE
5.4%
UNEMPLOYMENT RATE
Marshfield Zip Codes
Marshfield Area Codes
Income in Marshfield
Income Overview in Marshfield
Per Capita Income in Marshfield is $25,230, while median incomes of families and households are $75,321 and $63,842 respectively.
| Characteristic | Number | Measure |
| Per Capita Income | 7,501 | $25,230 |
| Median Family Income | 1,827 | $75,321 |
| Mean Family Income | 1,827 | $76,432 |
| Median Household Income | 2,619 | $63,842 |
| Mean Household Income | 2,619 | $68,987 |
| Income Deficit | 1,827 | $12,199 |
| Wage / Income Gap (%) | 7,501 | 41.50% |
| Wage / Income Gap ($) | 7,501 | 58.50¢ per $1 |
| Gini / Inequality Index | 7,501 | 0.34 |
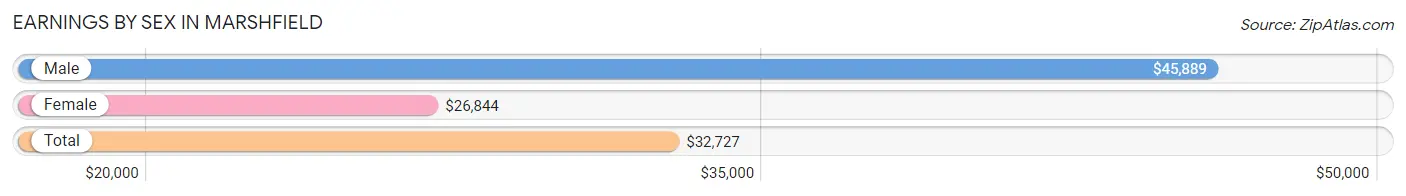
Earnings by Sex in Marshfield
Average Earnings in Marshfield are $32,727, $45,889 for men and $26,844 for women, a difference of 41.5%.
| Sex | Number | Average Earnings |
| Male | 1,881 (53.5%) | $45,889 |
| Female | 1,633 (46.5%) | $26,844 |
| Total | 3,514 (100.0%) | $32,727 |
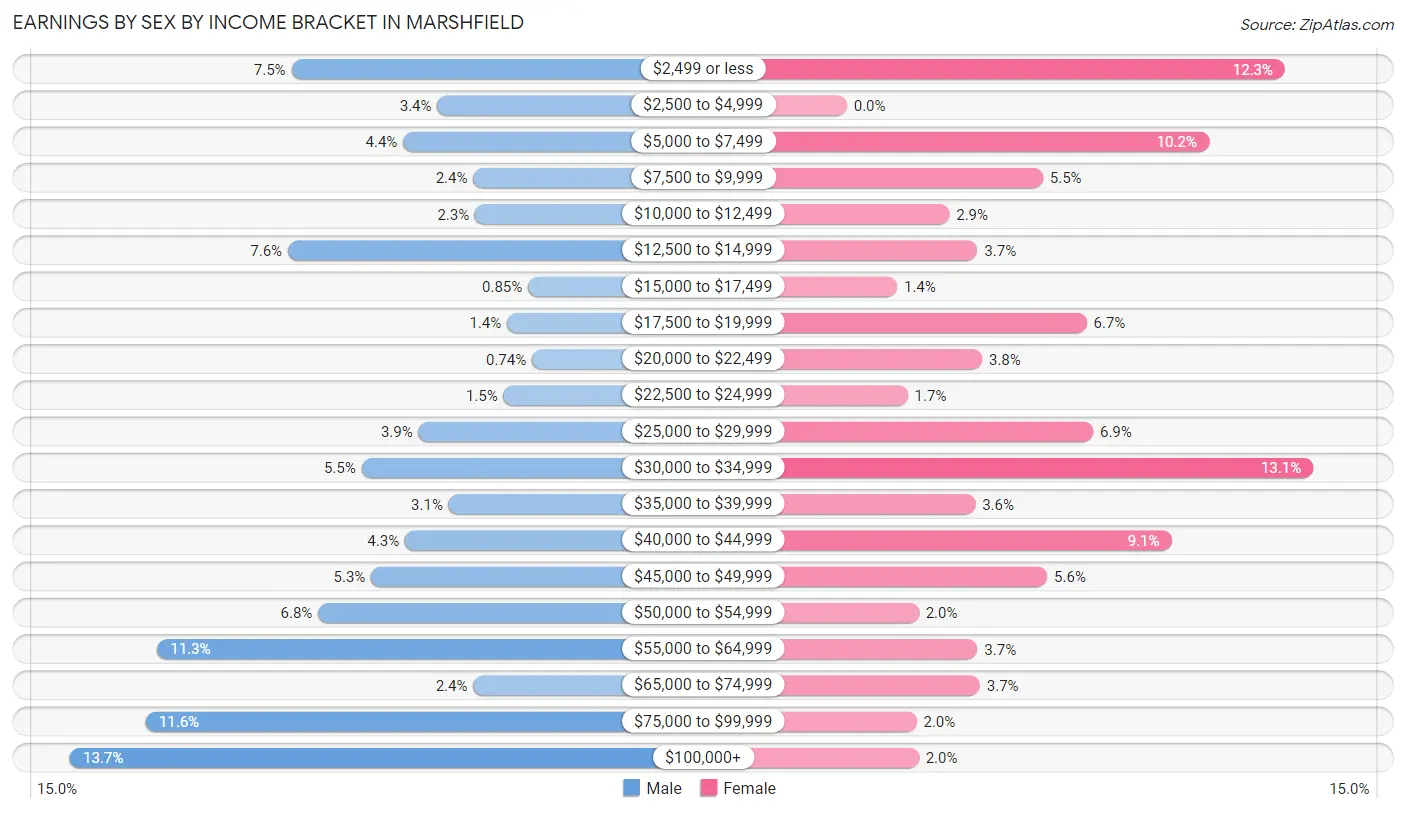
Earnings by Sex by Income Bracket in Marshfield
The most common earnings brackets in Marshfield are $100,000+ for men (258 | 13.7%) and $30,000 to $34,999 for women (214 | 13.1%).
| Income | Male | Female |
| $2,499 or less | 141 (7.5%) | 201 (12.3%) |
| $2,500 to $4,999 | 64 (3.4%) | 0 (0.0%) |
| $5,000 to $7,499 | 82 (4.4%) | 166 (10.2%) |
| $7,500 to $9,999 | 45 (2.4%) | 90 (5.5%) |
| $10,000 to $12,499 | 44 (2.3%) | 47 (2.9%) |
| $12,500 to $14,999 | 143 (7.6%) | 60 (3.7%) |
| $15,000 to $17,499 | 16 (0.9%) | 23 (1.4%) |
| $17,500 to $19,999 | 27 (1.4%) | 110 (6.7%) |
| $20,000 to $22,499 | 14 (0.7%) | 62 (3.8%) |
| $22,500 to $24,999 | 29 (1.5%) | 28 (1.7%) |
| $25,000 to $29,999 | 74 (3.9%) | 113 (6.9%) |
| $30,000 to $34,999 | 104 (5.5%) | 214 (13.1%) |
| $35,000 to $39,999 | 58 (3.1%) | 59 (3.6%) |
| $40,000 to $44,999 | 81 (4.3%) | 149 (9.1%) |
| $45,000 to $49,999 | 99 (5.3%) | 92 (5.6%) |
| $50,000 to $54,999 | 127 (6.8%) | 33 (2.0%) |
| $55,000 to $64,999 | 212 (11.3%) | 60 (3.7%) |
| $65,000 to $74,999 | 45 (2.4%) | 61 (3.7%) |
| $75,000 to $99,999 | 218 (11.6%) | 32 (2.0%) |
| $100,000+ | 258 (13.7%) | 33 (2.0%) |
| Total | 1,881 (100.0%) | 1,633 (100.0%) |
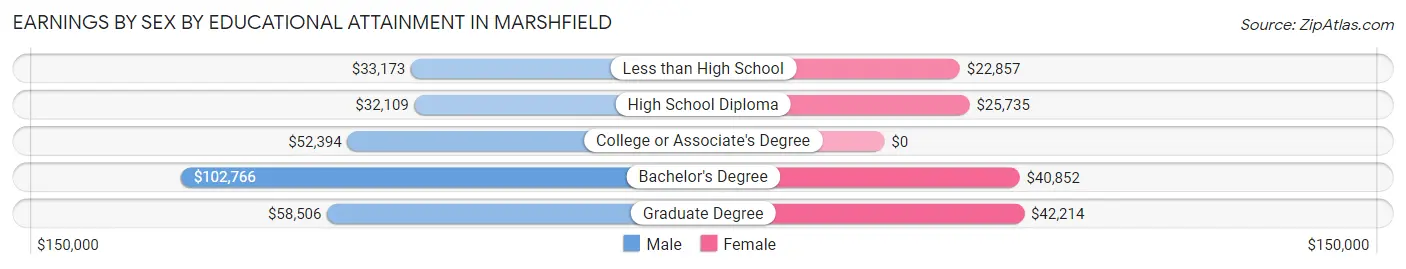
Earnings by Sex by Educational Attainment in Marshfield
Average earnings in Marshfield are $50,169 for men and $26,500 for women, a difference of 47.2%. Men with an educational attainment of bachelor's degree enjoy the highest average annual earnings of $102,766, while those with high school diploma education earn the least with $32,109. Women with an educational attainment of graduate degree earn the most with the average annual earnings of $42,214, while those with less than high school education have the smallest earnings of $22,857.
| Educational Attainment | Male Income | Female Income |
| Less than High School | $33,173 | $22,857 |
| High School Diploma | $32,109 | $25,735 |
| College or Associate's Degree | $52,394 | $0 |
| Bachelor's Degree | $102,766 | $40,852 |
| Graduate Degree | $58,506 | $42,214 |
| Total | $50,169 | $26,500 |
Family Income in Marshfield
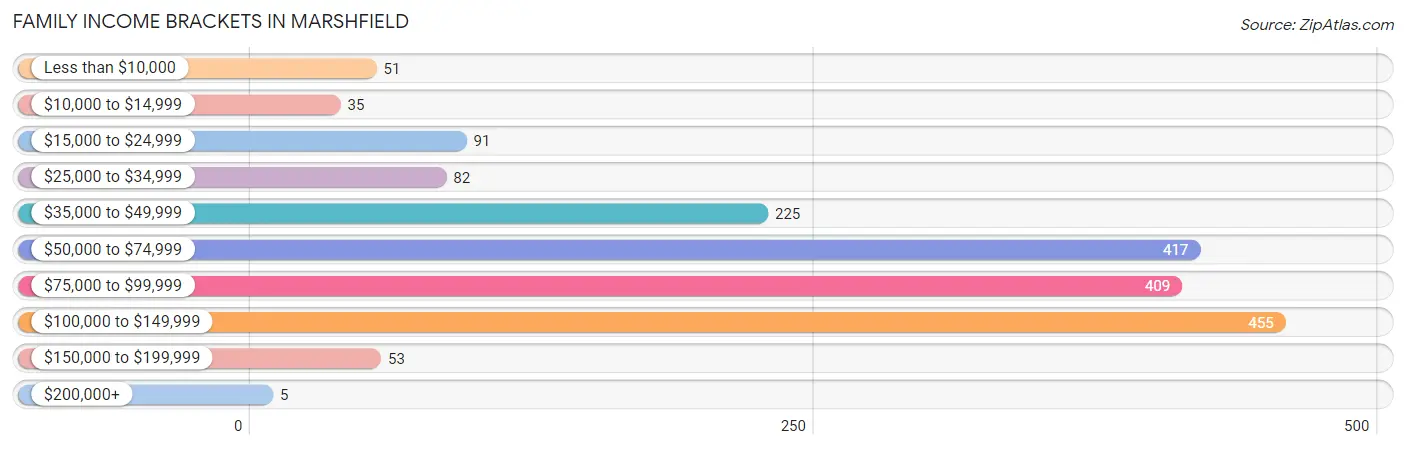
Family Income Brackets in Marshfield
According to the Marshfield family income data, there are 455 families falling into the $100,000 to $149,999 income range, which is the most common income bracket and makes up 24.9% of all families. Conversely, the $200,000+ income bracket is the least frequent group with only 5 families (0.3%) belonging to this category.
| Income Bracket | # Families | % Families |
| Less than $10,000 | 51 | 2.8% |
| $10,000 to $14,999 | 35 | 1.9% |
| $15,000 to $24,999 | 91 | 5.0% |
| $25,000 to $34,999 | 82 | 4.5% |
| $35,000 to $49,999 | 225 | 12.3% |
| $50,000 to $74,999 | 417 | 22.8% |
| $75,000 to $99,999 | 409 | 22.4% |
| $100,000 to $149,999 | 455 | 24.9% |
| $150,000 to $199,999 | 53 | 2.9% |
| $200,000+ | 5 | 0.3% |
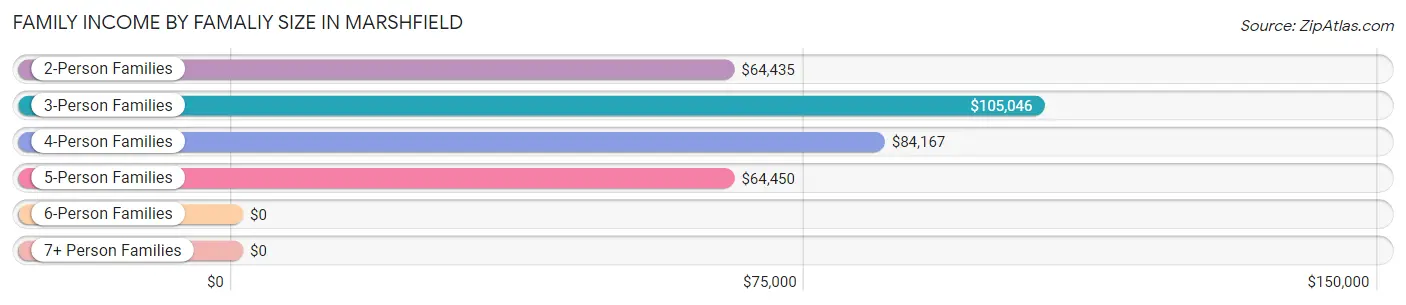
Family Income by Famaliy Size in Marshfield
3-person families (472 | 25.8%) account for the highest median family income in Marshfield with $105,046 per family, while 3-person families (472 | 25.8%) have the highest median income of $35,015 per family member.
| Income Bracket | # Families | Median Income |
| 2-Person Families | 822 (45.0%) | $64,435 |
| 3-Person Families | 472 (25.8%) | $105,046 |
| 4-Person Families | 310 (17.0%) | $84,167 |
| 5-Person Families | 175 (9.6%) | $64,450 |
| 6-Person Families | 48 (2.6%) | $0 |
| 7+ Person Families | 0 (0.0%) | $0 |
| Total | 1,827 (100.0%) | $75,321 |
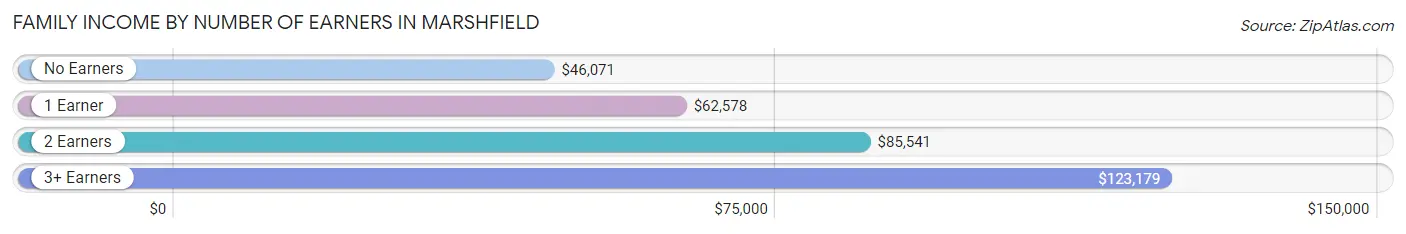
Family Income by Number of Earners in Marshfield
The median family income in Marshfield is $75,321, with families comprising 3+ earners (129) having the highest median family income of $123,179, while families with no earners (368) have the lowest median family income of $46,071, accounting for 7.1% and 20.1% of families, respectively.
| Number of Earners | # Families | Median Income |
| No Earners | 368 (20.1%) | $46,071 |
| 1 Earner | 381 (20.8%) | $62,578 |
| 2 Earners | 949 (51.9%) | $85,541 |
| 3+ Earners | 129 (7.1%) | $123,179 |
| Total | 1,827 (100.0%) | $75,321 |
Household Income in Marshfield
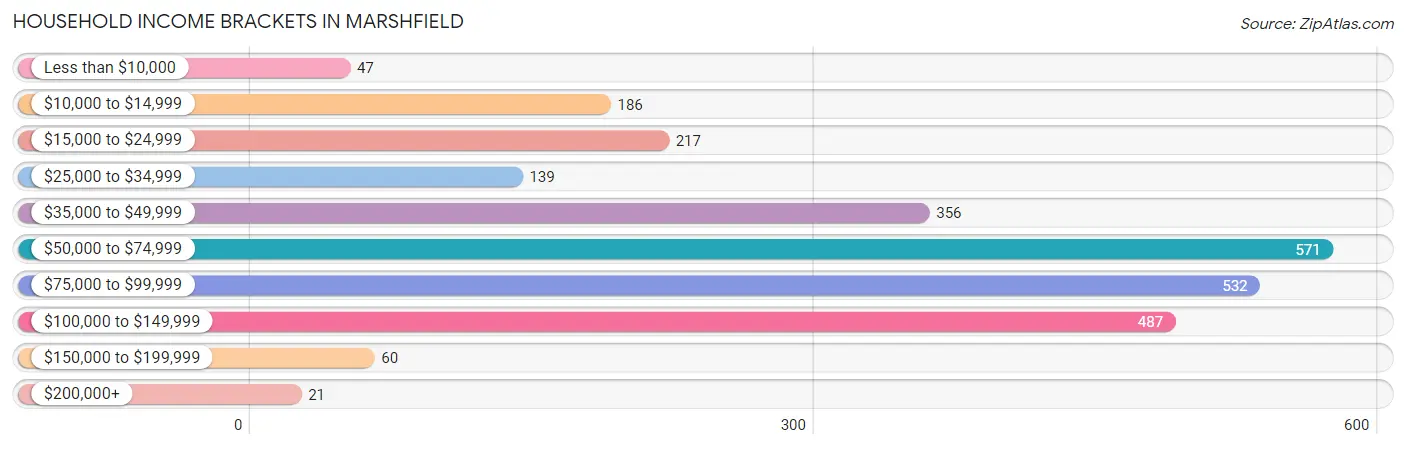
Household Income Brackets in Marshfield
With 571 households falling in the category, the $50,000 to $74,999 income range is the most frequent in Marshfield, accounting for 21.8% of all households. In contrast, only 21 households (0.8%) fall into the $200,000+ income bracket, making it the least populous group.
| Income Bracket | # Households | % Households |
| Less than $10,000 | 47 | 1.8% |
| $10,000 to $14,999 | 186 | 7.1% |
| $15,000 to $24,999 | 217 | 8.3% |
| $25,000 to $34,999 | 139 | 5.3% |
| $35,000 to $49,999 | 356 | 13.6% |
| $50,000 to $74,999 | 571 | 21.8% |
| $75,000 to $99,999 | 532 | 20.3% |
| $100,000 to $149,999 | 487 | 18.6% |
| $150,000 to $199,999 | 60 | 2.3% |
| $200,000+ | 21 | 0.8% |
Household Income by Householder Age in Marshfield
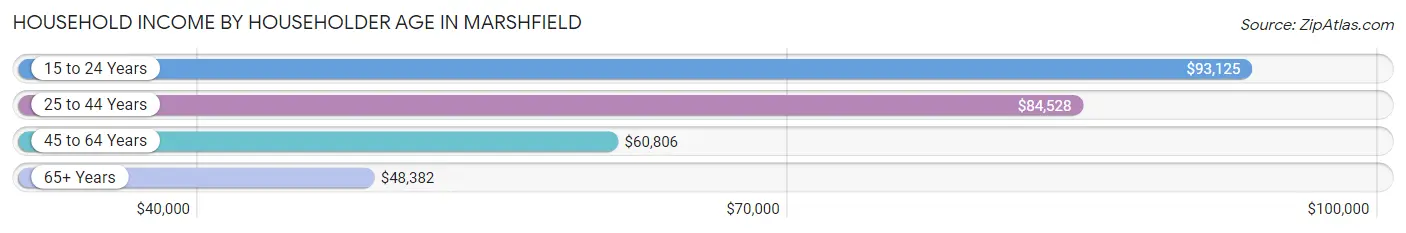
The median household income in Marshfield is $63,842, with the highest median household income of $93,125 found in the 15 to 24 years age bracket for the primary householder. A total of 167 households (6.4%) fall into this category. Meanwhile, the 65+ years age bracket for the primary householder has the lowest median household income of $48,382, with 832 households (31.8%) in this group.
| Income Bracket | # Households | Median Income |
| 15 to 24 Years | 167 (6.4%) | $93,125 |
| 25 to 44 Years | 910 (34.7%) | $84,528 |
| 45 to 64 Years | 710 (27.1%) | $60,806 |
| 65+ Years | 832 (31.8%) | $48,382 |
| Total | 2,619 (100.0%) | $63,842 |
Poverty in Marshfield
Income Below Poverty by Sex and Age in Marshfield
With 17.2% poverty level for males and 24.4% for females among the residents of Marshfield, 15 year old males and 12 to 14 year old females are the most vulnerable to poverty, with 28 males (77.8%) and 153 females (54.3%) in their respective age groups living below the poverty level.
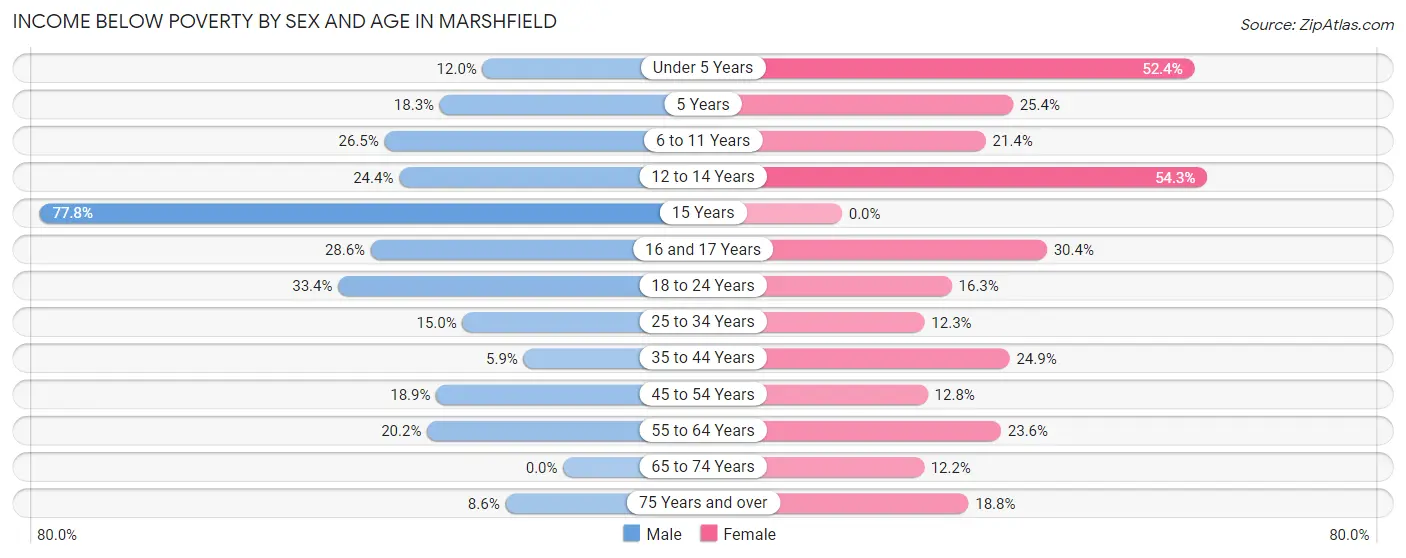
| Age Bracket | Male | Female |
| Under 5 Years | 29 (12.0%) | 210 (52.4%) |
| 5 Years | 22 (18.3%) | 33 (25.4%) |
| 6 to 11 Years | 69 (26.5%) | 44 (21.4%) |
| 12 to 14 Years | 58 (24.4%) | 153 (54.3%) |
| 15 Years | 28 (77.8%) | 0 (0.0%) |
| 16 and 17 Years | 28 (28.6%) | 7 (30.4%) |
| 18 to 24 Years | 130 (33.4%) | 38 (16.3%) |
| 25 to 34 Years | 69 (15.0%) | 72 (12.3%) |
| 35 to 44 Years | 30 (5.9%) | 125 (24.9%) |
| 45 to 54 Years | 57 (18.9%) | 44 (12.8%) |
| 55 to 64 Years | 57 (20.2%) | 73 (23.6%) |
| 65 to 74 Years | 0 (0.0%) | 45 (12.2%) |
| 75 Years and over | 22 (8.6%) | 59 (18.8%) |
| Total | 599 (17.2%) | 903 (24.4%) |
Income Above Poverty by Sex and Age in Marshfield
According to the poverty statistics in Marshfield, males aged 65 to 74 years and females aged 65 to 74 years are the age groups that are most secure financially, with 100.0% of males and 87.8% of females in these age groups living above the poverty line.
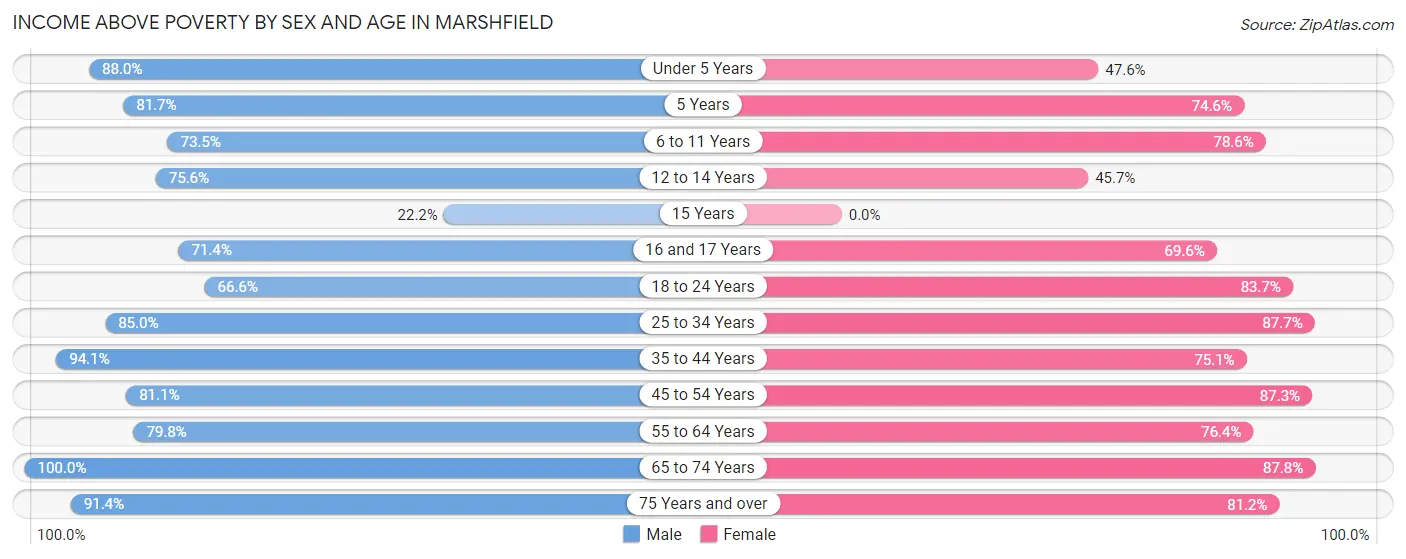
| Age Bracket | Male | Female |
| Under 5 Years | 213 (88.0%) | 191 (47.6%) |
| 5 Years | 98 (81.7%) | 97 (74.6%) |
| 6 to 11 Years | 191 (73.5%) | 162 (78.6%) |
| 12 to 14 Years | 180 (75.6%) | 129 (45.7%) |
| 15 Years | 8 (22.2%) | 0 (0.0%) |
| 16 and 17 Years | 70 (71.4%) | 16 (69.6%) |
| 18 to 24 Years | 259 (66.6%) | 195 (83.7%) |
| 25 to 34 Years | 392 (85.0%) | 515 (87.7%) |
| 35 to 44 Years | 479 (94.1%) | 377 (75.1%) |
| 45 to 54 Years | 245 (81.1%) | 301 (87.3%) |
| 55 to 64 Years | 225 (79.8%) | 236 (76.4%) |
| 65 to 74 Years | 281 (100.0%) | 325 (87.8%) |
| 75 Years and over | 234 (91.4%) | 255 (81.2%) |
| Total | 2,875 (82.8%) | 2,799 (75.6%) |
Income Below Poverty Among Married-Couple Families in Marshfield
The poverty statistics for married-couple families in Marshfield show that 4.5% or 67 of the total 1,491 families live below the poverty line. Families with 3 or 4 children have the highest poverty rate of 17.7%, comprising of 25 families. On the other hand, families with no children have the lowest poverty rate of 3.0%, which includes 25 families.
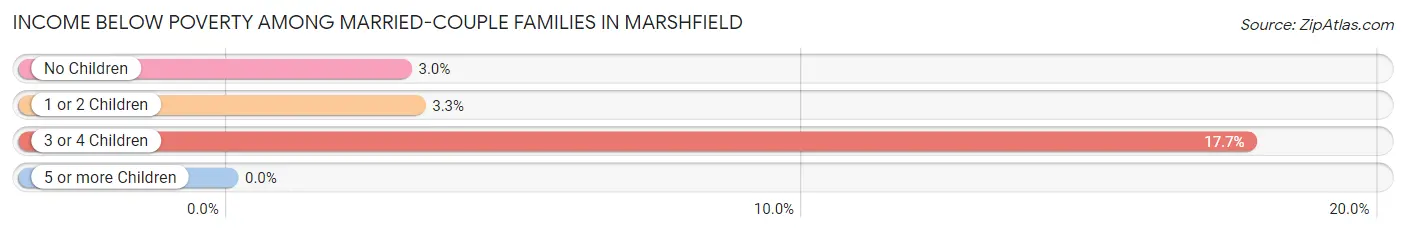
| Children | Above Poverty | Below Poverty |
| No Children | 803 (97.0%) | 25 (3.0%) |
| 1 or 2 Children | 505 (96.7%) | 17 (3.3%) |
| 3 or 4 Children | 116 (82.3%) | 25 (17.7%) |
| 5 or more Children | 0 (0.0%) | 0 (0.0%) |
| Total | 1,424 (95.5%) | 67 (4.5%) |
Income Below Poverty Among Single-Parent Households in Marshfield
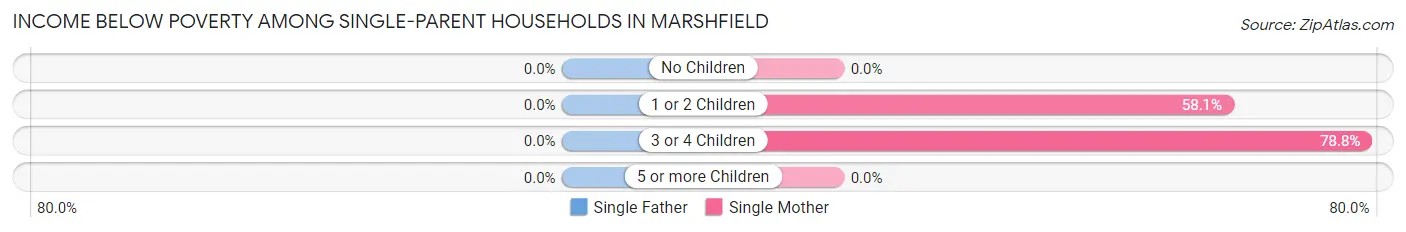
| Children | Single Father | Single Mother |
| No Children | 0 (0.0%) | 0 (0.0%) |
| 1 or 2 Children | 0 (0.0%) | 75 (58.1%) |
| 3 or 4 Children | 0 (0.0%) | 63 (78.7%) |
| 5 or more Children | 0 (0.0%) | 0 (0.0%) |
| Total | 0 (0.0%) | 138 (48.2%) |
Income Below Poverty Among Married-Couple vs Single-Parent Households in Marshfield
The poverty data for Marshfield shows that 67 of the married-couple family households (4.5%) and 138 of the single-parent households (41.1%) are living below the poverty level. Within the married-couple family households, those with 3 or 4 children have the highest poverty rate, with 25 households (17.7%) falling below the poverty line. Among the single-parent households, those with 3 or 4 children have the highest poverty rate, with 63 household (78.7%) living below poverty.
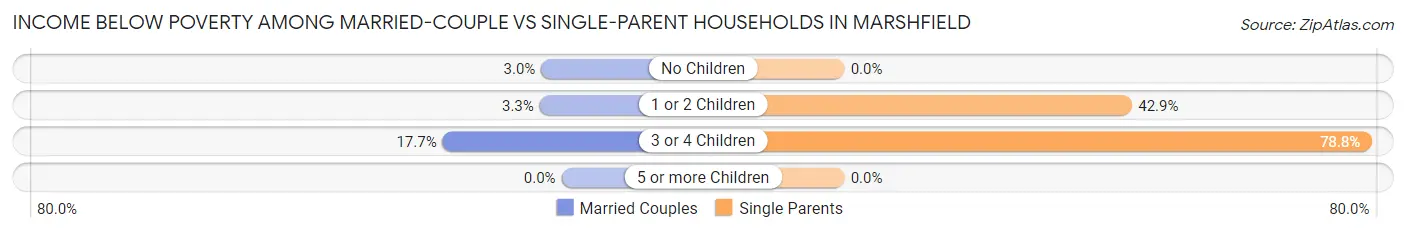
| Children | Married-Couple Families | Single-Parent Households |
| No Children | 25 (3.0%) | 0 (0.0%) |
| 1 or 2 Children | 17 (3.3%) | 75 (42.9%) |
| 3 or 4 Children | 25 (17.7%) | 63 (78.7%) |
| 5 or more Children | 0 (0.0%) | 0 (0.0%) |
| Total | 67 (4.5%) | 138 (41.1%) |
Race in Marshfield
The most populous races in Marshfield are White / Caucasian (6,625 | 88.3%), Two or more Races (719 | 9.6%), and Hispanic or Latino (89 | 1.2%).
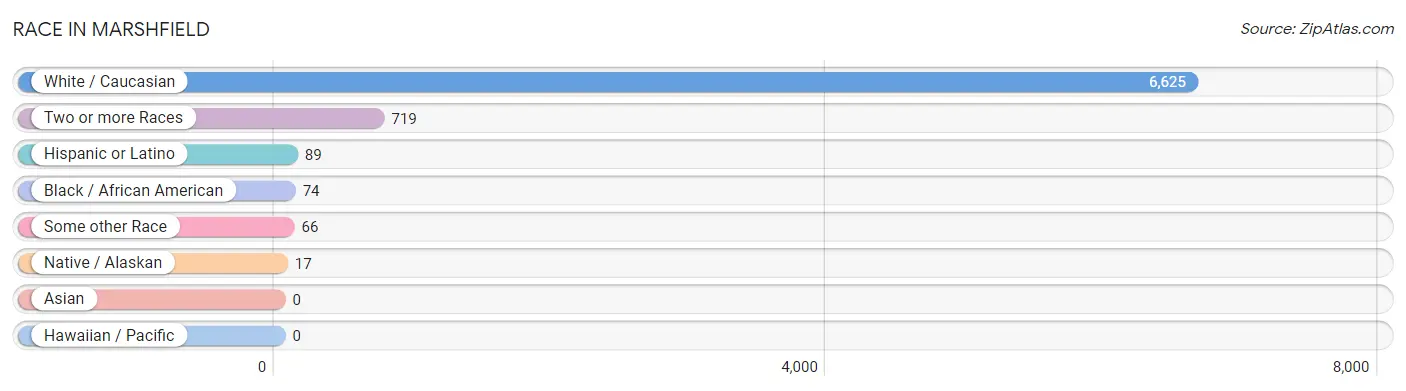
| Race | # Population | % Population |
| Asian | 0 | 0.0% |
| Black / African American | 74 | 1.0% |
| Hawaiian / Pacific | 0 | 0.0% |
| Hispanic or Latino | 89 | 1.2% |
| Native / Alaskan | 17 | 0.2% |
| White / Caucasian | 6,625 | 88.3% |
| Two or more Races | 719 | 9.6% |
| Some other Race | 66 | 0.9% |
| Total | 7,501 | 100.0% |
Ancestry in Marshfield
The most populous ancestries reported in Marshfield are German (959 | 12.8%), American (767 | 10.2%), Irish (651 | 8.7%), English (511 | 6.8%), and French (109 | 1.5%), together accounting for 40.0% of all Marshfield residents.
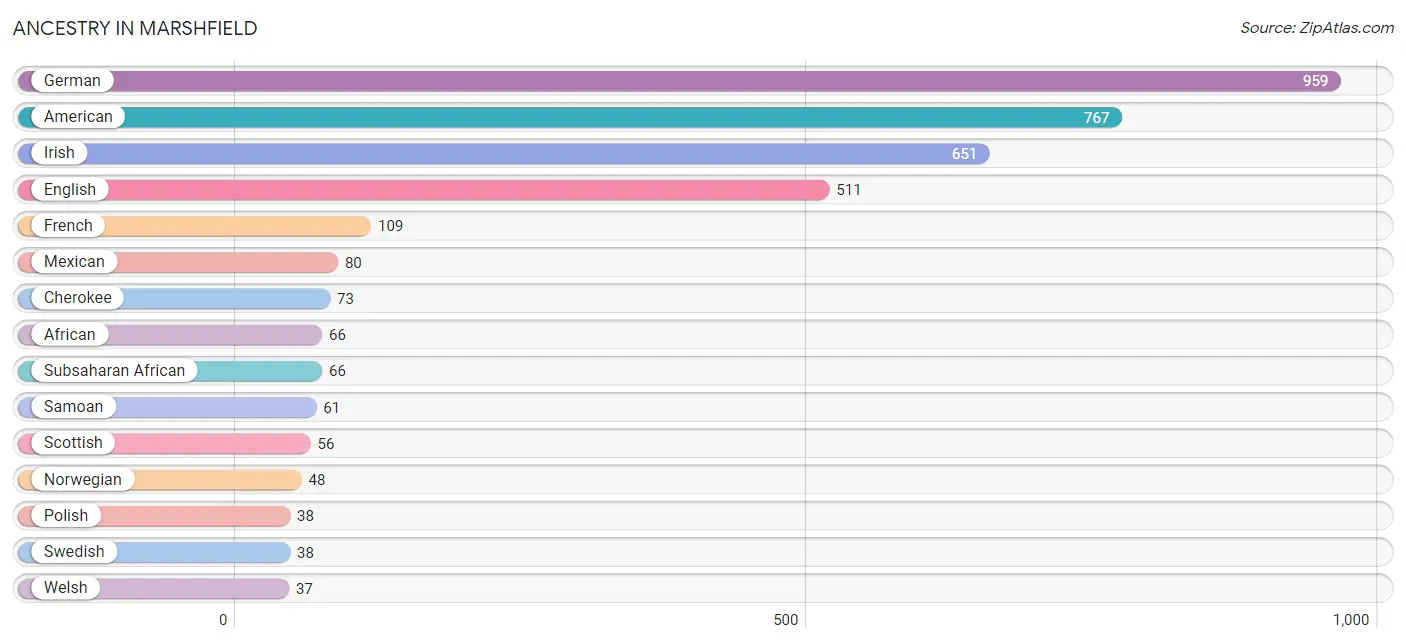
| Ancestry | # Population | % Population |
| African | 66 | 0.9% |
| American | 767 | 10.2% |
| Arab | 15 | 0.2% |
| British | 25 | 0.3% |
| Cherokee | 73 | 1.0% |
| Chickasaw | 7 | 0.1% |
| Choctaw | 4 | 0.1% |
| Creek | 9 | 0.1% |
| Czechoslovakian | 14 | 0.2% |
| English | 511 | 6.8% |
| European | 20 | 0.3% |
| French | 109 | 1.5% |
| German | 959 | 12.8% |
| Greek | 22 | 0.3% |
| Irish | 651 | 8.7% |
| Italian | 29 | 0.4% |
| Kiowa | 32 | 0.4% |
| Lebanese | 15 | 0.2% |
| Mexican | 80 | 1.1% |
| Norwegian | 48 | 0.6% |
| Polish | 38 | 0.5% |
| Portuguese | 14 | 0.2% |
| Puerto Rican | 9 | 0.1% |
| Russian | 27 | 0.4% |
| Samoan | 61 | 0.8% |
| Scotch-Irish | 19 | 0.3% |
| Scottish | 56 | 0.7% |
| Serbian | 14 | 0.2% |
| Sioux | 8 | 0.1% |
| Subsaharan African | 66 | 0.9% |
| Swedish | 38 | 0.5% |
| Ukrainian | 14 | 0.2% |
| Welsh | 37 | 0.5% | View All 33 Rows |
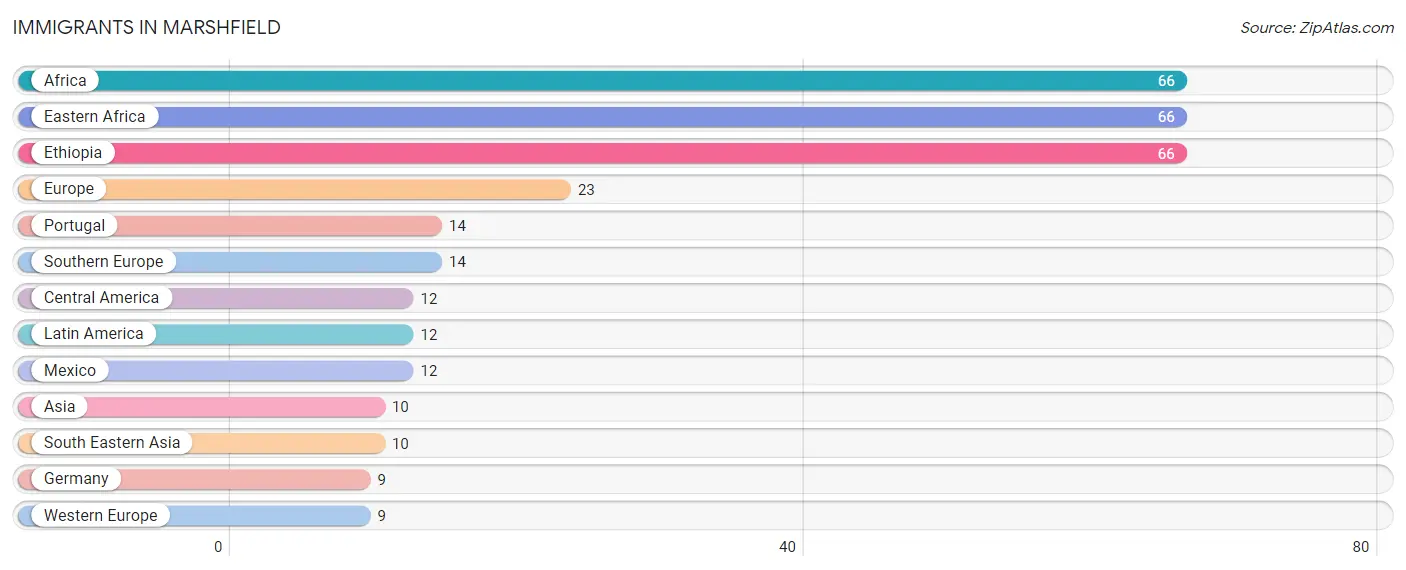
Immigrants in Marshfield
The most numerous immigrant groups reported in Marshfield came from Africa (66 | 0.9%), Eastern Africa (66 | 0.9%), Ethiopia (66 | 0.9%), Europe (23 | 0.3%), and Portugal (14 | 0.2%), together accounting for 3.1% of all Marshfield residents.
| Immigration Origin | # Population | % Population |
| Africa | 66 | 0.9% |
| Asia | 10 | 0.1% |
| Central America | 12 | 0.2% |
| Eastern Africa | 66 | 0.9% |
| Ethiopia | 66 | 0.9% |
| Europe | 23 | 0.3% |
| Germany | 9 | 0.1% |
| Latin America | 12 | 0.2% |
| Mexico | 12 | 0.2% |
| Portugal | 14 | 0.2% |
| South Eastern Asia | 10 | 0.1% |
| Southern Europe | 14 | 0.2% |
| Western Europe | 9 | 0.1% | View All 13 Rows |
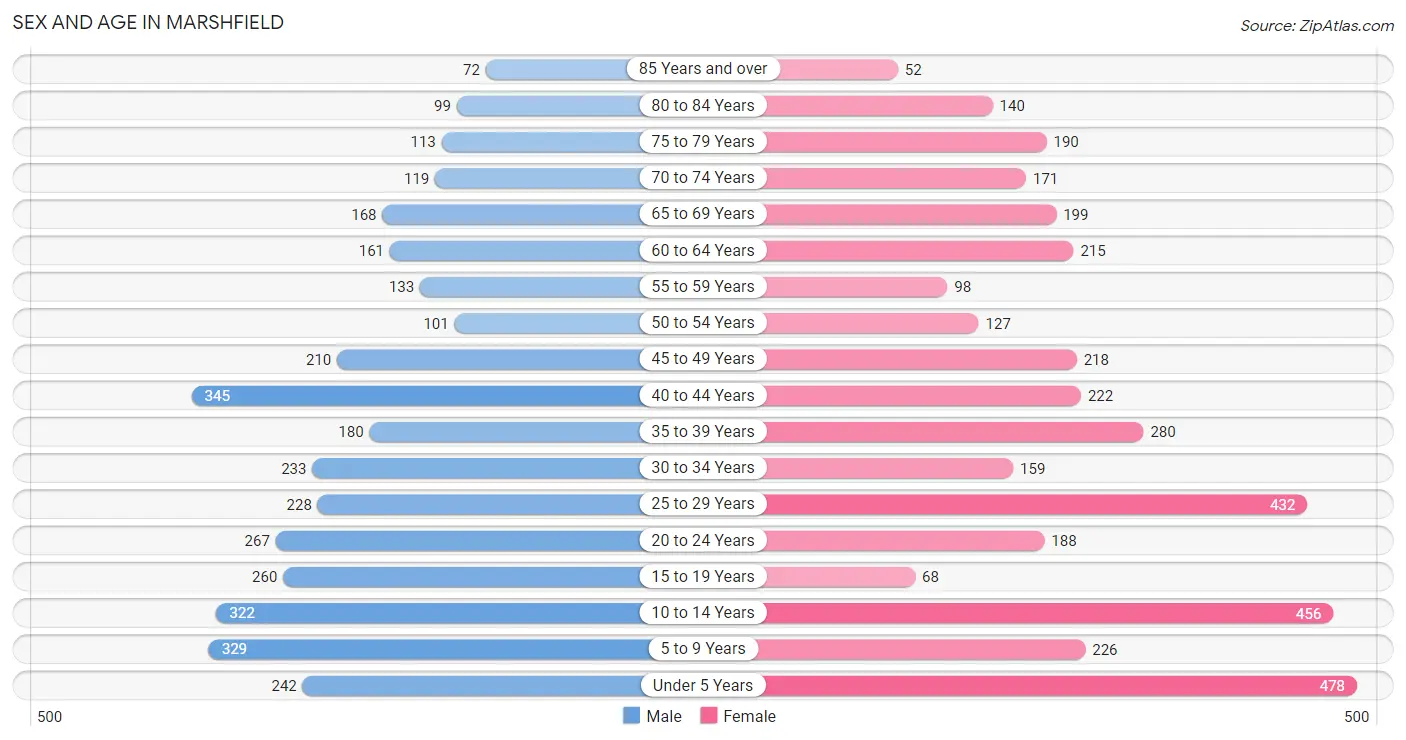
Sex and Age in Marshfield
Sex and Age in Marshfield
The most populous age groups in Marshfield are 40 to 44 Years (345 | 9.6%) for men and Under 5 Years (478 | 12.2%) for women.
| Age Bracket | Male | Female |
| Under 5 Years | 242 (6.8%) | 478 (12.2%) |
| 5 to 9 Years | 329 (9.2%) | 226 (5.8%) |
| 10 to 14 Years | 322 (9.0%) | 456 (11.6%) |
| 15 to 19 Years | 260 (7.3%) | 68 (1.7%) |
| 20 to 24 Years | 267 (7.4%) | 188 (4.8%) |
| 25 to 29 Years | 228 (6.4%) | 432 (11.0%) |
| 30 to 34 Years | 233 (6.5%) | 159 (4.1%) |
| 35 to 39 Years | 180 (5.0%) | 280 (7.1%) |
| 40 to 44 Years | 345 (9.6%) | 222 (5.7%) |
| 45 to 49 Years | 210 (5.9%) | 218 (5.6%) |
| 50 to 54 Years | 101 (2.8%) | 127 (3.2%) |
| 55 to 59 Years | 133 (3.7%) | 98 (2.5%) |
| 60 to 64 Years | 161 (4.5%) | 215 (5.5%) |
| 65 to 69 Years | 168 (4.7%) | 199 (5.1%) |
| 70 to 74 Years | 119 (3.3%) | 171 (4.4%) |
| 75 to 79 Years | 113 (3.2%) | 190 (4.9%) |
| 80 to 84 Years | 99 (2.8%) | 140 (3.6%) |
| 85 Years and over | 72 (2.0%) | 52 (1.3%) |
| Total | 3,582 (100.0%) | 3,919 (100.0%) |
Families and Households in Marshfield
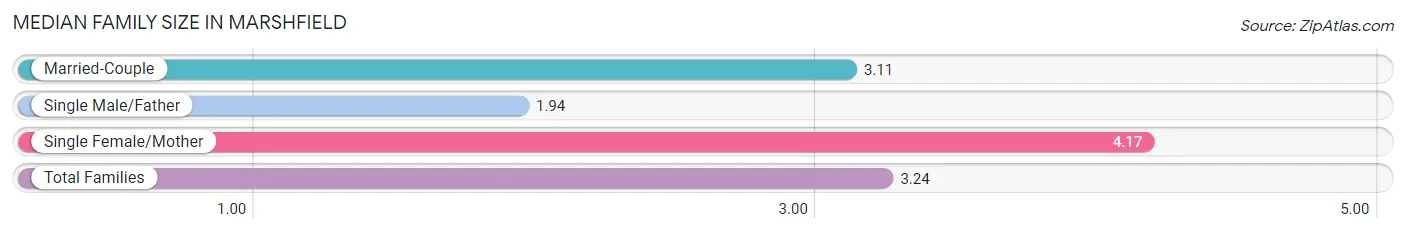
Median Family Size in Marshfield
The median family size in Marshfield is 3.24 persons per family, with single female/mother families (286 | 15.7%) accounting for the largest median family size of 4.17 persons per family. On the other hand, single male/father families (50 | 2.7%) represent the smallest median family size with 1.94 persons per family.
| Family Type | # Families | Family Size |
| Married-Couple | 1,491 (81.6%) | 3.11 |
| Single Male/Father | 50 (2.7%) | 1.94 |
| Single Female/Mother | 286 (15.7%) | 4.17 |
| Total Families | 1,827 (100.0%) | 3.24 |
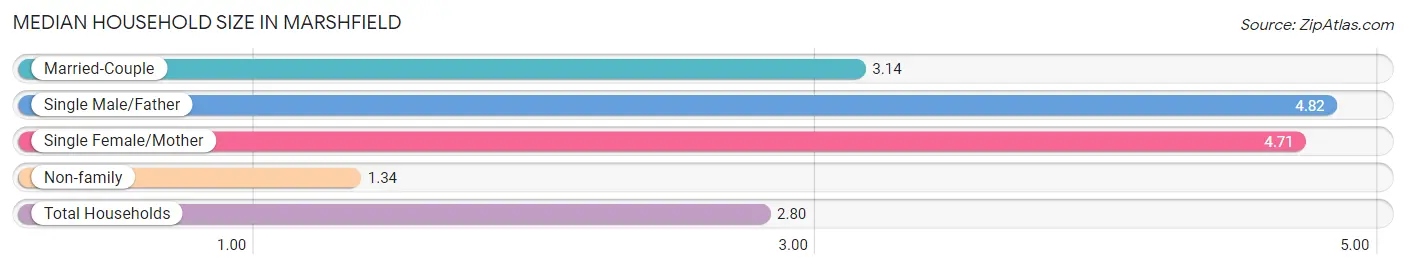
Median Household Size in Marshfield
The median household size in Marshfield is 2.80 persons per household, with single male/father households (50 | 1.9%) accounting for the largest median household size of 4.82 persons per household. non-family households (792 | 30.2%) represent the smallest median household size with 1.34 persons per household.
| Household Type | # Households | Household Size |
| Married-Couple | 1,491 (56.9%) | 3.14 |
| Single Male/Father | 50 (1.9%) | 4.82 |
| Single Female/Mother | 286 (10.9%) | 4.71 |
| Non-family | 792 (30.2%) | 1.34 |
| Total Households | 2,619 (100.0%) | 2.80 |
Household Size by Marriage Status in Marshfield
Out of a total of 2,619 households in Marshfield, 1,827 (69.8%) are family households, while 792 (30.2%) are nonfamily households. The most numerous type of family households are 2-person households, comprising 754, and the most common type of nonfamily households are 1-person households, comprising 655.
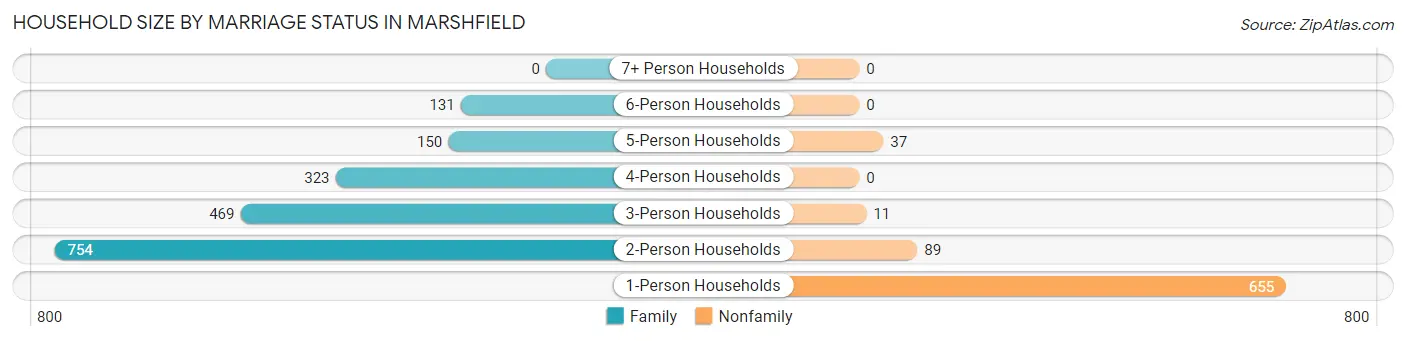
| Household Size | Family Households | Nonfamily Households |
| 1-Person Households | - | 655 (25.0%) |
| 2-Person Households | 754 (28.8%) | 89 (3.4%) |
| 3-Person Households | 469 (17.9%) | 11 (0.4%) |
| 4-Person Households | 323 (12.3%) | 0 (0.0%) |
| 5-Person Households | 150 (5.7%) | 37 (1.4%) |
| 6-Person Households | 131 (5.0%) | 0 (0.0%) |
| 7+ Person Households | 0 (0.0%) | 0 (0.0%) |
| Total | 1,827 (69.8%) | 792 (30.2%) |
Female Fertility in Marshfield
Fertility by Age in Marshfield
Average fertility rate in Marshfield is 97.0 births per 1,000 women. Women in the age bracket of 35 to 50 years have the highest fertility rate with 119.0 births per 1,000 women. Women in the age bracket of 35 to 50 years acount for 57.4% of all women with births.
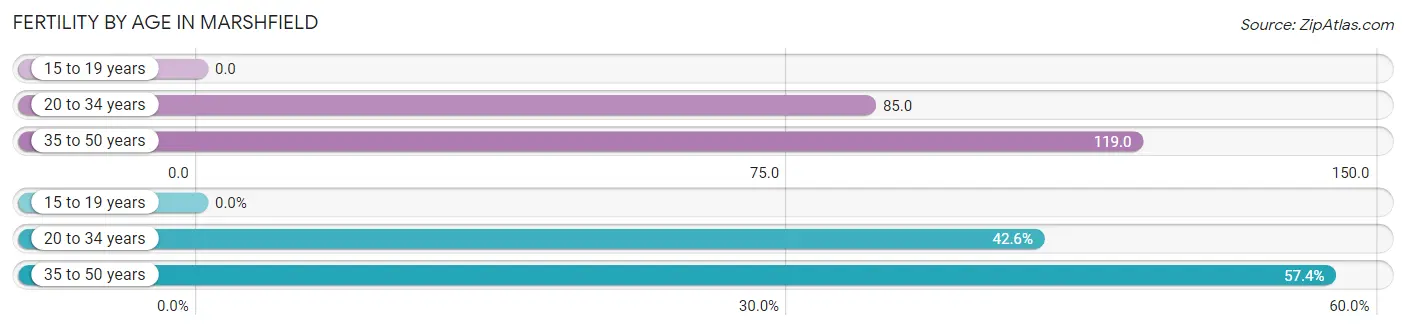
| Age Bracket | Women with Births | Births / 1,000 Women |
| 15 to 19 years | 0 (0.0%) | 0.0 |
| 20 to 34 years | 66 (42.6%) | 85.0 |
| 35 to 50 years | 89 (57.4%) | 119.0 |
| Total | 155 (100.0%) | 97.0 |
Fertility by Age by Marriage Status in Marshfield
78.7% of women with births (155) in Marshfield are married. The highest percentage of unmarried women with births falls into 20 to 34 years age bracket with 50.0% of them unmarried at the time of birth, while the lowest percentage of unmarried women with births belong to 35 to 50 years age bracket with 0.0% of them unmarried.
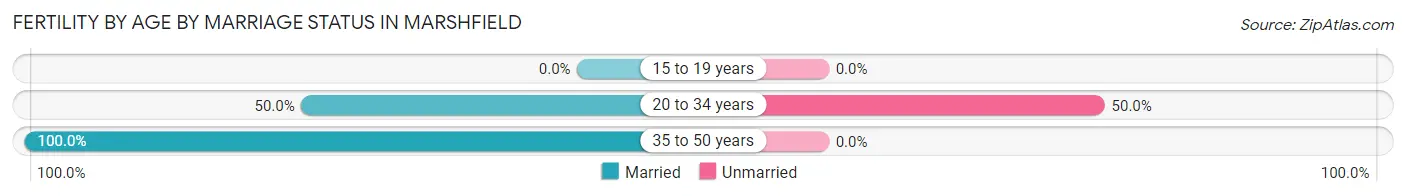
| Age Bracket | Married | Unmarried |
| 15 to 19 years | 0 (0.0%) | 0 (0.0%) |
| 20 to 34 years | 33 (50.0%) | 33 (50.0%) |
| 35 to 50 years | 89 (100.0%) | 0 (0.0%) |
| Total | 122 (78.7%) | 33 (21.3%) |
Fertility by Education in Marshfield
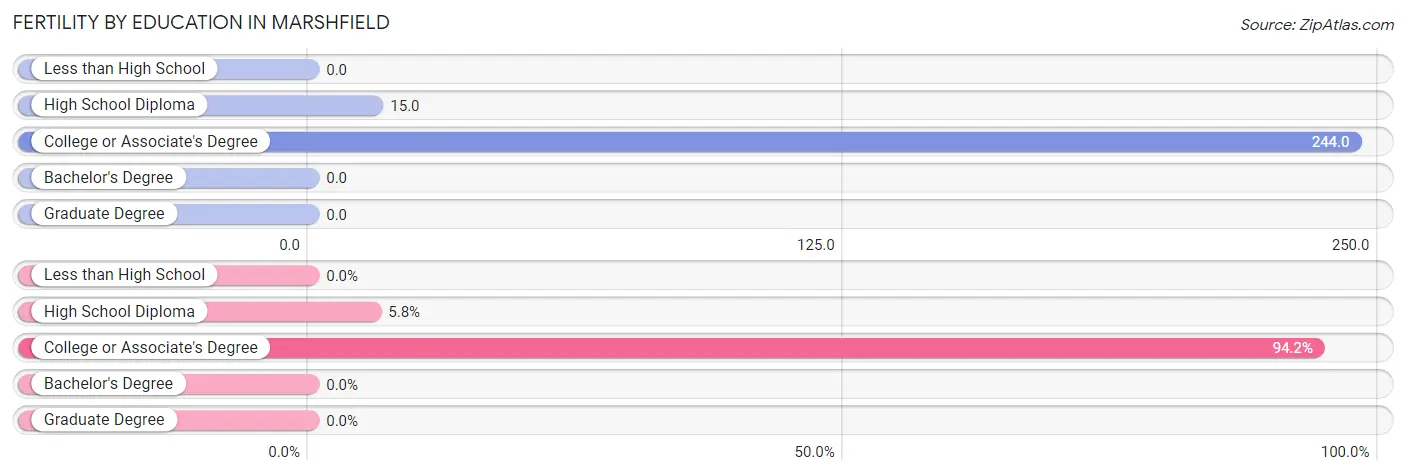
| Educational Attainment | Women with Births | Births / 1,000 Women |
| Less than High School | 0 (0.0%) | 0.0 |
| High School Diploma | 9 (5.8%) | 15.0 |
| College or Associate's Degree | 146 (94.2%) | 244.0 |
| Bachelor's Degree | 0 (0.0%) | 0.0 |
| Graduate Degree | 0 (0.0%) | 0.0 |
| Total | 155 (100.0%) | 97.0 |
Fertility by Education by Marriage Status in Marshfield
21.3% of women with births in Marshfield are unmarried. Women with the educational attainment of high school diploma are most likely to be married with 100.0% of them married at childbirth, while women with the educational attainment of college or associate's degree are least likely to be married with 22.6% of them unmarried at childbirth.
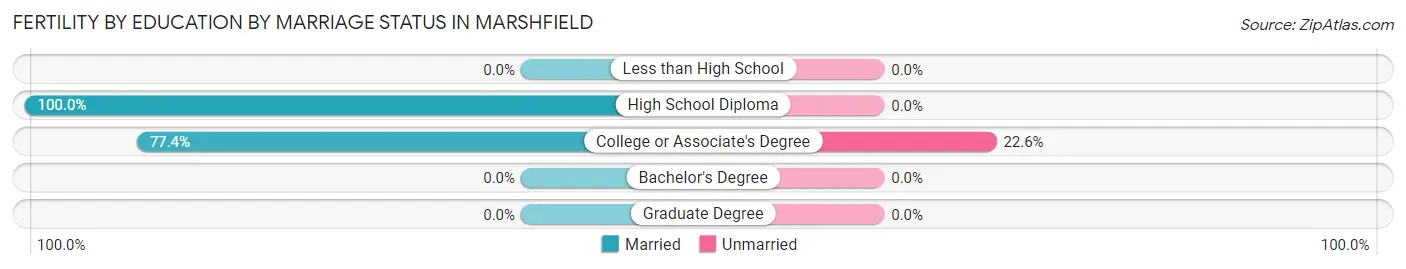
| Educational Attainment | Married | Unmarried |
| Less than High School | 0 (0.0%) | 0 (0.0%) |
| High School Diploma | 9 (100.0%) | 0 (0.0%) |
| College or Associate's Degree | 113 (77.4%) | 33 (22.6%) |
| Bachelor's Degree | 0 (0.0%) | 0 (0.0%) |
| Graduate Degree | 0 (0.0%) | 0 (0.0%) |
| Total | 122 (78.7%) | 33 (21.3%) |
Employment Characteristics in Marshfield
Employment by Class of Employer in Marshfield
Among the 2,935 employed individuals in Marshfield, private company employees (1,978 | 67.4%), not-for-profit organizations (272 | 9.3%), and local government employees (183 | 6.2%) make up the most common classes of employment.
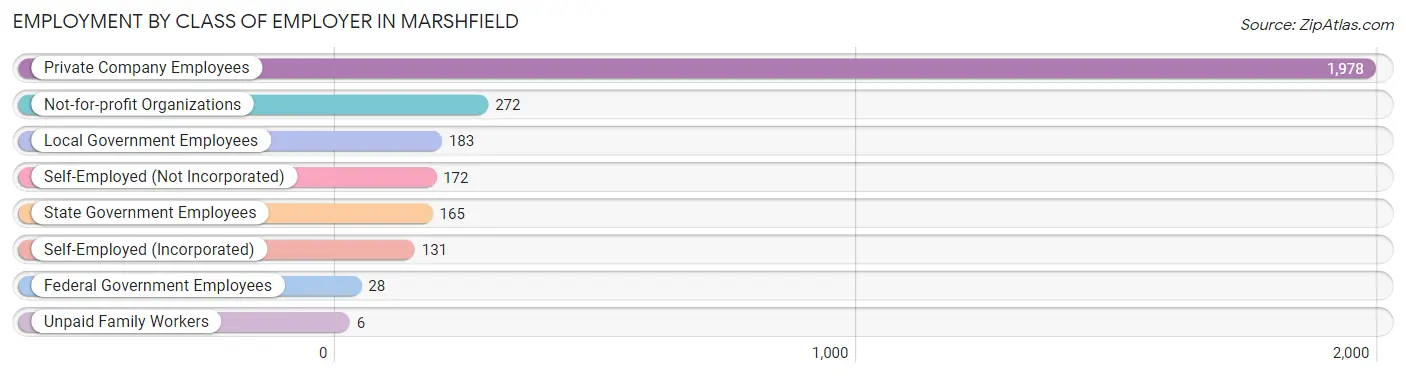
| Employer Class | # Employees | % Employees |
| Private Company Employees | 1,978 | 67.4% |
| Self-Employed (Incorporated) | 131 | 4.5% |
| Self-Employed (Not Incorporated) | 172 | 5.9% |
| Not-for-profit Organizations | 272 | 9.3% |
| Local Government Employees | 183 | 6.2% |
| State Government Employees | 165 | 5.6% |
| Federal Government Employees | 28 | 0.9% |
| Unpaid Family Workers | 6 | 0.2% |
| Total | 2,935 | 100.0% |
Employment Status by Age in Marshfield
According to the labor force statistics for Marshfield, out of the total population over 16 years of age (5,412), 58.4% or 3,161 individuals are in the labor force, with 5.4% or 171 of them unemployed. The age group with the highest labor force participation rate is 25 to 29 years, with 93.6% or 618 individuals in the labor force. Within the labor force, the 16 to 19 years age range has the highest percentage of unemployed individuals, with 29.4% or 37 of them being unemployed.
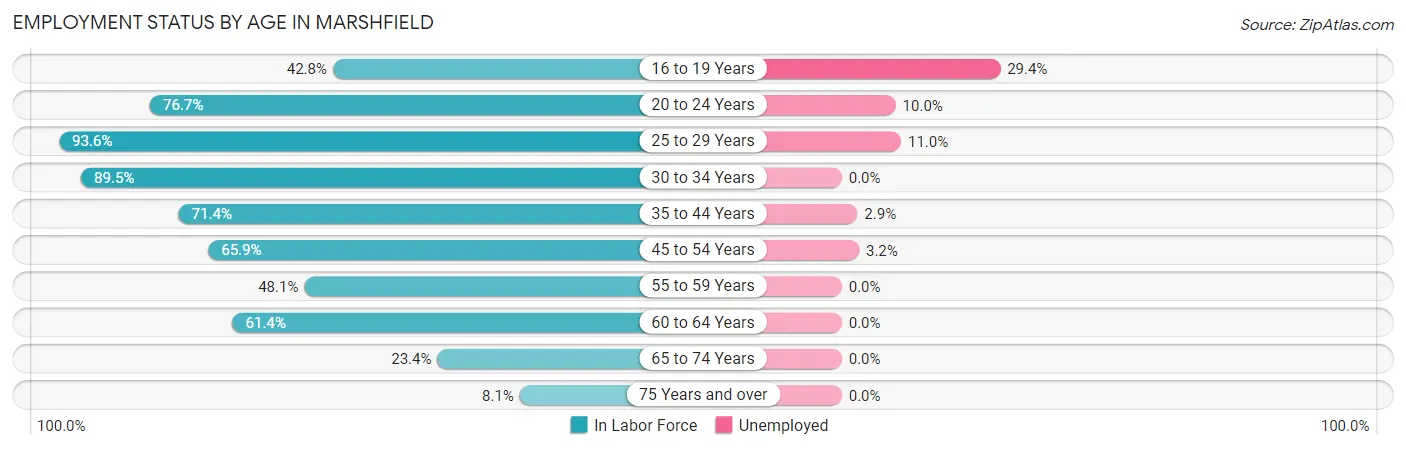
| Age Bracket | In Labor Force | Unemployed |
| 16 to 19 Years | 125 (42.8%) | 37 (29.4%) |
| 20 to 24 Years | 349 (76.7%) | 35 (10.0%) |
| 25 to 29 Years | 618 (93.6%) | 68 (11.0%) |
| 30 to 34 Years | 351 (89.5%) | 0 (0.0%) |
| 35 to 44 Years | 733 (71.4%) | 21 (2.9%) |
| 45 to 54 Years | 432 (65.9%) | 14 (3.2%) |
| 55 to 59 Years | 111 (48.1%) | 0 (0.0%) |
| 60 to 64 Years | 231 (61.4%) | 0 (0.0%) |
| 65 to 74 Years | 154 (23.4%) | 0 (0.0%) |
| 75 Years and over | 54 (8.1%) | 0 (0.0%) |
| Total | 3,161 (58.4%) | 171 (5.4%) |
Employment Status by Educational Attainment in Marshfield
According to labor force statistics for Marshfield, 74.1% of individuals (2,476) out of the total population between 25 and 64 years of age (3,342) are in the labor force, with 4.1% or 102 of them being unemployed. The group with the highest labor force participation rate are those with the educational attainment of bachelor's degree or higher, with 92.5% or 665 individuals in the labor force. Within the labor force, individuals with high school diploma education have the highest percentage of unemployment, with 7.8% or 74 of them being unemployed.
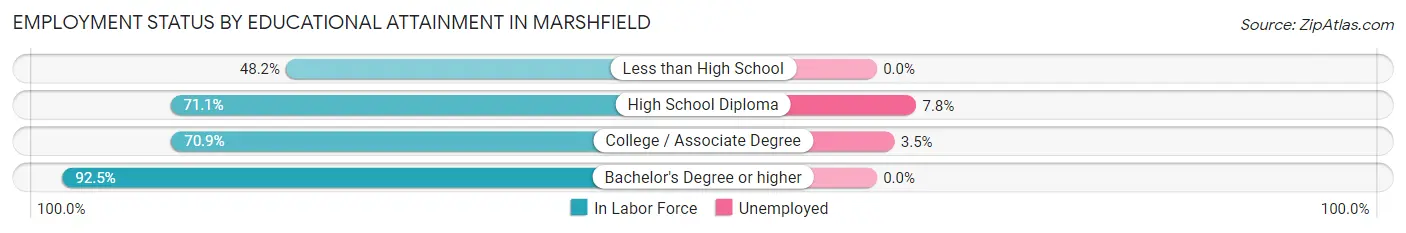
| Educational Attainment | In Labor Force | Unemployed |
| Less than High School | 110 (48.2%) | 0 (0.0%) |
| High School Diploma | 947 (71.1%) | 104 (7.8%) |
| College / Associate Degree | 754 (70.9%) | 37 (3.5%) |
| Bachelor's Degree or higher | 665 (92.5%) | 0 (0.0%) |
| Total | 2,476 (74.1%) | 137 (4.1%) |
Employment Occupations by Sex in Marshfield
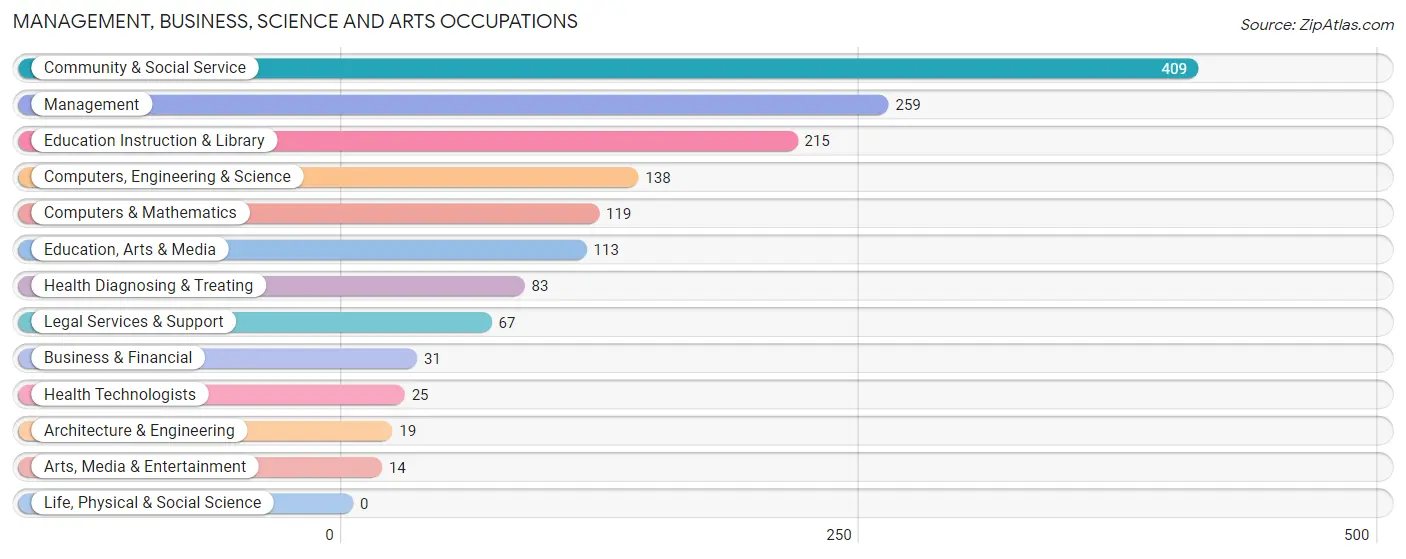
Management, Business, Science and Arts Occupations
The most common Management, Business, Science and Arts occupations in Marshfield are Community & Social Service (409 | 13.9%), Management (259 | 8.8%), Education Instruction & Library (215 | 7.3%), Computers, Engineering & Science (138 | 4.7%), and Computers & Mathematics (119 | 4.0%).
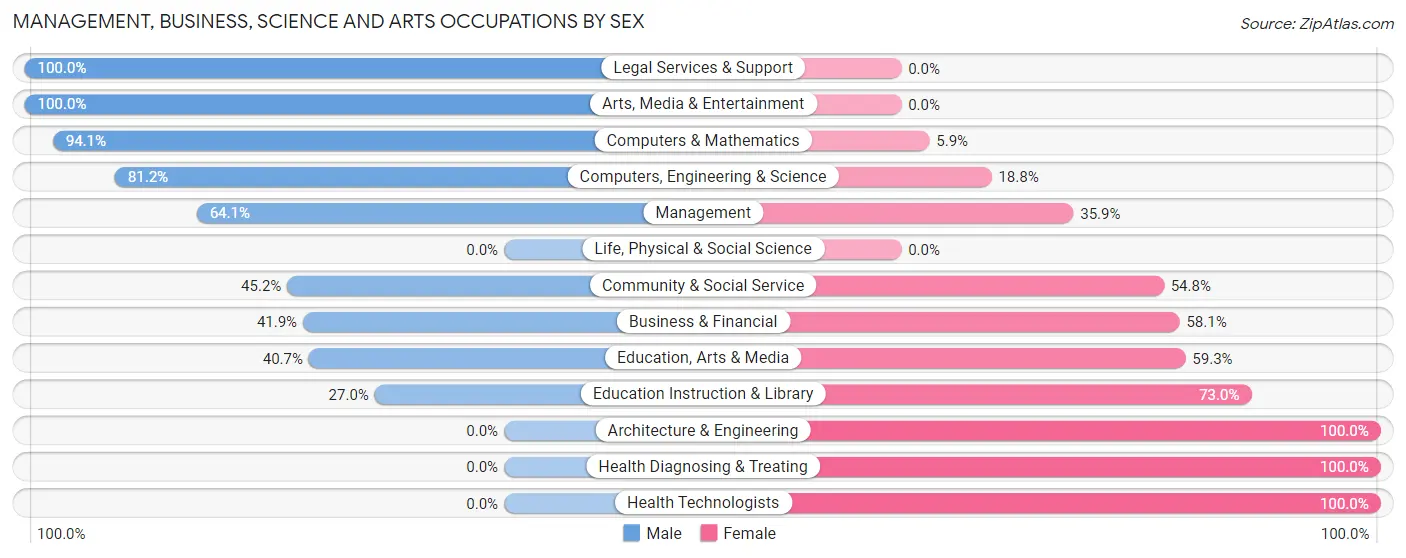
Management, Business, Science and Arts Occupations by Sex
Within the Management, Business, Science and Arts occupations in Marshfield, the most male-oriented occupations are Legal Services & Support (100.0%), Arts, Media & Entertainment (100.0%), and Computers & Mathematics (94.1%), while the most female-oriented occupations are Architecture & Engineering (100.0%), Health Diagnosing & Treating (100.0%), and Health Technologists (100.0%).
| Occupation | Male | Female |
| Management | 166 (64.1%) | 93 (35.9%) |
| Business & Financial | 13 (41.9%) | 18 (58.1%) |
| Computers, Engineering & Science | 112 (81.2%) | 26 (18.8%) |
| Computers & Mathematics | 112 (94.1%) | 7 (5.9%) |
| Architecture & Engineering | 0 (0.0%) | 19 (100.0%) |
| Life, Physical & Social Science | 0 (0.0%) | 0 (0.0%) |
| Community & Social Service | 185 (45.2%) | 224 (54.8%) |
| Education, Arts & Media | 46 (40.7%) | 67 (59.3%) |
| Legal Services & Support | 67 (100.0%) | 0 (0.0%) |
| Education Instruction & Library | 58 (27.0%) | 157 (73.0%) |
| Arts, Media & Entertainment | 14 (100.0%) | 0 (0.0%) |
| Health Diagnosing & Treating | 0 (0.0%) | 83 (100.0%) |
| Health Technologists | 0 (0.0%) | 25 (100.0%) |
| Total (Category) | 476 (51.7%) | 444 (48.3%) |
| Total (Overall) | 1,561 (53.0%) | 1,386 (47.0%) |
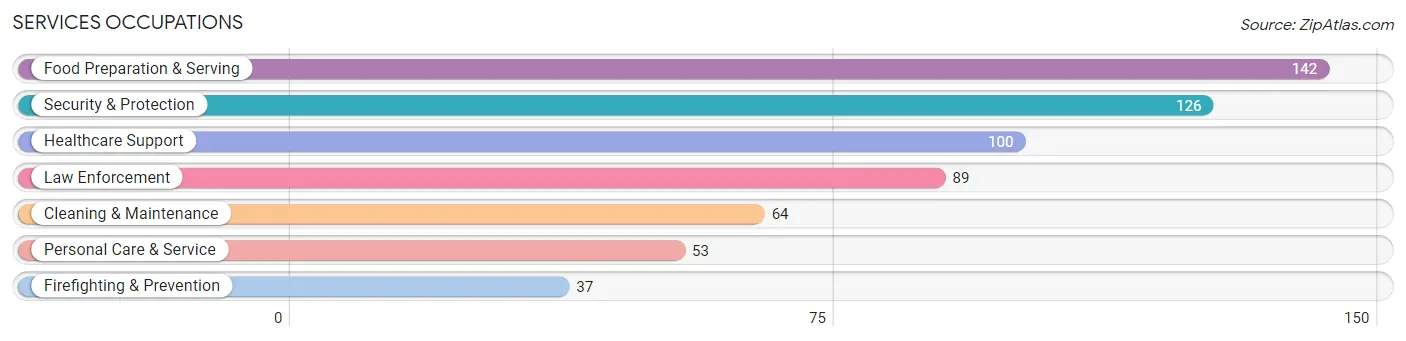
Services Occupations
The most common Services occupations in Marshfield are Food Preparation & Serving (142 | 4.8%), Security & Protection (126 | 4.3%), Healthcare Support (100 | 3.4%), Law Enforcement (89 | 3.0%), and Cleaning & Maintenance (64 | 2.2%).
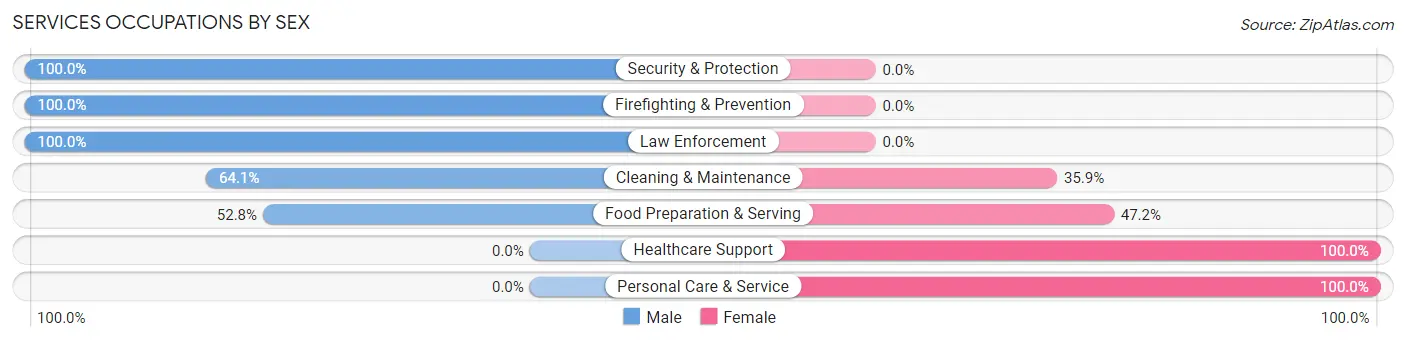
Services Occupations by Sex
Within the Services occupations in Marshfield, the most male-oriented occupations are Security & Protection (100.0%), Firefighting & Prevention (100.0%), and Law Enforcement (100.0%), while the most female-oriented occupations are Healthcare Support (100.0%), Personal Care & Service (100.0%), and Food Preparation & Serving (47.2%).
| Occupation | Male | Female |
| Healthcare Support | 0 (0.0%) | 100 (100.0%) |
| Security & Protection | 126 (100.0%) | 0 (0.0%) |
| Firefighting & Prevention | 37 (100.0%) | 0 (0.0%) |
| Law Enforcement | 89 (100.0%) | 0 (0.0%) |
| Food Preparation & Serving | 75 (52.8%) | 67 (47.2%) |
| Cleaning & Maintenance | 41 (64.1%) | 23 (35.9%) |
| Personal Care & Service | 0 (0.0%) | 53 (100.0%) |
| Total (Category) | 242 (49.9%) | 243 (50.1%) |
| Total (Overall) | 1,561 (53.0%) | 1,386 (47.0%) |
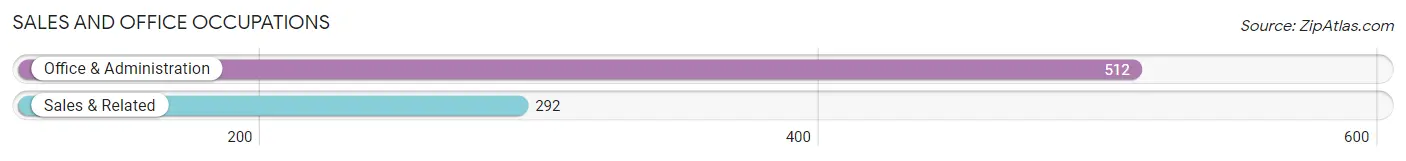
Sales and Office Occupations
The most common Sales and Office occupations in Marshfield are Office & Administration (512 | 17.4%), and Sales & Related (292 | 9.9%).
Sales and Office Occupations by Sex
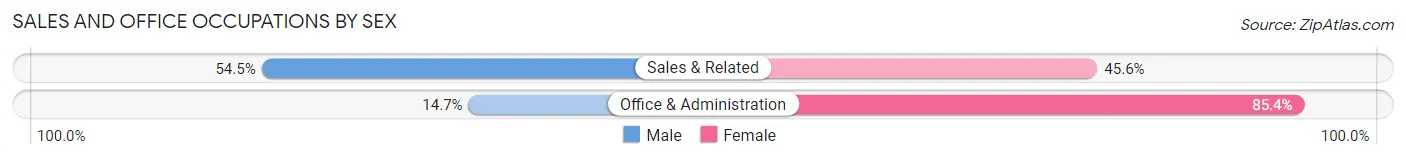
| Occupation | Male | Female |
| Sales & Related | 159 (54.4%) | 133 (45.6%) |
| Office & Administration | 75 (14.6%) | 437 (85.4%) |
| Total (Category) | 234 (29.1%) | 570 (70.9%) |
| Total (Overall) | 1,561 (53.0%) | 1,386 (47.0%) |
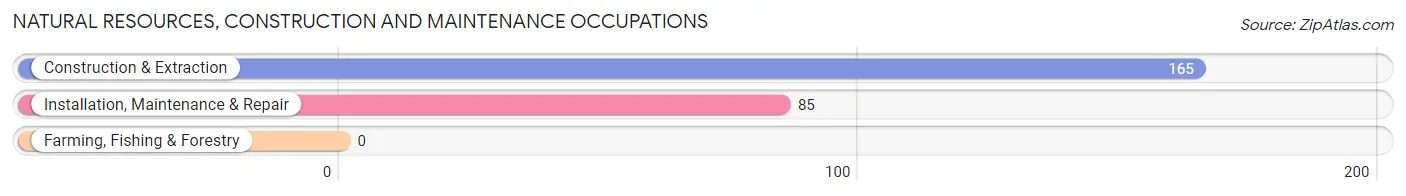
Natural Resources, Construction and Maintenance Occupations
The most common Natural Resources, Construction and Maintenance occupations in Marshfield are Construction & Extraction (165 | 5.6%), and Installation, Maintenance & Repair (85 | 2.9%).
Natural Resources, Construction and Maintenance Occupations by Sex
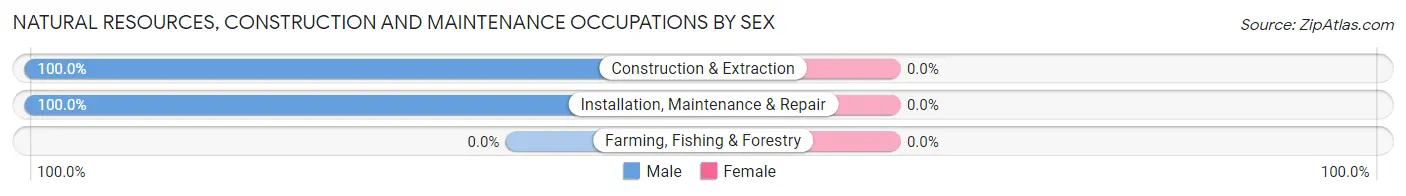
| Occupation | Male | Female |
| Farming, Fishing & Forestry | 0 (0.0%) | 0 (0.0%) |
| Construction & Extraction | 165 (100.0%) | 0 (0.0%) |
| Installation, Maintenance & Repair | 85 (100.0%) | 0 (0.0%) |
| Total (Category) | 250 (100.0%) | 0 (0.0%) |
| Total (Overall) | 1,561 (53.0%) | 1,386 (47.0%) |
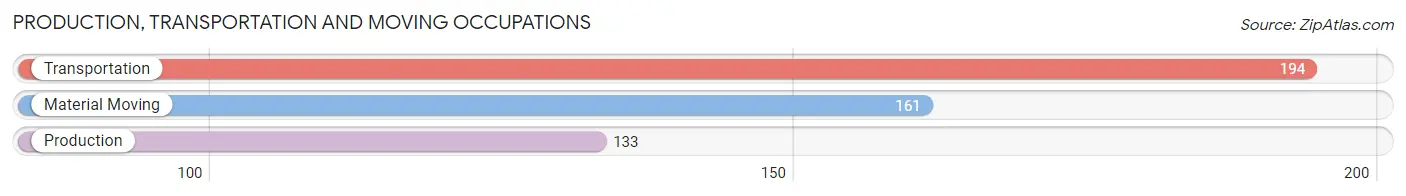
Production, Transportation and Moving Occupations
The most common Production, Transportation and Moving occupations in Marshfield are Transportation (194 | 6.6%), Material Moving (161 | 5.5%), and Production (133 | 4.5%).
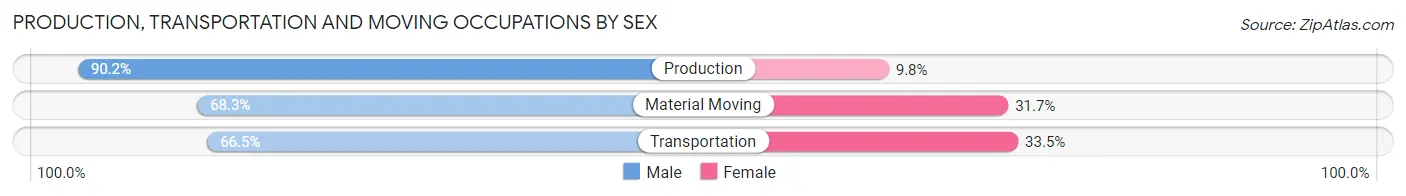
Production, Transportation and Moving Occupations by Sex
| Occupation | Male | Female |
| Production | 120 (90.2%) | 13 (9.8%) |
| Transportation | 129 (66.5%) | 65 (33.5%) |
| Material Moving | 110 (68.3%) | 51 (31.7%) |
| Total (Category) | 359 (73.6%) | 129 (26.4%) |
| Total (Overall) | 1,561 (53.0%) | 1,386 (47.0%) |
Employment Industries by Sex in Marshfield
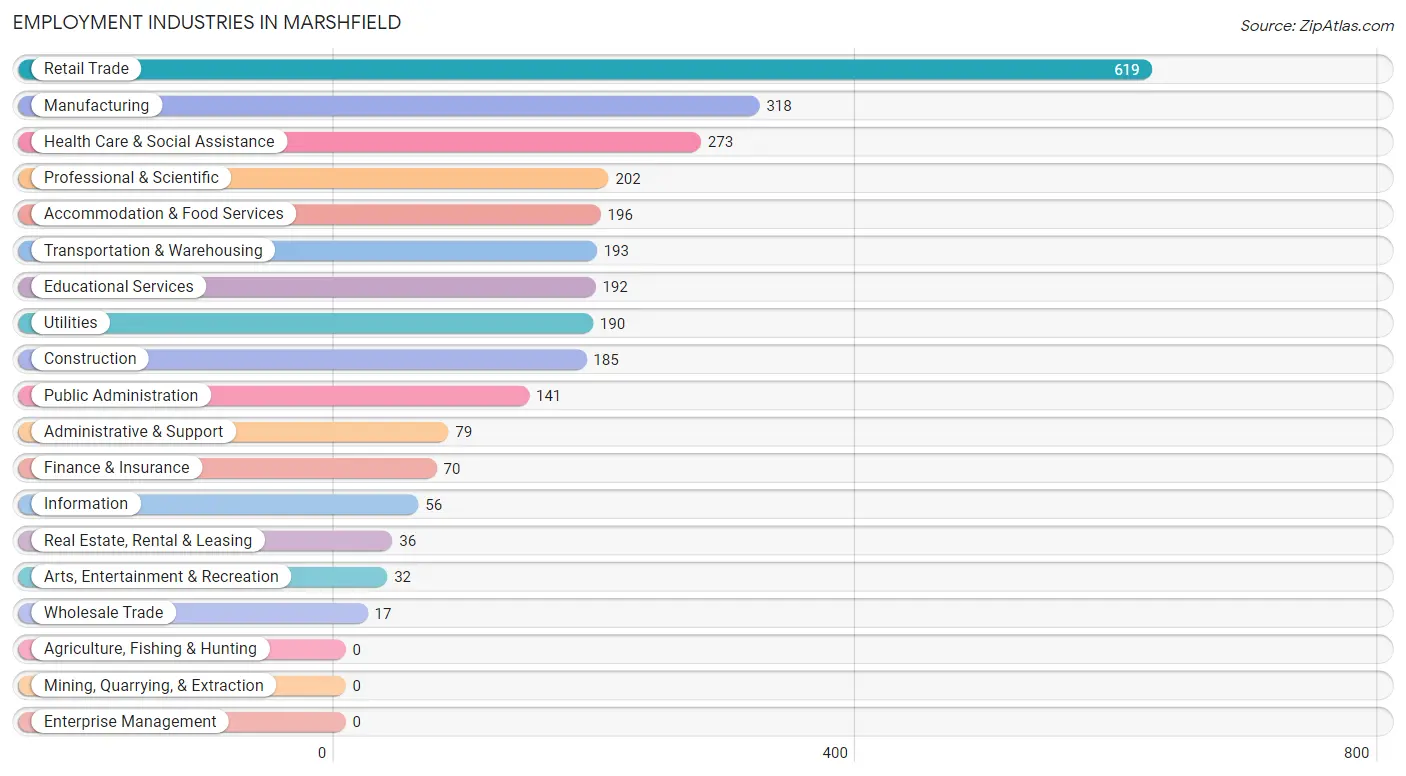
Employment Industries in Marshfield
The major employment industries in Marshfield include Retail Trade (619 | 21.0%), Manufacturing (318 | 10.8%), Health Care & Social Assistance (273 | 9.3%), Professional & Scientific (202 | 6.9%), and Accommodation & Food Services (196 | 6.7%).
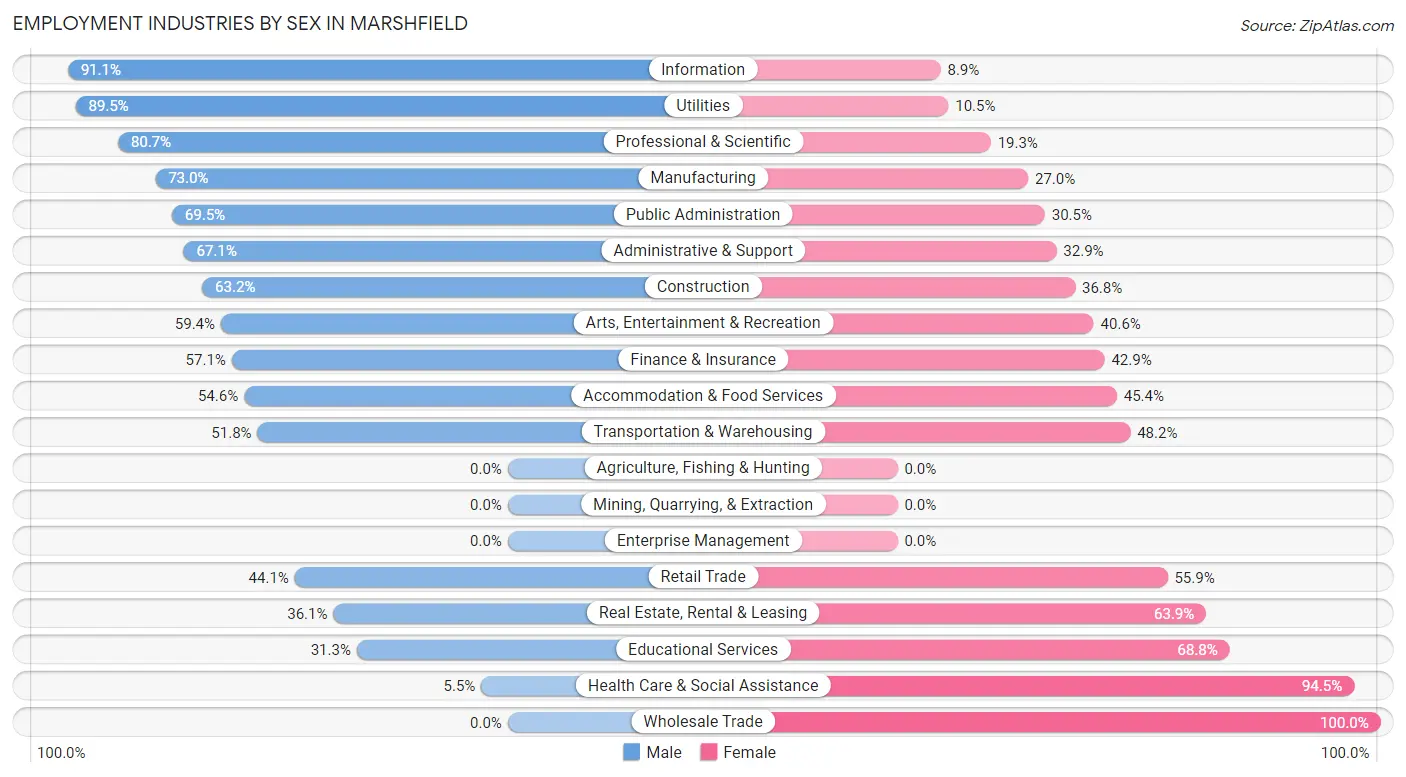
Employment Industries by Sex in Marshfield
The Marshfield industries that see more men than women are Information (91.1%), Utilities (89.5%), and Professional & Scientific (80.7%), whereas the industries that tend to have a higher number of women are Wholesale Trade (100.0%), Health Care & Social Assistance (94.5%), and Educational Services (68.8%).
| Industry | Male | Female |
| Agriculture, Fishing & Hunting | 0 (0.0%) | 0 (0.0%) |
| Mining, Quarrying, & Extraction | 0 (0.0%) | 0 (0.0%) |
| Construction | 117 (63.2%) | 68 (36.8%) |
| Manufacturing | 232 (73.0%) | 86 (27.0%) |
| Wholesale Trade | 0 (0.0%) | 17 (100.0%) |
| Retail Trade | 273 (44.1%) | 346 (55.9%) |
| Transportation & Warehousing | 100 (51.8%) | 93 (48.2%) |
| Utilities | 170 (89.5%) | 20 (10.5%) |
| Information | 51 (91.1%) | 5 (8.9%) |
| Finance & Insurance | 40 (57.1%) | 30 (42.9%) |
| Real Estate, Rental & Leasing | 13 (36.1%) | 23 (63.9%) |
| Professional & Scientific | 163 (80.7%) | 39 (19.3%) |
| Enterprise Management | 0 (0.0%) | 0 (0.0%) |
| Administrative & Support | 53 (67.1%) | 26 (32.9%) |
| Educational Services | 60 (31.2%) | 132 (68.8%) |
| Health Care & Social Assistance | 15 (5.5%) | 258 (94.5%) |
| Arts, Entertainment & Recreation | 19 (59.4%) | 13 (40.6%) |
| Accommodation & Food Services | 107 (54.6%) | 89 (45.4%) |
| Public Administration | 98 (69.5%) | 43 (30.5%) |
| Total | 1,561 (53.0%) | 1,386 (47.0%) |
Education in Marshfield
School Enrollment in Marshfield
The most common levels of schooling among the 1,910 students in Marshfield are middle school (644 | 33.7%), high school (308 | 16.1%), and elementary school (302 | 15.8%).
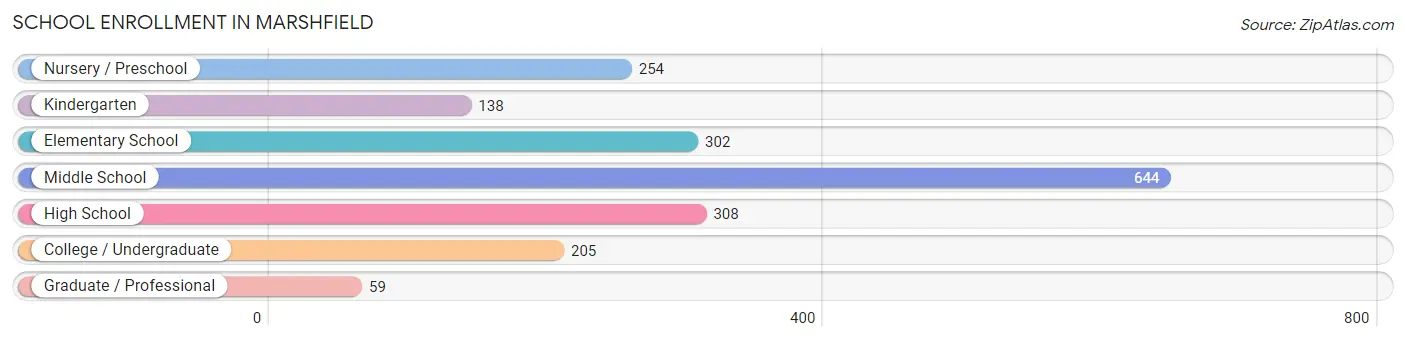
| School Level | # Students | % Students |
| Nursery / Preschool | 254 | 13.3% |
| Kindergarten | 138 | 7.2% |
| Elementary School | 302 | 15.8% |
| Middle School | 644 | 33.7% |
| High School | 308 | 16.1% |
| College / Undergraduate | 205 | 10.7% |
| Graduate / Professional | 59 | 3.1% |
| Total | 1,910 | 100.0% |
School Enrollment by Age by Funding Source in Marshfield
Out of a total of 1,910 students who are enrolled in schools in Marshfield, 155 (8.1%) attend a private institution, while the remaining 1,755 (91.9%) are enrolled in public schools. The age group of 35 years and over has the highest likelihood of being enrolled in private schools, with 20 (76.9% in the age bracket) enrolled. Conversely, the age group of 15 to 17 year olds has the lowest likelihood of being enrolled in a private school, with 138 (100.0% in the age bracket) attending a public institution.
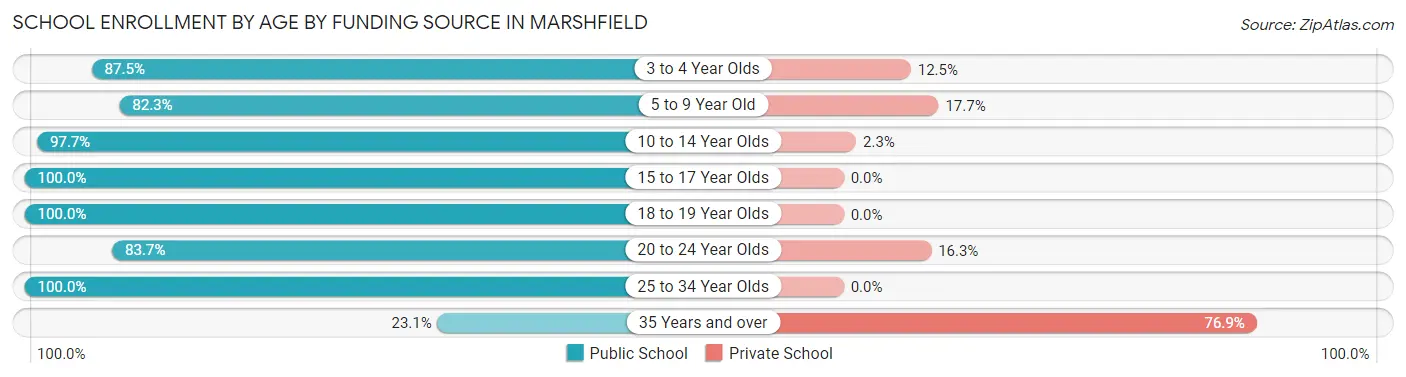
| Age Bracket | Public School | Private School |
| 3 to 4 Year Olds | 189 (87.5%) | 27 (12.5%) |
| 5 to 9 Year Old | 345 (82.3%) | 74 (17.7%) |
| 10 to 14 Year Olds | 760 (97.7%) | 18 (2.3%) |
| 15 to 17 Year Olds | 138 (100.0%) | 0 (0.0%) |
| 18 to 19 Year Olds | 118 (100.0%) | 0 (0.0%) |
| 20 to 24 Year Olds | 77 (83.7%) | 15 (16.3%) |
| 25 to 34 Year Olds | 123 (100.0%) | 0 (0.0%) |
| 35 Years and over | 6 (23.1%) | 20 (76.9%) |
| Total | 1,755 (91.9%) | 155 (8.1%) |
Educational Attainment by Field of Study in Marshfield
Education (282 | 29.8%), business (165 | 17.4%), computers & mathematics (132 | 14.0%), arts & humanities (91 | 9.6%), and social sciences (58 | 6.1%) are the most common fields of study among 946 individuals in Marshfield who have obtained a bachelor's degree or higher.
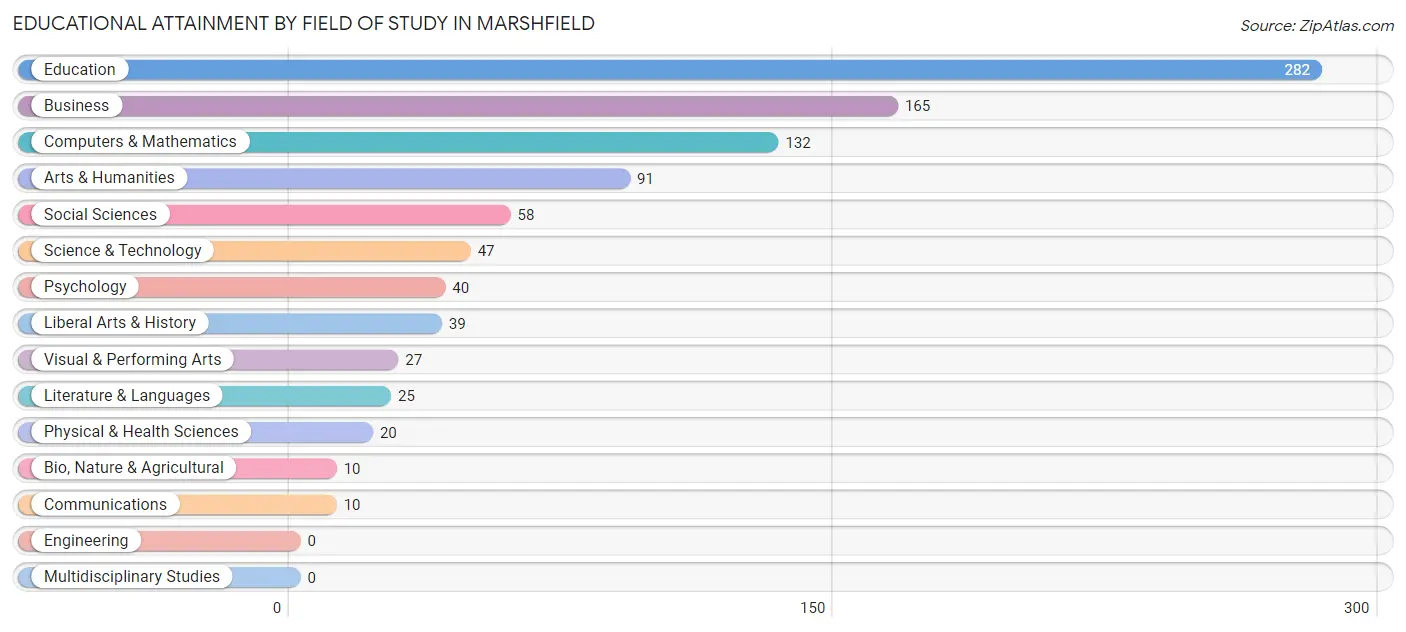
| Field of Study | # Graduates | % Graduates |
| Computers & Mathematics | 132 | 14.0% |
| Bio, Nature & Agricultural | 10 | 1.1% |
| Physical & Health Sciences | 20 | 2.1% |
| Psychology | 40 | 4.2% |
| Social Sciences | 58 | 6.1% |
| Engineering | 0 | 0.0% |
| Multidisciplinary Studies | 0 | 0.0% |
| Science & Technology | 47 | 5.0% |
| Business | 165 | 17.4% |
| Education | 282 | 29.8% |
| Literature & Languages | 25 | 2.6% |
| Liberal Arts & History | 39 | 4.1% |
| Visual & Performing Arts | 27 | 2.9% |
| Communications | 10 | 1.1% |
| Arts & Humanities | 91 | 9.6% |
| Total | 946 | 100.0% |
Transportation & Commute in Marshfield
Vehicle Availability by Sex in Marshfield
The most prevalent vehicle ownership categories in Marshfield are males with 2 vehicles (957, accounting for 59.7%) and females with 2 vehicles (714, making up 71.9%).
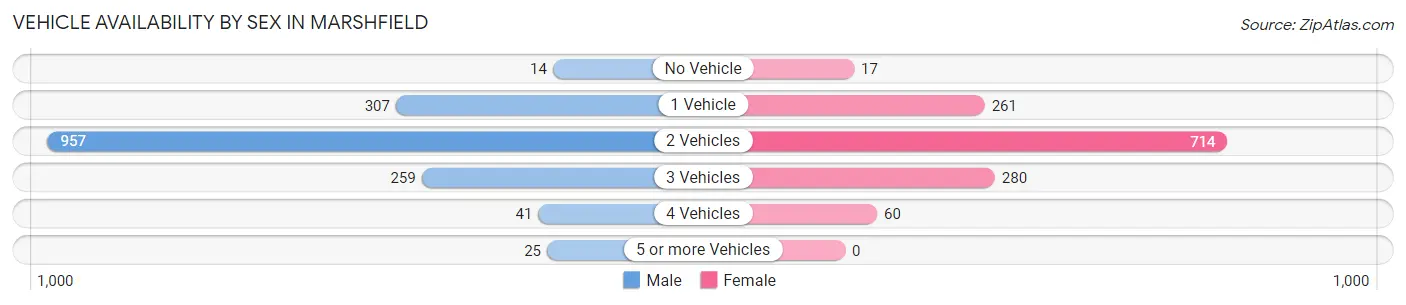
| Vehicles Available | Male | Female |
| No Vehicle | 14 (0.9%) | 17 (1.3%) |
| 1 Vehicle | 307 (19.2%) | 261 (19.6%) |
| 2 Vehicles | 957 (59.7%) | 714 (53.6%) |
| 3 Vehicles | 259 (16.2%) | 280 (21.0%) |
| 4 Vehicles | 41 (2.6%) | 60 (4.5%) |
| 5 or more Vehicles | 25 (1.6%) | 0 (0.0%) |
| Total | 1,603 (100.0%) | 1,332 (100.0%) |
Commute Time in Marshfield
The most frequently occuring commute durations in Marshfield are 5 to 9 minutes (817 commuters, 29.0%), 30 to 34 minutes (550 commuters, 19.6%), and 45 to 59 minutes (318 commuters, 11.3%).
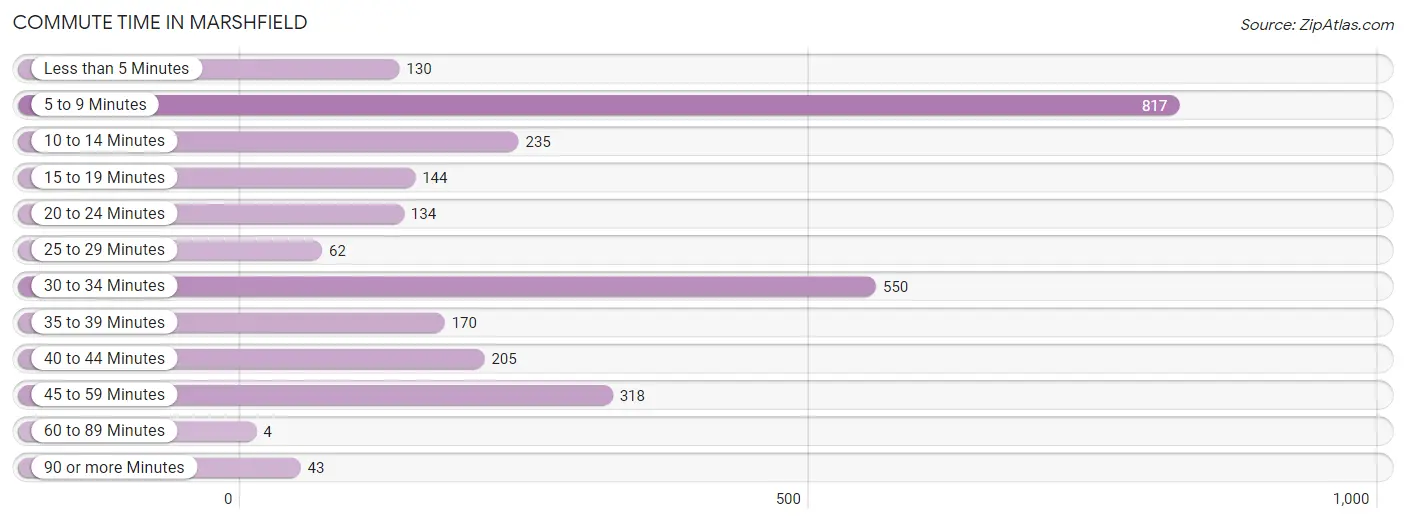
| Commute Time | # Commuters | % Commuters |
| Less than 5 Minutes | 130 | 4.6% |
| 5 to 9 Minutes | 817 | 29.0% |
| 10 to 14 Minutes | 235 | 8.4% |
| 15 to 19 Minutes | 144 | 5.1% |
| 20 to 24 Minutes | 134 | 4.8% |
| 25 to 29 Minutes | 62 | 2.2% |
| 30 to 34 Minutes | 550 | 19.6% |
| 35 to 39 Minutes | 170 | 6.0% |
| 40 to 44 Minutes | 205 | 7.3% |
| 45 to 59 Minutes | 318 | 11.3% |
| 60 to 89 Minutes | 4 | 0.1% |
| 90 or more Minutes | 43 | 1.5% |
Commute Time by Sex in Marshfield
The most common commute times in Marshfield are 5 to 9 minutes (426 commuters, 26.8%) for males and 5 to 9 minutes (391 commuters, 32.0%) for females.
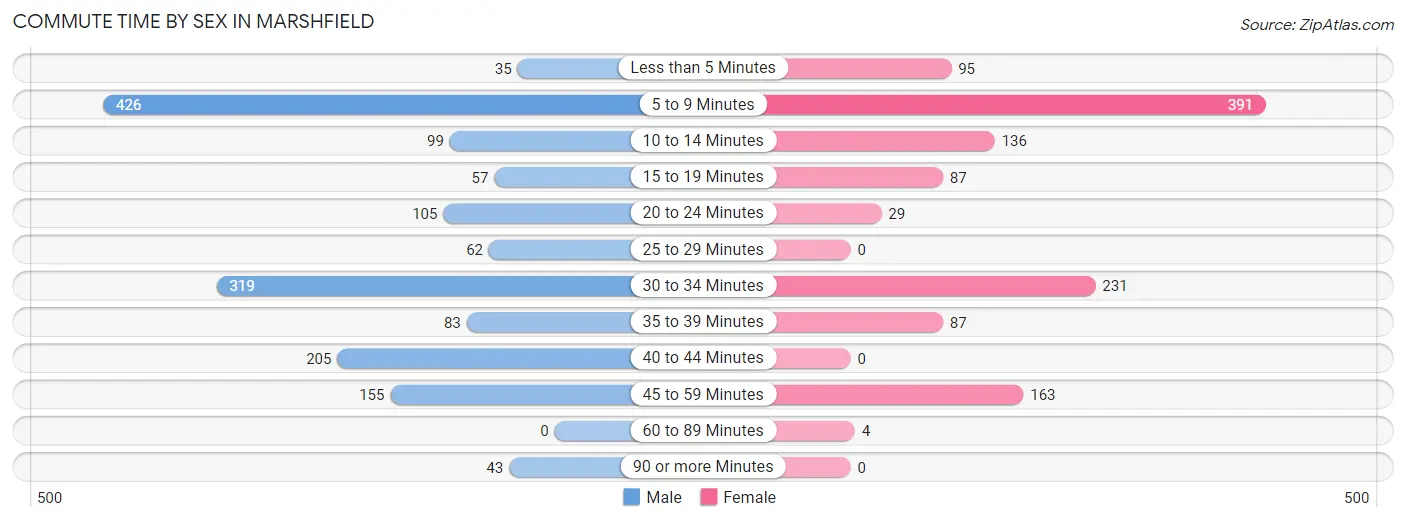
| Commute Time | Male | Female |
| Less than 5 Minutes | 35 (2.2%) | 95 (7.8%) |
| 5 to 9 Minutes | 426 (26.8%) | 391 (32.0%) |
| 10 to 14 Minutes | 99 (6.2%) | 136 (11.1%) |
| 15 to 19 Minutes | 57 (3.6%) | 87 (7.1%) |
| 20 to 24 Minutes | 105 (6.6%) | 29 (2.4%) |
| 25 to 29 Minutes | 62 (3.9%) | 0 (0.0%) |
| 30 to 34 Minutes | 319 (20.1%) | 231 (18.9%) |
| 35 to 39 Minutes | 83 (5.2%) | 87 (7.1%) |
| 40 to 44 Minutes | 205 (12.9%) | 0 (0.0%) |
| 45 to 59 Minutes | 155 (9.8%) | 163 (13.3%) |
| 60 to 89 Minutes | 0 (0.0%) | 4 (0.3%) |
| 90 or more Minutes | 43 (2.7%) | 0 (0.0%) |
Time of Departure to Work by Sex in Marshfield
The most frequent times of departure to work in Marshfield are 6:30 AM to 6:59 AM (295, 18.6%) for males and 7:00 AM to 7:29 AM (247, 20.2%) for females.
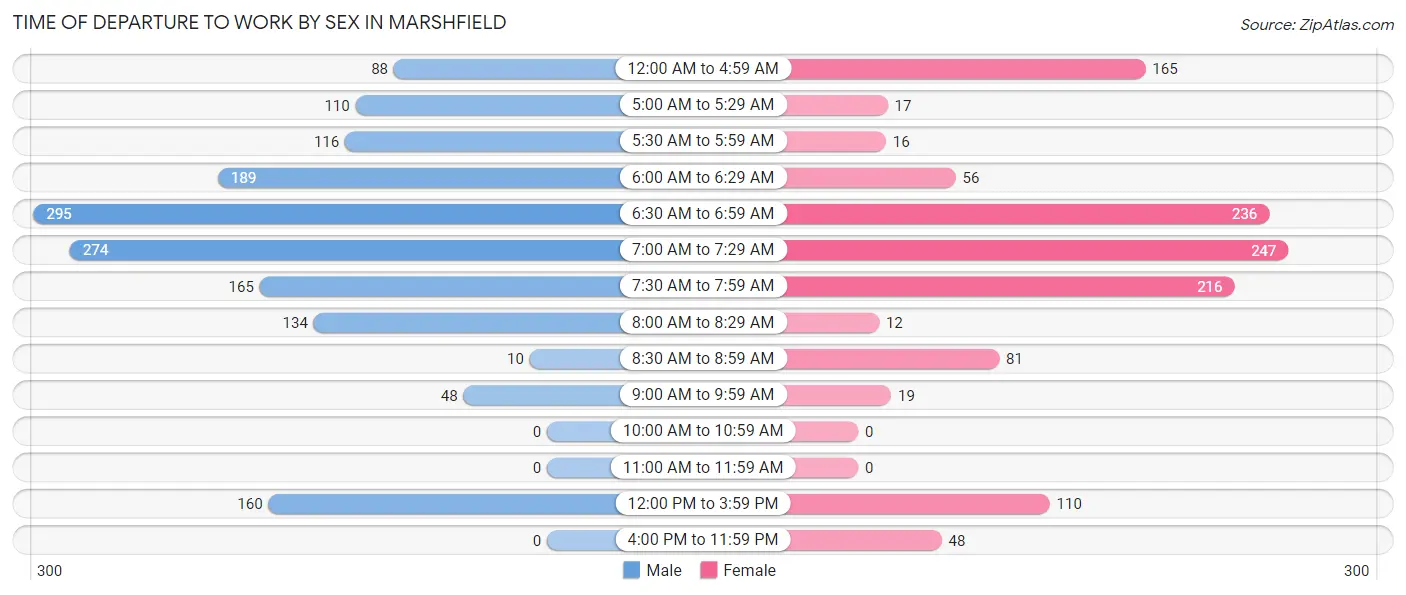
| Time of Departure | Male | Female |
| 12:00 AM to 4:59 AM | 88 (5.5%) | 165 (13.5%) |
| 5:00 AM to 5:29 AM | 110 (6.9%) | 17 (1.4%) |
| 5:30 AM to 5:59 AM | 116 (7.3%) | 16 (1.3%) |
| 6:00 AM to 6:29 AM | 189 (11.9%) | 56 (4.6%) |
| 6:30 AM to 6:59 AM | 295 (18.6%) | 236 (19.3%) |
| 7:00 AM to 7:29 AM | 274 (17.2%) | 247 (20.2%) |
| 7:30 AM to 7:59 AM | 165 (10.4%) | 216 (17.7%) |
| 8:00 AM to 8:29 AM | 134 (8.4%) | 12 (1.0%) |
| 8:30 AM to 8:59 AM | 10 (0.6%) | 81 (6.6%) |
| 9:00 AM to 9:59 AM | 48 (3.0%) | 19 (1.5%) |
| 10:00 AM to 10:59 AM | 0 (0.0%) | 0 (0.0%) |
| 11:00 AM to 11:59 AM | 0 (0.0%) | 0 (0.0%) |
| 12:00 PM to 3:59 PM | 160 (10.1%) | 110 (9.0%) |
| 4:00 PM to 11:59 PM | 0 (0.0%) | 48 (3.9%) |
| Total | 1,589 (100.0%) | 1,223 (100.0%) |
Housing Occupancy in Marshfield
Occupancy by Ownership in Marshfield
Of the total 2,619 dwellings in Marshfield, owner-occupied units account for 1,517 (57.9%), while renter-occupied units make up 1,102 (42.1%).
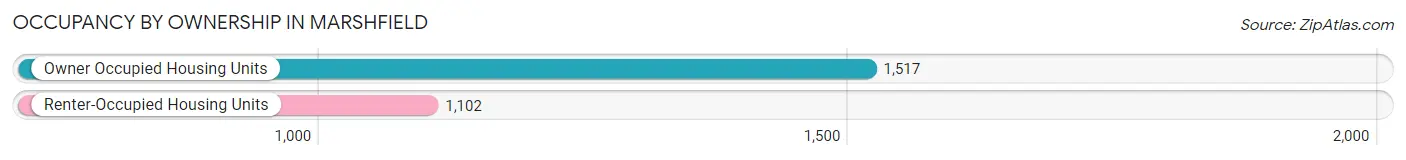
| Occupancy | # Housing Units | % Housing Units |
| Owner Occupied Housing Units | 1,517 | 57.9% |
| Renter-Occupied Housing Units | 1,102 | 42.1% |
| Total Occupied Housing Units | 2,619 | 100.0% |
Occupancy by Household Size in Marshfield
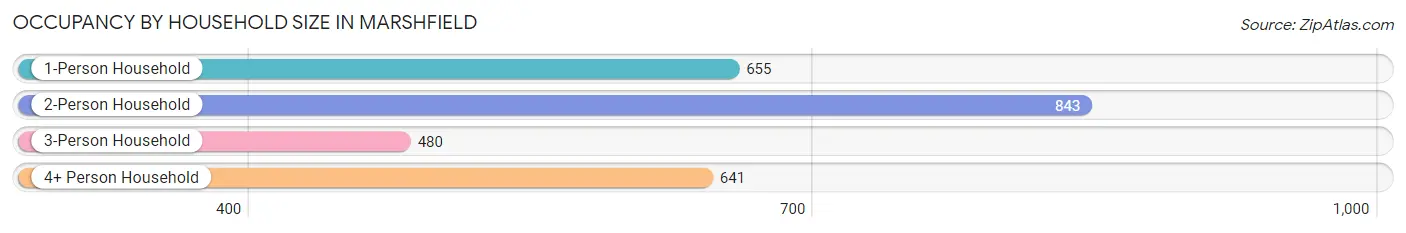
| Household Size | # Housing Units | % Housing Units |
| 1-Person Household | 655 | 25.0% |
| 2-Person Household | 843 | 32.2% |
| 3-Person Household | 480 | 18.3% |
| 4+ Person Household | 641 | 24.5% |
| Total Housing Units | 2,619 | 100.0% |
Occupancy by Ownership by Household Size in Marshfield
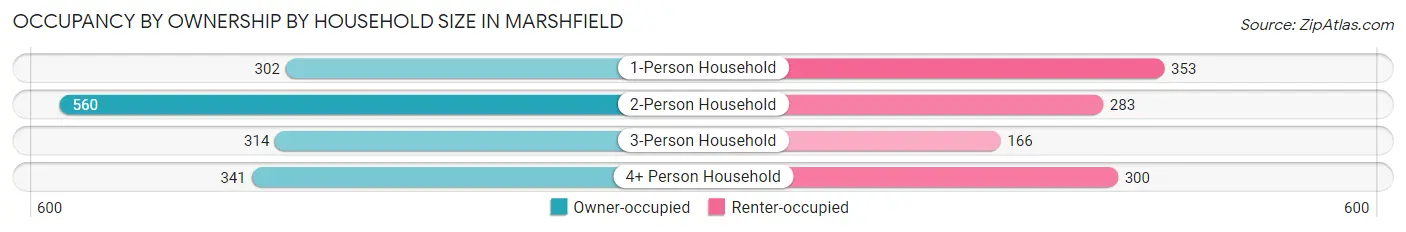
| Household Size | Owner-occupied | Renter-occupied |
| 1-Person Household | 302 (46.1%) | 353 (53.9%) |
| 2-Person Household | 560 (66.4%) | 283 (33.6%) |
| 3-Person Household | 314 (65.4%) | 166 (34.6%) |
| 4+ Person Household | 341 (53.2%) | 300 (46.8%) |
| Total Housing Units | 1,517 (57.9%) | 1,102 (42.1%) |
Occupancy by Educational Attainment in Marshfield
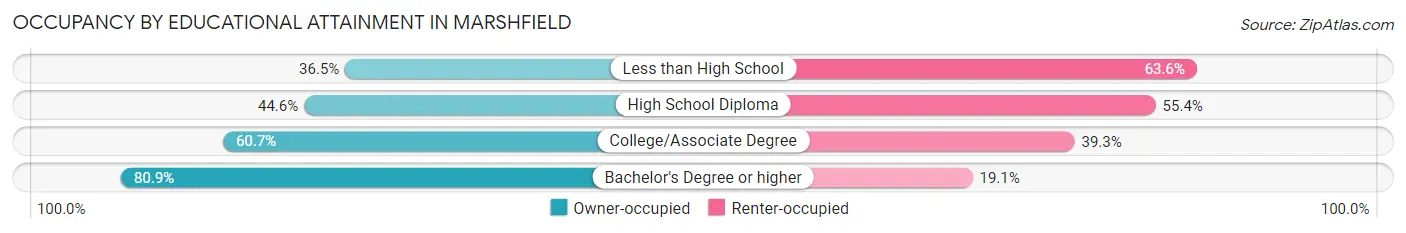
| Household Size | Owner-occupied | Renter-occupied |
| Less than High School | 78 (36.4%) | 136 (63.5%) |
| High School Diploma | 379 (44.6%) | 471 (55.4%) |
| College/Associate Degree | 594 (60.7%) | 385 (39.3%) |
| Bachelor's Degree or higher | 466 (80.9%) | 110 (19.1%) |
Occupancy by Age of Householder in Marshfield
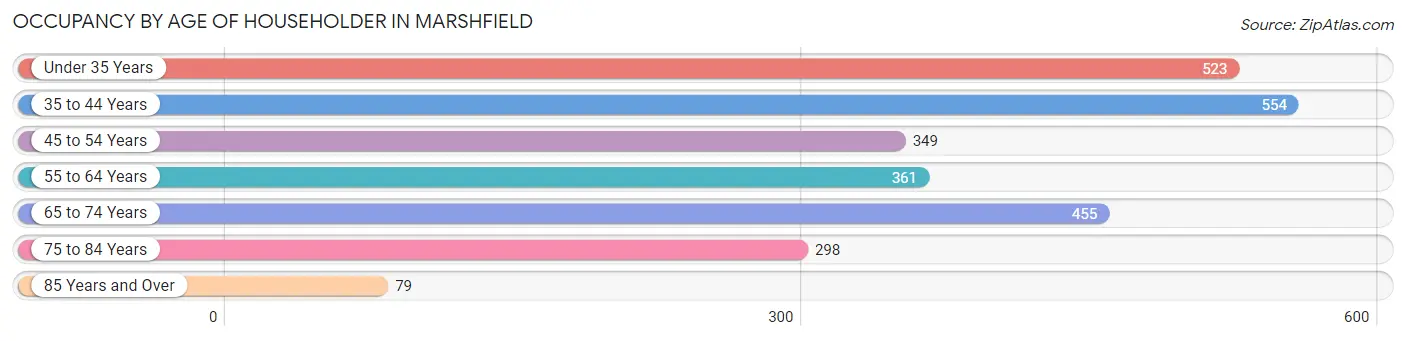
| Age Bracket | # Households | % Households |
| Under 35 Years | 523 | 20.0% |
| 35 to 44 Years | 554 | 21.1% |
| 45 to 54 Years | 349 | 13.3% |
| 55 to 64 Years | 361 | 13.8% |
| 65 to 74 Years | 455 | 17.4% |
| 75 to 84 Years | 298 | 11.4% |
| 85 Years and Over | 79 | 3.0% |
| Total | 2,619 | 100.0% |
Housing Finances in Marshfield
Median Income by Occupancy in Marshfield
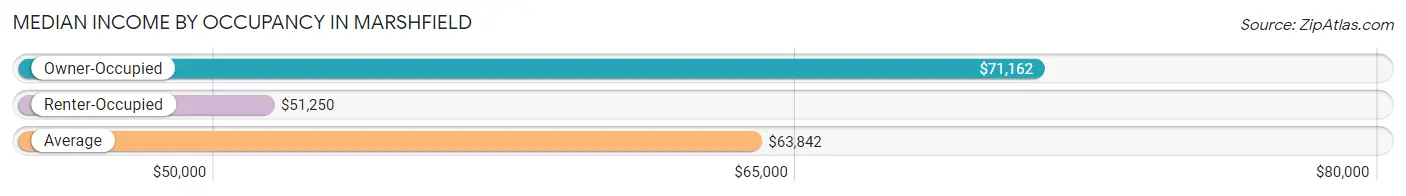
| Occupancy Type | # Households | Median Income |
| Owner-Occupied | 1,517 (57.9%) | $71,162 |
| Renter-Occupied | 1,102 (42.1%) | $51,250 |
| Average | 2,619 (100.0%) | $63,842 |
Occupancy by Householder Income Bracket in Marshfield
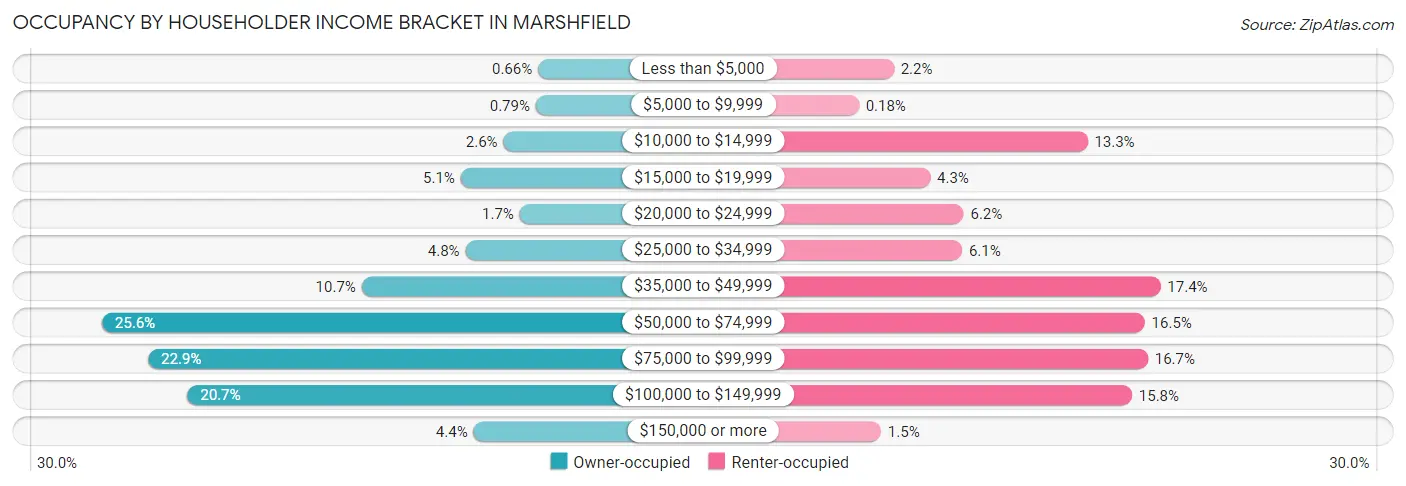
| Income Bracket | Owner-occupied | Renter-occupied |
| Less than $5,000 | 10 (0.7%) | 24 (2.2%) |
| $5,000 to $9,999 | 12 (0.8%) | 2 (0.2%) |
| $10,000 to $14,999 | 40 (2.6%) | 146 (13.3%) |
| $15,000 to $19,999 | 77 (5.1%) | 47 (4.3%) |
| $20,000 to $24,999 | 26 (1.7%) | 68 (6.2%) |
| $25,000 to $34,999 | 73 (4.8%) | 67 (6.1%) |
| $35,000 to $49,999 | 163 (10.7%) | 192 (17.4%) |
| $50,000 to $74,999 | 388 (25.6%) | 182 (16.5%) |
| $75,000 to $99,999 | 348 (22.9%) | 184 (16.7%) |
| $100,000 to $149,999 | 314 (20.7%) | 174 (15.8%) |
| $150,000 or more | 66 (4.3%) | 16 (1.5%) |
| Total | 1,517 (100.0%) | 1,102 (100.0%) |
Monthly Housing Cost Tiers in Marshfield
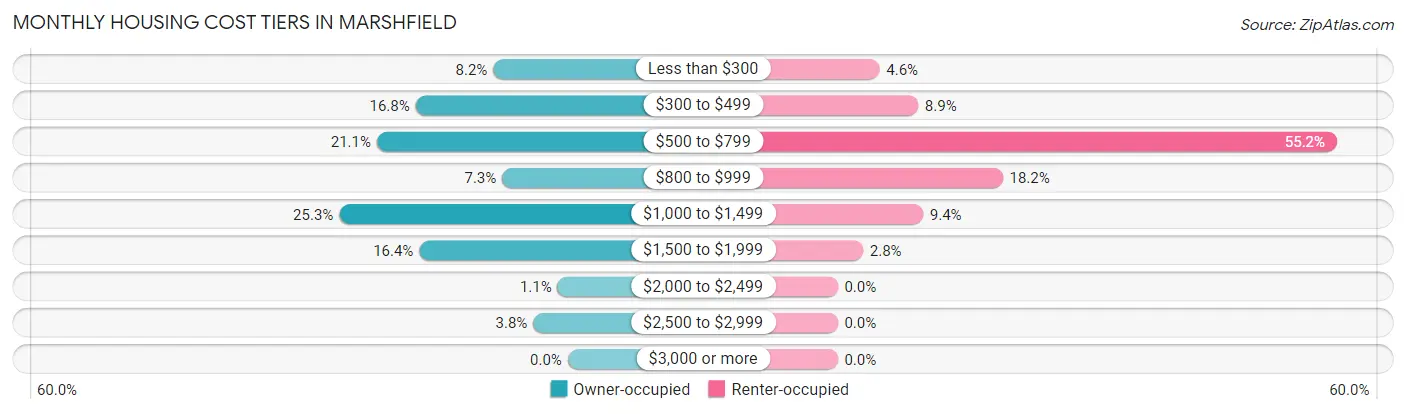
| Monthly Cost | Owner-occupied | Renter-occupied |
| Less than $300 | 125 (8.2%) | 51 (4.6%) |
| $300 to $499 | 255 (16.8%) | 98 (8.9%) |
| $500 to $799 | 320 (21.1%) | 608 (55.2%) |
| $800 to $999 | 110 (7.2%) | 201 (18.2%) |
| $1,000 to $1,499 | 383 (25.3%) | 104 (9.4%) |
| $1,500 to $1,999 | 249 (16.4%) | 31 (2.8%) |
| $2,000 to $2,499 | 17 (1.1%) | 0 (0.0%) |
| $2,500 to $2,999 | 58 (3.8%) | 0 (0.0%) |
| $3,000 or more | 0 (0.0%) | 0 (0.0%) |
| Total | 1,517 (100.0%) | 1,102 (100.0%) |
Physical Housing Characteristics in Marshfield
Housing Structures in Marshfield
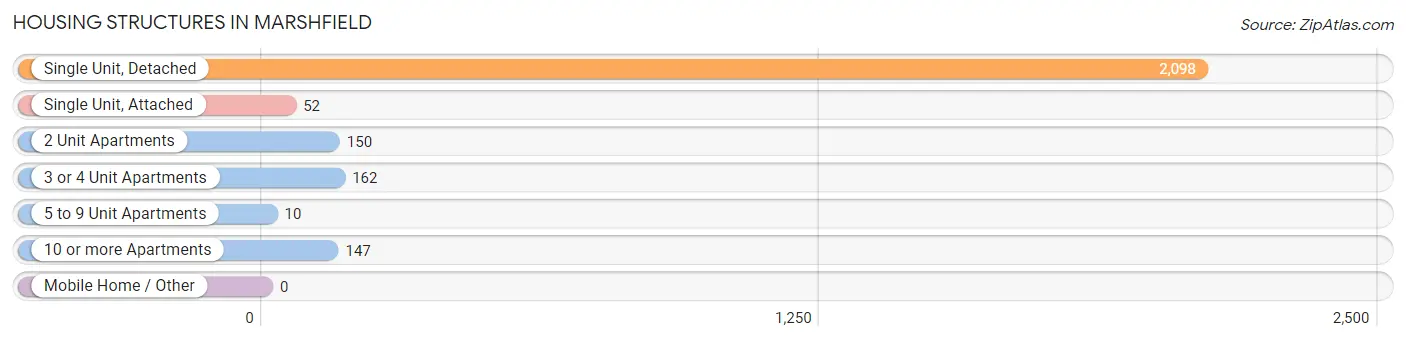
| Structure Type | # Housing Units | % Housing Units |
| Single Unit, Detached | 2,098 | 80.1% |
| Single Unit, Attached | 52 | 2.0% |
| 2 Unit Apartments | 150 | 5.7% |
| 3 or 4 Unit Apartments | 162 | 6.2% |
| 5 to 9 Unit Apartments | 10 | 0.4% |
| 10 or more Apartments | 147 | 5.6% |
| Mobile Home / Other | 0 | 0.0% |
| Total | 2,619 | 100.0% |
Housing Structures by Occupancy in Marshfield
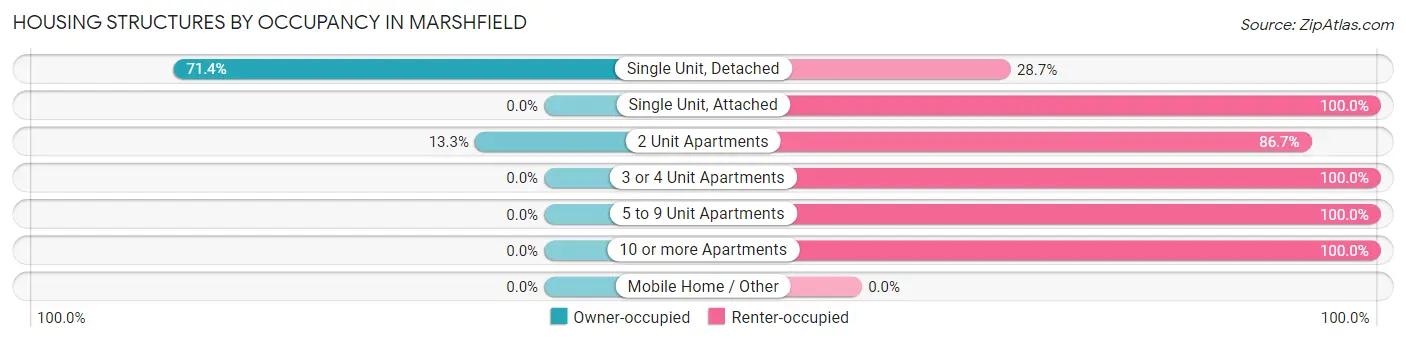
| Structure Type | Owner-occupied | Renter-occupied |
| Single Unit, Detached | 1,497 (71.4%) | 601 (28.6%) |
| Single Unit, Attached | 0 (0.0%) | 52 (100.0%) |
| 2 Unit Apartments | 20 (13.3%) | 130 (86.7%) |
| 3 or 4 Unit Apartments | 0 (0.0%) | 162 (100.0%) |
| 5 to 9 Unit Apartments | 0 (0.0%) | 10 (100.0%) |
| 10 or more Apartments | 0 (0.0%) | 147 (100.0%) |
| Mobile Home / Other | 0 (0.0%) | 0 (0.0%) |
| Total | 1,517 (57.9%) | 1,102 (42.1%) |
Housing Structures by Number of Rooms in Marshfield
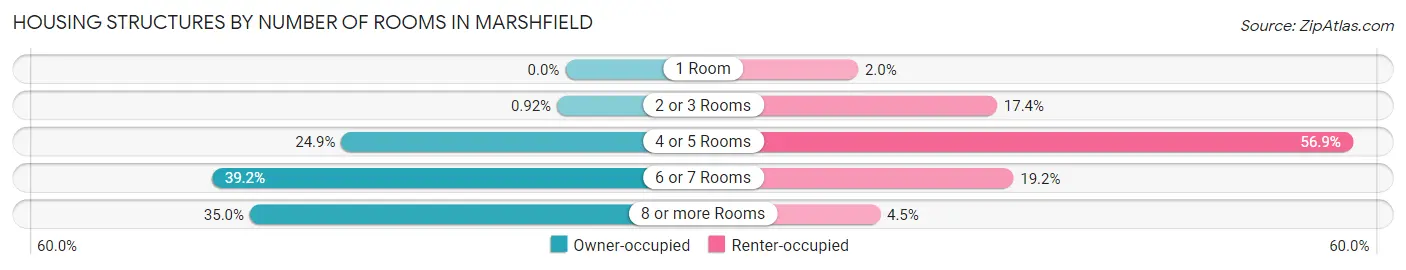
| Number of Rooms | Owner-occupied | Renter-occupied |
| 1 Room | 0 (0.0%) | 22 (2.0%) |
| 2 or 3 Rooms | 14 (0.9%) | 192 (17.4%) |
| 4 or 5 Rooms | 377 (24.8%) | 627 (56.9%) |
| 6 or 7 Rooms | 595 (39.2%) | 212 (19.2%) |
| 8 or more Rooms | 531 (35.0%) | 49 (4.4%) |
| Total | 1,517 (100.0%) | 1,102 (100.0%) |
Housing Structure by Heating Type in Marshfield
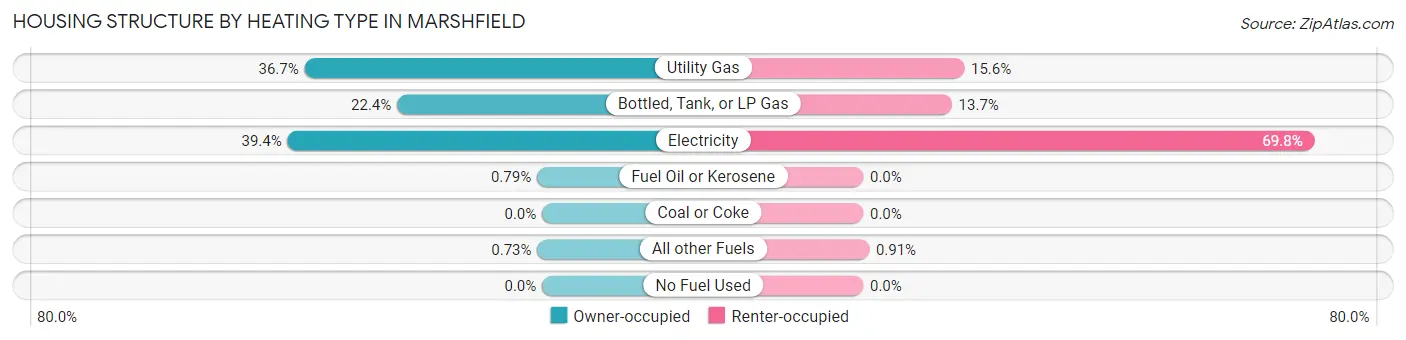
| Heating Type | Owner-occupied | Renter-occupied |
| Utility Gas | 557 (36.7%) | 172 (15.6%) |
| Bottled, Tank, or LP Gas | 340 (22.4%) | 151 (13.7%) |
| Electricity | 597 (39.4%) | 769 (69.8%) |
| Fuel Oil or Kerosene | 12 (0.8%) | 0 (0.0%) |
| Coal or Coke | 0 (0.0%) | 0 (0.0%) |
| All other Fuels | 11 (0.7%) | 10 (0.9%) |
| No Fuel Used | 0 (0.0%) | 0 (0.0%) |
| Total | 1,517 (100.0%) | 1,102 (100.0%) |
Household Vehicle Usage in Marshfield
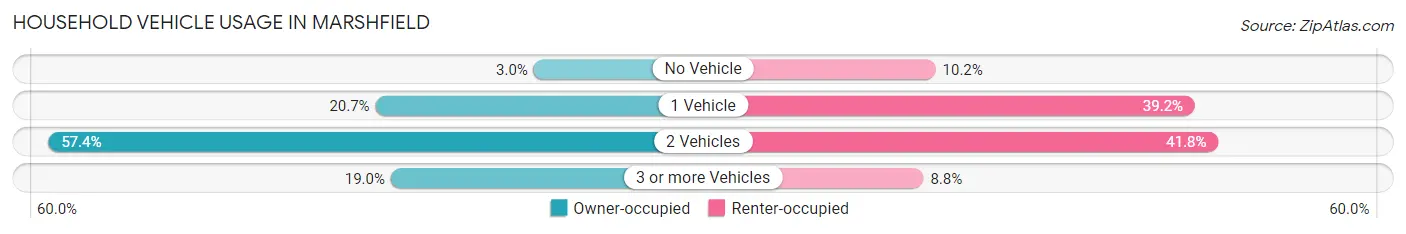
| Vehicles per Household | Owner-occupied | Renter-occupied |
| No Vehicle | 45 (3.0%) | 112 (10.2%) |
| 1 Vehicle | 314 (20.7%) | 432 (39.2%) |
| 2 Vehicles | 870 (57.4%) | 461 (41.8%) |
| 3 or more Vehicles | 288 (19.0%) | 97 (8.8%) |
| Total | 1,517 (100.0%) | 1,102 (100.0%) |
Real Estate & Mortgages in Marshfield
Real Estate and Mortgage Overview in Marshfield
| Characteristic | Without Mortgage | With Mortgage |
| Housing Units | 532 | 985 |
| Median Property Value | $144,600 | $180,700 |
| Median Household Income | $49,375 | $53 |
| Monthly Housing Costs | $425 | $0 |
| Real Estate Taxes | $1,046 | $3 |
Property Value by Mortgage Status in Marshfield
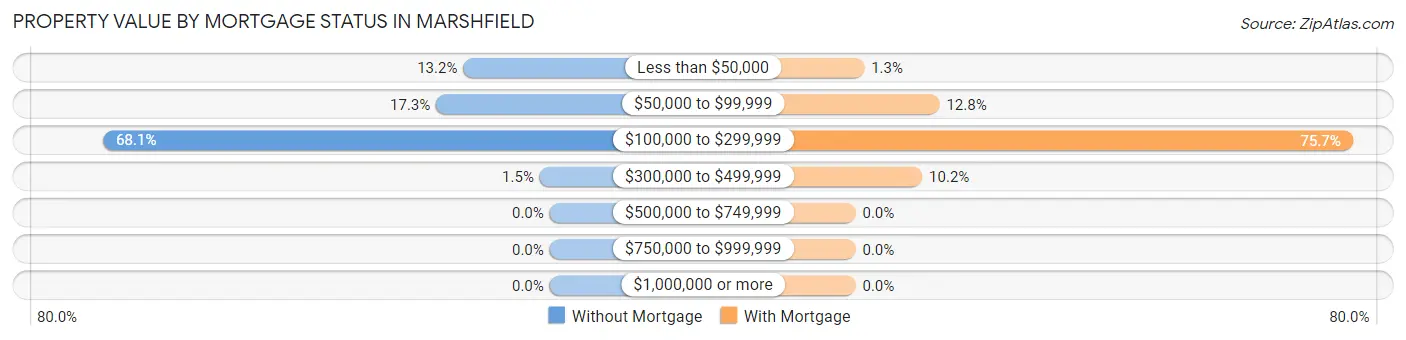
| Property Value | Without Mortgage | With Mortgage |
| Less than $50,000 | 70 (13.2%) | 13 (1.3%) |
| $50,000 to $99,999 | 92 (17.3%) | 126 (12.8%) |
| $100,000 to $299,999 | 362 (68.0%) | 746 (75.7%) |
| $300,000 to $499,999 | 8 (1.5%) | 100 (10.2%) |
| $500,000 to $749,999 | 0 (0.0%) | 0 (0.0%) |
| $750,000 to $999,999 | 0 (0.0%) | 0 (0.0%) |
| $1,000,000 or more | 0 (0.0%) | 0 (0.0%) |
| Total | 532 (100.0%) | 985 (100.0%) |
Household Income by Mortgage Status in Marshfield
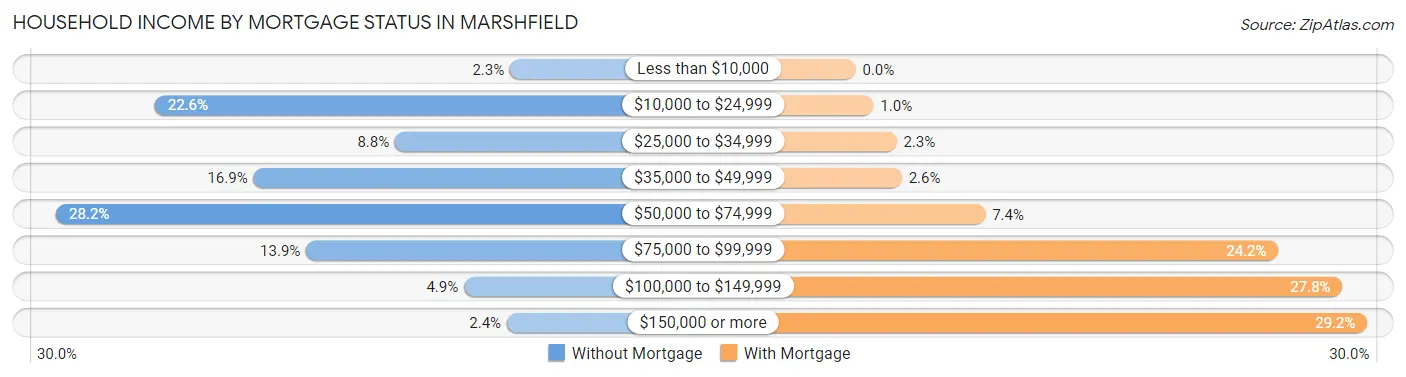
| Household Income | Without Mortgage | With Mortgage |
| Less than $10,000 | 12 (2.3%) | 0 (0.0%) |
| $10,000 to $24,999 | 120 (22.6%) | 10 (1.0%) |
| $25,000 to $34,999 | 47 (8.8%) | 23 (2.3%) |
| $35,000 to $49,999 | 90 (16.9%) | 26 (2.6%) |
| $50,000 to $74,999 | 150 (28.2%) | 73 (7.4%) |
| $75,000 to $99,999 | 74 (13.9%) | 238 (24.2%) |
| $100,000 to $149,999 | 26 (4.9%) | 274 (27.8%) |
| $150,000 or more | 13 (2.4%) | 288 (29.2%) |
| Total | 532 (100.0%) | 985 (100.0%) |
Property Value to Household Income Ratio in Marshfield
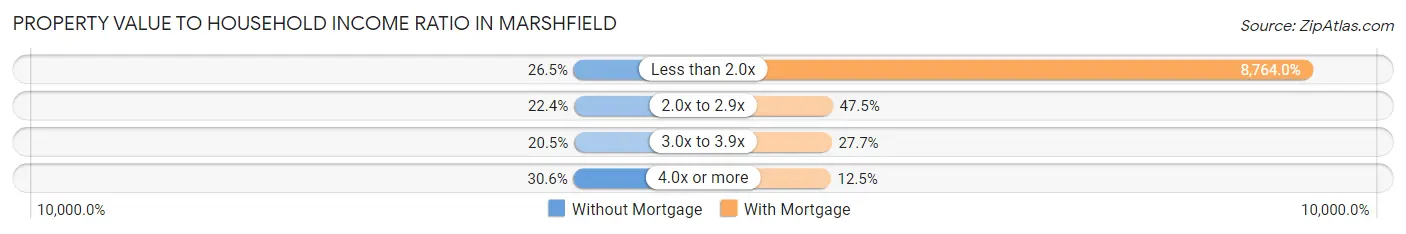
| Value-to-Income Ratio | Without Mortgage | With Mortgage |
| Less than 2.0x | 141 (26.5%) | 86,325 (8,764.0%) |
| 2.0x to 2.9x | 119 (22.4%) | 468 (47.5%) |
| 3.0x to 3.9x | 109 (20.5%) | 273 (27.7%) |
| 4.0x or more | 163 (30.6%) | 123 (12.5%) |
| Total | 532 (100.0%) | 985 (100.0%) |
Real Estate Taxes by Mortgage Status in Marshfield
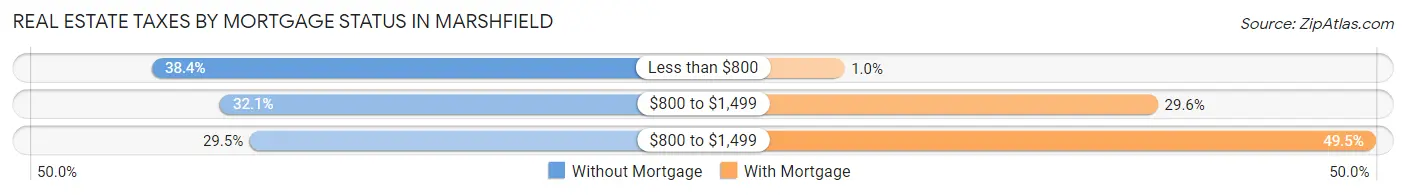
| Property Taxes | Without Mortgage | With Mortgage |
| Less than $800 | 204 (38.4%) | 10 (1.0%) |
| $800 to $1,499 | 171 (32.1%) | 292 (29.6%) |
| $800 to $1,499 | 157 (29.5%) | 488 (49.5%) |
| Total | 532 (100.0%) | 985 (100.0%) |
Health & Disability in Marshfield
Health Insurance Coverage by Age in Marshfield
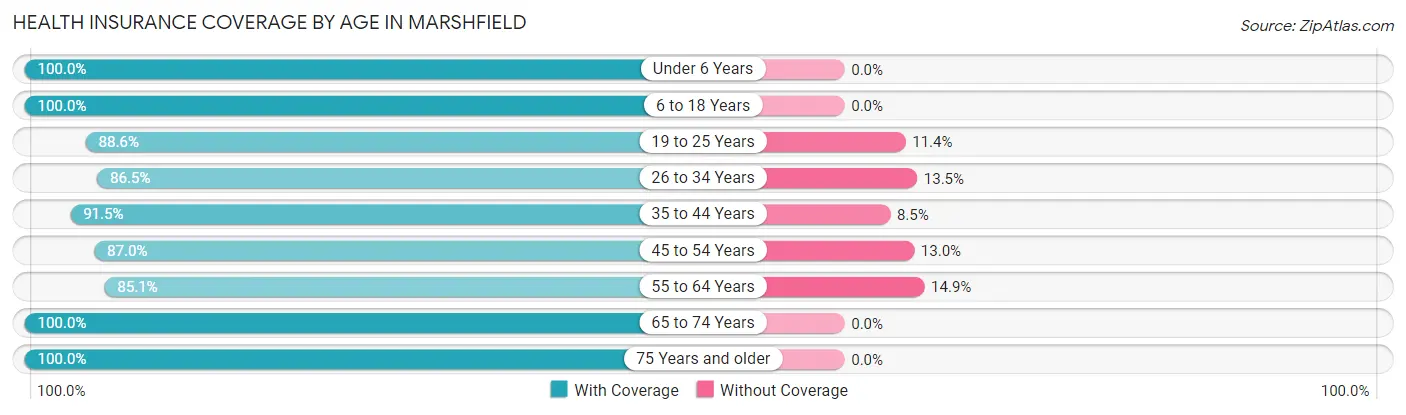
| Age Bracket | With Coverage | Without Coverage |
| Under 6 Years | 970 (100.0%) | 0 (0.0%) |
| 6 to 18 Years | 1,368 (100.0%) | 0 (0.0%) |
| 19 to 25 Years | 576 (88.6%) | 74 (11.4%) |
| 26 to 34 Years | 735 (86.5%) | 115 (13.5%) |
| 35 to 44 Years | 925 (91.5%) | 86 (8.5%) |
| 45 to 54 Years | 563 (87.0%) | 84 (13.0%) |
| 55 to 64 Years | 503 (85.1%) | 88 (14.9%) |
| 65 to 74 Years | 651 (100.0%) | 0 (0.0%) |
| 75 Years and older | 570 (100.0%) | 0 (0.0%) |
| Total | 6,861 (93.9%) | 447 (6.1%) |
Health Insurance Coverage by Citizenship Status in Marshfield
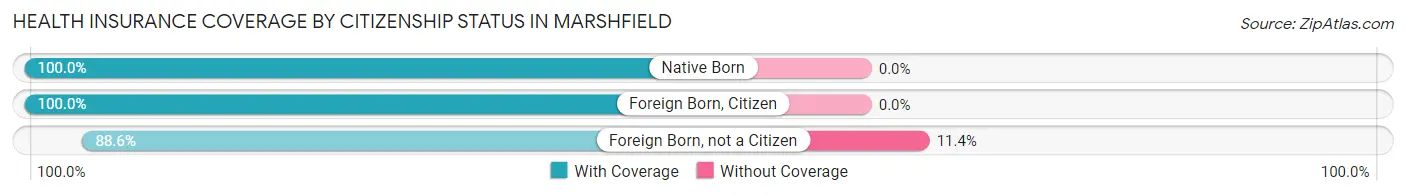
| Citizenship Status | With Coverage | Without Coverage |
| Native Born | 970 (100.0%) | 0 (0.0%) |
| Foreign Born, Citizen | 1,368 (100.0%) | 0 (0.0%) |
| Foreign Born, not a Citizen | 576 (88.6%) | 74 (11.4%) |
Health Insurance Coverage by Household Income in Marshfield
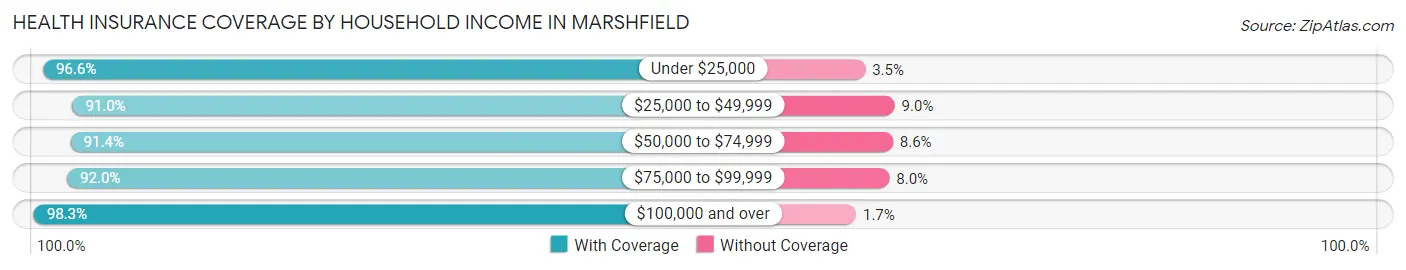
| Household Income | With Coverage | Without Coverage |
| Under $25,000 | 1,007 (96.6%) | 36 (3.5%) |
| $25,000 to $49,999 | 974 (91.0%) | 96 (9.0%) |
| $50,000 to $74,999 | 1,471 (91.4%) | 139 (8.6%) |
| $75,000 to $99,999 | 1,638 (92.0%) | 142 (8.0%) |
| $100,000 and over | 1,758 (98.3%) | 31 (1.7%) |
Public vs Private Health Insurance Coverage by Age in Marshfield
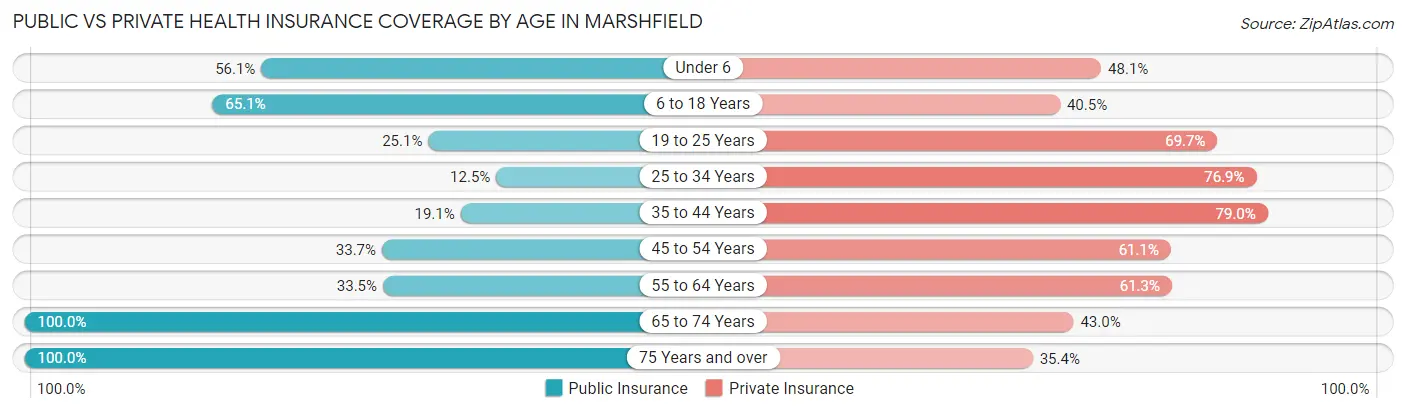
| Age Bracket | Public Insurance | Private Insurance |
| Under 6 | 544 (56.1%) | 467 (48.1%) |
| 6 to 18 Years | 891 (65.1%) | 554 (40.5%) |
| 19 to 25 Years | 163 (25.1%) | 453 (69.7%) |
| 25 to 34 Years | 106 (12.5%) | 654 (76.9%) |
| 35 to 44 Years | 193 (19.1%) | 799 (79.0%) |
| 45 to 54 Years | 218 (33.7%) | 395 (61.1%) |
| 55 to 64 Years | 198 (33.5%) | 362 (61.3%) |
| 65 to 74 Years | 651 (100.0%) | 280 (43.0%) |
| 75 Years and over | 570 (100.0%) | 202 (35.4%) |
| Total | 3,534 (48.4%) | 4,166 (57.0%) |
Disability Status by Sex by Age in Marshfield
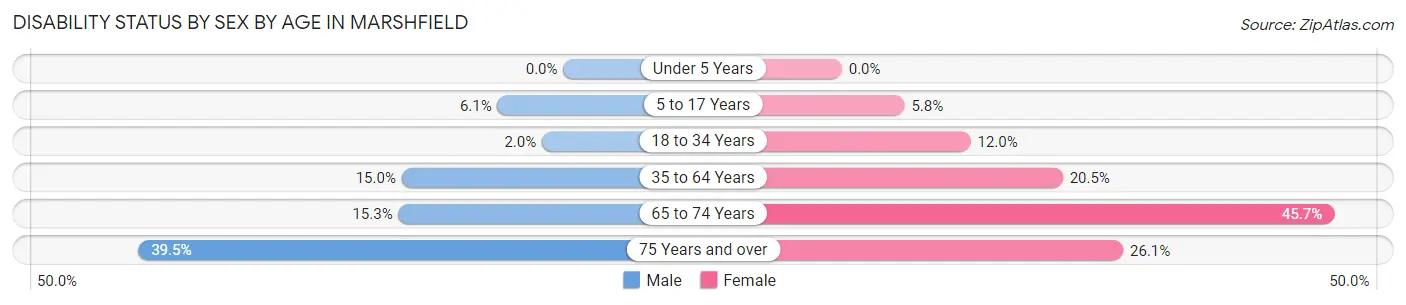
| Age Bracket | Male | Female |
| Under 5 Years | 0 (0.0%) | 0 (0.0%) |
| 5 to 17 Years | 48 (6.1%) | 41 (5.8%) |
| 18 to 34 Years | 16 (2.0%) | 98 (11.9%) |
| 35 to 64 Years | 164 (15.0%) | 237 (20.5%) |
| 65 to 74 Years | 43 (15.3%) | 169 (45.7%) |
| 75 Years and over | 101 (39.5%) | 82 (26.1%) |
Disability Class by Sex by Age in Marshfield
Disability Class: Hearing Difficulty
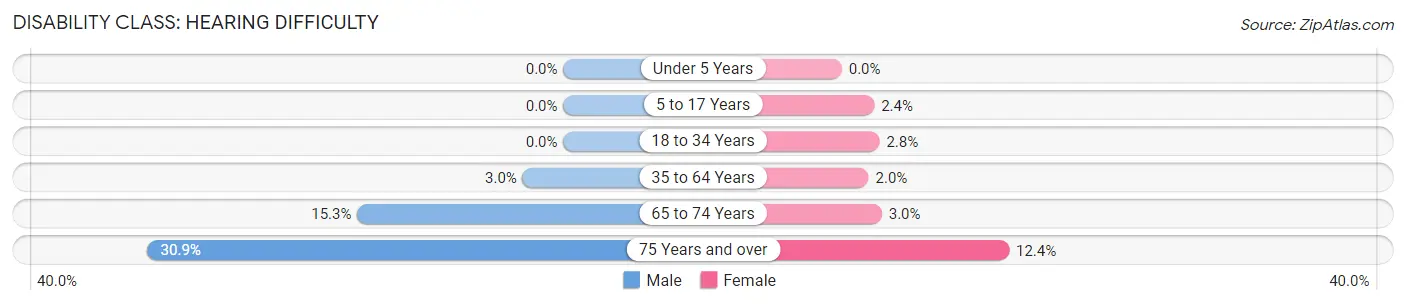
| Age Bracket | Male | Female |
| Under 5 Years | 0 (0.0%) | 0 (0.0%) |
| 5 to 17 Years | 0 (0.0%) | 17 (2.4%) |
| 18 to 34 Years | 0 (0.0%) | 23 (2.8%) |
| 35 to 64 Years | 33 (3.0%) | 23 (2.0%) |
| 65 to 74 Years | 43 (15.3%) | 11 (3.0%) |
| 75 Years and over | 79 (30.9%) | 39 (12.4%) |
Disability Class: Vision Difficulty
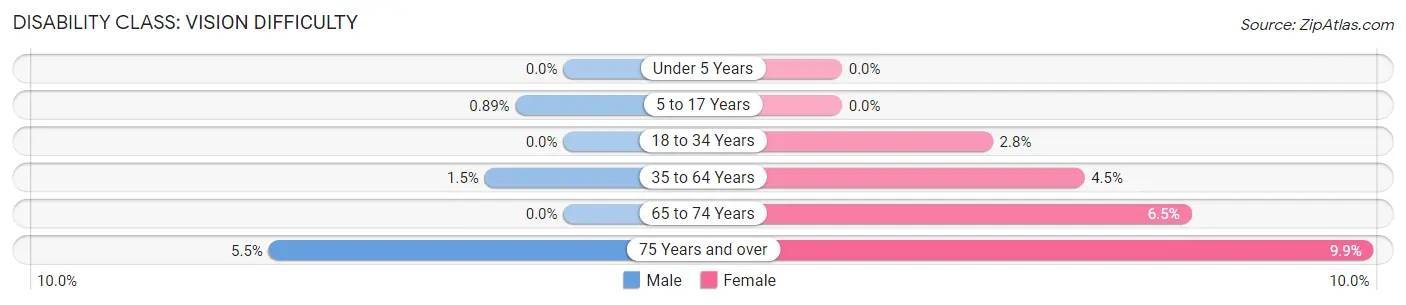
| Age Bracket | Male | Female |
| Under 5 Years | 0 (0.0%) | 0 (0.0%) |
| 5 to 17 Years | 7 (0.9%) | 0 (0.0%) |
| 18 to 34 Years | 0 (0.0%) | 23 (2.8%) |
| 35 to 64 Years | 16 (1.5%) | 52 (4.5%) |
| 65 to 74 Years | 0 (0.0%) | 24 (6.5%) |
| 75 Years and over | 14 (5.5%) | 31 (9.9%) |
Disability Class: Cognitive Difficulty

| Age Bracket | Male | Female |
| 5 to 17 Years | 41 (5.2%) | 24 (3.4%) |
| 18 to 34 Years | 16 (2.0%) | 78 (9.5%) |
| 35 to 64 Years | 101 (9.2%) | 129 (11.2%) |
| 65 to 74 Years | 0 (0.0%) | 83 (22.4%) |
| 75 Years and over | 5 (1.9%) | 25 (8.0%) |
Disability Class: Ambulatory Difficulty
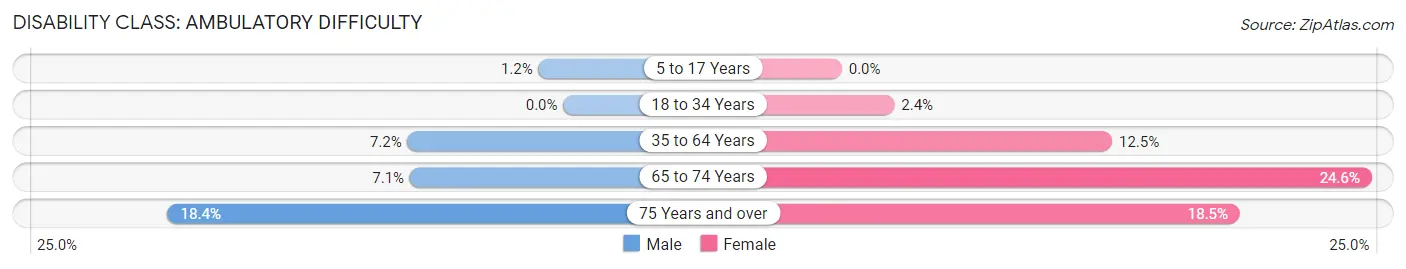
| Age Bracket | Male | Female |
| 5 to 17 Years | 9 (1.1%) | 0 (0.0%) |
| 18 to 34 Years | 0 (0.0%) | 20 (2.4%) |
| 35 to 64 Years | 79 (7.2%) | 145 (12.5%) |
| 65 to 74 Years | 20 (7.1%) | 91 (24.6%) |
| 75 Years and over | 47 (18.4%) | 58 (18.5%) |
Disability Class: Self-Care Difficulty
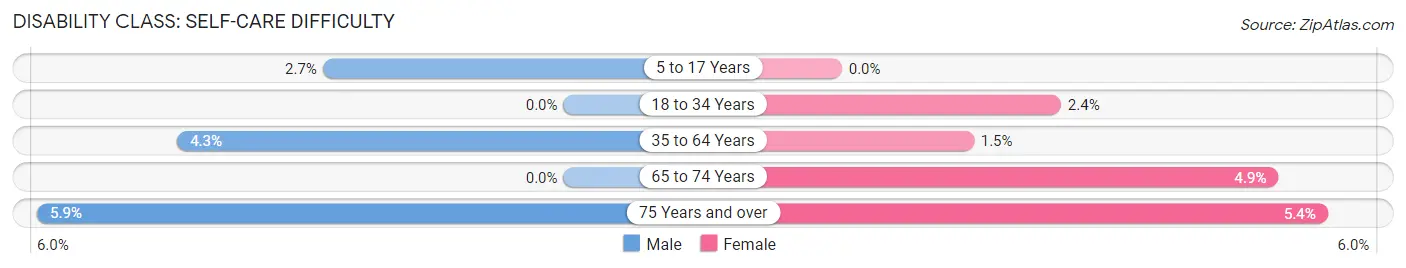
| Age Bracket | Male | Female |
| 5 to 17 Years | 21 (2.7%) | 0 (0.0%) |
| 18 to 34 Years | 0 (0.0%) | 20 (2.4%) |
| 35 to 64 Years | 47 (4.3%) | 17 (1.5%) |
| 65 to 74 Years | 0 (0.0%) | 18 (4.9%) |
| 75 Years and over | 15 (5.9%) | 17 (5.4%) |
Technology Access in Marshfield
Computing Device Access in Marshfield
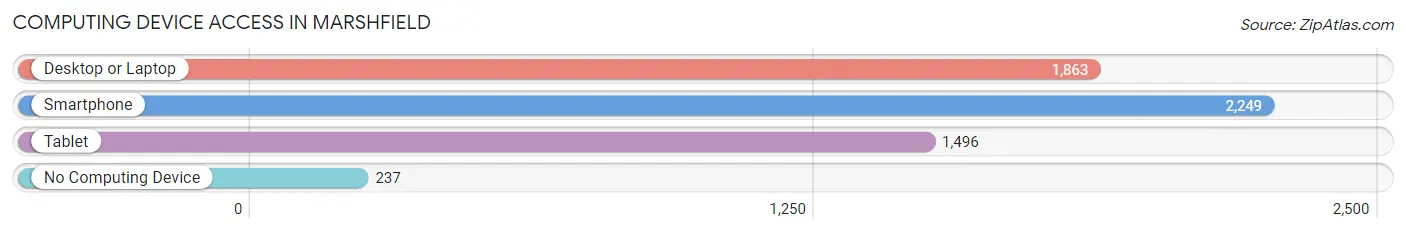
| Device Type | # Households | % Households |
| Desktop or Laptop | 1,863 | 71.1% |
| Smartphone | 2,249 | 85.9% |
| Tablet | 1,496 | 57.1% |
| No Computing Device | 237 | 9.0% |
| Total | 2,619 | 100.0% |
Internet Access in Marshfield
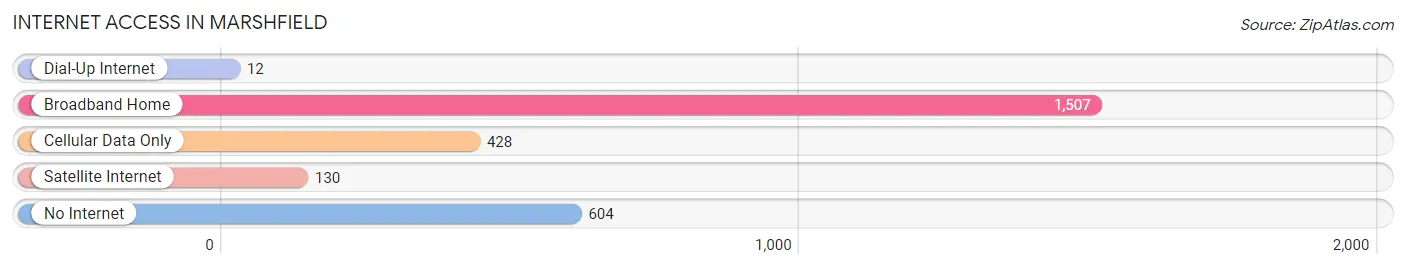
| Internet Type | # Households | % Households |
| Dial-Up Internet | 12 | 0.5% |
| Broadband Home | 1,507 | 57.5% |
| Cellular Data Only | 428 | 16.3% |
| Satellite Internet | 130 | 5.0% |
| No Internet | 604 | 23.1% |
| Total | 2,619 | 100.0% |
Marshfield Summary
Marshfield, Missouri is a small city located in Webster County, in the southwestern part of the state. It is situated on the banks of the James River, and is the county seat of Webster County. The city has a population of 8,945, according to the 2010 census.
History
Marshfield was founded in 1856 by a group of settlers from Kentucky and Tennessee. The city was named after the marshy land that surrounded it. The first post office was established in 1857, and the city was incorporated in 1868.
In the late 19th century, Marshfield was a thriving agricultural center, with a variety of crops being grown in the area. The city was also home to several mills, including a flour mill, a sawmill, and a gristmill.
In the early 20th century, Marshfield began to experience a period of growth and development. The city was connected to the railroad in 1906, and the first paved road was built in 1910. The city also saw the construction of several new buildings, including a new courthouse, a new school, and a new hospital.
Geography
Marshfield is located in the Ozark Mountains region of Missouri. The city is situated on the banks of the James River, and is surrounded by rolling hills and wooded areas. The city has a total area of 4.3 square miles, all of which is land.
The climate in Marshfield is humid subtropical, with hot, humid summers and mild winters. The average annual temperature is around 57 degrees Fahrenheit, and the average annual precipitation is around 40 inches.
Economy
The economy of Marshfield is largely based on agriculture and manufacturing. The city is home to several large agricultural operations, including a large dairy farm and a large poultry farm. The city is also home to several manufacturing companies, including a furniture manufacturer and a plastics manufacturer.
The city is also home to several retail stores, restaurants, and other businesses. The city is served by several major highways, including Interstate 44 and U.S. Route 60.
Demographics
According to the 2010 census, Marshfield has a population of 8,945. The racial makeup of the city is 87.3% White, 8.2% African American, 0.5% Native American, 0.7% Asian, 0.1% Pacific Islander, and 2.2% from other races. The median household income is $35,945, and the median family income is $41,945.
The city has a large number of churches, including Baptist, Methodist, and Catholic churches. The city also has several schools, including a public elementary school, a public middle school, and a public high school.
Conclusion
Marshfield, Missouri is a small city located in Webster County, in the southwestern part of the state. It is situated on the banks of the James River, and is the county seat of Webster County. The city has a population of 8,945, according to the 2010 census. The economy of Marshfield is largely based on agriculture and manufacturing, and the city is home to several large agricultural operations and manufacturing companies. The city is also home to several retail stores, restaurants, and other businesses. The racial makeup of the city is 87.3% White, 8.2% African American, 0.5% Native American, 0.7% Asian, 0.1% Pacific Islander, and 2.2% from other races. The median household income is $35,945, and the median family income is $41,945.
Common Questions
What is Per Capita Income in Marshfield?
Per Capita income in Marshfield is $25,230.
What is the Median Family Income in Marshfield?
Median Family Income in Marshfield is $75,321.
What is the Median Household income in Marshfield?
Median Household Income in Marshfield is $63,842.
What is Income or Wage Gap in Marshfield?
Income or Wage Gap in Marshfield is 41.5%.
Women in Marshfield earn 58.5 cents for every dollar earned by a man.
What is Family Income Deficit in Marshfield?
Family Income Deficit in Marshfield is $12,199.
Families that are below poverty line in Marshfield earn $12,199 less on average than the poverty threshold level.
What is Inequality or Gini Index in Marshfield?
Inequality or Gini Index in Marshfield is 0.34.
What is the Total Population of Marshfield?
Total Population of Marshfield is 7,501.
What is the Total Male Population of Marshfield?
Total Male Population of Marshfield is 3,582.
What is the Total Female Population of Marshfield?
Total Female Population of Marshfield is 3,919.
What is the Ratio of Males per 100 Females in Marshfield?
There are 91.40 Males per 100 Females in Marshfield.
What is the Ratio of Females per 100 Males in Marshfield?
There are 109.41 Females per 100 Males in Marshfield.
What is the Median Population Age in Marshfield?
Median Population Age in Marshfield is 32.8 Years.
What is the Average Family Size in Marshfield
Average Family Size in Marshfield is 3.2 People.
What is the Average Household Size in Marshfield
Average Household Size in Marshfield is 2.8 People.
How Large is the Labor Force in Marshfield?
There are 3,161 People in the Labor Forcein in Marshfield.
What is the Percentage of People in the Labor Force in Marshfield?
58.4% of People are in the Labor Force in Marshfield.
What is the Unemployment Rate in Marshfield?
Unemployment Rate in Marshfield is 5.4%.