Buffalo, MO Map & Demographics
Buffalo Map
Buffalo Overview
$23,205
PER CAPITA INCOME
$30,560
AVG FAMILY INCOME
$27,332
AVG HOUSEHOLD INCOME
46.9%
WAGE / INCOME GAP [ % ]
53.1¢/ $1
WAGE / INCOME GAP [ $ ]
$11,025
FAMILY INCOME DEFICIT
0.59
INEQUALITY / GINI INDEX
3,319
TOTAL POPULATION
1,271
MALE POPULATION
2,048
FEMALE POPULATION
62.06
MALES / 100 FEMALES
161.13
FEMALES / 100 MALES
41.0
MEDIAN AGE
3.0
AVG FAMILY SIZE
2.2
AVG HOUSEHOLD SIZE
1,158
LABOR FORCE [ PEOPLE ]
43.4%
PERCENT IN LABOR FORCE
2.8%
UNEMPLOYMENT RATE
Buffalo Zip Codes
Buffalo Area Codes
Income in Buffalo
Income Overview in Buffalo
Per Capita Income in Buffalo is $23,205, while median incomes of families and households are $30,560 and $27,332 respectively.
| Characteristic | Number | Measure |
| Per Capita Income | 3,319 | $23,205 |
| Median Family Income | 807 | $30,560 |
| Mean Family Income | 807 | $68,426 |
| Median Household Income | 1,439 | $27,332 |
| Mean Household Income | 1,439 | $49,794 |
| Income Deficit | 807 | $11,025 |
| Wage / Income Gap (%) | 3,319 | 46.89% |
| Wage / Income Gap ($) | 3,319 | 53.11¢ per $1 |
| Gini / Inequality Index | 3,319 | 0.59 |
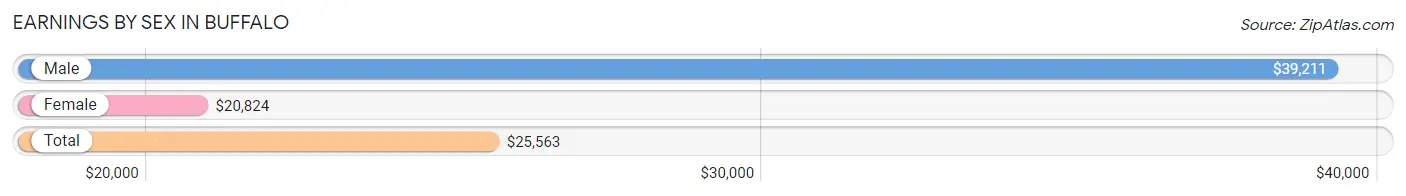
Earnings by Sex in Buffalo
Average Earnings in Buffalo are $25,563, $39,211 for men and $20,824 for women, a difference of 46.9%.
| Sex | Number | Average Earnings |
| Male | 462 (38.5%) | $39,211 |
| Female | 737 (61.5%) | $20,824 |
| Total | 1,199 (100.0%) | $25,563 |
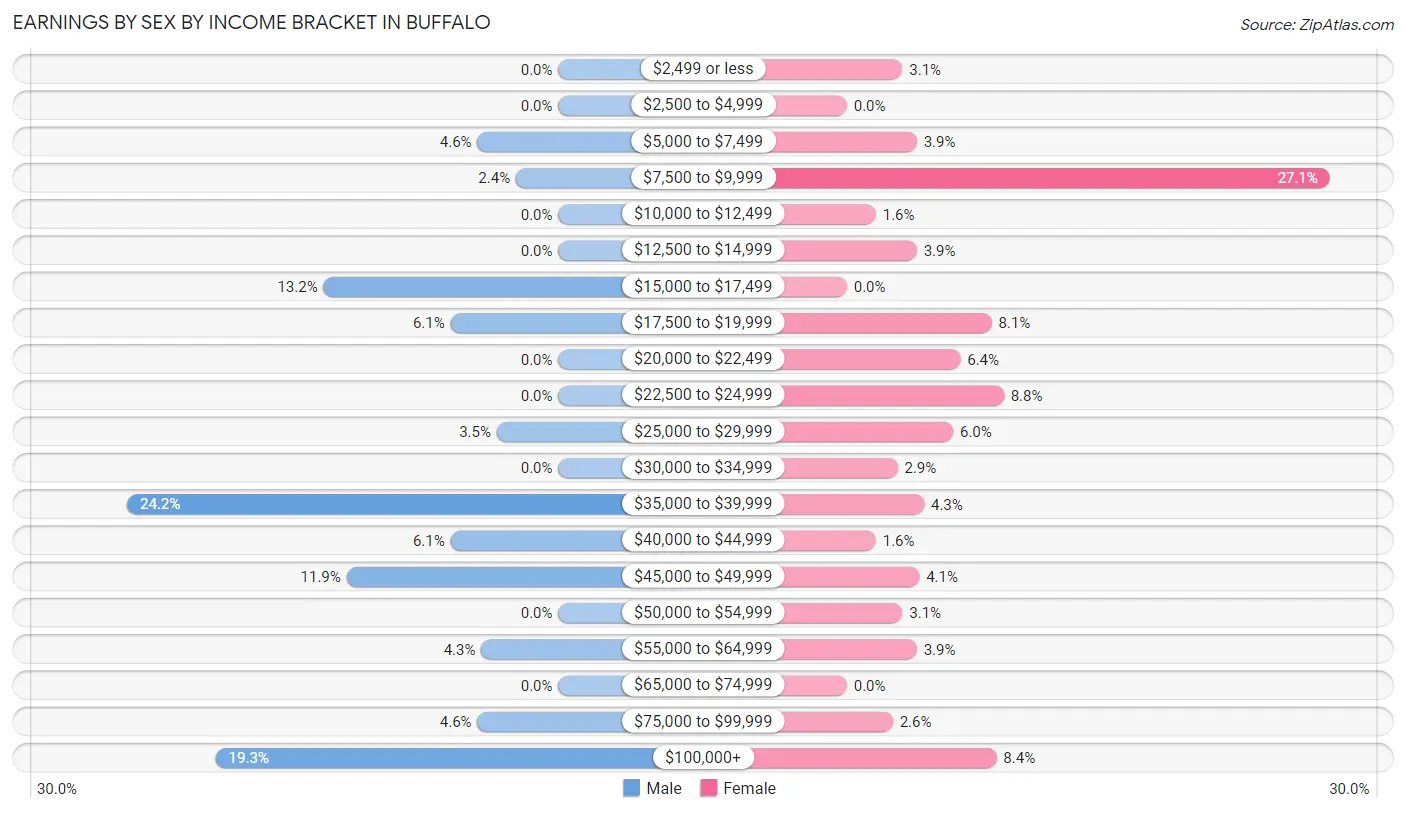
Earnings by Sex by Income Bracket in Buffalo
The most common earnings brackets in Buffalo are $35,000 to $39,999 for men (112 | 24.2%) and $7,500 to $9,999 for women (200 | 27.1%).
| Income | Male | Female |
| $2,499 or less | 0 (0.0%) | 23 (3.1%) |
| $2,500 to $4,999 | 0 (0.0%) | 0 (0.0%) |
| $5,000 to $7,499 | 21 (4.5%) | 29 (3.9%) |
| $7,500 to $9,999 | 11 (2.4%) | 200 (27.1%) |
| $10,000 to $12,499 | 0 (0.0%) | 12 (1.6%) |
| $12,500 to $14,999 | 0 (0.0%) | 29 (3.9%) |
| $15,000 to $17,499 | 61 (13.2%) | 0 (0.0%) |
| $17,500 to $19,999 | 28 (6.1%) | 60 (8.1%) |
| $20,000 to $22,499 | 0 (0.0%) | 47 (6.4%) |
| $22,500 to $24,999 | 0 (0.0%) | 65 (8.8%) |
| $25,000 to $29,999 | 16 (3.5%) | 44 (6.0%) |
| $30,000 to $34,999 | 0 (0.0%) | 21 (2.9%) |
| $35,000 to $39,999 | 112 (24.2%) | 32 (4.3%) |
| $40,000 to $44,999 | 28 (6.1%) | 12 (1.6%) |
| $45,000 to $49,999 | 55 (11.9%) | 30 (4.1%) |
| $50,000 to $54,999 | 0 (0.0%) | 23 (3.1%) |
| $55,000 to $64,999 | 20 (4.3%) | 29 (3.9%) |
| $65,000 to $74,999 | 0 (0.0%) | 0 (0.0%) |
| $75,000 to $99,999 | 21 (4.5%) | 19 (2.6%) |
| $100,000+ | 89 (19.3%) | 62 (8.4%) |
| Total | 462 (100.0%) | 737 (100.0%) |
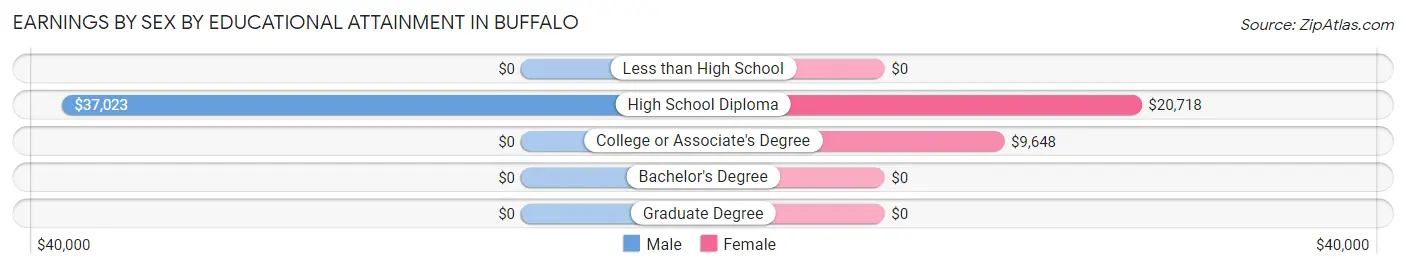
Earnings by Sex by Educational Attainment in Buffalo
Average earnings in Buffalo are $44,330 for men and $21,436 for women, a difference of 51.6%. Men with an educational attainment of high school diploma enjoy the highest average annual earnings of $37,023, while those with high school diploma education earn the least with $37,023. Women with an educational attainment of high school diploma earn the most with the average annual earnings of $20,718, while those with college or associate's degree education have the smallest earnings of $9,648.
| Educational Attainment | Male Income | Female Income |
| Less than High School | - | - |
| High School Diploma | $37,023 | $20,718 |
| College or Associate's Degree | - | - |
| Bachelor's Degree | - | - |
| Graduate Degree | - | - |
| Total | $44,330 | $21,436 |
Family Income in Buffalo
Family Income Brackets in Buffalo
According to the Buffalo family income data, there are 151 families falling into the $25,000 to $34,999 income range, which is the most common income bracket and makes up 18.7% of all families.
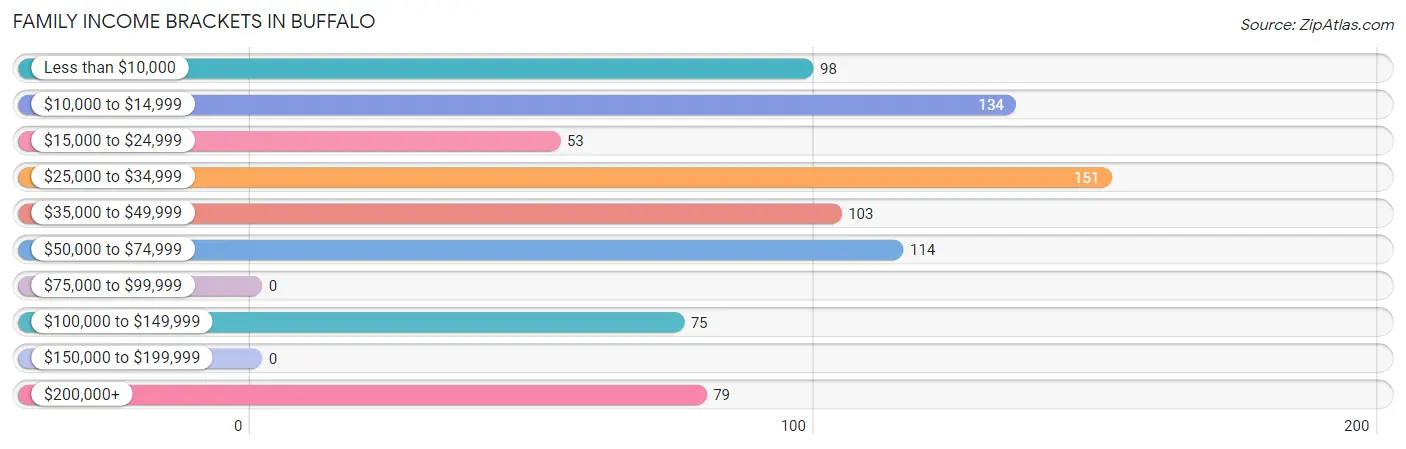
| Income Bracket | # Families | % Families |
| Less than $10,000 | 98 | 12.1% |
| $10,000 to $14,999 | 134 | 16.6% |
| $15,000 to $24,999 | 53 | 6.6% |
| $25,000 to $34,999 | 151 | 18.7% |
| $35,000 to $49,999 | 103 | 12.8% |
| $50,000 to $74,999 | 114 | 14.1% |
| $75,000 to $99,999 | 0 | 0.0% |
| $100,000 to $149,999 | 75 | 9.3% |
| $150,000 to $199,999 | 0 | 0.0% |
| $200,000+ | 79 | 9.8% |
Family Income by Famaliy Size in Buffalo
2-person families (463 | 57.4%) account for the highest median family income in Buffalo with $37,938 per family, while 2-person families (463 | 57.4%) have the highest median income of $18,969 per family member.
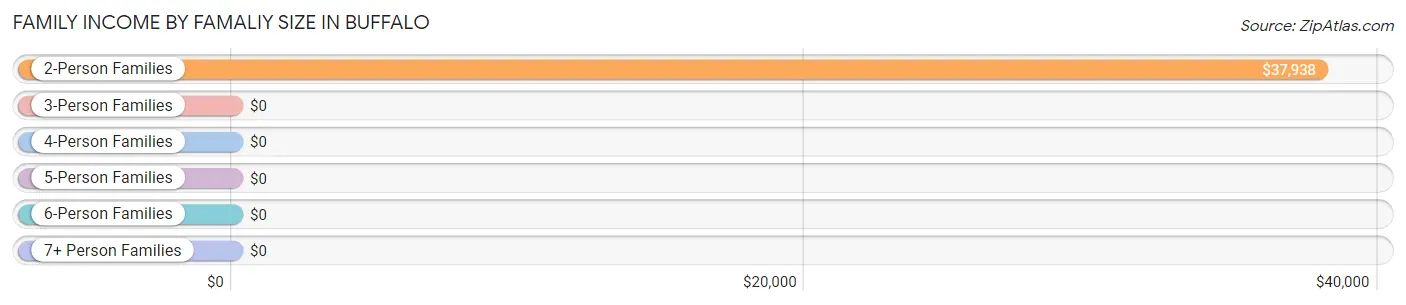
| Income Bracket | # Families | Median Income |
| 2-Person Families | 463 (57.4%) | $37,938 |
| 3-Person Families | 113 (14.0%) | $0 |
| 4-Person Families | 152 (18.8%) | $0 |
| 5-Person Families | 79 (9.8%) | $0 |
| 6-Person Families | 0 (0.0%) | $0 |
| 7+ Person Families | 0 (0.0%) | $0 |
| Total | 807 (100.0%) | $30,560 |
Family Income by Number of Earners in Buffalo
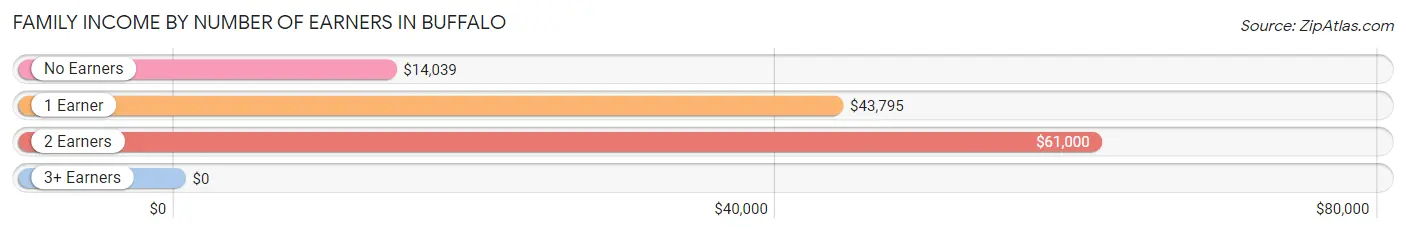
| Number of Earners | # Families | Median Income |
| No Earners | 361 (44.7%) | $14,039 |
| 1 Earner | 119 (14.7%) | $43,795 |
| 2 Earners | 312 (38.7%) | $61,000 |
| 3+ Earners | 15 (1.9%) | $0 |
| Total | 807 (100.0%) | $30,560 |
Household Income in Buffalo
Household Income Brackets in Buffalo
With 312 households falling in the category, the $10,000 to $14,999 income range is the most frequent in Buffalo, accounting for 21.7% of all households.
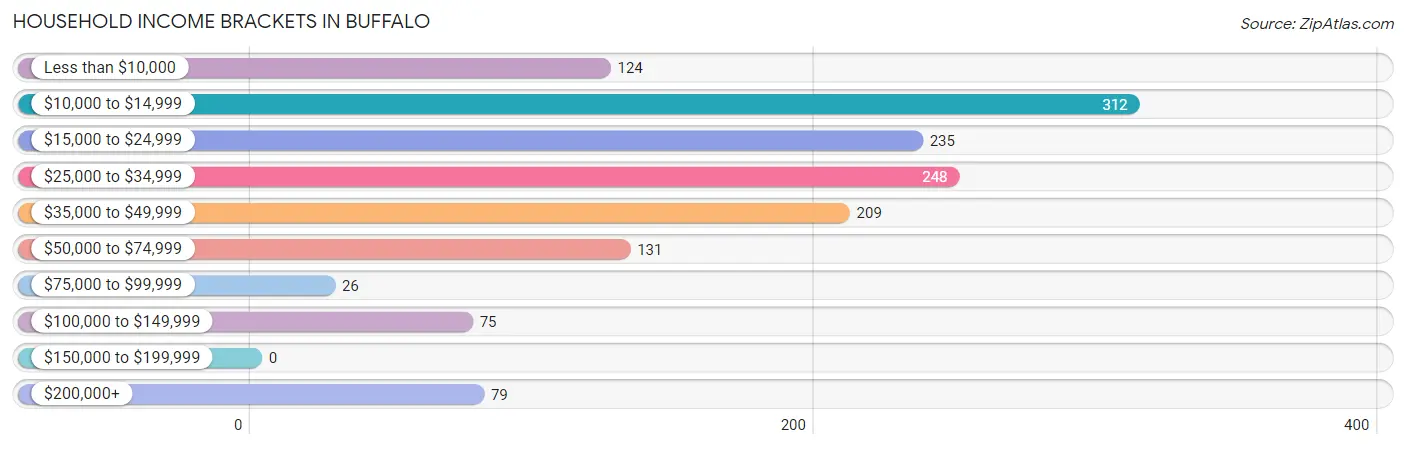
| Income Bracket | # Households | % Households |
| Less than $10,000 | 124 | 8.6% |
| $10,000 to $14,999 | 312 | 21.7% |
| $15,000 to $24,999 | 235 | 16.3% |
| $25,000 to $34,999 | 248 | 17.2% |
| $35,000 to $49,999 | 209 | 14.5% |
| $50,000 to $74,999 | 131 | 9.1% |
| $75,000 to $99,999 | 26 | 1.8% |
| $100,000 to $149,999 | 75 | 5.2% |
| $150,000 to $199,999 | 0 | 0.0% |
| $200,000+ | 79 | 5.5% |
Household Income by Householder Age in Buffalo
The median household income in Buffalo is $27,332, with the highest median household income of $43,343 found in the 25 to 44 years age bracket for the primary householder. A total of 404 households (28.1%) fall into this category. Meanwhile, the 15 to 24 years age bracket for the primary householder has the lowest median household income of $0, with 114 households (7.9%) in this group.
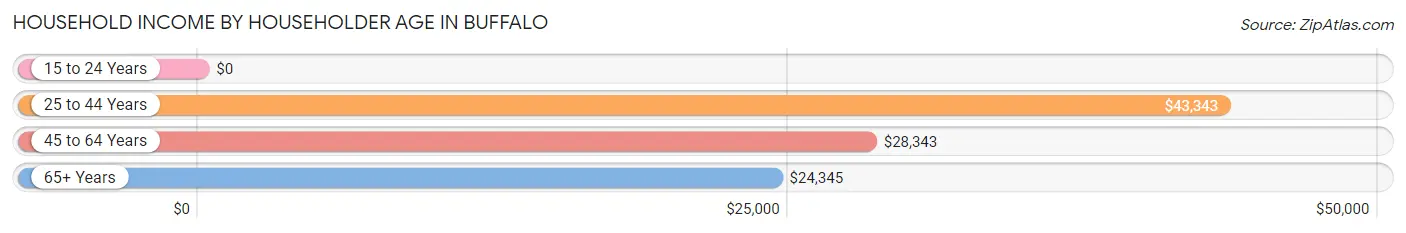
| Income Bracket | # Households | Median Income |
| 15 to 24 Years | 114 (7.9%) | $0 |
| 25 to 44 Years | 404 (28.1%) | $43,343 |
| 45 to 64 Years | 508 (35.3%) | $28,343 |
| 65+ Years | 413 (28.7%) | $24,345 |
| Total | 1,439 (100.0%) | $27,332 |
Poverty in Buffalo
Income Below Poverty by Sex and Age in Buffalo
With 25.8% poverty level for males and 50.9% for females among the residents of Buffalo, 5 year old males and 6 to 11 year old females are the most vulnerable to poverty, with 59 males (100.0%) and 83 females (100.0%) in their respective age groups living below the poverty level.
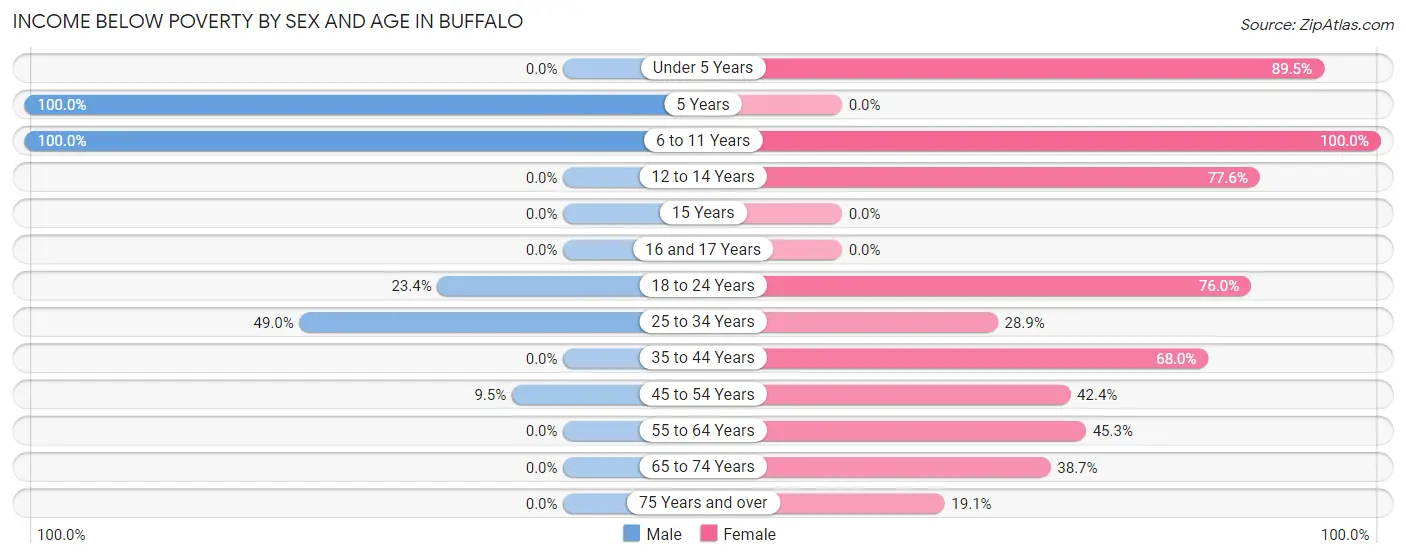
| Age Bracket | Male | Female |
| Under 5 Years | 0 (0.0%) | 153 (89.5%) |
| 5 Years | 59 (100.0%) | 0 (0.0%) |
| 6 to 11 Years | 111 (100.0%) | 83 (100.0%) |
| 12 to 14 Years | 0 (0.0%) | 83 (77.6%) |
| 15 Years | 0 (0.0%) | 0 (0.0%) |
| 16 and 17 Years | 0 (0.0%) | 0 (0.0%) |
| 18 to 24 Years | 32 (23.4%) | 98 (76.0%) |
| 25 to 34 Years | 95 (49.0%) | 109 (28.9%) |
| 35 to 44 Years | 0 (0.0%) | 134 (68.0%) |
| 45 to 54 Years | 14 (9.5%) | 78 (42.4%) |
| 55 to 64 Years | 0 (0.0%) | 144 (45.3%) |
| 65 to 74 Years | 0 (0.0%) | 60 (38.7%) |
| 75 Years and over | 0 (0.0%) | 32 (19.1%) |
| Total | 311 (25.8%) | 974 (50.9%) |
Income Above Poverty by Sex and Age in Buffalo
According to the poverty statistics in Buffalo, males aged under 5 years and females aged 16 and 17 years are the age groups that are most secure financially, with 100.0% of males and 100.0% of females in these age groups living above the poverty line.
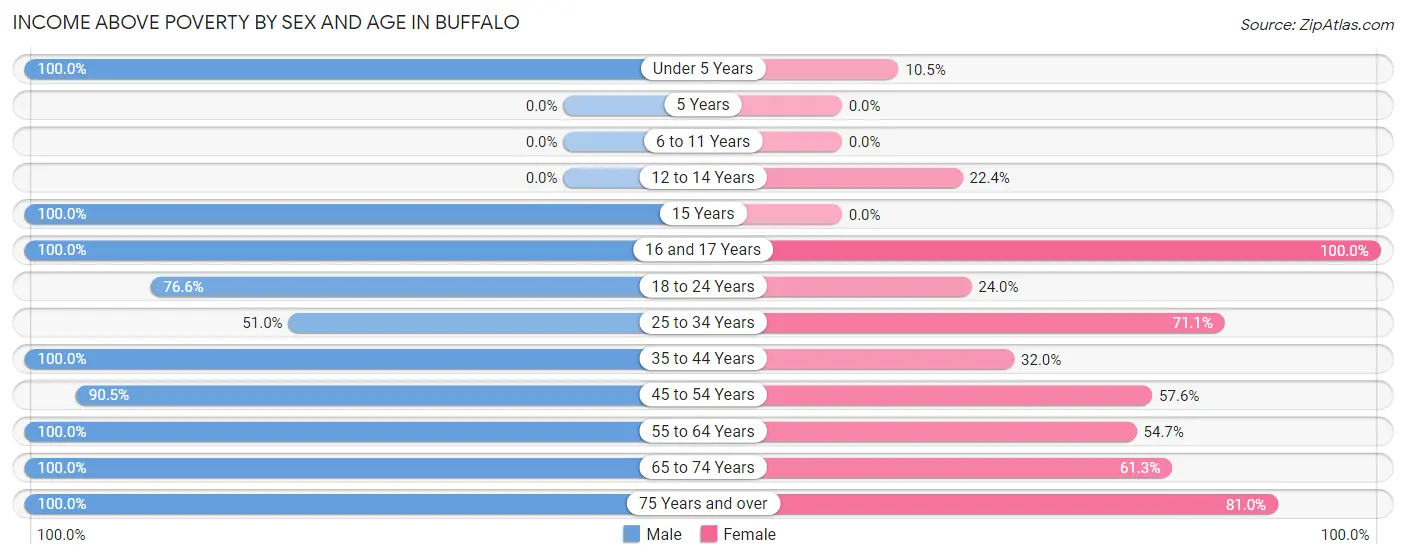
| Age Bracket | Male | Female |
| Under 5 Years | 67 (100.0%) | 18 (10.5%) |
| 5 Years | 0 (0.0%) | 0 (0.0%) |
| 6 to 11 Years | 0 (0.0%) | 0 (0.0%) |
| 12 to 14 Years | 0 (0.0%) | 24 (22.4%) |
| 15 Years | 53 (100.0%) | 0 (0.0%) |
| 16 and 17 Years | 52 (100.0%) | 23 (100.0%) |
| 18 to 24 Years | 105 (76.6%) | 31 (24.0%) |
| 25 to 34 Years | 99 (51.0%) | 268 (71.1%) |
| 35 to 44 Years | 109 (100.0%) | 63 (32.0%) |
| 45 to 54 Years | 133 (90.5%) | 106 (57.6%) |
| 55 to 64 Years | 63 (100.0%) | 174 (54.7%) |
| 65 to 74 Years | 145 (100.0%) | 95 (61.3%) |
| 75 Years and over | 68 (100.0%) | 136 (80.9%) |
| Total | 894 (74.2%) | 938 (49.1%) |
Income Below Poverty Among Married-Couple Families in Buffalo
| Children | Above Poverty | Below Poverty |
| No Children | 267 (100.0%) | 0 (0.0%) |
| 1 or 2 Children | 102 (100.0%) | 0 (0.0%) |
| 3 or 4 Children | 0 (0.0%) | 0 (0.0%) |
| 5 or more Children | 0 (0.0%) | 0 (0.0%) |
| Total | 369 (100.0%) | 0 (0.0%) |
Income Below Poverty Among Single-Parent Households in Buffalo
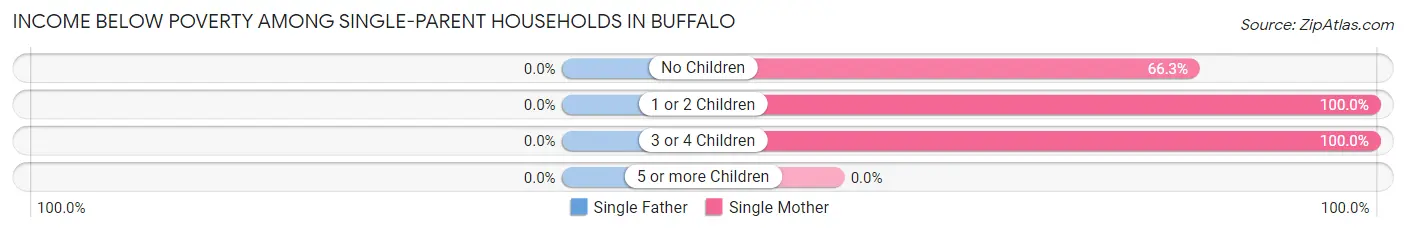
| Children | Single Father | Single Mother |
| No Children | 0 (0.0%) | 134 (66.3%) |
| 1 or 2 Children | 0 (0.0%) | 158 (100.0%) |
| 3 or 4 Children | 0 (0.0%) | 50 (100.0%) |
| 5 or more Children | 0 (0.0%) | 0 (0.0%) |
| Total | 0 (0.0%) | 342 (83.4%) |
Income Below Poverty Among Married-Couple vs Single-Parent Households in Buffalo
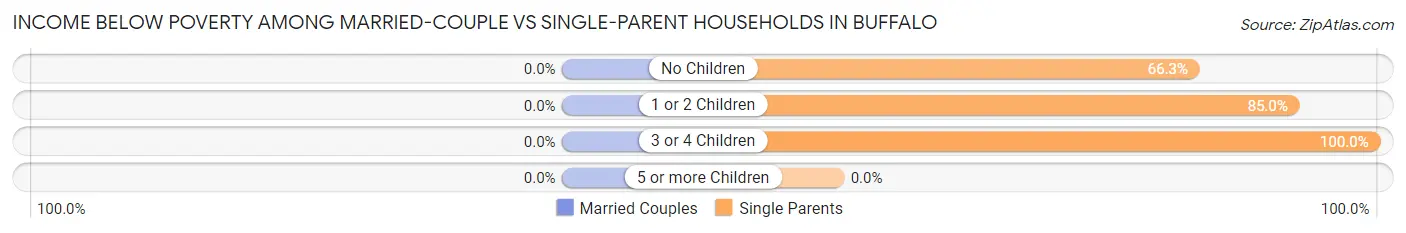
| Children | Married-Couple Families | Single-Parent Households |
| No Children | 0 (0.0%) | 134 (66.3%) |
| 1 or 2 Children | 0 (0.0%) | 158 (85.0%) |
| 3 or 4 Children | 0 (0.0%) | 50 (100.0%) |
| 5 or more Children | 0 (0.0%) | 0 (0.0%) |
| Total | 0 (0.0%) | 342 (78.1%) |
Race in Buffalo
The most populous races in Buffalo are White / Caucasian (3,235 | 97.5%), Hispanic or Latino (229 | 6.9%), and Two or more Races (81 | 2.4%).
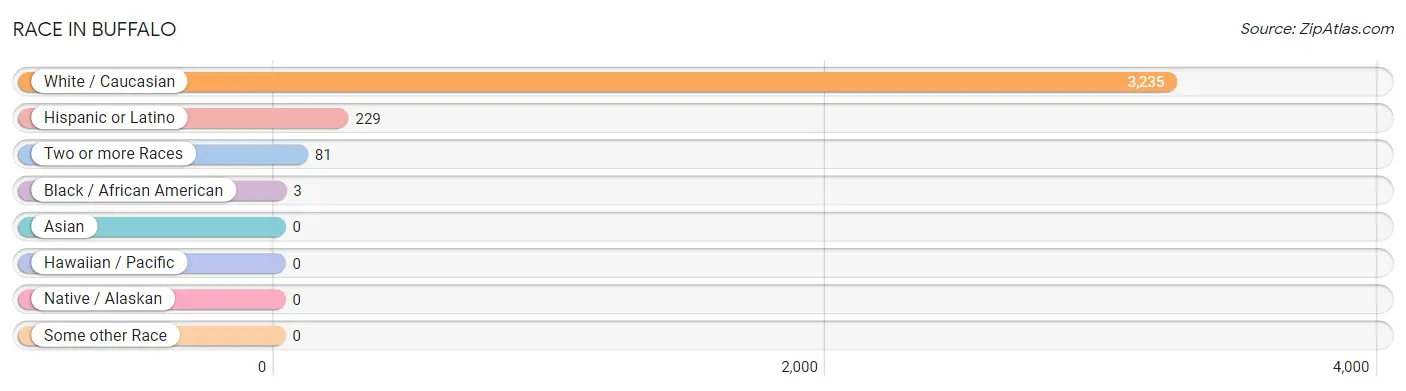
| Race | # Population | % Population |
| Asian | 0 | 0.0% |
| Black / African American | 3 | 0.1% |
| Hawaiian / Pacific | 0 | 0.0% |
| Hispanic or Latino | 229 | 6.9% |
| Native / Alaskan | 0 | 0.0% |
| White / Caucasian | 3,235 | 97.5% |
| Two or more Races | 81 | 2.4% |
| Some other Race | 0 | 0.0% |
| Total | 3,319 | 100.0% |
Ancestry in Buffalo
The most populous ancestries reported in Buffalo are American (451 | 13.6%), English (448 | 13.5%), German (348 | 10.5%), Irish (235 | 7.1%), and Mexican (229 | 6.9%), together accounting for 51.6% of all Buffalo residents.
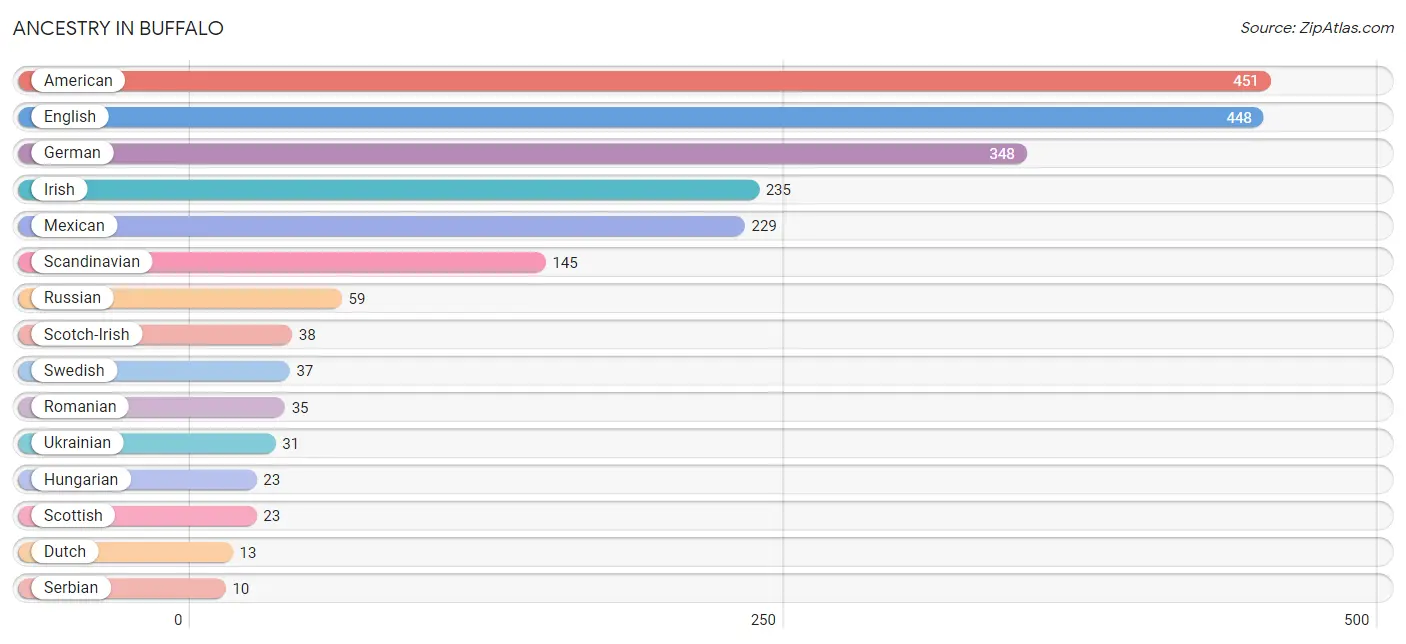
| Ancestry | # Population | % Population |
| American | 451 | 13.6% |
| Cherokee | 4 | 0.1% |
| Czech | 6 | 0.2% |
| Dutch | 13 | 0.4% |
| English | 448 | 13.5% |
| German | 348 | 10.5% |
| Hungarian | 23 | 0.7% |
| Irish | 235 | 7.1% |
| Mexican | 229 | 6.9% |
| Romanian | 35 | 1.1% |
| Russian | 59 | 1.8% |
| Scandinavian | 145 | 4.4% |
| Scotch-Irish | 38 | 1.1% |
| Scottish | 23 | 0.7% |
| Serbian | 10 | 0.3% |
| Swedish | 37 | 1.1% |
| Ukrainian | 31 | 0.9% | View All 17 Rows |
Immigrants in Buffalo
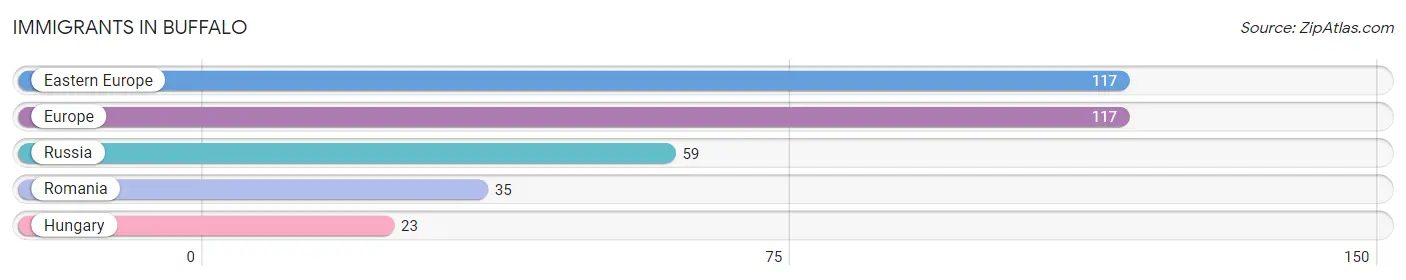
The most numerous immigrant groups reported in Buffalo came from Eastern Europe (117 | 3.5%), Europe (117 | 3.5%), Russia (59 | 1.8%), Romania (35 | 1.1%), and Hungary (23 | 0.7%), together accounting for 10.6% of all Buffalo residents.
| Immigration Origin | # Population | % Population |
| Eastern Europe | 117 | 3.5% |
| Europe | 117 | 3.5% |
| Hungary | 23 | 0.7% |
| Romania | 35 | 1.1% |
| Russia | 59 | 1.8% | View All 5 Rows |
Sex and Age in Buffalo
Sex and Age in Buffalo
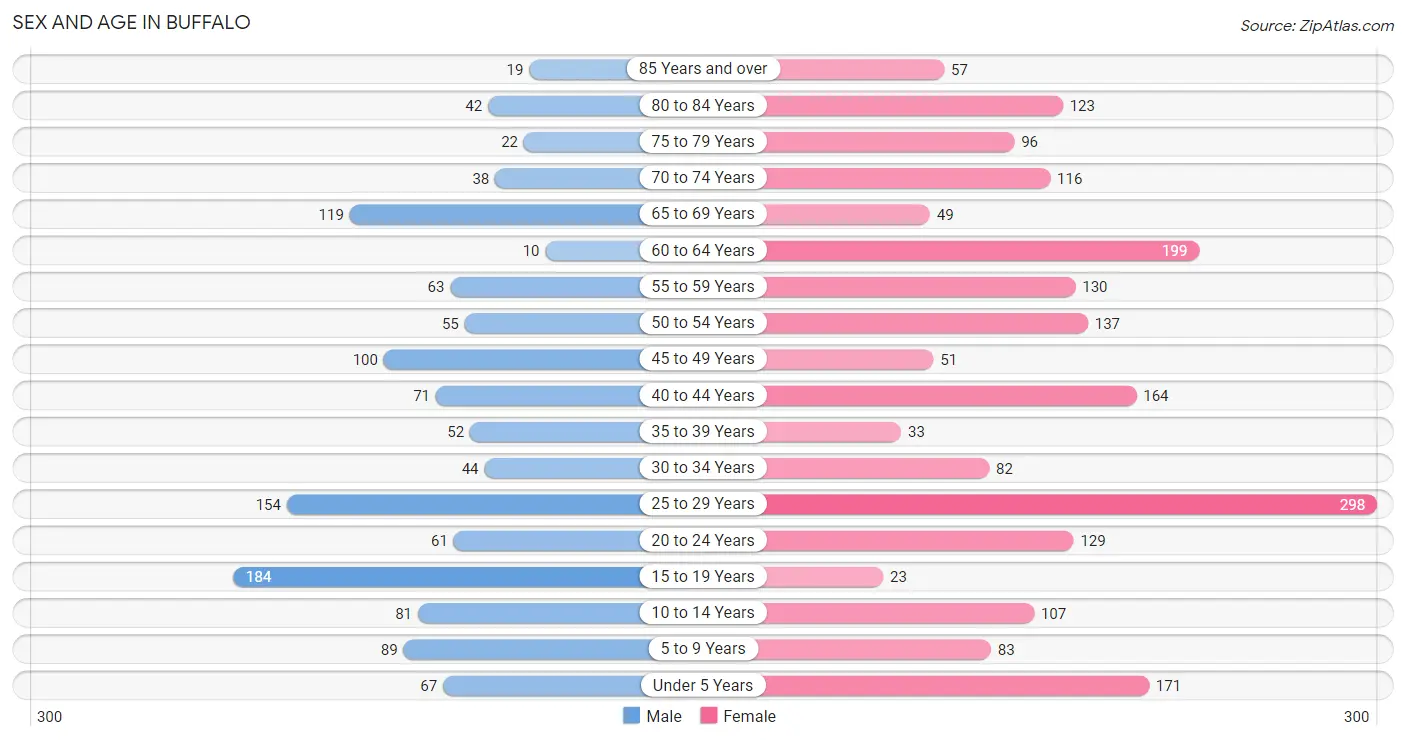
The most populous age groups in Buffalo are 15 to 19 Years (184 | 14.5%) for men and 25 to 29 Years (298 | 14.5%) for women.
| Age Bracket | Male | Female |
| Under 5 Years | 67 (5.3%) | 171 (8.4%) |
| 5 to 9 Years | 89 (7.0%) | 83 (4.1%) |
| 10 to 14 Years | 81 (6.4%) | 107 (5.2%) |
| 15 to 19 Years | 184 (14.5%) | 23 (1.1%) |
| 20 to 24 Years | 61 (4.8%) | 129 (6.3%) |
| 25 to 29 Years | 154 (12.1%) | 298 (14.5%) |
| 30 to 34 Years | 44 (3.5%) | 82 (4.0%) |
| 35 to 39 Years | 52 (4.1%) | 33 (1.6%) |
| 40 to 44 Years | 71 (5.6%) | 164 (8.0%) |
| 45 to 49 Years | 100 (7.9%) | 51 (2.5%) |
| 50 to 54 Years | 55 (4.3%) | 137 (6.7%) |
| 55 to 59 Years | 63 (5.0%) | 130 (6.4%) |
| 60 to 64 Years | 10 (0.8%) | 199 (9.7%) |
| 65 to 69 Years | 119 (9.4%) | 49 (2.4%) |
| 70 to 74 Years | 38 (3.0%) | 116 (5.7%) |
| 75 to 79 Years | 22 (1.7%) | 96 (4.7%) |
| 80 to 84 Years | 42 (3.3%) | 123 (6.0%) |
| 85 Years and over | 19 (1.5%) | 57 (2.8%) |
| Total | 1,271 (100.0%) | 2,048 (100.0%) |
Families and Households in Buffalo
Median Family Size in Buffalo
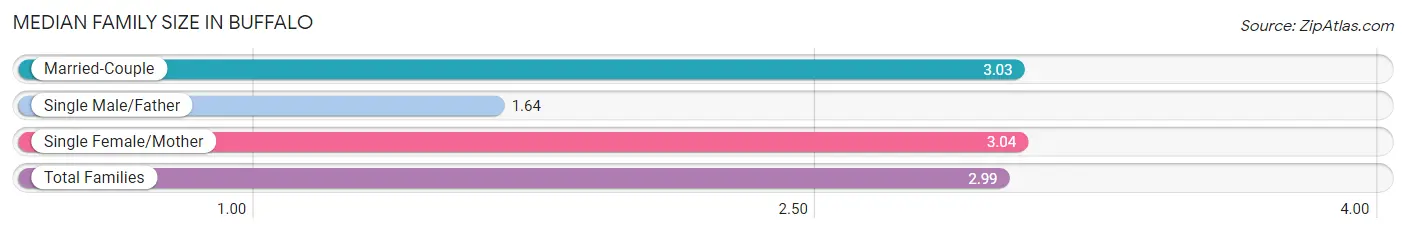
The median family size in Buffalo is 2.99 persons per family, with single female/mother families (410 | 50.8%) accounting for the largest median family size of 3.04 persons per family. On the other hand, single male/father families (28 | 3.5%) represent the smallest median family size with 1.64 persons per family.
| Family Type | # Families | Family Size |
| Married-Couple | 369 (45.7%) | 3.03 |
| Single Male/Father | 28 (3.5%) | 1.64 |
| Single Female/Mother | 410 (50.8%) | 3.04 |
| Total Families | 807 (100.0%) | 2.99 |
Median Household Size in Buffalo
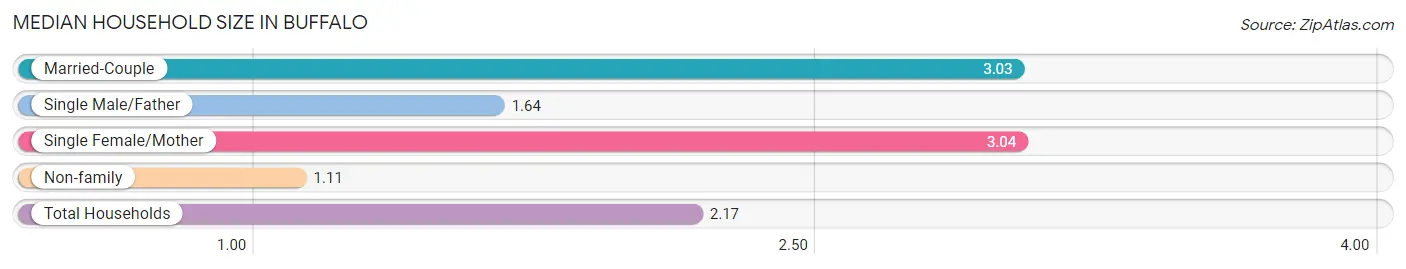
The median household size in Buffalo is 2.17 persons per household, with single female/mother households (410 | 28.5%) accounting for the largest median household size of 3.04 persons per household. non-family households (632 | 43.9%) represent the smallest median household size with 1.11 persons per household.
| Household Type | # Households | Household Size |
| Married-Couple | 369 (25.6%) | 3.03 |
| Single Male/Father | 28 (1.9%) | 1.64 |
| Single Female/Mother | 410 (28.5%) | 3.04 |
| Non-family | 632 (43.9%) | 1.11 |
| Total Households | 1,439 (100.0%) | 2.17 |
Household Size by Marriage Status in Buffalo
Out of a total of 1,439 households in Buffalo, 807 (56.1%) are family households, while 632 (43.9%) are nonfamily households. The most numerous type of family households are 2-person households, comprising 463, and the most common type of nonfamily households are 1-person households, comprising 573.
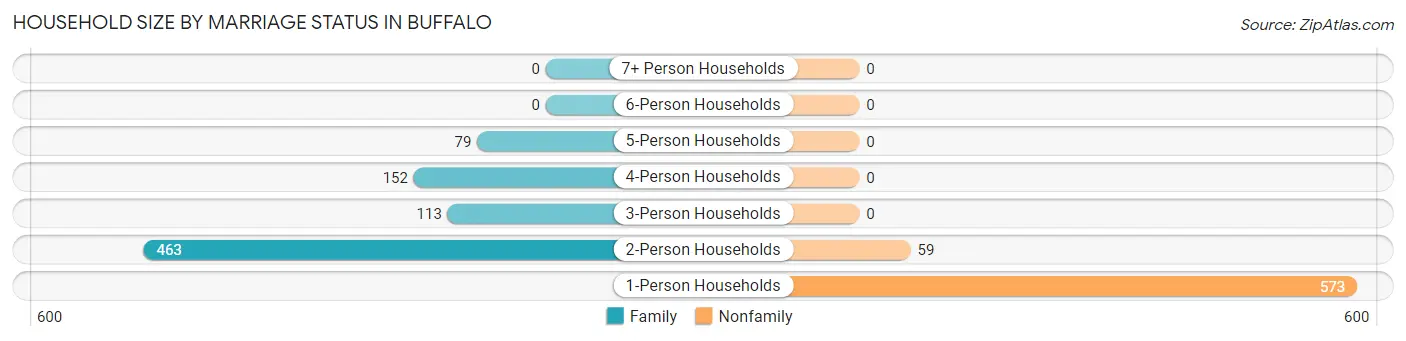
| Household Size | Family Households | Nonfamily Households |
| 1-Person Households | - | 573 (39.8%) |
| 2-Person Households | 463 (32.2%) | 59 (4.1%) |
| 3-Person Households | 113 (7.9%) | 0 (0.0%) |
| 4-Person Households | 152 (10.6%) | 0 (0.0%) |
| 5-Person Households | 79 (5.5%) | 0 (0.0%) |
| 6-Person Households | 0 (0.0%) | 0 (0.0%) |
| 7+ Person Households | 0 (0.0%) | 0 (0.0%) |
| Total | 807 (56.1%) | 632 (43.9%) |
Female Fertility in Buffalo
Fertility by Age in Buffalo
Average fertility rate in Buffalo is 265.0 births per 1,000 women. Women in the age bracket of 20 to 34 years have the highest fertility rate with 407.0 births per 1,000 women. Women in the age bracket of 20 to 34 years acount for 100.0% of all women with births.
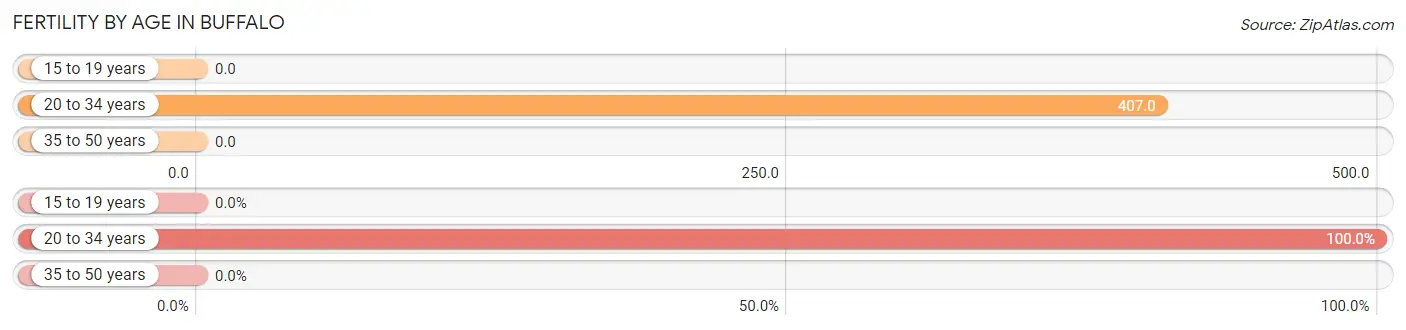
| Age Bracket | Women with Births | Births / 1,000 Women |
| 15 to 19 years | 0 (0.0%) | 0.0 |
| 20 to 34 years | 207 (100.0%) | 407.0 |
| 35 to 50 years | 0 (0.0%) | 0.0 |
| Total | 207 (100.0%) | 265.0 |
Fertility by Age by Marriage Status in Buffalo
52.7% of women with births (207) in Buffalo are married. The highest percentage of unmarried women with births falls into 20 to 34 years age bracket with 47.3% of them unmarried at the time of birth, while the lowest percentage of unmarried women with births belong to 20 to 34 years age bracket with 47.3% of them unmarried.
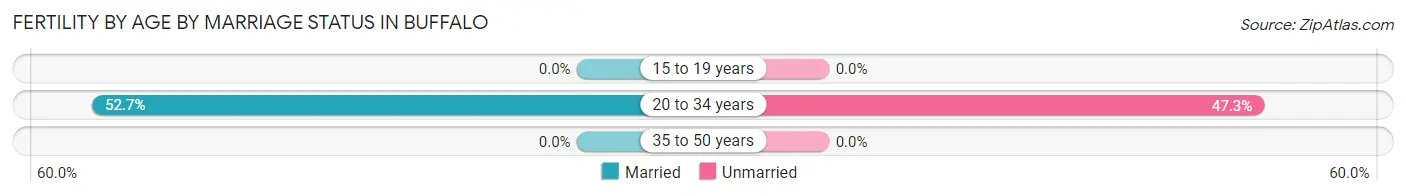
| Age Bracket | Married | Unmarried |
| 15 to 19 years | 0 (0.0%) | 0 (0.0%) |
| 20 to 34 years | 109 (52.7%) | 98 (47.3%) |
| 35 to 50 years | 0 (0.0%) | 0 (0.0%) |
| Total | 109 (52.7%) | 98 (47.3%) |
Fertility by Education in Buffalo
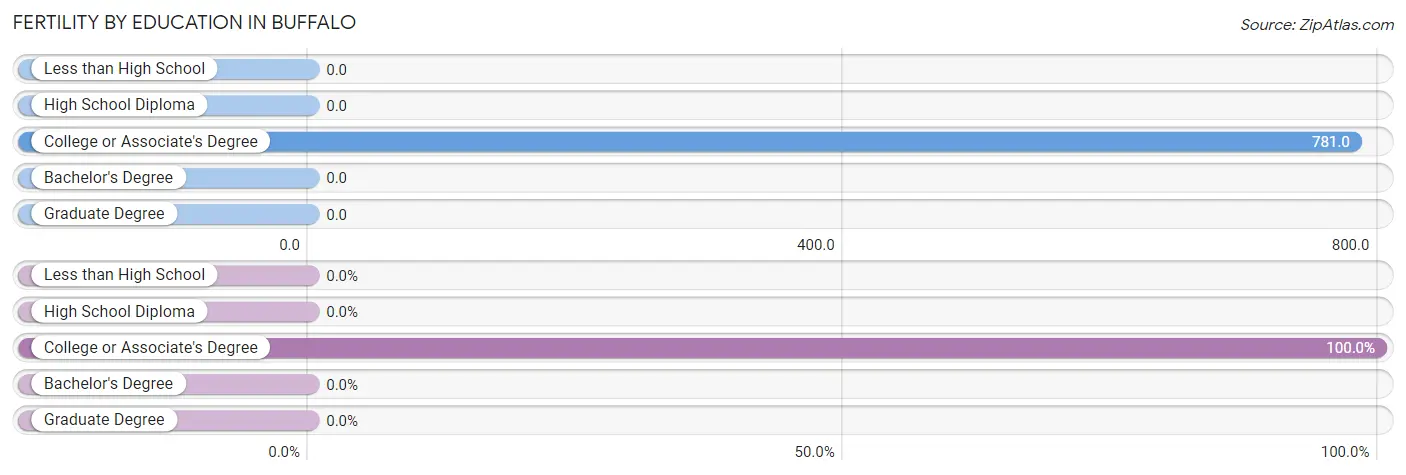
| Educational Attainment | Women with Births | Births / 1,000 Women |
| Less than High School | 0 (0.0%) | 0.0 |
| High School Diploma | 0 (0.0%) | 0.0 |
| College or Associate's Degree | 207 (100.0%) | 781.0 |
| Bachelor's Degree | 0 (0.0%) | 0.0 |
| Graduate Degree | 0 (0.0%) | 0.0 |
| Total | 207 (100.0%) | 265.0 |
Fertility by Education by Marriage Status in Buffalo
47.3% of women with births in Buffalo are unmarried. Women with the educational attainment of college or associate's degree are most likely to be married with 52.7% of them married at childbirth, while women with the educational attainment of college or associate's degree are least likely to be married with 47.3% of them unmarried at childbirth.
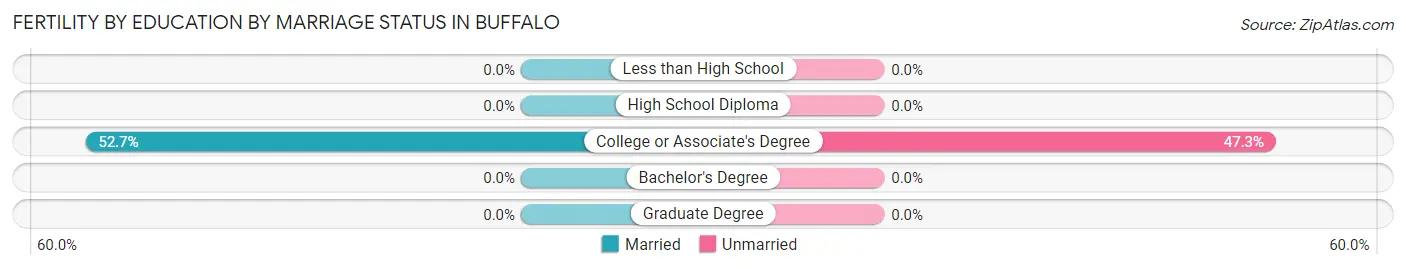
| Educational Attainment | Married | Unmarried |
| Less than High School | 0 (0.0%) | 0 (0.0%) |
| High School Diploma | 0 (0.0%) | 0 (0.0%) |
| College or Associate's Degree | 109 (52.7%) | 98 (47.3%) |
| Bachelor's Degree | 0 (0.0%) | 0 (0.0%) |
| Graduate Degree | 0 (0.0%) | 0 (0.0%) |
| Total | 109 (52.7%) | 98 (47.3%) |
Employment Characteristics in Buffalo
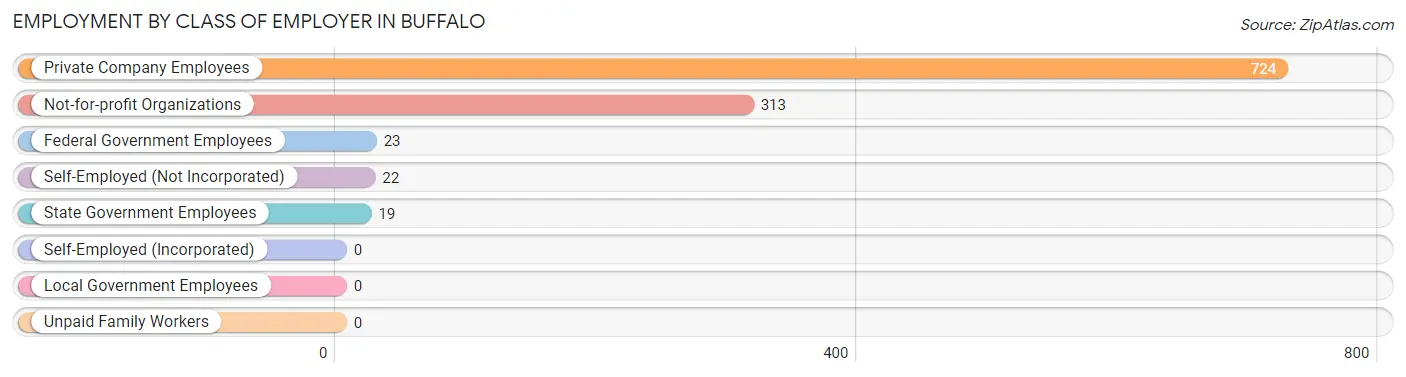
Employment by Class of Employer in Buffalo
Among the 1,101 employed individuals in Buffalo, private company employees (724 | 65.8%), not-for-profit organizations (313 | 28.4%), and federal government employees (23 | 2.1%) make up the most common classes of employment.
| Employer Class | # Employees | % Employees |
| Private Company Employees | 724 | 65.8% |
| Self-Employed (Incorporated) | 0 | 0.0% |
| Self-Employed (Not Incorporated) | 22 | 2.0% |
| Not-for-profit Organizations | 313 | 28.4% |
| Local Government Employees | 0 | 0.0% |
| State Government Employees | 19 | 1.7% |
| Federal Government Employees | 23 | 2.1% |
| Unpaid Family Workers | 0 | 0.0% |
| Total | 1,101 | 100.0% |
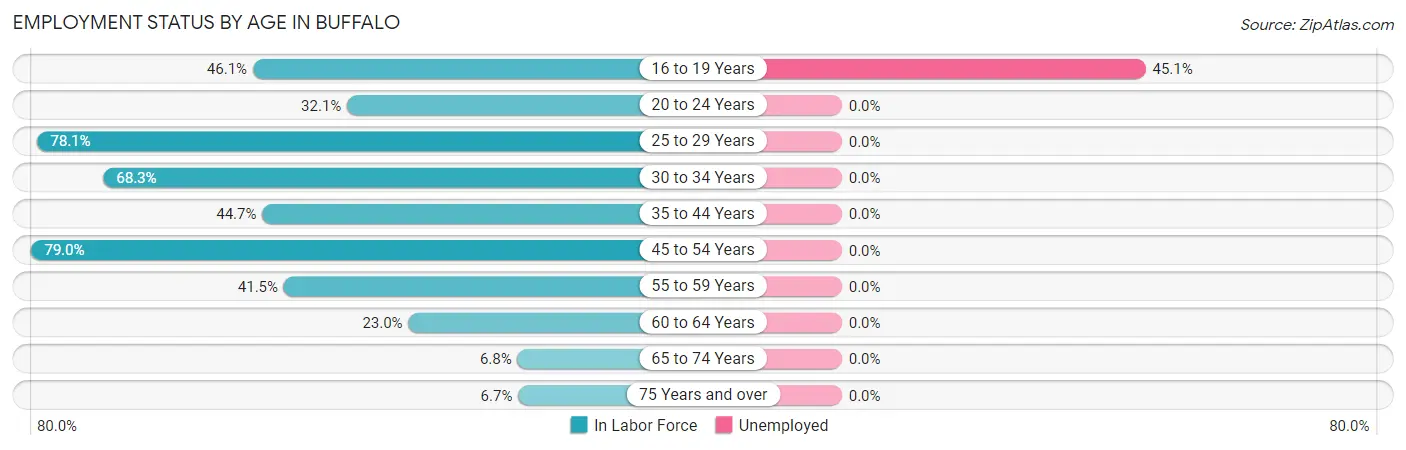
Employment Status by Age in Buffalo
According to the labor force statistics for Buffalo, out of the total population over 16 years of age (2,668), 43.4% or 1,158 individuals are in the labor force, with 2.8% or 32 of them unemployed. The age group with the highest labor force participation rate is 45 to 54 years, with 79.0% or 271 individuals in the labor force. Within the labor force, the 16 to 19 years age range has the highest percentage of unemployed individuals, with 45.1% or 32 of them being unemployed.
| Age Bracket | In Labor Force | Unemployed |
| 16 to 19 Years | 71 (46.1%) | 32 (45.1%) |
| 20 to 24 Years | 61 (32.1%) | 0 (0.0%) |
| 25 to 29 Years | 353 (78.1%) | 0 (0.0%) |
| 30 to 34 Years | 86 (68.3%) | 0 (0.0%) |
| 35 to 44 Years | 143 (44.7%) | 0 (0.0%) |
| 45 to 54 Years | 271 (79.0%) | 0 (0.0%) |
| 55 to 59 Years | 80 (41.5%) | 0 (0.0%) |
| 60 to 64 Years | 48 (23.0%) | 0 (0.0%) |
| 65 to 74 Years | 22 (6.8%) | 0 (0.0%) |
| 75 Years and over | 24 (6.7%) | 0 (0.0%) |
| Total | 1,158 (43.4%) | 32 (2.8%) |
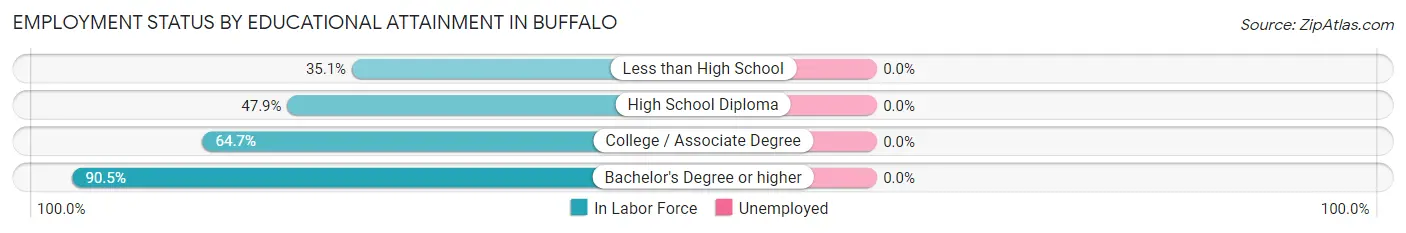
Employment Status by Educational Attainment in Buffalo
| Educational Attainment | In Labor Force | Unemployed |
| Less than High School | 27 (35.1%) | 0 (0.0%) |
| High School Diploma | 376 (47.9%) | 0 (0.0%) |
| College / Associate Degree | 322 (64.7%) | 0 (0.0%) |
| Bachelor's Degree or higher | 256 (90.5%) | 0 (0.0%) |
| Total | 981 (59.7%) | 0 (0.0%) |
Employment Occupations by Sex in Buffalo
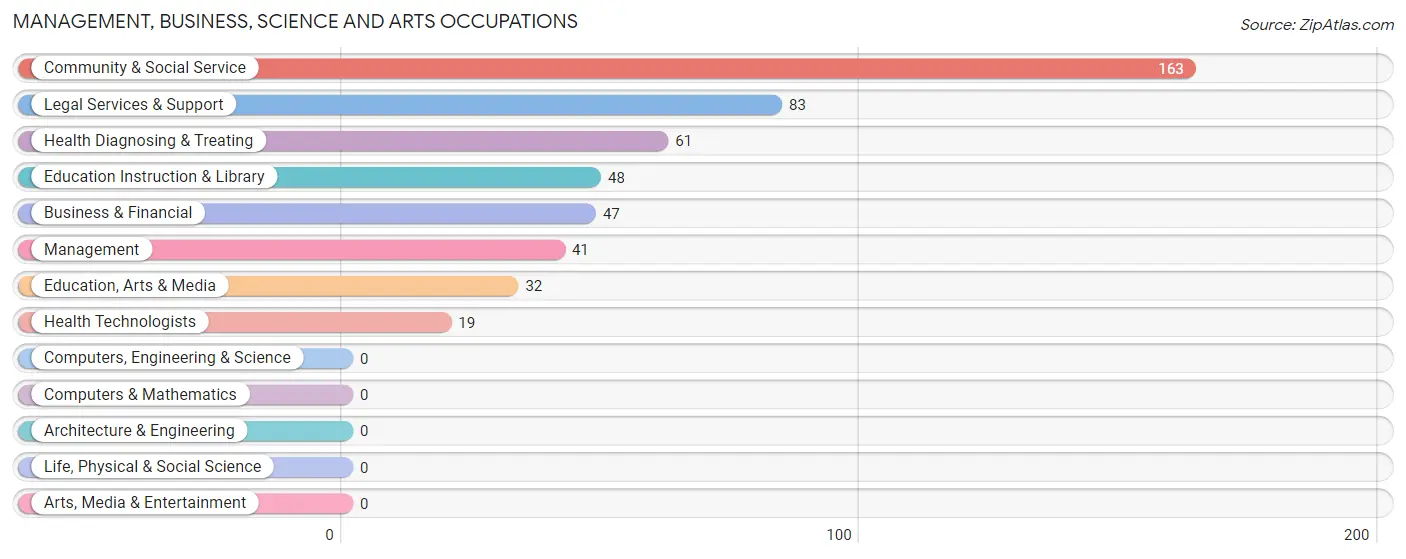
Management, Business, Science and Arts Occupations
The most common Management, Business, Science and Arts occupations in Buffalo are Community & Social Service (163 | 14.5%), Legal Services & Support (83 | 7.4%), Health Diagnosing & Treating (61 | 5.4%), Education Instruction & Library (48 | 4.3%), and Business & Financial (47 | 4.2%).
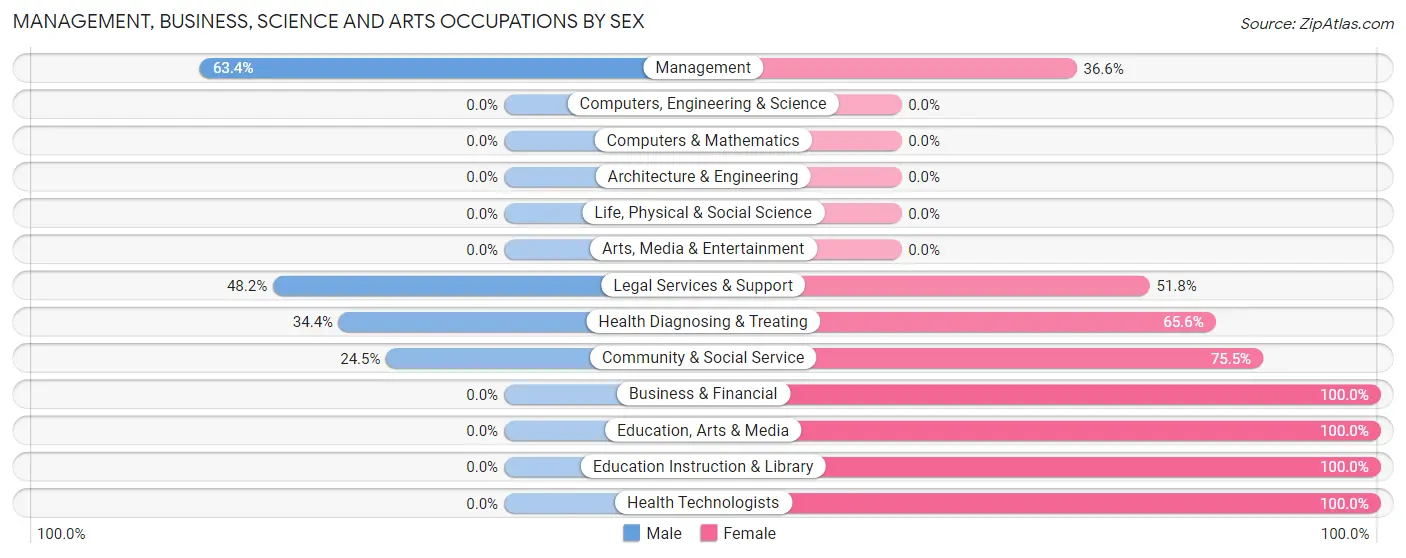
Management, Business, Science and Arts Occupations by Sex
Within the Management, Business, Science and Arts occupations in Buffalo, the most male-oriented occupations are Management (63.4%), Legal Services & Support (48.2%), and Health Diagnosing & Treating (34.4%), while the most female-oriented occupations are Business & Financial (100.0%), Education, Arts & Media (100.0%), and Education Instruction & Library (100.0%).
| Occupation | Male | Female |
| Management | 26 (63.4%) | 15 (36.6%) |
| Business & Financial | 0 (0.0%) | 47 (100.0%) |
| Computers, Engineering & Science | 0 (0.0%) | 0 (0.0%) |
| Computers & Mathematics | 0 (0.0%) | 0 (0.0%) |
| Architecture & Engineering | 0 (0.0%) | 0 (0.0%) |
| Life, Physical & Social Science | 0 (0.0%) | 0 (0.0%) |
| Community & Social Service | 40 (24.5%) | 123 (75.5%) |
| Education, Arts & Media | 0 (0.0%) | 32 (100.0%) |
| Legal Services & Support | 40 (48.2%) | 43 (51.8%) |
| Education Instruction & Library | 0 (0.0%) | 48 (100.0%) |
| Arts, Media & Entertainment | 0 (0.0%) | 0 (0.0%) |
| Health Diagnosing & Treating | 21 (34.4%) | 40 (65.6%) |
| Health Technologists | 0 (0.0%) | 19 (100.0%) |
| Total (Category) | 87 (27.9%) | 225 (72.1%) |
| Total (Overall) | 402 (35.7%) | 725 (64.3%) |
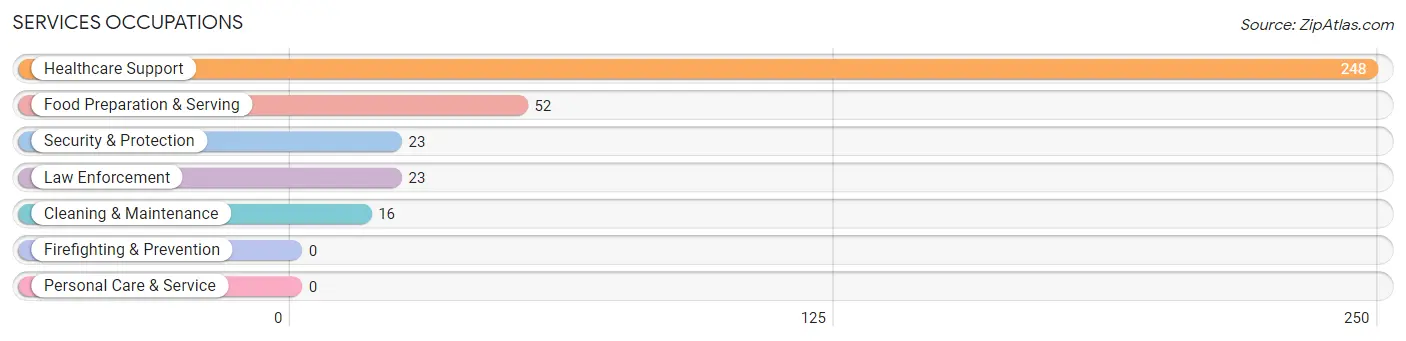
Services Occupations
The most common Services occupations in Buffalo are Healthcare Support (248 | 22.0%), Food Preparation & Serving (52 | 4.6%), Security & Protection (23 | 2.0%), Law Enforcement (23 | 2.0%), and Cleaning & Maintenance (16 | 1.4%).
Services Occupations by Sex
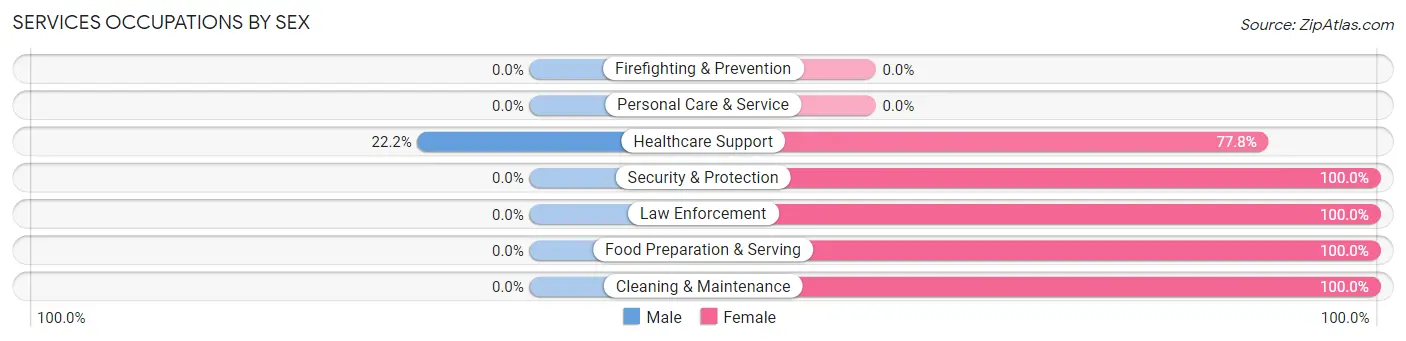
| Occupation | Male | Female |
| Healthcare Support | 55 (22.2%) | 193 (77.8%) |
| Security & Protection | 0 (0.0%) | 23 (100.0%) |
| Firefighting & Prevention | 0 (0.0%) | 0 (0.0%) |
| Law Enforcement | 0 (0.0%) | 23 (100.0%) |
| Food Preparation & Serving | 0 (0.0%) | 52 (100.0%) |
| Cleaning & Maintenance | 0 (0.0%) | 16 (100.0%) |
| Personal Care & Service | 0 (0.0%) | 0 (0.0%) |
| Total (Category) | 55 (16.2%) | 284 (83.8%) |
| Total (Overall) | 402 (35.7%) | 725 (64.3%) |
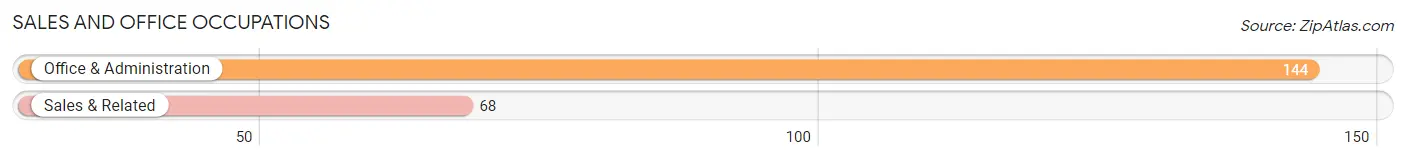
Sales and Office Occupations
The most common Sales and Office occupations in Buffalo are Office & Administration (144 | 12.8%), and Sales & Related (68 | 6.0%).
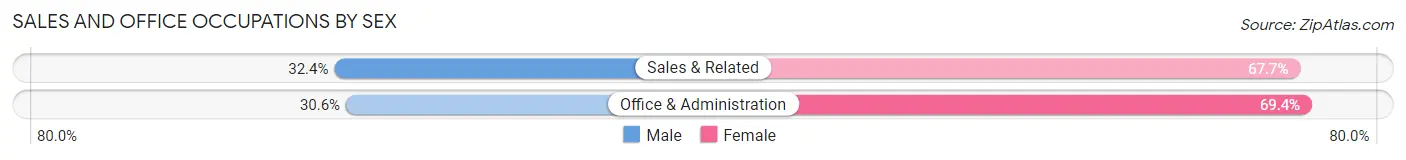
Sales and Office Occupations by Sex
| Occupation | Male | Female |
| Sales & Related | 22 (32.4%) | 46 (67.6%) |
| Office & Administration | 44 (30.6%) | 100 (69.4%) |
| Total (Category) | 66 (31.1%) | 146 (68.9%) |
| Total (Overall) | 402 (35.7%) | 725 (64.3%) |
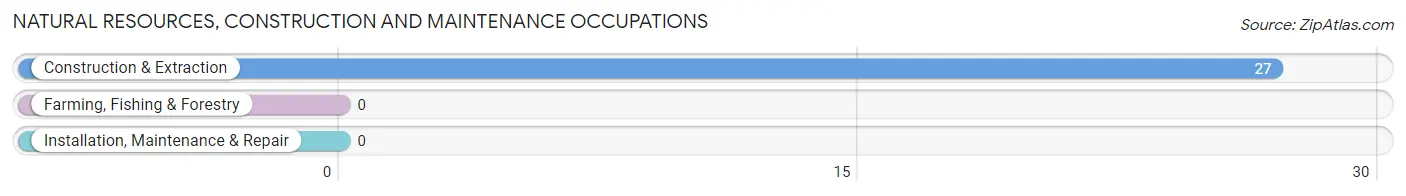
Natural Resources, Construction and Maintenance Occupations
The most common Natural Resources, Construction and Maintenance occupations in Buffalo are , and Construction & Extraction (27 | 2.4%).
Natural Resources, Construction and Maintenance Occupations by Sex

| Occupation | Male | Female |
| Farming, Fishing & Forestry | 0 (0.0%) | 0 (0.0%) |
| Construction & Extraction | 27 (100.0%) | 0 (0.0%) |
| Installation, Maintenance & Repair | 0 (0.0%) | 0 (0.0%) |
| Total (Category) | 27 (100.0%) | 0 (0.0%) |
| Total (Overall) | 402 (35.7%) | 725 (64.3%) |
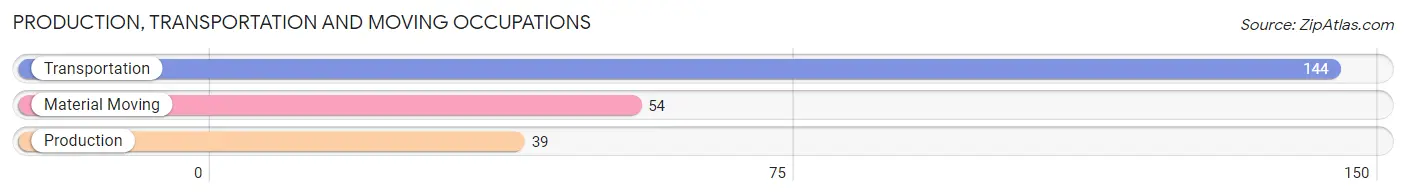
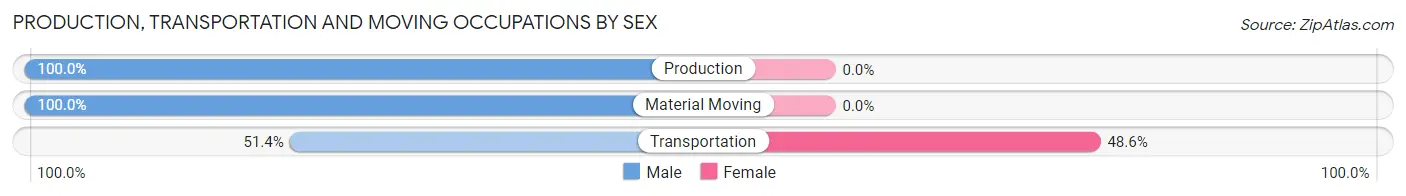
Production, Transportation and Moving Occupations
The most common Production, Transportation and Moving occupations in Buffalo are Transportation (144 | 12.8%), Material Moving (54 | 4.8%), and Production (39 | 3.5%).
Production, Transportation and Moving Occupations by Sex
| Occupation | Male | Female |
| Production | 39 (100.0%) | 0 (0.0%) |
| Transportation | 74 (51.4%) | 70 (48.6%) |
| Material Moving | 54 (100.0%) | 0 (0.0%) |
| Total (Category) | 167 (70.5%) | 70 (29.5%) |
| Total (Overall) | 402 (35.7%) | 725 (64.3%) |
Employment Industries by Sex in Buffalo
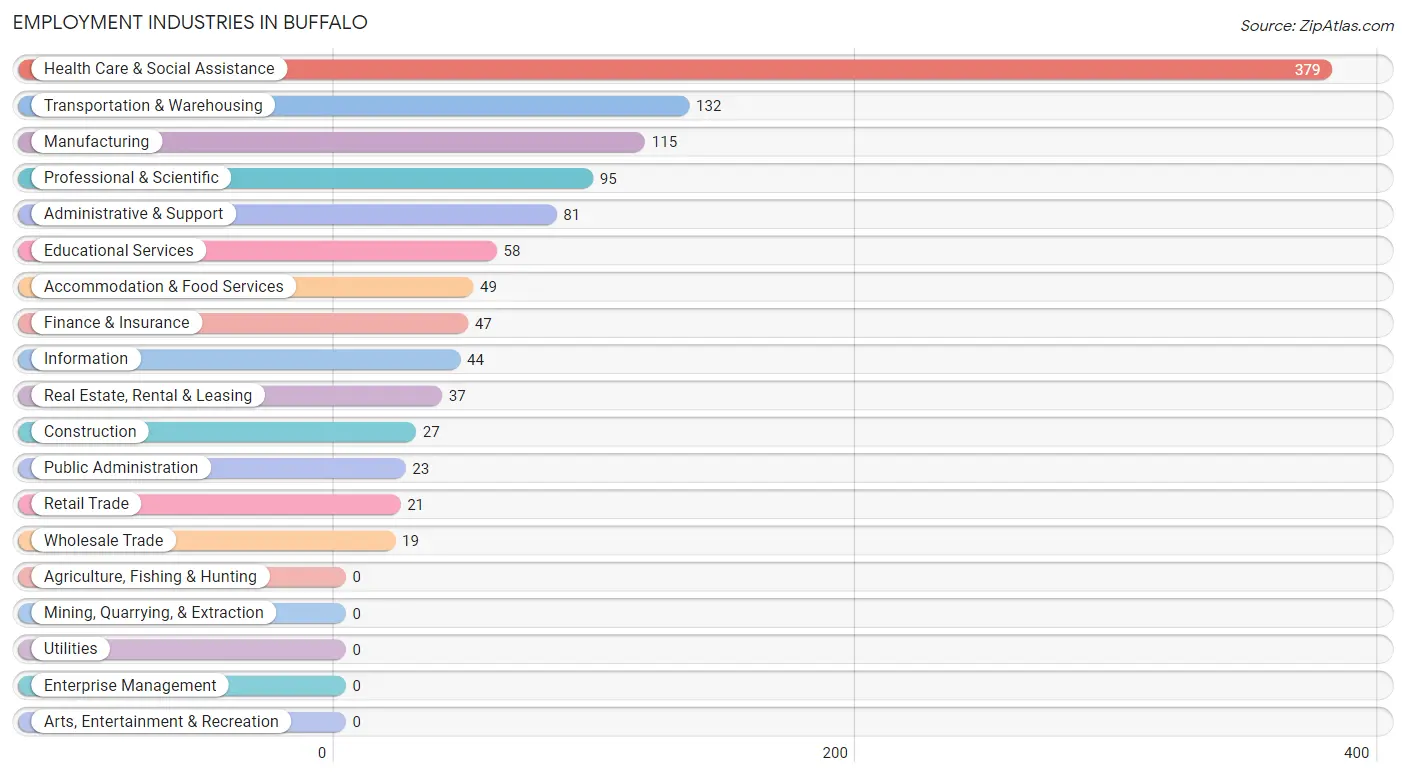
Employment Industries in Buffalo
The major employment industries in Buffalo include Health Care & Social Assistance (379 | 33.6%), Transportation & Warehousing (132 | 11.7%), Manufacturing (115 | 10.2%), Professional & Scientific (95 | 8.4%), and Administrative & Support (81 | 7.2%).
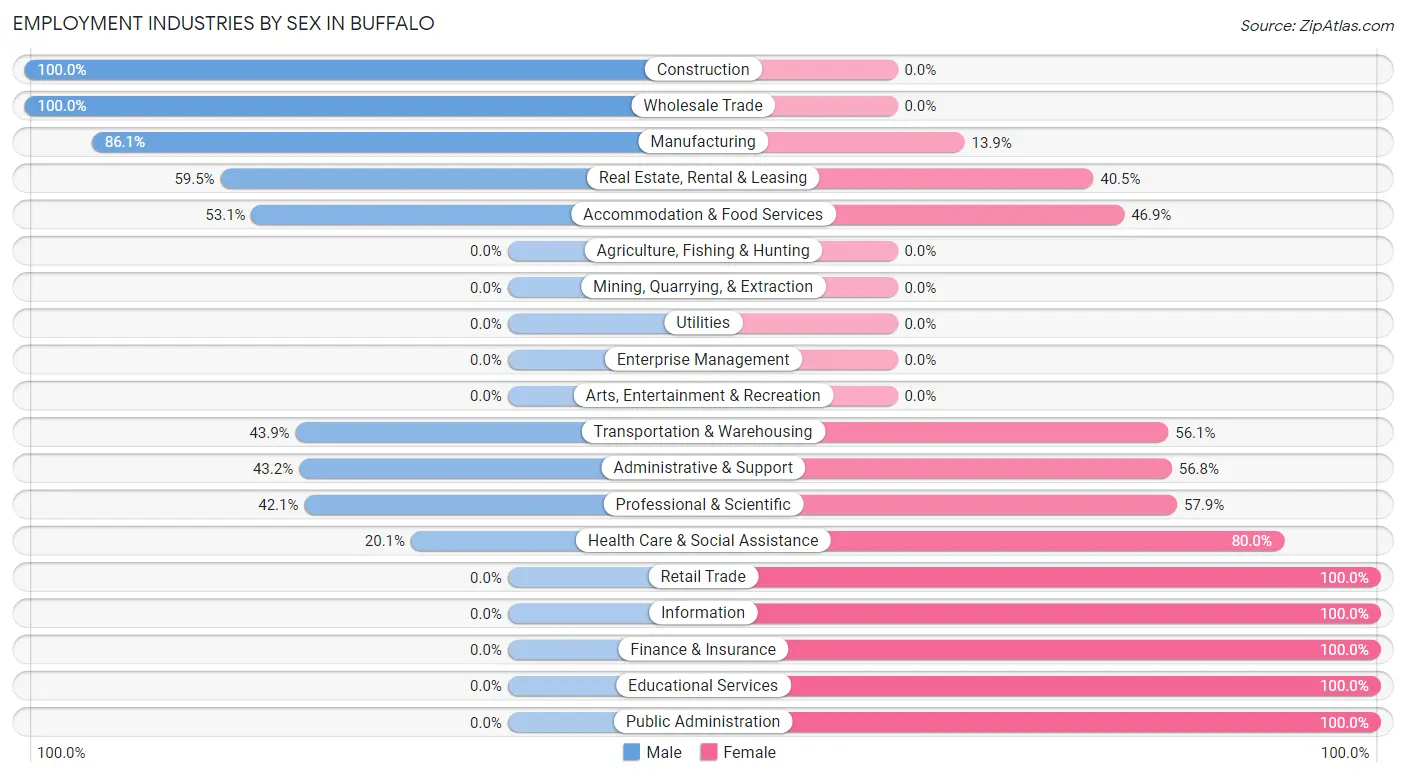
Employment Industries by Sex in Buffalo
The Buffalo industries that see more men than women are Construction (100.0%), Wholesale Trade (100.0%), and Manufacturing (86.1%), whereas the industries that tend to have a higher number of women are Retail Trade (100.0%), Information (100.0%), and Finance & Insurance (100.0%).
| Industry | Male | Female |
| Agriculture, Fishing & Hunting | 0 (0.0%) | 0 (0.0%) |
| Mining, Quarrying, & Extraction | 0 (0.0%) | 0 (0.0%) |
| Construction | 27 (100.0%) | 0 (0.0%) |
| Manufacturing | 99 (86.1%) | 16 (13.9%) |
| Wholesale Trade | 19 (100.0%) | 0 (0.0%) |
| Retail Trade | 0 (0.0%) | 21 (100.0%) |
| Transportation & Warehousing | 58 (43.9%) | 74 (56.1%) |
| Utilities | 0 (0.0%) | 0 (0.0%) |
| Information | 0 (0.0%) | 44 (100.0%) |
| Finance & Insurance | 0 (0.0%) | 47 (100.0%) |
| Real Estate, Rental & Leasing | 22 (59.5%) | 15 (40.5%) |
| Professional & Scientific | 40 (42.1%) | 55 (57.9%) |
| Enterprise Management | 0 (0.0%) | 0 (0.0%) |
| Administrative & Support | 35 (43.2%) | 46 (56.8%) |
| Educational Services | 0 (0.0%) | 58 (100.0%) |
| Health Care & Social Assistance | 76 (20.1%) | 303 (79.9%) |
| Arts, Entertainment & Recreation | 0 (0.0%) | 0 (0.0%) |
| Accommodation & Food Services | 26 (53.1%) | 23 (46.9%) |
| Public Administration | 0 (0.0%) | 23 (100.0%) |
| Total | 402 (35.7%) | 725 (64.3%) |
Education in Buffalo
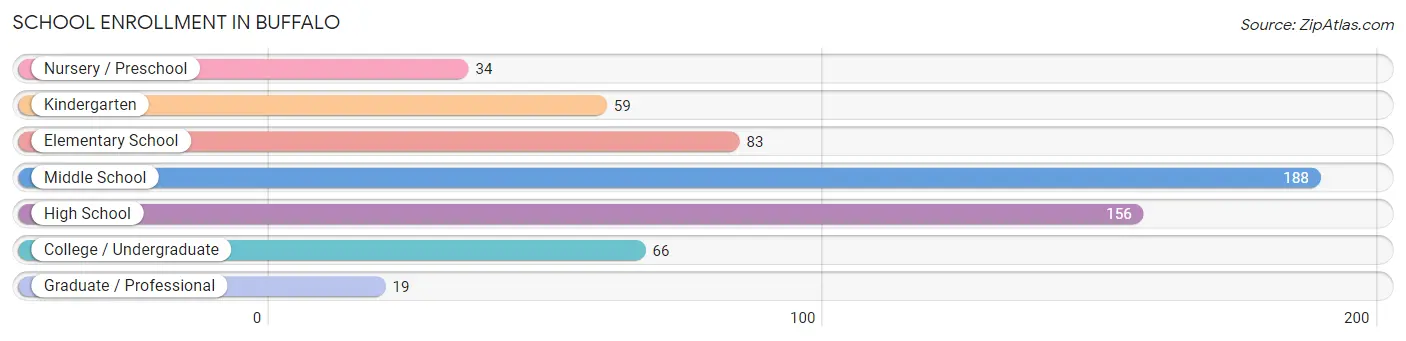
School Enrollment in Buffalo
The most common levels of schooling among the 605 students in Buffalo are middle school (188 | 31.1%), high school (156 | 25.8%), and elementary school (83 | 13.7%).
| School Level | # Students | % Students |
| Nursery / Preschool | 34 | 5.6% |
| Kindergarten | 59 | 9.8% |
| Elementary School | 83 | 13.7% |
| Middle School | 188 | 31.1% |
| High School | 156 | 25.8% |
| College / Undergraduate | 66 | 10.9% |
| Graduate / Professional | 19 | 3.1% |
| Total | 605 | 100.0% |
School Enrollment by Age by Funding Source in Buffalo
Out of a total of 605 students who are enrolled in schools in Buffalo, 35 (5.8%) attend a private institution, while the remaining 570 (94.2%) are enrolled in public schools. The age group of 20 to 24 year olds has the highest likelihood of being enrolled in private schools, with 35 (53.0% in the age bracket) enrolled. Conversely, the age group of 3 to 4 year olds has the lowest likelihood of being enrolled in a private school, with 34 (100.0% in the age bracket) attending a public institution.
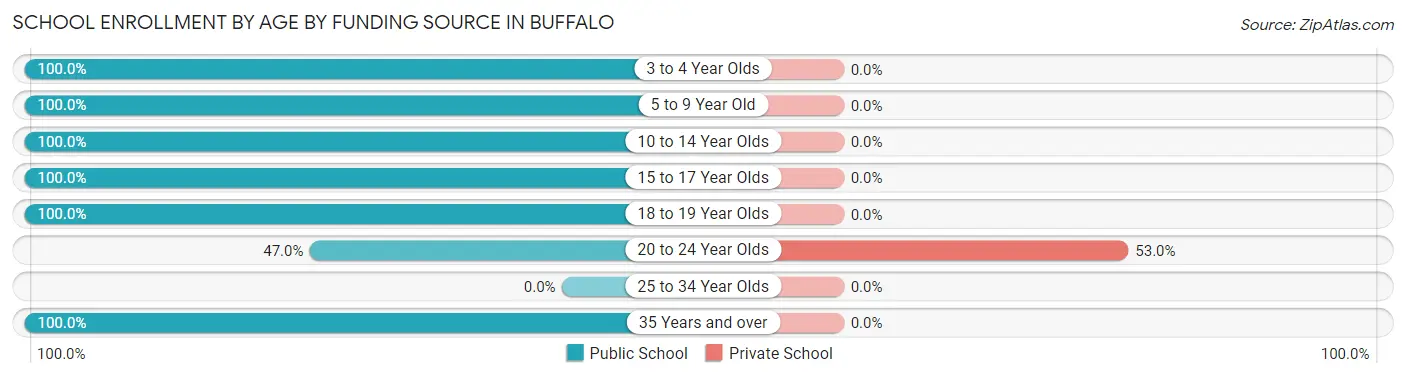
| Age Bracket | Public School | Private School |
| 3 to 4 Year Olds | 34 (100.0%) | 0 (0.0%) |
| 5 to 9 Year Old | 142 (100.0%) | 0 (0.0%) |
| 10 to 14 Year Olds | 188 (100.0%) | 0 (0.0%) |
| 15 to 17 Year Olds | 128 (100.0%) | 0 (0.0%) |
| 18 to 19 Year Olds | 28 (100.0%) | 0 (0.0%) |
| 20 to 24 Year Olds | 31 (47.0%) | 35 (53.0%) |
| 25 to 34 Year Olds | 0 (0.0%) | 0 (0.0%) |
| 35 Years and over | 19 (100.0%) | 0 (0.0%) |
| Total | 570 (94.2%) | 35 (5.8%) |
Educational Attainment by Field of Study in Buffalo
Arts & humanities (72 | 22.1%), business (63 | 19.3%), education (58 | 17.8%), science & technology (44 | 13.5%), and social sciences (43 | 13.2%) are the most common fields of study among 326 individuals in Buffalo who have obtained a bachelor's degree or higher.
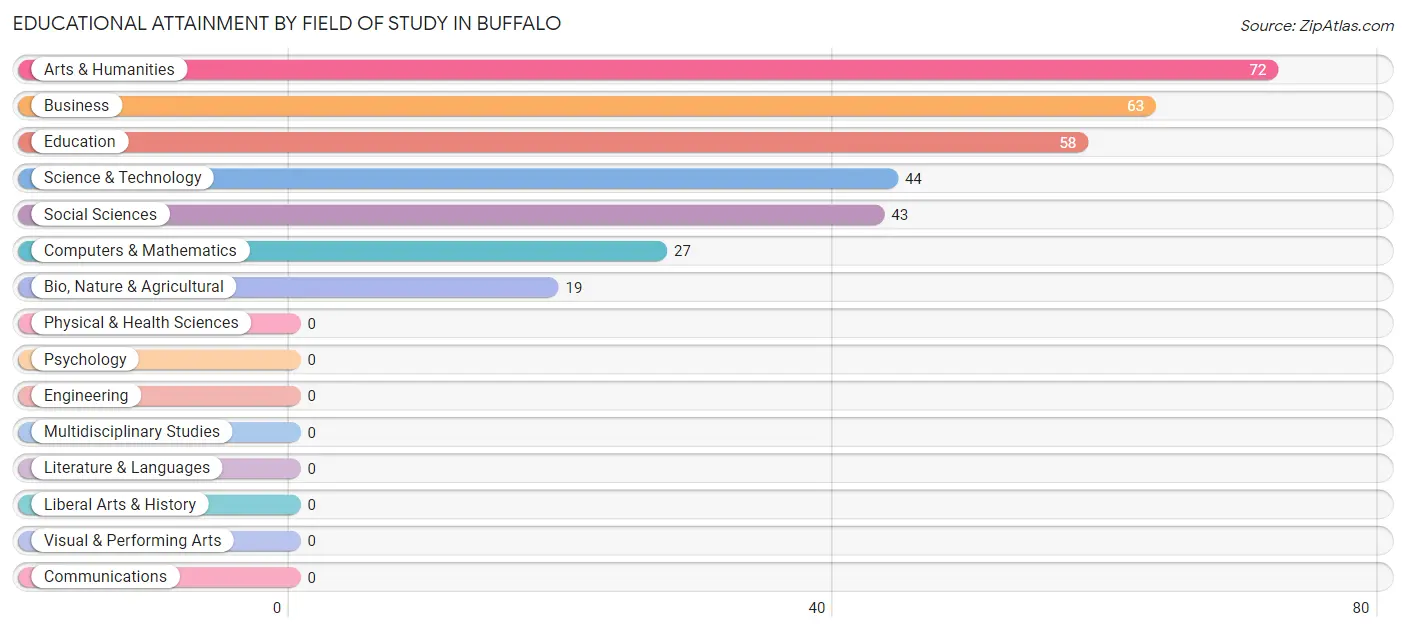
| Field of Study | # Graduates | % Graduates |
| Computers & Mathematics | 27 | 8.3% |
| Bio, Nature & Agricultural | 19 | 5.8% |
| Physical & Health Sciences | 0 | 0.0% |
| Psychology | 0 | 0.0% |
| Social Sciences | 43 | 13.2% |
| Engineering | 0 | 0.0% |
| Multidisciplinary Studies | 0 | 0.0% |
| Science & Technology | 44 | 13.5% |
| Business | 63 | 19.3% |
| Education | 58 | 17.8% |
| Literature & Languages | 0 | 0.0% |
| Liberal Arts & History | 0 | 0.0% |
| Visual & Performing Arts | 0 | 0.0% |
| Communications | 0 | 0.0% |
| Arts & Humanities | 72 | 22.1% |
| Total | 326 | 100.0% |
Transportation & Commute in Buffalo
Vehicle Availability by Sex in Buffalo
The most prevalent vehicle ownership categories in Buffalo are males with 2 vehicles (187, accounting for 49.7%) and females with 2 vehicles (237, making up 25.8%).
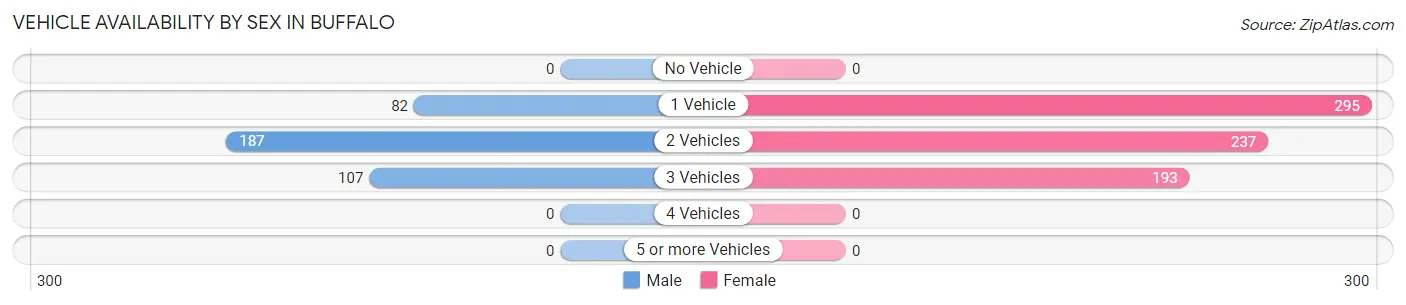
| Vehicles Available | Male | Female |
| No Vehicle | 0 (0.0%) | 0 (0.0%) |
| 1 Vehicle | 82 (21.8%) | 295 (40.7%) |
| 2 Vehicles | 187 (49.7%) | 237 (32.7%) |
| 3 Vehicles | 107 (28.5%) | 193 (26.6%) |
| 4 Vehicles | 0 (0.0%) | 0 (0.0%) |
| 5 or more Vehicles | 0 (0.0%) | 0 (0.0%) |
| Total | 376 (100.0%) | 725 (100.0%) |
Commute Time in Buffalo
The most frequently occuring commute durations in Buffalo are 30 to 34 minutes (191 commuters, 18.8%), 5 to 9 minutes (132 commuters, 13.0%), and 35 to 39 minutes (117 commuters, 11.5%).
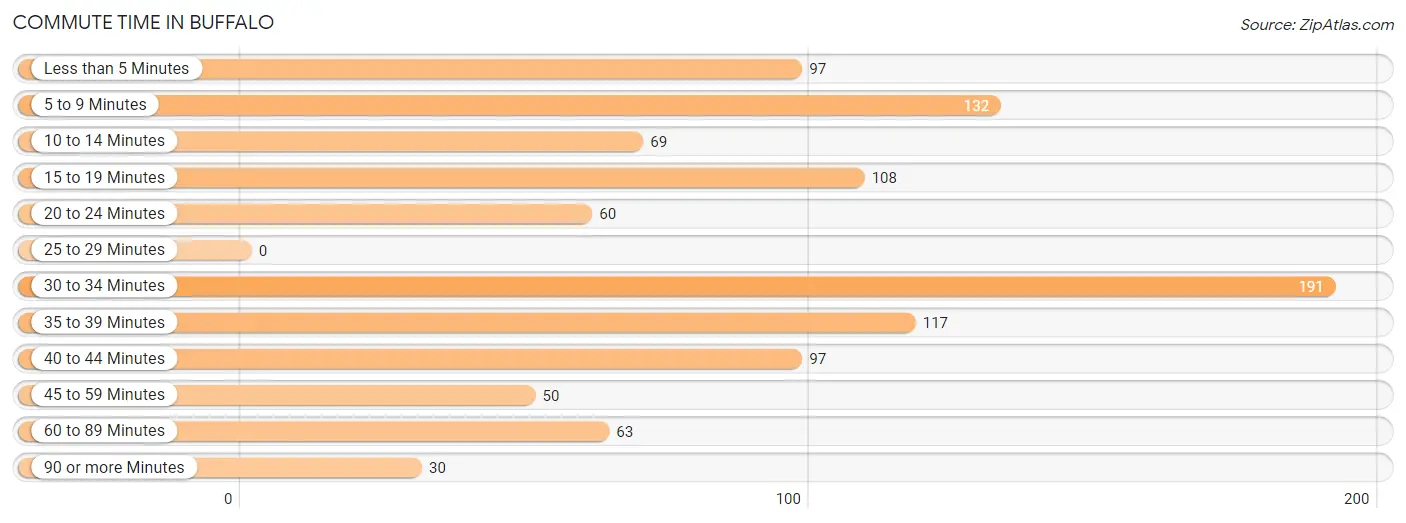
| Commute Time | # Commuters | % Commuters |
| Less than 5 Minutes | 97 | 9.6% |
| 5 to 9 Minutes | 132 | 13.0% |
| 10 to 14 Minutes | 69 | 6.8% |
| 15 to 19 Minutes | 108 | 10.6% |
| 20 to 24 Minutes | 60 | 5.9% |
| 25 to 29 Minutes | 0 | 0.0% |
| 30 to 34 Minutes | 191 | 18.8% |
| 35 to 39 Minutes | 117 | 11.5% |
| 40 to 44 Minutes | 97 | 9.6% |
| 45 to 59 Minutes | 50 | 4.9% |
| 60 to 89 Minutes | 63 | 6.2% |
| 90 or more Minutes | 30 | 3.0% |
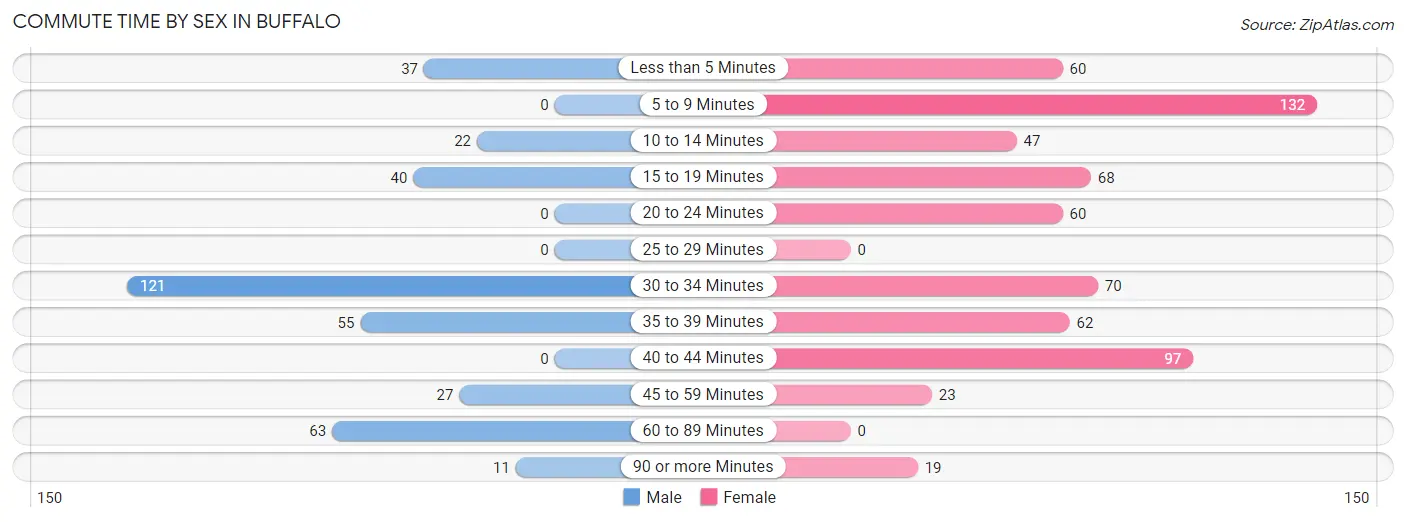
Commute Time by Sex in Buffalo
The most common commute times in Buffalo are 30 to 34 minutes (121 commuters, 32.2%) for males and 5 to 9 minutes (132 commuters, 20.7%) for females.
| Commute Time | Male | Female |
| Less than 5 Minutes | 37 (9.8%) | 60 (9.4%) |
| 5 to 9 Minutes | 0 (0.0%) | 132 (20.7%) |
| 10 to 14 Minutes | 22 (5.9%) | 47 (7.4%) |
| 15 to 19 Minutes | 40 (10.6%) | 68 (10.7%) |
| 20 to 24 Minutes | 0 (0.0%) | 60 (9.4%) |
| 25 to 29 Minutes | 0 (0.0%) | 0 (0.0%) |
| 30 to 34 Minutes | 121 (32.2%) | 70 (11.0%) |
| 35 to 39 Minutes | 55 (14.6%) | 62 (9.7%) |
| 40 to 44 Minutes | 0 (0.0%) | 97 (15.2%) |
| 45 to 59 Minutes | 27 (7.2%) | 23 (3.6%) |
| 60 to 89 Minutes | 63 (16.8%) | 0 (0.0%) |
| 90 or more Minutes | 11 (2.9%) | 19 (3.0%) |
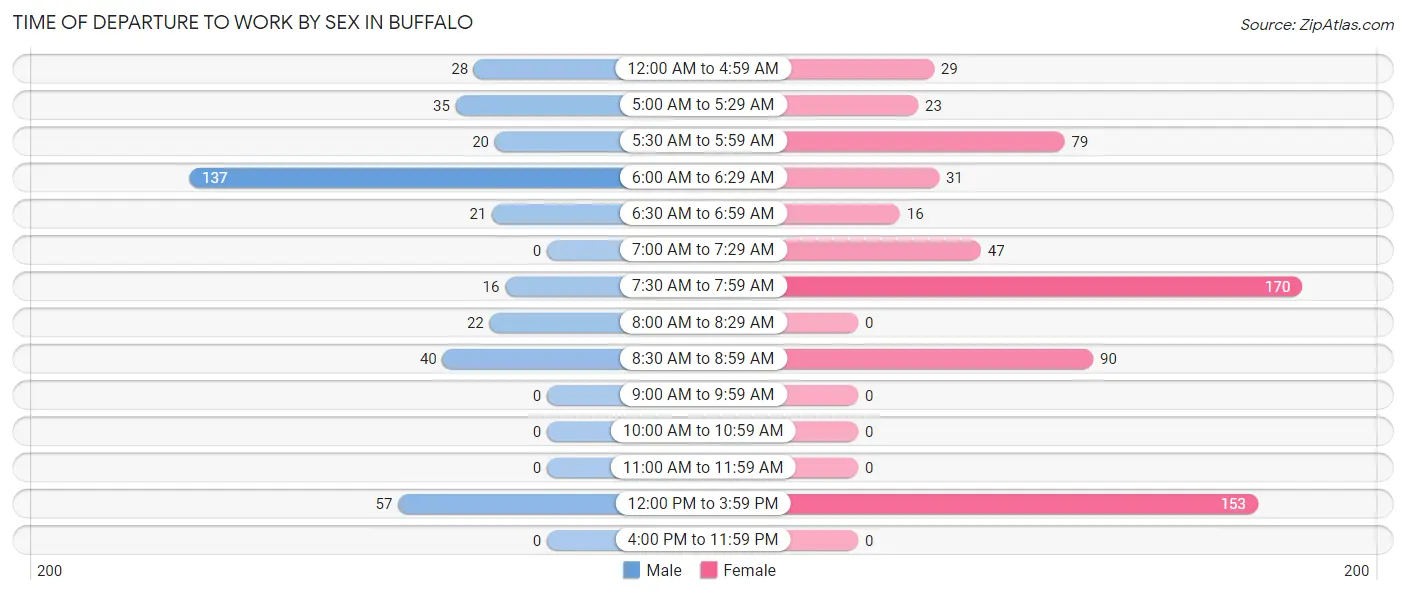
Time of Departure to Work by Sex in Buffalo
The most frequent times of departure to work in Buffalo are 6:00 AM to 6:29 AM (137, 36.4%) for males and 7:30 AM to 7:59 AM (170, 26.7%) for females.
| Time of Departure | Male | Female |
| 12:00 AM to 4:59 AM | 28 (7.4%) | 29 (4.5%) |
| 5:00 AM to 5:29 AM | 35 (9.3%) | 23 (3.6%) |
| 5:30 AM to 5:59 AM | 20 (5.3%) | 79 (12.4%) |
| 6:00 AM to 6:29 AM | 137 (36.4%) | 31 (4.9%) |
| 6:30 AM to 6:59 AM | 21 (5.6%) | 16 (2.5%) |
| 7:00 AM to 7:29 AM | 0 (0.0%) | 47 (7.4%) |
| 7:30 AM to 7:59 AM | 16 (4.3%) | 170 (26.7%) |
| 8:00 AM to 8:29 AM | 22 (5.9%) | 0 (0.0%) |
| 8:30 AM to 8:59 AM | 40 (10.6%) | 90 (14.1%) |
| 9:00 AM to 9:59 AM | 0 (0.0%) | 0 (0.0%) |
| 10:00 AM to 10:59 AM | 0 (0.0%) | 0 (0.0%) |
| 11:00 AM to 11:59 AM | 0 (0.0%) | 0 (0.0%) |
| 12:00 PM to 3:59 PM | 57 (15.2%) | 153 (24.0%) |
| 4:00 PM to 11:59 PM | 0 (0.0%) | 0 (0.0%) |
| Total | 376 (100.0%) | 638 (100.0%) |
Housing Occupancy in Buffalo
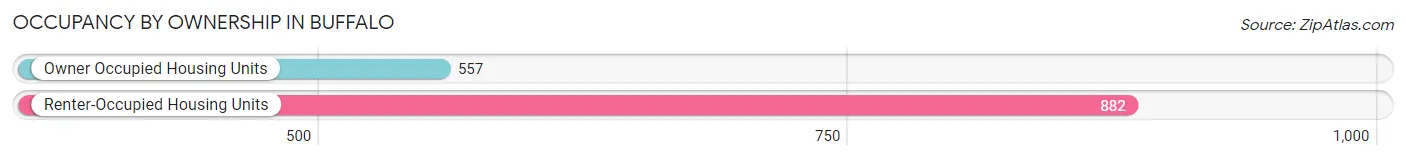
Occupancy by Ownership in Buffalo
Of the total 1,439 dwellings in Buffalo, owner-occupied units account for 557 (38.7%), while renter-occupied units make up 882 (61.3%).
| Occupancy | # Housing Units | % Housing Units |
| Owner Occupied Housing Units | 557 | 38.7% |
| Renter-Occupied Housing Units | 882 | 61.3% |
| Total Occupied Housing Units | 1,439 | 100.0% |
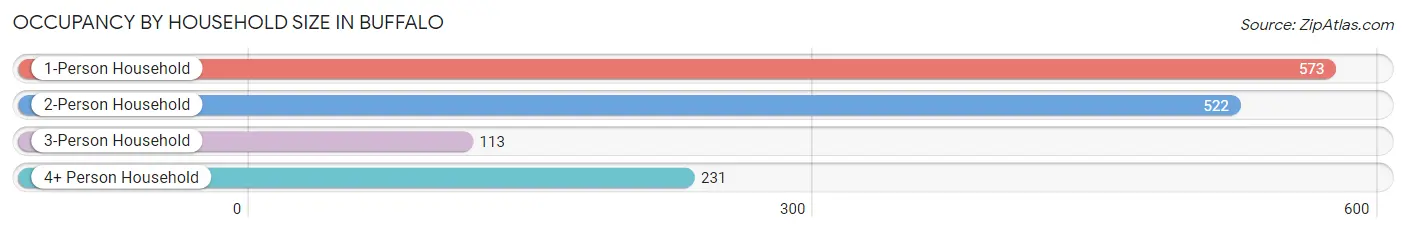
Occupancy by Household Size in Buffalo
| Household Size | # Housing Units | % Housing Units |
| 1-Person Household | 573 | 39.8% |
| 2-Person Household | 522 | 36.3% |
| 3-Person Household | 113 | 7.9% |
| 4+ Person Household | 231 | 16.1% |
| Total Housing Units | 1,439 | 100.0% |
Occupancy by Ownership by Household Size in Buffalo
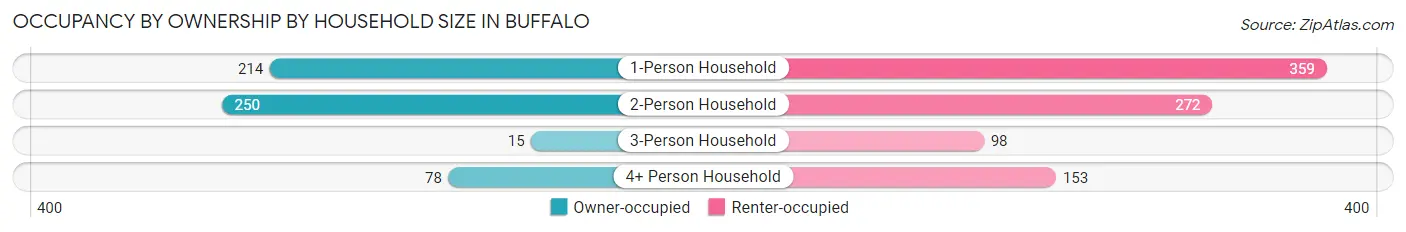
| Household Size | Owner-occupied | Renter-occupied |
| 1-Person Household | 214 (37.3%) | 359 (62.6%) |
| 2-Person Household | 250 (47.9%) | 272 (52.1%) |
| 3-Person Household | 15 (13.3%) | 98 (86.7%) |
| 4+ Person Household | 78 (33.8%) | 153 (66.2%) |
| Total Housing Units | 557 (38.7%) | 882 (61.3%) |
Occupancy by Educational Attainment in Buffalo
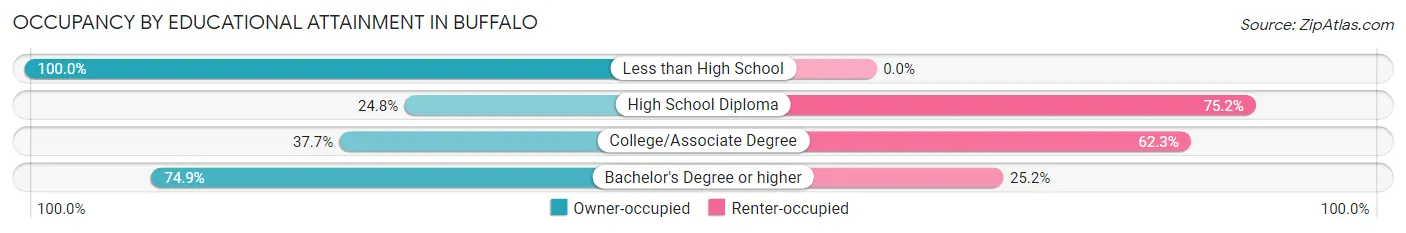
| Household Size | Owner-occupied | Renter-occupied |
| Less than High School | 71 (100.0%) | 0 (0.0%) |
| High School Diploma | 178 (24.8%) | 541 (75.2%) |
| College/Associate Degree | 180 (37.7%) | 298 (62.3%) |
| Bachelor's Degree or higher | 128 (74.9%) | 43 (25.2%) |
Occupancy by Age of Householder in Buffalo
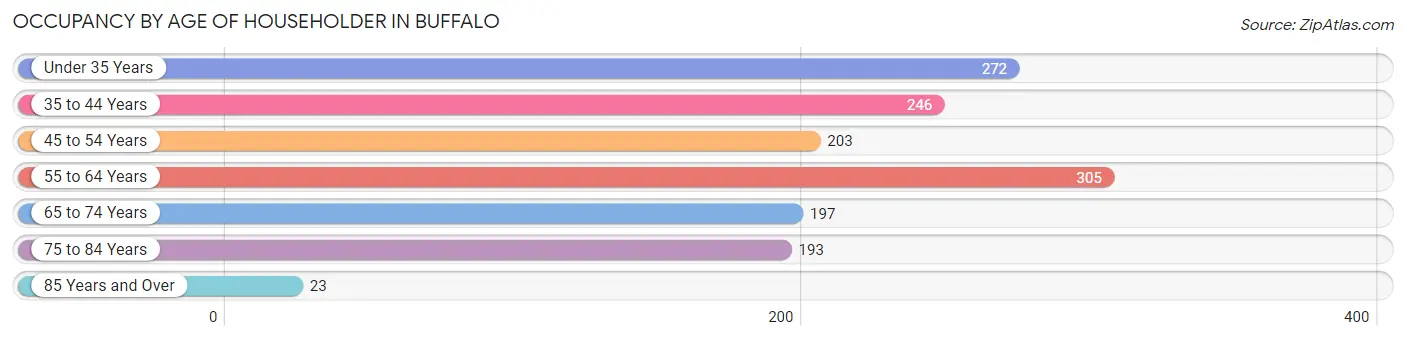
| Age Bracket | # Households | % Households |
| Under 35 Years | 272 | 18.9% |
| 35 to 44 Years | 246 | 17.1% |
| 45 to 54 Years | 203 | 14.1% |
| 55 to 64 Years | 305 | 21.2% |
| 65 to 74 Years | 197 | 13.7% |
| 75 to 84 Years | 193 | 13.4% |
| 85 Years and Over | 23 | 1.6% |
| Total | 1,439 | 100.0% |
Housing Finances in Buffalo
Median Income by Occupancy in Buffalo
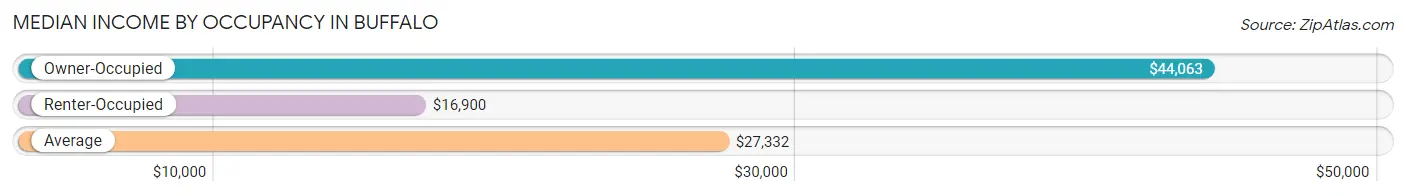
| Occupancy Type | # Households | Median Income |
| Owner-Occupied | 557 (38.7%) | $44,063 |
| Renter-Occupied | 882 (61.3%) | $16,900 |
| Average | 1,439 (100.0%) | $27,332 |
Occupancy by Householder Income Bracket in Buffalo
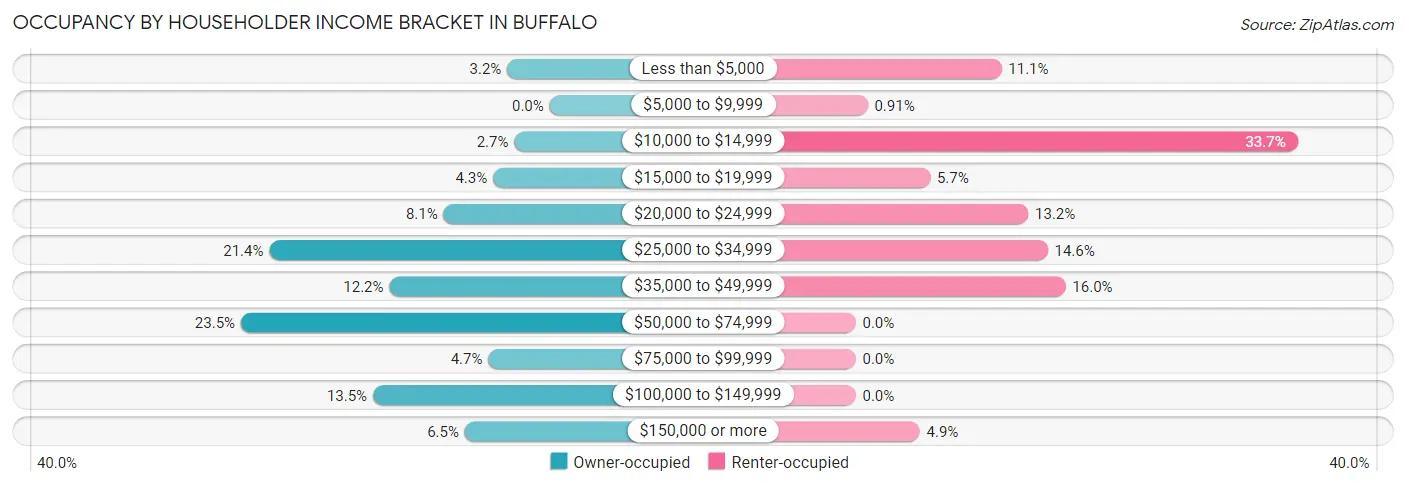
| Income Bracket | Owner-occupied | Renter-occupied |
| Less than $5,000 | 18 (3.2%) | 98 (11.1%) |
| $5,000 to $9,999 | 0 (0.0%) | 8 (0.9%) |
| $10,000 to $14,999 | 15 (2.7%) | 297 (33.7%) |
| $15,000 to $19,999 | 24 (4.3%) | 50 (5.7%) |
| $20,000 to $24,999 | 45 (8.1%) | 116 (13.2%) |
| $25,000 to $34,999 | 119 (21.4%) | 129 (14.6%) |
| $35,000 to $49,999 | 68 (12.2%) | 141 (16.0%) |
| $50,000 to $74,999 | 131 (23.5%) | 0 (0.0%) |
| $75,000 to $99,999 | 26 (4.7%) | 0 (0.0%) |
| $100,000 to $149,999 | 75 (13.5%) | 0 (0.0%) |
| $150,000 or more | 36 (6.5%) | 43 (4.9%) |
| Total | 557 (100.0%) | 882 (100.0%) |
Monthly Housing Cost Tiers in Buffalo
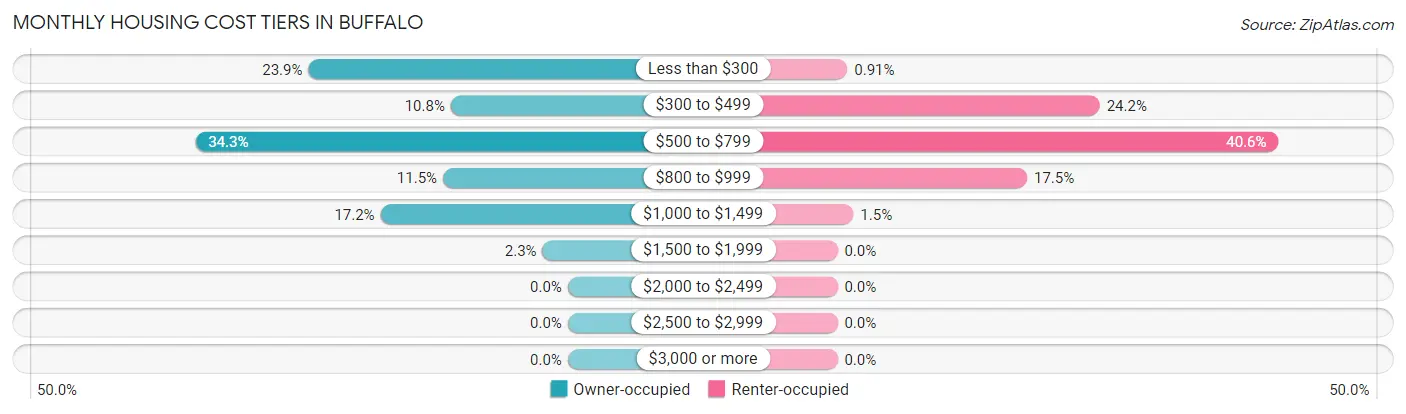
| Monthly Cost | Owner-occupied | Renter-occupied |
| Less than $300 | 133 (23.9%) | 8 (0.9%) |
| $300 to $499 | 60 (10.8%) | 213 (24.1%) |
| $500 to $799 | 191 (34.3%) | 358 (40.6%) |
| $800 to $999 | 64 (11.5%) | 154 (17.5%) |
| $1,000 to $1,499 | 96 (17.2%) | 13 (1.5%) |
| $1,500 to $1,999 | 13 (2.3%) | 0 (0.0%) |
| $2,000 to $2,499 | 0 (0.0%) | 0 (0.0%) |
| $2,500 to $2,999 | 0 (0.0%) | 0 (0.0%) |
| $3,000 or more | 0 (0.0%) | 0 (0.0%) |
| Total | 557 (100.0%) | 882 (100.0%) |
Physical Housing Characteristics in Buffalo
Housing Structures in Buffalo
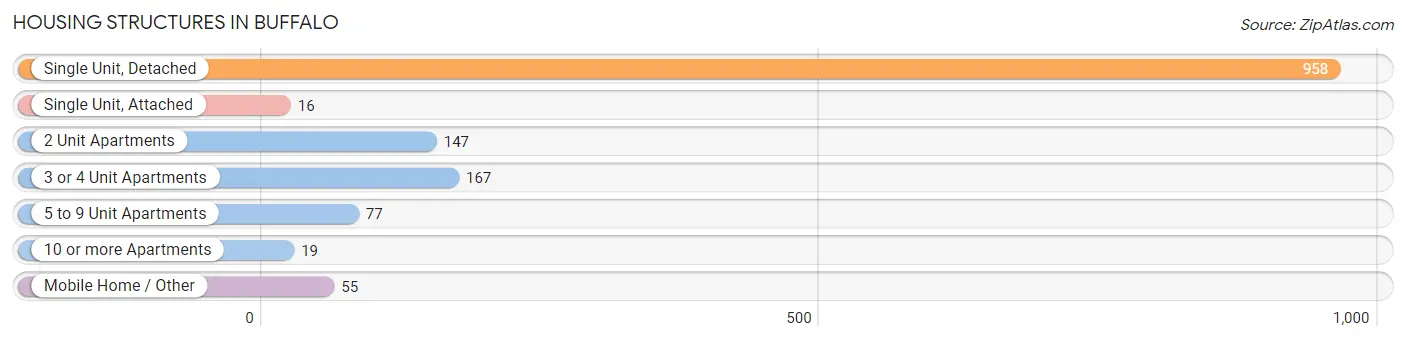
| Structure Type | # Housing Units | % Housing Units |
| Single Unit, Detached | 958 | 66.6% |
| Single Unit, Attached | 16 | 1.1% |
| 2 Unit Apartments | 147 | 10.2% |
| 3 or 4 Unit Apartments | 167 | 11.6% |
| 5 to 9 Unit Apartments | 77 | 5.3% |
| 10 or more Apartments | 19 | 1.3% |
| Mobile Home / Other | 55 | 3.8% |
| Total | 1,439 | 100.0% |
Housing Structures by Occupancy in Buffalo
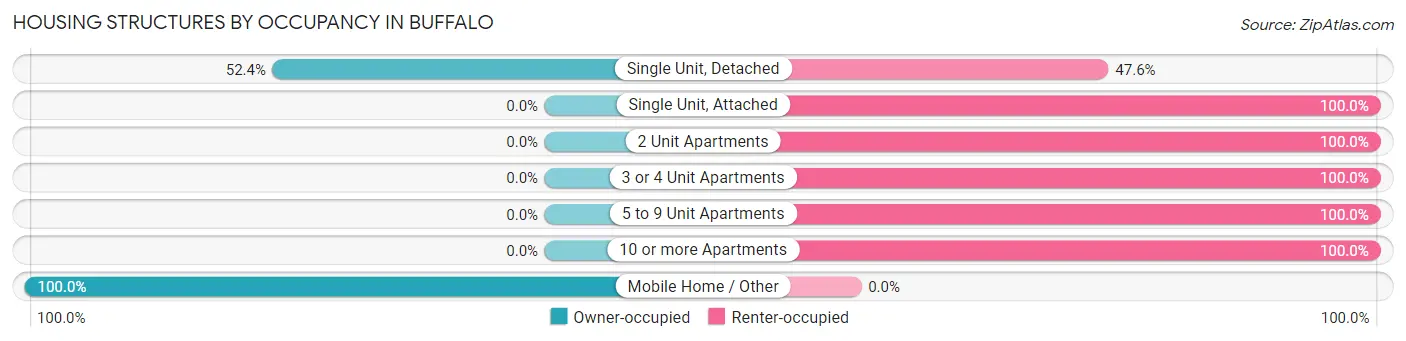
| Structure Type | Owner-occupied | Renter-occupied |
| Single Unit, Detached | 502 (52.4%) | 456 (47.6%) |
| Single Unit, Attached | 0 (0.0%) | 16 (100.0%) |
| 2 Unit Apartments | 0 (0.0%) | 147 (100.0%) |
| 3 or 4 Unit Apartments | 0 (0.0%) | 167 (100.0%) |
| 5 to 9 Unit Apartments | 0 (0.0%) | 77 (100.0%) |
| 10 or more Apartments | 0 (0.0%) | 19 (100.0%) |
| Mobile Home / Other | 55 (100.0%) | 0 (0.0%) |
| Total | 557 (38.7%) | 882 (61.3%) |
Housing Structures by Number of Rooms in Buffalo
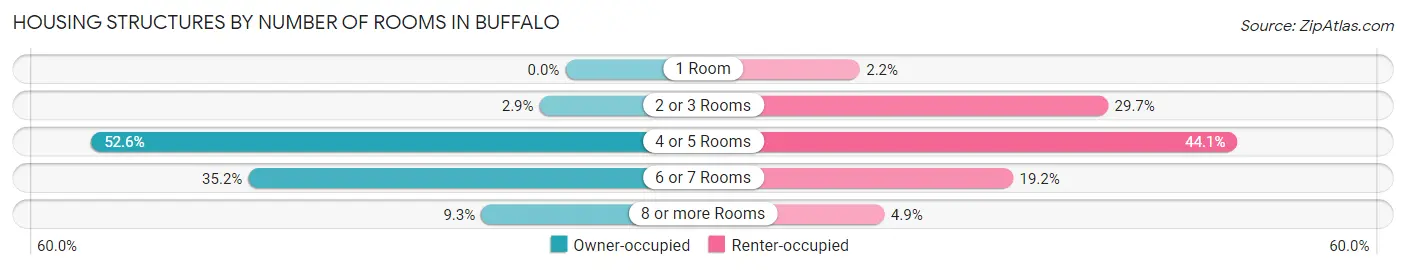
| Number of Rooms | Owner-occupied | Renter-occupied |
| 1 Room | 0 (0.0%) | 19 (2.1%) |
| 2 or 3 Rooms | 16 (2.9%) | 262 (29.7%) |
| 4 or 5 Rooms | 293 (52.6%) | 389 (44.1%) |
| 6 or 7 Rooms | 196 (35.2%) | 169 (19.2%) |
| 8 or more Rooms | 52 (9.3%) | 43 (4.9%) |
| Total | 557 (100.0%) | 882 (100.0%) |
Housing Structure by Heating Type in Buffalo
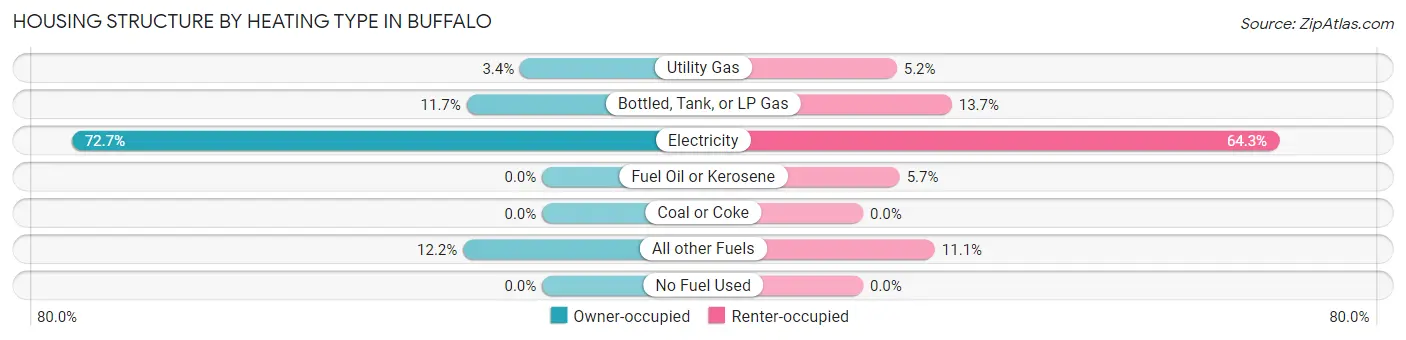
| Heating Type | Owner-occupied | Renter-occupied |
| Utility Gas | 19 (3.4%) | 46 (5.2%) |
| Bottled, Tank, or LP Gas | 65 (11.7%) | 121 (13.7%) |
| Electricity | 405 (72.7%) | 567 (64.3%) |
| Fuel Oil or Kerosene | 0 (0.0%) | 50 (5.7%) |
| Coal or Coke | 0 (0.0%) | 0 (0.0%) |
| All other Fuels | 68 (12.2%) | 98 (11.1%) |
| No Fuel Used | 0 (0.0%) | 0 (0.0%) |
| Total | 557 (100.0%) | 882 (100.0%) |
Household Vehicle Usage in Buffalo
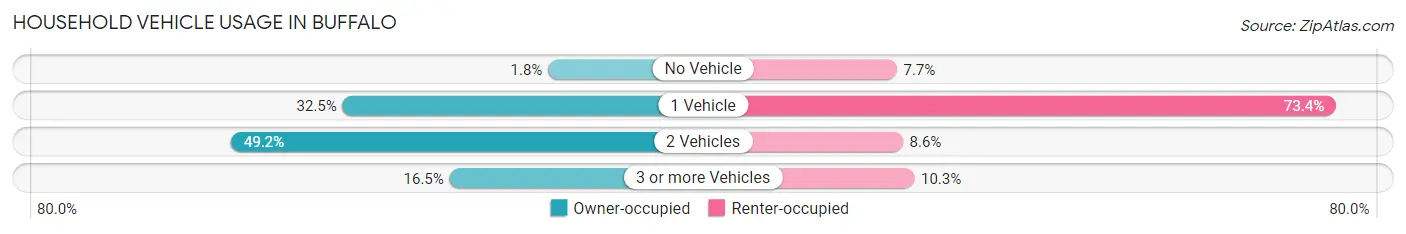
| Vehicles per Household | Owner-occupied | Renter-occupied |
| No Vehicle | 10 (1.8%) | 68 (7.7%) |
| 1 Vehicle | 181 (32.5%) | 647 (73.4%) |
| 2 Vehicles | 274 (49.2%) | 76 (8.6%) |
| 3 or more Vehicles | 92 (16.5%) | 91 (10.3%) |
| Total | 557 (100.0%) | 882 (100.0%) |
Real Estate & Mortgages in Buffalo
Real Estate and Mortgage Overview in Buffalo
| Characteristic | Without Mortgage | With Mortgage |
| Housing Units | 256 | 301 |
| Median Property Value | $100,000 | $97,100 |
| Median Household Income | $29,286 | $36 |
| Monthly Housing Costs | $294 | $0 |
| Real Estate Taxes | $568 | $0 |
Property Value by Mortgage Status in Buffalo
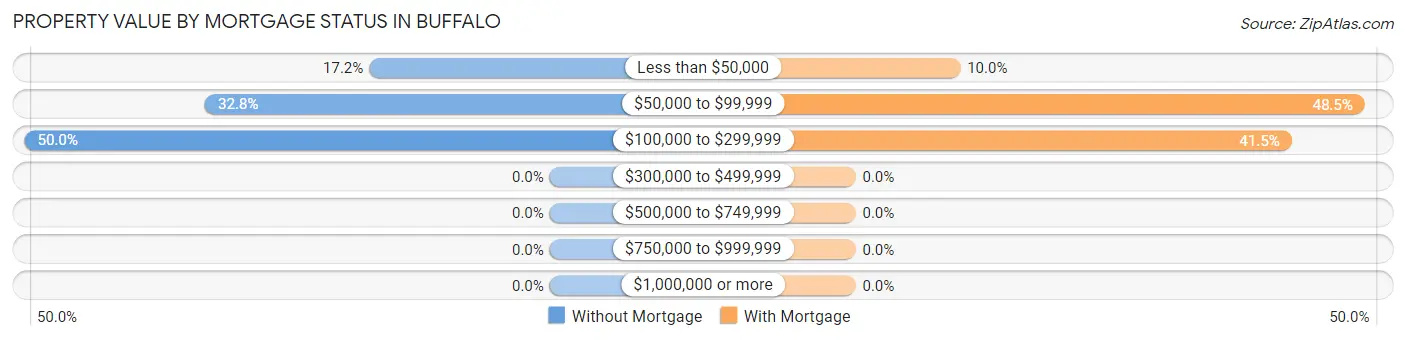
| Property Value | Without Mortgage | With Mortgage |
| Less than $50,000 | 44 (17.2%) | 30 (10.0%) |
| $50,000 to $99,999 | 84 (32.8%) | 146 (48.5%) |
| $100,000 to $299,999 | 128 (50.0%) | 125 (41.5%) |
| $300,000 to $499,999 | 0 (0.0%) | 0 (0.0%) |
| $500,000 to $749,999 | 0 (0.0%) | 0 (0.0%) |
| $750,000 to $999,999 | 0 (0.0%) | 0 (0.0%) |
| $1,000,000 or more | 0 (0.0%) | 0 (0.0%) |
| Total | 256 (100.0%) | 301 (100.0%) |
Household Income by Mortgage Status in Buffalo
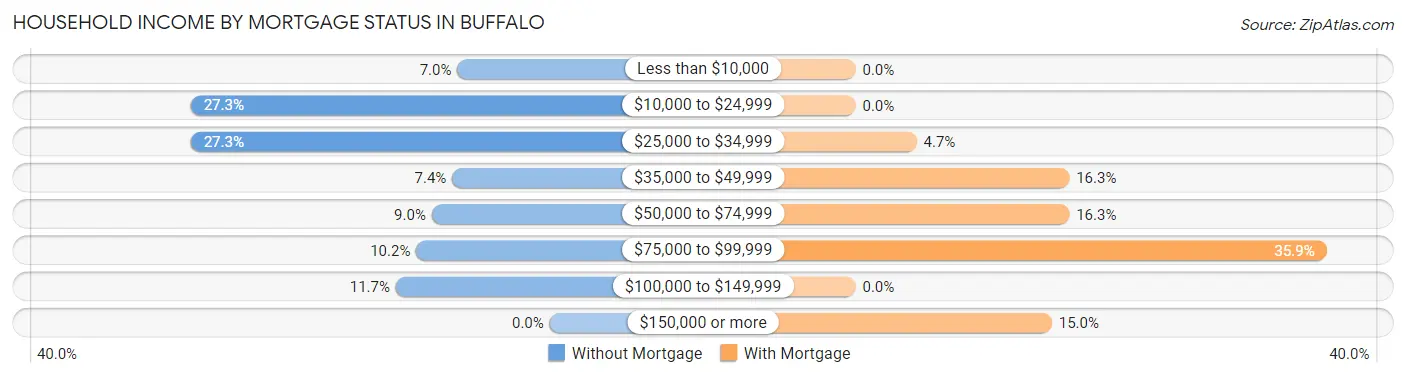
| Household Income | Without Mortgage | With Mortgage |
| Less than $10,000 | 18 (7.0%) | 0 (0.0%) |
| $10,000 to $24,999 | 70 (27.3%) | 0 (0.0%) |
| $25,000 to $34,999 | 70 (27.3%) | 14 (4.6%) |
| $35,000 to $49,999 | 19 (7.4%) | 49 (16.3%) |
| $50,000 to $74,999 | 23 (9.0%) | 49 (16.3%) |
| $75,000 to $99,999 | 26 (10.2%) | 108 (35.9%) |
| $100,000 to $149,999 | 30 (11.7%) | 0 (0.0%) |
| $150,000 or more | 0 (0.0%) | 45 (14.9%) |
| Total | 256 (100.0%) | 301 (100.0%) |
Property Value to Household Income Ratio in Buffalo
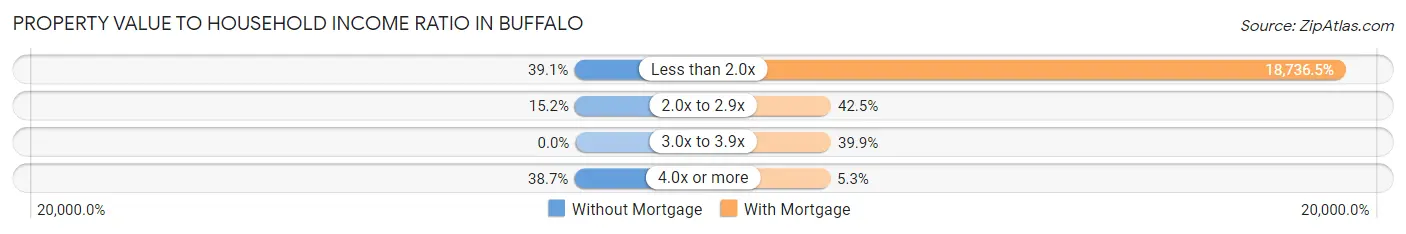
| Value-to-Income Ratio | Without Mortgage | With Mortgage |
| Less than 2.0x | 100 (39.1%) | 56,397 (18,736.5%) |
| 2.0x to 2.9x | 39 (15.2%) | 128 (42.5%) |
| 3.0x to 3.9x | 0 (0.0%) | 120 (39.9%) |
| 4.0x or more | 99 (38.7%) | 16 (5.3%) |
| Total | 256 (100.0%) | 301 (100.0%) |
Real Estate Taxes by Mortgage Status in Buffalo
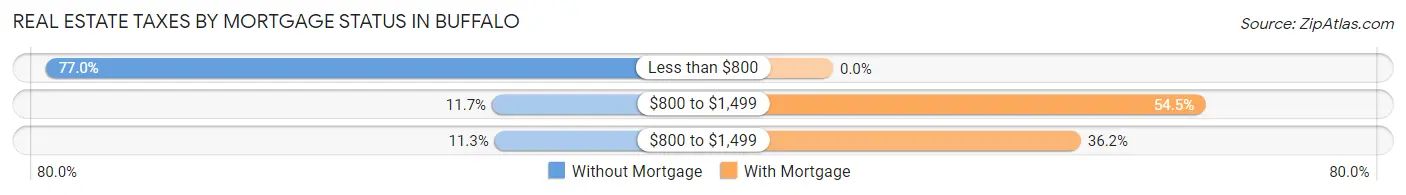
| Property Taxes | Without Mortgage | With Mortgage |
| Less than $800 | 197 (76.9%) | 0 (0.0%) |
| $800 to $1,499 | 30 (11.7%) | 164 (54.5%) |
| $800 to $1,499 | 29 (11.3%) | 109 (36.2%) |
| Total | 256 (100.0%) | 301 (100.0%) |
Health & Disability in Buffalo
Health Insurance Coverage by Age in Buffalo
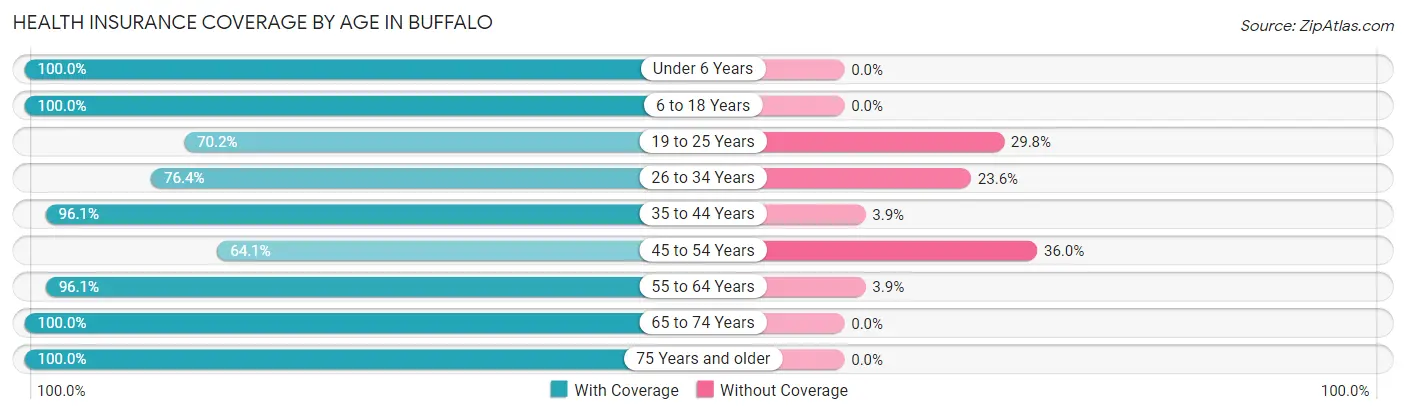
| Age Bracket | With Coverage | Without Coverage |
| Under 6 Years | 297 (100.0%) | 0 (0.0%) |
| 6 to 18 Years | 461 (100.0%) | 0 (0.0%) |
| 19 to 25 Years | 262 (70.2%) | 111 (29.8%) |
| 26 to 34 Years | 330 (76.4%) | 102 (23.6%) |
| 35 to 44 Years | 294 (96.1%) | 12 (3.9%) |
| 45 to 54 Years | 212 (64.0%) | 119 (35.9%) |
| 55 to 64 Years | 366 (96.1%) | 15 (3.9%) |
| 65 to 74 Years | 300 (100.0%) | 0 (0.0%) |
| 75 Years and older | 236 (100.0%) | 0 (0.0%) |
| Total | 2,758 (88.5%) | 359 (11.5%) |
Health Insurance Coverage by Citizenship Status in Buffalo
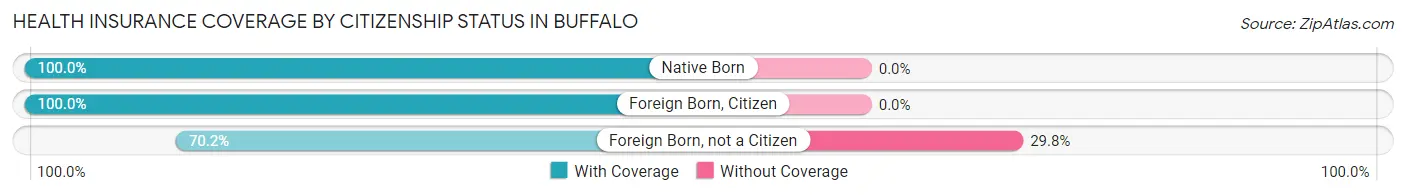
| Citizenship Status | With Coverage | Without Coverage |
| Native Born | 297 (100.0%) | 0 (0.0%) |
| Foreign Born, Citizen | 461 (100.0%) | 0 (0.0%) |
| Foreign Born, not a Citizen | 262 (70.2%) | 111 (29.8%) |
Health Insurance Coverage by Household Income in Buffalo
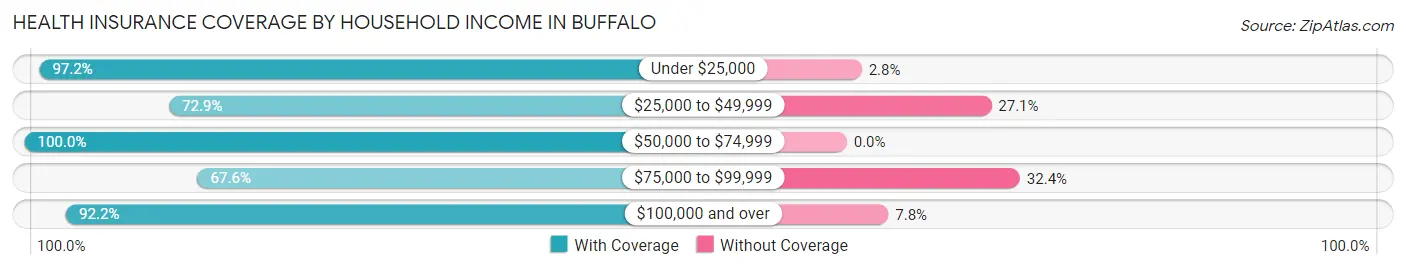
| Household Income | With Coverage | Without Coverage |
| Under $25,000 | 1,117 (97.2%) | 32 (2.8%) |
| $25,000 to $49,999 | 735 (72.9%) | 273 (27.1%) |
| $50,000 to $74,999 | 384 (100.0%) | 0 (0.0%) |
| $75,000 to $99,999 | 25 (67.6%) | 12 (32.4%) |
| $100,000 and over | 497 (92.2%) | 42 (7.8%) |
Public vs Private Health Insurance Coverage by Age in Buffalo
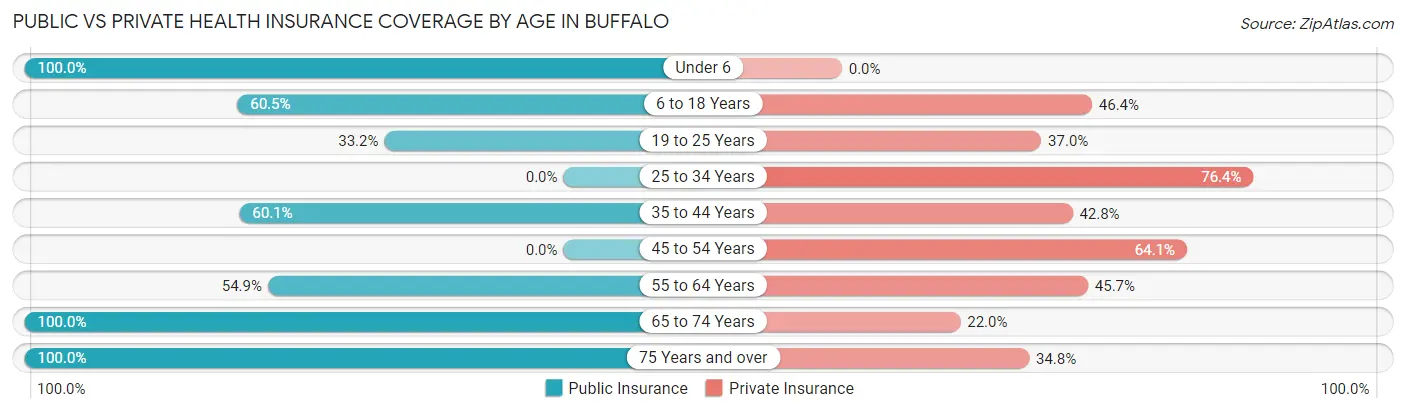
| Age Bracket | Public Insurance | Private Insurance |
| Under 6 | 297 (100.0%) | 0 (0.0%) |
| 6 to 18 Years | 279 (60.5%) | 214 (46.4%) |
| 19 to 25 Years | 124 (33.2%) | 138 (37.0%) |
| 25 to 34 Years | 0 (0.0%) | 330 (76.4%) |
| 35 to 44 Years | 184 (60.1%) | 131 (42.8%) |
| 45 to 54 Years | 0 (0.0%) | 212 (64.0%) |
| 55 to 64 Years | 209 (54.9%) | 174 (45.7%) |
| 65 to 74 Years | 300 (100.0%) | 66 (22.0%) |
| 75 Years and over | 236 (100.0%) | 82 (34.7%) |
| Total | 1,629 (52.3%) | 1,347 (43.2%) |
Disability Status by Sex by Age in Buffalo
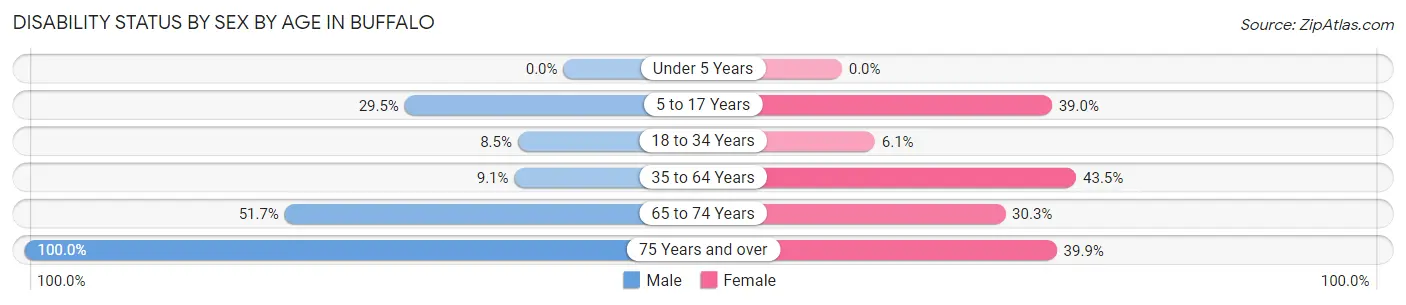
| Age Bracket | Male | Female |
| Under 5 Years | 0 (0.0%) | 0 (0.0%) |
| 5 to 17 Years | 81 (29.4%) | 83 (39.0%) |
| 18 to 34 Years | 28 (8.5%) | 31 (6.1%) |
| 35 to 64 Years | 29 (9.1%) | 304 (43.5%) |
| 65 to 74 Years | 75 (51.7%) | 47 (30.3%) |
| 75 Years and over | 68 (100.0%) | 67 (39.9%) |
Disability Class by Sex by Age in Buffalo
Disability Class: Hearing Difficulty
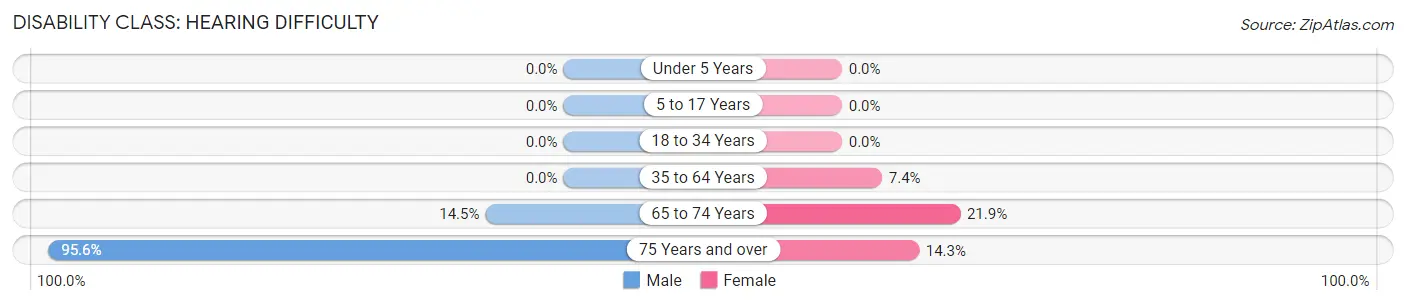
| Age Bracket | Male | Female |
| Under 5 Years | 0 (0.0%) | 0 (0.0%) |
| 5 to 17 Years | 0 (0.0%) | 0 (0.0%) |
| 18 to 34 Years | 0 (0.0%) | 0 (0.0%) |
| 35 to 64 Years | 0 (0.0%) | 52 (7.4%) |
| 65 to 74 Years | 21 (14.5%) | 34 (21.9%) |
| 75 Years and over | 65 (95.6%) | 24 (14.3%) |
Disability Class: Vision Difficulty
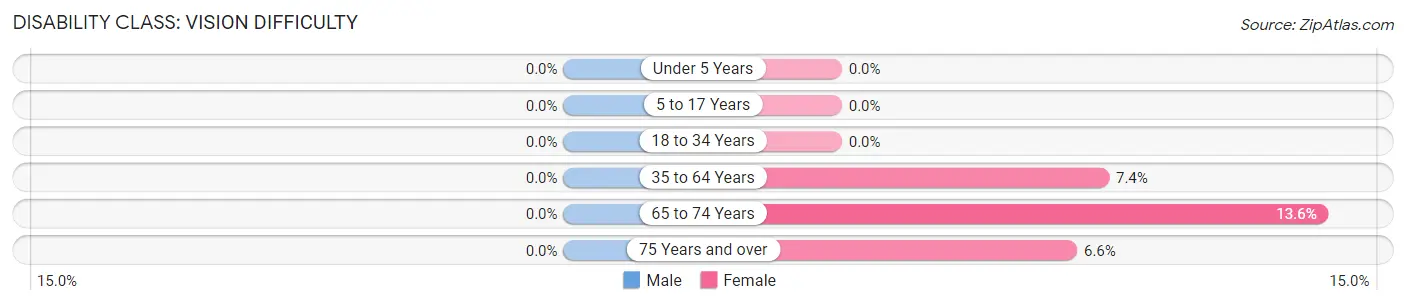
| Age Bracket | Male | Female |
| Under 5 Years | 0 (0.0%) | 0 (0.0%) |
| 5 to 17 Years | 0 (0.0%) | 0 (0.0%) |
| 18 to 34 Years | 0 (0.0%) | 0 (0.0%) |
| 35 to 64 Years | 0 (0.0%) | 52 (7.4%) |
| 65 to 74 Years | 0 (0.0%) | 21 (13.6%) |
| 75 Years and over | 0 (0.0%) | 11 (6.6%) |
Disability Class: Cognitive Difficulty
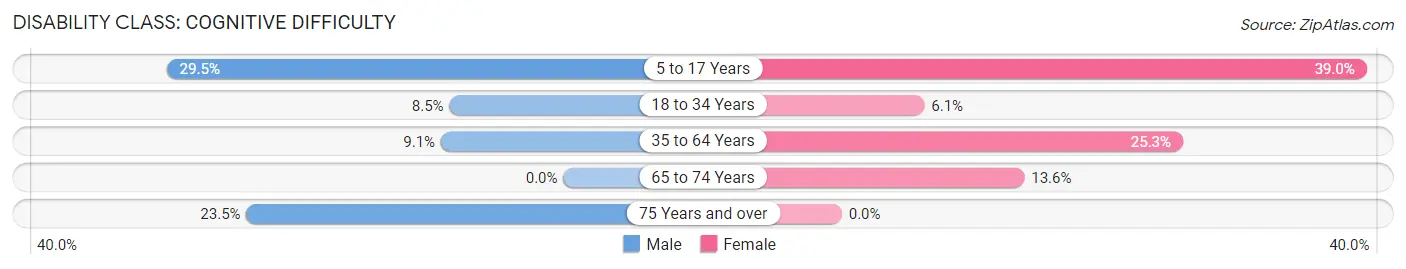
| Age Bracket | Male | Female |
| 5 to 17 Years | 81 (29.4%) | 83 (39.0%) |
| 18 to 34 Years | 28 (8.5%) | 31 (6.1%) |
| 35 to 64 Years | 29 (9.1%) | 177 (25.3%) |
| 65 to 74 Years | 0 (0.0%) | 21 (13.6%) |
| 75 Years and over | 16 (23.5%) | 0 (0.0%) |
Disability Class: Ambulatory Difficulty
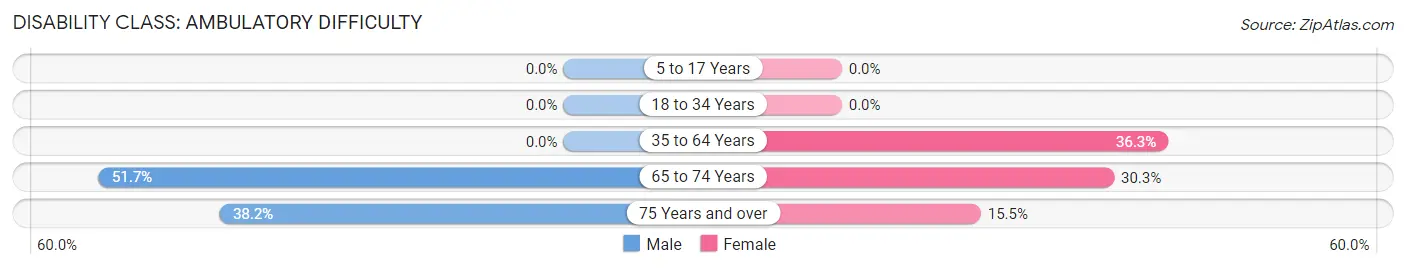
| Age Bracket | Male | Female |
| 5 to 17 Years | 0 (0.0%) | 0 (0.0%) |
| 18 to 34 Years | 0 (0.0%) | 0 (0.0%) |
| 35 to 64 Years | 0 (0.0%) | 254 (36.3%) |
| 65 to 74 Years | 75 (51.7%) | 47 (30.3%) |
| 75 Years and over | 26 (38.2%) | 26 (15.5%) |
Disability Class: Self-Care Difficulty
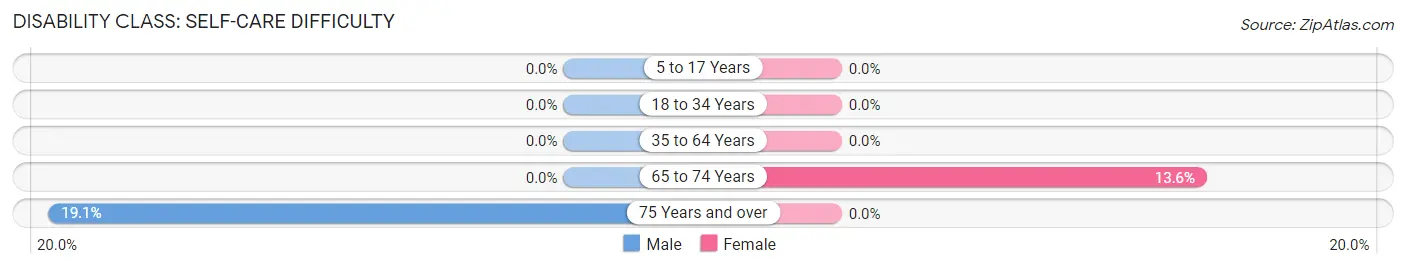
| Age Bracket | Male | Female |
| 5 to 17 Years | 0 (0.0%) | 0 (0.0%) |
| 18 to 34 Years | 0 (0.0%) | 0 (0.0%) |
| 35 to 64 Years | 0 (0.0%) | 0 (0.0%) |
| 65 to 74 Years | 0 (0.0%) | 21 (13.6%) |
| 75 Years and over | 13 (19.1%) | 0 (0.0%) |
Technology Access in Buffalo
Computing Device Access in Buffalo
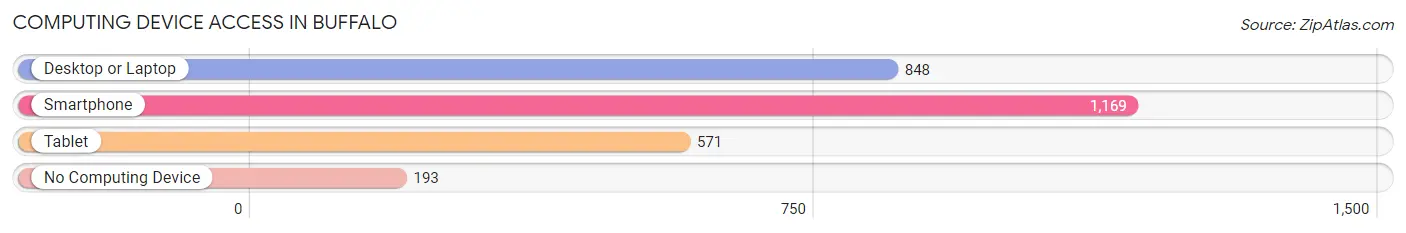
| Device Type | # Households | % Households |
| Desktop or Laptop | 848 | 58.9% |
| Smartphone | 1,169 | 81.2% |
| Tablet | 571 | 39.7% |
| No Computing Device | 193 | 13.4% |
| Total | 1,439 | 100.0% |
Internet Access in Buffalo
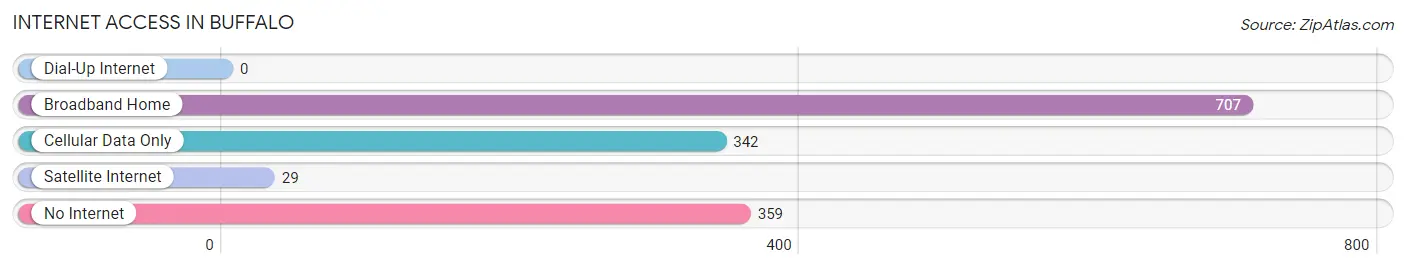
| Internet Type | # Households | % Households |
| Dial-Up Internet | 0 | 0.0% |
| Broadband Home | 707 | 49.1% |
| Cellular Data Only | 342 | 23.8% |
| Satellite Internet | 29 | 2.0% |
| No Internet | 359 | 24.9% |
| Total | 1,439 | 100.0% |
Buffalo Summary
Buffalo, Missouri is a small city located in Dallas County, Missouri. It is situated in the Ozark Mountains, approximately 50 miles east of Springfield, Missouri. The city has a population of approximately 4,000 people and is the county seat of Dallas County.
History
Buffalo was founded in 1837 by a group of settlers from Kentucky and Tennessee. The city was named after the nearby Buffalo Creek, which was named after the American bison that once roamed the area. The city was incorporated in 1845 and was the first county seat of Dallas County.
In the late 19th century, Buffalo was a thriving agricultural center, with a variety of crops being grown in the area. The city was also home to several mills, including a flour mill, a sawmill, and a cotton gin.
In the early 20th century, Buffalo experienced a period of growth and prosperity. The city was home to several businesses, including a bank, a hotel, a newspaper, and a movie theater. The city also had a thriving music scene, with several bands performing in the area.
Geography
Buffalo is located in the Ozark Mountains, approximately 50 miles east of Springfield, Missouri. The city is situated in a valley, surrounded by rolling hills and forests. The city is located at the intersection of two major highways, US Route 65 and Missouri Route 32.
The climate in Buffalo is humid subtropical, with hot summers and mild winters. The average annual temperature is around 60 degrees Fahrenheit. The average annual precipitation is around 40 inches.
Economy
The economy of Buffalo is largely based on agriculture. The city is home to several farms, which produce a variety of crops, including corn, soybeans, wheat, and hay. The city is also home to several businesses, including a bank, a hotel, a newspaper, and a movie theater.
Demographics
As of the 2010 census, the population of Buffalo was 4,000. The racial makeup of the city was 97.2% White, 0.7% African American, 0.3% Native American, 0.2% Asian, 0.1% Pacific Islander, 0.3% from other races, and 1.3% from two or more races. Hispanic or Latino of any race were 1.3% of the population.
The median household income in Buffalo was $35,000, and the median family income was $41,000. The per capita income was $17,000. About 15.3% of the population was below the poverty line.
Conclusion
Buffalo, Missouri is a small city located in Dallas County, Missouri. It is situated in the Ozark Mountains, approximately 50 miles east of Springfield, Missouri. The city has a population of approximately 4,000 people and is the county seat of Dallas County. The economy of Buffalo is largely based on agriculture, with several farms producing a variety of crops. The city is also home to several businesses, including a bank, a hotel, a newspaper, and a movie theater. The racial makeup of the city is 97.2% White, 0.7% African American, 0.3% Native American, 0.2% Asian, 0.1% Pacific Islander, 0.3% from other races, and 1.3% from two or more races. The median household income in Buffalo was $35,000, and the median family income was $41,000. The per capita income was $17,000. About 15.3% of the population was below the poverty line.
Common Questions
What is Per Capita Income in Buffalo?
Per Capita income in Buffalo is $23,205.
What is the Median Family Income in Buffalo?
Median Family Income in Buffalo is $30,560.
What is the Median Household income in Buffalo?
Median Household Income in Buffalo is $27,332.
What is Income or Wage Gap in Buffalo?
Income or Wage Gap in Buffalo is 46.9%.
Women in Buffalo earn 53.1 cents for every dollar earned by a man.
What is Family Income Deficit in Buffalo?
Family Income Deficit in Buffalo is $11,025.
Families that are below poverty line in Buffalo earn $11,025 less on average than the poverty threshold level.
What is Inequality or Gini Index in Buffalo?
Inequality or Gini Index in Buffalo is 0.59.
What is the Total Population of Buffalo?
Total Population of Buffalo is 3,319.
What is the Total Male Population of Buffalo?
Total Male Population of Buffalo is 1,271.
What is the Total Female Population of Buffalo?
Total Female Population of Buffalo is 2,048.
What is the Ratio of Males per 100 Females in Buffalo?
There are 62.06 Males per 100 Females in Buffalo.
What is the Ratio of Females per 100 Males in Buffalo?
There are 161.13 Females per 100 Males in Buffalo.
What is the Median Population Age in Buffalo?
Median Population Age in Buffalo is 41.0 Years.
What is the Average Family Size in Buffalo
Average Family Size in Buffalo is 3.0 People.
What is the Average Household Size in Buffalo
Average Household Size in Buffalo is 2.2 People.
How Large is the Labor Force in Buffalo?
There are 1,158 People in the Labor Forcein in Buffalo.
What is the Percentage of People in the Labor Force in Buffalo?
43.4% of People are in the Labor Force in Buffalo.
What is the Unemployment Rate in Buffalo?
Unemployment Rate in Buffalo is 2.8%.