West Plains, MO Map & Demographics
West Plains Map
West Plains Overview
$22,909
PER CAPITA INCOME
$51,313
AVG FAMILY INCOME
$38,676
AVG HOUSEHOLD INCOME
40.7%
WAGE / INCOME GAP [ % ]
59.3¢/ $1
WAGE / INCOME GAP [ $ ]
$12,176
FAMILY INCOME DEFICIT
0.48
INEQUALITY / GINI INDEX
12,250
TOTAL POPULATION
5,688
MALE POPULATION
6,562
FEMALE POPULATION
86.68
MALES / 100 FEMALES
115.37
FEMALES / 100 MALES
34.6
MEDIAN AGE
3.5
AVG FAMILY SIZE
2.4
AVG HOUSEHOLD SIZE
5,226
LABOR FORCE [ PEOPLE ]
56.1%
PERCENT IN LABOR FORCE
4.7%
UNEMPLOYMENT RATE
West Plains Zip Codes
West Plains Area Codes
Income in West Plains
Income Overview in West Plains
Per Capita Income in West Plains is $22,909, while median incomes of families and households are $51,313 and $38,676 respectively.
| Characteristic | Number | Measure |
| Per Capita Income | 12,250 | $22,909 |
| Median Family Income | 2,498 | $51,313 |
| Mean Family Income | 2,498 | $68,490 |
| Median Household Income | 4,874 | $38,676 |
| Mean Household Income | 4,874 | $53,695 |
| Income Deficit | 2,498 | $12,176 |
| Wage / Income Gap (%) | 12,250 | 40.67% |
| Wage / Income Gap ($) | 12,250 | 59.33¢ per $1 |
| Gini / Inequality Index | 12,250 | 0.48 |
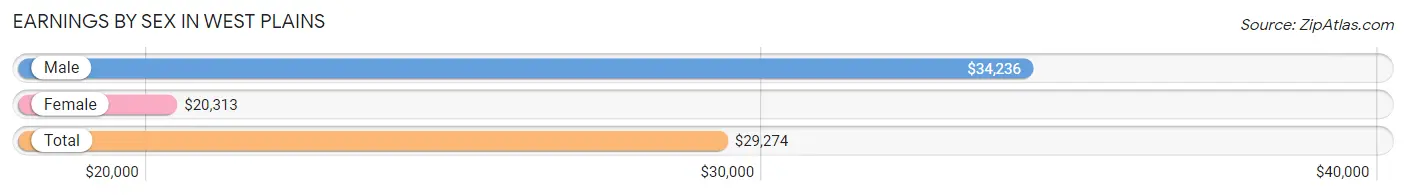
Earnings by Sex in West Plains
Average Earnings in West Plains are $29,274, $34,236 for men and $20,313 for women, a difference of 40.7%.
| Sex | Number | Average Earnings |
| Male | 2,838 (53.2%) | $34,236 |
| Female | 2,500 (46.8%) | $20,313 |
| Total | 5,338 (100.0%) | $29,274 |
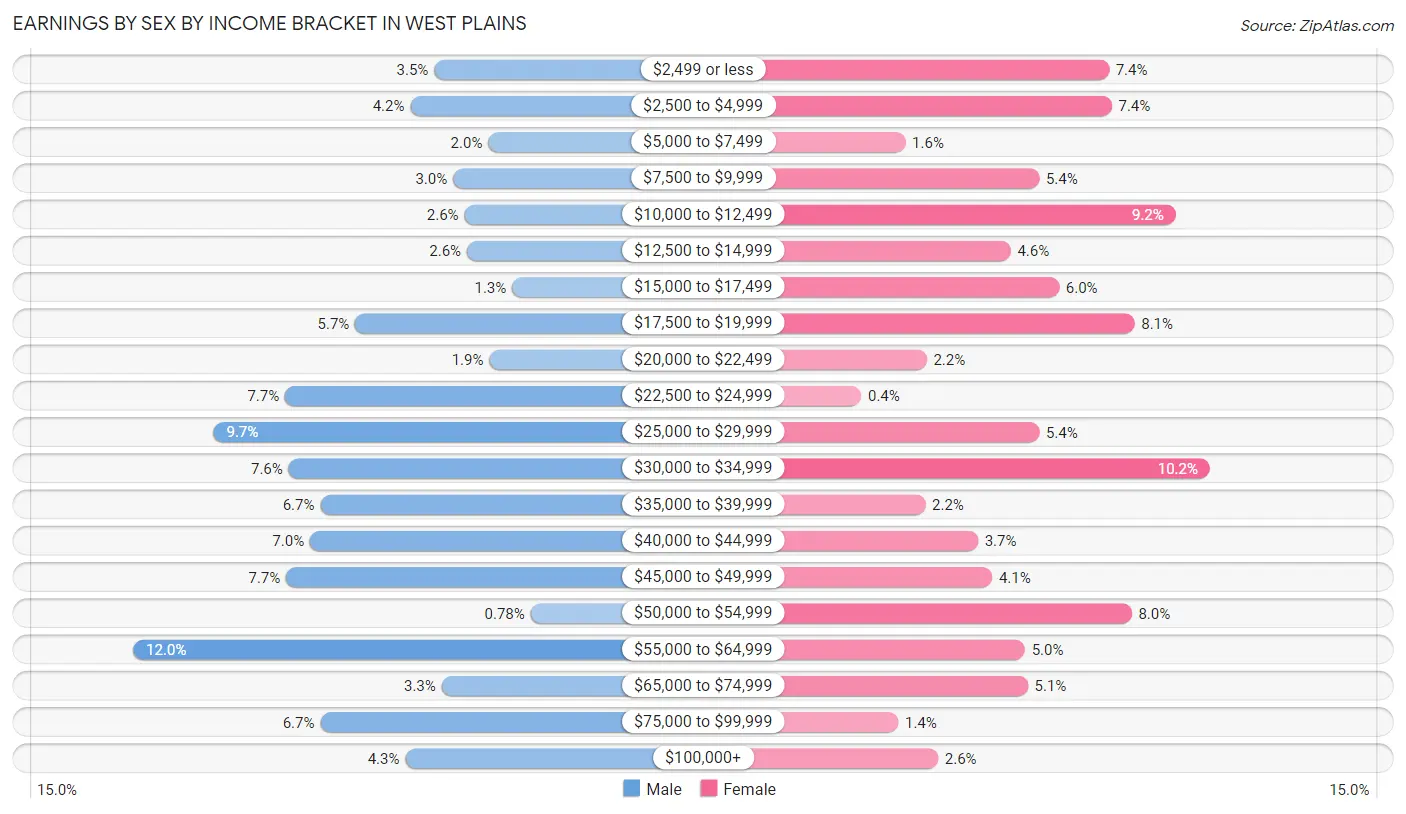
Earnings by Sex by Income Bracket in West Plains
The most common earnings brackets in West Plains are $55,000 to $64,999 for men (339 | 11.9%) and $30,000 to $34,999 for women (255 | 10.2%).
| Income | Male | Female |
| $2,499 or less | 99 (3.5%) | 184 (7.4%) |
| $2,500 to $4,999 | 118 (4.2%) | 186 (7.4%) |
| $5,000 to $7,499 | 56 (2.0%) | 41 (1.6%) |
| $7,500 to $9,999 | 84 (3.0%) | 135 (5.4%) |
| $10,000 to $12,499 | 75 (2.6%) | 231 (9.2%) |
| $12,500 to $14,999 | 73 (2.6%) | 115 (4.6%) |
| $15,000 to $17,499 | 37 (1.3%) | 149 (6.0%) |
| $17,500 to $19,999 | 162 (5.7%) | 202 (8.1%) |
| $20,000 to $22,499 | 55 (1.9%) | 56 (2.2%) |
| $22,500 to $24,999 | 218 (7.7%) | 10 (0.4%) |
| $25,000 to $29,999 | 275 (9.7%) | 135 (5.4%) |
| $30,000 to $34,999 | 215 (7.6%) | 255 (10.2%) |
| $35,000 to $39,999 | 190 (6.7%) | 55 (2.2%) |
| $40,000 to $44,999 | 198 (7.0%) | 92 (3.7%) |
| $45,000 to $49,999 | 217 (7.6%) | 102 (4.1%) |
| $50,000 to $54,999 | 22 (0.8%) | 200 (8.0%) |
| $55,000 to $64,999 | 339 (11.9%) | 125 (5.0%) |
| $65,000 to $74,999 | 93 (3.3%) | 127 (5.1%) |
| $75,000 to $99,999 | 190 (6.7%) | 36 (1.4%) |
| $100,000+ | 122 (4.3%) | 64 (2.6%) |
| Total | 2,838 (100.0%) | 2,500 (100.0%) |
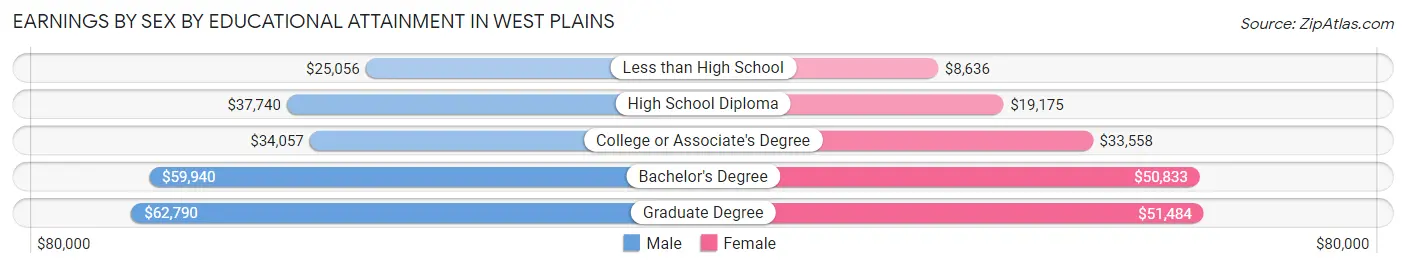
Earnings by Sex by Educational Attainment in West Plains
Average earnings in West Plains are $37,236 for men and $26,334 for women, a difference of 29.3%. Men with an educational attainment of graduate degree enjoy the highest average annual earnings of $62,790, while those with less than high school education earn the least with $25,056. Women with an educational attainment of graduate degree earn the most with the average annual earnings of $51,484, while those with less than high school education have the smallest earnings of $8,636.
| Educational Attainment | Male Income | Female Income |
| Less than High School | $25,056 | $8,636 |
| High School Diploma | $37,740 | $19,175 |
| College or Associate's Degree | $34,057 | $33,558 |
| Bachelor's Degree | $59,940 | $50,833 |
| Graduate Degree | $62,790 | $51,484 |
| Total | $37,236 | $26,334 |
Family Income in West Plains
Family Income Brackets in West Plains
According to the West Plains family income data, there are 487 families falling into the $50,000 to $74,999 income range, which is the most common income bracket and makes up 19.5% of all families. Conversely, the $150,000 to $199,999 income bracket is the least frequent group with only 52 families (2.1%) belonging to this category.
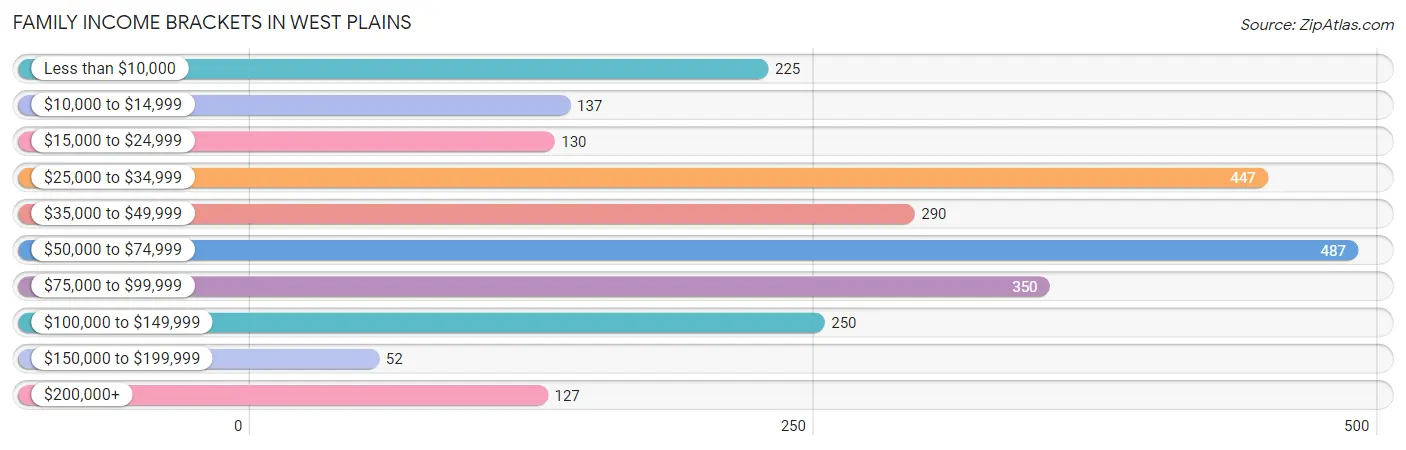
| Income Bracket | # Families | % Families |
| Less than $10,000 | 225 | 9.0% |
| $10,000 to $14,999 | 137 | 5.5% |
| $15,000 to $24,999 | 130 | 5.2% |
| $25,000 to $34,999 | 447 | 17.9% |
| $35,000 to $49,999 | 290 | 11.6% |
| $50,000 to $74,999 | 487 | 19.5% |
| $75,000 to $99,999 | 350 | 14.0% |
| $100,000 to $149,999 | 250 | 10.0% |
| $150,000 to $199,999 | 52 | 2.1% |
| $200,000+ | 127 | 5.1% |
Family Income by Famaliy Size in West Plains
4-person families (444 | 17.8%) account for the highest median family income in West Plains with $68,456 per family, while 2-person families (1,260 | 50.4%) have the highest median income of $24,056 per family member.
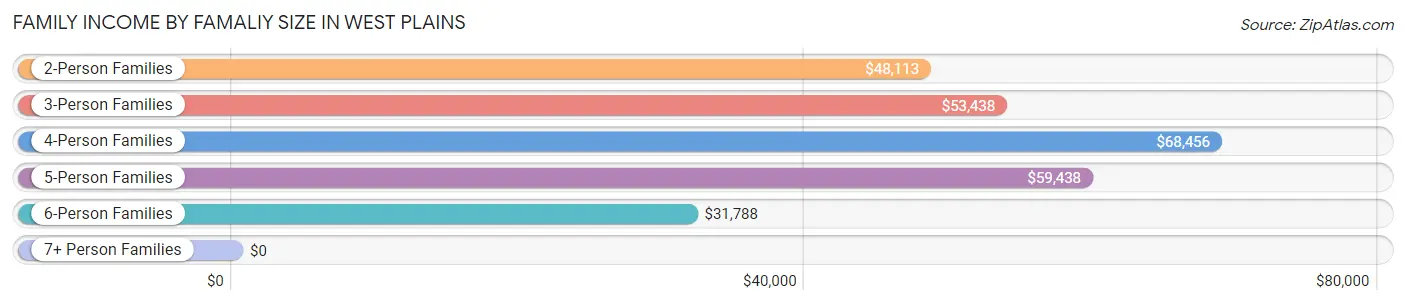
| Income Bracket | # Families | Median Income |
| 2-Person Families | 1,260 (50.4%) | $48,113 |
| 3-Person Families | 379 (15.2%) | $53,438 |
| 4-Person Families | 444 (17.8%) | $68,456 |
| 5-Person Families | 238 (9.5%) | $59,438 |
| 6-Person Families | 113 (4.5%) | $31,788 |
| 7+ Person Families | 64 (2.6%) | $0 |
| Total | 2,498 (100.0%) | $51,313 |
Family Income by Number of Earners in West Plains
The median family income in West Plains is $51,313, with families comprising 3+ earners (126) having the highest median family income of $92,083, while families with no earners (587) have the lowest median family income of $20,194, accounting for 5.0% and 23.5% of families, respectively.
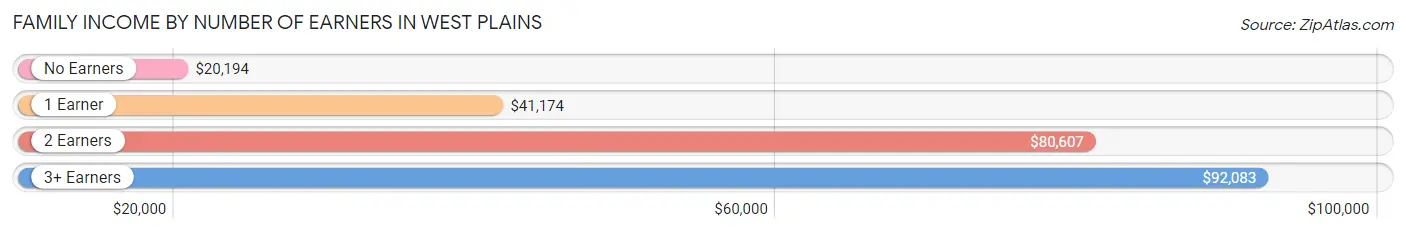
| Number of Earners | # Families | Median Income |
| No Earners | 587 (23.5%) | $20,194 |
| 1 Earner | 829 (33.2%) | $41,174 |
| 2 Earners | 956 (38.3%) | $80,607 |
| 3+ Earners | 126 (5.0%) | $92,083 |
| Total | 2,498 (100.0%) | $51,313 |
Household Income in West Plains
Household Income Brackets in West Plains
With 985 households falling in the category, the $50,000 to $74,999 income range is the most frequent in West Plains, accounting for 20.2% of all households. In contrast, only 54 households (1.1%) fall into the $150,000 to $199,999 income bracket, making it the least populous group.
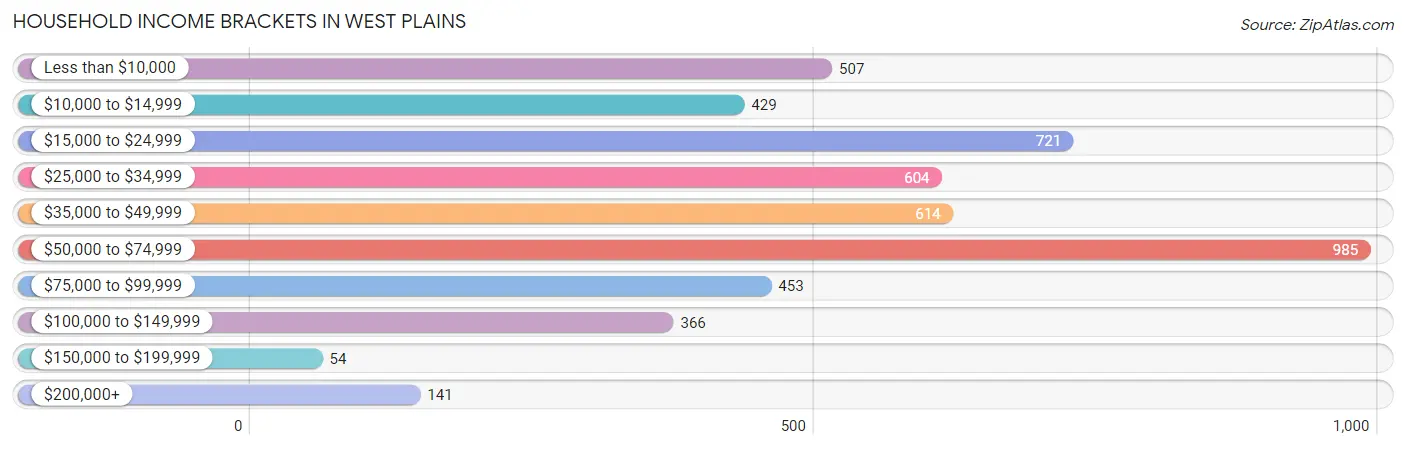
| Income Bracket | # Households | % Households |
| Less than $10,000 | 507 | 10.4% |
| $10,000 to $14,999 | 429 | 8.8% |
| $15,000 to $24,999 | 721 | 14.8% |
| $25,000 to $34,999 | 604 | 12.4% |
| $35,000 to $49,999 | 614 | 12.6% |
| $50,000 to $74,999 | 985 | 20.2% |
| $75,000 to $99,999 | 453 | 9.3% |
| $100,000 to $149,999 | 366 | 7.5% |
| $150,000 to $199,999 | 54 | 1.1% |
| $200,000+ | 141 | 2.9% |
Household Income by Householder Age in West Plains
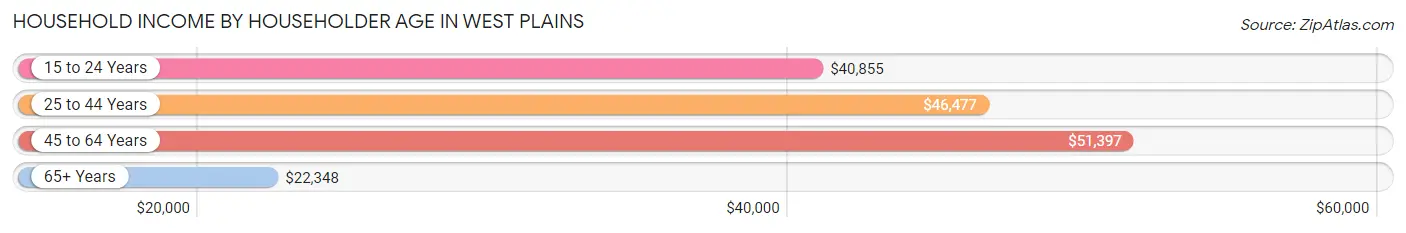
The median household income in West Plains is $38,676, with the highest median household income of $51,397 found in the 45 to 64 years age bracket for the primary householder. A total of 1,546 households (31.7%) fall into this category. Meanwhile, the 65+ years age bracket for the primary householder has the lowest median household income of $22,348, with 1,438 households (29.5%) in this group.
| Income Bracket | # Households | Median Income |
| 15 to 24 Years | 259 (5.3%) | $40,855 |
| 25 to 44 Years | 1,631 (33.5%) | $46,477 |
| 45 to 64 Years | 1,546 (31.7%) | $51,397 |
| 65+ Years | 1,438 (29.5%) | $22,348 |
| Total | 4,874 (100.0%) | $38,676 |
Poverty in West Plains
Income Below Poverty by Sex and Age in West Plains
With 28.3% poverty level for males and 38.6% for females among the residents of West Plains, 15 year old males and 5 year old females are the most vulnerable to poverty, with 80 males (70.8%) and 33 females (82.5%) in their respective age groups living below the poverty level.
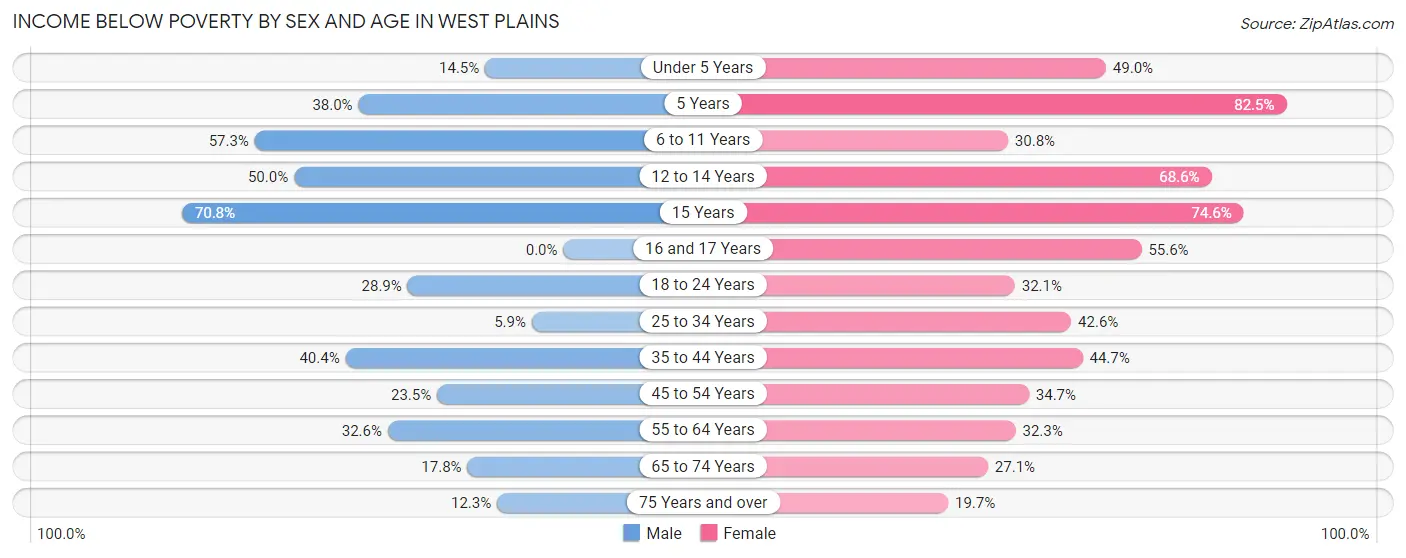
| Age Bracket | Male | Female |
| Under 5 Years | 45 (14.5%) | 276 (49.0%) |
| 5 Years | 27 (38.0%) | 33 (82.5%) |
| 6 to 11 Years | 460 (57.3%) | 168 (30.8%) |
| 12 to 14 Years | 35 (50.0%) | 225 (68.6%) |
| 15 Years | 80 (70.8%) | 44 (74.6%) |
| 16 and 17 Years | 0 (0.0%) | 89 (55.6%) |
| 18 to 24 Years | 133 (28.9%) | 158 (32.1%) |
| 25 to 34 Years | 60 (5.9%) | 421 (42.6%) |
| 35 to 44 Years | 277 (40.4%) | 336 (44.7%) |
| 45 to 54 Years | 178 (23.4%) | 201 (34.7%) |
| 55 to 64 Years | 147 (32.6%) | 228 (32.3%) |
| 65 to 74 Years | 78 (17.8%) | 150 (27.1%) |
| 75 Years and over | 41 (12.3%) | 111 (19.7%) |
| Total | 1,561 (28.3%) | 2,440 (38.6%) |
Income Above Poverty by Sex and Age in West Plains
According to the poverty statistics in West Plains, males aged 25 to 34 years and females aged 75 years and over are the age groups that are most secure financially, with 94.1% of males and 80.3% of females in these age groups living above the poverty line.
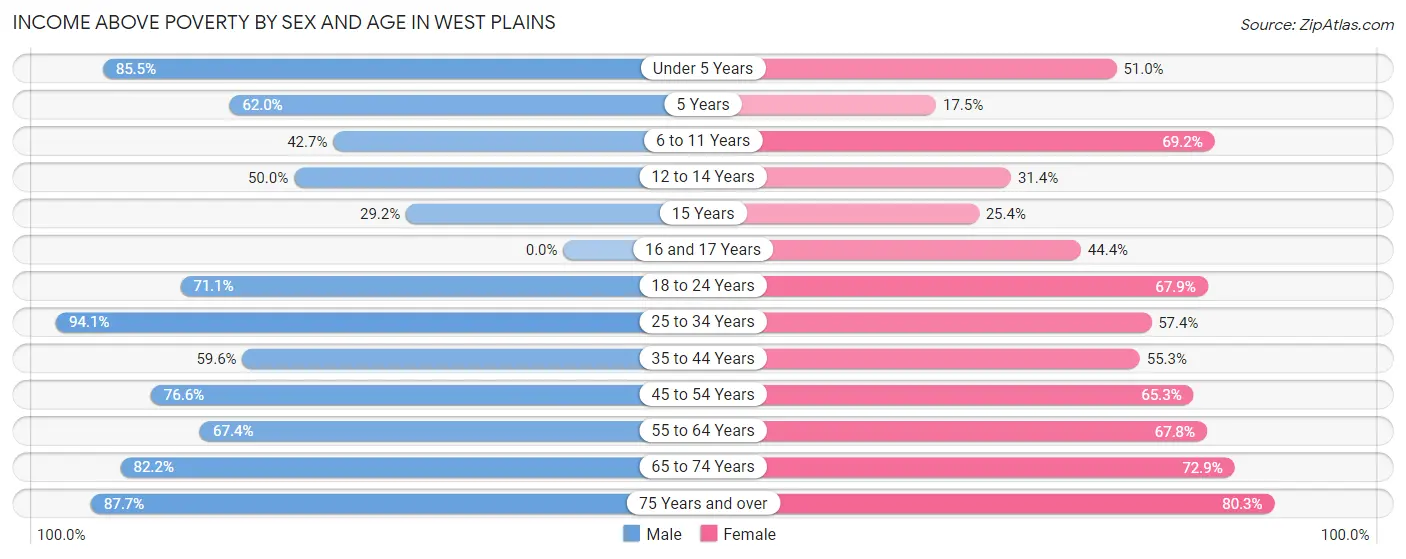
| Age Bracket | Male | Female |
| Under 5 Years | 265 (85.5%) | 287 (51.0%) |
| 5 Years | 44 (62.0%) | 7 (17.5%) |
| 6 to 11 Years | 343 (42.7%) | 377 (69.2%) |
| 12 to 14 Years | 35 (50.0%) | 103 (31.4%) |
| 15 Years | 33 (29.2%) | 15 (25.4%) |
| 16 and 17 Years | 0 (0.0%) | 71 (44.4%) |
| 18 to 24 Years | 327 (71.1%) | 334 (67.9%) |
| 25 to 34 Years | 964 (94.1%) | 568 (57.4%) |
| 35 to 44 Years | 408 (59.6%) | 416 (55.3%) |
| 45 to 54 Years | 581 (76.5%) | 378 (65.3%) |
| 55 to 64 Years | 304 (67.4%) | 479 (67.7%) |
| 65 to 74 Years | 360 (82.2%) | 403 (72.9%) |
| 75 Years and over | 292 (87.7%) | 452 (80.3%) |
| Total | 3,956 (71.7%) | 3,890 (61.5%) |
Income Below Poverty Among Married-Couple Families in West Plains
The poverty statistics for married-couple families in West Plains show that 14.6% or 238 of the total 1,627 families live below the poverty line. Families with 5 or more children have the highest poverty rate of 100.0%, comprising of 34 families. On the other hand, families with 1 or 2 children have the lowest poverty rate of 3.7%, which includes 15 families.
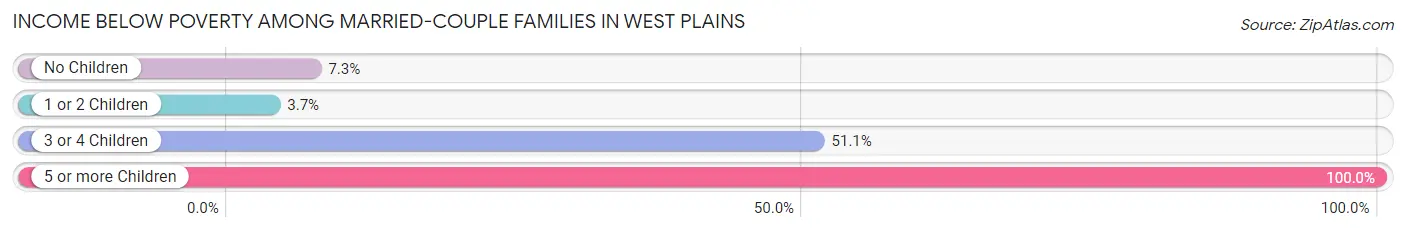
| Children | Above Poverty | Below Poverty |
| No Children | 881 (92.7%) | 69 (7.3%) |
| 1 or 2 Children | 393 (96.3%) | 15 (3.7%) |
| 3 or 4 Children | 115 (48.9%) | 120 (51.1%) |
| 5 or more Children | 0 (0.0%) | 34 (100.0%) |
| Total | 1,389 (85.4%) | 238 (14.6%) |
Income Below Poverty Among Single-Parent Households in West Plains
According to the poverty data in West Plains, 44.0% or 91 single-father households and 44.3% or 294 single-mother households are living below the poverty line. Among single-father households, those with 3 or 4 children have the highest poverty rate, with 27 households (100.0%) experiencing poverty. Likewise, among single-mother households, those with no children have the highest poverty rate, with 85 households (62.5%) falling below the poverty line.
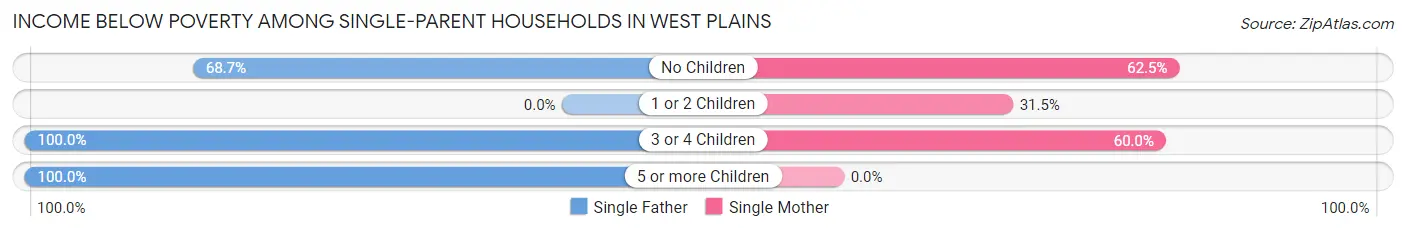
| Children | Single Father | Single Mother |
| No Children | 46 (68.7%) | 85 (62.5%) |
| 1 or 2 Children | 0 (0.0%) | 119 (31.5%) |
| 3 or 4 Children | 27 (100.0%) | 90 (60.0%) |
| 5 or more Children | 18 (100.0%) | 0 (0.0%) |
| Total | 91 (44.0%) | 294 (44.3%) |
Income Below Poverty Among Married-Couple vs Single-Parent Households in West Plains
The poverty data for West Plains shows that 238 of the married-couple family households (14.6%) and 385 of the single-parent households (44.2%) are living below the poverty level. Within the married-couple family households, those with 5 or more children have the highest poverty rate, with 34 households (100.0%) falling below the poverty line. Among the single-parent households, those with 5 or more children have the highest poverty rate, with 18 household (100.0%) living below poverty.
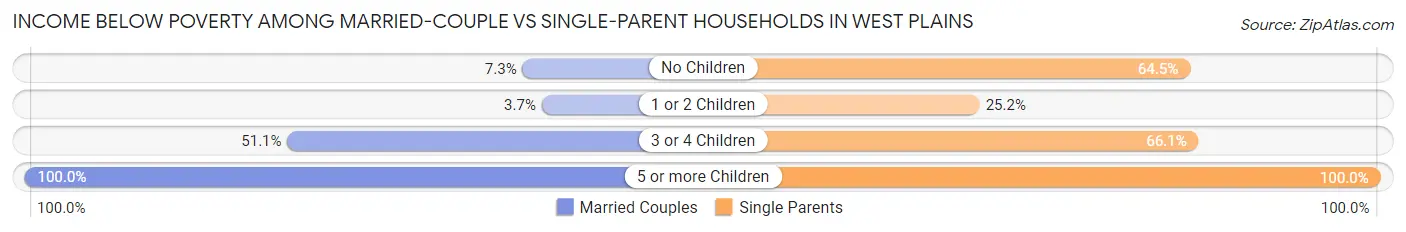
| Children | Married-Couple Families | Single-Parent Households |
| No Children | 69 (7.3%) | 131 (64.5%) |
| 1 or 2 Children | 15 (3.7%) | 119 (25.2%) |
| 3 or 4 Children | 120 (51.1%) | 117 (66.1%) |
| 5 or more Children | 34 (100.0%) | 18 (100.0%) |
| Total | 238 (14.6%) | 385 (44.2%) |
Race in West Plains
The most populous races in West Plains are White / Caucasian (11,801 | 96.3%), Two or more Races (299 | 2.4%), and Black / African American (66 | 0.5%).
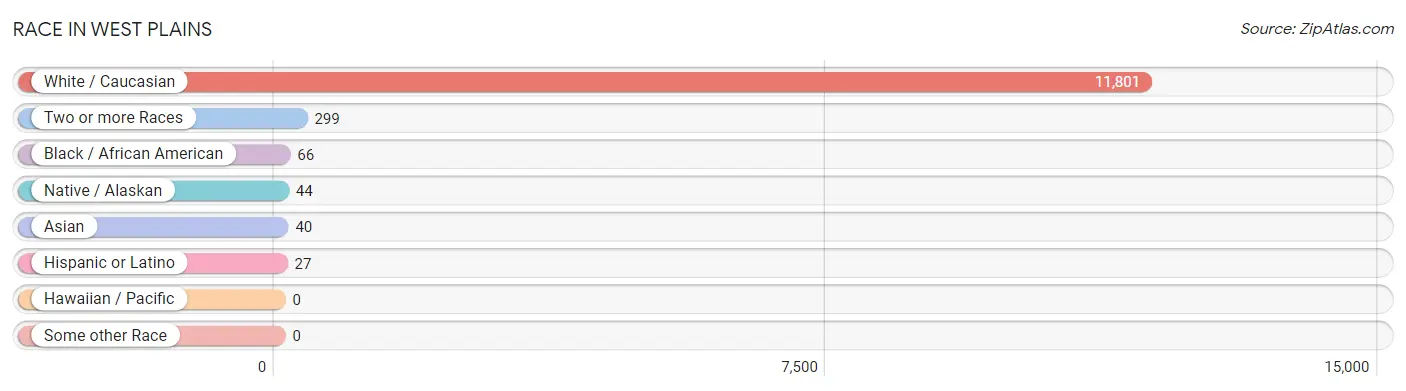
| Race | # Population | % Population |
| Asian | 40 | 0.3% |
| Black / African American | 66 | 0.5% |
| Hawaiian / Pacific | 0 | 0.0% |
| Hispanic or Latino | 27 | 0.2% |
| Native / Alaskan | 44 | 0.4% |
| White / Caucasian | 11,801 | 96.3% |
| Two or more Races | 299 | 2.4% |
| Some other Race | 0 | 0.0% |
| Total | 12,250 | 100.0% |
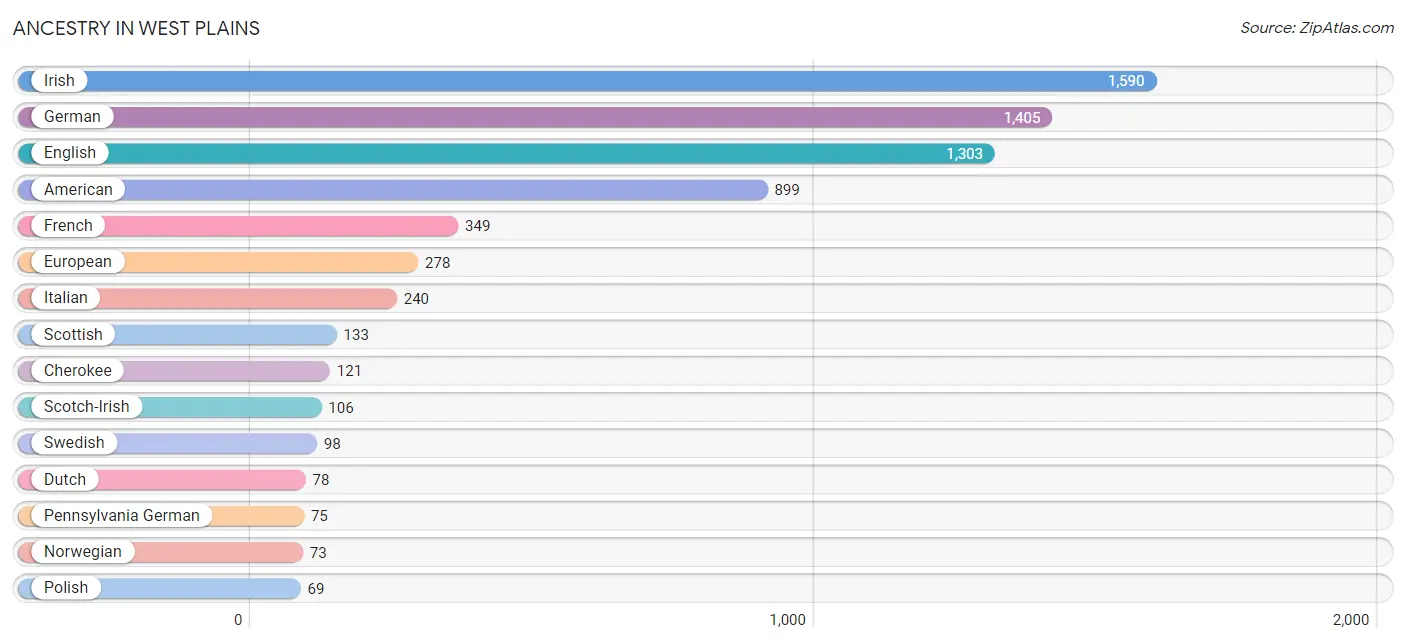
Ancestry in West Plains
The most populous ancestries reported in West Plains are Irish (1,590 | 13.0%), German (1,405 | 11.5%), English (1,303 | 10.6%), American (899 | 7.3%), and French (349 | 2.9%), together accounting for 45.3% of all West Plains residents.
| Ancestry | # Population | % Population |
| African | 9 | 0.1% |
| American | 899 | 7.3% |
| Argentinean | 19 | 0.2% |
| Armenian | 60 | 0.5% |
| Austrian | 20 | 0.2% |
| British | 6 | 0.1% |
| Celtic | 4 | 0.0% |
| Cherokee | 121 | 1.0% |
| Choctaw | 12 | 0.1% |
| Creek | 6 | 0.1% |
| Czechoslovakian | 35 | 0.3% |
| Dutch | 78 | 0.6% |
| English | 1,303 | 10.6% |
| European | 278 | 2.3% |
| French | 349 | 2.9% |
| French Canadian | 11 | 0.1% |
| German | 1,405 | 11.5% |
| Hungarian | 5 | 0.0% |
| Irish | 1,590 | 13.0% |
| Italian | 240 | 2.0% |
| Korean | 56 | 0.5% |
| Lithuanian | 11 | 0.1% |
| Mexican | 8 | 0.1% |
| Navajo | 22 | 0.2% |
| Norwegian | 73 | 0.6% |
| Pennsylvania German | 75 | 0.6% |
| Polish | 69 | 0.6% |
| Portuguese | 19 | 0.2% |
| Russian | 9 | 0.1% |
| Samoan | 37 | 0.3% |
| Scandinavian | 63 | 0.5% |
| Scotch-Irish | 106 | 0.9% |
| Scottish | 133 | 1.1% |
| South American | 19 | 0.2% |
| Sri Lankan | 59 | 0.5% |
| Subsaharan African | 9 | 0.1% |
| Swedish | 98 | 0.8% |
| Welsh | 3 | 0.0% | View All 38 Rows |
Immigrants in West Plains
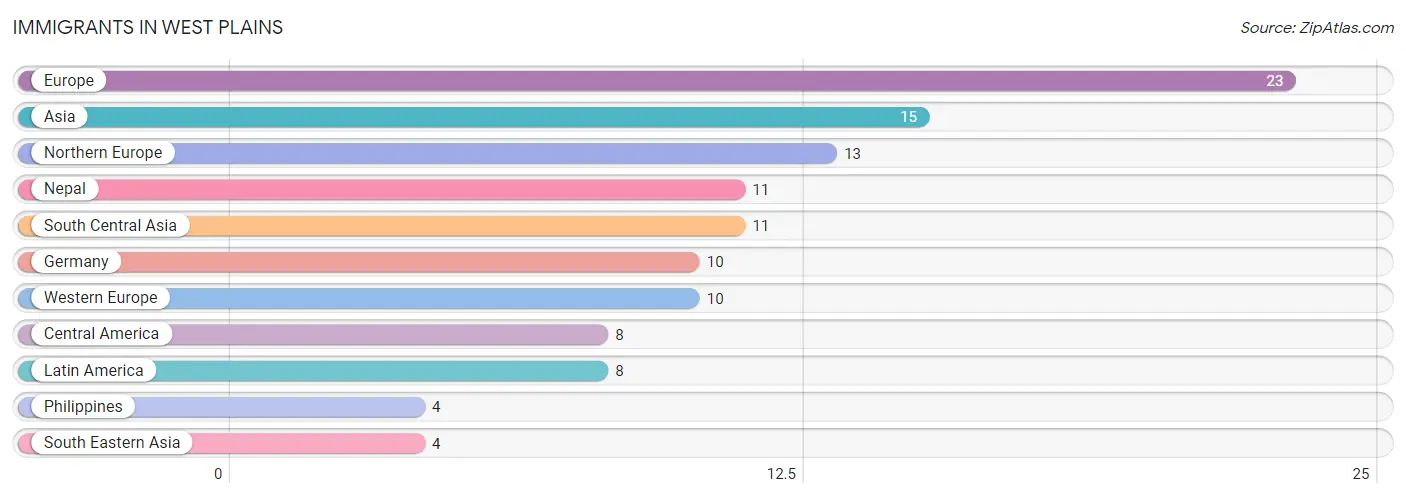
The most numerous immigrant groups reported in West Plains came from Europe (23 | 0.2%), Asia (15 | 0.1%), Northern Europe (13 | 0.1%), Nepal (11 | 0.1%), and South Central Asia (11 | 0.1%), together accounting for 0.6% of all West Plains residents.
| Immigration Origin | # Population | % Population |
| Asia | 15 | 0.1% |
| Central America | 8 | 0.1% |
| Europe | 23 | 0.2% |
| Germany | 10 | 0.1% |
| Latin America | 8 | 0.1% |
| Nepal | 11 | 0.1% |
| Northern Europe | 13 | 0.1% |
| Philippines | 4 | 0.0% |
| South Central Asia | 11 | 0.1% |
| South Eastern Asia | 4 | 0.0% |
| Western Europe | 10 | 0.1% | View All 11 Rows |
Sex and Age in West Plains
Sex and Age in West Plains
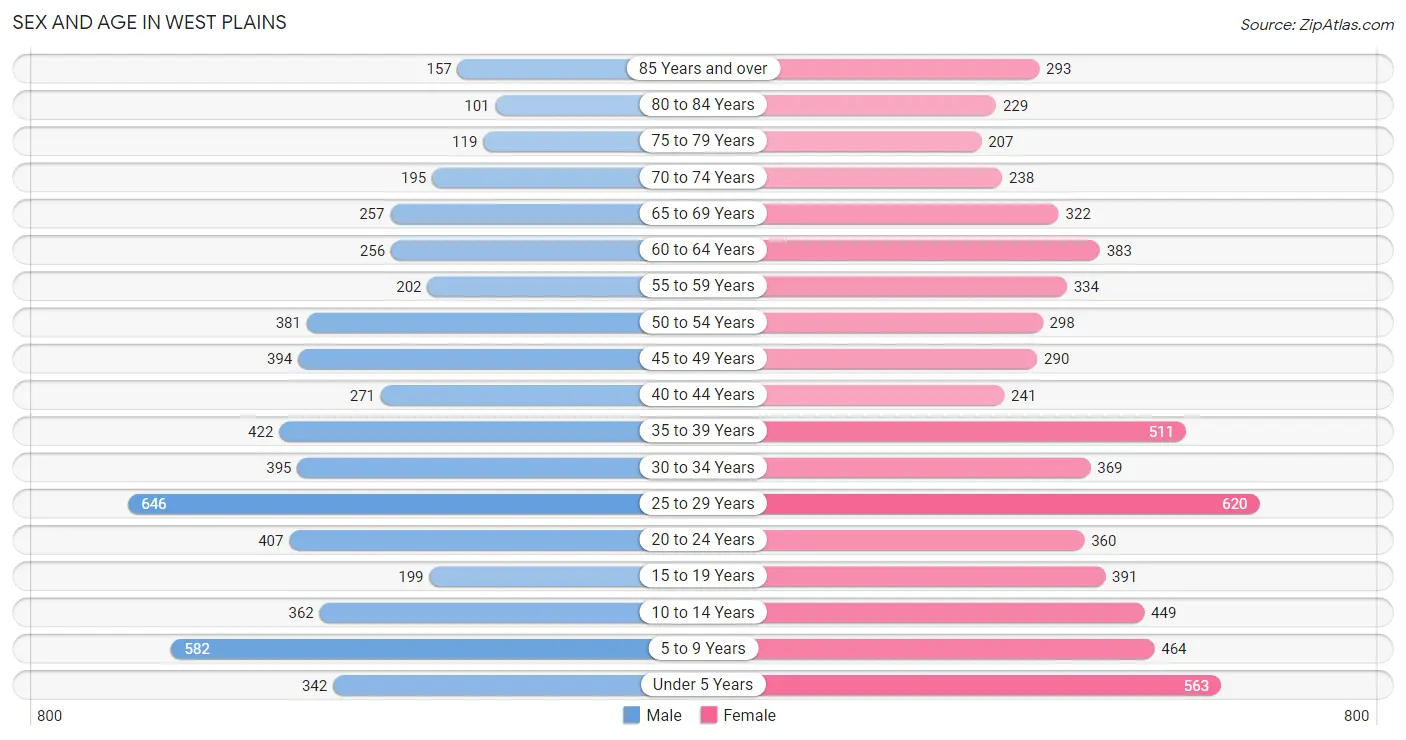
The most populous age groups in West Plains are 25 to 29 Years (646 | 11.4%) for men and 25 to 29 Years (620 | 9.5%) for women.
| Age Bracket | Male | Female |
| Under 5 Years | 342 (6.0%) | 563 (8.6%) |
| 5 to 9 Years | 582 (10.2%) | 464 (7.1%) |
| 10 to 14 Years | 362 (6.4%) | 449 (6.8%) |
| 15 to 19 Years | 199 (3.5%) | 391 (6.0%) |
| 20 to 24 Years | 407 (7.2%) | 360 (5.5%) |
| 25 to 29 Years | 646 (11.4%) | 620 (9.5%) |
| 30 to 34 Years | 395 (6.9%) | 369 (5.6%) |
| 35 to 39 Years | 422 (7.4%) | 511 (7.8%) |
| 40 to 44 Years | 271 (4.8%) | 241 (3.7%) |
| 45 to 49 Years | 394 (6.9%) | 290 (4.4%) |
| 50 to 54 Years | 381 (6.7%) | 298 (4.5%) |
| 55 to 59 Years | 202 (3.5%) | 334 (5.1%) |
| 60 to 64 Years | 256 (4.5%) | 383 (5.8%) |
| 65 to 69 Years | 257 (4.5%) | 322 (4.9%) |
| 70 to 74 Years | 195 (3.4%) | 238 (3.6%) |
| 75 to 79 Years | 119 (2.1%) | 207 (3.2%) |
| 80 to 84 Years | 101 (1.8%) | 229 (3.5%) |
| 85 Years and over | 157 (2.8%) | 293 (4.5%) |
| Total | 5,688 (100.0%) | 6,562 (100.0%) |
Families and Households in West Plains
Median Family Size in West Plains
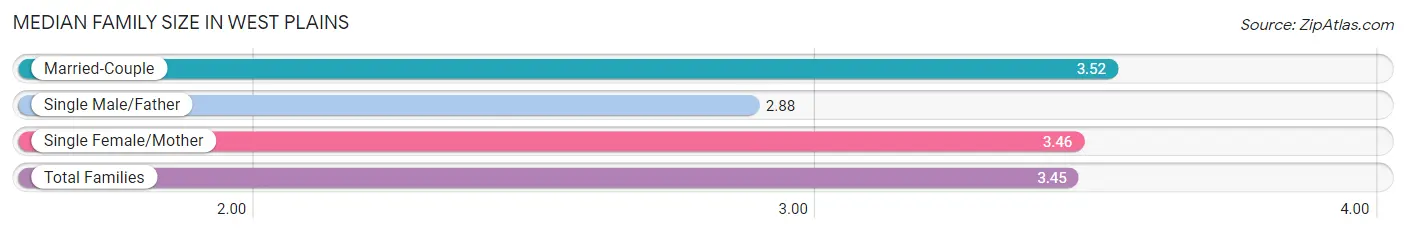
The median family size in West Plains is 3.45 persons per family, with married-couple families (1,627 | 65.1%) accounting for the largest median family size of 3.52 persons per family. On the other hand, single male/father families (207 | 8.3%) represent the smallest median family size with 2.88 persons per family.
| Family Type | # Families | Family Size |
| Married-Couple | 1,627 (65.1%) | 3.52 |
| Single Male/Father | 207 (8.3%) | 2.88 |
| Single Female/Mother | 664 (26.6%) | 3.46 |
| Total Families | 2,498 (100.0%) | 3.45 |
Median Household Size in West Plains
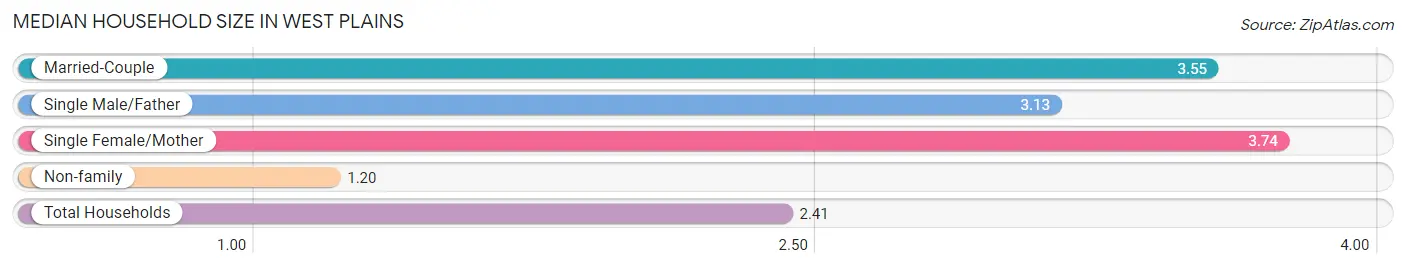
The median household size in West Plains is 2.41 persons per household, with single female/mother households (664 | 13.6%) accounting for the largest median household size of 3.74 persons per household. non-family households (2,376 | 48.7%) represent the smallest median household size with 1.20 persons per household.
| Household Type | # Households | Household Size |
| Married-Couple | 1,627 (33.4%) | 3.55 |
| Single Male/Father | 207 (4.3%) | 3.13 |
| Single Female/Mother | 664 (13.6%) | 3.74 |
| Non-family | 2,376 (48.7%) | 1.20 |
| Total Households | 4,874 (100.0%) | 2.41 |
Household Size by Marriage Status in West Plains
Out of a total of 4,874 households in West Plains, 2,498 (51.2%) are family households, while 2,376 (48.7%) are nonfamily households. The most numerous type of family households are 2-person households, comprising 1,084, and the most common type of nonfamily households are 1-person households, comprising 2,025.
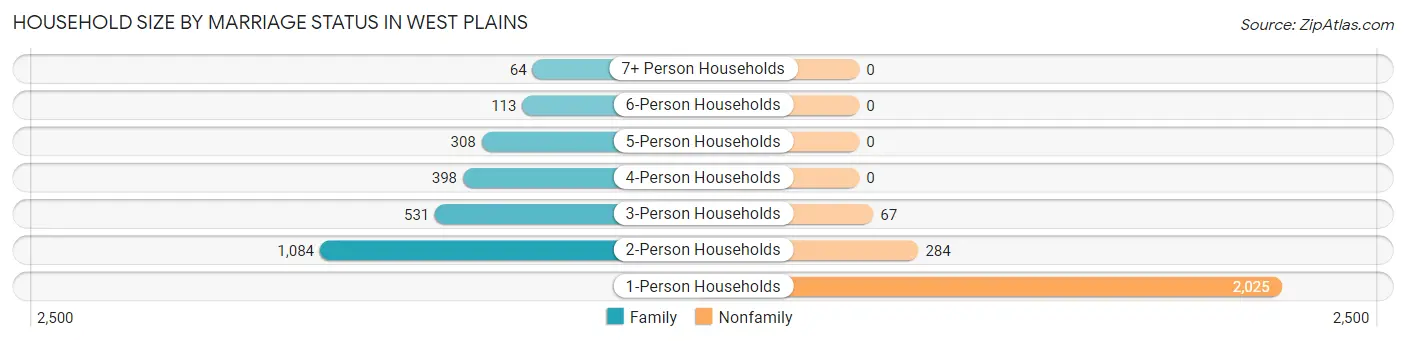
| Household Size | Family Households | Nonfamily Households |
| 1-Person Households | - | 2,025 (41.5%) |
| 2-Person Households | 1,084 (22.2%) | 284 (5.8%) |
| 3-Person Households | 531 (10.9%) | 67 (1.4%) |
| 4-Person Households | 398 (8.2%) | 0 (0.0%) |
| 5-Person Households | 308 (6.3%) | 0 (0.0%) |
| 6-Person Households | 113 (2.3%) | 0 (0.0%) |
| 7+ Person Households | 64 (1.3%) | 0 (0.0%) |
| Total | 2,498 (51.2%) | 2,376 (48.7%) |
Female Fertility in West Plains
Fertility by Age in West Plains
Average fertility rate in West Plains is 50.0 births per 1,000 women. Women in the age bracket of 20 to 34 years have the highest fertility rate with 93.0 births per 1,000 women. Women in the age bracket of 20 to 34 years acount for 87.4% of all women with births.
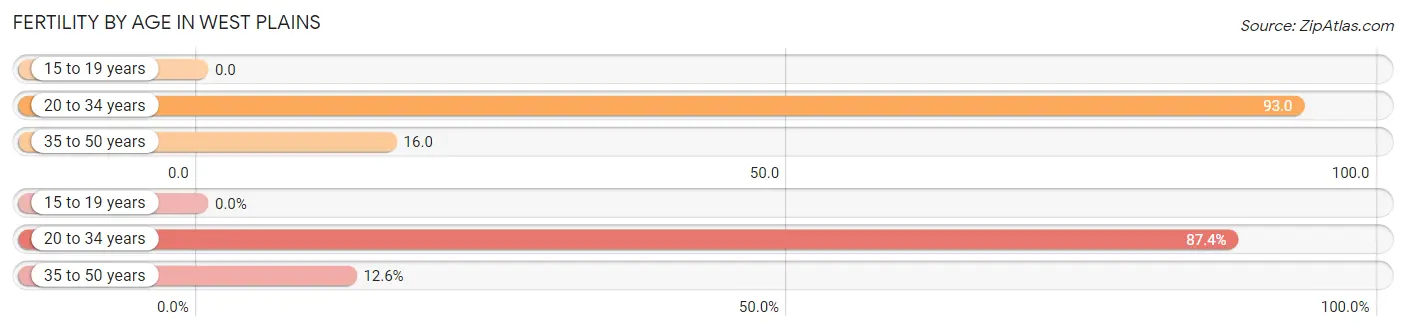
| Age Bracket | Women with Births | Births / 1,000 Women |
| 15 to 19 years | 0 (0.0%) | 0.0 |
| 20 to 34 years | 125 (87.4%) | 93.0 |
| 35 to 50 years | 18 (12.6%) | 16.0 |
| Total | 143 (100.0%) | 50.0 |
Fertility by Age by Marriage Status in West Plains
94.4% of women with births (143) in West Plains are married. The highest percentage of unmarried women with births falls into 20 to 34 years age bracket with 6.4% of them unmarried at the time of birth, while the lowest percentage of unmarried women with births belong to 35 to 50 years age bracket with 0.0% of them unmarried.
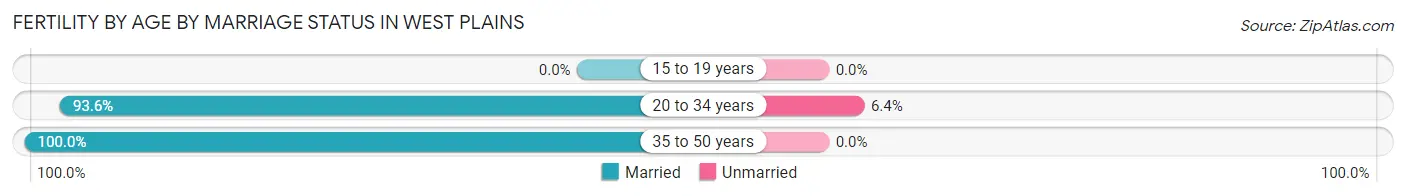
| Age Bracket | Married | Unmarried |
| 15 to 19 years | 0 (0.0%) | 0 (0.0%) |
| 20 to 34 years | 117 (93.6%) | 8 (6.4%) |
| 35 to 50 years | 18 (100.0%) | 0 (0.0%) |
| Total | 135 (94.4%) | 8 (5.6%) |
Fertility by Education in West Plains
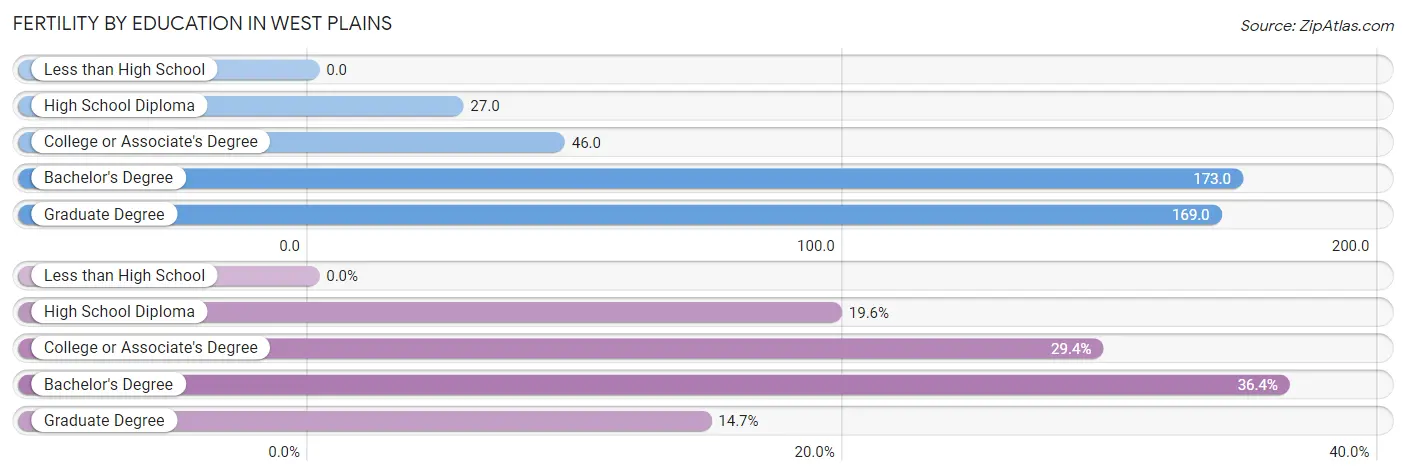
| Educational Attainment | Women with Births | Births / 1,000 Women |
| Less than High School | 0 (0.0%) | 0.0 |
| High School Diploma | 28 (19.6%) | 27.0 |
| College or Associate's Degree | 42 (29.4%) | 46.0 |
| Bachelor's Degree | 52 (36.4%) | 173.0 |
| Graduate Degree | 21 (14.7%) | 169.0 |
| Total | 143 (100.0%) | 50.0 |
Fertility by Education by Marriage Status in West Plains
5.6% of women with births in West Plains are unmarried. Women with the educational attainment of college or associate's degree are most likely to be married with 100.0% of them married at childbirth, while women with the educational attainment of high school diploma are least likely to be married with 28.6% of them unmarried at childbirth.
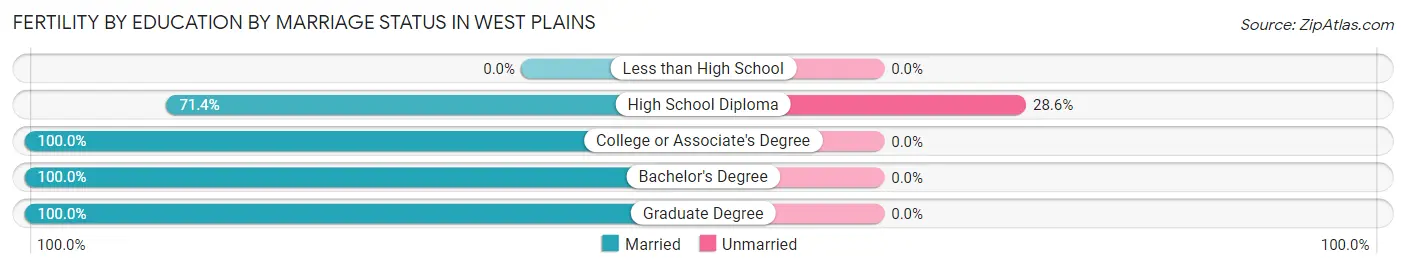
| Educational Attainment | Married | Unmarried |
| Less than High School | 0 (0.0%) | 0 (0.0%) |
| High School Diploma | 20 (71.4%) | 8 (28.6%) |
| College or Associate's Degree | 42 (100.0%) | 0 (0.0%) |
| Bachelor's Degree | 52 (100.0%) | 0 (0.0%) |
| Graduate Degree | 21 (100.0%) | 0 (0.0%) |
| Total | 135 (94.4%) | 8 (5.6%) |
Employment Characteristics in West Plains
Employment by Class of Employer in West Plains
Among the 4,675 employed individuals in West Plains, private company employees (2,878 | 61.6%), local government employees (561 | 12.0%), and not-for-profit organizations (545 | 11.7%) make up the most common classes of employment.
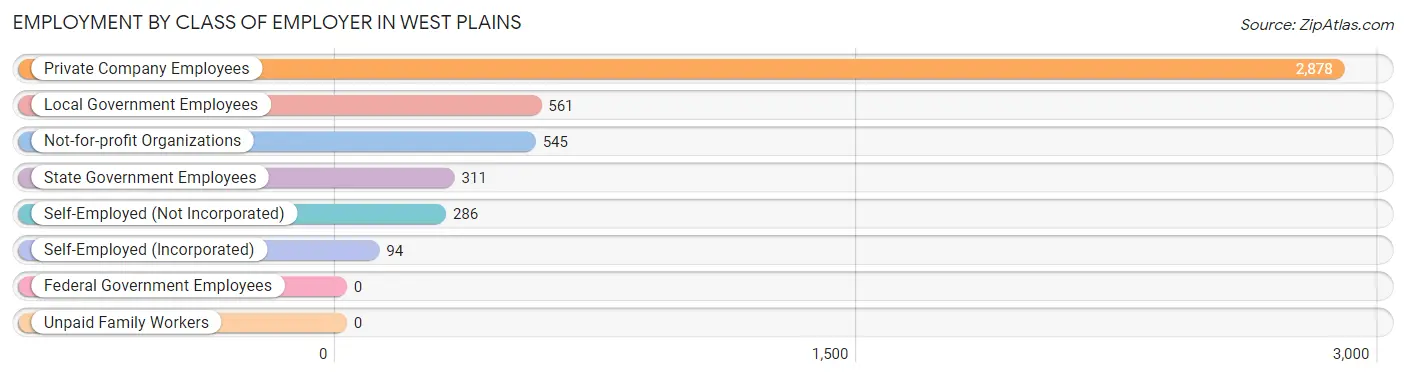
| Employer Class | # Employees | % Employees |
| Private Company Employees | 2,878 | 61.6% |
| Self-Employed (Incorporated) | 94 | 2.0% |
| Self-Employed (Not Incorporated) | 286 | 6.1% |
| Not-for-profit Organizations | 545 | 11.7% |
| Local Government Employees | 561 | 12.0% |
| State Government Employees | 311 | 6.7% |
| Federal Government Employees | 0 | 0.0% |
| Unpaid Family Workers | 0 | 0.0% |
| Total | 4,675 | 100.0% |
Employment Status by Age in West Plains
According to the labor force statistics for West Plains, out of the total population over 16 years of age (9,316), 56.1% or 5,226 individuals are in the labor force, with 4.7% or 246 of them unemployed. The age group with the highest labor force participation rate is 25 to 29 years, with 85.8% or 1,086 individuals in the labor force. Within the labor force, the 16 to 19 years age range has the highest percentage of unemployed individuals, with 15.0% or 22 of them being unemployed.
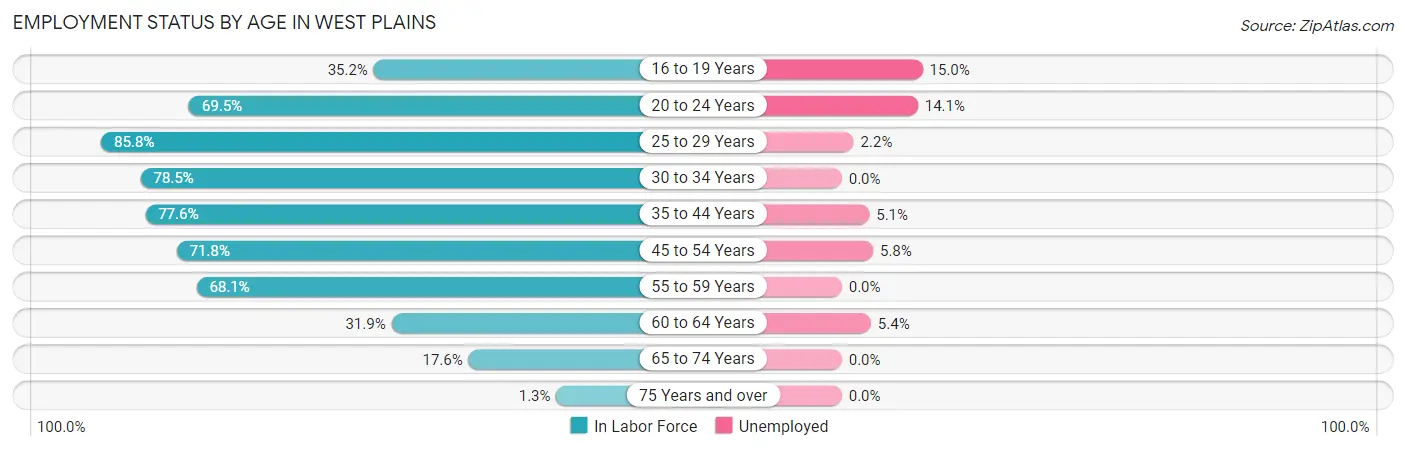
| Age Bracket | In Labor Force | Unemployed |
| 16 to 19 Years | 147 (35.2%) | 22 (15.0%) |
| 20 to 24 Years | 533 (69.5%) | 75 (14.1%) |
| 25 to 29 Years | 1,086 (85.8%) | 24 (2.2%) |
| 30 to 34 Years | 600 (78.5%) | 0 (0.0%) |
| 35 to 44 Years | 1,121 (77.6%) | 57 (5.1%) |
| 45 to 54 Years | 979 (71.8%) | 57 (5.8%) |
| 55 to 59 Years | 365 (68.1%) | 0 (0.0%) |
| 60 to 64 Years | 204 (31.9%) | 11 (5.4%) |
| 65 to 74 Years | 178 (17.6%) | 0 (0.0%) |
| 75 Years and over | 14 (1.3%) | 0 (0.0%) |
| Total | 5,226 (56.1%) | 246 (4.7%) |
Employment Status by Educational Attainment in West Plains
According to labor force statistics for West Plains, 72.4% of individuals (4,353) out of the total population between 25 and 64 years of age (6,013) are in the labor force, with 3.4% or 148 of them being unemployed. The group with the highest labor force participation rate are those with the educational attainment of bachelor's degree or higher, with 89.7% or 1,439 individuals in the labor force. Within the labor force, individuals with college / associate degree education have the highest percentage of unemployment, with 5.2% or 66 of them being unemployed.

| Educational Attainment | In Labor Force | Unemployed |
| Less than High School | 211 (33.9%) | 0 (0.0%) |
| High School Diploma | 1,441 (65.7%) | 88 (4.0%) |
| College / Associate Degree | 1,265 (79.4%) | 83 (5.2%) |
| Bachelor's Degree or higher | 1,439 (89.7%) | 29 (1.8%) |
| Total | 4,353 (72.4%) | 204 (3.4%) |
Employment Occupations by Sex in West Plains
Management, Business, Science and Arts Occupations
The most common Management, Business, Science and Arts occupations in West Plains are Community & Social Service (1,031 | 20.7%), Education Instruction & Library (562 | 11.3%), Health Diagnosing & Treating (519 | 10.4%), Management (288 | 5.8%), and Health Technologists (281 | 5.6%).
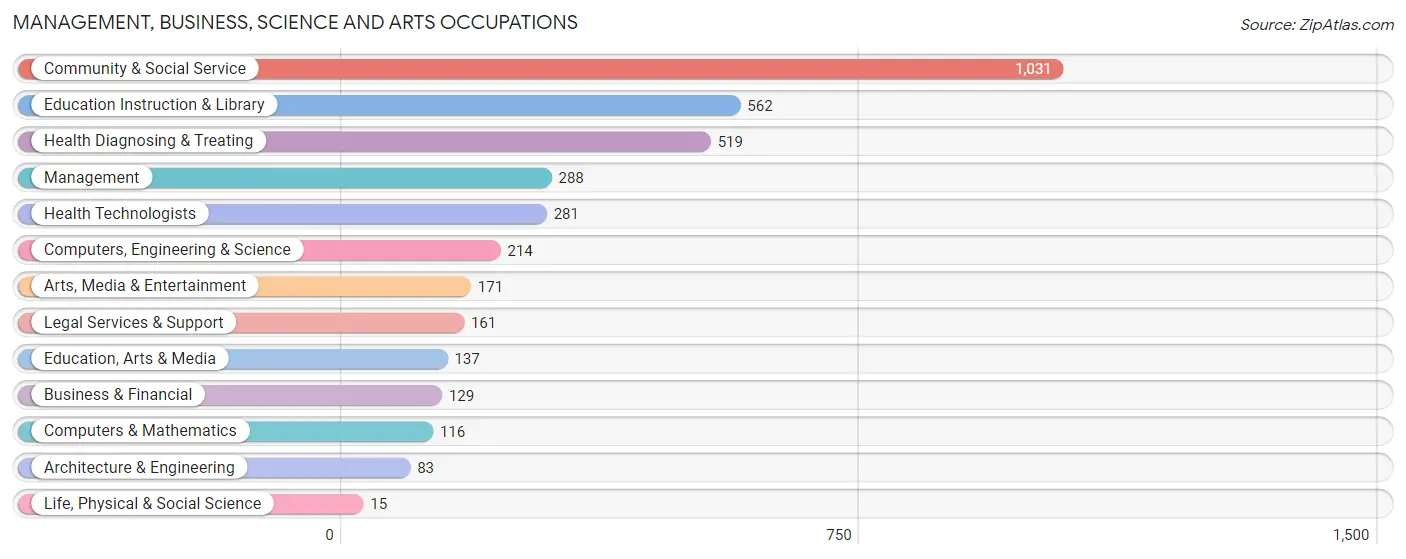
Management, Business, Science and Arts Occupations by Sex
Within the Management, Business, Science and Arts occupations in West Plains, the most male-oriented occupations are Architecture & Engineering (100.0%), Computers, Engineering & Science (83.6%), and Computers & Mathematics (82.8%), while the most female-oriented occupations are Life, Physical & Social Science (100.0%), Business & Financial (71.3%), and Health Diagnosing & Treating (69.0%).
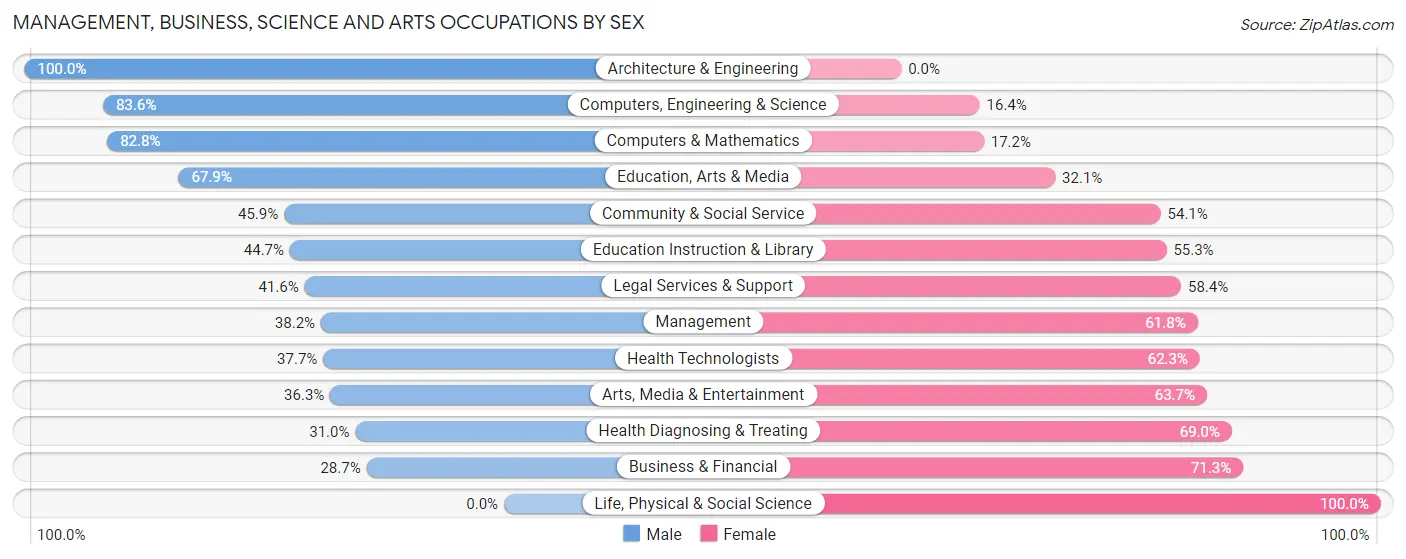
| Occupation | Male | Female |
| Management | 110 (38.2%) | 178 (61.8%) |
| Business & Financial | 37 (28.7%) | 92 (71.3%) |
| Computers, Engineering & Science | 179 (83.6%) | 35 (16.4%) |
| Computers & Mathematics | 96 (82.8%) | 20 (17.2%) |
| Architecture & Engineering | 83 (100.0%) | 0 (0.0%) |
| Life, Physical & Social Science | 0 (0.0%) | 15 (100.0%) |
| Community & Social Service | 473 (45.9%) | 558 (54.1%) |
| Education, Arts & Media | 93 (67.9%) | 44 (32.1%) |
| Legal Services & Support | 67 (41.6%) | 94 (58.4%) |
| Education Instruction & Library | 251 (44.7%) | 311 (55.3%) |
| Arts, Media & Entertainment | 62 (36.3%) | 109 (63.7%) |
| Health Diagnosing & Treating | 161 (31.0%) | 358 (69.0%) |
| Health Technologists | 106 (37.7%) | 175 (62.3%) |
| Total (Category) | 960 (44.0%) | 1,221 (56.0%) |
| Total (Overall) | 2,659 (53.4%) | 2,322 (46.6%) |
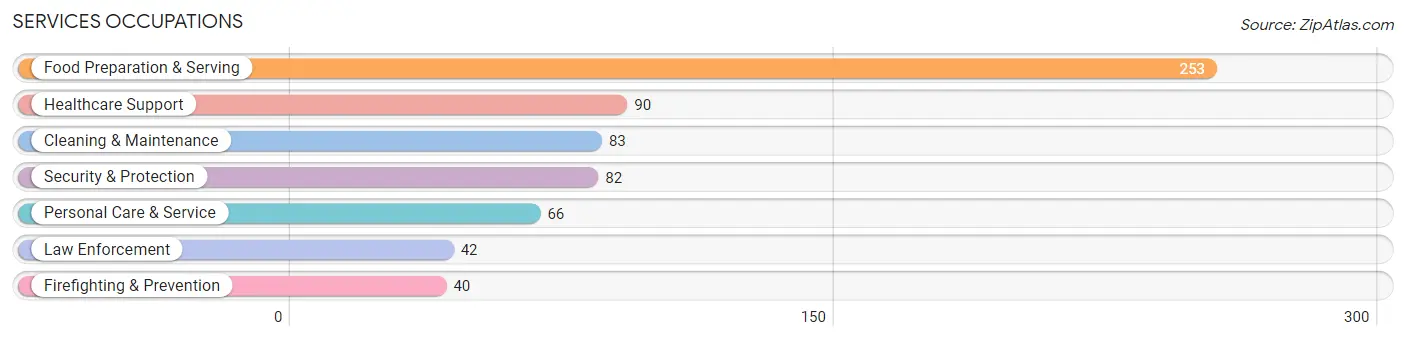
Services Occupations
The most common Services occupations in West Plains are Food Preparation & Serving (253 | 5.1%), Healthcare Support (90 | 1.8%), Cleaning & Maintenance (83 | 1.7%), Security & Protection (82 | 1.7%), and Personal Care & Service (66 | 1.3%).
Services Occupations by Sex
Within the Services occupations in West Plains, the most male-oriented occupations are Security & Protection (100.0%), Firefighting & Prevention (100.0%), and Law Enforcement (100.0%), while the most female-oriented occupations are Personal Care & Service (100.0%), Healthcare Support (81.1%), and Food Preparation & Serving (67.6%).
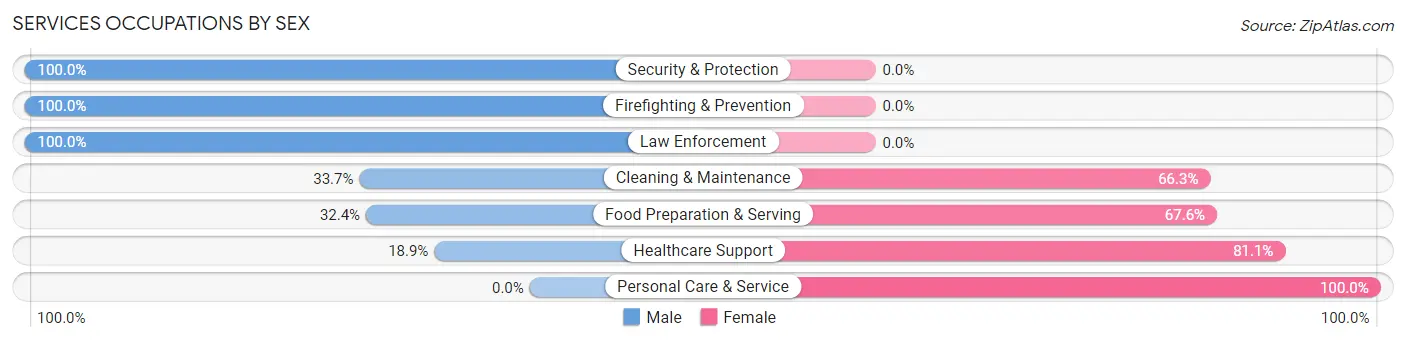
| Occupation | Male | Female |
| Healthcare Support | 17 (18.9%) | 73 (81.1%) |
| Security & Protection | 82 (100.0%) | 0 (0.0%) |
| Firefighting & Prevention | 40 (100.0%) | 0 (0.0%) |
| Law Enforcement | 42 (100.0%) | 0 (0.0%) |
| Food Preparation & Serving | 82 (32.4%) | 171 (67.6%) |
| Cleaning & Maintenance | 28 (33.7%) | 55 (66.3%) |
| Personal Care & Service | 0 (0.0%) | 66 (100.0%) |
| Total (Category) | 209 (36.4%) | 365 (63.6%) |
| Total (Overall) | 2,659 (53.4%) | 2,322 (46.6%) |
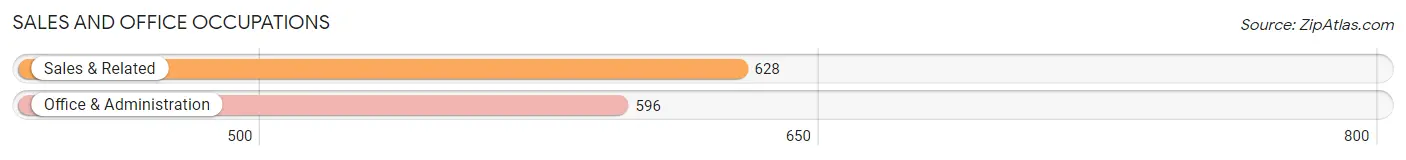
Sales and Office Occupations
The most common Sales and Office occupations in West Plains are Sales & Related (628 | 12.6%), and Office & Administration (596 | 12.0%).
Sales and Office Occupations by Sex
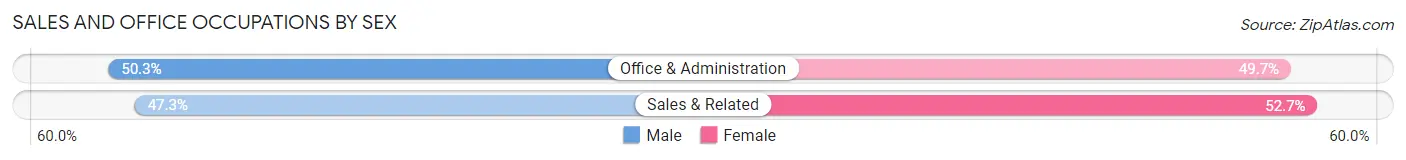
| Occupation | Male | Female |
| Sales & Related | 297 (47.3%) | 331 (52.7%) |
| Office & Administration | 300 (50.3%) | 296 (49.7%) |
| Total (Category) | 597 (48.8%) | 627 (51.2%) |
| Total (Overall) | 2,659 (53.4%) | 2,322 (46.6%) |
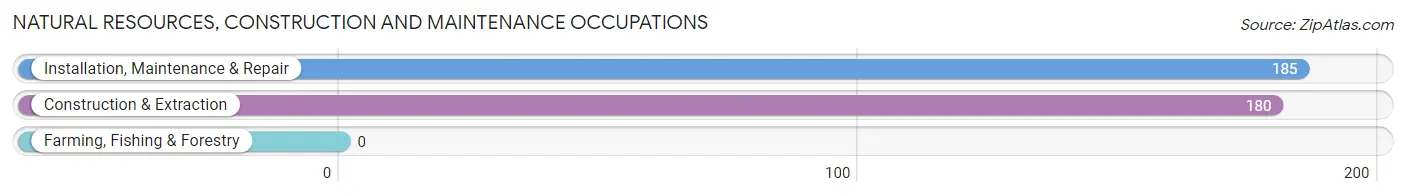
Natural Resources, Construction and Maintenance Occupations
The most common Natural Resources, Construction and Maintenance occupations in West Plains are Installation, Maintenance & Repair (185 | 3.7%), and Construction & Extraction (180 | 3.6%).
Natural Resources, Construction and Maintenance Occupations by Sex
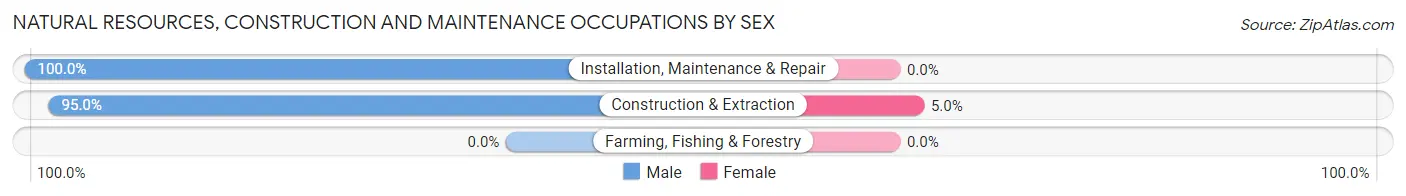
| Occupation | Male | Female |
| Farming, Fishing & Forestry | 0 (0.0%) | 0 (0.0%) |
| Construction & Extraction | 171 (95.0%) | 9 (5.0%) |
| Installation, Maintenance & Repair | 185 (100.0%) | 0 (0.0%) |
| Total (Category) | 356 (97.5%) | 9 (2.5%) |
| Total (Overall) | 2,659 (53.4%) | 2,322 (46.6%) |
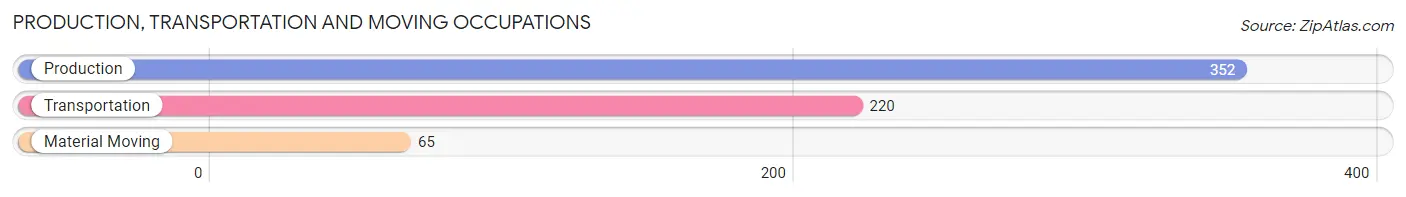
Production, Transportation and Moving Occupations
The most common Production, Transportation and Moving occupations in West Plains are Production (352 | 7.1%), Transportation (220 | 4.4%), and Material Moving (65 | 1.3%).
Production, Transportation and Moving Occupations by Sex
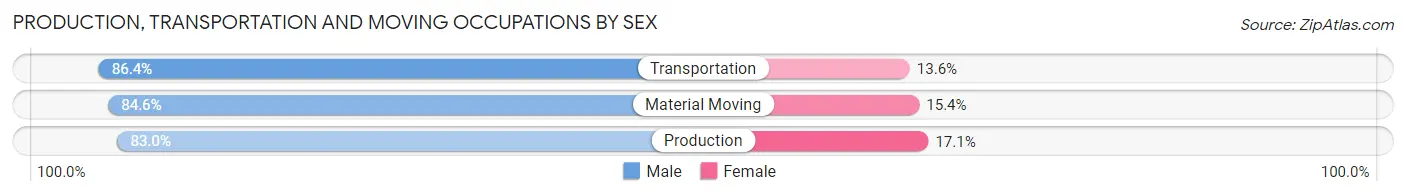
| Occupation | Male | Female |
| Production | 292 (83.0%) | 60 (17.1%) |
| Transportation | 190 (86.4%) | 30 (13.6%) |
| Material Moving | 55 (84.6%) | 10 (15.4%) |
| Total (Category) | 537 (84.3%) | 100 (15.7%) |
| Total (Overall) | 2,659 (53.4%) | 2,322 (46.6%) |
Employment Industries by Sex in West Plains
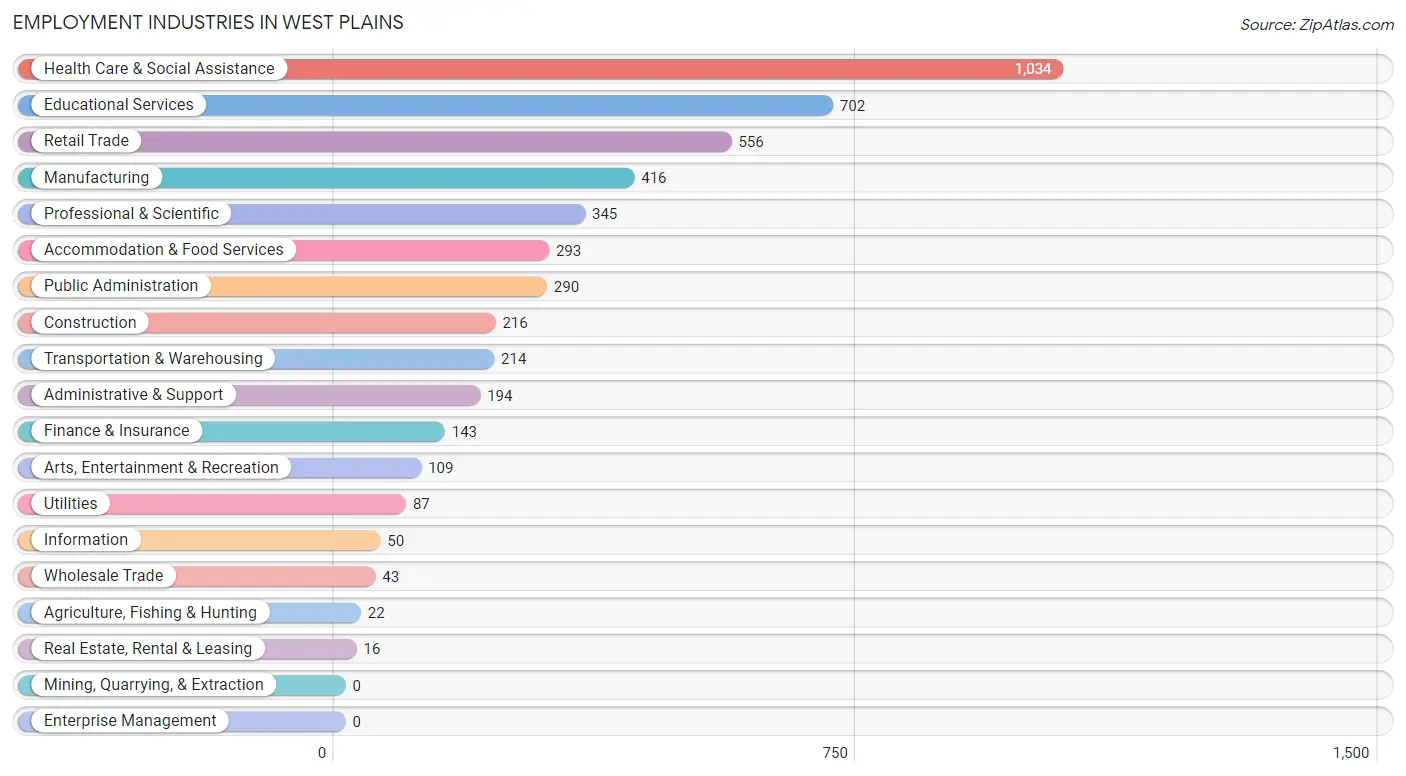
Employment Industries in West Plains
The major employment industries in West Plains include Health Care & Social Assistance (1,034 | 20.8%), Educational Services (702 | 14.1%), Retail Trade (556 | 11.2%), Manufacturing (416 | 8.4%), and Professional & Scientific (345 | 6.9%).
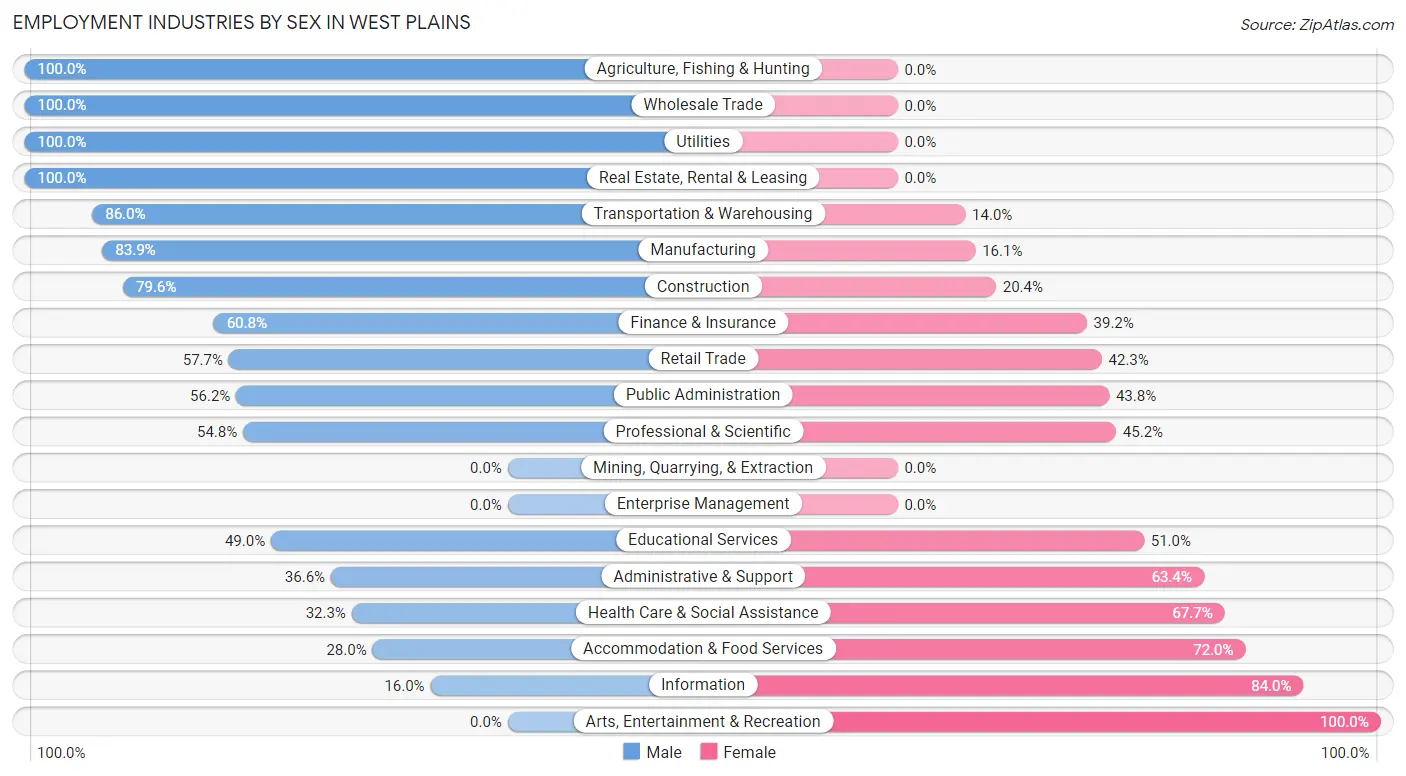
Employment Industries by Sex in West Plains
The West Plains industries that see more men than women are Agriculture, Fishing & Hunting (100.0%), Wholesale Trade (100.0%), and Utilities (100.0%), whereas the industries that tend to have a higher number of women are Arts, Entertainment & Recreation (100.0%), Information (84.0%), and Accommodation & Food Services (72.0%).
| Industry | Male | Female |
| Agriculture, Fishing & Hunting | 22 (100.0%) | 0 (0.0%) |
| Mining, Quarrying, & Extraction | 0 (0.0%) | 0 (0.0%) |
| Construction | 172 (79.6%) | 44 (20.4%) |
| Manufacturing | 349 (83.9%) | 67 (16.1%) |
| Wholesale Trade | 43 (100.0%) | 0 (0.0%) |
| Retail Trade | 321 (57.7%) | 235 (42.3%) |
| Transportation & Warehousing | 184 (86.0%) | 30 (14.0%) |
| Utilities | 87 (100.0%) | 0 (0.0%) |
| Information | 8 (16.0%) | 42 (84.0%) |
| Finance & Insurance | 87 (60.8%) | 56 (39.2%) |
| Real Estate, Rental & Leasing | 16 (100.0%) | 0 (0.0%) |
| Professional & Scientific | 189 (54.8%) | 156 (45.2%) |
| Enterprise Management | 0 (0.0%) | 0 (0.0%) |
| Administrative & Support | 71 (36.6%) | 123 (63.4%) |
| Educational Services | 344 (49.0%) | 358 (51.0%) |
| Health Care & Social Assistance | 334 (32.3%) | 700 (67.7%) |
| Arts, Entertainment & Recreation | 0 (0.0%) | 109 (100.0%) |
| Accommodation & Food Services | 82 (28.0%) | 211 (72.0%) |
| Public Administration | 163 (56.2%) | 127 (43.8%) |
| Total | 2,659 (53.4%) | 2,322 (46.6%) |
Education in West Plains
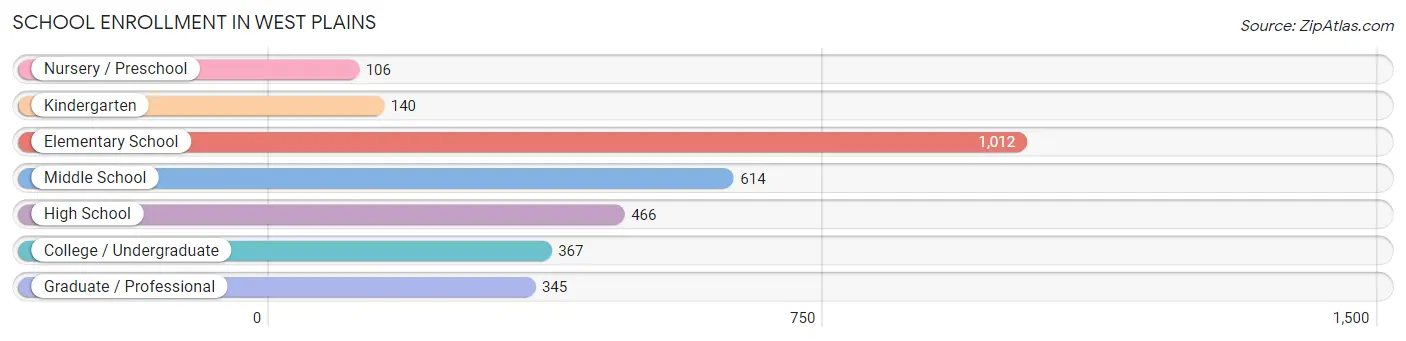
School Enrollment in West Plains
The most common levels of schooling among the 3,050 students in West Plains are elementary school (1,012 | 33.2%), middle school (614 | 20.1%), and high school (466 | 15.3%).
| School Level | # Students | % Students |
| Nursery / Preschool | 106 | 3.5% |
| Kindergarten | 140 | 4.6% |
| Elementary School | 1,012 | 33.2% |
| Middle School | 614 | 20.1% |
| High School | 466 | 15.3% |
| College / Undergraduate | 367 | 12.0% |
| Graduate / Professional | 345 | 11.3% |
| Total | 3,050 | 100.0% |
School Enrollment by Age by Funding Source in West Plains
Out of a total of 3,050 students who are enrolled in schools in West Plains, 491 (16.1%) attend a private institution, while the remaining 2,559 (83.9%) are enrolled in public schools. The age group of 25 to 34 year olds has the highest likelihood of being enrolled in private schools, with 82 (39.1% in the age bracket) enrolled. Conversely, the age group of 3 to 4 year olds has the lowest likelihood of being enrolled in a private school, with 35 (100.0% in the age bracket) attending a public institution.
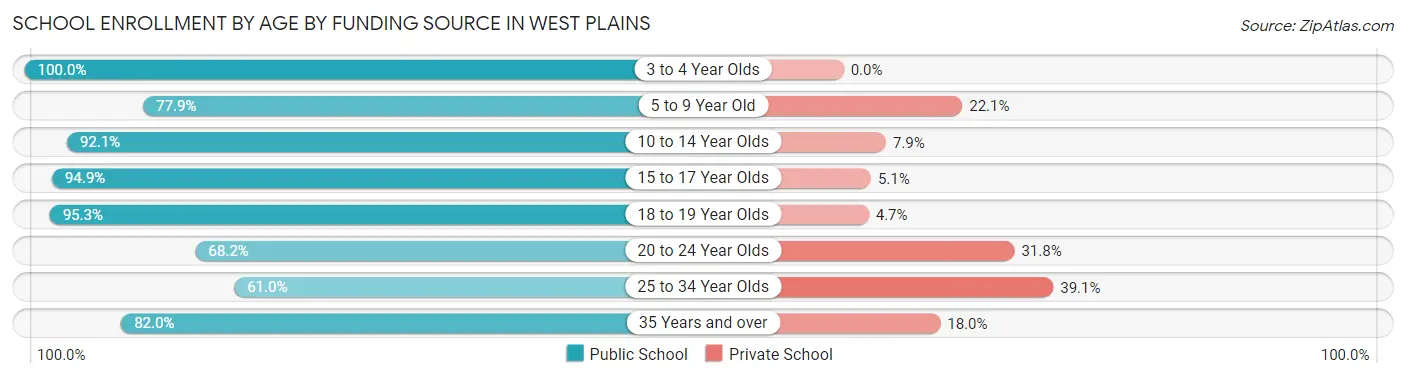
| Age Bracket | Public School | Private School |
| 3 to 4 Year Olds | 35 (100.0%) | 0 (0.0%) |
| 5 to 9 Year Old | 797 (77.9%) | 226 (22.1%) |
| 10 to 14 Year Olds | 747 (92.1%) | 64 (7.9%) |
| 15 to 17 Year Olds | 317 (94.9%) | 17 (5.1%) |
| 18 to 19 Year Olds | 163 (95.3%) | 8 (4.7%) |
| 20 to 24 Year Olds | 45 (68.2%) | 21 (31.8%) |
| 25 to 34 Year Olds | 128 (61.0%) | 82 (39.1%) |
| 35 Years and over | 328 (82.0%) | 72 (18.0%) |
| Total | 2,559 (83.9%) | 491 (16.1%) |
Educational Attainment by Field of Study in West Plains
Education (429 | 19.6%), social sciences (364 | 16.6%), business (319 | 14.6%), computers & mathematics (278 | 12.7%), and arts & humanities (150 | 6.9%) are the most common fields of study among 2,190 individuals in West Plains who have obtained a bachelor's degree or higher.
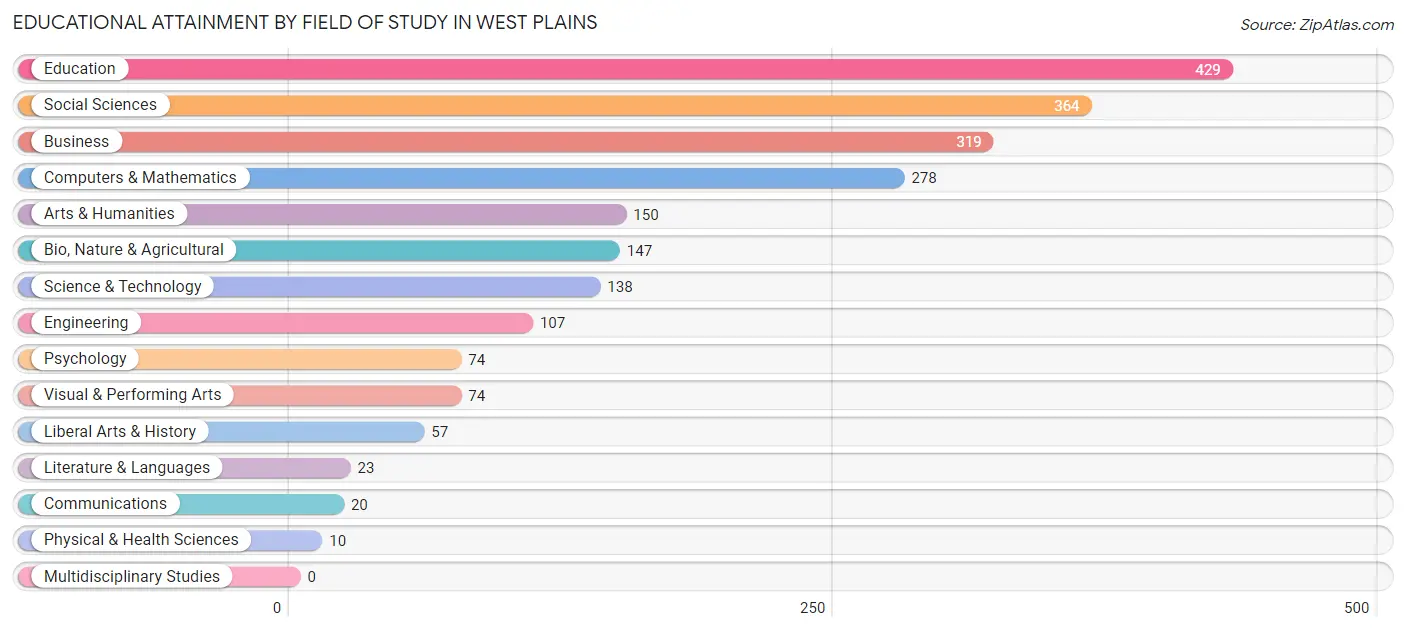
| Field of Study | # Graduates | % Graduates |
| Computers & Mathematics | 278 | 12.7% |
| Bio, Nature & Agricultural | 147 | 6.7% |
| Physical & Health Sciences | 10 | 0.5% |
| Psychology | 74 | 3.4% |
| Social Sciences | 364 | 16.6% |
| Engineering | 107 | 4.9% |
| Multidisciplinary Studies | 0 | 0.0% |
| Science & Technology | 138 | 6.3% |
| Business | 319 | 14.6% |
| Education | 429 | 19.6% |
| Literature & Languages | 23 | 1.1% |
| Liberal Arts & History | 57 | 2.6% |
| Visual & Performing Arts | 74 | 3.4% |
| Communications | 20 | 0.9% |
| Arts & Humanities | 150 | 6.9% |
| Total | 2,190 | 100.0% |
Transportation & Commute in West Plains
Vehicle Availability by Sex in West Plains
The most prevalent vehicle ownership categories in West Plains are males with 2 vehicles (1,046, accounting for 43.4%) and females with 2 vehicles (976, making up 46.5%).
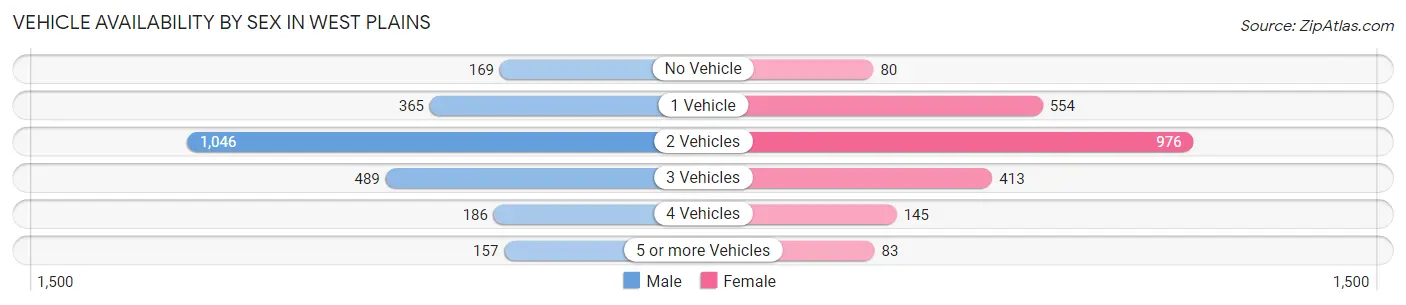
| Vehicles Available | Male | Female |
| No Vehicle | 169 (7.0%) | 80 (3.5%) |
| 1 Vehicle | 365 (15.1%) | 554 (24.6%) |
| 2 Vehicles | 1,046 (43.4%) | 976 (43.4%) |
| 3 Vehicles | 489 (20.3%) | 413 (18.3%) |
| 4 Vehicles | 186 (7.7%) | 145 (6.4%) |
| 5 or more Vehicles | 157 (6.5%) | 83 (3.7%) |
| Total | 2,412 (100.0%) | 2,251 (100.0%) |
Commute Time in West Plains
The most frequently occuring commute durations in West Plains are 5 to 9 minutes (1,630 commuters, 36.4%), 10 to 14 minutes (914 commuters, 20.4%), and 15 to 19 minutes (642 commuters, 14.3%).
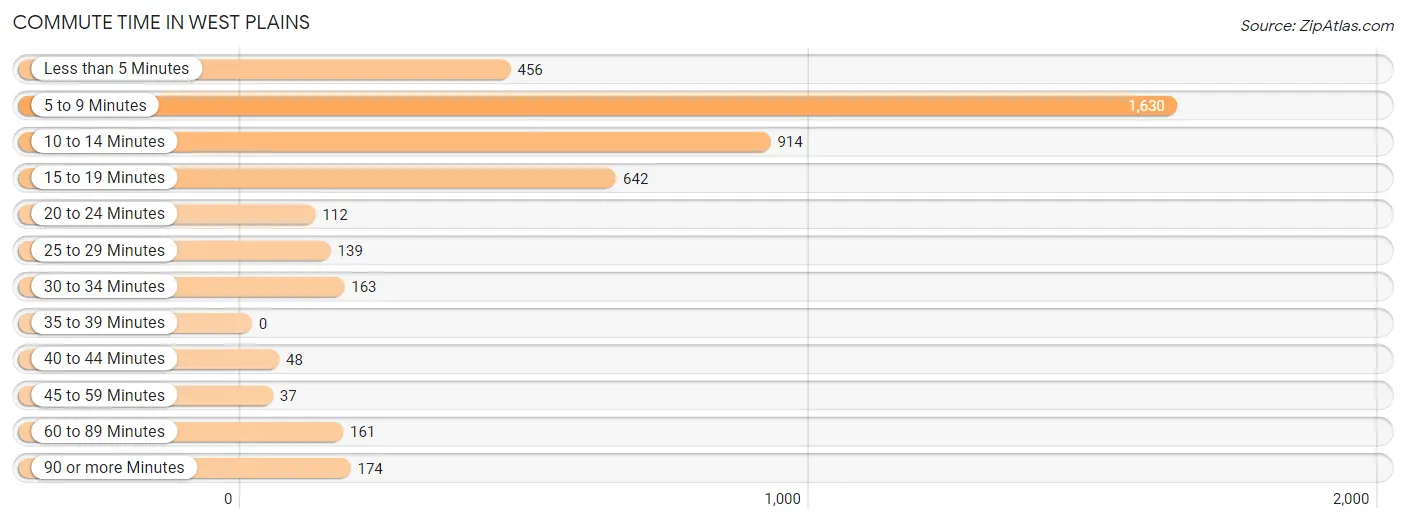
| Commute Time | # Commuters | % Commuters |
| Less than 5 Minutes | 456 | 10.2% |
| 5 to 9 Minutes | 1,630 | 36.4% |
| 10 to 14 Minutes | 914 | 20.4% |
| 15 to 19 Minutes | 642 | 14.3% |
| 20 to 24 Minutes | 112 | 2.5% |
| 25 to 29 Minutes | 139 | 3.1% |
| 30 to 34 Minutes | 163 | 3.6% |
| 35 to 39 Minutes | 0 | 0.0% |
| 40 to 44 Minutes | 48 | 1.1% |
| 45 to 59 Minutes | 37 | 0.8% |
| 60 to 89 Minutes | 161 | 3.6% |
| 90 or more Minutes | 174 | 3.9% |
Commute Time by Sex in West Plains
The most common commute times in West Plains are 5 to 9 minutes (809 commuters, 34.6%) for males and 5 to 9 minutes (821 commuters, 38.4%) for females.
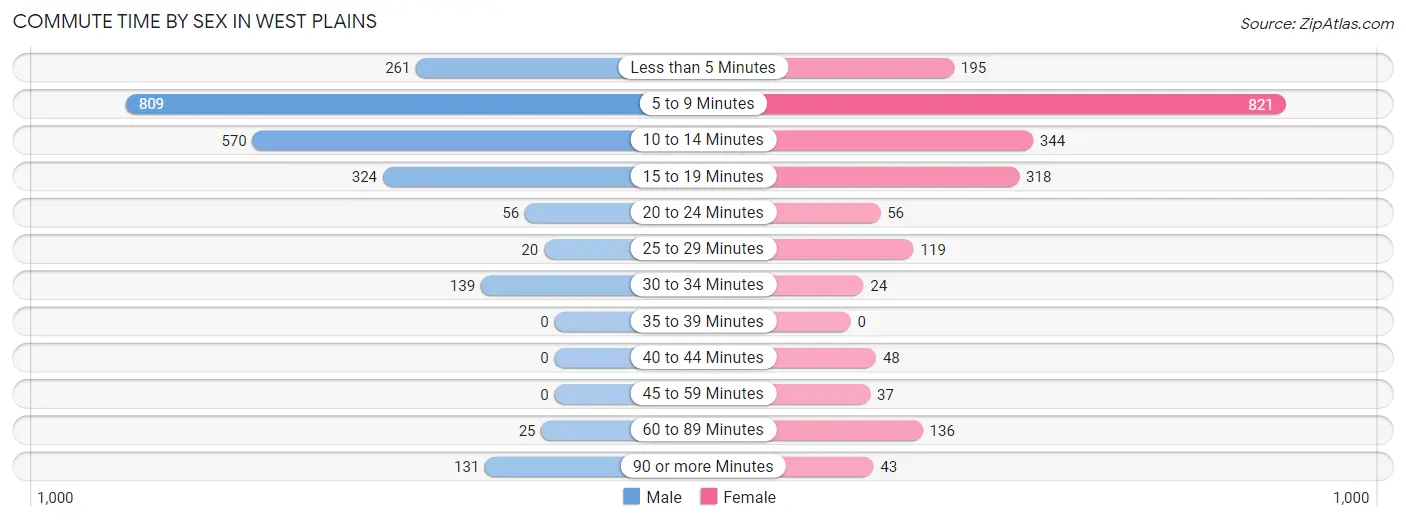
| Commute Time | Male | Female |
| Less than 5 Minutes | 261 (11.2%) | 195 (9.1%) |
| 5 to 9 Minutes | 809 (34.6%) | 821 (38.4%) |
| 10 to 14 Minutes | 570 (24.4%) | 344 (16.1%) |
| 15 to 19 Minutes | 324 (13.9%) | 318 (14.8%) |
| 20 to 24 Minutes | 56 (2.4%) | 56 (2.6%) |
| 25 to 29 Minutes | 20 (0.9%) | 119 (5.6%) |
| 30 to 34 Minutes | 139 (5.9%) | 24 (1.1%) |
| 35 to 39 Minutes | 0 (0.0%) | 0 (0.0%) |
| 40 to 44 Minutes | 0 (0.0%) | 48 (2.2%) |
| 45 to 59 Minutes | 0 (0.0%) | 37 (1.7%) |
| 60 to 89 Minutes | 25 (1.1%) | 136 (6.4%) |
| 90 or more Minutes | 131 (5.6%) | 43 (2.0%) |
Time of Departure to Work by Sex in West Plains
The most frequent times of departure to work in West Plains are 6:30 AM to 6:59 AM (424, 18.2%) for males and 7:30 AM to 7:59 AM (389, 18.2%) for females.
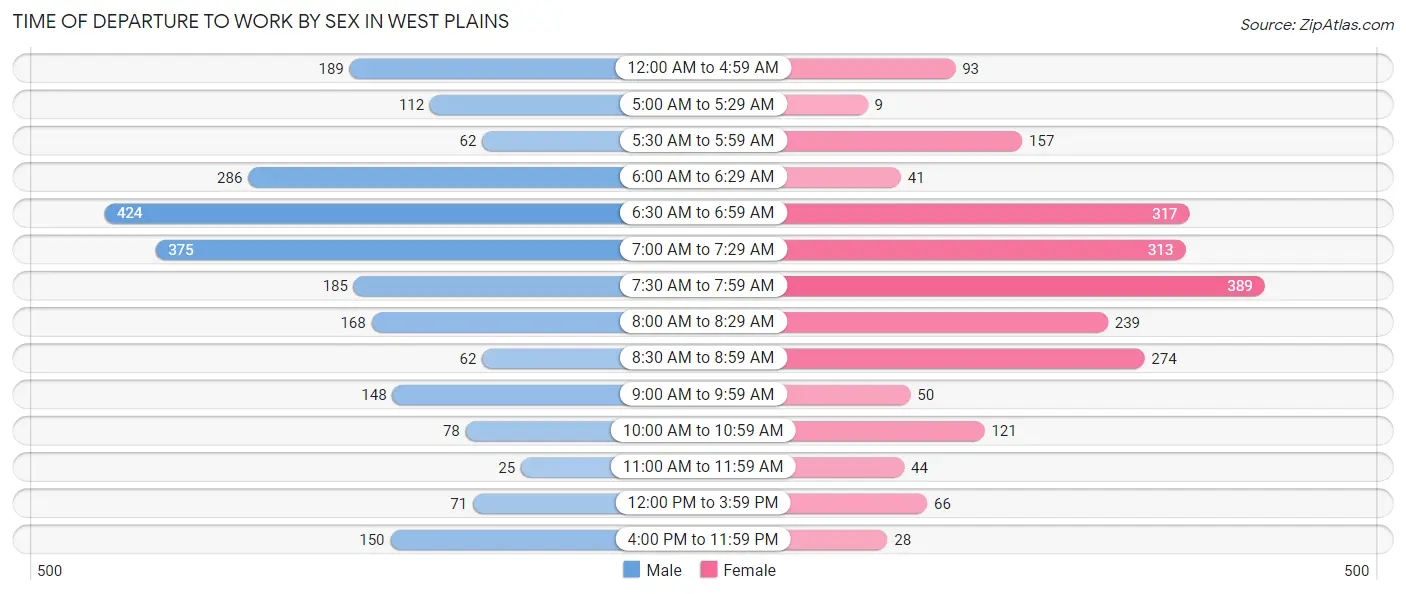
| Time of Departure | Male | Female |
| 12:00 AM to 4:59 AM | 189 (8.1%) | 93 (4.3%) |
| 5:00 AM to 5:29 AM | 112 (4.8%) | 9 (0.4%) |
| 5:30 AM to 5:59 AM | 62 (2.7%) | 157 (7.3%) |
| 6:00 AM to 6:29 AM | 286 (12.2%) | 41 (1.9%) |
| 6:30 AM to 6:59 AM | 424 (18.2%) | 317 (14.8%) |
| 7:00 AM to 7:29 AM | 375 (16.1%) | 313 (14.6%) |
| 7:30 AM to 7:59 AM | 185 (7.9%) | 389 (18.2%) |
| 8:00 AM to 8:29 AM | 168 (7.2%) | 239 (11.2%) |
| 8:30 AM to 8:59 AM | 62 (2.7%) | 274 (12.8%) |
| 9:00 AM to 9:59 AM | 148 (6.3%) | 50 (2.3%) |
| 10:00 AM to 10:59 AM | 78 (3.3%) | 121 (5.7%) |
| 11:00 AM to 11:59 AM | 25 (1.1%) | 44 (2.1%) |
| 12:00 PM to 3:59 PM | 71 (3.0%) | 66 (3.1%) |
| 4:00 PM to 11:59 PM | 150 (6.4%) | 28 (1.3%) |
| Total | 2,335 (100.0%) | 2,141 (100.0%) |
Housing Occupancy in West Plains
Occupancy by Ownership in West Plains
Of the total 4,874 dwellings in West Plains, owner-occupied units account for 2,314 (47.5%), while renter-occupied units make up 2,560 (52.5%).
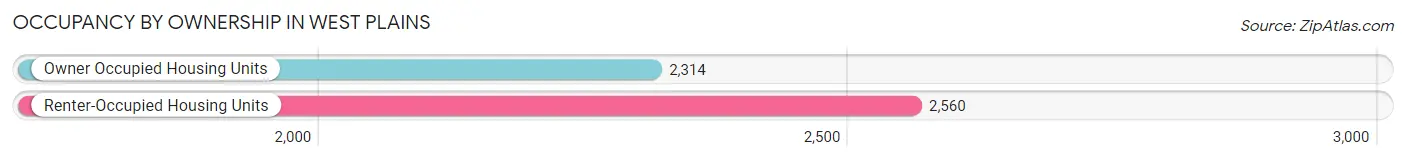
| Occupancy | # Housing Units | % Housing Units |
| Owner Occupied Housing Units | 2,314 | 47.5% |
| Renter-Occupied Housing Units | 2,560 | 52.5% |
| Total Occupied Housing Units | 4,874 | 100.0% |
Occupancy by Household Size in West Plains
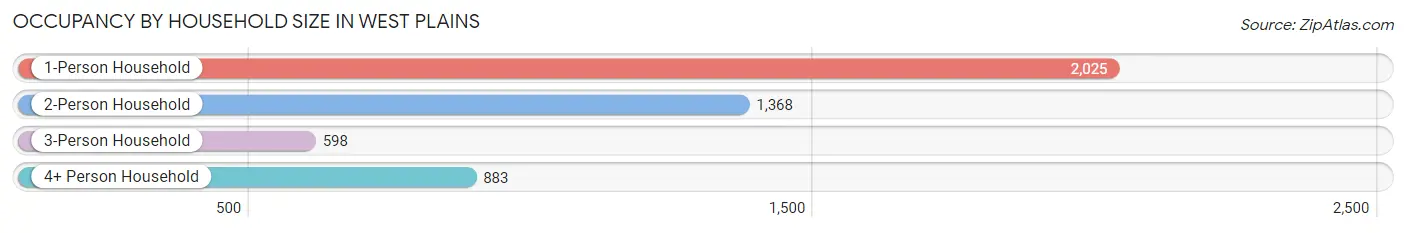
| Household Size | # Housing Units | % Housing Units |
| 1-Person Household | 2,025 | 41.5% |
| 2-Person Household | 1,368 | 28.1% |
| 3-Person Household | 598 | 12.3% |
| 4+ Person Household | 883 | 18.1% |
| Total Housing Units | 4,874 | 100.0% |
Occupancy by Ownership by Household Size in West Plains
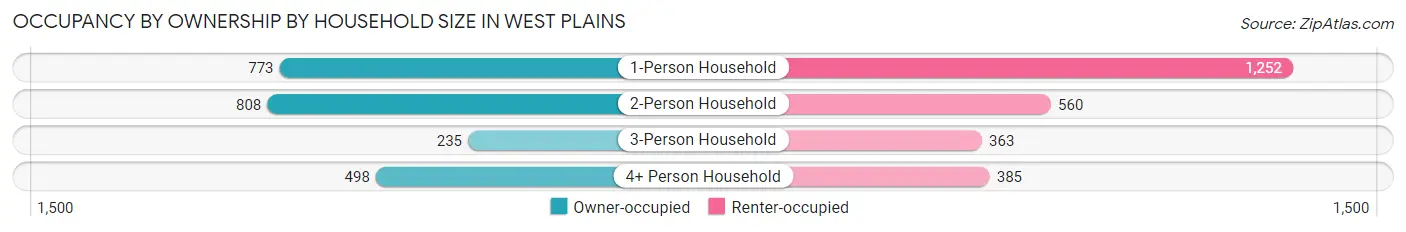
| Household Size | Owner-occupied | Renter-occupied |
| 1-Person Household | 773 (38.2%) | 1,252 (61.8%) |
| 2-Person Household | 808 (59.1%) | 560 (40.9%) |
| 3-Person Household | 235 (39.3%) | 363 (60.7%) |
| 4+ Person Household | 498 (56.4%) | 385 (43.6%) |
| Total Housing Units | 2,314 (47.5%) | 2,560 (52.5%) |
Occupancy by Educational Attainment in West Plains
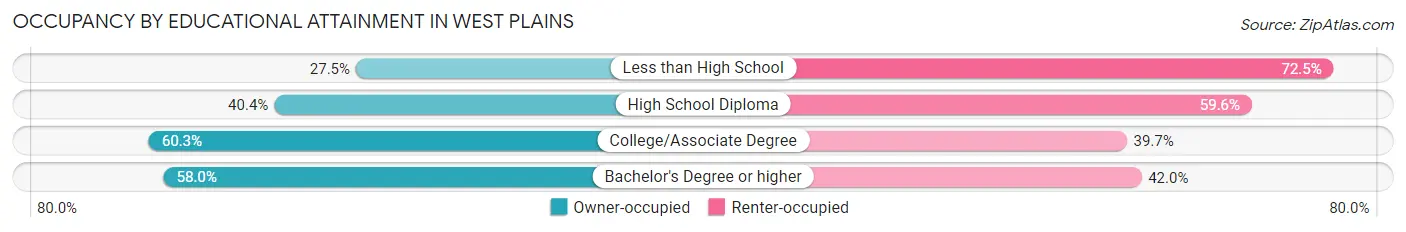
| Household Size | Owner-occupied | Renter-occupied |
| Less than High School | 198 (27.5%) | 523 (72.5%) |
| High School Diploma | 740 (40.4%) | 1,091 (59.6%) |
| College/Associate Degree | 779 (60.3%) | 513 (39.7%) |
| Bachelor's Degree or higher | 597 (58.0%) | 433 (42.0%) |
Occupancy by Age of Householder in West Plains
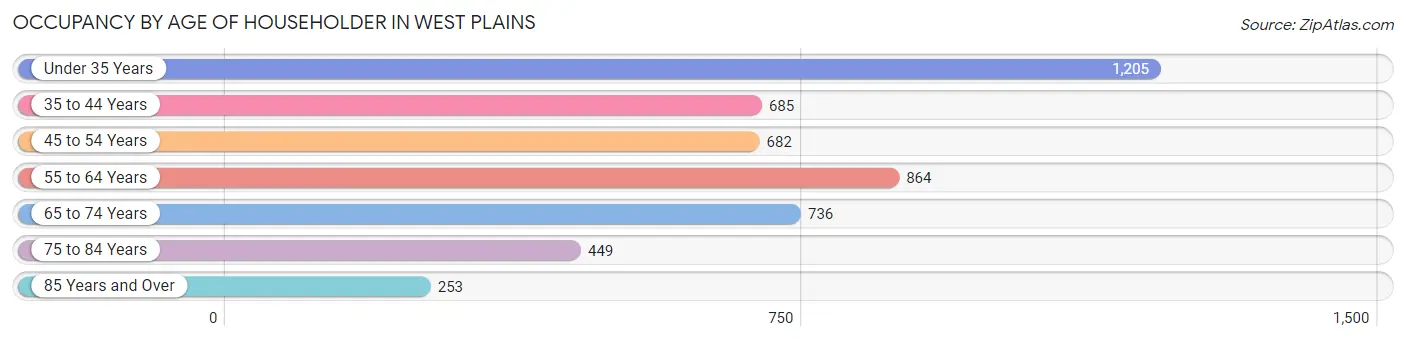
| Age Bracket | # Households | % Households |
| Under 35 Years | 1,205 | 24.7% |
| 35 to 44 Years | 685 | 14.1% |
| 45 to 54 Years | 682 | 14.0% |
| 55 to 64 Years | 864 | 17.7% |
| 65 to 74 Years | 736 | 15.1% |
| 75 to 84 Years | 449 | 9.2% |
| 85 Years and Over | 253 | 5.2% |
| Total | 4,874 | 100.0% |
Housing Finances in West Plains
Median Income by Occupancy in West Plains
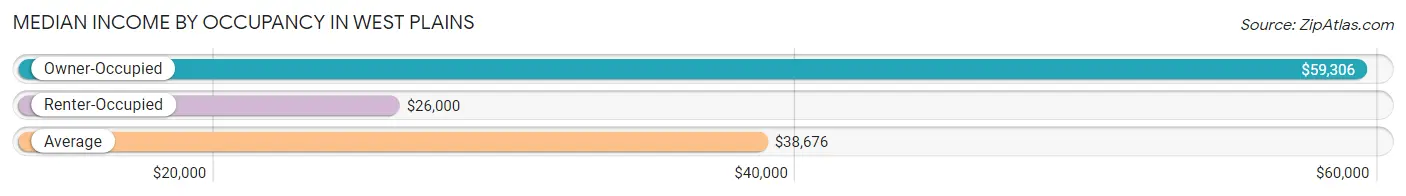
| Occupancy Type | # Households | Median Income |
| Owner-Occupied | 2,314 (47.5%) | $59,306 |
| Renter-Occupied | 2,560 (52.5%) | $26,000 |
| Average | 4,874 (100.0%) | $38,676 |
Occupancy by Householder Income Bracket in West Plains
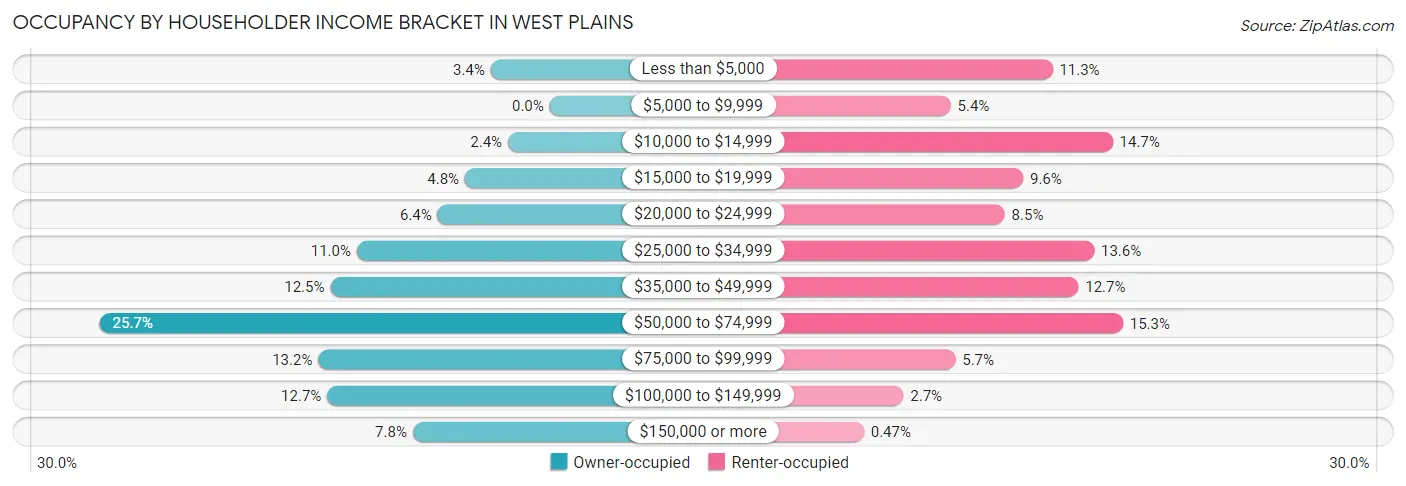
| Income Bracket | Owner-occupied | Renter-occupied |
| Less than $5,000 | 78 (3.4%) | 288 (11.3%) |
| $5,000 to $9,999 | 0 (0.0%) | 139 (5.4%) |
| $10,000 to $14,999 | 55 (2.4%) | 376 (14.7%) |
| $15,000 to $19,999 | 112 (4.8%) | 245 (9.6%) |
| $20,000 to $24,999 | 148 (6.4%) | 218 (8.5%) |
| $25,000 to $34,999 | 255 (11.0%) | 349 (13.6%) |
| $35,000 to $49,999 | 290 (12.5%) | 326 (12.7%) |
| $50,000 to $74,999 | 595 (25.7%) | 391 (15.3%) |
| $75,000 to $99,999 | 306 (13.2%) | 146 (5.7%) |
| $100,000 to $149,999 | 294 (12.7%) | 70 (2.7%) |
| $150,000 or more | 181 (7.8%) | 12 (0.5%) |
| Total | 2,314 (100.0%) | 2,560 (100.0%) |
Monthly Housing Cost Tiers in West Plains
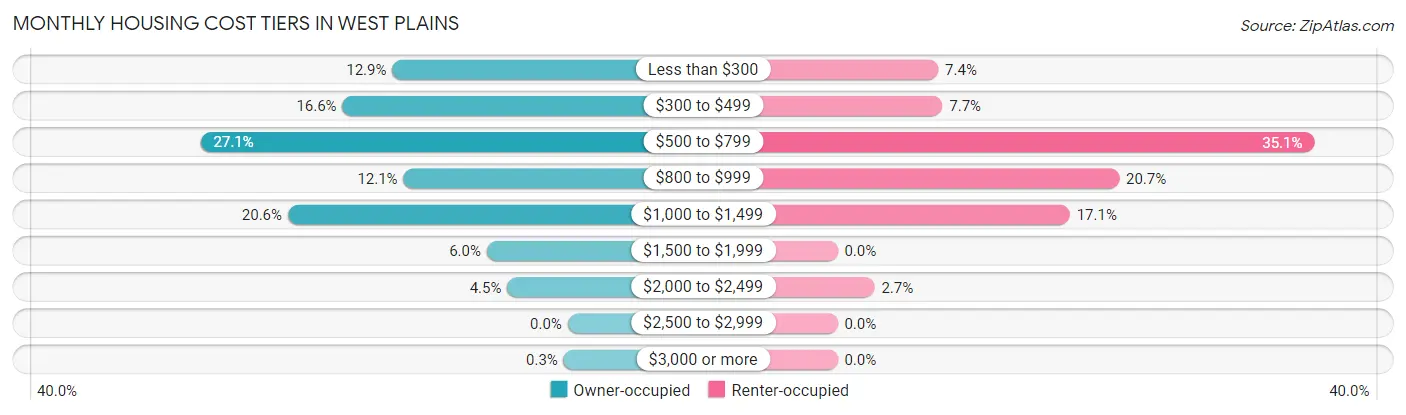
| Monthly Cost | Owner-occupied | Renter-occupied |
| Less than $300 | 299 (12.9%) | 190 (7.4%) |
| $300 to $499 | 384 (16.6%) | 198 (7.7%) |
| $500 to $799 | 626 (27.1%) | 899 (35.1%) |
| $800 to $999 | 280 (12.1%) | 531 (20.7%) |
| $1,000 to $1,499 | 477 (20.6%) | 438 (17.1%) |
| $1,500 to $1,999 | 138 (6.0%) | 0 (0.0%) |
| $2,000 to $2,499 | 103 (4.4%) | 70 (2.7%) |
| $2,500 to $2,999 | 0 (0.0%) | 0 (0.0%) |
| $3,000 or more | 7 (0.3%) | 0 (0.0%) |
| Total | 2,314 (100.0%) | 2,560 (100.0%) |
Physical Housing Characteristics in West Plains
Housing Structures in West Plains
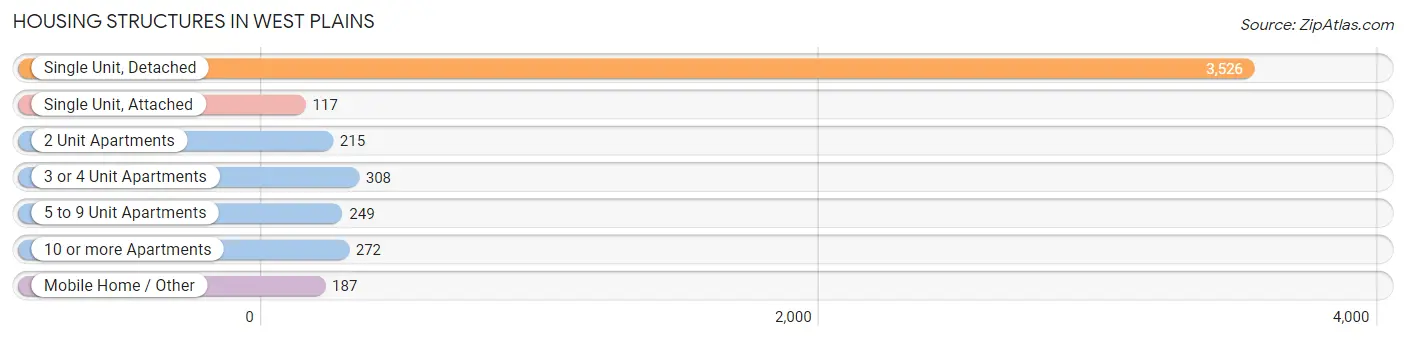
| Structure Type | # Housing Units | % Housing Units |
| Single Unit, Detached | 3,526 | 72.3% |
| Single Unit, Attached | 117 | 2.4% |
| 2 Unit Apartments | 215 | 4.4% |
| 3 or 4 Unit Apartments | 308 | 6.3% |
| 5 to 9 Unit Apartments | 249 | 5.1% |
| 10 or more Apartments | 272 | 5.6% |
| Mobile Home / Other | 187 | 3.8% |
| Total | 4,874 | 100.0% |
Housing Structures by Occupancy in West Plains
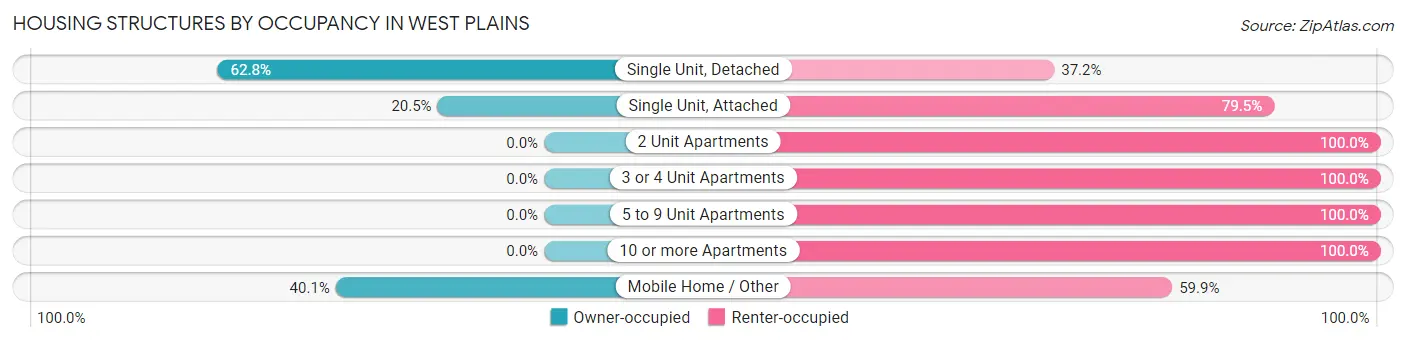
| Structure Type | Owner-occupied | Renter-occupied |
| Single Unit, Detached | 2,215 (62.8%) | 1,311 (37.2%) |
| Single Unit, Attached | 24 (20.5%) | 93 (79.5%) |
| 2 Unit Apartments | 0 (0.0%) | 215 (100.0%) |
| 3 or 4 Unit Apartments | 0 (0.0%) | 308 (100.0%) |
| 5 to 9 Unit Apartments | 0 (0.0%) | 249 (100.0%) |
| 10 or more Apartments | 0 (0.0%) | 272 (100.0%) |
| Mobile Home / Other | 75 (40.1%) | 112 (59.9%) |
| Total | 2,314 (47.5%) | 2,560 (52.5%) |
Housing Structures by Number of Rooms in West Plains
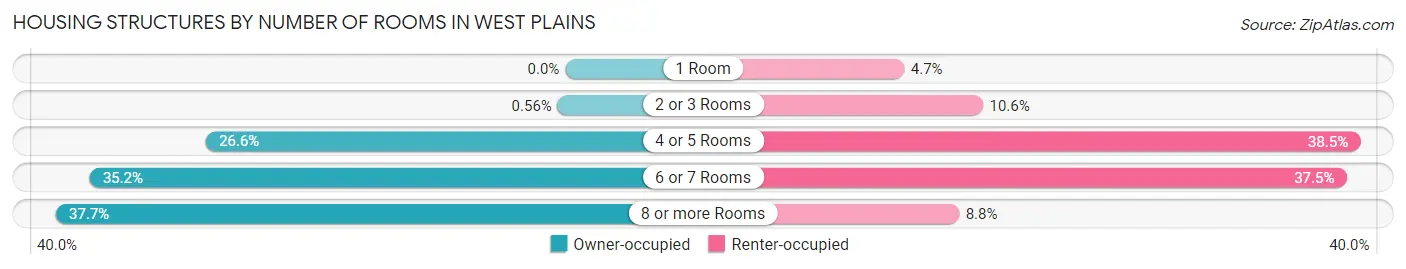
| Number of Rooms | Owner-occupied | Renter-occupied |
| 1 Room | 0 (0.0%) | 121 (4.7%) |
| 2 or 3 Rooms | 13 (0.6%) | 270 (10.5%) |
| 4 or 5 Rooms | 615 (26.6%) | 985 (38.5%) |
| 6 or 7 Rooms | 814 (35.2%) | 959 (37.5%) |
| 8 or more Rooms | 872 (37.7%) | 225 (8.8%) |
| Total | 2,314 (100.0%) | 2,560 (100.0%) |
Housing Structure by Heating Type in West Plains
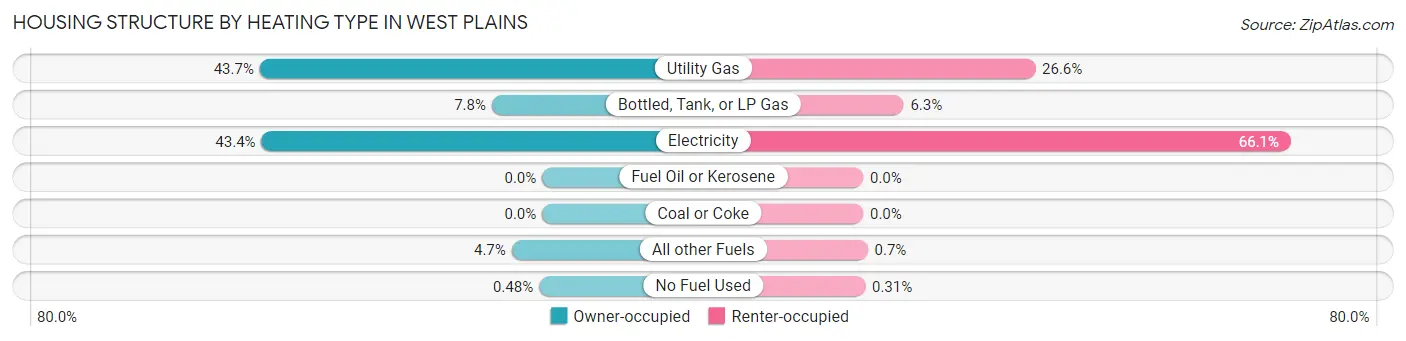
| Heating Type | Owner-occupied | Renter-occupied |
| Utility Gas | 1,010 (43.6%) | 681 (26.6%) |
| Bottled, Tank, or LP Gas | 180 (7.8%) | 160 (6.2%) |
| Electricity | 1,004 (43.4%) | 1,693 (66.1%) |
| Fuel Oil or Kerosene | 0 (0.0%) | 0 (0.0%) |
| Coal or Coke | 0 (0.0%) | 0 (0.0%) |
| All other Fuels | 109 (4.7%) | 18 (0.7%) |
| No Fuel Used | 11 (0.5%) | 8 (0.3%) |
| Total | 2,314 (100.0%) | 2,560 (100.0%) |
Household Vehicle Usage in West Plains
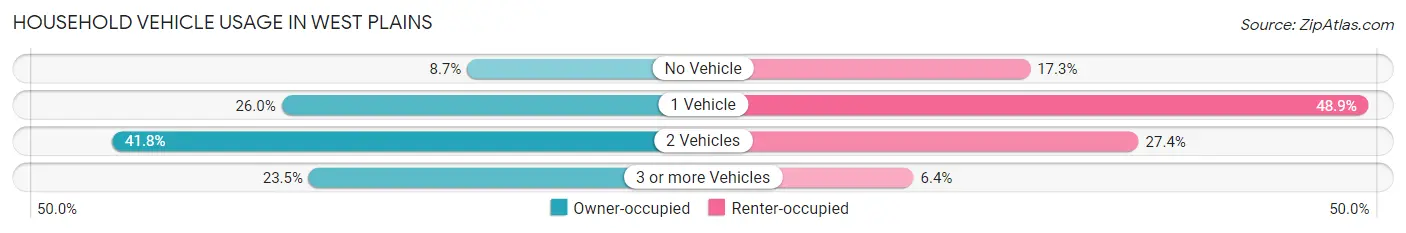
| Vehicles per Household | Owner-occupied | Renter-occupied |
| No Vehicle | 201 (8.7%) | 443 (17.3%) |
| 1 Vehicle | 602 (26.0%) | 1,251 (48.9%) |
| 2 Vehicles | 968 (41.8%) | 702 (27.4%) |
| 3 or more Vehicles | 543 (23.5%) | 164 (6.4%) |
| Total | 2,314 (100.0%) | 2,560 (100.0%) |
Real Estate & Mortgages in West Plains
Real Estate and Mortgage Overview in West Plains
| Characteristic | Without Mortgage | With Mortgage |
| Housing Units | 1,019 | 1,295 |
| Median Property Value | $117,200 | $152,000 |
| Median Household Income | $42,760 | $148 |
| Monthly Housing Costs | $397 | $7 |
| Real Estate Taxes | $912 | $5 |
Property Value by Mortgage Status in West Plains
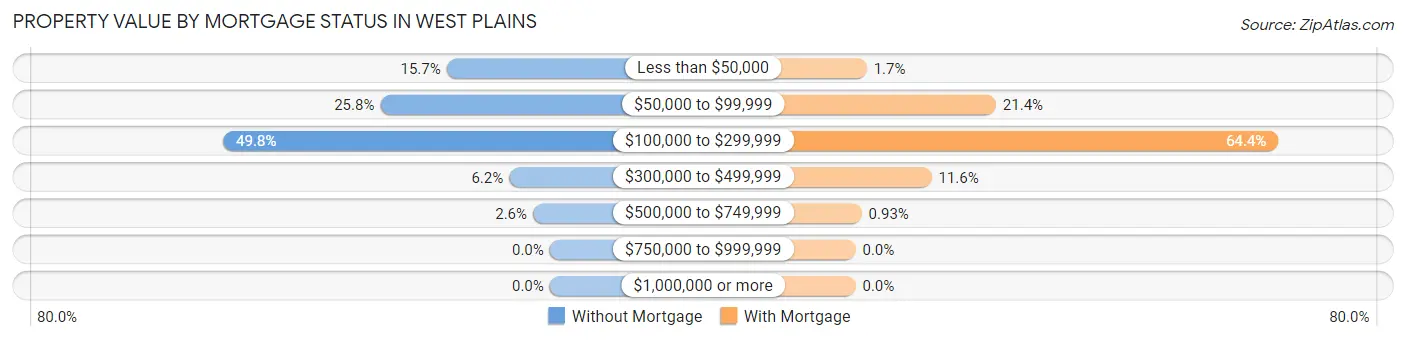
| Property Value | Without Mortgage | With Mortgage |
| Less than $50,000 | 160 (15.7%) | 22 (1.7%) |
| $50,000 to $99,999 | 263 (25.8%) | 277 (21.4%) |
| $100,000 to $299,999 | 507 (49.7%) | 834 (64.4%) |
| $300,000 to $499,999 | 63 (6.2%) | 150 (11.6%) |
| $500,000 to $749,999 | 26 (2.5%) | 12 (0.9%) |
| $750,000 to $999,999 | 0 (0.0%) | 0 (0.0%) |
| $1,000,000 or more | 0 (0.0%) | 0 (0.0%) |
| Total | 1,019 (100.0%) | 1,295 (100.0%) |
Household Income by Mortgage Status in West Plains
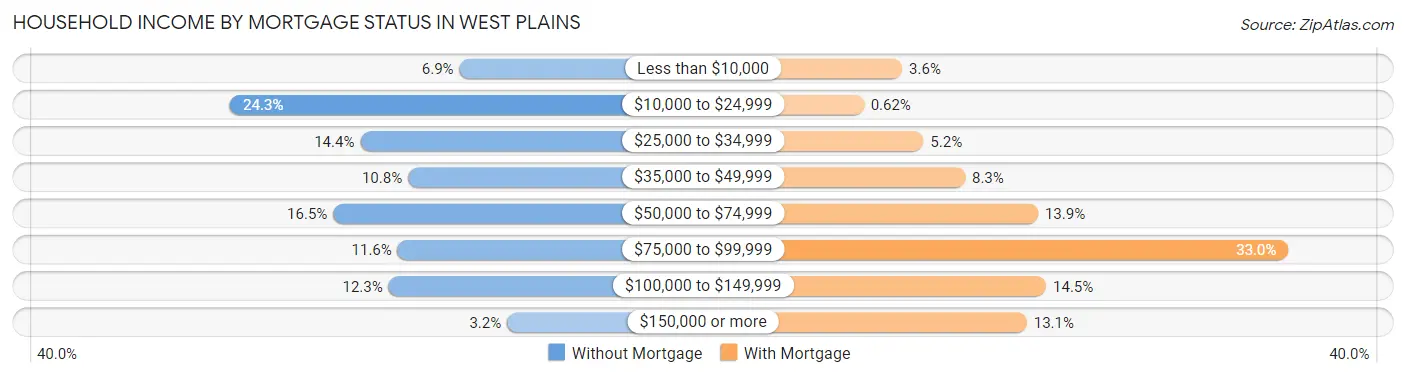
| Household Income | Without Mortgage | With Mortgage |
| Less than $10,000 | 70 (6.9%) | 46 (3.5%) |
| $10,000 to $24,999 | 248 (24.3%) | 8 (0.6%) |
| $25,000 to $34,999 | 147 (14.4%) | 67 (5.2%) |
| $35,000 to $49,999 | 110 (10.8%) | 108 (8.3%) |
| $50,000 to $74,999 | 168 (16.5%) | 180 (13.9%) |
| $75,000 to $99,999 | 118 (11.6%) | 427 (33.0%) |
| $100,000 to $149,999 | 125 (12.3%) | 188 (14.5%) |
| $150,000 or more | 33 (3.2%) | 169 (13.1%) |
| Total | 1,019 (100.0%) | 1,295 (100.0%) |
Property Value to Household Income Ratio in West Plains
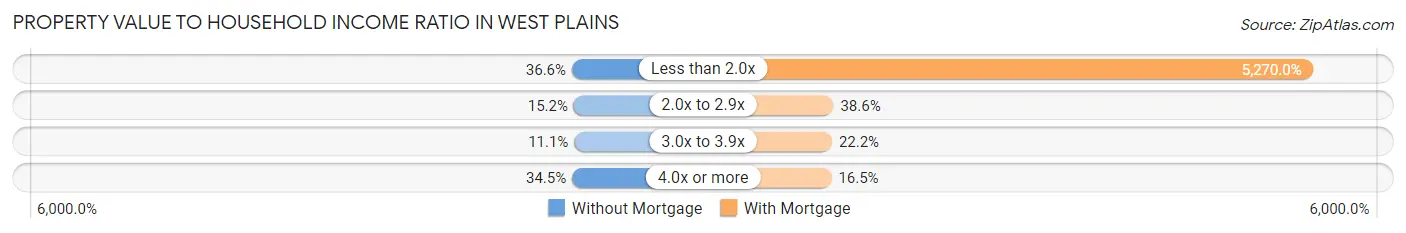
| Value-to-Income Ratio | Without Mortgage | With Mortgage |
| Less than 2.0x | 373 (36.6%) | 68,247 (5,270.0%) |
| 2.0x to 2.9x | 155 (15.2%) | 500 (38.6%) |
| 3.0x to 3.9x | 113 (11.1%) | 287 (22.2%) |
| 4.0x or more | 352 (34.5%) | 213 (16.5%) |
| Total | 1,019 (100.0%) | 1,295 (100.0%) |
Real Estate Taxes by Mortgage Status in West Plains
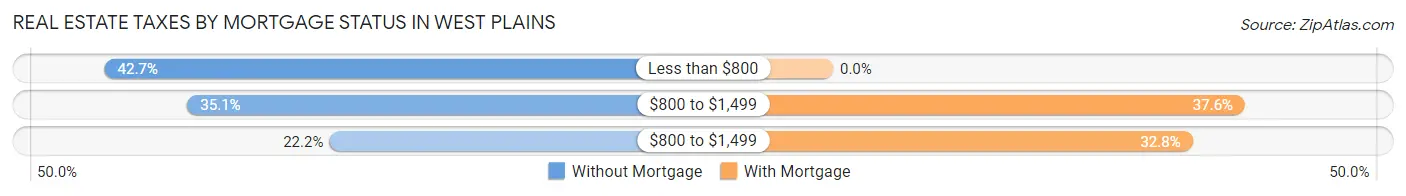
| Property Taxes | Without Mortgage | With Mortgage |
| Less than $800 | 435 (42.7%) | 0 (0.0%) |
| $800 to $1,499 | 358 (35.1%) | 487 (37.6%) |
| $800 to $1,499 | 226 (22.2%) | 425 (32.8%) |
| Total | 1,019 (100.0%) | 1,295 (100.0%) |
Health & Disability in West Plains
Health Insurance Coverage by Age in West Plains
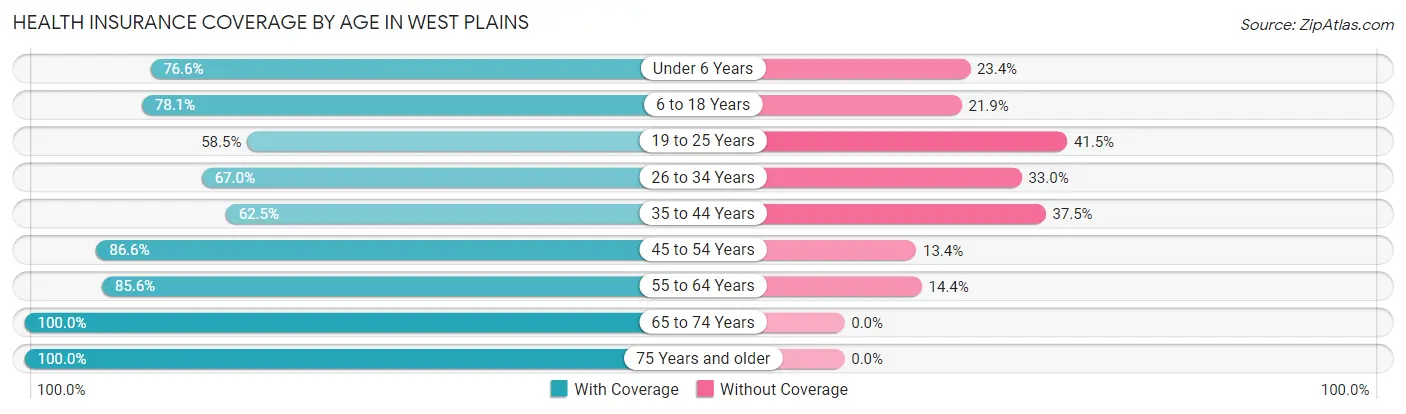
| Age Bracket | With Coverage | Without Coverage |
| Under 6 Years | 778 (76.6%) | 238 (23.4%) |
| 6 to 18 Years | 1,754 (78.1%) | 491 (21.9%) |
| 19 to 25 Years | 614 (58.5%) | 436 (41.5%) |
| 26 to 34 Years | 1,214 (67.0%) | 599 (33.0%) |
| 35 to 44 Years | 898 (62.5%) | 539 (37.5%) |
| 45 to 54 Years | 1,159 (86.6%) | 179 (13.4%) |
| 55 to 64 Years | 991 (85.6%) | 167 (14.4%) |
| 65 to 74 Years | 991 (100.0%) | 0 (0.0%) |
| 75 Years and older | 896 (100.0%) | 0 (0.0%) |
| Total | 9,295 (77.8%) | 2,649 (22.2%) |
Health Insurance Coverage by Citizenship Status in West Plains
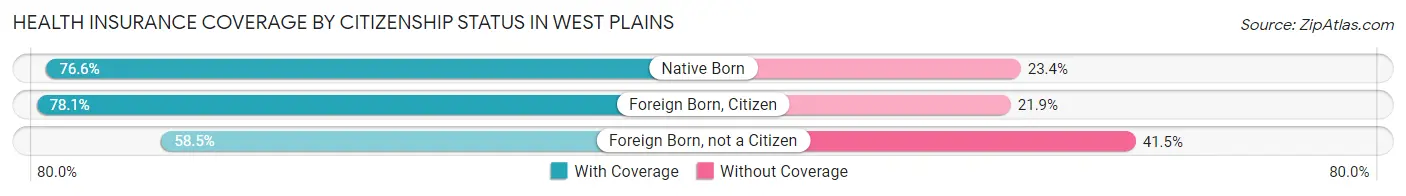
| Citizenship Status | With Coverage | Without Coverage |
| Native Born | 778 (76.6%) | 238 (23.4%) |
| Foreign Born, Citizen | 1,754 (78.1%) | 491 (21.9%) |
| Foreign Born, not a Citizen | 614 (58.5%) | 436 (41.5%) |
Health Insurance Coverage by Household Income in West Plains
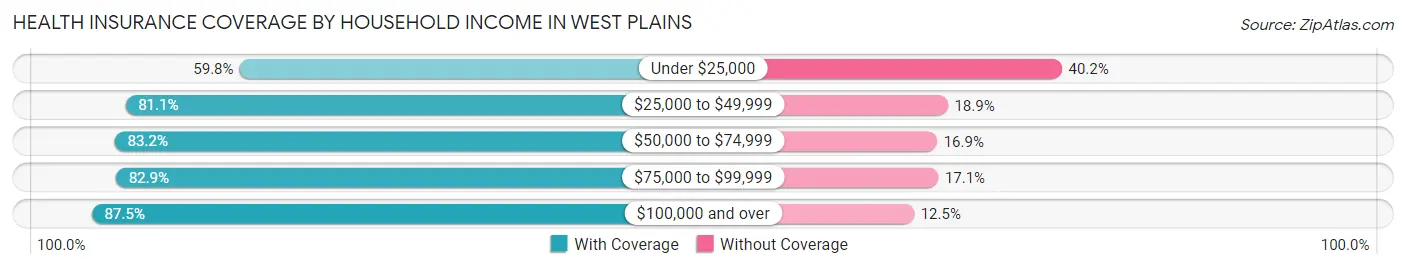
| Household Income | With Coverage | Without Coverage |
| Under $25,000 | 1,712 (59.8%) | 1,153 (40.2%) |
| $25,000 to $49,999 | 2,655 (81.1%) | 617 (18.9%) |
| $50,000 to $74,999 | 2,043 (83.2%) | 414 (16.9%) |
| $75,000 to $99,999 | 1,131 (82.9%) | 233 (17.1%) |
| $100,000 and over | 1,576 (87.5%) | 226 (12.5%) |
Public vs Private Health Insurance Coverage by Age in West Plains
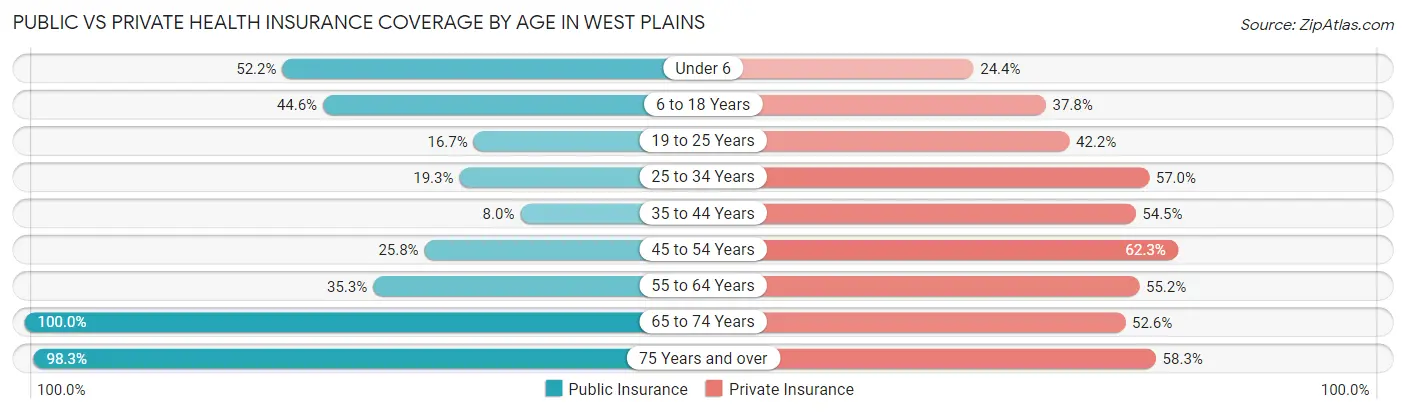
| Age Bracket | Public Insurance | Private Insurance |
| Under 6 | 530 (52.2%) | 248 (24.4%) |
| 6 to 18 Years | 1,002 (44.6%) | 849 (37.8%) |
| 19 to 25 Years | 175 (16.7%) | 443 (42.2%) |
| 25 to 34 Years | 350 (19.3%) | 1,033 (57.0%) |
| 35 to 44 Years | 115 (8.0%) | 783 (54.5%) |
| 45 to 54 Years | 345 (25.8%) | 834 (62.3%) |
| 55 to 64 Years | 409 (35.3%) | 639 (55.2%) |
| 65 to 74 Years | 991 (100.0%) | 521 (52.6%) |
| 75 Years and over | 881 (98.3%) | 522 (58.3%) |
| Total | 4,798 (40.2%) | 5,872 (49.2%) |
Disability Status by Sex by Age in West Plains
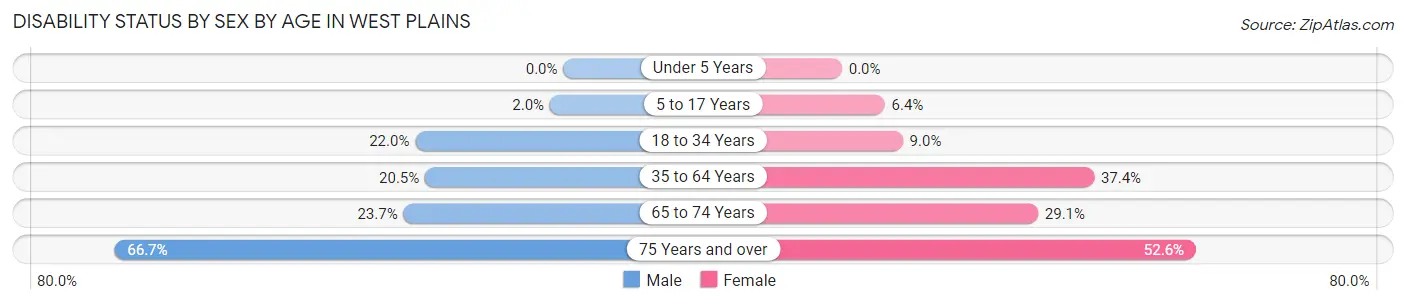
| Age Bracket | Male | Female |
| Under 5 Years | 0 (0.0%) | 0 (0.0%) |
| 5 to 17 Years | 21 (2.0%) | 72 (6.4%) |
| 18 to 34 Years | 333 (22.0%) | 137 (9.0%) |
| 35 to 64 Years | 389 (20.5%) | 763 (37.4%) |
| 65 to 74 Years | 104 (23.7%) | 161 (29.1%) |
| 75 Years and over | 222 (66.7%) | 296 (52.6%) |
Disability Class by Sex by Age in West Plains
Disability Class: Hearing Difficulty
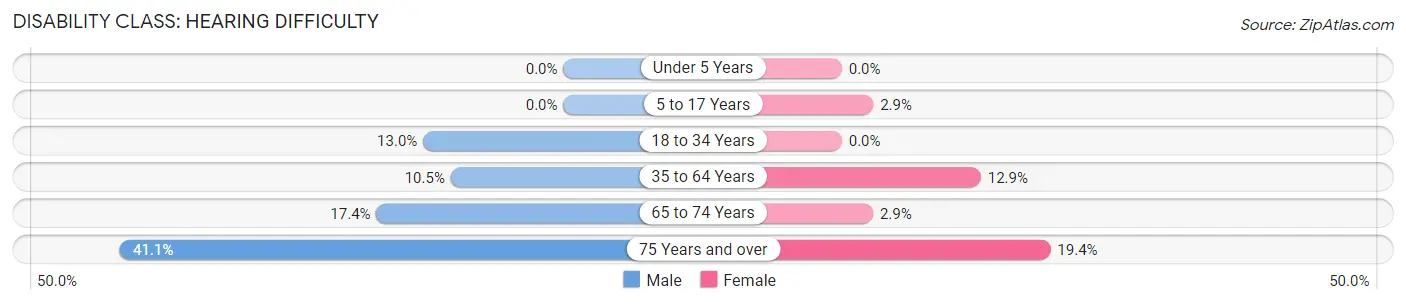
| Age Bracket | Male | Female |
| Under 5 Years | 0 (0.0%) | 0 (0.0%) |
| 5 to 17 Years | 0 (0.0%) | 33 (2.9%) |
| 18 to 34 Years | 197 (13.0%) | 0 (0.0%) |
| 35 to 64 Years | 198 (10.4%) | 263 (12.9%) |
| 65 to 74 Years | 76 (17.3%) | 16 (2.9%) |
| 75 Years and over | 137 (41.1%) | 109 (19.4%) |
Disability Class: Vision Difficulty
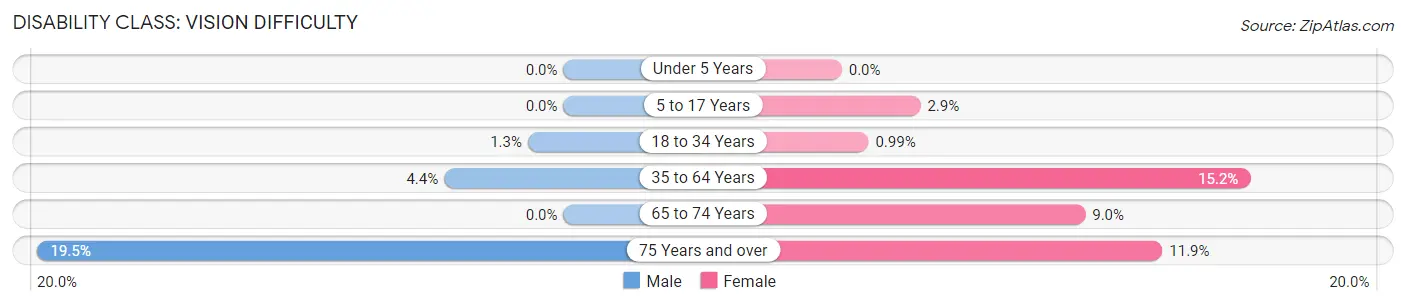
| Age Bracket | Male | Female |
| Under 5 Years | 0 (0.0%) | 0 (0.0%) |
| 5 to 17 Years | 0 (0.0%) | 33 (2.9%) |
| 18 to 34 Years | 20 (1.3%) | 15 (1.0%) |
| 35 to 64 Years | 84 (4.4%) | 309 (15.2%) |
| 65 to 74 Years | 0 (0.0%) | 50 (9.0%) |
| 75 Years and over | 65 (19.5%) | 67 (11.9%) |
Disability Class: Cognitive Difficulty
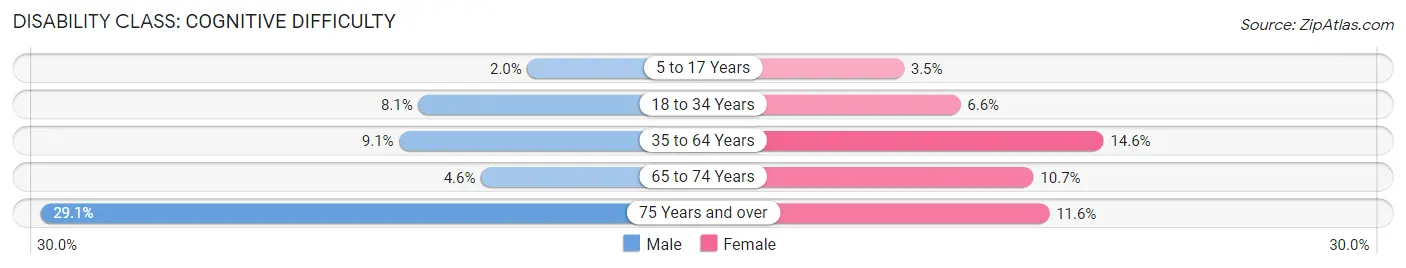
| Age Bracket | Male | Female |
| 5 to 17 Years | 21 (2.0%) | 39 (3.5%) |
| 18 to 34 Years | 122 (8.1%) | 100 (6.6%) |
| 35 to 64 Years | 173 (9.1%) | 297 (14.6%) |
| 65 to 74 Years | 20 (4.6%) | 59 (10.7%) |
| 75 Years and over | 97 (29.1%) | 65 (11.6%) |
Disability Class: Ambulatory Difficulty
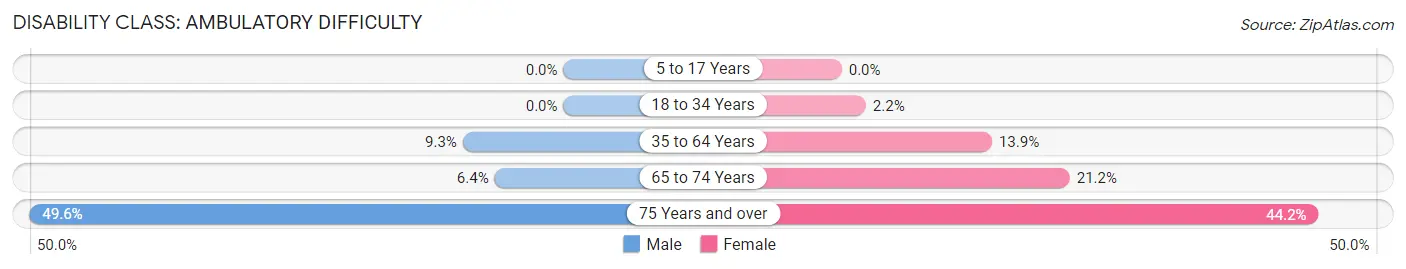
| Age Bracket | Male | Female |
| 5 to 17 Years | 0 (0.0%) | 0 (0.0%) |
| 18 to 34 Years | 0 (0.0%) | 34 (2.2%) |
| 35 to 64 Years | 177 (9.3%) | 284 (13.9%) |
| 65 to 74 Years | 28 (6.4%) | 117 (21.2%) |
| 75 Years and over | 165 (49.5%) | 249 (44.2%) |
Disability Class: Self-Care Difficulty
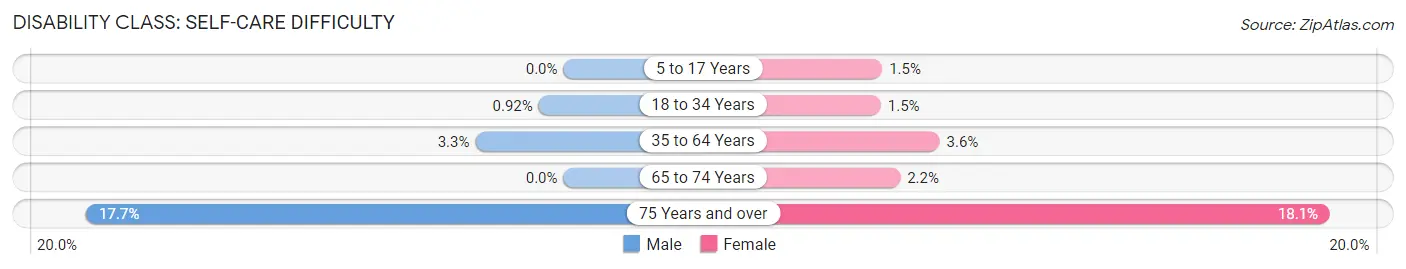
| Age Bracket | Male | Female |
| 5 to 17 Years | 0 (0.0%) | 17 (1.5%) |
| 18 to 34 Years | 14 (0.9%) | 22 (1.5%) |
| 35 to 64 Years | 62 (3.3%) | 74 (3.6%) |
| 65 to 74 Years | 0 (0.0%) | 12 (2.2%) |
| 75 Years and over | 59 (17.7%) | 102 (18.1%) |
Technology Access in West Plains
Computing Device Access in West Plains
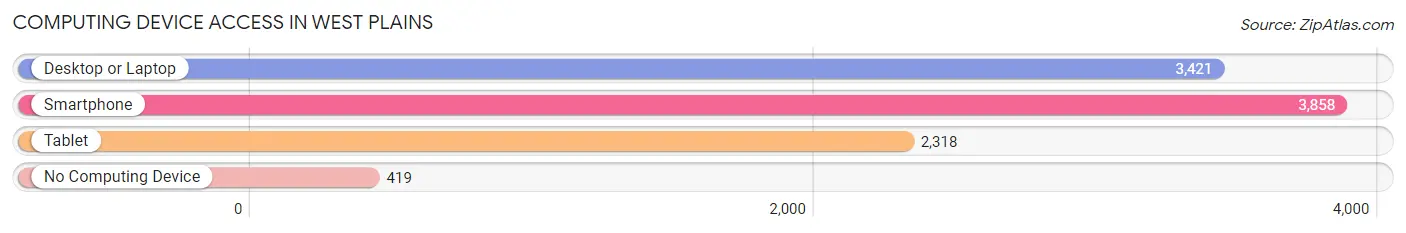
| Device Type | # Households | % Households |
| Desktop or Laptop | 3,421 | 70.2% |
| Smartphone | 3,858 | 79.1% |
| Tablet | 2,318 | 47.6% |
| No Computing Device | 419 | 8.6% |
| Total | 4,874 | 100.0% |
Internet Access in West Plains
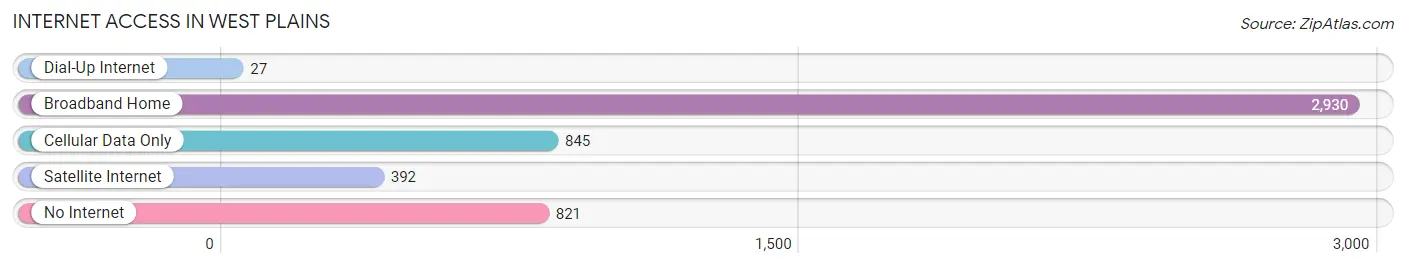
| Internet Type | # Households | % Households |
| Dial-Up Internet | 27 | 0.5% |
| Broadband Home | 2,930 | 60.1% |
| Cellular Data Only | 845 | 17.3% |
| Satellite Internet | 392 | 8.0% |
| No Internet | 821 | 16.8% |
| Total | 4,874 | 100.0% |
West Plains Summary
History
West Plains, Missouri is a small city located in Howell County in the Ozark Mountains. It was founded in 1832 by settlers from Tennessee and Kentucky, and was originally known as “Plainview”. The city was renamed West Plains in 1857, and has since grown to become the county seat of Howell County.
West Plains has a rich history, and has been home to many notable figures throughout its history. The city was the birthplace of the famous outlaw Jesse James, and was also the home of the first female mayor in the United States, Mary E. Moore. West Plains was also the site of the first public school in the state of Missouri, which was established in 1845.
The city has also been home to several notable businesses, including the West Plains Bank, which was founded in 1872 and is still in operation today. The city was also the site of the first telephone exchange in the state of Missouri, which was established in 1883.
West Plains has also been the site of several important events in the history of the United States. In 1864, the city was the site of a major battle between Union and Confederate forces during the Civil War. The city was also the site of the first public school in the state of Missouri, which was established in 1845.
Geography
West Plains is located in the Ozark Mountains in Howell County, Missouri. The city is situated at the intersection of US Route 63 and US Route 160, and is approximately 90 miles south of Springfield, Missouri. The city is located at an elevation of 1,072 feet above sea level, and has a total area of 8.3 square miles.
The city is surrounded by rolling hills and forests, and is home to several small lakes and streams. The city is also located near the Mark Twain National Forest, which is a popular destination for outdoor recreation.
Economy
West Plains is a small city with a population of approximately 11,000 people. The city’s economy is largely based on agriculture, with the majority of the population employed in farming and related industries. The city is also home to several small businesses, including retail stores, restaurants, and other service-based businesses.
West Plains is also home to several manufacturing companies, including a large furniture factory and a plastics manufacturing plant. The city is also home to several educational institutions, including Missouri State University-West Plains and Ozarks Technical Community College.
Demographics
As of the 2010 census, West Plains had a population of 11,986 people. The racial makeup of the city was 95.3% White, 0.7% African American, 0.4% Native American, 0.4% Asian, 0.1% Pacific Islander, 1.2% from other races, and 1.9% from two or more races. Hispanic or Latino of any race were 3.2% of the population.
The median income for a household in the city was $30,945, and the median income for a family was $37,917. The per capita income for the city was $17,845. About 17.2% of families and 20.7% of the population were below the poverty line, including 28.2% of those under age 18 and 11.2% of those age 65 or over.
Common Questions
What is Per Capita Income in West Plains?
Per Capita income in West Plains is $22,909.
What is the Median Family Income in West Plains?
Median Family Income in West Plains is $51,313.
What is the Median Household income in West Plains?
Median Household Income in West Plains is $38,676.
What is Income or Wage Gap in West Plains?
Income or Wage Gap in West Plains is 40.7%.
Women in West Plains earn 59.3 cents for every dollar earned by a man.
What is Family Income Deficit in West Plains?
Family Income Deficit in West Plains is $12,176.
Families that are below poverty line in West Plains earn $12,176 less on average than the poverty threshold level.
What is Inequality or Gini Index in West Plains?
Inequality or Gini Index in West Plains is 0.48.
What is the Total Population of West Plains?
Total Population of West Plains is 12,250.
What is the Total Male Population of West Plains?
Total Male Population of West Plains is 5,688.
What is the Total Female Population of West Plains?
Total Female Population of West Plains is 6,562.
What is the Ratio of Males per 100 Females in West Plains?
There are 86.68 Males per 100 Females in West Plains.
What is the Ratio of Females per 100 Males in West Plains?
There are 115.37 Females per 100 Males in West Plains.
What is the Median Population Age in West Plains?
Median Population Age in West Plains is 34.6 Years.
What is the Average Family Size in West Plains
Average Family Size in West Plains is 3.5 People.
What is the Average Household Size in West Plains
Average Household Size in West Plains is 2.4 People.
How Large is the Labor Force in West Plains?
There are 5,226 People in the Labor Forcein in West Plains.
What is the Percentage of People in the Labor Force in West Plains?
56.1% of People are in the Labor Force in West Plains.
What is the Unemployment Rate in West Plains?
Unemployment Rate in West Plains is 4.7%.