Zip Codes with the Highest Percentage of Population Employed in Legal Services & Support in Kansas City, MO
RELATED REPORTS & OPTIONS
Legal Services & Support
Kansas City
Compare Zip Codes
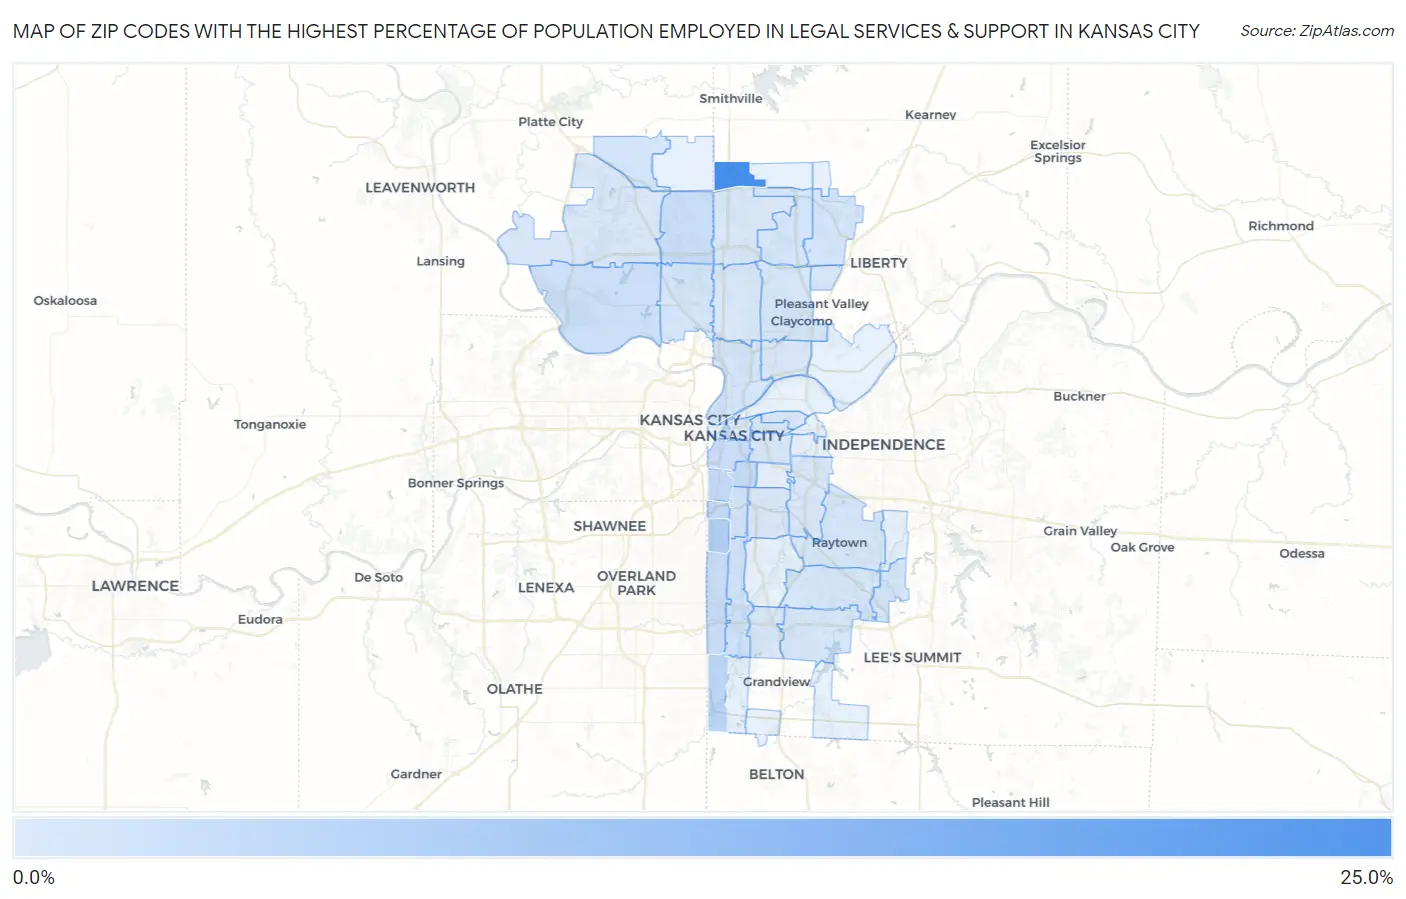
Map of Zip Codes with the Highest Percentage of Population Employed in Legal Services & Support in Kansas City
0.073%
22.0%
Zip Codes with the Highest Percentage of Population Employed in Legal Services & Support in Kansas City, MO
| Zip Code | % Employed | vs State | vs National | |
| 1. | 64165 | 22.0% | 0.99%(+21.0)#1 | 1.2%(+20.8)#41 |
| 2. | 64113 | 6.2% | 0.99%(+5.19)#5 | 1.2%(+4.99)#449 |
| 3. | 64105 | 4.6% | 0.99%(+3.62)#11 | 1.2%(+3.42)#848 |
| 4. | 64145 | 4.4% | 0.99%(+3.42)#14 | 1.2%(+3.23)#930 |
| 5. | 64111 | 3.5% | 0.99%(+2.56)#30 | 1.2%(+2.36)#1,395 |
| 6. | 64112 | 3.3% | 0.99%(+2.31)#37 | 1.2%(+2.12)#1,578 |
| 7. | 64109 | 3.1% | 0.99%(+2.10)#39 | 1.2%(+1.91)#1,762 |
| 8. | 64154 | 2.8% | 0.99%(+1.78)#47 | 1.2%(+1.58)#2,116 |
| 9. | 64114 | 2.6% | 0.99%(+1.60)#51 | 1.2%(+1.40)#2,377 |
| 10. | 64108 | 2.6% | 0.99%(+1.58)#53 | 1.2%(+1.39)#2,392 |
| 11. | 64152 | 2.3% | 0.99%(+1.31)#57 | 1.2%(+1.12)#2,842 |
| 12. | 64131 | 1.6% | 0.99%(+0.622)#95 | 1.2%(+0.428)#4,631 |
| 13. | 64110 | 1.5% | 0.99%(+0.535)#101 | 1.2%(+0.341)#4,938 |
| 14. | 64116 | 1.4% | 0.99%(+0.456)#109 | 1.2%(+0.263)#5,267 |
| 15. | 64151 | 1.3% | 0.99%(+0.348)#121 | 1.2%(+0.154)#5,742 |
| 16. | 64156 | 1.2% | 0.99%(+0.243)#131 | 1.2%(+0.050)#6,303 |
| 17. | 64163 | 1.2% | 0.99%(+0.219)#134 | 1.2%(+0.026)#6,422 |
| 18. | 64157 | 1.2% | 0.99%(+0.161)#139 | 1.2%(-0.032)#6,808 |
| 19. | 64139 | 1.1% | 0.99%(+0.155)#141 | 1.2%(-0.038)#6,845 |
| 20. | 64158 | 1.1% | 0.99%(+0.111)#152 | 1.2%(-0.082)#7,155 |
| 21. | 64134 | 1.0% | 0.99%(+0.059)#157 | 1.2%(-0.135)#7,494 |
| 22. | 64133 | 1.0% | 0.99%(+0.036)#162 | 1.2%(-0.157)#7,641 |
| 23. | 64138 | 1.0% | 0.99%(+0.034)#163 | 1.2%(-0.160)#7,661 |
| 24. | 64119 | 0.85% | 0.99%(-0.142)#192 | 1.2%(-0.336)#9,032 |
| 25. | 64153 | 0.82% | 0.99%(-0.171)#200 | 1.2%(-0.365)#9,285 |
| 26. | 64118 | 0.78% | 0.99%(-0.205)#207 | 1.2%(-0.399)#9,600 |
| 27. | 64137 | 0.76% | 0.99%(-0.229)#212 | 1.2%(-0.422)#9,806 |
| 28. | 64127 | 0.71% | 0.99%(-0.276)#226 | 1.2%(-0.470)#10,279 |
| 29. | 64155 | 0.67% | 0.99%(-0.319)#233 | 1.2%(-0.513)#10,722 |
| 30. | 64129 | 0.50% | 0.99%(-0.491)#276 | 1.2%(-0.685)#12,650 |
| 31. | 64123 | 0.48% | 0.99%(-0.512)#285 | 1.2%(-0.706)#12,911 |
| 32. | 64130 | 0.34% | 0.99%(-0.655)#332 | 1.2%(-0.848)#14,637 |
| 33. | 64117 | 0.26% | 0.99%(-0.730)#352 | 1.2%(-0.924)#15,509 |
| 34. | 64124 | 0.24% | 0.99%(-0.755)#363 | 1.2%(-0.949)#15,813 |
| 35. | 64106 | 0.073% | 0.99%(-0.918)#402 | 1.2%(-1.11)#17,316 |
1
Common Questions
What are the Top 10 Zip Codes with the Highest Percentage of Population Employed in Legal Services & Support in Kansas City, MO?
Top 10 Zip Codes with the Highest Percentage of Population Employed in Legal Services & Support in Kansas City, MO are:
What zip code has the Highest Percentage of Population Employed in Legal Services & Support in Kansas City, MO?
64165 has the Highest Percentage of Population Employed in Legal Services & Support in Kansas City, MO with 22.0%.
What is the Percentage of Population Employed in Legal Services & Support in Kansas City, MO?
Percentage of Population Employed in Legal Services & Support in Kansas City is 1.5%.
What is the Percentage of Population Employed in Legal Services & Support in Missouri?
Percentage of Population Employed in Legal Services & Support in Missouri is 0.99%.
What is the Percentage of Population Employed in Legal Services & Support in the United States?
Percentage of Population Employed in Legal Services & Support in the United States is 1.2%.