Zip Codes with the Highest Percentage of Population Employed in Legal Services & Support in Saint Joseph, MO
RELATED REPORTS & OPTIONS
Legal Services & Support
Saint Joseph
Compare Zip Codes
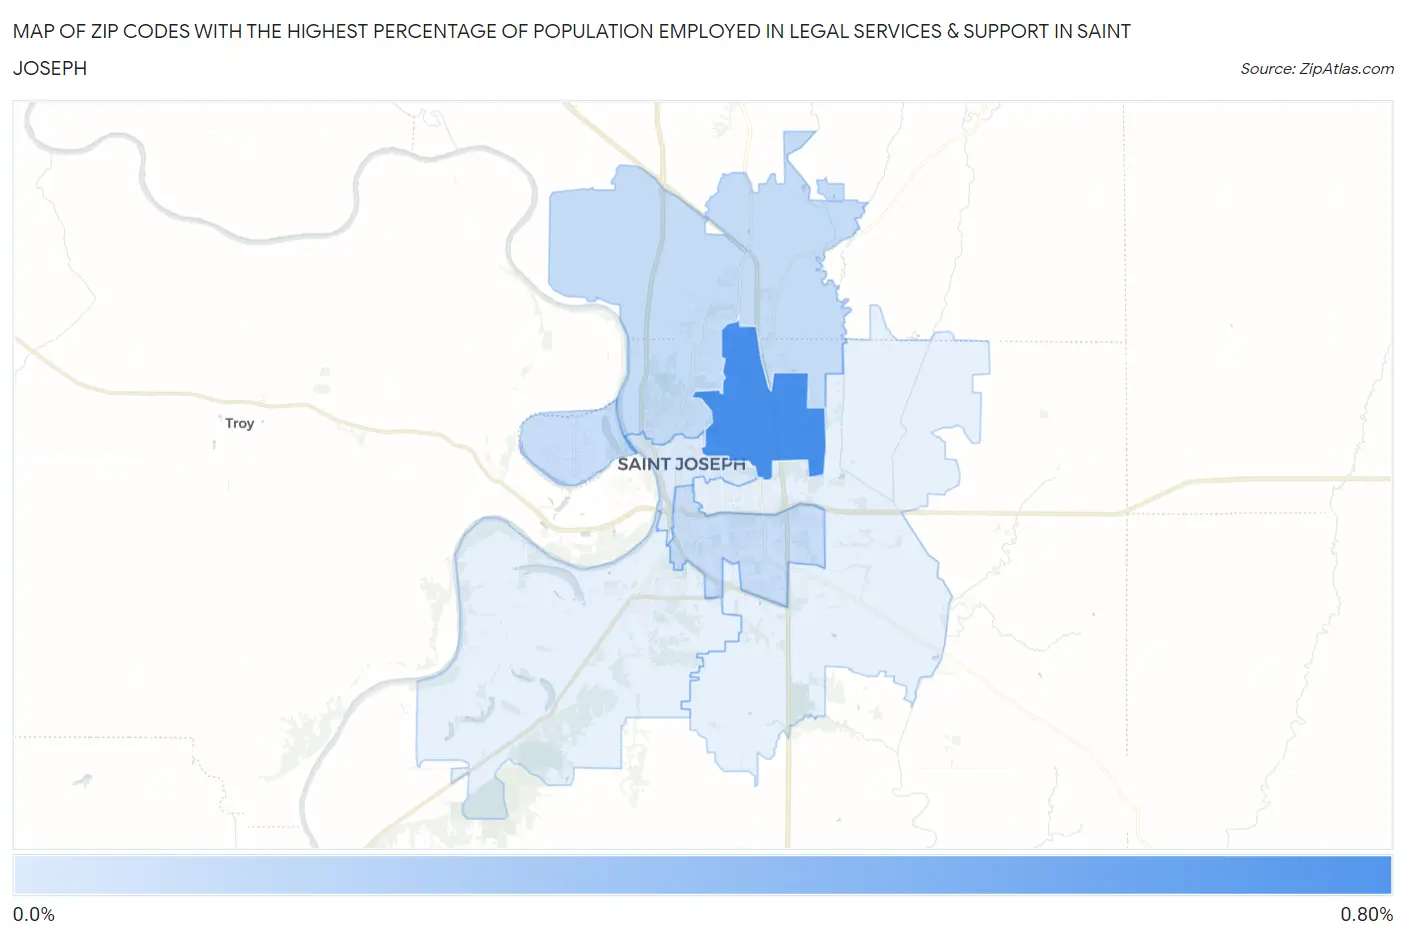
Map of Zip Codes with the Highest Percentage of Population Employed in Legal Services & Support in Saint Joseph
0.15%
0.64%
Zip Codes with the Highest Percentage of Population Employed in Legal Services & Support in Saint Joseph, MO
| Zip Code | % Employed | vs State | vs National | |
| 1. | 64506 | 0.64% | 0.99%(-0.350)#241 | 1.2%(-0.543)#11,028 |
| 2. | 64505 | 0.23% | 0.99%(-0.764)#367 | 1.2%(-0.958)#15,923 |
| 3. | 64503 | 0.22% | 0.99%(-0.772)#370 | 1.2%(-0.965)#16,000 |
| 4. | 64501 | 0.15% | 0.99%(-0.838)#386 | 1.2%(-1.03)#16,667 |
1
Common Questions
What are the Top 5 Zip Codes with the Highest Percentage of Population Employed in Legal Services & Support in Saint Joseph, MO?
Top 5 Zip Codes with the Highest Percentage of Population Employed in Legal Services & Support in Saint Joseph, MO are:
What zip code has the Highest Percentage of Population Employed in Legal Services & Support in Saint Joseph, MO?
64506 has the Highest Percentage of Population Employed in Legal Services & Support in Saint Joseph, MO with 0.64%.
What is the Percentage of Population Employed in Legal Services & Support in Missouri?
Percentage of Population Employed in Legal Services & Support in Missouri is 0.99%.
What is the Percentage of Population Employed in Legal Services & Support in the United States?
Percentage of Population Employed in Legal Services & Support in the United States is 1.2%.