Mount Vernon, MO Map & Demographics
Mount Vernon Map
Mount Vernon Overview
$24,853
PER CAPITA INCOME
$59,648
AVG FAMILY INCOME
$44,491
AVG HOUSEHOLD INCOME
43.9%
WAGE / INCOME GAP [ % ]
56.1¢/ $1
WAGE / INCOME GAP [ $ ]
0.45
INEQUALITY / GINI INDEX
4,511
TOTAL POPULATION
2,355
MALE POPULATION
2,156
FEMALE POPULATION
109.23
MALES / 100 FEMALES
91.55
FEMALES / 100 MALES
37.3
MEDIAN AGE
3.4
AVG FAMILY SIZE
2.3
AVG HOUSEHOLD SIZE
1,859
LABOR FORCE [ PEOPLE ]
52.3%
PERCENT IN LABOR FORCE
1.7%
UNEMPLOYMENT RATE
Mount Vernon Zip Codes
Mount Vernon Area Codes
Income in Mount Vernon
Income Overview in Mount Vernon
Per Capita Income in Mount Vernon is $24,853, while median incomes of families and households are $59,648 and $44,491 respectively.
| Characteristic | Number | Measure |
| Per Capita Income | 4,511 | $24,853 |
| Median Family Income | 901 | $59,648 |
| Mean Family Income | 901 | $81,780 |
| Median Household Income | 1,773 | $44,491 |
| Mean Household Income | 1,773 | $59,291 |
| Income Deficit | 901 | $0 |
| Wage / Income Gap (%) | 4,511 | 43.85% |
| Wage / Income Gap ($) | 4,511 | 56.15¢ per $1 |
| Gini / Inequality Index | 4,511 | 0.45 |
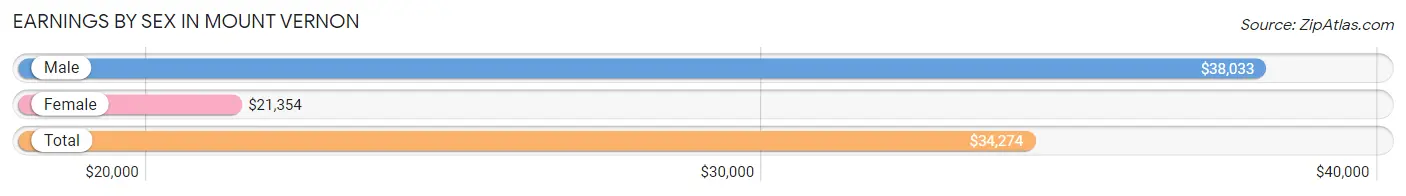
Earnings by Sex in Mount Vernon
Average Earnings in Mount Vernon are $34,274, $38,033 for men and $21,354 for women, a difference of 43.9%.
| Sex | Number | Average Earnings |
| Male | 1,116 (57.0%) | $38,033 |
| Female | 843 (43.0%) | $21,354 |
| Total | 1,959 (100.0%) | $34,274 |
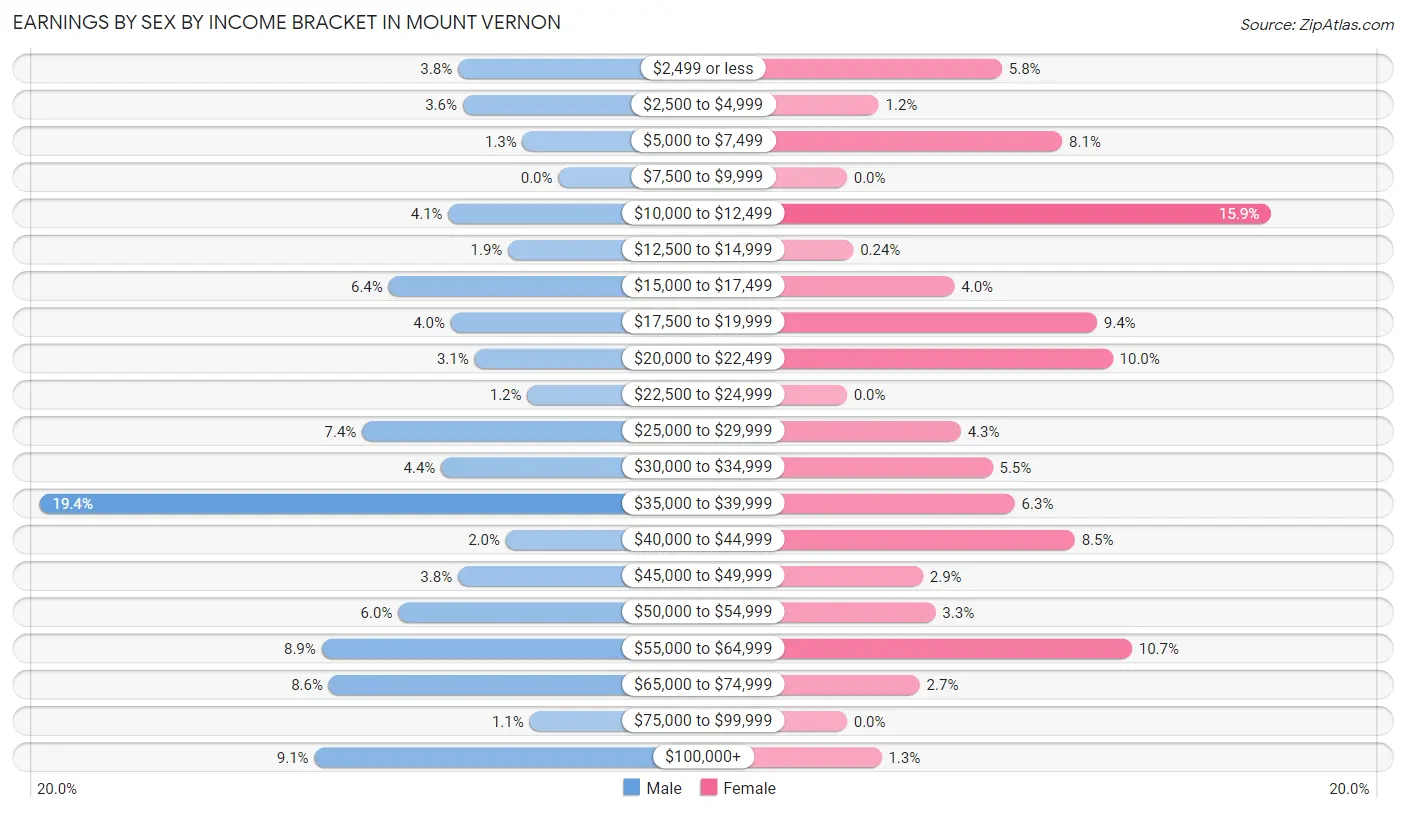
Earnings by Sex by Income Bracket in Mount Vernon
The most common earnings brackets in Mount Vernon are $35,000 to $39,999 for men (217 | 19.4%) and $10,000 to $12,499 for women (134 | 15.9%).
| Income | Male | Female |
| $2,499 or less | 42 (3.8%) | 49 (5.8%) |
| $2,500 to $4,999 | 40 (3.6%) | 10 (1.2%) |
| $5,000 to $7,499 | 15 (1.3%) | 68 (8.1%) |
| $7,500 to $9,999 | 0 (0.0%) | 0 (0.0%) |
| $10,000 to $12,499 | 46 (4.1%) | 134 (15.9%) |
| $12,500 to $14,999 | 21 (1.9%) | 2 (0.2%) |
| $15,000 to $17,499 | 71 (6.4%) | 34 (4.0%) |
| $17,500 to $19,999 | 45 (4.0%) | 79 (9.4%) |
| $20,000 to $22,499 | 35 (3.1%) | 84 (10.0%) |
| $22,500 to $24,999 | 13 (1.2%) | 0 (0.0%) |
| $25,000 to $29,999 | 82 (7.3%) | 36 (4.3%) |
| $30,000 to $34,999 | 49 (4.4%) | 46 (5.5%) |
| $35,000 to $39,999 | 217 (19.4%) | 53 (6.3%) |
| $40,000 to $44,999 | 22 (2.0%) | 72 (8.5%) |
| $45,000 to $49,999 | 42 (3.8%) | 24 (2.9%) |
| $50,000 to $54,999 | 67 (6.0%) | 28 (3.3%) |
| $55,000 to $64,999 | 99 (8.9%) | 90 (10.7%) |
| $65,000 to $74,999 | 96 (8.6%) | 23 (2.7%) |
| $75,000 to $99,999 | 12 (1.1%) | 0 (0.0%) |
| $100,000+ | 102 (9.1%) | 11 (1.3%) |
| Total | 1,116 (100.0%) | 843 (100.0%) |
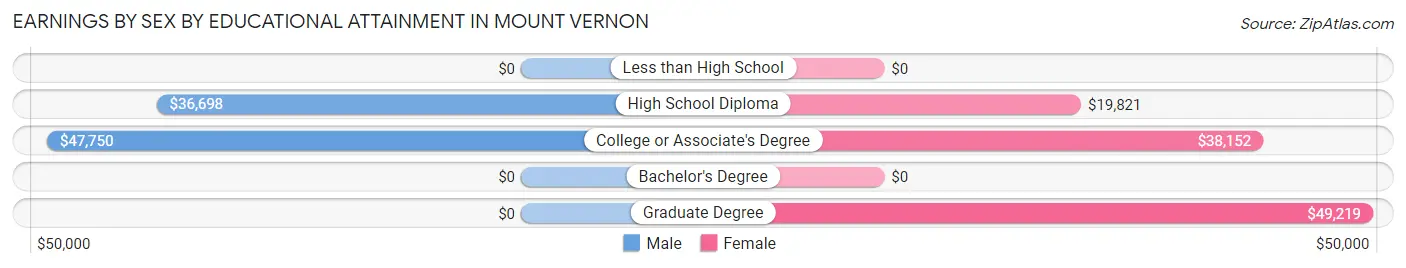
Earnings by Sex by Educational Attainment in Mount Vernon
Average earnings in Mount Vernon are $39,258 for men and $22,068 for women, a difference of 43.8%. Men with an educational attainment of college or associate's degree enjoy the highest average annual earnings of $47,750, while those with high school diploma education earn the least with $36,698. Women with an educational attainment of graduate degree earn the most with the average annual earnings of $49,219, while those with high school diploma education have the smallest earnings of $19,821.
| Educational Attainment | Male Income | Female Income |
| Less than High School | - | - |
| High School Diploma | $36,698 | $19,821 |
| College or Associate's Degree | $47,750 | $38,152 |
| Bachelor's Degree | - | - |
| Graduate Degree | - | - |
| Total | $39,258 | $22,068 |
Family Income in Mount Vernon
Family Income Brackets in Mount Vernon
According to the Mount Vernon family income data, there are 255 families falling into the $50,000 to $74,999 income range, which is the most common income bracket and makes up 28.3% of all families.
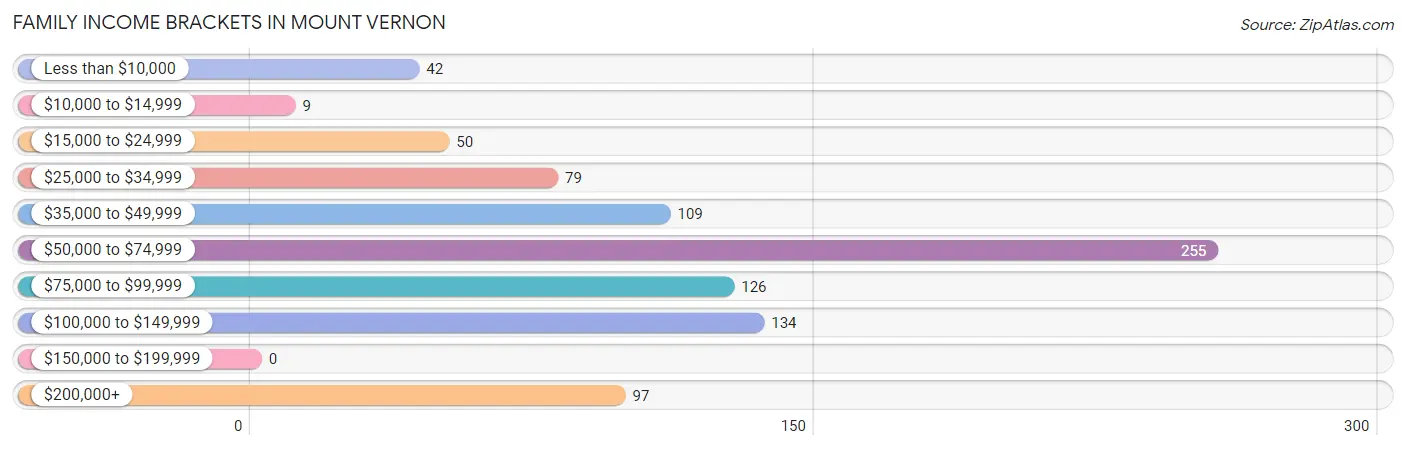
| Income Bracket | # Families | % Families |
| Less than $10,000 | 42 | 4.7% |
| $10,000 to $14,999 | 9 | 1.0% |
| $15,000 to $24,999 | 50 | 5.5% |
| $25,000 to $34,999 | 79 | 8.8% |
| $35,000 to $49,999 | 109 | 12.1% |
| $50,000 to $74,999 | 255 | 28.3% |
| $75,000 to $99,999 | 126 | 14.0% |
| $100,000 to $149,999 | 134 | 14.9% |
| $150,000 to $199,999 | 0 | 0.0% |
| $200,000+ | 97 | 10.8% |
Family Income by Famaliy Size in Mount Vernon
5-person families (80 | 8.9%) account for the highest median family income in Mount Vernon with $216,045 per family, while 5-person families (80 | 8.9%) have the highest median income of $43,209 per family member.
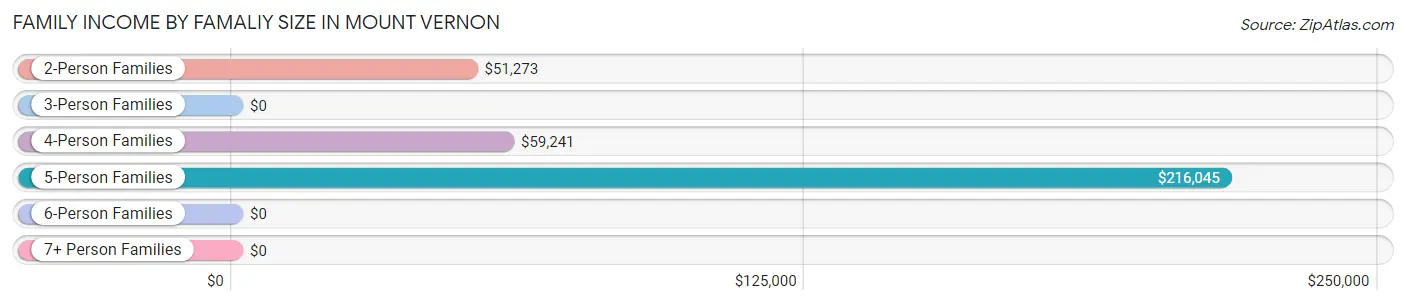
| Income Bracket | # Families | Median Income |
| 2-Person Families | 384 (42.6%) | $51,273 |
| 3-Person Families | 134 (14.9%) | $0 |
| 4-Person Families | 263 (29.2%) | $59,241 |
| 5-Person Families | 80 (8.9%) | $216,045 |
| 6-Person Families | 40 (4.4%) | $0 |
| 7+ Person Families | 0 (0.0%) | $0 |
| Total | 901 (100.0%) | $59,648 |
Family Income by Number of Earners in Mount Vernon
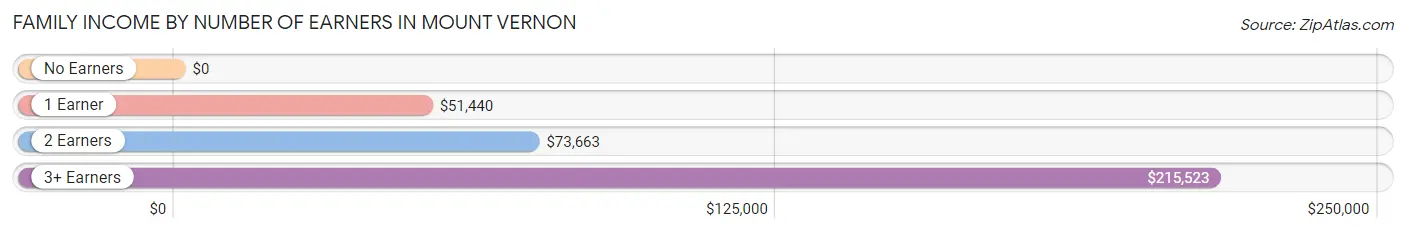
| Number of Earners | # Families | Median Income |
| No Earners | 145 (16.1%) | $0 |
| 1 Earner | 255 (28.3%) | $51,440 |
| 2 Earners | 398 (44.2%) | $73,663 |
| 3+ Earners | 103 (11.4%) | $215,523 |
| Total | 901 (100.0%) | $59,648 |
Household Income in Mount Vernon
Household Income Brackets in Mount Vernon
With 408 households falling in the category, the $50,000 to $74,999 income range is the most frequent in Mount Vernon, accounting for 23.0% of all households. In contrast, only 5 households (0.3%) fall into the $150,000 to $199,999 income bracket, making it the least populous group.
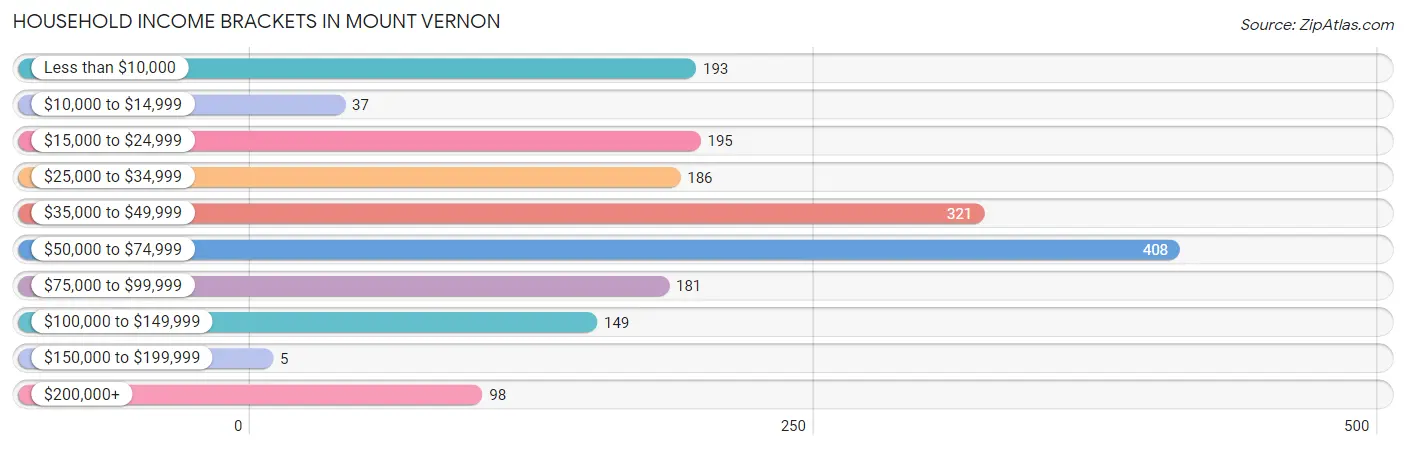
| Income Bracket | # Households | % Households |
| Less than $10,000 | 193 | 10.9% |
| $10,000 to $14,999 | 37 | 2.1% |
| $15,000 to $24,999 | 195 | 11.0% |
| $25,000 to $34,999 | 186 | 10.5% |
| $35,000 to $49,999 | 321 | 18.1% |
| $50,000 to $74,999 | 408 | 23.0% |
| $75,000 to $99,999 | 181 | 10.2% |
| $100,000 to $149,999 | 149 | 8.4% |
| $150,000 to $199,999 | 5 | 0.3% |
| $200,000+ | 98 | 5.5% |
Household Income by Householder Age in Mount Vernon
The median household income in Mount Vernon is $44,491, with the highest median household income of $52,363 found in the 25 to 44 years age bracket for the primary householder. A total of 633 households (35.7%) fall into this category. Meanwhile, the 15 to 24 years age bracket for the primary householder has the lowest median household income of $0, with 68 households (3.8%) in this group.
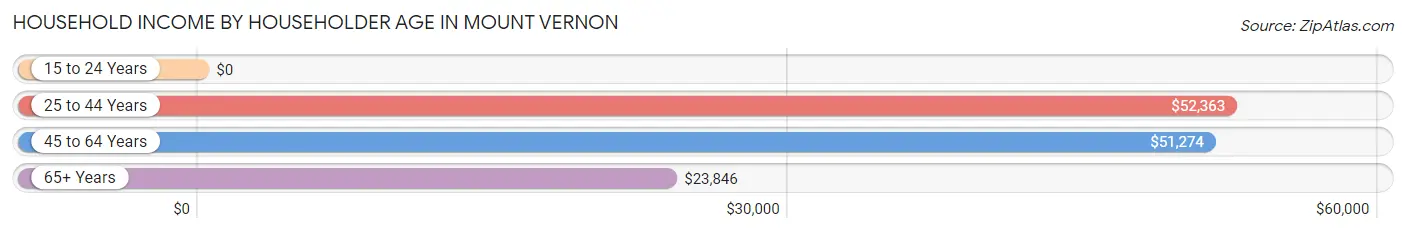
| Income Bracket | # Households | Median Income |
| 15 to 24 Years | 68 (3.8%) | $0 |
| 25 to 44 Years | 633 (35.7%) | $52,363 |
| 45 to 64 Years | 498 (28.1%) | $51,274 |
| 65+ Years | 574 (32.4%) | $23,846 |
| Total | 1,773 (100.0%) | $44,491 |
Poverty in Mount Vernon
Income Below Poverty by Sex and Age in Mount Vernon
With 8.7% poverty level for males and 17.2% for females among the residents of Mount Vernon, 15 year old males and 15 year old females are the most vulnerable to poverty, with 38 males (92.7%) and 7 females (87.5%) in their respective age groups living below the poverty level.
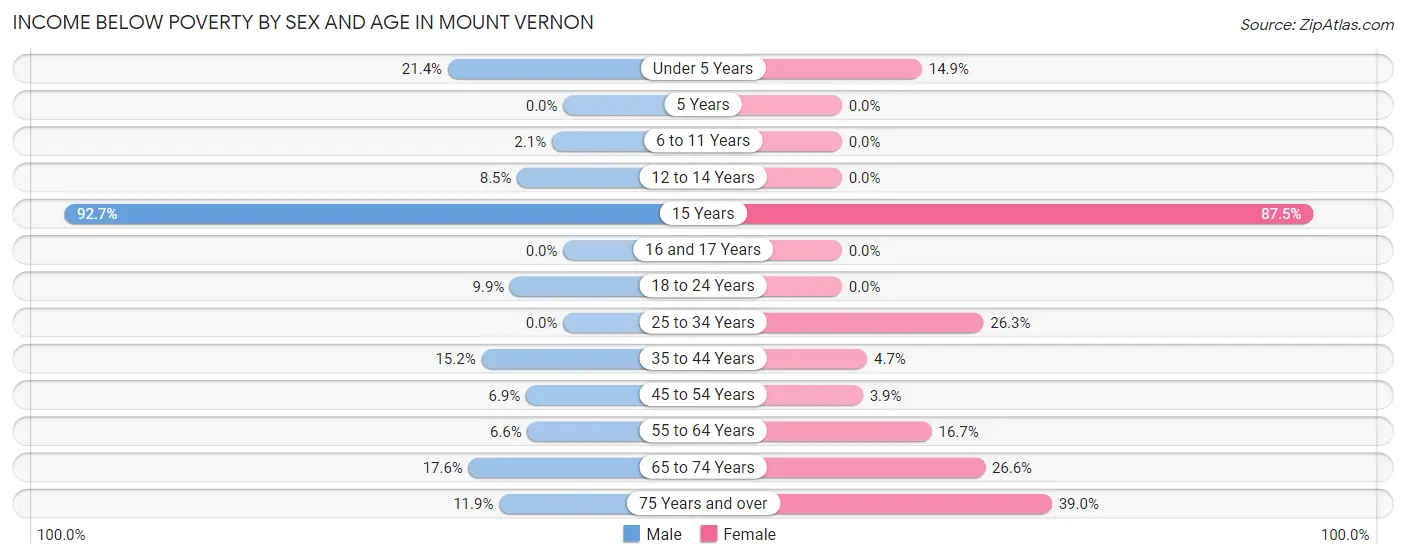
| Age Bracket | Male | Female |
| Under 5 Years | 9 (21.4%) | 15 (14.8%) |
| 5 Years | 0 (0.0%) | 0 (0.0%) |
| 6 to 11 Years | 9 (2.1%) | 0 (0.0%) |
| 12 to 14 Years | 7 (8.5%) | 0 (0.0%) |
| 15 Years | 38 (92.7%) | 7 (87.5%) |
| 16 and 17 Years | 0 (0.0%) | 0 (0.0%) |
| 18 to 24 Years | 15 (9.9%) | 0 (0.0%) |
| 25 to 34 Years | 0 (0.0%) | 99 (26.3%) |
| 35 to 44 Years | 43 (15.2%) | 15 (4.7%) |
| 45 to 54 Years | 19 (6.9%) | 8 (3.9%) |
| 55 to 64 Years | 14 (6.6%) | 24 (16.7%) |
| 65 to 74 Years | 13 (17.6%) | 76 (26.6%) |
| 75 Years and over | 10 (11.9%) | 113 (39.0%) |
| Total | 177 (8.7%) | 357 (17.2%) |
Income Above Poverty by Sex and Age in Mount Vernon
According to the poverty statistics in Mount Vernon, males aged 5 years and females aged 6 to 11 years are the age groups that are most secure financially, with 100.0% of males and 100.0% of females in these age groups living above the poverty line.
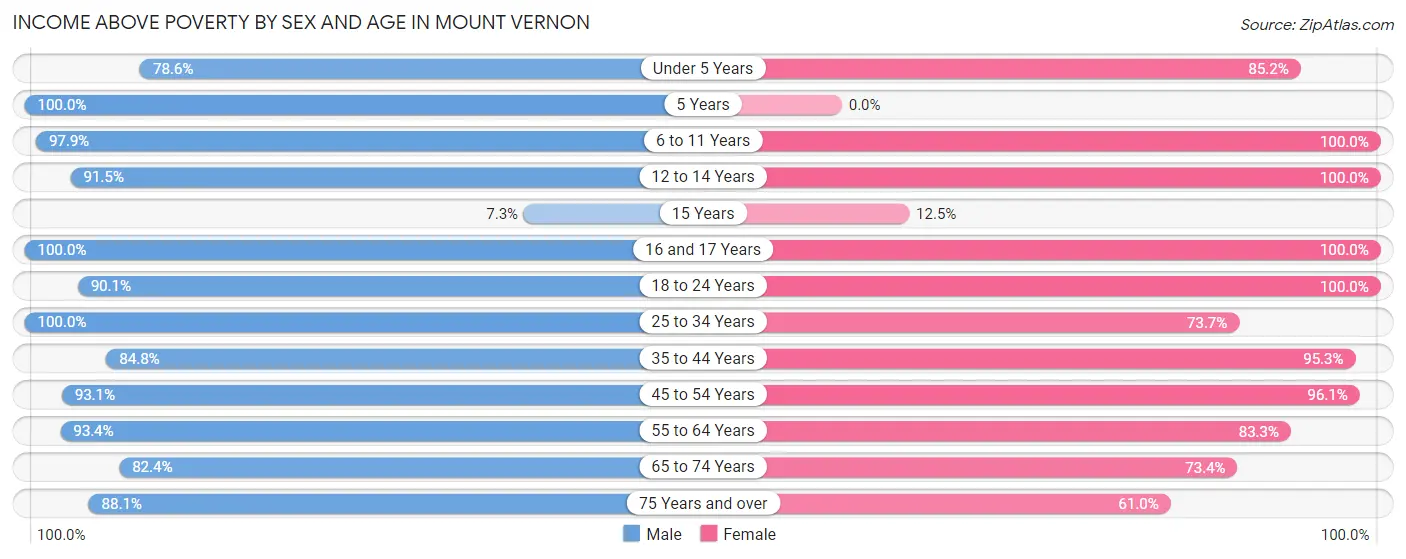
| Age Bracket | Male | Female |
| Under 5 Years | 33 (78.6%) | 86 (85.2%) |
| 5 Years | 16 (100.0%) | 0 (0.0%) |
| 6 to 11 Years | 418 (97.9%) | 129 (100.0%) |
| 12 to 14 Years | 75 (91.5%) | 90 (100.0%) |
| 15 Years | 3 (7.3%) | 1 (12.5%) |
| 16 and 17 Years | 45 (100.0%) | 35 (100.0%) |
| 18 to 24 Years | 137 (90.1%) | 94 (100.0%) |
| 25 to 34 Years | 291 (100.0%) | 278 (73.7%) |
| 35 to 44 Years | 240 (84.8%) | 304 (95.3%) |
| 45 to 54 Years | 256 (93.1%) | 198 (96.1%) |
| 55 to 64 Years | 197 (93.4%) | 120 (83.3%) |
| 65 to 74 Years | 61 (82.4%) | 210 (73.4%) |
| 75 Years and over | 74 (88.1%) | 177 (61.0%) |
| Total | 1,846 (91.2%) | 1,722 (82.8%) |
Income Below Poverty Among Married-Couple Families in Mount Vernon
The poverty statistics for married-couple families in Mount Vernon show that 2.5% or 17 of the total 681 families live below the poverty line. Families with 3 or 4 children have the highest poverty rate of 12.0%, comprising of 6 families. On the other hand, families with 1 or 2 children have the lowest poverty rate of 0.0%, which includes 0 families.
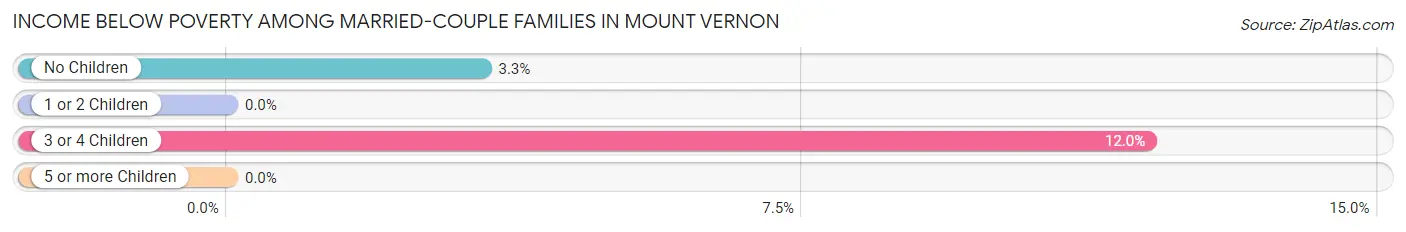
| Children | Above Poverty | Below Poverty |
| No Children | 321 (96.7%) | 11 (3.3%) |
| 1 or 2 Children | 299 (100.0%) | 0 (0.0%) |
| 3 or 4 Children | 44 (88.0%) | 6 (12.0%) |
| 5 or more Children | 0 (0.0%) | 0 (0.0%) |
| Total | 664 (97.5%) | 17 (2.5%) |
Income Below Poverty Among Single-Parent Households in Mount Vernon
According to the poverty data in Mount Vernon, 11.2% or 10 single-father households and 43.5% or 57 single-mother households are living below the poverty line. Among single-father households, those with 3 or 4 children have the highest poverty rate, with 10 households (18.9%) experiencing poverty. Likewise, among single-mother households, those with 1 or 2 children have the highest poverty rate, with 31 households (73.8%) falling below the poverty line.
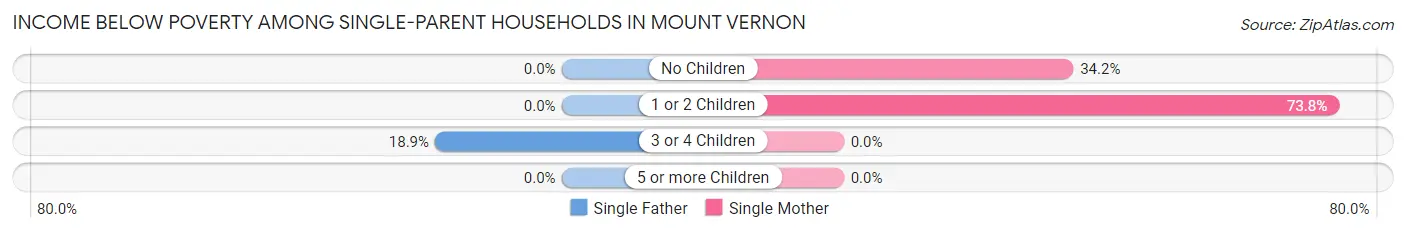
| Children | Single Father | Single Mother |
| No Children | 0 (0.0%) | 26 (34.2%) |
| 1 or 2 Children | 0 (0.0%) | 31 (73.8%) |
| 3 or 4 Children | 10 (18.9%) | 0 (0.0%) |
| 5 or more Children | 0 (0.0%) | 0 (0.0%) |
| Total | 10 (11.2%) | 57 (43.5%) |
Income Below Poverty Among Married-Couple vs Single-Parent Households in Mount Vernon
The poverty data for Mount Vernon shows that 17 of the married-couple family households (2.5%) and 67 of the single-parent households (30.4%) are living below the poverty level. Within the married-couple family households, those with 3 or 4 children have the highest poverty rate, with 6 households (12.0%) falling below the poverty line. Among the single-parent households, those with 1 or 2 children have the highest poverty rate, with 31 household (39.7%) living below poverty.
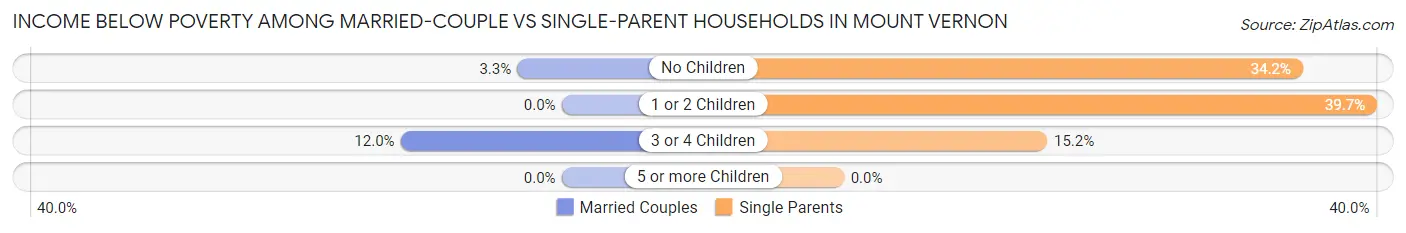
| Children | Married-Couple Families | Single-Parent Households |
| No Children | 11 (3.3%) | 26 (34.2%) |
| 1 or 2 Children | 0 (0.0%) | 31 (39.7%) |
| 3 or 4 Children | 6 (12.0%) | 10 (15.1%) |
| 5 or more Children | 0 (0.0%) | 0 (0.0%) |
| Total | 17 (2.5%) | 67 (30.4%) |
Race in Mount Vernon
The most populous races in Mount Vernon are White / Caucasian (4,122 | 91.4%), Two or more Races (311 | 6.9%), and Hispanic or Latino (163 | 3.6%).
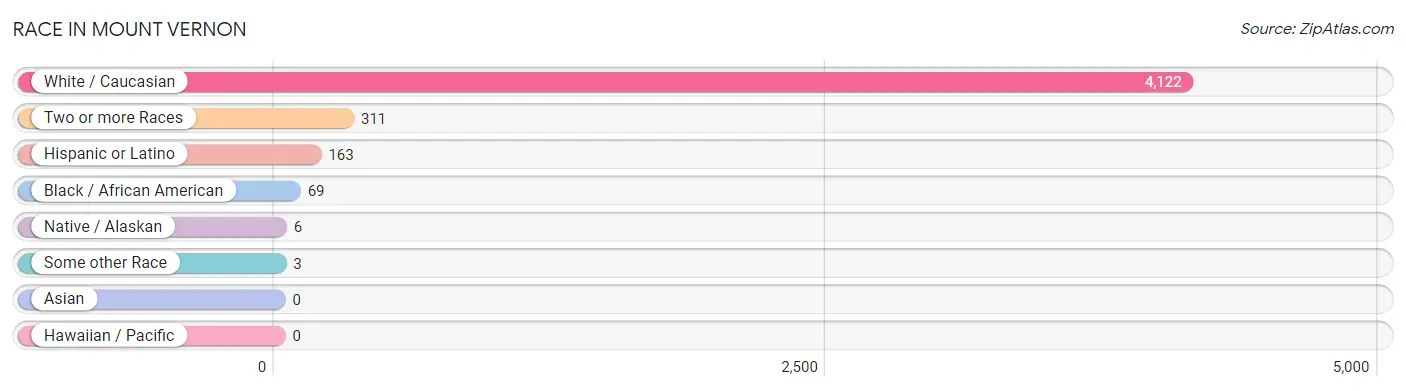
| Race | # Population | % Population |
| Asian | 0 | 0.0% |
| Black / African American | 69 | 1.5% |
| Hawaiian / Pacific | 0 | 0.0% |
| Hispanic or Latino | 163 | 3.6% |
| Native / Alaskan | 6 | 0.1% |
| White / Caucasian | 4,122 | 91.4% |
| Two or more Races | 311 | 6.9% |
| Some other Race | 3 | 0.1% |
| Total | 4,511 | 100.0% |
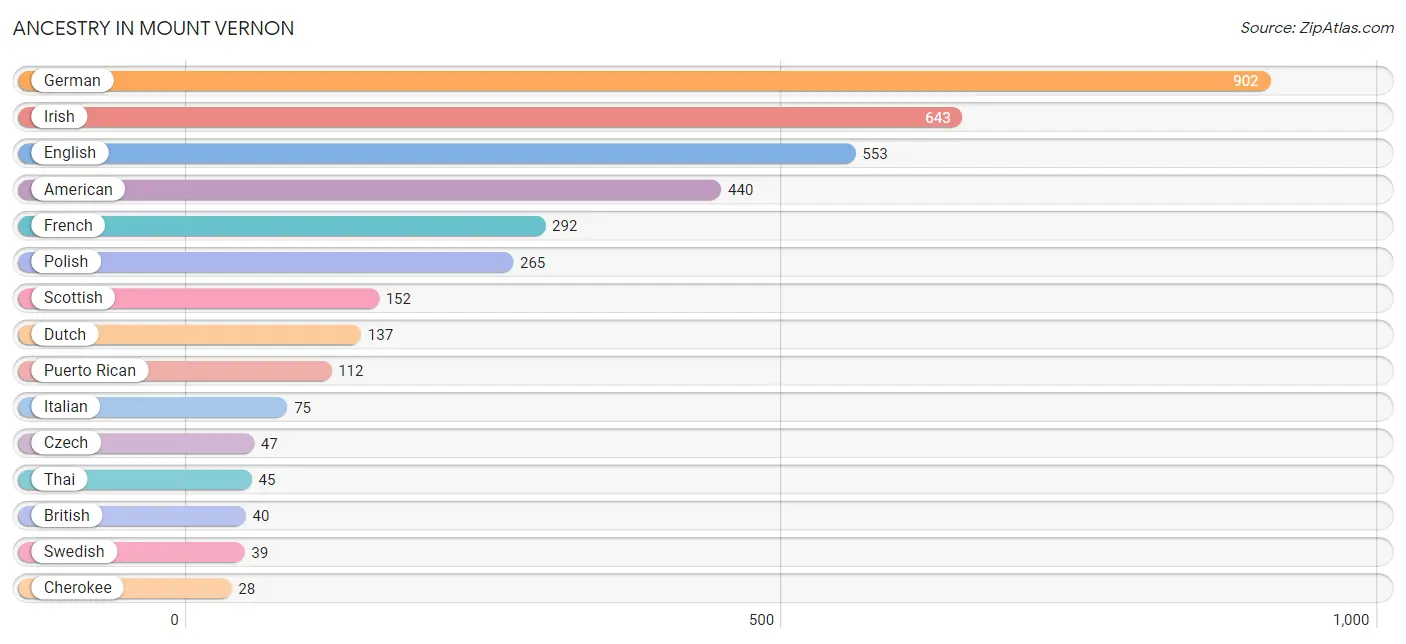
Ancestry in Mount Vernon
The most populous ancestries reported in Mount Vernon are German (902 | 20.0%), Irish (643 | 14.2%), English (553 | 12.3%), American (440 | 9.8%), and French (292 | 6.5%), together accounting for 62.7% of all Mount Vernon residents.
| Ancestry | # Population | % Population |
| American | 440 | 9.8% |
| Austrian | 5 | 0.1% |
| Blackfeet | 7 | 0.2% |
| British | 40 | 0.9% |
| Cherokee | 28 | 0.6% |
| Czech | 47 | 1.0% |
| Czechoslovakian | 11 | 0.2% |
| Dominican | 5 | 0.1% |
| Dutch | 137 | 3.0% |
| English | 553 | 12.3% |
| European | 18 | 0.4% |
| French | 292 | 6.5% |
| German | 902 | 20.0% |
| Hungarian | 7 | 0.2% |
| Irish | 643 | 14.2% |
| Italian | 75 | 1.7% |
| Mexican | 18 | 0.4% |
| Polish | 265 | 5.9% |
| Puerto Rican | 112 | 2.5% |
| Scotch-Irish | 13 | 0.3% |
| Scottish | 152 | 3.4% |
| Spaniard | 22 | 0.5% |
| Spanish | 6 | 0.1% |
| Swedish | 39 | 0.9% |
| Thai | 45 | 1.0% |
| Welsh | 5 | 0.1% | View All 26 Rows |
Immigrants in Mount Vernon
The most numerous immigrant groups reported in Mount Vernon came from Europe (52 | 1.1%), Southern Europe (22 | 0.5%), Spain (22 | 0.5%), Eastern Europe (15 | 0.3%), and Germany (15 | 0.3%), together accounting for 2.8% of all Mount Vernon residents.
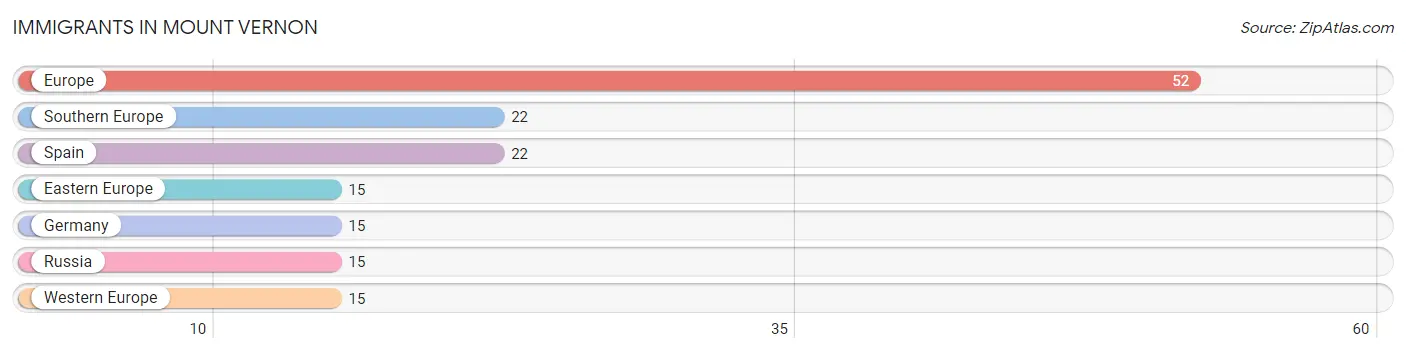
| Immigration Origin | # Population | % Population |
| Eastern Europe | 15 | 0.3% |
| Europe | 52 | 1.1% |
| Germany | 15 | 0.3% |
| Russia | 15 | 0.3% |
| Southern Europe | 22 | 0.5% |
| Spain | 22 | 0.5% |
| Western Europe | 15 | 0.3% | View All 7 Rows |
Sex and Age in Mount Vernon
Sex and Age in Mount Vernon
The most populous age groups in Mount Vernon are 5 to 9 Years (354 | 15.0%) for men and 30 to 34 Years (237 | 11.0%) for women.
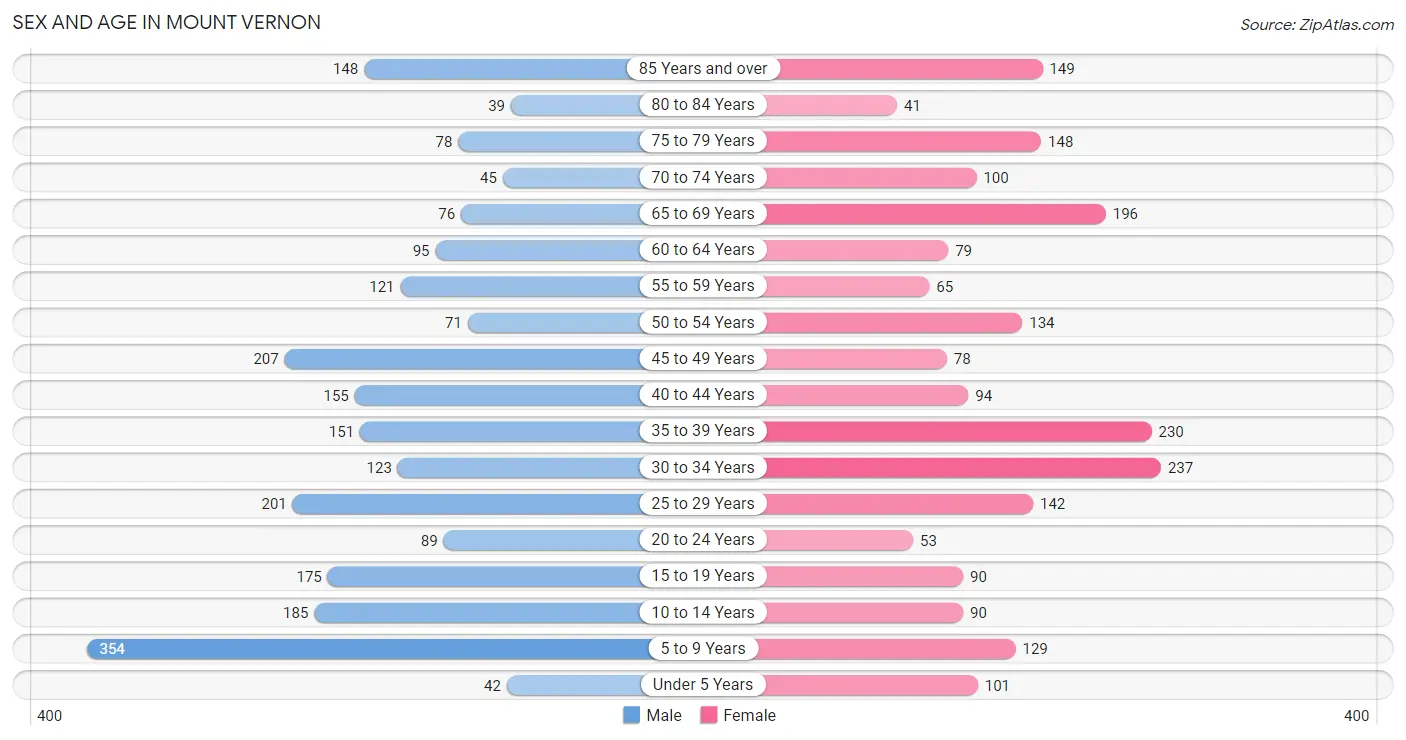
| Age Bracket | Male | Female |
| Under 5 Years | 42 (1.8%) | 101 (4.7%) |
| 5 to 9 Years | 354 (15.0%) | 129 (6.0%) |
| 10 to 14 Years | 185 (7.9%) | 90 (4.2%) |
| 15 to 19 Years | 175 (7.4%) | 90 (4.2%) |
| 20 to 24 Years | 89 (3.8%) | 53 (2.5%) |
| 25 to 29 Years | 201 (8.5%) | 142 (6.6%) |
| 30 to 34 Years | 123 (5.2%) | 237 (11.0%) |
| 35 to 39 Years | 151 (6.4%) | 230 (10.7%) |
| 40 to 44 Years | 155 (6.6%) | 94 (4.4%) |
| 45 to 49 Years | 207 (8.8%) | 78 (3.6%) |
| 50 to 54 Years | 71 (3.0%) | 134 (6.2%) |
| 55 to 59 Years | 121 (5.1%) | 65 (3.0%) |
| 60 to 64 Years | 95 (4.0%) | 79 (3.7%) |
| 65 to 69 Years | 76 (3.2%) | 196 (9.1%) |
| 70 to 74 Years | 45 (1.9%) | 100 (4.6%) |
| 75 to 79 Years | 78 (3.3%) | 148 (6.9%) |
| 80 to 84 Years | 39 (1.7%) | 41 (1.9%) |
| 85 Years and over | 148 (6.3%) | 149 (6.9%) |
| Total | 2,355 (100.0%) | 2,156 (100.0%) |
Families and Households in Mount Vernon
Median Family Size in Mount Vernon
The median family size in Mount Vernon is 3.36 persons per family, with married-couple families (681 | 75.6%) accounting for the largest median family size of 3.58 persons per family. On the other hand, single female/mother families (131 | 14.5%) represent the smallest median family size with 2.60 persons per family.
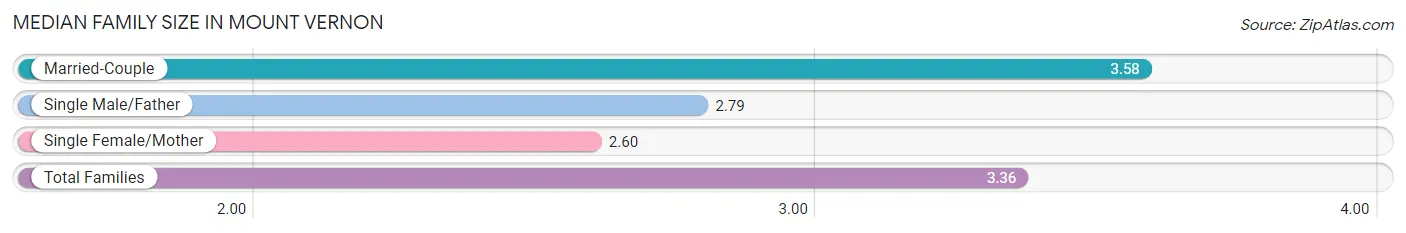
| Family Type | # Families | Family Size |
| Married-Couple | 681 (75.6%) | 3.58 |
| Single Male/Father | 89 (9.9%) | 2.79 |
| Single Female/Mother | 131 (14.5%) | 2.60 |
| Total Families | 901 (100.0%) | 3.36 |
Median Household Size in Mount Vernon
The median household size in Mount Vernon is 2.31 persons per household, with married-couple households (681 | 38.4%) accounting for the largest median household size of 3.58 persons per household. non-family households (872 | 49.2%) represent the smallest median household size with 1.16 persons per household.
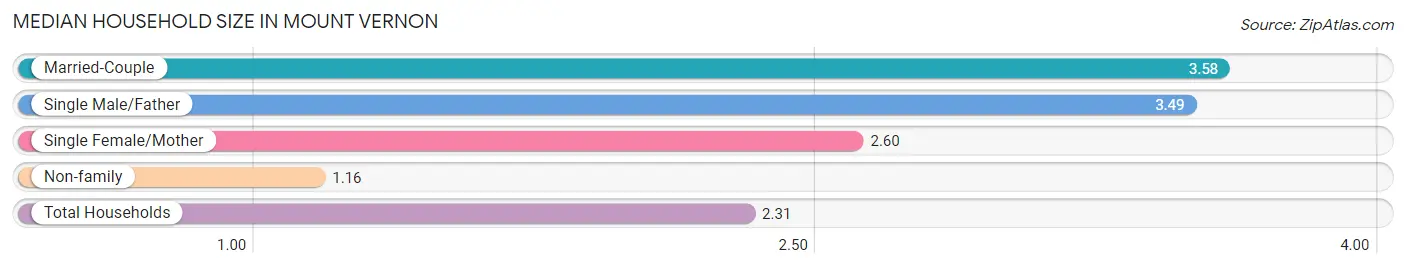
| Household Type | # Households | Household Size |
| Married-Couple | 681 (38.4%) | 3.58 |
| Single Male/Father | 89 (5.0%) | 3.49 |
| Single Female/Mother | 131 (7.4%) | 2.60 |
| Non-family | 872 (49.2%) | 1.16 |
| Total Households | 1,773 (100.0%) | 2.31 |
Household Size by Marriage Status in Mount Vernon
Out of a total of 1,773 households in Mount Vernon, 901 (50.8%) are family households, while 872 (49.2%) are nonfamily households. The most numerous type of family households are 2-person households, comprising 348, and the most common type of nonfamily households are 1-person households, comprising 700.
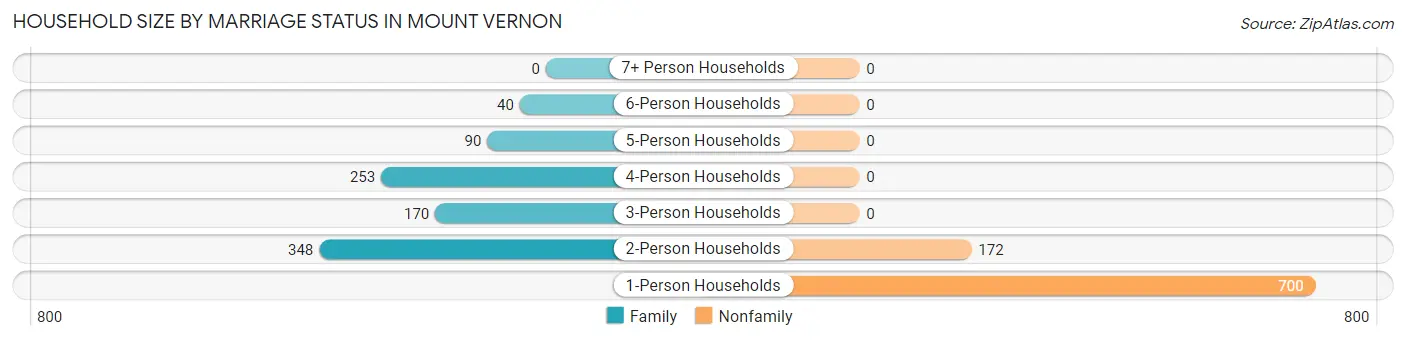
| Household Size | Family Households | Nonfamily Households |
| 1-Person Households | - | 700 (39.5%) |
| 2-Person Households | 348 (19.6%) | 172 (9.7%) |
| 3-Person Households | 170 (9.6%) | 0 (0.0%) |
| 4-Person Households | 253 (14.3%) | 0 (0.0%) |
| 5-Person Households | 90 (5.1%) | 0 (0.0%) |
| 6-Person Households | 40 (2.3%) | 0 (0.0%) |
| 7+ Person Households | 0 (0.0%) | 0 (0.0%) |
| Total | 901 (50.8%) | 872 (49.2%) |
Female Fertility in Mount Vernon
Fertility by Age in Mount Vernon
Average fertility rate in Mount Vernon is 47.0 births per 1,000 women. Women in the age bracket of 20 to 34 years have the highest fertility rate with 65.0 births per 1,000 women. Women in the age bracket of 20 to 34 years acount for 65.1% of all women with births.
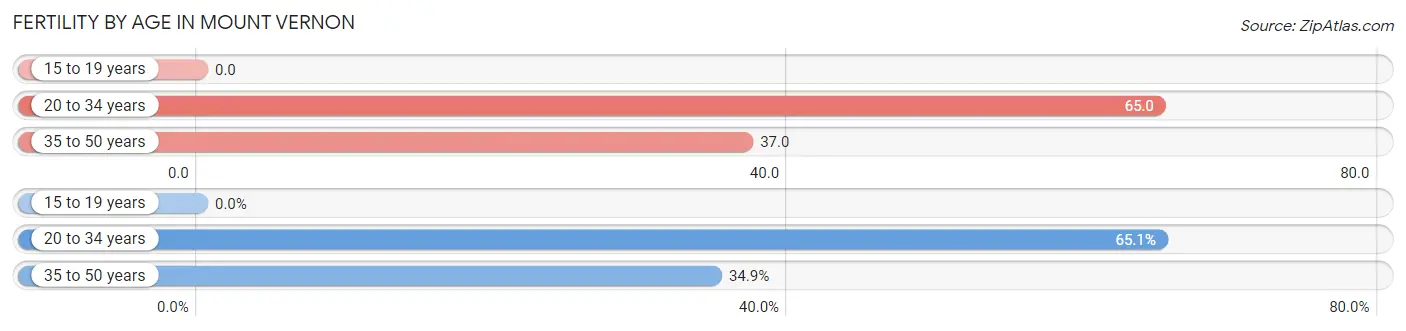
| Age Bracket | Women with Births | Births / 1,000 Women |
| 15 to 19 years | 0 (0.0%) | 0.0 |
| 20 to 34 years | 28 (65.1%) | 65.0 |
| 35 to 50 years | 15 (34.9%) | 37.0 |
| Total | 43 (100.0%) | 47.0 |
Fertility by Age by Marriage Status in Mount Vernon
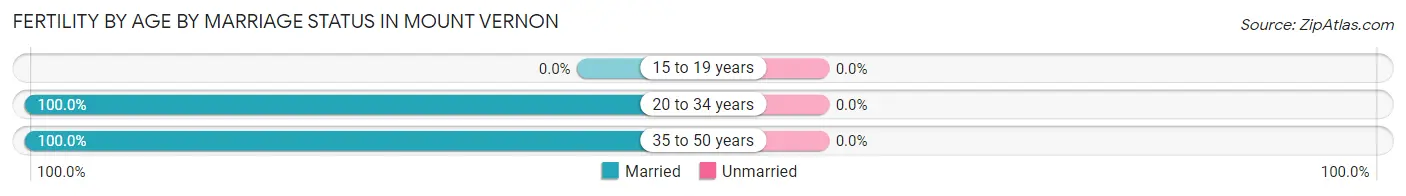
| Age Bracket | Married | Unmarried |
| 15 to 19 years | 0 (0.0%) | 0 (0.0%) |
| 20 to 34 years | 28 (100.0%) | 0 (0.0%) |
| 35 to 50 years | 15 (100.0%) | 0 (0.0%) |
| Total | 43 (100.0%) | 0 (0.0%) |
Fertility by Education in Mount Vernon
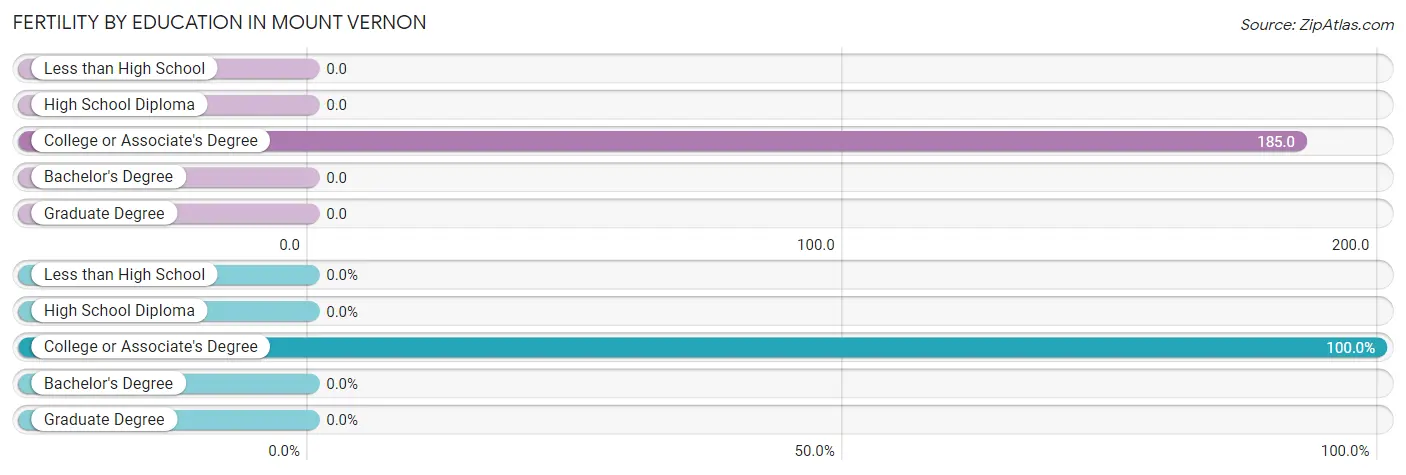
| Educational Attainment | Women with Births | Births / 1,000 Women |
| Less than High School | 0 (0.0%) | 0.0 |
| High School Diploma | 0 (0.0%) | 0.0 |
| College or Associate's Degree | 43 (100.0%) | 185.0 |
| Bachelor's Degree | 0 (0.0%) | 0.0 |
| Graduate Degree | 0 (0.0%) | 0.0 |
| Total | 43 (100.0%) | 47.0 |
Fertility by Education by Marriage Status in Mount Vernon
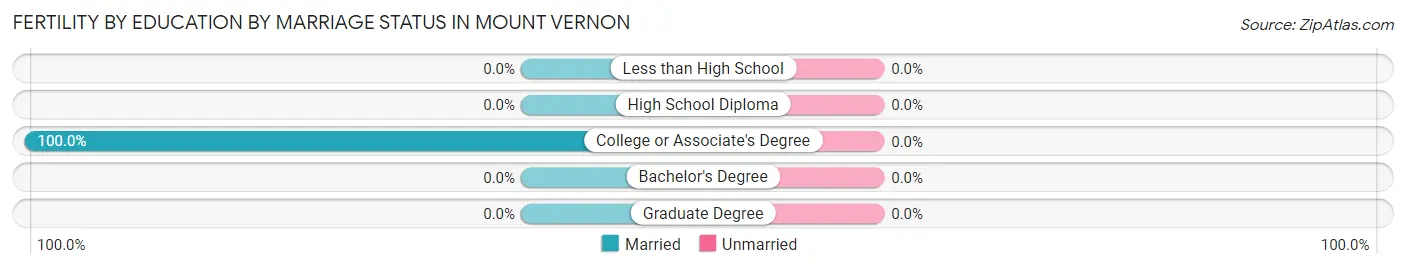
| Educational Attainment | Married | Unmarried |
| Less than High School | 0 (0.0%) | 0 (0.0%) |
| High School Diploma | 0 (0.0%) | 0 (0.0%) |
| College or Associate's Degree | 43 (100.0%) | 0 (0.0%) |
| Bachelor's Degree | 0 (0.0%) | 0 (0.0%) |
| Graduate Degree | 0 (0.0%) | 0 (0.0%) |
| Total | 43 (100.0%) | 0 (0.0%) |
Employment Characteristics in Mount Vernon
Employment by Class of Employer in Mount Vernon
Among the 1,826 employed individuals in Mount Vernon, private company employees (1,322 | 72.4%), state government employees (178 | 9.8%), and self-employed (not incorporated) (77 | 4.2%) make up the most common classes of employment.
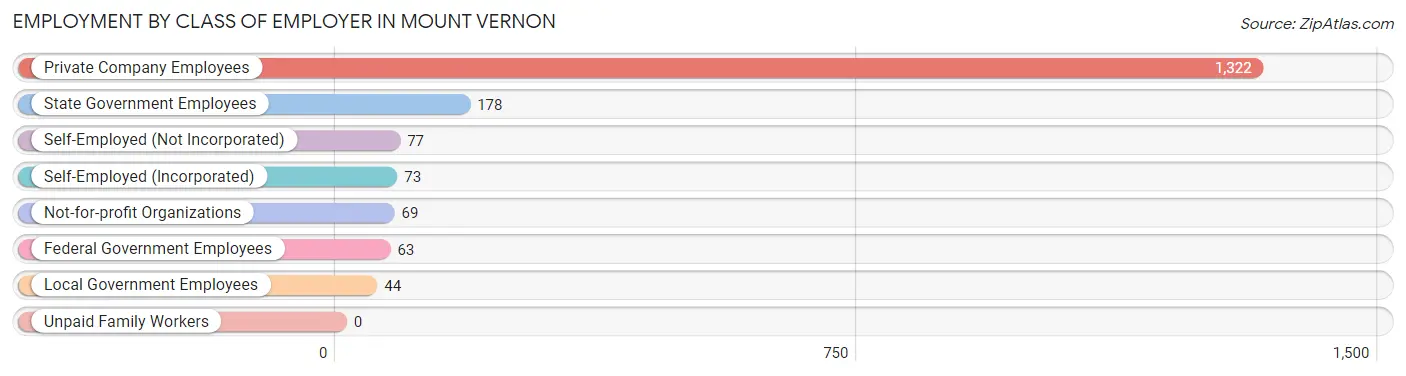
| Employer Class | # Employees | % Employees |
| Private Company Employees | 1,322 | 72.4% |
| Self-Employed (Incorporated) | 73 | 4.0% |
| Self-Employed (Not Incorporated) | 77 | 4.2% |
| Not-for-profit Organizations | 69 | 3.8% |
| Local Government Employees | 44 | 2.4% |
| State Government Employees | 178 | 9.8% |
| Federal Government Employees | 63 | 3.5% |
| Unpaid Family Workers | 0 | 0.0% |
| Total | 1,826 | 100.0% |
Employment Status by Age in Mount Vernon
According to the labor force statistics for Mount Vernon, out of the total population over 16 years of age (3,555), 52.3% or 1,859 individuals are in the labor force, with 1.7% or 32 of them unemployed. The age group with the highest labor force participation rate is 20 to 24 years, with 98.6% or 140 individuals in the labor force. Within the labor force, the 75 years and over age range has the highest percentage of unemployed individuals, with 100.0% or 15 of them being unemployed.
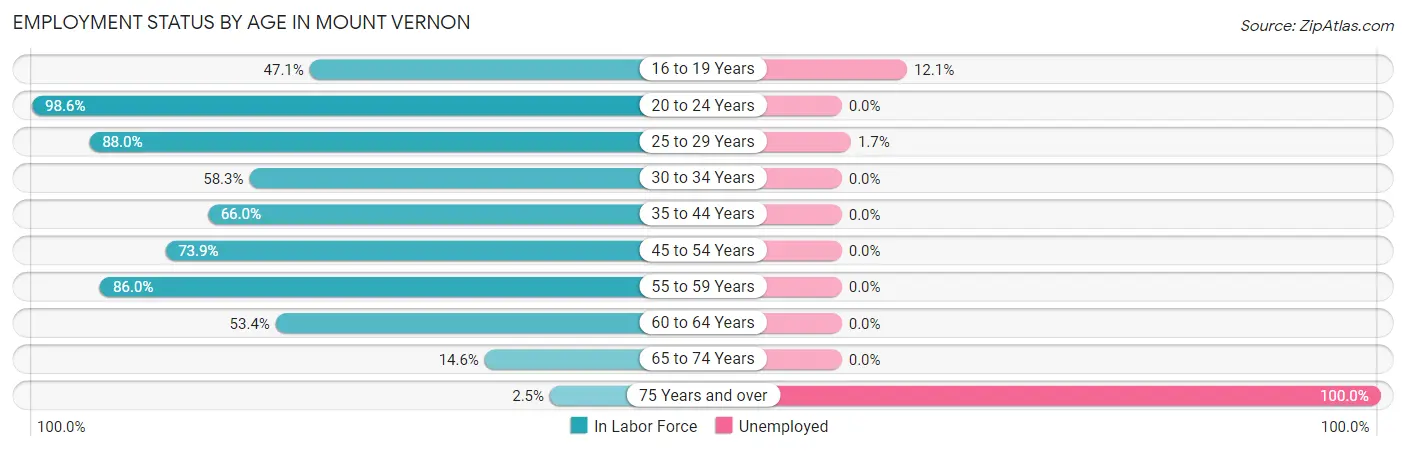
| Age Bracket | In Labor Force | Unemployed |
| 16 to 19 Years | 99 (47.1%) | 12 (12.1%) |
| 20 to 24 Years | 140 (98.6%) | 0 (0.0%) |
| 25 to 29 Years | 302 (88.0%) | 5 (1.7%) |
| 30 to 34 Years | 210 (58.3%) | 0 (0.0%) |
| 35 to 44 Years | 416 (66.0%) | 0 (0.0%) |
| 45 to 54 Years | 362 (73.9%) | 0 (0.0%) |
| 55 to 59 Years | 160 (86.0%) | 0 (0.0%) |
| 60 to 64 Years | 93 (53.4%) | 0 (0.0%) |
| 65 to 74 Years | 61 (14.6%) | 0 (0.0%) |
| 75 Years and over | 15 (2.5%) | 15 (100.0%) |
| Total | 1,859 (52.3%) | 32 (1.7%) |
Employment Status by Educational Attainment in Mount Vernon
According to labor force statistics for Mount Vernon, 70.7% of individuals (1,543) out of the total population between 25 and 64 years of age (2,183) are in the labor force, with 0.3% or 5 of them being unemployed. The group with the highest labor force participation rate are those with the educational attainment of college / associate degree, with 83.0% or 541 individuals in the labor force. Within the labor force, individuals with high school diploma education have the highest percentage of unemployment, with 0.7% or 5 of them being unemployed.
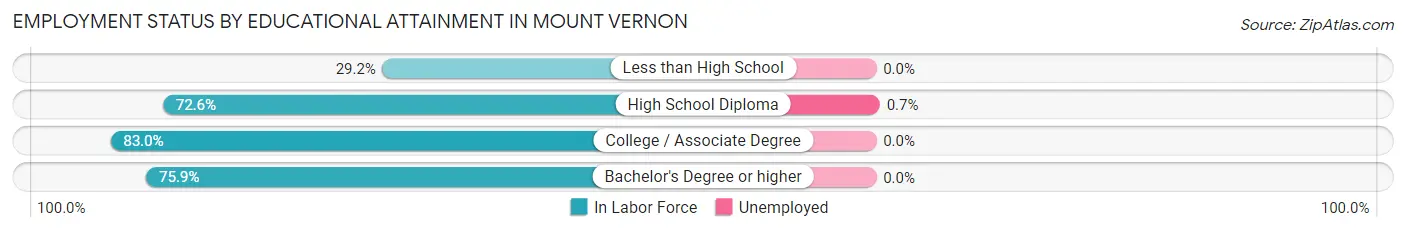
| Educational Attainment | In Labor Force | Unemployed |
| Less than High School | 81 (29.2%) | 0 (0.0%) |
| High School Diploma | 669 (72.6%) | 6 (0.7%) |
| College / Associate Degree | 541 (83.0%) | 0 (0.0%) |
| Bachelor's Degree or higher | 252 (75.9%) | 0 (0.0%) |
| Total | 1,543 (70.7%) | 7 (0.3%) |
Employment Occupations by Sex in Mount Vernon
Management, Business, Science and Arts Occupations
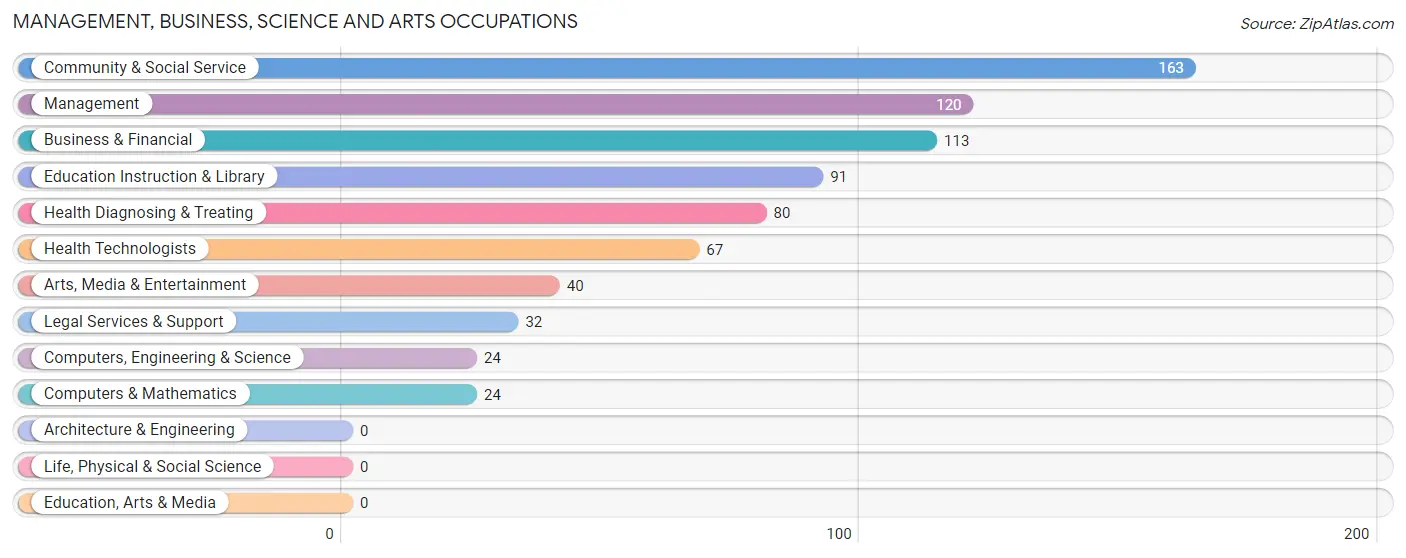
The most common Management, Business, Science and Arts occupations in Mount Vernon are Community & Social Service (163 | 8.9%), Management (120 | 6.6%), Business & Financial (113 | 6.2%), Education Instruction & Library (91 | 5.0%), and Health Diagnosing & Treating (80 | 4.4%).
Management, Business, Science and Arts Occupations by Sex
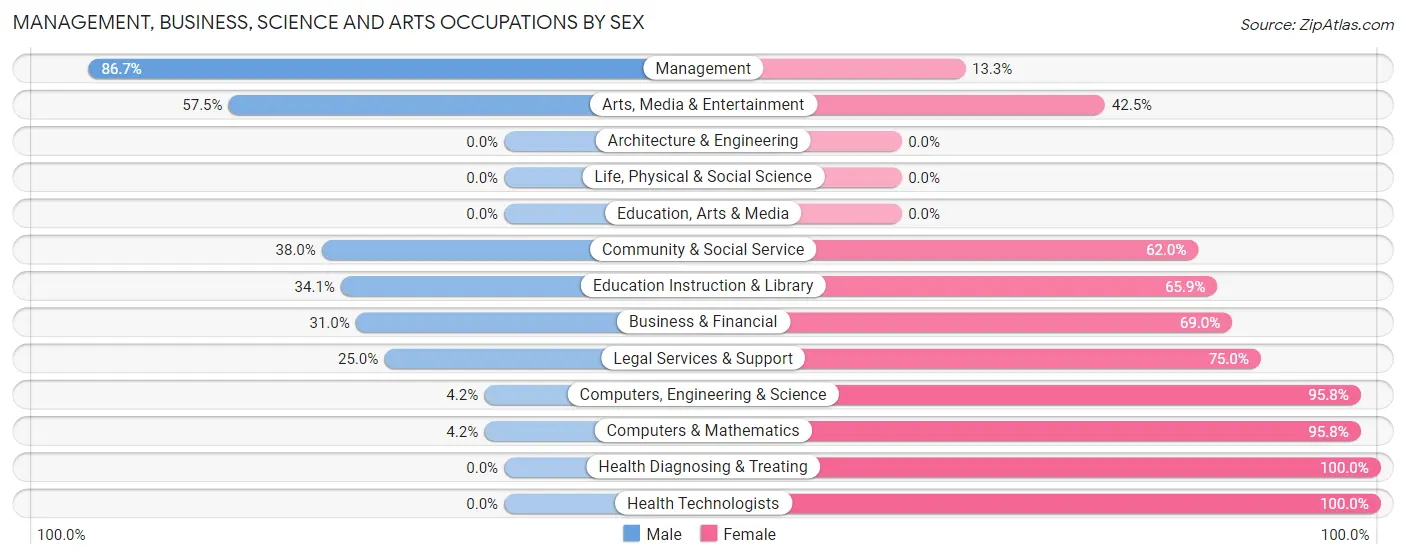
Within the Management, Business, Science and Arts occupations in Mount Vernon, the most male-oriented occupations are Management (86.7%), Arts, Media & Entertainment (57.5%), and Community & Social Service (38.0%), while the most female-oriented occupations are Health Diagnosing & Treating (100.0%), Health Technologists (100.0%), and Computers, Engineering & Science (95.8%).
| Occupation | Male | Female |
| Management | 104 (86.7%) | 16 (13.3%) |
| Business & Financial | 35 (31.0%) | 78 (69.0%) |
| Computers, Engineering & Science | 1 (4.2%) | 23 (95.8%) |
| Computers & Mathematics | 1 (4.2%) | 23 (95.8%) |
| Architecture & Engineering | 0 (0.0%) | 0 (0.0%) |
| Life, Physical & Social Science | 0 (0.0%) | 0 (0.0%) |
| Community & Social Service | 62 (38.0%) | 101 (62.0%) |
| Education, Arts & Media | 0 (0.0%) | 0 (0.0%) |
| Legal Services & Support | 8 (25.0%) | 24 (75.0%) |
| Education Instruction & Library | 31 (34.1%) | 60 (65.9%) |
| Arts, Media & Entertainment | 23 (57.5%) | 17 (42.5%) |
| Health Diagnosing & Treating | 0 (0.0%) | 80 (100.0%) |
| Health Technologists | 0 (0.0%) | 67 (100.0%) |
| Total (Category) | 202 (40.4%) | 298 (59.6%) |
| Total (Overall) | 1,040 (57.0%) | 786 (43.0%) |
Services Occupations
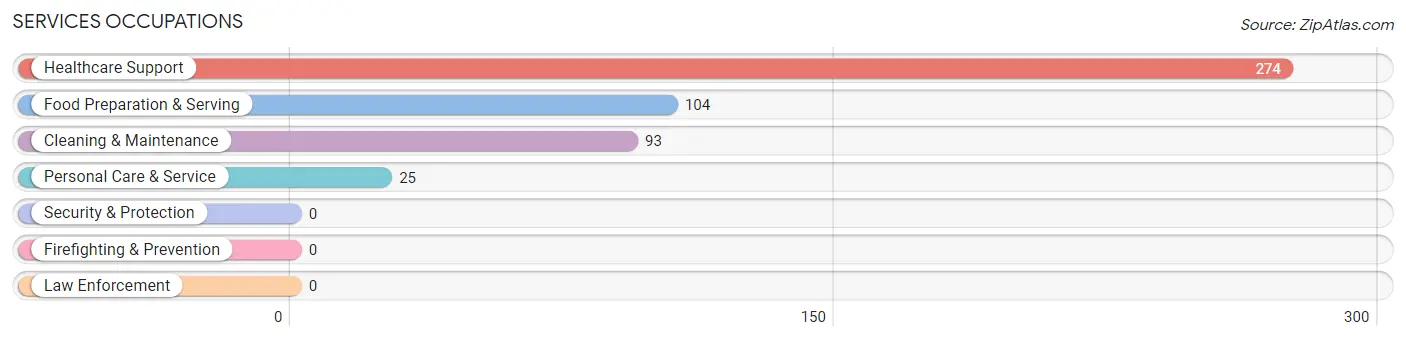
The most common Services occupations in Mount Vernon are Healthcare Support (274 | 15.0%), Food Preparation & Serving (104 | 5.7%), Cleaning & Maintenance (93 | 5.1%), and Personal Care & Service (25 | 1.4%).
Services Occupations by Sex
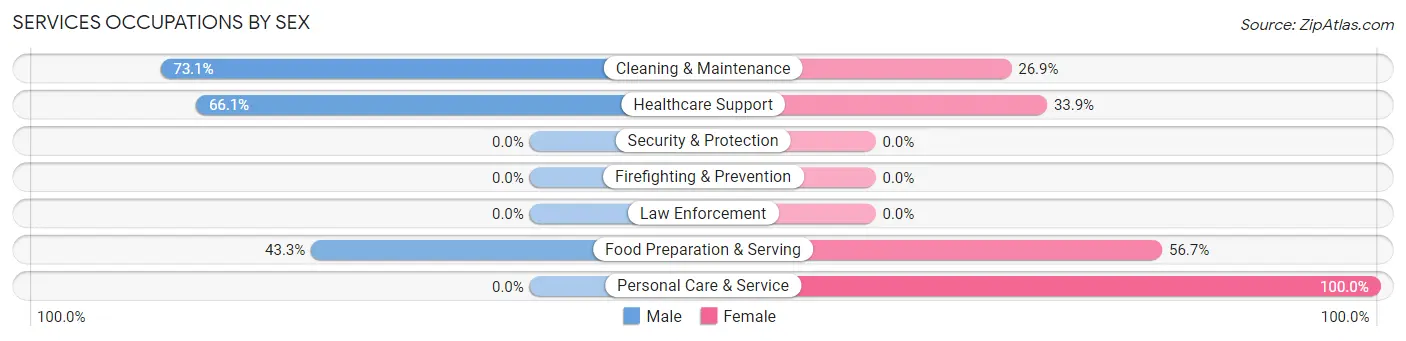
Within the Services occupations in Mount Vernon, the most male-oriented occupations are Cleaning & Maintenance (73.1%), Healthcare Support (66.1%), and Food Preparation & Serving (43.3%), while the most female-oriented occupations are Personal Care & Service (100.0%), Food Preparation & Serving (56.7%), and Healthcare Support (33.9%).
| Occupation | Male | Female |
| Healthcare Support | 181 (66.1%) | 93 (33.9%) |
| Security & Protection | 0 (0.0%) | 0 (0.0%) |
| Firefighting & Prevention | 0 (0.0%) | 0 (0.0%) |
| Law Enforcement | 0 (0.0%) | 0 (0.0%) |
| Food Preparation & Serving | 45 (43.3%) | 59 (56.7%) |
| Cleaning & Maintenance | 68 (73.1%) | 25 (26.9%) |
| Personal Care & Service | 0 (0.0%) | 25 (100.0%) |
| Total (Category) | 294 (59.3%) | 202 (40.7%) |
| Total (Overall) | 1,040 (57.0%) | 786 (43.0%) |
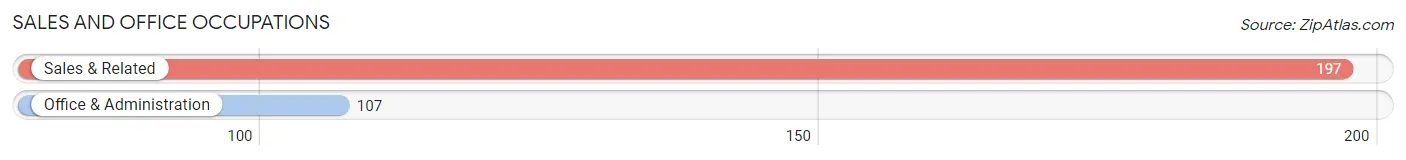
Sales and Office Occupations
The most common Sales and Office occupations in Mount Vernon are Sales & Related (197 | 10.8%), and Office & Administration (107 | 5.9%).
Sales and Office Occupations by Sex
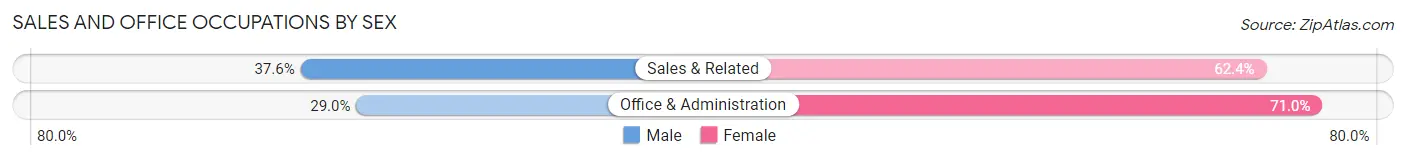
| Occupation | Male | Female |
| Sales & Related | 74 (37.6%) | 123 (62.4%) |
| Office & Administration | 31 (29.0%) | 76 (71.0%) |
| Total (Category) | 105 (34.5%) | 199 (65.5%) |
| Total (Overall) | 1,040 (57.0%) | 786 (43.0%) |
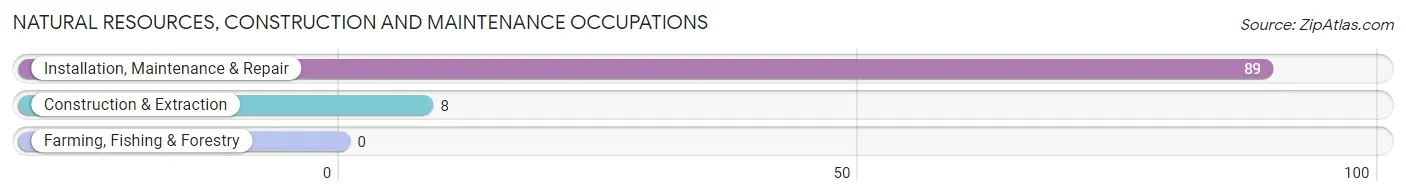
Natural Resources, Construction and Maintenance Occupations
The most common Natural Resources, Construction and Maintenance occupations in Mount Vernon are Installation, Maintenance & Repair (89 | 4.9%), and Construction & Extraction (8 | 0.4%).
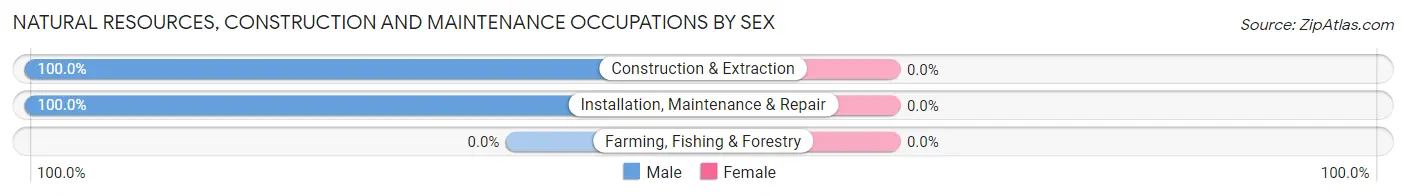
Natural Resources, Construction and Maintenance Occupations by Sex
| Occupation | Male | Female |
| Farming, Fishing & Forestry | 0 (0.0%) | 0 (0.0%) |
| Construction & Extraction | 8 (100.0%) | 0 (0.0%) |
| Installation, Maintenance & Repair | 89 (100.0%) | 0 (0.0%) |
| Total (Category) | 97 (100.0%) | 0 (0.0%) |
| Total (Overall) | 1,040 (57.0%) | 786 (43.0%) |
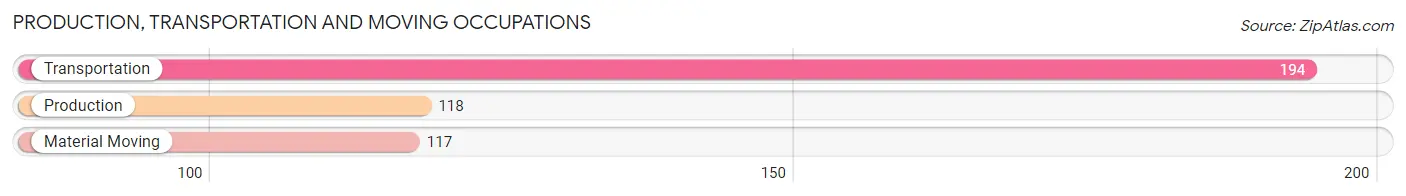
Production, Transportation and Moving Occupations
The most common Production, Transportation and Moving occupations in Mount Vernon are Transportation (194 | 10.6%), Production (118 | 6.5%), and Material Moving (117 | 6.4%).
Production, Transportation and Moving Occupations by Sex
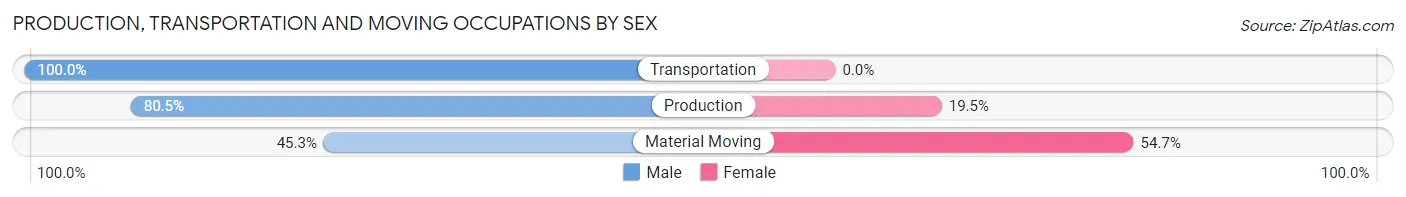
| Occupation | Male | Female |
| Production | 95 (80.5%) | 23 (19.5%) |
| Transportation | 194 (100.0%) | 0 (0.0%) |
| Material Moving | 53 (45.3%) | 64 (54.7%) |
| Total (Category) | 342 (79.7%) | 87 (20.3%) |
| Total (Overall) | 1,040 (57.0%) | 786 (43.0%) |
Employment Industries by Sex in Mount Vernon
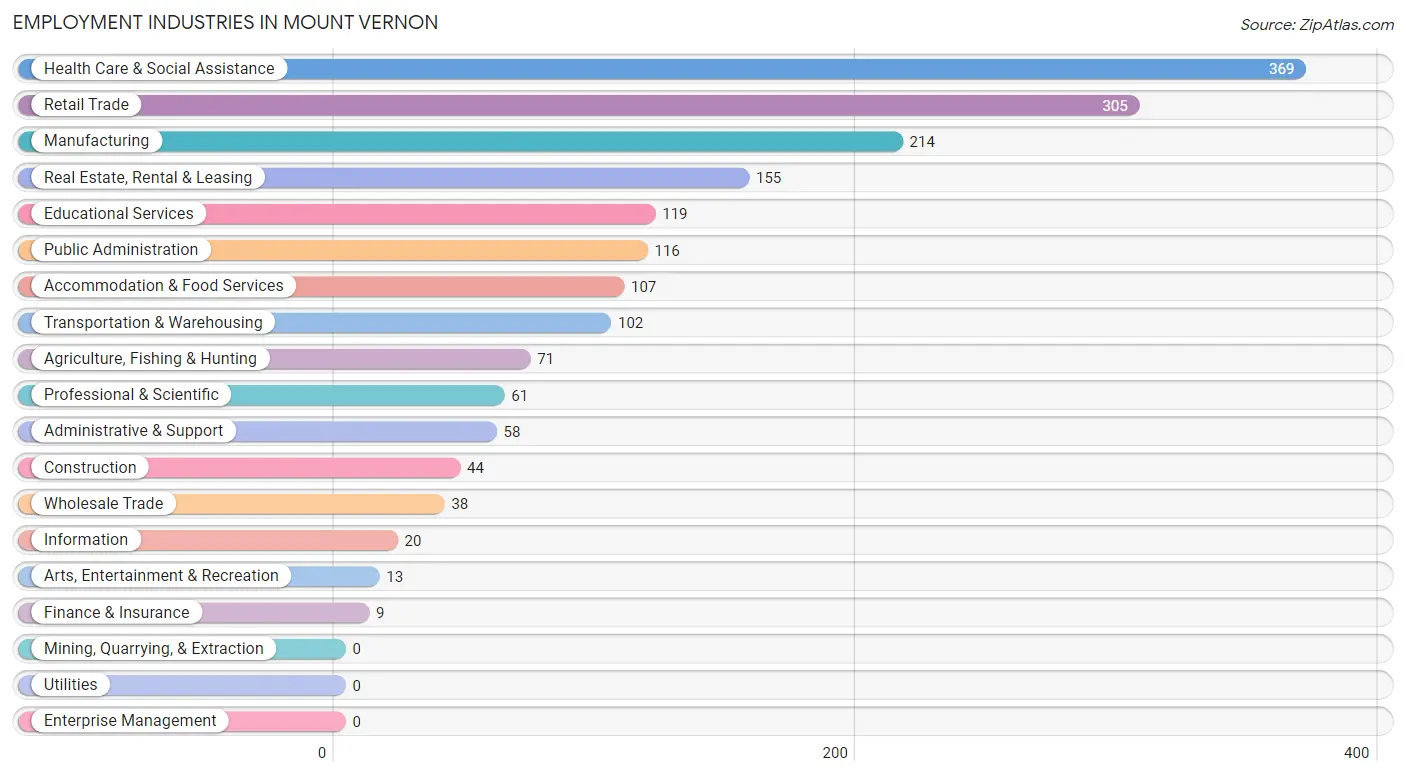
Employment Industries in Mount Vernon
The major employment industries in Mount Vernon include Health Care & Social Assistance (369 | 20.2%), Retail Trade (305 | 16.7%), Manufacturing (214 | 11.7%), Real Estate, Rental & Leasing (155 | 8.5%), and Educational Services (119 | 6.5%).
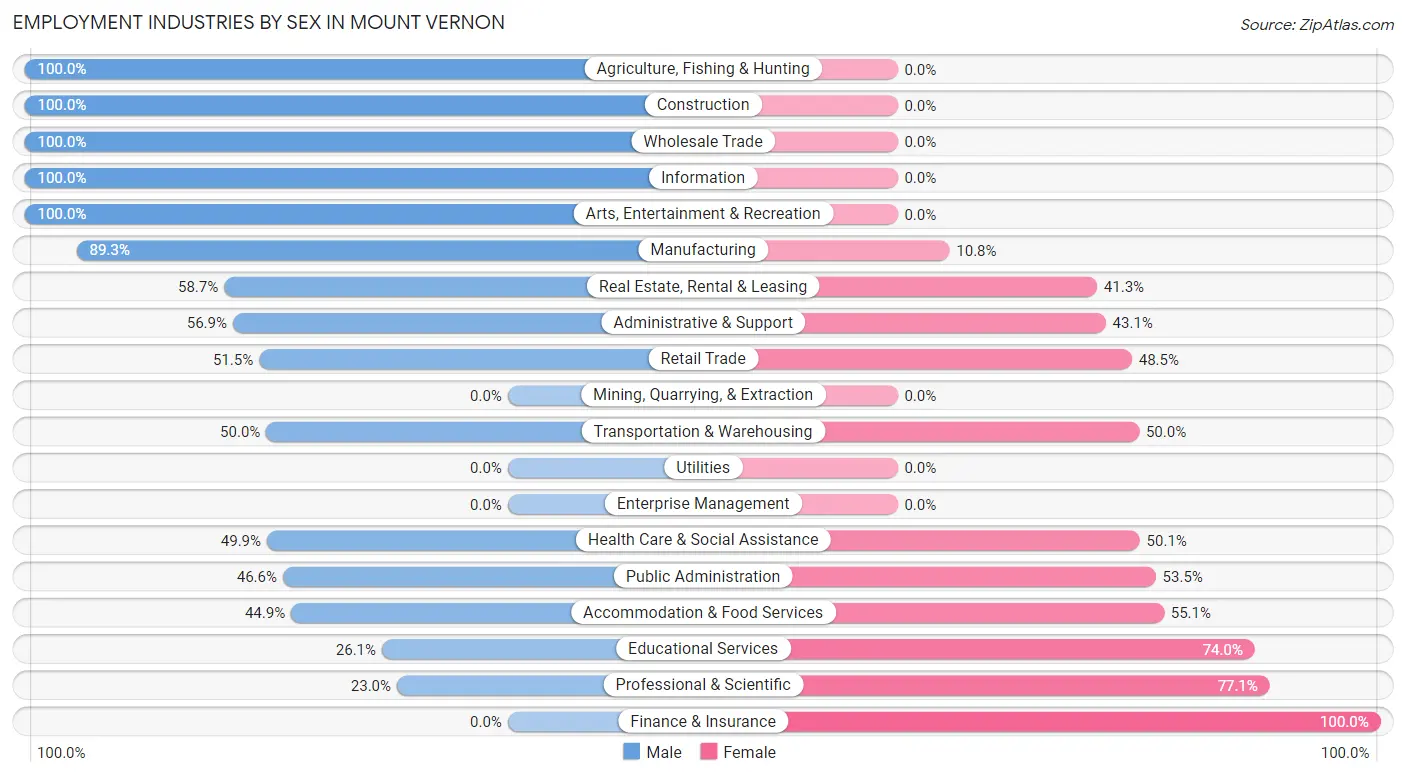
Employment Industries by Sex in Mount Vernon
The Mount Vernon industries that see more men than women are Agriculture, Fishing & Hunting (100.0%), Construction (100.0%), and Wholesale Trade (100.0%), whereas the industries that tend to have a higher number of women are Finance & Insurance (100.0%), Professional & Scientific (77.0%), and Educational Services (74.0%).
| Industry | Male | Female |
| Agriculture, Fishing & Hunting | 71 (100.0%) | 0 (0.0%) |
| Mining, Quarrying, & Extraction | 0 (0.0%) | 0 (0.0%) |
| Construction | 44 (100.0%) | 0 (0.0%) |
| Manufacturing | 191 (89.2%) | 23 (10.7%) |
| Wholesale Trade | 38 (100.0%) | 0 (0.0%) |
| Retail Trade | 157 (51.5%) | 148 (48.5%) |
| Transportation & Warehousing | 51 (50.0%) | 51 (50.0%) |
| Utilities | 0 (0.0%) | 0 (0.0%) |
| Information | 20 (100.0%) | 0 (0.0%) |
| Finance & Insurance | 0 (0.0%) | 9 (100.0%) |
| Real Estate, Rental & Leasing | 91 (58.7%) | 64 (41.3%) |
| Professional & Scientific | 14 (23.0%) | 47 (77.0%) |
| Enterprise Management | 0 (0.0%) | 0 (0.0%) |
| Administrative & Support | 33 (56.9%) | 25 (43.1%) |
| Educational Services | 31 (26.1%) | 88 (74.0%) |
| Health Care & Social Assistance | 184 (49.9%) | 185 (50.1%) |
| Arts, Entertainment & Recreation | 13 (100.0%) | 0 (0.0%) |
| Accommodation & Food Services | 48 (44.9%) | 59 (55.1%) |
| Public Administration | 54 (46.6%) | 62 (53.4%) |
| Total | 1,040 (57.0%) | 786 (43.0%) |
Education in Mount Vernon
School Enrollment in Mount Vernon
The most common levels of schooling among the 1,006 students in Mount Vernon are elementary school (447 | 44.4%), high school (219 | 21.8%), and middle school (215 | 21.4%).
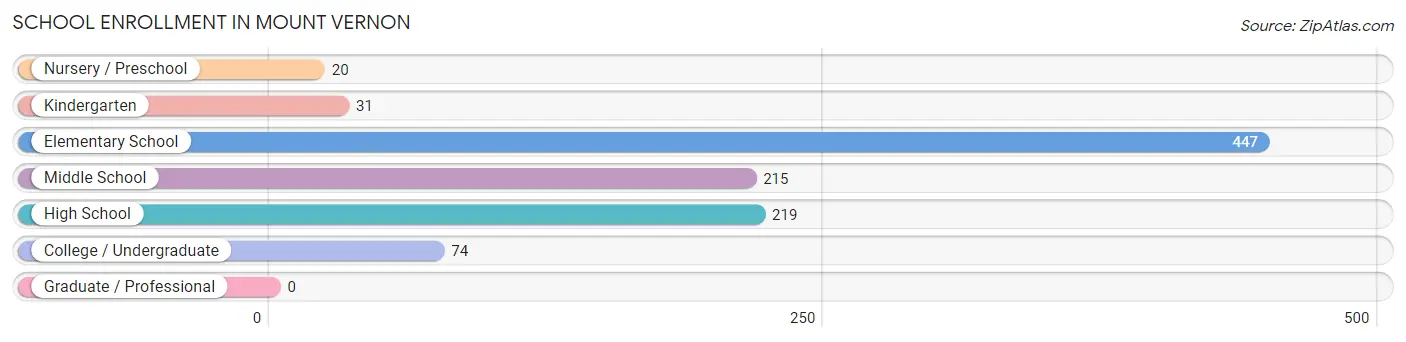
| School Level | # Students | % Students |
| Nursery / Preschool | 20 | 2.0% |
| Kindergarten | 31 | 3.1% |
| Elementary School | 447 | 44.4% |
| Middle School | 215 | 21.4% |
| High School | 219 | 21.8% |
| College / Undergraduate | 74 | 7.4% |
| Graduate / Professional | 0 | 0.0% |
| Total | 1,006 | 100.0% |
School Enrollment by Age by Funding Source in Mount Vernon
Out of a total of 1,006 students who are enrolled in schools in Mount Vernon, 151 (15.0%) attend a private institution, while the remaining 855 (85.0%) are enrolled in public schools. The age group of 18 to 19 year olds has the highest likelihood of being enrolled in private schools, with 29 (40.8% in the age bracket) enrolled. Conversely, the age group of 20 to 24 year olds has the lowest likelihood of being enrolled in a private school, with 15 (100.0% in the age bracket) attending a public institution.
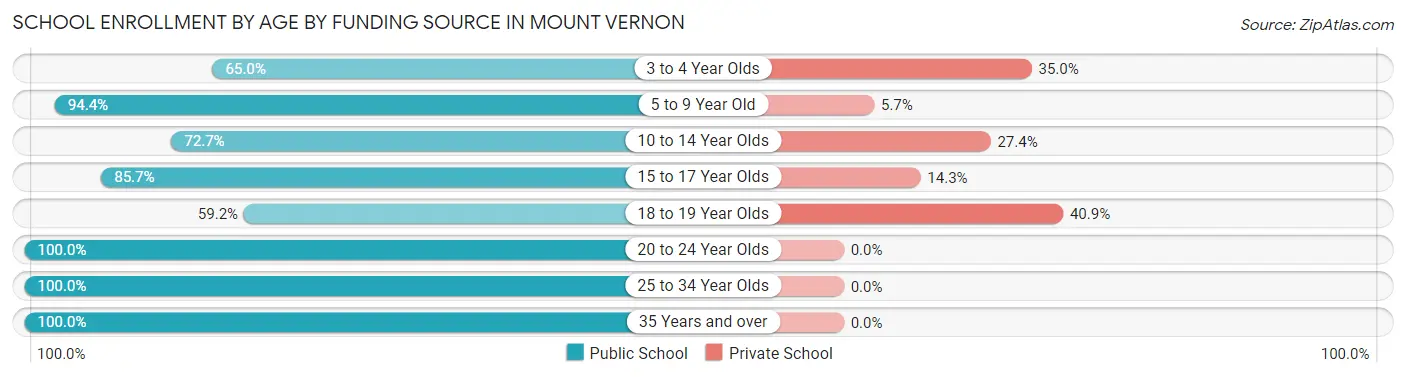
| Age Bracket | Public School | Private School |
| 3 to 4 Year Olds | 13 (65.0%) | 7 (35.0%) |
| 5 to 9 Year Old | 451 (94.4%) | 27 (5.7%) |
| 10 to 14 Year Olds | 178 (72.7%) | 67 (27.4%) |
| 15 to 17 Year Olds | 126 (85.7%) | 21 (14.3%) |
| 18 to 19 Year Olds | 42 (59.2%) | 29 (40.8%) |
| 20 to 24 Year Olds | 15 (100.0%) | 0 (0.0%) |
| 25 to 34 Year Olds | 12 (100.0%) | 0 (0.0%) |
| 35 Years and over | 18 (100.0%) | 0 (0.0%) |
| Total | 855 (85.0%) | 151 (15.0%) |
Educational Attainment by Field of Study in Mount Vernon
Education (214 | 38.0%), business (78 | 13.9%), bio, nature & agricultural (71 | 12.6%), arts & humanities (48 | 8.5%), and visual & performing arts (36 | 6.4%) are the most common fields of study among 563 individuals in Mount Vernon who have obtained a bachelor's degree or higher.
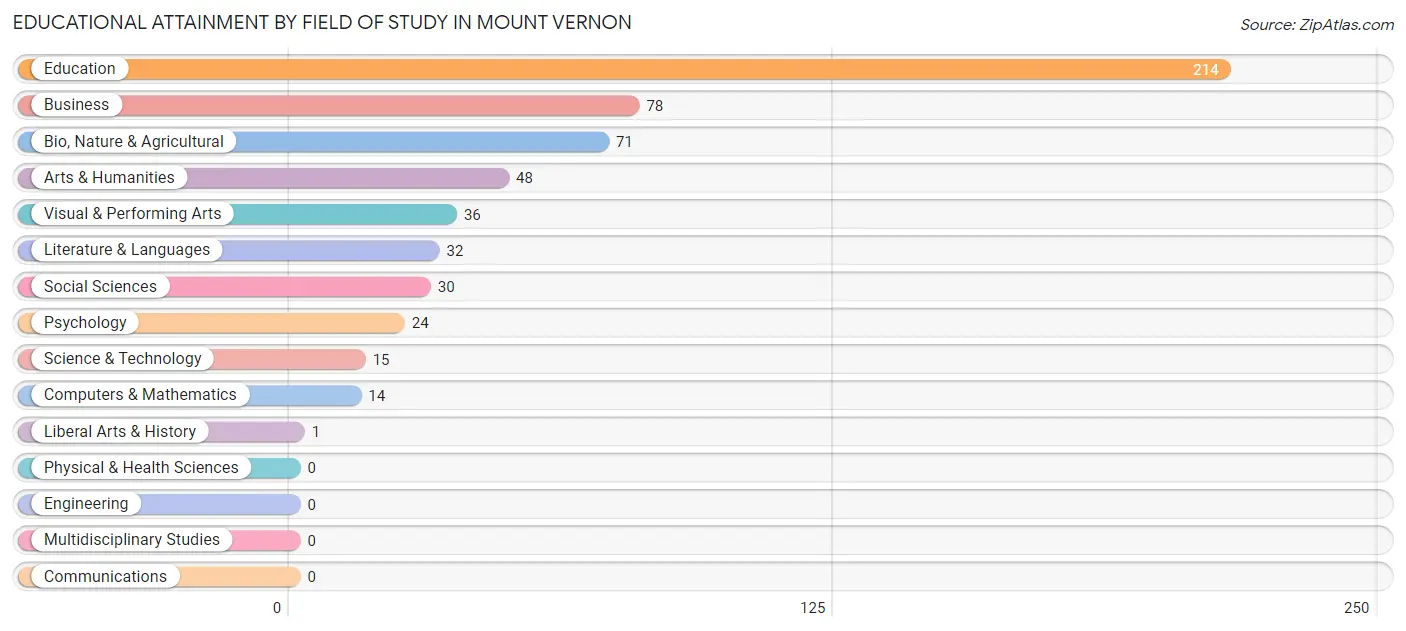
| Field of Study | # Graduates | % Graduates |
| Computers & Mathematics | 14 | 2.5% |
| Bio, Nature & Agricultural | 71 | 12.6% |
| Physical & Health Sciences | 0 | 0.0% |
| Psychology | 24 | 4.3% |
| Social Sciences | 30 | 5.3% |
| Engineering | 0 | 0.0% |
| Multidisciplinary Studies | 0 | 0.0% |
| Science & Technology | 15 | 2.7% |
| Business | 78 | 13.9% |
| Education | 214 | 38.0% |
| Literature & Languages | 32 | 5.7% |
| Liberal Arts & History | 1 | 0.2% |
| Visual & Performing Arts | 36 | 6.4% |
| Communications | 0 | 0.0% |
| Arts & Humanities | 48 | 8.5% |
| Total | 563 | 100.0% |
Transportation & Commute in Mount Vernon
Vehicle Availability by Sex in Mount Vernon
The most prevalent vehicle ownership categories in Mount Vernon are males with 2 vehicles (487, accounting for 46.8%) and females with 2 vehicles (470, making up 62.0%).
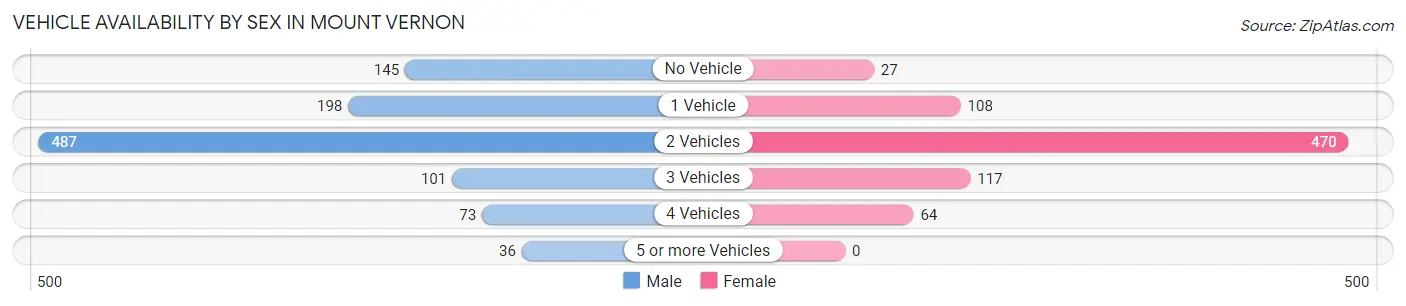
| Vehicles Available | Male | Female |
| No Vehicle | 145 (13.9%) | 27 (3.4%) |
| 1 Vehicle | 198 (19.0%) | 108 (13.7%) |
| 2 Vehicles | 487 (46.8%) | 470 (59.8%) |
| 3 Vehicles | 101 (9.7%) | 117 (14.9%) |
| 4 Vehicles | 73 (7.0%) | 64 (8.1%) |
| 5 or more Vehicles | 36 (3.5%) | 0 (0.0%) |
| Total | 1,040 (100.0%) | 786 (100.0%) |
Commute Time in Mount Vernon
The most frequently occuring commute durations in Mount Vernon are 10 to 14 minutes (266 commuters, 16.2%), 15 to 19 minutes (247 commuters, 15.0%), and 5 to 9 minutes (244 commuters, 14.8%).
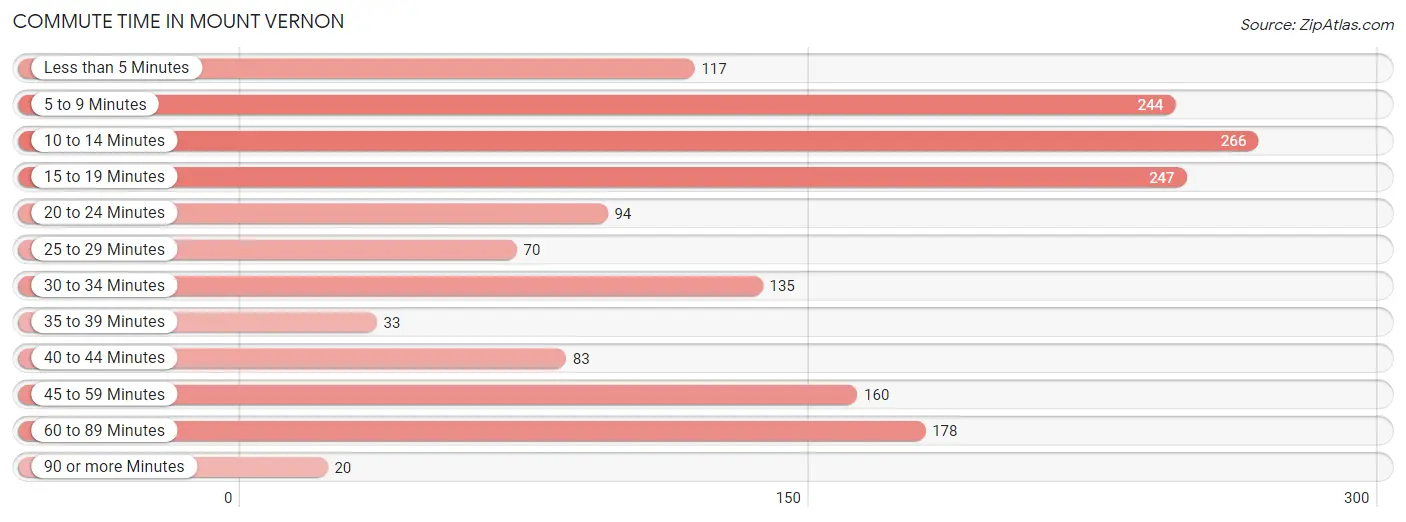
| Commute Time | # Commuters | % Commuters |
| Less than 5 Minutes | 117 | 7.1% |
| 5 to 9 Minutes | 244 | 14.8% |
| 10 to 14 Minutes | 266 | 16.2% |
| 15 to 19 Minutes | 247 | 15.0% |
| 20 to 24 Minutes | 94 | 5.7% |
| 25 to 29 Minutes | 70 | 4.3% |
| 30 to 34 Minutes | 135 | 8.2% |
| 35 to 39 Minutes | 33 | 2.0% |
| 40 to 44 Minutes | 83 | 5.0% |
| 45 to 59 Minutes | 160 | 9.7% |
| 60 to 89 Minutes | 178 | 10.8% |
| 90 or more Minutes | 20 | 1.2% |
Commute Time by Sex in Mount Vernon
The most common commute times in Mount Vernon are 15 to 19 minutes (199 commuters, 20.6%) for males and 5 to 9 minutes (132 commuters, 19.4%) for females.
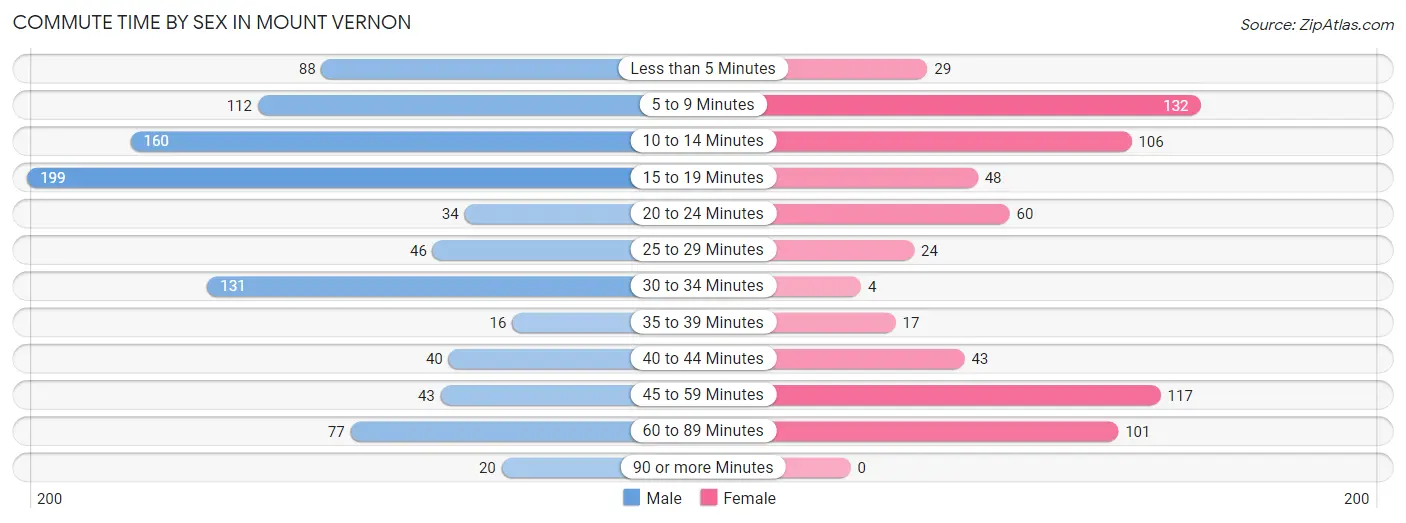
| Commute Time | Male | Female |
| Less than 5 Minutes | 88 (9.1%) | 29 (4.3%) |
| 5 to 9 Minutes | 112 (11.6%) | 132 (19.4%) |
| 10 to 14 Minutes | 160 (16.6%) | 106 (15.6%) |
| 15 to 19 Minutes | 199 (20.6%) | 48 (7.0%) |
| 20 to 24 Minutes | 34 (3.5%) | 60 (8.8%) |
| 25 to 29 Minutes | 46 (4.8%) | 24 (3.5%) |
| 30 to 34 Minutes | 131 (13.6%) | 4 (0.6%) |
| 35 to 39 Minutes | 16 (1.7%) | 17 (2.5%) |
| 40 to 44 Minutes | 40 (4.1%) | 43 (6.3%) |
| 45 to 59 Minutes | 43 (4.4%) | 117 (17.2%) |
| 60 to 89 Minutes | 77 (8.0%) | 101 (14.8%) |
| 90 or more Minutes | 20 (2.1%) | 0 (0.0%) |
Time of Departure to Work by Sex in Mount Vernon
The most frequent times of departure to work in Mount Vernon are 12:00 PM to 3:59 PM (158, 16.4%) for males and 7:00 AM to 7:29 AM (166, 24.4%) for females.
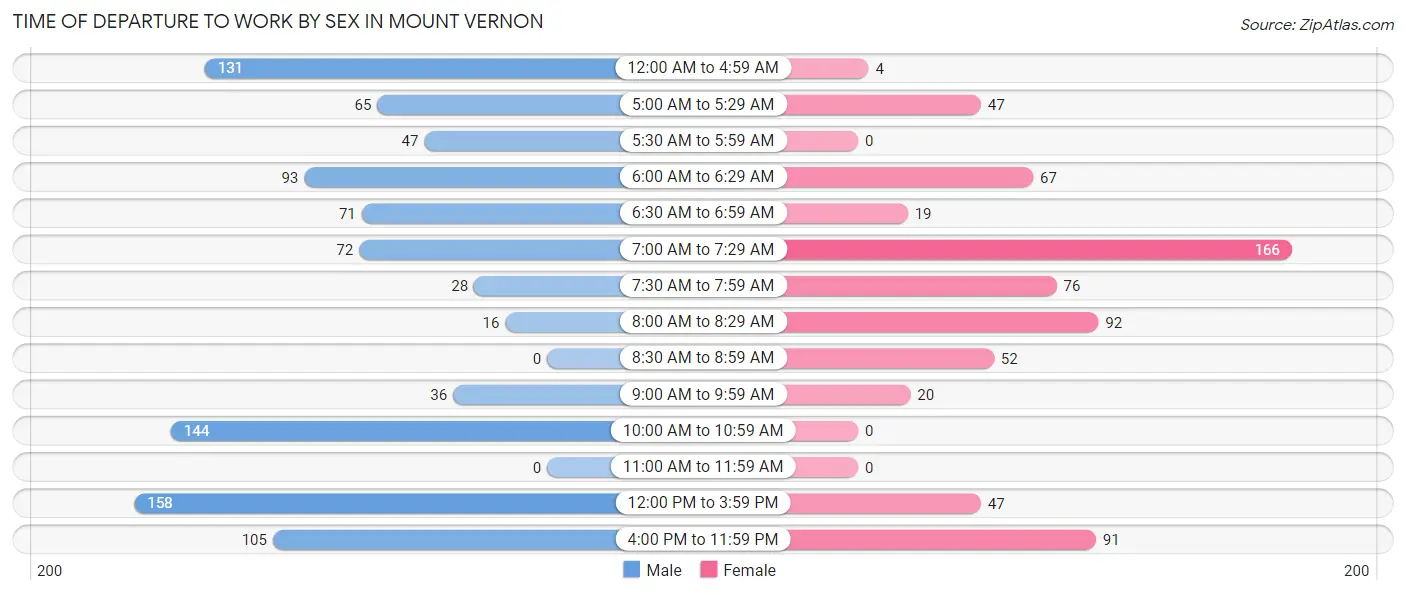
| Time of Departure | Male | Female |
| 12:00 AM to 4:59 AM | 131 (13.6%) | 4 (0.6%) |
| 5:00 AM to 5:29 AM | 65 (6.7%) | 47 (6.9%) |
| 5:30 AM to 5:59 AM | 47 (4.9%) | 0 (0.0%) |
| 6:00 AM to 6:29 AM | 93 (9.6%) | 67 (9.8%) |
| 6:30 AM to 6:59 AM | 71 (7.3%) | 19 (2.8%) |
| 7:00 AM to 7:29 AM | 72 (7.4%) | 166 (24.4%) |
| 7:30 AM to 7:59 AM | 28 (2.9%) | 76 (11.2%) |
| 8:00 AM to 8:29 AM | 16 (1.7%) | 92 (13.5%) |
| 8:30 AM to 8:59 AM | 0 (0.0%) | 52 (7.6%) |
| 9:00 AM to 9:59 AM | 36 (3.7%) | 20 (2.9%) |
| 10:00 AM to 10:59 AM | 144 (14.9%) | 0 (0.0%) |
| 11:00 AM to 11:59 AM | 0 (0.0%) | 0 (0.0%) |
| 12:00 PM to 3:59 PM | 158 (16.4%) | 47 (6.9%) |
| 4:00 PM to 11:59 PM | 105 (10.9%) | 91 (13.4%) |
| Total | 966 (100.0%) | 681 (100.0%) |
Housing Occupancy in Mount Vernon
Occupancy by Ownership in Mount Vernon
Of the total 1,773 dwellings in Mount Vernon, owner-occupied units account for 938 (52.9%), while renter-occupied units make up 835 (47.1%).
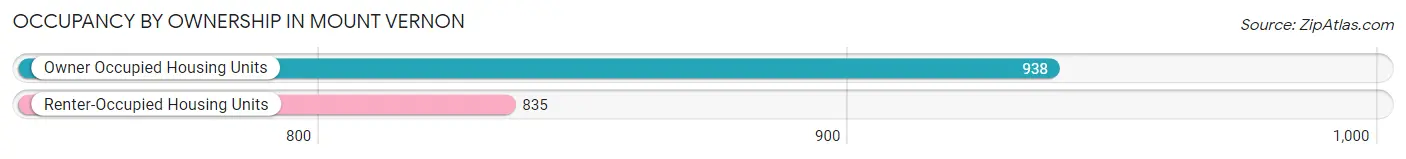
| Occupancy | # Housing Units | % Housing Units |
| Owner Occupied Housing Units | 938 | 52.9% |
| Renter-Occupied Housing Units | 835 | 47.1% |
| Total Occupied Housing Units | 1,773 | 100.0% |
Occupancy by Household Size in Mount Vernon
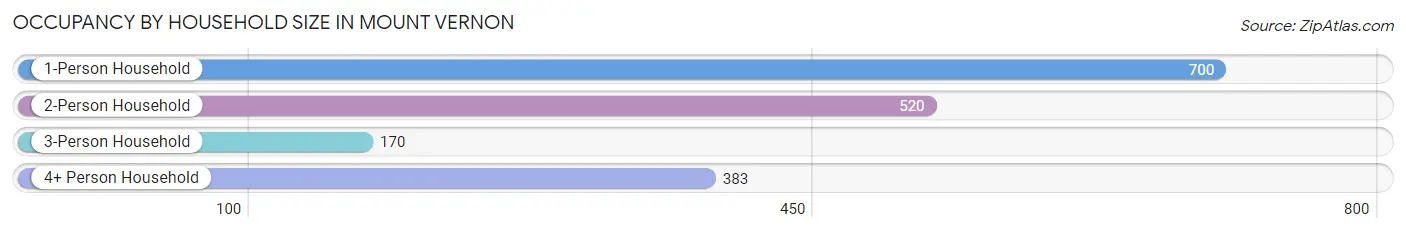
| Household Size | # Housing Units | % Housing Units |
| 1-Person Household | 700 | 39.5% |
| 2-Person Household | 520 | 29.3% |
| 3-Person Household | 170 | 9.6% |
| 4+ Person Household | 383 | 21.6% |
| Total Housing Units | 1,773 | 100.0% |
Occupancy by Ownership by Household Size in Mount Vernon
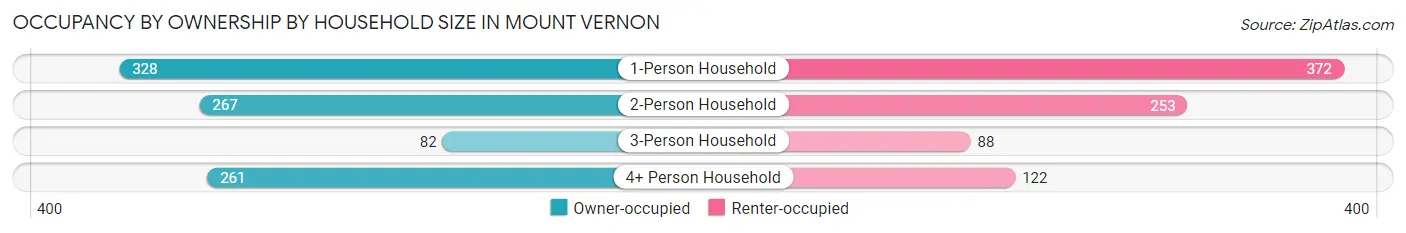
| Household Size | Owner-occupied | Renter-occupied |
| 1-Person Household | 328 (46.9%) | 372 (53.1%) |
| 2-Person Household | 267 (51.3%) | 253 (48.6%) |
| 3-Person Household | 82 (48.2%) | 88 (51.8%) |
| 4+ Person Household | 261 (68.1%) | 122 (31.9%) |
| Total Housing Units | 938 (52.9%) | 835 (47.1%) |
Occupancy by Educational Attainment in Mount Vernon
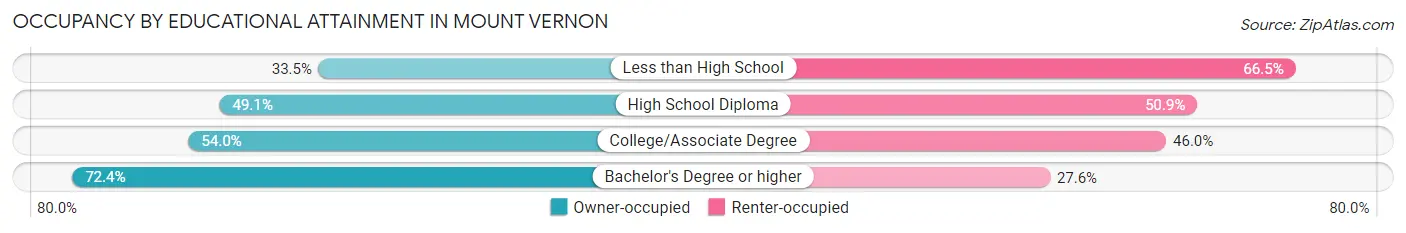
| Household Size | Owner-occupied | Renter-occupied |
| Less than High School | 69 (33.5%) | 137 (66.5%) |
| High School Diploma | 294 (49.1%) | 305 (50.9%) |
| College/Associate Degree | 370 (54.0%) | 315 (46.0%) |
| Bachelor's Degree or higher | 205 (72.4%) | 78 (27.6%) |
Occupancy by Age of Householder in Mount Vernon
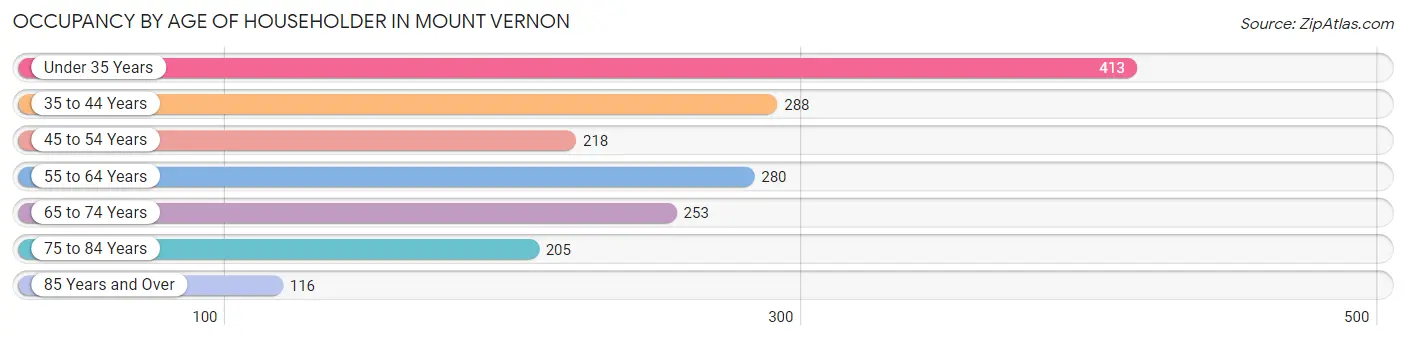
| Age Bracket | # Households | % Households |
| Under 35 Years | 413 | 23.3% |
| 35 to 44 Years | 288 | 16.2% |
| 45 to 54 Years | 218 | 12.3% |
| 55 to 64 Years | 280 | 15.8% |
| 65 to 74 Years | 253 | 14.3% |
| 75 to 84 Years | 205 | 11.6% |
| 85 Years and Over | 116 | 6.5% |
| Total | 1,773 | 100.0% |
Housing Finances in Mount Vernon
Median Income by Occupancy in Mount Vernon
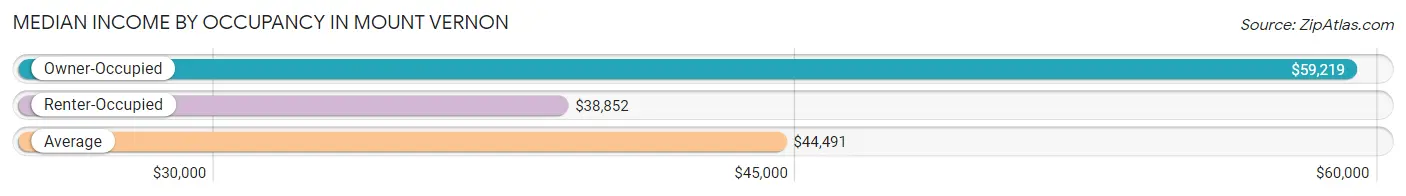
| Occupancy Type | # Households | Median Income |
| Owner-Occupied | 938 (52.9%) | $59,219 |
| Renter-Occupied | 835 (47.1%) | $38,852 |
| Average | 1,773 (100.0%) | $44,491 |
Occupancy by Householder Income Bracket in Mount Vernon
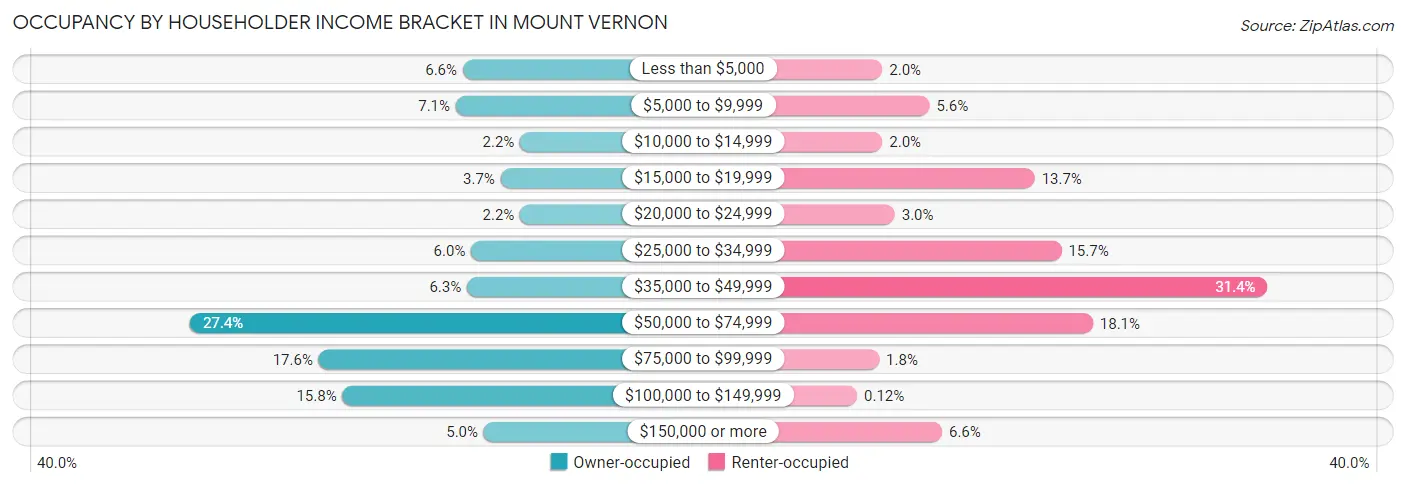
| Income Bracket | Owner-occupied | Renter-occupied |
| Less than $5,000 | 62 (6.6%) | 17 (2.0%) |
| $5,000 to $9,999 | 67 (7.1%) | 47 (5.6%) |
| $10,000 to $14,999 | 21 (2.2%) | 17 (2.0%) |
| $15,000 to $19,999 | 35 (3.7%) | 114 (13.7%) |
| $20,000 to $24,999 | 21 (2.2%) | 25 (3.0%) |
| $25,000 to $34,999 | 56 (6.0%) | 131 (15.7%) |
| $35,000 to $49,999 | 59 (6.3%) | 262 (31.4%) |
| $50,000 to $74,999 | 257 (27.4%) | 151 (18.1%) |
| $75,000 to $99,999 | 165 (17.6%) | 15 (1.8%) |
| $100,000 to $149,999 | 148 (15.8%) | 1 (0.1%) |
| $150,000 or more | 47 (5.0%) | 55 (6.6%) |
| Total | 938 (100.0%) | 835 (100.0%) |
Monthly Housing Cost Tiers in Mount Vernon
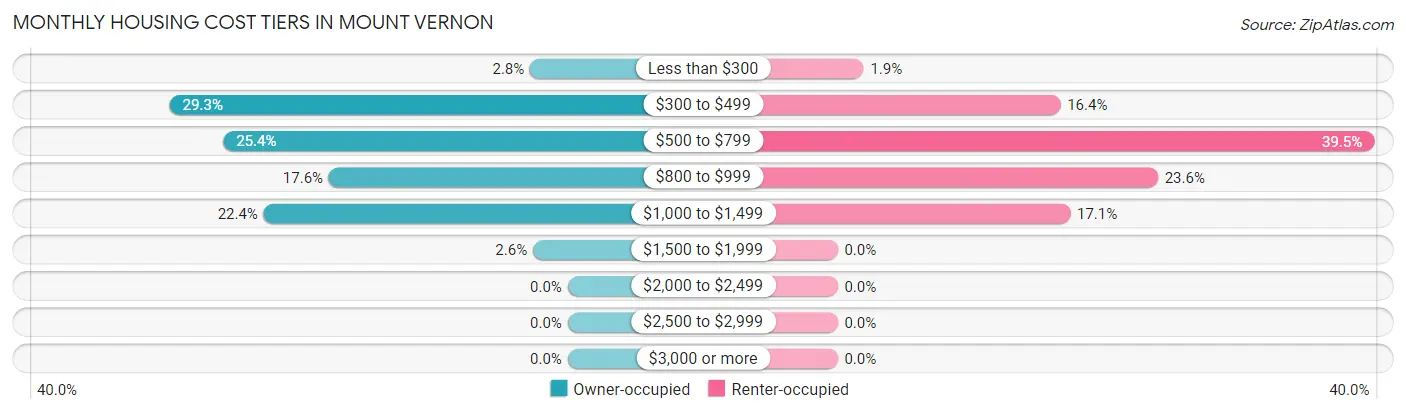
| Monthly Cost | Owner-occupied | Renter-occupied |
| Less than $300 | 26 (2.8%) | 16 (1.9%) |
| $300 to $499 | 275 (29.3%) | 137 (16.4%) |
| $500 to $799 | 238 (25.4%) | 330 (39.5%) |
| $800 to $999 | 165 (17.6%) | 197 (23.6%) |
| $1,000 to $1,499 | 210 (22.4%) | 143 (17.1%) |
| $1,500 to $1,999 | 24 (2.6%) | 0 (0.0%) |
| $2,000 to $2,499 | 0 (0.0%) | 0 (0.0%) |
| $2,500 to $2,999 | 0 (0.0%) | 0 (0.0%) |
| $3,000 or more | 0 (0.0%) | 0 (0.0%) |
| Total | 938 (100.0%) | 835 (100.0%) |
Physical Housing Characteristics in Mount Vernon
Housing Structures in Mount Vernon
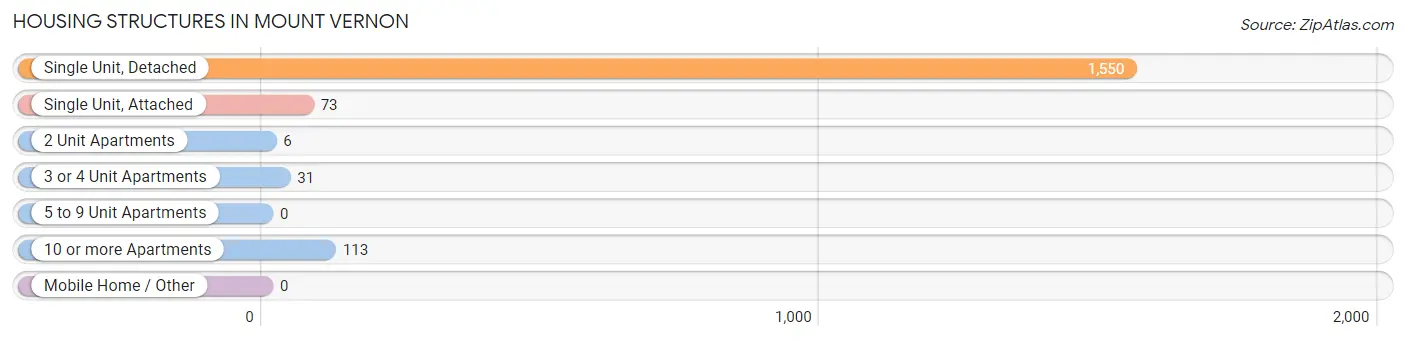
| Structure Type | # Housing Units | % Housing Units |
| Single Unit, Detached | 1,550 | 87.4% |
| Single Unit, Attached | 73 | 4.1% |
| 2 Unit Apartments | 6 | 0.3% |
| 3 or 4 Unit Apartments | 31 | 1.8% |
| 5 to 9 Unit Apartments | 0 | 0.0% |
| 10 or more Apartments | 113 | 6.4% |
| Mobile Home / Other | 0 | 0.0% |
| Total | 1,773 | 100.0% |
Housing Structures by Occupancy in Mount Vernon
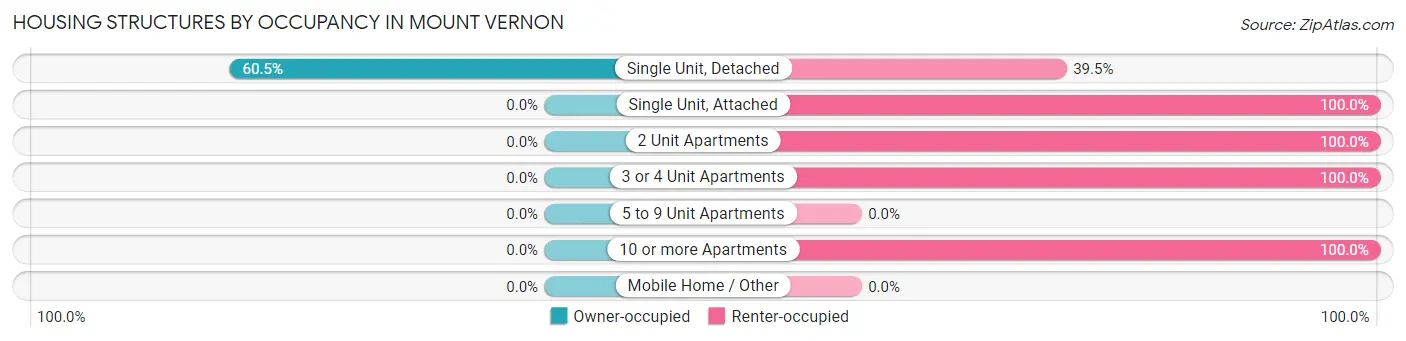
| Structure Type | Owner-occupied | Renter-occupied |
| Single Unit, Detached | 938 (60.5%) | 612 (39.5%) |
| Single Unit, Attached | 0 (0.0%) | 73 (100.0%) |
| 2 Unit Apartments | 0 (0.0%) | 6 (100.0%) |
| 3 or 4 Unit Apartments | 0 (0.0%) | 31 (100.0%) |
| 5 to 9 Unit Apartments | 0 (0.0%) | 0 (0.0%) |
| 10 or more Apartments | 0 (0.0%) | 113 (100.0%) |
| Mobile Home / Other | 0 (0.0%) | 0 (0.0%) |
| Total | 938 (52.9%) | 835 (47.1%) |
Housing Structures by Number of Rooms in Mount Vernon
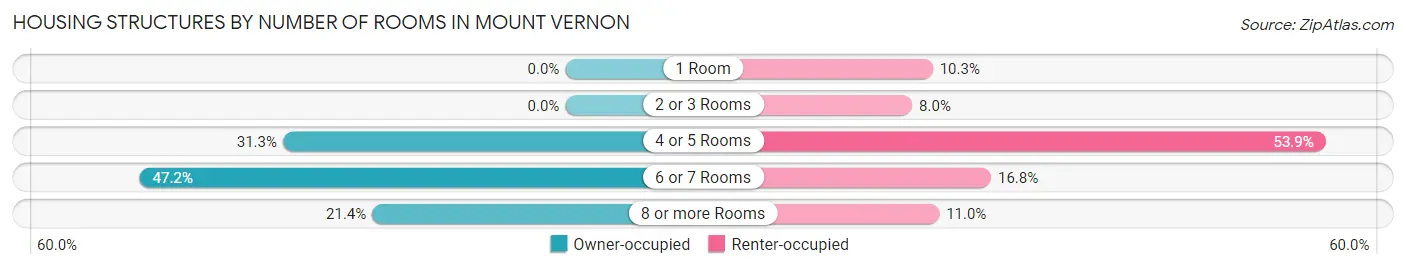
| Number of Rooms | Owner-occupied | Renter-occupied |
| 1 Room | 0 (0.0%) | 86 (10.3%) |
| 2 or 3 Rooms | 0 (0.0%) | 67 (8.0%) |
| 4 or 5 Rooms | 294 (31.3%) | 450 (53.9%) |
| 6 or 7 Rooms | 443 (47.2%) | 140 (16.8%) |
| 8 or more Rooms | 201 (21.4%) | 92 (11.0%) |
| Total | 938 (100.0%) | 835 (100.0%) |
Housing Structure by Heating Type in Mount Vernon
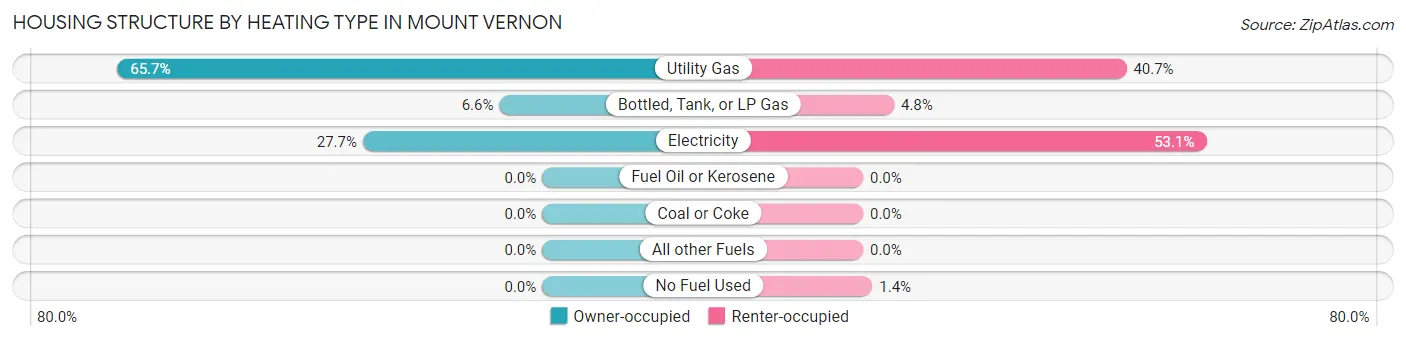
| Heating Type | Owner-occupied | Renter-occupied |
| Utility Gas | 616 (65.7%) | 340 (40.7%) |
| Bottled, Tank, or LP Gas | 62 (6.6%) | 40 (4.8%) |
| Electricity | 260 (27.7%) | 443 (53.0%) |
| Fuel Oil or Kerosene | 0 (0.0%) | 0 (0.0%) |
| Coal or Coke | 0 (0.0%) | 0 (0.0%) |
| All other Fuels | 0 (0.0%) | 0 (0.0%) |
| No Fuel Used | 0 (0.0%) | 12 (1.4%) |
| Total | 938 (100.0%) | 835 (100.0%) |
Household Vehicle Usage in Mount Vernon
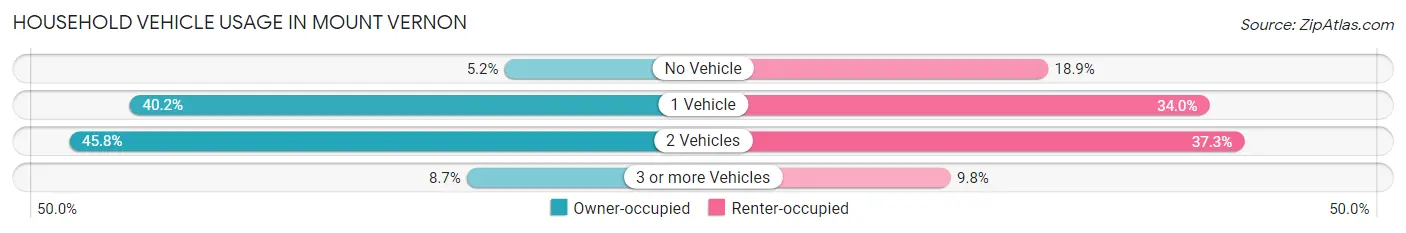
| Vehicles per Household | Owner-occupied | Renter-occupied |
| No Vehicle | 49 (5.2%) | 158 (18.9%) |
| 1 Vehicle | 377 (40.2%) | 284 (34.0%) |
| 2 Vehicles | 430 (45.8%) | 311 (37.2%) |
| 3 or more Vehicles | 82 (8.7%) | 82 (9.8%) |
| Total | 938 (100.0%) | 835 (100.0%) |
Real Estate & Mortgages in Mount Vernon
Real Estate and Mortgage Overview in Mount Vernon
| Characteristic | Without Mortgage | With Mortgage |
| Housing Units | 418 | 520 |
| Median Property Value | $190,500 | $126,600 |
| Median Household Income | - | - |
| Monthly Housing Costs | $446 | $0 |
| Real Estate Taxes | $966 | $33 |
Property Value by Mortgage Status in Mount Vernon
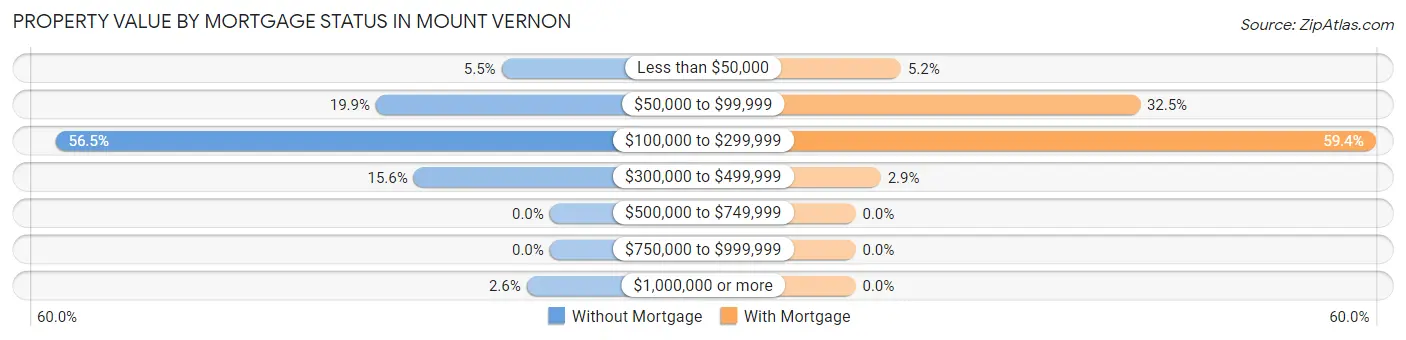
| Property Value | Without Mortgage | With Mortgage |
| Less than $50,000 | 23 (5.5%) | 27 (5.2%) |
| $50,000 to $99,999 | 83 (19.9%) | 169 (32.5%) |
| $100,000 to $299,999 | 236 (56.5%) | 309 (59.4%) |
| $300,000 to $499,999 | 65 (15.5%) | 15 (2.9%) |
| $500,000 to $749,999 | 0 (0.0%) | 0 (0.0%) |
| $750,000 to $999,999 | 0 (0.0%) | 0 (0.0%) |
| $1,000,000 or more | 11 (2.6%) | 0 (0.0%) |
| Total | 418 (100.0%) | 520 (100.0%) |
Household Income by Mortgage Status in Mount Vernon
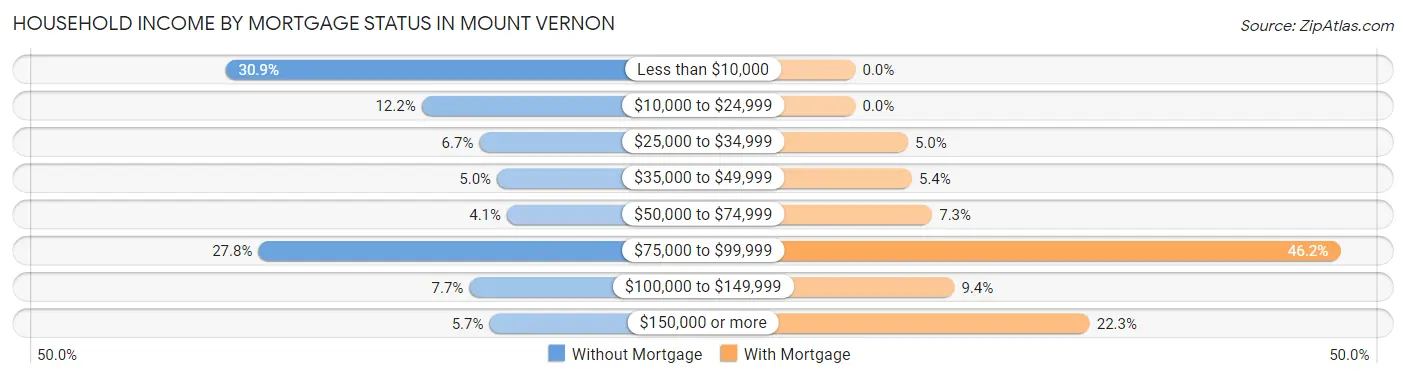
| Household Income | Without Mortgage | With Mortgage |
| Less than $10,000 | 129 (30.9%) | 0 (0.0%) |
| $10,000 to $24,999 | 51 (12.2%) | 0 (0.0%) |
| $25,000 to $34,999 | 28 (6.7%) | 26 (5.0%) |
| $35,000 to $49,999 | 21 (5.0%) | 28 (5.4%) |
| $50,000 to $74,999 | 17 (4.1%) | 38 (7.3%) |
| $75,000 to $99,999 | 116 (27.8%) | 240 (46.2%) |
| $100,000 to $149,999 | 32 (7.7%) | 49 (9.4%) |
| $150,000 or more | 24 (5.7%) | 116 (22.3%) |
| Total | 418 (100.0%) | 520 (100.0%) |
Property Value to Household Income Ratio in Mount Vernon
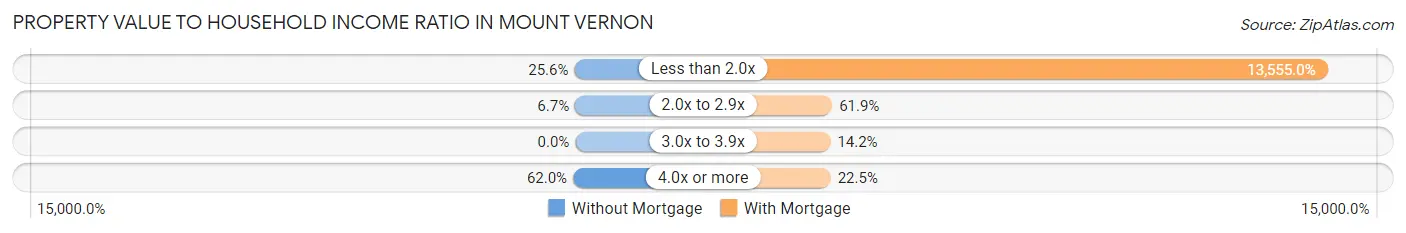
| Value-to-Income Ratio | Without Mortgage | With Mortgage |
| Less than 2.0x | 107 (25.6%) | 70,486 (13,555.0%) |
| 2.0x to 2.9x | 28 (6.7%) | 322 (61.9%) |
| 3.0x to 3.9x | 0 (0.0%) | 74 (14.2%) |
| 4.0x or more | 259 (62.0%) | 117 (22.5%) |
| Total | 418 (100.0%) | 520 (100.0%) |
Real Estate Taxes by Mortgage Status in Mount Vernon
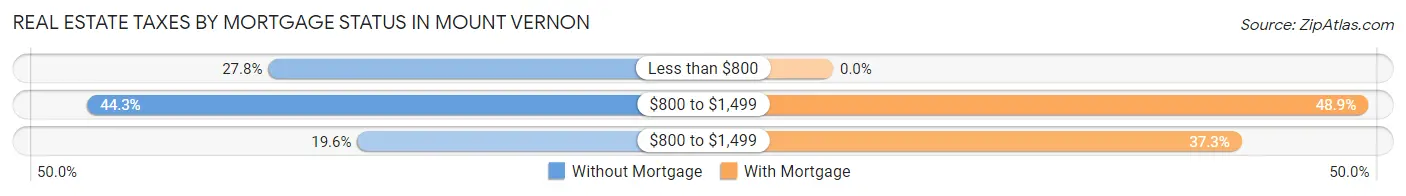
| Property Taxes | Without Mortgage | With Mortgage |
| Less than $800 | 116 (27.8%) | 0 (0.0%) |
| $800 to $1,499 | 185 (44.3%) | 254 (48.8%) |
| $800 to $1,499 | 82 (19.6%) | 194 (37.3%) |
| Total | 418 (100.0%) | 520 (100.0%) |
Health & Disability in Mount Vernon
Health Insurance Coverage by Age in Mount Vernon
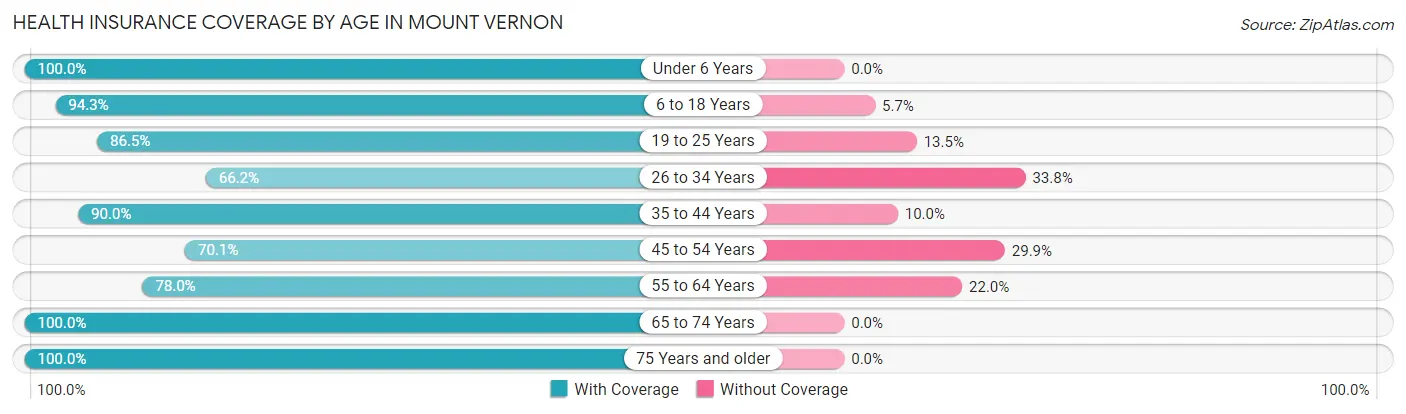
| Age Bracket | With Coverage | Without Coverage |
| Under 6 Years | 159 (100.0%) | 0 (0.0%) |
| 6 to 18 Years | 870 (94.3%) | 53 (5.7%) |
| 19 to 25 Years | 160 (86.5%) | 25 (13.5%) |
| 26 to 34 Years | 439 (66.2%) | 224 (33.8%) |
| 35 to 44 Years | 542 (90.0%) | 60 (10.0%) |
| 45 to 54 Years | 337 (70.1%) | 144 (29.9%) |
| 55 to 64 Years | 277 (78.0%) | 78 (22.0%) |
| 65 to 74 Years | 360 (100.0%) | 0 (0.0%) |
| 75 Years and older | 374 (100.0%) | 0 (0.0%) |
| Total | 3,518 (85.8%) | 584 (14.2%) |
Health Insurance Coverage by Citizenship Status in Mount Vernon
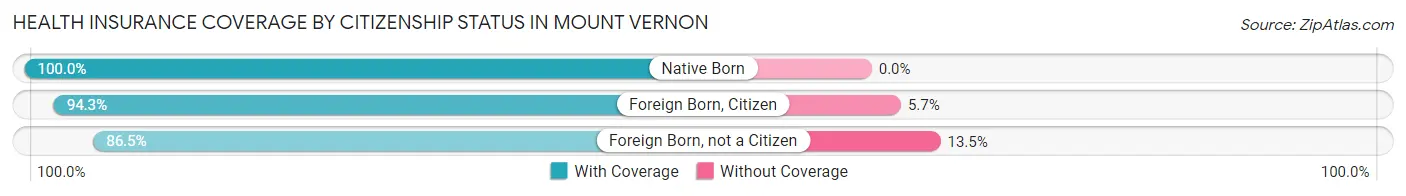
| Citizenship Status | With Coverage | Without Coverage |
| Native Born | 159 (100.0%) | 0 (0.0%) |
| Foreign Born, Citizen | 870 (94.3%) | 53 (5.7%) |
| Foreign Born, not a Citizen | 160 (86.5%) | 25 (13.5%) |
Health Insurance Coverage by Household Income in Mount Vernon
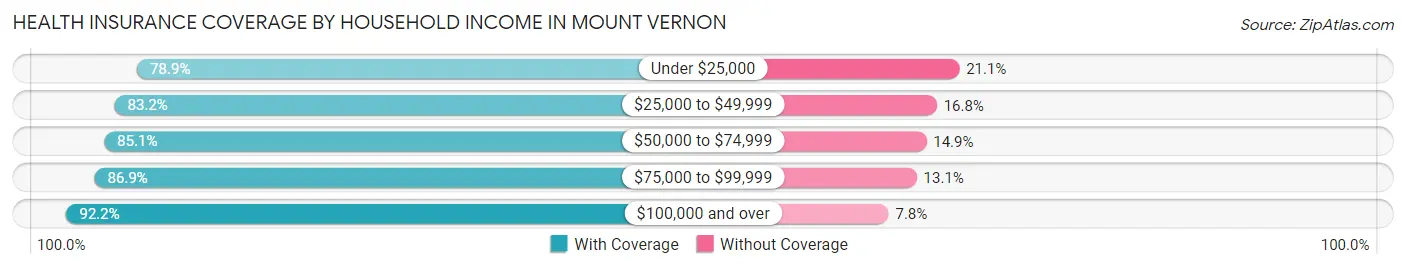
| Household Income | With Coverage | Without Coverage |
| Under $25,000 | 431 (78.9%) | 115 (21.1%) |
| $25,000 to $49,999 | 810 (83.2%) | 164 (16.8%) |
| $50,000 to $74,999 | 982 (85.1%) | 172 (14.9%) |
| $75,000 to $99,999 | 352 (86.9%) | 53 (13.1%) |
| $100,000 and over | 943 (92.2%) | 80 (7.8%) |
Public vs Private Health Insurance Coverage by Age in Mount Vernon
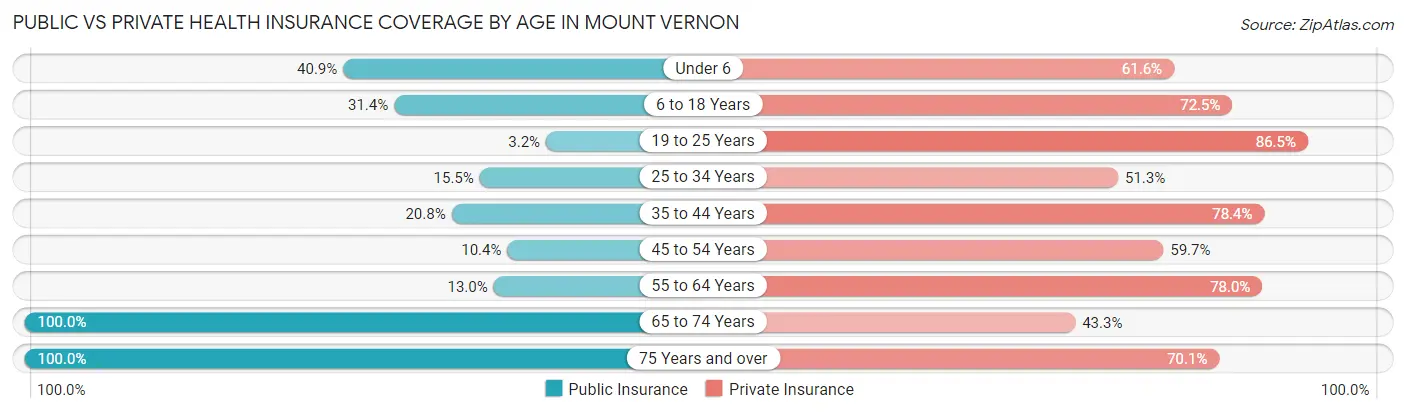
| Age Bracket | Public Insurance | Private Insurance |
| Under 6 | 65 (40.9%) | 98 (61.6%) |
| 6 to 18 Years | 290 (31.4%) | 669 (72.5%) |
| 19 to 25 Years | 6 (3.2%) | 160 (86.5%) |
| 25 to 34 Years | 103 (15.5%) | 340 (51.3%) |
| 35 to 44 Years | 125 (20.8%) | 472 (78.4%) |
| 45 to 54 Years | 50 (10.4%) | 287 (59.7%) |
| 55 to 64 Years | 46 (13.0%) | 277 (78.0%) |
| 65 to 74 Years | 360 (100.0%) | 156 (43.3%) |
| 75 Years and over | 374 (100.0%) | 262 (70.1%) |
| Total | 1,419 (34.6%) | 2,721 (66.3%) |
Disability Status by Sex by Age in Mount Vernon
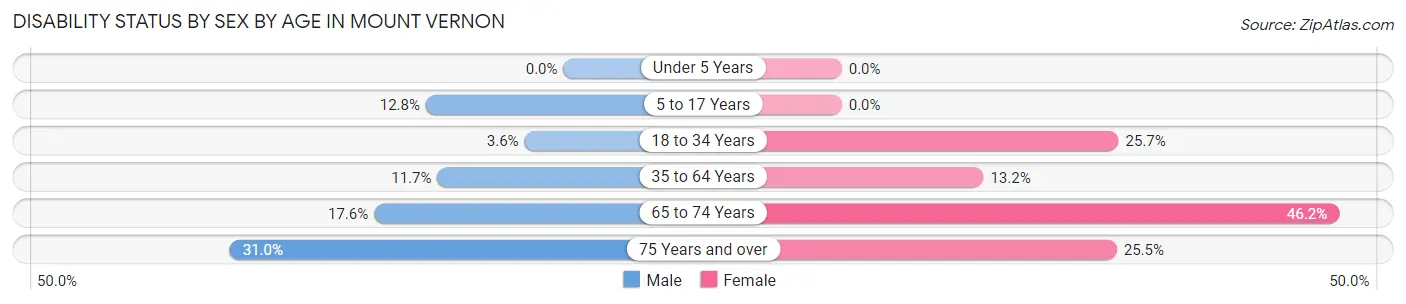
| Age Bracket | Male | Female |
| Under 5 Years | 0 (0.0%) | 0 (0.0%) |
| 5 to 17 Years | 78 (12.8%) | 0 (0.0%) |
| 18 to 34 Years | 16 (3.6%) | 121 (25.7%) |
| 35 to 64 Years | 90 (11.7%) | 88 (13.2%) |
| 65 to 74 Years | 13 (17.6%) | 132 (46.2%) |
| 75 Years and over | 26 (30.9%) | 74 (25.5%) |
Disability Class by Sex by Age in Mount Vernon
Disability Class: Hearing Difficulty
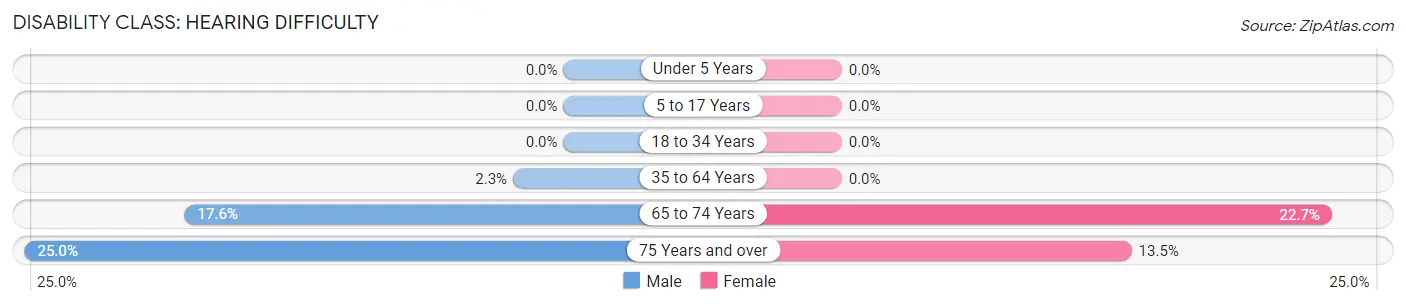
| Age Bracket | Male | Female |
| Under 5 Years | 0 (0.0%) | 0 (0.0%) |
| 5 to 17 Years | 0 (0.0%) | 0 (0.0%) |
| 18 to 34 Years | 0 (0.0%) | 0 (0.0%) |
| 35 to 64 Years | 18 (2.3%) | 0 (0.0%) |
| 65 to 74 Years | 13 (17.6%) | 65 (22.7%) |
| 75 Years and over | 21 (25.0%) | 39 (13.5%) |
Disability Class: Vision Difficulty
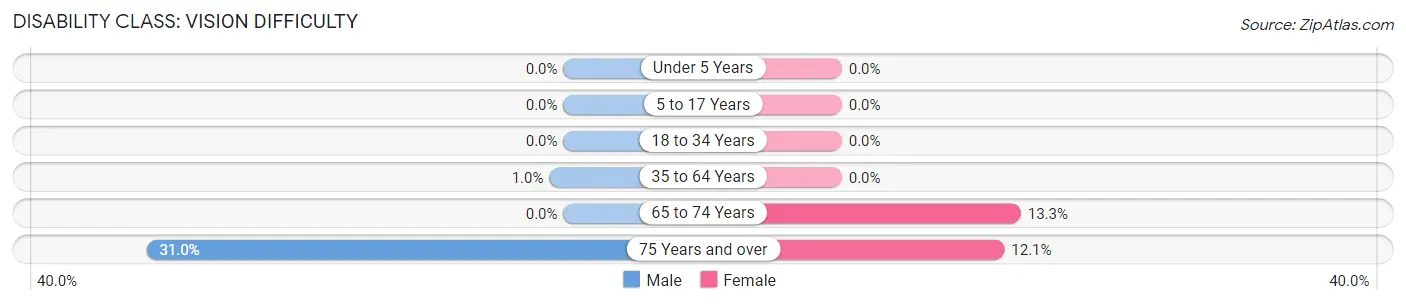
| Age Bracket | Male | Female |
| Under 5 Years | 0 (0.0%) | 0 (0.0%) |
| 5 to 17 Years | 0 (0.0%) | 0 (0.0%) |
| 18 to 34 Years | 0 (0.0%) | 0 (0.0%) |
| 35 to 64 Years | 8 (1.0%) | 0 (0.0%) |
| 65 to 74 Years | 0 (0.0%) | 38 (13.3%) |
| 75 Years and over | 26 (30.9%) | 35 (12.1%) |
Disability Class: Cognitive Difficulty
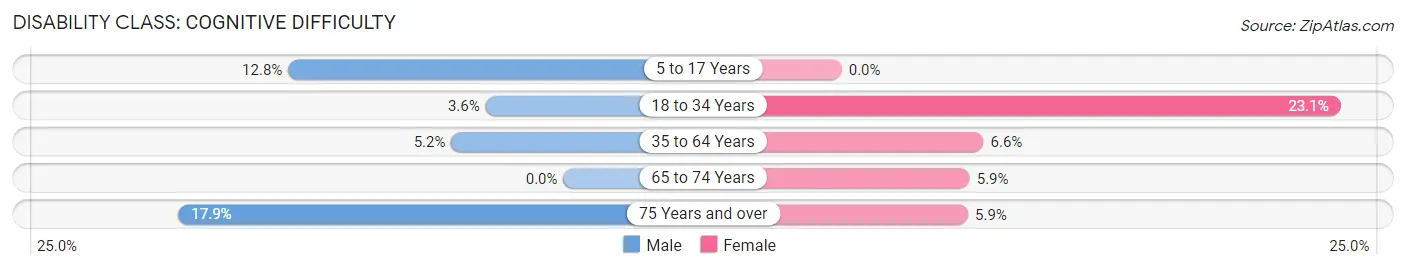
| Age Bracket | Male | Female |
| 5 to 17 Years | 78 (12.8%) | 0 (0.0%) |
| 18 to 34 Years | 16 (3.6%) | 109 (23.1%) |
| 35 to 64 Years | 40 (5.2%) | 44 (6.6%) |
| 65 to 74 Years | 0 (0.0%) | 17 (5.9%) |
| 75 Years and over | 15 (17.9%) | 17 (5.9%) |
Disability Class: Ambulatory Difficulty
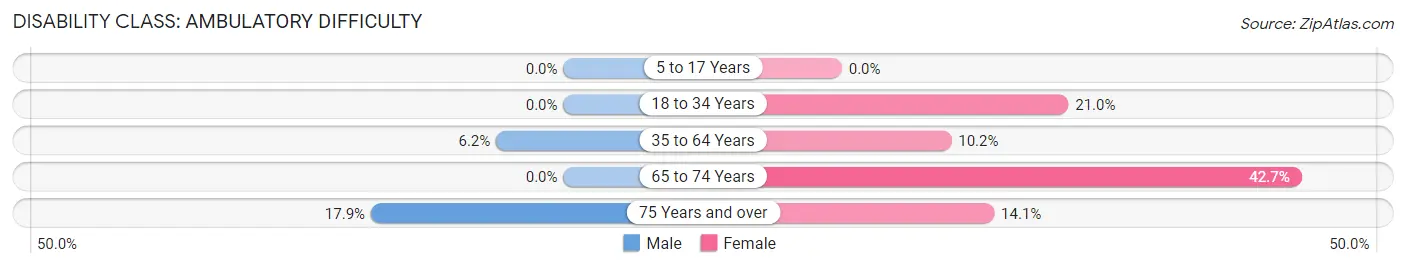
| Age Bracket | Male | Female |
| 5 to 17 Years | 0 (0.0%) | 0 (0.0%) |
| 18 to 34 Years | 0 (0.0%) | 99 (21.0%) |
| 35 to 64 Years | 48 (6.2%) | 68 (10.2%) |
| 65 to 74 Years | 0 (0.0%) | 122 (42.7%) |
| 75 Years and over | 15 (17.9%) | 41 (14.1%) |
Disability Class: Self-Care Difficulty
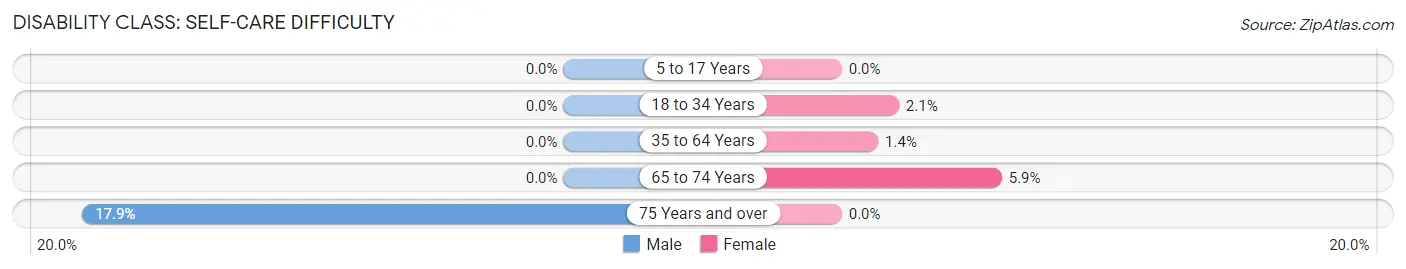
| Age Bracket | Male | Female |
| 5 to 17 Years | 0 (0.0%) | 0 (0.0%) |
| 18 to 34 Years | 0 (0.0%) | 10 (2.1%) |
| 35 to 64 Years | 0 (0.0%) | 9 (1.3%) |
| 65 to 74 Years | 0 (0.0%) | 17 (5.9%) |
| 75 Years and over | 15 (17.9%) | 0 (0.0%) |
Technology Access in Mount Vernon
Computing Device Access in Mount Vernon
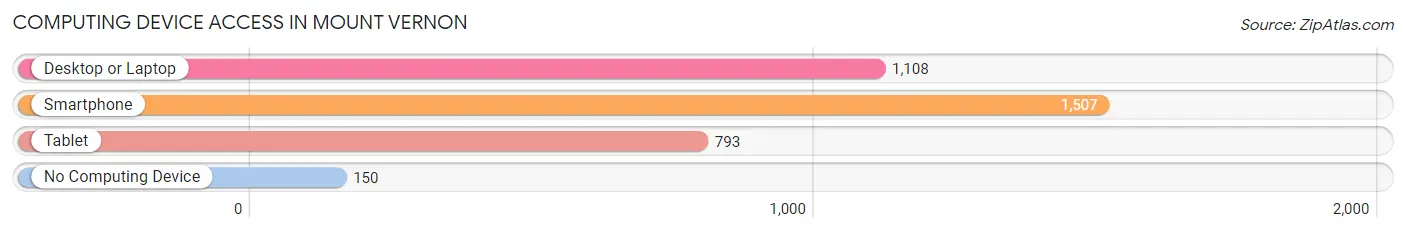
| Device Type | # Households | % Households |
| Desktop or Laptop | 1,108 | 62.5% |
| Smartphone | 1,507 | 85.0% |
| Tablet | 793 | 44.7% |
| No Computing Device | 150 | 8.5% |
| Total | 1,773 | 100.0% |
Internet Access in Mount Vernon
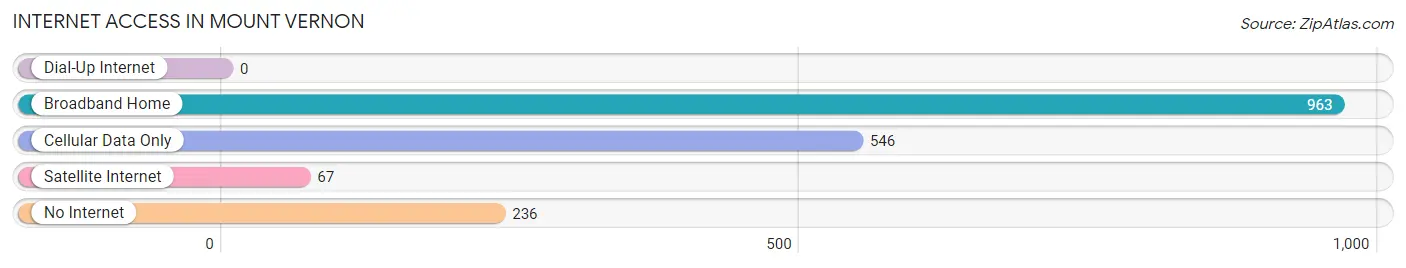
| Internet Type | # Households | % Households |
| Dial-Up Internet | 0 | 0.0% |
| Broadband Home | 963 | 54.3% |
| Cellular Data Only | 546 | 30.8% |
| Satellite Internet | 67 | 3.8% |
| No Internet | 236 | 13.3% |
| Total | 1,773 | 100.0% |
Mount Vernon Summary
Introduction
Mount Vernon, Missouri is a small city located in Lawrence County, Missouri. It is the county seat of Lawrence County and is located in the Ozark Mountains. The city has a population of 4,711 according to the 2010 census. The city is known for its historic downtown area, which is listed on the National Register of Historic Places. The city is also home to several parks, museums, and other attractions.
History
Mount Vernon was founded in 1845 by a group of settlers from Kentucky. The city was named after George Washington's home, Mount Vernon. The city was incorporated in 1859 and was the county seat of Lawrence County. The city was a major stop on the Butterfield Overland Mail route and was a major trading center for the area.
In the late 19th century, the city was a major center for the timber industry. The city was also home to several coal mines. The city was also home to several manufacturing plants, including a glass factory and a furniture factory.
The city was also home to several educational institutions, including the Mount Vernon Normal School, which was founded in 1887. The school was later renamed the Southwest Missouri State Teachers College and is now known as Missouri State University.
Geography
Mount Vernon is located in the Ozark Mountains in southwestern Missouri. The city is located at the intersection of U.S. Route 60 and Missouri Route 39. The city is located about 30 miles south of Springfield, Missouri and about 60 miles north of Fayetteville, Arkansas.
The city is located in a hilly area and is surrounded by several small lakes and streams. The city is located in a temperate climate and has four distinct seasons. The average temperature in the summer is around 80 degrees Fahrenheit and the average temperature in the winter is around 40 degrees Fahrenheit.
Economy
The economy of Mount Vernon is largely based on agriculture and tourism. The city is home to several farms and ranches, which produce a variety of crops, including corn, soybeans, wheat, and hay. The city is also home to several wineries and vineyards, which produce a variety of wines.
The city is also home to several manufacturing plants, including a glass factory and a furniture factory. The city is also home to several retail stores, restaurants, and other businesses.
Demographics
According to the 2010 census, the population of Mount Vernon was 4,711. The racial makeup of the city was 95.3% White, 0.7% African American, 0.3% Native American, 0.3% Asian, 0.1% Pacific Islander, 1.2% from other races, and 2.3% from two or more races. Hispanic or Latino of any race were 3.2% of the population.
The median household income in the city was $35,938 and the median family income was $41,944. The per capita income in the city was $17,945. About 16.2% of the population was below the poverty line.
Conclusion
Mount Vernon, Missouri is a small city located in Lawrence County, Missouri. The city has a population of 4,711 according to the 2010 census. The city is known for its historic downtown area, which is listed on the National Register of Historic Places. The economy of the city is largely based on agriculture and tourism. The racial makeup of the city was 95.3% White, 0.7% African American, 0.3% Native American, 0.3% Asian, 0.1% Pacific Islander, 1.2% from other races, and 2.3% from two or more races. The median household income in the city was $35,938 and the median family income was $41,944. The per capita income in the city was $17,945. About 16.2% of the population was below the poverty line.
Common Questions
What is Per Capita Income in Mount Vernon?
Per Capita income in Mount Vernon is $24,853.
What is the Median Family Income in Mount Vernon?
Median Family Income in Mount Vernon is $59,648.
What is the Median Household income in Mount Vernon?
Median Household Income in Mount Vernon is $44,491.
What is Income or Wage Gap in Mount Vernon?
Income or Wage Gap in Mount Vernon is 43.9%.
Women in Mount Vernon earn 56.1 cents for every dollar earned by a man.
What is Inequality or Gini Index in Mount Vernon?
Inequality or Gini Index in Mount Vernon is 0.45.
What is the Total Population of Mount Vernon?
Total Population of Mount Vernon is 4,511.
What is the Total Male Population of Mount Vernon?
Total Male Population of Mount Vernon is 2,355.
What is the Total Female Population of Mount Vernon?
Total Female Population of Mount Vernon is 2,156.
What is the Ratio of Males per 100 Females in Mount Vernon?
There are 109.23 Males per 100 Females in Mount Vernon.
What is the Ratio of Females per 100 Males in Mount Vernon?
There are 91.55 Females per 100 Males in Mount Vernon.
What is the Median Population Age in Mount Vernon?
Median Population Age in Mount Vernon is 37.3 Years.
What is the Average Family Size in Mount Vernon
Average Family Size in Mount Vernon is 3.4 People.
What is the Average Household Size in Mount Vernon
Average Household Size in Mount Vernon is 2.3 People.
How Large is the Labor Force in Mount Vernon?
There are 1,859 People in the Labor Forcein in Mount Vernon.
What is the Percentage of People in the Labor Force in Mount Vernon?
52.3% of People are in the Labor Force in Mount Vernon.
What is the Unemployment Rate in Mount Vernon?
Unemployment Rate in Mount Vernon is 1.7%.