Area Code 601 Map & Demographics
Area Code 601 Map
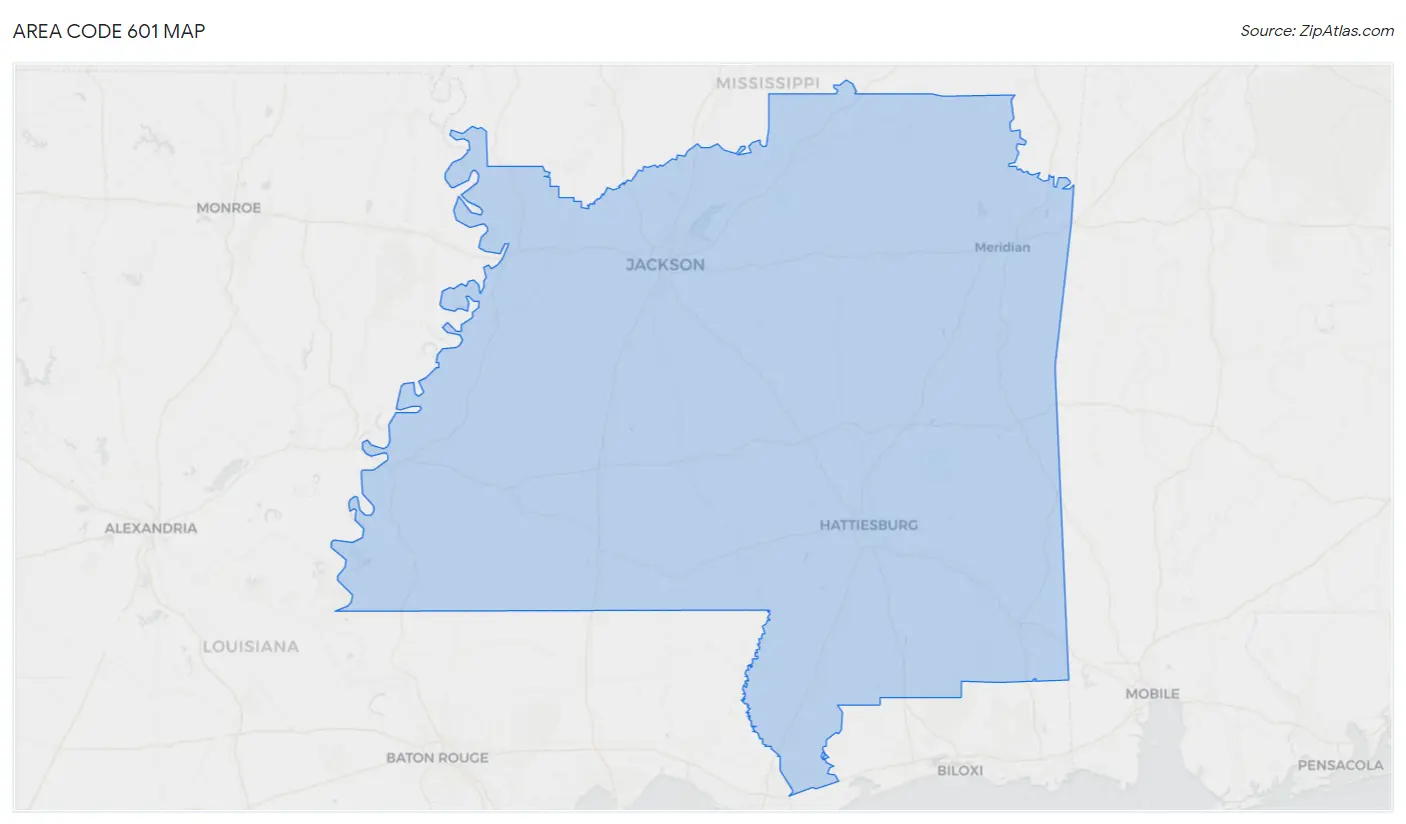
Area Code 601 Overview
$25,881
PER CAPITA INCOME
$64,698
AVG FAMILY INCOME
$49,658
AVG HOUSEHOLD INCOME
33.4%
WAGE / INCOME GAP [ % ]
66.6¢/ $1
WAGE / INCOME GAP [ $ ]
$11,619
FAMILY INCOME DEFICIT
69.67
INEQUALITY / GINI INDEX
1,396,444
TOTAL POPULATION
674,565
MALE POPULATION
721,879
FEMALE POPULATION
93.45
MALES / 100 FEMALES
107.01
FEMALES / 100 MALES
39.4
MEDIAN AGE
3.2
AVG FAMILY SIZE
2.6
AVG HOUSEHOLD SIZE
584,584
LABOR FORCE [ PEOPLE ]
52.8%
PERCENT IN LABOR FORCE
7.0%
UNEMPLOYMENT RATE
Income in Area Code 601
Income Overview in Area Code 601
Per Capita Income in Area Code 601 is $25,881, while median incomes of families and households are $64,698 and $49,658 respectively.
| Characteristic | Number | Measure |
| Per Capita Income | 1,396,444 | $25,881 |
| Median Family Income | 348,752 | $64,698 |
| Mean Family Income | 348,752 | $12,210,891 |
| Median Household Income | 528,542 | $49,658 |
| Mean Household Income | 528,542 | $10,258,680 |
| Income Deficit | 348,752 | $11,619 |
| Wage / Income Gap (%) | 1,396,444 | 33.40% |
| Wage / Income Gap ($) | 1,396,444 | 66.60¢ per $1 |
| Gini / Inequality Index | 1,396,444 | 69.67 |
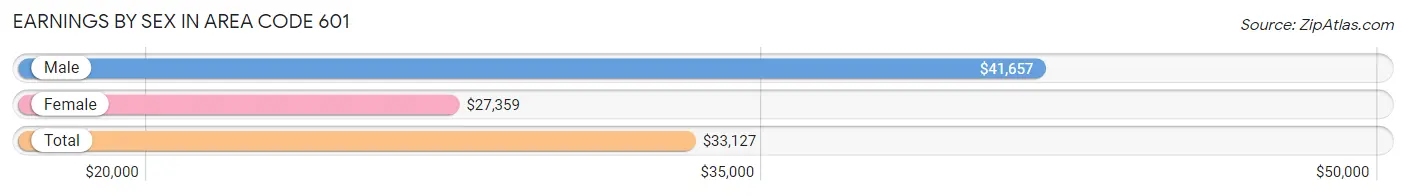
Earnings by Sex in Area Code 601
Average Earnings in Area Code 601 are $33,127, $41,657 for men and $27,359 for women, a difference of 34.3%.
| Sex | Number | Average Earnings |
| Male | 331,759 (50.6%) | $41,657 |
| Female | 323,486 (49.4%) | $27,359 |
| Total | 655,245 (100.0%) | $33,127 |
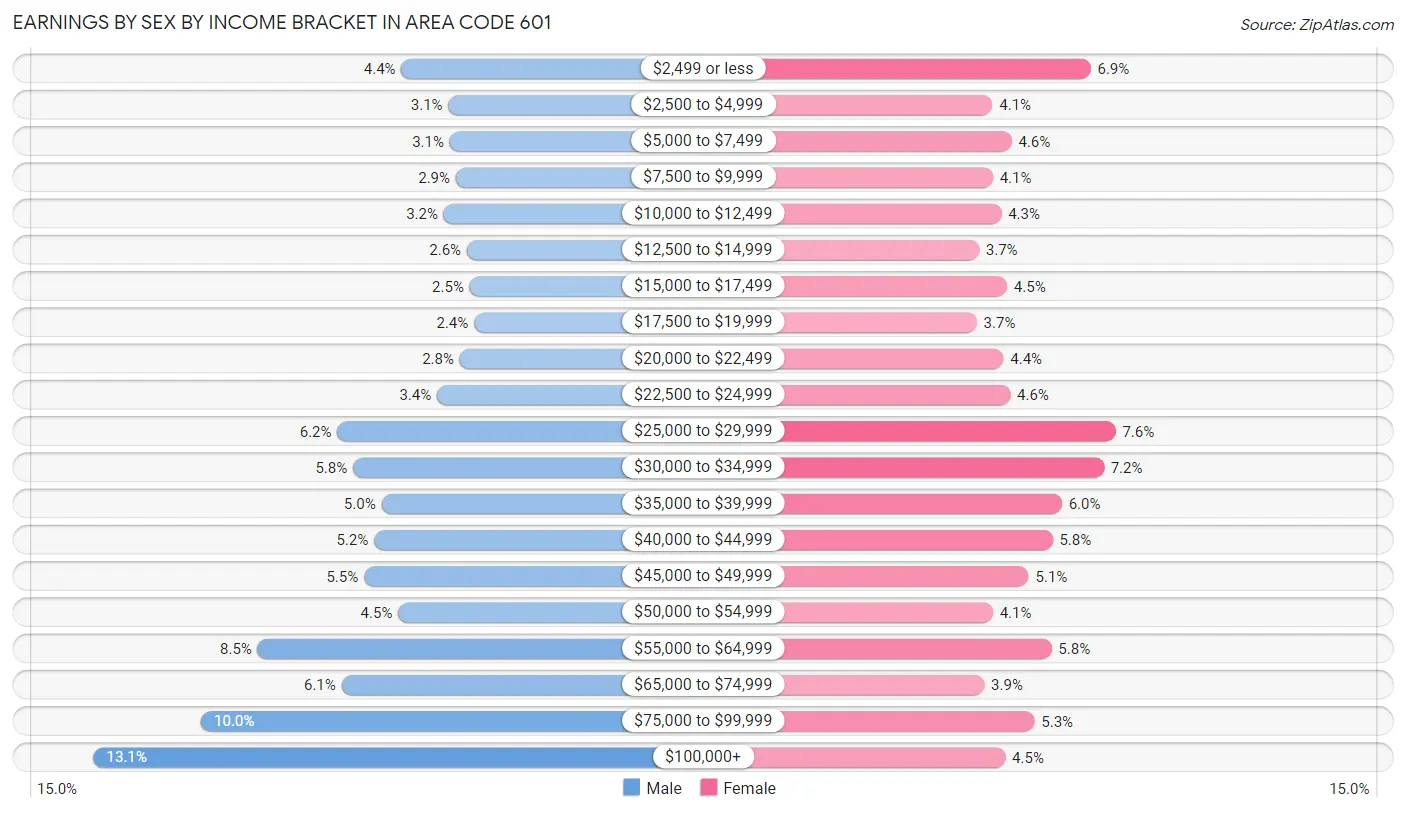
Earnings by Sex by Income Bracket in Area Code 601
The most common earnings brackets in Area Code 601 are $100,000+ for men (43,321 | 13.1%) and $25,000 to $29,999 for women (24,416 | 7.5%).
| Income | Male | Female |
| $2,499 or less | 14,627 (4.4%) | 22,171 (6.9%) |
| $2,500 to $4,999 | 10,264 (3.1%) | 13,234 (4.1%) |
| $5,000 to $7,499 | 10,133 (3.0%) | 14,983 (4.6%) |
| $7,500 to $9,999 | 9,541 (2.9%) | 13,261 (4.1%) |
| $10,000 to $12,499 | 10,675 (3.2%) | 14,044 (4.3%) |
| $12,500 to $14,999 | 8,538 (2.6%) | 12,002 (3.7%) |
| $15,000 to $17,499 | 8,259 (2.5%) | 14,565 (4.5%) |
| $17,500 to $19,999 | 7,875 (2.4%) | 11,818 (3.6%) |
| $20,000 to $22,499 | 9,176 (2.8%) | 14,222 (4.4%) |
| $22,500 to $24,999 | 11,321 (3.4%) | 14,840 (4.6%) |
| $25,000 to $29,999 | 20,590 (6.2%) | 24,416 (7.5%) |
| $30,000 to $34,999 | 19,137 (5.8%) | 23,353 (7.2%) |
| $35,000 to $39,999 | 16,491 (5.0%) | 19,542 (6.0%) |
| $40,000 to $44,999 | 17,170 (5.2%) | 18,710 (5.8%) |
| $45,000 to $49,999 | 18,129 (5.5%) | 16,518 (5.1%) |
| $50,000 to $54,999 | 14,944 (4.5%) | 13,272 (4.1%) |
| $55,000 to $64,999 | 28,039 (8.5%) | 18,595 (5.8%) |
| $65,000 to $74,999 | 20,214 (6.1%) | 12,501 (3.9%) |
| $75,000 to $99,999 | 33,315 (10.0%) | 17,038 (5.3%) |
| $100,000+ | 43,321 (13.1%) | 14,401 (4.4%) |
| Total | 331,759 (100.0%) | 323,486 (100.0%) |
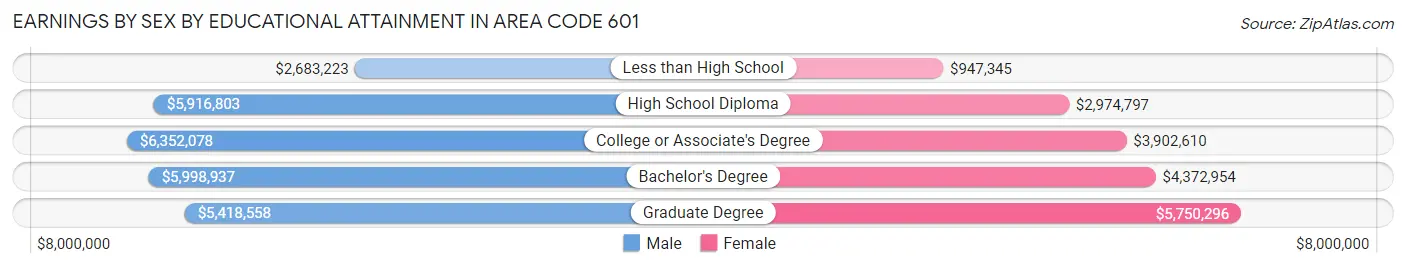
Earnings by Sex by Educational Attainment in Area Code 601
Average earnings in Area Code 601 are $6,832,991 for men and $4,511,781 for women, a difference of 34.0%. Men with an educational attainment of college or associate's degree enjoy the highest average annual earnings of $6,352,078, while those with less than high school education earn the least with $2,683,223. Women with an educational attainment of graduate degree earn the most with the average annual earnings of $5,750,296, while those with less than high school education have the smallest earnings of $947,345.
| Educational Attainment | Male Income | Female Income |
| Less than High School | $2,683,223 | $947,345 |
| High School Diploma | $5,916,803 | $2,974,797 |
| College or Associate's Degree | $6,352,078 | $3,902,610 |
| Bachelor's Degree | $5,998,937 | $4,372,954 |
| Graduate Degree | $5,418,558 | $5,750,296 |
| Total | $6,832,991 | $4,511,781 |
Family Income in Area Code 601
Family Income Brackets in Area Code 601
According to the Area Code 601 family income data, there are 10,791,084 families falling into the $50,000 to $74,999 income range, which is the most common income bracket and makes up 3,094.2% of all families. Conversely, the $10,000 to $14,999 income bracket is the least frequent group with only 2,430,801 families (697.0%) belonging to this category.
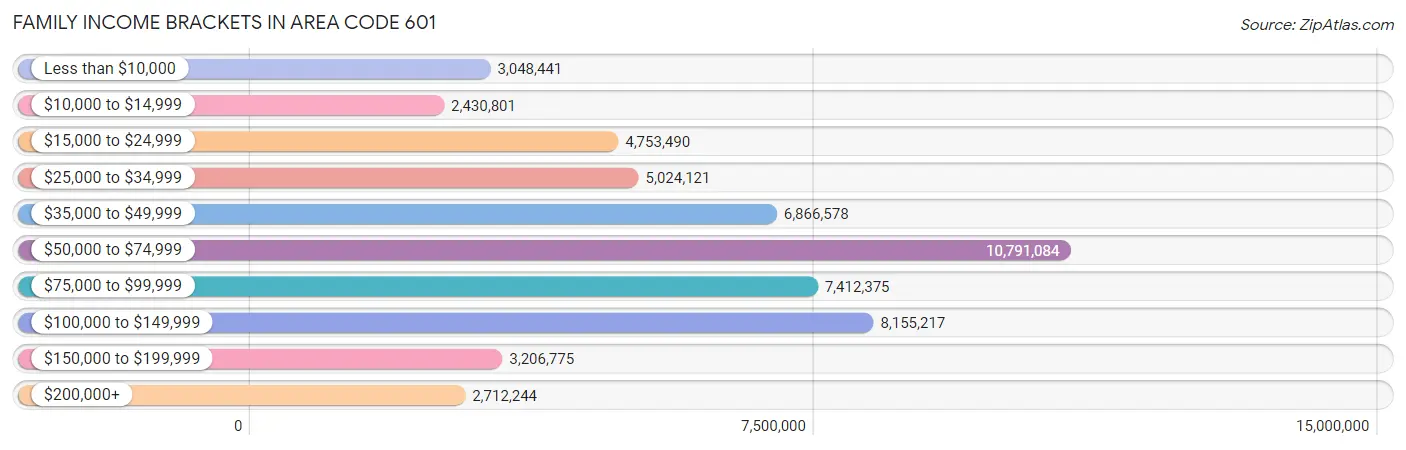
| Income Bracket | # Families | % Families |
| Less than $10,000 | 3,048,441 | 874.1% |
| $10,000 to $14,999 | 2,430,801 | 697.0% |
| $15,000 to $24,999 | 4,753,490 | 1,363.0% |
| $25,000 to $34,999 | 5,024,121 | 1,440.6% |
| $35,000 to $49,999 | 6,866,578 | 1,968.9% |
| $50,000 to $74,999 | 10,791,084 | 3,094.2% |
| $75,000 to $99,999 | 7,412,375 | 2,125.4% |
| $100,000 to $149,999 | 8,155,217 | 2,338.4% |
| $150,000 to $199,999 | 3,206,775 | 919.5% |
| $200,000+ | 2,712,244 | 777.7% |
Family Income by Famaliy Size in Area Code 601
7+ person families (4,978 | 1.4%) account for the highest median family income in Area Code 601 with $112,440 per family, while 2-person families (168,741 | 48.4%) have the highest median income of $28,959 per family member.
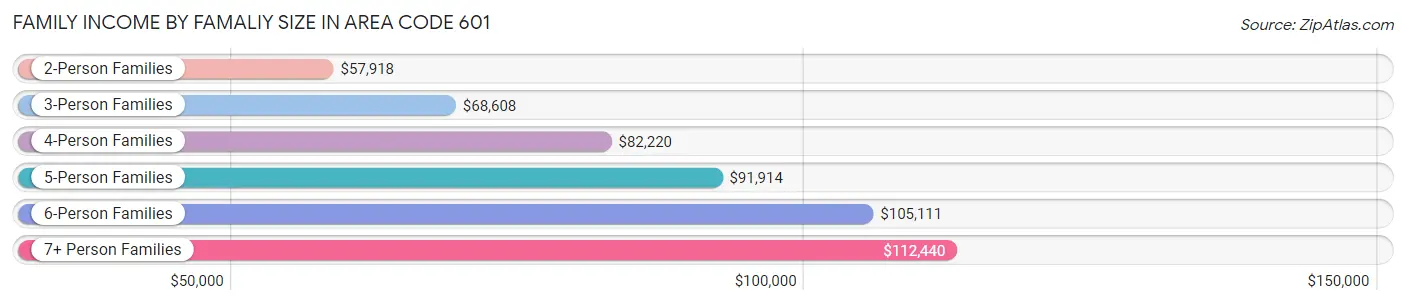
| Income Bracket | # Families | Median Income |
| 2-Person Families | 168,741 (48.4%) | $57,918 |
| 3-Person Families | 78,527 (22.5%) | $68,608 |
| 4-Person Families | 60,705 (17.4%) | $82,220 |
| 5-Person Families | 26,259 (7.5%) | $91,914 |
| 6-Person Families | 9,542 (2.7%) | $105,111 |
| 7+ Person Families | 4,978 (1.4%) | $112,440 |
| Total | 348,752 (100.0%) | $64,698 |
Family Income by Number of Earners in Area Code 601
The median family income in Area Code 601 is $64,698, with families comprising 3+ earners (29,911) having the highest median family income of $121,113, while families with no earners (63,659) have the lowest median family income of $37,571, accounting for 8.6% and 18.2% of families, respectively.
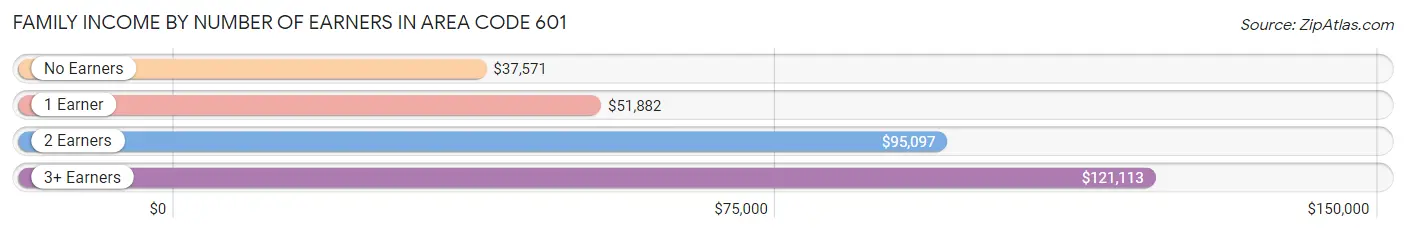
| Number of Earners | # Families | Median Income |
| No Earners | 63,659 (18.2%) | $37,571 |
| 1 Earner | 125,587 (36.0%) | $51,882 |
| 2 Earners | 129,595 (37.2%) | $95,097 |
| 3+ Earners | 29,911 (8.6%) | $121,113 |
| Total | 348,752 (100.0%) | $64,698 |
Household Income in Area Code 601
Household Income Brackets in Area Code 601
With 14,782,263 households falling in the category, the $50,000 to $74,999 income range is the most frequent in Area Code 601, accounting for 2,796.8% of all households. In contrast, only 3,266,390 households (618.0%) fall into the $200,000+ income bracket, making it the least populous group.
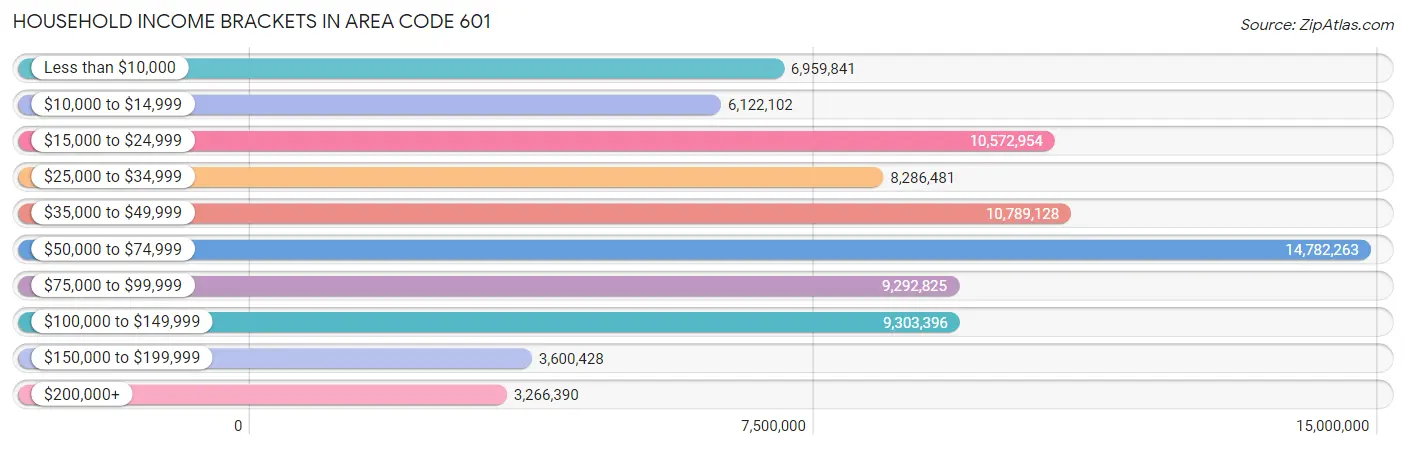
| Income Bracket | # Households | % Households |
| Less than $10,000 | 6,959,841 | 1,316.8% |
| $10,000 to $14,999 | 6,122,102 | 1,158.3% |
| $15,000 to $24,999 | 10,572,954 | 2,000.4% |
| $25,000 to $34,999 | 8,286,481 | 1,567.8% |
| $35,000 to $49,999 | 10,789,128 | 2,041.3% |
| $50,000 to $74,999 | 14,782,263 | 2,796.8% |
| $75,000 to $99,999 | 9,292,825 | 1,758.2% |
| $100,000 to $149,999 | 9,303,396 | 1,760.2% |
| $150,000 to $199,999 | 3,600,428 | 681.2% |
| $200,000+ | 3,266,390 | 618.0% |
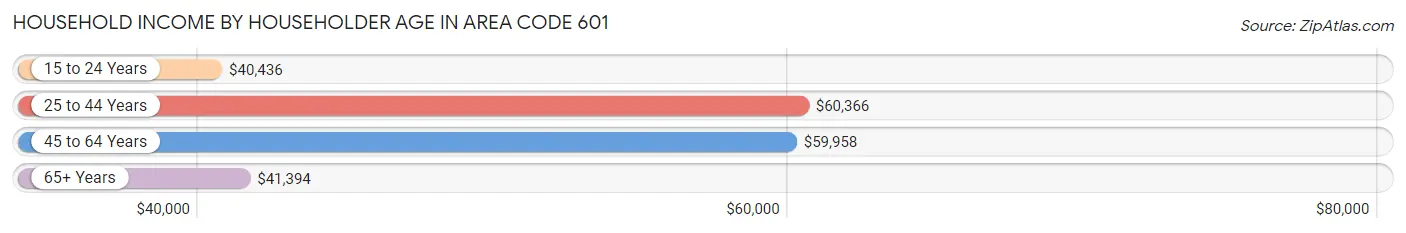
Household Income by Householder Age in Area Code 601
The median household income in Area Code 601 is $49,658, with the highest median household income of $60,366 found in the 25 to 44 years age bracket for the primary householder. A total of 164,546 households (31.1%) fall into this category. Meanwhile, the 15 to 24 years age bracket for the primary householder has the lowest median household income of $40,436, with 18,818 households (3.6%) in this group.
| Income Bracket | # Households | Median Income |
| 15 to 24 Years | 18,818 (3.6%) | $40,436 |
| 25 to 44 Years | 164,546 (31.1%) | $60,366 |
| 45 to 64 Years | 196,944 (37.3%) | $59,958 |
| 65+ Years | 148,234 (28.1%) | $41,394 |
| Total | 528,542 (100.0%) | $49,658 |
Poverty in Area Code 601
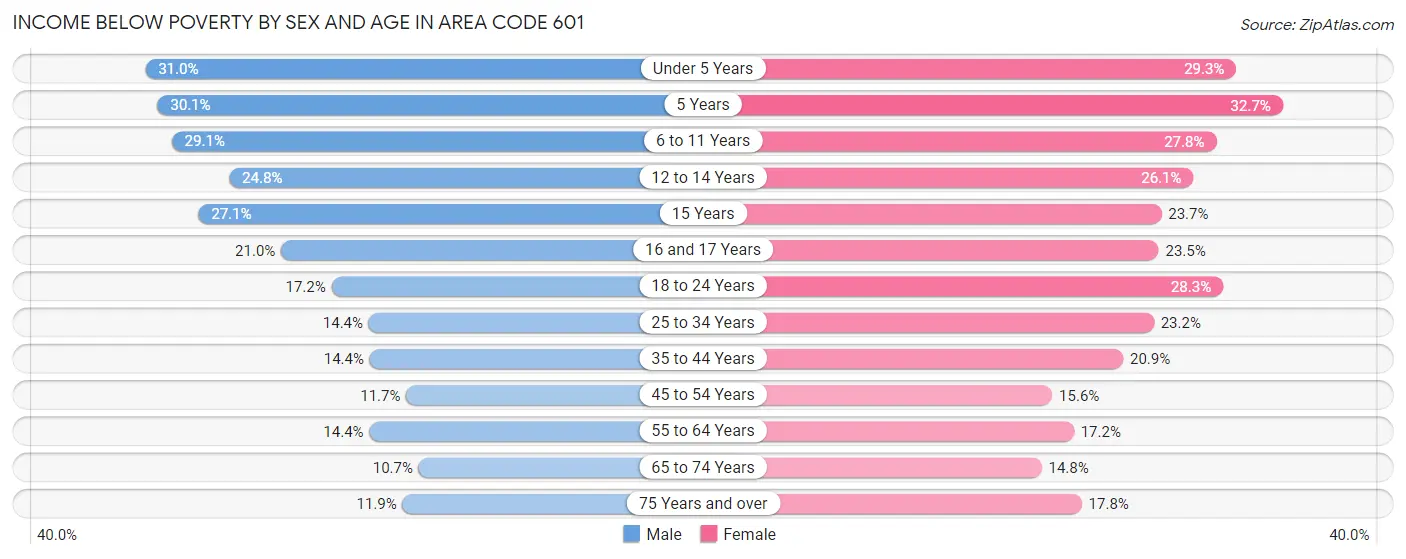
Income Below Poverty by Sex and Age in Area Code 601
With 17.2% poverty level for males and 21.3% for females among the residents of Area Code 601, under 5 year old males and 5 year old females are the most vulnerable to poverty, with 13,368 males (31.0%) and 2,636 females (32.7%) in their respective age groups living below the poverty level.
| Age Bracket | Male | Female |
| Under 5 Years | 13,368 (31.0%) | 11,906 (29.3%) |
| 5 Years | 2,286 (30.1%) | 2,636 (32.7%) |
| 6 to 11 Years | 15,703 (29.1%) | 14,685 (27.8%) |
| 12 to 14 Years | 7,748 (24.8%) | 7,479 (26.1%) |
| 15 Years | 2,313 (27.1%) | 2,270 (23.7%) |
| 16 and 17 Years | 4,255 (20.9%) | 4,376 (23.5%) |
| 18 to 24 Years | 10,142 (17.2%) | 17,196 (28.3%) |
| 25 to 34 Years | 11,582 (14.4%) | 20,564 (23.2%) |
| 35 to 44 Years | 11,743 (14.4%) | 18,640 (20.9%) |
| 45 to 54 Years | 9,170 (11.7%) | 13,443 (15.6%) |
| 55 to 64 Years | 12,013 (14.4%) | 16,091 (17.2%) |
| 65 to 74 Years | 6,814 (10.7%) | 11,011 (14.8%) |
| 75 Years and over | 4,220 (11.9%) | 9,451 (17.8%) |
| Total | 111,357 (17.2%) | 149,748 (21.3%) |
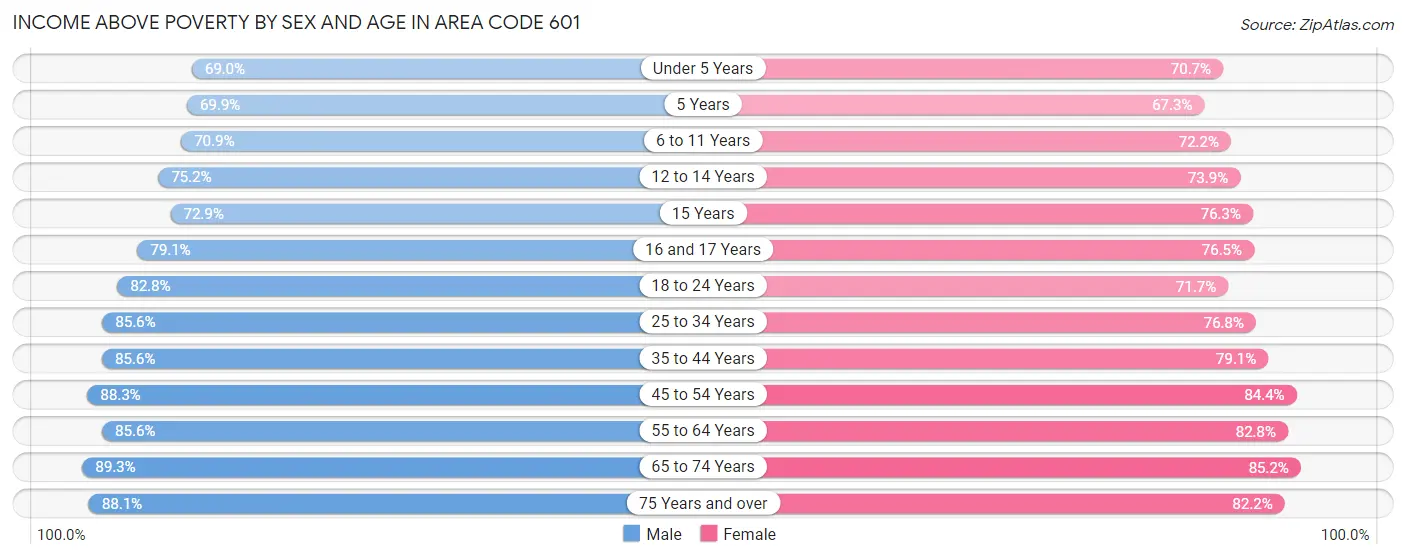
Income Above Poverty by Sex and Age in Area Code 601
According to the poverty statistics in Area Code 601, males aged 65 to 74 years and females aged 65 to 74 years are the age groups that are most secure financially, with 89.3% of males and 85.2% of females in these age groups living above the poverty line.
| Age Bracket | Male | Female |
| Under 5 Years | 29,699 (69.0%) | 28,758 (70.7%) |
| 5 Years | 5,298 (69.9%) | 5,418 (67.3%) |
| 6 to 11 Years | 38,293 (70.9%) | 38,148 (72.2%) |
| 12 to 14 Years | 23,479 (75.2%) | 21,178 (73.9%) |
| 15 Years | 6,223 (72.9%) | 7,299 (76.3%) |
| 16 and 17 Years | 16,054 (79.0%) | 14,230 (76.5%) |
| 18 to 24 Years | 48,794 (82.8%) | 43,576 (71.7%) |
| 25 to 34 Years | 68,636 (85.6%) | 68,228 (76.8%) |
| 35 to 44 Years | 69,953 (85.6%) | 70,651 (79.1%) |
| 45 to 54 Years | 69,488 (88.3%) | 72,621 (84.4%) |
| 55 to 64 Years | 71,411 (85.6%) | 77,377 (82.8%) |
| 65 to 74 Years | 56,661 (89.3%) | 63,259 (85.2%) |
| 75 Years and over | 31,114 (88.1%) | 43,610 (82.2%) |
| Total | 535,103 (82.8%) | 554,353 (78.7%) |
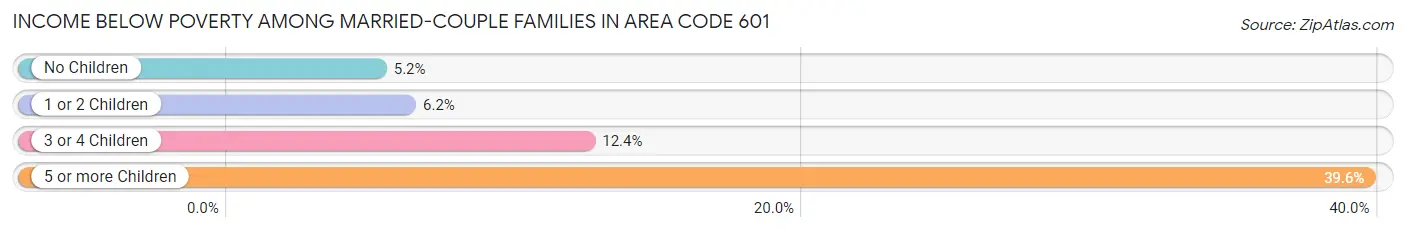
Income Below Poverty Among Married-Couple Families in Area Code 601
The poverty statistics for married-couple families in Area Code 601 show that 6.3% or 14,839 of the total 236,101 families live below the poverty line. Families with 5 or more children have the highest poverty rate of 39.6%, comprising of 529 families. On the other hand, families with no children have the lowest poverty rate of 5.2%, which includes 7,297 families.
| Children | Above Poverty | Below Poverty |
| No Children | 133,530 (94.8%) | 7,297 (5.2%) |
| 1 or 2 Children | 70,236 (93.8%) | 4,642 (6.2%) |
| 3 or 4 Children | 16,690 (87.6%) | 2,371 (12.4%) |
| 5 or more Children | 806 (60.4%) | 529 (39.6%) |
| Total | 221,262 (93.7%) | 14,839 (6.3%) |
Income Below Poverty Among Single-Parent Households in Area Code 601
According to the poverty data in Area Code 601, 21.1% or 4,833 single-father households and 35.2% or 31,597 single-mother households are living below the poverty line. Among single-father households, those with 5 or more children have the highest poverty rate, with 150 households (70.4%) experiencing poverty. Likewise, among single-mother households, those with 5 or more children have the highest poverty rate, with 1,148 households (97.8%) falling below the poverty line.
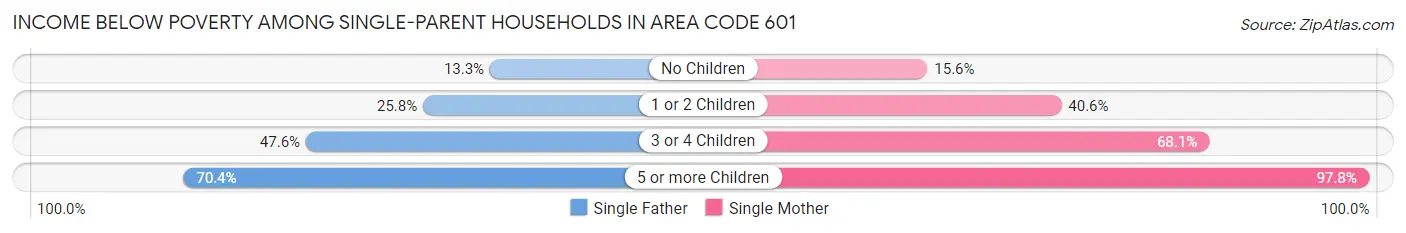
| Children | Single Father | Single Mother |
| No Children | 1,480 (13.3%) | 5,224 (15.6%) |
| 1 or 2 Children | 2,727 (25.8%) | 18,083 (40.6%) |
| 3 or 4 Children | 476 (47.6%) | 7,142 (68.1%) |
| 5 or more Children | 150 (70.4%) | 1,148 (97.8%) |
| Total | 4,833 (21.1%) | 31,597 (35.2%) |
Income Below Poverty Among Married-Couple vs Single-Parent Households in Area Code 601
The poverty data for Area Code 601 shows that 14,839 of the married-couple family households (6.3%) and 36,430 of the single-parent households (32.3%) are living below the poverty level. Within the married-couple family households, those with 5 or more children have the highest poverty rate, with 529 households (39.6%) falling below the poverty line. Among the single-parent households, those with 5 or more children have the highest poverty rate, with 1,298 household (93.6%) living below poverty.
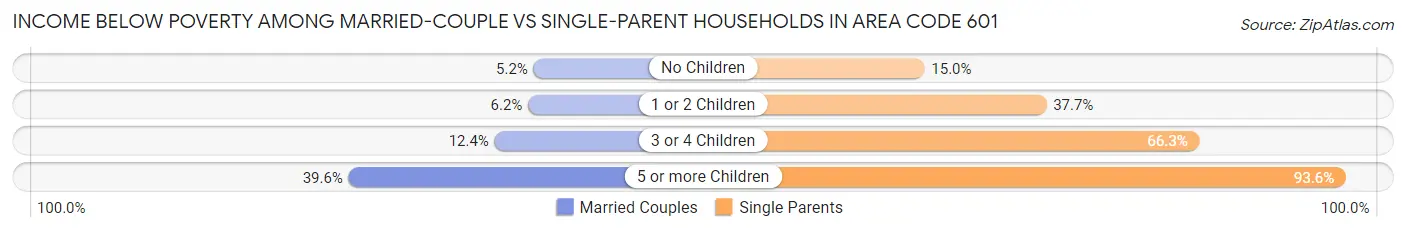
| Children | Married-Couple Families | Single-Parent Households |
| No Children | 7,297 (5.2%) | 6,704 (15.0%) |
| 1 or 2 Children | 4,642 (6.2%) | 20,810 (37.7%) |
| 3 or 4 Children | 2,371 (12.4%) | 7,618 (66.3%) |
| 5 or more Children | 529 (39.6%) | 1,298 (93.6%) |
| Total | 14,839 (6.3%) | 36,430 (32.3%) |
Race in Area Code 601
The most populous races in Area Code 601 are White / Caucasian (769,546 | 55.1%), Black / African American (557,575 | 39.9%), and Hispanic or Latino (38,860 | 2.8%).
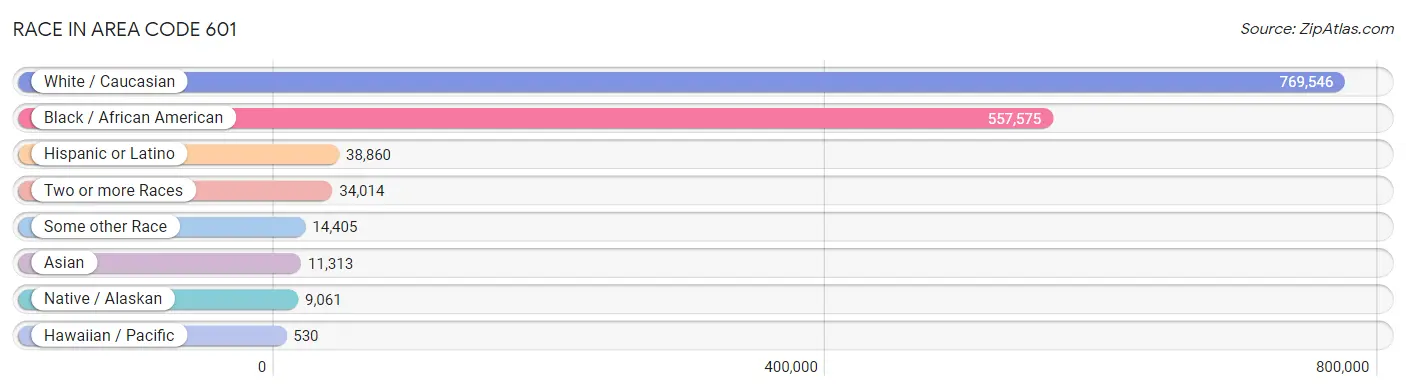
| Race | # Population | % Population |
| Asian | 11,313 | 0.8% |
| Black / African American | 557,575 | 39.9% |
| Hawaiian / Pacific | 530 | 0.0% |
| Hispanic or Latino | 38,860 | 2.8% |
| Native / Alaskan | 9,061 | 0.6% |
| White / Caucasian | 769,546 | 55.1% |
| Two or more Races | 34,014 | 2.4% |
| Some other Race | 14,405 | 1.0% |
| Total | 1,396,444 | 100.0% |
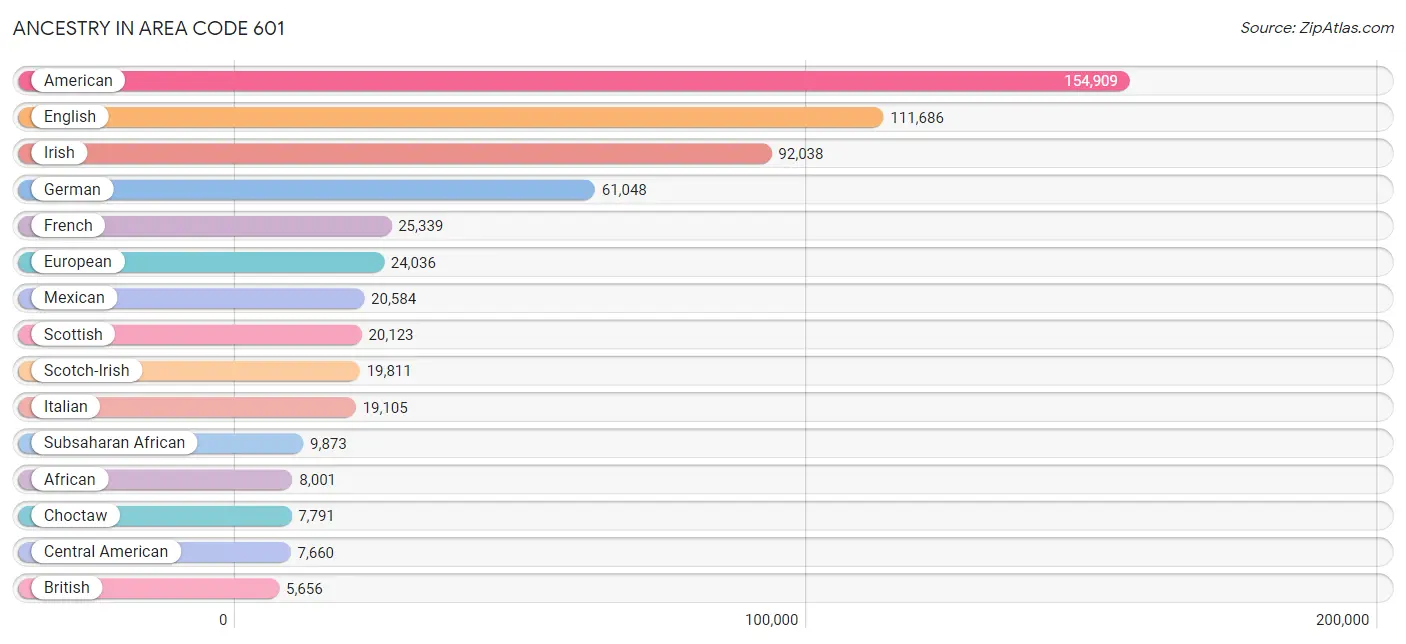
Ancestry in Area Code 601
The most populous ancestries reported in Area Code 601 are American (154,909 | 11.1%), English (111,686 | 8.0%), Irish (92,038 | 6.6%), German (61,048 | 4.4%), and French (25,339 | 1.8%), together accounting for 31.9% of all Area Code 601 residents.
| Ancestry | # Population | % Population |
| Afghan | 66 | 0.0% |
| African | 8,001 | 0.6% |
| Albanian | 31 | 0.0% |
| American | 154,909 | 11.1% |
| Apache | 135 | 0.0% |
| Arab | 3,890 | 0.3% |
| Arapaho | 7 | 0.0% |
| Argentinean | 121 | 0.0% |
| Armenian | 118 | 0.0% |
| Australian | 58 | 0.0% |
| Austrian | 421 | 0.0% |
| Bahamian | 5 | 0.0% |
| Barbadian | 38 | 0.0% |
| Basque | 93 | 0.0% |
| Belgian | 219 | 0.0% |
| Belizean | 20 | 0.0% |
| Bhutanese | 913 | 0.1% |
| Blackfeet | 544 | 0.0% |
| Bolivian | 14 | 0.0% |
| Brazilian | 288 | 0.0% |
| British | 5,656 | 0.4% |
| Bulgarian | 28 | 0.0% |
| Burmese | 1,191 | 0.1% |
| Cajun | 1,197 | 0.1% |
| Canadian | 515 | 0.0% |
| Cape Verdean | 13 | 0.0% |
| Carpatho Rusyn | 31 | 0.0% |
| Celtic | 56 | 0.0% |
| Central American | 7,660 | 0.5% |
| Central American Indian | 547 | 0.0% |
| Cherokee | 1,822 | 0.1% |
| Cheyenne | 163 | 0.0% |
| Chickasaw | 93 | 0.0% |
| Chilean | 18 | 0.0% |
| Chinese | 11 | 0.0% |
| Chippewa | 12 | 0.0% |
| Choctaw | 7,791 | 0.6% |
| Colombian | 634 | 0.1% |
| Comanche | 11 | 0.0% |
| Costa Rican | 126 | 0.0% |
| Creek | 215 | 0.0% |
| Croatian | 162 | 0.0% |
| Crow | 19 | 0.0% |
| Cuban | 1,333 | 0.1% |
| Cypriot | 46 | 0.0% |
| Czech | 621 | 0.0% |
| Czechoslovakian | 67 | 0.0% |
| Danish | 576 | 0.0% |
| Dominican | 408 | 0.0% |
| Dutch | 4,997 | 0.4% |
| Dutch West Indian | 80 | 0.0% |
| Eastern European | 530 | 0.0% |
| Ecuadorian | 80 | 0.0% |
| Egyptian | 115 | 0.0% |
| English | 111,686 | 8.0% |
| Ethiopian | 66 | 0.0% |
| European | 24,036 | 1.7% |
| Fijian | 155 | 0.0% |
| Filipino | 10 | 0.0% |
| Finnish | 258 | 0.0% |
| French | 25,339 | 1.8% |
| French American Indian | 33 | 0.0% |
| French Canadian | 2,597 | 0.2% |
| German | 61,048 | 4.4% |
| Ghanaian | 97 | 0.0% |
| Greek | 2,021 | 0.1% |
| Guamanian / Chamorro | 66 | 0.0% |
| Guatemalan | 3,875 | 0.3% |
| Guyanese | 64 | 0.0% |
| Haitian | 425 | 0.0% |
| Honduran | 2,282 | 0.2% |
| Houma | 375 | 0.0% |
| Hungarian | 684 | 0.1% |
| Icelander | 95 | 0.0% |
| Indian (Asian) | 3,304 | 0.2% |
| Indonesian | 29 | 0.0% |
| Inupiat | 26 | 0.0% |
| Iranian | 363 | 0.0% |
| Irish | 92,038 | 6.6% |
| Iroquois | 38 | 0.0% |
| Israeli | 317 | 0.0% |
| Italian | 19,105 | 1.4% |
| Jamaican | 407 | 0.0% |
| Japanese | 107 | 0.0% |
| Jordanian | 26 | 0.0% |
| Kenyan | 2 | 0.0% |
| Kiowa | 1 | 0.0% |
| Korean | 2,176 | 0.2% |
| Laotian | 146 | 0.0% |
| Lebanese | 1,565 | 0.1% |
| Lithuanian | 174 | 0.0% |
| Malaysian | 62 | 0.0% |
| Maltese | 20 | 0.0% |
| Mexican | 20,584 | 1.5% |
| Mexican American Indian | 557 | 0.0% |
| Mongolian | 120 | 0.0% |
| Moroccan | 69 | 0.0% |
| Native Hawaiian | 534 | 0.0% |
| Navajo | 87 | 0.0% |
| New Zealander | 6 | 0.0% |
| Nicaraguan | 559 | 0.0% |
| Nigerian | 1,277 | 0.1% |
| Northern European | 1,225 | 0.1% |
| Norwegian | 2,648 | 0.2% |
| Osage | 9 | 0.0% |
| Pakistani | 347 | 0.0% |
| Palestinian | 215 | 0.0% |
| Panamanian | 222 | 0.0% |
| Paraguayan | 61 | 0.0% |
| Pennsylvania German | 212 | 0.0% |
| Peruvian | 744 | 0.1% |
| Pima | 94 | 0.0% |
| Polish | 3,712 | 0.3% |
| Portuguese | 550 | 0.0% |
| Pueblo | 3 | 0.0% |
| Puerto Rican | 2,628 | 0.2% |
| Puget Sound Salish | 4 | 0.0% |
| Romanian | 53 | 0.0% |
| Russian | 1,095 | 0.1% |
| Salvadoran | 496 | 0.0% |
| Samoan | 65 | 0.0% |
| Scandinavian | 1,135 | 0.1% |
| Scotch-Irish | 19,811 | 1.4% |
| Scottish | 20,123 | 1.4% |
| Seminole | 117 | 0.0% |
| Senegalese | 23 | 0.0% |
| Serbian | 119 | 0.0% |
| Shoshone | 18 | 0.0% |
| Sierra Leonean | 13 | 0.0% |
| Sioux | 113 | 0.0% |
| Slavic | 127 | 0.0% |
| Slovak | 168 | 0.0% |
| Slovene | 36 | 0.0% |
| Somali | 1 | 0.0% |
| South African | 66 | 0.0% |
| South American | 1,913 | 0.1% |
| South American Indian | 15 | 0.0% |
| Spaniard | 1,004 | 0.1% |
| Spanish | 1,340 | 0.1% |
| Spanish American | 29 | 0.0% |
| Spanish American Indian | 2 | 0.0% |
| Sri Lankan | 2,467 | 0.2% |
| Subsaharan African | 9,873 | 0.7% |
| Sudanese | 3 | 0.0% |
| Swedish | 3,379 | 0.2% |
| Swiss | 442 | 0.0% |
| Syrian | 206 | 0.0% |
| Thai | 4,016 | 0.3% |
| Tlingit-Haida | 14 | 0.0% |
| Trinidadian and Tobagonian | 47 | 0.0% |
| Turkish | 39 | 0.0% |
| Ukrainian | 235 | 0.0% |
| Venezuelan | 184 | 0.0% |
| Vietnamese | 12 | 0.0% |
| Welsh | 3,719 | 0.3% |
| West Indian | 79 | 0.0% |
| Yaqui | 13 | 0.0% |
| Yugoslavian | 240 | 0.0% | View All 158 Rows |
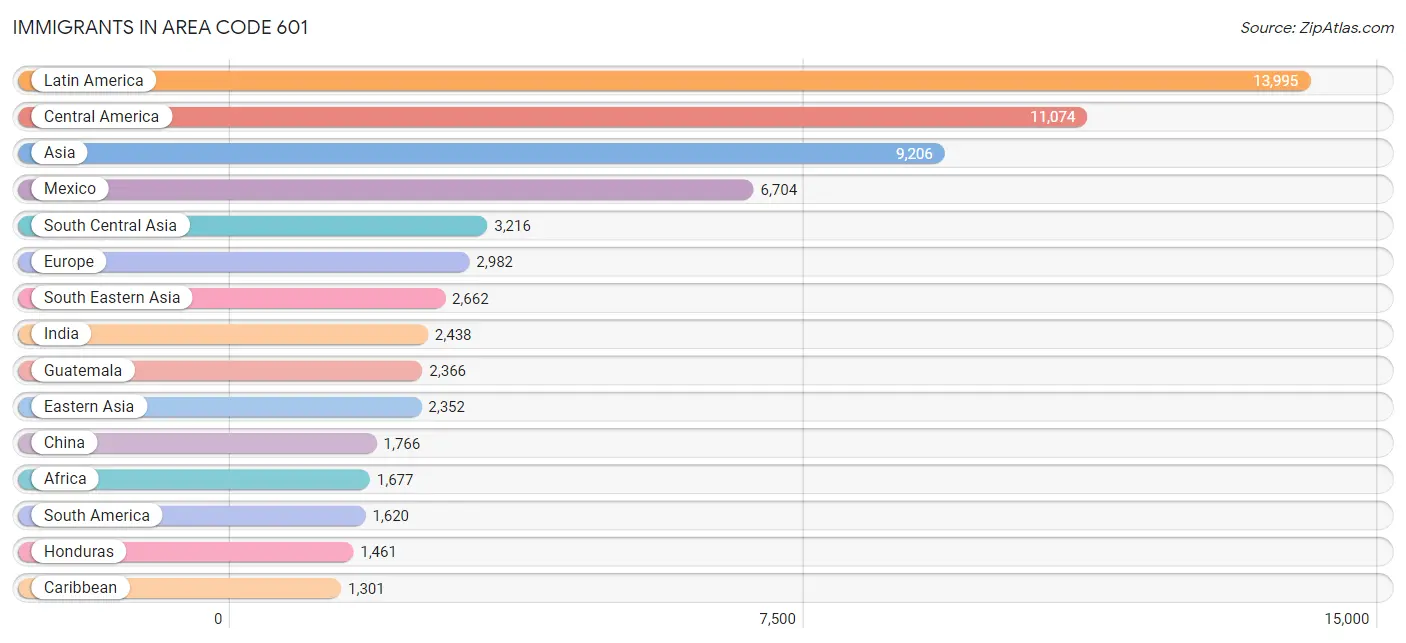
Immigrants in Area Code 601
The most numerous immigrant groups reported in Area Code 601 came from Latin America (13,995 | 1.0%), Central America (11,074 | 0.8%), Asia (9,206 | 0.7%), Mexico (6,704 | 0.5%), and South Central Asia (3,216 | 0.2%), together accounting for 3.2% of all Area Code 601 residents.
| Immigration Origin | # Population | % Population |
| Afghanistan | 50 | 0.0% |
| Africa | 1,677 | 0.1% |
| Albania | 13 | 0.0% |
| Argentina | 26 | 0.0% |
| Asia | 9,206 | 0.7% |
| Australia | 63 | 0.0% |
| Austria | 47 | 0.0% |
| Bahamas | 5 | 0.0% |
| Bangladesh | 13 | 0.0% |
| Barbados | 15 | 0.0% |
| Belarus | 10 | 0.0% |
| Belgium | 45 | 0.0% |
| Belize | 11 | 0.0% |
| Bolivia | 14 | 0.0% |
| Brazil | 289 | 0.0% |
| Bulgaria | 28 | 0.0% |
| Cambodia | 25 | 0.0% |
| Cameroon | 121 | 0.0% |
| Canada | 700 | 0.1% |
| Caribbean | 1,301 | 0.1% |
| Central America | 11,074 | 0.8% |
| Chile | 6 | 0.0% |
| China | 1,766 | 0.1% |
| Colombia | 408 | 0.0% |
| Congo | 9 | 0.0% |
| Costa Rica | 33 | 0.0% |
| Croatia | 4 | 0.0% |
| Cuba | 484 | 0.0% |
| Czechoslovakia | 4 | 0.0% |
| Denmark | 53 | 0.0% |
| Dominican Republic | 253 | 0.0% |
| Eastern Africa | 298 | 0.0% |
| Eastern Asia | 2,352 | 0.2% |
| Eastern Europe | 557 | 0.0% |
| Ecuador | 34 | 0.0% |
| Egypt | 128 | 0.0% |
| El Salvador | 243 | 0.0% |
| England | 360 | 0.0% |
| Eritrea | 33 | 0.0% |
| Ethiopia | 86 | 0.0% |
| Europe | 2,982 | 0.2% |
| France | 29 | 0.0% |
| Germany | 824 | 0.1% |
| Ghana | 200 | 0.0% |
| Greece | 139 | 0.0% |
| Guatemala | 2,366 | 0.2% |
| Guyana | 72 | 0.0% |
| Haiti | 232 | 0.0% |
| Honduras | 1,461 | 0.1% |
| Hong Kong | 18 | 0.0% |
| Hungary | 32 | 0.0% |
| India | 2,438 | 0.2% |
| Indonesia | 87 | 0.0% |
| Iran | 246 | 0.0% |
| Ireland | 146 | 0.0% |
| Israel | 37 | 0.0% |
| Italy | 55 | 0.0% |
| Jamaica | 266 | 0.0% |
| Japan | 240 | 0.0% |
| Jordan | 32 | 0.0% |
| Kazakhstan | 7 | 0.0% |
| Kenya | 5 | 0.0% |
| Korea | 346 | 0.0% |
| Kuwait | 22 | 0.0% |
| Laos | 82 | 0.0% |
| Latin America | 13,995 | 1.0% |
| Lebanon | 44 | 0.0% |
| Liberia | 40 | 0.0% |
| Malaysia | 12 | 0.0% |
| Mexico | 6,704 | 0.5% |
| Middle Africa | 148 | 0.0% |
| Moldova | 12 | 0.0% |
| Morocco | 28 | 0.0% |
| Nepal | 120 | 0.0% |
| Netherlands | 96 | 0.0% |
| Nicaragua | 194 | 0.0% |
| Nigeria | 452 | 0.0% |
| Northern Africa | 253 | 0.0% |
| Northern Europe | 1,097 | 0.1% |
| Norway | 18 | 0.0% |
| Oceania | 282 | 0.0% |
| Pakistan | 323 | 0.0% |
| Panama | 62 | 0.0% |
| Peru | 432 | 0.0% |
| Philippines | 986 | 0.1% |
| Poland | 154 | 0.0% |
| Portugal | 26 | 0.0% |
| Romania | 14 | 0.0% |
| Russia | 198 | 0.0% |
| Scotland | 127 | 0.0% |
| Senegal | 42 | 0.0% |
| Serbia | 14 | 0.0% |
| Somalia | 26 | 0.0% |
| South Africa | 136 | 0.0% |
| South America | 1,620 | 0.1% |
| South Central Asia | 3,216 | 0.2% |
| South Eastern Asia | 2,662 | 0.2% |
| Southern Europe | 281 | 0.0% |
| Spain | 61 | 0.0% |
| Sudan | 75 | 0.0% |
| Sweden | 5 | 0.0% |
| Switzerland | 6 | 0.0% |
| Syria | 186 | 0.0% |
| Taiwan | 40 | 0.0% |
| Thailand | 290 | 0.0% |
| Trinidad and Tobago | 35 | 0.0% |
| Uganda | 87 | 0.0% |
| Ukraine | 74 | 0.0% |
| Uzbekistan | 19 | 0.0% |
| Venezuela | 137 | 0.0% |
| Vietnam | 1,169 | 0.1% |
| Western Africa | 815 | 0.1% |
| Western Asia | 865 | 0.1% |
| Western Europe | 1,047 | 0.1% |
| Yemen | 487 | 0.0% | View All 115 Rows |
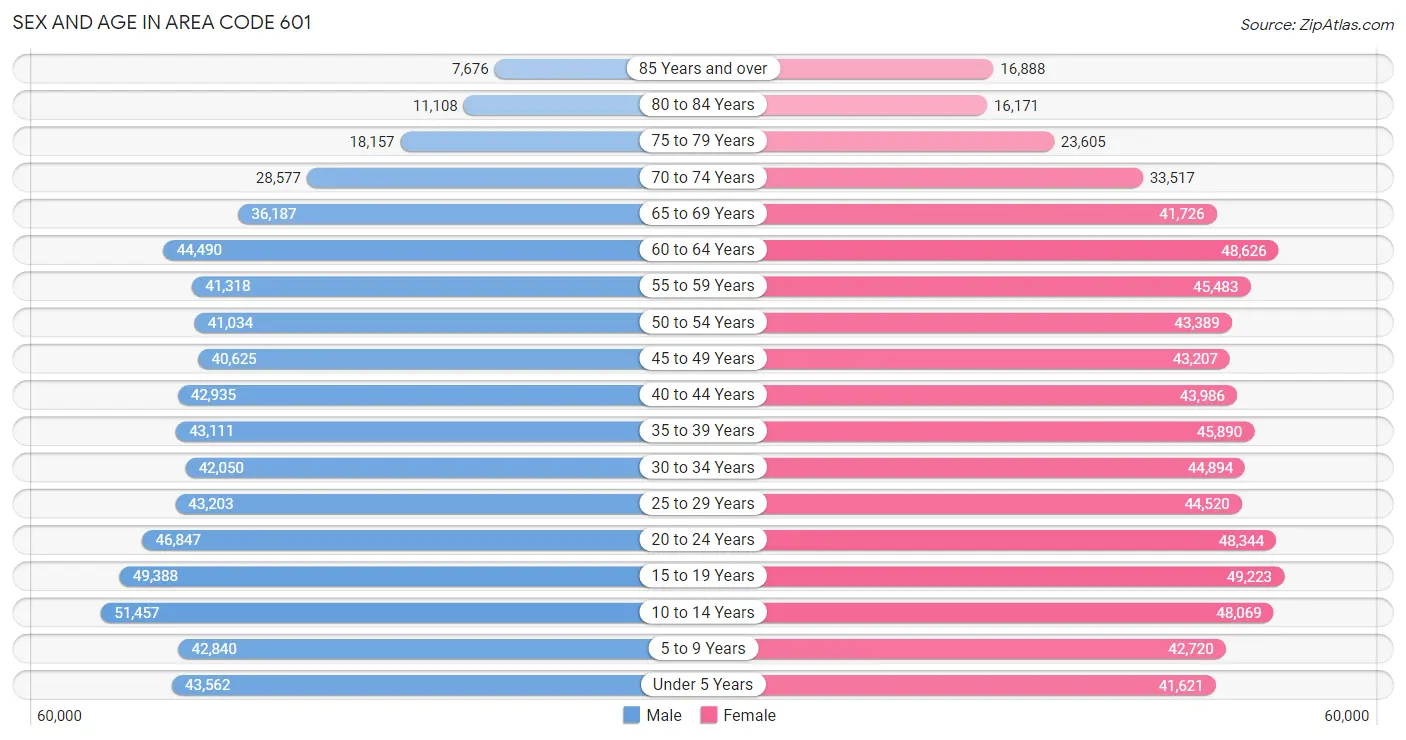
Sex and Age in Area Code 601
Sex and Age in Area Code 601
The most populous age groups in Area Code 601 are 10 to 14 Years (51,457 | 7.6%) for men and 15 to 19 Years (49,223 | 6.8%) for women.
| Age Bracket | Male | Female |
| Under 5 Years | 43,562 (6.5%) | 41,621 (5.8%) |
| 5 to 9 Years | 42,840 (6.4%) | 42,720 (5.9%) |
| 10 to 14 Years | 51,457 (7.6%) | 48,069 (6.7%) |
| 15 to 19 Years | 49,388 (7.3%) | 49,223 (6.8%) |
| 20 to 24 Years | 46,847 (6.9%) | 48,344 (6.7%) |
| 25 to 29 Years | 43,203 (6.4%) | 44,520 (6.2%) |
| 30 to 34 Years | 42,050 (6.2%) | 44,894 (6.2%) |
| 35 to 39 Years | 43,111 (6.4%) | 45,890 (6.4%) |
| 40 to 44 Years | 42,935 (6.4%) | 43,986 (6.1%) |
| 45 to 49 Years | 40,625 (6.0%) | 43,207 (6.0%) |
| 50 to 54 Years | 41,034 (6.1%) | 43,389 (6.0%) |
| 55 to 59 Years | 41,318 (6.1%) | 45,483 (6.3%) |
| 60 to 64 Years | 44,490 (6.6%) | 48,626 (6.7%) |
| 65 to 69 Years | 36,187 (5.4%) | 41,726 (5.8%) |
| 70 to 74 Years | 28,577 (4.2%) | 33,517 (4.6%) |
| 75 to 79 Years | 18,157 (2.7%) | 23,605 (3.3%) |
| 80 to 84 Years | 11,108 (1.7%) | 16,171 (2.2%) |
| 85 Years and over | 7,676 (1.1%) | 16,888 (2.3%) |
| Total | 674,565 (100.0%) | 721,879 (100.0%) |
Families and Households in Area Code 601
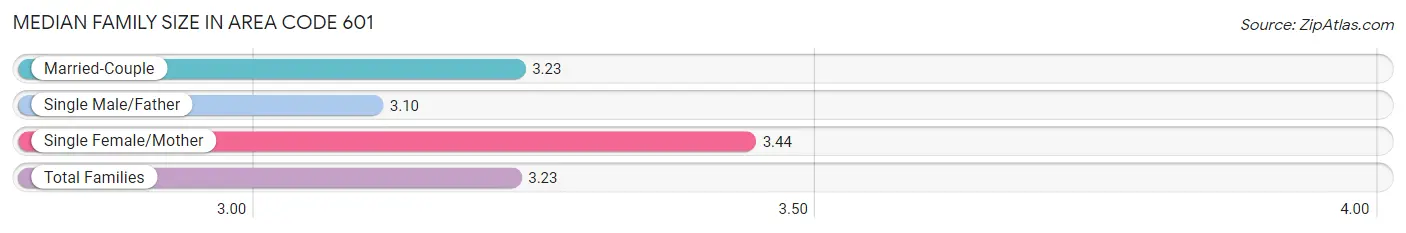
Median Family Size in Area Code 601
The median family size in Area Code 601 is 3.23 persons per family, with single female/mother families (89,753 | 25.7%) accounting for the largest median family size of 3.43714 persons per family. On the other hand, single male/father families (22,898 | 6.6%) represent the smallest median family size with 3.10 persons per family.
| Family Type | # Families | Family Size |
| Married-Couple | 236,101 (67.7%) | 3.23 |
| Single Male/Father | 22,898 (6.6%) | 3.10 |
| Single Female/Mother | 89,753 (25.7%) | 3.44 |
| Total Families | 348,752 (100.0%) | 3.23 |
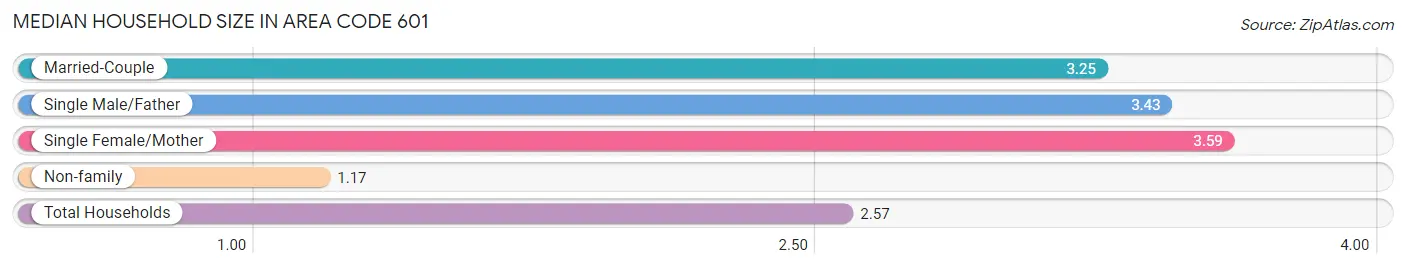
Median Household Size in Area Code 601
The median household size in Area Code 601 is 2.57 persons per household, with single female/mother households (89,753 | 17.0%) accounting for the largest median household size of 3.59272 persons per household. non-family households (179,790 | 34.0%) represent the smallest median household size with 1.17 persons per household.
| Household Type | # Households | Household Size |
| Married-Couple | 236,101 (44.7%) | 3.25 |
| Single Male/Father | 22,898 (4.3%) | 3.43 |
| Single Female/Mother | 89,753 (17.0%) | 3.59 |
| Non-family | 179,790 (34.0%) | 1.17 |
| Total Households | 528,542 (100.0%) | 2.57 |
Household Size by Marriage Status in Area Code 601
Out of a total of 528,542 households in Area Code 601, 348,752 (66.0%) are family households, while 179,790 (34.0%) are nonfamily households. The most numerous type of family households are 2-person households, comprising 161,173, and the most common type of nonfamily households are 1-person households, comprising 157,372.
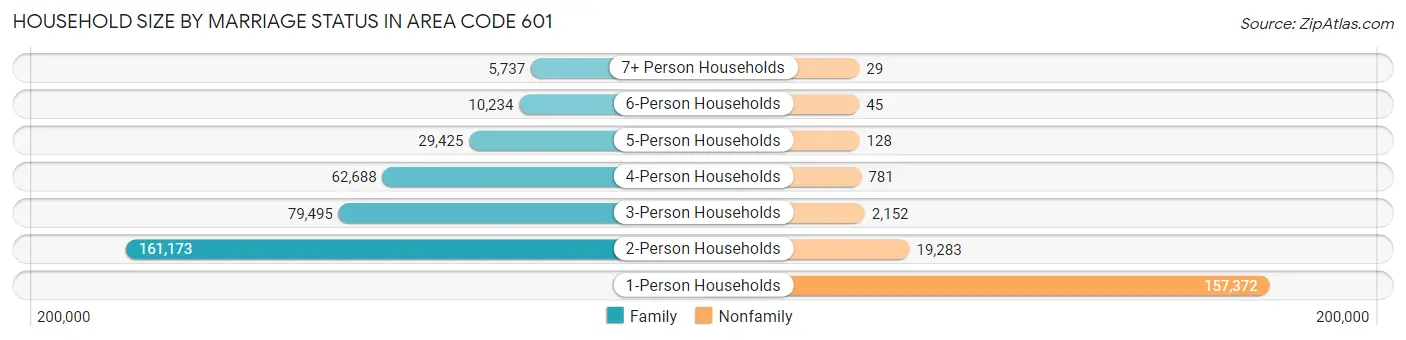
| Household Size | Family Households | Nonfamily Households |
| 1-Person Households | - | 157,372 (29.8%) |
| 2-Person Households | 161,173 (30.5%) | 19,283 (3.6%) |
| 3-Person Households | 79,495 (15.0%) | 2,152 (0.4%) |
| 4-Person Households | 62,688 (11.9%) | 781 (0.2%) |
| 5-Person Households | 29,425 (5.6%) | 128 (0.0%) |
| 6-Person Households | 10,234 (1.9%) | 45 (0.0%) |
| 7+ Person Households | 5,737 (1.1%) | 29 (0.0%) |
| Total | 348,752 (66.0%) | 179,790 (34.0%) |
Female Fertility in Area Code 601
Fertility by Age in Area Code 601
Average fertility rate in Area Code 601 is 67.2 births per 1,000 women. Women in the age bracket of 20 to 34 years have the highest fertility rate with 130.3 births per 1,000 women. Women in the age bracket of 20 to 34 years acount for 77.1% of all women with births.
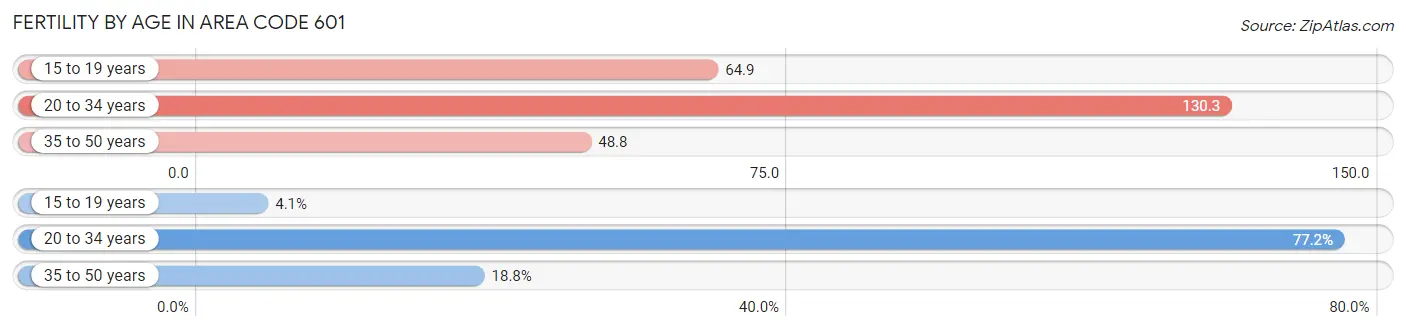
| Age Bracket | Women with Births | Births / 1,000 Women |
| 15 to 19 years | 773 (4.1%) | 64.9 |
| 20 to 34 years | 14,595 (77.1%) | 130.3 |
| 35 to 50 years | 3,550 (18.8%) | 48.8 |
| Total | 18,918 (100.0%) | 67.2 |
Fertility by Age by Marriage Status in Area Code 601
44.5% of women with births (18,918) in Area Code 601 are married. The highest percentage of unmarried women with births falls into 15 to 19 years age bracket with 99.7% of them unmarried at the time of birth, while the lowest percentage of unmarried women with births belong to 20 to 34 years age bracket with 59.1% of them unmarried.
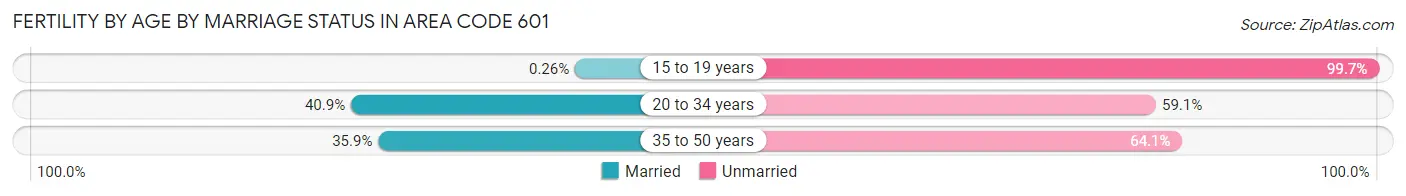
| Age Bracket | Married | Unmarried |
| 15 to 19 years | 2 (0.3%) | 771 (99.7%) |
| 20 to 34 years | 5,963 (40.9%) | 8,632 (59.1%) |
| 35 to 50 years | 1,275 (35.9%) | 2,275 (64.1%) |
| Total | 8,422 (44.5%) | 10,496 (55.5%) |
Fertility by Education in Area Code 601
Average fertility rate in Area Code 601 is 67.2 births per 1,000 women. Women with the education attainment of graduate degree have the highest fertility rate of 170.5 births per 1,000 women, while women with the education attainment of less than high school have the lowest fertility at 90.2 births per 1,000 women. Women with the education attainment of college or associate's degree represent 39.0% of all women with births.
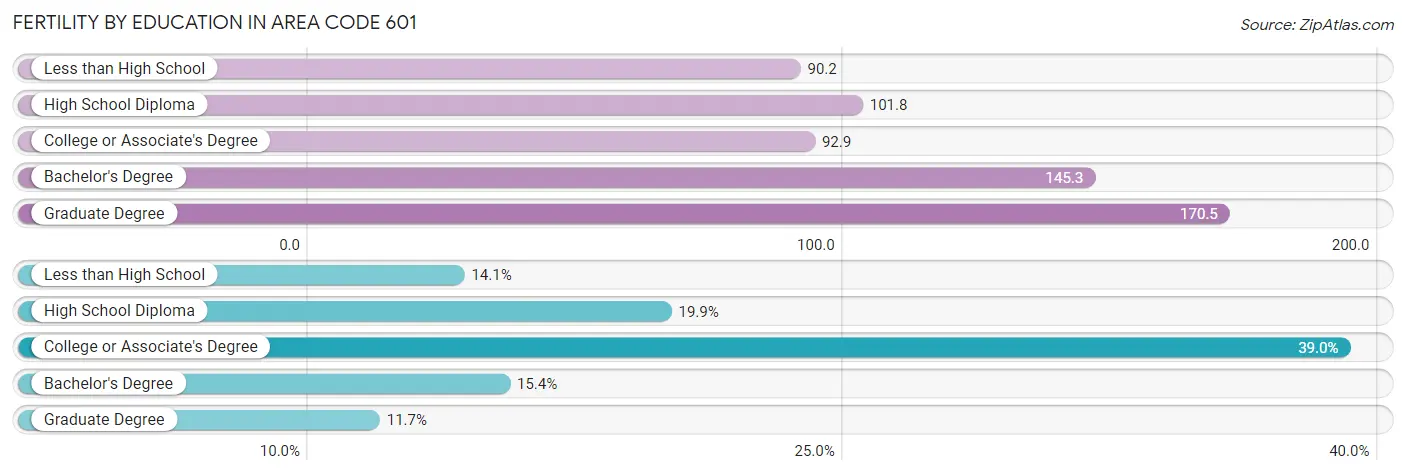
| Educational Attainment | Women with Births | Births / 1,000 Women |
| Less than High School | 2,664 (14.1%) | 90.2 |
| High School Diploma | 3,764 (19.9%) | 101.8 |
| College or Associate's Degree | 7,372 (39.0%) | 92.9 |
| Bachelor's Degree | 2,905 (15.4%) | 145.3 |
| Graduate Degree | 2,213 (11.7%) | 170.5 |
| Total | 18,918 (100.0%) | 67.2 |
Fertility by Education by Marriage Status in Area Code 601
55.5% of women with births in Area Code 601 are unmarried. Women with the educational attainment of college or associate's degree are most likely to be married with 38.1% of them married at childbirth, while women with the educational attainment of less than high school are least likely to be married with 86.8% of them unmarried at childbirth.
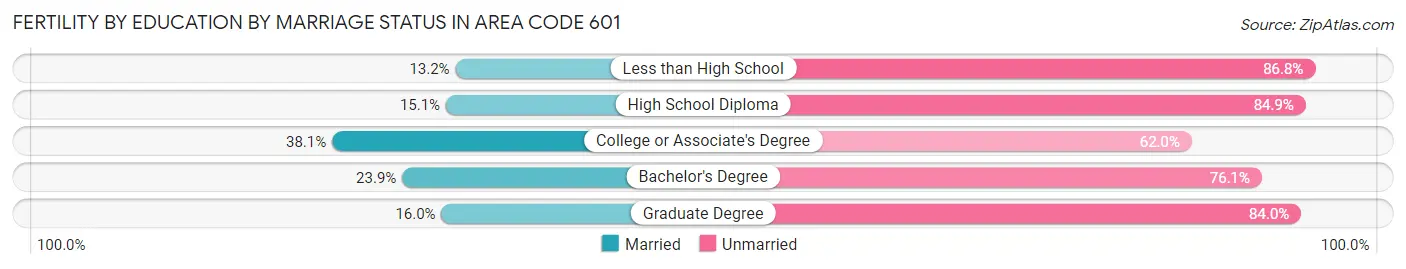
| Educational Attainment | Married | Unmarried |
| Less than High School | 351 (13.2%) | 2,313 (86.8%) |
| High School Diploma | 568 (15.1%) | 3,196 (84.9%) |
| College or Associate's Degree | 2,805 (38.1%) | 4,567 (62.0%) |
| Bachelor's Degree | 695 (23.9%) | 2,210 (76.1%) |
| Graduate Degree | 354 (16.0%) | 1,859 (84.0%) |
| Total | 8,422 (44.5%) | 10,496 (55.5%) |
Employment Characteristics in Area Code 601
Employment by Class of Employer in Area Code 601
Among the 579,700 employed individuals in Area Code 601, private company employees (379,160 | 65.4%), state government employees (53,747 | 9.3%), and local government employees (37,581 | 6.5%) make up the most common classes of employment.
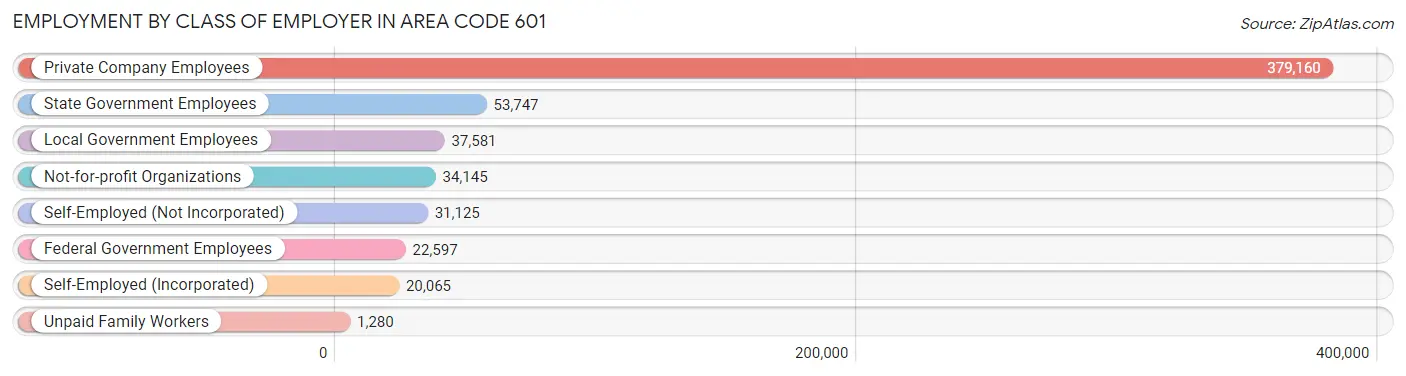
| Employer Class | # Employees | % Employees |
| Private Company Employees | 379,160 | 65.4% |
| Self-Employed (Incorporated) | 20,065 | 3.5% |
| Self-Employed (Not Incorporated) | 31,125 | 5.4% |
| Not-for-profit Organizations | 34,145 | 5.9% |
| Local Government Employees | 37,581 | 6.5% |
| State Government Employees | 53,747 | 9.3% |
| Federal Government Employees | 22,597 | 3.9% |
| Unpaid Family Workers | 1,280 | 0.2% |
| Total | 579,700 | 100.0% |
Employment Status by Age in Area Code 601
According to the labor force statistics for Area Code 601, out of the total population over 16 years of age (1,107,996), 52.8% or 584,579 individuals are in the labor force, with 7.0% or 40,921 of them unemployed. The age group with the highest labor force participation rate is 30 to 34 years, with 80.0% or 69,555 individuals in the labor force. Within the labor force, the 16 to 19 years age range has the highest percentage of unemployed individuals, with 2,486.7% or 643,831 of them being unemployed.
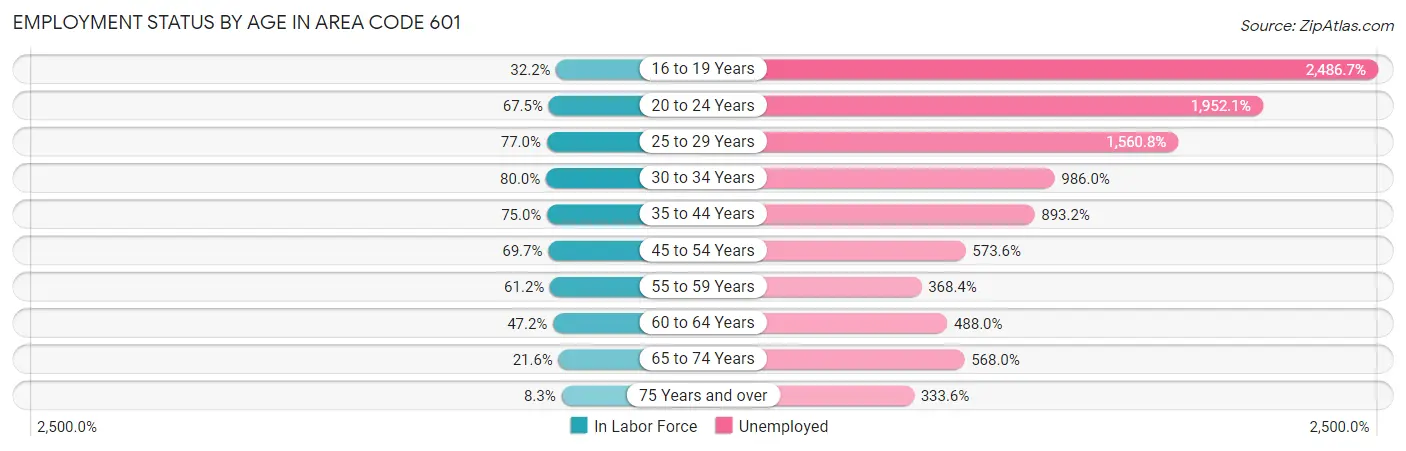
| Age Bracket | In Labor Force | Unemployed |
| 16 to 19 Years | 25,891 (32.2%) | 643,831 (2,486.7%) |
| 20 to 24 Years | 64,276 (67.5%) | 1,254,673 (1,952.1%) |
| 25 to 29 Years | 67,549 (77.0%) | 1,054,274 (1,560.8%) |
| 30 to 34 Years | 69,554 (80.0%) | 685,812 (986.0%) |
| 35 to 44 Years | 131,976 (75.0%) | 1,178,819 (893.2%) |
| 45 to 54 Years | 117,316 (69.7%) | 672,873 (573.6%) |
| 55 to 59 Years | 53,147 (61.2%) | 195,797 (368.4%) |
| 60 to 64 Years | 43,951 (47.2%) | 214,481 (488.0%) |
| 65 to 74 Years | 30,276 (21.6%) | 171,934 (568.0%) |
| 75 Years and over | 7,742 (8.3%) | 25,824 (333.6%) |
| Total | 584,584 (52.8%) | 40,924 (7.0%) |
Employment Status by Educational Attainment in Area Code 601
According to labor force statistics for Area Code 601, 67.5% of individuals (471,943) out of the total population between 25 and 64 years of age (698,761) are in the labor force, with 877.6% or 4,141,772 of them being unemployed. The group with the highest labor force participation rate are those with the educational attainment of bachelor's degree or higher, with 81.4% or 147,042 individuals in the labor force. Within the labor force, individuals with less than high school education have the highest percentage of unemployment, with 1,433.3% or 560,377 of them being unemployed.
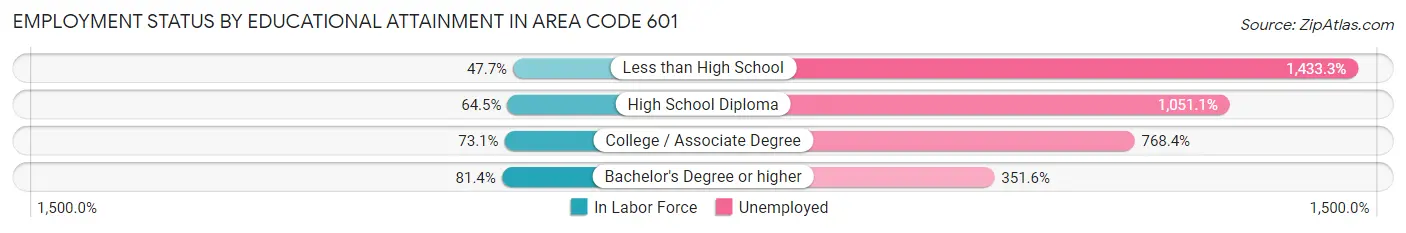
| Educational Attainment | In Labor Force | Unemployed |
| Less than High School | 39,101 (47.7%) | 1,175,535 (1,433.3%) |
| High School Diploma | 126,727 (64.5%) | 2,063,971 (1,051.1%) |
| College / Associate Degree | 175,259 (73.1%) | 1,841,486 (768.4%) |
| Bachelor's Degree or higher | 147,047 (81.4%) | 635,447 (351.6%) |
| Total | 471,948 (67.5%) | 6,132,327 (877.6%) |
Employment Occupations by Sex in Area Code 601
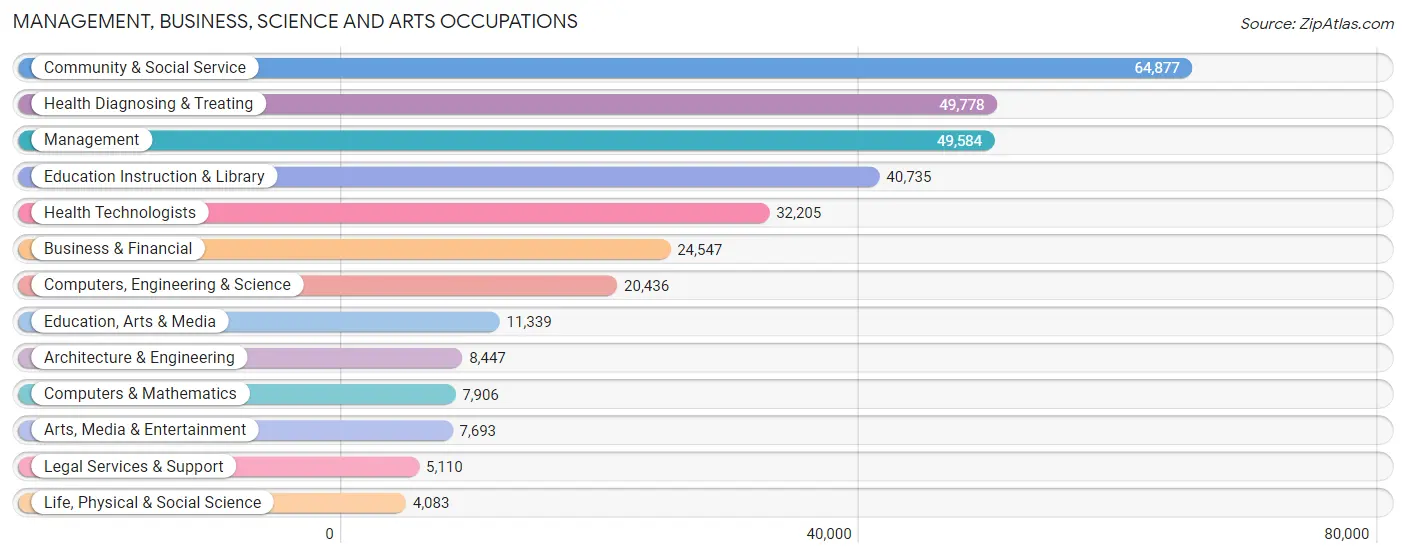
Management, Business, Science and Arts Occupations
The most common Management, Business, Science and Arts occupations in Area Code 601 are Community & Social Service (64,877 | 11.0%), Health Diagnosing & Treating (49,778 | 8.5%), Management (49,584 | 8.4%), Education Instruction & Library (40,735 | 6.9%), and Health Technologists (32,205 | 5.5%).
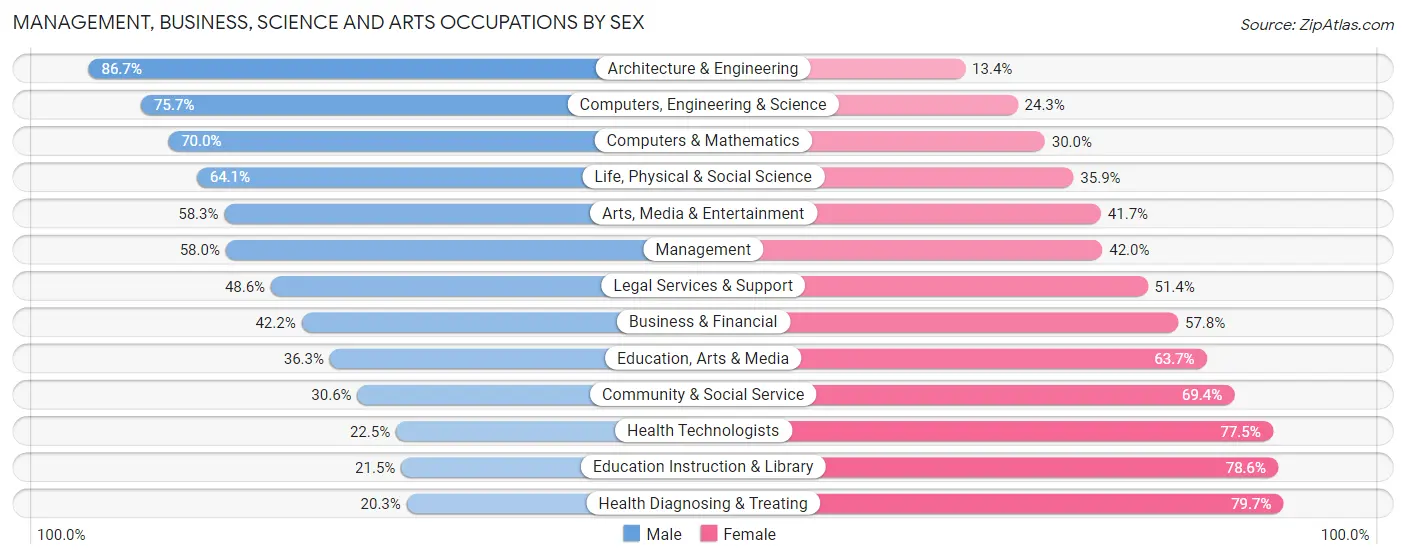
Management, Business, Science and Arts Occupations by Sex
Within the Management, Business, Science and Arts occupations in Area Code 601, the most male-oriented occupations are Architecture & Engineering (86.7%), Computers, Engineering & Science (75.7%), and Computers & Mathematics (70.0%), while the most female-oriented occupations are Health Diagnosing & Treating (79.7%), Education Instruction & Library (78.5%), and Health Technologists (77.5%).
| Occupation | Male | Female |
| Management | 28,777 (58.0%) | 20,807 (42.0%) |
| Business & Financial | 10,368 (42.2%) | 14,179 (57.8%) |
| Computers, Engineering & Science | 15,472 (75.7%) | 4,964 (24.3%) |
| Computers & Mathematics | 5,537 (70.0%) | 2,369 (30.0%) |
| Architecture & Engineering | 7,319 (86.7%) | 1,128 (13.4%) |
| Life, Physical & Social Science | 2,616 (64.1%) | 1,467 (35.9%) |
| Community & Social Service | 19,830 (30.6%) | 45,047 (69.4%) |
| Education, Arts & Media | 4,119 (36.3%) | 7,220 (63.7%) |
| Legal Services & Support | 2,484 (48.6%) | 2,626 (51.4%) |
| Education Instruction & Library | 8,739 (21.4%) | 31,996 (78.5%) |
| Arts, Media & Entertainment | 4,488 (58.3%) | 3,205 (41.7%) |
| Health Diagnosing & Treating | 10,112 (20.3%) | 39,666 (79.7%) |
| Health Technologists | 7,255 (22.5%) | 24,950 (77.5%) |
| Total (Category) | 84,559 (40.4%) | 124,663 (59.6%) |
| Total (Overall) | 297,902 (50.6%) | 290,740 (49.4%) |
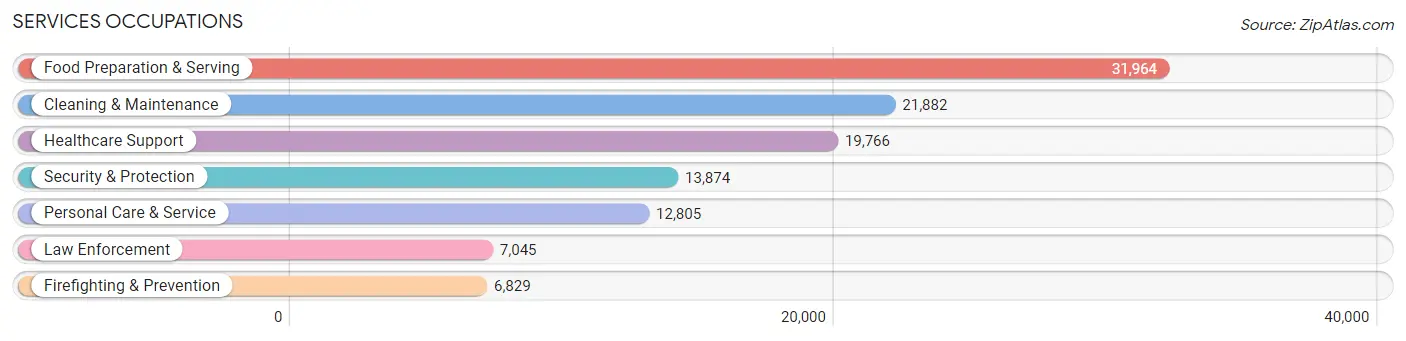
Services Occupations
The most common Services occupations in Area Code 601 are Food Preparation & Serving (31,964 | 5.4%), Cleaning & Maintenance (21,882 | 3.7%), Healthcare Support (19,766 | 3.4%), Security & Protection (13,874 | 2.4%), and Personal Care & Service (12,805 | 2.2%).
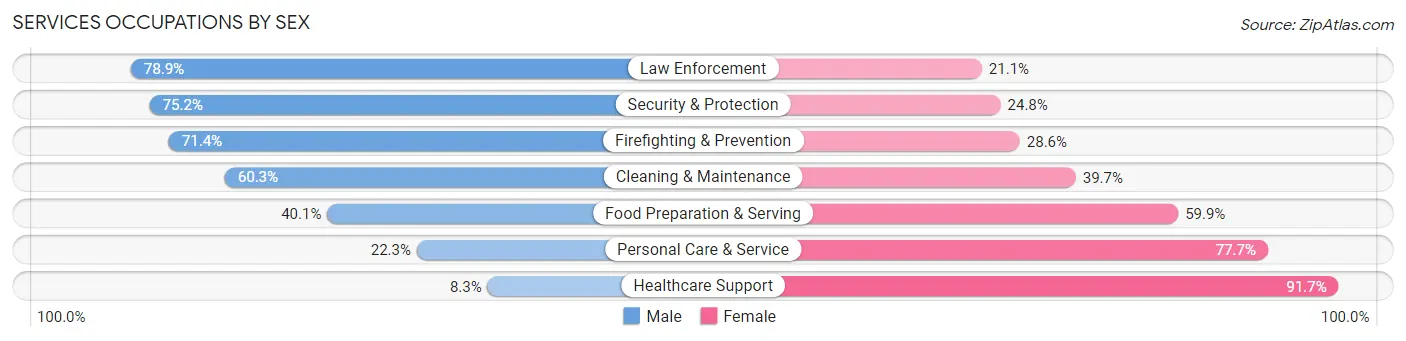
Services Occupations by Sex
Within the Services occupations in Area Code 601, the most male-oriented occupations are Law Enforcement (78.9%), Security & Protection (75.2%), and Firefighting & Prevention (71.4%), while the most female-oriented occupations are Healthcare Support (91.7%), Personal Care & Service (77.7%), and Food Preparation & Serving (59.9%).
| Occupation | Male | Female |
| Healthcare Support | 1,644 (8.3%) | 18,122 (91.7%) |
| Security & Protection | 10,438 (75.2%) | 3,436 (24.8%) |
| Firefighting & Prevention | 4,877 (71.4%) | 1,952 (28.6%) |
| Law Enforcement | 5,561 (78.9%) | 1,484 (21.1%) |
| Food Preparation & Serving | 12,809 (40.1%) | 19,155 (59.9%) |
| Cleaning & Maintenance | 13,204 (60.3%) | 8,678 (39.7%) |
| Personal Care & Service | 2,861 (22.3%) | 9,944 (77.7%) |
| Total (Category) | 40,956 (40.8%) | 59,335 (59.2%) |
| Total (Overall) | 297,902 (50.6%) | 290,740 (49.4%) |
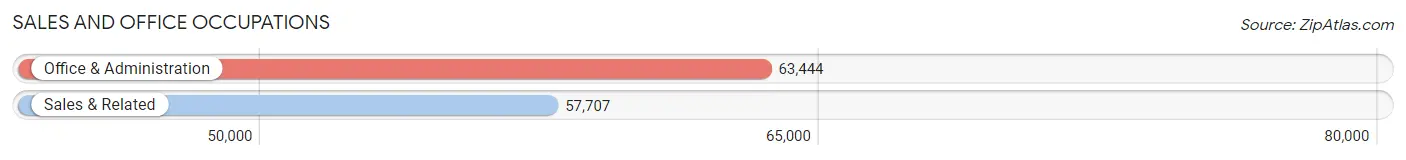
Sales and Office Occupations
The most common Sales and Office occupations in Area Code 601 are Office & Administration (63,444 | 10.8%), and Sales & Related (57,707 | 9.8%).
Sales and Office Occupations by Sex
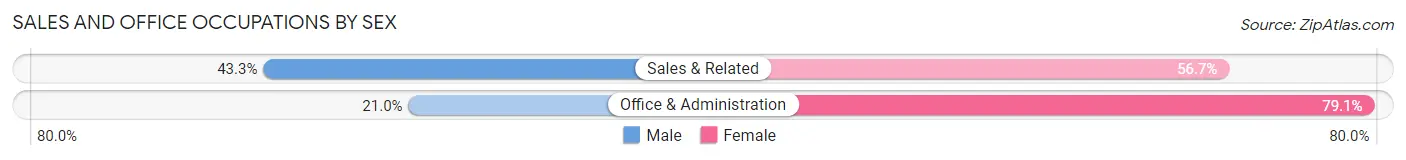
| Occupation | Male | Female |
| Sales & Related | 24,980 (43.3%) | 32,727 (56.7%) |
| Office & Administration | 13,293 (20.9%) | 50,151 (79.0%) |
| Total (Category) | 38,273 (31.6%) | 82,878 (68.4%) |
| Total (Overall) | 297,902 (50.6%) | 290,740 (49.4%) |
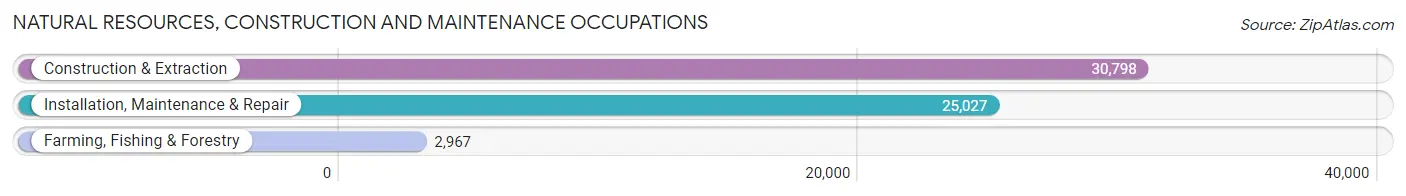
Natural Resources, Construction and Maintenance Occupations
The most common Natural Resources, Construction and Maintenance occupations in Area Code 601 are Construction & Extraction (30,798 | 5.2%), Installation, Maintenance & Repair (25,027 | 4.3%), and Farming, Fishing & Forestry (2,967 | 0.5%).
Natural Resources, Construction and Maintenance Occupations by Sex
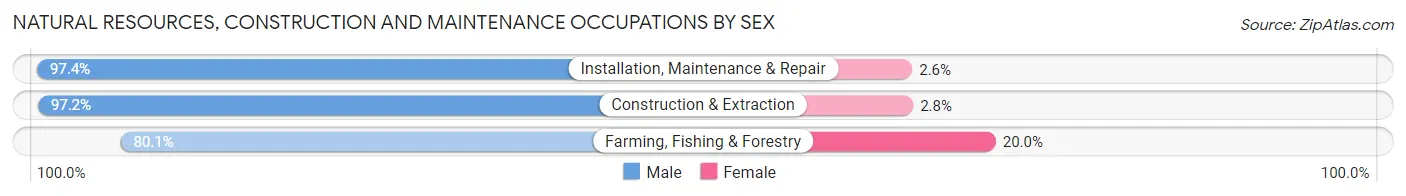
| Occupation | Male | Female |
| Farming, Fishing & Forestry | 2,375 (80.0%) | 592 (20.0%) |
| Construction & Extraction | 29,947 (97.2%) | 851 (2.8%) |
| Installation, Maintenance & Repair | 24,385 (97.4%) | 642 (2.6%) |
| Total (Category) | 56,707 (96.5%) | 2,085 (3.5%) |
| Total (Overall) | 297,902 (50.6%) | 290,740 (49.4%) |
Production, Transportation and Moving Occupations
The most common Production, Transportation and Moving occupations in Area Code 601 are Production (43,434 | 7.4%), Transportation (30,374 | 5.2%), and Material Moving (25,378 | 4.3%).
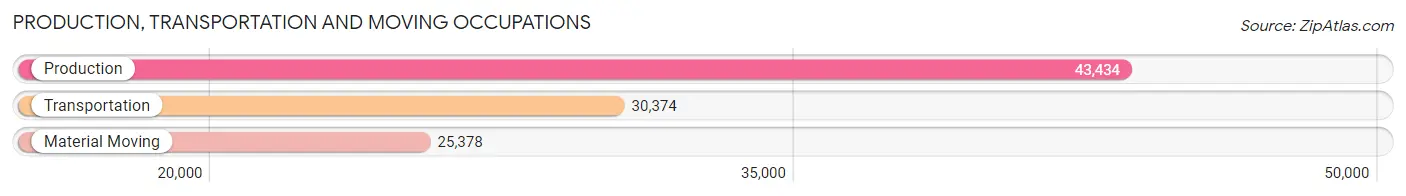
Production, Transportation and Moving Occupations by Sex
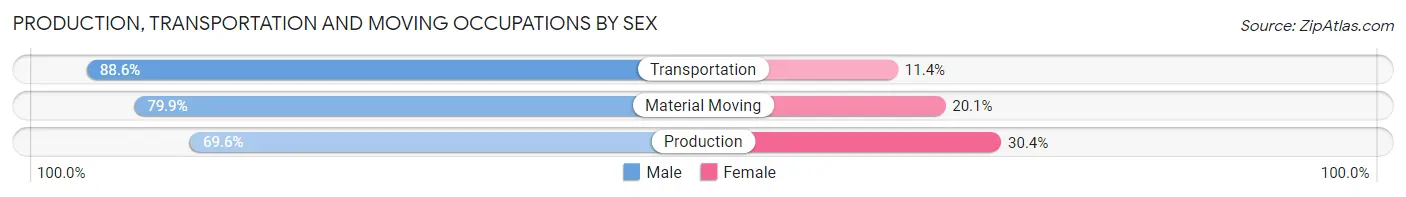
| Occupation | Male | Female |
| Production | 30,239 (69.6%) | 13,195 (30.4%) |
| Transportation | 26,900 (88.6%) | 3,474 (11.4%) |
| Material Moving | 20,268 (79.9%) | 5,110 (20.1%) |
| Total (Category) | 77,407 (78.0%) | 21,779 (22.0%) |
| Total (Overall) | 297,902 (50.6%) | 290,740 (49.4%) |
Employment Industries by Sex in Area Code 601
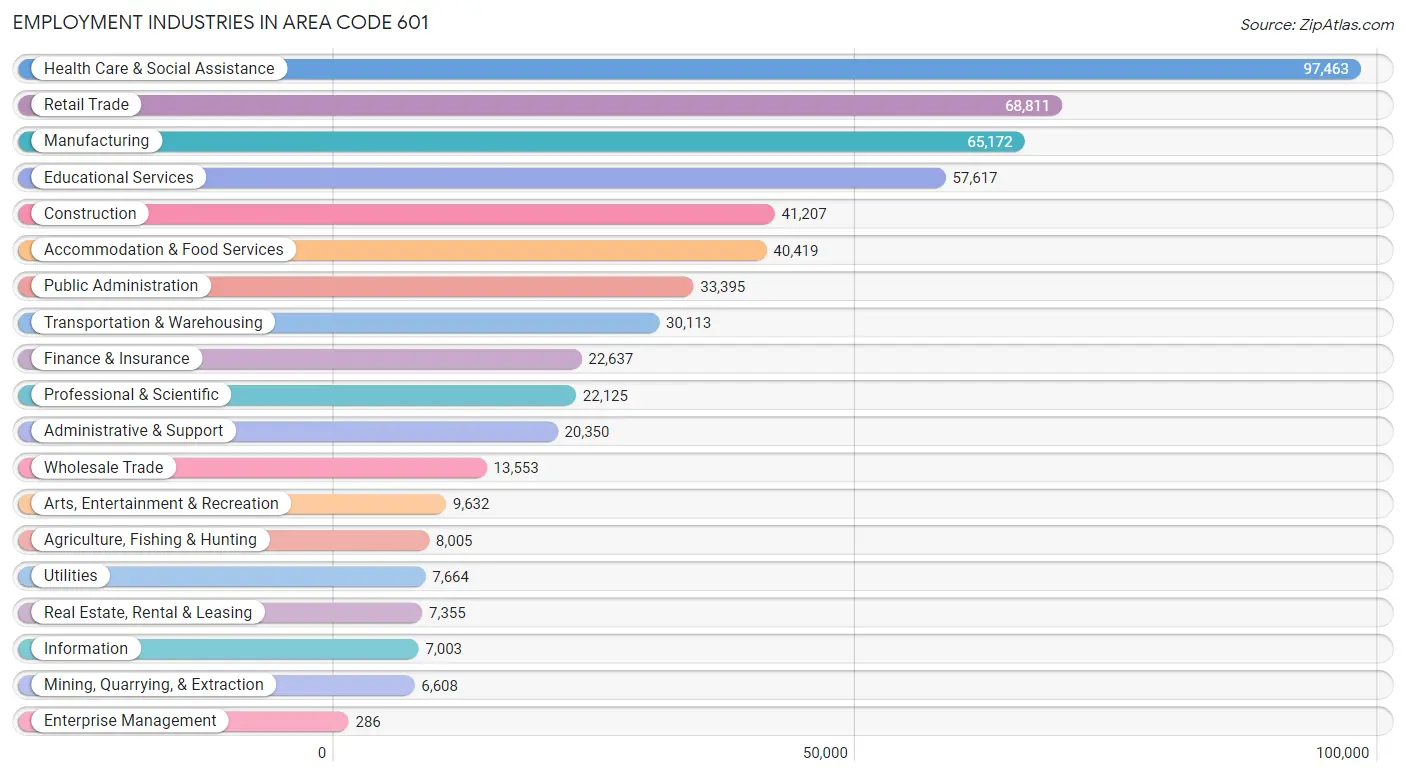
Employment Industries in Area Code 601
The major employment industries in Area Code 601 include Health Care & Social Assistance (97,463 | 16.6%), Retail Trade (68,811 | 11.7%), Manufacturing (65,172 | 11.1%), Educational Services (57,617 | 9.8%), and Construction (41,207 | 7.0%).
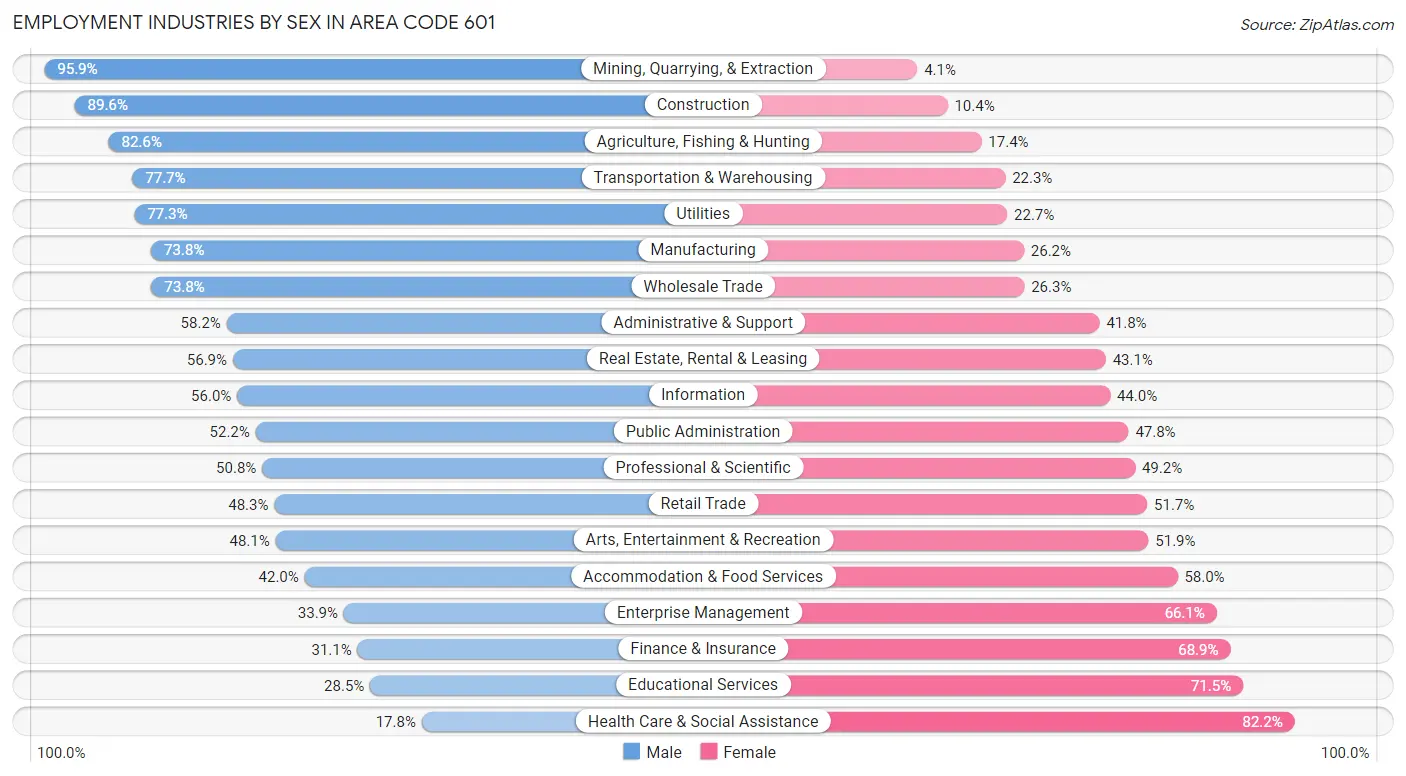
Employment Industries by Sex in Area Code 601
The Area Code 601 industries that see more men than women are Mining, Quarrying, & Extraction (95.9%), Construction (89.6%), and Agriculture, Fishing & Hunting (82.6%), whereas the industries that tend to have a higher number of women are Health Care & Social Assistance (82.2%), Educational Services (71.5%), and Finance & Insurance (68.9%).
| Industry | Male | Female |
| Agriculture, Fishing & Hunting | 6,614 (82.6%) | 1,391 (17.4%) |
| Mining, Quarrying, & Extraction | 6,337 (95.9%) | 271 (4.1%) |
| Construction | 36,939 (89.6%) | 4,268 (10.4%) |
| Manufacturing | 48,117 (73.8%) | 17,055 (26.2%) |
| Wholesale Trade | 9,995 (73.8%) | 3,558 (26.3%) |
| Retail Trade | 33,250 (48.3%) | 35,561 (51.7%) |
| Transportation & Warehousing | 23,396 (77.7%) | 6,717 (22.3%) |
| Utilities | 5,924 (77.3%) | 1,740 (22.7%) |
| Information | 3,922 (56.0%) | 3,081 (44.0%) |
| Finance & Insurance | 7,037 (31.1%) | 15,600 (68.9%) |
| Real Estate, Rental & Leasing | 4,184 (56.9%) | 3,171 (43.1%) |
| Professional & Scientific | 11,247 (50.8%) | 10,878 (49.2%) |
| Enterprise Management | 97 (33.9%) | 189 (66.1%) |
| Administrative & Support | 11,840 (58.2%) | 8,510 (41.8%) |
| Educational Services | 16,406 (28.5%) | 41,211 (71.5%) |
| Health Care & Social Assistance | 17,347 (17.8%) | 80,116 (82.2%) |
| Arts, Entertainment & Recreation | 4,629 (48.1%) | 5,003 (51.9%) |
| Accommodation & Food Services | 16,991 (42.0%) | 23,428 (58.0%) |
| Public Administration | 17,426 (52.2%) | 15,969 (47.8%) |
| Total | 297,902 (50.6%) | 290,740 (49.4%) |
Education in Area Code 601
School Enrollment in Area Code 601
The most common levels of schooling among the 345,193 students in Area Code 601 are middle school (76,050 | 22.0%), high school (74,834 | 21.7%), and elementary school (70,096 | 20.3%).
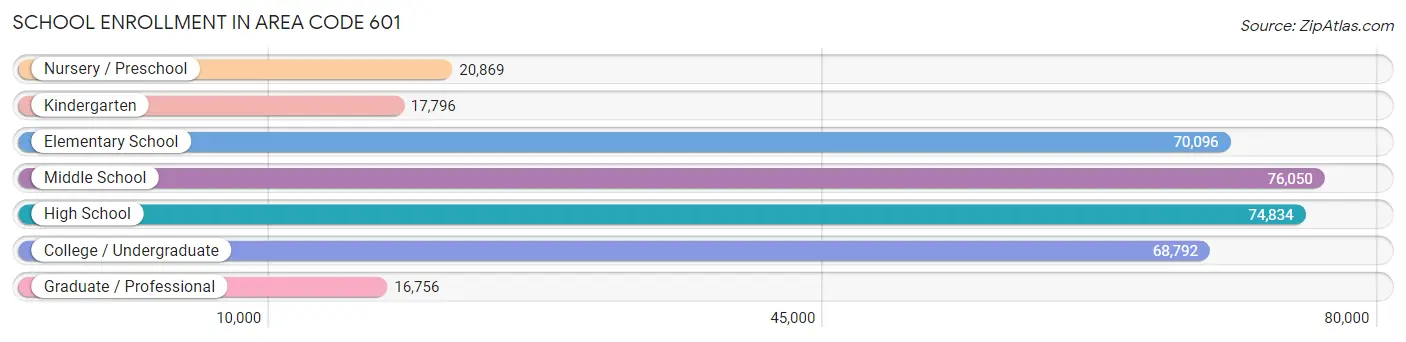
| School Level | # Students | % Students |
| Nursery / Preschool | 20,869 | 6.0% |
| Kindergarten | 17,796 | 5.2% |
| Elementary School | 70,096 | 20.3% |
| Middle School | 76,050 | 22.0% |
| High School | 74,834 | 21.7% |
| College / Undergraduate | 68,792 | 19.9% |
| Graduate / Professional | 16,756 | 4.9% |
| Total | 345,193 | 100.0% |
School Enrollment by Age by Funding Source in Area Code 601
Out of a total of 345,193 students who are enrolled in schools in Area Code 601, 59,932 (17.4%) attend a private institution, while the remaining 285,261 (82.6%) are enrolled in public schools. The age group of 3 to 4 year olds has the highest likelihood of being enrolled in private schools, with 7,743 (42.5% in the age bracket) enrolled. Conversely, the age group of 18 to 19 year olds has the lowest likelihood of being enrolled in a private school, with 27,117 (88.5% in the age bracket) attending a public institution.
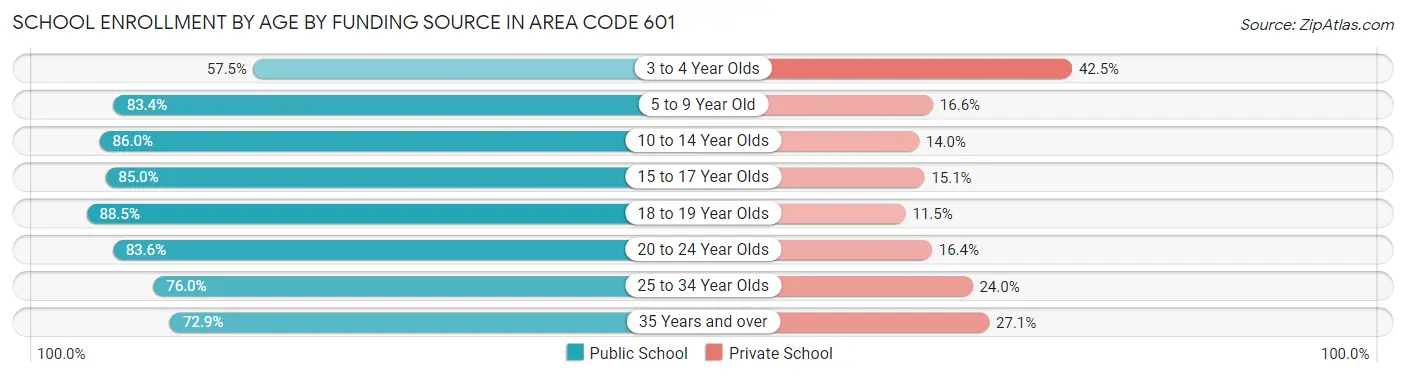
| Age Bracket | Public School | Private School |
| 3 to 4 Year Olds | 10,467 (57.5%) | 7,743 (42.5%) |
| 5 to 9 Year Old | 65,604 (83.4%) | 13,077 (16.6%) |
| 10 to 14 Year Olds | 82,484 (86.0%) | 13,411 (14.0%) |
| 15 to 17 Year Olds | 45,818 (85.0%) | 8,120 (15.0%) |
| 18 to 19 Year Olds | 27,117 (88.5%) | 3,534 (11.5%) |
| 20 to 24 Year Olds | 29,773 (83.6%) | 5,851 (16.4%) |
| 25 to 34 Year Olds | 13,330 (76.0%) | 4,208 (24.0%) |
| 35 Years and over | 10,685 (72.9%) | 3,971 (27.1%) |
| Total | 285,261 (82.6%) | 59,932 (17.4%) |
Educational Attainment by Field of Study in Area Code 601
Business (52,447 | 21.1%), education (45,406 | 18.2%), science & technology (34,307 | 13.8%), arts & humanities (18,919 | 7.6%), and bio, nature & agricultural (17,654 | 7.1%) are the most common fields of study among 248,906 individuals in Area Code 601 who have obtained a bachelor's degree or higher.
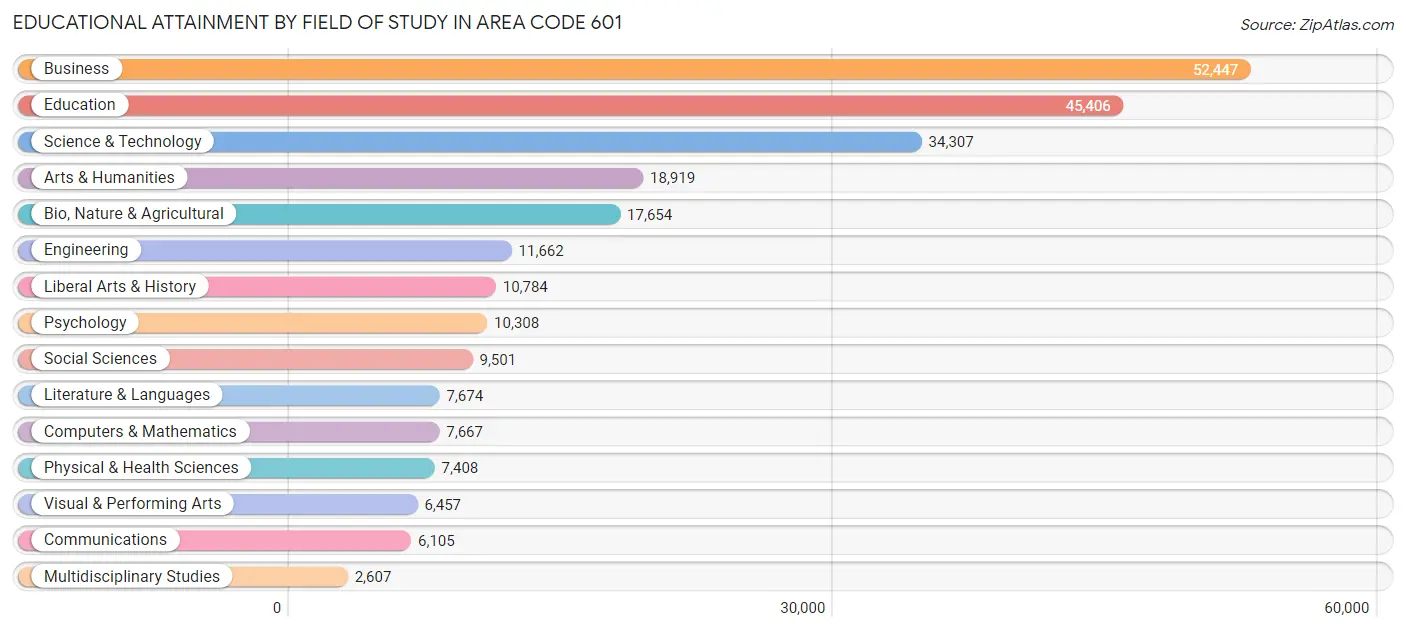
| Field of Study | # Graduates | % Graduates |
| Computers & Mathematics | 7,667 | 3.1% |
| Bio, Nature & Agricultural | 17,654 | 7.1% |
| Physical & Health Sciences | 7,408 | 3.0% |
| Psychology | 10,308 | 4.1% |
| Social Sciences | 9,501 | 3.8% |
| Engineering | 11,662 | 4.7% |
| Multidisciplinary Studies | 2,607 | 1.1% |
| Science & Technology | 34,307 | 13.8% |
| Business | 52,447 | 21.1% |
| Education | 45,406 | 18.2% |
| Literature & Languages | 7,674 | 3.1% |
| Liberal Arts & History | 10,784 | 4.3% |
| Visual & Performing Arts | 6,457 | 2.6% |
| Communications | 6,105 | 2.5% |
| Arts & Humanities | 18,919 | 7.6% |
| Total | 248,906 | 100.0% |
Transportation & Commute in Area Code 601
Vehicle Availability by Sex in Area Code 601
The most prevalent vehicle ownership categories in Area Code 601 are males with 2 vehicles (119,957, accounting for 40.8%) and females with 2 vehicles (107,759, making up 42.6%).
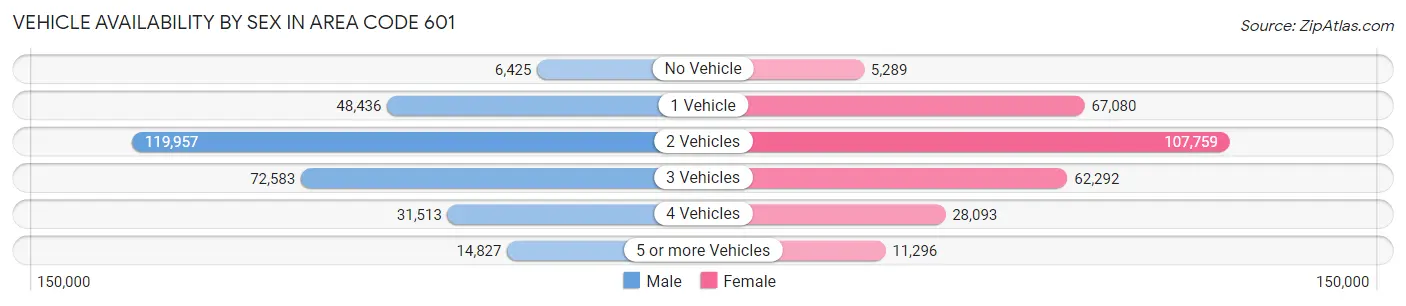
| Vehicles Available | Male | Female |
| No Vehicle | 6,425 (2.2%) | 5,289 (1.9%) |
| 1 Vehicle | 48,436 (16.5%) | 67,080 (23.8%) |
| 2 Vehicles | 119,957 (40.8%) | 107,759 (38.2%) |
| 3 Vehicles | 72,583 (24.7%) | 62,292 (22.1%) |
| 4 Vehicles | 31,513 (10.7%) | 28,093 (10.0%) |
| 5 or more Vehicles | 14,827 (5.1%) | 11,296 (4.0%) |
| Total | 293,741 (100.0%) | 281,809 (100.0%) |
Commute Time in Area Code 601
The most frequently occuring commute durations in Area Code 601 are 15 to 19 minutes (91,326 commuters, 16.5%), 20 to 24 minutes (83,202 commuters, 15.0%), and 10 to 14 minutes (79,018 commuters, 14.3%).
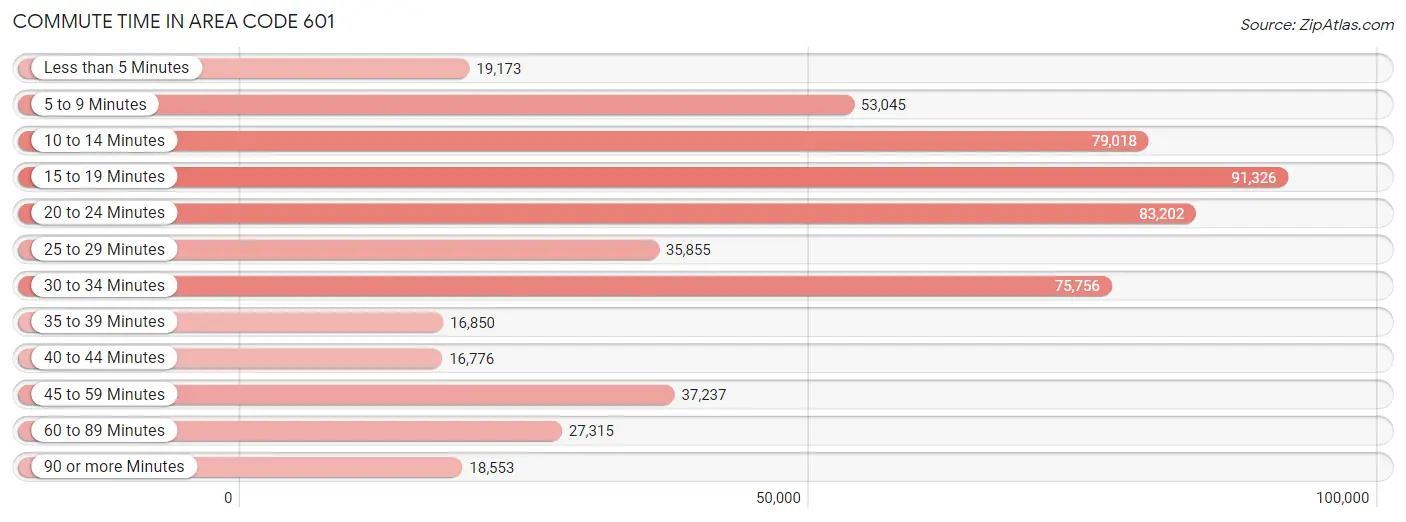
| Commute Time | # Commuters | % Commuters |
| Less than 5 Minutes | 19,173 | 3.5% |
| 5 to 9 Minutes | 53,045 | 9.6% |
| 10 to 14 Minutes | 79,018 | 14.3% |
| 15 to 19 Minutes | 91,326 | 16.5% |
| 20 to 24 Minutes | 83,202 | 15.0% |
| 25 to 29 Minutes | 35,855 | 6.5% |
| 30 to 34 Minutes | 75,756 | 13.7% |
| 35 to 39 Minutes | 16,850 | 3.0% |
| 40 to 44 Minutes | 16,776 | 3.0% |
| 45 to 59 Minutes | 37,237 | 6.7% |
| 60 to 89 Minutes | 27,315 | 4.9% |
| 90 or more Minutes | 18,553 | 3.4% |
Commute Time by Sex in Area Code 601
The most common commute times in Area Code 601 are 15 to 19 minutes (44,658 commuters, 15.7%) for males and 15 to 19 minutes (46,668 commuters, 17.3%) for females.
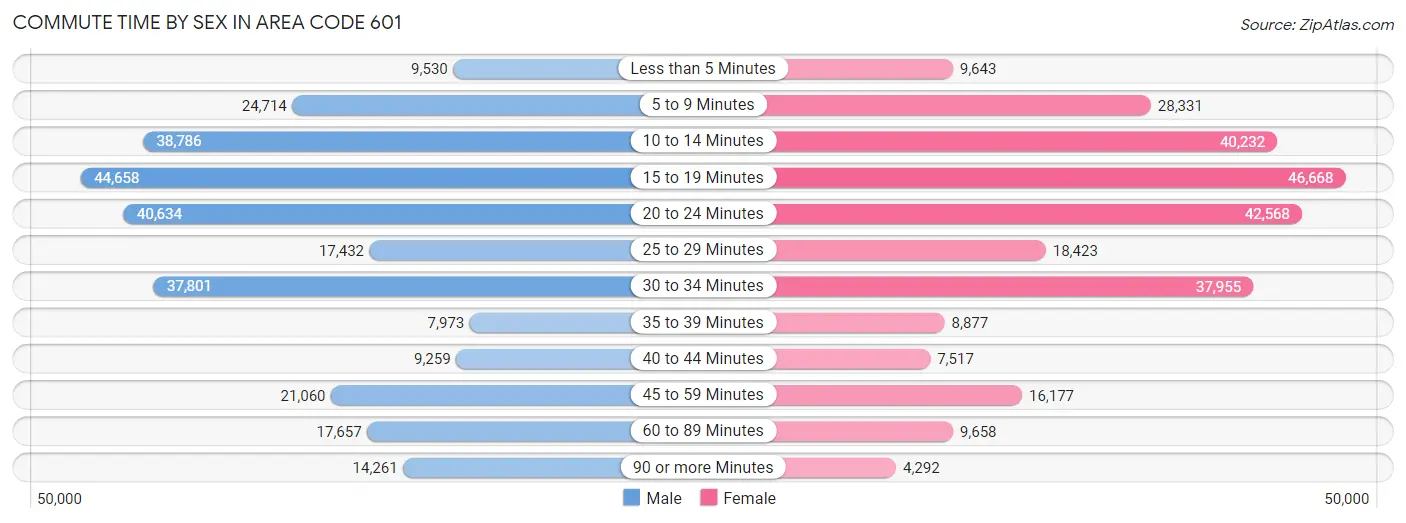
| Commute Time | Male | Female |
| Less than 5 Minutes | 9,530 (3.4%) | 9,643 (3.6%) |
| 5 to 9 Minutes | 24,714 (8.7%) | 28,331 (10.5%) |
| 10 to 14 Minutes | 38,786 (13.7%) | 40,232 (14.9%) |
| 15 to 19 Minutes | 44,658 (15.7%) | 46,668 (17.3%) |
| 20 to 24 Minutes | 40,634 (14.3%) | 42,568 (15.8%) |
| 25 to 29 Minutes | 17,432 (6.1%) | 18,423 (6.8%) |
| 30 to 34 Minutes | 37,801 (13.3%) | 37,955 (14.0%) |
| 35 to 39 Minutes | 7,973 (2.8%) | 8,877 (3.3%) |
| 40 to 44 Minutes | 9,259 (3.3%) | 7,517 (2.8%) |
| 45 to 59 Minutes | 21,060 (7.4%) | 16,177 (6.0%) |
| 60 to 89 Minutes | 17,657 (6.2%) | 9,658 (3.6%) |
| 90 or more Minutes | 14,261 (5.0%) | 4,292 (1.6%) |
Time of Departure to Work by Sex in Area Code 601
The most frequent times of departure to work in Area Code 601 are 7:00 AM to 7:29 AM (41,336, 14.6%) for males and 7:00 AM to 7:29 AM (55,351, 20.5%) for females.
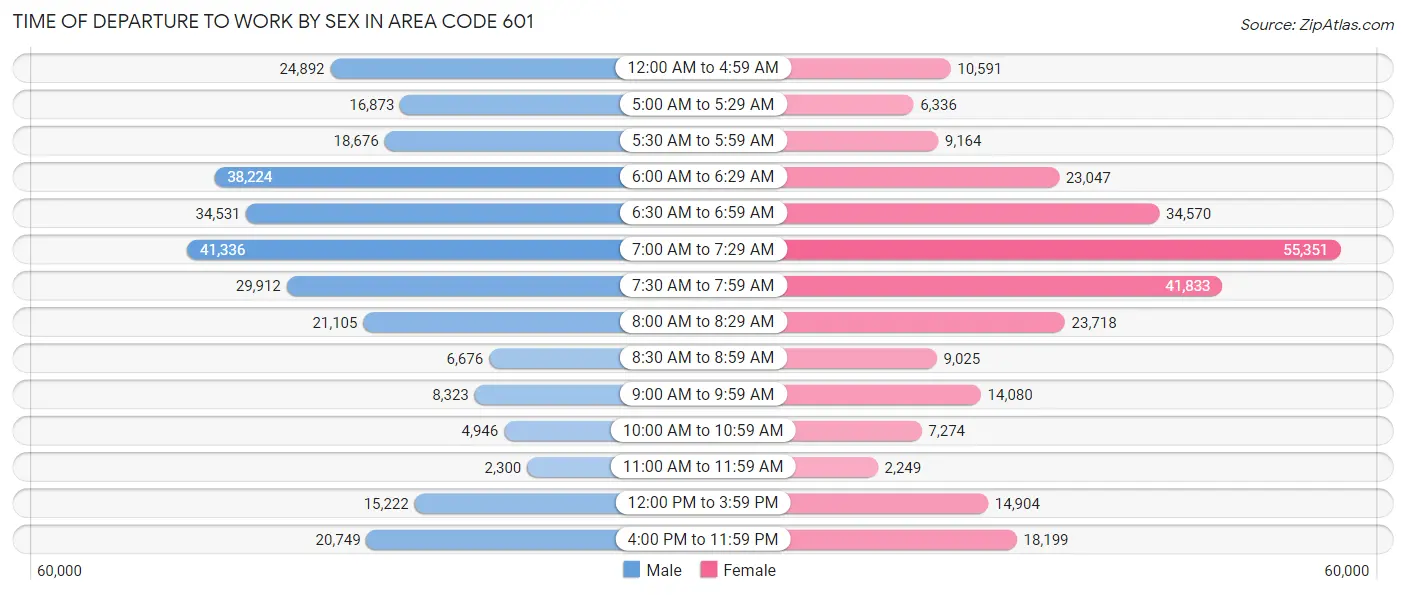
| Time of Departure | Male | Female |
| 12:00 AM to 4:59 AM | 24,892 (8.8%) | 10,591 (3.9%) |
| 5:00 AM to 5:29 AM | 16,873 (5.9%) | 6,336 (2.3%) |
| 5:30 AM to 5:59 AM | 18,676 (6.6%) | 9,164 (3.4%) |
| 6:00 AM to 6:29 AM | 38,224 (13.5%) | 23,047 (8.5%) |
| 6:30 AM to 6:59 AM | 34,531 (12.2%) | 34,570 (12.8%) |
| 7:00 AM to 7:29 AM | 41,336 (14.6%) | 55,351 (20.5%) |
| 7:30 AM to 7:59 AM | 29,912 (10.5%) | 41,833 (15.5%) |
| 8:00 AM to 8:29 AM | 21,105 (7.4%) | 23,718 (8.8%) |
| 8:30 AM to 8:59 AM | 6,676 (2.4%) | 9,025 (3.3%) |
| 9:00 AM to 9:59 AM | 8,323 (2.9%) | 14,080 (5.2%) |
| 10:00 AM to 10:59 AM | 4,946 (1.7%) | 7,274 (2.7%) |
| 11:00 AM to 11:59 AM | 2,300 (0.8%) | 2,249 (0.8%) |
| 12:00 PM to 3:59 PM | 15,222 (5.4%) | 14,904 (5.5%) |
| 4:00 PM to 11:59 PM | 20,749 (7.3%) | 18,199 (6.7%) |
| Total | 283,765 (100.0%) | 270,341 (100.0%) |
Housing Occupancy in Area Code 601
Occupancy by Ownership in Area Code 601
Of the total 528,542 dwellings in Area Code 601, owner-occupied units account for 374,277 (70.8%), while renter-occupied units make up 154,265 (29.2%).
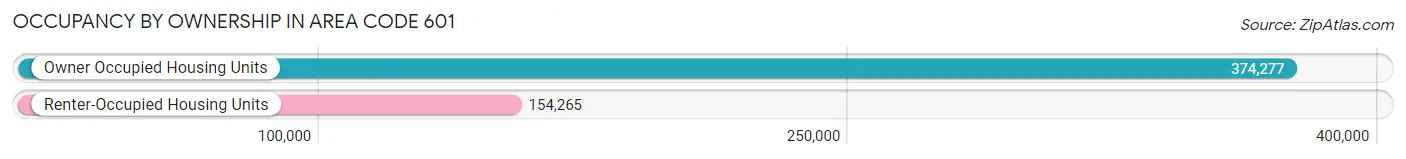
| Occupancy | # Housing Units | % Housing Units |
| Owner Occupied Housing Units | 374,277 | 70.8% |
| Renter-Occupied Housing Units | 154,265 | 29.2% |
| Total Occupied Housing Units | 528,542 | 100.0% |
Occupancy by Household Size in Area Code 601
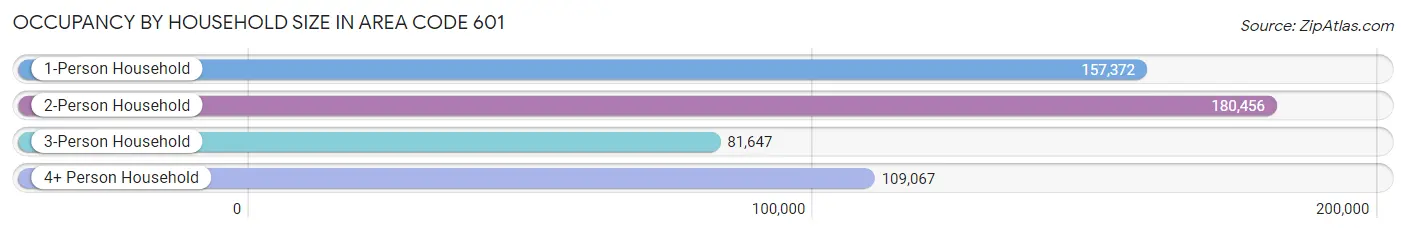
| Household Size | # Housing Units | % Housing Units |
| 1-Person Household | 157,372 | 29.8% |
| 2-Person Household | 180,456 | 34.1% |
| 3-Person Household | 81,647 | 15.4% |
| 4+ Person Household | 109,067 | 20.6% |
| Total Housing Units | 528,542 | 100.0% |
Occupancy by Ownership by Household Size in Area Code 601
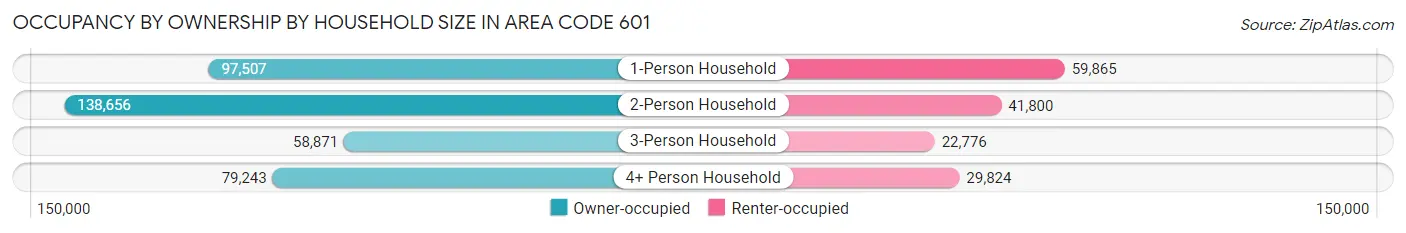
| Household Size | Owner-occupied | Renter-occupied |
| 1-Person Household | 97,507 (62.0%) | 59,865 (38.0%) |
| 2-Person Household | 138,656 (76.8%) | 41,800 (23.2%) |
| 3-Person Household | 58,871 (72.1%) | 22,776 (27.9%) |
| 4+ Person Household | 79,243 (72.7%) | 29,824 (27.3%) |
| Total Housing Units | 374,277 (70.8%) | 154,265 (29.2%) |
Occupancy by Educational Attainment in Area Code 601
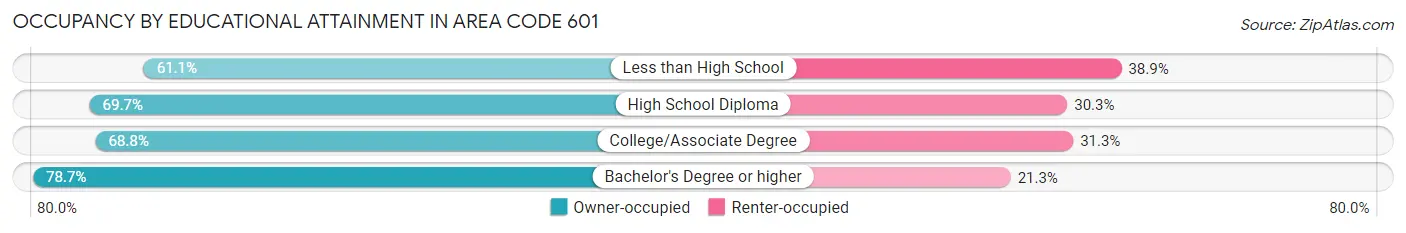
| Household Size | Owner-occupied | Renter-occupied |
| Less than High School | 36,689 (61.1%) | 23,367 (38.9%) |
| High School Diploma | 98,363 (69.7%) | 42,795 (30.3%) |
| College/Associate Degree | 126,573 (68.8%) | 57,535 (31.2%) |
| Bachelor's Degree or higher | 112,652 (78.7%) | 30,568 (21.3%) |
Occupancy by Age of Householder in Area Code 601
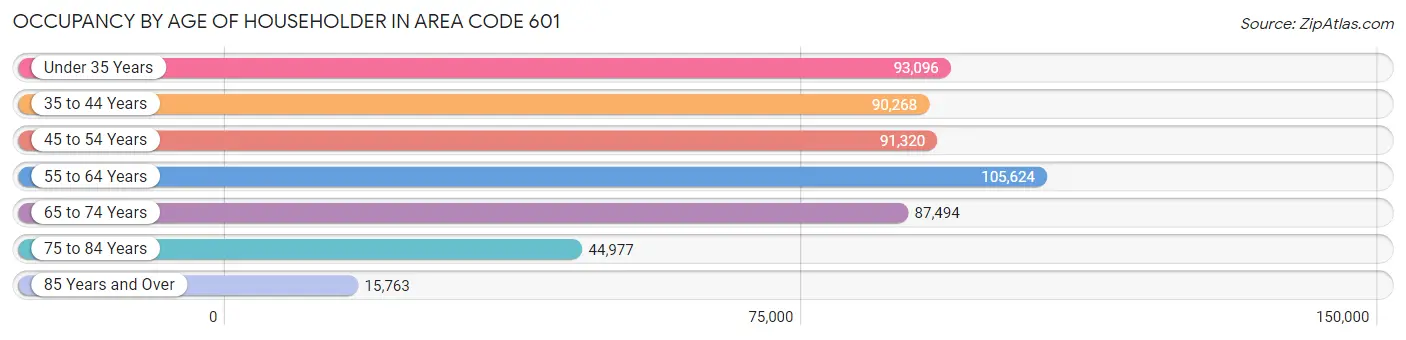
| Age Bracket | # Households | % Households |
| Under 35 Years | 93,096 | 17.6% |
| 35 to 44 Years | 90,268 | 17.1% |
| 45 to 54 Years | 91,320 | 17.3% |
| 55 to 64 Years | 105,624 | 20.0% |
| 65 to 74 Years | 87,494 | 16.6% |
| 75 to 84 Years | 44,977 | 8.5% |
| 85 Years and Over | 15,763 | 3.0% |
| Total | 528,542 | 100.0% |
Housing Finances in Area Code 601
Median Income by Occupancy in Area Code 601
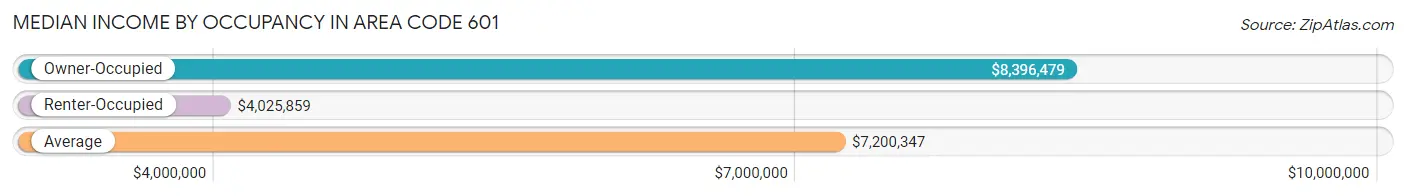
| Occupancy Type | # Households | Median Income |
| Owner-Occupied | 374,277 (70.8%) | $8,396,479 |
| Renter-Occupied | 154,265 (29.2%) | $4,025,859 |
| Average | 528,542 (100.0%) | $7,200,347 |
Occupancy by Householder Income Bracket in Area Code 601
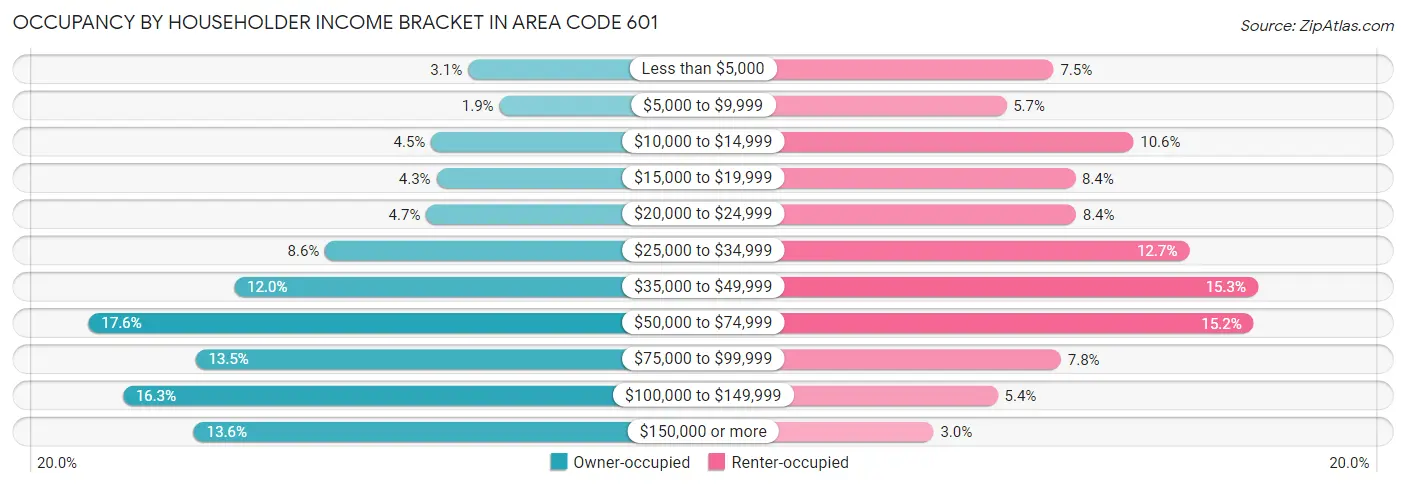
| Income Bracket | Owner-occupied | Renter-occupied |
| Less than $5,000 | 11,648 (3.1%) | 11,639 (7.5%) |
| $5,000 to $9,999 | 7,164 (1.9%) | 8,855 (5.7%) |
| $10,000 to $14,999 | 16,883 (4.5%) | 16,317 (10.6%) |
| $15,000 to $19,999 | 16,150 (4.3%) | 12,897 (8.4%) |
| $20,000 to $24,999 | 17,581 (4.7%) | 12,938 (8.4%) |
| $25,000 to $34,999 | 31,991 (8.6%) | 19,605 (12.7%) |
| $35,000 to $49,999 | 44,998 (12.0%) | 23,639 (15.3%) |
| $50,000 to $74,999 | 65,751 (17.6%) | 23,381 (15.2%) |
| $75,000 to $99,999 | 50,488 (13.5%) | 12,062 (7.8%) |
| $100,000 to $149,999 | 60,869 (16.3%) | 8,347 (5.4%) |
| $150,000 or more | 50,754 (13.6%) | 4,585 (3.0%) |
| Total | 374,277 (100.0%) | 154,265 (100.0%) |
Monthly Housing Cost Tiers in Area Code 601
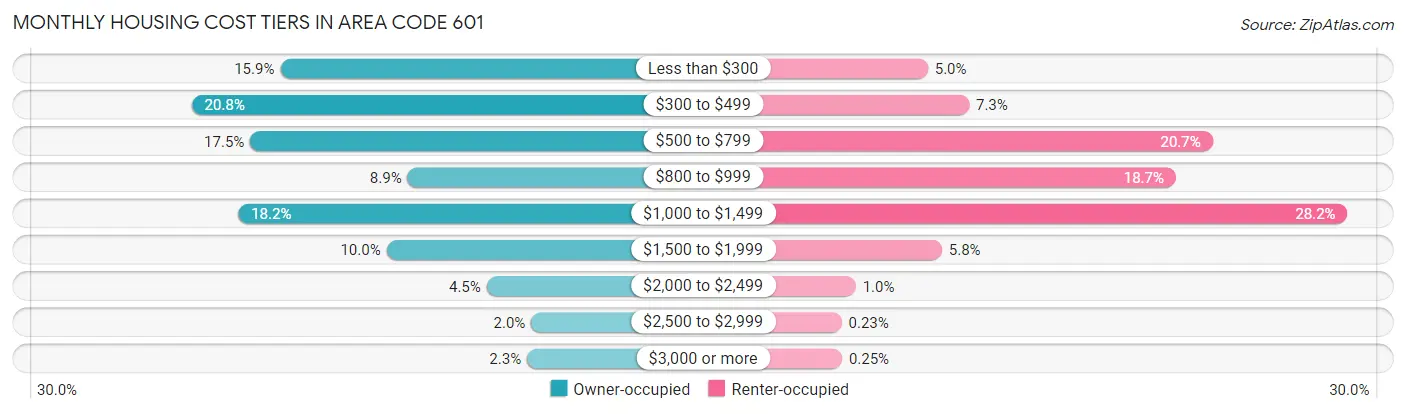
| Monthly Cost | Owner-occupied | Renter-occupied |
| Less than $300 | 59,431 (15.9%) | 7,703 (5.0%) |
| $300 to $499 | 77,781 (20.8%) | 11,211 (7.3%) |
| $500 to $799 | 65,647 (17.5%) | 31,969 (20.7%) |
| $800 to $999 | 33,138 (8.8%) | 28,834 (18.7%) |
| $1,000 to $1,499 | 68,109 (18.2%) | 43,452 (28.2%) |
| $1,500 to $1,999 | 37,449 (10.0%) | 8,900 (5.8%) |
| $2,000 to $2,499 | 16,767 (4.5%) | 1,551 (1.0%) |
| $2,500 to $2,999 | 7,545 (2.0%) | 352 (0.2%) |
| $3,000 or more | 8,410 (2.2%) | 378 (0.3%) |
| Total | 374,277 (100.0%) | 154,265 (100.0%) |
Physical Housing Characteristics in Area Code 601
Housing Structures in Area Code 601
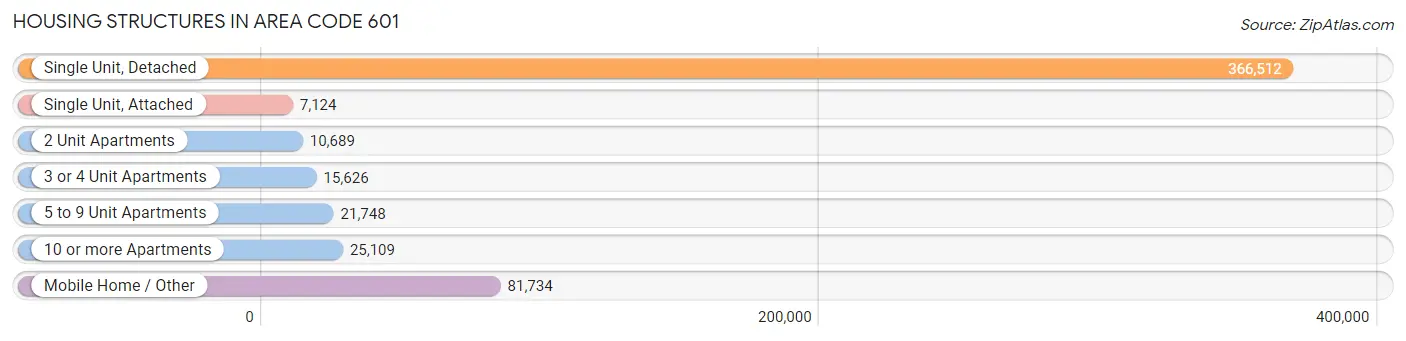
| Structure Type | # Housing Units | % Housing Units |
| Single Unit, Detached | 366,512 | 69.3% |
| Single Unit, Attached | 7,124 | 1.3% |
| 2 Unit Apartments | 10,689 | 2.0% |
| 3 or 4 Unit Apartments | 15,626 | 3.0% |
| 5 to 9 Unit Apartments | 21,748 | 4.1% |
| 10 or more Apartments | 25,109 | 4.8% |
| Mobile Home / Other | 81,734 | 15.5% |
| Total | 528,542 | 100.0% |
Housing Structures by Occupancy in Area Code 601
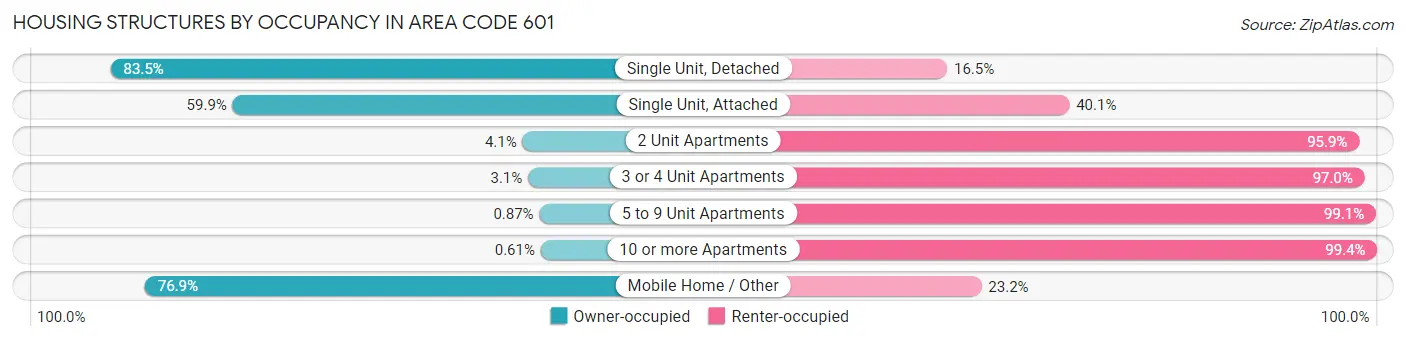
| Structure Type | Owner-occupied | Renter-occupied |
| Single Unit, Detached | 305,936 (83.5%) | 60,576 (16.5%) |
| Single Unit, Attached | 4,270 (59.9%) | 2,854 (40.1%) |
| 2 Unit Apartments | 440 (4.1%) | 10,249 (95.9%) |
| 3 or 4 Unit Apartments | 476 (3.0%) | 15,150 (97.0%) |
| 5 to 9 Unit Apartments | 190 (0.9%) | 21,558 (99.1%) |
| 10 or more Apartments | 152 (0.6%) | 24,957 (99.4%) |
| Mobile Home / Other | 62,813 (76.8%) | 18,921 (23.2%) |
| Total | 374,277 (70.8%) | 154,265 (29.2%) |
Housing Structures by Number of Rooms in Area Code 601
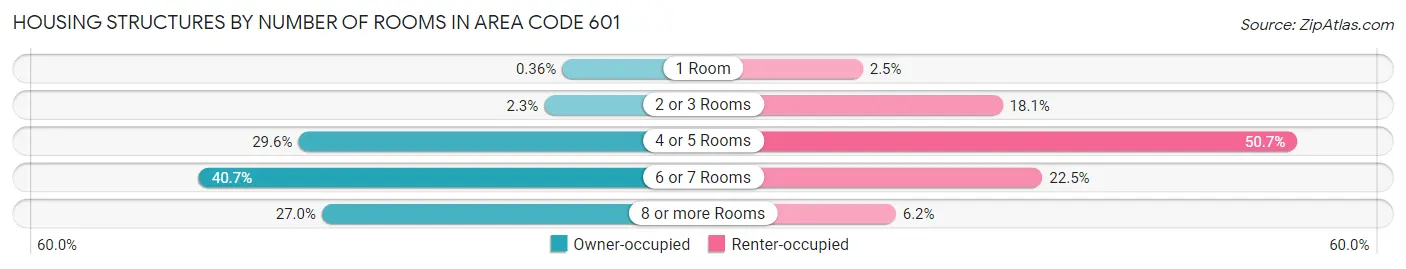
| Number of Rooms | Owner-occupied | Renter-occupied |
| 1 Room | 1,332 (0.4%) | 3,918 (2.5%) |
| 2 or 3 Rooms | 8,745 (2.3%) | 27,859 (18.1%) |
| 4 or 5 Rooms | 110,900 (29.6%) | 78,252 (50.7%) |
| 6 or 7 Rooms | 152,182 (40.7%) | 34,665 (22.5%) |
| 8 or more Rooms | 101,118 (27.0%) | 9,571 (6.2%) |
| Total | 374,277 (100.0%) | 154,265 (100.0%) |
Housing Structure by Heating Type in Area Code 601
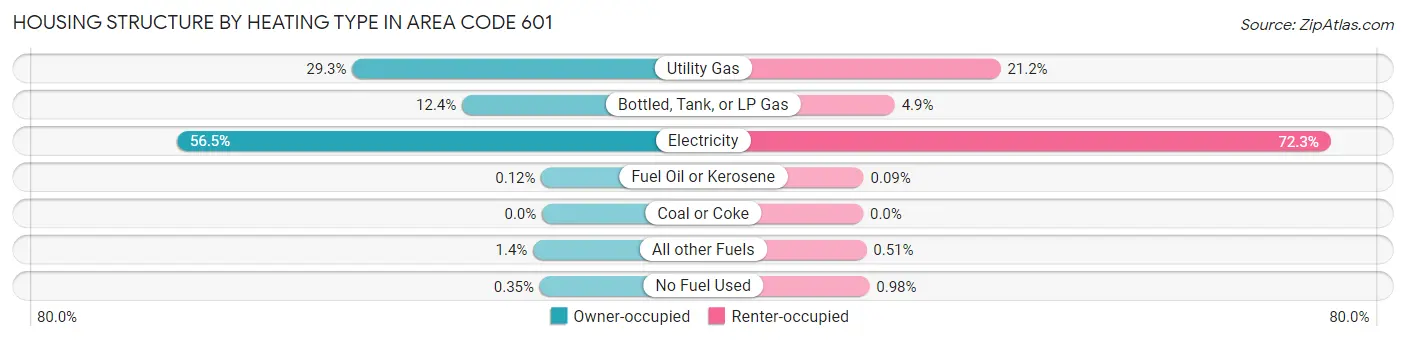
| Heating Type | Owner-occupied | Renter-occupied |
| Utility Gas | 109,781 (29.3%) | 32,773 (21.2%) |
| Bottled, Tank, or LP Gas | 46,287 (12.4%) | 7,563 (4.9%) |
| Electricity | 211,315 (56.5%) | 111,501 (72.3%) |
| Fuel Oil or Kerosene | 446 (0.1%) | 135 (0.1%) |
| Coal or Coke | 0 (0.0%) | 0 (0.0%) |
| All other Fuels | 5,147 (1.4%) | 782 (0.5%) |
| No Fuel Used | 1,301 (0.4%) | 1,511 (1.0%) |
| Total | 374,277 (100.0%) | 154,265 (100.0%) |
Household Vehicle Usage in Area Code 601
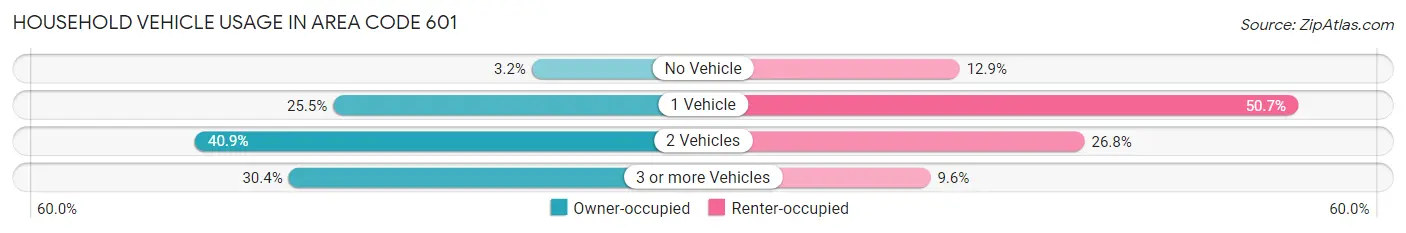
| Vehicles per Household | Owner-occupied | Renter-occupied |
| No Vehicle | 11,993 (3.2%) | 19,834 (12.9%) |
| 1 Vehicle | 95,262 (25.5%) | 78,239 (50.7%) |
| 2 Vehicles | 153,094 (40.9%) | 41,411 (26.8%) |
| 3 or more Vehicles | 113,928 (30.4%) | 14,781 (9.6%) |
| Total | 374,277 (100.0%) | 154,265 (100.0%) |
Real Estate & Mortgages in Area Code 601
Real Estate and Mortgage Overview in Area Code 601
| Characteristic | Without Mortgage | With Mortgage |
| Housing Units | 193,527 | 180,750 |
| Median Property Value | $15,015,000 | $21,346,000 |
| Median Household Income | $6,531,429 | $34,722 |
| Monthly Housing Costs | $59,039 | $8,198 |
| Real Estate Taxes | $99,553 | $26,005 |
Property Value by Mortgage Status in Area Code 601
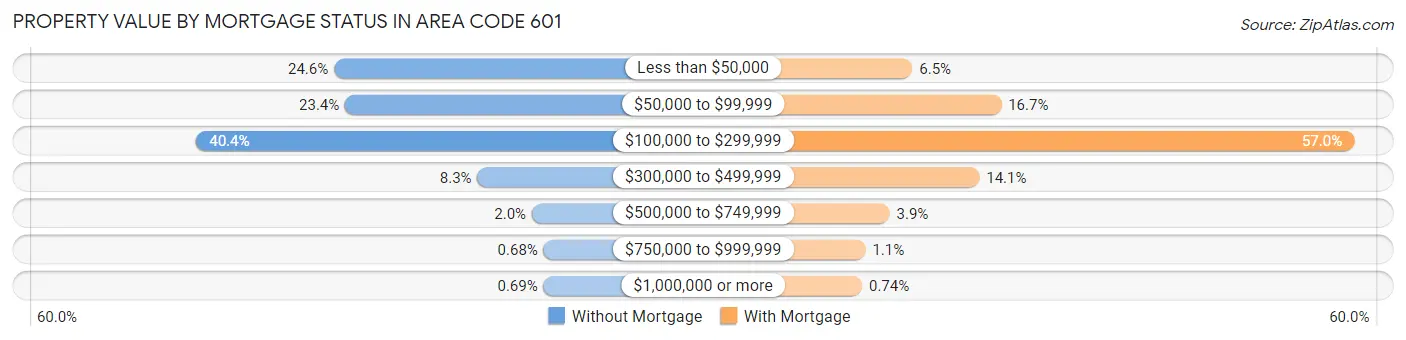
| Property Value | Without Mortgage | With Mortgage |
| Less than $50,000 | 47,661 (24.6%) | 11,723 (6.5%) |
| $50,000 to $99,999 | 45,230 (23.4%) | 30,093 (16.7%) |
| $100,000 to $299,999 | 78,122 (40.4%) | 102,972 (57.0%) |
| $300,000 to $499,999 | 15,967 (8.3%) | 25,552 (14.1%) |
| $500,000 to $749,999 | 3,913 (2.0%) | 7,034 (3.9%) |
| $750,000 to $999,999 | 1,307 (0.7%) | 2,047 (1.1%) |
| $1,000,000 or more | 1,327 (0.7%) | 1,329 (0.7%) |
| Total | 193,527 (100.0%) | 180,750 (100.0%) |
Household Income by Mortgage Status in Area Code 601
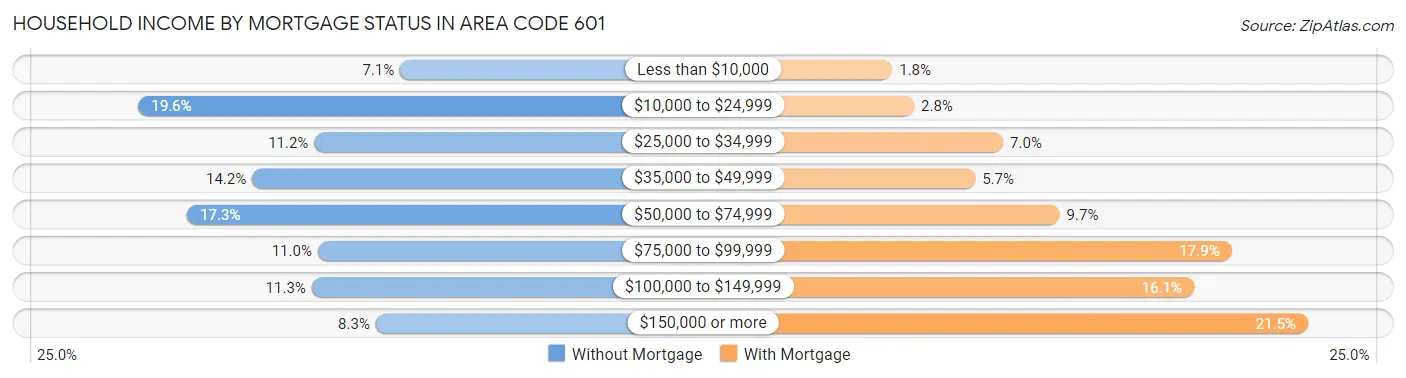
| Household Income | Without Mortgage | With Mortgage |
| Less than $10,000 | 13,777 (7.1%) | 3,158 (1.8%) |
| $10,000 to $24,999 | 37,902 (19.6%) | 5,035 (2.8%) |
| $25,000 to $34,999 | 21,697 (11.2%) | 12,712 (7.0%) |
| $35,000 to $49,999 | 27,425 (14.2%) | 10,294 (5.7%) |
| $50,000 to $74,999 | 33,400 (17.3%) | 17,573 (9.7%) |
| $75,000 to $99,999 | 21,366 (11.0%) | 32,351 (17.9%) |
| $100,000 to $149,999 | 21,928 (11.3%) | 29,122 (16.1%) |
| $150,000 or more | 16,032 (8.3%) | 38,941 (21.5%) |
| Total | 193,527 (100.0%) | 180,750 (100.0%) |
Property Value to Household Income Ratio in Area Code 601
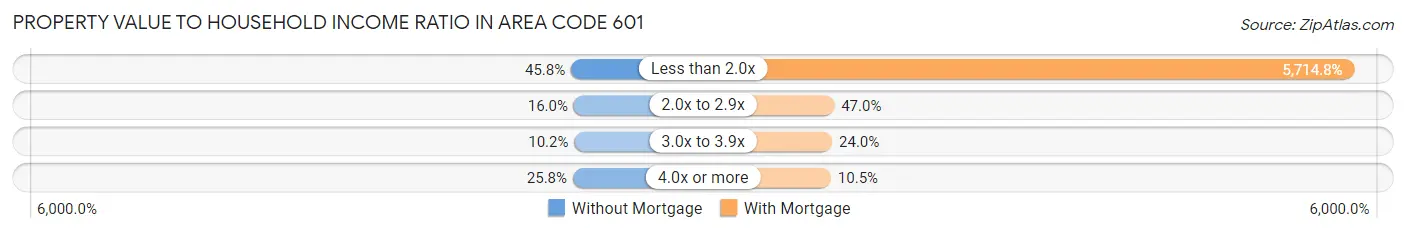
| Value-to-Income Ratio | Without Mortgage | With Mortgage |
| Less than 2.0x | 88,566 (45.8%) | 10,329,535 (5,714.8%) |
| 2.0x to 2.9x | 30,864 (16.0%) | 84,909 (47.0%) |
| 3.0x to 3.9x | 19,778 (10.2%) | 43,361 (24.0%) |
| 4.0x or more | 50,012 (25.8%) | 18,970 (10.5%) |
| Total | 193,527 (100.0%) | 180,750 (100.0%) |
Real Estate Taxes by Mortgage Status in Area Code 601
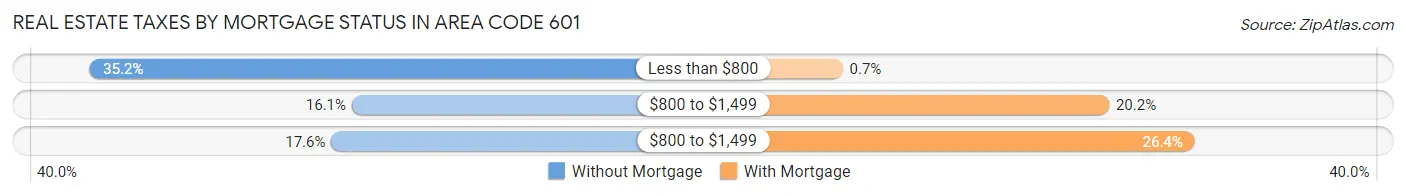
| Property Taxes | Without Mortgage | With Mortgage |
| Less than $800 | 68,150 (35.2%) | 1,267 (0.7%) |
| $800 to $1,499 | 31,131 (16.1%) | 36,432 (20.2%) |
| $800 to $1,499 | 34,044 (17.6%) | 47,778 (26.4%) |
| Total | 193,527 (100.0%) | 180,750 (100.0%) |
Health & Disability in Area Code 601
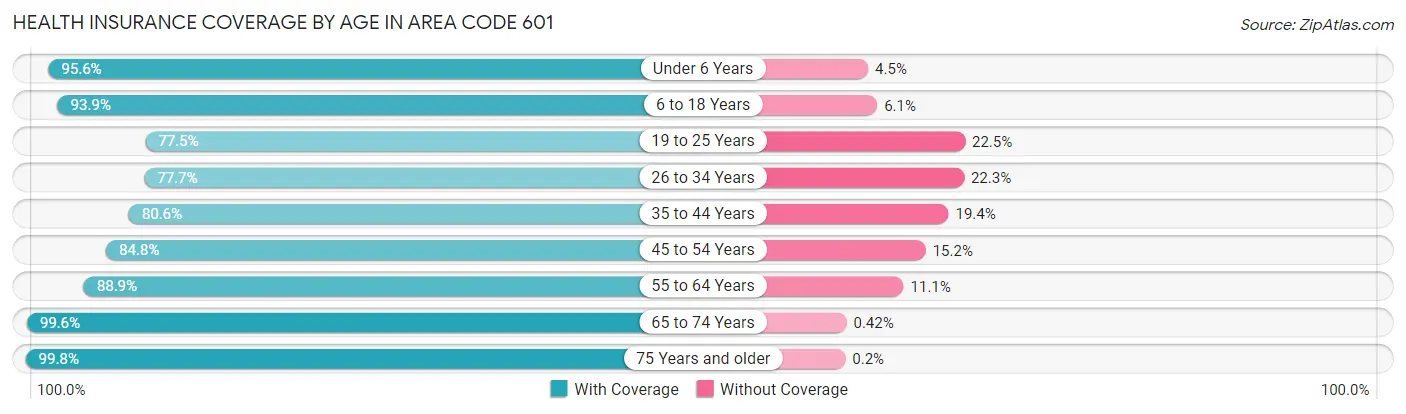
Health Insurance Coverage by Age in Area Code 601
| Age Bracket | With Coverage | Without Coverage |
| Under 6 Years | 96,622 (95.6%) | 4,501 (4.4%) |
| 6 to 18 Years | 232,282 (93.9%) | 15,188 (6.1%) |
| 19 to 25 Years | 100,480 (77.5%) | 29,191 (22.5%) |
| 26 to 34 Years | 117,049 (77.7%) | 33,640 (22.3%) |
| 35 to 44 Years | 136,942 (80.6%) | 33,038 (19.4%) |
| 45 to 54 Years | 139,322 (84.8%) | 24,960 (15.2%) |
| 55 to 64 Years | 157,308 (88.9%) | 19,569 (11.1%) |
| 65 to 74 Years | 137,168 (99.6%) | 577 (0.4%) |
| 75 Years and older | 88,216 (99.8%) | 179 (0.2%) |
| Total | 1,205,389 (88.2%) | 160,843 (11.8%) |
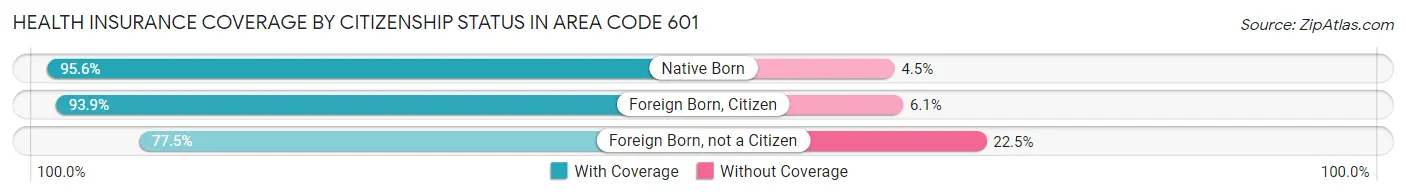
Health Insurance Coverage by Citizenship Status in Area Code 601
| Citizenship Status | With Coverage | Without Coverage |
| Native Born | 96,622 (95.6%) | 4,501 (4.4%) |
| Foreign Born, Citizen | 232,282 (93.9%) | 15,188 (6.1%) |
| Foreign Born, not a Citizen | 100,480 (77.5%) | 29,191 (22.5%) |
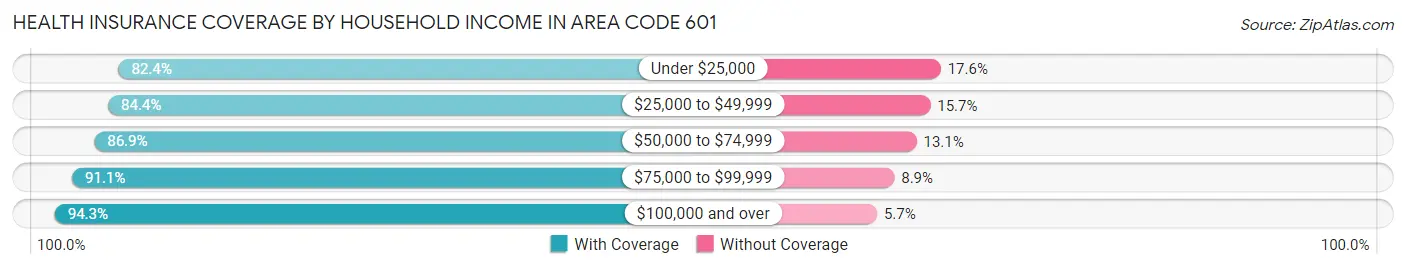
Health Insurance Coverage by Household Income in Area Code 601
| Household Income | With Coverage | Without Coverage |
| Under $25,000 | 208,656 (82.4%) | 44,560 (17.6%) |
| $25,000 to $49,999 | 237,468 (84.4%) | 44,074 (15.7%) |
| $50,000 to $74,999 | 203,786 (86.9%) | 30,621 (13.1%) |
| $75,000 to $99,999 | 161,980 (91.1%) | 15,834 (8.9%) |
| $100,000 and over | 377,571 (94.3%) | 22,666 (5.7%) |
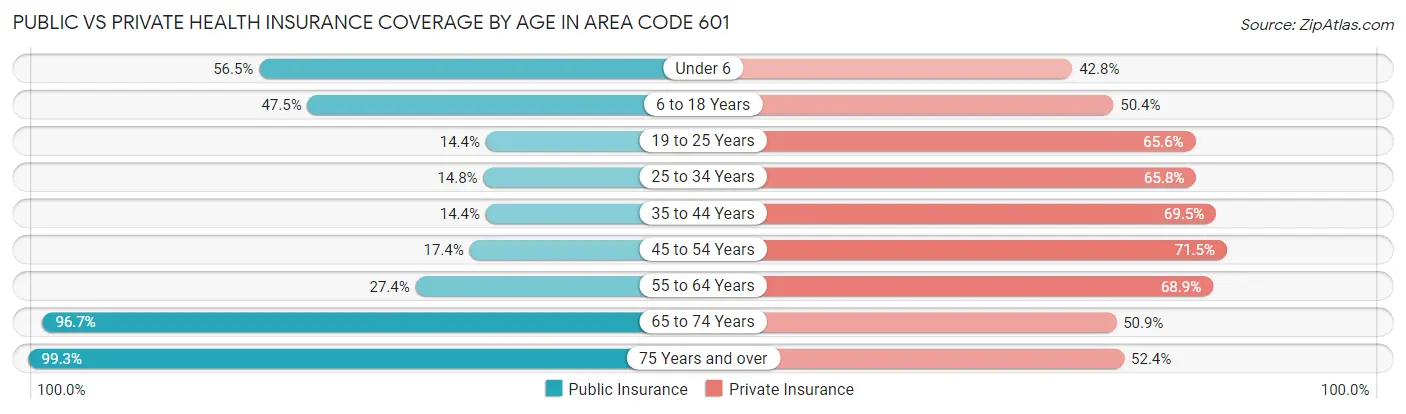
Public vs Private Health Insurance Coverage by Age in Area Code 601
| Age Bracket | Public Insurance | Private Insurance |
| Under 6 | 57,094 (56.5%) | 43,249 (42.8%) |
| 6 to 18 Years | 117,528 (47.5%) | 124,696 (50.4%) |
| 19 to 25 Years | 18,677 (14.4%) | 85,097 (65.6%) |
| 25 to 34 Years | 22,359 (14.8%) | 99,111 (65.8%) |
| 35 to 44 Years | 24,454 (14.4%) | 118,106 (69.5%) |
| 45 to 54 Years | 28,594 (17.4%) | 117,404 (71.5%) |
| 55 to 64 Years | 48,491 (27.4%) | 121,845 (68.9%) |
| 65 to 74 Years | 133,176 (96.7%) | 70,159 (50.9%) |
| 75 Years and over | 87,730 (99.3%) | 46,322 (52.4%) |
| Total | 538,103 (39.4%) | 825,989 (60.5%) |
Disability Status by Sex by Age in Area Code 601
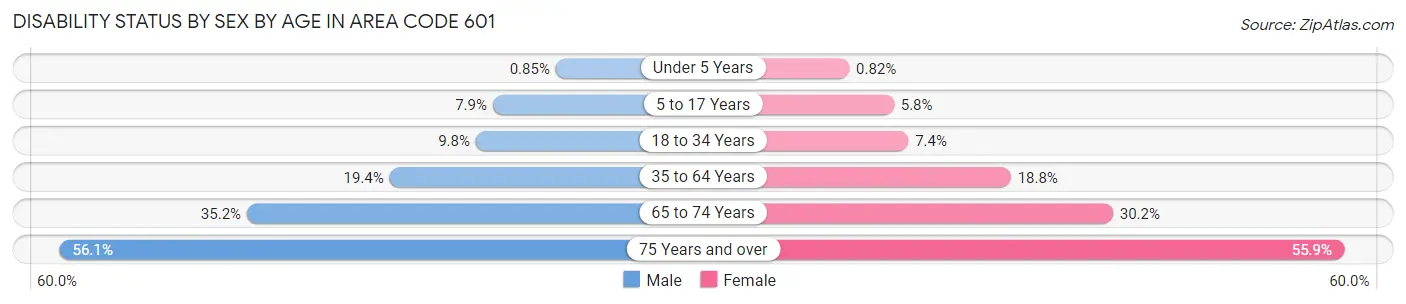
| Age Bracket | Male | Female |
| Under 5 Years | 372 (0.9%) | 342 (0.8%) |
| 5 to 17 Years | 9,676 (7.9%) | 6,883 (5.8%) |
| 18 to 34 Years | 14,063 (9.8%) | 11,653 (7.4%) |
| 35 to 64 Years | 46,928 (19.4%) | 50,543 (18.8%) |
| 65 to 74 Years | 22,367 (35.2%) | 22,416 (30.2%) |
| 75 Years and over | 19,824 (56.1%) | 29,662 (55.9%) |
Disability Class by Sex by Age in Area Code 601
Disability Class: Hearing Difficulty
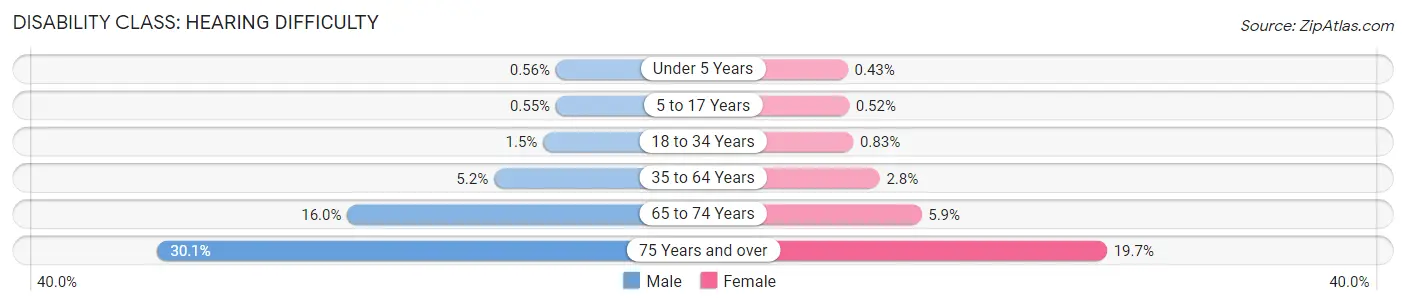
| Age Bracket | Male | Female |
| Under 5 Years | 243 (0.6%) | 180 (0.4%) |
| 5 to 17 Years | 677 (0.5%) | 623 (0.5%) |
| 18 to 34 Years | 2,160 (1.5%) | 1,311 (0.8%) |
| 35 to 64 Years | 12,481 (5.1%) | 7,534 (2.8%) |
| 65 to 74 Years | 10,184 (16.0%) | 4,382 (5.9%) |
| 75 Years and over | 10,648 (30.1%) | 10,439 (19.7%) |
Disability Class: Vision Difficulty
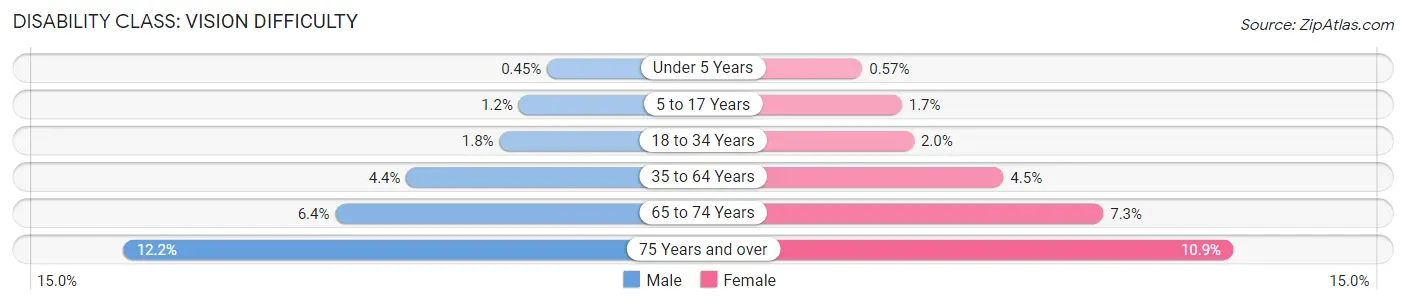
| Age Bracket | Male | Female |
| Under 5 Years | 194 (0.4%) | 237 (0.6%) |
| 5 to 17 Years | 1,531 (1.2%) | 1,986 (1.7%) |
| 18 to 34 Years | 2,566 (1.8%) | 3,161 (2.0%) |
| 35 to 64 Years | 10,601 (4.4%) | 12,096 (4.5%) |
| 65 to 74 Years | 4,031 (6.4%) | 5,407 (7.3%) |
| 75 Years and over | 4,326 (12.2%) | 5,777 (10.9%) |
Disability Class: Cognitive Difficulty
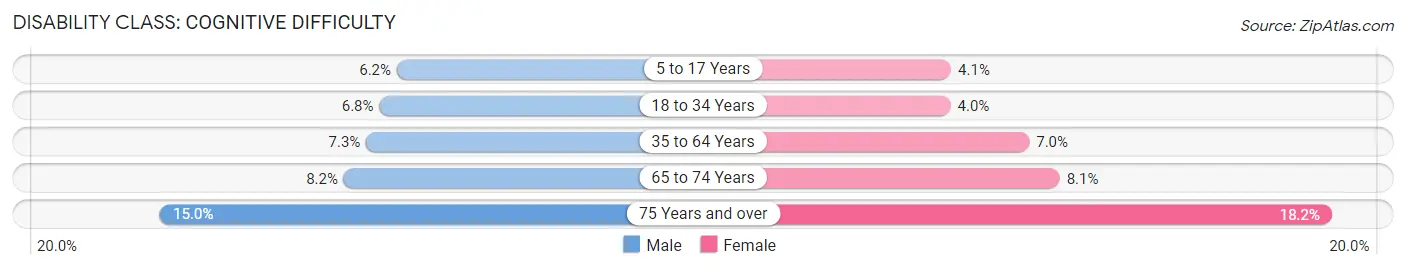
| Age Bracket | Male | Female |
| 5 to 17 Years | 7,604 (6.2%) | 4,833 (4.1%) |
| 18 to 34 Years | 9,860 (6.8%) | 6,360 (4.0%) |
| 35 to 64 Years | 17,752 (7.3%) | 18,697 (7.0%) |
| 65 to 74 Years | 5,174 (8.2%) | 6,011 (8.1%) |
| 75 Years and over | 5,291 (15.0%) | 9,652 (18.2%) |
Disability Class: Ambulatory Difficulty
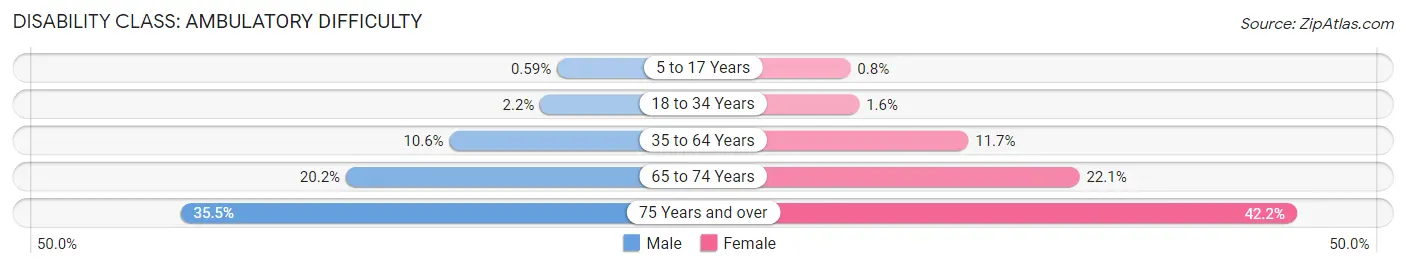
| Age Bracket | Male | Female |
| 5 to 17 Years | 731 (0.6%) | 957 (0.8%) |
| 18 to 34 Years | 3,100 (2.1%) | 2,558 (1.6%) |
| 35 to 64 Years | 25,619 (10.6%) | 31,537 (11.7%) |
| 65 to 74 Years | 12,811 (20.2%) | 16,387 (22.1%) |
| 75 Years and over | 12,550 (35.5%) | 22,404 (42.2%) |
Disability Class: Self-Care Difficulty
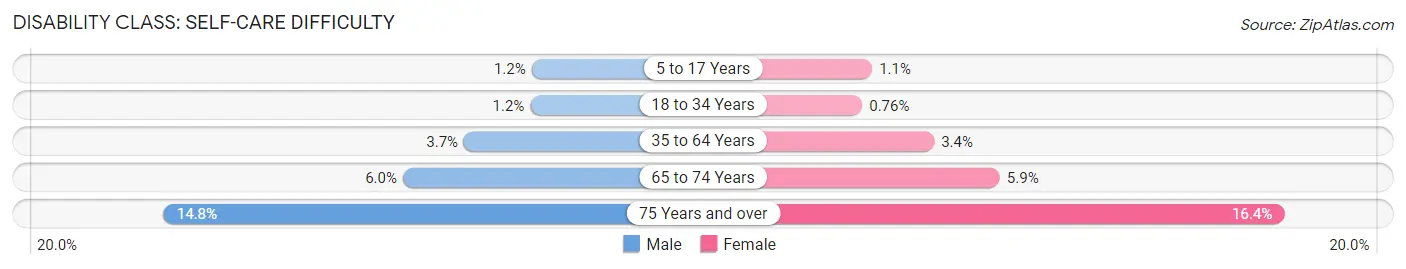
| Age Bracket | Male | Female |
| 5 to 17 Years | 1,458 (1.2%) | 1,350 (1.1%) |
| 18 to 34 Years | 1,772 (1.2%) | 1,196 (0.8%) |
| 35 to 64 Years | 8,941 (3.7%) | 9,215 (3.4%) |
| 65 to 74 Years | 3,783 (6.0%) | 4,363 (5.9%) |
| 75 Years and over | 5,239 (14.8%) | 8,714 (16.4%) |
Technology Access in Area Code 601
Computing Device Access in Area Code 601
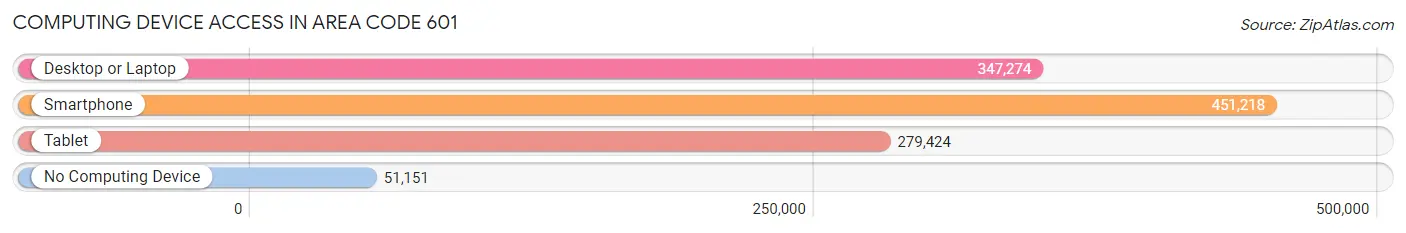
| Device Type | # Households | % Households |
| Desktop or Laptop | 347,274 | 65.7% |
| Smartphone | 451,218 | 85.4% |
| Tablet | 279,424 | 52.9% |
| No Computing Device | 51,151 | 9.7% |
| Total | 528,542 | 100.0% |
Internet Access in Area Code 601
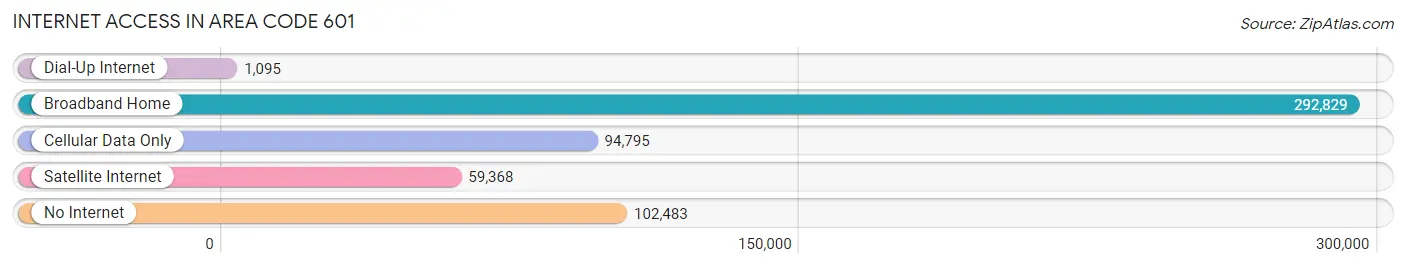
| Internet Type | # Households | % Households |
| Dial-Up Internet | 1,095 | 0.2% |
| Broadband Home | 292,829 | 55.4% |
| Cellular Data Only | 94,795 | 17.9% |
| Satellite Internet | 59,368 | 11.2% |
| No Internet | 102,483 | 19.4% |
| Total | 528,542 | 100.0% |
Area Code 601 Summary
Geography
Area code 601 is located in the state of Mississippi. It covers the entire state, including the cities of Jackson, Hattiesburg, and Gulfport.
Social
Area code 601 is home to a diverse population of people from all walks of life. The area is known for its friendly and welcoming atmosphere, and its residents are proud of their Southern heritage.
Economics
Area code 601 is home to a thriving economy. The area is home to a number of large corporations, including Nissan, Tyson Foods, and Entergy. The area also has a strong agricultural sector, with cotton, soybeans, and corn being the main crops.
Demographics
Area code 601 is home to a population of over 3 million people. The majority of the population is African American, with a smaller percentage of whites and other ethnicities. The median household income is around $40,000, and the unemployment rate is around 5%.
Common Questions
What is Per Capita Income in Area Code 601?
Per Capita income in Area Code 601 is $25,881.
What is the Median Family Income in Area Code 601?
Median Family Income in Area Code 601 is $64,698.
What is the Median Household income in Area Code 601?
Median Household Income in Area Code 601 is $49,658.
What is Income or Wage Gap in Area Code 601?
Income or Wage Gap in Area Code 601 is 33.4%.
Women in Area Code 601 earn 66.6 cents for every dollar earned by a man.
What is Family Income Deficit in Area Code 601?
Family Income Deficit in Area Code 601 is $11,619.
Families that are below poverty line in Area Code 601 earn $11,619 less on average than the poverty threshold level.
What is Inequality or Gini Index in Area Code 601?
Inequality or Gini Index in Area Code 601 is 69.67.
What is the Total Population of Area Code 601?
Total Population of Area Code 601 is 1,396,444.
What is the Total Male Population of Area Code 601?
Total Male Population of Area Code 601 is 674,565.
What is the Total Female Population of Area Code 601?
Total Female Population of Area Code 601 is 721,879.
What is the Ratio of Males per 100 Females in Area Code 601?
There are 93.45 Males per 100 Females in Area Code 601.
What is the Ratio of Females per 100 Males in Area Code 601?
There are 107.01 Females per 100 Males in Area Code 601.
What is the Median Population Age in Area Code 601?
Median Population Age in Area Code 601 is 39.4 Years.
What is the Average Family Size in Area Code 601
Average Family Size in Area Code 601 is 3.2 People.
What is the Average Household Size in Area Code 601
Average Household Size in Area Code 601 is 2.6 People.
How Large is the Labor Force in Area Code 601?
There are 584,584 People in the Labor Forcein in Area Code 601.
What is the Percentage of People in the Labor Force in Area Code 601?
52.8% of People are in the Labor Force in Area Code 601.
What is the Unemployment Rate in Area Code 601?
Unemployment Rate in Area Code 601 is 7.0%.