Greenville, MS Map & Demographics
Greenville Map
Greenville Overview
$22,111
PER CAPITA INCOME
$46,043
AVG FAMILY INCOME
$35,148
AVG HOUSEHOLD INCOME
20.4%
WAGE / INCOME GAP [ % ]
79.6¢/ $1
WAGE / INCOME GAP [ $ ]
$13,082
FAMILY INCOME DEFICIT
0.50
INEQUALITY / GINI INDEX
29,495
TOTAL POPULATION
13,344
MALE POPULATION
16,151
FEMALE POPULATION
82.62
MALES / 100 FEMALES
121.04
FEMALES / 100 MALES
38.7
MEDIAN AGE
3.4
AVG FAMILY SIZE
2.5
AVG HOUSEHOLD SIZE
11,659
LABOR FORCE [ PEOPLE ]
50.6%
PERCENT IN LABOR FORCE
11.5%
UNEMPLOYMENT RATE
Greenville Area Codes
Income in Greenville
Income Overview in Greenville
Per Capita Income in Greenville is $22,111, while median incomes of families and households are $46,043 and $35,148 respectively.
| Characteristic | Number | Measure |
| Per Capita Income | 29,495 | $22,111 |
| Median Family Income | 6,794 | $46,043 |
| Mean Family Income | 6,794 | $63,160 |
| Median Household Income | 11,487 | $35,148 |
| Mean Household Income | 11,487 | $53,825 |
| Income Deficit | 6,794 | $13,082 |
| Wage / Income Gap (%) | 29,495 | 20.35% |
| Wage / Income Gap ($) | 29,495 | 79.65¢ per $1 |
| Gini / Inequality Index | 29,495 | 0.50 |
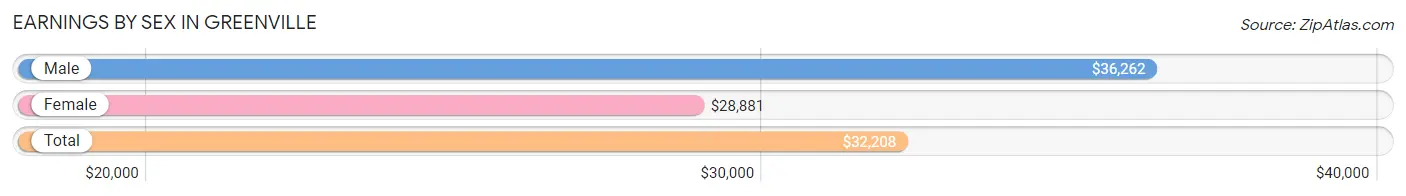
Earnings by Sex in Greenville
Average Earnings in Greenville are $32,208, $36,262 for men and $28,881 for women, a difference of 20.3%.
| Sex | Number | Average Earnings |
| Male | 5,327 (46.8%) | $36,262 |
| Female | 6,049 (53.2%) | $28,881 |
| Total | 11,376 (100.0%) | $32,208 |
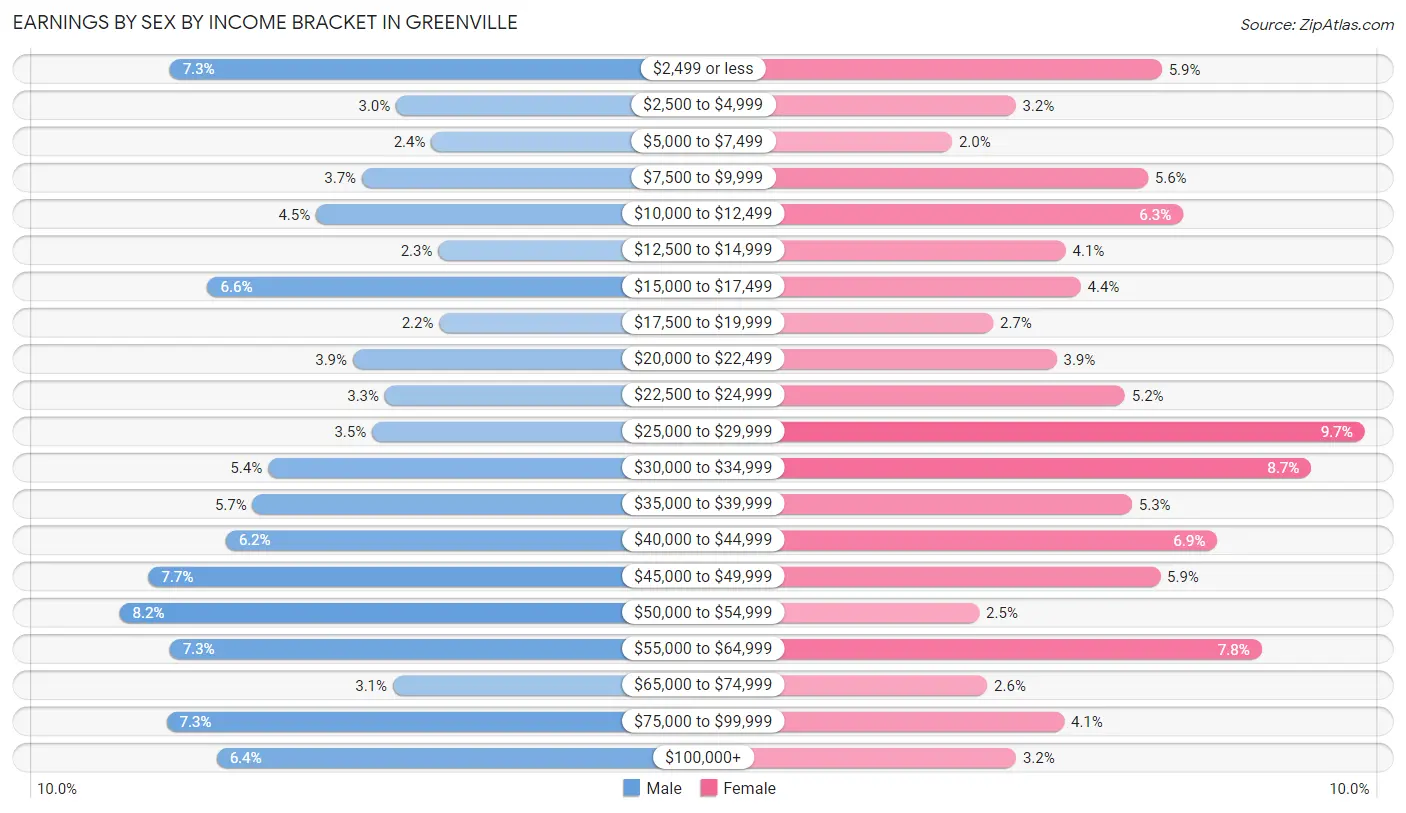
Earnings by Sex by Income Bracket in Greenville
The most common earnings brackets in Greenville are $50,000 to $54,999 for men (438 | 8.2%) and $25,000 to $29,999 for women (587 | 9.7%).
| Income | Male | Female |
| $2,499 or less | 388 (7.3%) | 357 (5.9%) |
| $2,500 to $4,999 | 162 (3.0%) | 191 (3.2%) |
| $5,000 to $7,499 | 127 (2.4%) | 119 (2.0%) |
| $7,500 to $9,999 | 196 (3.7%) | 341 (5.6%) |
| $10,000 to $12,499 | 242 (4.5%) | 381 (6.3%) |
| $12,500 to $14,999 | 120 (2.2%) | 248 (4.1%) |
| $15,000 to $17,499 | 350 (6.6%) | 265 (4.4%) |
| $17,500 to $19,999 | 119 (2.2%) | 166 (2.7%) |
| $20,000 to $22,499 | 205 (3.8%) | 238 (3.9%) |
| $22,500 to $24,999 | 173 (3.3%) | 315 (5.2%) |
| $25,000 to $29,999 | 186 (3.5%) | 587 (9.7%) |
| $30,000 to $34,999 | 290 (5.4%) | 526 (8.7%) |
| $35,000 to $39,999 | 305 (5.7%) | 323 (5.3%) |
| $40,000 to $44,999 | 332 (6.2%) | 420 (6.9%) |
| $45,000 to $49,999 | 409 (7.7%) | 355 (5.9%) |
| $50,000 to $54,999 | 438 (8.2%) | 150 (2.5%) |
| $55,000 to $64,999 | 388 (7.3%) | 470 (7.8%) |
| $65,000 to $74,999 | 165 (3.1%) | 159 (2.6%) |
| $75,000 to $99,999 | 391 (7.3%) | 246 (4.1%) |
| $100,000+ | 341 (6.4%) | 192 (3.2%) |
| Total | 5,327 (100.0%) | 6,049 (100.0%) |
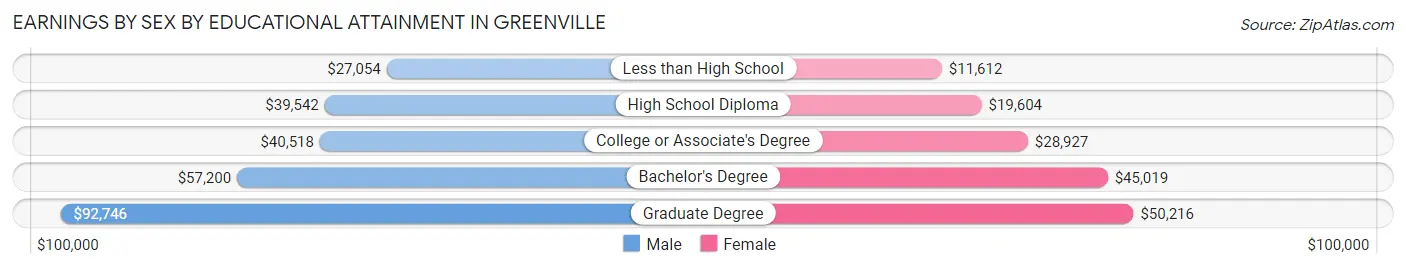
Earnings by Sex by Educational Attainment in Greenville
Average earnings in Greenville are $40,856 for men and $29,603 for women, a difference of 27.5%. Men with an educational attainment of graduate degree enjoy the highest average annual earnings of $92,746, while those with less than high school education earn the least with $27,054. Women with an educational attainment of graduate degree earn the most with the average annual earnings of $50,216, while those with less than high school education have the smallest earnings of $11,612.
| Educational Attainment | Male Income | Female Income |
| Less than High School | $27,054 | $11,612 |
| High School Diploma | $39,542 | $19,604 |
| College or Associate's Degree | $40,518 | $28,927 |
| Bachelor's Degree | $57,200 | $45,019 |
| Graduate Degree | $92,746 | $50,216 |
| Total | $40,856 | $29,603 |
Family Income in Greenville
Family Income Brackets in Greenville
According to the Greenville family income data, there are 1,182 families falling into the $50,000 to $74,999 income range, which is the most common income bracket and makes up 17.4% of all families. Conversely, the $150,000 to $199,999 income bracket is the least frequent group with only 238 families (3.5%) belonging to this category.
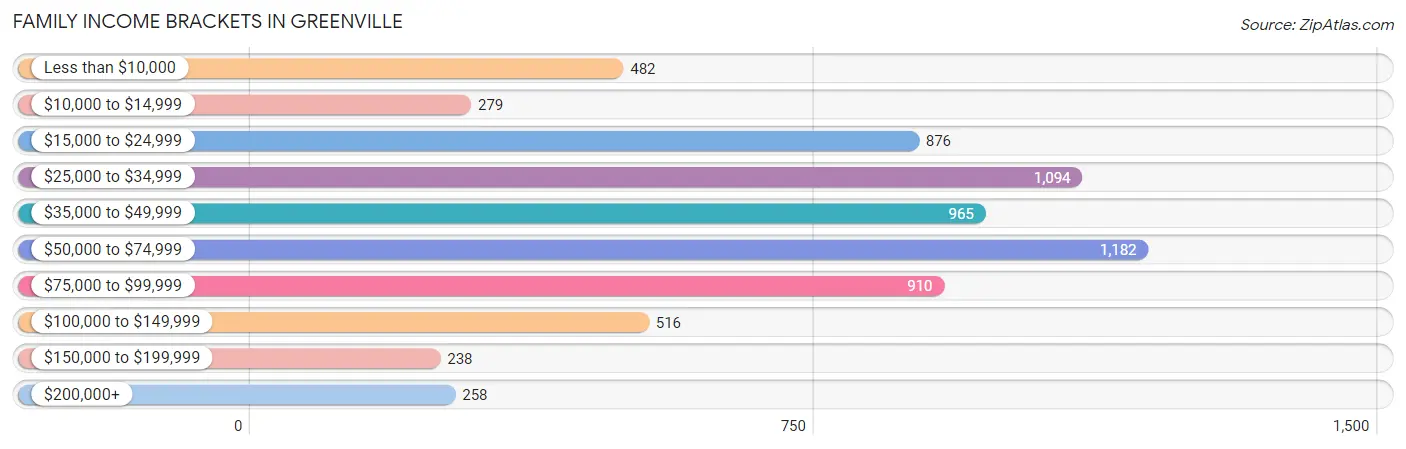
| Income Bracket | # Families | % Families |
| Less than $10,000 | 482 | 7.1% |
| $10,000 to $14,999 | 279 | 4.1% |
| $15,000 to $24,999 | 876 | 12.9% |
| $25,000 to $34,999 | 1,094 | 16.1% |
| $35,000 to $49,999 | 965 | 14.2% |
| $50,000 to $74,999 | 1,182 | 17.4% |
| $75,000 to $99,999 | 910 | 13.4% |
| $100,000 to $149,999 | 516 | 7.6% |
| $150,000 to $199,999 | 238 | 3.5% |
| $200,000+ | 258 | 3.8% |
Family Income by Famaliy Size in Greenville
4-person families (862 | 12.7%) account for the highest median family income in Greenville with $71,408 per family, while 2-person families (3,309 | 48.7%) have the highest median income of $21,922 per family member.
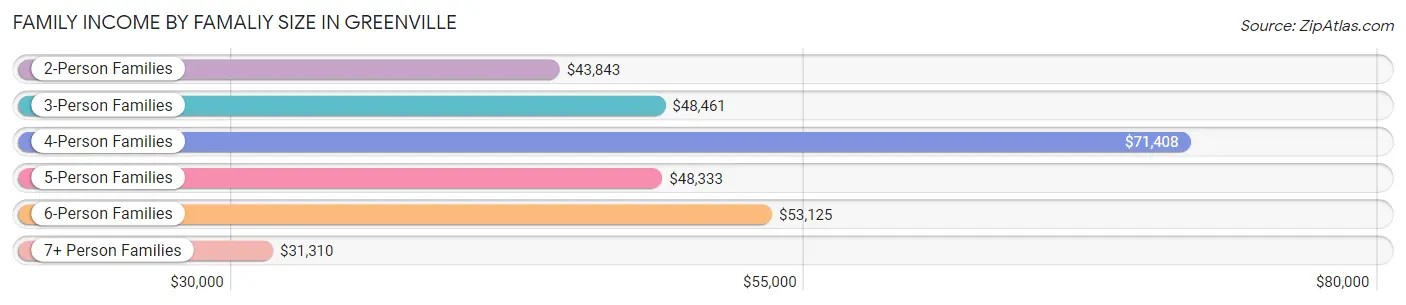
| Income Bracket | # Families | Median Income |
| 2-Person Families | 3,309 (48.7%) | $43,843 |
| 3-Person Families | 1,839 (27.1%) | $48,461 |
| 4-Person Families | 862 (12.7%) | $71,408 |
| 5-Person Families | 474 (7.0%) | $48,333 |
| 6-Person Families | 124 (1.8%) | $53,125 |
| 7+ Person Families | 186 (2.7%) | $31,310 |
| Total | 6,794 (100.0%) | $46,043 |
Family Income by Number of Earners in Greenville
The median family income in Greenville is $46,043, with families comprising 3+ earners (276) having the highest median family income of $93,125, while families with no earners (1,655) have the lowest median family income of $23,053, accounting for 4.1% and 24.4% of families, respectively.
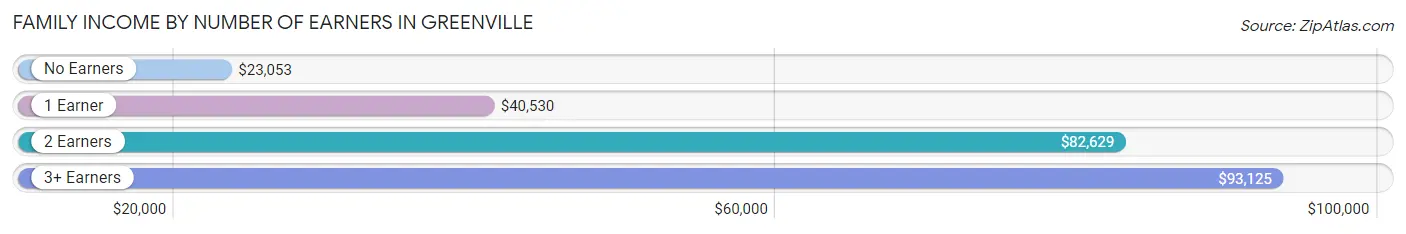
| Number of Earners | # Families | Median Income |
| No Earners | 1,655 (24.4%) | $23,053 |
| 1 Earner | 2,945 (43.3%) | $40,530 |
| 2 Earners | 1,918 (28.2%) | $82,629 |
| 3+ Earners | 276 (4.1%) | $93,125 |
| Total | 6,794 (100.0%) | $46,043 |
Household Income in Greenville
Household Income Brackets in Greenville
With 1,735 households falling in the category, the $25,000 to $34,999 income range is the most frequent in Greenville, accounting for 15.1% of all households. In contrast, only 287 households (2.5%) fall into the $200,000+ income bracket, making it the least populous group.
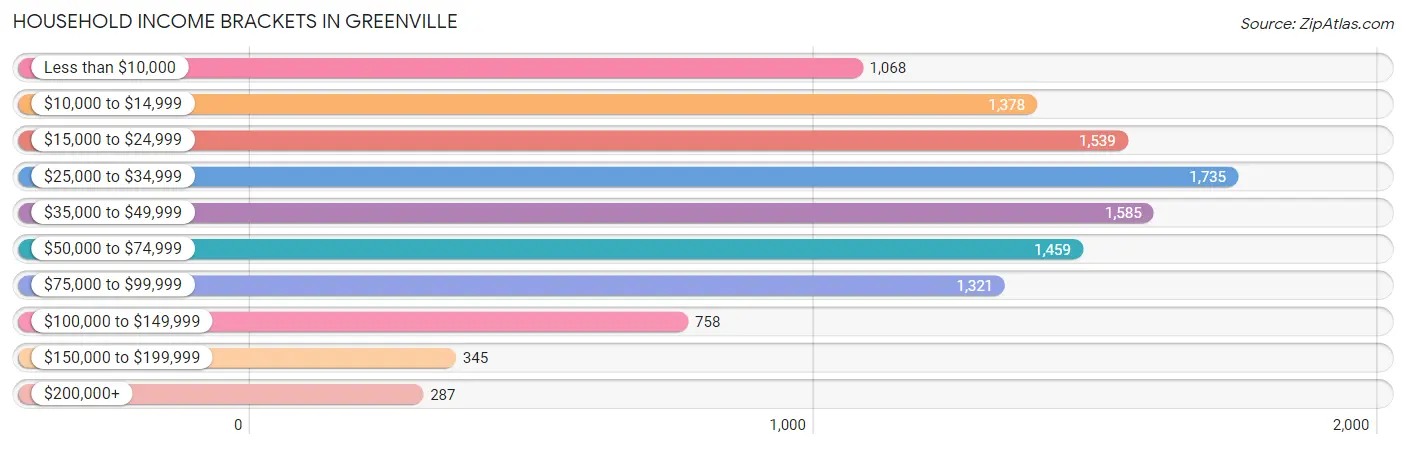
| Income Bracket | # Households | % Households |
| Less than $10,000 | 1,068 | 9.3% |
| $10,000 to $14,999 | 1,378 | 12.0% |
| $15,000 to $24,999 | 1,539 | 13.4% |
| $25,000 to $34,999 | 1,735 | 15.1% |
| $35,000 to $49,999 | 1,585 | 13.8% |
| $50,000 to $74,999 | 1,459 | 12.7% |
| $75,000 to $99,999 | 1,321 | 11.5% |
| $100,000 to $149,999 | 758 | 6.6% |
| $150,000 to $199,999 | 345 | 3.0% |
| $200,000+ | 287 | 2.5% |
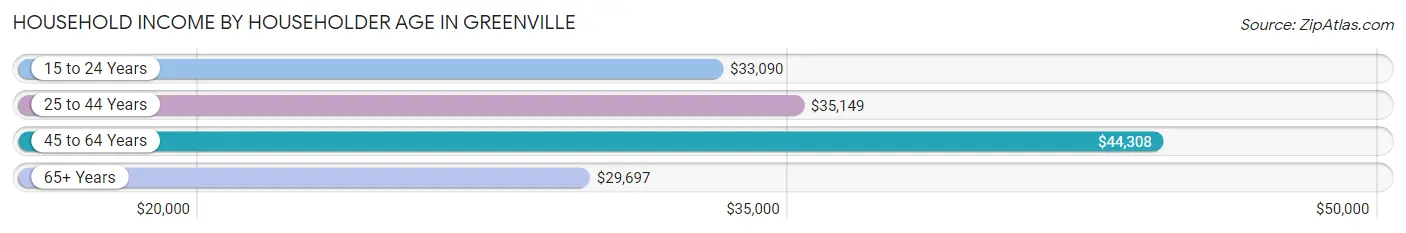
Household Income by Householder Age in Greenville
The median household income in Greenville is $35,148, with the highest median household income of $44,308 found in the 45 to 64 years age bracket for the primary householder. A total of 4,448 households (38.7%) fall into this category. Meanwhile, the 65+ years age bracket for the primary householder has the lowest median household income of $29,697, with 3,544 households (30.8%) in this group.
| Income Bracket | # Households | Median Income |
| 15 to 24 Years | 339 (2.9%) | $33,090 |
| 25 to 44 Years | 3,156 (27.5%) | $35,149 |
| 45 to 64 Years | 4,448 (38.7%) | $44,308 |
| 65+ Years | 3,544 (30.8%) | $29,697 |
| Total | 11,487 (100.0%) | $35,148 |
Poverty in Greenville
Income Below Poverty by Sex and Age in Greenville
With 29.6% poverty level for males and 34.4% for females among the residents of Greenville, 15 year old males and 6 to 11 year old females are the most vulnerable to poverty, with 87 males (90.6%) and 613 females (57.3%) in their respective age groups living below the poverty level.
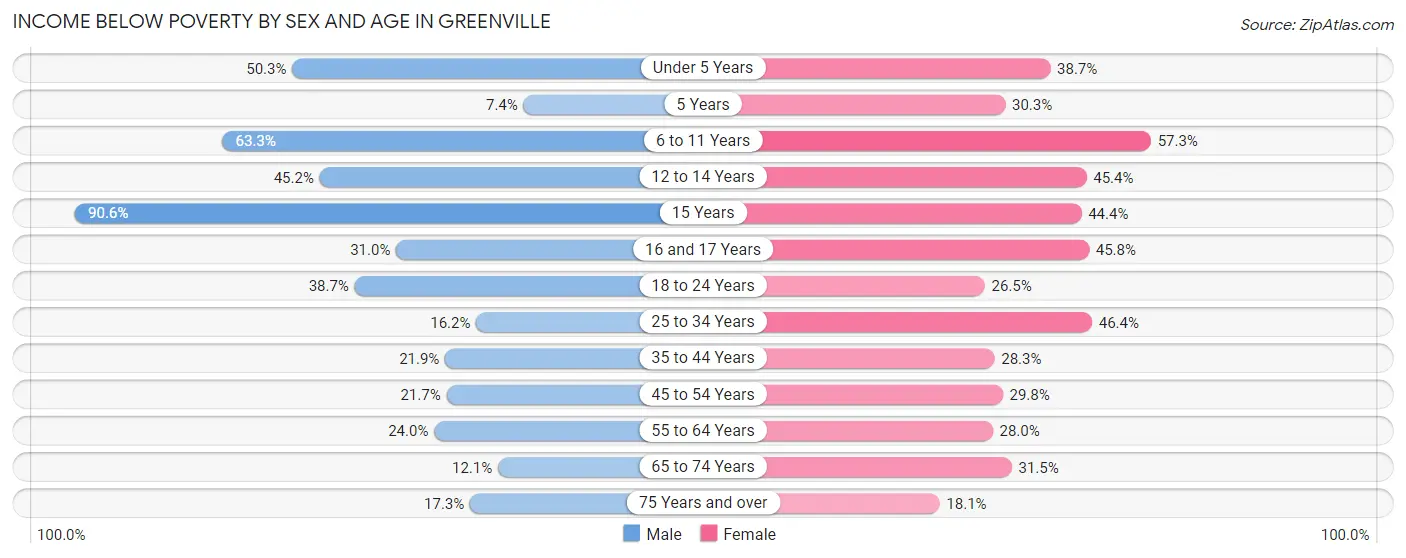
| Age Bracket | Male | Female |
| Under 5 Years | 486 (50.3%) | 343 (38.7%) |
| 5 Years | 9 (7.4%) | 70 (30.3%) |
| 6 to 11 Years | 900 (63.2%) | 613 (57.3%) |
| 12 to 14 Years | 194 (45.2%) | 324 (45.4%) |
| 15 Years | 87 (90.6%) | 96 (44.4%) |
| 16 and 17 Years | 161 (31.0%) | 226 (45.8%) |
| 18 to 24 Years | 404 (38.7%) | 303 (26.5%) |
| 25 to 34 Years | 284 (16.2%) | 911 (46.4%) |
| 35 to 44 Years | 314 (21.9%) | 528 (28.3%) |
| 45 to 54 Years | 331 (21.7%) | 583 (29.8%) |
| 55 to 64 Years | 394 (24.0%) | 650 (28.0%) |
| 65 to 74 Years | 172 (12.1%) | 553 (31.5%) |
| 75 Years and over | 103 (17.3%) | 200 (18.1%) |
| Total | 3,839 (29.6%) | 5,400 (34.4%) |
Income Above Poverty by Sex and Age in Greenville
According to the poverty statistics in Greenville, males aged 5 years and females aged 75 years and over are the age groups that are most secure financially, with 92.6% of males and 81.9% of females in these age groups living above the poverty line.
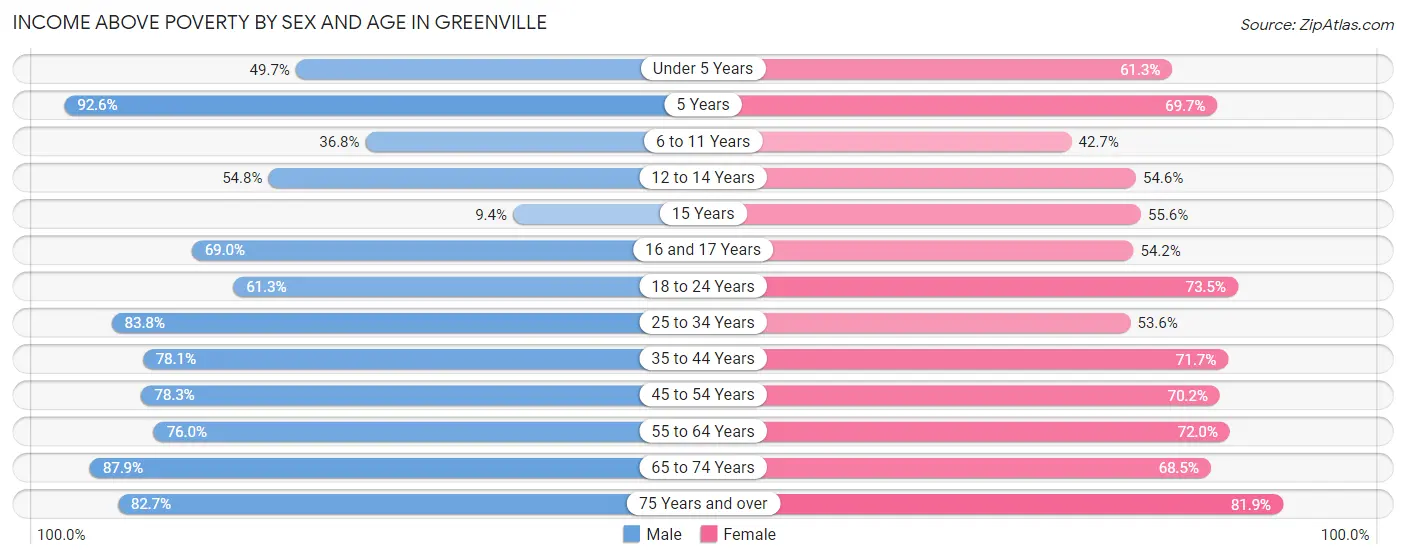
| Age Bracket | Male | Female |
| Under 5 Years | 480 (49.7%) | 544 (61.3%) |
| 5 Years | 113 (92.6%) | 161 (69.7%) |
| 6 to 11 Years | 523 (36.7%) | 456 (42.7%) |
| 12 to 14 Years | 235 (54.8%) | 390 (54.6%) |
| 15 Years | 9 (9.4%) | 120 (55.6%) |
| 16 and 17 Years | 358 (69.0%) | 267 (54.2%) |
| 18 to 24 Years | 639 (61.3%) | 840 (73.5%) |
| 25 to 34 Years | 1,473 (83.8%) | 1,052 (53.6%) |
| 35 to 44 Years | 1,118 (78.1%) | 1,338 (71.7%) |
| 45 to 54 Years | 1,195 (78.3%) | 1,371 (70.2%) |
| 55 to 64 Years | 1,250 (76.0%) | 1,673 (72.0%) |
| 65 to 74 Years | 1,247 (87.9%) | 1,202 (68.5%) |
| 75 Years and over | 492 (82.7%) | 904 (81.9%) |
| Total | 9,132 (70.4%) | 10,318 (65.6%) |
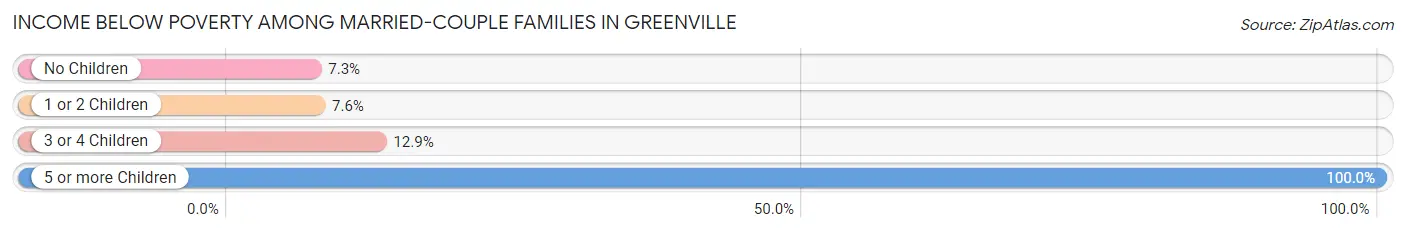
Income Below Poverty Among Married-Couple Families in Greenville
The poverty statistics for married-couple families in Greenville show that 7.9% or 248 of the total 3,132 families live below the poverty line. Families with 5 or more children have the highest poverty rate of 100.0%, comprising of 9 families. On the other hand, families with no children have the lowest poverty rate of 7.2%, which includes 160 families.
| Children | Above Poverty | Below Poverty |
| No Children | 2,046 (92.7%) | 160 (7.2%) |
| 1 or 2 Children | 683 (92.4%) | 56 (7.6%) |
| 3 or 4 Children | 155 (87.1%) | 23 (12.9%) |
| 5 or more Children | 0 (0.0%) | 9 (100.0%) |
| Total | 2,884 (92.1%) | 248 (7.9%) |
Income Below Poverty Among Single-Parent Households in Greenville
According to the poverty data in Greenville, 32.2% or 181 single-father households and 34.5% or 1,069 single-mother households are living below the poverty line. Among single-father households, those with 3 or 4 children have the highest poverty rate, with 24 households (72.7%) experiencing poverty. Likewise, among single-mother households, those with 5 or more children have the highest poverty rate, with 80 households (100.0%) falling below the poverty line.
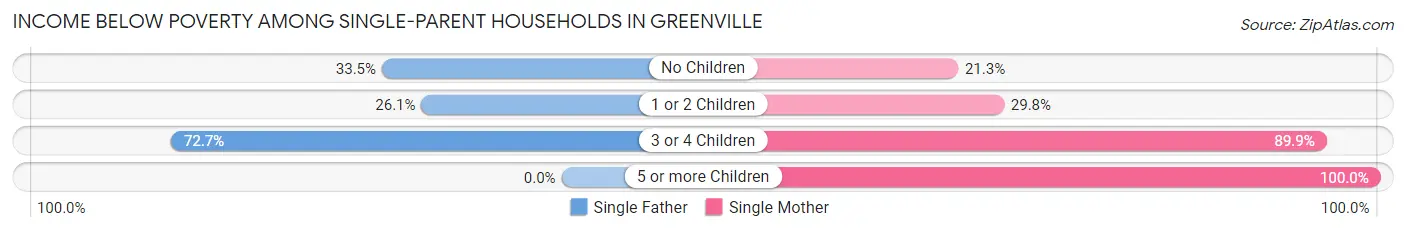
| Children | Single Father | Single Mother |
| No Children | 86 (33.5%) | 287 (21.3%) |
| 1 or 2 Children | 71 (26.1%) | 398 (29.8%) |
| 3 or 4 Children | 24 (72.7%) | 304 (89.9%) |
| 5 or more Children | 0 (0.0%) | 80 (100.0%) |
| Total | 181 (32.2%) | 1,069 (34.5%) |
Income Below Poverty Among Married-Couple vs Single-Parent Households in Greenville
The poverty data for Greenville shows that 248 of the married-couple family households (7.9%) and 1,250 of the single-parent households (34.1%) are living below the poverty level. Within the married-couple family households, those with 5 or more children have the highest poverty rate, with 9 households (100.0%) falling below the poverty line. Among the single-parent households, those with 5 or more children have the highest poverty rate, with 80 household (100.0%) living below poverty.
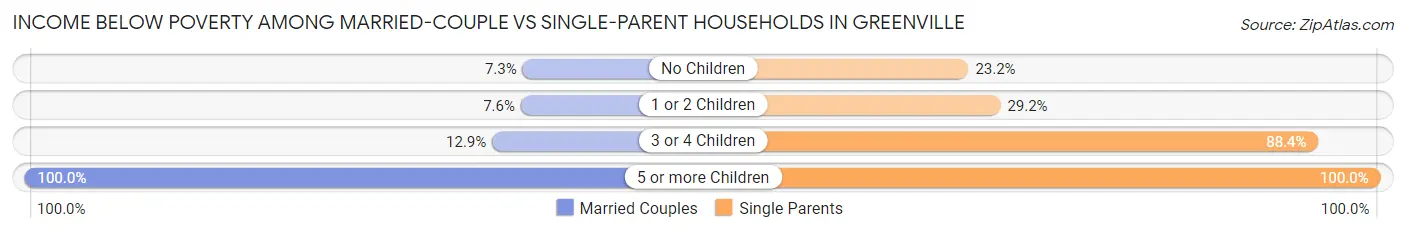
| Children | Married-Couple Families | Single-Parent Households |
| No Children | 160 (7.2%) | 373 (23.2%) |
| 1 or 2 Children | 56 (7.6%) | 469 (29.2%) |
| 3 or 4 Children | 23 (12.9%) | 328 (88.4%) |
| 5 or more Children | 9 (100.0%) | 80 (100.0%) |
| Total | 248 (7.9%) | 1,250 (34.1%) |
Race in Greenville
The most populous races in Greenville are Black / African American (24,416 | 82.8%), White / Caucasian (4,440 | 15.0%), and Asian (345 | 1.2%).
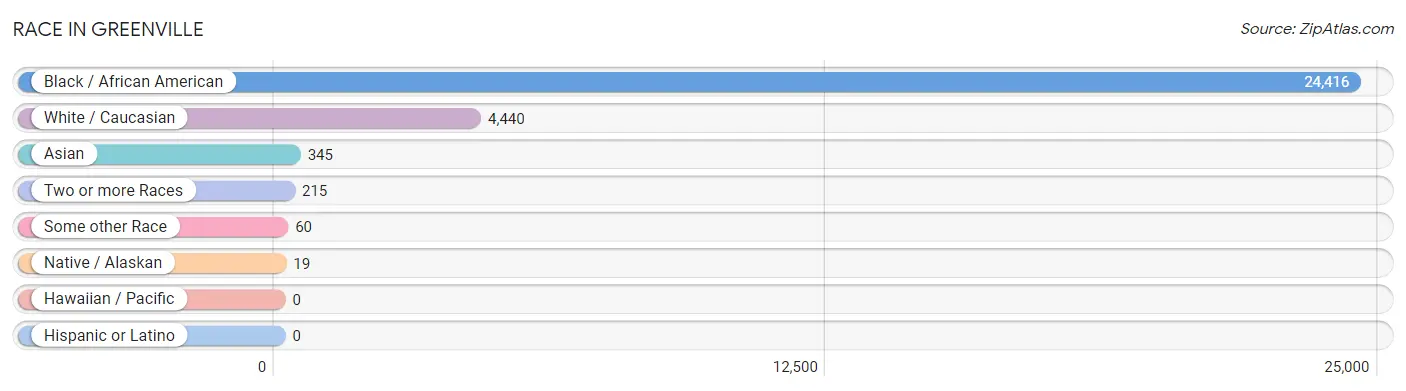
| Race | # Population | % Population |
| Asian | 345 | 1.2% |
| Black / African American | 24,416 | 82.8% |
| Hawaiian / Pacific | 0 | 0.0% |
| Hispanic or Latino | 0 | 0.0% |
| Native / Alaskan | 19 | 0.1% |
| White / Caucasian | 4,440 | 15.0% |
| Two or more Races | 215 | 0.7% |
| Some other Race | 60 | 0.2% |
| Total | 29,495 | 100.0% |
Ancestry in Greenville
The most populous ancestries reported in Greenville are American (5,573 | 18.9%), English (690 | 2.3%), Irish (415 | 1.4%), Subsaharan African (403 | 1.4%), and African (384 | 1.3%), together accounting for 25.3% of all Greenville residents.
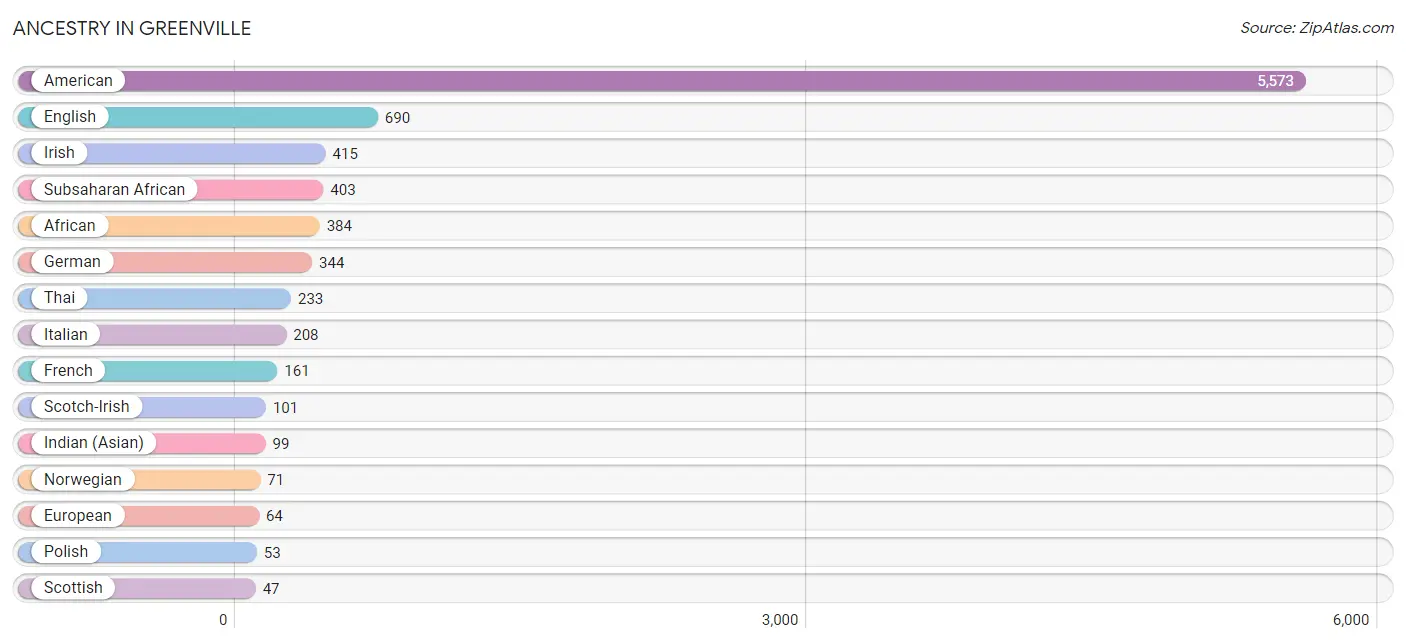
| Ancestry | # Population | % Population |
| African | 384 | 1.3% |
| American | 5,573 | 18.9% |
| Arab | 39 | 0.1% |
| Belizean | 41 | 0.1% |
| British | 41 | 0.1% |
| Cherokee | 19 | 0.1% |
| Choctaw | 6 | 0.0% |
| Czech | 8 | 0.0% |
| English | 690 | 2.3% |
| European | 64 | 0.2% |
| French | 161 | 0.5% |
| German | 344 | 1.2% |
| Greek | 19 | 0.1% |
| Indian (Asian) | 99 | 0.3% |
| Irish | 415 | 1.4% |
| Italian | 208 | 0.7% |
| Jamaican | 46 | 0.2% |
| Korean | 13 | 0.0% |
| Lebanese | 39 | 0.1% |
| Nigerian | 19 | 0.1% |
| Northern European | 8 | 0.0% |
| Norwegian | 71 | 0.2% |
| Polish | 53 | 0.2% |
| Scotch-Irish | 101 | 0.3% |
| Scottish | 47 | 0.2% |
| Subsaharan African | 403 | 1.4% |
| Swedish | 11 | 0.0% |
| Thai | 233 | 0.8% |
| Welsh | 16 | 0.1% | View All 29 Rows |
Immigrants in Greenville
The most numerous immigrant groups reported in Greenville came from Europe (187 | 0.6%), Southern Europe (162 | 0.5%), Spain (162 | 0.5%), Asia (42 | 0.1%), and China (29 | 0.1%), together accounting for 2.0% of all Greenville residents.
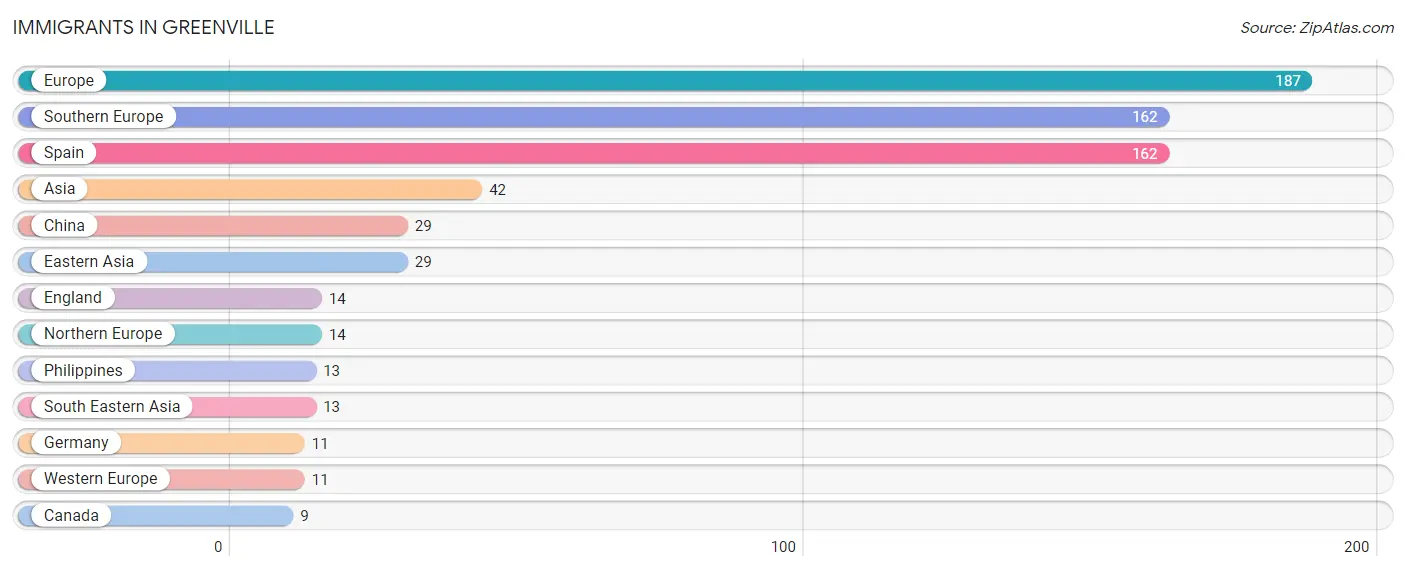
| Immigration Origin | # Population | % Population |
| Asia | 42 | 0.1% |
| Canada | 9 | 0.0% |
| China | 29 | 0.1% |
| Eastern Asia | 29 | 0.1% |
| England | 14 | 0.1% |
| Europe | 187 | 0.6% |
| Germany | 11 | 0.0% |
| Northern Europe | 14 | 0.1% |
| Philippines | 13 | 0.0% |
| South Eastern Asia | 13 | 0.0% |
| Southern Europe | 162 | 0.5% |
| Spain | 162 | 0.5% |
| Western Europe | 11 | 0.0% | View All 13 Rows |
Sex and Age in Greenville
Sex and Age in Greenville
The most populous age groups in Greenville are 5 to 9 Years (1,143 | 8.6%) for men and 55 to 59 Years (1,291 | 8.0%) for women.
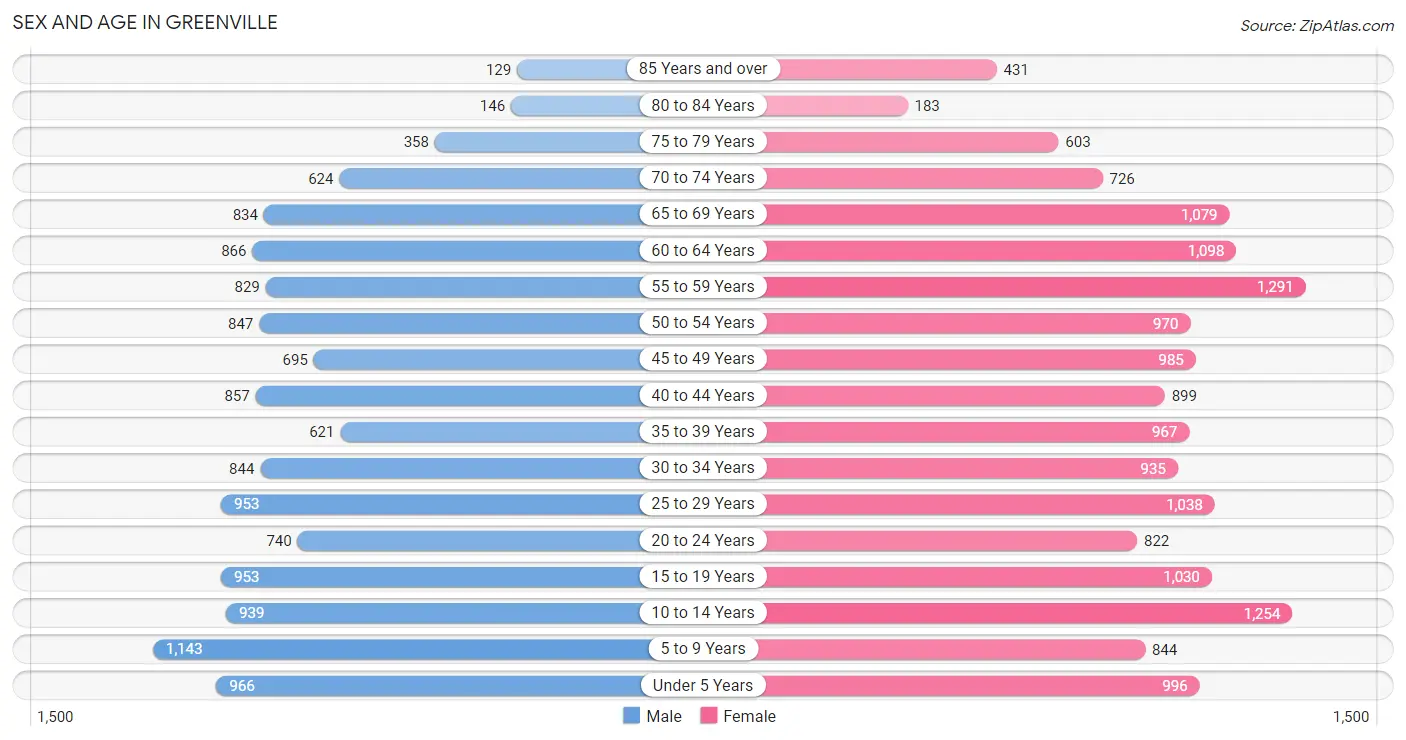
| Age Bracket | Male | Female |
| Under 5 Years | 966 (7.2%) | 996 (6.2%) |
| 5 to 9 Years | 1,143 (8.6%) | 844 (5.2%) |
| 10 to 14 Years | 939 (7.0%) | 1,254 (7.8%) |
| 15 to 19 Years | 953 (7.1%) | 1,030 (6.4%) |
| 20 to 24 Years | 740 (5.6%) | 822 (5.1%) |
| 25 to 29 Years | 953 (7.1%) | 1,038 (6.4%) |
| 30 to 34 Years | 844 (6.3%) | 935 (5.8%) |
| 35 to 39 Years | 621 (4.6%) | 967 (6.0%) |
| 40 to 44 Years | 857 (6.4%) | 899 (5.6%) |
| 45 to 49 Years | 695 (5.2%) | 985 (6.1%) |
| 50 to 54 Years | 847 (6.4%) | 970 (6.0%) |
| 55 to 59 Years | 829 (6.2%) | 1,291 (8.0%) |
| 60 to 64 Years | 866 (6.5%) | 1,098 (6.8%) |
| 65 to 69 Years | 834 (6.2%) | 1,079 (6.7%) |
| 70 to 74 Years | 624 (4.7%) | 726 (4.5%) |
| 75 to 79 Years | 358 (2.7%) | 603 (3.7%) |
| 80 to 84 Years | 146 (1.1%) | 183 (1.1%) |
| 85 Years and over | 129 (1.0%) | 431 (2.7%) |
| Total | 13,344 (100.0%) | 16,151 (100.0%) |
Families and Households in Greenville
Median Family Size in Greenville
The median family size in Greenville is 3.37 persons per family, with single female/mother families (3,100 | 45.6%) accounting for the largest median family size of 3.7 persons per family. On the other hand, married-couple families (3,132 | 46.1%) represent the smallest median family size with 3.09 persons per family.
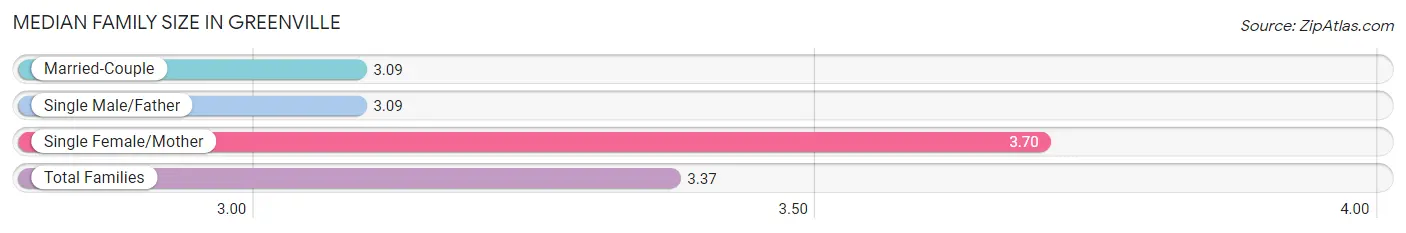
| Family Type | # Families | Family Size |
| Married-Couple | 3,132 (46.1%) | 3.09 |
| Single Male/Father | 562 (8.3%) | 3.09 |
| Single Female/Mother | 3,100 (45.6%) | 3.70 |
| Total Families | 6,794 (100.0%) | 3.37 |
Median Household Size in Greenville
The median household size in Greenville is 2.52 persons per household, with single female/mother households (3,100 | 27.0%) accounting for the largest median household size of 3.84 persons per household. non-family households (4,693 | 40.8%) represent the smallest median household size with 1.09 persons per household.
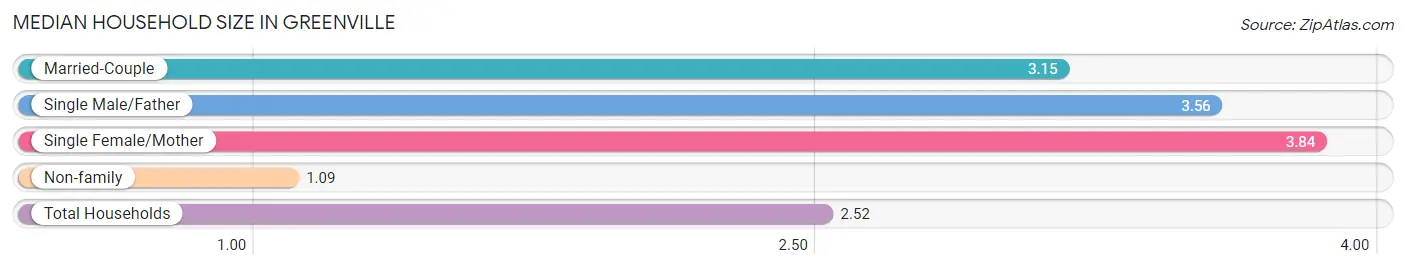
| Household Type | # Households | Household Size |
| Married-Couple | 3,132 (27.3%) | 3.15 |
| Single Male/Father | 562 (4.9%) | 3.56 |
| Single Female/Mother | 3,100 (27.0%) | 3.84 |
| Non-family | 4,693 (40.8%) | 1.09 |
| Total Households | 11,487 (100.0%) | 2.52 |
Household Size by Marriage Status in Greenville
Out of a total of 11,487 households in Greenville, 6,794 (59.2%) are family households, while 4,693 (40.8%) are nonfamily households. The most numerous type of family households are 2-person households, comprising 2,817, and the most common type of nonfamily households are 1-person households, comprising 4,318.
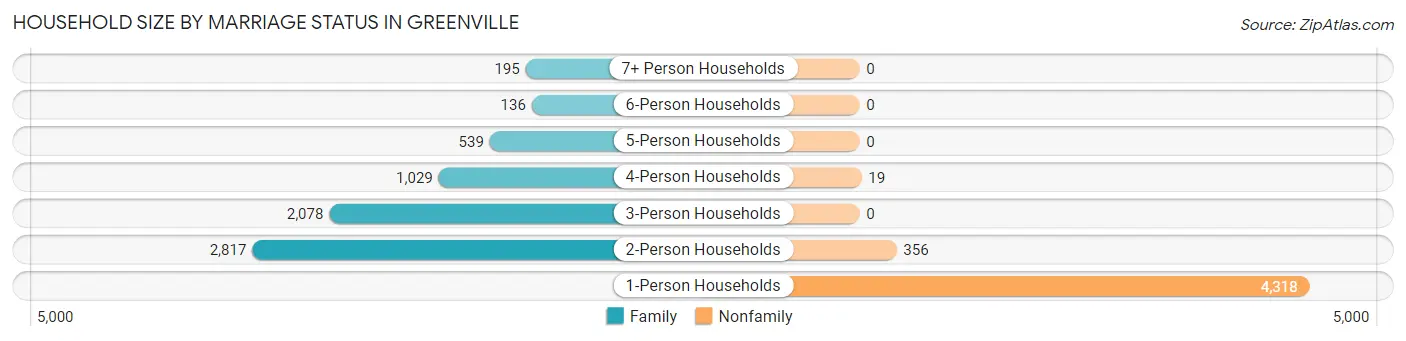
| Household Size | Family Households | Nonfamily Households |
| 1-Person Households | - | 4,318 (37.6%) |
| 2-Person Households | 2,817 (24.5%) | 356 (3.1%) |
| 3-Person Households | 2,078 (18.1%) | 0 (0.0%) |
| 4-Person Households | 1,029 (9.0%) | 19 (0.2%) |
| 5-Person Households | 539 (4.7%) | 0 (0.0%) |
| 6-Person Households | 136 (1.2%) | 0 (0.0%) |
| 7+ Person Households | 195 (1.7%) | 0 (0.0%) |
| Total | 6,794 (59.2%) | 4,693 (40.8%) |
Female Fertility in Greenville
Fertility by Age in Greenville
Average fertility rate in Greenville is 35.0 births per 1,000 women. Women in the age bracket of 35 to 50 years have the highest fertility rate with 44.0 births per 1,000 women. Women in the age bracket of 35 to 50 years acount for 54.2% of all women with births.
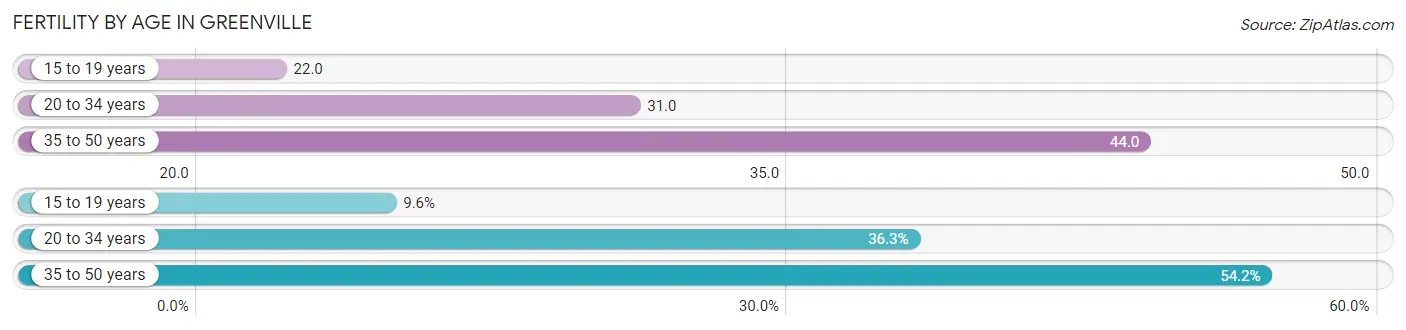
| Age Bracket | Women with Births | Births / 1,000 Women |
| 15 to 19 years | 23 (9.6%) | 22.0 |
| 20 to 34 years | 87 (36.2%) | 31.0 |
| 35 to 50 years | 130 (54.2%) | 44.0 |
| Total | 240 (100.0%) | 35.0 |
Fertility by Age by Marriage Status in Greenville
27.9% of women with births (240) in Greenville are married. The highest percentage of unmarried women with births falls into 15 to 19 years age bracket with 100.0% of them unmarried at the time of birth, while the lowest percentage of unmarried women with births belong to 20 to 34 years age bracket with 32.2% of them unmarried.
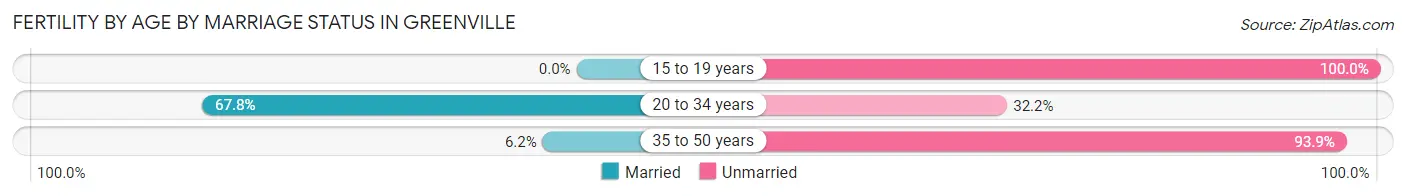
| Age Bracket | Married | Unmarried |
| 15 to 19 years | 0 (0.0%) | 23 (100.0%) |
| 20 to 34 years | 59 (67.8%) | 28 (32.2%) |
| 35 to 50 years | 8 (6.1%) | 122 (93.9%) |
| Total | 67 (27.9%) | 173 (72.1%) |
Fertility by Education in Greenville
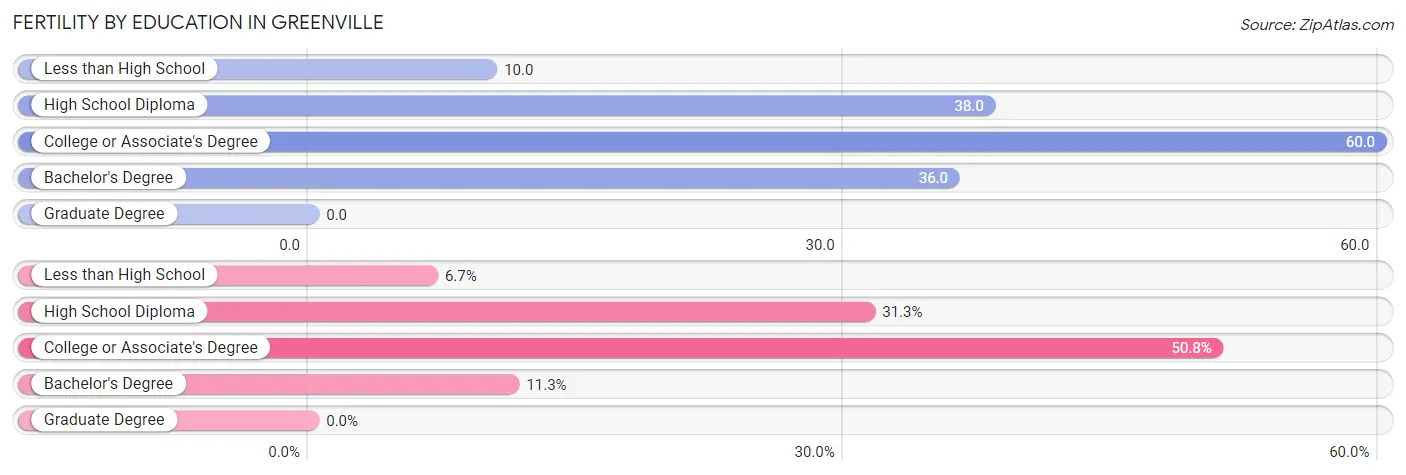
| Educational Attainment | Women with Births | Births / 1,000 Women |
| Less than High School | 16 (6.7%) | 10.0 |
| High School Diploma | 75 (31.2%) | 38.0 |
| College or Associate's Degree | 122 (50.8%) | 60.0 |
| Bachelor's Degree | 27 (11.3%) | 36.0 |
| Graduate Degree | 0 (0.0%) | 0.0 |
| Total | 240 (100.0%) | 35.0 |
Fertility by Education by Marriage Status in Greenville
72.1% of women with births in Greenville are unmarried. Women with the educational attainment of college or associate's degree are most likely to be married with 48.4% of them married at childbirth, while women with the educational attainment of less than high school are least likely to be married with 100.0% of them unmarried at childbirth.
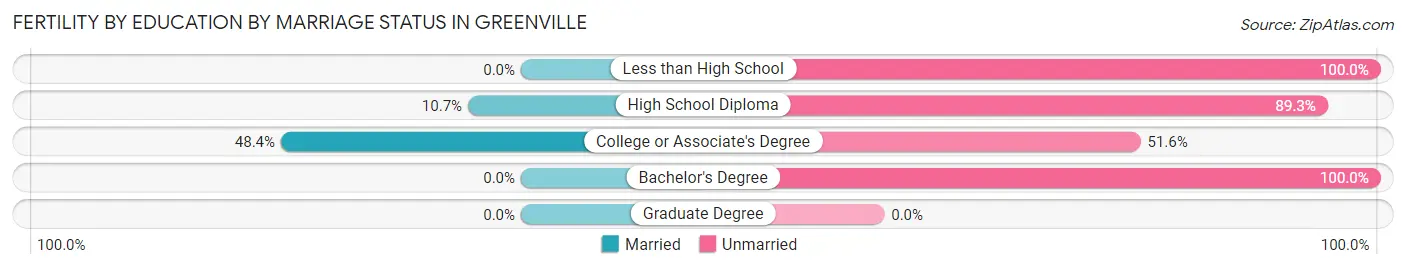
| Educational Attainment | Married | Unmarried |
| Less than High School | 0 (0.0%) | 16 (100.0%) |
| High School Diploma | 8 (10.7%) | 67 (89.3%) |
| College or Associate's Degree | 59 (48.4%) | 63 (51.6%) |
| Bachelor's Degree | 0 (0.0%) | 27 (100.0%) |
| Graduate Degree | 0 (0.0%) | 0 (0.0%) |
| Total | 67 (27.9%) | 173 (72.1%) |
Employment Characteristics in Greenville
Employment by Class of Employer in Greenville
Among the 10,238 employed individuals in Greenville, private company employees (6,868 | 67.1%), local government employees (1,146 | 11.2%), and state government employees (776 | 7.6%) make up the most common classes of employment.
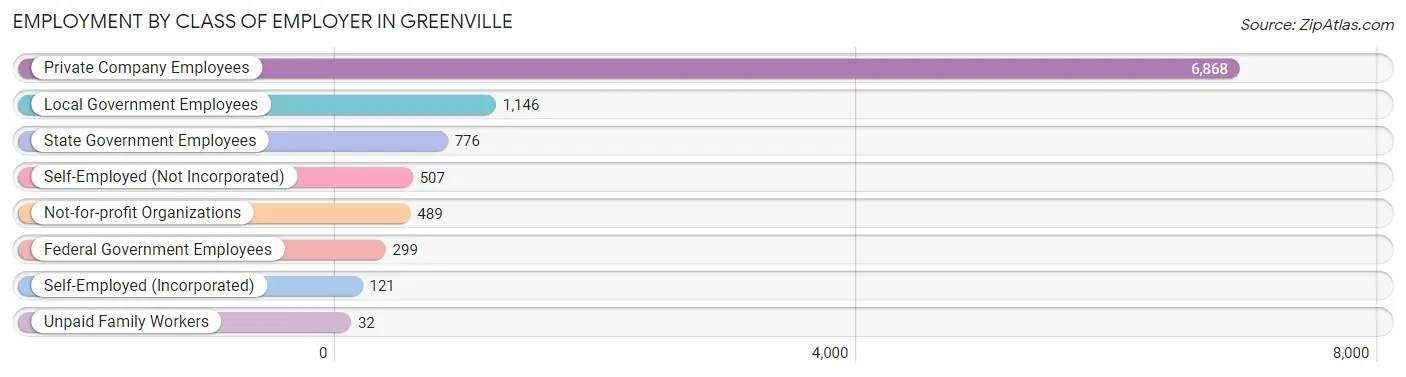
| Employer Class | # Employees | % Employees |
| Private Company Employees | 6,868 | 67.1% |
| Self-Employed (Incorporated) | 121 | 1.2% |
| Self-Employed (Not Incorporated) | 507 | 5.0% |
| Not-for-profit Organizations | 489 | 4.8% |
| Local Government Employees | 1,146 | 11.2% |
| State Government Employees | 776 | 7.6% |
| Federal Government Employees | 299 | 2.9% |
| Unpaid Family Workers | 32 | 0.3% |
| Total | 10,238 | 100.0% |
Employment Status by Age in Greenville
According to the labor force statistics for Greenville, out of the total population over 16 years of age (23,041), 50.6% or 11,659 individuals are in the labor force, with 11.5% or 1,341 of them unemployed. The age group with the highest labor force participation rate is 45 to 54 years, with 69.4% or 2,427 individuals in the labor force. Within the labor force, the 20 to 24 years age range has the highest percentage of unemployed individuals, with 38.0% or 407 of them being unemployed.
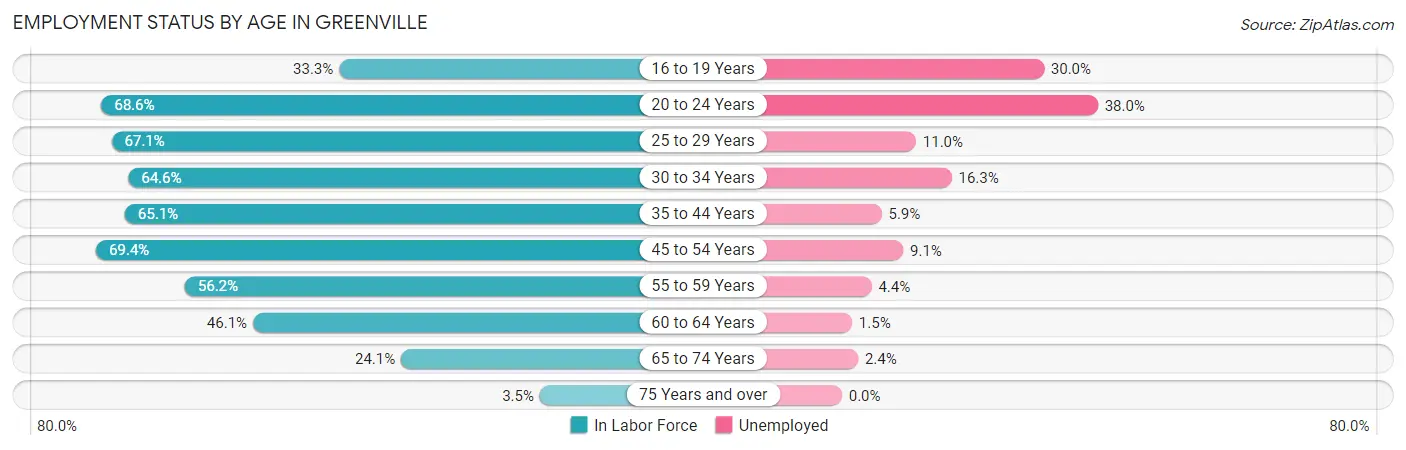
| Age Bracket | In Labor Force | Unemployed |
| 16 to 19 Years | 556 (33.3%) | 167 (30.0%) |
| 20 to 24 Years | 1,072 (68.6%) | 407 (38.0%) |
| 25 to 29 Years | 1,336 (67.1%) | 147 (11.0%) |
| 30 to 34 Years | 1,149 (64.6%) | 187 (16.3%) |
| 35 to 44 Years | 2,177 (65.1%) | 128 (5.9%) |
| 45 to 54 Years | 2,427 (69.4%) | 221 (9.1%) |
| 55 to 59 Years | 1,191 (56.2%) | 52 (4.4%) |
| 60 to 64 Years | 905 (46.1%) | 14 (1.5%) |
| 65 to 74 Years | 786 (24.1%) | 19 (2.4%) |
| 75 Years and over | 65 (3.5%) | 0 (0.0%) |
| Total | 11,659 (50.6%) | 1,341 (11.5%) |
Employment Status by Educational Attainment in Greenville
According to labor force statistics for Greenville, 62.5% of individuals (9,184) out of the total population between 25 and 64 years of age (14,695) are in the labor force, with 8.2% or 753 of them being unemployed. The group with the highest labor force participation rate are those with the educational attainment of bachelor's degree or higher, with 82.5% or 2,339 individuals in the labor force. Within the labor force, individuals with less than high school education have the highest percentage of unemployment, with 28.0% or 265 of them being unemployed.
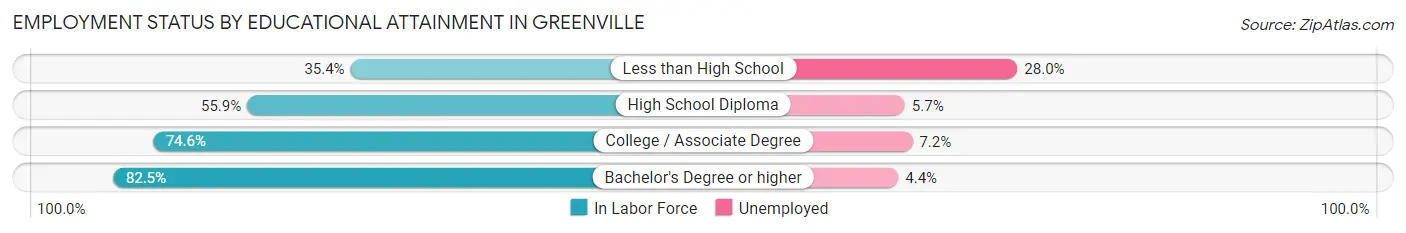
| Educational Attainment | In Labor Force | Unemployed |
| Less than High School | 948 (35.4%) | 750 (28.0%) |
| High School Diploma | 2,841 (55.9%) | 290 (5.7%) |
| College / Associate Degree | 3,059 (74.6%) | 295 (7.2%) |
| Bachelor's Degree or higher | 2,339 (82.5%) | 125 (4.4%) |
| Total | 9,184 (62.5%) | 1,205 (8.2%) |
Employment Occupations by Sex in Greenville
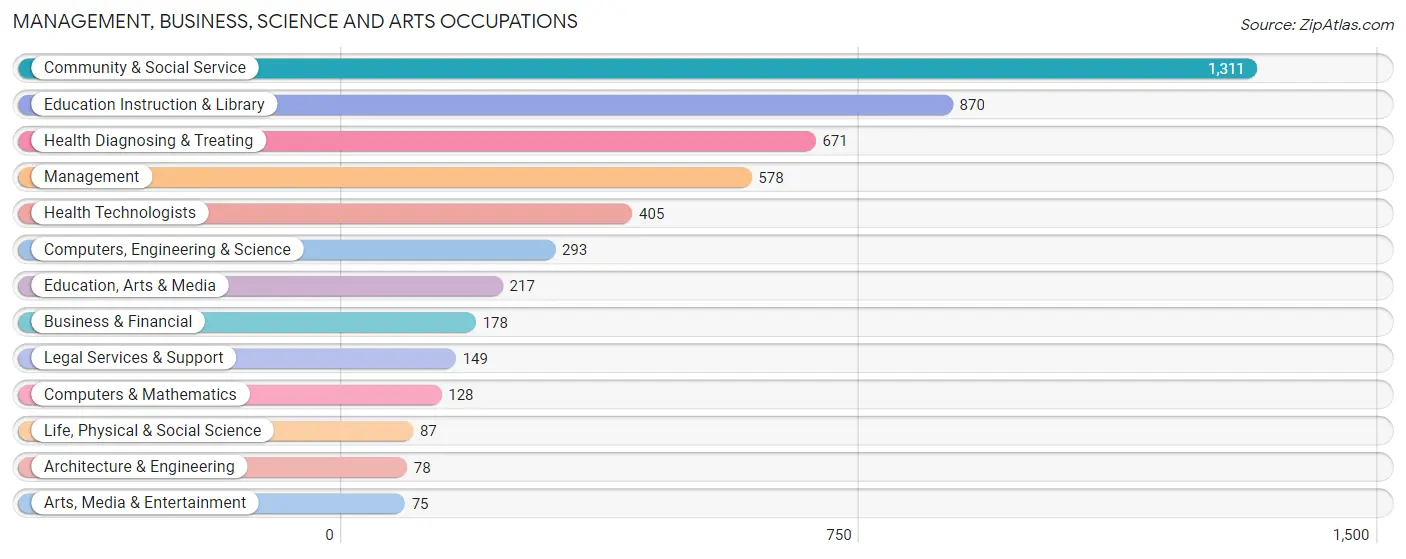
Management, Business, Science and Arts Occupations
The most common Management, Business, Science and Arts occupations in Greenville are Community & Social Service (1,311 | 12.7%), Education Instruction & Library (870 | 8.4%), Health Diagnosing & Treating (671 | 6.5%), Management (578 | 5.6%), and Health Technologists (405 | 3.9%).
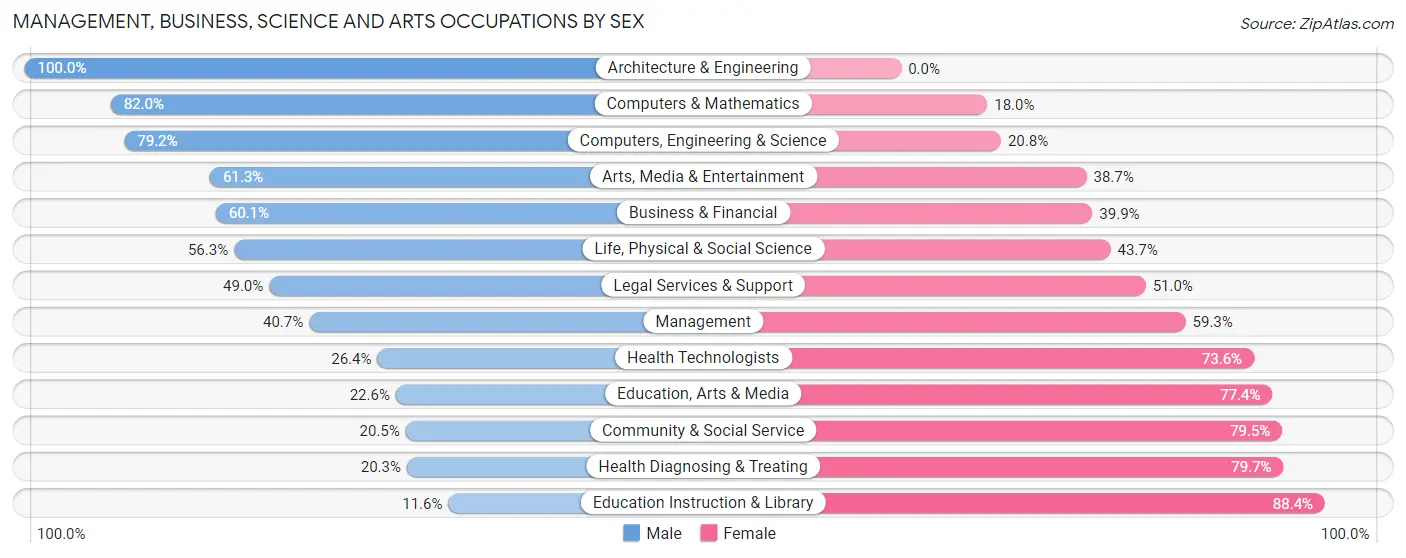
Management, Business, Science and Arts Occupations by Sex
Within the Management, Business, Science and Arts occupations in Greenville, the most male-oriented occupations are Architecture & Engineering (100.0%), Computers & Mathematics (82.0%), and Computers, Engineering & Science (79.2%), while the most female-oriented occupations are Education Instruction & Library (88.4%), Health Diagnosing & Treating (79.7%), and Community & Social Service (79.5%).
| Occupation | Male | Female |
| Management | 235 (40.7%) | 343 (59.3%) |
| Business & Financial | 107 (60.1%) | 71 (39.9%) |
| Computers, Engineering & Science | 232 (79.2%) | 61 (20.8%) |
| Computers & Mathematics | 105 (82.0%) | 23 (18.0%) |
| Architecture & Engineering | 78 (100.0%) | 0 (0.0%) |
| Life, Physical & Social Science | 49 (56.3%) | 38 (43.7%) |
| Community & Social Service | 269 (20.5%) | 1,042 (79.5%) |
| Education, Arts & Media | 49 (22.6%) | 168 (77.4%) |
| Legal Services & Support | 73 (49.0%) | 76 (51.0%) |
| Education Instruction & Library | 101 (11.6%) | 769 (88.4%) |
| Arts, Media & Entertainment | 46 (61.3%) | 29 (38.7%) |
| Health Diagnosing & Treating | 136 (20.3%) | 535 (79.7%) |
| Health Technologists | 107 (26.4%) | 298 (73.6%) |
| Total (Category) | 979 (32.3%) | 2,052 (67.7%) |
| Total (Overall) | 4,916 (47.6%) | 5,402 (52.4%) |
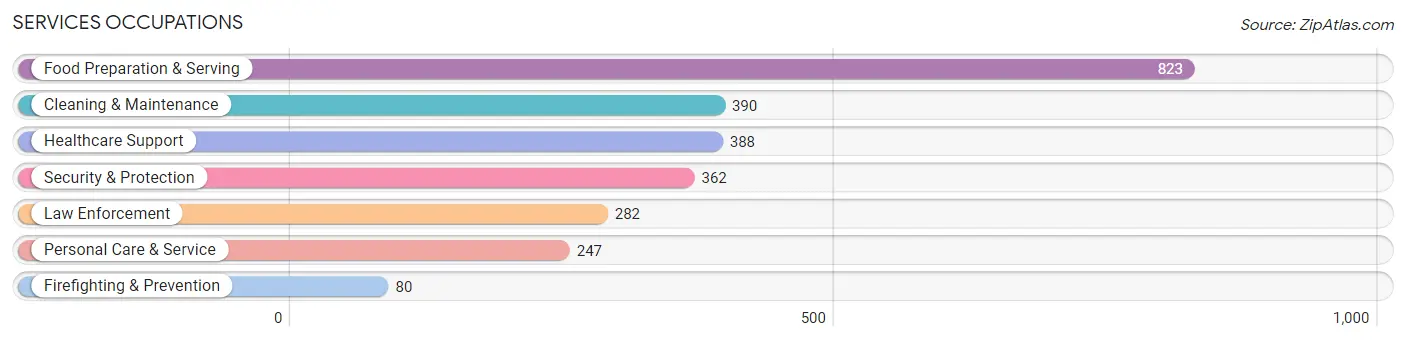
Services Occupations
The most common Services occupations in Greenville are Food Preparation & Serving (823 | 8.0%), Cleaning & Maintenance (390 | 3.8%), Healthcare Support (388 | 3.8%), Security & Protection (362 | 3.5%), and Law Enforcement (282 | 2.7%).
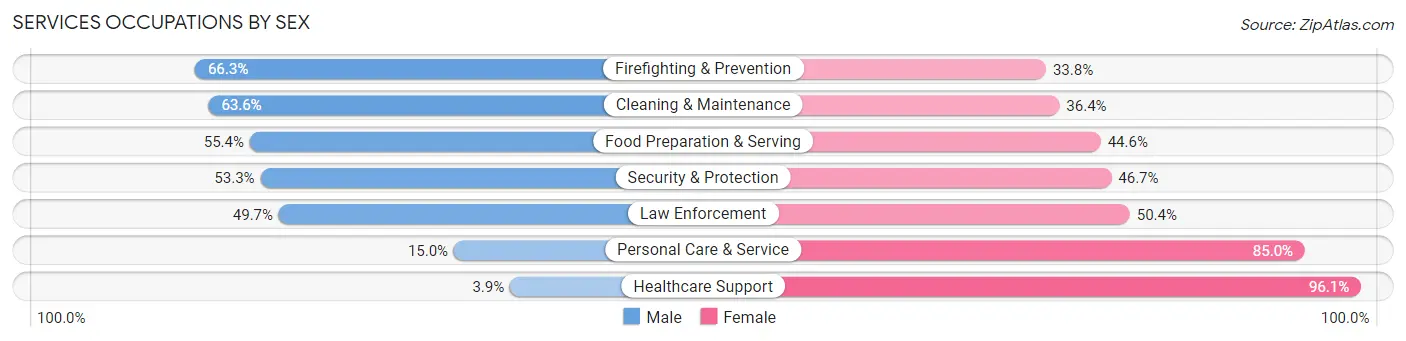
Services Occupations by Sex
Within the Services occupations in Greenville, the most male-oriented occupations are Firefighting & Prevention (66.2%), Cleaning & Maintenance (63.6%), and Food Preparation & Serving (55.4%), while the most female-oriented occupations are Healthcare Support (96.1%), Personal Care & Service (85.0%), and Law Enforcement (50.3%).
| Occupation | Male | Female |
| Healthcare Support | 15 (3.9%) | 373 (96.1%) |
| Security & Protection | 193 (53.3%) | 169 (46.7%) |
| Firefighting & Prevention | 53 (66.2%) | 27 (33.8%) |
| Law Enforcement | 140 (49.6%) | 142 (50.3%) |
| Food Preparation & Serving | 456 (55.4%) | 367 (44.6%) |
| Cleaning & Maintenance | 248 (63.6%) | 142 (36.4%) |
| Personal Care & Service | 37 (15.0%) | 210 (85.0%) |
| Total (Category) | 949 (42.9%) | 1,261 (57.1%) |
| Total (Overall) | 4,916 (47.6%) | 5,402 (52.4%) |
Sales and Office Occupations
The most common Sales and Office occupations in Greenville are Sales & Related (1,266 | 12.3%), and Office & Administration (960 | 9.3%).

Sales and Office Occupations by Sex
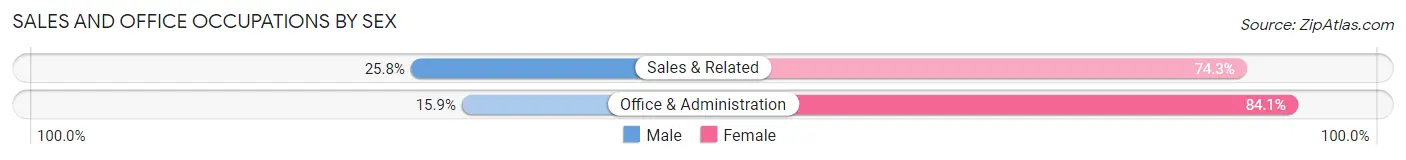
| Occupation | Male | Female |
| Sales & Related | 326 (25.8%) | 940 (74.3%) |
| Office & Administration | 153 (15.9%) | 807 (84.1%) |
| Total (Category) | 479 (21.5%) | 1,747 (78.5%) |
| Total (Overall) | 4,916 (47.6%) | 5,402 (52.4%) |
Natural Resources, Construction and Maintenance Occupations
The most common Natural Resources, Construction and Maintenance occupations in Greenville are Installation, Maintenance & Repair (385 | 3.7%), Construction & Extraction (359 | 3.5%), and Farming, Fishing & Forestry (41 | 0.4%).

Natural Resources, Construction and Maintenance Occupations by Sex
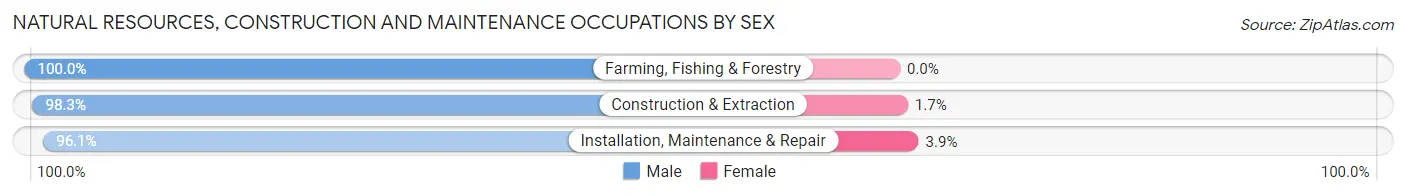
| Occupation | Male | Female |
| Farming, Fishing & Forestry | 41 (100.0%) | 0 (0.0%) |
| Construction & Extraction | 353 (98.3%) | 6 (1.7%) |
| Installation, Maintenance & Repair | 370 (96.1%) | 15 (3.9%) |
| Total (Category) | 764 (97.3%) | 21 (2.7%) |
| Total (Overall) | 4,916 (47.6%) | 5,402 (52.4%) |
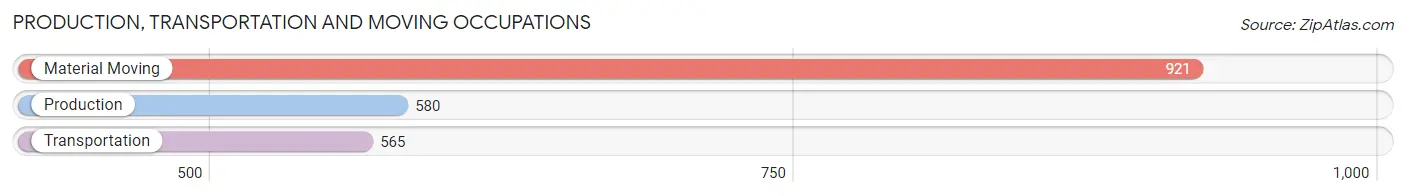
Production, Transportation and Moving Occupations
The most common Production, Transportation and Moving occupations in Greenville are Material Moving (921 | 8.9%), Production (580 | 5.6%), and Transportation (565 | 5.5%).
Production, Transportation and Moving Occupations by Sex
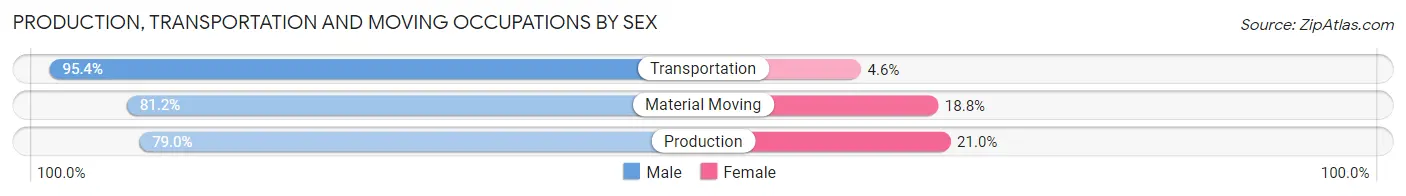
| Occupation | Male | Female |
| Production | 458 (79.0%) | 122 (21.0%) |
| Transportation | 539 (95.4%) | 26 (4.6%) |
| Material Moving | 748 (81.2%) | 173 (18.8%) |
| Total (Category) | 1,745 (84.5%) | 321 (15.5%) |
| Total (Overall) | 4,916 (47.6%) | 5,402 (52.4%) |
Employment Industries by Sex in Greenville
Employment Industries in Greenville
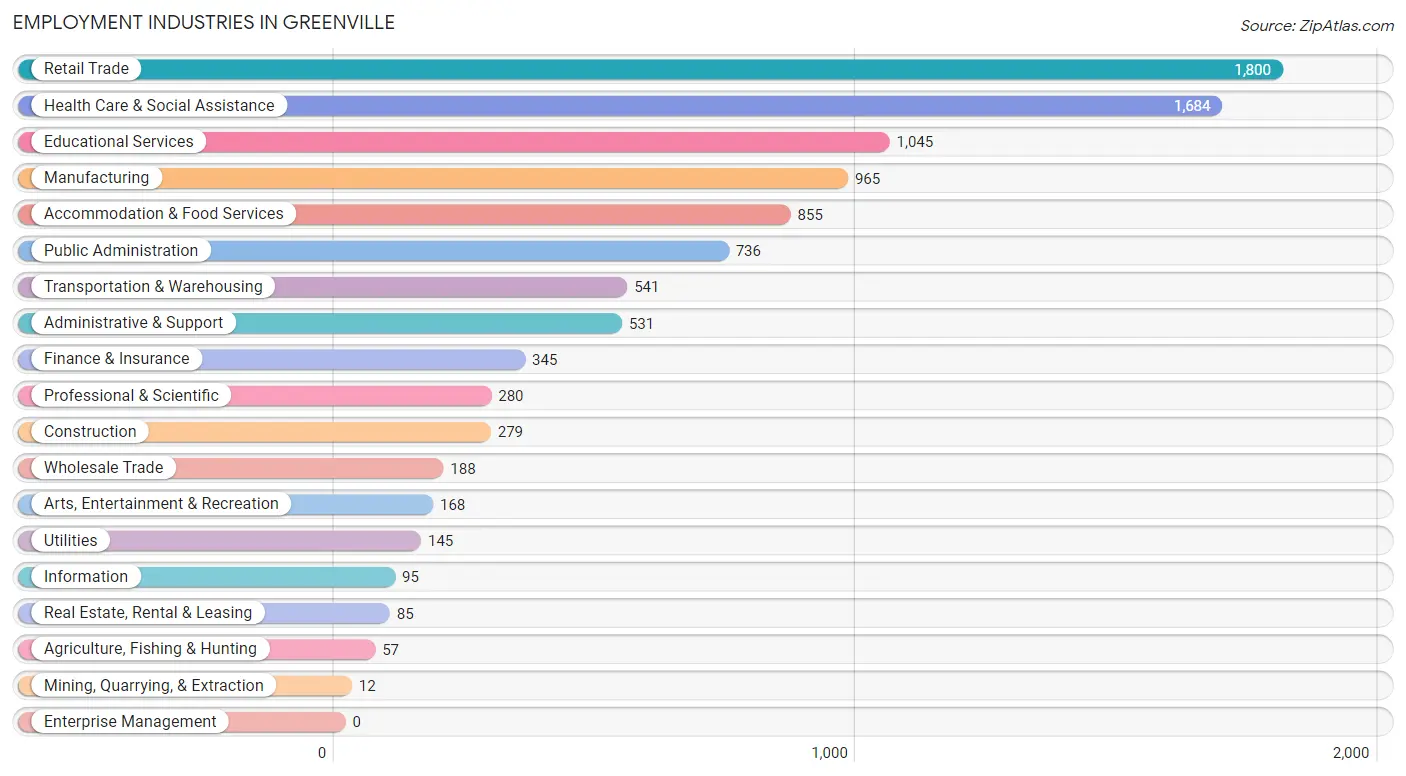
The major employment industries in Greenville include Retail Trade (1,800 | 17.4%), Health Care & Social Assistance (1,684 | 16.3%), Educational Services (1,045 | 10.1%), Manufacturing (965 | 9.3%), and Accommodation & Food Services (855 | 8.3%).
Employment Industries by Sex in Greenville
The Greenville industries that see more men than women are Mining, Quarrying, & Extraction (100.0%), Wholesale Trade (100.0%), and Information (100.0%), whereas the industries that tend to have a higher number of women are Health Care & Social Assistance (85.0%), Educational Services (81.3%), and Finance & Insurance (74.2%).
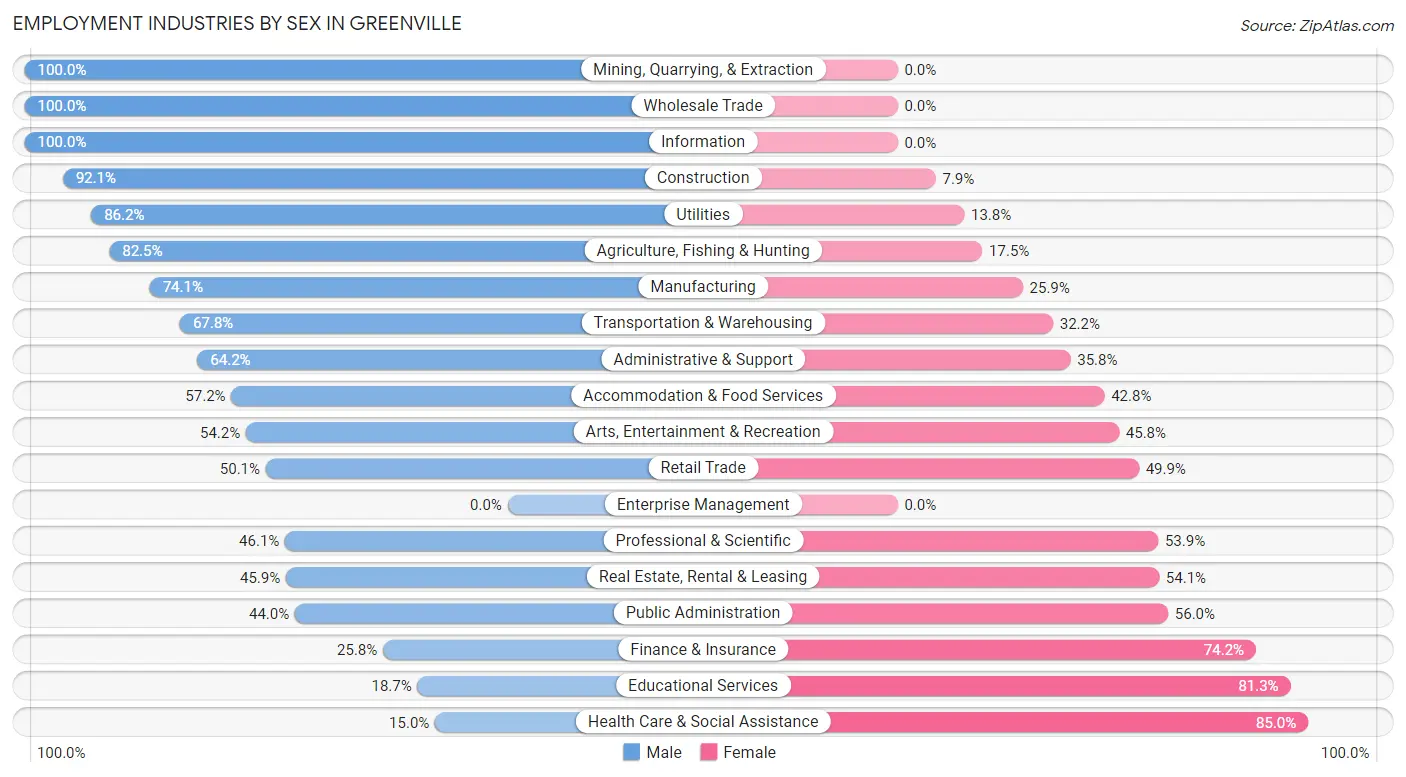
| Industry | Male | Female |
| Agriculture, Fishing & Hunting | 47 (82.5%) | 10 (17.5%) |
| Mining, Quarrying, & Extraction | 12 (100.0%) | 0 (0.0%) |
| Construction | 257 (92.1%) | 22 (7.9%) |
| Manufacturing | 715 (74.1%) | 250 (25.9%) |
| Wholesale Trade | 188 (100.0%) | 0 (0.0%) |
| Retail Trade | 901 (50.1%) | 899 (49.9%) |
| Transportation & Warehousing | 367 (67.8%) | 174 (32.2%) |
| Utilities | 125 (86.2%) | 20 (13.8%) |
| Information | 95 (100.0%) | 0 (0.0%) |
| Finance & Insurance | 89 (25.8%) | 256 (74.2%) |
| Real Estate, Rental & Leasing | 39 (45.9%) | 46 (54.1%) |
| Professional & Scientific | 129 (46.1%) | 151 (53.9%) |
| Enterprise Management | 0 (0.0%) | 0 (0.0%) |
| Administrative & Support | 341 (64.2%) | 190 (35.8%) |
| Educational Services | 195 (18.7%) | 850 (81.3%) |
| Health Care & Social Assistance | 253 (15.0%) | 1,431 (85.0%) |
| Arts, Entertainment & Recreation | 91 (54.2%) | 77 (45.8%) |
| Accommodation & Food Services | 489 (57.2%) | 366 (42.8%) |
| Public Administration | 324 (44.0%) | 412 (56.0%) |
| Total | 4,916 (47.6%) | 5,402 (52.4%) |
Education in Greenville
School Enrollment in Greenville
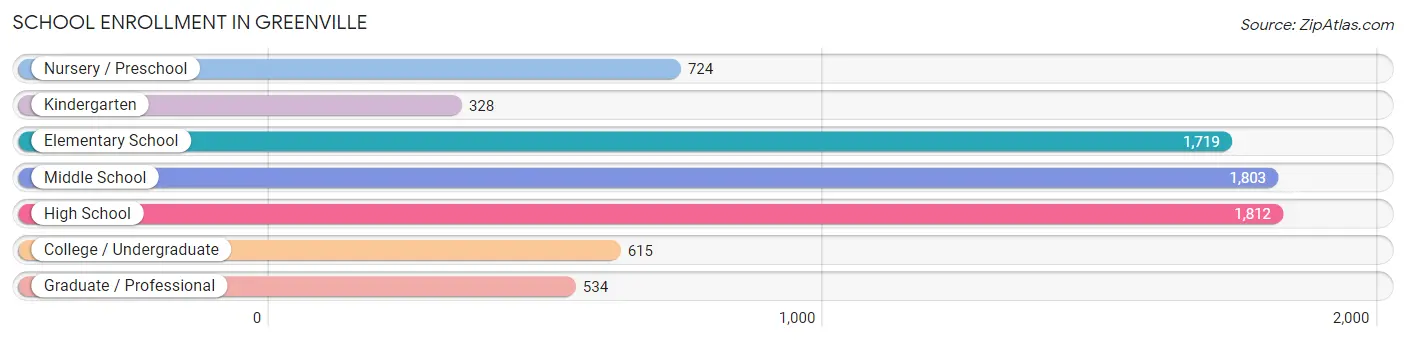
The most common levels of schooling among the 7,535 students in Greenville are high school (1,812 | 24.0%), middle school (1,803 | 23.9%), and elementary school (1,719 | 22.8%).
| School Level | # Students | % Students |
| Nursery / Preschool | 724 | 9.6% |
| Kindergarten | 328 | 4.3% |
| Elementary School | 1,719 | 22.8% |
| Middle School | 1,803 | 23.9% |
| High School | 1,812 | 24.0% |
| College / Undergraduate | 615 | 8.2% |
| Graduate / Professional | 534 | 7.1% |
| Total | 7,535 | 100.0% |
School Enrollment by Age by Funding Source in Greenville
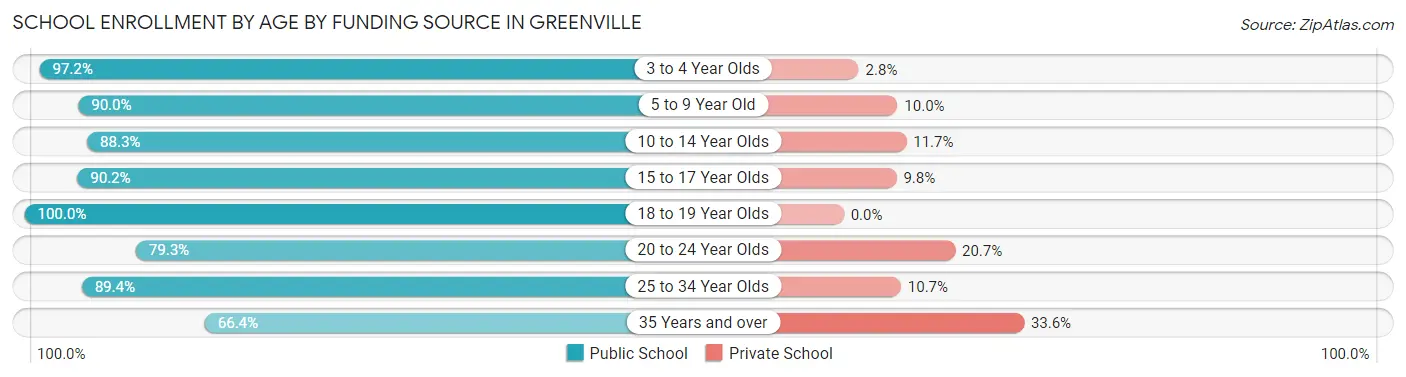
Out of a total of 7,535 students who are enrolled in schools in Greenville, 844 (11.2%) attend a private institution, while the remaining 6,691 (88.8%) are enrolled in public schools. The age group of 35 years and over has the highest likelihood of being enrolled in private schools, with 182 (33.6% in the age bracket) enrolled. Conversely, the age group of 18 to 19 year olds has the lowest likelihood of being enrolled in a private school, with 566 (100.0% in the age bracket) attending a public institution.
| Age Bracket | Public School | Private School |
| 3 to 4 Year Olds | 628 (97.2%) | 18 (2.8%) |
| 5 to 9 Year Old | 1,601 (90.0%) | 178 (10.0%) |
| 10 to 14 Year Olds | 1,811 (88.3%) | 239 (11.7%) |
| 15 to 17 Year Olds | 1,101 (90.2%) | 120 (9.8%) |
| 18 to 19 Year Olds | 566 (100.0%) | 0 (0.0%) |
| 20 to 24 Year Olds | 237 (79.3%) | 62 (20.7%) |
| 25 to 34 Year Olds | 386 (89.3%) | 46 (10.6%) |
| 35 Years and over | 360 (66.4%) | 182 (33.6%) |
| Total | 6,691 (88.8%) | 844 (11.2%) |
Educational Attainment by Field of Study in Greenville
Education (982 | 22.8%), business (936 | 21.7%), arts & humanities (567 | 13.2%), science & technology (493 | 11.4%), and bio, nature & agricultural (275 | 6.4%) are the most common fields of study among 4,308 individuals in Greenville who have obtained a bachelor's degree or higher.
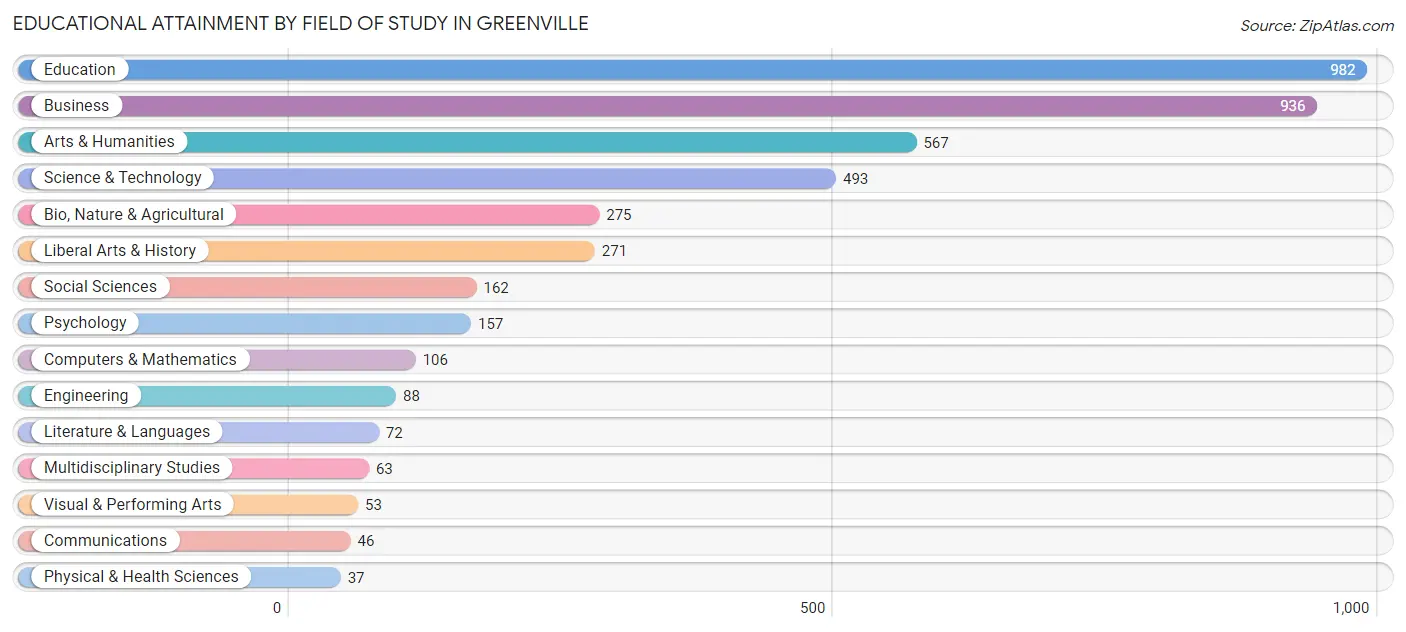
| Field of Study | # Graduates | % Graduates |
| Computers & Mathematics | 106 | 2.5% |
| Bio, Nature & Agricultural | 275 | 6.4% |
| Physical & Health Sciences | 37 | 0.9% |
| Psychology | 157 | 3.6% |
| Social Sciences | 162 | 3.8% |
| Engineering | 88 | 2.0% |
| Multidisciplinary Studies | 63 | 1.5% |
| Science & Technology | 493 | 11.4% |
| Business | 936 | 21.7% |
| Education | 982 | 22.8% |
| Literature & Languages | 72 | 1.7% |
| Liberal Arts & History | 271 | 6.3% |
| Visual & Performing Arts | 53 | 1.2% |
| Communications | 46 | 1.1% |
| Arts & Humanities | 567 | 13.2% |
| Total | 4,308 | 100.0% |
Transportation & Commute in Greenville
Vehicle Availability by Sex in Greenville
The most prevalent vehicle ownership categories in Greenville are males with 2 vehicles (1,752, accounting for 35.7%) and females with 2 vehicles (1,897, making up 32.9%).
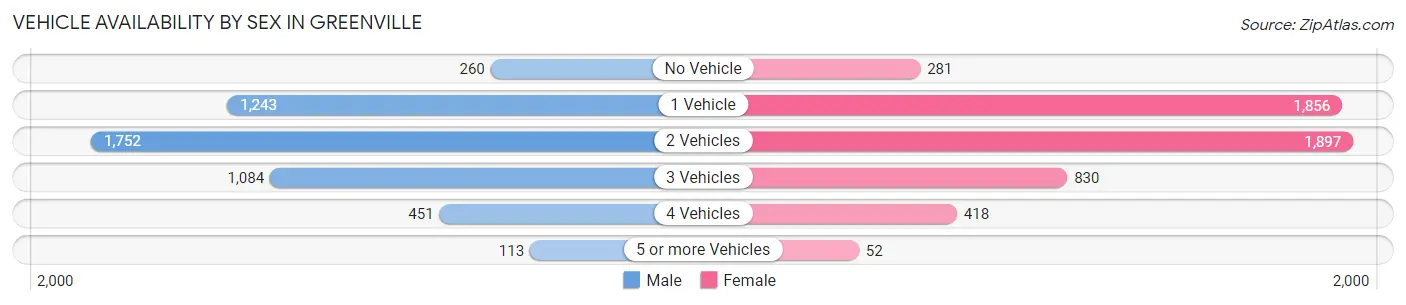
| Vehicles Available | Male | Female |
| No Vehicle | 260 (5.3%) | 281 (5.3%) |
| 1 Vehicle | 1,243 (25.4%) | 1,856 (34.8%) |
| 2 Vehicles | 1,752 (35.7%) | 1,897 (35.6%) |
| 3 Vehicles | 1,084 (22.1%) | 830 (15.6%) |
| 4 Vehicles | 451 (9.2%) | 418 (7.8%) |
| 5 or more Vehicles | 113 (2.3%) | 52 (1.0%) |
| Total | 4,903 (100.0%) | 5,334 (100.0%) |
Commute Time in Greenville
The most frequently occuring commute durations in Greenville are 10 to 14 minutes (2,901 commuters, 29.1%), 15 to 19 minutes (2,702 commuters, 27.2%), and 5 to 9 minutes (1,653 commuters, 16.6%).
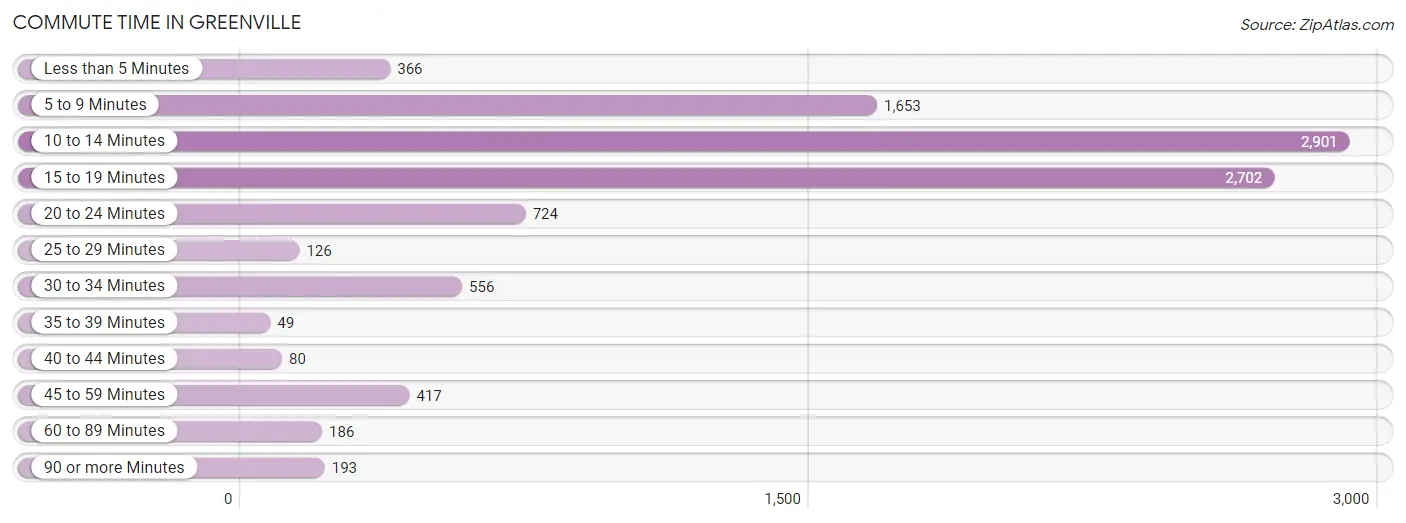
| Commute Time | # Commuters | % Commuters |
| Less than 5 Minutes | 366 | 3.7% |
| 5 to 9 Minutes | 1,653 | 16.6% |
| 10 to 14 Minutes | 2,901 | 29.1% |
| 15 to 19 Minutes | 2,702 | 27.2% |
| 20 to 24 Minutes | 724 | 7.3% |
| 25 to 29 Minutes | 126 | 1.3% |
| 30 to 34 Minutes | 556 | 5.6% |
| 35 to 39 Minutes | 49 | 0.5% |
| 40 to 44 Minutes | 80 | 0.8% |
| 45 to 59 Minutes | 417 | 4.2% |
| 60 to 89 Minutes | 186 | 1.9% |
| 90 or more Minutes | 193 | 1.9% |
Commute Time by Sex in Greenville
The most common commute times in Greenville are 10 to 14 minutes (1,468 commuters, 30.9%) for males and 10 to 14 minutes (1,433 commuters, 27.6%) for females.
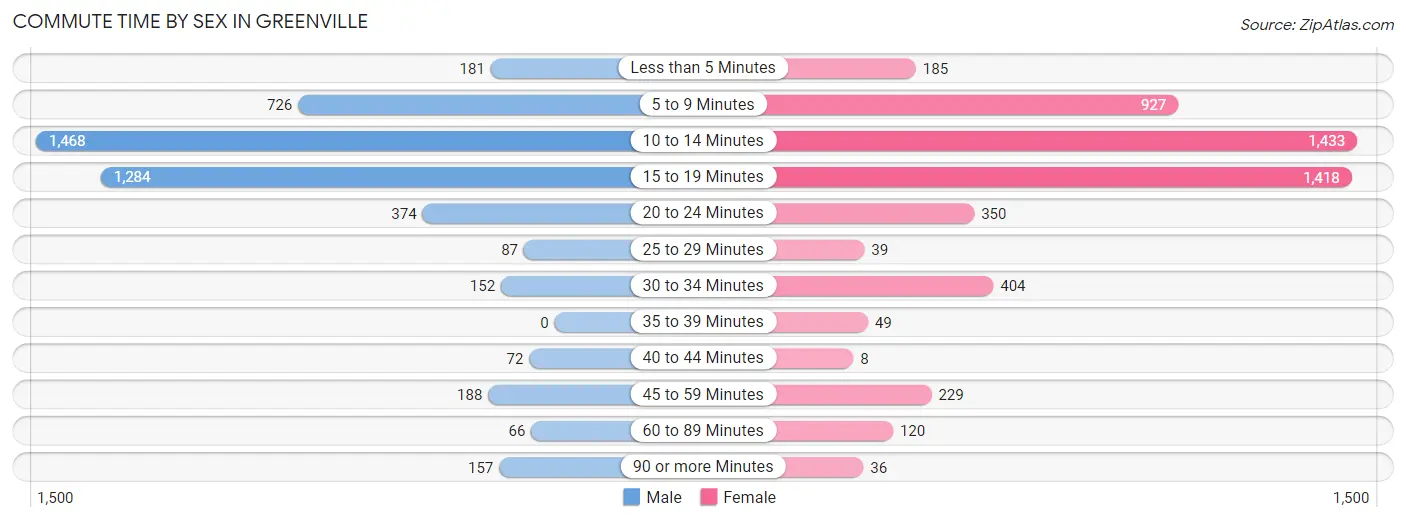
| Commute Time | Male | Female |
| Less than 5 Minutes | 181 (3.8%) | 185 (3.6%) |
| 5 to 9 Minutes | 726 (15.3%) | 927 (17.8%) |
| 10 to 14 Minutes | 1,468 (30.9%) | 1,433 (27.6%) |
| 15 to 19 Minutes | 1,284 (27.0%) | 1,418 (27.3%) |
| 20 to 24 Minutes | 374 (7.9%) | 350 (6.7%) |
| 25 to 29 Minutes | 87 (1.8%) | 39 (0.7%) |
| 30 to 34 Minutes | 152 (3.2%) | 404 (7.8%) |
| 35 to 39 Minutes | 0 (0.0%) | 49 (0.9%) |
| 40 to 44 Minutes | 72 (1.5%) | 8 (0.2%) |
| 45 to 59 Minutes | 188 (4.0%) | 229 (4.4%) |
| 60 to 89 Minutes | 66 (1.4%) | 120 (2.3%) |
| 90 or more Minutes | 157 (3.3%) | 36 (0.7%) |
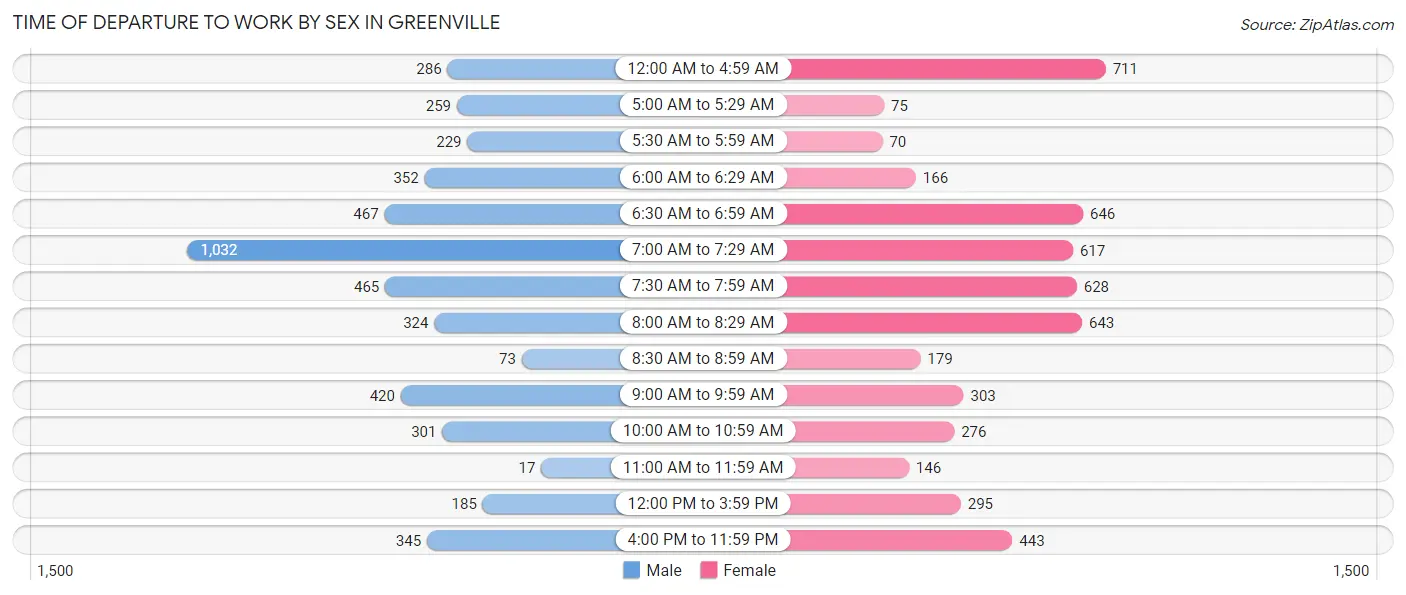
Time of Departure to Work by Sex in Greenville
The most frequent times of departure to work in Greenville are 7:00 AM to 7:29 AM (1,032, 21.7%) for males and 12:00 AM to 4:59 AM (711, 13.7%) for females.
| Time of Departure | Male | Female |
| 12:00 AM to 4:59 AM | 286 (6.0%) | 711 (13.7%) |
| 5:00 AM to 5:29 AM | 259 (5.4%) | 75 (1.4%) |
| 5:30 AM to 5:59 AM | 229 (4.8%) | 70 (1.3%) |
| 6:00 AM to 6:29 AM | 352 (7.4%) | 166 (3.2%) |
| 6:30 AM to 6:59 AM | 467 (9.8%) | 646 (12.4%) |
| 7:00 AM to 7:29 AM | 1,032 (21.7%) | 617 (11.9%) |
| 7:30 AM to 7:59 AM | 465 (9.8%) | 628 (12.1%) |
| 8:00 AM to 8:29 AM | 324 (6.8%) | 643 (12.4%) |
| 8:30 AM to 8:59 AM | 73 (1.5%) | 179 (3.4%) |
| 9:00 AM to 9:59 AM | 420 (8.8%) | 303 (5.8%) |
| 10:00 AM to 10:59 AM | 301 (6.3%) | 276 (5.3%) |
| 11:00 AM to 11:59 AM | 17 (0.4%) | 146 (2.8%) |
| 12:00 PM to 3:59 PM | 185 (3.9%) | 295 (5.7%) |
| 4:00 PM to 11:59 PM | 345 (7.3%) | 443 (8.5%) |
| Total | 4,755 (100.0%) | 5,198 (100.0%) |
Housing Occupancy in Greenville
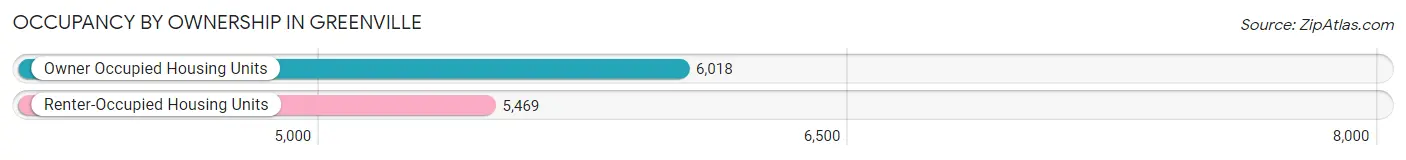
Occupancy by Ownership in Greenville
Of the total 11,487 dwellings in Greenville, owner-occupied units account for 6,018 (52.4%), while renter-occupied units make up 5,469 (47.6%).
| Occupancy | # Housing Units | % Housing Units |
| Owner Occupied Housing Units | 6,018 | 52.4% |
| Renter-Occupied Housing Units | 5,469 | 47.6% |
| Total Occupied Housing Units | 11,487 | 100.0% |
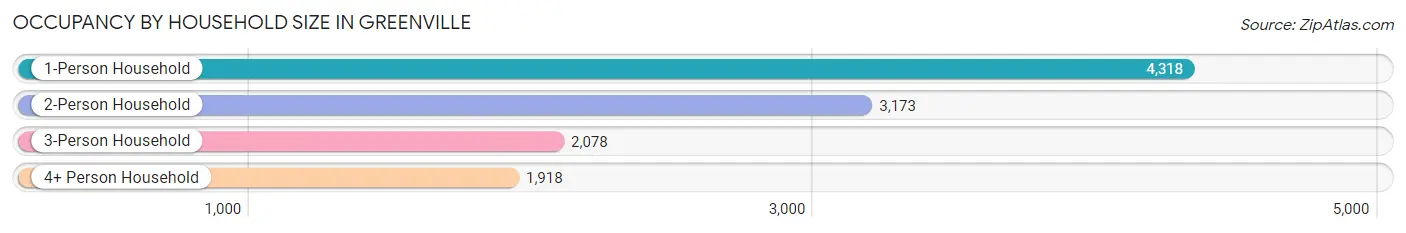
Occupancy by Household Size in Greenville
| Household Size | # Housing Units | % Housing Units |
| 1-Person Household | 4,318 | 37.6% |
| 2-Person Household | 3,173 | 27.6% |
| 3-Person Household | 2,078 | 18.1% |
| 4+ Person Household | 1,918 | 16.7% |
| Total Housing Units | 11,487 | 100.0% |
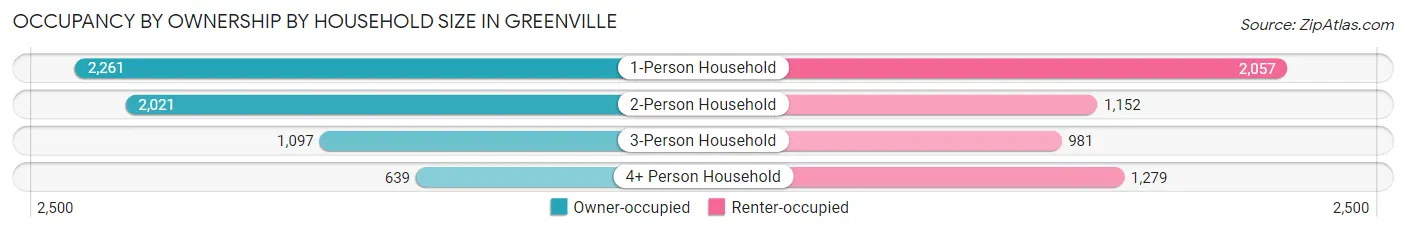
Occupancy by Ownership by Household Size in Greenville
| Household Size | Owner-occupied | Renter-occupied |
| 1-Person Household | 2,261 (52.4%) | 2,057 (47.6%) |
| 2-Person Household | 2,021 (63.7%) | 1,152 (36.3%) |
| 3-Person Household | 1,097 (52.8%) | 981 (47.2%) |
| 4+ Person Household | 639 (33.3%) | 1,279 (66.7%) |
| Total Housing Units | 6,018 (52.4%) | 5,469 (47.6%) |
Occupancy by Educational Attainment in Greenville
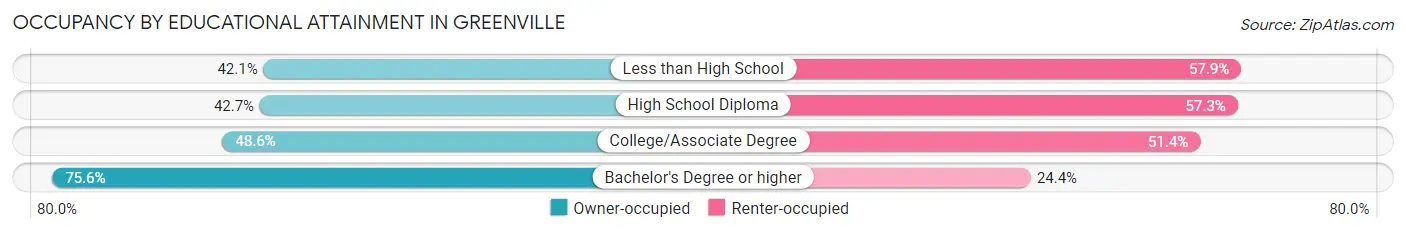
| Household Size | Owner-occupied | Renter-occupied |
| Less than High School | 801 (42.1%) | 1,101 (57.9%) |
| High School Diploma | 1,403 (42.7%) | 1,885 (57.3%) |
| College/Associate Degree | 1,706 (48.6%) | 1,803 (51.4%) |
| Bachelor's Degree or higher | 2,108 (75.6%) | 680 (24.4%) |
Occupancy by Age of Householder in Greenville
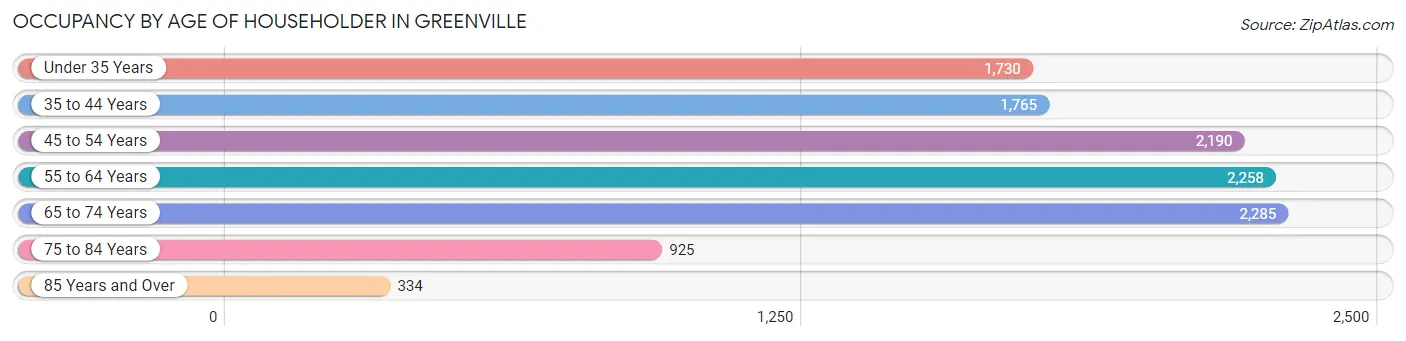
| Age Bracket | # Households | % Households |
| Under 35 Years | 1,730 | 15.1% |
| 35 to 44 Years | 1,765 | 15.4% |
| 45 to 54 Years | 2,190 | 19.1% |
| 55 to 64 Years | 2,258 | 19.7% |
| 65 to 74 Years | 2,285 | 19.9% |
| 75 to 84 Years | 925 | 8.1% |
| 85 Years and Over | 334 | 2.9% |
| Total | 11,487 | 100.0% |
Housing Finances in Greenville
Median Income by Occupancy in Greenville
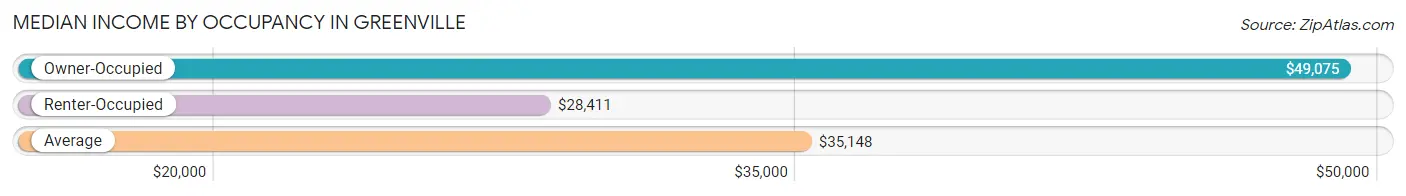
| Occupancy Type | # Households | Median Income |
| Owner-Occupied | 6,018 (52.4%) | $49,075 |
| Renter-Occupied | 5,469 (47.6%) | $28,411 |
| Average | 11,487 (100.0%) | $35,148 |
Occupancy by Householder Income Bracket in Greenville
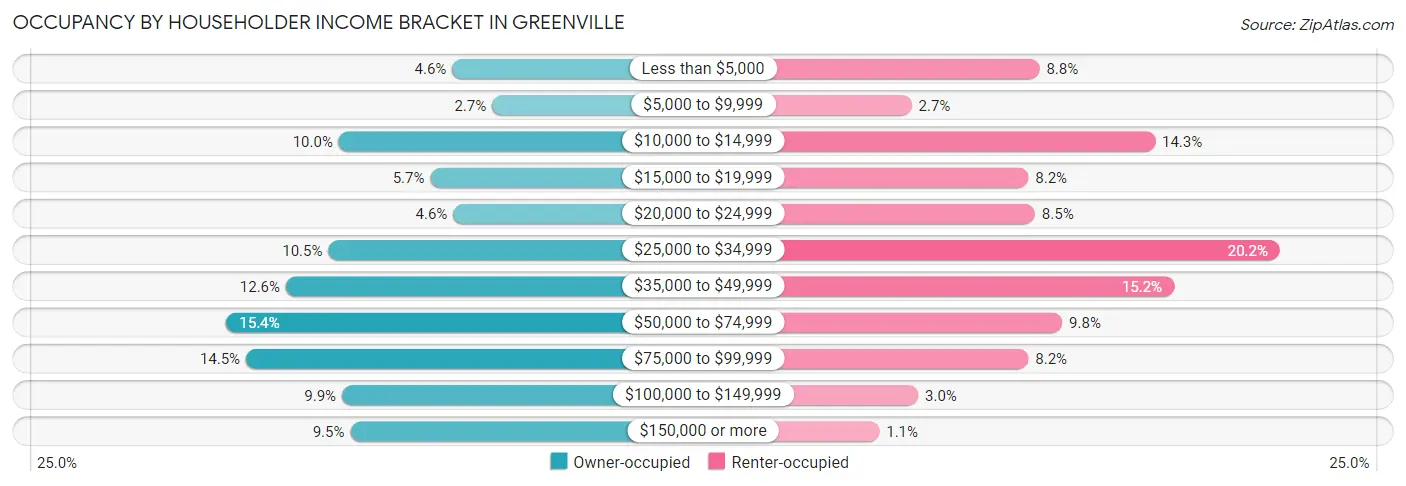
| Income Bracket | Owner-occupied | Renter-occupied |
| Less than $5,000 | 279 (4.6%) | 479 (8.8%) |
| $5,000 to $9,999 | 165 (2.7%) | 146 (2.7%) |
| $10,000 to $14,999 | 604 (10.0%) | 780 (14.3%) |
| $15,000 to $19,999 | 342 (5.7%) | 450 (8.2%) |
| $20,000 to $24,999 | 276 (4.6%) | 467 (8.5%) |
| $25,000 to $34,999 | 634 (10.5%) | 1,105 (20.2%) |
| $35,000 to $49,999 | 756 (12.6%) | 829 (15.2%) |
| $50,000 to $74,999 | 926 (15.4%) | 538 (9.8%) |
| $75,000 to $99,999 | 870 (14.5%) | 450 (8.2%) |
| $100,000 to $149,999 | 595 (9.9%) | 163 (3.0%) |
| $150,000 or more | 571 (9.5%) | 62 (1.1%) |
| Total | 6,018 (100.0%) | 5,469 (100.0%) |
Monthly Housing Cost Tiers in Greenville
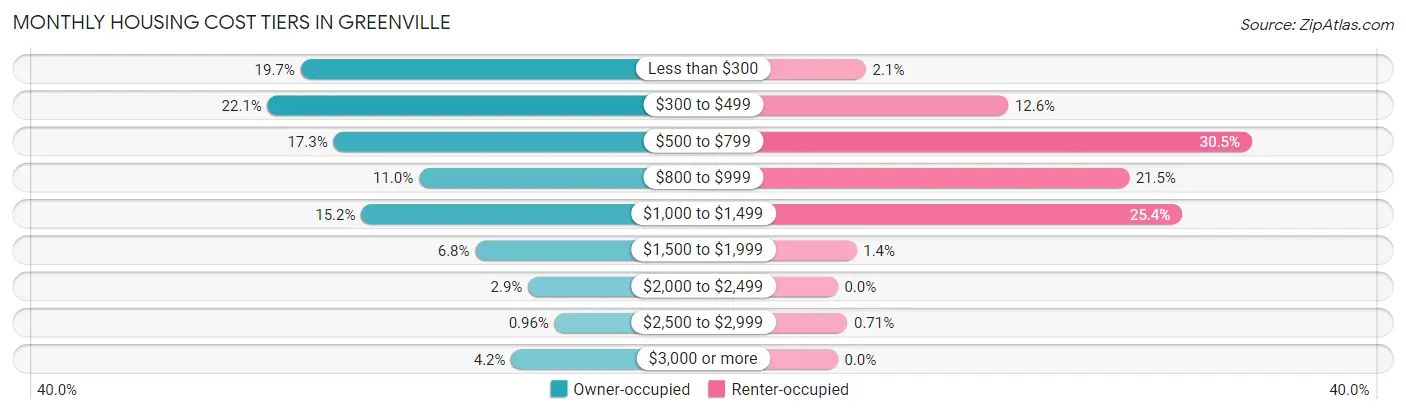
| Monthly Cost | Owner-occupied | Renter-occupied |
| Less than $300 | 1,184 (19.7%) | 114 (2.1%) |
| $300 to $499 | 1,330 (22.1%) | 687 (12.6%) |
| $500 to $799 | 1,038 (17.2%) | 1,669 (30.5%) |
| $800 to $999 | 659 (11.0%) | 1,173 (21.4%) |
| $1,000 to $1,499 | 915 (15.2%) | 1,388 (25.4%) |
| $1,500 to $1,999 | 409 (6.8%) | 76 (1.4%) |
| $2,000 to $2,499 | 175 (2.9%) | 0 (0.0%) |
| $2,500 to $2,999 | 58 (1.0%) | 39 (0.7%) |
| $3,000 or more | 250 (4.2%) | 0 (0.0%) |
| Total | 6,018 (100.0%) | 5,469 (100.0%) |
Physical Housing Characteristics in Greenville
Housing Structures in Greenville
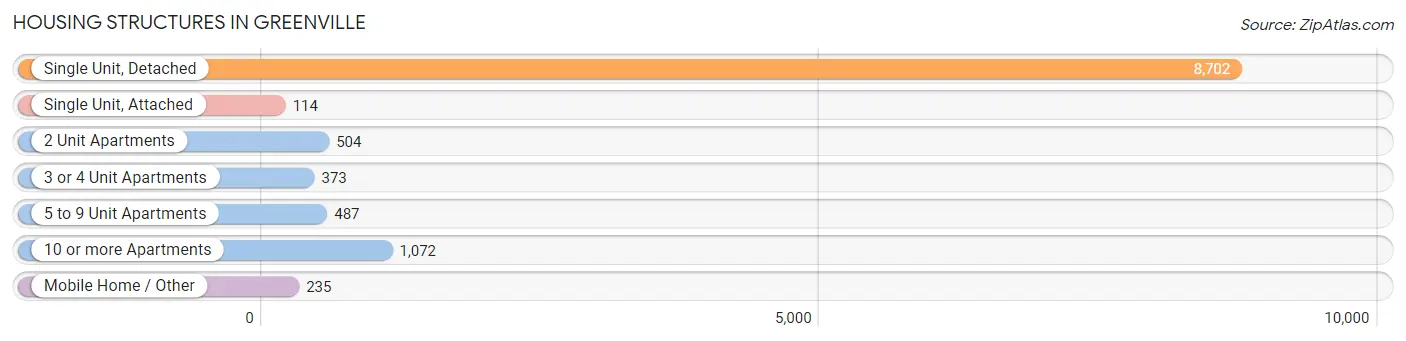
| Structure Type | # Housing Units | % Housing Units |
| Single Unit, Detached | 8,702 | 75.8% |
| Single Unit, Attached | 114 | 1.0% |
| 2 Unit Apartments | 504 | 4.4% |
| 3 or 4 Unit Apartments | 373 | 3.3% |
| 5 to 9 Unit Apartments | 487 | 4.2% |
| 10 or more Apartments | 1,072 | 9.3% |
| Mobile Home / Other | 235 | 2.1% |
| Total | 11,487 | 100.0% |
Housing Structures by Occupancy in Greenville
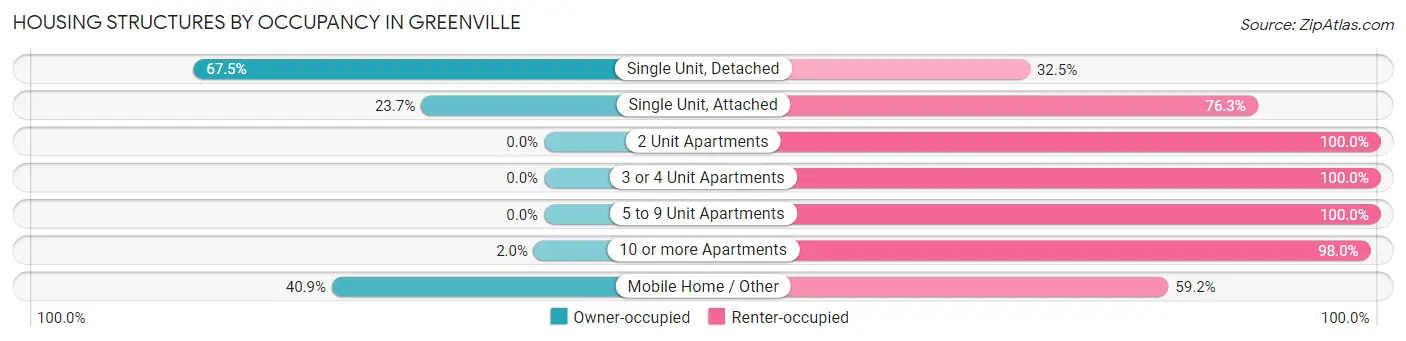
| Structure Type | Owner-occupied | Renter-occupied |
| Single Unit, Detached | 5,874 (67.5%) | 2,828 (32.5%) |
| Single Unit, Attached | 27 (23.7%) | 87 (76.3%) |
| 2 Unit Apartments | 0 (0.0%) | 504 (100.0%) |
| 3 or 4 Unit Apartments | 0 (0.0%) | 373 (100.0%) |
| 5 to 9 Unit Apartments | 0 (0.0%) | 487 (100.0%) |
| 10 or more Apartments | 21 (2.0%) | 1,051 (98.0%) |
| Mobile Home / Other | 96 (40.8%) | 139 (59.2%) |
| Total | 6,018 (52.4%) | 5,469 (47.6%) |
Housing Structures by Number of Rooms in Greenville
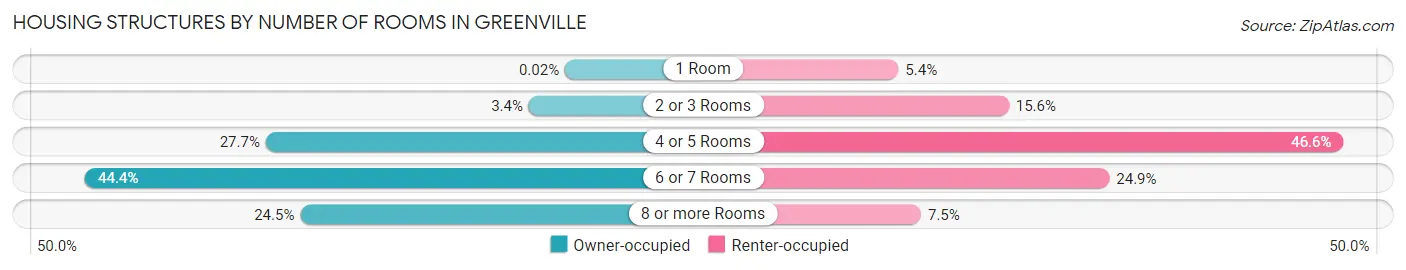
| Number of Rooms | Owner-occupied | Renter-occupied |
| 1 Room | 1 (0.0%) | 296 (5.4%) |
| 2 or 3 Rooms | 203 (3.4%) | 854 (15.6%) |
| 4 or 5 Rooms | 1,667 (27.7%) | 2,546 (46.6%) |
| 6 or 7 Rooms | 2,672 (44.4%) | 1,363 (24.9%) |
| 8 or more Rooms | 1,475 (24.5%) | 410 (7.5%) |
| Total | 6,018 (100.0%) | 5,469 (100.0%) |
Housing Structure by Heating Type in Greenville
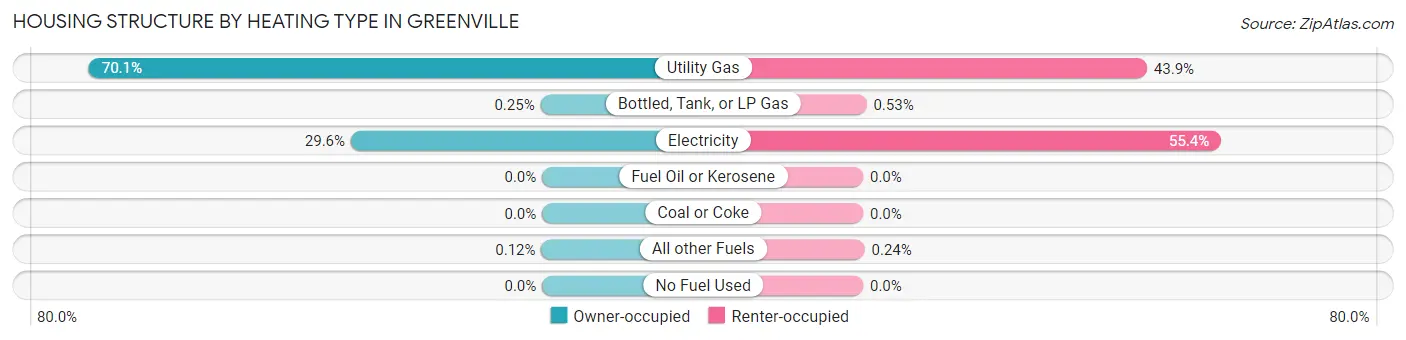
| Heating Type | Owner-occupied | Renter-occupied |
| Utility Gas | 4,217 (70.1%) | 2,400 (43.9%) |
| Bottled, Tank, or LP Gas | 15 (0.3%) | 29 (0.5%) |
| Electricity | 1,779 (29.6%) | 3,027 (55.3%) |
| Fuel Oil or Kerosene | 0 (0.0%) | 0 (0.0%) |
| Coal or Coke | 0 (0.0%) | 0 (0.0%) |
| All other Fuels | 7 (0.1%) | 13 (0.2%) |
| No Fuel Used | 0 (0.0%) | 0 (0.0%) |
| Total | 6,018 (100.0%) | 5,469 (100.0%) |
Household Vehicle Usage in Greenville
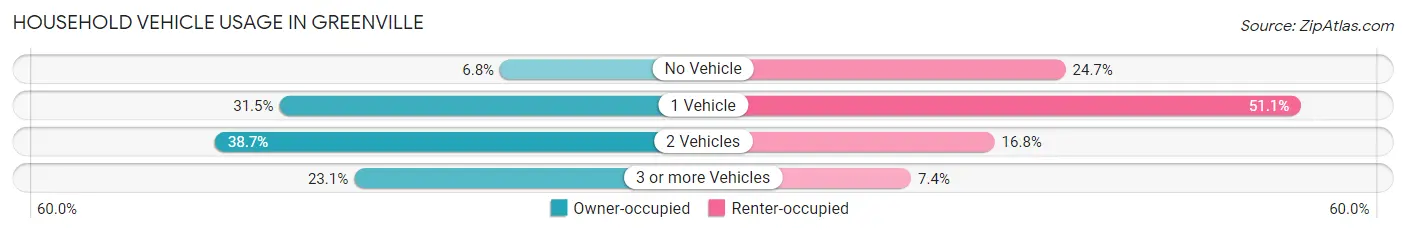
| Vehicles per Household | Owner-occupied | Renter-occupied |
| No Vehicle | 406 (6.8%) | 1,352 (24.7%) |
| 1 Vehicle | 1,894 (31.5%) | 2,794 (51.1%) |
| 2 Vehicles | 2,328 (38.7%) | 917 (16.8%) |
| 3 or more Vehicles | 1,390 (23.1%) | 406 (7.4%) |
| Total | 6,018 (100.0%) | 5,469 (100.0%) |
Real Estate & Mortgages in Greenville
Real Estate and Mortgage Overview in Greenville
| Characteristic | Without Mortgage | With Mortgage |
| Housing Units | 3,525 | 2,493 |
| Median Property Value | $82,400 | $113,500 |
| Median Household Income | $39,256 | $346 |
| Monthly Housing Costs | $369 | $193 |
| Real Estate Taxes | $515 | $47 |
Property Value by Mortgage Status in Greenville
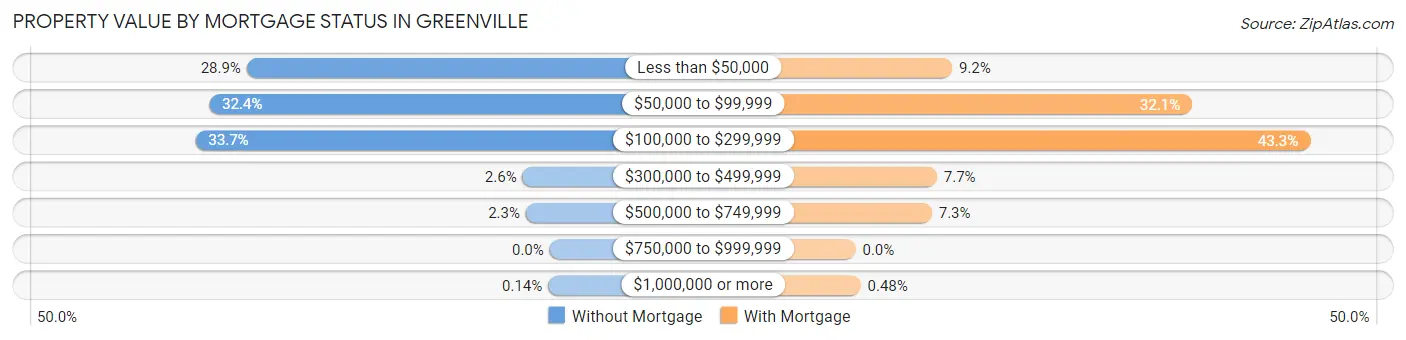
| Property Value | Without Mortgage | With Mortgage |
| Less than $50,000 | 1,017 (28.8%) | 229 (9.2%) |
| $50,000 to $99,999 | 1,143 (32.4%) | 799 (32.1%) |
| $100,000 to $299,999 | 1,189 (33.7%) | 1,079 (43.3%) |
| $300,000 to $499,999 | 91 (2.6%) | 193 (7.7%) |
| $500,000 to $749,999 | 80 (2.3%) | 181 (7.3%) |
| $750,000 to $999,999 | 0 (0.0%) | 0 (0.0%) |
| $1,000,000 or more | 5 (0.1%) | 12 (0.5%) |
| Total | 3,525 (100.0%) | 2,493 (100.0%) |
Household Income by Mortgage Status in Greenville
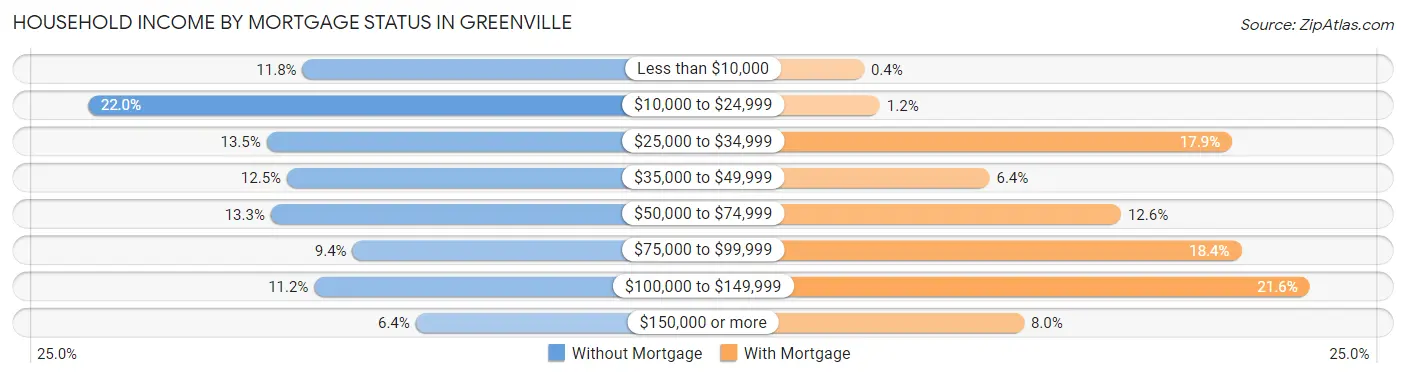
| Household Income | Without Mortgage | With Mortgage |
| Less than $10,000 | 415 (11.8%) | 10 (0.4%) |
| $10,000 to $24,999 | 775 (22.0%) | 29 (1.2%) |
| $25,000 to $34,999 | 475 (13.5%) | 447 (17.9%) |
| $35,000 to $49,999 | 441 (12.5%) | 159 (6.4%) |
| $50,000 to $74,999 | 468 (13.3%) | 315 (12.6%) |
| $75,000 to $99,999 | 331 (9.4%) | 458 (18.4%) |
| $100,000 to $149,999 | 395 (11.2%) | 539 (21.6%) |
| $150,000 or more | 225 (6.4%) | 200 (8.0%) |
| Total | 3,525 (100.0%) | 2,493 (100.0%) |
Property Value to Household Income Ratio in Greenville
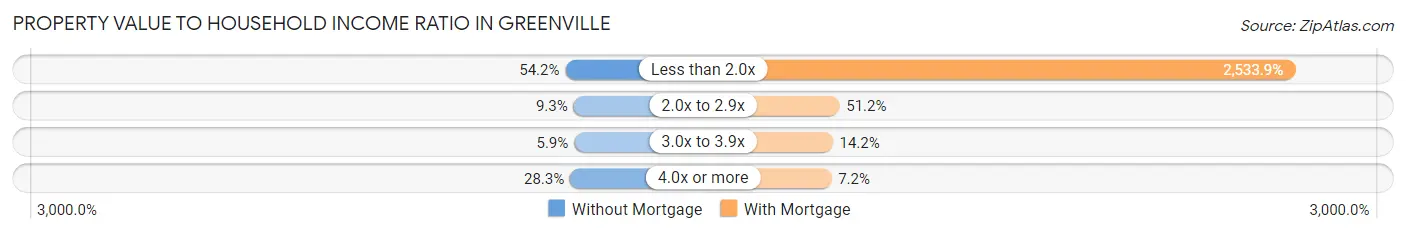
| Value-to-Income Ratio | Without Mortgage | With Mortgage |
| Less than 2.0x | 1,910 (54.2%) | 63,171 (2,533.9%) |
| 2.0x to 2.9x | 329 (9.3%) | 1,276 (51.2%) |
| 3.0x to 3.9x | 207 (5.9%) | 354 (14.2%) |
| 4.0x or more | 999 (28.3%) | 180 (7.2%) |
| Total | 3,525 (100.0%) | 2,493 (100.0%) |
Real Estate Taxes by Mortgage Status in Greenville
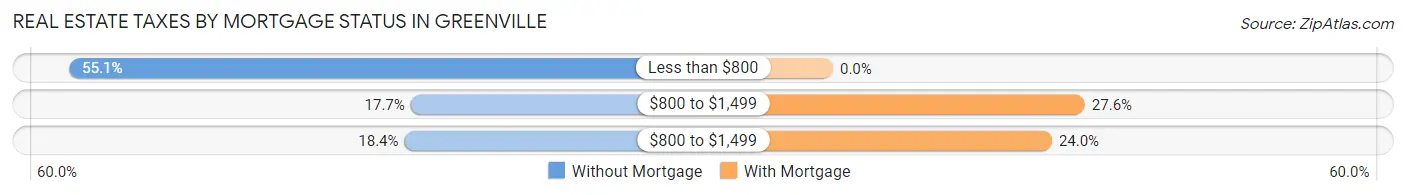
| Property Taxes | Without Mortgage | With Mortgage |
| Less than $800 | 1,943 (55.1%) | 0 (0.0%) |
| $800 to $1,499 | 624 (17.7%) | 688 (27.6%) |
| $800 to $1,499 | 648 (18.4%) | 598 (24.0%) |
| Total | 3,525 (100.0%) | 2,493 (100.0%) |
Health & Disability in Greenville
Health Insurance Coverage by Age in Greenville
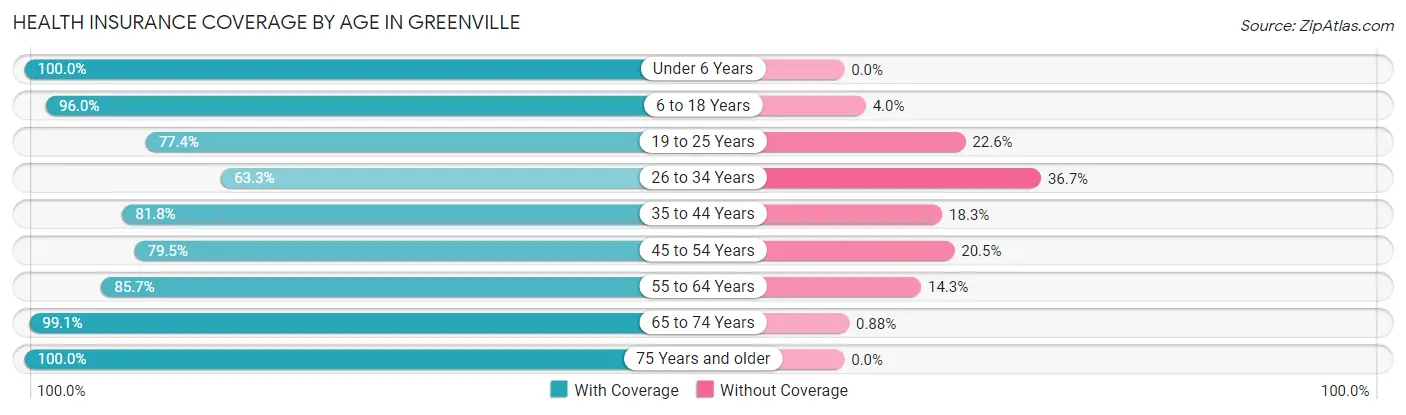
| Age Bracket | With Coverage | Without Coverage |
| Under 6 Years | 2,341 (100.0%) | 0 (0.0%) |
| 6 to 18 Years | 5,441 (96.0%) | 227 (4.0%) |
| 19 to 25 Years | 1,707 (77.4%) | 498 (22.6%) |
| 26 to 34 Years | 1,998 (63.3%) | 1,157 (36.7%) |
| 35 to 44 Years | 2,696 (81.8%) | 602 (18.2%) |
| 45 to 54 Years | 2,766 (79.5%) | 714 (20.5%) |
| 55 to 64 Years | 3,399 (85.7%) | 568 (14.3%) |
| 65 to 74 Years | 3,146 (99.1%) | 28 (0.9%) |
| 75 Years and older | 1,699 (100.0%) | 0 (0.0%) |
| Total | 25,193 (86.9%) | 3,794 (13.1%) |
Health Insurance Coverage by Citizenship Status in Greenville
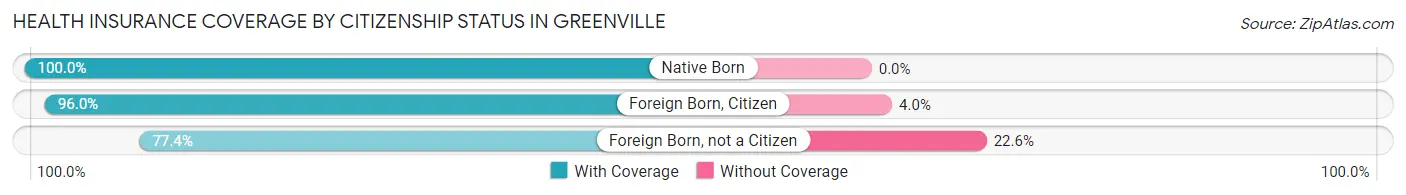
| Citizenship Status | With Coverage | Without Coverage |
| Native Born | 2,341 (100.0%) | 0 (0.0%) |
| Foreign Born, Citizen | 5,441 (96.0%) | 227 (4.0%) |
| Foreign Born, not a Citizen | 1,707 (77.4%) | 498 (22.6%) |
Health Insurance Coverage by Household Income in Greenville
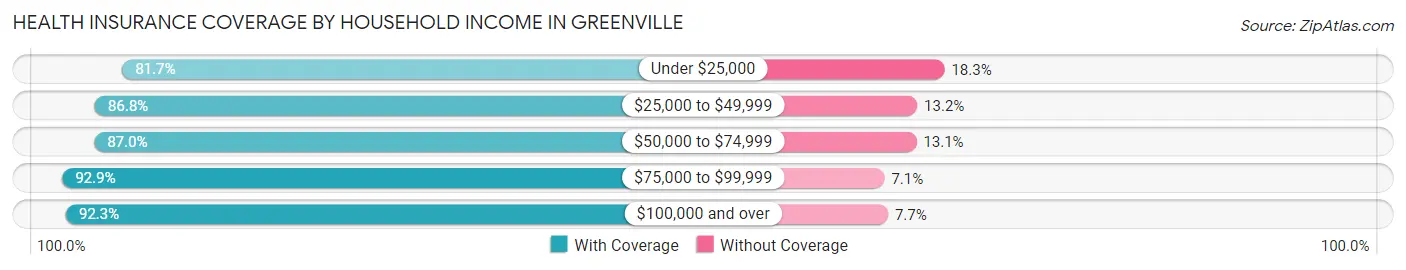
| Household Income | With Coverage | Without Coverage |
| Under $25,000 | 7,071 (81.7%) | 1,584 (18.3%) |
| $25,000 to $49,999 | 6,886 (86.8%) | 1,045 (13.2%) |
| $50,000 to $74,999 | 3,905 (87.0%) | 586 (13.1%) |
| $75,000 to $99,999 | 3,657 (92.9%) | 278 (7.1%) |
| $100,000 and over | 3,596 (92.3%) | 301 (7.7%) |
Public vs Private Health Insurance Coverage by Age in Greenville
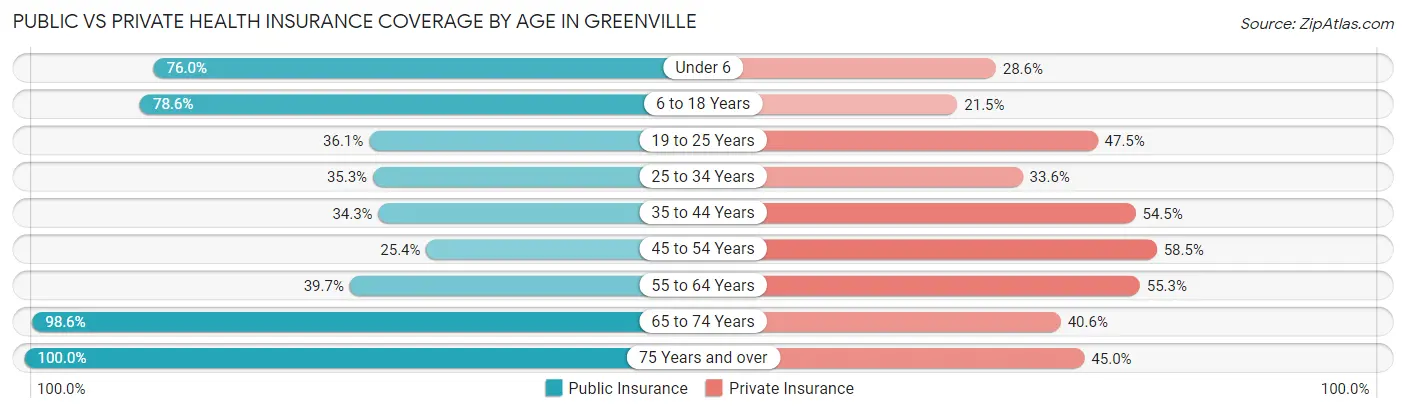
| Age Bracket | Public Insurance | Private Insurance |
| Under 6 | 1,780 (76.0%) | 669 (28.6%) |
| 6 to 18 Years | 4,453 (78.6%) | 1,216 (21.4%) |
| 19 to 25 Years | 795 (36.0%) | 1,047 (47.5%) |
| 25 to 34 Years | 1,115 (35.3%) | 1,059 (33.6%) |
| 35 to 44 Years | 1,132 (34.3%) | 1,798 (54.5%) |
| 45 to 54 Years | 885 (25.4%) | 2,034 (58.5%) |
| 55 to 64 Years | 1,573 (39.7%) | 2,194 (55.3%) |
| 65 to 74 Years | 3,128 (98.6%) | 1,290 (40.6%) |
| 75 Years and over | 1,699 (100.0%) | 765 (45.0%) |
| Total | 16,560 (57.1%) | 12,072 (41.6%) |
Disability Status by Sex by Age in Greenville
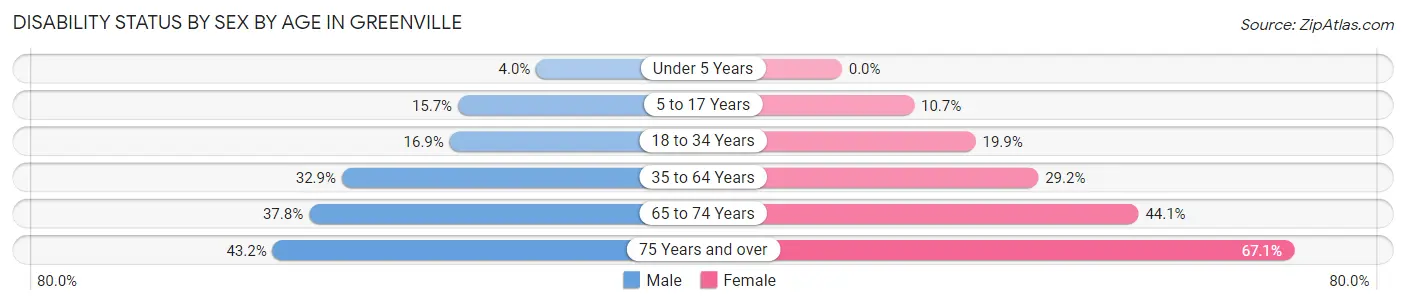
| Age Bracket | Male | Female |
| Under 5 Years | 39 (4.0%) | 0 (0.0%) |
| 5 to 17 Years | 422 (15.7%) | 301 (10.7%) |
| 18 to 34 Years | 473 (16.9%) | 617 (19.9%) |
| 35 to 64 Years | 1,514 (32.9%) | 1,792 (29.2%) |
| 65 to 74 Years | 536 (37.8%) | 773 (44.1%) |
| 75 Years and over | 257 (43.2%) | 741 (67.1%) |
Disability Class by Sex by Age in Greenville
Disability Class: Hearing Difficulty
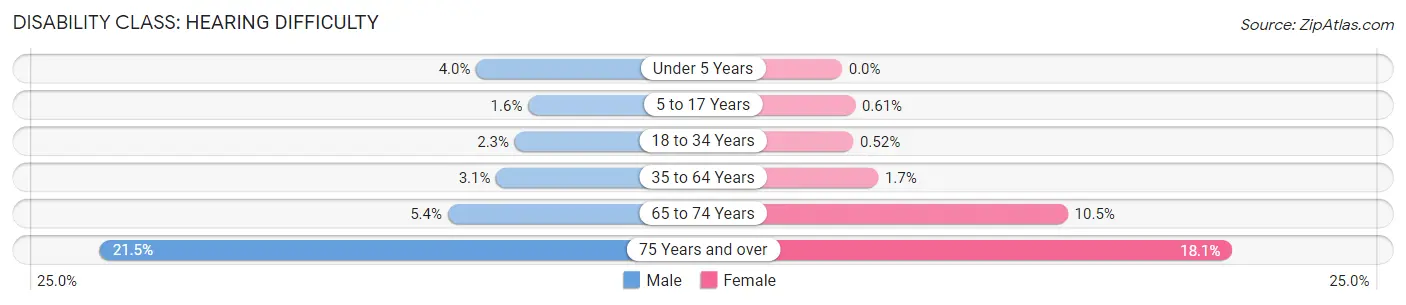
| Age Bracket | Male | Female |
| Under 5 Years | 39 (4.0%) | 0 (0.0%) |
| 5 to 17 Years | 44 (1.6%) | 17 (0.6%) |
| 18 to 34 Years | 63 (2.2%) | 16 (0.5%) |
| 35 to 64 Years | 143 (3.1%) | 103 (1.7%) |
| 65 to 74 Years | 76 (5.4%) | 184 (10.5%) |
| 75 Years and over | 128 (21.5%) | 200 (18.1%) |
Disability Class: Vision Difficulty
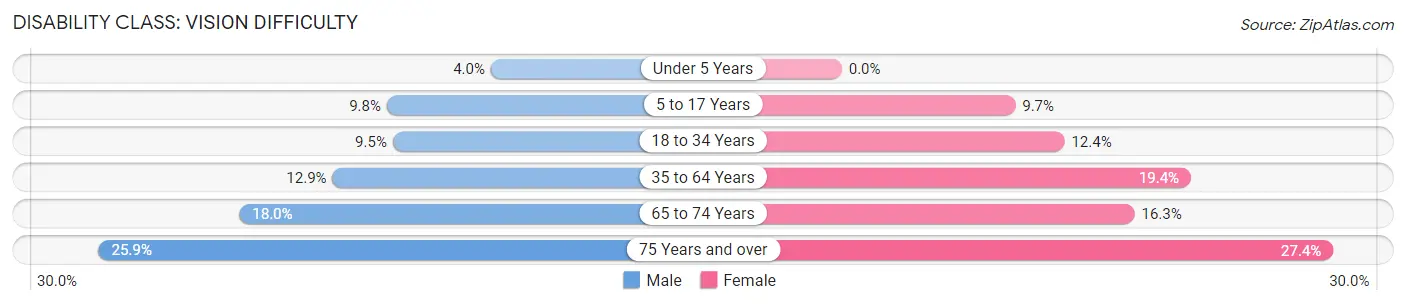
| Age Bracket | Male | Female |
| Under 5 Years | 39 (4.0%) | 0 (0.0%) |
| 5 to 17 Years | 265 (9.8%) | 271 (9.7%) |
| 18 to 34 Years | 266 (9.5%) | 385 (12.4%) |
| 35 to 64 Years | 592 (12.9%) | 1,194 (19.4%) |
| 65 to 74 Years | 256 (18.0%) | 286 (16.3%) |
| 75 Years and over | 154 (25.9%) | 302 (27.4%) |
Disability Class: Cognitive Difficulty
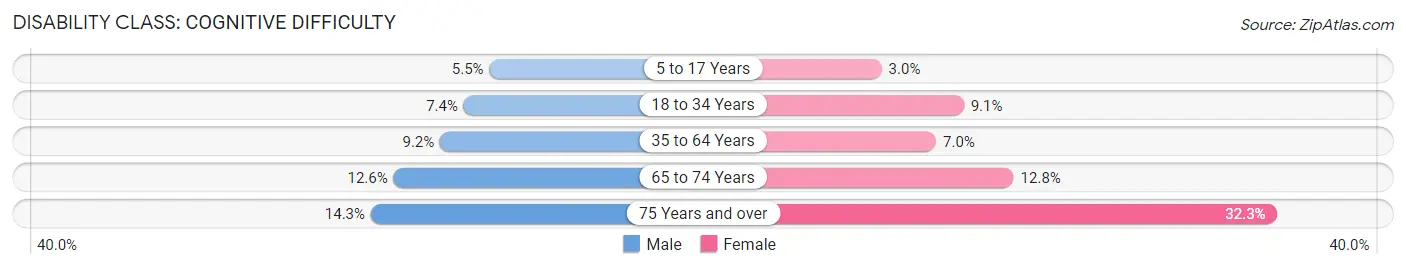
| Age Bracket | Male | Female |
| 5 to 17 Years | 148 (5.5%) | 83 (3.0%) |
| 18 to 34 Years | 207 (7.4%) | 281 (9.0%) |
| 35 to 64 Years | 421 (9.1%) | 430 (7.0%) |
| 65 to 74 Years | 179 (12.6%) | 224 (12.8%) |
| 75 Years and over | 85 (14.3%) | 357 (32.3%) |
Disability Class: Ambulatory Difficulty
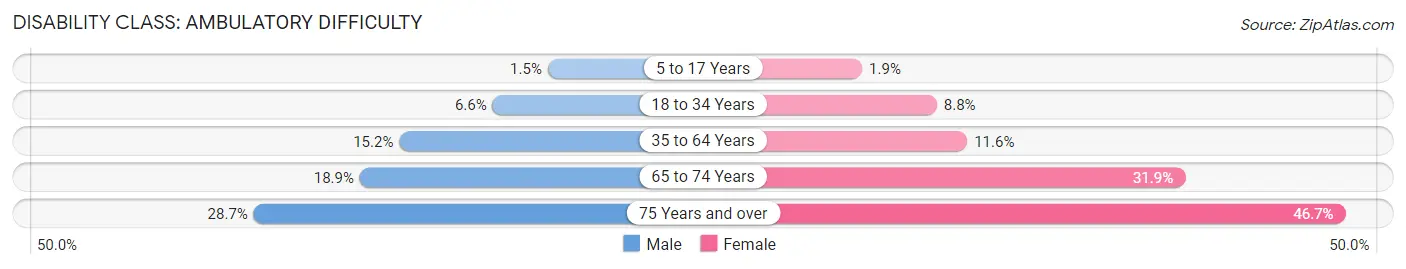
| Age Bracket | Male | Female |
| 5 to 17 Years | 39 (1.5%) | 53 (1.9%) |
| 18 to 34 Years | 184 (6.6%) | 274 (8.8%) |
| 35 to 64 Years | 701 (15.2%) | 715 (11.6%) |
| 65 to 74 Years | 268 (18.9%) | 559 (31.9%) |
| 75 Years and over | 171 (28.7%) | 516 (46.7%) |
Disability Class: Self-Care Difficulty
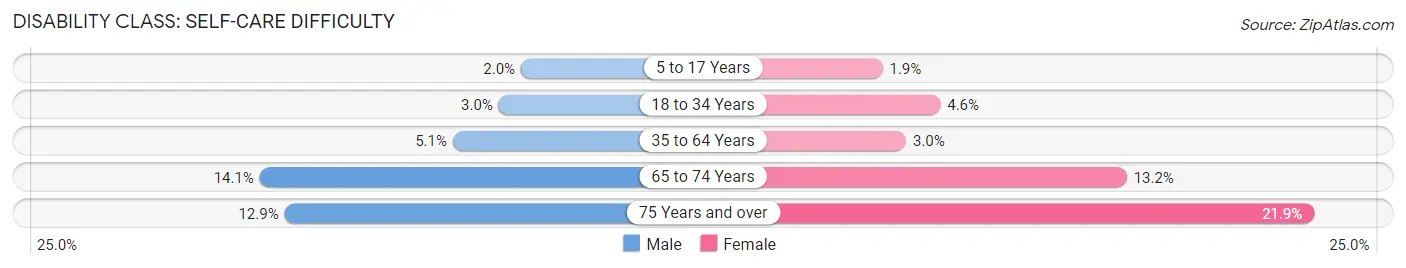
| Age Bracket | Male | Female |
| 5 to 17 Years | 53 (2.0%) | 53 (1.9%) |
| 18 to 34 Years | 84 (3.0%) | 142 (4.6%) |
| 35 to 64 Years | 236 (5.1%) | 183 (3.0%) |
| 65 to 74 Years | 200 (14.1%) | 232 (13.2%) |
| 75 Years and over | 77 (12.9%) | 242 (21.9%) |
Technology Access in Greenville
Computing Device Access in Greenville
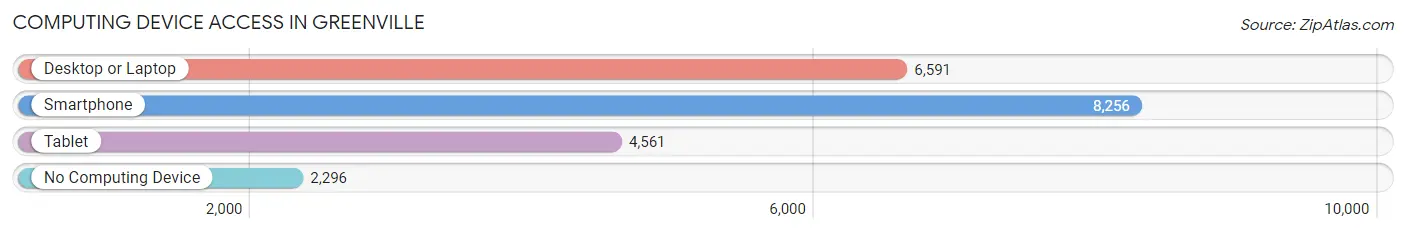
| Device Type | # Households | % Households |
| Desktop or Laptop | 6,591 | 57.4% |
| Smartphone | 8,256 | 71.9% |
| Tablet | 4,561 | 39.7% |
| No Computing Device | 2,296 | 20.0% |
| Total | 11,487 | 100.0% |
Internet Access in Greenville
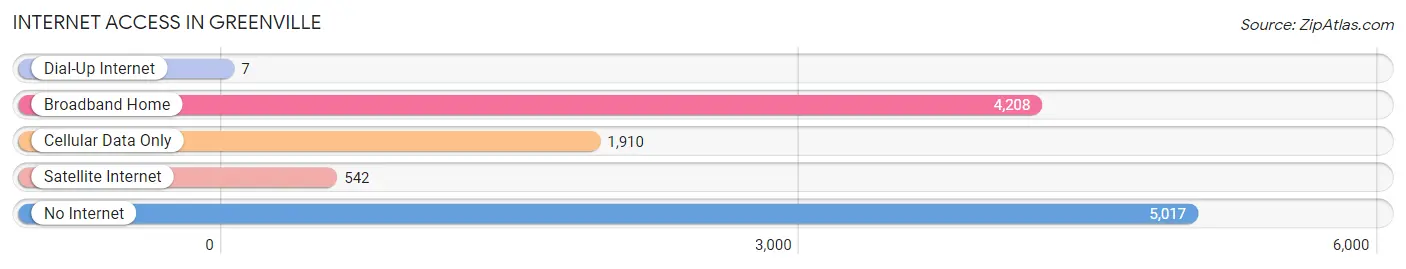
| Internet Type | # Households | % Households |
| Dial-Up Internet | 7 | 0.1% |
| Broadband Home | 4,208 | 36.6% |
| Cellular Data Only | 1,910 | 16.6% |
| Satellite Internet | 542 | 4.7% |
| No Internet | 5,017 | 43.7% |
| Total | 11,487 | 100.0% |
Greenville Summary
Greenville, Mississippi is a city located in Washington County, Mississippi, United States. It is the county seat of Washington County and the principal city of the Greenville, Mississippi Metropolitan Statistical Area. As of the 2010 census, the population of Greenville was 34,400.
History
Greenville was founded in 1824 by William W. Blanton, who named the city after General Nathanael Greene, a hero of the American Revolutionary War. The city was incorporated in 1844 and became the county seat of Washington County in 1846.
Greenville was a major cotton trading center in the 19th century and was home to several cotton plantations. The city was also a major port on the Mississippi River, with steamboats arriving and departing daily.
In the early 20th century, Greenville was a major center of the blues music scene, with many famous blues musicians performing in the city.
Geography
Greenville is located at 33°26′N 91°3′W (33.4333, -91.0500). It is situated on the east bank of the Mississippi River, approximately 80 miles (130 km) northwest of Jackson, Mississippi.
The city has a total area of 24.2 square miles (62.7 km2), of which 23.9 square miles (61.9 km2) is land and 0.3 square miles (0.8 km2) is water.
Economy
Greenville is the economic center of the Mississippi Delta region. The city is home to several major industries, including agriculture, manufacturing, and tourism.
Agriculture is a major part of the local economy, with cotton, soybeans, corn, and rice being the main crops. The city is also home to several large poultry processing plants.
Manufacturing is also an important part of the local economy, with several large factories located in the city. These factories produce a variety of products, including furniture, clothing, and automotive parts.
Tourism is also an important part of the local economy, with the city being home to several attractions, including the Greenville Zoo, the Delta Blues Museum, and the Greenville Country Club.
Demographics
As of the 2010 census, there were 34,400 people, 12,845 households, and 8,717 families residing in the city. The population density was 1,433.2 people per square mile (553.3/km2). There were 14,845 housing units at an average density of 621.3 per square mile (239.6/km2).
The racial makeup of the city was 57.2% African American, 40.2% White, 0.3% Native American, 0.7% Asian, 0.1% Pacific Islander, 0.7% from other races, and 0.9% from two or more races. Hispanic or Latino of any race were 1.7% of the population.
The median income for a household in the city was $25,945, and the median income for a family was $32,945. Males had a median income of $30,945 versus $21,945 for females. The per capita income for the city was $14,945. About 22.2% of families and 25.7% of the population were below the poverty line, including 36.2% of those under age 18 and 18.2% of those age 65 or over.
Common Questions
What is Per Capita Income in Greenville?
Per Capita income in Greenville is $22,111.
What is the Median Family Income in Greenville?
Median Family Income in Greenville is $46,043.
What is the Median Household income in Greenville?
Median Household Income in Greenville is $35,148.
What is Income or Wage Gap in Greenville?
Income or Wage Gap in Greenville is 20.4%.
Women in Greenville earn 79.6 cents for every dollar earned by a man.
What is Family Income Deficit in Greenville?
Family Income Deficit in Greenville is $13,082.
Families that are below poverty line in Greenville earn $13,082 less on average than the poverty threshold level.
What is Inequality or Gini Index in Greenville?
Inequality or Gini Index in Greenville is 0.50.
What is the Total Population of Greenville?
Total Population of Greenville is 29,495.
What is the Total Male Population of Greenville?
Total Male Population of Greenville is 13,344.
What is the Total Female Population of Greenville?
Total Female Population of Greenville is 16,151.
What is the Ratio of Males per 100 Females in Greenville?
There are 82.62 Males per 100 Females in Greenville.
What is the Ratio of Females per 100 Males in Greenville?
There are 121.04 Females per 100 Males in Greenville.
What is the Median Population Age in Greenville?
Median Population Age in Greenville is 38.7 Years.
What is the Average Family Size in Greenville
Average Family Size in Greenville is 3.4 People.
What is the Average Household Size in Greenville
Average Household Size in Greenville is 2.5 People.
How Large is the Labor Force in Greenville?
There are 11,659 People in the Labor Forcein in Greenville.
What is the Percentage of People in the Labor Force in Greenville?
50.6% of People are in the Labor Force in Greenville.
What is the Unemployment Rate in Greenville?
Unemployment Rate in Greenville is 11.5%.