Area Code 228 Map & Demographics
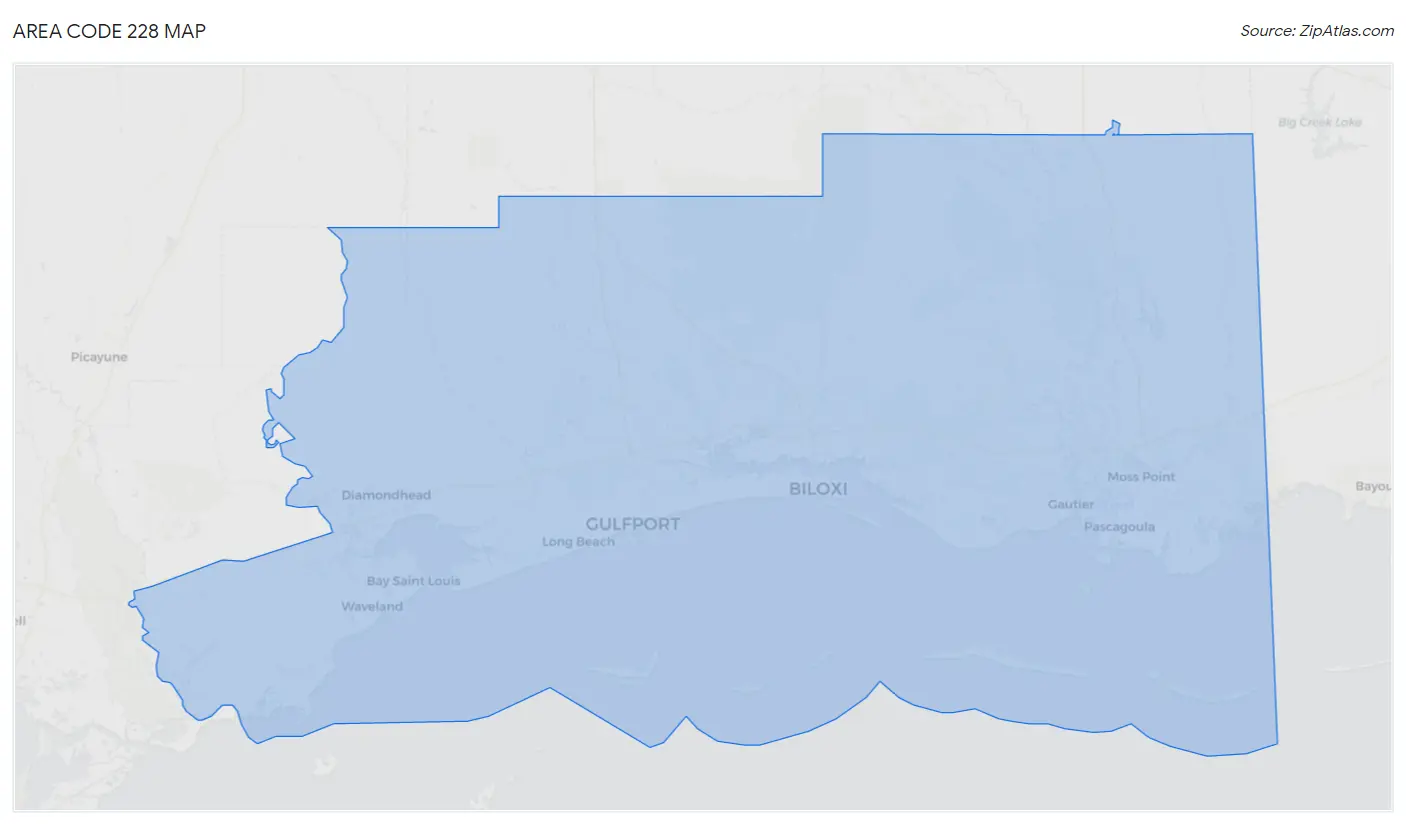
Area Code 228 Map
Area Code 228 Overview
$30,364
PER CAPITA INCOME
$70,518
AVG FAMILY INCOME
$56,911
AVG HOUSEHOLD INCOME
32.0%
WAGE / INCOME GAP [ % ]
68.0¢/ $1
WAGE / INCOME GAP [ $ ]
$10,902
FAMILY INCOME DEFICIT
10.53
INEQUALITY / GINI INDEX
418,601
TOTAL POPULATION
205,801
MALE POPULATION
212,800
FEMALE POPULATION
96.71
MALES / 100 FEMALES
103.40
FEMALES / 100 MALES
39.1
MEDIAN AGE
3.1
AVG FAMILY SIZE
2.5
AVG HOUSEHOLD SIZE
205,434
LABOR FORCE [ PEOPLE ]
61.7%
PERCENT IN LABOR FORCE
8.0%
UNEMPLOYMENT RATE
Income in Area Code 228
Income Overview in Area Code 228
Per Capita Income in Area Code 228 is $30,364, while median incomes of families and households are $70,518 and $56,911 respectively.
| Characteristic | Number | Measure |
| Per Capita Income | 418,601 | $30,364 |
| Median Family Income | 108,364 | $70,518 |
| Mean Family Income | 108,364 | $2,052,013 |
| Median Household Income | 162,106 | $56,911 |
| Mean Household Income | 162,106 | $1,749,114 |
| Income Deficit | 108,364 | $10,902 |
| Wage / Income Gap (%) | 418,601 | 31.97% |
| Wage / Income Gap ($) | 418,601 | 68.03¢ per $1 |
| Gini / Inequality Index | 418,601 | 10.53 |
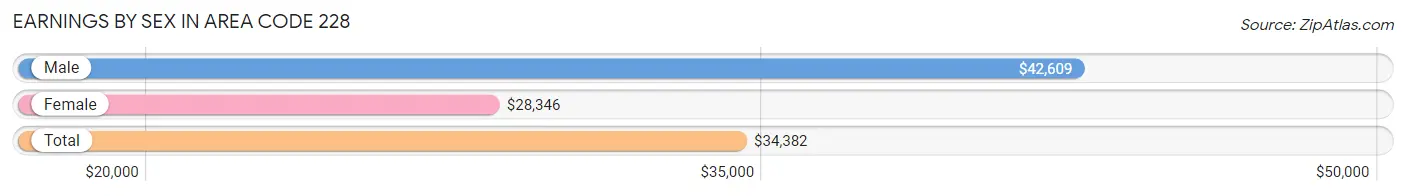
Earnings by Sex in Area Code 228
Average Earnings in Area Code 228 are $34,382, $42,609 for men and $28,346 for women, a difference of 33.5%.
| Sex | Number | Average Earnings |
| Male | 105,589 (52.0%) | $42,609 |
| Female | 97,348 (48.0%) | $28,346 |
| Total | 202,937 (100.0%) | $34,382 |
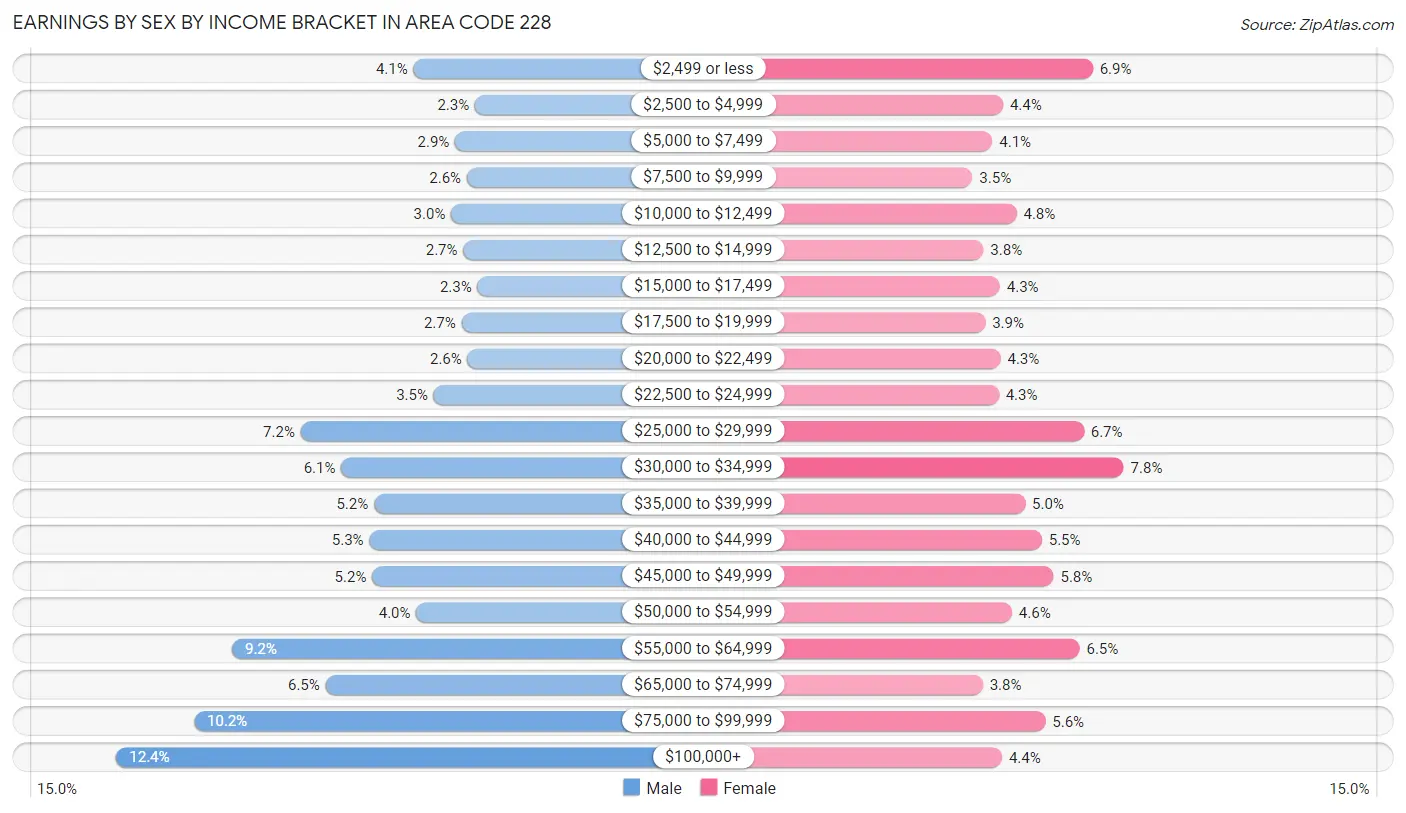
Earnings by Sex by Income Bracket in Area Code 228
The most common earnings brackets in Area Code 228 are $100,000+ for men (13,117 | 12.4%) and $30,000 to $34,999 for women (7,575 | 7.8%).
| Income | Male | Female |
| $2,499 or less | 4,295 (4.1%) | 6,728 (6.9%) |
| $2,500 to $4,999 | 2,472 (2.3%) | 4,274 (4.4%) |
| $5,000 to $7,499 | 3,057 (2.9%) | 3,979 (4.1%) |
| $7,500 to $9,999 | 2,718 (2.6%) | 3,435 (3.5%) |
| $10,000 to $12,499 | 3,181 (3.0%) | 4,647 (4.8%) |
| $12,500 to $14,999 | 2,814 (2.7%) | 3,741 (3.8%) |
| $15,000 to $17,499 | 2,394 (2.3%) | 4,189 (4.3%) |
| $17,500 to $19,999 | 2,877 (2.7%) | 3,784 (3.9%) |
| $20,000 to $22,499 | 2,688 (2.5%) | 4,201 (4.3%) |
| $22,500 to $24,999 | 3,693 (3.5%) | 4,156 (4.3%) |
| $25,000 to $29,999 | 7,640 (7.2%) | 6,483 (6.7%) |
| $30,000 to $34,999 | 6,445 (6.1%) | 7,575 (7.8%) |
| $35,000 to $39,999 | 5,469 (5.2%) | 4,878 (5.0%) |
| $40,000 to $44,999 | 5,607 (5.3%) | 5,339 (5.5%) |
| $45,000 to $49,999 | 5,519 (5.2%) | 5,659 (5.8%) |
| $50,000 to $54,999 | 4,208 (4.0%) | 4,519 (4.6%) |
| $55,000 to $64,999 | 9,682 (9.2%) | 6,369 (6.5%) |
| $65,000 to $74,999 | 6,904 (6.5%) | 3,719 (3.8%) |
| $75,000 to $99,999 | 10,809 (10.2%) | 5,431 (5.6%) |
| $100,000+ | 13,117 (12.4%) | 4,242 (4.4%) |
| Total | 105,589 (100.0%) | 97,348 (100.0%) |
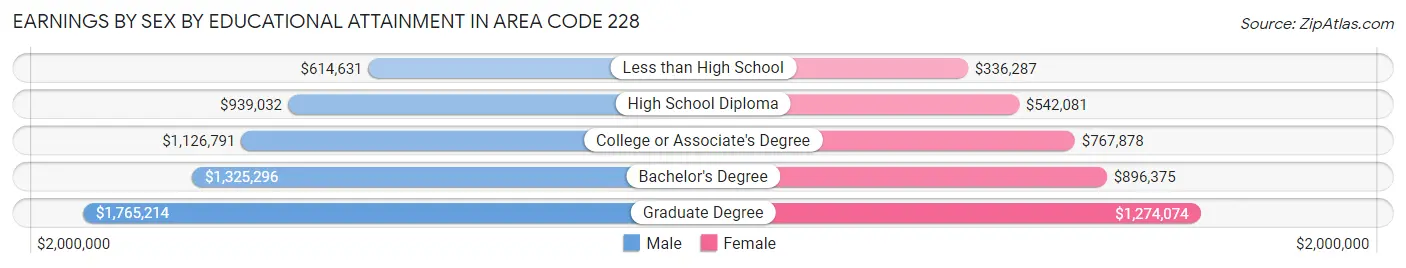
Earnings by Sex by Educational Attainment in Area Code 228
Average earnings in Area Code 228 are $1,145,320 for men and $783,492 for women, a difference of 31.6%. Men with an educational attainment of graduate degree enjoy the highest average annual earnings of $1,765,214, while those with less than high school education earn the least with $614,631. Women with an educational attainment of graduate degree earn the most with the average annual earnings of $1,274,074, while those with less than high school education have the smallest earnings of $336,287.
| Educational Attainment | Male Income | Female Income |
| Less than High School | $614,631 | $336,287 |
| High School Diploma | $939,032 | $542,081 |
| College or Associate's Degree | $1,126,791 | $767,878 |
| Bachelor's Degree | $1,325,296 | $896,375 |
| Graduate Degree | $1,765,214 | $1,274,074 |
| Total | $1,145,320 | $783,492 |
Family Income in Area Code 228
Family Income Brackets in Area Code 228
According to the Area Code 228 family income data, there are 452,962 families falling into the $100,000 to $149,999 income range, which is the most common income bracket and makes up 418.0% of all families. Conversely, the $10,000 to $14,999 income bracket is the least frequent group with only 81,598 families (75.3%) belonging to this category.
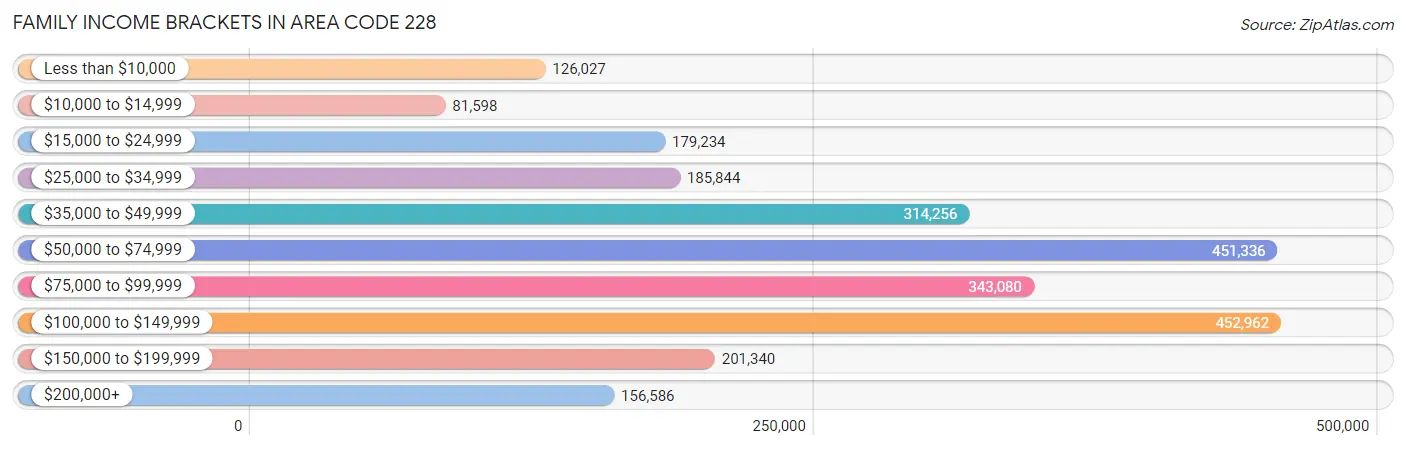
| Income Bracket | # Families | % Families |
| Less than $10,000 | 126,027 | 116.3% |
| $10,000 to $14,999 | 81,598 | 75.3% |
| $15,000 to $24,999 | 179,234 | 165.4% |
| $25,000 to $34,999 | 185,844 | 171.5% |
| $35,000 to $49,999 | 314,256 | 290.0% |
| $50,000 to $74,999 | 451,336 | 416.5% |
| $75,000 to $99,999 | 343,080 | 316.6% |
| $100,000 to $149,999 | 452,962 | 418.0% |
| $150,000 to $199,999 | 201,340 | 185.8% |
| $200,000+ | 156,586 | 144.5% |
Family Income by Famaliy Size in Area Code 228
6-person families (2,666 | 2.5%) account for the highest median family income in Area Code 228 with $101,280 per family, while 2-person families (51,616 | 47.6%) have the highest median income of $33,347 per family member.
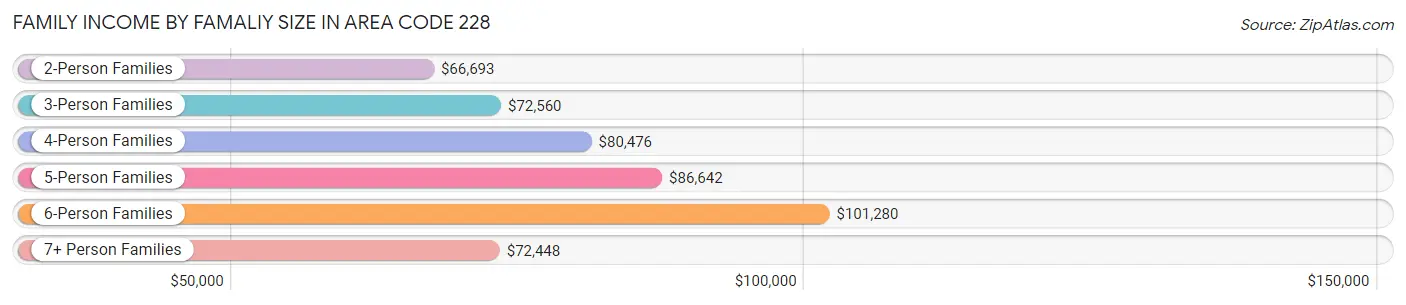
| Income Bracket | # Families | Median Income |
| 2-Person Families | 51,616 (47.6%) | $66,693 |
| 3-Person Families | 25,296 (23.3%) | $72,560 |
| 4-Person Families | 18,757 (17.3%) | $80,476 |
| 5-Person Families | 7,948 (7.3%) | $86,642 |
| 6-Person Families | 2,666 (2.5%) | $101,280 |
| 7+ Person Families | 2,081 (1.9%) | $72,448 |
| Total | 108,364 (100.0%) | $70,518 |
Family Income by Number of Earners in Area Code 228
The median family income in Area Code 228 is $70,518, with families comprising 3+ earners (9,724) having the highest median family income of $130,240, while families with no earners (19,444) have the lowest median family income of $43,841, accounting for 9.0% and 17.9% of families, respectively.
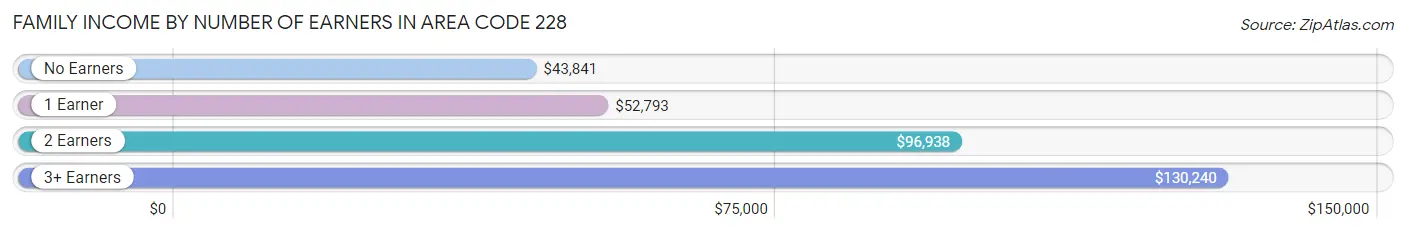
| Number of Earners | # Families | Median Income |
| No Earners | 19,444 (17.9%) | $43,841 |
| 1 Earner | 39,201 (36.2%) | $52,793 |
| 2 Earners | 39,995 (36.9%) | $96,938 |
| 3+ Earners | 9,724 (9.0%) | $130,240 |
| Total | 108,364 (100.0%) | $70,518 |
Household Income in Area Code 228
Household Income Brackets in Area Code 228
With 645,668 households falling in the category, the $50,000 to $74,999 income range is the most frequent in Area Code 228, accounting for 398.3% of all households. In contrast, only 175,237 households (108.1%) fall into the $200,000+ income bracket, making it the least populous group.
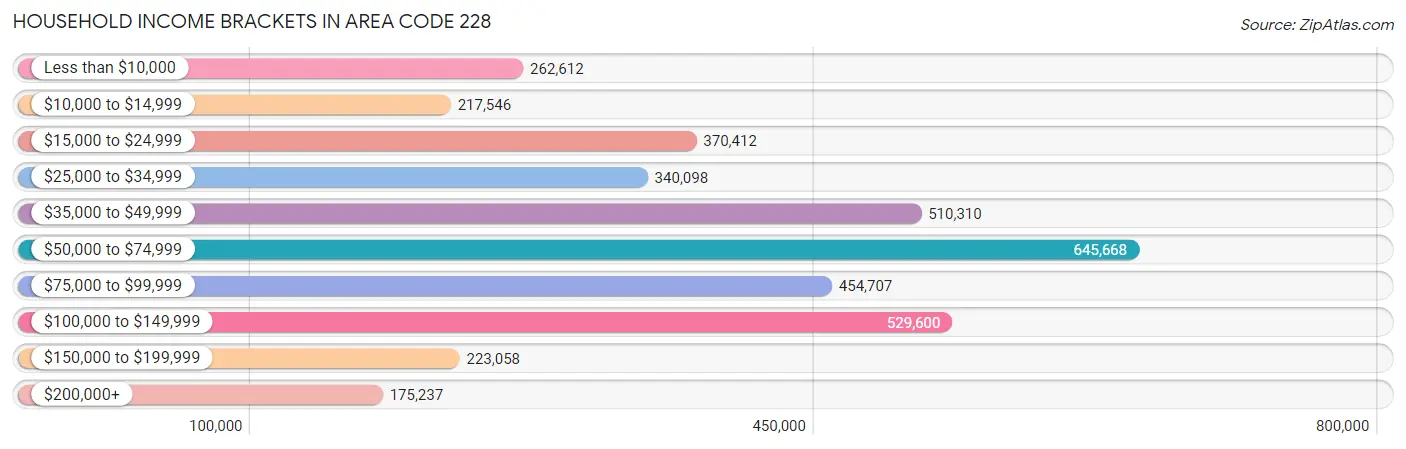
| Income Bracket | # Households | % Households |
| Less than $10,000 | 262,612 | 162.0% |
| $10,000 to $14,999 | 217,546 | 134.2% |
| $15,000 to $24,999 | 370,412 | 228.5% |
| $25,000 to $34,999 | 340,098 | 209.8% |
| $35,000 to $49,999 | 510,310 | 314.8% |
| $50,000 to $74,999 | 645,668 | 398.3% |
| $75,000 to $99,999 | 454,707 | 280.5% |
| $100,000 to $149,999 | 529,600 | 326.7% |
| $150,000 to $199,999 | 223,058 | 137.6% |
| $200,000+ | 175,237 | 108.1% |
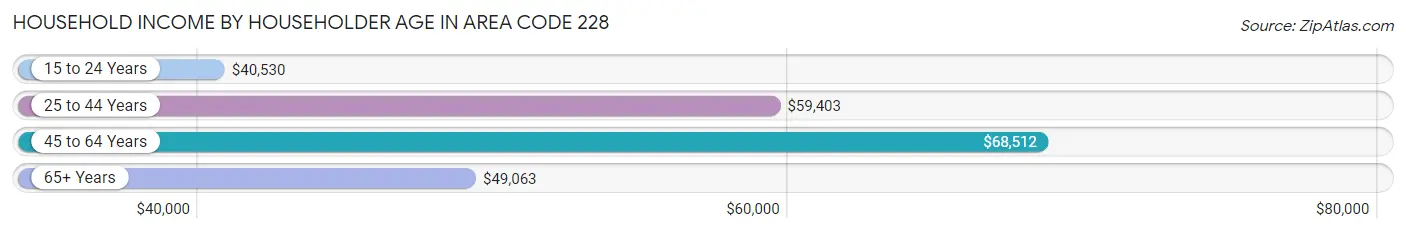
Household Income by Householder Age in Area Code 228
The median household income in Area Code 228 is $56,911, with the highest median household income of $68,512 found in the 45 to 64 years age bracket for the primary householder. A total of 61,384 households (37.9%) fall into this category. Meanwhile, the 15 to 24 years age bracket for the primary householder has the lowest median household income of $40,530, with 5,214 households (3.2%) in this group.
| Income Bracket | # Households | Median Income |
| 15 to 24 Years | 5,214 (3.2%) | $40,530 |
| 25 to 44 Years | 50,702 (31.3%) | $59,403 |
| 45 to 64 Years | 61,384 (37.9%) | $68,512 |
| 65+ Years | 44,806 (27.6%) | $49,063 |
| Total | 162,106 (100.0%) | $56,911 |
Poverty in Area Code 228
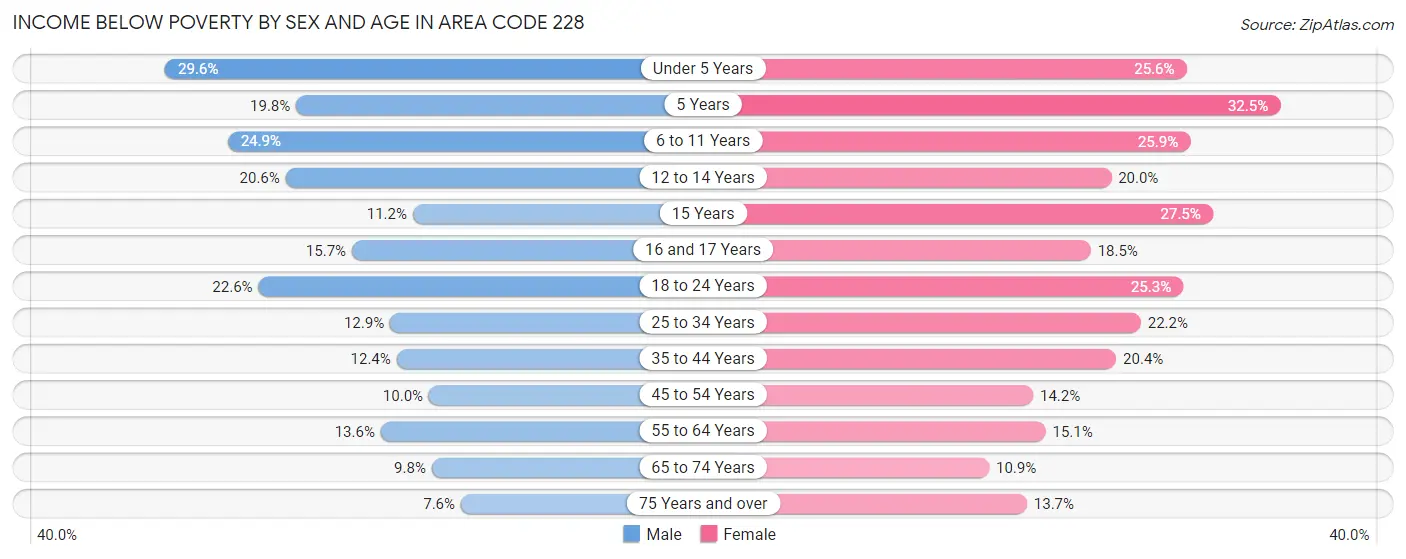
Income Below Poverty by Sex and Age in Area Code 228
With 15.3% poverty level for males and 18.9% for females among the residents of Area Code 228, under 5 year old males and 5 year old females are the most vulnerable to poverty, with 3,799 males (29.6%) and 964 females (32.5%) in their respective age groups living below the poverty level.
| Age Bracket | Male | Female |
| Under 5 Years | 3,799 (29.6%) | 2,992 (25.6%) |
| 5 Years | 463 (19.8%) | 964 (32.5%) |
| 6 to 11 Years | 4,046 (24.9%) | 3,940 (25.9%) |
| 12 to 14 Years | 1,816 (20.6%) | 1,641 (20.0%) |
| 15 Years | 307 (11.2%) | 728 (27.5%) |
| 16 and 17 Years | 946 (15.7%) | 1,026 (18.5%) |
| 18 to 24 Years | 3,895 (22.6%) | 4,206 (25.3%) |
| 25 to 34 Years | 3,345 (12.9%) | 6,116 (22.2%) |
| 35 to 44 Years | 3,060 (12.4%) | 5,568 (20.4%) |
| 45 to 54 Years | 2,532 (10.0%) | 3,760 (14.2%) |
| 55 to 64 Years | 3,689 (13.6%) | 4,345 (15.1%) |
| 65 to 74 Years | 1,916 (9.8%) | 2,441 (10.9%) |
| 75 Years and over | 882 (7.6%) | 2,030 (13.7%) |
| Total | 30,696 (15.3%) | 39,757 (18.9%) |
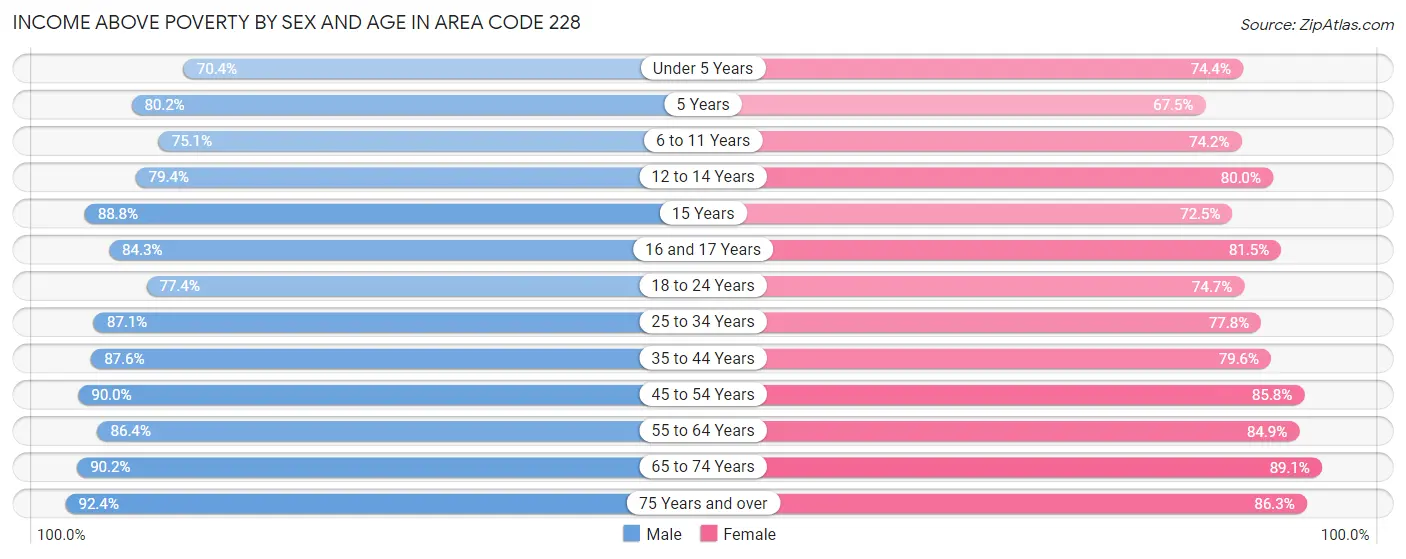
Income Above Poverty by Sex and Age in Area Code 228
According to the poverty statistics in Area Code 228, males aged 75 years and over and females aged 65 to 74 years are the age groups that are most secure financially, with 92.4% of males and 89.1% of females in these age groups living above the poverty line.
| Age Bracket | Male | Female |
| Under 5 Years | 9,048 (70.4%) | 8,705 (74.4%) |
| 5 Years | 1,871 (80.2%) | 1,999 (67.5%) |
| 6 to 11 Years | 12,192 (75.1%) | 11,299 (74.2%) |
| 12 to 14 Years | 6,992 (79.4%) | 6,562 (80.0%) |
| 15 Years | 2,440 (88.8%) | 1,916 (72.5%) |
| 16 and 17 Years | 5,078 (84.3%) | 4,527 (81.5%) |
| 18 to 24 Years | 13,309 (77.4%) | 12,397 (74.7%) |
| 25 to 34 Years | 22,646 (87.1%) | 21,432 (77.8%) |
| 35 to 44 Years | 21,658 (87.6%) | 21,768 (79.6%) |
| 45 to 54 Years | 22,827 (90.0%) | 22,724 (85.8%) |
| 55 to 64 Years | 23,520 (86.4%) | 24,382 (84.9%) |
| 65 to 74 Years | 17,691 (90.2%) | 19,901 (89.1%) |
| 75 Years and over | 10,709 (92.4%) | 12,744 (86.3%) |
| Total | 169,981 (84.7%) | 170,356 (81.1%) |
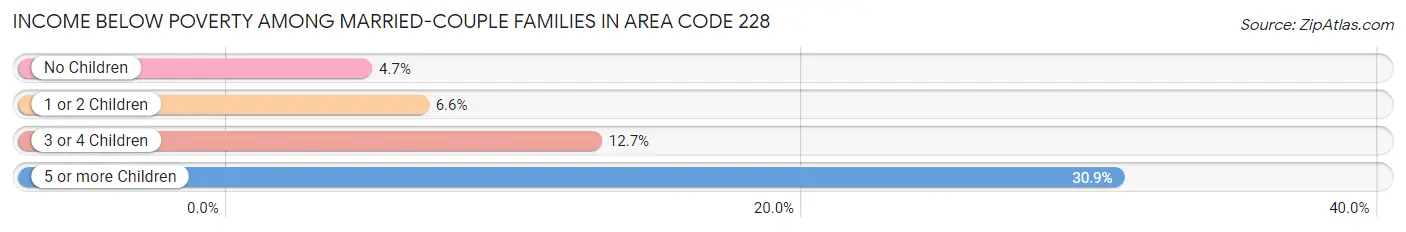
Income Below Poverty Among Married-Couple Families in Area Code 228
The poverty statistics for married-couple families in Area Code 228 show that 6.1% or 4,544 of the total 74,264 families live below the poverty line. Families with 5 or more children have the highest poverty rate of 30.9%, comprising of 166 families. On the other hand, families with no children have the lowest poverty rate of 4.7%, which includes 2,047 families.
| Children | Above Poverty | Below Poverty |
| No Children | 41,777 (95.3%) | 2,047 (4.7%) |
| 1 or 2 Children | 22,552 (93.4%) | 1,603 (6.6%) |
| 3 or 4 Children | 5,019 (87.3%) | 728 (12.7%) |
| 5 or more Children | 372 (69.1%) | 166 (30.9%) |
| Total | 69,720 (93.9%) | 4,544 (6.1%) |
Income Below Poverty Among Single-Parent Households in Area Code 228
According to the poverty data in Area Code 228, 17.9% or 1,406 single-father households and 33.1% or 8,688 single-mother households are living below the poverty line. Among single-father households, those with 5 or more children have the highest poverty rate, with 71 households (100.0%) experiencing poverty. Likewise, among single-mother households, those with 5 or more children have the highest poverty rate, with 317 households (100.0%) falling below the poverty line.
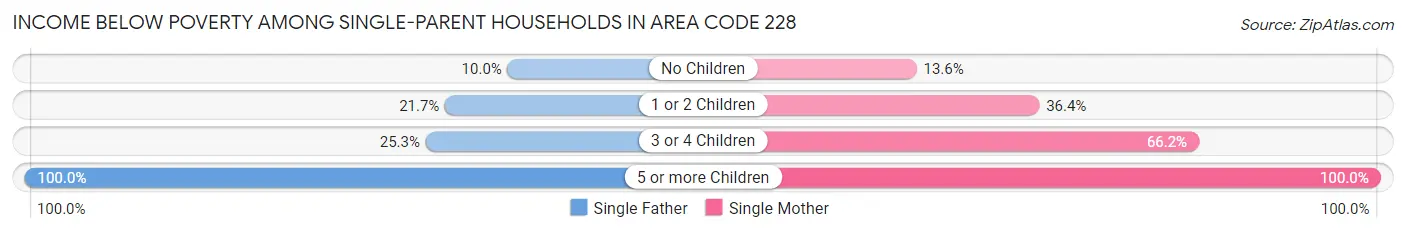
| Children | Single Father | Single Mother |
| No Children | 316 (10.0%) | 1,187 (13.6%) |
| 1 or 2 Children | 907 (21.7%) | 5,126 (36.4%) |
| 3 or 4 Children | 112 (25.3%) | 2,058 (66.2%) |
| 5 or more Children | 71 (100.0%) | 317 (100.0%) |
| Total | 1,406 (17.9%) | 8,688 (33.1%) |
Income Below Poverty Among Married-Couple vs Single-Parent Households in Area Code 228
The poverty data for Area Code 228 shows that 4,544 of the married-couple family households (6.1%) and 10,094 of the single-parent households (29.6%) are living below the poverty level. Within the married-couple family households, those with 5 or more children have the highest poverty rate, with 166 households (30.9%) falling below the poverty line. Among the single-parent households, those with 5 or more children have the highest poverty rate, with 388 household (100.0%) living below poverty.
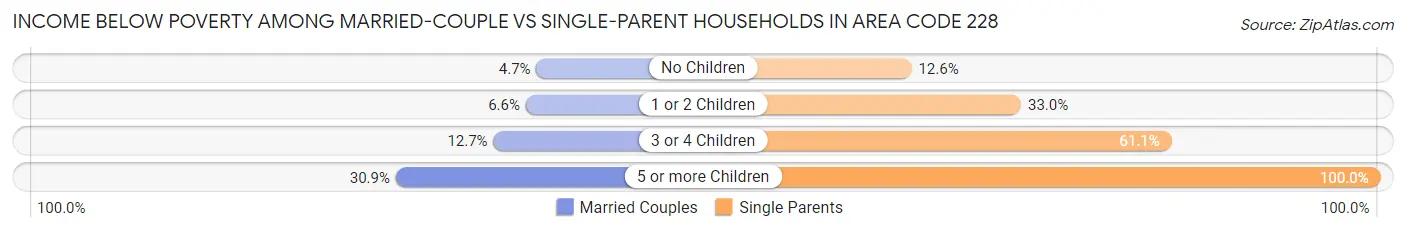
| Children | Married-Couple Families | Single-Parent Households |
| No Children | 2,047 (4.7%) | 1,503 (12.6%) |
| 1 or 2 Children | 1,603 (6.6%) | 6,033 (33.0%) |
| 3 or 4 Children | 728 (12.7%) | 2,170 (61.1%) |
| 5 or more Children | 166 (30.9%) | 388 (100.0%) |
| Total | 4,544 (6.1%) | 10,094 (29.6%) |
Race in Area Code 228
The most populous races in Area Code 228 are White / Caucasian (291,398 | 69.6%), Black / African American (86,197 | 20.6%), and Hispanic or Latino (24,321 | 5.8%).
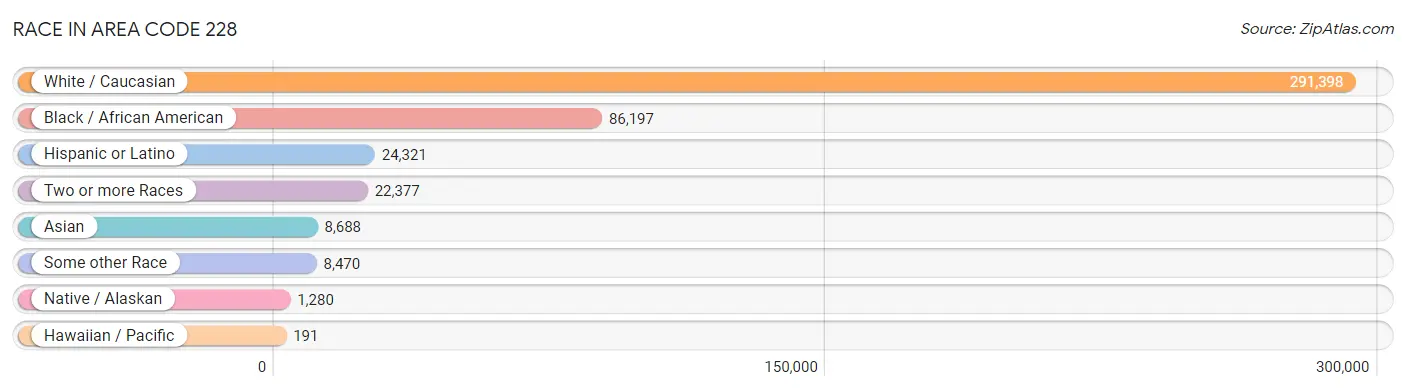
| Race | # Population | % Population |
| Asian | 8,688 | 2.1% |
| Black / African American | 86,197 | 20.6% |
| Hawaiian / Pacific | 191 | 0.1% |
| Hispanic or Latino | 24,321 | 5.8% |
| Native / Alaskan | 1,280 | 0.3% |
| White / Caucasian | 291,398 | 69.6% |
| Two or more Races | 22,377 | 5.3% |
| Some other Race | 8,470 | 2.0% |
| Total | 418,601 | 100.0% |
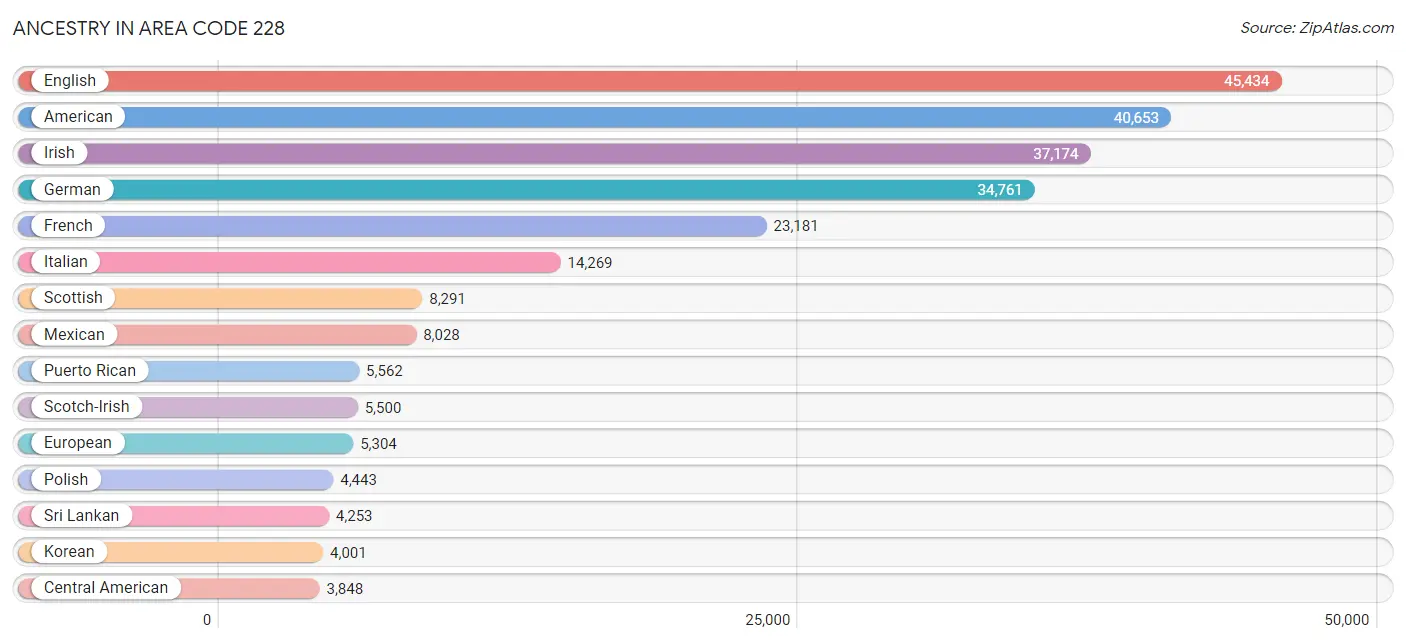
Ancestry in Area Code 228
The most populous ancestries reported in Area Code 228 are English (45,434 | 10.8%), American (40,653 | 9.7%), Irish (37,174 | 8.9%), German (34,761 | 8.3%), and French (23,181 | 5.5%), together accounting for 43.3% of all Area Code 228 residents.
| Ancestry | # Population | % Population |
| African | 1,801 | 0.4% |
| Albanian | 32 | 0.0% |
| American | 40,653 | 9.7% |
| Apache | 60 | 0.0% |
| Arab | 829 | 0.2% |
| Argentinean | 31 | 0.0% |
| Armenian | 92 | 0.0% |
| Australian | 145 | 0.0% |
| Austrian | 320 | 0.1% |
| Bangladeshi | 19 | 0.0% |
| Barbadian | 61 | 0.0% |
| Basque | 92 | 0.0% |
| Belgian | 62 | 0.0% |
| Belizean | 7 | 0.0% |
| Bhutanese | 686 | 0.2% |
| Blackfeet | 136 | 0.0% |
| Bolivian | 67 | 0.0% |
| Brazilian | 81 | 0.0% |
| British | 2,534 | 0.6% |
| British West Indian | 2 | 0.0% |
| Bulgarian | 14 | 0.0% |
| Burmese | 1,297 | 0.3% |
| Cajun | 414 | 0.1% |
| Canadian | 498 | 0.1% |
| Cape Verdean | 39 | 0.0% |
| Celtic | 42 | 0.0% |
| Central American | 3,848 | 0.9% |
| Central American Indian | 109 | 0.0% |
| Cherokee | 1,335 | 0.3% |
| Chickasaw | 20 | 0.0% |
| Chilean | 9 | 0.0% |
| Chinese | 300 | 0.1% |
| Chippewa | 134 | 0.0% |
| Choctaw | 1,152 | 0.3% |
| Colombian | 460 | 0.1% |
| Comanche | 20 | 0.0% |
| Costa Rican | 168 | 0.0% |
| Cree | 5 | 0.0% |
| Creek | 207 | 0.1% |
| Croatian | 854 | 0.2% |
| Cuban | 684 | 0.2% |
| Czech | 527 | 0.1% |
| Czechoslovakian | 100 | 0.0% |
| Danish | 368 | 0.1% |
| Dominican | 1,429 | 0.3% |
| Dutch | 2,465 | 0.6% |
| Dutch West Indian | 20 | 0.0% |
| Eastern European | 326 | 0.1% |
| English | 45,434 | 10.8% |
| Ethiopian | 38 | 0.0% |
| European | 5,304 | 1.3% |
| Filipino | 28 | 0.0% |
| Finnish | 228 | 0.1% |
| French | 23,181 | 5.5% |
| French American Indian | 35 | 0.0% |
| French Canadian | 3,077 | 0.7% |
| German | 34,761 | 8.3% |
| Greek | 1,116 | 0.3% |
| Guamanian / Chamorro | 209 | 0.1% |
| Guatemalan | 939 | 0.2% |
| Guyanese | 43 | 0.0% |
| Haitian | 175 | 0.0% |
| Honduran | 1,983 | 0.5% |
| Houma | 59 | 0.0% |
| Hungarian | 289 | 0.1% |
| Indian (Asian) | 1,196 | 0.3% |
| Inupiat | 3 | 0.0% |
| Iranian | 319 | 0.1% |
| Irish | 37,174 | 8.9% |
| Iroquois | 73 | 0.0% |
| Israeli | 40 | 0.0% |
| Italian | 14,269 | 3.4% |
| Jamaican | 744 | 0.2% |
| Japanese | 71 | 0.0% |
| Jordanian | 70 | 0.0% |
| Korean | 4,001 | 1.0% |
| Lebanese | 363 | 0.1% |
| Lithuanian | 256 | 0.1% |
| Lumbee | 25 | 0.0% |
| Malaysian | 115 | 0.0% |
| Maltese | 26 | 0.0% |
| Mexican | 8,028 | 1.9% |
| Mexican American Indian | 189 | 0.1% |
| Mongolian | 8 | 0.0% |
| Native Hawaiian | 210 | 0.1% |
| Navajo | 34 | 0.0% |
| New Zealander | 22 | 0.0% |
| Nicaraguan | 57 | 0.0% |
| Nigerian | 461 | 0.1% |
| Northern European | 322 | 0.1% |
| Norwegian | 2,170 | 0.5% |
| Pakistani | 232 | 0.1% |
| Palestinian | 14 | 0.0% |
| Panamanian | 447 | 0.1% |
| Pennsylvania German | 162 | 0.0% |
| Peruvian | 310 | 0.1% |
| Polish | 4,443 | 1.1% |
| Portuguese | 431 | 0.1% |
| Puerto Rican | 5,562 | 1.3% |
| Romanian | 46 | 0.0% |
| Russian | 1,021 | 0.2% |
| Salvadoran | 254 | 0.1% |
| Samoan | 144 | 0.0% |
| Scandinavian | 760 | 0.2% |
| Scotch-Irish | 5,500 | 1.3% |
| Scottish | 8,291 | 2.0% |
| Serbian | 6 | 0.0% |
| Sioux | 105 | 0.0% |
| Slavic | 290 | 0.1% |
| Slovak | 402 | 0.1% |
| Slovene | 19 | 0.0% |
| South African | 96 | 0.0% |
| South American | 1,183 | 0.3% |
| Spaniard | 853 | 0.2% |
| Spanish | 1,789 | 0.4% |
| Spanish American | 16 | 0.0% |
| Sri Lankan | 4,253 | 1.0% |
| Subsaharan African | 2,504 | 0.6% |
| Swedish | 1,834 | 0.4% |
| Swiss | 269 | 0.1% |
| Syrian | 39 | 0.0% |
| Thai | 1,177 | 0.3% |
| Tongan | 59 | 0.0% |
| Trinidadian and Tobagonian | 27 | 0.0% |
| Turkish | 94 | 0.0% |
| Ukrainian | 438 | 0.1% |
| Venezuelan | 306 | 0.1% |
| Welsh | 1,767 | 0.4% |
| West Indian | 139 | 0.0% |
| Yaqui | 34 | 0.0% |
| Yugoslavian | 229 | 0.1% |
| Zimbabwean | 5 | 0.0% | View All 132 Rows |
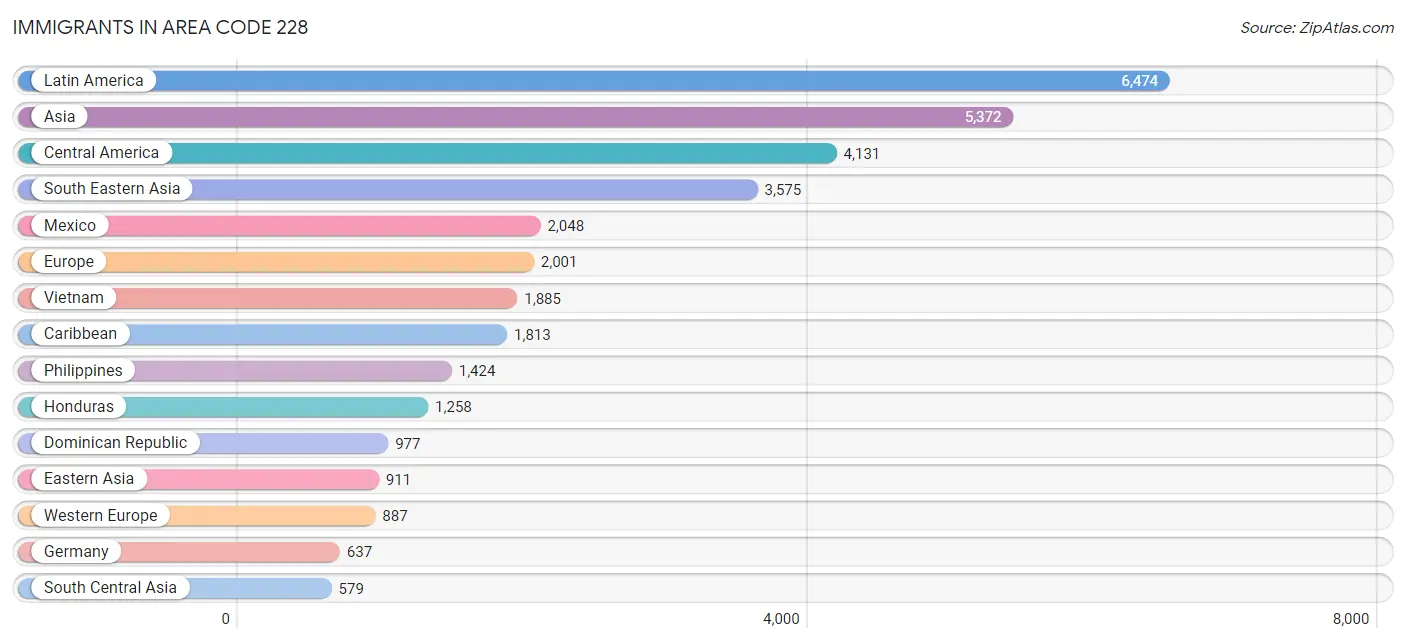
Immigrants in Area Code 228
The most numerous immigrant groups reported in Area Code 228 came from Latin America (6,474 | 1.5%), Asia (5,372 | 1.3%), Central America (4,131 | 1.0%), South Eastern Asia (3,575 | 0.9%), and Mexico (2,048 | 0.5%), together accounting for 5.2% of all Area Code 228 residents.
| Immigration Origin | # Population | % Population |
| Africa | 462 | 0.1% |
| Argentina | 24 | 0.0% |
| Armenia | 54 | 0.0% |
| Asia | 5,372 | 1.3% |
| Australia | 67 | 0.0% |
| Austria | 21 | 0.0% |
| Azores | 5 | 0.0% |
| Belgium | 5 | 0.0% |
| Belize | 52 | 0.0% |
| Bolivia | 70 | 0.0% |
| Brazil | 117 | 0.0% |
| Bulgaria | 24 | 0.0% |
| Cambodia | 13 | 0.0% |
| Cameroon | 74 | 0.0% |
| Canada | 350 | 0.1% |
| Caribbean | 1,813 | 0.4% |
| Central America | 4,131 | 1.0% |
| Chile | 12 | 0.0% |
| China | 341 | 0.1% |
| Colombia | 132 | 0.0% |
| Costa Rica | 88 | 0.0% |
| Cuba | 72 | 0.0% |
| Czechoslovakia | 13 | 0.0% |
| Dominica | 2 | 0.0% |
| Dominican Republic | 977 | 0.2% |
| Eastern Africa | 155 | 0.0% |
| Eastern Asia | 911 | 0.2% |
| Eastern Europe | 418 | 0.1% |
| Egypt | 8 | 0.0% |
| El Salvador | 153 | 0.0% |
| England | 289 | 0.1% |
| Ethiopia | 108 | 0.0% |
| Europe | 2,001 | 0.5% |
| France | 153 | 0.0% |
| Germany | 637 | 0.2% |
| Ghana | 4 | 0.0% |
| Greece | 102 | 0.0% |
| Grenada | 21 | 0.0% |
| Guatemala | 384 | 0.1% |
| Guyana | 7 | 0.0% |
| Haiti | 124 | 0.0% |
| Honduras | 1,258 | 0.3% |
| Hong Kong | 16 | 0.0% |
| India | 410 | 0.1% |
| Iran | 20 | 0.0% |
| Ireland | 24 | 0.0% |
| Italy | 43 | 0.0% |
| Jamaica | 528 | 0.1% |
| Japan | 111 | 0.0% |
| Jordan | 42 | 0.0% |
| Korea | 459 | 0.1% |
| Latin America | 6,474 | 1.5% |
| Liberia | 14 | 0.0% |
| Lithuania | 24 | 0.0% |
| Malaysia | 54 | 0.0% |
| Mexico | 2,048 | 0.5% |
| Middle Africa | 74 | 0.0% |
| Morocco | 6 | 0.0% |
| Nepal | 87 | 0.0% |
| Netherlands | 71 | 0.0% |
| Nicaragua | 27 | 0.0% |
| Nigeria | 15 | 0.0% |
| Northern Africa | 14 | 0.0% |
| Northern Europe | 486 | 0.1% |
| Norway | 28 | 0.0% |
| Oceania | 89 | 0.0% |
| Pakistan | 62 | 0.0% |
| Panama | 121 | 0.0% |
| Peru | 156 | 0.0% |
| Philippines | 1,424 | 0.3% |
| Poland | 5 | 0.0% |
| Portugal | 13 | 0.0% |
| Romania | 18 | 0.0% |
| Russia | 59 | 0.0% |
| Saudi Arabia | 143 | 0.0% |
| Scotland | 71 | 0.0% |
| Sierra Leone | 19 | 0.0% |
| South Africa | 145 | 0.0% |
| South America | 530 | 0.1% |
| South Central Asia | 579 | 0.1% |
| South Eastern Asia | 3,575 | 0.9% |
| Southern Europe | 202 | 0.1% |
| Spain | 22 | 0.0% |
| St. Vincent and the Grenadines | 21 | 0.0% |
| Syria | 28 | 0.0% |
| Taiwan | 139 | 0.0% |
| Thailand | 191 | 0.1% |
| Trinidad and Tobago | 33 | 0.0% |
| Turkey | 13 | 0.0% |
| Ukraine | 118 | 0.0% |
| Vietnam | 1,885 | 0.4% |
| West Indies | 35 | 0.0% |
| Western Africa | 52 | 0.0% |
| Western Asia | 307 | 0.1% |
| Western Europe | 887 | 0.2% |
| Zimbabwe | 8 | 0.0% | View All 96 Rows |
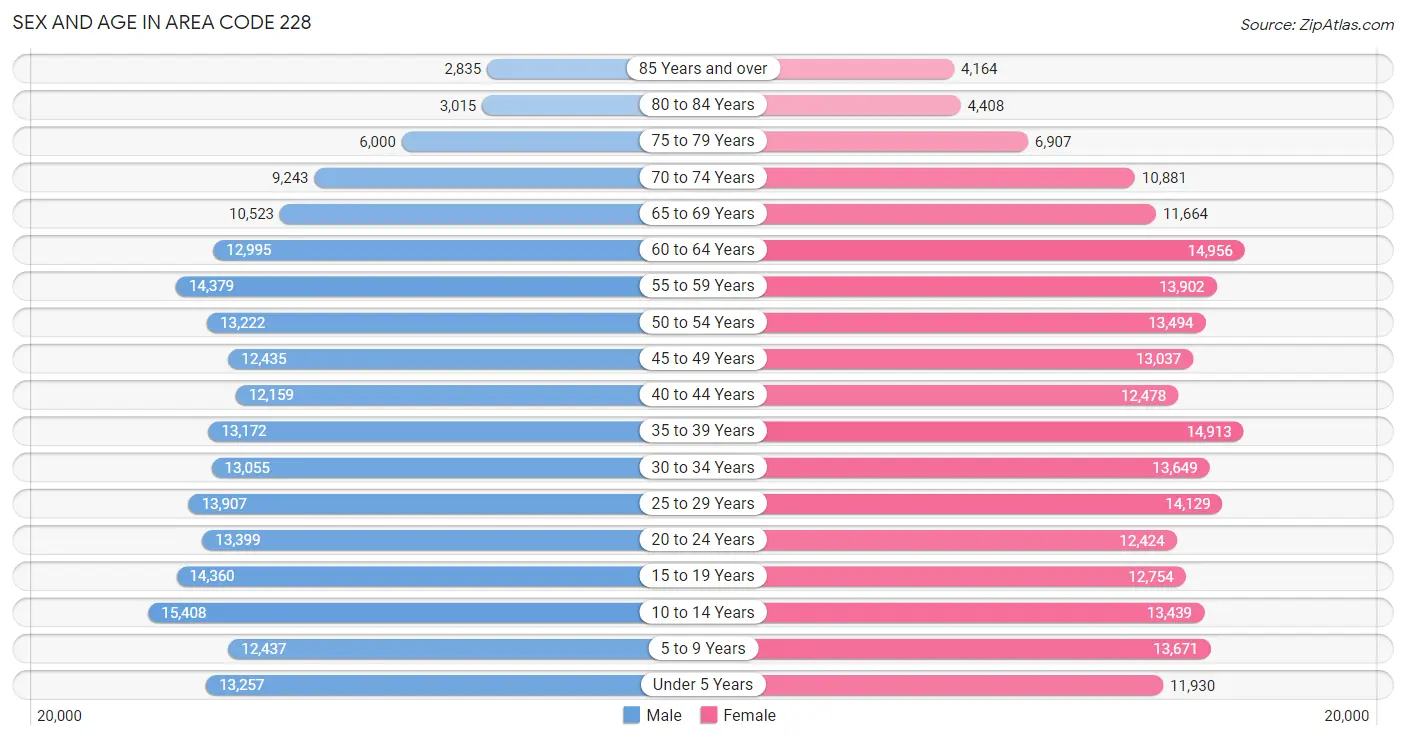
Sex and Age in Area Code 228
Sex and Age in Area Code 228
The most populous age groups in Area Code 228 are 10 to 14 Years (15,408 | 7.5%) for men and 60 to 64 Years (14,956 | 7.0%) for women.
| Age Bracket | Male | Female |
| Under 5 Years | 13,257 (6.4%) | 11,930 (5.6%) |
| 5 to 9 Years | 12,437 (6.0%) | 13,671 (6.4%) |
| 10 to 14 Years | 15,408 (7.5%) | 13,439 (6.3%) |
| 15 to 19 Years | 14,360 (7.0%) | 12,754 (6.0%) |
| 20 to 24 Years | 13,399 (6.5%) | 12,424 (5.8%) |
| 25 to 29 Years | 13,907 (6.8%) | 14,129 (6.6%) |
| 30 to 34 Years | 13,055 (6.3%) | 13,649 (6.4%) |
| 35 to 39 Years | 13,172 (6.4%) | 14,913 (7.0%) |
| 40 to 44 Years | 12,159 (5.9%) | 12,478 (5.9%) |
| 45 to 49 Years | 12,435 (6.0%) | 13,037 (6.1%) |
| 50 to 54 Years | 13,222 (6.4%) | 13,494 (6.3%) |
| 55 to 59 Years | 14,379 (7.0%) | 13,902 (6.5%) |
| 60 to 64 Years | 12,995 (6.3%) | 14,956 (7.0%) |
| 65 to 69 Years | 10,523 (5.1%) | 11,664 (5.5%) |
| 70 to 74 Years | 9,243 (4.5%) | 10,881 (5.1%) |
| 75 to 79 Years | 6,000 (2.9%) | 6,907 (3.3%) |
| 80 to 84 Years | 3,015 (1.5%) | 4,408 (2.1%) |
| 85 Years and over | 2,835 (1.4%) | 4,164 (2.0%) |
| Total | 205,801 (100.0%) | 212,800 (100.0%) |
Families and Households in Area Code 228
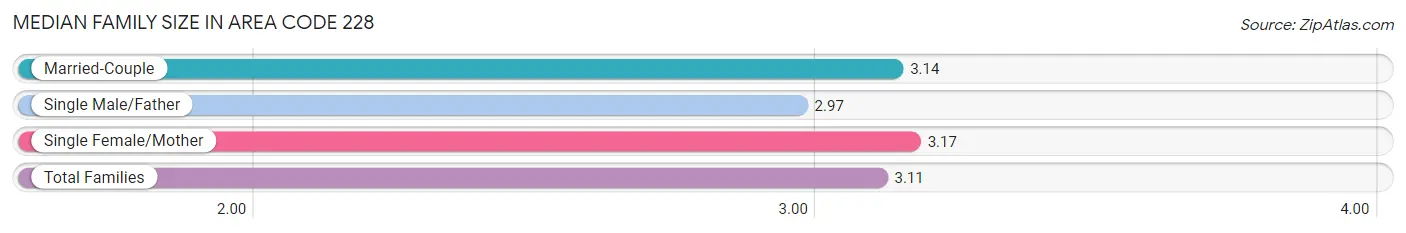
Median Family Size in Area Code 228
The median family size in Area Code 228 is 3.11 persons per family, with single female/mother families (26,246 | 24.2%) accounting for the largest median family size of 3.16869 persons per family. On the other hand, single male/father families (7,854 | 7.2%) represent the smallest median family size with 2.97 persons per family.
| Family Type | # Families | Family Size |
| Married-Couple | 74,264 (68.5%) | 3.14 |
| Single Male/Father | 7,854 (7.2%) | 2.97 |
| Single Female/Mother | 26,246 (24.2%) | 3.17 |
| Total Families | 108,364 (100.0%) | 3.11 |
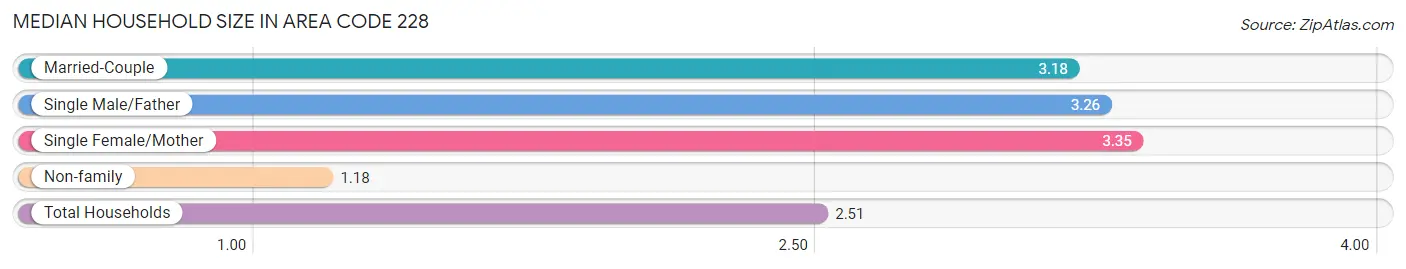
Median Household Size in Area Code 228
The median household size in Area Code 228 is 2.51 persons per household, with single female/mother households (26,246 | 16.2%) accounting for the largest median household size of 3.34913 persons per household. non-family households (53,742 | 33.2%) represent the smallest median household size with 1.18 persons per household.
| Household Type | # Households | Household Size |
| Married-Couple | 74,264 (45.8%) | 3.18 |
| Single Male/Father | 7,854 (4.8%) | 3.26 |
| Single Female/Mother | 26,246 (16.2%) | 3.35 |
| Non-family | 53,742 (33.2%) | 1.18 |
| Total Households | 162,106 (100.0%) | 2.51 |
Household Size by Marriage Status in Area Code 228
Out of a total of 162,106 households in Area Code 228, 108,364 (66.8%) are family households, while 53,742 (33.2%) are nonfamily households. The most numerous type of family households are 2-person households, comprising 48,454, and the most common type of nonfamily households are 1-person households, comprising 45,653.
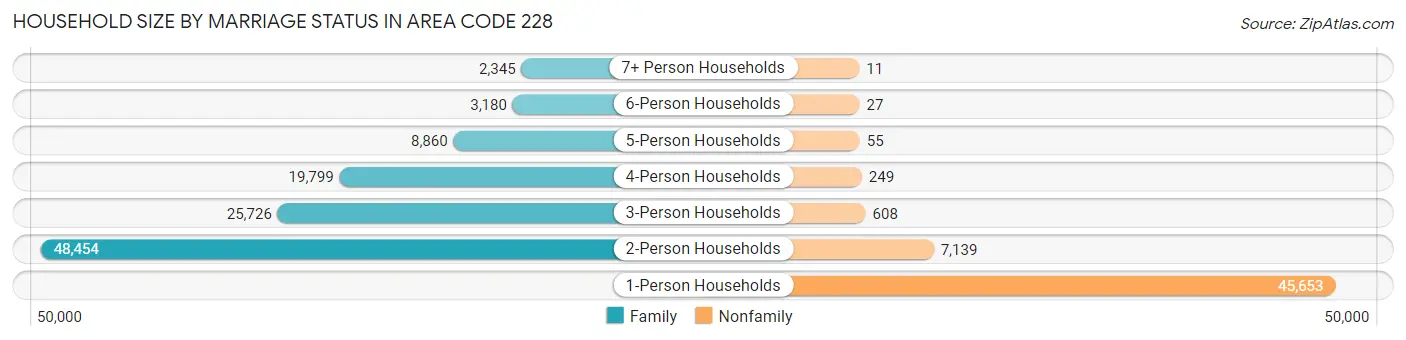
| Household Size | Family Households | Nonfamily Households |
| 1-Person Households | - | 45,653 (28.2%) |
| 2-Person Households | 48,454 (29.9%) | 7,139 (4.4%) |
| 3-Person Households | 25,726 (15.9%) | 608 (0.4%) |
| 4-Person Households | 19,799 (12.2%) | 249 (0.2%) |
| 5-Person Households | 8,860 (5.5%) | 55 (0.0%) |
| 6-Person Households | 3,180 (2.0%) | 27 (0.0%) |
| 7+ Person Households | 2,345 (1.5%) | 11 (0.0%) |
| Total | 108,364 (66.8%) | 53,742 (33.2%) |
Female Fertility in Area Code 228
Fertility by Age in Area Code 228
Average fertility rate in Area Code 228 is 59.8 births per 1,000 women. Women in the age bracket of 20 to 34 years have the highest fertility rate with 105.5 births per 1,000 women. Women in the age bracket of 20 to 34 years acount for 77.5% of all women with births.
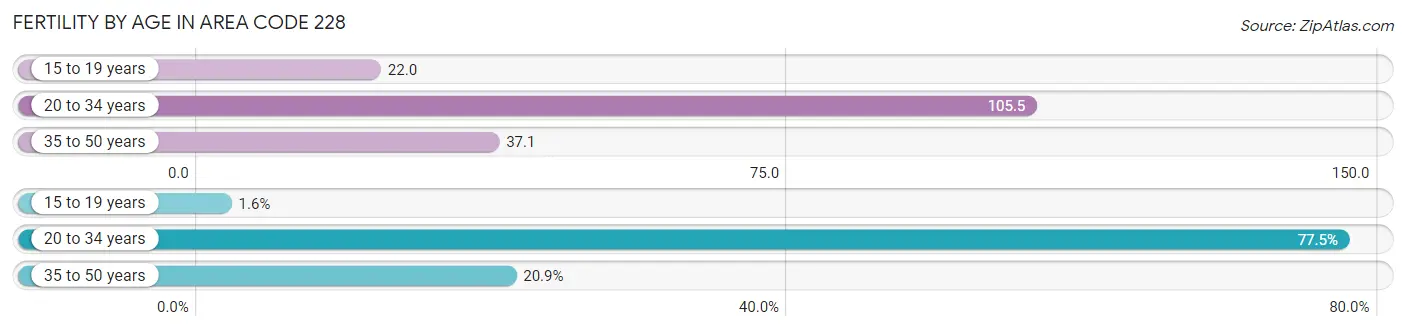
| Age Bracket | Women with Births | Births / 1,000 Women |
| 15 to 19 years | 90 (1.6%) | 22.0 |
| 20 to 34 years | 4,352 (77.5%) | 105.5 |
| 35 to 50 years | 1,175 (20.9%) | 37.0 |
| Total | 5,617 (100.0%) | 59.8 |
Fertility by Age by Marriage Status in Area Code 228
60.9% of women with births (5,617) in Area Code 228 are married. The highest percentage of unmarried women with births falls into 15 to 19 years age bracket with 100.0% of them unmarried at the time of birth, while the lowest percentage of unmarried women with births belong to 20 to 34 years age bracket with 42.9% of them unmarried.
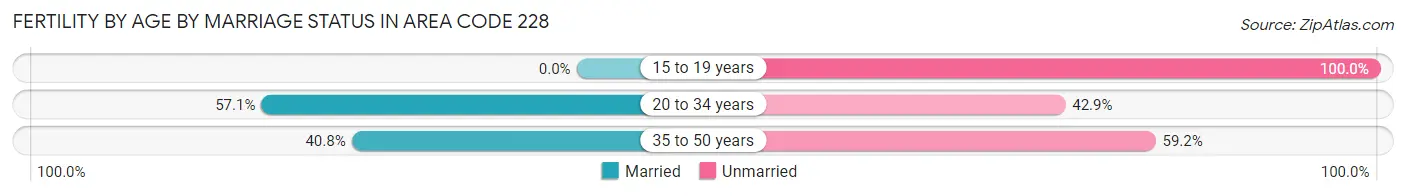
| Age Bracket | Married | Unmarried |
| 15 to 19 years | 0 (0.0%) | 90 (100.0%) |
| 20 to 34 years | 2,486 (57.1%) | 1,866 (42.9%) |
| 35 to 50 years | 479 (40.8%) | 696 (59.2%) |
| Total | 3,419 (60.9%) | 2,198 (39.1%) |
Fertility by Education in Area Code 228
Average fertility rate in Area Code 228 is 59.8 births per 1,000 women. Women with the education attainment of graduate degree have the highest fertility rate of 139.2 births per 1,000 women, while women with the education attainment of less than high school have the lowest fertility at 49.0 births per 1,000 women. Women with the education attainment of college or associate's degree represent 40.5% of all women with births.
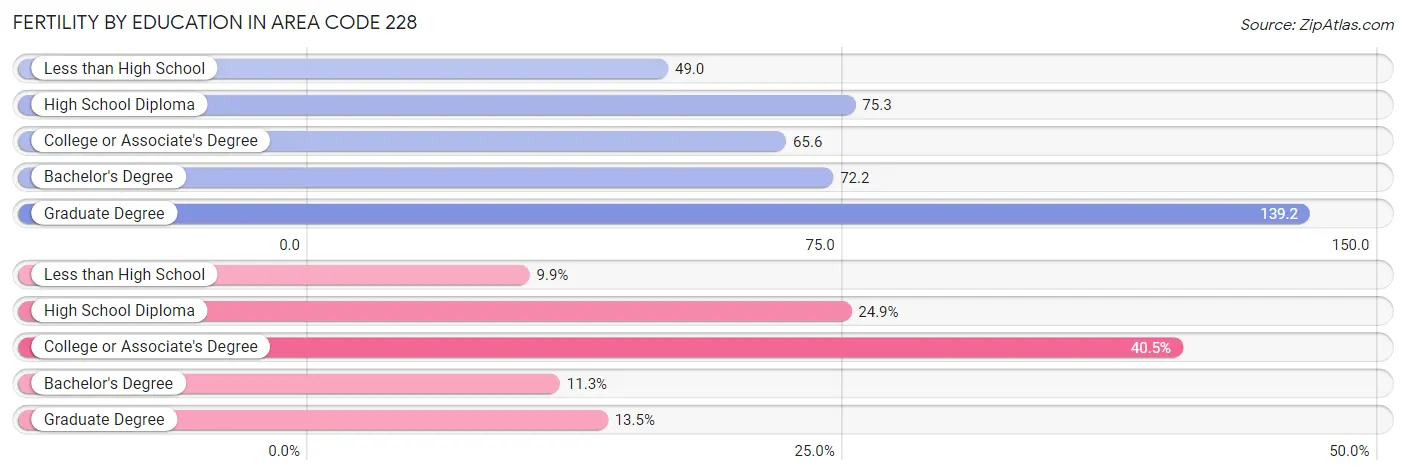
| Educational Attainment | Women with Births | Births / 1,000 Women |
| Less than High School | 553 (9.9%) | 49.0 |
| High School Diploma | 1,400 (24.9%) | 75.3 |
| College or Associate's Degree | 2,272 (40.5%) | 65.6 |
| Bachelor's Degree | 633 (11.3%) | 72.2 |
| Graduate Degree | 759 (13.5%) | 139.2 |
| Total | 5,617 (100.0%) | 59.8 |
Fertility by Education by Marriage Status in Area Code 228
39.1% of women with births in Area Code 228 are unmarried. Women with the educational attainment of graduate degree are most likely to be married with 74.4% of them married at childbirth, while women with the educational attainment of less than high school are least likely to be married with 75.8% of them unmarried at childbirth.
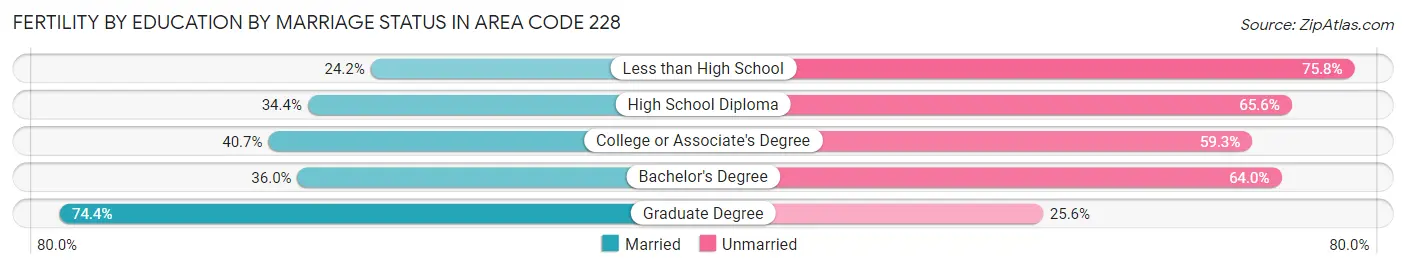
| Educational Attainment | Married | Unmarried |
| Less than High School | 134 (24.2%) | 419 (75.8%) |
| High School Diploma | 481 (34.4%) | 919 (65.6%) |
| College or Associate's Degree | 925 (40.7%) | 1,347 (59.3%) |
| Bachelor's Degree | 228 (36.0%) | 405 (64.0%) |
| Graduate Degree | 565 (74.4%) | 194 (25.6%) |
| Total | 3,419 (60.9%) | 2,198 (39.1%) |
Employment Characteristics in Area Code 228
Employment by Class of Employer in Area Code 228
Among the 179,482 employed individuals in Area Code 228, private company employees (113,349 | 63.1%), federal government employees (18,030 | 10.1%), and local government employees (13,269 | 7.4%) make up the most common classes of employment.
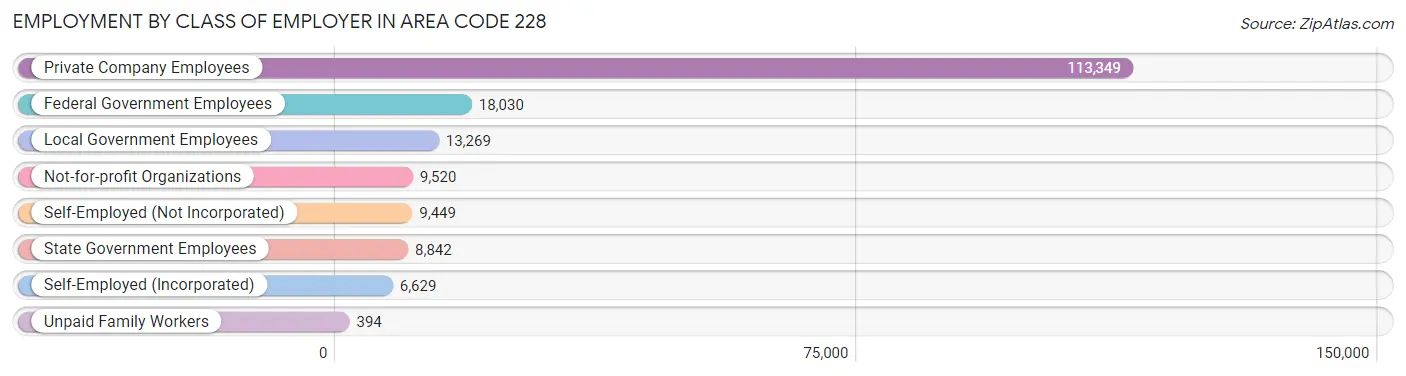
| Employer Class | # Employees | % Employees |
| Private Company Employees | 113,349 | 63.1% |
| Self-Employed (Incorporated) | 6,629 | 3.7% |
| Self-Employed (Not Incorporated) | 9,449 | 5.3% |
| Not-for-profit Organizations | 9,520 | 5.3% |
| Local Government Employees | 13,269 | 7.4% |
| State Government Employees | 8,842 | 4.9% |
| Federal Government Employees | 18,030 | 10.1% |
| Unpaid Family Workers | 394 | 0.2% |
| Total | 179,482 | 100.0% |
Employment Status by Age in Area Code 228
According to the labor force statistics for Area Code 228, out of the total population over 16 years of age (333,064), 61.7% or 205,434 individuals are in the labor force, with 8.0% or 16,435 of them unemployed. The age group with the highest labor force participation rate is 30 to 34 years, with 84.0% or 22,437 individuals in the labor force. Within the labor force, the 16 to 19 years age range has the highest percentage of unemployed individuals, with 435.6% or 37,557 of them being unemployed.
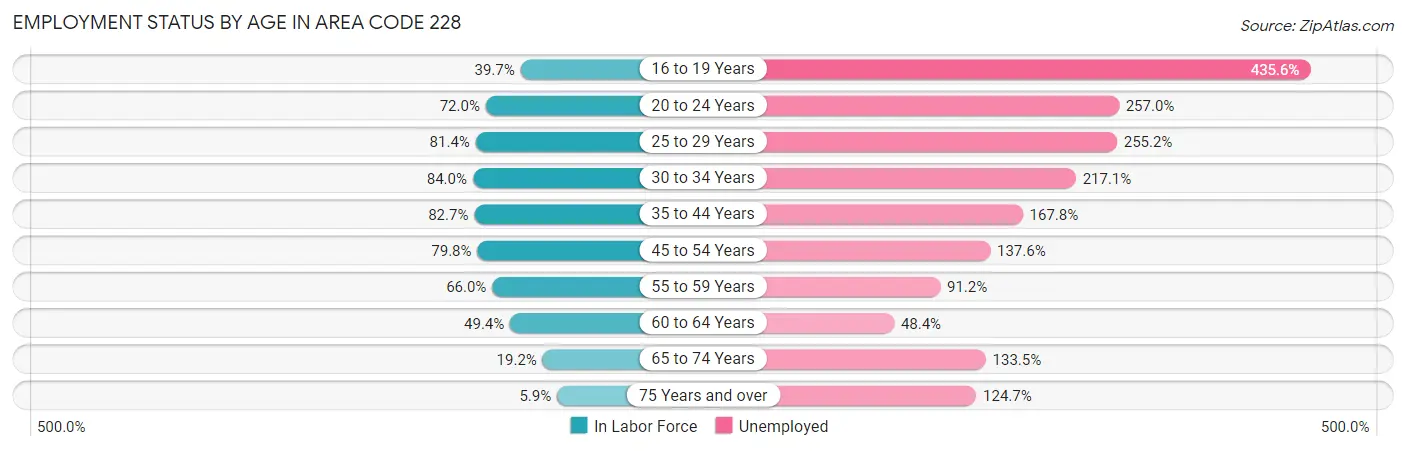
| Age Bracket | In Labor Force | Unemployed |
| 16 to 19 Years | 8,623 (39.7%) | 37,557 (435.6%) |
| 20 to 24 Years | 18,597 (72.0%) | 47,797 (257.0%) |
| 25 to 29 Years | 22,817 (81.4%) | 58,226 (255.2%) |
| 30 to 34 Years | 22,436 (84.0%) | 48,711 (217.1%) |
| 35 to 44 Years | 43,608 (82.7%) | 73,171 (167.8%) |
| 45 to 54 Years | 41,635 (79.8%) | 57,291 (137.6%) |
| 55 to 59 Years | 18,677 (66.0%) | 17,033 (91.2%) |
| 60 to 64 Years | 13,810 (49.4%) | 6,685 (48.4%) |
| 65 to 74 Years | 8,128 (19.2%) | 10,851 (133.5%) |
| 75 Years and over | 1,609 (5.9%) | 2,008 (124.7%) |
| Total | 205,434 (61.7%) | 16,426 (8.0%) |
Employment Status by Educational Attainment in Area Code 228
According to labor force statistics for Area Code 228, 77.0% of individuals (166,229) out of the total population between 25 and 64 years of age (215,882) are in the labor force, with 161.0% or 267,629 of them being unemployed. The group with the highest labor force participation rate are those with the educational attainment of bachelor's degree or higher, with 87.7% or 45,735 individuals in the labor force. Within the labor force, individuals with less than high school education have the highest percentage of unemployment, with 280.6% or 35,504 of them being unemployed.
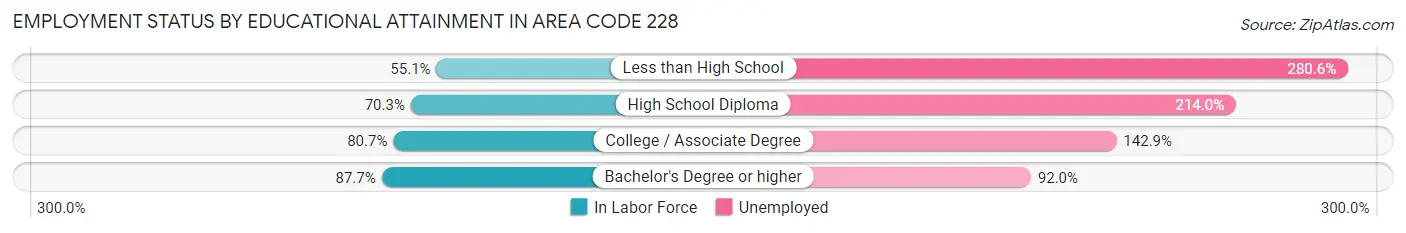
| Educational Attainment | In Labor Force | Unemployed |
| Less than High School | 12,652 (55.1%) | 64,473 (280.6%) |
| High School Diploma | 41,679 (70.3%) | 126,823 (214.0%) |
| College / Associate Degree | 65,796 (80.7%) | 116,445 (142.9%) |
| Bachelor's Degree or higher | 45,734 (87.7%) | 47,983 (92.0%) |
| Total | 166,229 (77.0%) | 347,570 (161.0%) |
Employment Occupations by Sex in Area Code 228
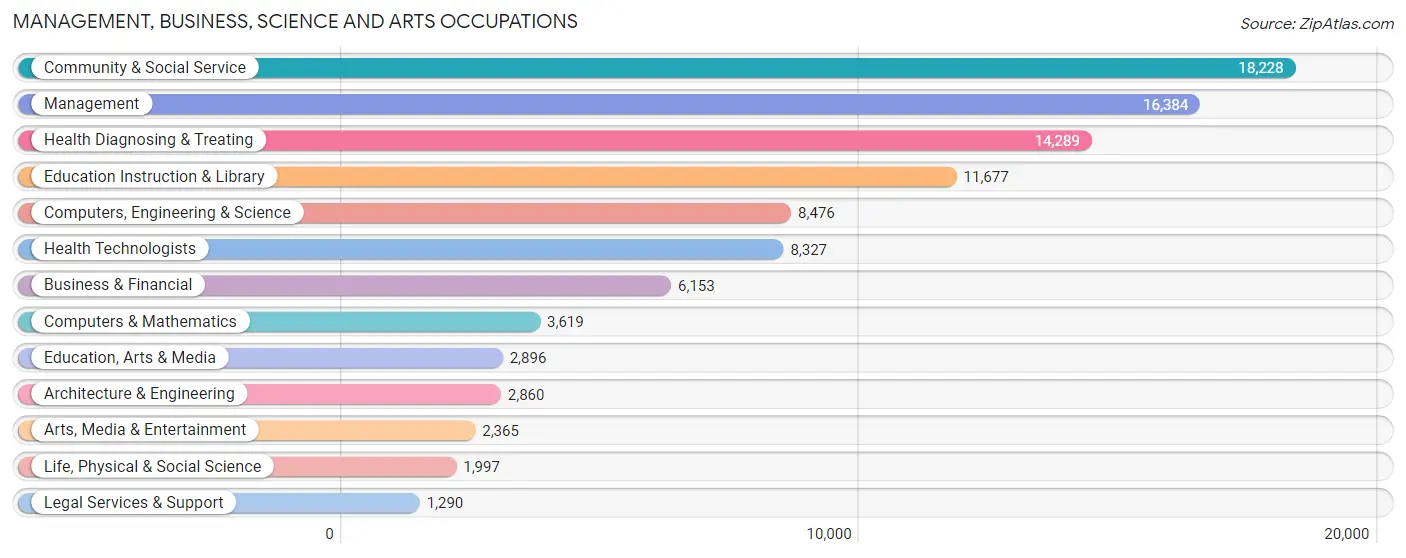
Management, Business, Science and Arts Occupations
The most common Management, Business, Science and Arts occupations in Area Code 228 are Community & Social Service (18,228 | 10.4%), Management (16,384 | 9.3%), Health Diagnosing & Treating (14,289 | 8.1%), Education Instruction & Library (11,677 | 6.6%), and Computers, Engineering & Science (8,476 | 4.8%).
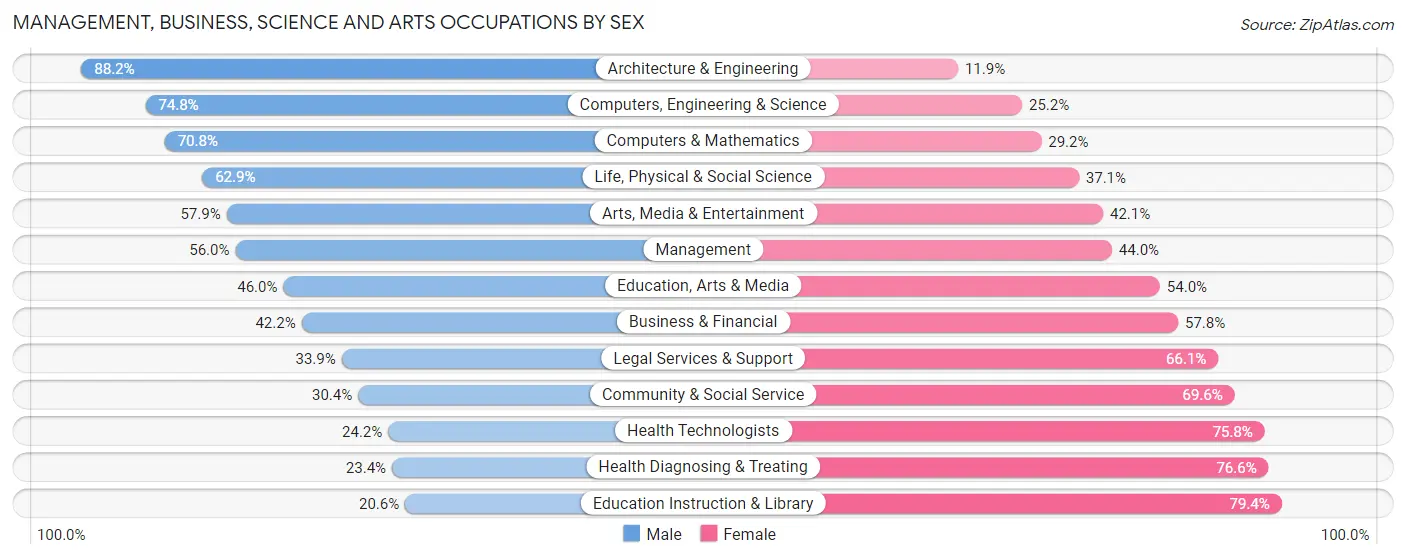
Management, Business, Science and Arts Occupations by Sex
Within the Management, Business, Science and Arts occupations in Area Code 228, the most male-oriented occupations are Architecture & Engineering (88.1%), Computers, Engineering & Science (74.8%), and Computers & Mathematics (70.8%), while the most female-oriented occupations are Education Instruction & Library (79.4%), Health Diagnosing & Treating (76.6%), and Health Technologists (75.8%).
| Occupation | Male | Female |
| Management | 9,182 (56.0%) | 7,202 (44.0%) |
| Business & Financial | 2,599 (42.2%) | 3,554 (57.8%) |
| Computers, Engineering & Science | 6,339 (74.8%) | 2,137 (25.2%) |
| Computers & Mathematics | 2,561 (70.8%) | 1,058 (29.2%) |
| Architecture & Engineering | 2,521 (88.1%) | 339 (11.8%) |
| Life, Physical & Social Science | 1,257 (62.9%) | 740 (37.1%) |
| Community & Social Service | 5,549 (30.4%) | 12,679 (69.6%) |
| Education, Arts & Media | 1,333 (46.0%) | 1,563 (54.0%) |
| Legal Services & Support | 437 (33.9%) | 853 (66.1%) |
| Education Instruction & Library | 2,410 (20.6%) | 9,267 (79.4%) |
| Arts, Media & Entertainment | 1,369 (57.9%) | 996 (42.1%) |
| Health Diagnosing & Treating | 3,341 (23.4%) | 10,948 (76.6%) |
| Health Technologists | 2,013 (24.2%) | 6,314 (75.8%) |
| Total (Category) | 27,010 (42.5%) | 36,520 (57.5%) |
| Total (Overall) | 89,294 (50.8%) | 86,477 (49.2%) |
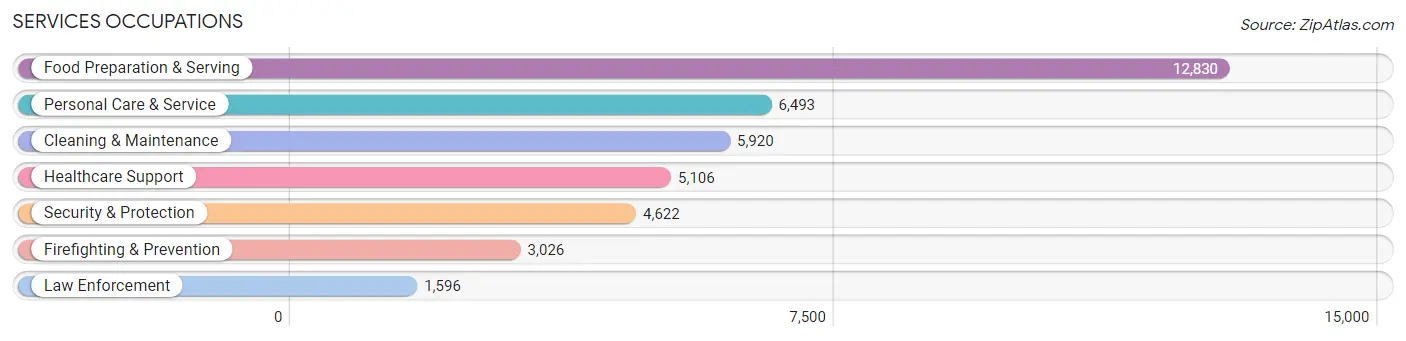
Services Occupations
The most common Services occupations in Area Code 228 are Food Preparation & Serving (12,830 | 7.3%), Personal Care & Service (6,493 | 3.7%), Cleaning & Maintenance (5,920 | 3.4%), Healthcare Support (5,106 | 2.9%), and Security & Protection (4,622 | 2.6%).
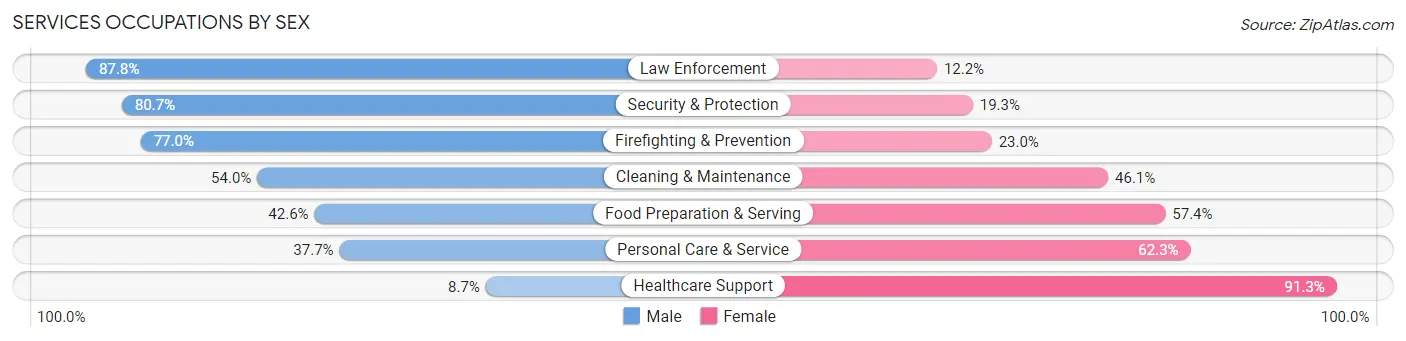
Services Occupations by Sex
Within the Services occupations in Area Code 228, the most male-oriented occupations are Law Enforcement (87.8%), Security & Protection (80.7%), and Firefighting & Prevention (77.0%), while the most female-oriented occupations are Healthcare Support (91.3%), Personal Care & Service (62.3%), and Food Preparation & Serving (57.4%).
| Occupation | Male | Female |
| Healthcare Support | 444 (8.7%) | 4,662 (91.3%) |
| Security & Protection | 3,732 (80.7%) | 890 (19.3%) |
| Firefighting & Prevention | 2,330 (77.0%) | 696 (23.0%) |
| Law Enforcement | 1,402 (87.8%) | 194 (12.2%) |
| Food Preparation & Serving | 5,467 (42.6%) | 7,363 (57.4%) |
| Cleaning & Maintenance | 3,194 (53.9%) | 2,726 (46.1%) |
| Personal Care & Service | 2,445 (37.7%) | 4,048 (62.3%) |
| Total (Category) | 15,282 (43.7%) | 19,689 (56.3%) |
| Total (Overall) | 89,294 (50.8%) | 86,477 (49.2%) |
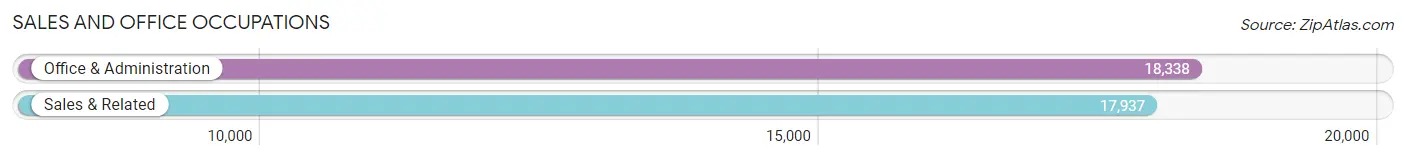
Sales and Office Occupations
The most common Sales and Office occupations in Area Code 228 are Office & Administration (18,338 | 10.4%), and Sales & Related (17,937 | 10.2%).
Sales and Office Occupations by Sex
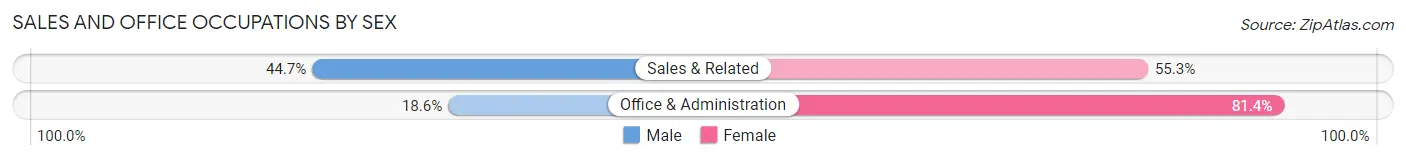
| Occupation | Male | Female |
| Sales & Related | 8,022 (44.7%) | 9,915 (55.3%) |
| Office & Administration | 3,408 (18.6%) | 14,930 (81.4%) |
| Total (Category) | 11,430 (31.5%) | 24,845 (68.5%) |
| Total (Overall) | 89,294 (50.8%) | 86,477 (49.2%) |
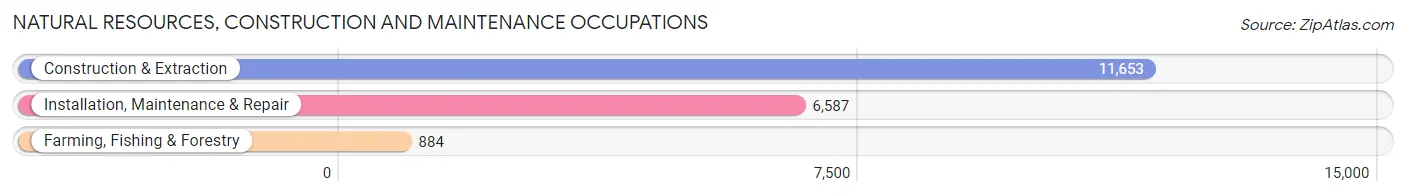
Natural Resources, Construction and Maintenance Occupations
The most common Natural Resources, Construction and Maintenance occupations in Area Code 228 are Construction & Extraction (11,653 | 6.6%), Installation, Maintenance & Repair (6,587 | 3.7%), and Farming, Fishing & Forestry (884 | 0.5%).
Natural Resources, Construction and Maintenance Occupations by Sex
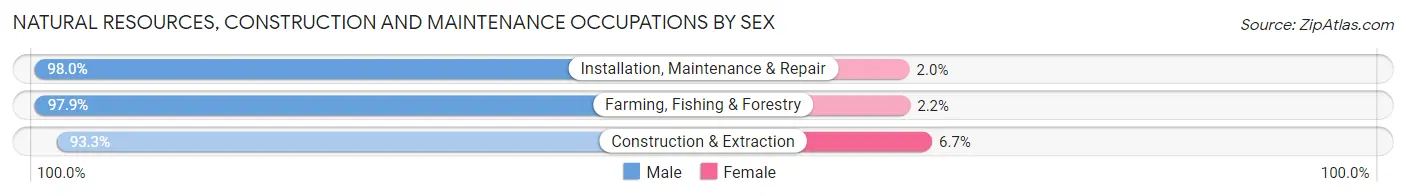
| Occupation | Male | Female |
| Farming, Fishing & Forestry | 865 (97.9%) | 19 (2.1%) |
| Construction & Extraction | 10,872 (93.3%) | 781 (6.7%) |
| Installation, Maintenance & Repair | 6,453 (98.0%) | 134 (2.0%) |
| Total (Category) | 18,190 (95.1%) | 934 (4.9%) |
| Total (Overall) | 89,294 (50.8%) | 86,477 (49.2%) |
Production, Transportation and Moving Occupations
The most common Production, Transportation and Moving occupations in Area Code 228 are Production (10,209 | 5.8%), Transportation (6,999 | 4.0%), and Material Moving (4,663 | 2.6%).
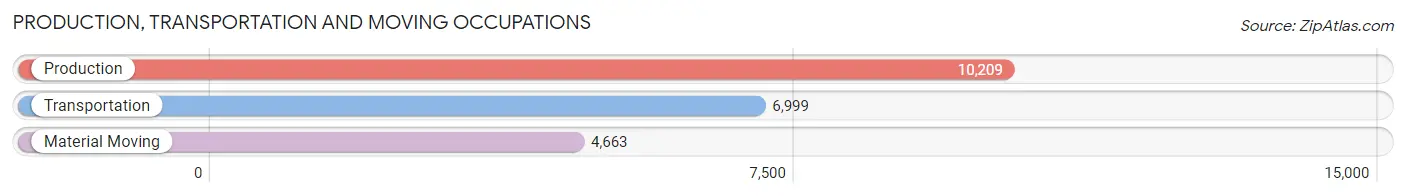
Production, Transportation and Moving Occupations by Sex
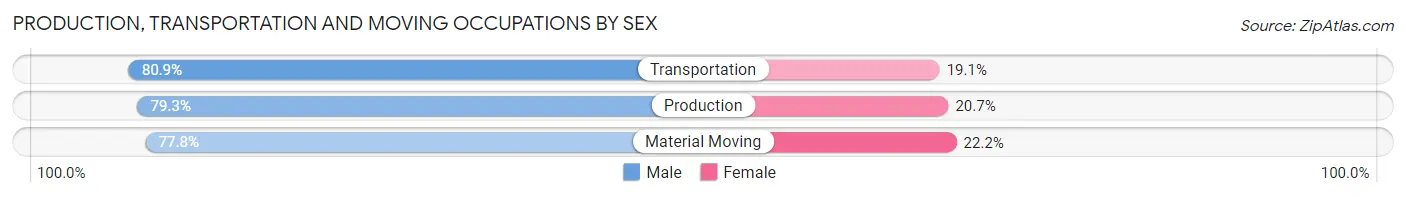
| Occupation | Male | Female |
| Production | 8,094 (79.3%) | 2,115 (20.7%) |
| Transportation | 5,661 (80.9%) | 1,338 (19.1%) |
| Material Moving | 3,627 (77.8%) | 1,036 (22.2%) |
| Total (Category) | 17,382 (79.5%) | 4,489 (20.5%) |
| Total (Overall) | 89,294 (50.8%) | 86,477 (49.2%) |
Employment Industries by Sex in Area Code 228
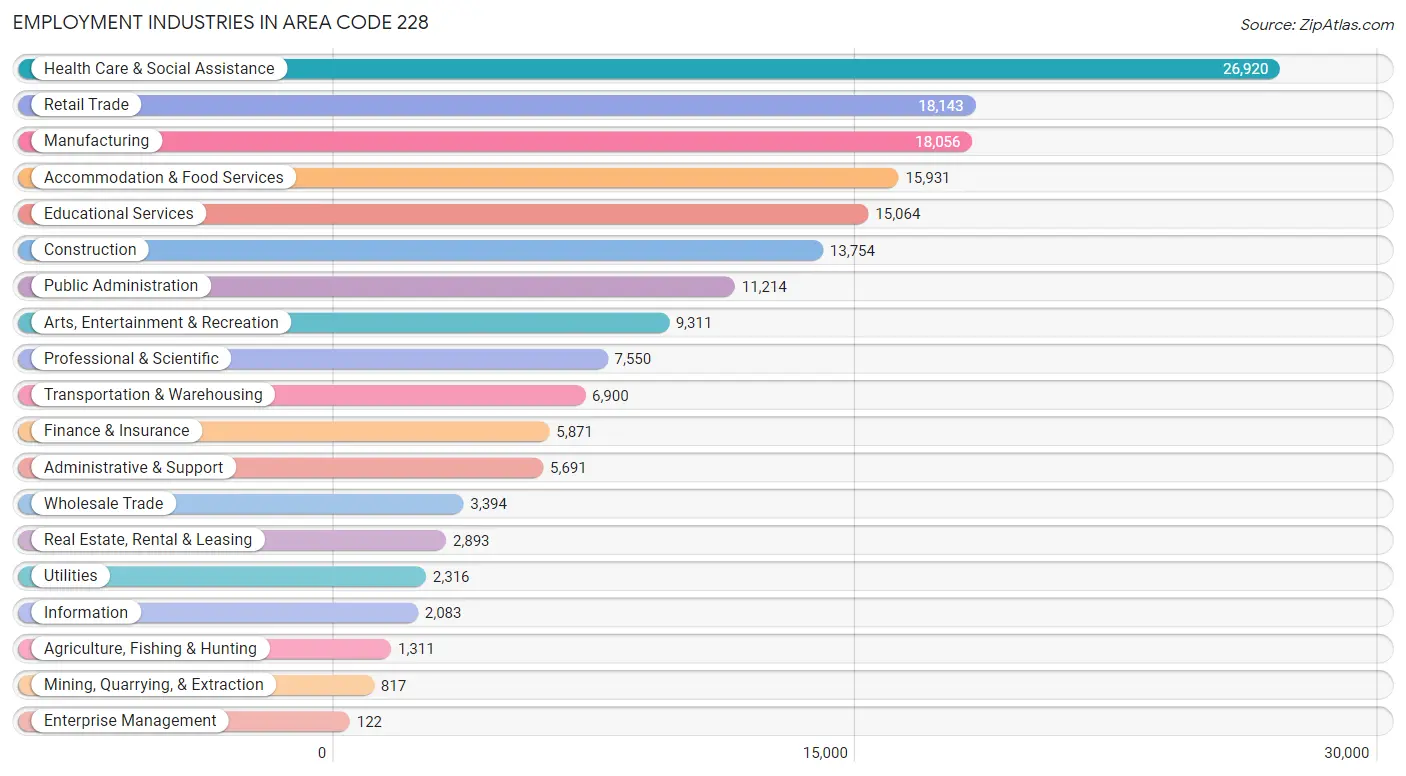
Employment Industries in Area Code 228
The major employment industries in Area Code 228 include Health Care & Social Assistance (26,920 | 15.3%), Retail Trade (18,143 | 10.3%), Manufacturing (18,056 | 10.3%), Accommodation & Food Services (15,931 | 9.1%), and Educational Services (15,064 | 8.6%).
Employment Industries by Sex in Area Code 228
The Area Code 228 industries that see more men than women are Utilities (91.7%), Mining, Quarrying, & Extraction (90.8%), and Construction (88.1%), whereas the industries that tend to have a higher number of women are Health Care & Social Assistance (80.4%), Educational Services (72.3%), and Finance & Insurance (68.6%).
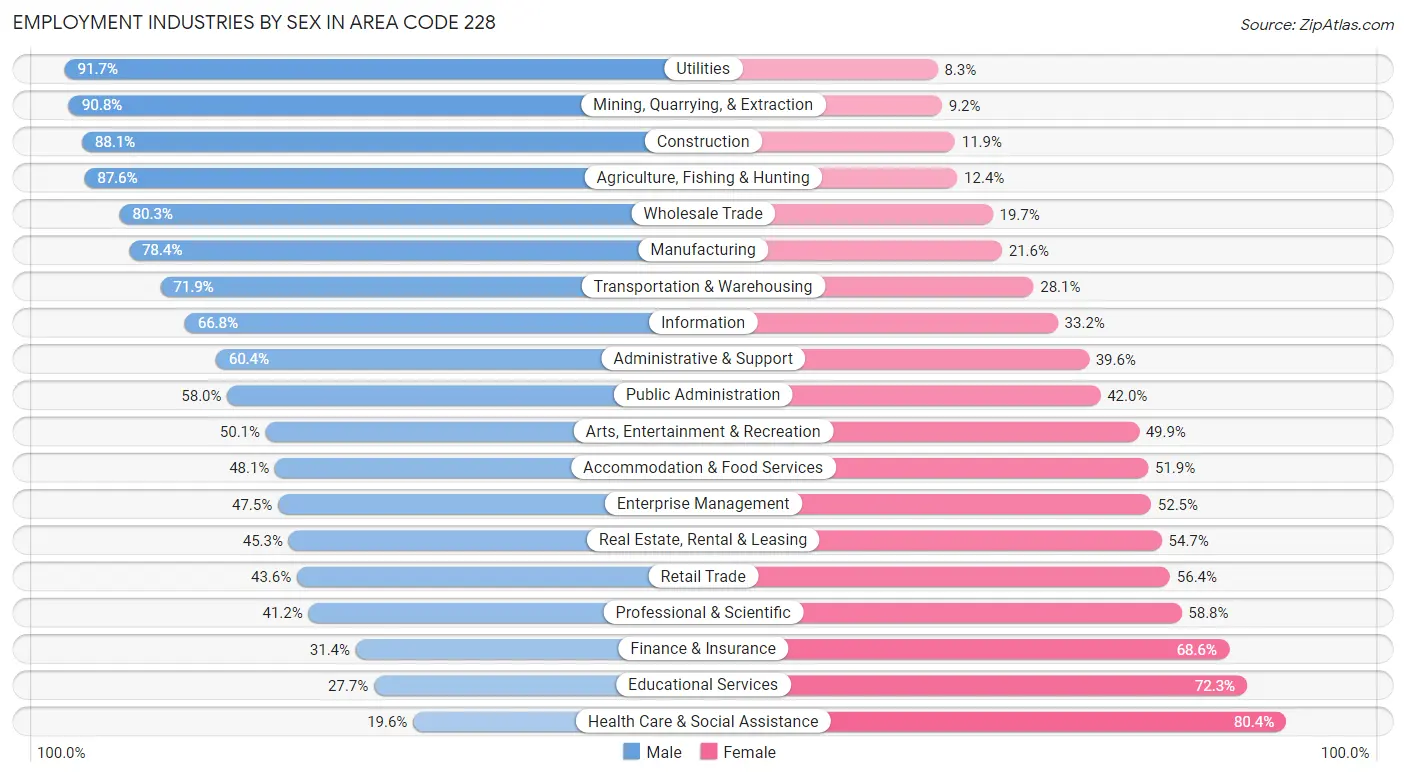
| Industry | Male | Female |
| Agriculture, Fishing & Hunting | 1,149 (87.6%) | 162 (12.4%) |
| Mining, Quarrying, & Extraction | 742 (90.8%) | 75 (9.2%) |
| Construction | 12,122 (88.1%) | 1,632 (11.9%) |
| Manufacturing | 14,155 (78.4%) | 3,901 (21.6%) |
| Wholesale Trade | 2,726 (80.3%) | 668 (19.7%) |
| Retail Trade | 7,912 (43.6%) | 10,231 (56.4%) |
| Transportation & Warehousing | 4,960 (71.9%) | 1,940 (28.1%) |
| Utilities | 2,124 (91.7%) | 192 (8.3%) |
| Information | 1,392 (66.8%) | 691 (33.2%) |
| Finance & Insurance | 1,845 (31.4%) | 4,026 (68.6%) |
| Real Estate, Rental & Leasing | 1,311 (45.3%) | 1,582 (54.7%) |
| Professional & Scientific | 3,113 (41.2%) | 4,437 (58.8%) |
| Enterprise Management | 58 (47.5%) | 64 (52.5%) |
| Administrative & Support | 3,438 (60.4%) | 2,253 (39.6%) |
| Educational Services | 4,166 (27.7%) | 10,898 (72.3%) |
| Health Care & Social Assistance | 5,269 (19.6%) | 21,651 (80.4%) |
| Arts, Entertainment & Recreation | 4,661 (50.1%) | 4,650 (49.9%) |
| Accommodation & Food Services | 7,668 (48.1%) | 8,263 (51.9%) |
| Public Administration | 6,508 (58.0%) | 4,706 (42.0%) |
| Total | 89,294 (50.8%) | 86,477 (49.2%) |
Education in Area Code 228
School Enrollment in Area Code 228
The most common levels of schooling among the 96,968 students in Area Code 228 are middle school (22,664 | 23.4%), high school (21,521 | 22.2%), and elementary school (21,443 | 22.1%).
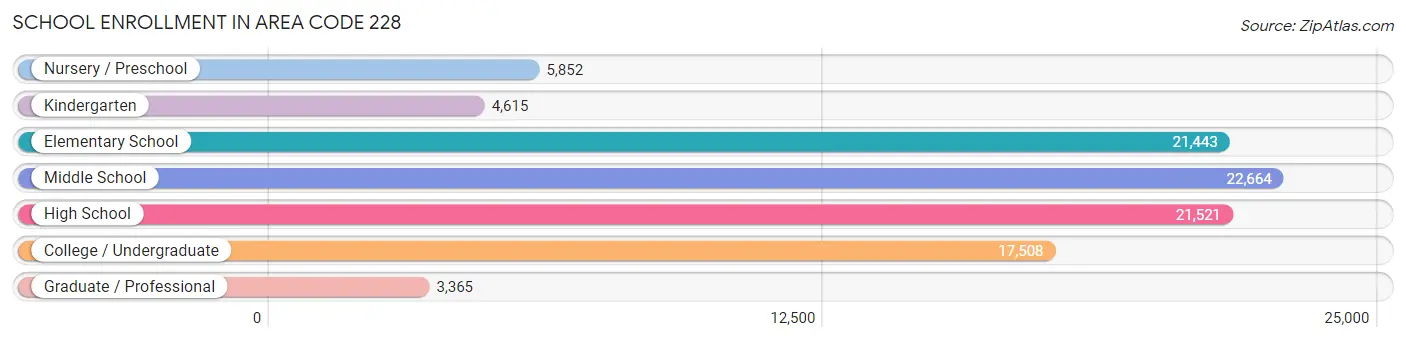
| School Level | # Students | % Students |
| Nursery / Preschool | 5,852 | 6.0% |
| Kindergarten | 4,615 | 4.8% |
| Elementary School | 21,443 | 22.1% |
| Middle School | 22,664 | 23.4% |
| High School | 21,521 | 22.2% |
| College / Undergraduate | 17,508 | 18.1% |
| Graduate / Professional | 3,365 | 3.5% |
| Total | 96,968 | 100.0% |
School Enrollment by Age by Funding Source in Area Code 228
Out of a total of 96,968 students who are enrolled in schools in Area Code 228, 13,576 (14.0%) attend a private institution, while the remaining 83,392 (86.0%) are enrolled in public schools. The age group of 3 to 4 year olds has the highest likelihood of being enrolled in private schools, with 1,749 (39.9% in the age bracket) enrolled. Conversely, the age group of 20 to 24 year olds has the lowest likelihood of being enrolled in a private school, with 6,765 (90.8% in the age bracket) attending a public institution.
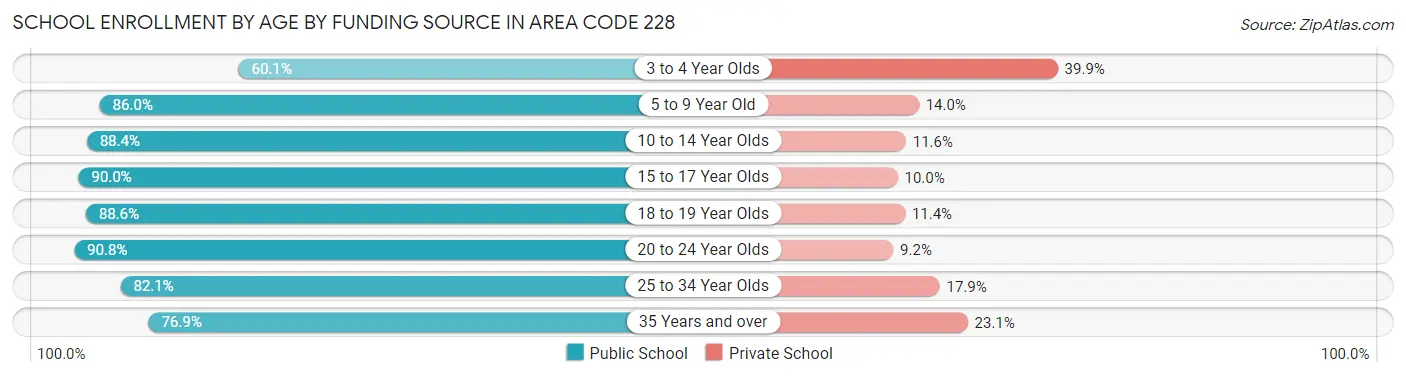
| Age Bracket | Public School | Private School |
| 3 to 4 Year Olds | 2,639 (60.1%) | 1,749 (39.9%) |
| 5 to 9 Year Old | 20,841 (86.0%) | 3,385 (14.0%) |
| 10 to 14 Year Olds | 24,749 (88.4%) | 3,237 (11.6%) |
| 15 to 17 Year Olds | 14,526 (90.0%) | 1,619 (10.0%) |
| 18 to 19 Year Olds | 5,355 (88.6%) | 690 (11.4%) |
| 20 to 24 Year Olds | 6,765 (90.8%) | 687 (9.2%) |
| 25 to 34 Year Olds | 4,223 (82.1%) | 918 (17.9%) |
| 35 Years and over | 4,296 (76.9%) | 1,289 (23.1%) |
| Total | 83,392 (86.0%) | 13,576 (14.0%) |
Educational Attainment by Field of Study in Area Code 228
Business (14,832 | 20.2%), education (12,816 | 17.4%), science & technology (10,394 | 14.1%), arts & humanities (4,700 | 6.4%), and bio, nature & agricultural (4,431 | 6.0%) are the most common fields of study among 73,550 individuals in Area Code 228 who have obtained a bachelor's degree or higher.
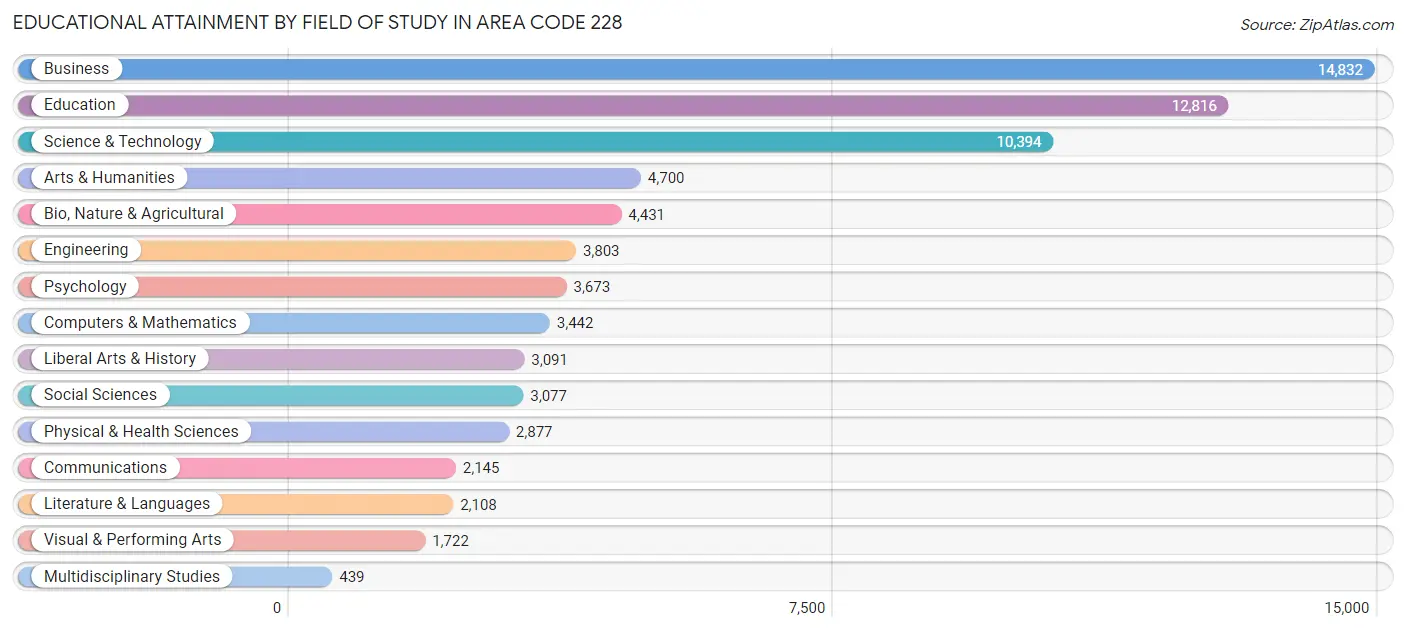
| Field of Study | # Graduates | % Graduates |
| Computers & Mathematics | 3,442 | 4.7% |
| Bio, Nature & Agricultural | 4,431 | 6.0% |
| Physical & Health Sciences | 2,877 | 3.9% |
| Psychology | 3,673 | 5.0% |
| Social Sciences | 3,077 | 4.2% |
| Engineering | 3,803 | 5.2% |
| Multidisciplinary Studies | 439 | 0.6% |
| Science & Technology | 10,394 | 14.1% |
| Business | 14,832 | 20.2% |
| Education | 12,816 | 17.4% |
| Literature & Languages | 2,108 | 2.9% |
| Liberal Arts & History | 3,091 | 4.2% |
| Visual & Performing Arts | 1,722 | 2.3% |
| Communications | 2,145 | 2.9% |
| Arts & Humanities | 4,700 | 6.4% |
| Total | 73,550 | 100.0% |
Transportation & Commute in Area Code 228
Vehicle Availability by Sex in Area Code 228
The most prevalent vehicle ownership categories in Area Code 228 are males with 2 vehicles (36,418, accounting for 39.8%) and females with 2 vehicles (32,191, making up 42.5%).
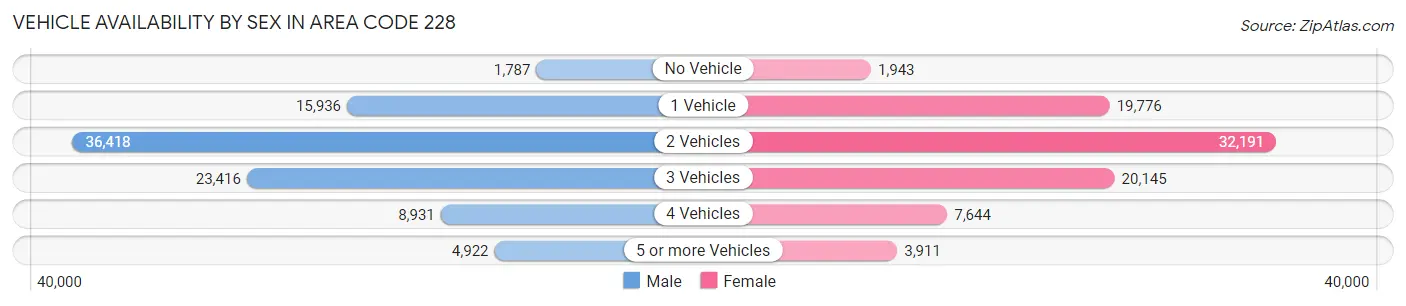
| Vehicles Available | Male | Female |
| No Vehicle | 1,787 (1.9%) | 1,943 (2.3%) |
| 1 Vehicle | 15,936 (17.4%) | 19,776 (23.1%) |
| 2 Vehicles | 36,418 (39.8%) | 32,191 (37.6%) |
| 3 Vehicles | 23,416 (25.6%) | 20,145 (23.5%) |
| 4 Vehicles | 8,931 (9.8%) | 7,644 (8.9%) |
| 5 or more Vehicles | 4,922 (5.4%) | 3,911 (4.6%) |
| Total | 91,410 (100.0%) | 85,610 (100.0%) |
Commute Time in Area Code 228
The most frequently occuring commute durations in Area Code 228 are 15 to 19 minutes (29,450 commuters, 17.4%), 20 to 24 minutes (27,366 commuters, 16.1%), and 10 to 14 minutes (22,911 commuters, 13.5%).
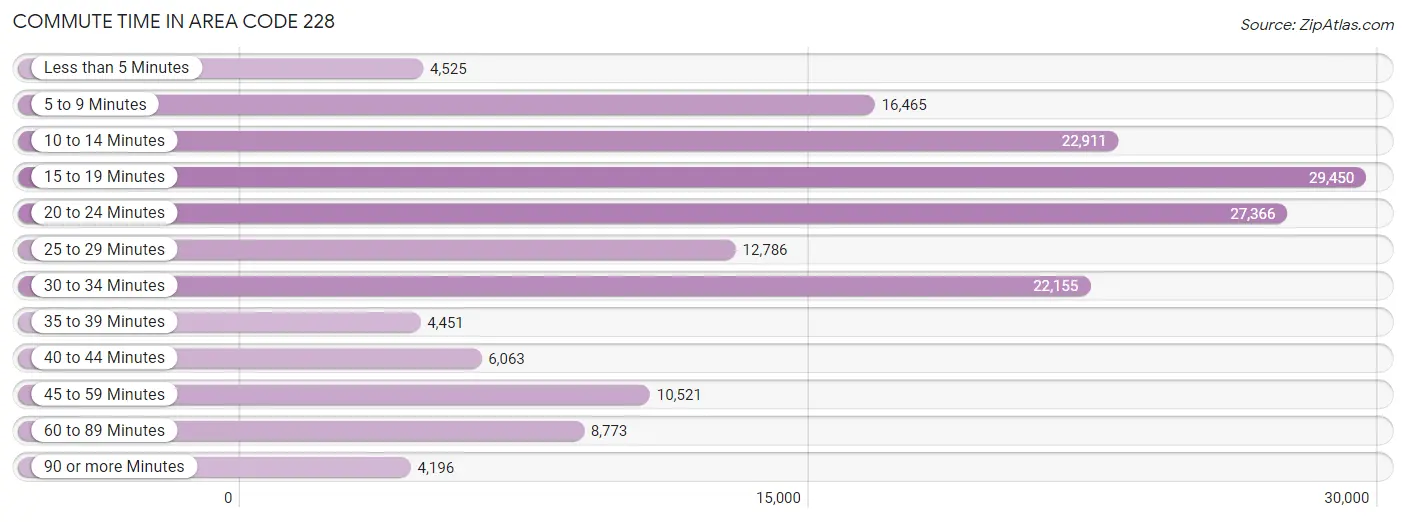
| Commute Time | # Commuters | % Commuters |
| Less than 5 Minutes | 4,525 | 2.7% |
| 5 to 9 Minutes | 16,465 | 9.7% |
| 10 to 14 Minutes | 22,911 | 13.5% |
| 15 to 19 Minutes | 29,450 | 17.4% |
| 20 to 24 Minutes | 27,366 | 16.1% |
| 25 to 29 Minutes | 12,786 | 7.5% |
| 30 to 34 Minutes | 22,155 | 13.1% |
| 35 to 39 Minutes | 4,451 | 2.6% |
| 40 to 44 Minutes | 6,063 | 3.6% |
| 45 to 59 Minutes | 10,521 | 6.2% |
| 60 to 89 Minutes | 8,773 | 5.2% |
| 90 or more Minutes | 4,196 | 2.5% |
Commute Time by Sex in Area Code 228
The most common commute times in Area Code 228 are 15 to 19 minutes (14,541 commuters, 16.4%) for males and 15 to 19 minutes (14,909 commuters, 18.4%) for females.
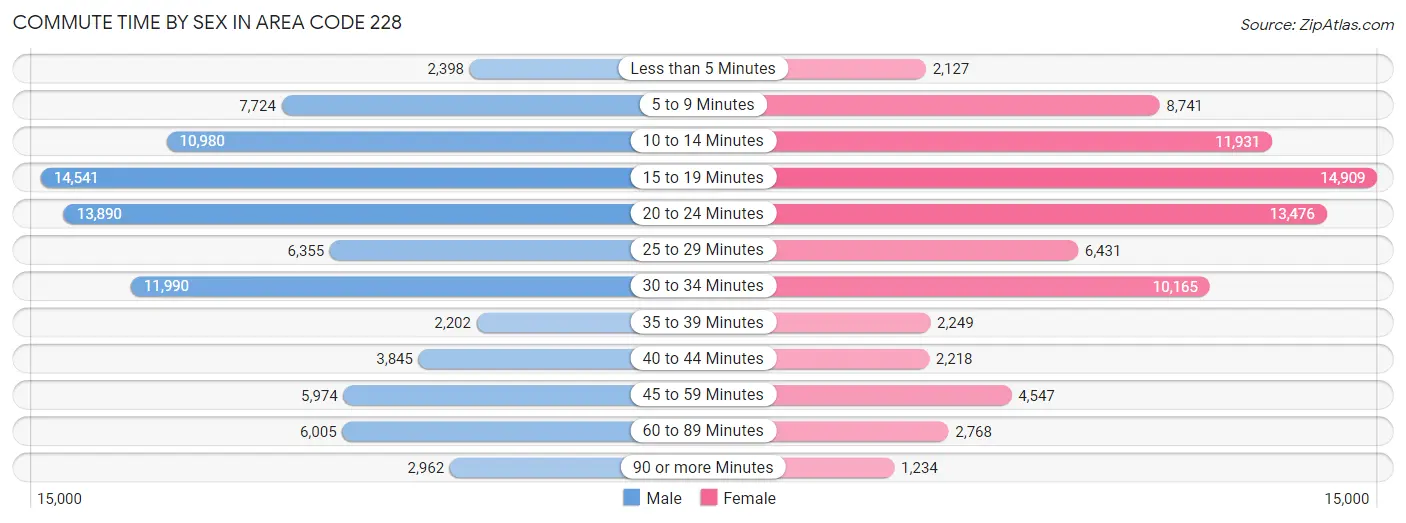
| Commute Time | Male | Female |
| Less than 5 Minutes | 2,398 (2.7%) | 2,127 (2.6%) |
| 5 to 9 Minutes | 7,724 (8.7%) | 8,741 (10.8%) |
| 10 to 14 Minutes | 10,980 (12.4%) | 11,931 (14.8%) |
| 15 to 19 Minutes | 14,541 (16.4%) | 14,909 (18.4%) |
| 20 to 24 Minutes | 13,890 (15.6%) | 13,476 (16.7%) |
| 25 to 29 Minutes | 6,355 (7.1%) | 6,431 (8.0%) |
| 30 to 34 Minutes | 11,990 (13.5%) | 10,165 (12.6%) |
| 35 to 39 Minutes | 2,202 (2.5%) | 2,249 (2.8%) |
| 40 to 44 Minutes | 3,845 (4.3%) | 2,218 (2.8%) |
| 45 to 59 Minutes | 5,974 (6.7%) | 4,547 (5.6%) |
| 60 to 89 Minutes | 6,005 (6.8%) | 2,768 (3.4%) |
| 90 or more Minutes | 2,962 (3.3%) | 1,234 (1.5%) |
Time of Departure to Work by Sex in Area Code 228
The most frequent times of departure to work in Area Code 228 are 6:00 AM to 6:29 AM (12,508, 14.1%) for males and 7:00 AM to 7:29 AM (14,867, 18.4%) for females.
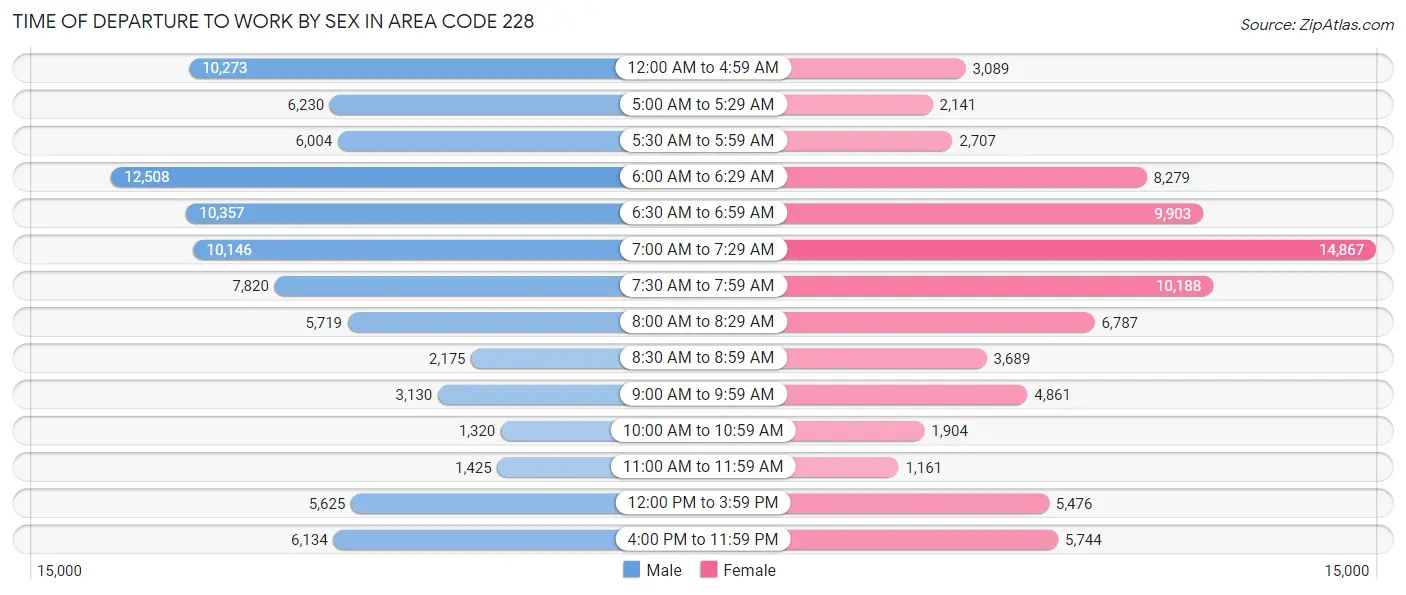
| Time of Departure | Male | Female |
| 12:00 AM to 4:59 AM | 10,273 (11.6%) | 3,089 (3.8%) |
| 5:00 AM to 5:29 AM | 6,230 (7.0%) | 2,141 (2.6%) |
| 5:30 AM to 5:59 AM | 6,004 (6.8%) | 2,707 (3.4%) |
| 6:00 AM to 6:29 AM | 12,508 (14.1%) | 8,279 (10.2%) |
| 6:30 AM to 6:59 AM | 10,357 (11.7%) | 9,903 (12.3%) |
| 7:00 AM to 7:29 AM | 10,146 (11.4%) | 14,867 (18.4%) |
| 7:30 AM to 7:59 AM | 7,820 (8.8%) | 10,188 (12.6%) |
| 8:00 AM to 8:29 AM | 5,719 (6.4%) | 6,787 (8.4%) |
| 8:30 AM to 8:59 AM | 2,175 (2.5%) | 3,689 (4.6%) |
| 9:00 AM to 9:59 AM | 3,130 (3.5%) | 4,861 (6.0%) |
| 10:00 AM to 10:59 AM | 1,320 (1.5%) | 1,904 (2.4%) |
| 11:00 AM to 11:59 AM | 1,425 (1.6%) | 1,161 (1.4%) |
| 12:00 PM to 3:59 PM | 5,625 (6.3%) | 5,476 (6.8%) |
| 4:00 PM to 11:59 PM | 6,134 (6.9%) | 5,744 (7.1%) |
| Total | 88,866 (100.0%) | 80,796 (100.0%) |
Housing Occupancy in Area Code 228
Occupancy by Ownership in Area Code 228
Of the total 162,106 dwellings in Area Code 228, owner-occupied units account for 108,684 (67.0%), while renter-occupied units make up 53,422 (33.0%).
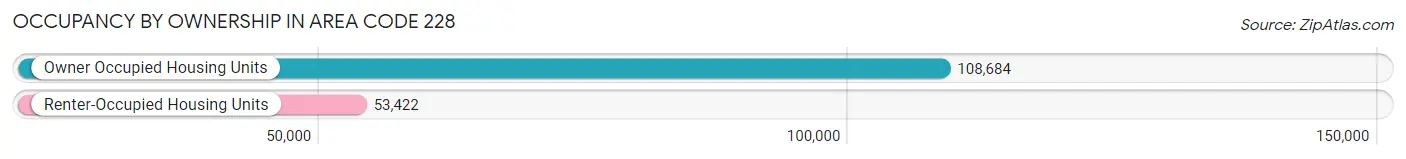
| Occupancy | # Housing Units | % Housing Units |
| Owner Occupied Housing Units | 108,684 | 67.0% |
| Renter-Occupied Housing Units | 53,422 | 33.0% |
| Total Occupied Housing Units | 162,106 | 100.0% |
Occupancy by Household Size in Area Code 228
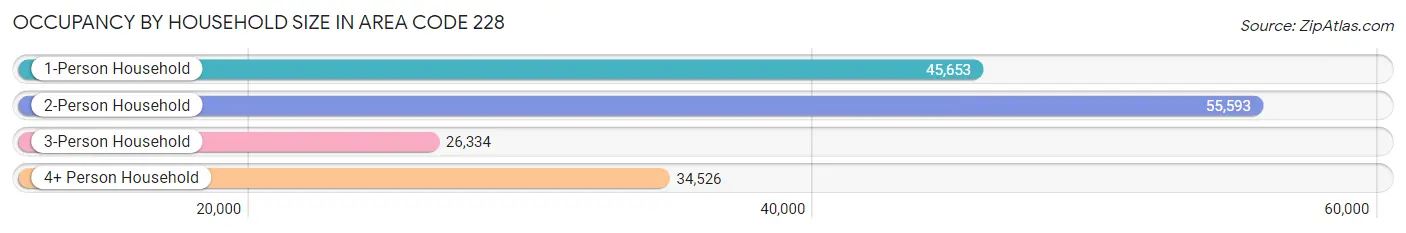
| Household Size | # Housing Units | % Housing Units |
| 1-Person Household | 45,653 | 28.2% |
| 2-Person Household | 55,593 | 34.3% |
| 3-Person Household | 26,334 | 16.2% |
| 4+ Person Household | 34,526 | 21.3% |
| Total Housing Units | 162,106 | 100.0% |
Occupancy by Ownership by Household Size in Area Code 228
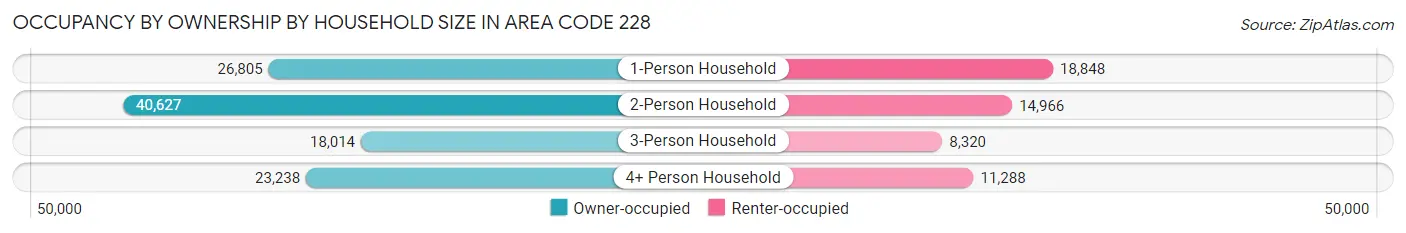
| Household Size | Owner-occupied | Renter-occupied |
| 1-Person Household | 26,805 (58.7%) | 18,848 (41.3%) |
| 2-Person Household | 40,627 (73.1%) | 14,966 (26.9%) |
| 3-Person Household | 18,014 (68.4%) | 8,320 (31.6%) |
| 4+ Person Household | 23,238 (67.3%) | 11,288 (32.7%) |
| Total Housing Units | 108,684 (67.0%) | 53,422 (33.0%) |
Occupancy by Educational Attainment in Area Code 228
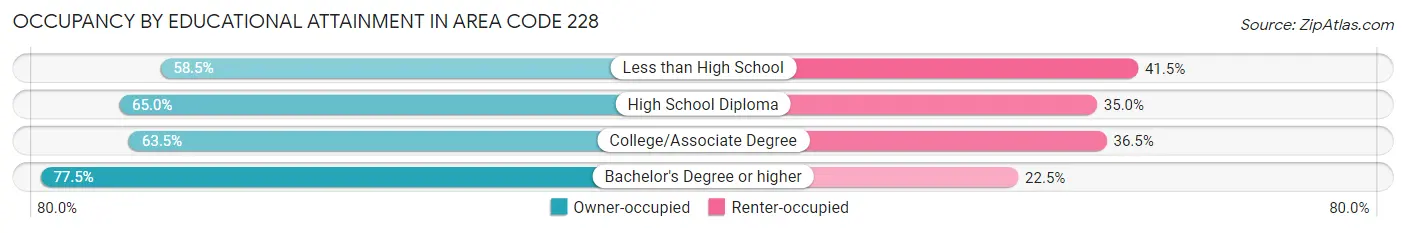
| Household Size | Owner-occupied | Renter-occupied |
| Less than High School | 9,592 (58.5%) | 6,814 (41.5%) |
| High School Diploma | 25,957 (65.0%) | 13,979 (35.0%) |
| College/Associate Degree | 39,898 (63.5%) | 22,969 (36.5%) |
| Bachelor's Degree or higher | 33,237 (77.5%) | 9,660 (22.5%) |
Occupancy by Age of Householder in Area Code 228
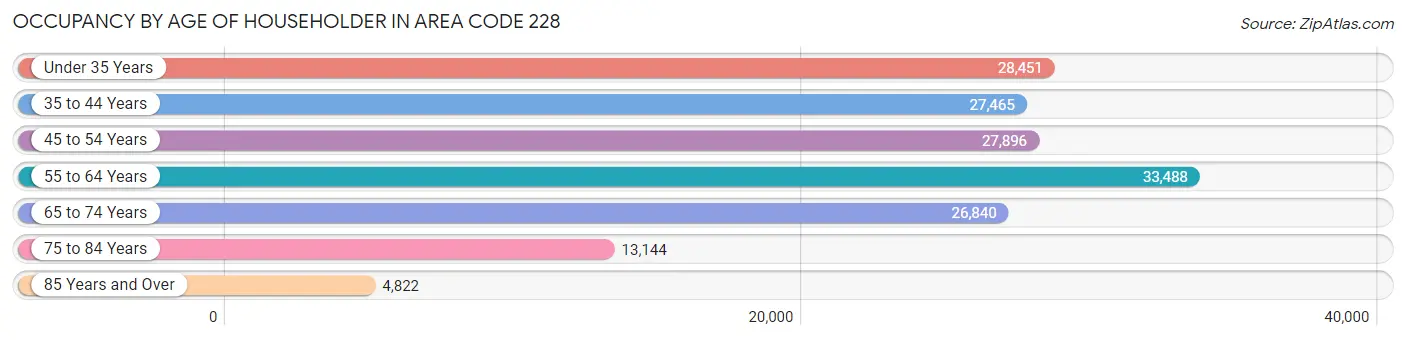
| Age Bracket | # Households | % Households |
| Under 35 Years | 28,451 | 17.5% |
| 35 to 44 Years | 27,465 | 16.9% |
| 45 to 54 Years | 27,896 | 17.2% |
| 55 to 64 Years | 33,488 | 20.7% |
| 65 to 74 Years | 26,840 | 16.6% |
| 75 to 84 Years | 13,144 | 8.1% |
| 85 Years and Over | 4,822 | 3.0% |
| Total | 162,106 | 100.0% |
Housing Finances in Area Code 228
Median Income by Occupancy in Area Code 228
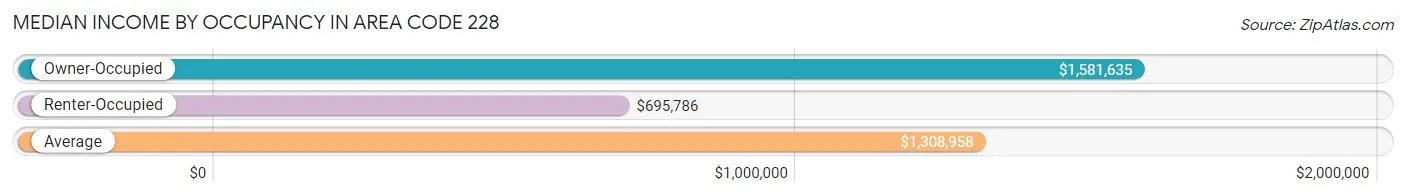
| Occupancy Type | # Households | Median Income |
| Owner-Occupied | 108,684 (67.0%) | $1,581,635 |
| Renter-Occupied | 53,422 (33.0%) | $695,786 |
| Average | 162,106 (100.0%) | $1,308,958 |
Occupancy by Householder Income Bracket in Area Code 228
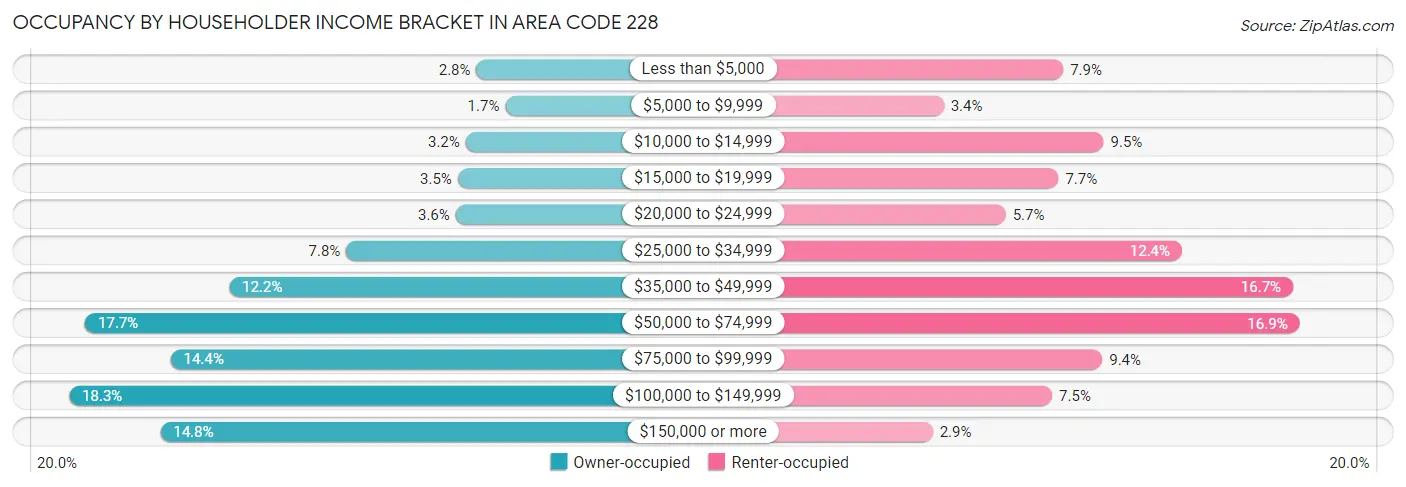
| Income Bracket | Owner-occupied | Renter-occupied |
| Less than $5,000 | 3,034 (2.8%) | 4,226 (7.9%) |
| $5,000 to $9,999 | 1,840 (1.7%) | 1,793 (3.4%) |
| $10,000 to $14,999 | 3,478 (3.2%) | 5,048 (9.5%) |
| $15,000 to $19,999 | 3,801 (3.5%) | 4,131 (7.7%) |
| $20,000 to $24,999 | 3,892 (3.6%) | 3,057 (5.7%) |
| $25,000 to $34,999 | 8,418 (7.7%) | 6,643 (12.4%) |
| $35,000 to $49,999 | 13,268 (12.2%) | 8,898 (16.7%) |
| $50,000 to $74,999 | 19,239 (17.7%) | 9,032 (16.9%) |
| $75,000 to $99,999 | 15,694 (14.4%) | 5,019 (9.4%) |
| $100,000 to $149,999 | 19,897 (18.3%) | 4,002 (7.5%) |
| $150,000 or more | 16,123 (14.8%) | 1,573 (2.9%) |
| Total | 108,684 (100.0%) | 53,422 (100.0%) |
Monthly Housing Cost Tiers in Area Code 228
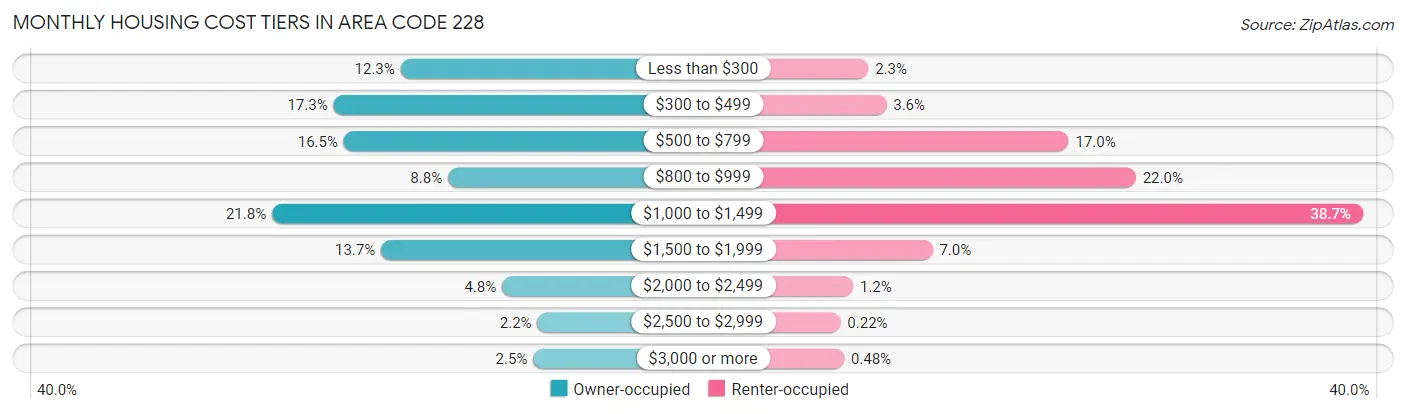
| Monthly Cost | Owner-occupied | Renter-occupied |
| Less than $300 | 13,377 (12.3%) | 1,215 (2.3%) |
| $300 to $499 | 18,751 (17.2%) | 1,924 (3.6%) |
| $500 to $799 | 17,917 (16.5%) | 9,095 (17.0%) |
| $800 to $999 | 9,583 (8.8%) | 11,739 (22.0%) |
| $1,000 to $1,499 | 23,675 (21.8%) | 20,666 (38.7%) |
| $1,500 to $1,999 | 14,936 (13.7%) | 3,740 (7.0%) |
| $2,000 to $2,499 | 5,255 (4.8%) | 615 (1.1%) |
| $2,500 to $2,999 | 2,427 (2.2%) | 116 (0.2%) |
| $3,000 or more | 2,763 (2.5%) | 258 (0.5%) |
| Total | 108,684 (100.0%) | 53,422 (100.0%) |
Physical Housing Characteristics in Area Code 228
Housing Structures in Area Code 228
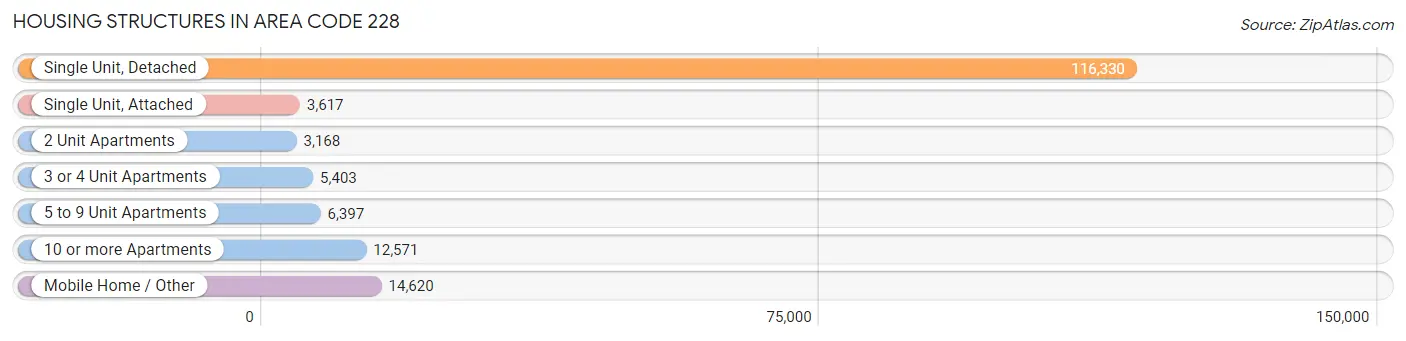
| Structure Type | # Housing Units | % Housing Units |
| Single Unit, Detached | 116,330 | 71.8% |
| Single Unit, Attached | 3,617 | 2.2% |
| 2 Unit Apartments | 3,168 | 1.9% |
| 3 or 4 Unit Apartments | 5,403 | 3.3% |
| 5 to 9 Unit Apartments | 6,397 | 4.0% |
| 10 or more Apartments | 12,571 | 7.7% |
| Mobile Home / Other | 14,620 | 9.0% |
| Total | 162,106 | 100.0% |
Housing Structures by Occupancy in Area Code 228
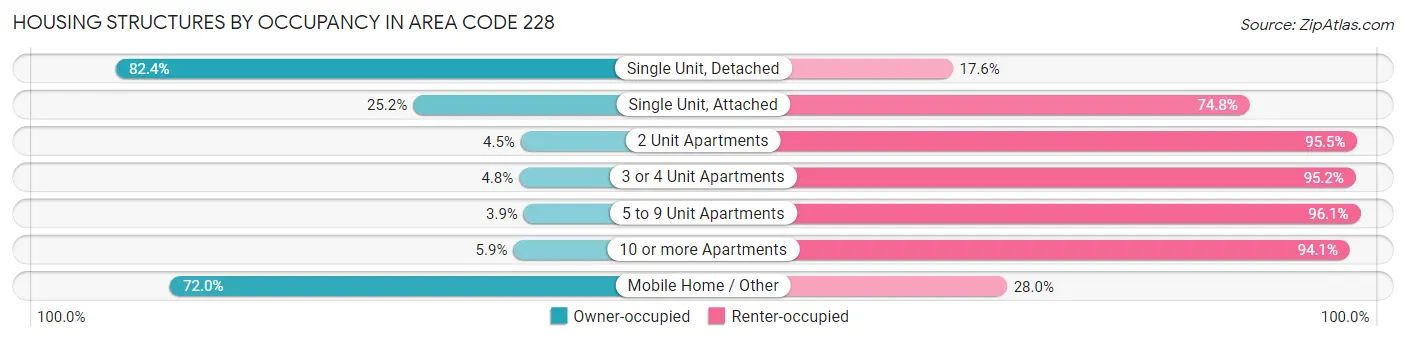
| Structure Type | Owner-occupied | Renter-occupied |
| Single Unit, Detached | 95,855 (82.4%) | 20,475 (17.6%) |
| Single Unit, Attached | 912 (25.2%) | 2,705 (74.8%) |
| 2 Unit Apartments | 142 (4.5%) | 3,026 (95.5%) |
| 3 or 4 Unit Apartments | 259 (4.8%) | 5,144 (95.2%) |
| 5 to 9 Unit Apartments | 250 (3.9%) | 6,147 (96.1%) |
| 10 or more Apartments | 744 (5.9%) | 11,827 (94.1%) |
| Mobile Home / Other | 10,522 (72.0%) | 4,098 (28.0%) |
| Total | 108,684 (67.0%) | 53,422 (33.0%) |
Housing Structures by Number of Rooms in Area Code 228
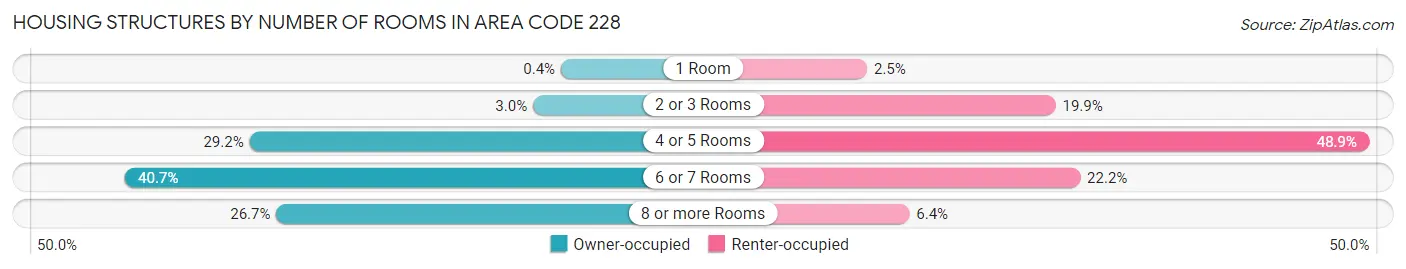
| Number of Rooms | Owner-occupied | Renter-occupied |
| 1 Room | 435 (0.4%) | 1,339 (2.5%) |
| 2 or 3 Rooms | 3,238 (3.0%) | 10,652 (19.9%) |
| 4 or 5 Rooms | 31,736 (29.2%) | 26,128 (48.9%) |
| 6 or 7 Rooms | 44,238 (40.7%) | 11,873 (22.2%) |
| 8 or more Rooms | 29,037 (26.7%) | 3,430 (6.4%) |
| Total | 108,684 (100.0%) | 53,422 (100.0%) |
Housing Structure by Heating Type in Area Code 228
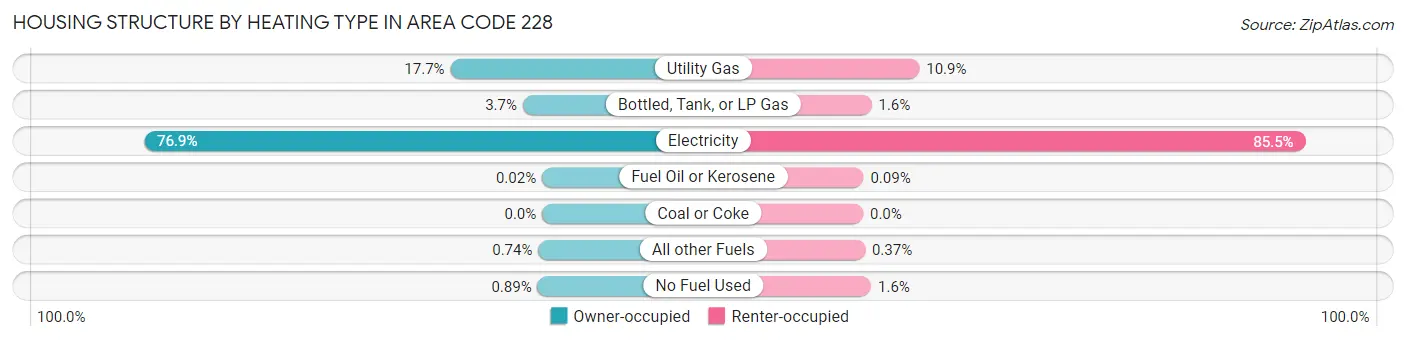
| Heating Type | Owner-occupied | Renter-occupied |
| Utility Gas | 19,258 (17.7%) | 5,806 (10.9%) |
| Bottled, Tank, or LP Gas | 4,050 (3.7%) | 877 (1.6%) |
| Electricity | 83,586 (76.9%) | 45,666 (85.5%) |
| Fuel Oil or Kerosene | 17 (0.0%) | 46 (0.1%) |
| Coal or Coke | 0 (0.0%) | 0 (0.0%) |
| All other Fuels | 809 (0.7%) | 196 (0.4%) |
| No Fuel Used | 964 (0.9%) | 831 (1.6%) |
| Total | 108,684 (100.0%) | 53,422 (100.0%) |
Household Vehicle Usage in Area Code 228
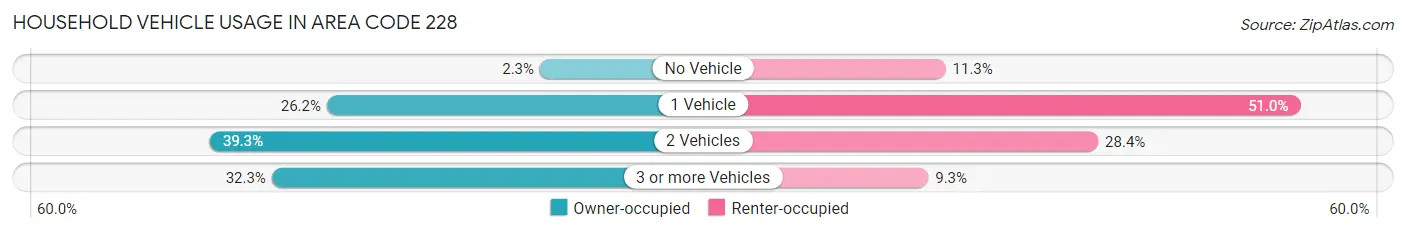
| Vehicles per Household | Owner-occupied | Renter-occupied |
| No Vehicle | 2,482 (2.3%) | 6,026 (11.3%) |
| 1 Vehicle | 28,419 (26.2%) | 27,247 (51.0%) |
| 2 Vehicles | 42,659 (39.3%) | 15,157 (28.4%) |
| 3 or more Vehicles | 35,124 (32.3%) | 4,992 (9.3%) |
| Total | 108,684 (100.0%) | 53,422 (100.0%) |
Real Estate & Mortgages in Area Code 228
Real Estate and Mortgage Overview in Area Code 228
| Characteristic | Without Mortgage | With Mortgage |
| Housing Units | 50,312 | 58,372 |
| Median Property Value | $3,415,000 | $4,256,300 |
| Median Household Income | $1,228,619 | $11,132 |
| Monthly Housing Costs | $9,860 | $2,672 |
| Real Estate Taxes | $22,787 | $6,274 |
Property Value by Mortgage Status in Area Code 228
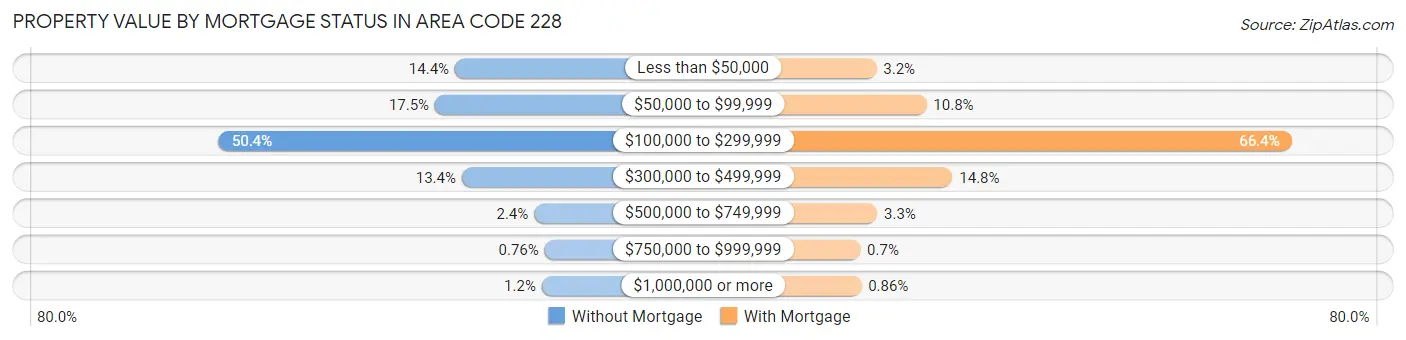
| Property Value | Without Mortgage | With Mortgage |
| Less than $50,000 | 7,262 (14.4%) | 1,853 (3.2%) |
| $50,000 to $99,999 | 8,789 (17.5%) | 6,307 (10.8%) |
| $100,000 to $299,999 | 25,350 (50.4%) | 38,778 (66.4%) |
| $300,000 to $499,999 | 6,734 (13.4%) | 8,612 (14.7%) |
| $500,000 to $749,999 | 1,188 (2.4%) | 1,913 (3.3%) |
| $750,000 to $999,999 | 383 (0.8%) | 407 (0.7%) |
| $1,000,000 or more | 606 (1.2%) | 502 (0.9%) |
| Total | 50,312 (100.0%) | 58,372 (100.0%) |
Household Income by Mortgage Status in Area Code 228
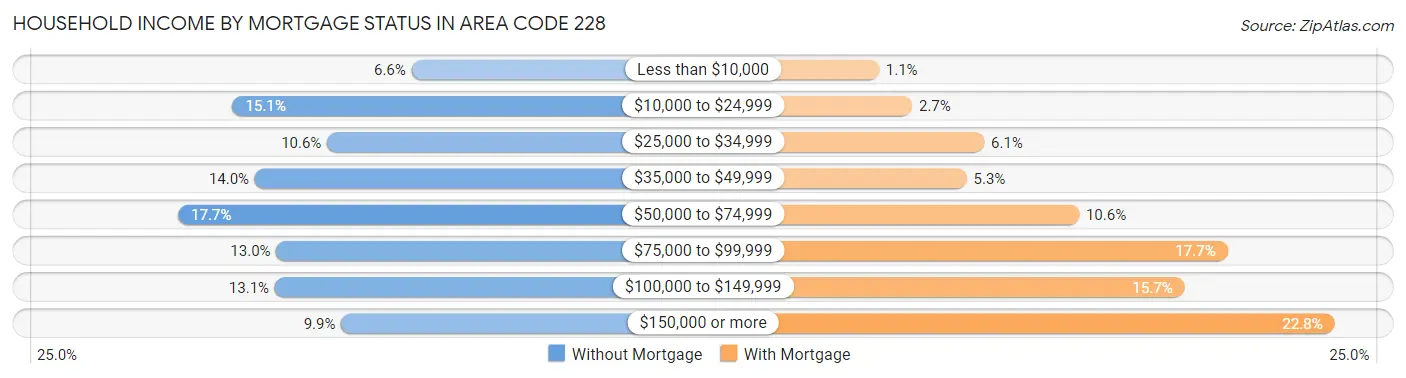
| Household Income | Without Mortgage | With Mortgage |
| Less than $10,000 | 3,304 (6.6%) | 647 (1.1%) |
| $10,000 to $24,999 | 7,596 (15.1%) | 1,570 (2.7%) |
| $25,000 to $34,999 | 5,330 (10.6%) | 3,575 (6.1%) |
| $35,000 to $49,999 | 7,060 (14.0%) | 3,088 (5.3%) |
| $50,000 to $74,999 | 8,902 (17.7%) | 6,208 (10.6%) |
| $75,000 to $99,999 | 6,547 (13.0%) | 10,337 (17.7%) |
| $100,000 to $149,999 | 6,582 (13.1%) | 9,147 (15.7%) |
| $150,000 or more | 4,991 (9.9%) | 13,315 (22.8%) |
| Total | 50,312 (100.0%) | 58,372 (100.0%) |
Property Value to Household Income Ratio in Area Code 228
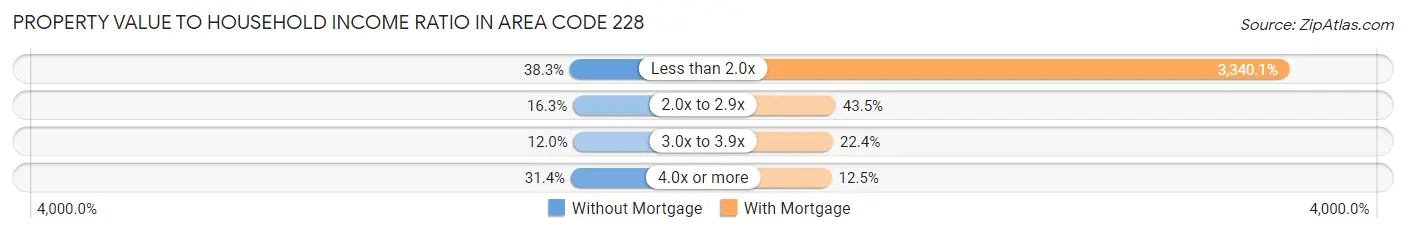
| Value-to-Income Ratio | Without Mortgage | With Mortgage |
| Less than 2.0x | 19,282 (38.3%) | 1,949,678 (3,340.1%) |
| 2.0x to 2.9x | 8,212 (16.3%) | 25,386 (43.5%) |
| 3.0x to 3.9x | 6,021 (12.0%) | 13,090 (22.4%) |
| 4.0x or more | 15,807 (31.4%) | 7,302 (12.5%) |
| Total | 50,312 (100.0%) | 58,372 (100.0%) |
Real Estate Taxes by Mortgage Status in Area Code 228
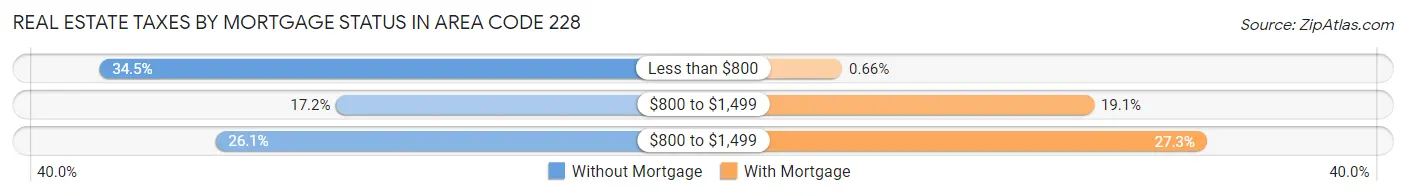
| Property Taxes | Without Mortgage | With Mortgage |
| Less than $800 | 17,378 (34.5%) | 387 (0.7%) |
| $800 to $1,499 | 8,670 (17.2%) | 11,128 (19.1%) |
| $800 to $1,499 | 13,113 (26.1%) | 15,941 (27.3%) |
| Total | 50,312 (100.0%) | 58,372 (100.0%) |
Health & Disability in Area Code 228
Health Insurance Coverage by Age in Area Code 228
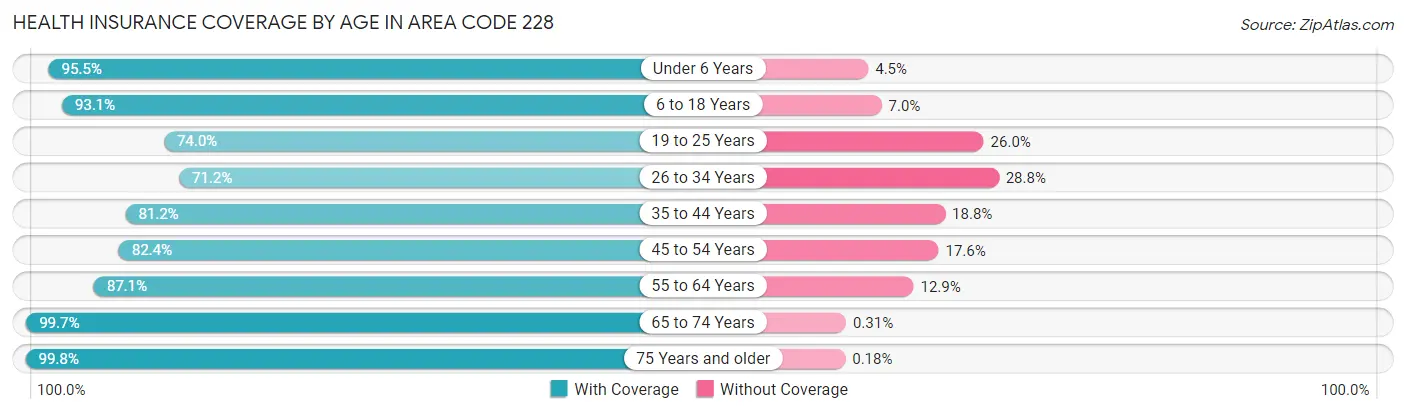
| Age Bracket | With Coverage | Without Coverage |
| Under 6 Years | 29,150 (95.5%) | 1,365 (4.5%) |
| 6 to 18 Years | 66,571 (93.0%) | 4,971 (7.0%) |
| 19 to 25 Years | 24,696 (74.0%) | 8,672 (26.0%) |
| 26 to 34 Years | 33,074 (71.2%) | 13,377 (28.8%) |
| 35 to 44 Years | 40,828 (81.2%) | 9,456 (18.8%) |
| 45 to 54 Years | 42,456 (82.4%) | 9,055 (17.6%) |
| 55 to 64 Years | 48,674 (87.1%) | 7,218 (12.9%) |
| 65 to 74 Years | 41,817 (99.7%) | 132 (0.3%) |
| 75 Years and older | 26,317 (99.8%) | 48 (0.2%) |
| Total | 353,583 (86.7%) | 54,294 (13.3%) |
Health Insurance Coverage by Citizenship Status in Area Code 228
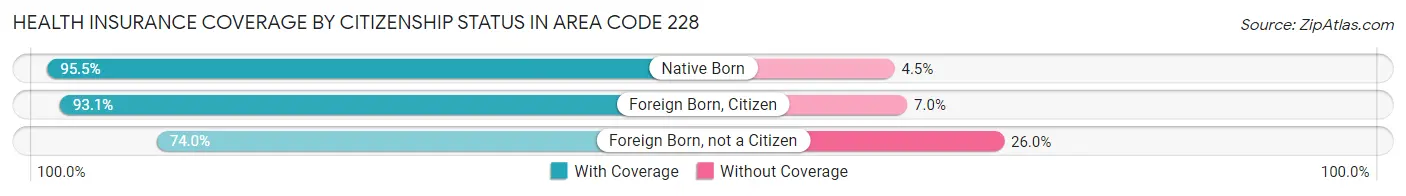
| Citizenship Status | With Coverage | Without Coverage |
| Native Born | 29,150 (95.5%) | 1,365 (4.5%) |
| Foreign Born, Citizen | 66,571 (93.0%) | 4,971 (7.0%) |
| Foreign Born, not a Citizen | 24,696 (74.0%) | 8,672 (26.0%) |
Health Insurance Coverage by Household Income in Area Code 228
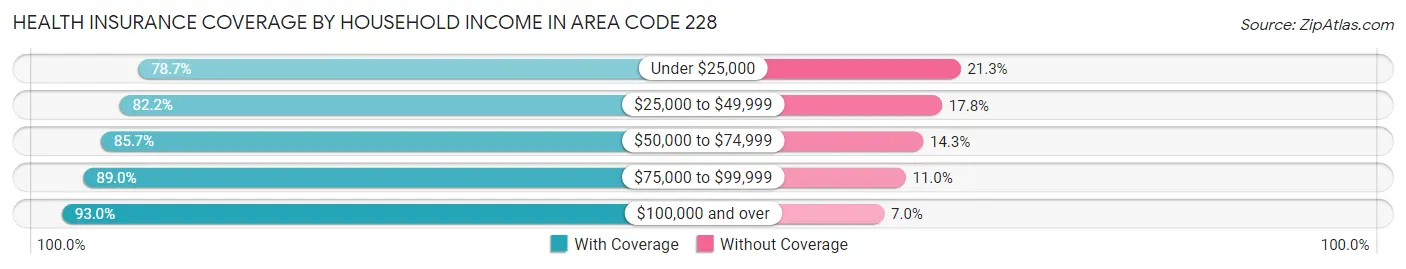
| Household Income | With Coverage | Without Coverage |
| Under $25,000 | 49,860 (78.7%) | 13,483 (21.3%) |
| $25,000 to $49,999 | 67,399 (82.2%) | 14,618 (17.8%) |
| $50,000 to $74,999 | 63,850 (85.7%) | 10,642 (14.3%) |
| $75,000 to $99,999 | 51,626 (89.0%) | 6,385 (11.0%) |
| $100,000 and over | 120,551 (93.0%) | 9,062 (7.0%) |
Public vs Private Health Insurance Coverage by Age in Area Code 228
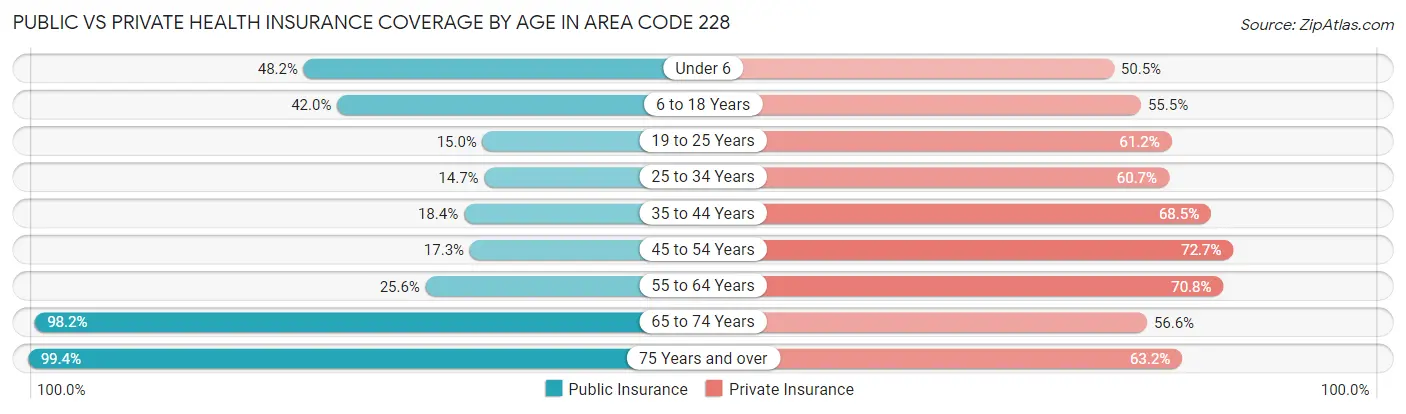
| Age Bracket | Public Insurance | Private Insurance |
| Under 6 | 14,703 (48.2%) | 15,413 (50.5%) |
| 6 to 18 Years | 30,023 (42.0%) | 39,726 (55.5%) |
| 19 to 25 Years | 4,995 (15.0%) | 20,426 (61.2%) |
| 25 to 34 Years | 6,803 (14.6%) | 28,194 (60.7%) |
| 35 to 44 Years | 9,273 (18.4%) | 34,455 (68.5%) |
| 45 to 54 Years | 8,932 (17.3%) | 37,429 (72.7%) |
| 55 to 64 Years | 14,278 (25.6%) | 39,581 (70.8%) |
| 65 to 74 Years | 41,197 (98.2%) | 23,762 (56.6%) |
| 75 Years and over | 26,210 (99.4%) | 16,655 (63.2%) |
| Total | 156,414 (38.4%) | 255,641 (62.7%) |
Disability Status by Sex by Age in Area Code 228
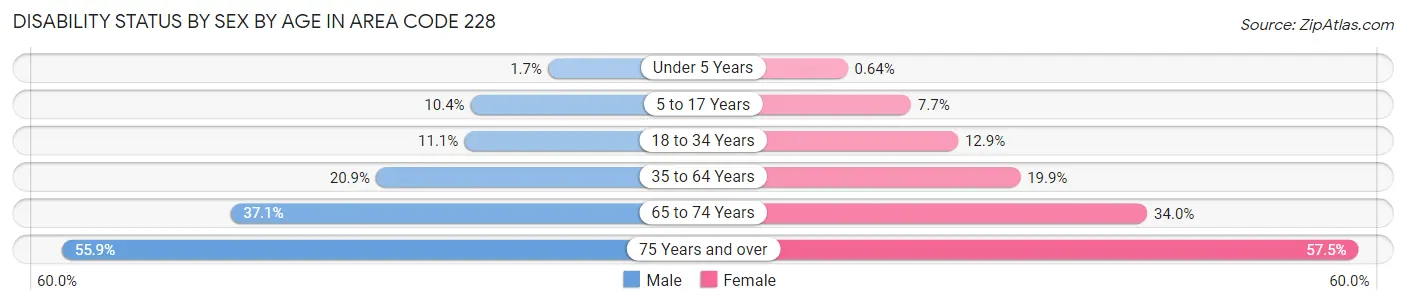
| Age Bracket | Male | Female |
| Under 5 Years | 230 (1.7%) | 76 (0.6%) |
| 5 to 17 Years | 3,788 (10.3%) | 2,717 (7.7%) |
| 18 to 34 Years | 4,537 (11.1%) | 5,654 (12.9%) |
| 35 to 64 Years | 15,788 (20.9%) | 16,311 (19.9%) |
| 65 to 74 Years | 7,272 (37.1%) | 7,599 (34.0%) |
| 75 Years and over | 6,474 (55.8%) | 8,500 (57.5%) |
Disability Class by Sex by Age in Area Code 228
Disability Class: Hearing Difficulty
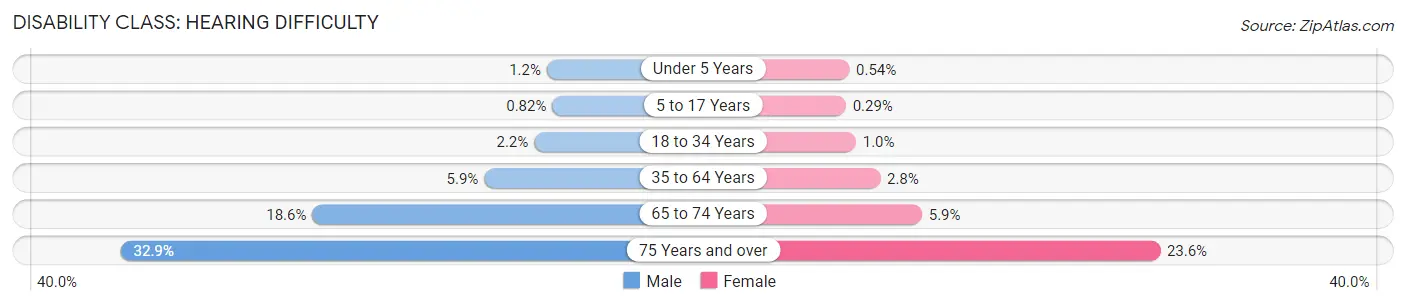
| Age Bracket | Male | Female |
| Under 5 Years | 163 (1.2%) | 64 (0.5%) |
| 5 to 17 Years | 299 (0.8%) | 101 (0.3%) |
| 18 to 34 Years | 891 (2.2%) | 453 (1.0%) |
| 35 to 64 Years | 4,448 (5.9%) | 2,328 (2.8%) |
| 65 to 74 Years | 3,655 (18.6%) | 1,326 (5.9%) |
| 75 Years and over | 3,810 (32.9%) | 3,489 (23.6%) |
Disability Class: Vision Difficulty
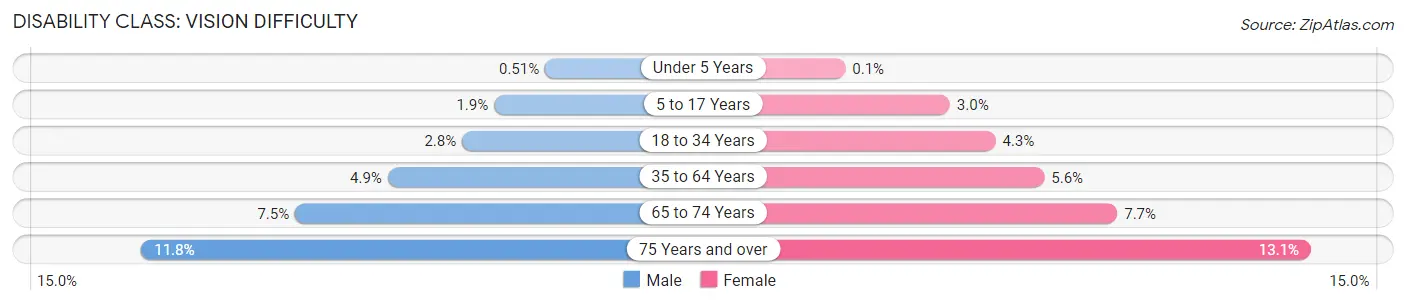
| Age Bracket | Male | Female |
| Under 5 Years | 67 (0.5%) | 12 (0.1%) |
| 5 to 17 Years | 707 (1.9%) | 1,061 (3.0%) |
| 18 to 34 Years | 1,159 (2.8%) | 1,869 (4.3%) |
| 35 to 64 Years | 3,698 (4.9%) | 4,631 (5.6%) |
| 65 to 74 Years | 1,465 (7.5%) | 1,713 (7.7%) |
| 75 Years and over | 1,362 (11.7%) | 1,929 (13.1%) |
Disability Class: Cognitive Difficulty
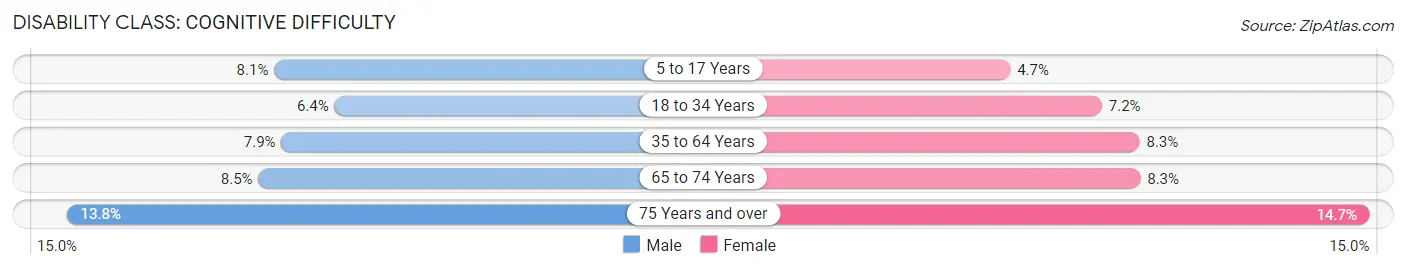
| Age Bracket | Male | Female |
| 5 to 17 Years | 2,947 (8.1%) | 1,657 (4.7%) |
| 18 to 34 Years | 2,617 (6.4%) | 3,165 (7.2%) |
| 35 to 64 Years | 5,937 (7.9%) | 6,806 (8.3%) |
| 65 to 74 Years | 1,664 (8.5%) | 1,856 (8.3%) |
| 75 Years and over | 1,599 (13.8%) | 2,168 (14.7%) |
Disability Class: Ambulatory Difficulty
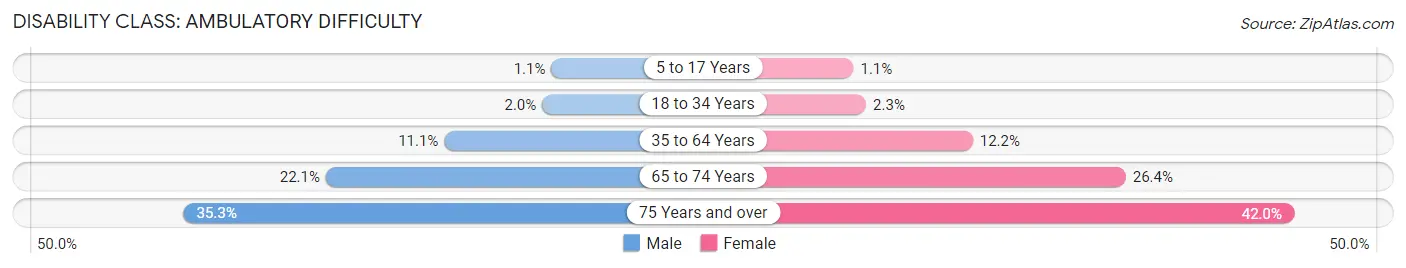
| Age Bracket | Male | Female |
| 5 to 17 Years | 410 (1.1%) | 385 (1.1%) |
| 18 to 34 Years | 811 (2.0%) | 989 (2.3%) |
| 35 to 64 Years | 8,363 (11.1%) | 9,983 (12.2%) |
| 65 to 74 Years | 4,323 (22.1%) | 5,889 (26.4%) |
| 75 Years and over | 4,086 (35.2%) | 6,197 (41.9%) |
Disability Class: Self-Care Difficulty
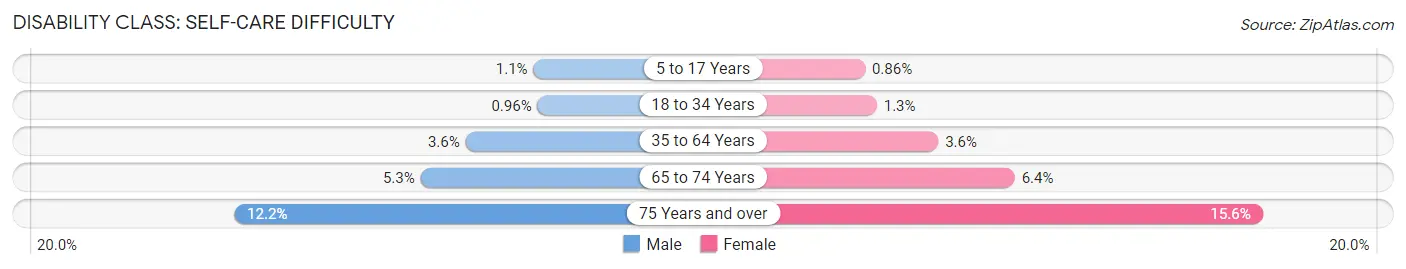
| Age Bracket | Male | Female |
| 5 to 17 Years | 407 (1.1%) | 303 (0.9%) |
| 18 to 34 Years | 396 (1.0%) | 568 (1.3%) |
| 35 to 64 Years | 2,746 (3.6%) | 2,936 (3.6%) |
| 65 to 74 Years | 1,039 (5.3%) | 1,435 (6.4%) |
| 75 Years and over | 1,416 (12.2%) | 2,308 (15.6%) |
Technology Access in Area Code 228
Computing Device Access in Area Code 228
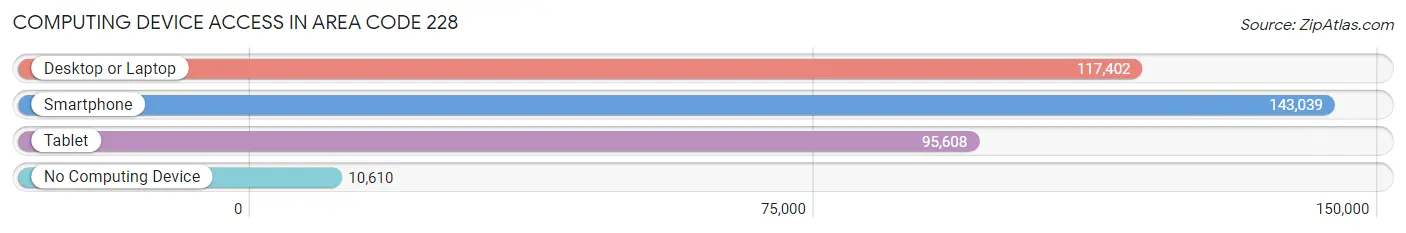
| Device Type | # Households | % Households |
| Desktop or Laptop | 117,402 | 72.4% |
| Smartphone | 143,039 | 88.2% |
| Tablet | 95,608 | 59.0% |
| No Computing Device | 10,610 | 6.6% |
| Total | 162,106 | 100.0% |
Internet Access in Area Code 228
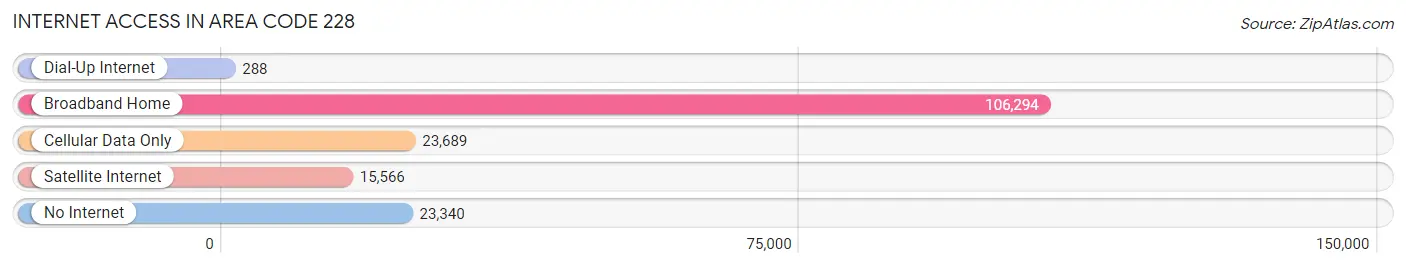
| Internet Type | # Households | % Households |
| Dial-Up Internet | 288 | 0.2% |
| Broadband Home | 106,294 | 65.6% |
| Cellular Data Only | 23,689 | 14.6% |
| Satellite Internet | 15,566 | 9.6% |
| No Internet | 23,340 | 14.4% |
| Total | 162,106 | 100.0% |
Area Code 228 Summary
Geography
Area code 228 is a telephone area code in the North American Numbering Plan (NANP) for the Mississippi Gulf Coast, including the cities of Biloxi, Gulfport, Pascagoula, and Ocean Springs. It was created in 1998 as a split from area code 601.
Social
Area code 228 is a vibrant and diverse area, with a wide range of cultural and recreational activities. The area is home to a number of popular tourist attractions, including the Gulf Islands National Seashore, the Biloxi Lighthouse, and the Mississippi Coast Coliseum.
Economics
Area code 228 is an important economic hub for the state of Mississippi. The area is home to a number of major employers, including Ingalls Shipbuilding, Chevron, and the Keesler Air Force Base. The area is also home to a number of casinos, which provide a significant source of revenue for the region.
Demographics
Area code 228 is home to a diverse population, with a mix of African American, Caucasian, and Hispanic residents. The area has a median household income of $45,000, and a poverty rate of 17.5%. The area is also home to a number of universities and colleges, including the University of Southern Mississippi and Mississippi Gulf Coast Community College.
Common Questions
What is Per Capita Income in Area Code 228?
Per Capita income in Area Code 228 is $30,364.
What is the Median Family Income in Area Code 228?
Median Family Income in Area Code 228 is $70,518.
What is the Median Household income in Area Code 228?
Median Household Income in Area Code 228 is $56,911.
What is Income or Wage Gap in Area Code 228?
Income or Wage Gap in Area Code 228 is 32.0%.
Women in Area Code 228 earn 68.0 cents for every dollar earned by a man.
What is Family Income Deficit in Area Code 228?
Family Income Deficit in Area Code 228 is $10,902.
Families that are below poverty line in Area Code 228 earn $10,902 less on average than the poverty threshold level.
What is Inequality or Gini Index in Area Code 228?
Inequality or Gini Index in Area Code 228 is 10.53.
What is the Total Population of Area Code 228?
Total Population of Area Code 228 is 418,601.
What is the Total Male Population of Area Code 228?
Total Male Population of Area Code 228 is 205,801.
What is the Total Female Population of Area Code 228?
Total Female Population of Area Code 228 is 212,800.
What is the Ratio of Males per 100 Females in Area Code 228?
There are 96.71 Males per 100 Females in Area Code 228.
What is the Ratio of Females per 100 Males in Area Code 228?
There are 103.40 Females per 100 Males in Area Code 228.
What is the Median Population Age in Area Code 228?
Median Population Age in Area Code 228 is 39.1 Years.
What is the Average Family Size in Area Code 228
Average Family Size in Area Code 228 is 3.1 People.
What is the Average Household Size in Area Code 228
Average Household Size in Area Code 228 is 2.5 People.
How Large is the Labor Force in Area Code 228?
There are 205,434 People in the Labor Forcein in Area Code 228.
What is the Percentage of People in the Labor Force in Area Code 228?
61.7% of People are in the Labor Force in Area Code 228.
What is the Unemployment Rate in Area Code 228?
Unemployment Rate in Area Code 228 is 8.0%.