Area Code 662 Map & Demographics
Area Code 662 Map
Area Code 662 Overview
$25,641
PER CAPITA INCOME
$59,828
AVG FAMILY INCOME
$47,218
AVG HOUSEHOLD INCOME
27.6%
WAGE / INCOME GAP [ % ]
72.4¢/ $1
WAGE / INCOME GAP [ $ ]
$11,939
FAMILY INCOME DEFICIT
94.32
INEQUALITY / GINI INDEX
1,156,870
TOTAL POPULATION
565,520
MALE POPULATION
591,350
FEMALE POPULATION
95.63
MALES / 100 FEMALES
104.57
FEMALES / 100 MALES
40.5
MEDIAN AGE
3.3
AVG FAMILY SIZE
2.5
AVG HOUSEHOLD SIZE
485,910
LABOR FORCE [ PEOPLE ]
52.9%
PERCENT IN LABOR FORCE
8.4%
UNEMPLOYMENT RATE
Income in Area Code 662
Income Overview in Area Code 662
Per Capita Income in Area Code 662 is $25,641, while median incomes of families and households are $59,828 and $47,218 respectively.
| Characteristic | Number | Measure |
| Per Capita Income | 1,156,870 | $25,641 |
| Median Family Income | 286,871 | $59,828 |
| Mean Family Income | 286,871 | $14,945,692 |
| Median Household Income | 435,858 | $47,218 |
| Mean Household Income | 435,858 | $13,474,137 |
| Income Deficit | 286,871 | $11,939 |
| Wage / Income Gap (%) | 1,156,870 | 27.63% |
| Wage / Income Gap ($) | 1,156,870 | 72.37¢ per $1 |
| Gini / Inequality Index | 1,156,870 | 94.32 |
Earnings by Sex in Area Code 662
Average Earnings in Area Code 662 are $32,708, $38,223 for men and $28,195 for women, a difference of 26.2%.
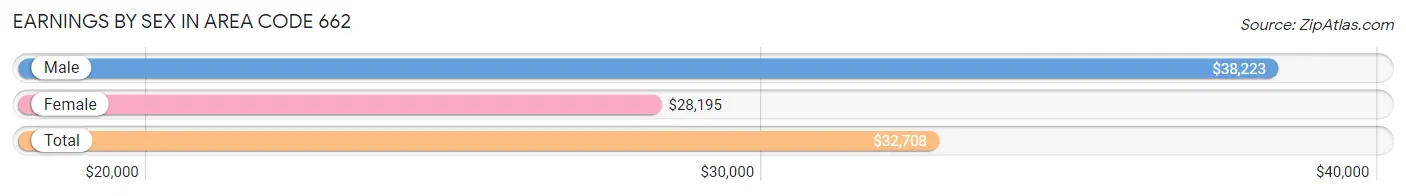
| Sex | Number | Average Earnings |
| Male | 279,255 (51.4%) | $38,223 |
| Female | 263,841 (48.6%) | $28,195 |
| Total | 543,096 (100.0%) | $32,708 |
Earnings by Sex by Income Bracket in Area Code 662
The most common earnings brackets in Area Code 662 are $100,000+ for men (30,659 | 11.0%) and $25,000 to $29,999 for women (21,867 | 8.3%).
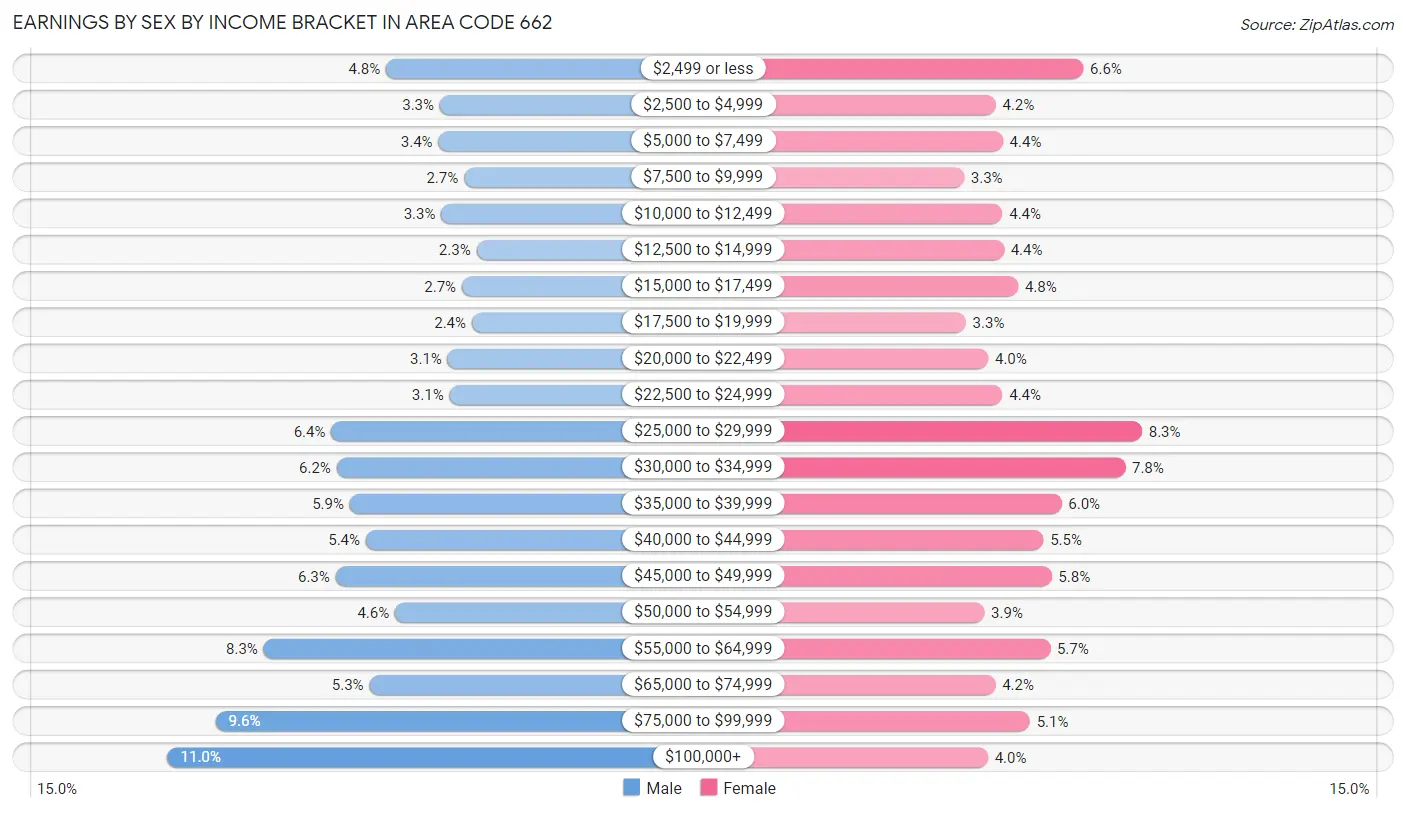
| Income | Male | Female |
| $2,499 or less | 13,509 (4.8%) | 17,528 (6.6%) |
| $2,500 to $4,999 | 9,299 (3.3%) | 11,032 (4.2%) |
| $5,000 to $7,499 | 9,412 (3.4%) | 11,558 (4.4%) |
| $7,500 to $9,999 | 7,403 (2.6%) | 8,681 (3.3%) |
| $10,000 to $12,499 | 9,199 (3.3%) | 11,522 (4.4%) |
| $12,500 to $14,999 | 6,414 (2.3%) | 11,628 (4.4%) |
| $15,000 to $17,499 | 7,568 (2.7%) | 12,693 (4.8%) |
| $17,500 to $19,999 | 6,798 (2.4%) | 8,805 (3.3%) |
| $20,000 to $22,499 | 8,675 (3.1%) | 10,473 (4.0%) |
| $22,500 to $24,999 | 8,534 (3.1%) | 11,532 (4.4%) |
| $25,000 to $29,999 | 17,812 (6.4%) | 21,867 (8.3%) |
| $30,000 to $34,999 | 17,399 (6.2%) | 20,645 (7.8%) |
| $35,000 to $39,999 | 16,364 (5.9%) | 15,903 (6.0%) |
| $40,000 to $44,999 | 15,114 (5.4%) | 14,566 (5.5%) |
| $45,000 to $49,999 | 17,474 (6.3%) | 15,167 (5.8%) |
| $50,000 to $54,999 | 12,815 (4.6%) | 10,183 (3.9%) |
| $55,000 to $64,999 | 23,110 (8.3%) | 15,059 (5.7%) |
| $65,000 to $74,999 | 14,817 (5.3%) | 10,989 (4.2%) |
| $75,000 to $99,999 | 26,880 (9.6%) | 13,572 (5.1%) |
| $100,000+ | 30,659 (11.0%) | 10,438 (4.0%) |
| Total | 279,255 (100.0%) | 263,841 (100.0%) |
Earnings by Sex by Educational Attainment in Area Code 662
Average earnings in Area Code 662 are $7,961,201 for men and $5,691,548 for women, a difference of 28.5%. Men with an educational attainment of college or associate's degree enjoy the highest average annual earnings of $7,207,430, while those with less than high school education earn the least with $3,400,922. Women with an educational attainment of graduate degree earn the most with the average annual earnings of $6,064,091, while those with less than high school education have the smallest earnings of $1,664,686.
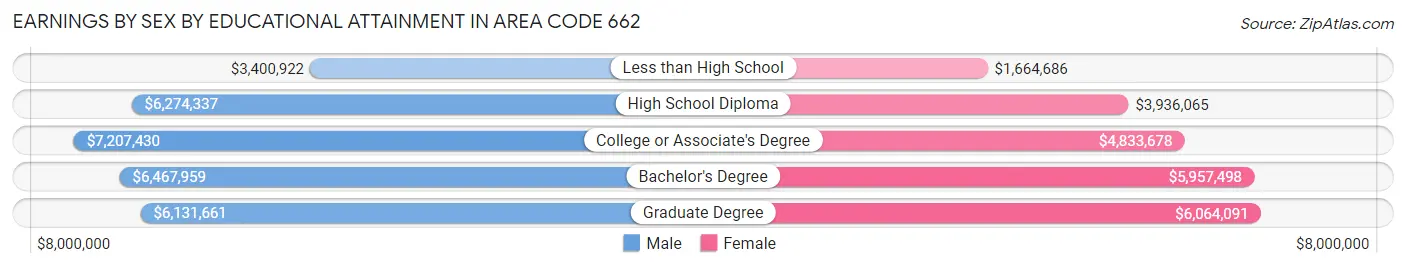
| Educational Attainment | Male Income | Female Income |
| Less than High School | $3,400,922 | $1,664,686 |
| High School Diploma | $6,274,337 | $3,936,065 |
| College or Associate's Degree | $7,207,430 | $4,833,678 |
| Bachelor's Degree | $6,467,959 | $5,957,498 |
| Graduate Degree | $6,131,661 | $6,064,091 |
| Total | $7,961,201 | $5,691,548 |
Family Income in Area Code 662
Family Income Brackets in Area Code 662
According to the Area Code 662 family income data, there are 12,591,055 families falling into the $50,000 to $74,999 income range, which is the most common income bracket and makes up 4,389.1% of all families. Conversely, the $200,000+ income bracket is the least frequent group with only 2,193,989 families (764.8%) belonging to this category.
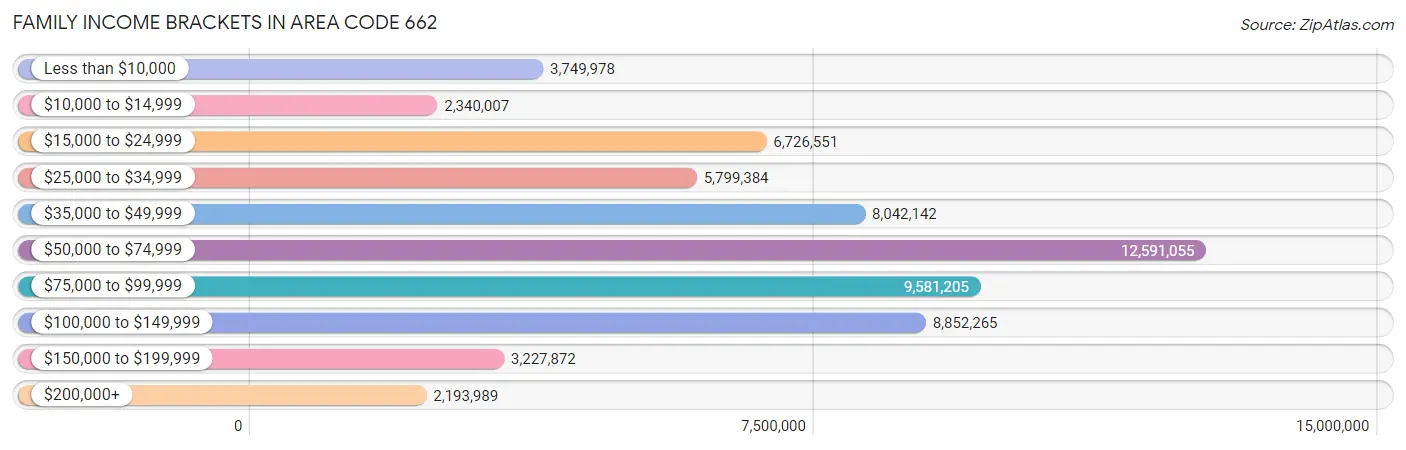
| Income Bracket | # Families | % Families |
| Less than $10,000 | 3,749,978 | 1,307.2% |
| $10,000 to $14,999 | 2,340,007 | 815.7% |
| $15,000 to $24,999 | 6,726,551 | 2,344.8% |
| $25,000 to $34,999 | 5,799,384 | 2,021.6% |
| $35,000 to $49,999 | 8,042,142 | 2,803.4% |
| $50,000 to $74,999 | 12,591,055 | 4,389.1% |
| $75,000 to $99,999 | 9,581,205 | 3,339.9% |
| $100,000 to $149,999 | 8,852,265 | 3,085.8% |
| $150,000 to $199,999 | 3,227,872 | 1,125.2% |
| $200,000+ | 2,193,989 | 764.8% |
Family Income by Famaliy Size in Area Code 662
7+ person families (4,341 | 1.5%) account for the highest median family income in Area Code 662 with $96,613 per family, while 2-person families (137,700 | 48.0%) have the highest median income of $27,098 per family member.
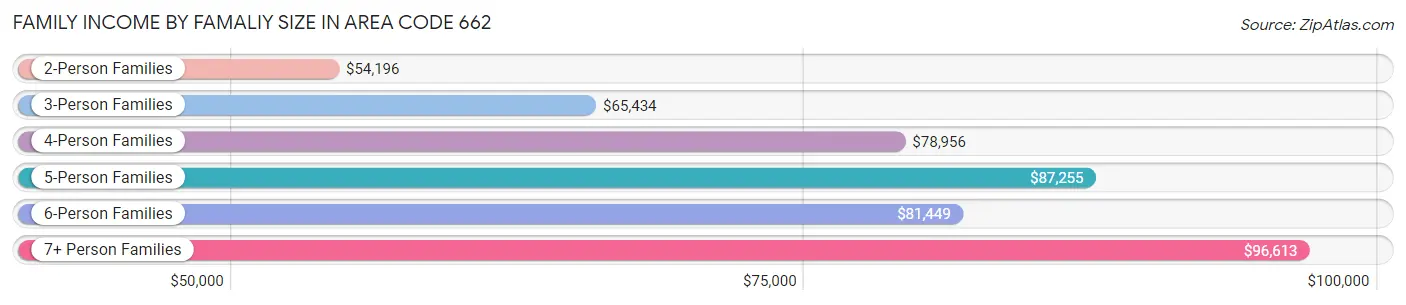
| Income Bracket | # Families | Median Income |
| 2-Person Families | 137,700 (48.0%) | $54,196 |
| 3-Person Families | 67,453 (23.5%) | $65,434 |
| 4-Person Families | 47,571 (16.6%) | $78,956 |
| 5-Person Families | 23,130 (8.1%) | $87,255 |
| 6-Person Families | 6,676 (2.3%) | $81,449 |
| 7+ Person Families | 4,341 (1.5%) | $96,613 |
| Total | 286,871 (100.0%) | $59,828 |
Family Income by Number of Earners in Area Code 662
The median family income in Area Code 662 is $59,828, with families comprising 3+ earners (25,008) having the highest median family income of $122,811, while families with no earners (52,588) have the lowest median family income of $32,354, accounting for 8.7% and 18.3% of families, respectively.
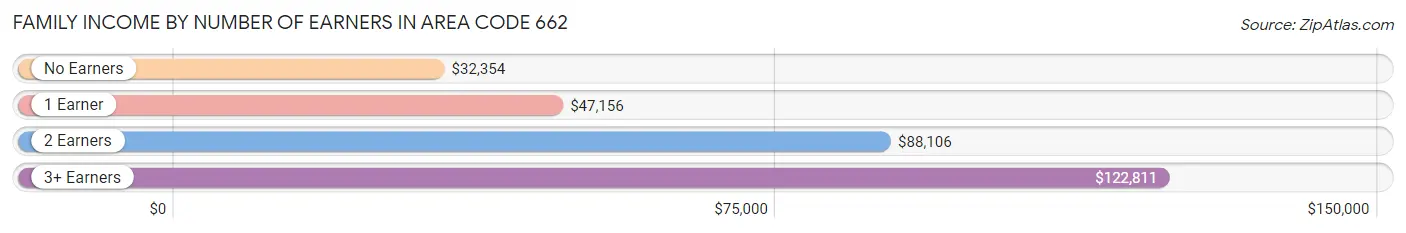
| Number of Earners | # Families | Median Income |
| No Earners | 52,588 (18.3%) | $32,354 |
| 1 Earner | 101,733 (35.5%) | $47,156 |
| 2 Earners | 107,542 (37.5%) | $88,106 |
| 3+ Earners | 25,008 (8.7%) | $122,811 |
| Total | 286,871 (100.0%) | $59,828 |
Household Income in Area Code 662
Household Income Brackets in Area Code 662
With 16,777,046 households falling in the category, the $50,000 to $74,999 income range is the most frequent in Area Code 662, accounting for 3,849.2% of all households. In contrast, only 2,646,966 households (607.3%) fall into the $200,000+ income bracket, making it the least populous group.
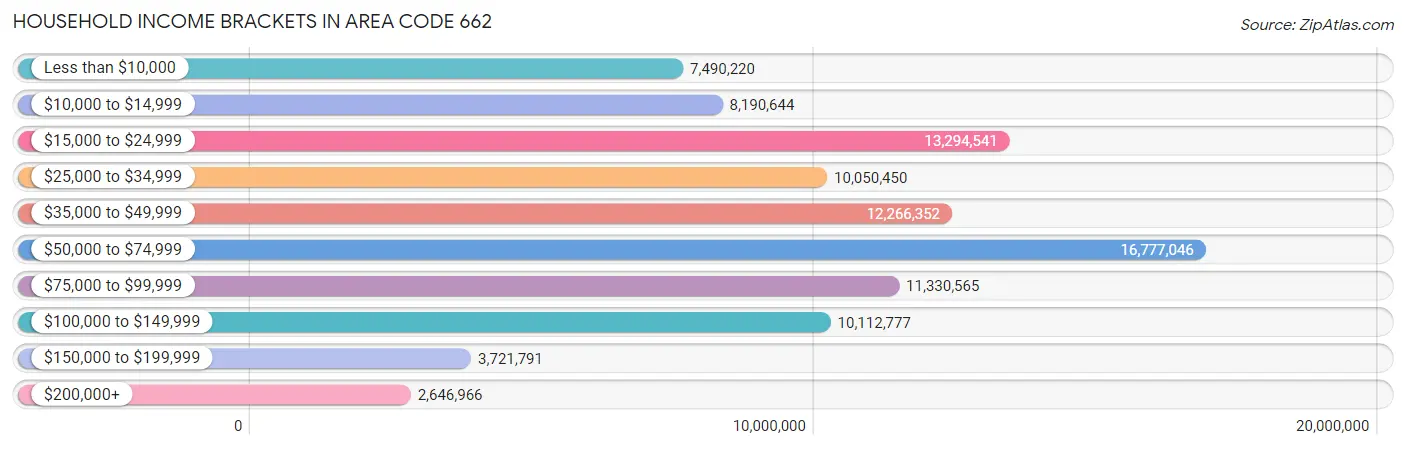
| Income Bracket | # Households | % Households |
| Less than $10,000 | 7,490,220 | 1,718.5% |
| $10,000 to $14,999 | 8,190,644 | 1,879.2% |
| $15,000 to $24,999 | 13,294,541 | 3,050.2% |
| $25,000 to $34,999 | 10,050,450 | 2,305.9% |
| $35,000 to $49,999 | 12,266,352 | 2,814.3% |
| $50,000 to $74,999 | 16,777,046 | 3,849.2% |
| $75,000 to $99,999 | 11,330,565 | 2,599.6% |
| $100,000 to $149,999 | 10,112,777 | 2,320.2% |
| $150,000 to $199,999 | 3,721,791 | 853.9% |
| $200,000+ | 2,646,966 | 607.3% |
Household Income by Householder Age in Area Code 662
The median household income in Area Code 662 is $47,218, with the highest median household income of $57,240 found in the 25 to 44 years age bracket for the primary householder. A total of 133,876 households (30.7%) fall into this category. Meanwhile, the 65+ years age bracket for the primary householder has the lowest median household income of $38,287, with 120,112 households (27.6%) in this group.
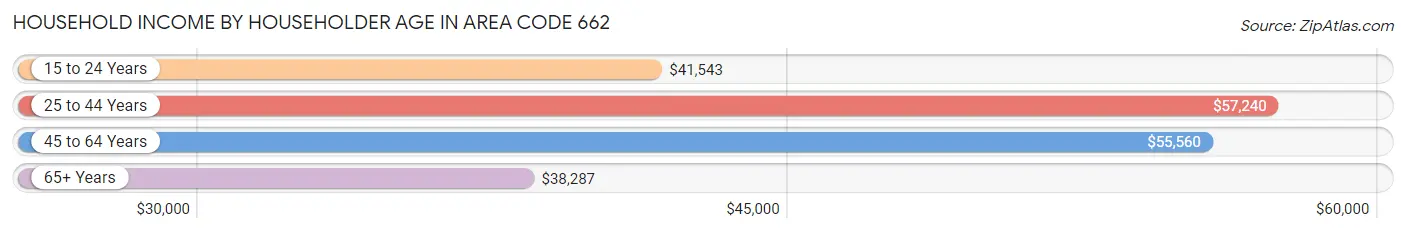
| Income Bracket | # Households | Median Income |
| 15 to 24 Years | 20,053 (4.6%) | $41,543 |
| 25 to 44 Years | 133,876 (30.7%) | $57,240 |
| 45 to 64 Years | 161,817 (37.1%) | $55,560 |
| 65+ Years | 120,112 (27.6%) | $38,287 |
| Total | 435,858 (100.0%) | $47,218 |
Poverty in Area Code 662
Income Below Poverty by Sex and Age in Area Code 662
With 18.0% poverty level for males and 21.5% for females among the residents of Area Code 662, 5 year old males and 18 to 24 year old females are the most vulnerable to poverty, with 2,382 males (32.4%) and 17,114 females (32.9%) in their respective age groups living below the poverty level.
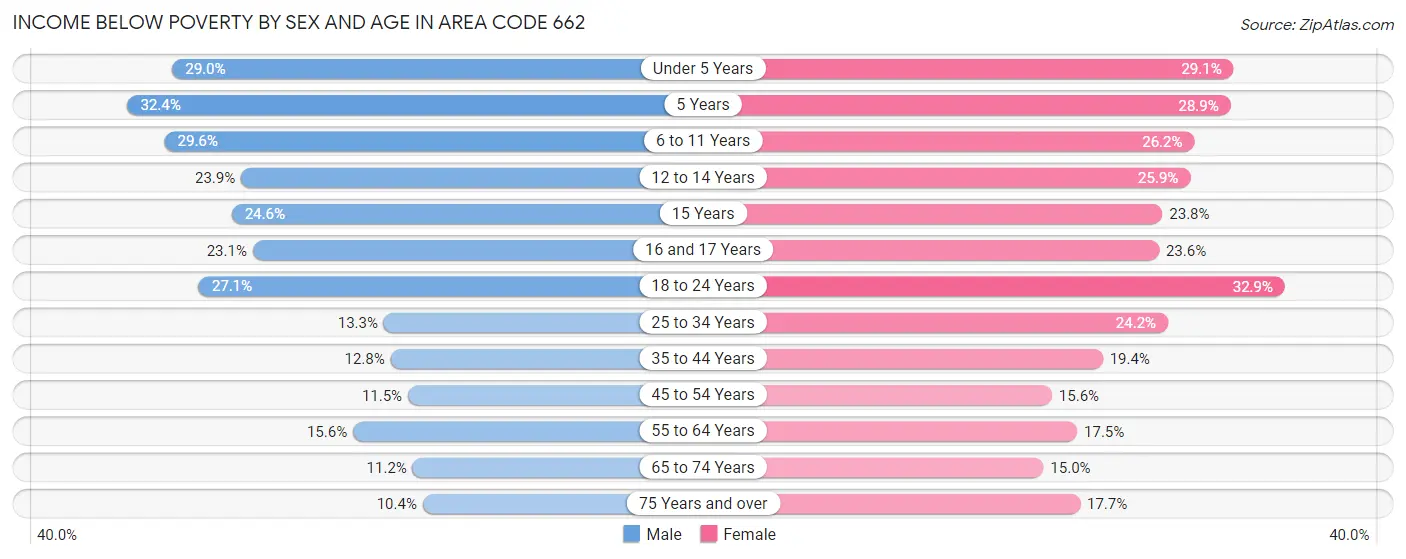
| Age Bracket | Male | Female |
| Under 5 Years | 9,902 (29.0%) | 9,614 (29.1%) |
| 5 Years | 2,382 (32.4%) | 2,138 (28.9%) |
| 6 to 11 Years | 13,452 (29.6%) | 10,981 (26.2%) |
| 12 to 14 Years | 5,630 (23.9%) | 6,043 (25.9%) |
| 15 Years | 2,039 (24.6%) | 1,957 (23.8%) |
| 16 and 17 Years | 3,604 (23.1%) | 3,598 (23.5%) |
| 18 to 24 Years | 15,333 (27.1%) | 17,114 (32.9%) |
| 25 to 34 Years | 9,325 (13.3%) | 17,523 (24.2%) |
| 35 to 44 Years | 8,511 (12.8%) | 13,813 (19.4%) |
| 45 to 54 Years | 7,445 (11.5%) | 11,183 (15.6%) |
| 55 to 64 Years | 10,494 (15.6%) | 13,014 (17.5%) |
| 65 to 74 Years | 5,685 (11.2%) | 8,878 (15.0%) |
| 75 Years and over | 2,811 (10.4%) | 7,495 (17.7%) |
| Total | 96,613 (18.0%) | 123,351 (21.5%) |
Income Above Poverty by Sex and Age in Area Code 662
According to the poverty statistics in Area Code 662, males aged 75 years and over and females aged 65 to 74 years are the age groups that are most secure financially, with 89.6% of males and 85.0% of females in these age groups living above the poverty line.
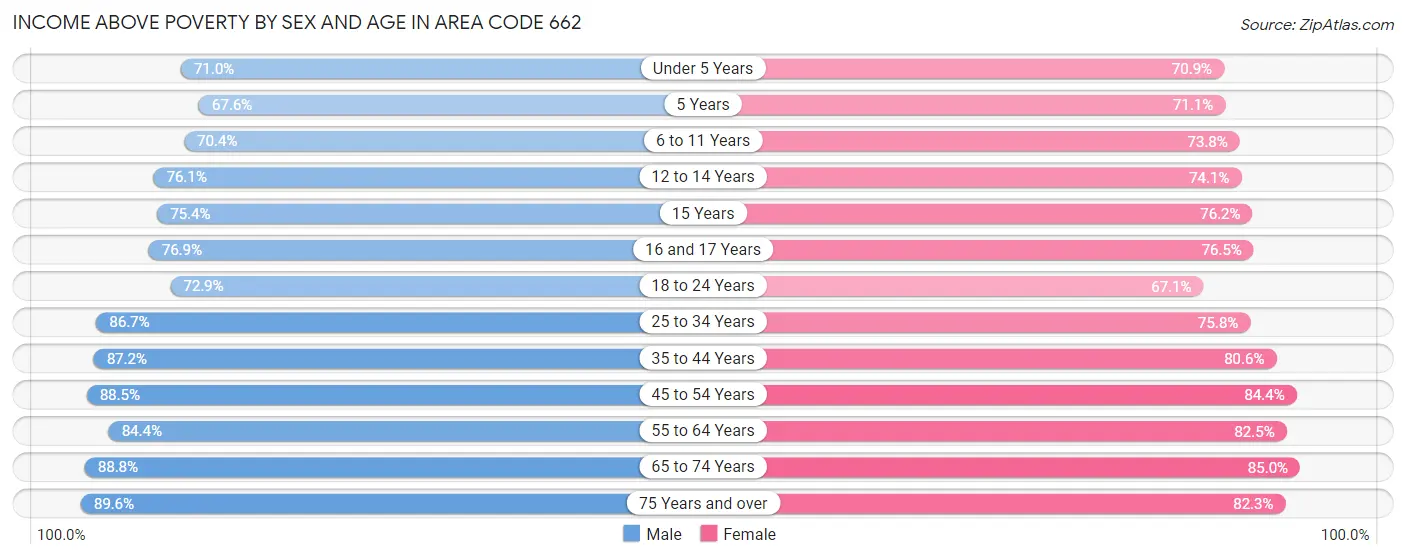
| Age Bracket | Male | Female |
| Under 5 Years | 24,203 (71.0%) | 23,447 (70.9%) |
| 5 Years | 4,979 (67.6%) | 5,269 (71.1%) |
| 6 to 11 Years | 32,000 (70.4%) | 30,977 (73.8%) |
| 12 to 14 Years | 17,899 (76.1%) | 17,327 (74.1%) |
| 15 Years | 6,243 (75.4%) | 6,266 (76.2%) |
| 16 and 17 Years | 12,026 (76.9%) | 11,681 (76.4%) |
| 18 to 24 Years | 41,330 (72.9%) | 34,913 (67.1%) |
| 25 to 34 Years | 60,631 (86.7%) | 54,852 (75.8%) |
| 35 to 44 Years | 57,811 (87.2%) | 57,503 (80.6%) |
| 45 to 54 Years | 57,060 (88.5%) | 60,516 (84.4%) |
| 55 to 64 Years | 56,704 (84.4%) | 61,490 (82.5%) |
| 65 to 74 Years | 45,122 (88.8%) | 50,415 (85.0%) |
| 75 Years and over | 24,106 (89.6%) | 34,862 (82.3%) |
| Total | 440,114 (82.0%) | 449,518 (78.5%) |
Income Below Poverty Among Married-Couple Families in Area Code 662
The poverty statistics for married-couple families in Area Code 662 show that 5.6% or 10,617 of the total 189,938 families live below the poverty line. Families with 5 or more children have the highest poverty rate of 26.3%, comprising of 305 families. On the other hand, families with no children have the lowest poverty rate of 4.4%, which includes 5,069 families.
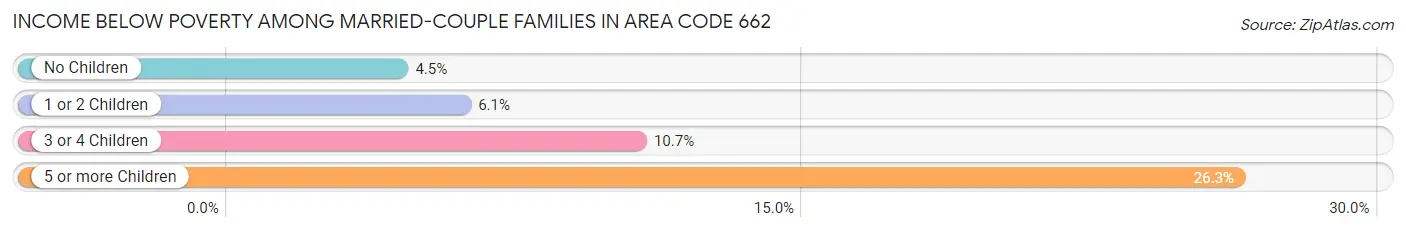
| Children | Above Poverty | Below Poverty |
| No Children | 108,858 (95.6%) | 5,069 (4.4%) |
| 1 or 2 Children | 56,260 (93.9%) | 3,647 (6.1%) |
| 3 or 4 Children | 13,349 (89.3%) | 1,596 (10.7%) |
| 5 or more Children | 854 (73.7%) | 305 (26.3%) |
| Total | 179,321 (94.4%) | 10,617 (5.6%) |
Income Below Poverty Among Single-Parent Households in Area Code 662
According to the poverty data in Area Code 662, 19.0% or 4,180 single-father households and 35.6% or 26,656 single-mother households are living below the poverty line. Among single-father households, those with 5 or more children have the highest poverty rate, with 139 households (81.8%) experiencing poverty. Likewise, among single-mother households, those with 5 or more children have the highest poverty rate, with 1,044 households (79.6%) falling below the poverty line.
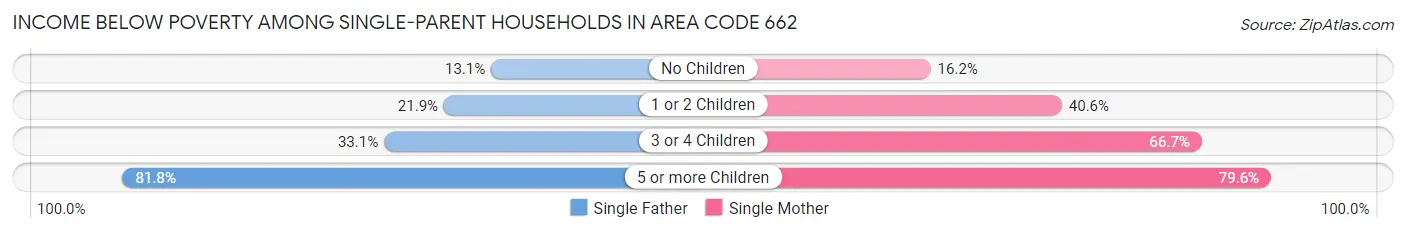
| Children | Single Father | Single Mother |
| No Children | 1,383 (13.1%) | 4,360 (16.2%) |
| 1 or 2 Children | 2,097 (21.9%) | 15,462 (40.6%) |
| 3 or 4 Children | 561 (33.1%) | 5,790 (66.7%) |
| 5 or more Children | 139 (81.8%) | 1,044 (79.6%) |
| Total | 4,180 (19.0%) | 26,656 (35.6%) |
Income Below Poverty Among Married-Couple vs Single-Parent Households in Area Code 662
The poverty data for Area Code 662 shows that 10,617 of the married-couple family households (5.6%) and 30,836 of the single-parent households (31.8%) are living below the poverty level. Within the married-couple family households, those with 5 or more children have the highest poverty rate, with 305 households (26.3%) falling below the poverty line. Among the single-parent households, those with 5 or more children have the highest poverty rate, with 1,183 household (79.8%) living below poverty.
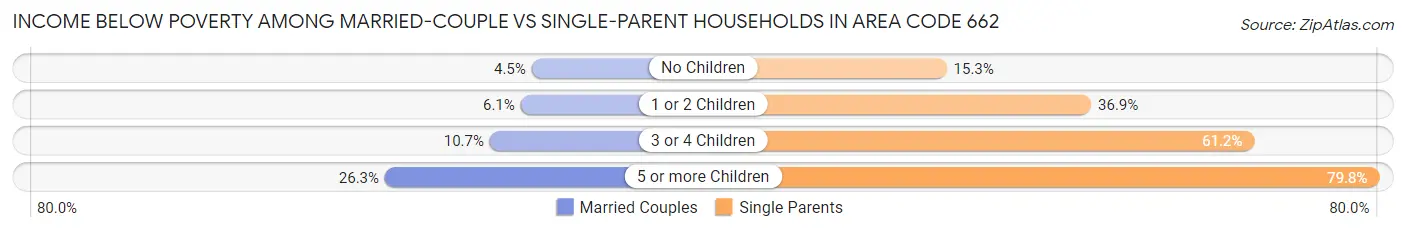
| Children | Married-Couple Families | Single-Parent Households |
| No Children | 5,069 (4.4%) | 5,743 (15.3%) |
| 1 or 2 Children | 3,647 (6.1%) | 17,559 (36.9%) |
| 3 or 4 Children | 1,596 (10.7%) | 6,351 (61.2%) |
| 5 or more Children | 305 (26.3%) | 1,183 (79.8%) |
| Total | 10,617 (5.6%) | 30,836 (31.8%) |
Race in Area Code 662
The most populous races in Area Code 662 are White / Caucasian (635,917 | 55.0%), Black / African American (460,113 | 39.8%), and Hispanic or Latino (34,425 | 3.0%).
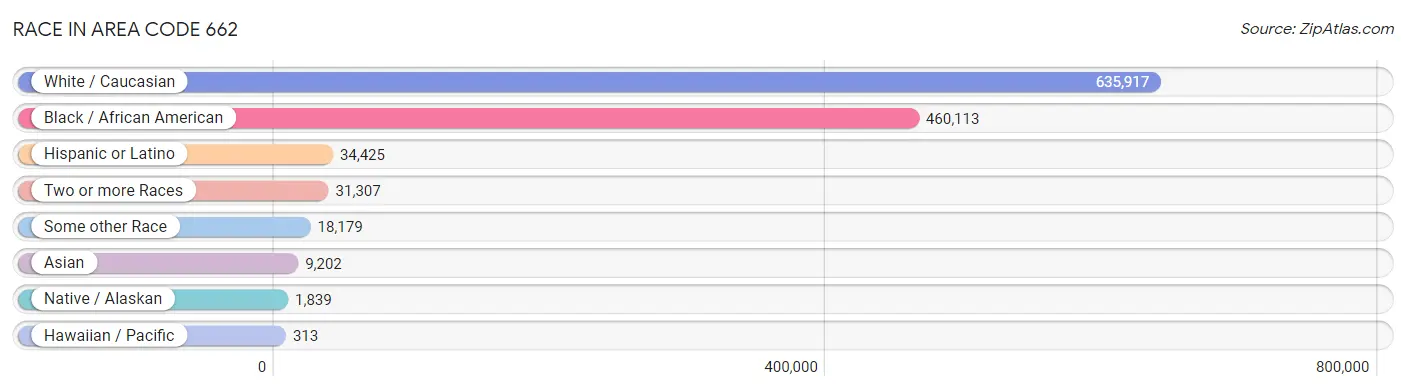
| Race | # Population | % Population |
| Asian | 9,202 | 0.8% |
| Black / African American | 460,113 | 39.8% |
| Hawaiian / Pacific | 313 | 0.0% |
| Hispanic or Latino | 34,425 | 3.0% |
| Native / Alaskan | 1,839 | 0.2% |
| White / Caucasian | 635,917 | 55.0% |
| Two or more Races | 31,307 | 2.7% |
| Some other Race | 18,179 | 1.6% |
| Total | 1,156,870 | 100.0% |
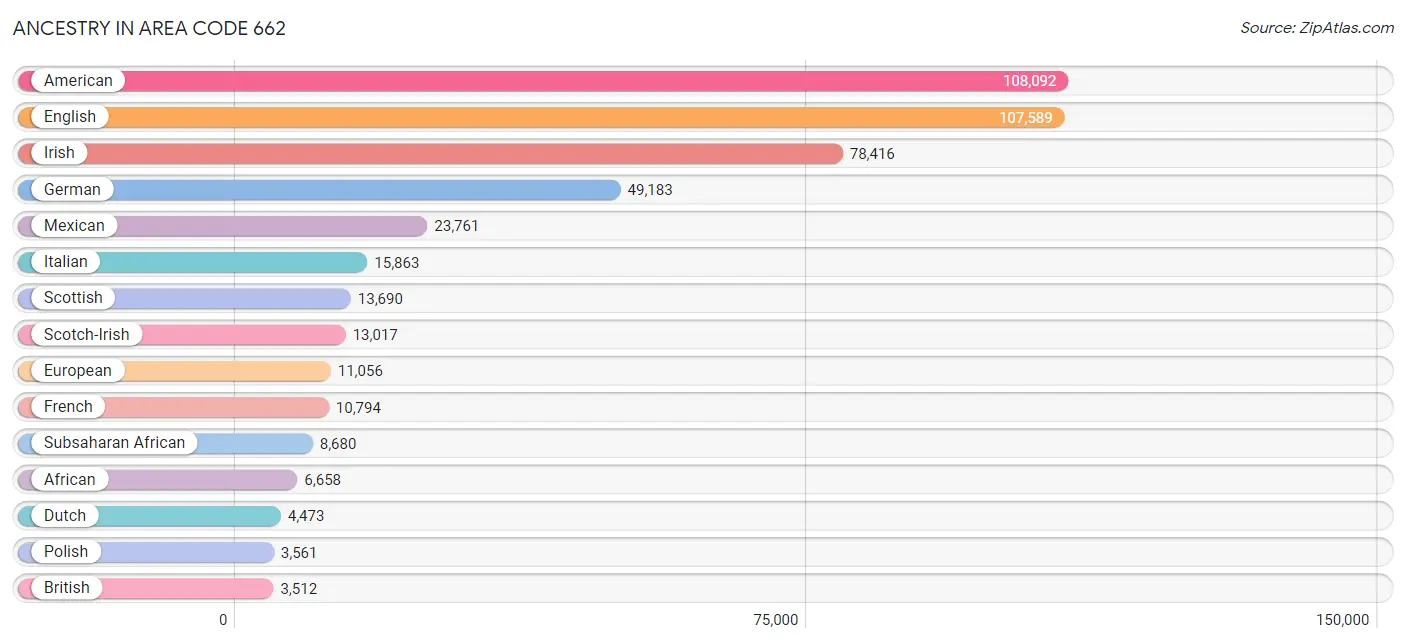
Ancestry in Area Code 662
The most populous ancestries reported in Area Code 662 are American (108,092 | 9.3%), English (107,589 | 9.3%), Irish (78,416 | 6.8%), German (49,183 | 4.3%), and Mexican (23,761 | 2.1%), together accounting for 31.7% of all Area Code 662 residents.
| Ancestry | # Population | % Population |
| Afghan | 28 | 0.0% |
| African | 6,658 | 0.6% |
| Alsatian | 38 | 0.0% |
| American | 108,092 | 9.3% |
| Apache | 56 | 0.0% |
| Arab | 2,236 | 0.2% |
| Arapaho | 13 | 0.0% |
| Argentinean | 57 | 0.0% |
| Armenian | 217 | 0.0% |
| Australian | 74 | 0.0% |
| Austrian | 139 | 0.0% |
| Bahamian | 124 | 0.0% |
| Belgian | 321 | 0.0% |
| Belizean | 68 | 0.0% |
| Bhutanese | 729 | 0.1% |
| Blackfeet | 213 | 0.0% |
| Bolivian | 106 | 0.0% |
| Brazilian | 163 | 0.0% |
| British | 3,512 | 0.3% |
| Bulgarian | 19 | 0.0% |
| Burmese | 488 | 0.0% |
| Cajun | 196 | 0.0% |
| Cambodian | 1 | 0.0% |
| Canadian | 377 | 0.0% |
| Celtic | 100 | 0.0% |
| Central American | 3,384 | 0.3% |
| Central American Indian | 196 | 0.0% |
| Cherokee | 1,826 | 0.2% |
| Chickasaw | 112 | 0.0% |
| Chilean | 57 | 0.0% |
| Chippewa | 47 | 0.0% |
| Choctaw | 1,201 | 0.1% |
| Colombian | 504 | 0.0% |
| Comanche | 53 | 0.0% |
| Costa Rican | 114 | 0.0% |
| Cree | 10 | 0.0% |
| Creek | 110 | 0.0% |
| Croatian | 248 | 0.0% |
| Crow | 1 | 0.0% |
| Cuban | 1,058 | 0.1% |
| Czech | 485 | 0.0% |
| Czechoslovakian | 135 | 0.0% |
| Danish | 597 | 0.1% |
| Dominican | 347 | 0.0% |
| Dutch | 4,473 | 0.4% |
| Eastern European | 339 | 0.0% |
| Ecuadorian | 136 | 0.0% |
| Egyptian | 1 | 0.0% |
| English | 107,589 | 9.3% |
| Ethiopian | 333 | 0.0% |
| European | 11,056 | 1.0% |
| Fijian | 16 | 0.0% |
| Filipino | 152 | 0.0% |
| Finnish | 218 | 0.0% |
| French | 10,794 | 0.9% |
| French American Indian | 10 | 0.0% |
| French Canadian | 1,073 | 0.1% |
| German | 49,183 | 4.3% |
| Greek | 714 | 0.1% |
| Guamanian / Chamorro | 77 | 0.0% |
| Guatemalan | 1,719 | 0.2% |
| Guyanese | 323 | 0.0% |
| Haitian | 87 | 0.0% |
| Honduran | 863 | 0.1% |
| Hopi | 18 | 0.0% |
| Houma | 82 | 0.0% |
| Hungarian | 348 | 0.0% |
| Icelander | 26 | 0.0% |
| Indian (Asian) | 1,780 | 0.2% |
| Iranian | 147 | 0.0% |
| Irish | 78,416 | 6.8% |
| Iroquois | 18 | 0.0% |
| Israeli | 49 | 0.0% |
| Italian | 15,863 | 1.4% |
| Jamaican | 679 | 0.1% |
| Japanese | 163 | 0.0% |
| Jordanian | 237 | 0.0% |
| Kenyan | 25 | 0.0% |
| Kiowa | 7 | 0.0% |
| Korean | 2,361 | 0.2% |
| Laotian | 131 | 0.0% |
| Latvian | 20 | 0.0% |
| Lebanese | 1,036 | 0.1% |
| Lithuanian | 139 | 0.0% |
| Luxembourger | 2 | 0.0% |
| Malaysian | 25 | 0.0% |
| Maltese | 9 | 0.0% |
| Mexican | 23,761 | 2.1% |
| Mexican American Indian | 232 | 0.0% |
| Mongolian | 64 | 0.0% |
| Moroccan | 96 | 0.0% |
| Native Hawaiian | 335 | 0.0% |
| Navajo | 24 | 0.0% |
| New Zealander | 136 | 0.0% |
| Nicaraguan | 144 | 0.0% |
| Nigerian | 769 | 0.1% |
| Northern European | 461 | 0.0% |
| Norwegian | 1,740 | 0.2% |
| Okinawan | 6 | 0.0% |
| Osage | 47 | 0.0% |
| Pakistani | 359 | 0.0% |
| Palestinian | 87 | 0.0% |
| Panamanian | 65 | 0.0% |
| Paraguayan | 26 | 0.0% |
| Pennsylvania German | 18 | 0.0% |
| Peruvian | 154 | 0.0% |
| Polish | 3,561 | 0.3% |
| Portuguese | 309 | 0.0% |
| Potawatomi | 13 | 0.0% |
| Puerto Rican | 1,524 | 0.1% |
| Puget Sound Salish | 62 | 0.0% |
| Romanian | 135 | 0.0% |
| Russian | 1,267 | 0.1% |
| Salvadoran | 479 | 0.0% |
| Samoan | 172 | 0.0% |
| Scandinavian | 1,128 | 0.1% |
| Scotch-Irish | 13,017 | 1.1% |
| Scottish | 13,690 | 1.2% |
| Seminole | 52 | 0.0% |
| Senegalese | 11 | 0.0% |
| Shoshone | 5 | 0.0% |
| Sioux | 50 | 0.0% |
| Slavic | 5 | 0.0% |
| Slovak | 138 | 0.0% |
| Slovene | 78 | 0.0% |
| South African | 222 | 0.0% |
| South American | 1,194 | 0.1% |
| South American Indian | 1 | 0.0% |
| Spaniard | 629 | 0.1% |
| Spanish | 487 | 0.0% |
| Sri Lankan | 2,508 | 0.2% |
| Subsaharan African | 8,680 | 0.7% |
| Swedish | 3,138 | 0.3% |
| Swiss | 409 | 0.0% |
| Syrian | 117 | 0.0% |
| Thai | 2,445 | 0.2% |
| Turkish | 52 | 0.0% |
| Ukrainian | 153 | 0.0% |
| Uruguayan | 5 | 0.0% |
| Venezuelan | 149 | 0.0% |
| Vietnamese | 71 | 0.0% |
| Welsh | 3,300 | 0.3% |
| Yugoslavian | 59 | 0.0% | View All 143 Rows |
Immigrants in Area Code 662
The most numerous immigrant groups reported in Area Code 662 came from Latin America (13,006 | 1.1%), Central America (11,043 | 0.9%), Mexico (8,784 | 0.8%), Asia (6,816 | 0.6%), and Europe (2,460 | 0.2%), together accounting for 3.6% of all Area Code 662 residents.
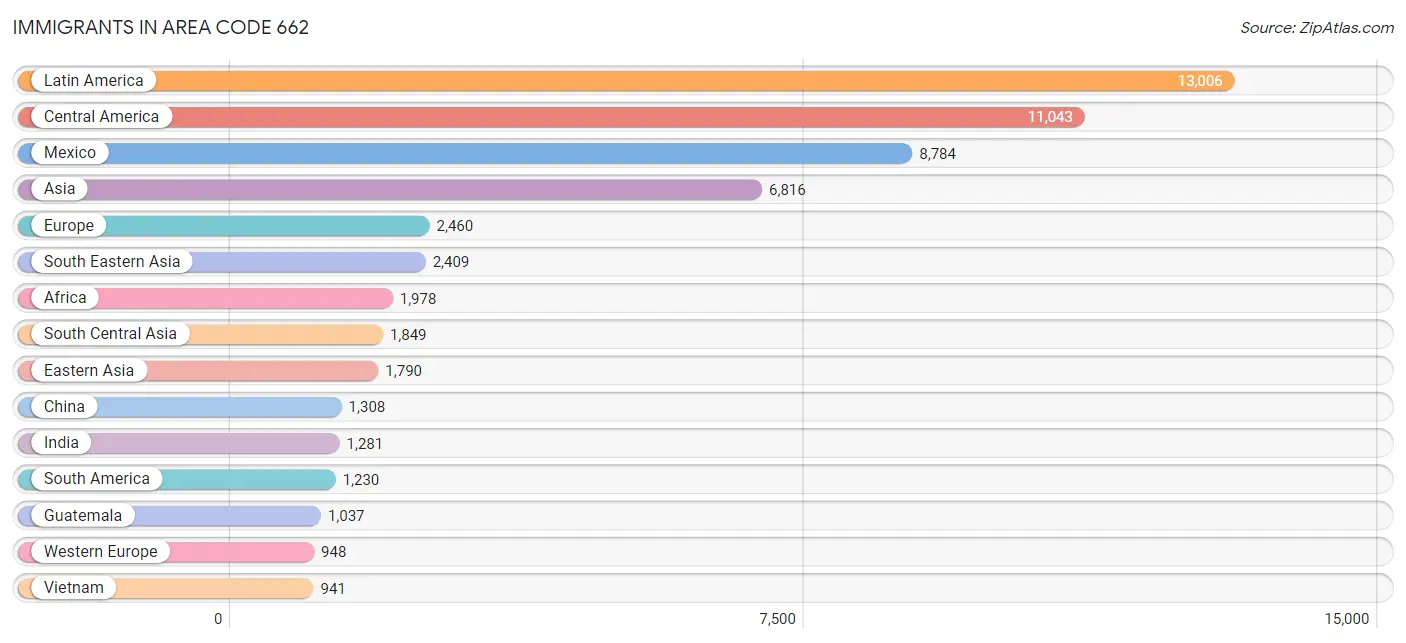
| Immigration Origin | # Population | % Population |
| Africa | 1,978 | 0.2% |
| Argentina | 77 | 0.0% |
| Asia | 6,816 | 0.6% |
| Australia | 66 | 0.0% |
| Austria | 34 | 0.0% |
| Bahamas | 151 | 0.0% |
| Bangladesh | 87 | 0.0% |
| Belgium | 37 | 0.0% |
| Belize | 10 | 0.0% |
| Bolivia | 40 | 0.0% |
| Brazil | 150 | 0.0% |
| Bulgaria | 8 | 0.0% |
| Cambodia | 111 | 0.0% |
| Cameroon | 360 | 0.0% |
| Canada | 340 | 0.0% |
| Caribbean | 733 | 0.1% |
| Central America | 11,043 | 0.9% |
| Chile | 28 | 0.0% |
| China | 1,308 | 0.1% |
| Colombia | 401 | 0.0% |
| Congo | 19 | 0.0% |
| Costa Rica | 64 | 0.0% |
| Cuba | 323 | 0.0% |
| Czechoslovakia | 50 | 0.0% |
| Dominica | 10 | 0.0% |
| Dominican Republic | 94 | 0.0% |
| Eastern Africa | 273 | 0.0% |
| Eastern Asia | 1,790 | 0.2% |
| Eastern Europe | 620 | 0.1% |
| Ecuador | 39 | 0.0% |
| El Salvador | 250 | 0.0% |
| England | 413 | 0.0% |
| Eritrea | 20 | 0.0% |
| Ethiopia | 120 | 0.0% |
| Europe | 2,460 | 0.2% |
| France | 77 | 0.0% |
| Germany | 680 | 0.1% |
| Ghana | 53 | 0.0% |
| Greece | 9 | 0.0% |
| Guatemala | 1,037 | 0.1% |
| Guyana | 5 | 0.0% |
| Haiti | 29 | 0.0% |
| Honduras | 756 | 0.1% |
| Hong Kong | 22 | 0.0% |
| India | 1,281 | 0.1% |
| Indonesia | 46 | 0.0% |
| Iran | 59 | 0.0% |
| Ireland | 14 | 0.0% |
| Israel | 74 | 0.0% |
| Italy | 56 | 0.0% |
| Jamaica | 105 | 0.0% |
| Japan | 244 | 0.0% |
| Jordan | 322 | 0.0% |
| Kazakhstan | 9 | 0.0% |
| Kenya | 67 | 0.0% |
| Korea | 238 | 0.0% |
| Laos | 1 | 0.0% |
| Latin America | 13,006 | 1.1% |
| Liberia | 78 | 0.0% |
| Lithuania | 15 | 0.0% |
| Malaysia | 49 | 0.0% |
| Mexico | 8,784 | 0.8% |
| Middle Africa | 379 | 0.0% |
| Morocco | 111 | 0.0% |
| Nepal | 254 | 0.0% |
| Netherlands | 118 | 0.0% |
| Nicaragua | 104 | 0.0% |
| Nigeria | 251 | 0.0% |
| Northern Africa | 112 | 0.0% |
| Northern Europe | 652 | 0.1% |
| Oceania | 322 | 0.0% |
| Pakistan | 70 | 0.0% |
| Panama | 38 | 0.0% |
| Peru | 301 | 0.0% |
| Philippines | 889 | 0.1% |
| Poland | 30 | 0.0% |
| Romania | 73 | 0.0% |
| Russia | 290 | 0.0% |
| Saudi Arabia | 72 | 0.0% |
| Scotland | 44 | 0.0% |
| Senegal | 82 | 0.0% |
| Sierra Leone | 35 | 0.0% |
| Singapore | 38 | 0.0% |
| South Africa | 215 | 0.0% |
| South America | 1,230 | 0.1% |
| South Central Asia | 1,849 | 0.2% |
| South Eastern Asia | 2,409 | 0.2% |
| Southern Europe | 240 | 0.0% |
| Spain | 175 | 0.0% |
| Sri Lanka | 11 | 0.0% |
| Sudan | 1 | 0.0% |
| Switzerland | 2 | 0.0% |
| Syria | 6 | 0.0% |
| Taiwan | 235 | 0.0% |
| Thailand | 334 | 0.0% |
| Trinidad and Tobago | 21 | 0.0% |
| Turkey | 54 | 0.0% |
| Ukraine | 76 | 0.0% |
| Uruguay | 100 | 0.0% |
| Uzbekistan | 74 | 0.0% |
| Venezuela | 63 | 0.0% |
| Vietnam | 941 | 0.1% |
| Western Africa | 695 | 0.1% |
| Western Asia | 735 | 0.1% |
| Western Europe | 948 | 0.1% |
| Yemen | 193 | 0.0% |
| Zimbabwe | 9 | 0.0% | View All 107 Rows |
Sex and Age in Area Code 662
Sex and Age in Area Code 662
The most populous age groups in Area Code 662 are 20 to 24 Years (45,854 | 8.1%) for men and 15 to 19 Years (43,650 | 7.4%) for women.
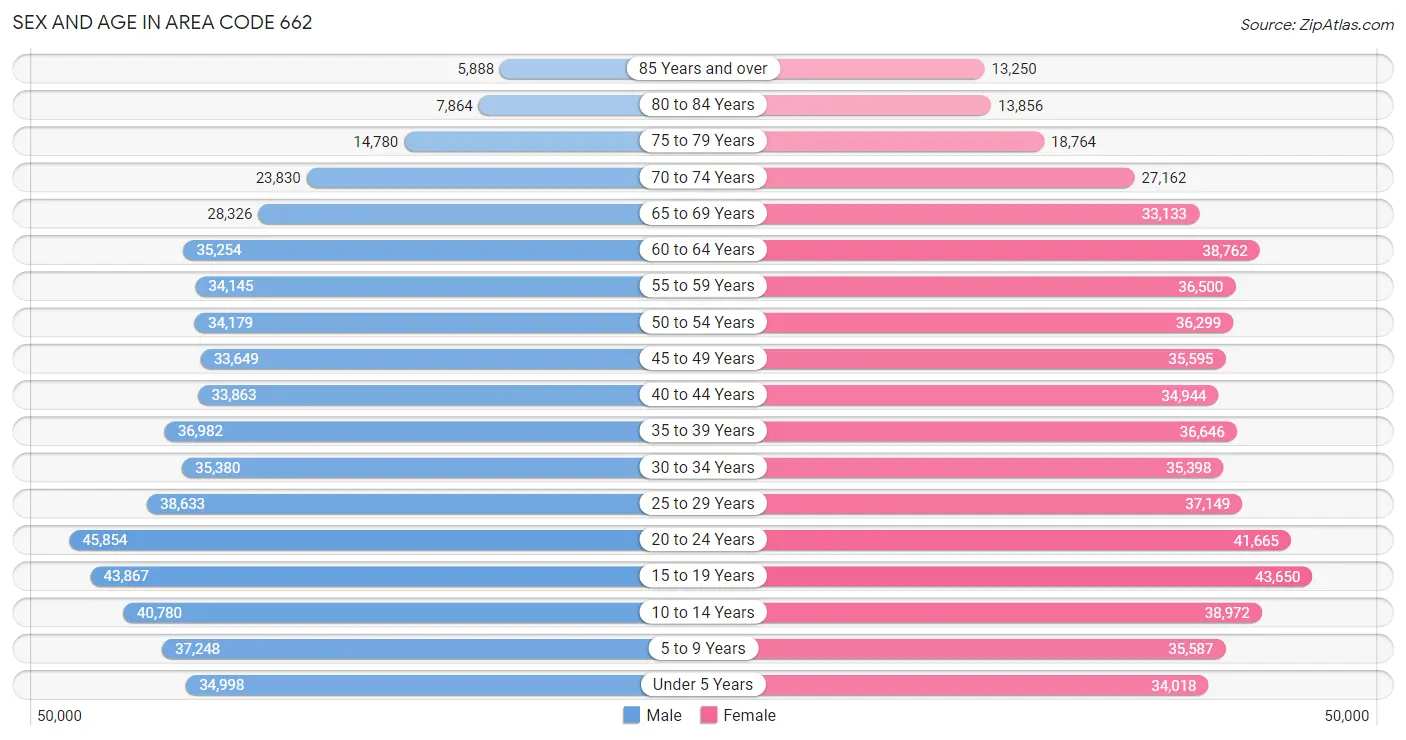
| Age Bracket | Male | Female |
| Under 5 Years | 34,998 (6.2%) | 34,018 (5.8%) |
| 5 to 9 Years | 37,248 (6.6%) | 35,587 (6.0%) |
| 10 to 14 Years | 40,780 (7.2%) | 38,972 (6.6%) |
| 15 to 19 Years | 43,867 (7.8%) | 43,650 (7.4%) |
| 20 to 24 Years | 45,854 (8.1%) | 41,665 (7.0%) |
| 25 to 29 Years | 38,633 (6.8%) | 37,149 (6.3%) |
| 30 to 34 Years | 35,380 (6.3%) | 35,398 (6.0%) |
| 35 to 39 Years | 36,982 (6.5%) | 36,646 (6.2%) |
| 40 to 44 Years | 33,863 (6.0%) | 34,944 (5.9%) |
| 45 to 49 Years | 33,649 (5.9%) | 35,595 (6.0%) |
| 50 to 54 Years | 34,179 (6.0%) | 36,299 (6.1%) |
| 55 to 59 Years | 34,145 (6.0%) | 36,500 (6.2%) |
| 60 to 64 Years | 35,254 (6.2%) | 38,762 (6.6%) |
| 65 to 69 Years | 28,326 (5.0%) | 33,133 (5.6%) |
| 70 to 74 Years | 23,830 (4.2%) | 27,162 (4.6%) |
| 75 to 79 Years | 14,780 (2.6%) | 18,764 (3.2%) |
| 80 to 84 Years | 7,864 (1.4%) | 13,856 (2.3%) |
| 85 Years and over | 5,888 (1.0%) | 13,250 (2.2%) |
| Total | 565,520 (100.0%) | 591,350 (100.0%) |
Families and Households in Area Code 662
Median Family Size in Area Code 662
The median family size in Area Code 662 is 3.28 persons per family, with single female/mother families (74,949 | 26.1%) accounting for the largest median family size of 3.65296 persons per family. On the other hand, single male/father families (21,984 | 7.7%) represent the smallest median family size with 3.02 persons per family.
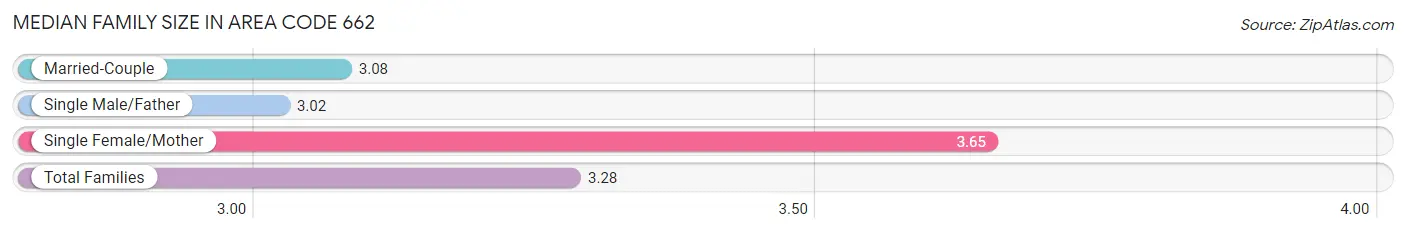
| Family Type | # Families | Family Size |
| Married-Couple | 189,938 (66.2%) | 3.08 |
| Single Male/Father | 21,984 (7.7%) | 3.02 |
| Single Female/Mother | 74,949 (26.1%) | 3.65 |
| Total Families | 286,871 (100.0%) | 3.28 |
Median Household Size in Area Code 662
The median household size in Area Code 662 is 2.55 persons per household, with single female/mother households (74,949 | 17.2%) accounting for the largest median household size of 3.79708 persons per household. non-family households (148,987 | 34.2%) represent the smallest median household size with 1.25 persons per household.
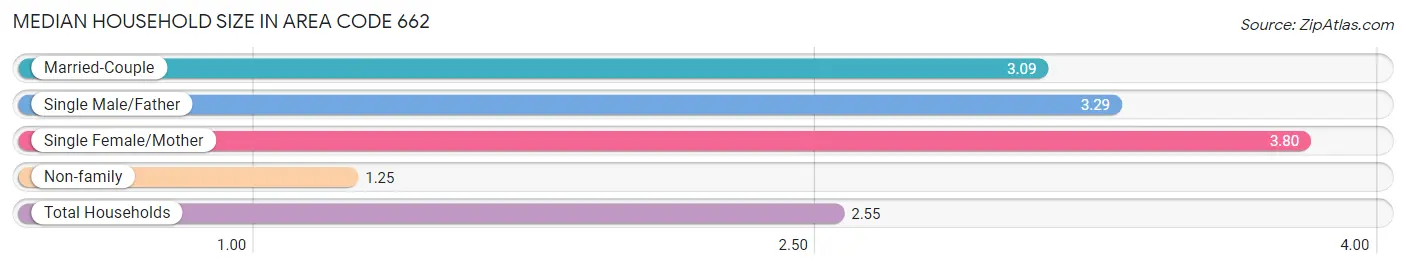
| Household Type | # Households | Household Size |
| Married-Couple | 189,938 (43.6%) | 3.09 |
| Single Male/Father | 21,984 (5.0%) | 3.29 |
| Single Female/Mother | 74,949 (17.2%) | 3.80 |
| Non-family | 148,987 (34.2%) | 1.25 |
| Total Households | 435,858 (100.0%) | 2.55 |
Household Size by Marriage Status in Area Code 662
Out of a total of 435,858 households in Area Code 662, 286,871 (65.8%) are family households, while 148,987 (34.2%) are nonfamily households. The most numerous type of family households are 2-person households, comprising 129,570, and the most common type of nonfamily households are 1-person households, comprising 127,422.
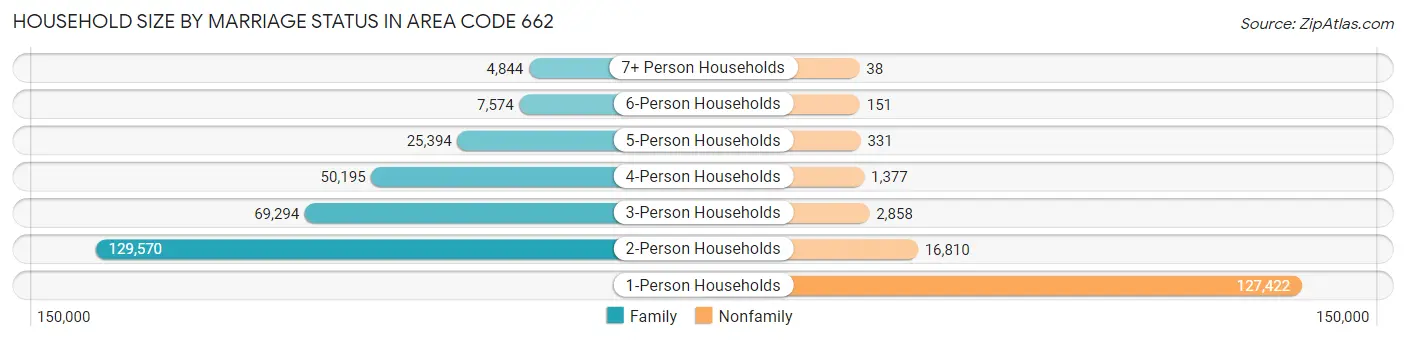
| Household Size | Family Households | Nonfamily Households |
| 1-Person Households | - | 127,422 (29.2%) |
| 2-Person Households | 129,570 (29.7%) | 16,810 (3.9%) |
| 3-Person Households | 69,294 (15.9%) | 2,858 (0.7%) |
| 4-Person Households | 50,195 (11.5%) | 1,377 (0.3%) |
| 5-Person Households | 25,394 (5.8%) | 331 (0.1%) |
| 6-Person Households | 7,574 (1.7%) | 151 (0.0%) |
| 7+ Person Households | 4,844 (1.1%) | 38 (0.0%) |
| Total | 286,871 (65.8%) | 148,987 (34.2%) |
Female Fertility in Area Code 662
Fertility by Age in Area Code 662
Average fertility rate in Area Code 662 is 80.3 births per 1,000 women. Women in the age bracket of 20 to 34 years have the highest fertility rate with 162.1 births per 1,000 women. Women in the age bracket of 20 to 34 years acount for 75.6% of all women with births.
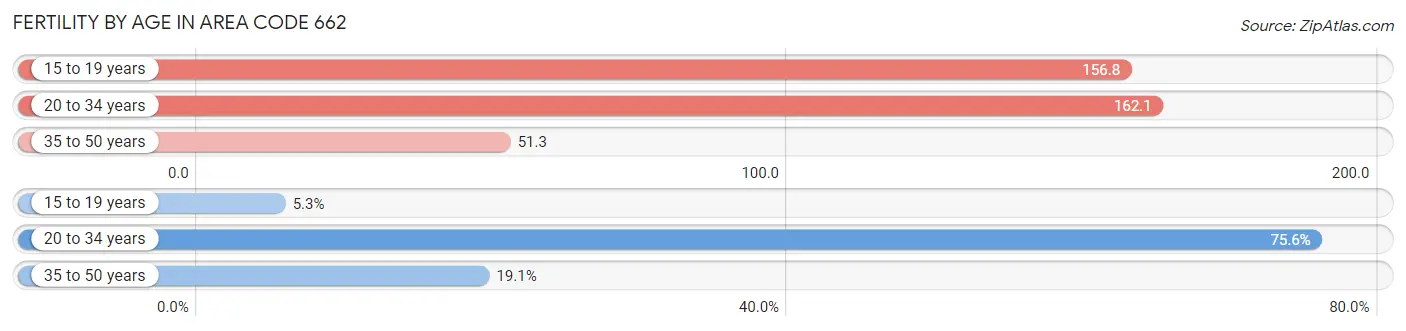
| Age Bracket | Women with Births | Births / 1,000 Women |
| 15 to 19 years | 762 (5.3%) | 156.8 |
| 20 to 34 years | 10,929 (75.6%) | 162.1 |
| 35 to 50 years | 2,760 (19.1%) | 51.3 |
| Total | 14,451 (100.0%) | 80.3 |
Fertility by Age by Marriage Status in Area Code 662
36.3% of women with births (14,451) in Area Code 662 are married. The highest percentage of unmarried women with births falls into 15 to 19 years age bracket with 97.0% of them unmarried at the time of birth, while the lowest percentage of unmarried women with births belong to 20 to 34 years age bracket with 63.9% of them unmarried.
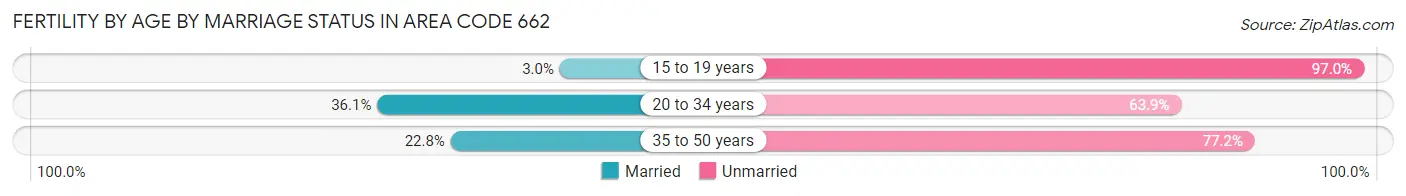
| Age Bracket | Married | Unmarried |
| 15 to 19 years | 23 (3.0%) | 739 (97.0%) |
| 20 to 34 years | 3,945 (36.1%) | 6,984 (63.9%) |
| 35 to 50 years | 629 (22.8%) | 2,131 (77.2%) |
| Total | 5,249 (36.3%) | 9,202 (63.7%) |
Fertility by Education in Area Code 662
Average fertility rate in Area Code 662 is 80.3 births per 1,000 women. Women with the education attainment of graduate degree have the highest fertility rate of 224.2 births per 1,000 women, while women with the education attainment of less than high school have the lowest fertility at 111.9 births per 1,000 women. Women with the education attainment of college or associate's degree represent 39.3% of all women with births.
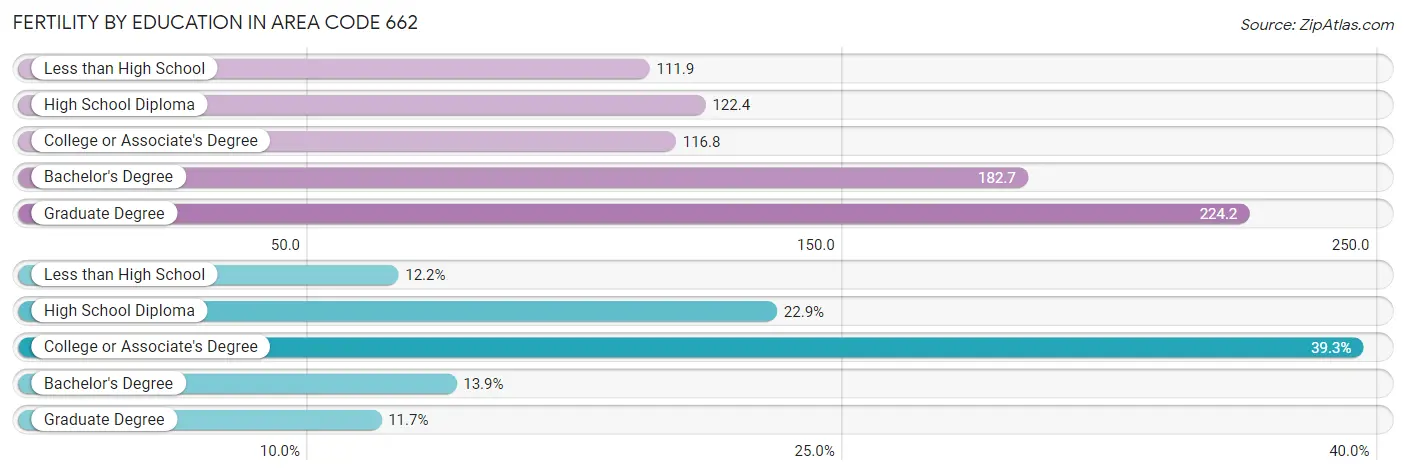
| Educational Attainment | Women with Births | Births / 1,000 Women |
| Less than High School | 1,766 (12.2%) | 111.9 |
| High School Diploma | 3,304 (22.9%) | 122.4 |
| College or Associate's Degree | 5,683 (39.3%) | 116.8 |
| Bachelor's Degree | 2,002 (13.9%) | 182.7 |
| Graduate Degree | 1,696 (11.7%) | 224.2 |
| Total | 14,451 (100.0%) | 80.3 |
Fertility by Education by Marriage Status in Area Code 662
63.7% of women with births in Area Code 662 are unmarried. Women with the educational attainment of college or associate's degree are most likely to be married with 25.7% of them married at childbirth, while women with the educational attainment of less than high school are least likely to be married with 92.9% of them unmarried at childbirth.
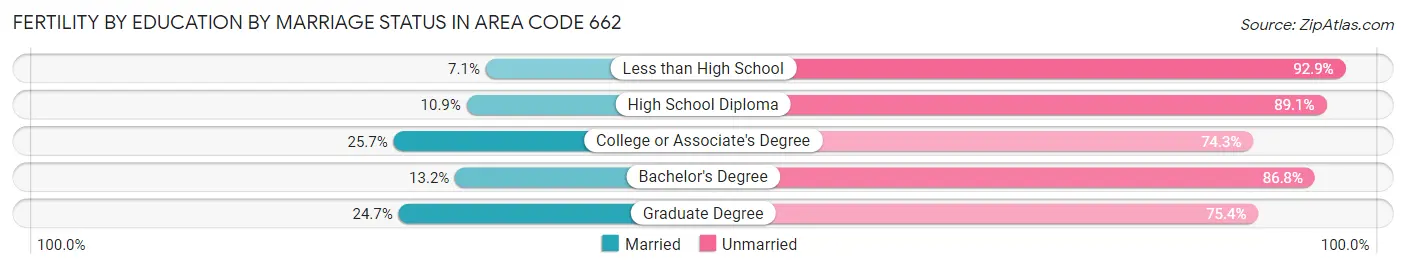
| Educational Attainment | Married | Unmarried |
| Less than High School | 125 (7.1%) | 1,641 (92.9%) |
| High School Diploma | 361 (10.9%) | 2,943 (89.1%) |
| College or Associate's Degree | 1,458 (25.7%) | 4,225 (74.3%) |
| Bachelor's Degree | 265 (13.2%) | 1,737 (86.8%) |
| Graduate Degree | 418 (24.6%) | 1,278 (75.3%) |
| Total | 5,249 (36.3%) | 9,202 (63.7%) |
Employment Characteristics in Area Code 662
Employment by Class of Employer in Area Code 662
Among the 477,314 employed individuals in Area Code 662, private company employees (323,311 | 67.7%), state government employees (38,089 | 8.0%), and local government employees (32,358 | 6.8%) make up the most common classes of employment.
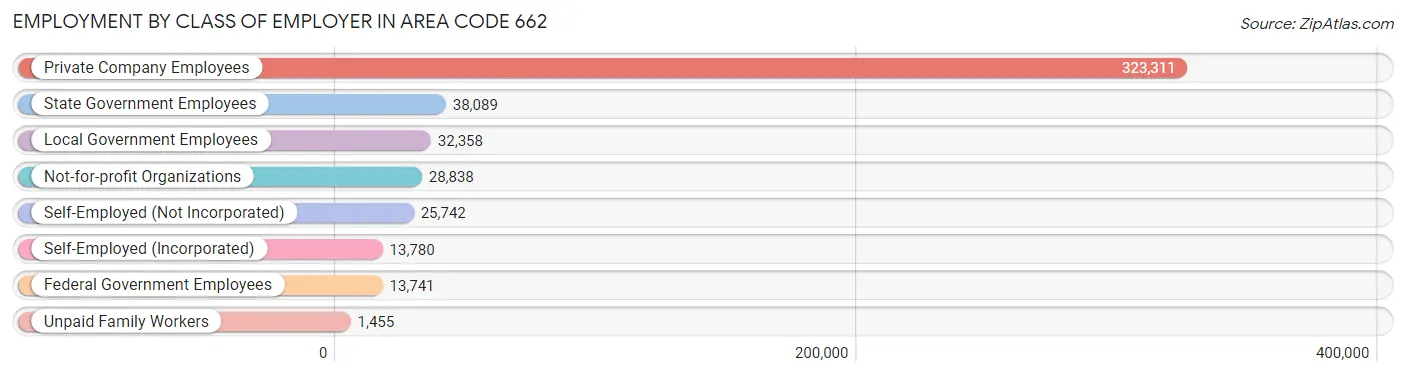
| Employer Class | # Employees | % Employees |
| Private Company Employees | 323,311 | 67.7% |
| Self-Employed (Incorporated) | 13,780 | 2.9% |
| Self-Employed (Not Incorporated) | 25,742 | 5.4% |
| Not-for-profit Organizations | 28,838 | 6.0% |
| Local Government Employees | 32,358 | 6.8% |
| State Government Employees | 38,089 | 8.0% |
| Federal Government Employees | 13,741 | 2.9% |
| Unpaid Family Workers | 1,455 | 0.3% |
| Total | 477,314 | 100.0% |
Employment Status by Age in Area Code 662
According to the labor force statistics for Area Code 662, out of the total population over 16 years of age (918,669), 52.9% or 485,884 individuals are in the labor force, with 8.4% or 40,571 of them unemployed. The age group with the highest labor force participation rate is 25 to 29 years, with 77.8% or 58,996 individuals in the labor force. Within the labor force, the 16 to 19 years age range has the highest percentage of unemployed individuals, with 3,117.0% or 684,150 of them being unemployed.
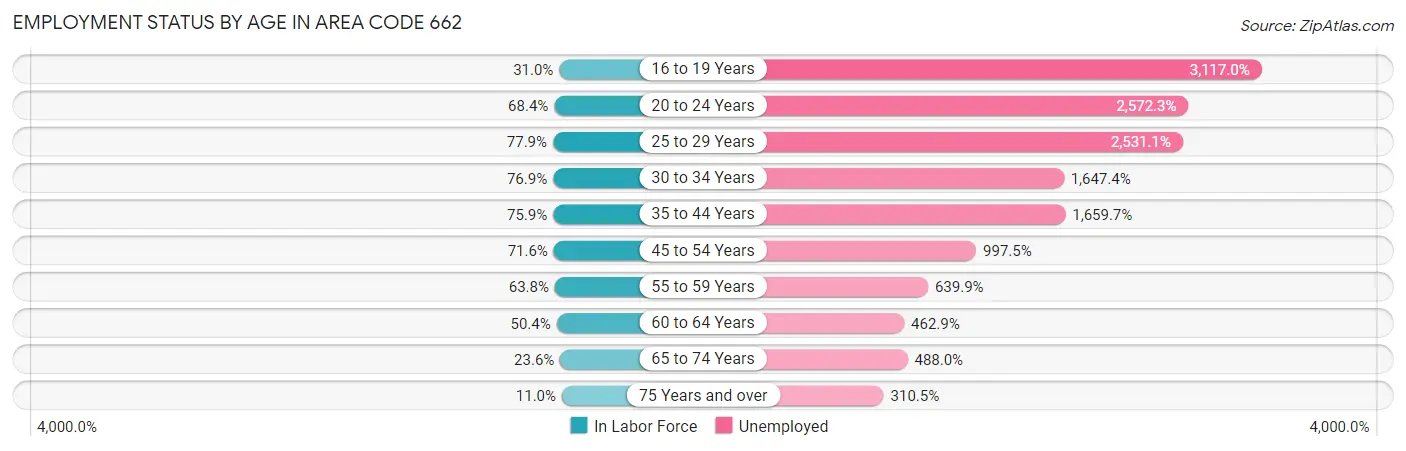
| Age Bracket | In Labor Force | Unemployed |
| 16 to 19 Years | 21,951 (30.9%) | 684,150 (3,117.0%) |
| 20 to 24 Years | 59,861 (68.4%) | 1,539,856 (2,572.3%) |
| 25 to 29 Years | 58,998 (77.8%) | 1,493,248 (2,531.1%) |
| 30 to 34 Years | 54,453 (76.9%) | 897,009 (1,647.4%) |
| 35 to 44 Years | 108,116 (75.9%) | 1,794,501 (1,659.7%) |
| 45 to 54 Years | 99,966 (71.6%) | 997,211 (997.5%) |
| 55 to 59 Years | 45,072 (63.8%) | 288,416 (639.9%) |
| 60 to 64 Years | 37,286 (50.4%) | 172,611 (462.9%) |
| 65 to 74 Years | 26,550 (23.6%) | 129,564 (488.0%) |
| 75 Years and over | 8,166 (11.0%) | 25,365 (310.5%) |
| Total | 485,910 (52.9%) | 40,583 (8.4%) |
Employment Status by Educational Attainment in Area Code 662
According to labor force statistics for Area Code 662, 68.4% of individuals (392,363) out of the total population between 25 and 64 years of age (573,378) are in the labor force, with 1,431.5% or 5,616,676 of them being unemployed. The group with the highest labor force participation rate are those with the educational attainment of bachelor's degree or higher, with 84.4% or 110,345 individuals in the labor force. Within the labor force, individuals with less than high school education have the highest percentage of unemployment, with 2,720.2% or 1,039,769 of them being unemployed.
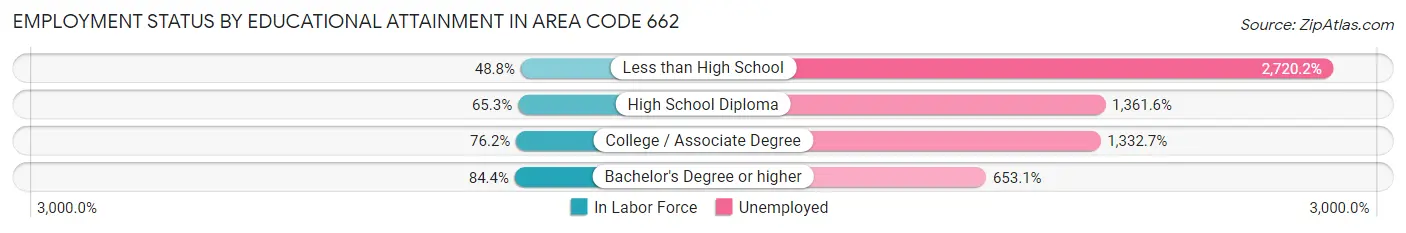
| Educational Attainment | In Labor Force | Unemployed |
| Less than High School | 38,221 (48.8%) | 2,129,373 (2,720.2%) |
| High School Diploma | 115,449 (65.3%) | 2,407,050 (1,361.6%) |
| College / Associate Degree | 142,877 (76.1%) | 2,500,452 (1,332.7%) |
| Bachelor's Degree or higher | 110,341 (84.4%) | 853,563 (653.1%) |
| Total | 392,361 (68.4%) | 8,207,906 (1,431.5%) |
Employment Occupations by Sex in Area Code 662
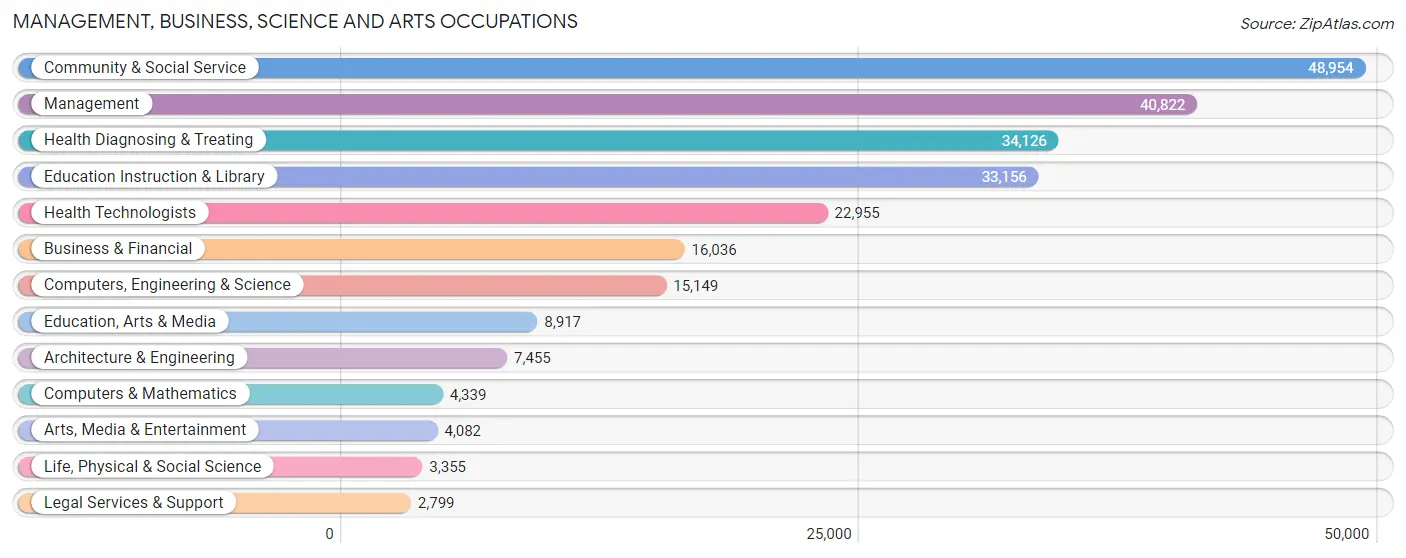
Management, Business, Science and Arts Occupations
The most common Management, Business, Science and Arts occupations in Area Code 662 are Community & Social Service (48,954 | 10.1%), Management (40,822 | 8.4%), Health Diagnosing & Treating (34,126 | 7.0%), Education Instruction & Library (33,156 | 6.8%), and Health Technologists (22,955 | 4.7%).
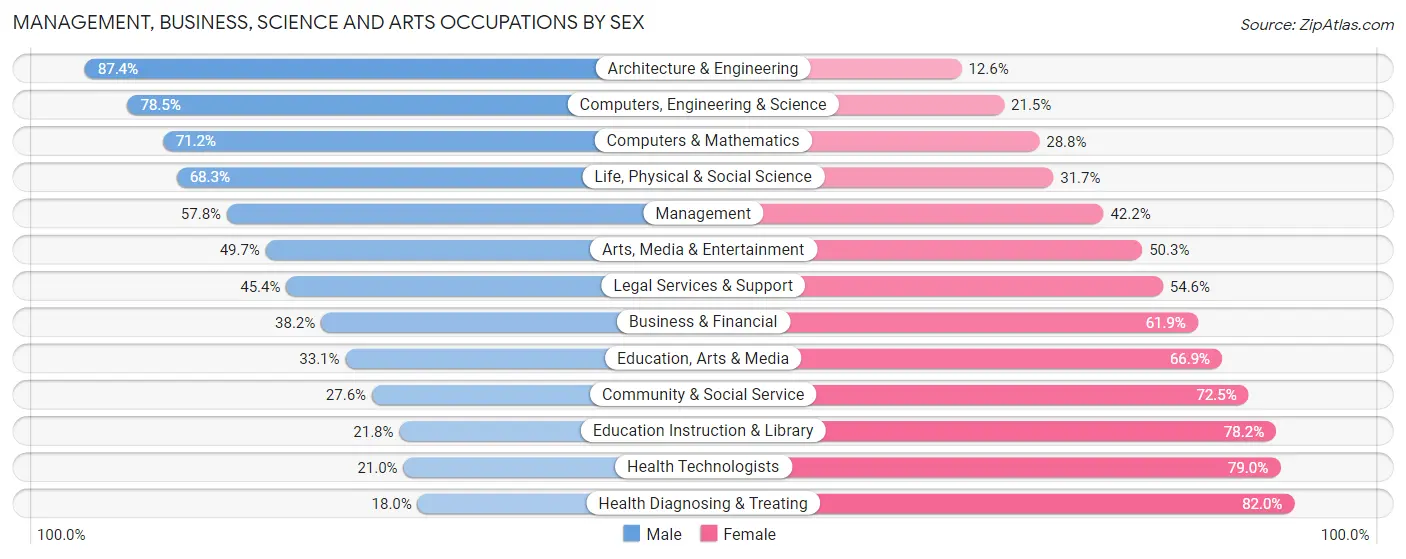
Management, Business, Science and Arts Occupations by Sex
Within the Management, Business, Science and Arts occupations in Area Code 662, the most male-oriented occupations are Architecture & Engineering (87.4%), Computers, Engineering & Science (78.5%), and Computers & Mathematics (71.2%), while the most female-oriented occupations are Health Diagnosing & Treating (82.0%), Health Technologists (79.0%), and Education Instruction & Library (78.2%).
| Occupation | Male | Female |
| Management | 23,597 (57.8%) | 17,225 (42.2%) |
| Business & Financial | 6,117 (38.2%) | 9,919 (61.9%) |
| Computers, Engineering & Science | 11,896 (78.5%) | 3,253 (21.5%) |
| Computers & Mathematics | 3,089 (71.2%) | 1,250 (28.8%) |
| Architecture & Engineering | 6,517 (87.4%) | 938 (12.6%) |
| Life, Physical & Social Science | 2,290 (68.3%) | 1,065 (31.7%) |
| Community & Social Service | 13,485 (27.6%) | 35,469 (72.5%) |
| Education, Arts & Media | 2,951 (33.1%) | 5,966 (66.9%) |
| Legal Services & Support | 1,271 (45.4%) | 1,528 (54.6%) |
| Education Instruction & Library | 7,234 (21.8%) | 25,922 (78.2%) |
| Arts, Media & Entertainment | 2,029 (49.7%) | 2,053 (50.3%) |
| Health Diagnosing & Treating | 6,151 (18.0%) | 27,975 (82.0%) |
| Health Technologists | 4,813 (21.0%) | 18,142 (79.0%) |
| Total (Category) | 61,246 (39.5%) | 93,841 (60.5%) |
| Total (Overall) | 249,418 (51.4%) | 235,707 (48.6%) |
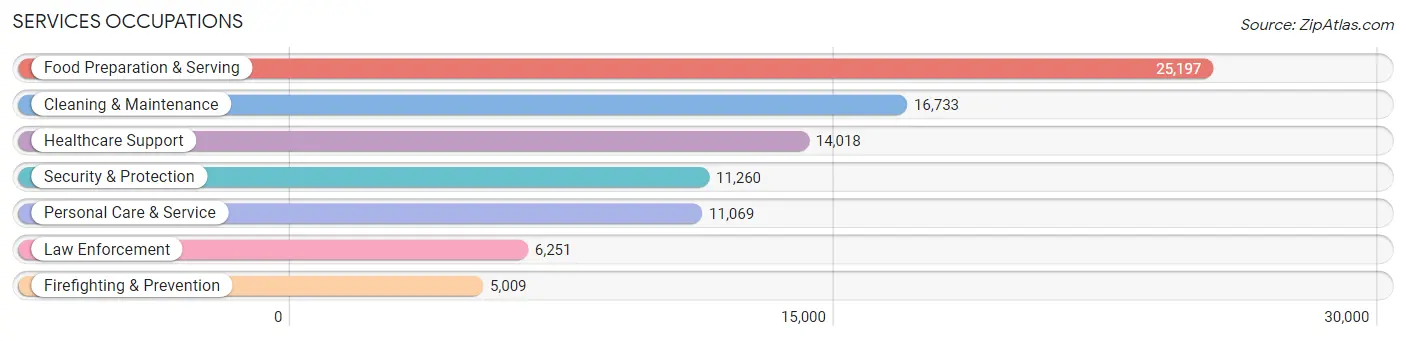
Services Occupations
The most common Services occupations in Area Code 662 are Food Preparation & Serving (25,197 | 5.2%), Cleaning & Maintenance (16,733 | 3.5%), Healthcare Support (14,018 | 2.9%), Security & Protection (11,260 | 2.3%), and Personal Care & Service (11,069 | 2.3%).
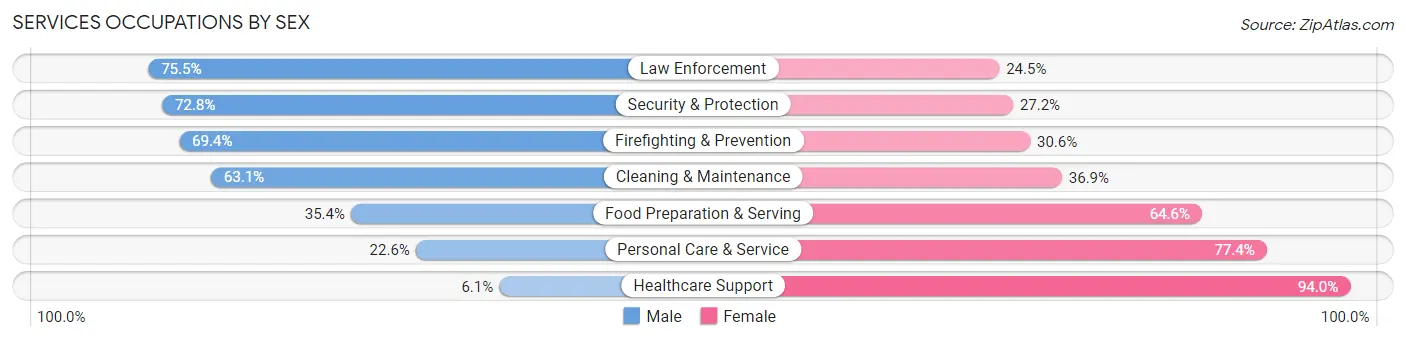
Services Occupations by Sex
Within the Services occupations in Area Code 662, the most male-oriented occupations are Law Enforcement (75.5%), Security & Protection (72.8%), and Firefighting & Prevention (69.4%), while the most female-oriented occupations are Healthcare Support (94.0%), Personal Care & Service (77.4%), and Food Preparation & Serving (64.6%).
| Occupation | Male | Female |
| Healthcare Support | 848 (6.0%) | 13,170 (94.0%) |
| Security & Protection | 8,196 (72.8%) | 3,064 (27.2%) |
| Firefighting & Prevention | 3,476 (69.4%) | 1,533 (30.6%) |
| Law Enforcement | 4,720 (75.5%) | 1,531 (24.5%) |
| Food Preparation & Serving | 8,920 (35.4%) | 16,277 (64.6%) |
| Cleaning & Maintenance | 10,558 (63.1%) | 6,175 (36.9%) |
| Personal Care & Service | 2,497 (22.6%) | 8,572 (77.4%) |
| Total (Category) | 31,019 (39.6%) | 47,258 (60.4%) |
| Total (Overall) | 249,418 (51.4%) | 235,707 (48.6%) |
Sales and Office Occupations
The most common Sales and Office occupations in Area Code 662 are Office & Administration (52,511 | 10.8%), and Sales & Related (46,669 | 9.6%).
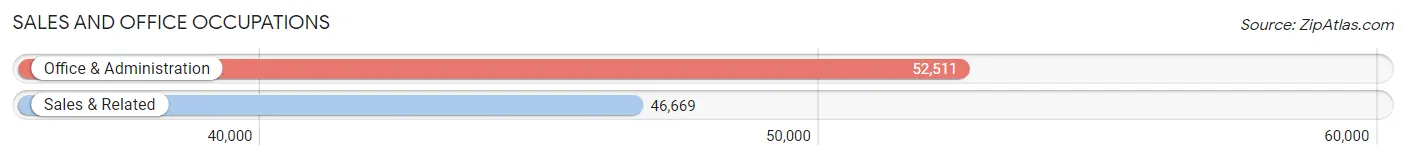
Sales and Office Occupations by Sex
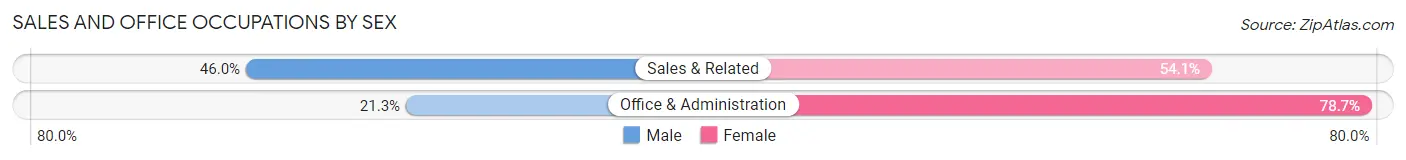
| Occupation | Male | Female |
| Sales & Related | 21,445 (46.0%) | 25,224 (54.0%) |
| Office & Administration | 11,204 (21.3%) | 41,307 (78.7%) |
| Total (Category) | 32,649 (32.9%) | 66,531 (67.1%) |
| Total (Overall) | 249,418 (51.4%) | 235,707 (48.6%) |
Natural Resources, Construction and Maintenance Occupations
The most common Natural Resources, Construction and Maintenance occupations in Area Code 662 are Construction & Extraction (22,520 | 4.6%), Installation, Maintenance & Repair (21,819 | 4.5%), and Farming, Fishing & Forestry (4,086 | 0.8%).
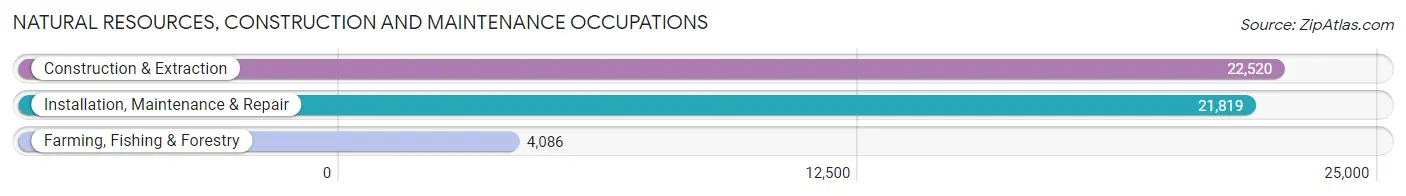
Natural Resources, Construction and Maintenance Occupations by Sex
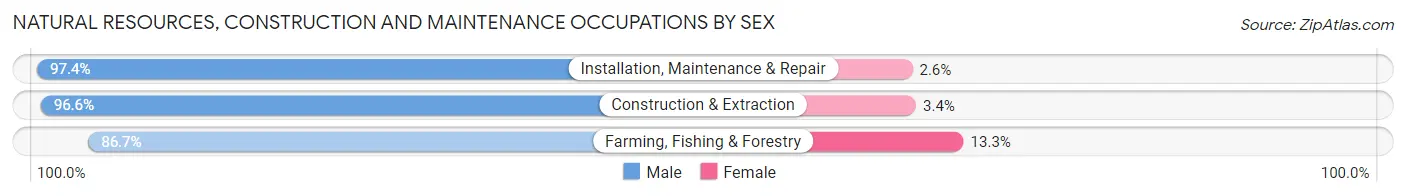
| Occupation | Male | Female |
| Farming, Fishing & Forestry | 3,544 (86.7%) | 542 (13.3%) |
| Construction & Extraction | 21,760 (96.6%) | 760 (3.4%) |
| Installation, Maintenance & Repair | 21,248 (97.4%) | 571 (2.6%) |
| Total (Category) | 46,552 (96.1%) | 1,873 (3.9%) |
| Total (Overall) | 249,418 (51.4%) | 235,707 (48.6%) |
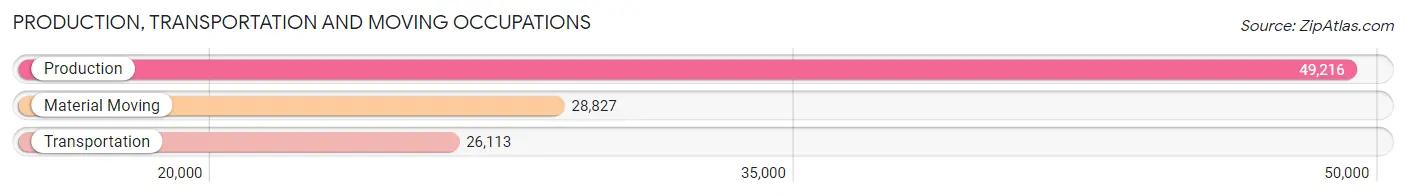
Production, Transportation and Moving Occupations
The most common Production, Transportation and Moving occupations in Area Code 662 are Production (49,216 | 10.2%), Material Moving (28,827 | 5.9%), and Transportation (26,113 | 5.4%).
Production, Transportation and Moving Occupations by Sex
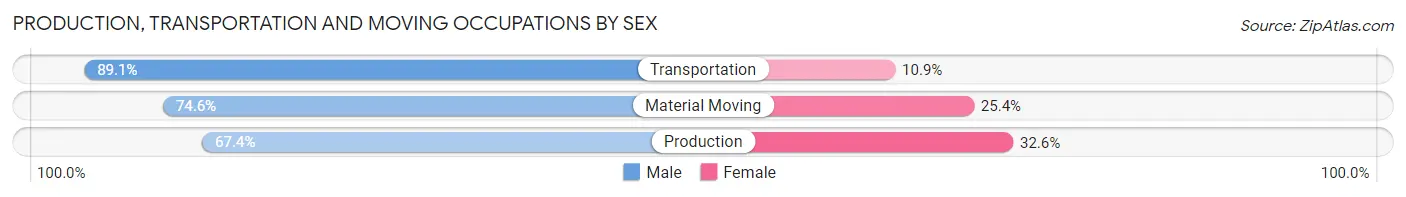
| Occupation | Male | Female |
| Production | 33,188 (67.4%) | 16,028 (32.6%) |
| Transportation | 23,255 (89.1%) | 2,858 (10.9%) |
| Material Moving | 21,509 (74.6%) | 7,318 (25.4%) |
| Total (Category) | 77,952 (74.8%) | 26,204 (25.2%) |
| Total (Overall) | 249,418 (51.4%) | 235,707 (48.6%) |
Employment Industries by Sex in Area Code 662
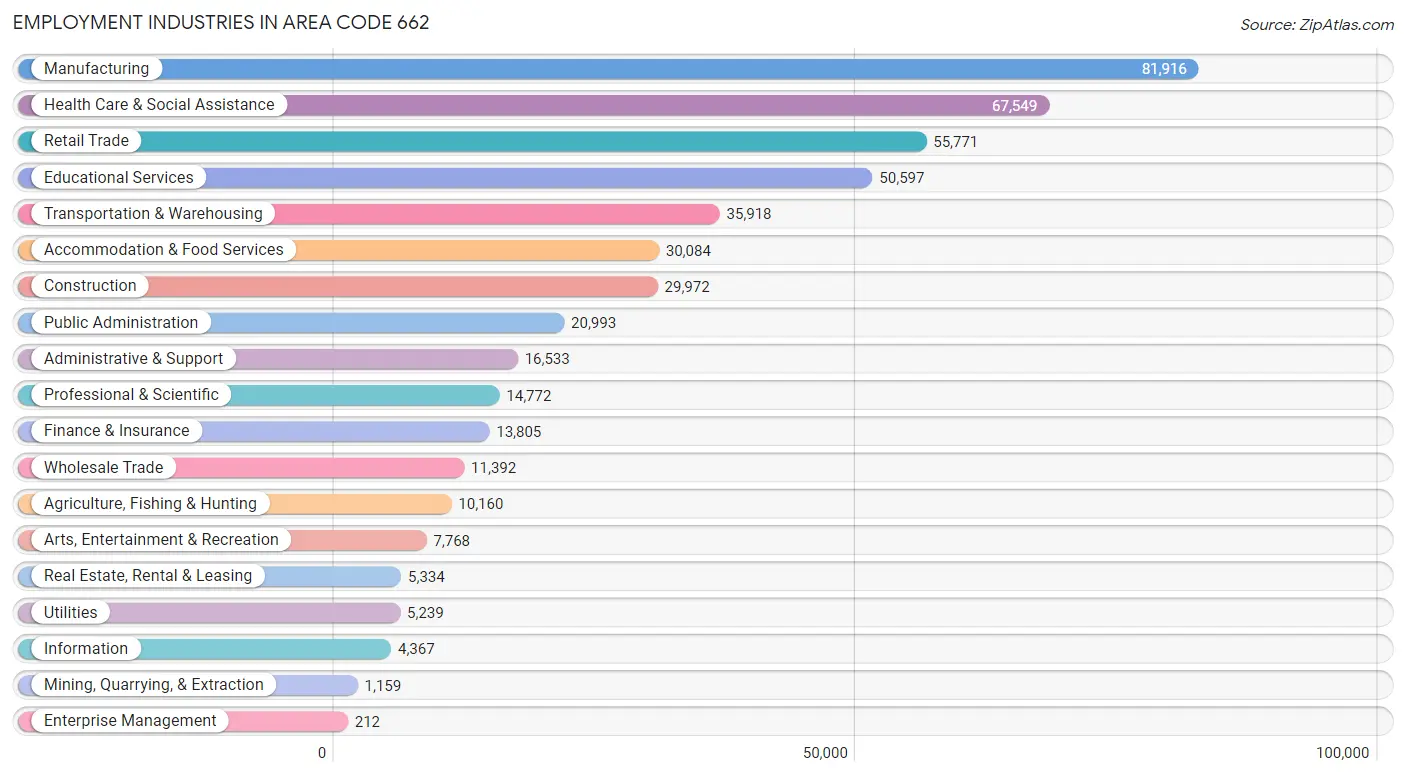
Employment Industries in Area Code 662
The major employment industries in Area Code 662 include Manufacturing (81,916 | 16.9%), Health Care & Social Assistance (67,549 | 13.9%), Retail Trade (55,771 | 11.5%), Educational Services (50,597 | 10.4%), and Transportation & Warehousing (35,918 | 7.4%).
Employment Industries by Sex in Area Code 662
The Area Code 662 industries that see more men than women are Construction (92.9%), Mining, Quarrying, & Extraction (88.7%), and Utilities (81.2%), whereas the industries that tend to have a higher number of women are Health Care & Social Assistance (84.3%), Enterprise Management (77.4%), and Educational Services (71.7%).
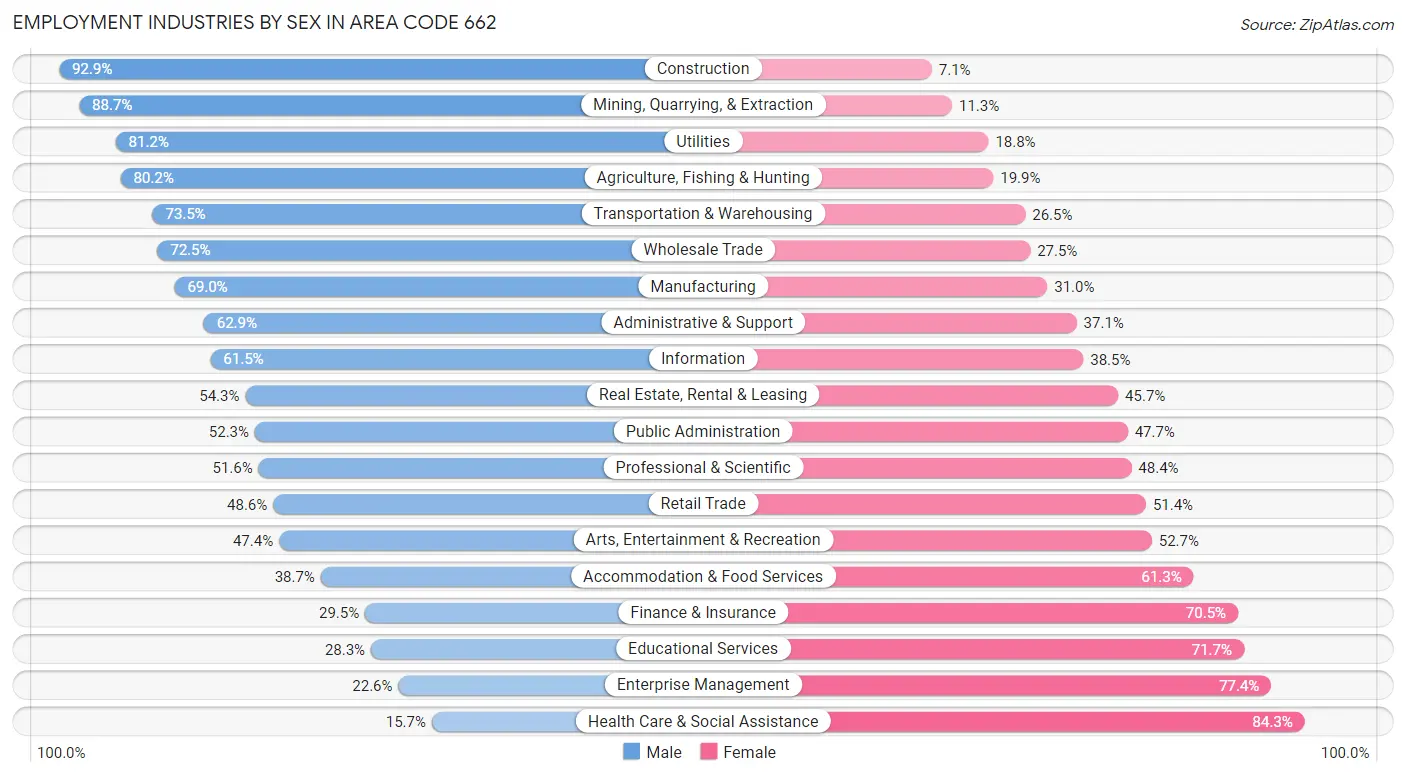
| Industry | Male | Female |
| Agriculture, Fishing & Hunting | 8,143 (80.1%) | 2,017 (19.9%) |
| Mining, Quarrying, & Extraction | 1,028 (88.7%) | 131 (11.3%) |
| Construction | 27,837 (92.9%) | 2,135 (7.1%) |
| Manufacturing | 56,509 (69.0%) | 25,407 (31.0%) |
| Wholesale Trade | 8,261 (72.5%) | 3,131 (27.5%) |
| Retail Trade | 27,082 (48.6%) | 28,689 (51.4%) |
| Transportation & Warehousing | 26,411 (73.5%) | 9,507 (26.5%) |
| Utilities | 4,252 (81.2%) | 987 (18.8%) |
| Information | 2,687 (61.5%) | 1,680 (38.5%) |
| Finance & Insurance | 4,076 (29.5%) | 9,729 (70.5%) |
| Real Estate, Rental & Leasing | 2,897 (54.3%) | 2,437 (45.7%) |
| Professional & Scientific | 7,618 (51.6%) | 7,154 (48.4%) |
| Enterprise Management | 48 (22.6%) | 164 (77.4%) |
| Administrative & Support | 10,399 (62.9%) | 6,134 (37.1%) |
| Educational Services | 14,326 (28.3%) | 36,271 (71.7%) |
| Health Care & Social Assistance | 10,612 (15.7%) | 56,937 (84.3%) |
| Arts, Entertainment & Recreation | 3,678 (47.3%) | 4,090 (52.6%) |
| Accommodation & Food Services | 11,647 (38.7%) | 18,437 (61.3%) |
| Public Administration | 10,988 (52.3%) | 10,005 (47.7%) |
| Total | 249,418 (51.4%) | 235,707 (48.6%) |
Education in Area Code 662
School Enrollment in Area Code 662
The most common levels of schooling among the 300,235 students in Area Code 662 are college / undergraduate (69,472 | 23.1%), middle school (61,805 | 20.6%), and high school (61,231 | 20.4%).
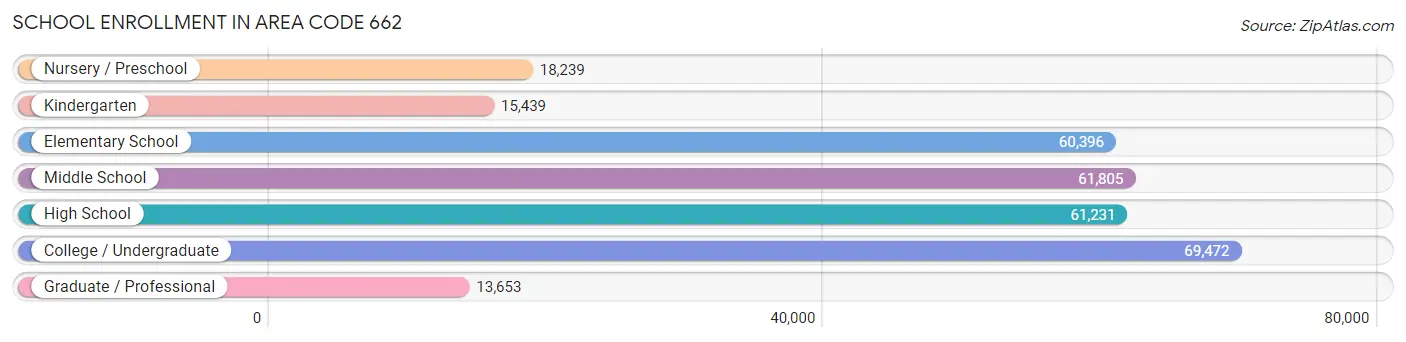
| School Level | # Students | % Students |
| Nursery / Preschool | 18,239 | 6.1% |
| Kindergarten | 15,439 | 5.1% |
| Elementary School | 60,396 | 20.1% |
| Middle School | 61,805 | 20.6% |
| High School | 61,231 | 20.4% |
| College / Undergraduate | 69,472 | 23.1% |
| Graduate / Professional | 13,653 | 4.5% |
| Total | 300,235 | 100.0% |
School Enrollment by Age by Funding Source in Area Code 662
Out of a total of 300,235 students who are enrolled in schools in Area Code 662, 37,002 (12.3%) attend a private institution, while the remaining 263,233 (87.7%) are enrolled in public schools. The age group of 35 years and over has the highest likelihood of being enrolled in private schools, with 3,134 (23.6% in the age bracket) enrolled. Conversely, the age group of 18 to 19 year olds has the lowest likelihood of being enrolled in a private school, with 29,472 (94.5% in the age bracket) attending a public institution.
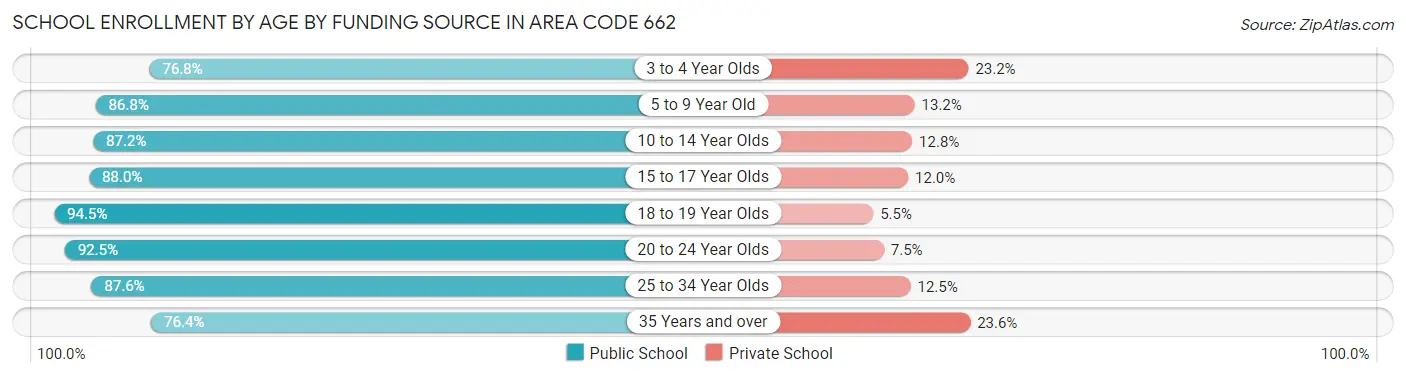
| Age Bracket | Public School | Private School |
| 3 to 4 Year Olds | 11,190 (76.8%) | 3,388 (23.2%) |
| 5 to 9 Year Old | 59,624 (86.8%) | 9,073 (13.2%) |
| 10 to 14 Year Olds | 67,298 (87.2%) | 9,846 (12.8%) |
| 15 to 17 Year Olds | 40,256 (88.0%) | 5,491 (12.0%) |
| 18 to 19 Year Olds | 29,472 (94.5%) | 1,716 (5.5%) |
| 20 to 24 Year Olds | 33,694 (92.5%) | 2,724 (7.5%) |
| 25 to 34 Year Olds | 11,527 (87.5%) | 1,639 (12.4%) |
| 35 Years and over | 10,163 (76.4%) | 3,134 (23.6%) |
| Total | 263,234 (87.7%) | 37,002 (12.3%) |
Educational Attainment by Field of Study in Area Code 662
Education (38,475 | 21.6%), business (37,441 | 21.1%), science & technology (21,193 | 11.9%), arts & humanities (16,552 | 9.3%), and bio, nature & agricultural (13,338 | 7.5%) are the most common fields of study among 177,688 individuals in Area Code 662 who have obtained a bachelor's degree or higher.
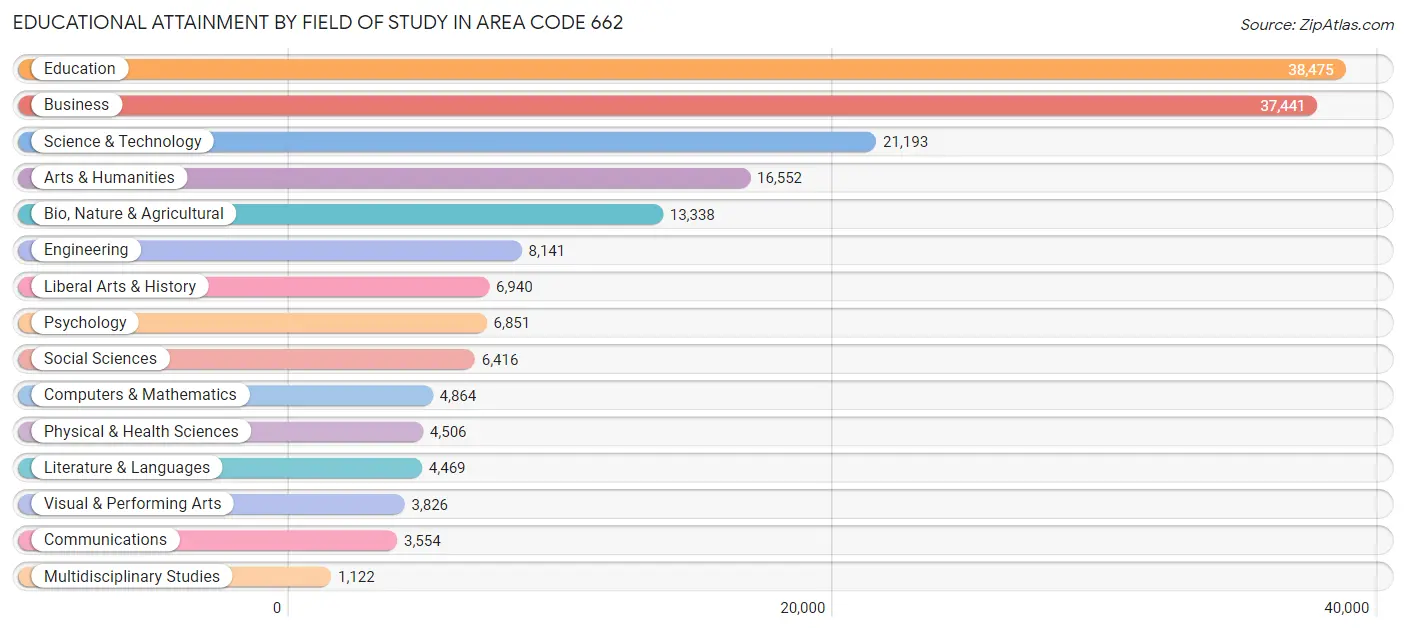
| Field of Study | # Graduates | % Graduates |
| Computers & Mathematics | 4,864 | 2.7% |
| Bio, Nature & Agricultural | 13,338 | 7.5% |
| Physical & Health Sciences | 4,506 | 2.5% |
| Psychology | 6,851 | 3.9% |
| Social Sciences | 6,416 | 3.6% |
| Engineering | 8,141 | 4.6% |
| Multidisciplinary Studies | 1,122 | 0.6% |
| Science & Technology | 21,193 | 11.9% |
| Business | 37,441 | 21.1% |
| Education | 38,475 | 21.6% |
| Literature & Languages | 4,469 | 2.5% |
| Liberal Arts & History | 6,940 | 3.9% |
| Visual & Performing Arts | 3,826 | 2.1% |
| Communications | 3,554 | 2.0% |
| Arts & Humanities | 16,552 | 9.3% |
| Total | 177,688 | 100.0% |
Transportation & Commute in Area Code 662
Vehicle Availability by Sex in Area Code 662
The most prevalent vehicle ownership categories in Area Code 662 are males with 2 vehicles (98,775, accounting for 40.3%) and females with 2 vehicles (87,903, making up 43.3%).
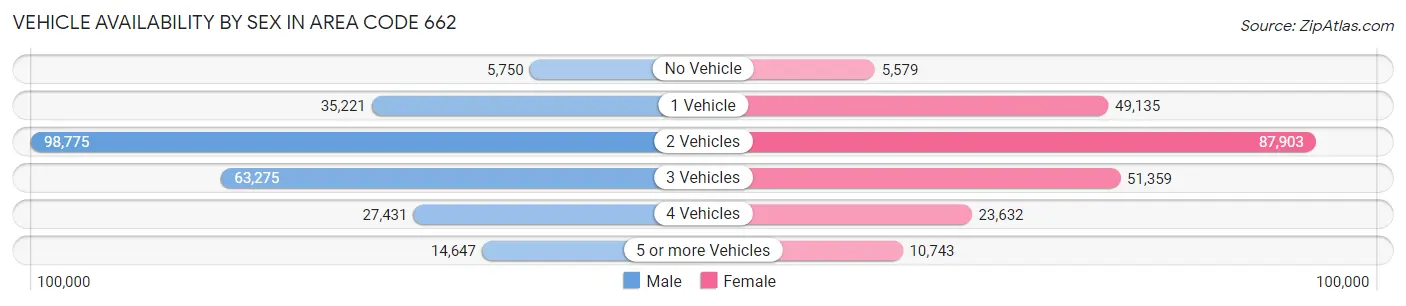
| Vehicles Available | Male | Female |
| No Vehicle | 5,750 (2.4%) | 5,579 (2.4%) |
| 1 Vehicle | 35,221 (14.4%) | 49,135 (21.5%) |
| 2 Vehicles | 98,775 (40.3%) | 87,903 (38.5%) |
| 3 Vehicles | 63,275 (25.8%) | 51,359 (22.5%) |
| 4 Vehicles | 27,431 (11.2%) | 23,632 (10.3%) |
| 5 or more Vehicles | 14,647 (6.0%) | 10,743 (4.7%) |
| Total | 245,099 (100.0%) | 228,351 (100.0%) |
Commute Time in Area Code 662
The most frequently occuring commute durations in Area Code 662 are 10 to 14 minutes (73,907 commuters, 16.2%), 15 to 19 minutes (72,104 commuters, 15.8%), and 30 to 34 minutes (60,381 commuters, 13.2%).
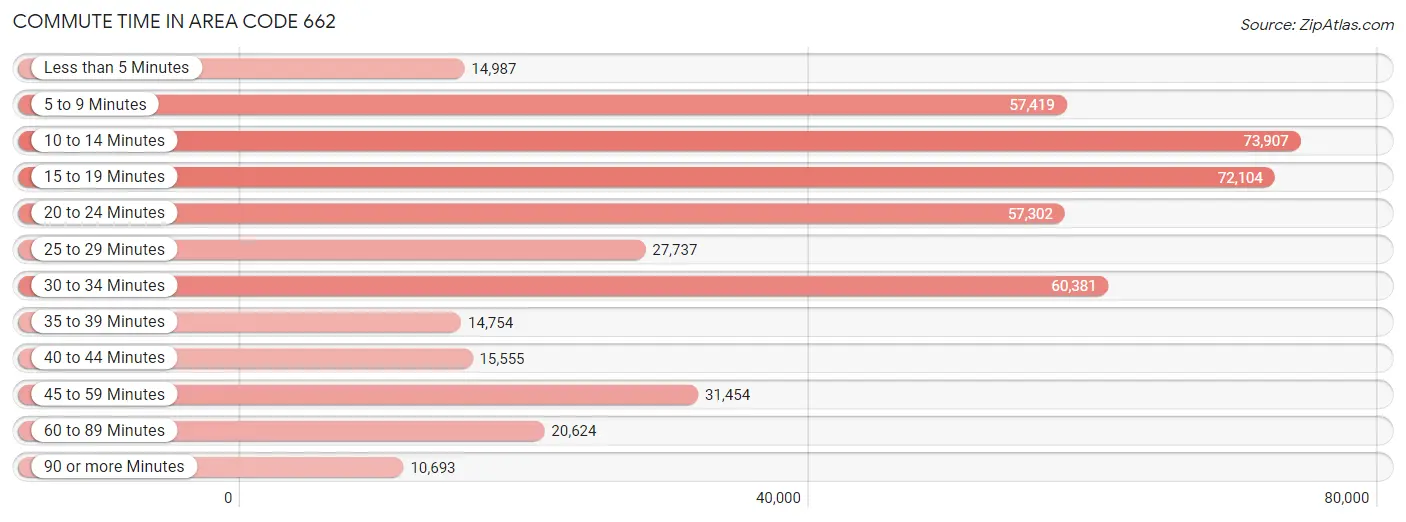
| Commute Time | # Commuters | % Commuters |
| Less than 5 Minutes | 14,987 | 3.3% |
| 5 to 9 Minutes | 57,419 | 12.6% |
| 10 to 14 Minutes | 73,907 | 16.2% |
| 15 to 19 Minutes | 72,104 | 15.8% |
| 20 to 24 Minutes | 57,302 | 12.5% |
| 25 to 29 Minutes | 27,737 | 6.1% |
| 30 to 34 Minutes | 60,381 | 13.2% |
| 35 to 39 Minutes | 14,754 | 3.2% |
| 40 to 44 Minutes | 15,555 | 3.4% |
| 45 to 59 Minutes | 31,454 | 6.9% |
| 60 to 89 Minutes | 20,624 | 4.5% |
| 90 or more Minutes | 10,693 | 2.3% |
Commute Time by Sex in Area Code 662
The most common commute times in Area Code 662 are 15 to 19 minutes (36,498 commuters, 15.4%) for males and 10 to 14 minutes (38,453 commuters, 17.4%) for females.
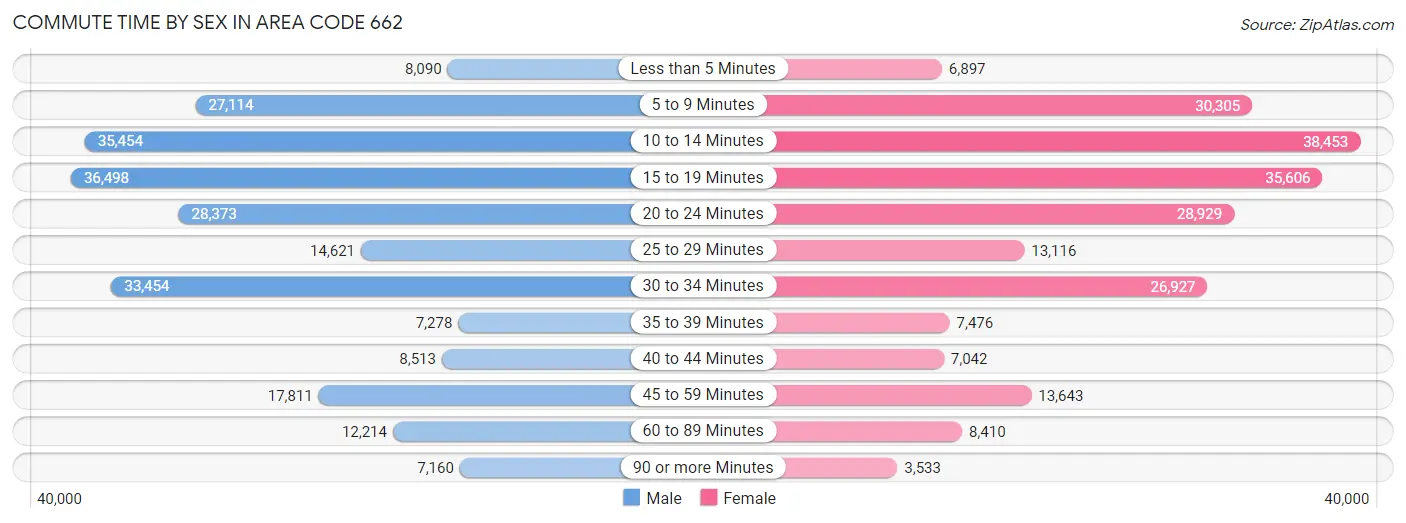
| Commute Time | Male | Female |
| Less than 5 Minutes | 8,090 (3.4%) | 6,897 (3.1%) |
| 5 to 9 Minutes | 27,114 (11.5%) | 30,305 (13.8%) |
| 10 to 14 Minutes | 35,454 (15.0%) | 38,453 (17.4%) |
| 15 to 19 Minutes | 36,498 (15.4%) | 35,606 (16.2%) |
| 20 to 24 Minutes | 28,373 (12.0%) | 28,929 (13.1%) |
| 25 to 29 Minutes | 14,621 (6.2%) | 13,116 (5.9%) |
| 30 to 34 Minutes | 33,454 (14.1%) | 26,927 (12.2%) |
| 35 to 39 Minutes | 7,278 (3.1%) | 7,476 (3.4%) |
| 40 to 44 Minutes | 8,513 (3.6%) | 7,042 (3.2%) |
| 45 to 59 Minutes | 17,811 (7.5%) | 13,643 (6.2%) |
| 60 to 89 Minutes | 12,214 (5.2%) | 8,410 (3.8%) |
| 90 or more Minutes | 7,160 (3.0%) | 3,533 (1.6%) |
Time of Departure to Work by Sex in Area Code 662
The most frequent times of departure to work in Area Code 662 are 7:00 AM to 7:29 AM (37,909, 16.0%) for males and 7:00 AM to 7:29 AM (39,880, 18.1%) for females.
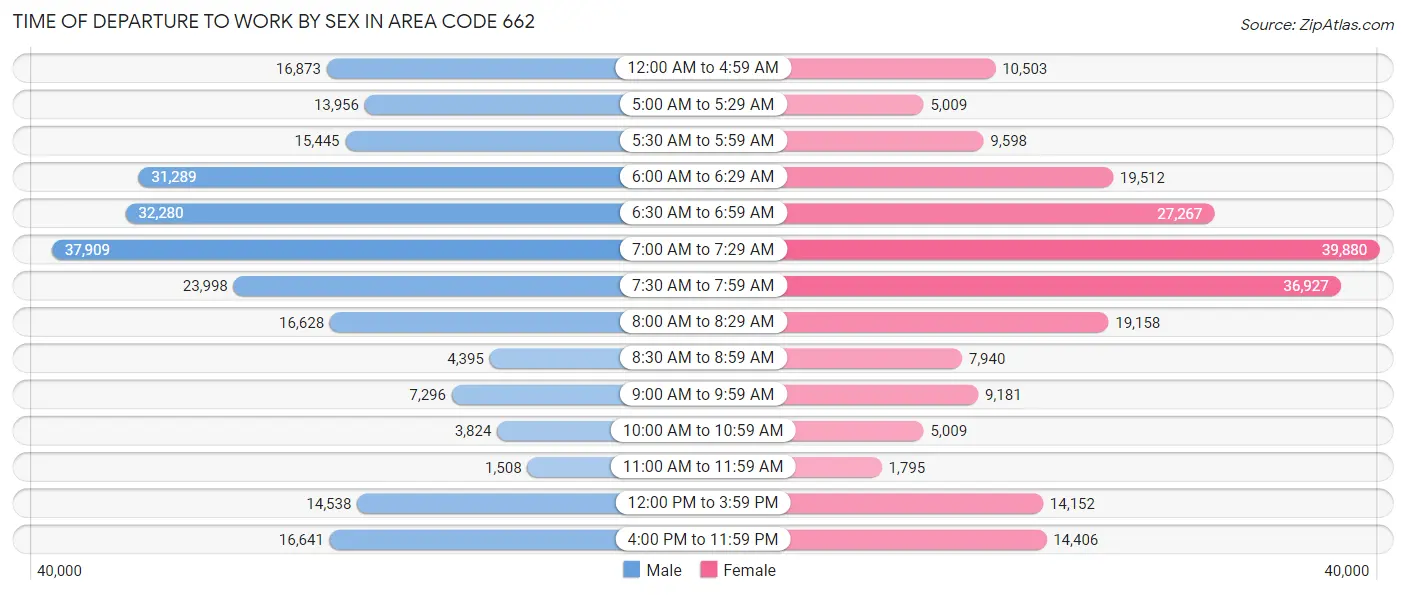
| Time of Departure | Male | Female |
| 12:00 AM to 4:59 AM | 16,873 (7.1%) | 10,503 (4.8%) |
| 5:00 AM to 5:29 AM | 13,956 (5.9%) | 5,009 (2.3%) |
| 5:30 AM to 5:59 AM | 15,445 (6.5%) | 9,598 (4.4%) |
| 6:00 AM to 6:29 AM | 31,289 (13.2%) | 19,512 (8.9%) |
| 6:30 AM to 6:59 AM | 32,280 (13.6%) | 27,267 (12.4%) |
| 7:00 AM to 7:29 AM | 37,909 (16.0%) | 39,880 (18.1%) |
| 7:30 AM to 7:59 AM | 23,998 (10.1%) | 36,927 (16.8%) |
| 8:00 AM to 8:29 AM | 16,628 (7.0%) | 19,158 (8.7%) |
| 8:30 AM to 8:59 AM | 4,395 (1.9%) | 7,940 (3.6%) |
| 9:00 AM to 9:59 AM | 7,296 (3.1%) | 9,181 (4.2%) |
| 10:00 AM to 10:59 AM | 3,824 (1.6%) | 5,009 (2.3%) |
| 11:00 AM to 11:59 AM | 1,508 (0.6%) | 1,795 (0.8%) |
| 12:00 PM to 3:59 PM | 14,538 (6.1%) | 14,152 (6.4%) |
| 4:00 PM to 11:59 PM | 16,641 (7.0%) | 14,406 (6.5%) |
| Total | 236,580 (100.0%) | 220,337 (100.0%) |
Housing Occupancy in Area Code 662
Occupancy by Ownership in Area Code 662
Of the total 435,858 dwellings in Area Code 662, owner-occupied units account for 296,734 (68.1%), while renter-occupied units make up 139,124 (31.9%).
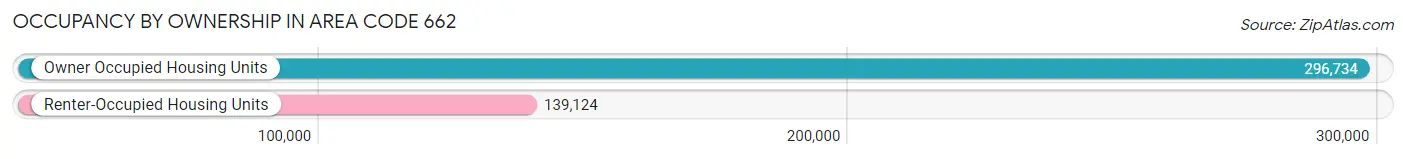
| Occupancy | # Housing Units | % Housing Units |
| Owner Occupied Housing Units | 296,734 | 68.1% |
| Renter-Occupied Housing Units | 139,124 | 31.9% |
| Total Occupied Housing Units | 435,858 | 100.0% |
Occupancy by Household Size in Area Code 662
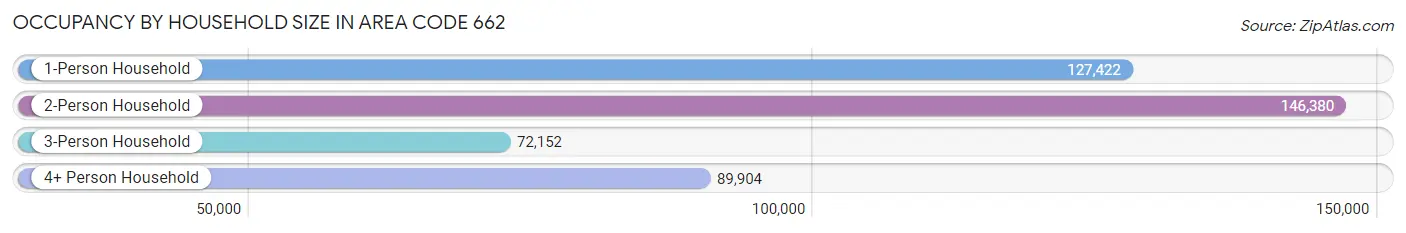
| Household Size | # Housing Units | % Housing Units |
| 1-Person Household | 127,422 | 29.2% |
| 2-Person Household | 146,380 | 33.6% |
| 3-Person Household | 72,152 | 16.6% |
| 4+ Person Household | 89,904 | 20.6% |
| Total Housing Units | 435,858 | 100.0% |
Occupancy by Ownership by Household Size in Area Code 662
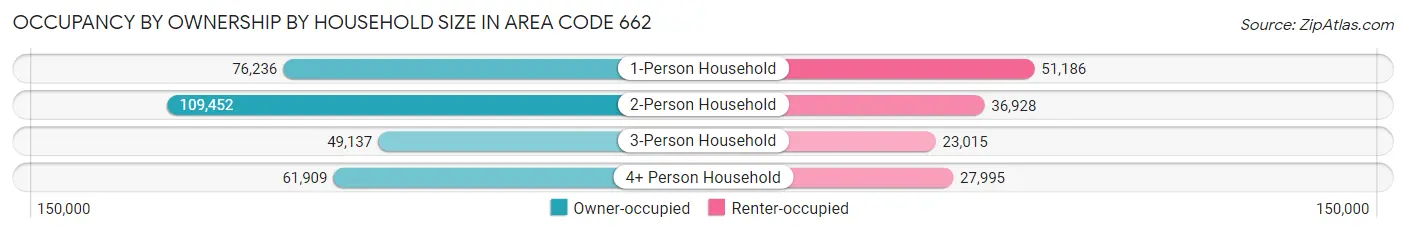
| Household Size | Owner-occupied | Renter-occupied |
| 1-Person Household | 76,236 (59.8%) | 51,186 (40.2%) |
| 2-Person Household | 109,452 (74.8%) | 36,928 (25.2%) |
| 3-Person Household | 49,137 (68.1%) | 23,015 (31.9%) |
| 4+ Person Household | 61,909 (68.9%) | 27,995 (31.1%) |
| Total Housing Units | 296,734 (68.1%) | 139,124 (31.9%) |
Occupancy by Educational Attainment in Area Code 662
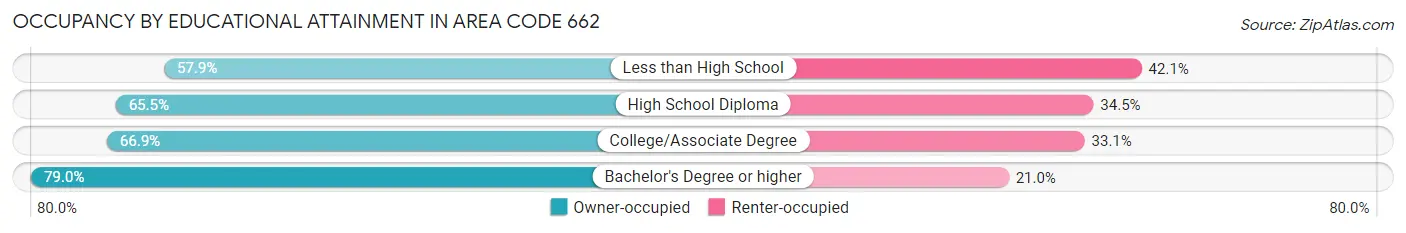
| Household Size | Owner-occupied | Renter-occupied |
| Less than High School | 36,576 (57.9%) | 26,602 (42.1%) |
| High School Diploma | 82,837 (65.5%) | 43,564 (34.5%) |
| College/Associate Degree | 95,579 (66.9%) | 47,199 (33.1%) |
| Bachelor's Degree or higher | 81,742 (79.0%) | 21,759 (21.0%) |
Occupancy by Age of Householder in Area Code 662
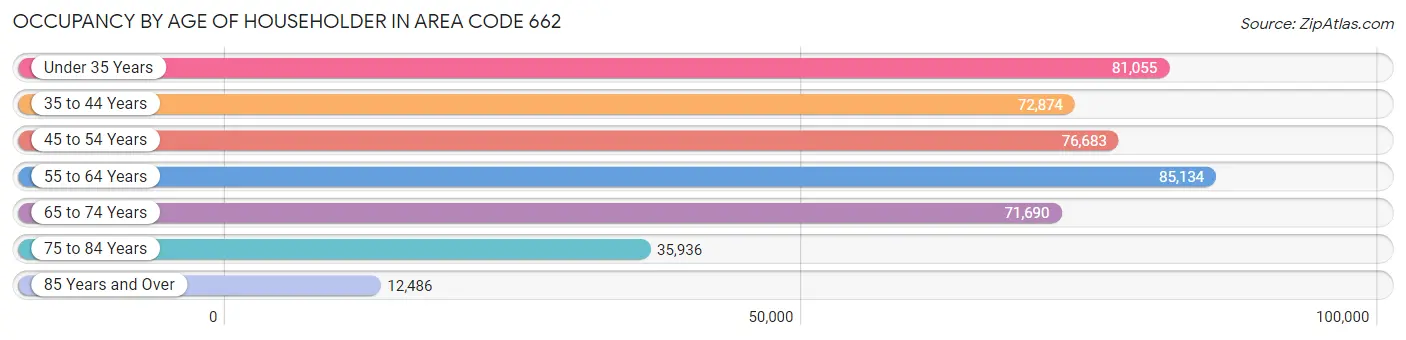
| Age Bracket | # Households | % Households |
| Under 35 Years | 81,055 | 18.6% |
| 35 to 44 Years | 72,874 | 16.7% |
| 45 to 54 Years | 76,683 | 17.6% |
| 55 to 64 Years | 85,134 | 19.5% |
| 65 to 74 Years | 71,690 | 16.5% |
| 75 to 84 Years | 35,936 | 8.2% |
| 85 Years and Over | 12,486 | 2.9% |
| Total | 435,858 | 100.0% |
Housing Finances in Area Code 662
Median Income by Occupancy in Area Code 662
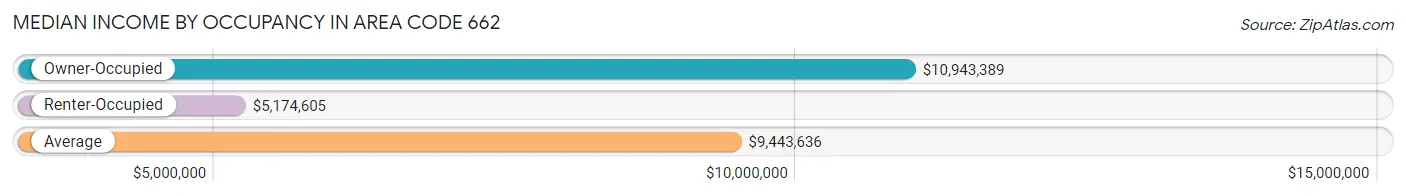
| Occupancy Type | # Households | Median Income |
| Owner-Occupied | 296,734 (68.1%) | $10,943,389 |
| Renter-Occupied | 139,124 (31.9%) | $5,174,605 |
| Average | 435,858 (100.0%) | $9,443,636 |
Occupancy by Householder Income Bracket in Area Code 662
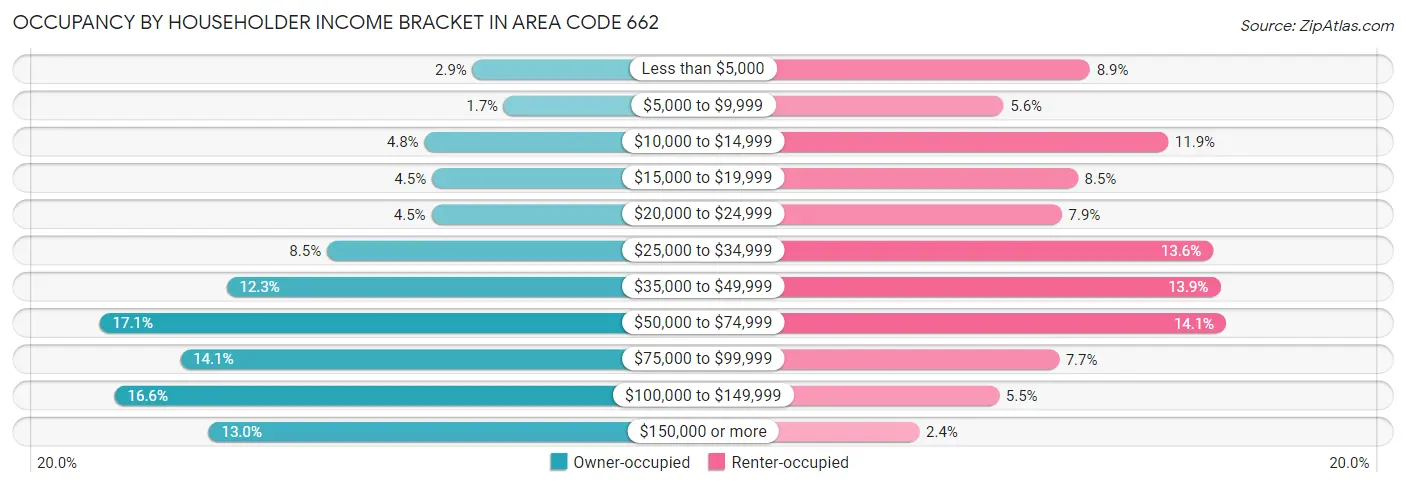
| Income Bracket | Owner-occupied | Renter-occupied |
| Less than $5,000 | 8,698 (2.9%) | 12,416 (8.9%) |
| $5,000 to $9,999 | 5,160 (1.7%) | 7,832 (5.6%) |
| $10,000 to $14,999 | 14,163 (4.8%) | 16,560 (11.9%) |
| $15,000 to $19,999 | 13,299 (4.5%) | 11,769 (8.5%) |
| $20,000 to $24,999 | 13,358 (4.5%) | 10,919 (7.9%) |
| $25,000 to $34,999 | 25,174 (8.5%) | 18,950 (13.6%) |
| $35,000 to $49,999 | 36,526 (12.3%) | 19,325 (13.9%) |
| $50,000 to $74,999 | 50,870 (17.1%) | 19,627 (14.1%) |
| $75,000 to $99,999 | 41,757 (14.1%) | 10,765 (7.7%) |
| $100,000 to $149,999 | 49,175 (16.6%) | 7,591 (5.5%) |
| $150,000 or more | 38,554 (13.0%) | 3,370 (2.4%) |
| Total | 296,734 (100.0%) | 139,124 (100.0%) |
Monthly Housing Cost Tiers in Area Code 662
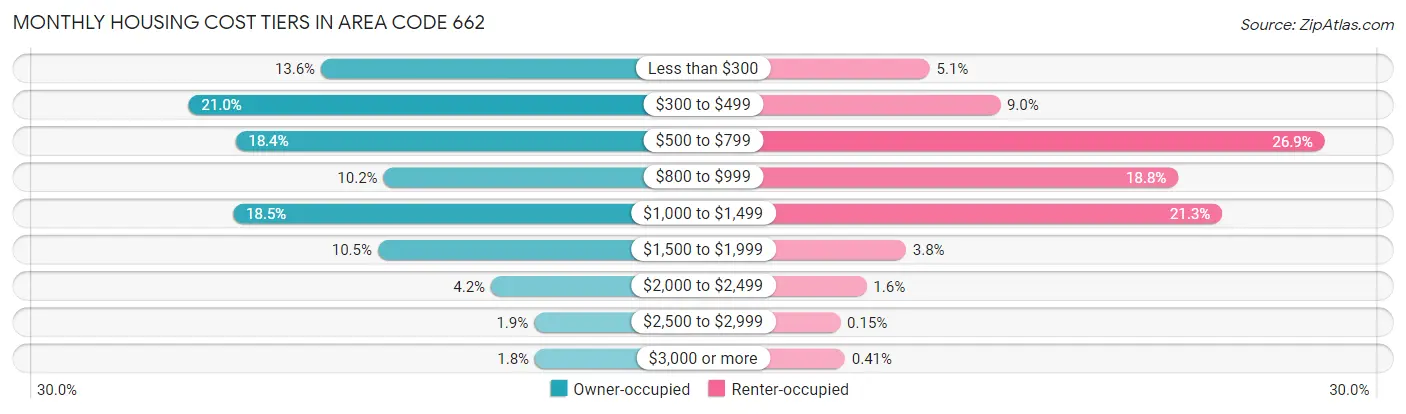
| Monthly Cost | Owner-occupied | Renter-occupied |
| Less than $300 | 40,433 (13.6%) | 7,085 (5.1%) |
| $300 to $499 | 62,174 (20.9%) | 12,498 (9.0%) |
| $500 to $799 | 54,471 (18.4%) | 37,445 (26.9%) |
| $800 to $999 | 30,216 (10.2%) | 26,179 (18.8%) |
| $1,000 to $1,499 | 54,859 (18.5%) | 29,565 (21.2%) |
| $1,500 to $1,999 | 31,118 (10.5%) | 5,257 (3.8%) |
| $2,000 to $2,499 | 12,595 (4.2%) | 2,225 (1.6%) |
| $2,500 to $2,999 | 5,506 (1.9%) | 211 (0.2%) |
| $3,000 or more | 5,362 (1.8%) | 576 (0.4%) |
| Total | 296,734 (100.0%) | 139,124 (100.0%) |
Physical Housing Characteristics in Area Code 662
Housing Structures in Area Code 662
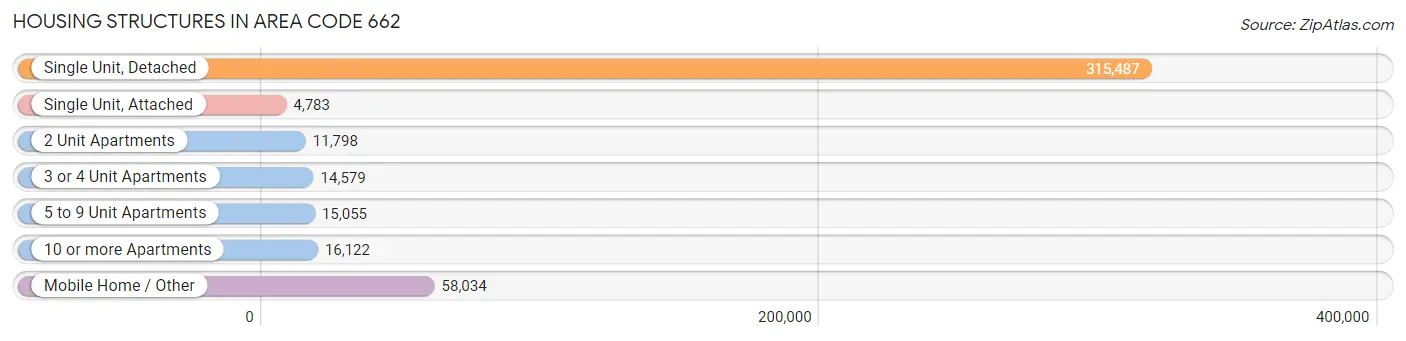
| Structure Type | # Housing Units | % Housing Units |
| Single Unit, Detached | 315,487 | 72.4% |
| Single Unit, Attached | 4,783 | 1.1% |
| 2 Unit Apartments | 11,798 | 2.7% |
| 3 or 4 Unit Apartments | 14,579 | 3.3% |
| 5 to 9 Unit Apartments | 15,055 | 3.5% |
| 10 or more Apartments | 16,122 | 3.7% |
| Mobile Home / Other | 58,034 | 13.3% |
| Total | 435,858 | 100.0% |
Housing Structures by Occupancy in Area Code 662
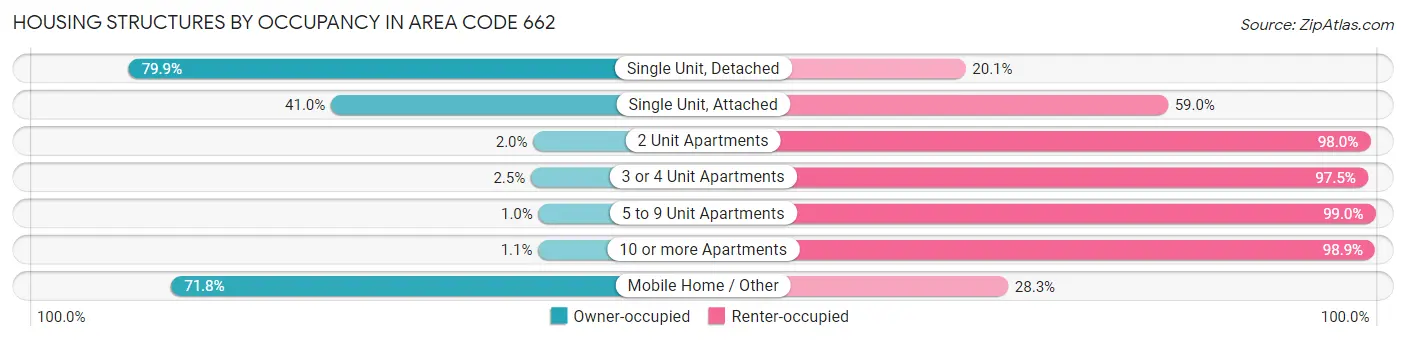
| Structure Type | Owner-occupied | Renter-occupied |
| Single Unit, Detached | 252,200 (79.9%) | 63,287 (20.1%) |
| Single Unit, Attached | 1,960 (41.0%) | 2,823 (59.0%) |
| 2 Unit Apartments | 241 (2.0%) | 11,557 (98.0%) |
| 3 or 4 Unit Apartments | 363 (2.5%) | 14,216 (97.5%) |
| 5 to 9 Unit Apartments | 155 (1.0%) | 14,900 (99.0%) |
| 10 or more Apartments | 175 (1.1%) | 15,947 (98.9%) |
| Mobile Home / Other | 41,640 (71.8%) | 16,394 (28.2%) |
| Total | 296,734 (68.1%) | 139,124 (31.9%) |
Housing Structures by Number of Rooms in Area Code 662
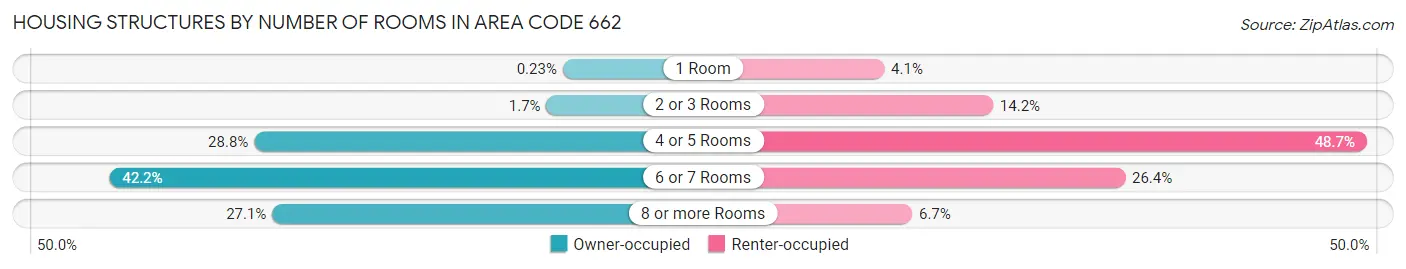
| Number of Rooms | Owner-occupied | Renter-occupied |
| 1 Room | 684 (0.2%) | 5,692 (4.1%) |
| 2 or 3 Rooms | 5,155 (1.7%) | 19,681 (14.1%) |
| 4 or 5 Rooms | 85,364 (28.8%) | 67,785 (48.7%) |
| 6 or 7 Rooms | 125,105 (42.2%) | 36,685 (26.4%) |
| 8 or more Rooms | 80,426 (27.1%) | 9,281 (6.7%) |
| Total | 296,734 (100.0%) | 139,124 (100.0%) |
Housing Structure by Heating Type in Area Code 662
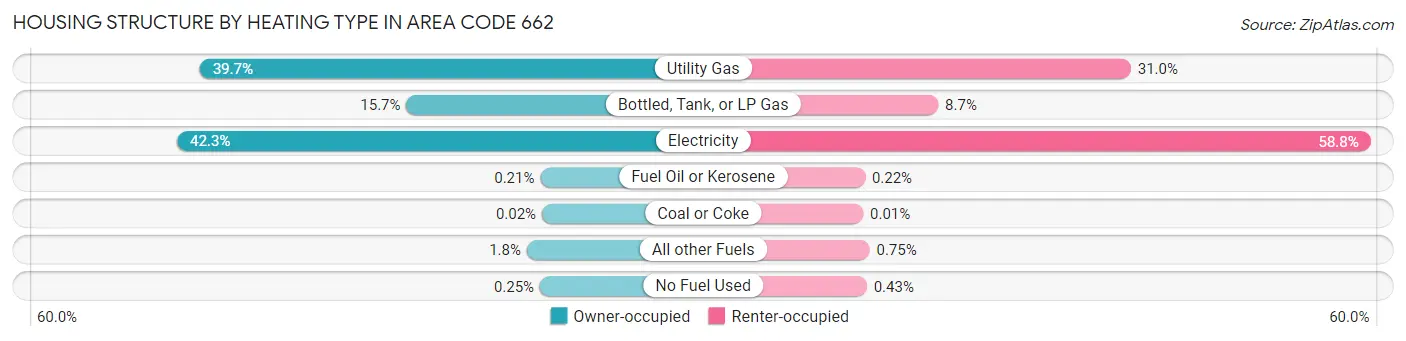
| Heating Type | Owner-occupied | Renter-occupied |
| Utility Gas | 117,770 (39.7%) | 43,181 (31.0%) |
| Bottled, Tank, or LP Gas | 46,703 (15.7%) | 12,120 (8.7%) |
| Electricity | 125,590 (42.3%) | 81,864 (58.8%) |
| Fuel Oil or Kerosene | 615 (0.2%) | 304 (0.2%) |
| Coal or Coke | 67 (0.0%) | 11 (0.0%) |
| All other Fuels | 5,245 (1.8%) | 1,048 (0.7%) |
| No Fuel Used | 744 (0.3%) | 596 (0.4%) |
| Total | 296,734 (100.0%) | 139,124 (100.0%) |
Household Vehicle Usage in Area Code 662
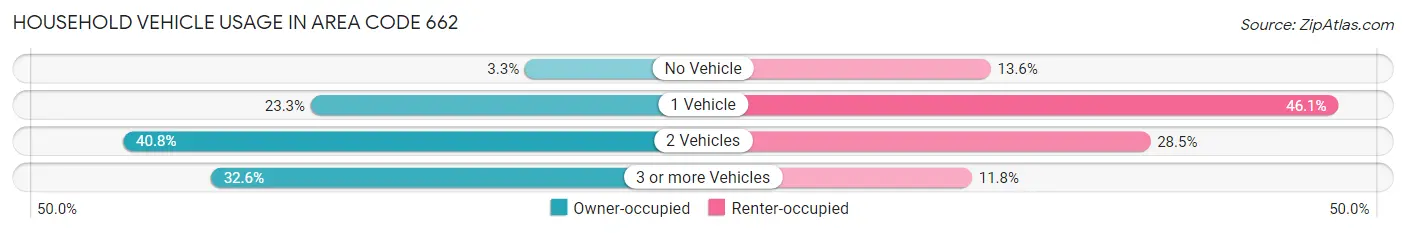
| Vehicles per Household | Owner-occupied | Renter-occupied |
| No Vehicle | 9,777 (3.3%) | 18,926 (13.6%) |
| 1 Vehicle | 69,090 (23.3%) | 64,081 (46.1%) |
| 2 Vehicles | 121,077 (40.8%) | 39,649 (28.5%) |
| 3 or more Vehicles | 96,790 (32.6%) | 16,468 (11.8%) |
| Total | 296,734 (100.0%) | 139,124 (100.0%) |
Real Estate & Mortgages in Area Code 662
Real Estate and Mortgage Overview in Area Code 662
| Characteristic | Without Mortgage | With Mortgage |
| Housing Units | 146,872 | 149,862 |
| Median Property Value | $18,797,099 | $25,594,099 |
| Median Household Income | $8,400,844 | $25,815 |
| Monthly Housing Costs | $80,325 | $5,086 |
| Real Estate Taxes | $106,121 | $20,347 |
Property Value by Mortgage Status in Area Code 662
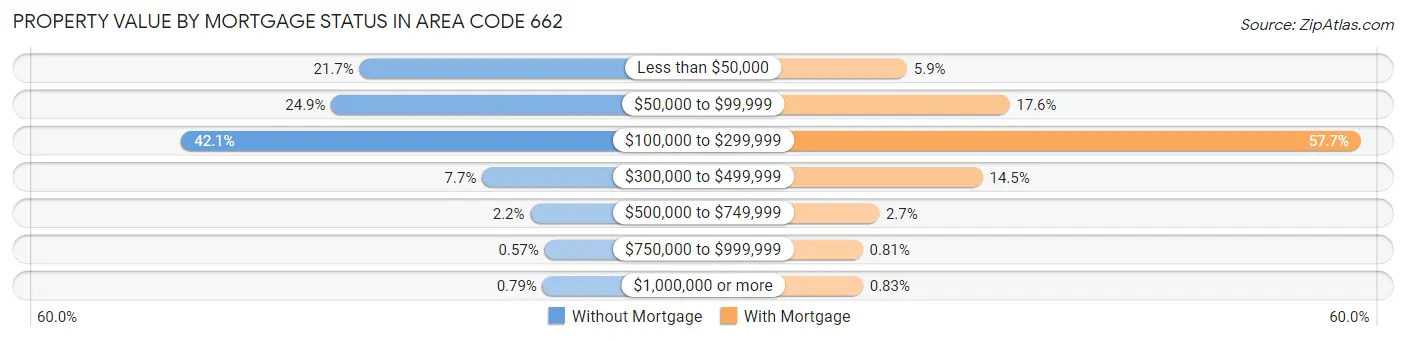
| Property Value | Without Mortgage | With Mortgage |
| Less than $50,000 | 31,899 (21.7%) | 8,775 (5.9%) |
| $50,000 to $99,999 | 36,635 (24.9%) | 26,342 (17.6%) |
| $100,000 to $299,999 | 61,804 (42.1%) | 86,530 (57.7%) |
| $300,000 to $499,999 | 11,316 (7.7%) | 21,739 (14.5%) |
| $500,000 to $749,999 | 3,227 (2.2%) | 4,023 (2.7%) |
| $750,000 to $999,999 | 830 (0.6%) | 1,214 (0.8%) |
| $1,000,000 or more | 1,161 (0.8%) | 1,239 (0.8%) |
| Total | 146,872 (100.0%) | 149,862 (100.0%) |
Household Income by Mortgage Status in Area Code 662
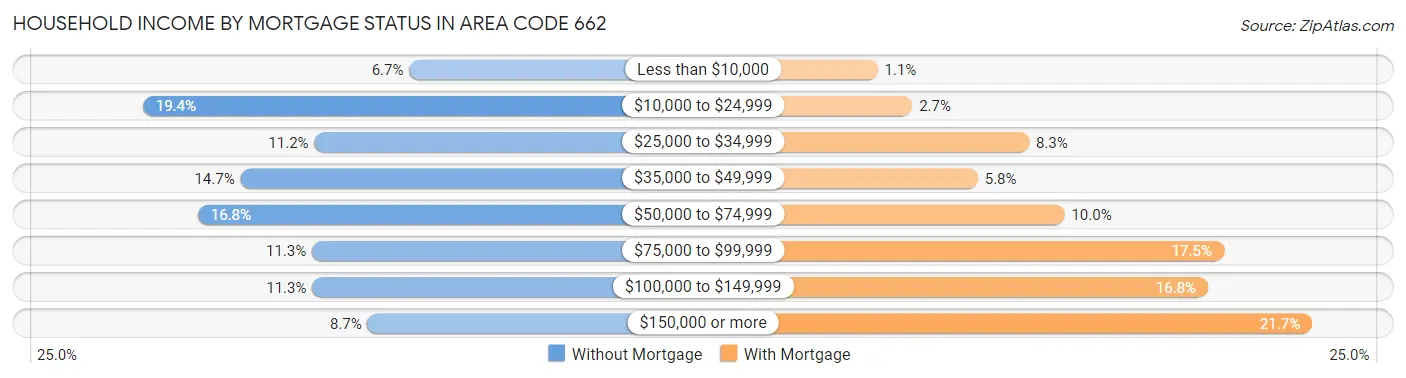
| Household Income | Without Mortgage | With Mortgage |
| Less than $10,000 | 9,814 (6.7%) | 1,571 (1.1%) |
| $10,000 to $24,999 | 28,444 (19.4%) | 4,044 (2.7%) |
| $25,000 to $34,999 | 16,452 (11.2%) | 12,376 (8.3%) |
| $35,000 to $49,999 | 21,622 (14.7%) | 8,722 (5.8%) |
| $50,000 to $74,999 | 24,594 (16.8%) | 14,904 (10.0%) |
| $75,000 to $99,999 | 16,608 (11.3%) | 26,276 (17.5%) |
| $100,000 to $149,999 | 16,599 (11.3%) | 25,149 (16.8%) |
| $150,000 or more | 12,739 (8.7%) | 32,576 (21.7%) |
| Total | 146,872 (100.0%) | 149,862 (100.0%) |
Property Value to Household Income Ratio in Area Code 662
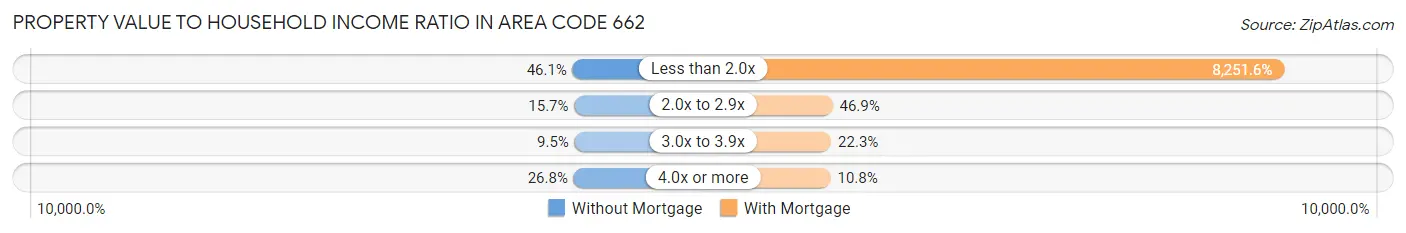
| Value-to-Income Ratio | Without Mortgage | With Mortgage |
| Less than 2.0x | 67,697 (46.1%) | 12,366,068 (8,251.6%) |
| 2.0x to 2.9x | 23,048 (15.7%) | 70,248 (46.9%) |
| 3.0x to 3.9x | 13,990 (9.5%) | 33,460 (22.3%) |
| 4.0x or more | 39,336 (26.8%) | 16,230 (10.8%) |
| Total | 146,872 (100.0%) | 149,862 (100.0%) |
Real Estate Taxes by Mortgage Status in Area Code 662
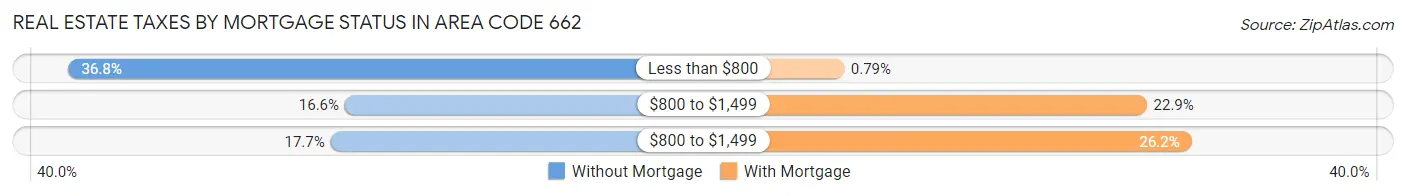
| Property Taxes | Without Mortgage | With Mortgage |
| Less than $800 | 54,039 (36.8%) | 1,182 (0.8%) |
| $800 to $1,499 | 24,380 (16.6%) | 34,337 (22.9%) |
| $800 to $1,499 | 25,919 (17.6%) | 39,252 (26.2%) |
| Total | 146,872 (100.0%) | 149,862 (100.0%) |
Health & Disability in Area Code 662
Health Insurance Coverage by Age in Area Code 662
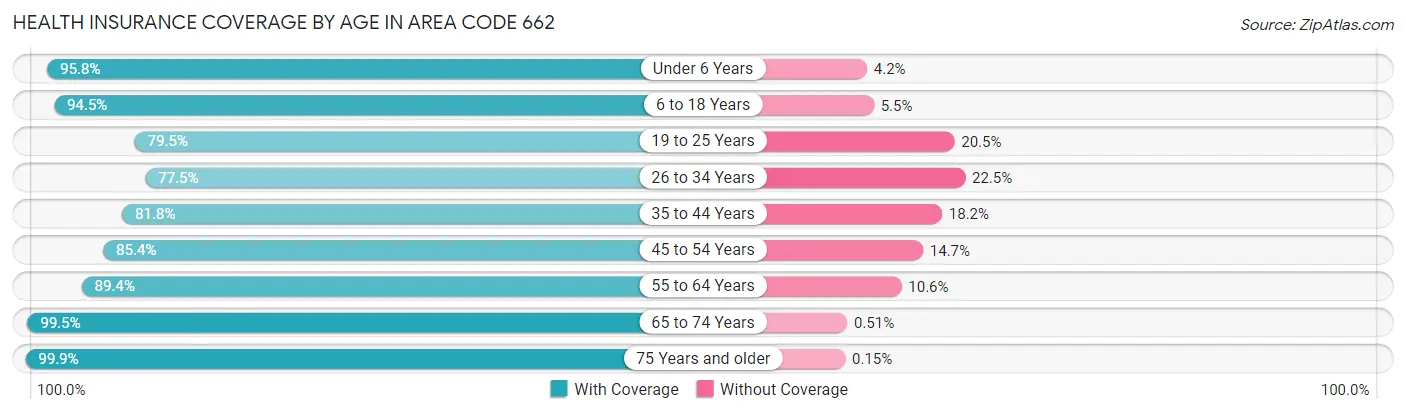
| Age Bracket | With Coverage | Without Coverage |
| Under 6 Years | 80,737 (95.8%) | 3,551 (4.2%) |
| 6 to 18 Years | 193,425 (94.5%) | 11,222 (5.5%) |
| 19 to 25 Years | 95,264 (79.5%) | 24,592 (20.5%) |
| 26 to 34 Years | 98,229 (77.5%) | 28,530 (22.5%) |
| 35 to 44 Years | 112,148 (81.8%) | 24,940 (18.2%) |
| 45 to 54 Years | 116,116 (85.4%) | 19,924 (14.6%) |
| 55 to 64 Years | 126,618 (89.4%) | 15,079 (10.6%) |
| 65 to 74 Years | 109,534 (99.5%) | 566 (0.5%) |
| 75 Years and older | 69,171 (99.9%) | 103 (0.2%) |
| Total | 1,001,242 (88.6%) | 128,507 (11.4%) |
Health Insurance Coverage by Citizenship Status in Area Code 662
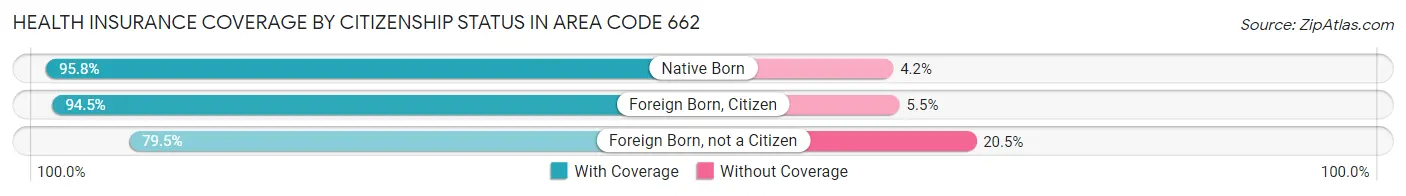
| Citizenship Status | With Coverage | Without Coverage |
| Native Born | 80,737 (95.8%) | 3,551 (4.2%) |
| Foreign Born, Citizen | 193,425 (94.5%) | 11,222 (5.5%) |
| Foreign Born, not a Citizen | 95,264 (79.5%) | 24,592 (20.5%) |
Health Insurance Coverage by Household Income in Area Code 662
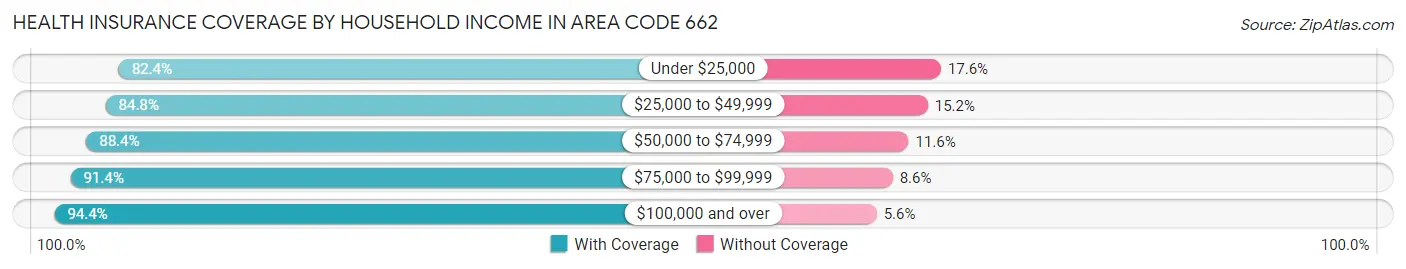
| Household Income | With Coverage | Without Coverage |
| Under $25,000 | 180,566 (82.4%) | 38,675 (17.6%) |
| $25,000 to $49,999 | 199,981 (84.8%) | 35,781 (15.2%) |
| $50,000 to $74,999 | 167,021 (88.4%) | 21,850 (11.6%) |
| $75,000 to $99,999 | 141,348 (91.4%) | 13,302 (8.6%) |
| $100,000 and over | 295,434 (94.4%) | 17,538 (5.6%) |
Public vs Private Health Insurance Coverage by Age in Area Code 662
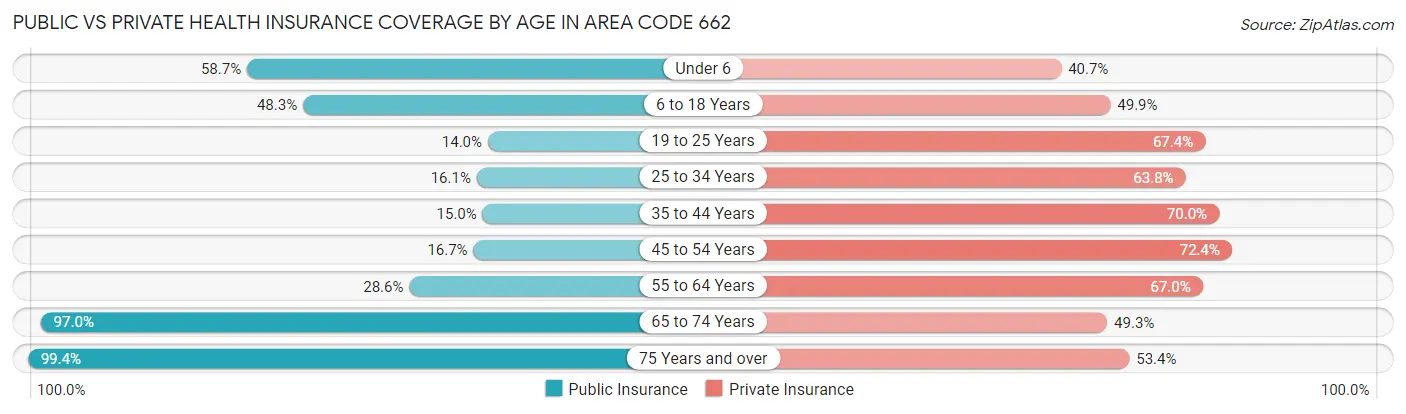
| Age Bracket | Public Insurance | Private Insurance |
| Under 6 | 49,493 (58.7%) | 34,320 (40.7%) |
| 6 to 18 Years | 98,904 (48.3%) | 102,016 (49.8%) |
| 19 to 25 Years | 16,786 (14.0%) | 80,792 (67.4%) |
| 25 to 34 Years | 20,379 (16.1%) | 80,843 (63.8%) |
| 35 to 44 Years | 20,550 (15.0%) | 95,942 (70.0%) |
| 45 to 54 Years | 22,706 (16.7%) | 98,468 (72.4%) |
| 55 to 64 Years | 40,529 (28.6%) | 94,880 (67.0%) |
| 65 to 74 Years | 106,805 (97.0%) | 54,233 (49.3%) |
| 75 Years and over | 68,872 (99.4%) | 36,971 (53.4%) |
| Total | 445,024 (39.4%) | 678,465 (60.1%) |
Disability Status by Sex by Age in Area Code 662
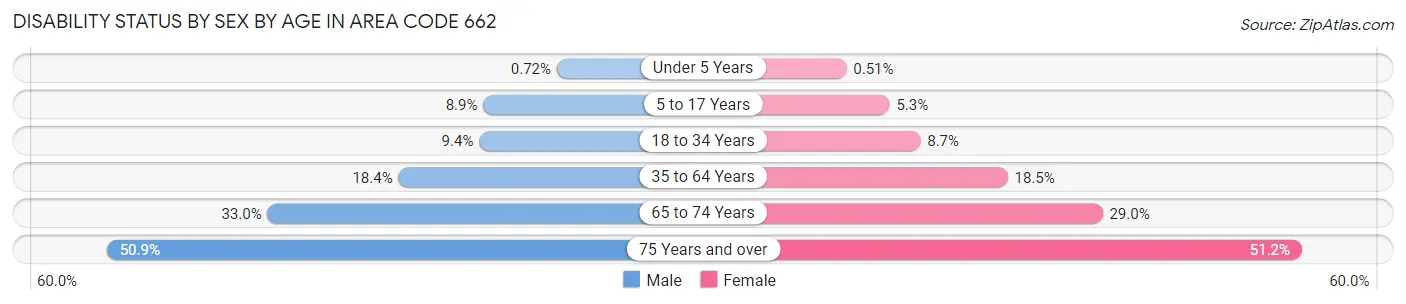
| Age Bracket | Male | Female |
| Under 5 Years | 251 (0.7%) | 175 (0.5%) |
| 5 to 17 Years | 9,099 (8.9%) | 5,212 (5.3%) |
| 18 to 34 Years | 12,443 (9.4%) | 11,683 (8.7%) |
| 35 to 64 Years | 36,232 (18.4%) | 40,142 (18.5%) |
| 65 to 74 Years | 16,743 (33.0%) | 17,210 (29.0%) |
| 75 Years and over | 13,688 (50.8%) | 21,699 (51.2%) |
Disability Class by Sex by Age in Area Code 662
Disability Class: Hearing Difficulty
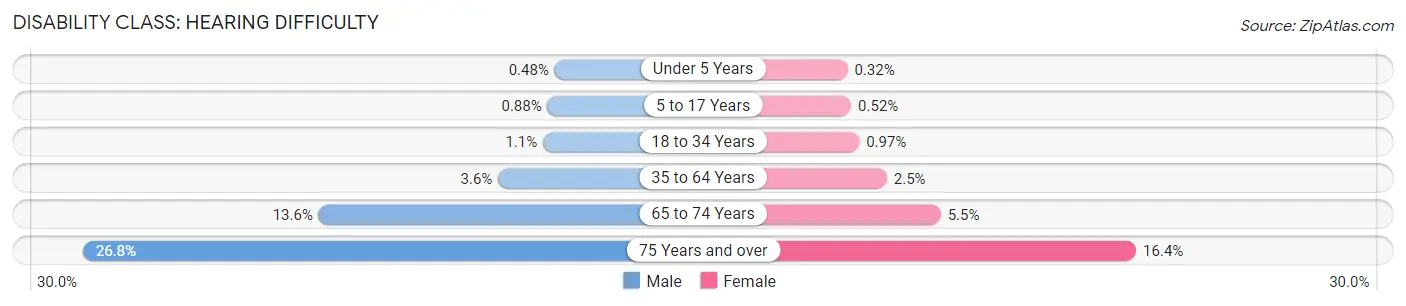
| Age Bracket | Male | Female |
| Under 5 Years | 167 (0.5%) | 108 (0.3%) |
| 5 to 17 Years | 901 (0.9%) | 508 (0.5%) |
| 18 to 34 Years | 1,506 (1.1%) | 1,295 (1.0%) |
| 35 to 64 Years | 7,163 (3.6%) | 5,455 (2.5%) |
| 65 to 74 Years | 6,919 (13.6%) | 3,268 (5.5%) |
| 75 Years and over | 7,203 (26.8%) | 6,942 (16.4%) |
Disability Class: Vision Difficulty
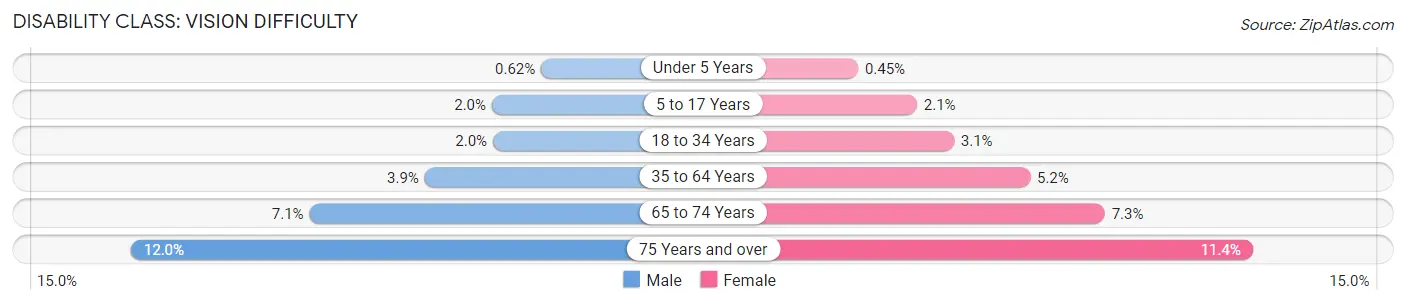
| Age Bracket | Male | Female |
| Under 5 Years | 218 (0.6%) | 154 (0.4%) |
| 5 to 17 Years | 2,030 (2.0%) | 2,054 (2.1%) |
| 18 to 34 Years | 2,602 (2.0%) | 4,177 (3.1%) |
| 35 to 64 Years | 7,621 (3.9%) | 11,394 (5.2%) |
| 65 to 74 Years | 3,593 (7.1%) | 4,340 (7.3%) |
| 75 Years and over | 3,240 (12.0%) | 4,847 (11.4%) |
Disability Class: Cognitive Difficulty
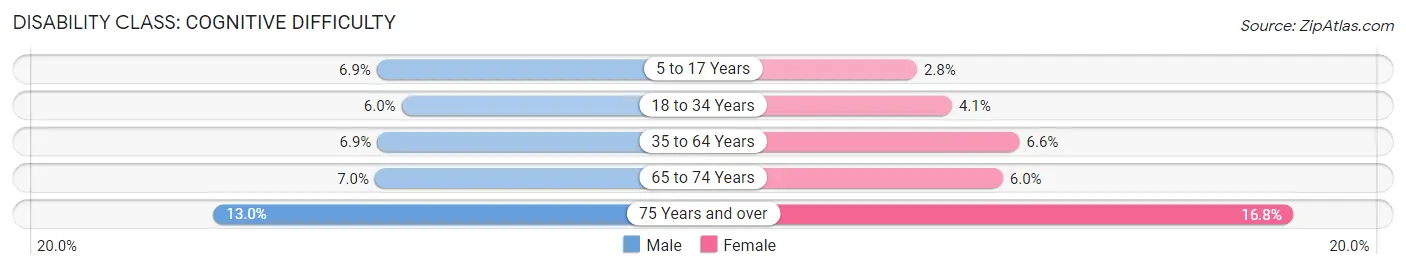
| Age Bracket | Male | Female |
| 5 to 17 Years | 7,067 (6.9%) | 2,735 (2.8%) |
| 18 to 34 Years | 7,984 (6.0%) | 5,463 (4.1%) |
| 35 to 64 Years | 13,639 (6.9%) | 14,355 (6.6%) |
| 65 to 74 Years | 3,555 (7.0%) | 3,543 (6.0%) |
| 75 Years and over | 3,496 (13.0%) | 7,102 (16.8%) |
Disability Class: Ambulatory Difficulty
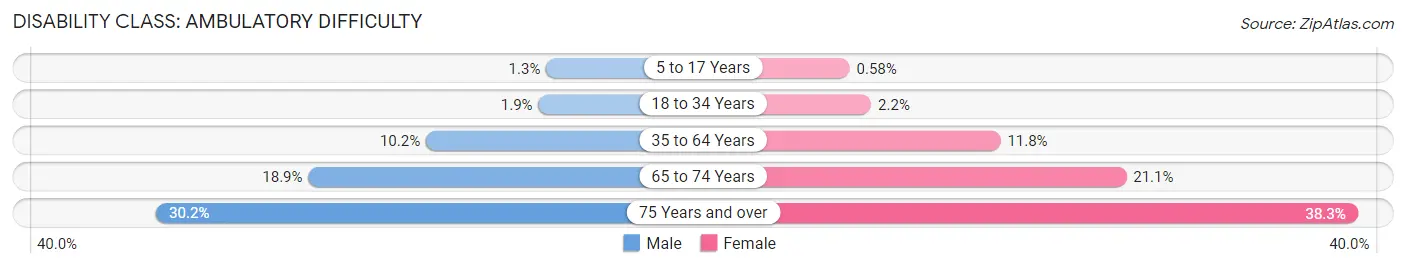
| Age Bracket | Male | Female |
| 5 to 17 Years | 1,293 (1.3%) | 571 (0.6%) |
| 18 to 34 Years | 2,452 (1.8%) | 2,918 (2.2%) |
| 35 to 64 Years | 20,125 (10.2%) | 25,620 (11.8%) |
| 65 to 74 Years | 9,616 (18.9%) | 12,520 (21.1%) |
| 75 Years and over | 8,137 (30.2%) | 16,217 (38.3%) |
Disability Class: Self-Care Difficulty
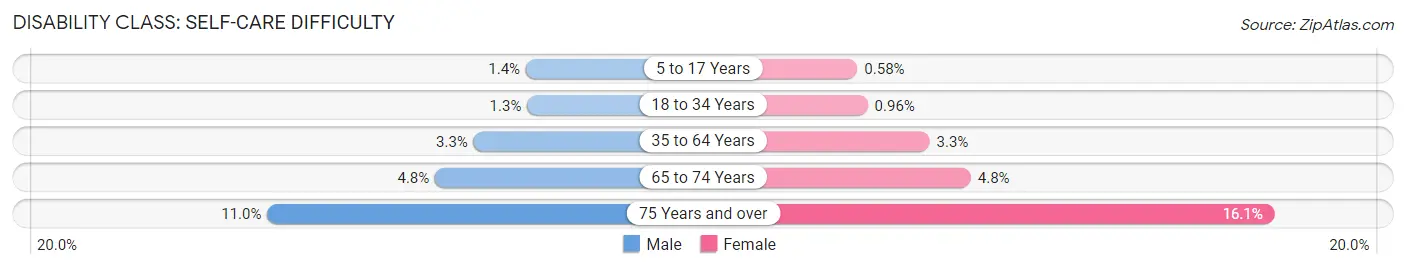
| Age Bracket | Male | Female |
| 5 to 17 Years | 1,417 (1.4%) | 571 (0.6%) |
| 18 to 34 Years | 1,782 (1.3%) | 1,283 (1.0%) |
| 35 to 64 Years | 6,573 (3.3%) | 7,086 (3.3%) |
| 65 to 74 Years | 2,416 (4.8%) | 2,840 (4.8%) |
| 75 Years and over | 2,957 (11.0%) | 6,805 (16.1%) |
Technology Access in Area Code 662
Computing Device Access in Area Code 662
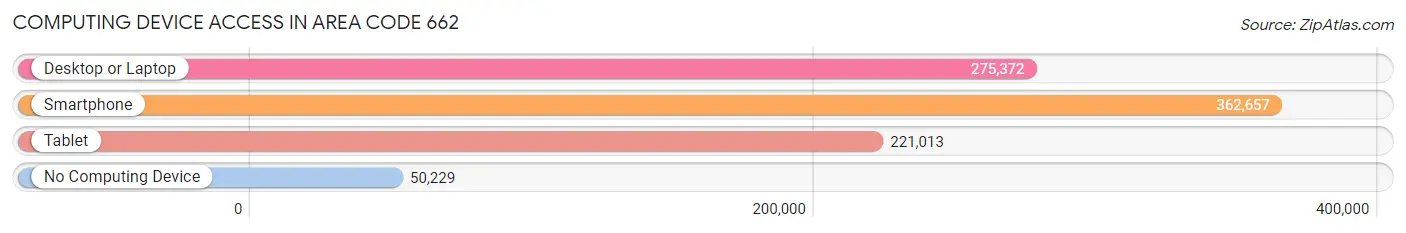
| Device Type | # Households | % Households |
| Desktop or Laptop | 275,372 | 63.2% |
| Smartphone | 362,657 | 83.2% |
| Tablet | 221,013 | 50.7% |
| No Computing Device | 50,229 | 11.5% |
| Total | 435,858 | 100.0% |
Internet Access in Area Code 662
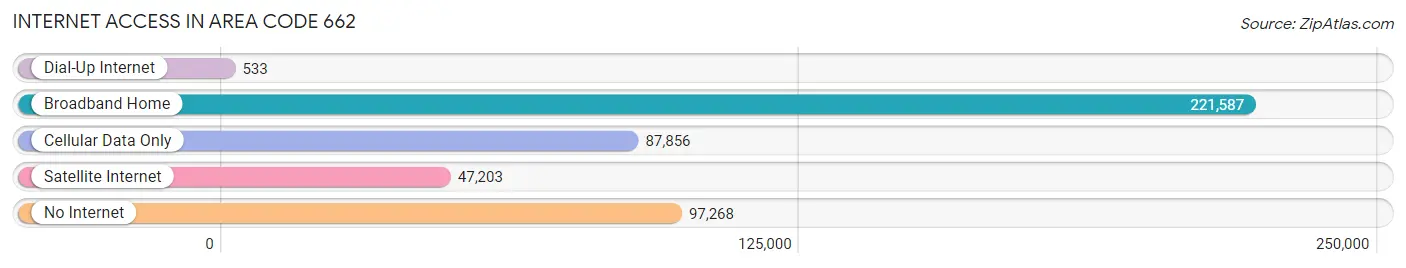
| Internet Type | # Households | % Households |
| Dial-Up Internet | 533 | 0.1% |
| Broadband Home | 221,587 | 50.8% |
| Cellular Data Only | 87,856 | 20.2% |
| Satellite Internet | 47,203 | 10.8% |
| No Internet | 97,268 | 22.3% |
| Total | 435,858 | 100.0% |
Area Code 662 Summary
Geography
Area code 662 is located in the northern part of Mississippi, covering the cities of Tupelo, Columbus, Southaven, and Olive Branch. It also covers parts of the counties of Alcorn, Benton, Calhoun, Chickasaw, Itawamba, Lafayette, Lee, Marshall, Monroe, Pontotoc, Prentiss, Tippah, Tishomingo, and Union.
Social
Area code 662 is home to a variety of cultures and lifestyles. The area is known for its music, art, and food. It is also home to a number of universities and colleges, including the University of Mississippi, Mississippi State University, and the University of Memphis.
Economics
Area code 662 is home to a number of industries, including manufacturing, healthcare, and retail. The area is also home to a number of large companies, such as Nissan, Tyson Foods, and Walmart.
Demographics
Area code 662 is home to a population of over 1.2 million people. The population is largely made up of African Americans, with a smaller percentage of whites and other ethnicities. The median household income is around $40,000, and the median age is around 35.
Common Questions
What is Per Capita Income in Area Code 662?
Per Capita income in Area Code 662 is $25,641.
What is the Median Family Income in Area Code 662?
Median Family Income in Area Code 662 is $59,828.
What is the Median Household income in Area Code 662?
Median Household Income in Area Code 662 is $47,218.
What is Income or Wage Gap in Area Code 662?
Income or Wage Gap in Area Code 662 is 27.6%.
Women in Area Code 662 earn 72.4 cents for every dollar earned by a man.
What is Family Income Deficit in Area Code 662?
Family Income Deficit in Area Code 662 is $11,939.
Families that are below poverty line in Area Code 662 earn $11,939 less on average than the poverty threshold level.
What is Inequality or Gini Index in Area Code 662?
Inequality or Gini Index in Area Code 662 is 94.32.
What is the Total Population of Area Code 662?
Total Population of Area Code 662 is 1,156,870.
What is the Total Male Population of Area Code 662?
Total Male Population of Area Code 662 is 565,520.
What is the Total Female Population of Area Code 662?
Total Female Population of Area Code 662 is 591,350.
What is the Ratio of Males per 100 Females in Area Code 662?
There are 95.63 Males per 100 Females in Area Code 662.
What is the Ratio of Females per 100 Males in Area Code 662?
There are 104.57 Females per 100 Males in Area Code 662.
What is the Median Population Age in Area Code 662?
Median Population Age in Area Code 662 is 40.5 Years.
What is the Average Family Size in Area Code 662
Average Family Size in Area Code 662 is 3.3 People.
What is the Average Household Size in Area Code 662
Average Household Size in Area Code 662 is 2.5 People.
How Large is the Labor Force in Area Code 662?
There are 485,910 People in the Labor Forcein in Area Code 662.
What is the Percentage of People in the Labor Force in Area Code 662?
52.9% of People are in the Labor Force in Area Code 662.
What is the Unemployment Rate in Area Code 662?
Unemployment Rate in Area Code 662 is 8.4%.