Hernando, MS Map & Demographics
Hernando Map
Hernando Overview
$35,172
PER CAPITA INCOME
$87,135
AVG FAMILY INCOME
$69,761
AVG HOUSEHOLD INCOME
6.7%
WAGE / INCOME GAP [ % ]
93.3¢/ $1
WAGE / INCOME GAP [ $ ]
0.44
INEQUALITY / GINI INDEX
17,262
TOTAL POPULATION
8,305
MALE POPULATION
8,957
FEMALE POPULATION
92.72
MALES / 100 FEMALES
107.85
FEMALES / 100 MALES
36.1
MEDIAN AGE
2.9
AVG FAMILY SIZE
2.5
AVG HOUSEHOLD SIZE
8,234
LABOR FORCE [ PEOPLE ]
63.2%
PERCENT IN LABOR FORCE
2.2%
UNEMPLOYMENT RATE
Hernando Zip Codes
Hernando Area Codes
Income in Hernando
Income Overview in Hernando
Per Capita Income in Hernando is $35,172, while median incomes of families and households are $87,135 and $69,761 respectively.
| Characteristic | Number | Measure |
| Per Capita Income | 17,262 | $35,172 |
| Median Family Income | 5,035 | $87,135 |
| Mean Family Income | 5,035 | $101,677 |
| Median Household Income | 6,715 | $69,761 |
| Mean Household Income | 6,715 | $90,616 |
| Income Deficit | 5,035 | $0 |
| Wage / Income Gap (%) | 17,262 | 6.65% |
| Wage / Income Gap ($) | 17,262 | 93.35¢ per $1 |
| Gini / Inequality Index | 17,262 | 0.44 |
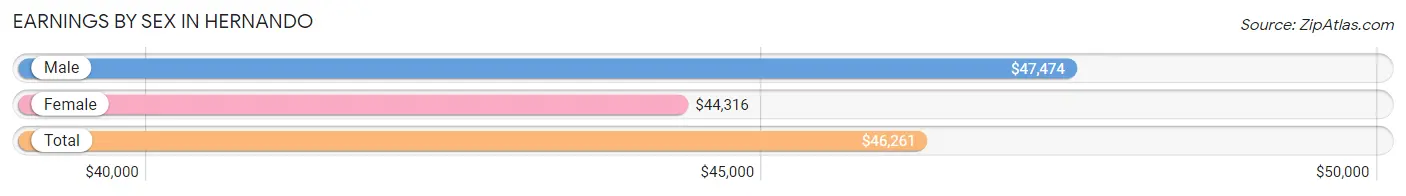
Earnings by Sex in Hernando
Average Earnings in Hernando are $46,261, $47,474 for men and $44,316 for women, a difference of 6.7%.
| Sex | Number | Average Earnings |
| Male | 4,647 (52.6%) | $47,474 |
| Female | 4,180 (47.3%) | $44,316 |
| Total | 8,827 (100.0%) | $46,261 |
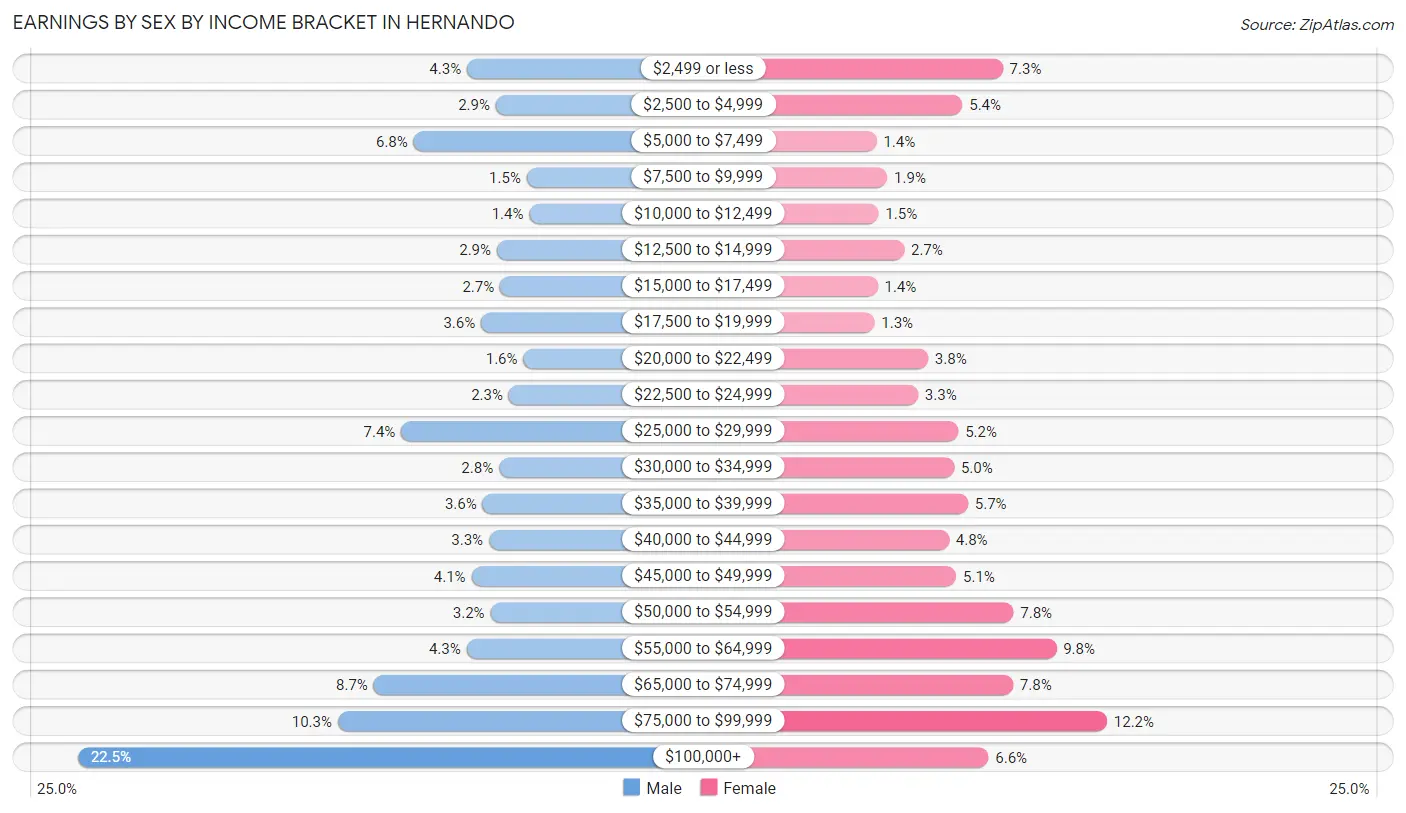
Earnings by Sex by Income Bracket in Hernando
The most common earnings brackets in Hernando are $100,000+ for men (1,046 | 22.5%) and $75,000 to $99,999 for women (509 | 12.2%).
| Income | Male | Female |
| $2,499 or less | 199 (4.3%) | 305 (7.3%) |
| $2,500 to $4,999 | 136 (2.9%) | 226 (5.4%) |
| $5,000 to $7,499 | 315 (6.8%) | 58 (1.4%) |
| $7,500 to $9,999 | 69 (1.5%) | 79 (1.9%) |
| $10,000 to $12,499 | 63 (1.4%) | 62 (1.5%) |
| $12,500 to $14,999 | 134 (2.9%) | 112 (2.7%) |
| $15,000 to $17,499 | 127 (2.7%) | 60 (1.4%) |
| $17,500 to $19,999 | 168 (3.6%) | 54 (1.3%) |
| $20,000 to $22,499 | 76 (1.6%) | 159 (3.8%) |
| $22,500 to $24,999 | 108 (2.3%) | 139 (3.3%) |
| $25,000 to $29,999 | 342 (7.4%) | 218 (5.2%) |
| $30,000 to $34,999 | 129 (2.8%) | 210 (5.0%) |
| $35,000 to $39,999 | 165 (3.5%) | 237 (5.7%) |
| $40,000 to $44,999 | 151 (3.3%) | 200 (4.8%) |
| $45,000 to $49,999 | 189 (4.1%) | 214 (5.1%) |
| $50,000 to $54,999 | 148 (3.2%) | 326 (7.8%) |
| $55,000 to $64,999 | 200 (4.3%) | 410 (9.8%) |
| $65,000 to $74,999 | 402 (8.6%) | 325 (7.8%) |
| $75,000 to $99,999 | 480 (10.3%) | 509 (12.2%) |
| $100,000+ | 1,046 (22.5%) | 277 (6.6%) |
| Total | 4,647 (100.0%) | 4,180 (100.0%) |
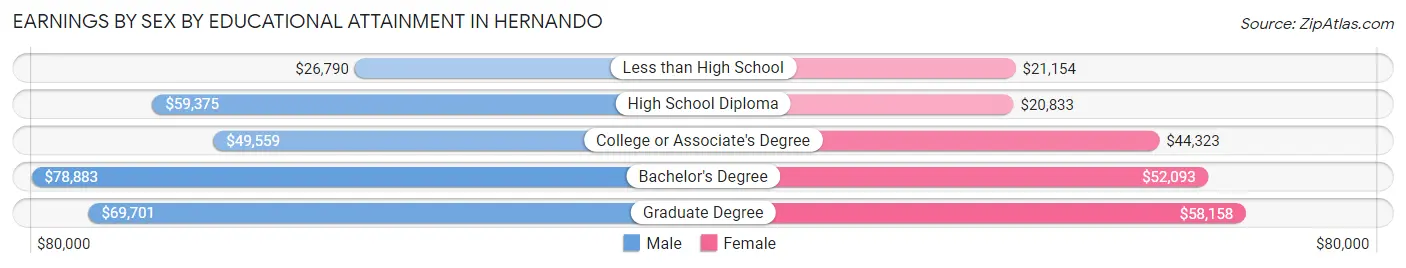
Earnings by Sex by Educational Attainment in Hernando
Average earnings in Hernando are $60,361 for men and $50,099 for women, a difference of 17.0%. Men with an educational attainment of bachelor's degree enjoy the highest average annual earnings of $78,883, while those with less than high school education earn the least with $26,790. Women with an educational attainment of graduate degree earn the most with the average annual earnings of $58,158, while those with high school diploma education have the smallest earnings of $20,833.
| Educational Attainment | Male Income | Female Income |
| Less than High School | $26,790 | $21,154 |
| High School Diploma | $59,375 | $20,833 |
| College or Associate's Degree | $49,559 | $44,323 |
| Bachelor's Degree | $78,883 | $52,093 |
| Graduate Degree | $69,701 | $58,158 |
| Total | $60,361 | $50,099 |
Family Income in Hernando
Family Income Brackets in Hernando
According to the Hernando family income data, there are 1,022 families falling into the $100,000 to $149,999 income range, which is the most common income bracket and makes up 20.3% of all families. Conversely, the $10,000 to $14,999 income bracket is the least frequent group with only 86 families (1.7%) belonging to this category.
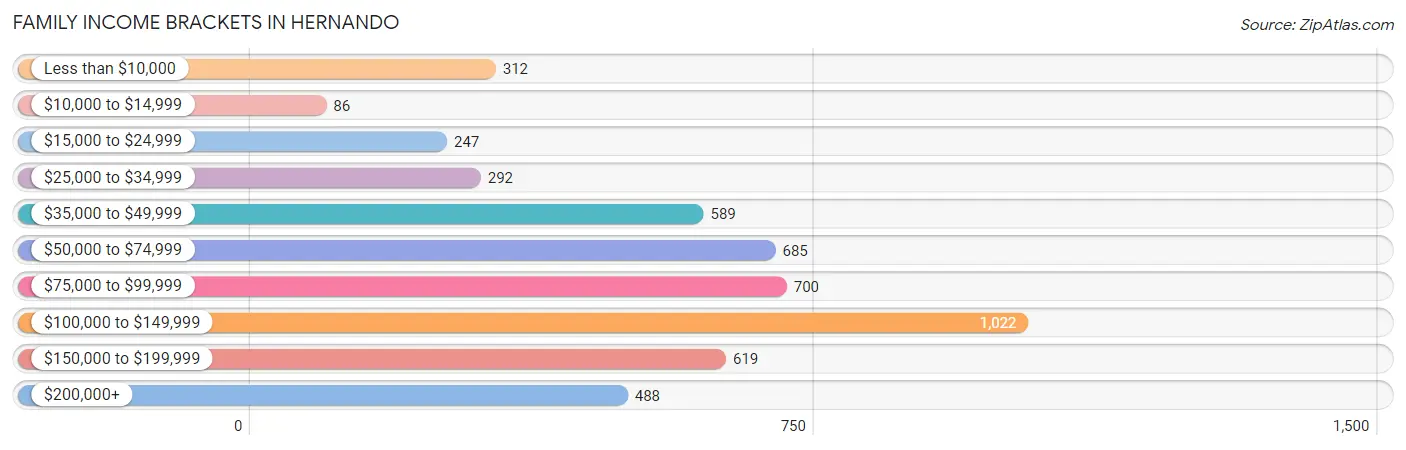
| Income Bracket | # Families | % Families |
| Less than $10,000 | 312 | 6.2% |
| $10,000 to $14,999 | 86 | 1.7% |
| $15,000 to $24,999 | 247 | 4.9% |
| $25,000 to $34,999 | 292 | 5.8% |
| $35,000 to $49,999 | 589 | 11.7% |
| $50,000 to $74,999 | 685 | 13.6% |
| $75,000 to $99,999 | 700 | 13.9% |
| $100,000 to $149,999 | 1,022 | 20.3% |
| $150,000 to $199,999 | 619 | 12.3% |
| $200,000+ | 488 | 9.7% |
Family Income by Famaliy Size in Hernando
4-person families (872 | 17.3%) account for the highest median family income in Hernando with $140,139 per family, while 4-person families (872 | 17.3%) have the highest median income of $35,035 per family member.
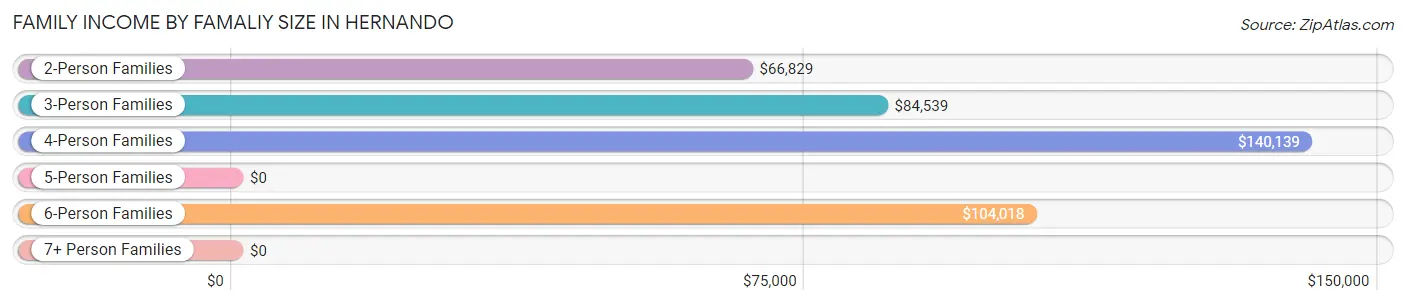
| Income Bracket | # Families | Median Income |
| 2-Person Families | 2,193 (43.6%) | $66,829 |
| 3-Person Families | 1,237 (24.6%) | $84,539 |
| 4-Person Families | 872 (17.3%) | $140,139 |
| 5-Person Families | 618 (12.3%) | $0 |
| 6-Person Families | 92 (1.8%) | $104,018 |
| 7+ Person Families | 23 (0.5%) | $0 |
| Total | 5,035 (100.0%) | $87,135 |
Family Income by Number of Earners in Hernando
The median family income in Hernando is $87,135, with families comprising 3+ earners (378) having the highest median family income of $165,119, while families with no earners (785) have the lowest median family income of $38,956, accounting for 7.5% and 15.6% of families, respectively.
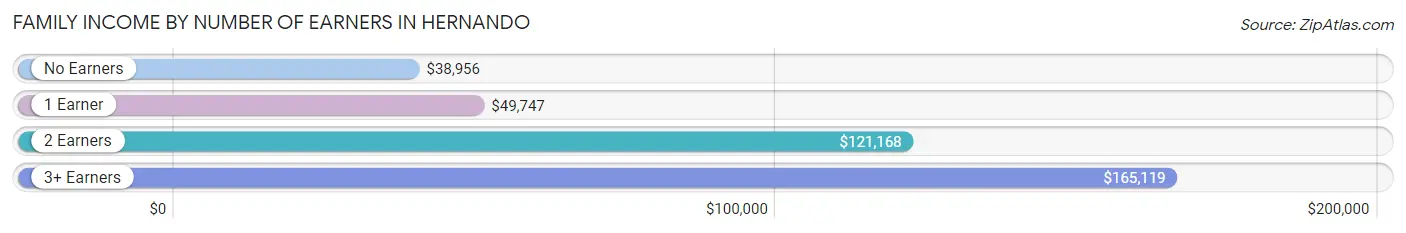
| Number of Earners | # Families | Median Income |
| No Earners | 785 (15.6%) | $38,956 |
| 1 Earner | 1,519 (30.2%) | $49,747 |
| 2 Earners | 2,353 (46.7%) | $121,168 |
| 3+ Earners | 378 (7.5%) | $165,119 |
| Total | 5,035 (100.0%) | $87,135 |
Household Income in Hernando
Household Income Brackets in Hernando
With 1,189 households falling in the category, the $100,000 to $149,999 income range is the most frequent in Hernando, accounting for 17.7% of all households. In contrast, only 255 households (3.8%) fall into the $10,000 to $14,999 income bracket, making it the least populous group.
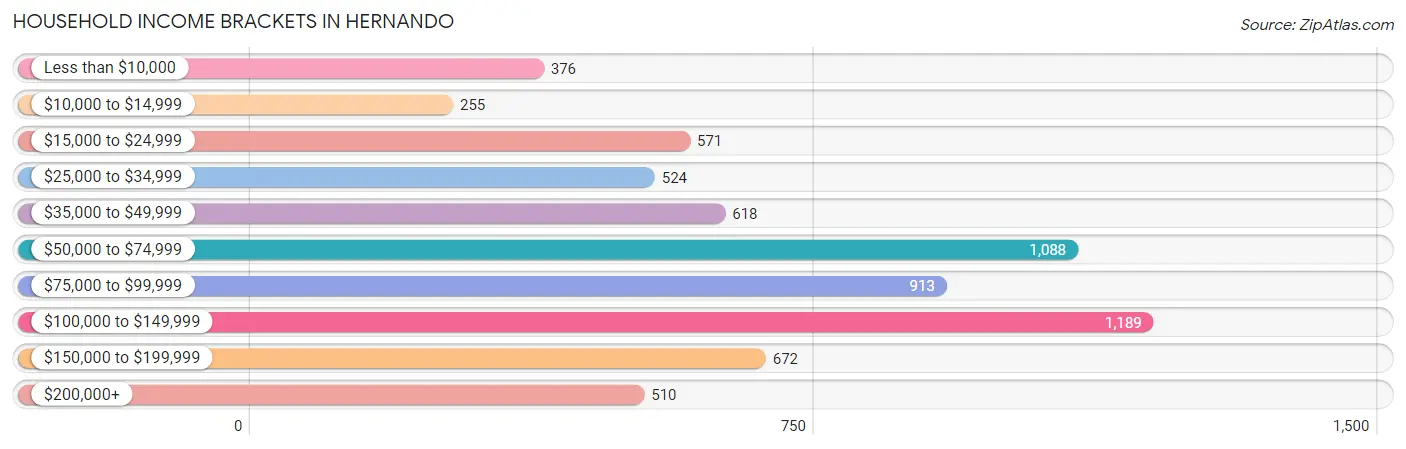
| Income Bracket | # Households | % Households |
| Less than $10,000 | 376 | 5.6% |
| $10,000 to $14,999 | 255 | 3.8% |
| $15,000 to $24,999 | 571 | 8.5% |
| $25,000 to $34,999 | 524 | 7.8% |
| $35,000 to $49,999 | 618 | 9.2% |
| $50,000 to $74,999 | 1,088 | 16.2% |
| $75,000 to $99,999 | 913 | 13.6% |
| $100,000 to $149,999 | 1,189 | 17.7% |
| $150,000 to $199,999 | 672 | 10.0% |
| $200,000+ | 510 | 7.6% |
Household Income by Householder Age in Hernando
The median household income in Hernando is $69,761, with the highest median household income of $95,233 found in the 25 to 44 years age bracket for the primary householder. A total of 2,360 households (35.1%) fall into this category. Meanwhile, the 15 to 24 years age bracket for the primary householder has the lowest median household income of $0, with 183 households (2.7%) in this group.
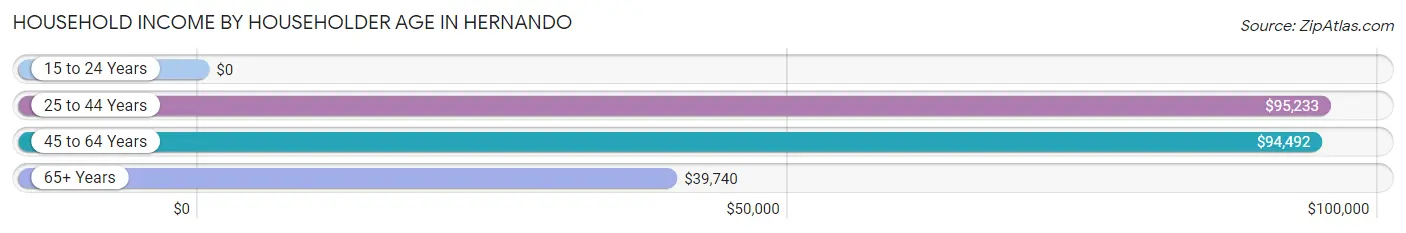
| Income Bracket | # Households | Median Income |
| 15 to 24 Years | 183 (2.7%) | $0 |
| 25 to 44 Years | 2,360 (35.1%) | $95,233 |
| 45 to 64 Years | 2,104 (31.3%) | $94,492 |
| 65+ Years | 2,068 (30.8%) | $39,740 |
| Total | 6,715 (100.0%) | $69,761 |
Poverty in Hernando
Income Below Poverty by Sex and Age in Hernando
With 6.9% poverty level for males and 8.6% for females among the residents of Hernando, 18 to 24 year old males and 15 year old females are the most vulnerable to poverty, with 120 males (20.8%) and 30 females (26.6%) in their respective age groups living below the poverty level.
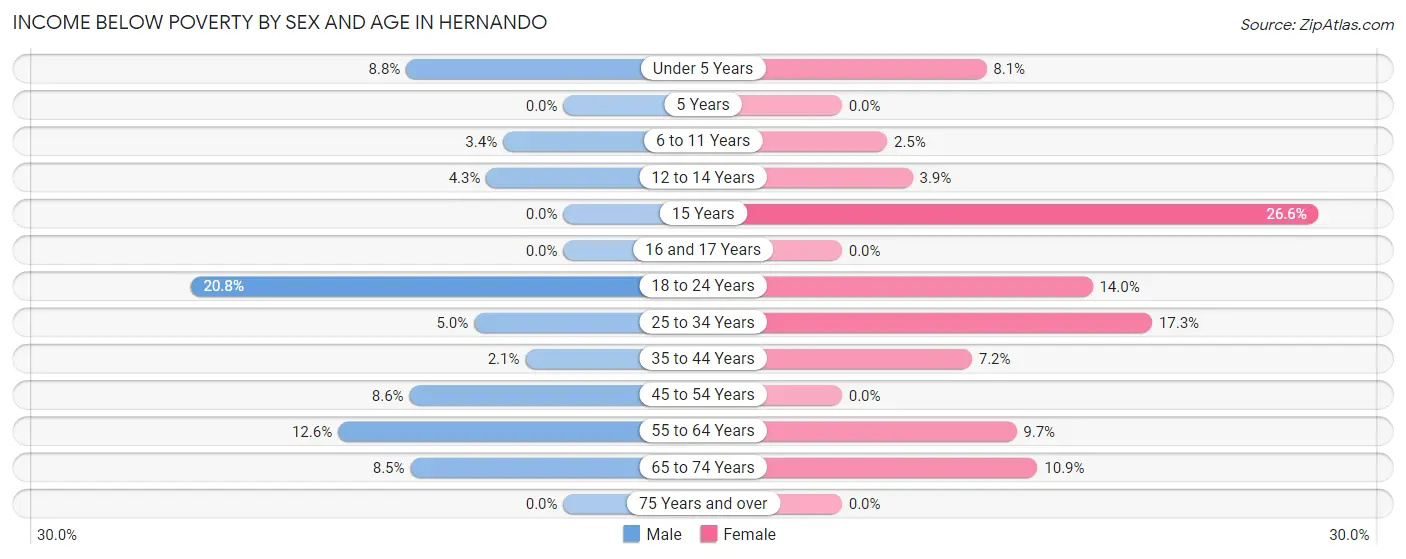
| Age Bracket | Male | Female |
| Under 5 Years | 74 (8.7%) | 48 (8.1%) |
| 5 Years | 0 (0.0%) | 0 (0.0%) |
| 6 to 11 Years | 22 (3.4%) | 16 (2.5%) |
| 12 to 14 Years | 22 (4.3%) | 16 (3.9%) |
| 15 Years | 0 (0.0%) | 30 (26.6%) |
| 16 and 17 Years | 0 (0.0%) | 0 (0.0%) |
| 18 to 24 Years | 120 (20.8%) | 73 (14.0%) |
| 25 to 34 Years | 48 (5.0%) | 261 (17.3%) |
| 35 to 44 Years | 24 (2.1%) | 81 (7.2%) |
| 45 to 54 Years | 87 (8.6%) | 0 (0.0%) |
| 55 to 64 Years | 90 (12.6%) | 83 (9.7%) |
| 65 to 74 Years | 71 (8.5%) | 145 (10.9%) |
| 75 Years and over | 0 (0.0%) | 0 (0.0%) |
| Total | 558 (6.9%) | 753 (8.6%) |
Income Above Poverty by Sex and Age in Hernando
According to the poverty statistics in Hernando, males aged 5 years and females aged 5 years are the age groups that are most secure financially, with 100.0% of males and 100.0% of females in these age groups living above the poverty line.
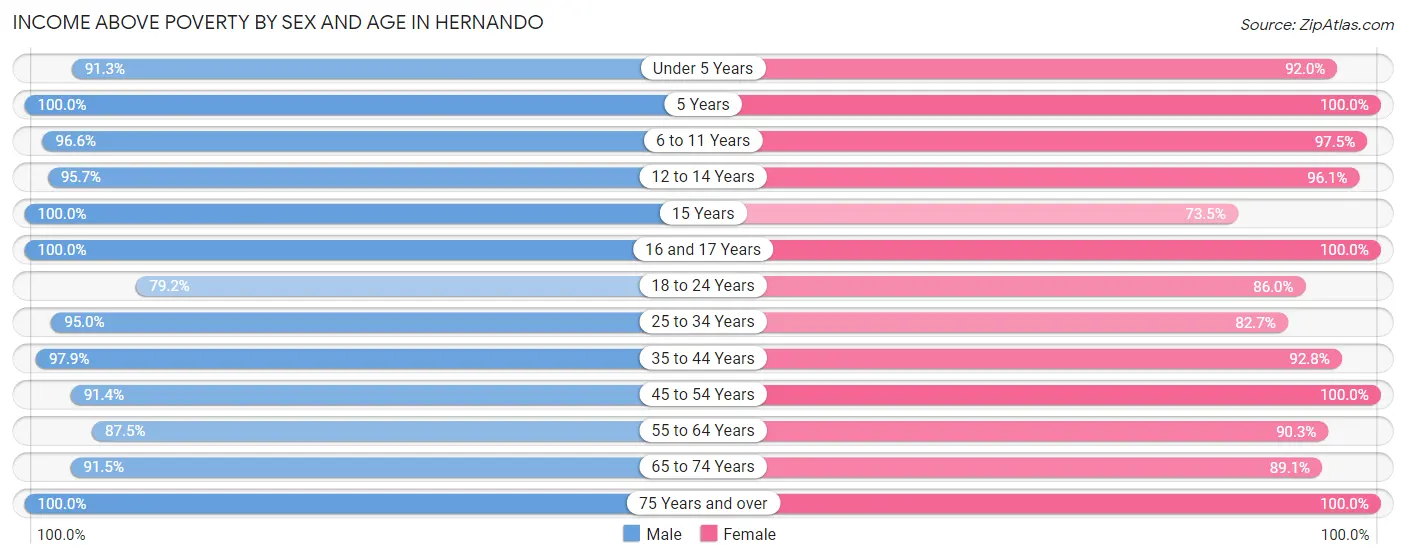
| Age Bracket | Male | Female |
| Under 5 Years | 772 (91.2%) | 548 (91.9%) |
| 5 Years | 54 (100.0%) | 41 (100.0%) |
| 6 to 11 Years | 633 (96.6%) | 619 (97.5%) |
| 12 to 14 Years | 491 (95.7%) | 390 (96.1%) |
| 15 Years | 172 (100.0%) | 83 (73.5%) |
| 16 and 17 Years | 118 (100.0%) | 265 (100.0%) |
| 18 to 24 Years | 458 (79.2%) | 450 (86.0%) |
| 25 to 34 Years | 918 (95.0%) | 1,250 (82.7%) |
| 35 to 44 Years | 1,108 (97.9%) | 1,038 (92.8%) |
| 45 to 54 Years | 928 (91.4%) | 876 (100.0%) |
| 55 to 64 Years | 627 (87.5%) | 771 (90.3%) |
| 65 to 74 Years | 762 (91.5%) | 1,187 (89.1%) |
| 75 Years and over | 482 (100.0%) | 473 (100.0%) |
| Total | 7,523 (93.1%) | 7,991 (91.4%) |
Income Below Poverty Among Married-Couple Families in Hernando
The poverty statistics for married-couple families in Hernando show that 4.8% or 186 of the total 3,898 families live below the poverty line. Families with 1 or 2 children have the highest poverty rate of 6.8%, comprising of 100 families. On the other hand, families with 5 or more children have the lowest poverty rate of 0.0%, which includes 0 families.
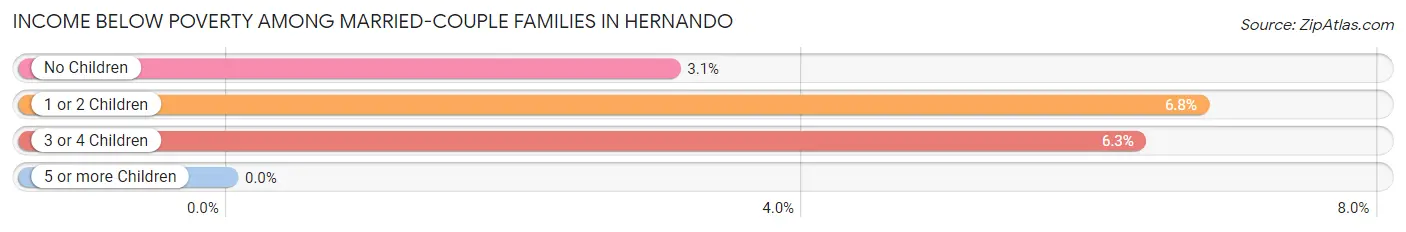
| Children | Above Poverty | Below Poverty |
| No Children | 1,954 (96.9%) | 62 (3.1%) |
| 1 or 2 Children | 1,379 (93.2%) | 100 (6.8%) |
| 3 or 4 Children | 356 (93.7%) | 24 (6.3%) |
| 5 or more Children | 23 (100.0%) | 0 (0.0%) |
| Total | 3,712 (95.2%) | 186 (4.8%) |
Income Below Poverty Among Single-Parent Households in Hernando
According to the poverty data in Hernando, 12.5% or 41 single-father households and 30.1% or 244 single-mother households are living below the poverty line. Among single-father households, those with no children have the highest poverty rate, with 41 households (31.3%) experiencing poverty. Likewise, among single-mother households, those with 1 or 2 children have the highest poverty rate, with 231 households (32.9%) falling below the poverty line.
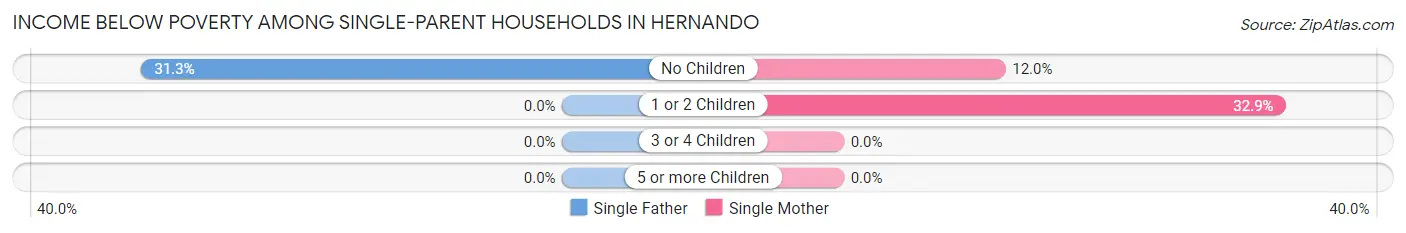
| Children | Single Father | Single Mother |
| No Children | 41 (31.3%) | 13 (12.0%) |
| 1 or 2 Children | 0 (0.0%) | 231 (32.9%) |
| 3 or 4 Children | 0 (0.0%) | 0 (0.0%) |
| 5 or more Children | 0 (0.0%) | 0 (0.0%) |
| Total | 41 (12.5%) | 244 (30.1%) |
Income Below Poverty Among Married-Couple vs Single-Parent Households in Hernando
The poverty data for Hernando shows that 186 of the married-couple family households (4.8%) and 285 of the single-parent households (25.1%) are living below the poverty level. Within the married-couple family households, those with 1 or 2 children have the highest poverty rate, with 100 households (6.8%) falling below the poverty line. Among the single-parent households, those with 1 or 2 children have the highest poverty rate, with 231 household (26.3%) living below poverty.
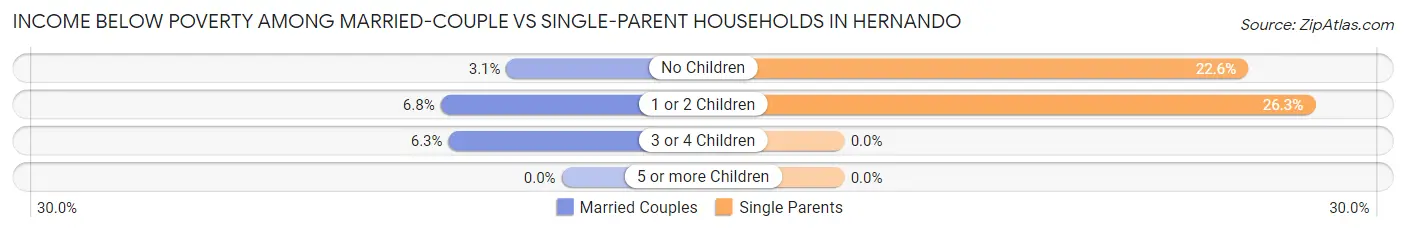
| Children | Married-Couple Families | Single-Parent Households |
| No Children | 62 (3.1%) | 54 (22.6%) |
| 1 or 2 Children | 100 (6.8%) | 231 (26.3%) |
| 3 or 4 Children | 24 (6.3%) | 0 (0.0%) |
| 5 or more Children | 0 (0.0%) | 0 (0.0%) |
| Total | 186 (4.8%) | 285 (25.1%) |
Race in Hernando
The most populous races in Hernando are White / Caucasian (13,193 | 76.4%), Black / African American (3,200 | 18.5%), and Hispanic or Latino (894 | 5.2%).
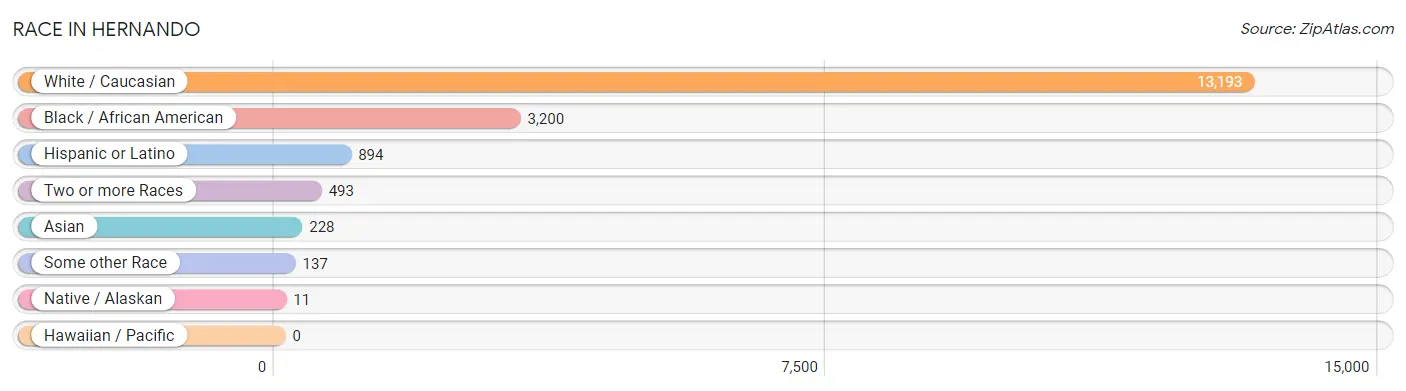
| Race | # Population | % Population |
| Asian | 228 | 1.3% |
| Black / African American | 3,200 | 18.5% |
| Hawaiian / Pacific | 0 | 0.0% |
| Hispanic or Latino | 894 | 5.2% |
| Native / Alaskan | 11 | 0.1% |
| White / Caucasian | 13,193 | 76.4% |
| Two or more Races | 493 | 2.9% |
| Some other Race | 137 | 0.8% |
| Total | 17,262 | 100.0% |
Ancestry in Hernando
The most populous ancestries reported in Hernando are English (2,320 | 13.4%), American (1,590 | 9.2%), Irish (1,580 | 9.1%), German (846 | 4.9%), and Mexican (726 | 4.2%), together accounting for 40.9% of all Hernando residents.
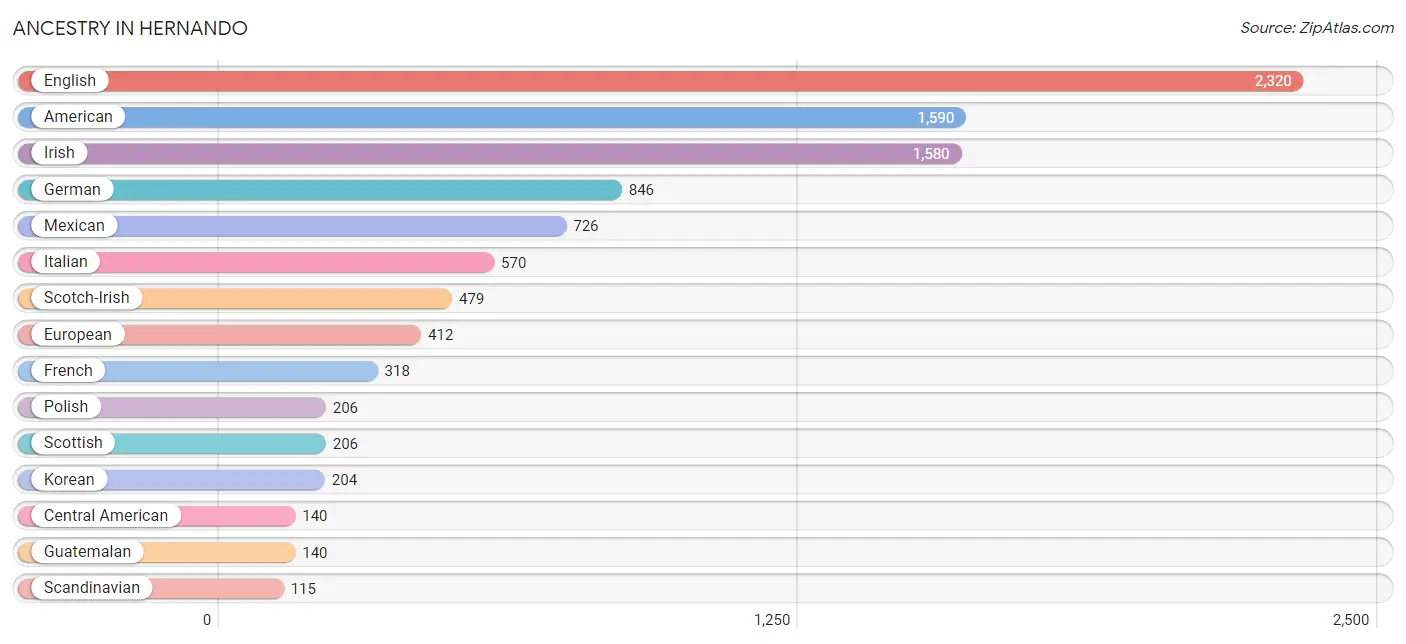
| Ancestry | # Population | % Population |
| African | 9 | 0.1% |
| American | 1,590 | 9.2% |
| Arab | 64 | 0.4% |
| Austrian | 8 | 0.1% |
| Bhutanese | 111 | 0.6% |
| British | 46 | 0.3% |
| Bulgarian | 11 | 0.1% |
| Burmese | 9 | 0.1% |
| Cajun | 10 | 0.1% |
| Central American | 140 | 0.8% |
| Cherokee | 27 | 0.2% |
| Choctaw | 11 | 0.1% |
| Danish | 86 | 0.5% |
| Dutch | 93 | 0.5% |
| English | 2,320 | 13.4% |
| European | 412 | 2.4% |
| Finnish | 17 | 0.1% |
| French | 318 | 1.8% |
| French Canadian | 30 | 0.2% |
| German | 846 | 4.9% |
| Guatemalan | 140 | 0.8% |
| Indian (Asian) | 36 | 0.2% |
| Irish | 1,580 | 9.1% |
| Iroquois | 4 | 0.0% |
| Italian | 570 | 3.3% |
| Korean | 204 | 1.2% |
| Lebanese | 18 | 0.1% |
| Mexican | 726 | 4.2% |
| Moroccan | 46 | 0.3% |
| Norwegian | 12 | 0.1% |
| Peruvian | 6 | 0.0% |
| Polish | 206 | 1.2% |
| Puerto Rican | 22 | 0.1% |
| Romanian | 48 | 0.3% |
| Russian | 20 | 0.1% |
| Scandinavian | 115 | 0.7% |
| Scotch-Irish | 479 | 2.8% |
| Scottish | 206 | 1.2% |
| South American | 6 | 0.0% |
| Subsaharan African | 9 | 0.1% |
| Swedish | 91 | 0.5% |
| Swiss | 23 | 0.1% |
| Welsh | 84 | 0.5% | View All 43 Rows |
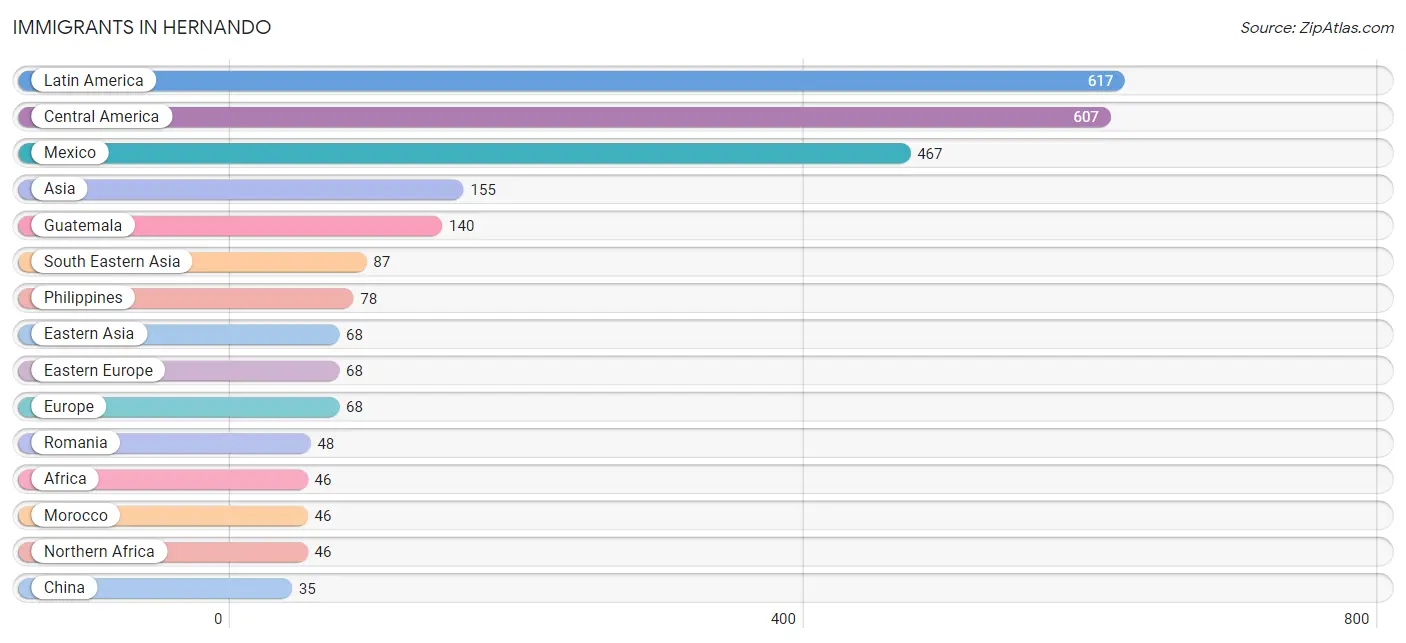
Immigrants in Hernando
The most numerous immigrant groups reported in Hernando came from Latin America (617 | 3.6%), Central America (607 | 3.5%), Mexico (467 | 2.7%), Asia (155 | 0.9%), and Guatemala (140 | 0.8%), together accounting for 11.5% of all Hernando residents.
| Immigration Origin | # Population | % Population |
| Africa | 46 | 0.3% |
| Asia | 155 | 0.9% |
| Caribbean | 10 | 0.1% |
| Central America | 607 | 3.5% |
| China | 35 | 0.2% |
| Eastern Asia | 68 | 0.4% |
| Eastern Europe | 68 | 0.4% |
| Europe | 68 | 0.4% |
| Guatemala | 140 | 0.8% |
| Haiti | 10 | 0.1% |
| Hong Kong | 5 | 0.0% |
| Japan | 33 | 0.2% |
| Latin America | 617 | 3.6% |
| Malaysia | 9 | 0.1% |
| Mexico | 467 | 2.7% |
| Morocco | 46 | 0.3% |
| Northern Africa | 46 | 0.3% |
| Philippines | 78 | 0.4% |
| Romania | 48 | 0.3% |
| Russia | 20 | 0.1% |
| South Eastern Asia | 87 | 0.5% | View All 21 Rows |
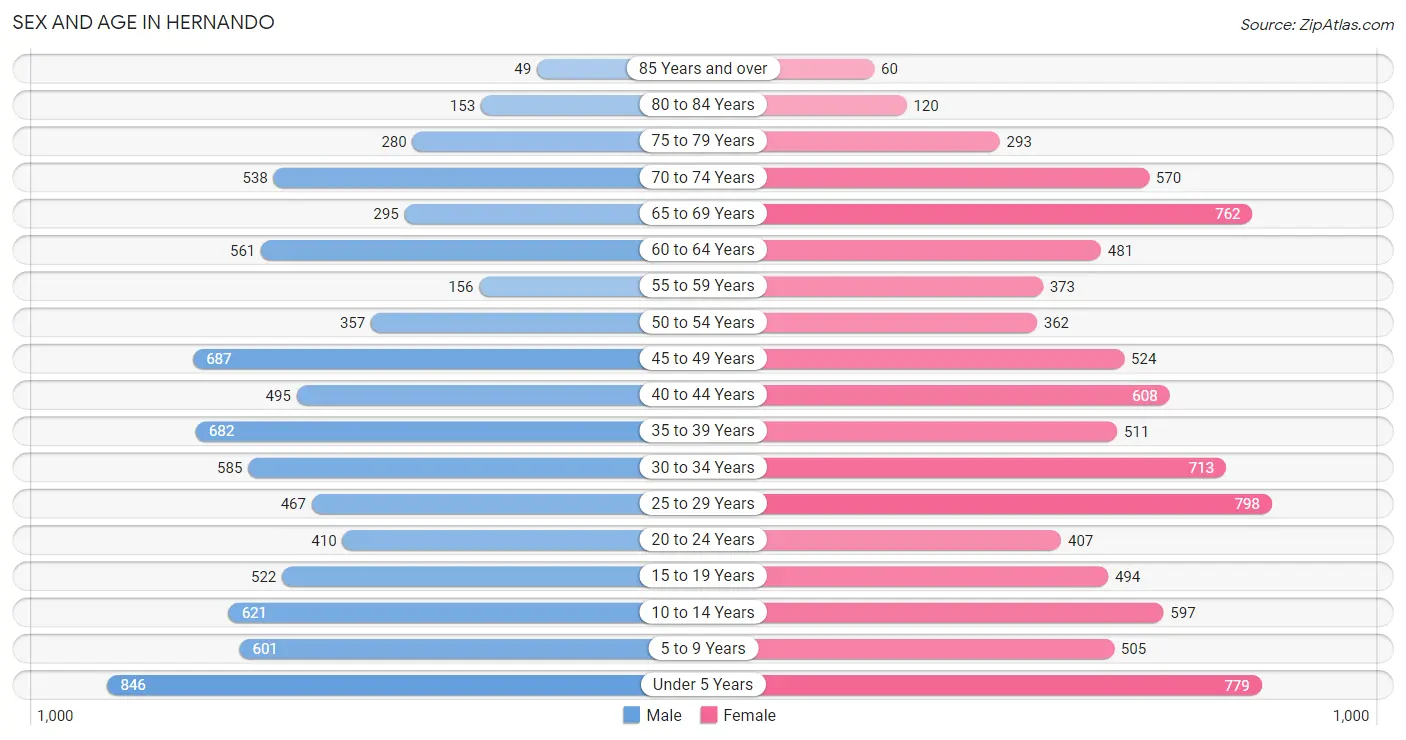
Sex and Age in Hernando
Sex and Age in Hernando
The most populous age groups in Hernando are Under 5 Years (846 | 10.2%) for men and 25 to 29 Years (798 | 8.9%) for women.
| Age Bracket | Male | Female |
| Under 5 Years | 846 (10.2%) | 779 (8.7%) |
| 5 to 9 Years | 601 (7.2%) | 505 (5.6%) |
| 10 to 14 Years | 621 (7.5%) | 597 (6.7%) |
| 15 to 19 Years | 522 (6.3%) | 494 (5.5%) |
| 20 to 24 Years | 410 (4.9%) | 407 (4.5%) |
| 25 to 29 Years | 467 (5.6%) | 798 (8.9%) |
| 30 to 34 Years | 585 (7.0%) | 713 (8.0%) |
| 35 to 39 Years | 682 (8.2%) | 511 (5.7%) |
| 40 to 44 Years | 495 (6.0%) | 608 (6.8%) |
| 45 to 49 Years | 687 (8.3%) | 524 (5.9%) |
| 50 to 54 Years | 357 (4.3%) | 362 (4.0%) |
| 55 to 59 Years | 156 (1.9%) | 373 (4.2%) |
| 60 to 64 Years | 561 (6.8%) | 481 (5.4%) |
| 65 to 69 Years | 295 (3.5%) | 762 (8.5%) |
| 70 to 74 Years | 538 (6.5%) | 570 (6.4%) |
| 75 to 79 Years | 280 (3.4%) | 293 (3.3%) |
| 80 to 84 Years | 153 (1.8%) | 120 (1.3%) |
| 85 Years and over | 49 (0.6%) | 60 (0.7%) |
| Total | 8,305 (100.0%) | 8,957 (100.0%) |
Families and Households in Hernando
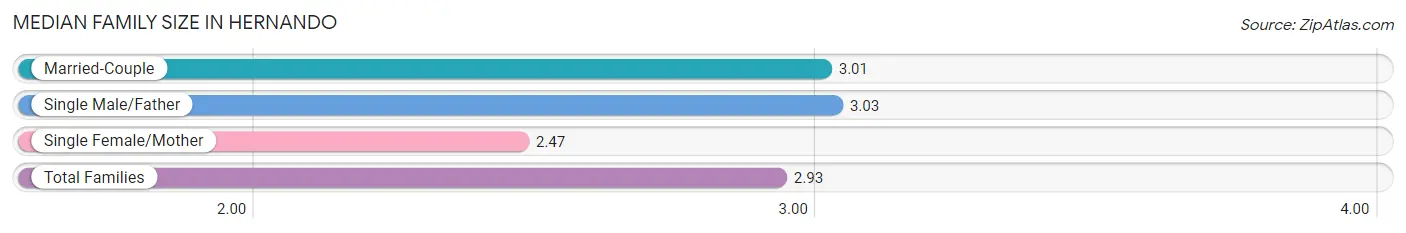
Median Family Size in Hernando
The median family size in Hernando is 2.93 persons per family, with single male/father families (327 | 6.5%) accounting for the largest median family size of 3.03 persons per family. On the other hand, single female/mother families (810 | 16.1%) represent the smallest median family size with 2.47 persons per family.
| Family Type | # Families | Family Size |
| Married-Couple | 3,898 (77.4%) | 3.01 |
| Single Male/Father | 327 (6.5%) | 3.03 |
| Single Female/Mother | 810 (16.1%) | 2.47 |
| Total Families | 5,035 (100.0%) | 2.93 |
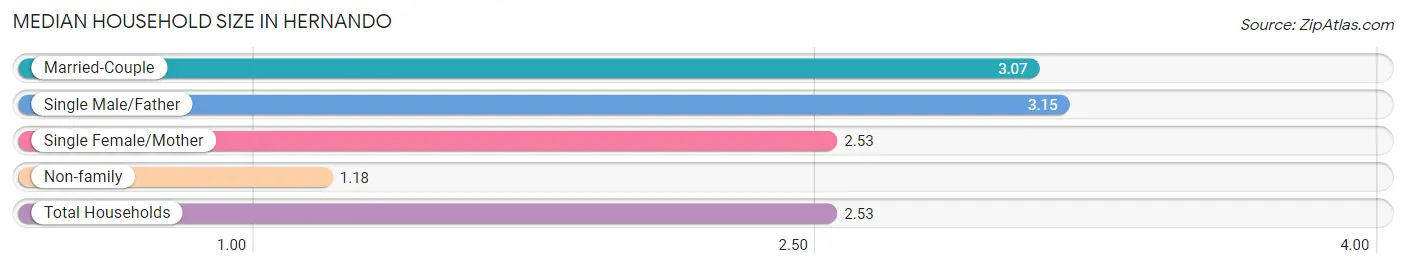
Median Household Size in Hernando
The median household size in Hernando is 2.53 persons per household, with single male/father households (327 | 4.9%) accounting for the largest median household size of 3.15 persons per household. non-family households (1,680 | 25.0%) represent the smallest median household size with 1.18 persons per household.
| Household Type | # Households | Household Size |
| Married-Couple | 3,898 (58.1%) | 3.07 |
| Single Male/Father | 327 (4.9%) | 3.15 |
| Single Female/Mother | 810 (12.1%) | 2.53 |
| Non-family | 1,680 (25.0%) | 1.18 |
| Total Households | 6,715 (100.0%) | 2.53 |
Household Size by Marriage Status in Hernando
Out of a total of 6,715 households in Hernando, 5,035 (75.0%) are family households, while 1,680 (25.0%) are nonfamily households. The most numerous type of family households are 2-person households, comprising 2,167, and the most common type of nonfamily households are 1-person households, comprising 1,411.
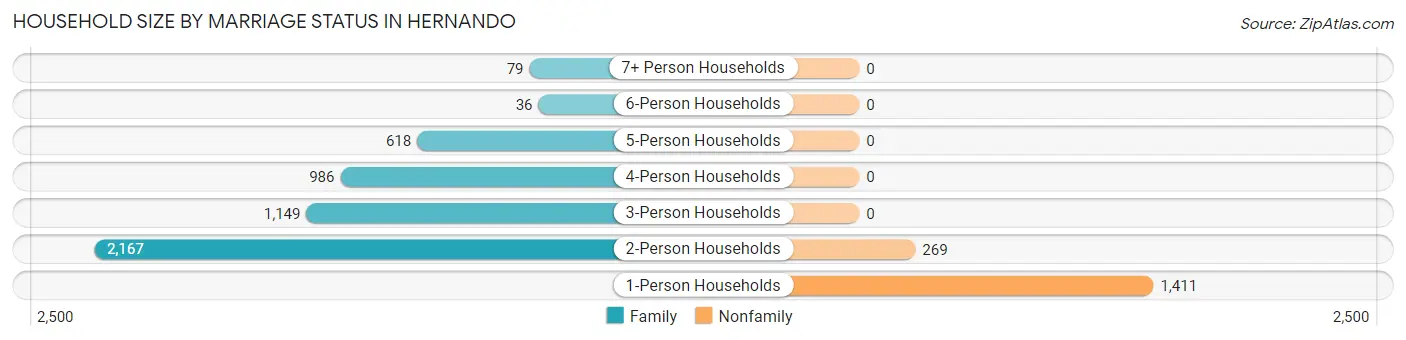
| Household Size | Family Households | Nonfamily Households |
| 1-Person Households | - | 1,411 (21.0%) |
| 2-Person Households | 2,167 (32.3%) | 269 (4.0%) |
| 3-Person Households | 1,149 (17.1%) | 0 (0.0%) |
| 4-Person Households | 986 (14.7%) | 0 (0.0%) |
| 5-Person Households | 618 (9.2%) | 0 (0.0%) |
| 6-Person Households | 36 (0.5%) | 0 (0.0%) |
| 7+ Person Households | 79 (1.2%) | 0 (0.0%) |
| Total | 5,035 (75.0%) | 1,680 (25.0%) |
Female Fertility in Hernando
Fertility by Age in Hernando
Average fertility rate in Hernando is 88.0 births per 1,000 women. Women in the age bracket of 20 to 34 years have the highest fertility rate with 158.0 births per 1,000 women. Women in the age bracket of 20 to 34 years acount for 82.2% of all women with births.
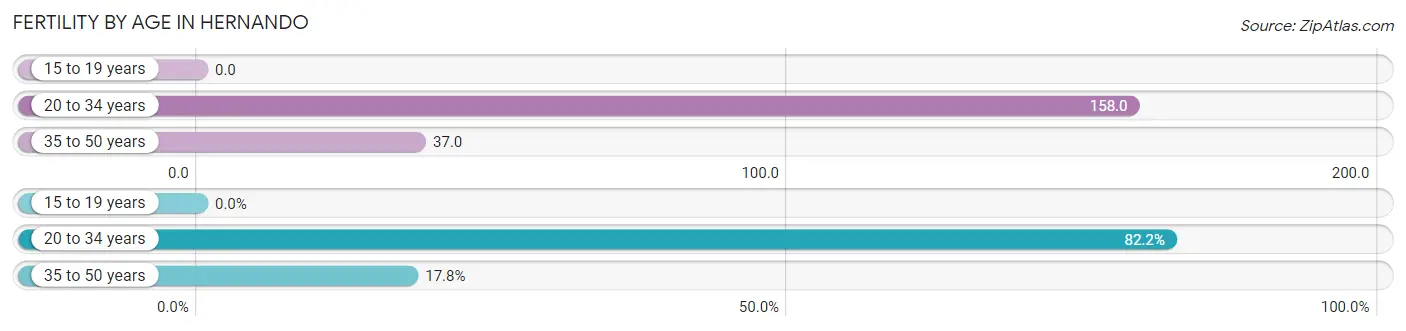
| Age Bracket | Women with Births | Births / 1,000 Women |
| 15 to 19 years | 0 (0.0%) | 0.0 |
| 20 to 34 years | 304 (82.2%) | 158.0 |
| 35 to 50 years | 66 (17.8%) | 37.0 |
| Total | 370 (100.0%) | 88.0 |
Fertility by Age by Marriage Status in Hernando
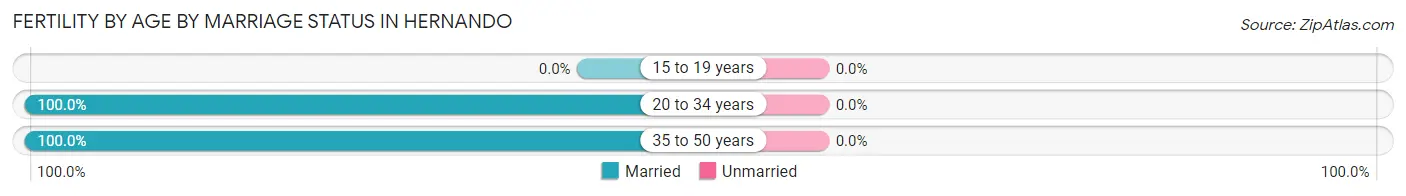
| Age Bracket | Married | Unmarried |
| 15 to 19 years | 0 (0.0%) | 0 (0.0%) |
| 20 to 34 years | 304 (100.0%) | 0 (0.0%) |
| 35 to 50 years | 66 (100.0%) | 0 (0.0%) |
| Total | 370 (100.0%) | 0 (0.0%) |
Fertility by Education in Hernando
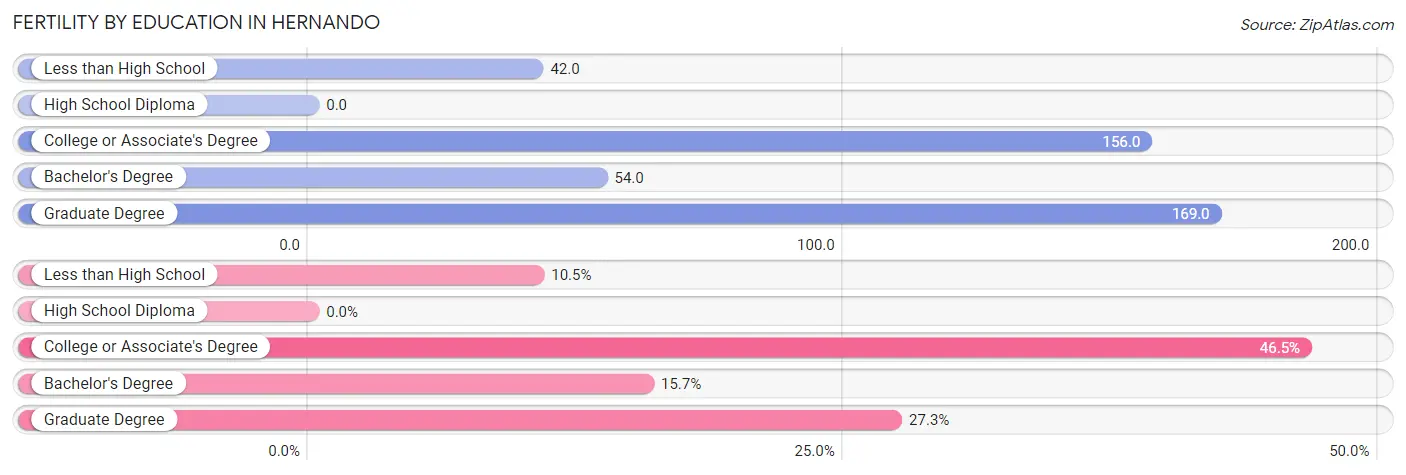
| Educational Attainment | Women with Births | Births / 1,000 Women |
| Less than High School | 39 (10.5%) | 42.0 |
| High School Diploma | 0 (0.0%) | 0.0 |
| College or Associate's Degree | 172 (46.5%) | 156.0 |
| Bachelor's Degree | 58 (15.7%) | 54.0 |
| Graduate Degree | 101 (27.3%) | 169.0 |
| Total | 370 (100.0%) | 88.0 |
Fertility by Education by Marriage Status in Hernando
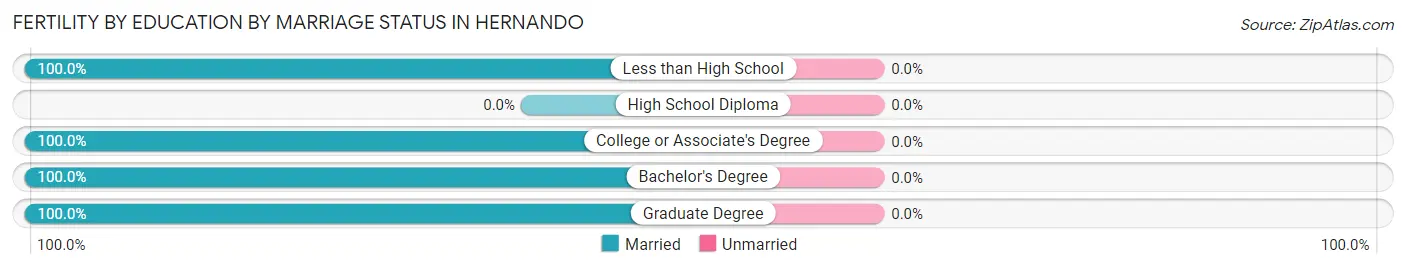
| Educational Attainment | Married | Unmarried |
| Less than High School | 39 (100.0%) | 0 (0.0%) |
| High School Diploma | 0 (0.0%) | 0 (0.0%) |
| College or Associate's Degree | 172 (100.0%) | 0 (0.0%) |
| Bachelor's Degree | 58 (100.0%) | 0 (0.0%) |
| Graduate Degree | 101 (100.0%) | 0 (0.0%) |
| Total | 370 (100.0%) | 0 (0.0%) |
Employment Characteristics in Hernando
Employment by Class of Employer in Hernando
Among the 8,007 employed individuals in Hernando, private company employees (5,381 | 67.2%), local government employees (854 | 10.7%), and not-for-profit organizations (452 | 5.7%) make up the most common classes of employment.
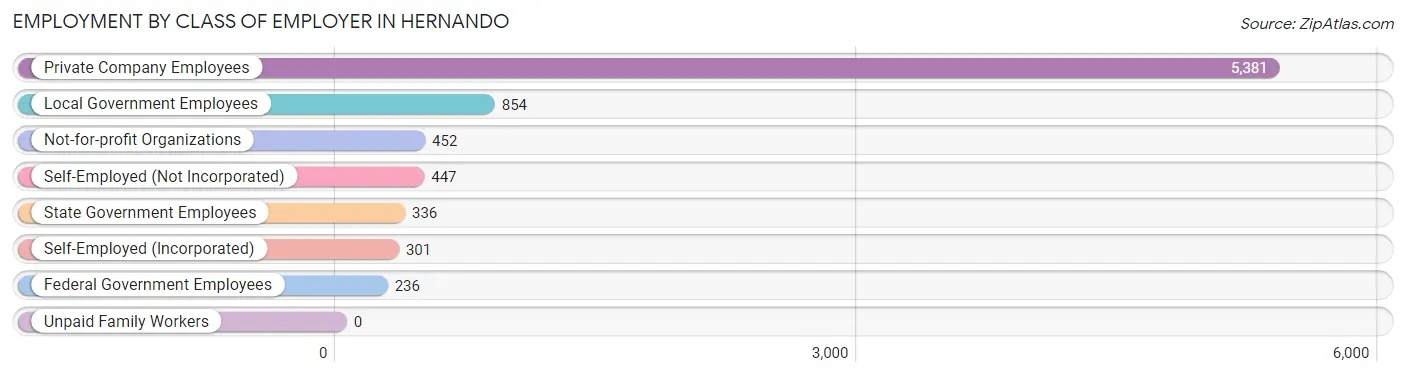
| Employer Class | # Employees | % Employees |
| Private Company Employees | 5,381 | 67.2% |
| Self-Employed (Incorporated) | 301 | 3.8% |
| Self-Employed (Not Incorporated) | 447 | 5.6% |
| Not-for-profit Organizations | 452 | 5.7% |
| Local Government Employees | 854 | 10.7% |
| State Government Employees | 336 | 4.2% |
| Federal Government Employees | 236 | 2.9% |
| Unpaid Family Workers | 0 | 0.0% |
| Total | 8,007 | 100.0% |
Employment Status by Age in Hernando
According to the labor force statistics for Hernando, out of the total population over 16 years of age (13,028), 63.2% or 8,234 individuals are in the labor force, with 2.2% or 181 of them unemployed. The age group with the highest labor force participation rate is 45 to 54 years, with 88.0% or 1,698 individuals in the labor force. Within the labor force, the 20 to 24 years age range has the highest percentage of unemployed individuals, with 20.3% or 104 of them being unemployed.
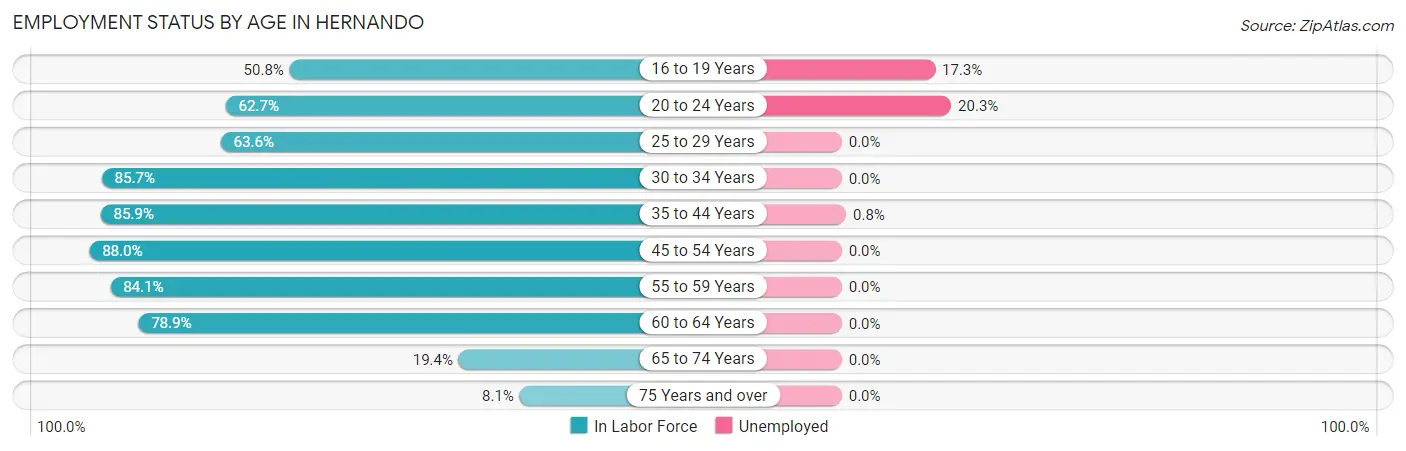
| Age Bracket | In Labor Force | Unemployed |
| 16 to 19 Years | 371 (50.8%) | 64 (17.3%) |
| 20 to 24 Years | 512 (62.7%) | 104 (20.3%) |
| 25 to 29 Years | 805 (63.6%) | 0 (0.0%) |
| 30 to 34 Years | 1,112 (85.7%) | 0 (0.0%) |
| 35 to 44 Years | 1,972 (85.9%) | 16 (0.8%) |
| 45 to 54 Years | 1,698 (88.0%) | 0 (0.0%) |
| 55 to 59 Years | 445 (84.1%) | 0 (0.0%) |
| 60 to 64 Years | 822 (78.9%) | 0 (0.0%) |
| 65 to 74 Years | 420 (19.4%) | 0 (0.0%) |
| 75 Years and over | 77 (8.1%) | 0 (0.0%) |
| Total | 8,234 (63.2%) | 181 (2.2%) |
Employment Status by Educational Attainment in Hernando
According to labor force statistics for Hernando, 82.0% of individuals (6,855) out of the total population between 25 and 64 years of age (8,360) are in the labor force, with 0.2% or 14 of them being unemployed. The group with the highest labor force participation rate are those with the educational attainment of bachelor's degree or higher, with 93.5% or 3,244 individuals in the labor force. Within the labor force, individuals with high school diploma education have the highest percentage of unemployment, with 1.6% or 16 of them being unemployed.
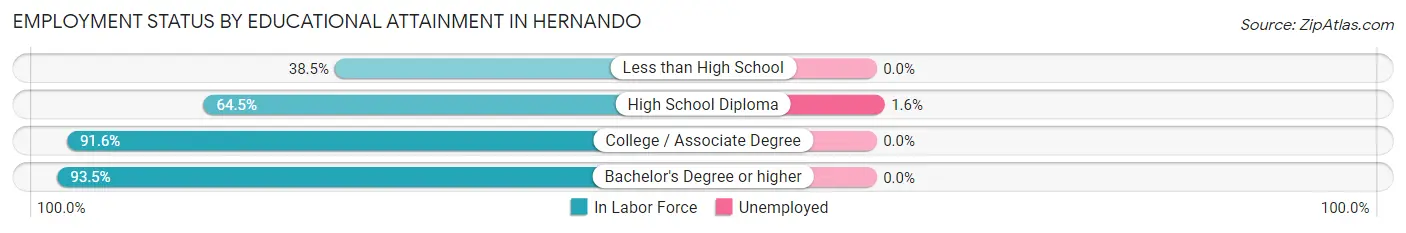
| Educational Attainment | In Labor Force | Unemployed |
| Less than High School | 328 (38.5%) | 0 (0.0%) |
| High School Diploma | 989 (64.5%) | 25 (1.6%) |
| College / Associate Degree | 2,294 (91.6%) | 0 (0.0%) |
| Bachelor's Degree or higher | 3,244 (93.5%) | 0 (0.0%) |
| Total | 6,855 (82.0%) | 17 (0.2%) |
Employment Occupations by Sex in Hernando
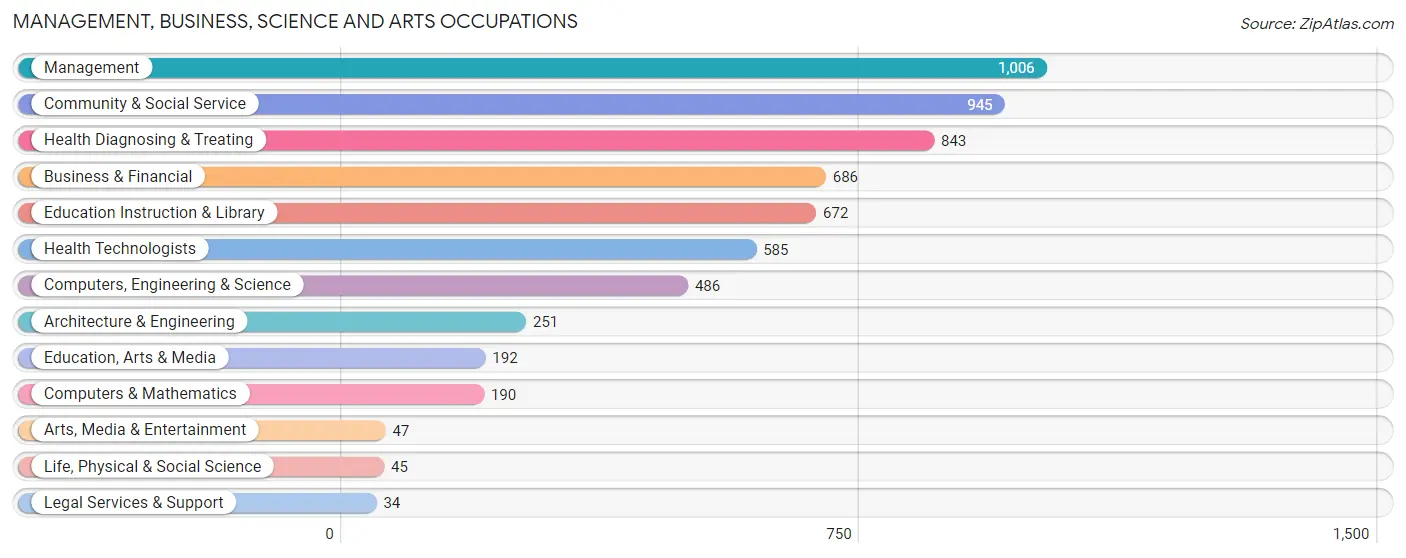
Management, Business, Science and Arts Occupations
The most common Management, Business, Science and Arts occupations in Hernando are Management (1,006 | 12.5%), Community & Social Service (945 | 11.8%), Health Diagnosing & Treating (843 | 10.5%), Business & Financial (686 | 8.6%), and Education Instruction & Library (672 | 8.4%).
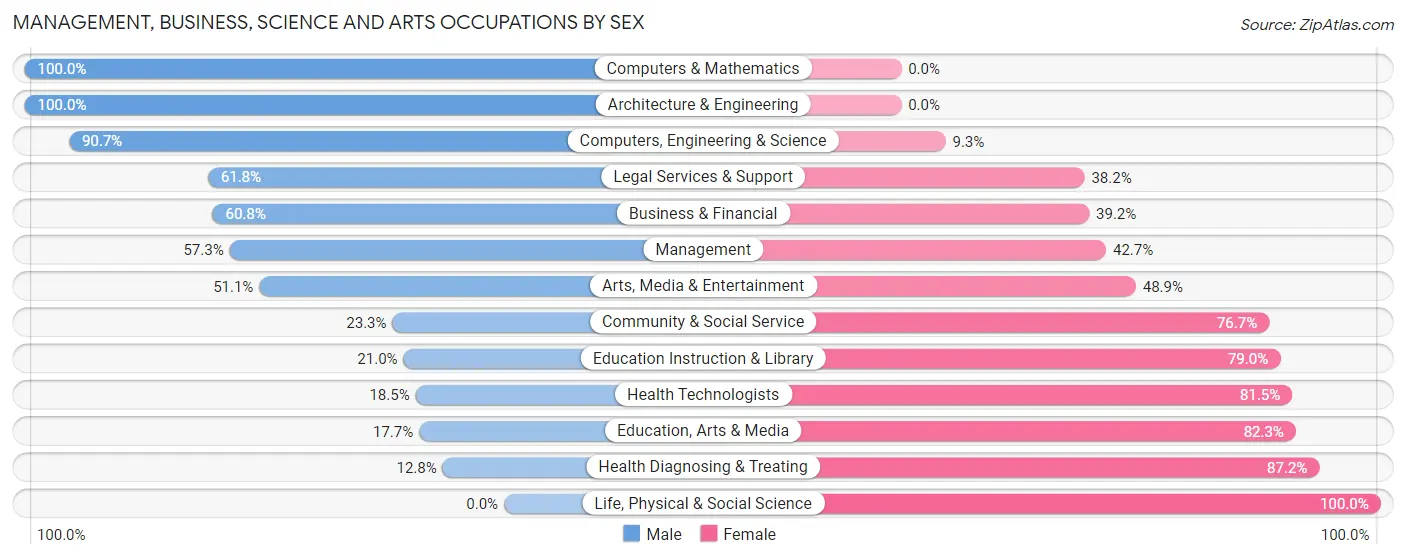
Management, Business, Science and Arts Occupations by Sex
Within the Management, Business, Science and Arts occupations in Hernando, the most male-oriented occupations are Computers & Mathematics (100.0%), Architecture & Engineering (100.0%), and Computers, Engineering & Science (90.7%), while the most female-oriented occupations are Life, Physical & Social Science (100.0%), Health Diagnosing & Treating (87.2%), and Education, Arts & Media (82.3%).
| Occupation | Male | Female |
| Management | 576 (57.3%) | 430 (42.7%) |
| Business & Financial | 417 (60.8%) | 269 (39.2%) |
| Computers, Engineering & Science | 441 (90.7%) | 45 (9.3%) |
| Computers & Mathematics | 190 (100.0%) | 0 (0.0%) |
| Architecture & Engineering | 251 (100.0%) | 0 (0.0%) |
| Life, Physical & Social Science | 0 (0.0%) | 45 (100.0%) |
| Community & Social Service | 220 (23.3%) | 725 (76.7%) |
| Education, Arts & Media | 34 (17.7%) | 158 (82.3%) |
| Legal Services & Support | 21 (61.8%) | 13 (38.2%) |
| Education Instruction & Library | 141 (21.0%) | 531 (79.0%) |
| Arts, Media & Entertainment | 24 (51.1%) | 23 (48.9%) |
| Health Diagnosing & Treating | 108 (12.8%) | 735 (87.2%) |
| Health Technologists | 108 (18.5%) | 477 (81.5%) |
| Total (Category) | 1,762 (44.4%) | 2,204 (55.6%) |
| Total (Overall) | 4,296 (53.5%) | 3,730 (46.5%) |
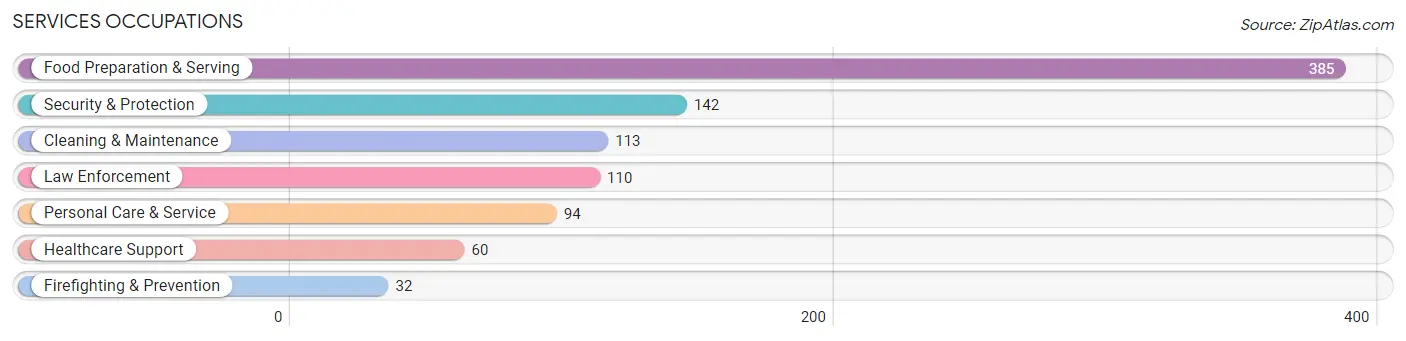
Services Occupations
The most common Services occupations in Hernando are Food Preparation & Serving (385 | 4.8%), Security & Protection (142 | 1.8%), Cleaning & Maintenance (113 | 1.4%), Law Enforcement (110 | 1.4%), and Personal Care & Service (94 | 1.2%).
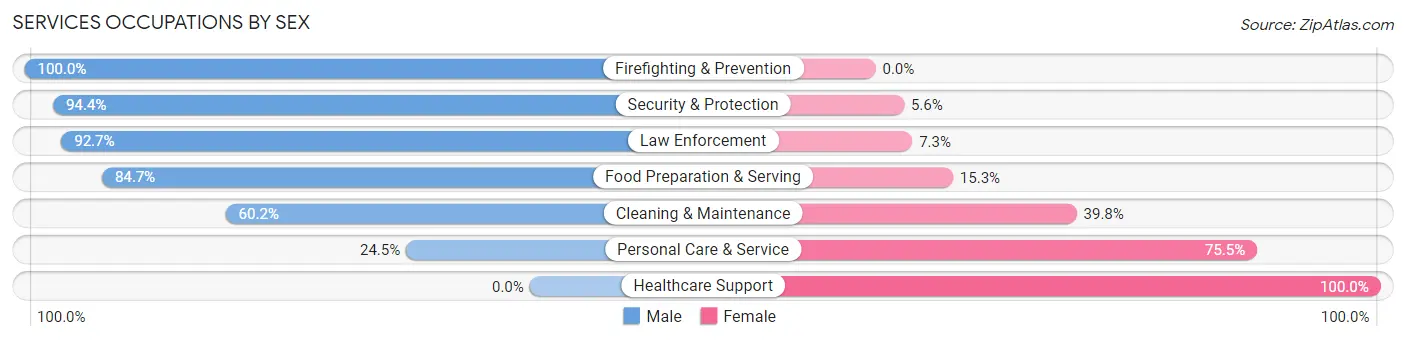
Services Occupations by Sex
Within the Services occupations in Hernando, the most male-oriented occupations are Firefighting & Prevention (100.0%), Security & Protection (94.4%), and Law Enforcement (92.7%), while the most female-oriented occupations are Healthcare Support (100.0%), Personal Care & Service (75.5%), and Cleaning & Maintenance (39.8%).
| Occupation | Male | Female |
| Healthcare Support | 0 (0.0%) | 60 (100.0%) |
| Security & Protection | 134 (94.4%) | 8 (5.6%) |
| Firefighting & Prevention | 32 (100.0%) | 0 (0.0%) |
| Law Enforcement | 102 (92.7%) | 8 (7.3%) |
| Food Preparation & Serving | 326 (84.7%) | 59 (15.3%) |
| Cleaning & Maintenance | 68 (60.2%) | 45 (39.8%) |
| Personal Care & Service | 23 (24.5%) | 71 (75.5%) |
| Total (Category) | 551 (69.4%) | 243 (30.6%) |
| Total (Overall) | 4,296 (53.5%) | 3,730 (46.5%) |
Sales and Office Occupations
The most common Sales and Office occupations in Hernando are Sales & Related (886 | 11.0%), and Office & Administration (801 | 10.0%).

Sales and Office Occupations by Sex
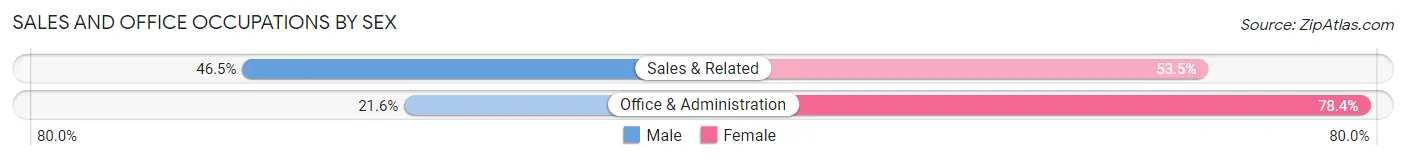
| Occupation | Male | Female |
| Sales & Related | 412 (46.5%) | 474 (53.5%) |
| Office & Administration | 173 (21.6%) | 628 (78.4%) |
| Total (Category) | 585 (34.7%) | 1,102 (65.3%) |
| Total (Overall) | 4,296 (53.5%) | 3,730 (46.5%) |
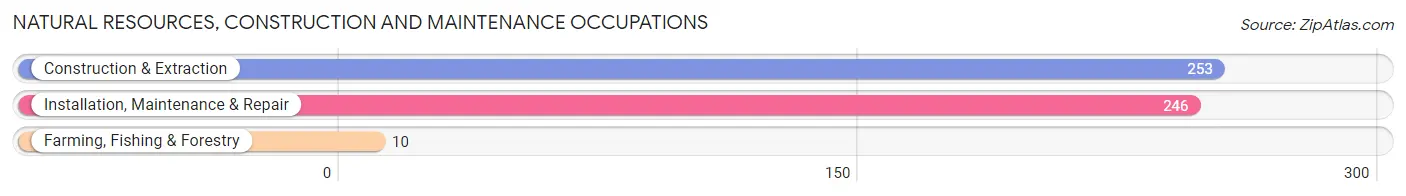
Natural Resources, Construction and Maintenance Occupations
The most common Natural Resources, Construction and Maintenance occupations in Hernando are Construction & Extraction (253 | 3.2%), Installation, Maintenance & Repair (246 | 3.1%), and Farming, Fishing & Forestry (10 | 0.1%).
Natural Resources, Construction and Maintenance Occupations by Sex
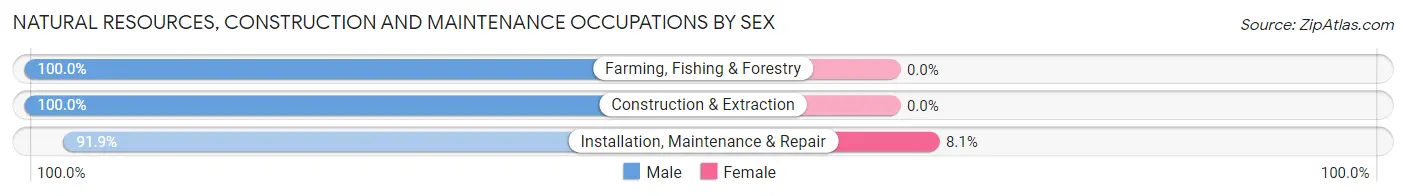
| Occupation | Male | Female |
| Farming, Fishing & Forestry | 10 (100.0%) | 0 (0.0%) |
| Construction & Extraction | 253 (100.0%) | 0 (0.0%) |
| Installation, Maintenance & Repair | 226 (91.9%) | 20 (8.1%) |
| Total (Category) | 489 (96.1%) | 20 (3.9%) |
| Total (Overall) | 4,296 (53.5%) | 3,730 (46.5%) |
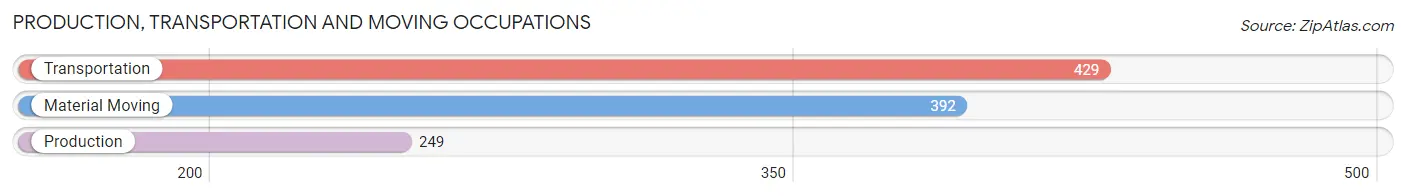
Production, Transportation and Moving Occupations
The most common Production, Transportation and Moving occupations in Hernando are Transportation (429 | 5.3%), Material Moving (392 | 4.9%), and Production (249 | 3.1%).
Production, Transportation and Moving Occupations by Sex
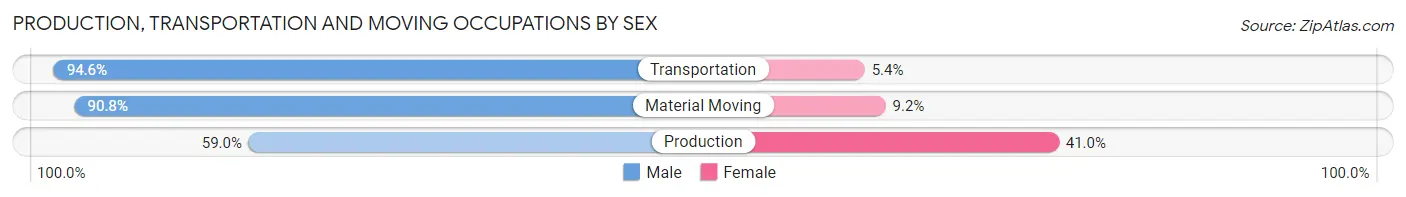
| Occupation | Male | Female |
| Production | 147 (59.0%) | 102 (41.0%) |
| Transportation | 406 (94.6%) | 23 (5.4%) |
| Material Moving | 356 (90.8%) | 36 (9.2%) |
| Total (Category) | 909 (85.0%) | 161 (15.0%) |
| Total (Overall) | 4,296 (53.5%) | 3,730 (46.5%) |
Employment Industries by Sex in Hernando
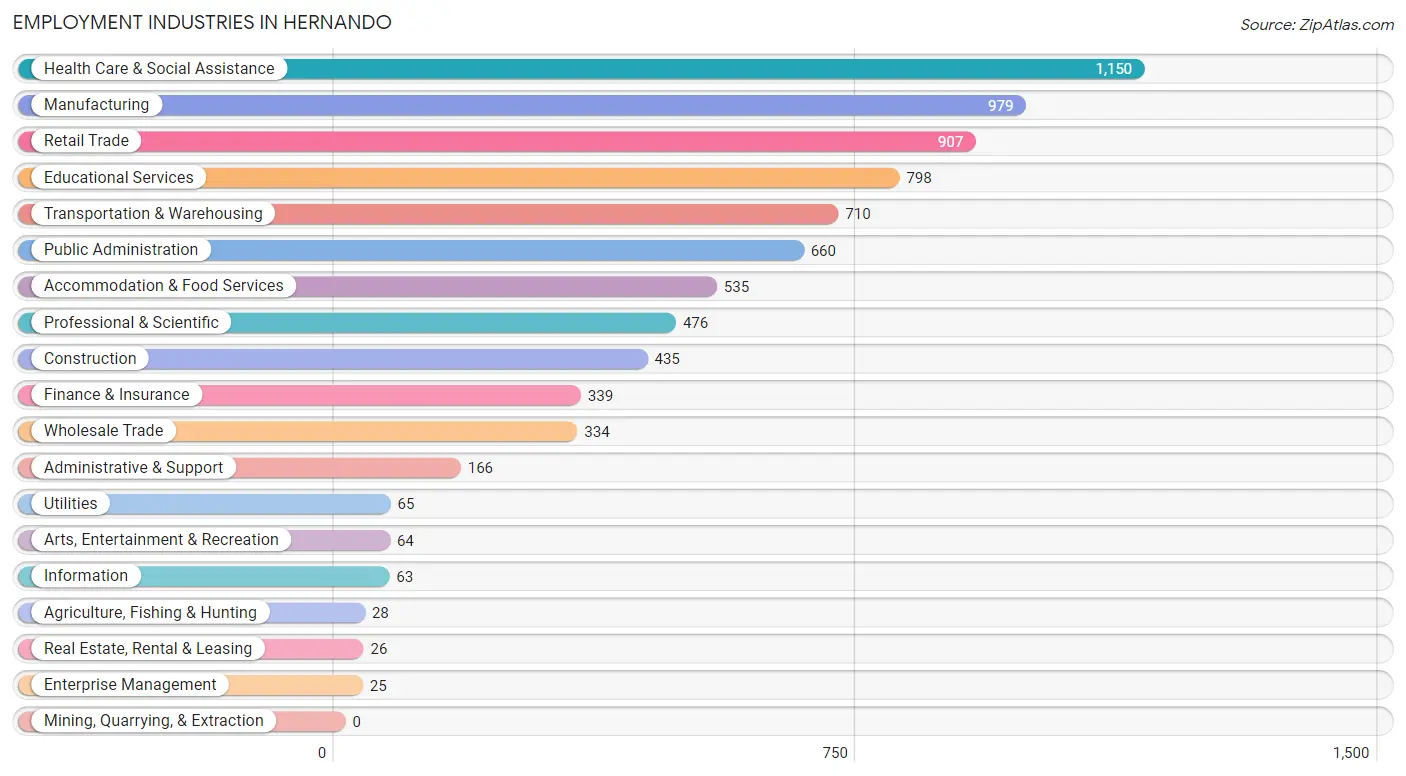
Employment Industries in Hernando
The major employment industries in Hernando include Health Care & Social Assistance (1,150 | 14.3%), Manufacturing (979 | 12.2%), Retail Trade (907 | 11.3%), Educational Services (798 | 9.9%), and Transportation & Warehousing (710 | 8.8%).
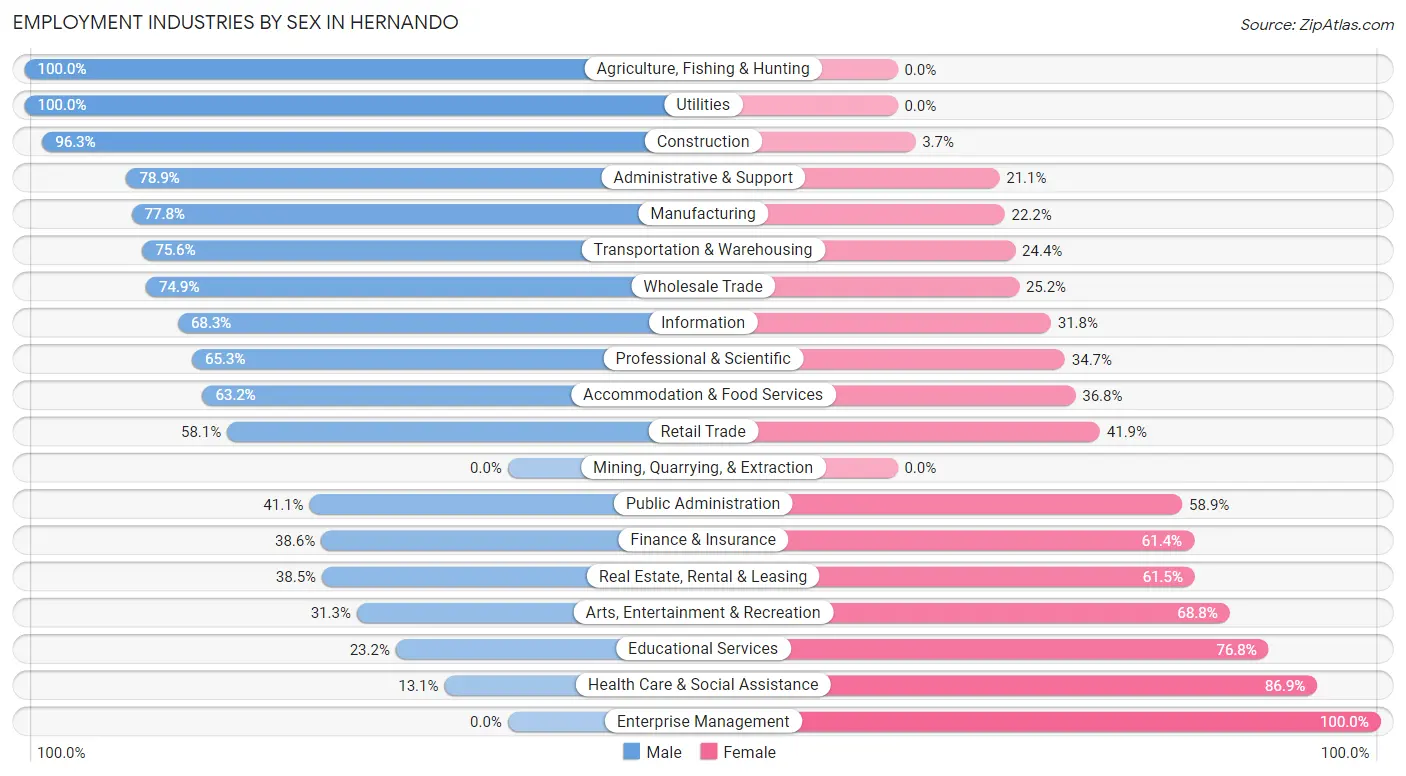
Employment Industries by Sex in Hernando
The Hernando industries that see more men than women are Agriculture, Fishing & Hunting (100.0%), Utilities (100.0%), and Construction (96.3%), whereas the industries that tend to have a higher number of women are Enterprise Management (100.0%), Health Care & Social Assistance (86.9%), and Educational Services (76.8%).
| Industry | Male | Female |
| Agriculture, Fishing & Hunting | 28 (100.0%) | 0 (0.0%) |
| Mining, Quarrying, & Extraction | 0 (0.0%) | 0 (0.0%) |
| Construction | 419 (96.3%) | 16 (3.7%) |
| Manufacturing | 762 (77.8%) | 217 (22.2%) |
| Wholesale Trade | 250 (74.9%) | 84 (25.2%) |
| Retail Trade | 527 (58.1%) | 380 (41.9%) |
| Transportation & Warehousing | 537 (75.6%) | 173 (24.4%) |
| Utilities | 65 (100.0%) | 0 (0.0%) |
| Information | 43 (68.2%) | 20 (31.8%) |
| Finance & Insurance | 131 (38.6%) | 208 (61.4%) |
| Real Estate, Rental & Leasing | 10 (38.5%) | 16 (61.5%) |
| Professional & Scientific | 311 (65.3%) | 165 (34.7%) |
| Enterprise Management | 0 (0.0%) | 25 (100.0%) |
| Administrative & Support | 131 (78.9%) | 35 (21.1%) |
| Educational Services | 185 (23.2%) | 613 (76.8%) |
| Health Care & Social Assistance | 151 (13.1%) | 999 (86.9%) |
| Arts, Entertainment & Recreation | 20 (31.2%) | 44 (68.8%) |
| Accommodation & Food Services | 338 (63.2%) | 197 (36.8%) |
| Public Administration | 271 (41.1%) | 389 (58.9%) |
| Total | 4,296 (53.5%) | 3,730 (46.5%) |
Education in Hernando
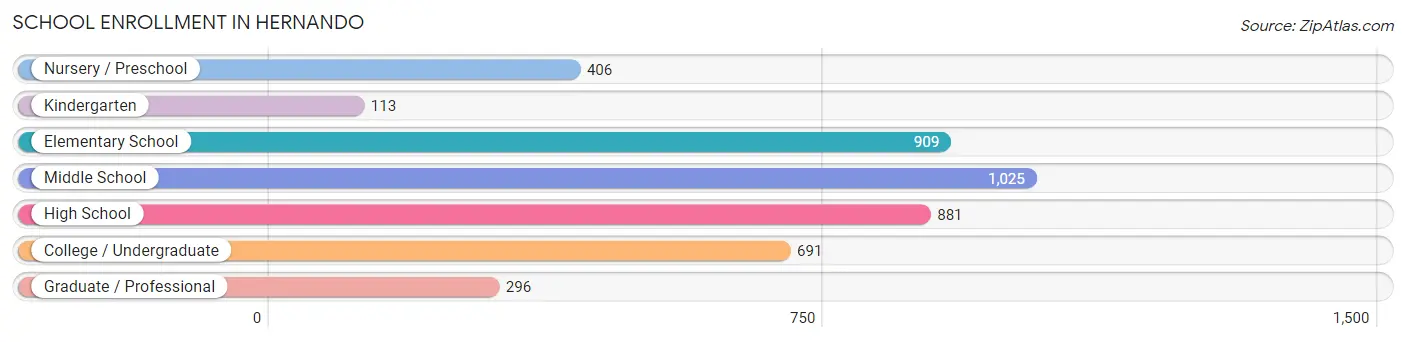
School Enrollment in Hernando
The most common levels of schooling among the 4,321 students in Hernando are middle school (1,025 | 23.7%), elementary school (909 | 21.0%), and high school (881 | 20.4%).
| School Level | # Students | % Students |
| Nursery / Preschool | 406 | 9.4% |
| Kindergarten | 113 | 2.6% |
| Elementary School | 909 | 21.0% |
| Middle School | 1,025 | 23.7% |
| High School | 881 | 20.4% |
| College / Undergraduate | 691 | 16.0% |
| Graduate / Professional | 296 | 6.9% |
| Total | 4,321 | 100.0% |
School Enrollment by Age by Funding Source in Hernando
Out of a total of 4,321 students who are enrolled in schools in Hernando, 393 (9.1%) attend a private institution, while the remaining 3,928 (90.9%) are enrolled in public schools. The age group of 3 to 4 year olds has the highest likelihood of being enrolled in private schools, with 101 (28.0% in the age bracket) enrolled. Conversely, the age group of 25 to 34 year olds has the lowest likelihood of being enrolled in a private school, with 105 (100.0% in the age bracket) attending a public institution.
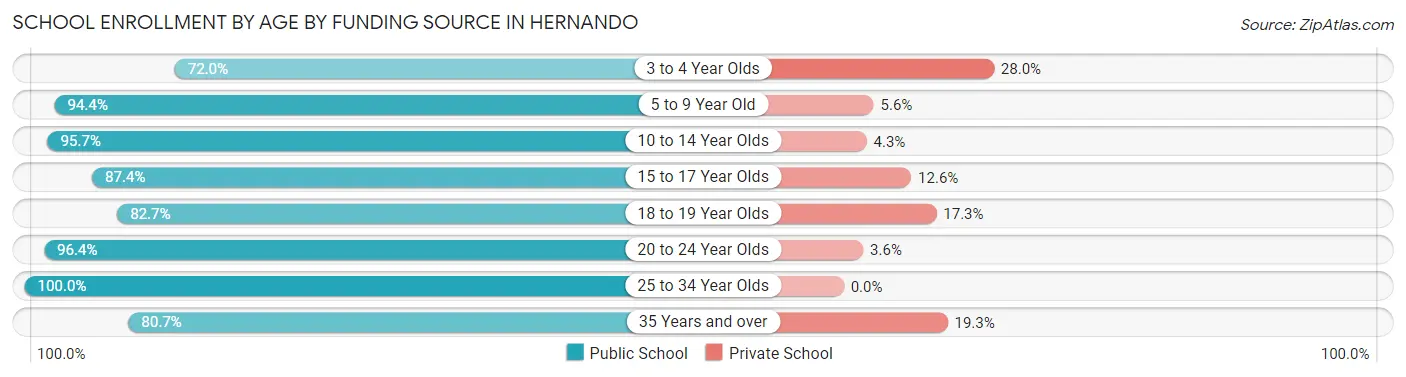
| Age Bracket | Public School | Private School |
| 3 to 4 Year Olds | 260 (72.0%) | 101 (28.0%) |
| 5 to 9 Year Old | 948 (94.4%) | 56 (5.6%) |
| 10 to 14 Year Olds | 1,166 (95.7%) | 52 (4.3%) |
| 15 to 17 Year Olds | 584 (87.4%) | 84 (12.6%) |
| 18 to 19 Year Olds | 139 (82.7%) | 29 (17.3%) |
| 20 to 24 Year Olds | 504 (96.4%) | 19 (3.6%) |
| 25 to 34 Year Olds | 105 (100.0%) | 0 (0.0%) |
| 35 Years and over | 221 (80.7%) | 53 (19.3%) |
| Total | 3,928 (90.9%) | 393 (9.1%) |
Educational Attainment by Field of Study in Hernando
Business (1,113 | 25.2%), education (1,022 | 23.1%), science & technology (676 | 15.3%), engineering (329 | 7.4%), and arts & humanities (324 | 7.3%) are the most common fields of study among 4,426 individuals in Hernando who have obtained a bachelor's degree or higher.
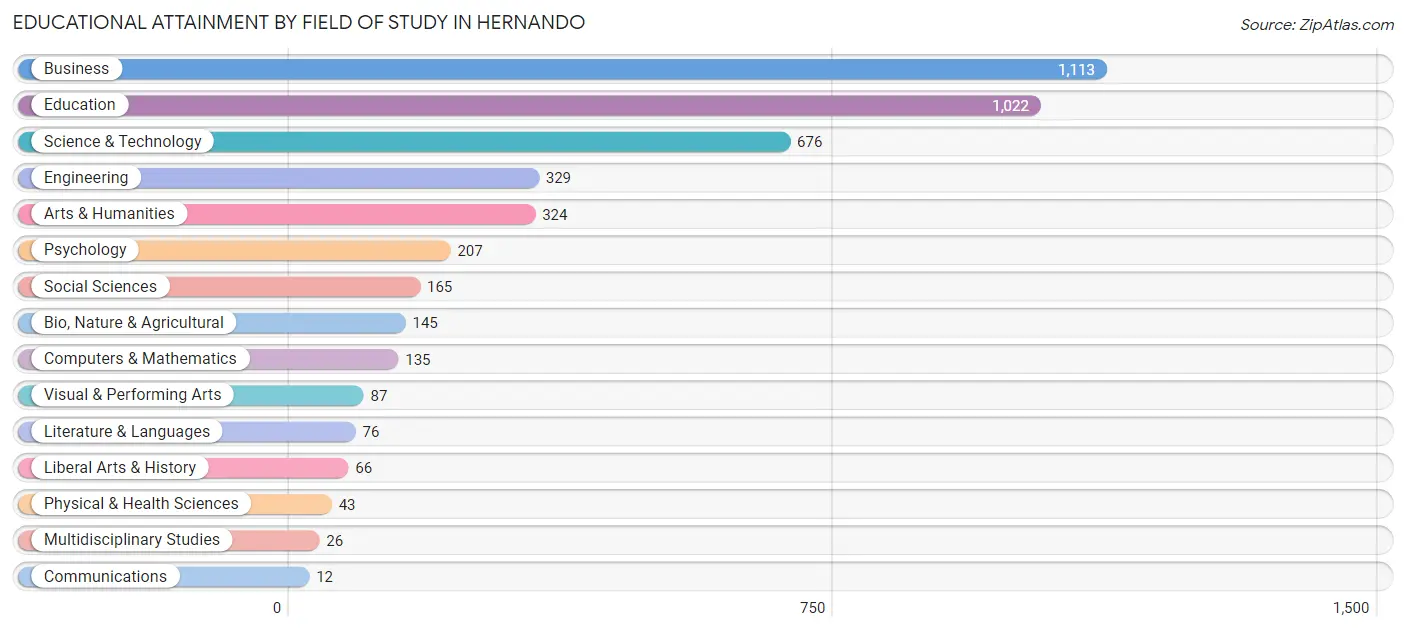
| Field of Study | # Graduates | % Graduates |
| Computers & Mathematics | 135 | 3.0% |
| Bio, Nature & Agricultural | 145 | 3.3% |
| Physical & Health Sciences | 43 | 1.0% |
| Psychology | 207 | 4.7% |
| Social Sciences | 165 | 3.7% |
| Engineering | 329 | 7.4% |
| Multidisciplinary Studies | 26 | 0.6% |
| Science & Technology | 676 | 15.3% |
| Business | 1,113 | 25.2% |
| Education | 1,022 | 23.1% |
| Literature & Languages | 76 | 1.7% |
| Liberal Arts & History | 66 | 1.5% |
| Visual & Performing Arts | 87 | 2.0% |
| Communications | 12 | 0.3% |
| Arts & Humanities | 324 | 7.3% |
| Total | 4,426 | 100.0% |
Transportation & Commute in Hernando
Vehicle Availability by Sex in Hernando
The most prevalent vehicle ownership categories in Hernando are males with 2 vehicles (1,767, accounting for 41.1%) and females with 2 vehicles (1,696, making up 47.9%).
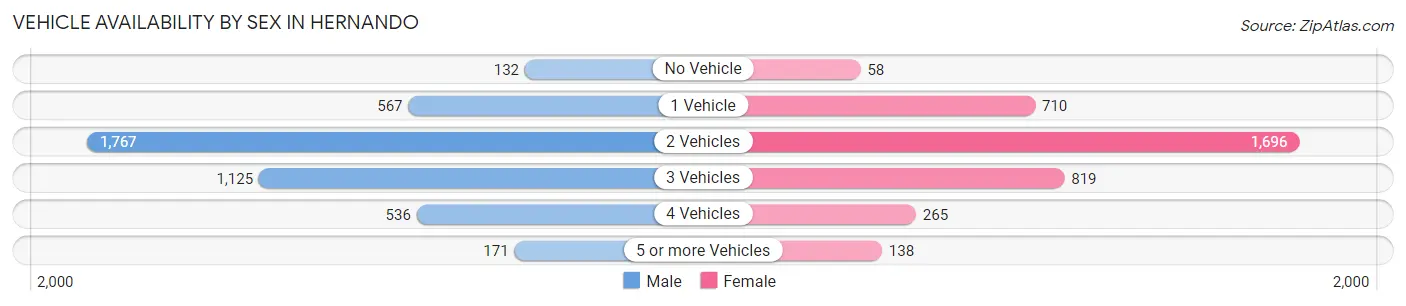
| Vehicles Available | Male | Female |
| No Vehicle | 132 (3.1%) | 58 (1.6%) |
| 1 Vehicle | 567 (13.2%) | 710 (19.3%) |
| 2 Vehicles | 1,767 (41.1%) | 1,696 (46.0%) |
| 3 Vehicles | 1,125 (26.2%) | 819 (22.2%) |
| 4 Vehicles | 536 (12.5%) | 265 (7.2%) |
| 5 or more Vehicles | 171 (4.0%) | 138 (3.7%) |
| Total | 4,298 (100.0%) | 3,686 (100.0%) |
Commute Time in Hernando
The most frequently occuring commute durations in Hernando are 30 to 34 minutes (1,339 commuters, 17.9%), 20 to 24 minutes (1,324 commuters, 17.7%), and 10 to 14 minutes (992 commuters, 13.3%).
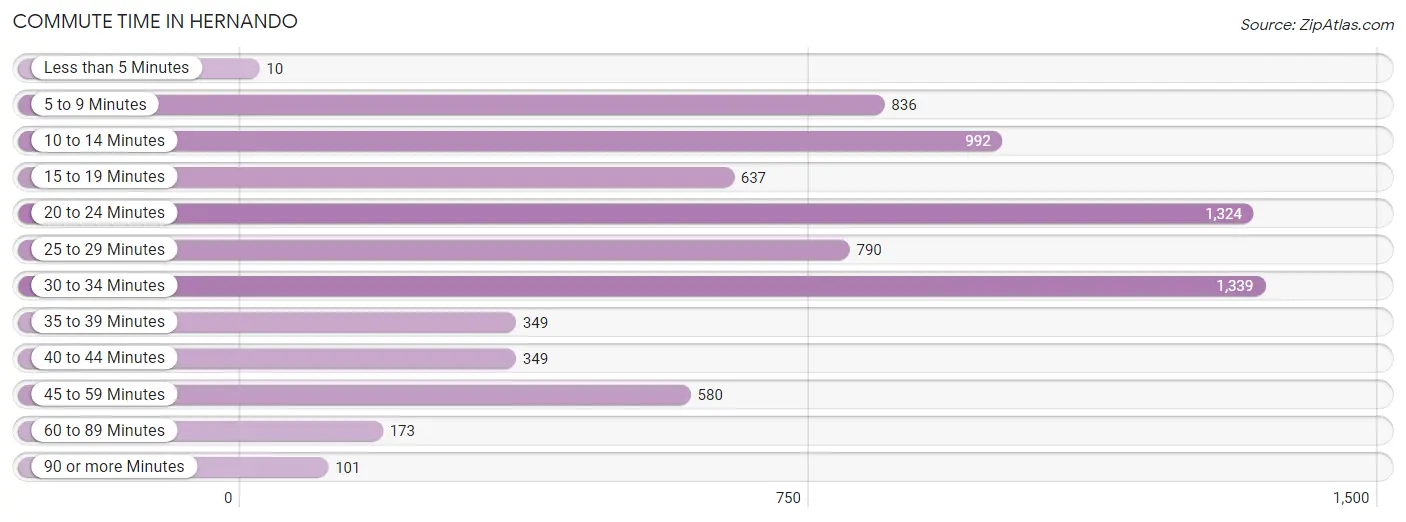
| Commute Time | # Commuters | % Commuters |
| Less than 5 Minutes | 10 | 0.1% |
| 5 to 9 Minutes | 836 | 11.2% |
| 10 to 14 Minutes | 992 | 13.3% |
| 15 to 19 Minutes | 637 | 8.5% |
| 20 to 24 Minutes | 1,324 | 17.7% |
| 25 to 29 Minutes | 790 | 10.6% |
| 30 to 34 Minutes | 1,339 | 17.9% |
| 35 to 39 Minutes | 349 | 4.7% |
| 40 to 44 Minutes | 349 | 4.7% |
| 45 to 59 Minutes | 580 | 7.7% |
| 60 to 89 Minutes | 173 | 2.3% |
| 90 or more Minutes | 101 | 1.3% |
Commute Time by Sex in Hernando
The most common commute times in Hernando are 30 to 34 minutes (861 commuters, 21.1%) for males and 20 to 24 minutes (753 commuters, 22.2%) for females.
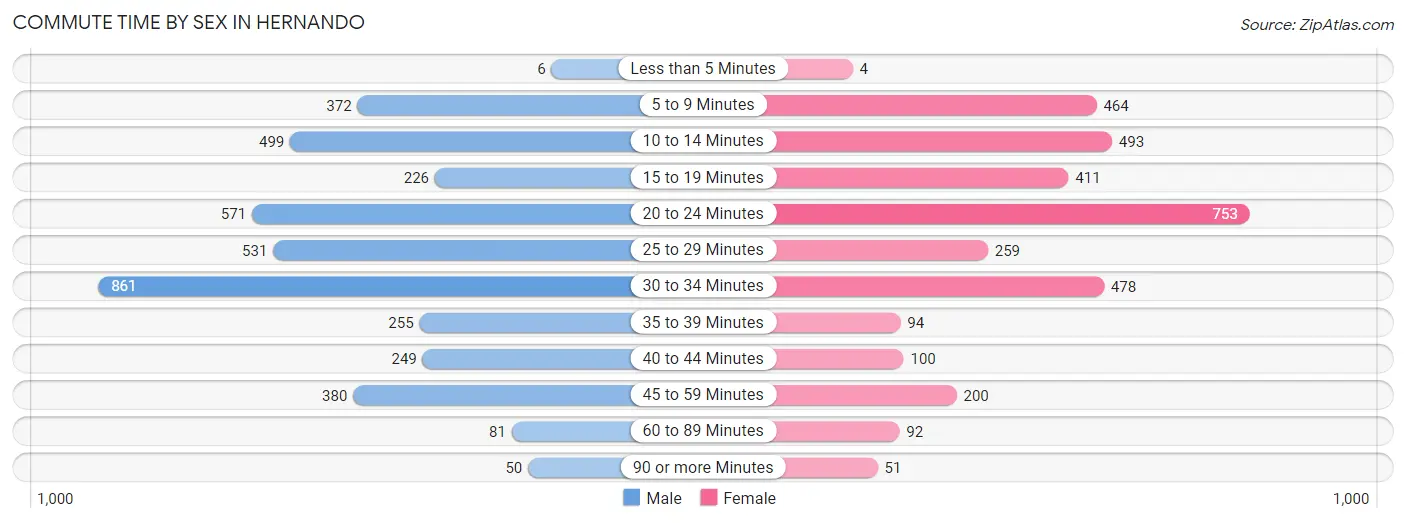
| Commute Time | Male | Female |
| Less than 5 Minutes | 6 (0.2%) | 4 (0.1%) |
| 5 to 9 Minutes | 372 (9.1%) | 464 (13.7%) |
| 10 to 14 Minutes | 499 (12.2%) | 493 (14.5%) |
| 15 to 19 Minutes | 226 (5.5%) | 411 (12.1%) |
| 20 to 24 Minutes | 571 (14.0%) | 753 (22.2%) |
| 25 to 29 Minutes | 531 (13.0%) | 259 (7.6%) |
| 30 to 34 Minutes | 861 (21.1%) | 478 (14.1%) |
| 35 to 39 Minutes | 255 (6.2%) | 94 (2.8%) |
| 40 to 44 Minutes | 249 (6.1%) | 100 (2.9%) |
| 45 to 59 Minutes | 380 (9.3%) | 200 (5.9%) |
| 60 to 89 Minutes | 81 (2.0%) | 92 (2.7%) |
| 90 or more Minutes | 50 (1.2%) | 51 (1.5%) |
Time of Departure to Work by Sex in Hernando
The most frequent times of departure to work in Hernando are 7:00 AM to 7:29 AM (988, 24.2%) for males and 7:00 AM to 7:29 AM (875, 25.7%) for females.
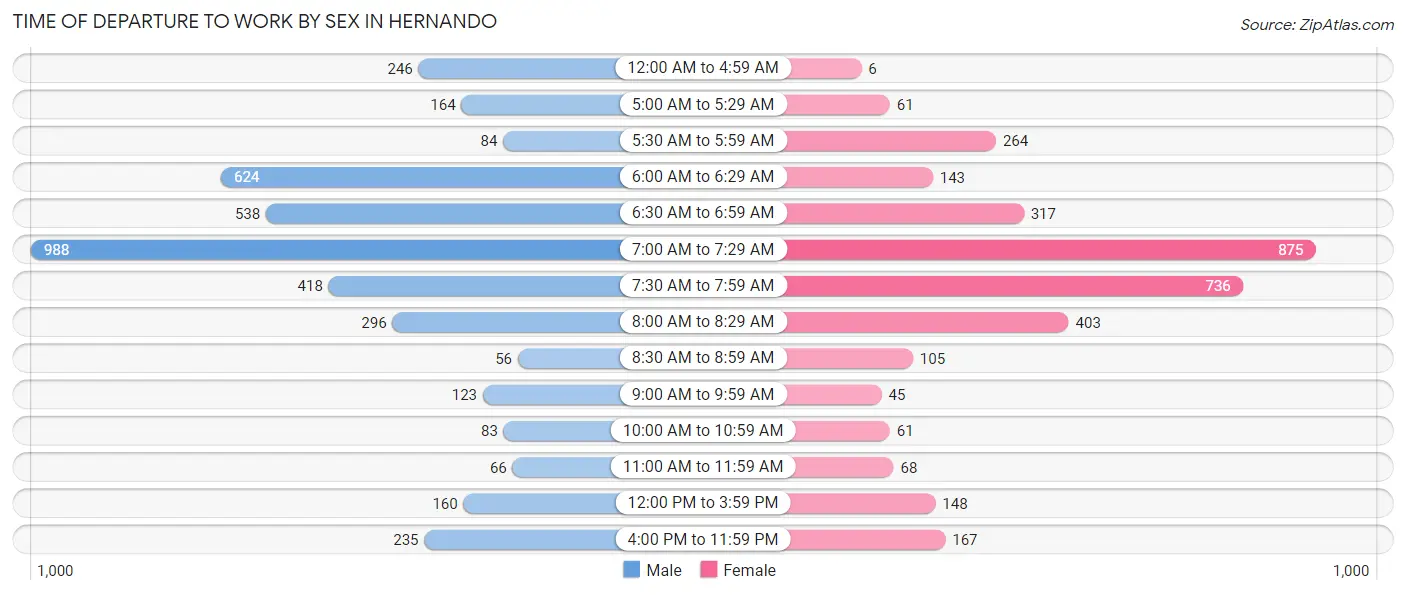
| Time of Departure | Male | Female |
| 12:00 AM to 4:59 AM | 246 (6.0%) | 6 (0.2%) |
| 5:00 AM to 5:29 AM | 164 (4.0%) | 61 (1.8%) |
| 5:30 AM to 5:59 AM | 84 (2.1%) | 264 (7.8%) |
| 6:00 AM to 6:29 AM | 624 (15.3%) | 143 (4.2%) |
| 6:30 AM to 6:59 AM | 538 (13.2%) | 317 (9.3%) |
| 7:00 AM to 7:29 AM | 988 (24.2%) | 875 (25.7%) |
| 7:30 AM to 7:59 AM | 418 (10.2%) | 736 (21.6%) |
| 8:00 AM to 8:29 AM | 296 (7.2%) | 403 (11.9%) |
| 8:30 AM to 8:59 AM | 56 (1.4%) | 105 (3.1%) |
| 9:00 AM to 9:59 AM | 123 (3.0%) | 45 (1.3%) |
| 10:00 AM to 10:59 AM | 83 (2.0%) | 61 (1.8%) |
| 11:00 AM to 11:59 AM | 66 (1.6%) | 68 (2.0%) |
| 12:00 PM to 3:59 PM | 160 (3.9%) | 148 (4.3%) |
| 4:00 PM to 11:59 PM | 235 (5.8%) | 167 (4.9%) |
| Total | 4,081 (100.0%) | 3,399 (100.0%) |
Housing Occupancy in Hernando
Occupancy by Ownership in Hernando
Of the total 6,715 dwellings in Hernando, owner-occupied units account for 5,376 (80.1%), while renter-occupied units make up 1,339 (19.9%).
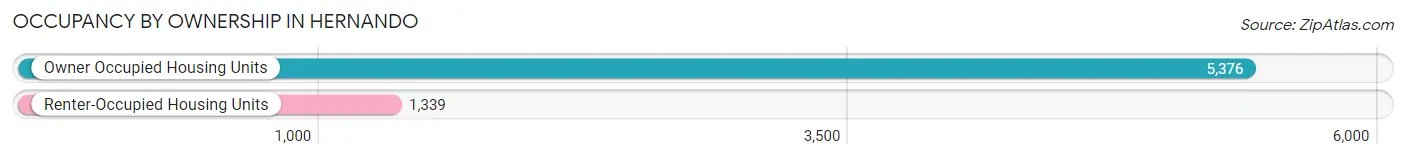
| Occupancy | # Housing Units | % Housing Units |
| Owner Occupied Housing Units | 5,376 | 80.1% |
| Renter-Occupied Housing Units | 1,339 | 19.9% |
| Total Occupied Housing Units | 6,715 | 100.0% |
Occupancy by Household Size in Hernando
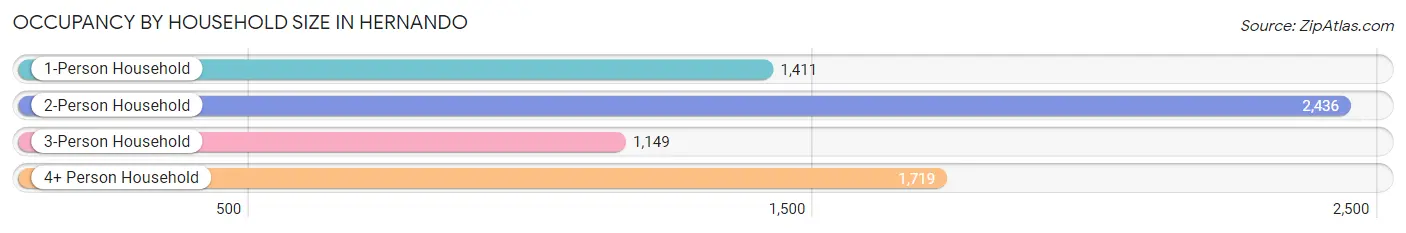
| Household Size | # Housing Units | % Housing Units |
| 1-Person Household | 1,411 | 21.0% |
| 2-Person Household | 2,436 | 36.3% |
| 3-Person Household | 1,149 | 17.1% |
| 4+ Person Household | 1,719 | 25.6% |
| Total Housing Units | 6,715 | 100.0% |
Occupancy by Ownership by Household Size in Hernando
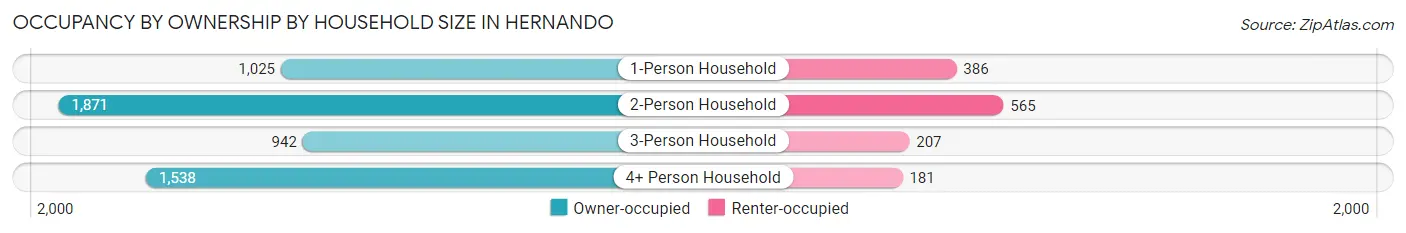
| Household Size | Owner-occupied | Renter-occupied |
| 1-Person Household | 1,025 (72.6%) | 386 (27.4%) |
| 2-Person Household | 1,871 (76.8%) | 565 (23.2%) |
| 3-Person Household | 942 (82.0%) | 207 (18.0%) |
| 4+ Person Household | 1,538 (89.5%) | 181 (10.5%) |
| Total Housing Units | 5,376 (80.1%) | 1,339 (19.9%) |
Occupancy by Educational Attainment in Hernando
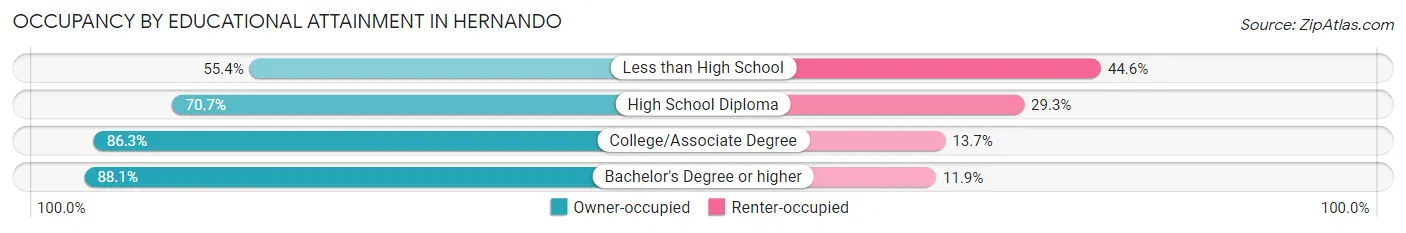
| Household Size | Owner-occupied | Renter-occupied |
| Less than High School | 538 (55.4%) | 433 (44.6%) |
| High School Diploma | 744 (70.7%) | 309 (29.3%) |
| College/Associate Degree | 1,839 (86.3%) | 293 (13.7%) |
| Bachelor's Degree or higher | 2,255 (88.1%) | 304 (11.9%) |
Occupancy by Age of Householder in Hernando
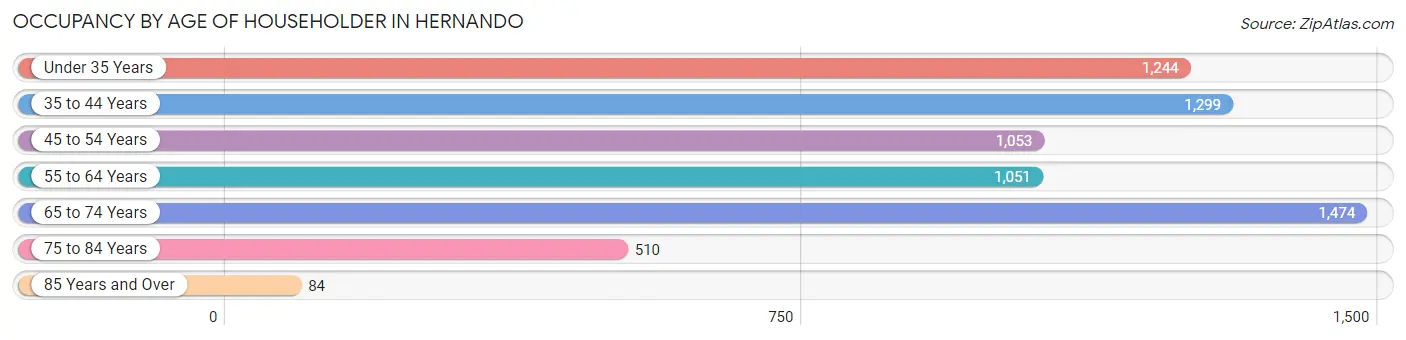
| Age Bracket | # Households | % Households |
| Under 35 Years | 1,244 | 18.5% |
| 35 to 44 Years | 1,299 | 19.3% |
| 45 to 54 Years | 1,053 | 15.7% |
| 55 to 64 Years | 1,051 | 15.7% |
| 65 to 74 Years | 1,474 | 22.0% |
| 75 to 84 Years | 510 | 7.6% |
| 85 Years and Over | 84 | 1.3% |
| Total | 6,715 | 100.0% |
Housing Finances in Hernando
Median Income by Occupancy in Hernando
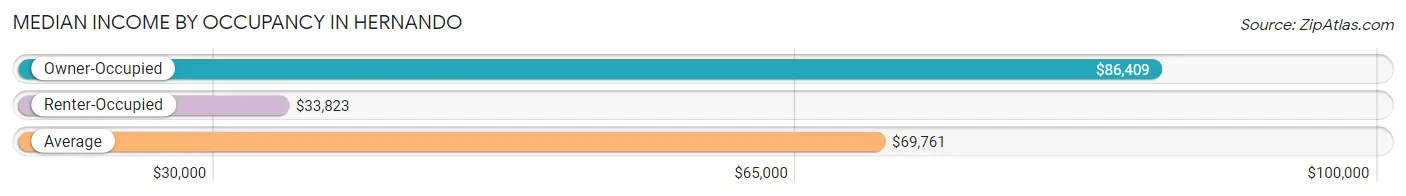
| Occupancy Type | # Households | Median Income |
| Owner-Occupied | 5,376 (80.1%) | $86,409 |
| Renter-Occupied | 1,339 (19.9%) | $33,823 |
| Average | 6,715 (100.0%) | $69,761 |
Occupancy by Householder Income Bracket in Hernando
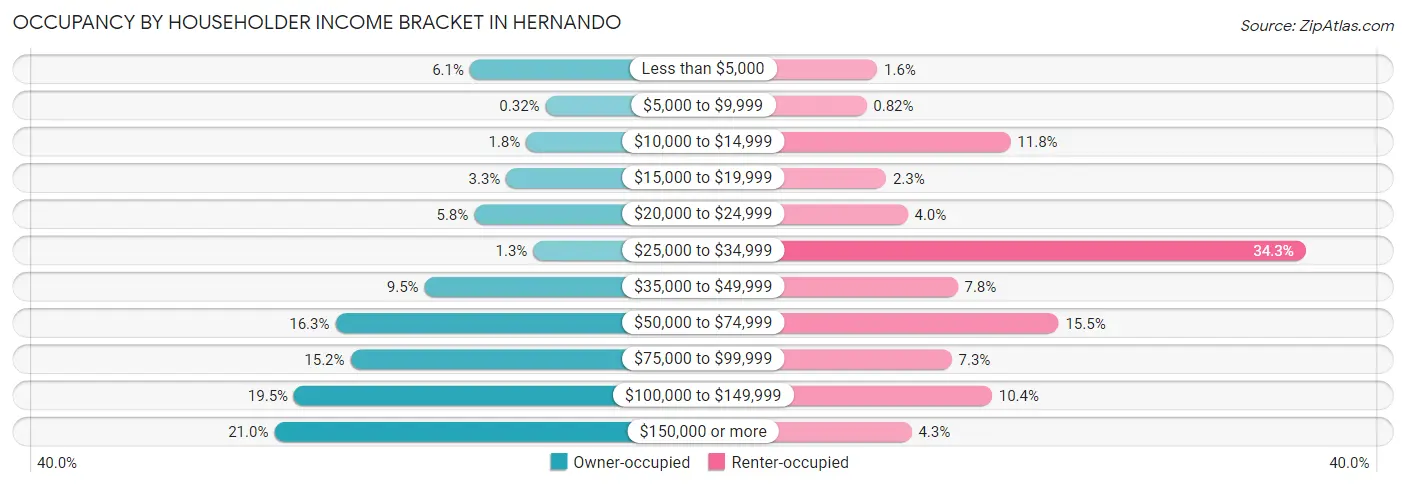
| Income Bracket | Owner-occupied | Renter-occupied |
| Less than $5,000 | 327 (6.1%) | 22 (1.6%) |
| $5,000 to $9,999 | 17 (0.3%) | 11 (0.8%) |
| $10,000 to $14,999 | 96 (1.8%) | 158 (11.8%) |
| $15,000 to $19,999 | 178 (3.3%) | 31 (2.3%) |
| $20,000 to $24,999 | 309 (5.8%) | 53 (4.0%) |
| $25,000 to $34,999 | 67 (1.3%) | 459 (34.3%) |
| $35,000 to $49,999 | 513 (9.5%) | 104 (7.8%) |
| $50,000 to $74,999 | 878 (16.3%) | 207 (15.5%) |
| $75,000 to $99,999 | 816 (15.2%) | 98 (7.3%) |
| $100,000 to $149,999 | 1,047 (19.5%) | 139 (10.4%) |
| $150,000 or more | 1,128 (21.0%) | 57 (4.3%) |
| Total | 5,376 (100.0%) | 1,339 (100.0%) |
Monthly Housing Cost Tiers in Hernando
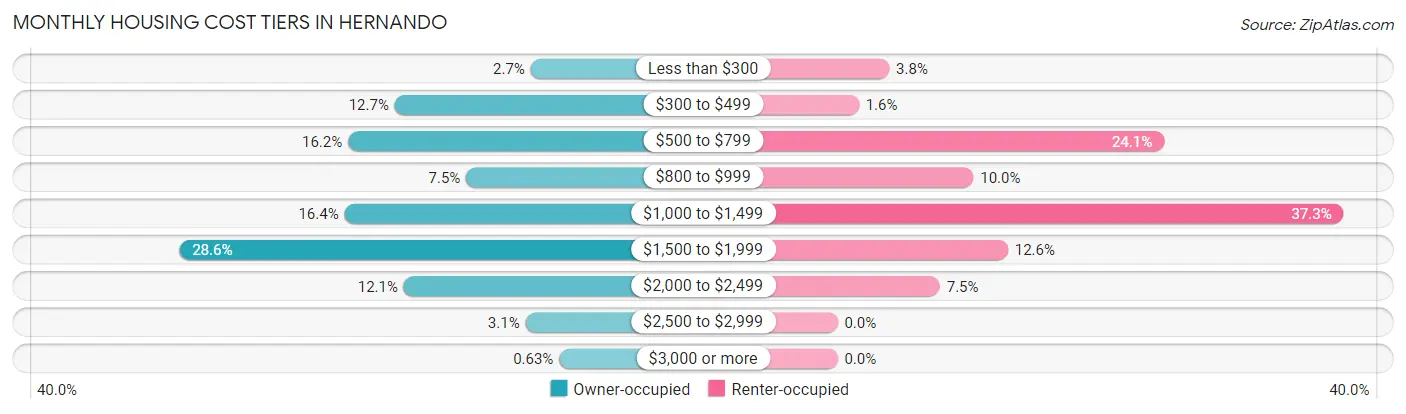
| Monthly Cost | Owner-occupied | Renter-occupied |
| Less than $300 | 147 (2.7%) | 51 (3.8%) |
| $300 to $499 | 685 (12.7%) | 21 (1.6%) |
| $500 to $799 | 870 (16.2%) | 322 (24.0%) |
| $800 to $999 | 402 (7.5%) | 134 (10.0%) |
| $1,000 to $1,499 | 884 (16.4%) | 499 (37.3%) |
| $1,500 to $1,999 | 1,538 (28.6%) | 168 (12.6%) |
| $2,000 to $2,499 | 649 (12.1%) | 101 (7.5%) |
| $2,500 to $2,999 | 167 (3.1%) | 0 (0.0%) |
| $3,000 or more | 34 (0.6%) | 0 (0.0%) |
| Total | 5,376 (100.0%) | 1,339 (100.0%) |
Physical Housing Characteristics in Hernando
Housing Structures in Hernando
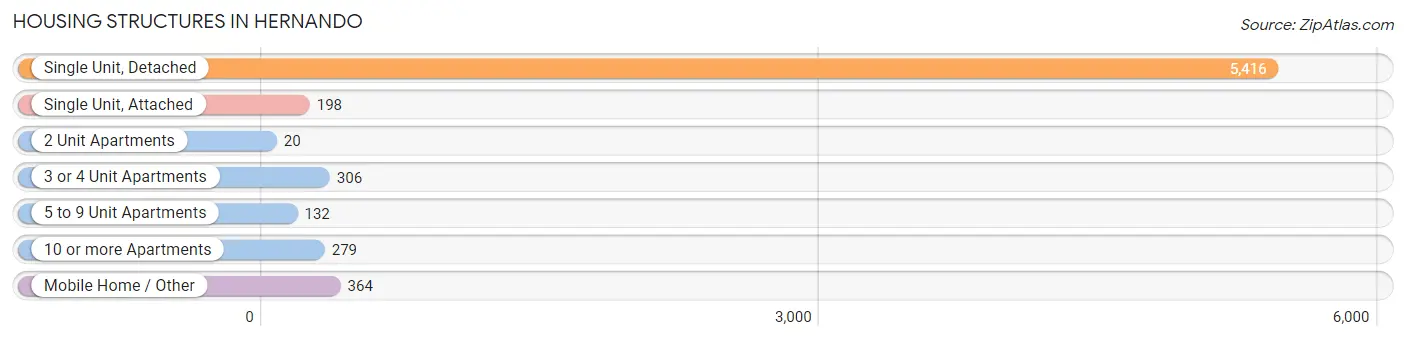
| Structure Type | # Housing Units | % Housing Units |
| Single Unit, Detached | 5,416 | 80.7% |
| Single Unit, Attached | 198 | 2.9% |
| 2 Unit Apartments | 20 | 0.3% |
| 3 or 4 Unit Apartments | 306 | 4.6% |
| 5 to 9 Unit Apartments | 132 | 2.0% |
| 10 or more Apartments | 279 | 4.2% |
| Mobile Home / Other | 364 | 5.4% |
| Total | 6,715 | 100.0% |
Housing Structures by Occupancy in Hernando
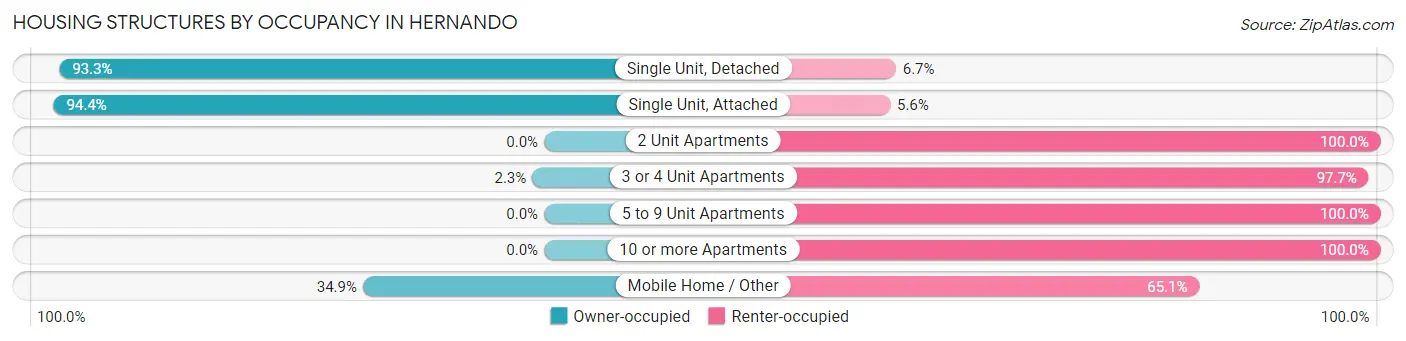
| Structure Type | Owner-occupied | Renter-occupied |
| Single Unit, Detached | 5,055 (93.3%) | 361 (6.7%) |
| Single Unit, Attached | 187 (94.4%) | 11 (5.6%) |
| 2 Unit Apartments | 0 (0.0%) | 20 (100.0%) |
| 3 or 4 Unit Apartments | 7 (2.3%) | 299 (97.7%) |
| 5 to 9 Unit Apartments | 0 (0.0%) | 132 (100.0%) |
| 10 or more Apartments | 0 (0.0%) | 279 (100.0%) |
| Mobile Home / Other | 127 (34.9%) | 237 (65.1%) |
| Total | 5,376 (80.1%) | 1,339 (19.9%) |
Housing Structures by Number of Rooms in Hernando
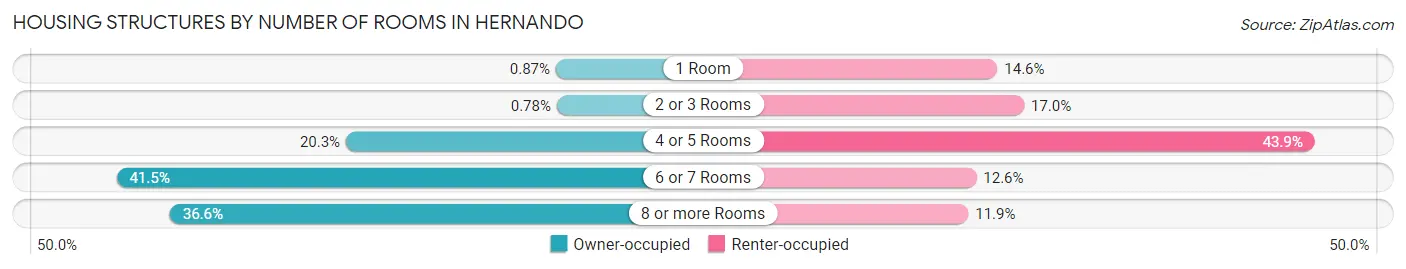
| Number of Rooms | Owner-occupied | Renter-occupied |
| 1 Room | 47 (0.9%) | 195 (14.6%) |
| 2 or 3 Rooms | 42 (0.8%) | 228 (17.0%) |
| 4 or 5 Rooms | 1,090 (20.3%) | 588 (43.9%) |
| 6 or 7 Rooms | 2,231 (41.5%) | 169 (12.6%) |
| 8 or more Rooms | 1,966 (36.6%) | 159 (11.9%) |
| Total | 5,376 (100.0%) | 1,339 (100.0%) |
Housing Structure by Heating Type in Hernando
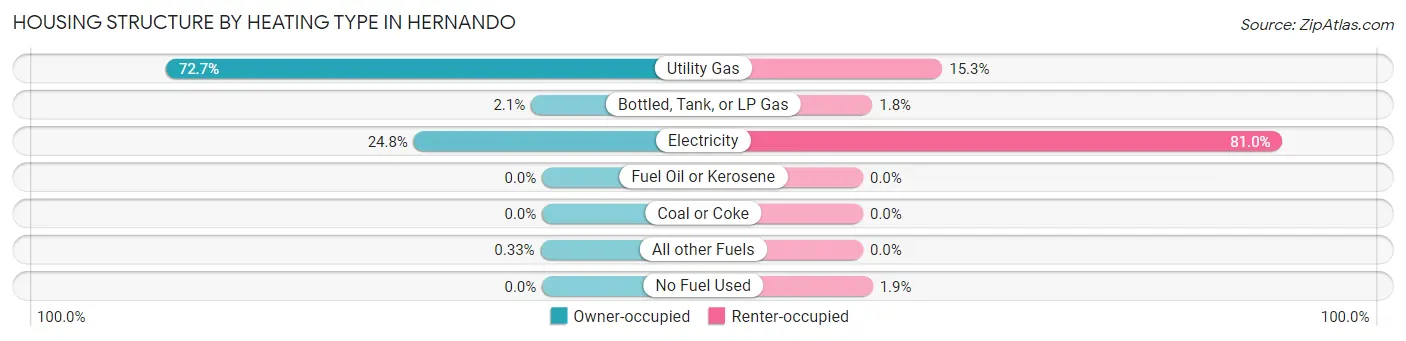
| Heating Type | Owner-occupied | Renter-occupied |
| Utility Gas | 3,909 (72.7%) | 205 (15.3%) |
| Bottled, Tank, or LP Gas | 115 (2.1%) | 24 (1.8%) |
| Electricity | 1,334 (24.8%) | 1,085 (81.0%) |
| Fuel Oil or Kerosene | 0 (0.0%) | 0 (0.0%) |
| Coal or Coke | 0 (0.0%) | 0 (0.0%) |
| All other Fuels | 18 (0.3%) | 0 (0.0%) |
| No Fuel Used | 0 (0.0%) | 25 (1.9%) |
| Total | 5,376 (100.0%) | 1,339 (100.0%) |
Household Vehicle Usage in Hernando
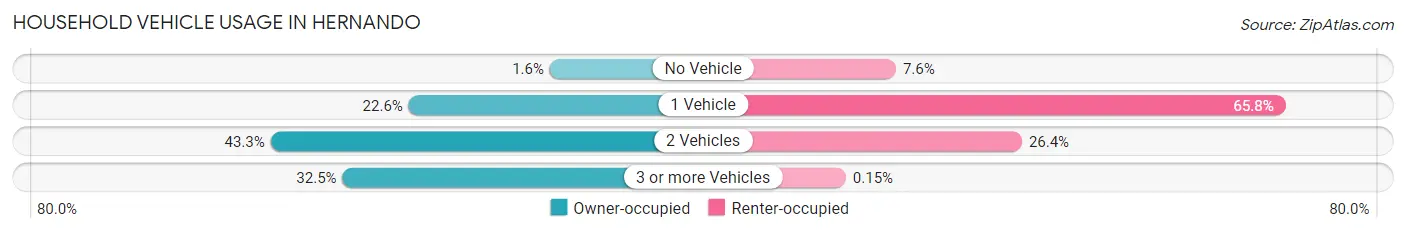
| Vehicles per Household | Owner-occupied | Renter-occupied |
| No Vehicle | 84 (1.6%) | 102 (7.6%) |
| 1 Vehicle | 1,217 (22.6%) | 881 (65.8%) |
| 2 Vehicles | 2,326 (43.3%) | 354 (26.4%) |
| 3 or more Vehicles | 1,749 (32.5%) | 2 (0.2%) |
| Total | 5,376 (100.0%) | 1,339 (100.0%) |
Real Estate & Mortgages in Hernando
Real Estate and Mortgage Overview in Hernando
| Characteristic | Without Mortgage | With Mortgage |
| Housing Units | 1,741 | 3,635 |
| Median Property Value | $250,500 | $275,200 |
| Median Household Income | $53,303 | $974 |
| Monthly Housing Costs | $519 | $34 |
| Real Estate Taxes | $1,377 | $200 |
Property Value by Mortgage Status in Hernando
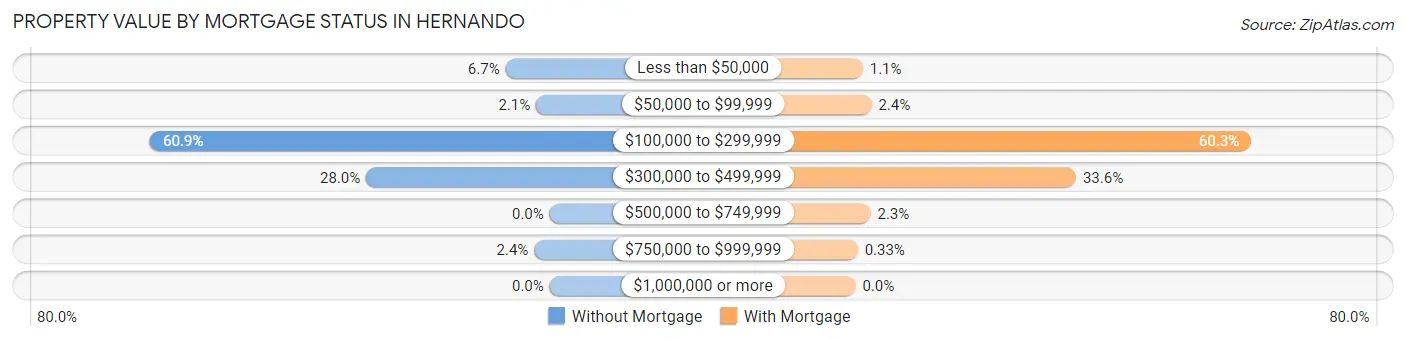
| Property Value | Without Mortgage | With Mortgage |
| Less than $50,000 | 117 (6.7%) | 40 (1.1%) |
| $50,000 to $99,999 | 36 (2.1%) | 88 (2.4%) |
| $100,000 to $299,999 | 1,060 (60.9%) | 2,191 (60.3%) |
| $300,000 to $499,999 | 487 (28.0%) | 1,221 (33.6%) |
| $500,000 to $749,999 | 0 (0.0%) | 83 (2.3%) |
| $750,000 to $999,999 | 41 (2.4%) | 12 (0.3%) |
| $1,000,000 or more | 0 (0.0%) | 0 (0.0%) |
| Total | 1,741 (100.0%) | 3,635 (100.0%) |
Household Income by Mortgage Status in Hernando
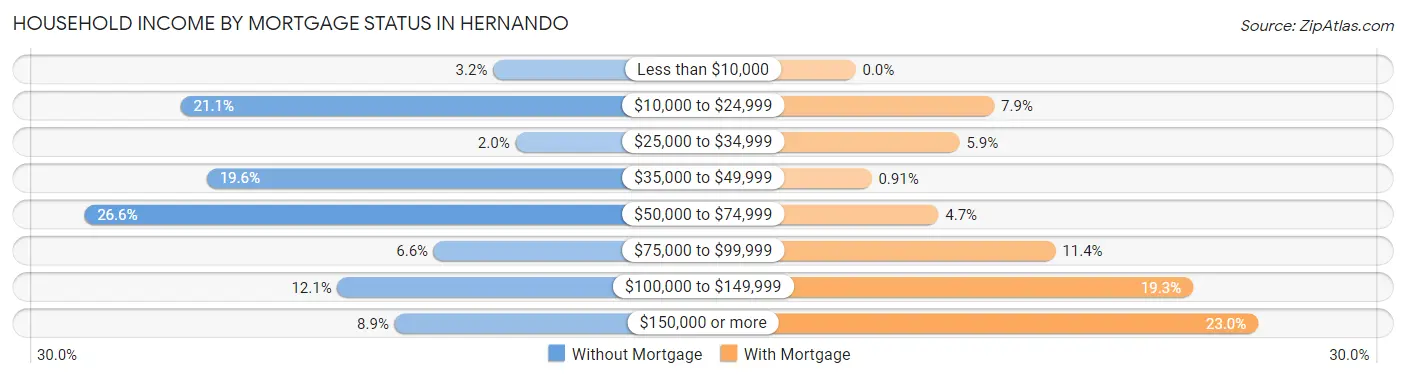
| Household Income | Without Mortgage | With Mortgage |
| Less than $10,000 | 56 (3.2%) | 0 (0.0%) |
| $10,000 to $24,999 | 367 (21.1%) | 288 (7.9%) |
| $25,000 to $34,999 | 34 (1.9%) | 216 (5.9%) |
| $35,000 to $49,999 | 341 (19.6%) | 33 (0.9%) |
| $50,000 to $74,999 | 463 (26.6%) | 172 (4.7%) |
| $75,000 to $99,999 | 115 (6.6%) | 415 (11.4%) |
| $100,000 to $149,999 | 211 (12.1%) | 701 (19.3%) |
| $150,000 or more | 154 (8.8%) | 836 (23.0%) |
| Total | 1,741 (100.0%) | 3,635 (100.0%) |
Property Value to Household Income Ratio in Hernando
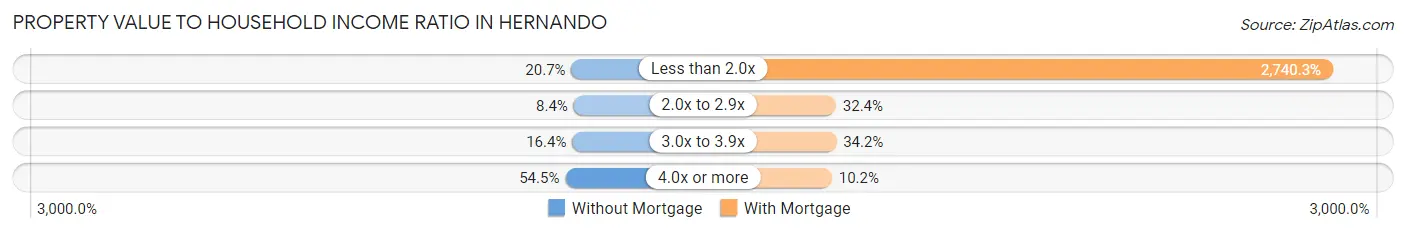
| Value-to-Income Ratio | Without Mortgage | With Mortgage |
| Less than 2.0x | 360 (20.7%) | 99,609 (2,740.3%) |
| 2.0x to 2.9x | 147 (8.4%) | 1,177 (32.4%) |
| 3.0x to 3.9x | 285 (16.4%) | 1,244 (34.2%) |
| 4.0x or more | 949 (54.5%) | 369 (10.2%) |
| Total | 1,741 (100.0%) | 3,635 (100.0%) |
Real Estate Taxes by Mortgage Status in Hernando
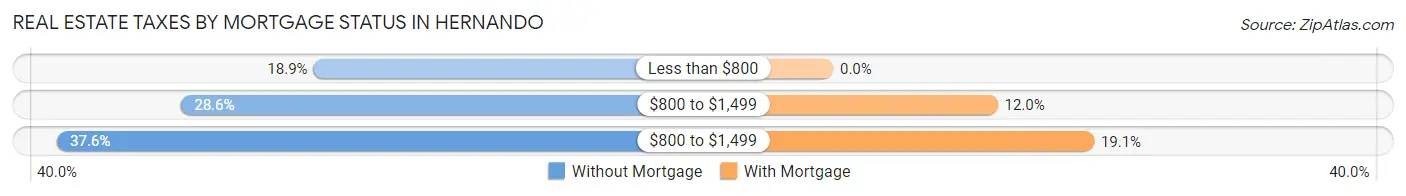
| Property Taxes | Without Mortgage | With Mortgage |
| Less than $800 | 329 (18.9%) | 0 (0.0%) |
| $800 to $1,499 | 497 (28.5%) | 437 (12.0%) |
| $800 to $1,499 | 655 (37.6%) | 693 (19.1%) |
| Total | 1,741 (100.0%) | 3,635 (100.0%) |
Health & Disability in Hernando
Health Insurance Coverage by Age in Hernando
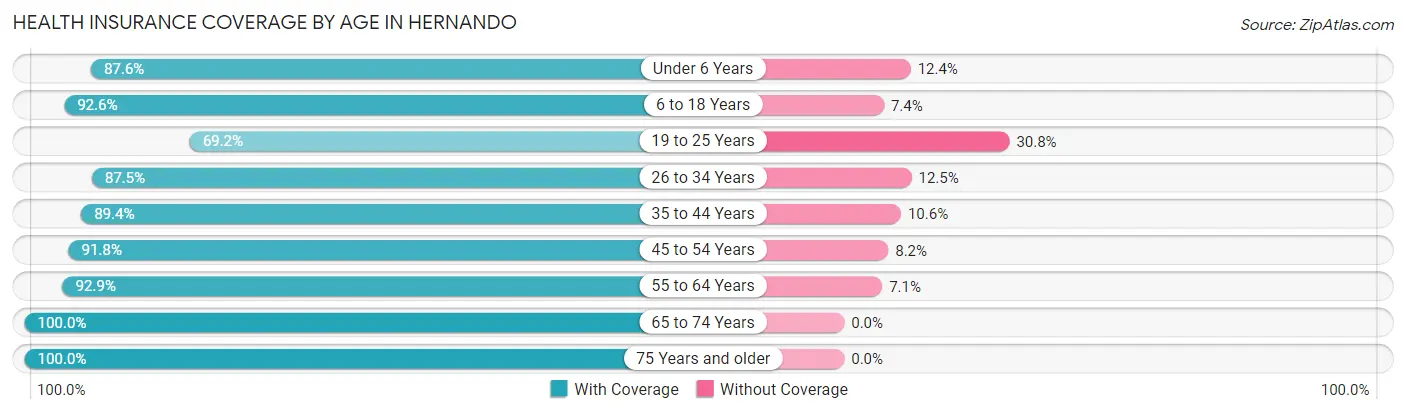
| Age Bracket | With Coverage | Without Coverage |
| Under 6 Years | 1,507 (87.6%) | 213 (12.4%) |
| 6 to 18 Years | 2,751 (92.6%) | 220 (7.4%) |
| 19 to 25 Years | 939 (69.2%) | 418 (30.8%) |
| 26 to 34 Years | 1,856 (87.5%) | 266 (12.5%) |
| 35 to 44 Years | 2,013 (89.4%) | 238 (10.6%) |
| 45 to 54 Years | 1,736 (91.8%) | 155 (8.2%) |
| 55 to 64 Years | 1,460 (92.9%) | 111 (7.1%) |
| 65 to 74 Years | 2,165 (100.0%) | 0 (0.0%) |
| 75 Years and older | 955 (100.0%) | 0 (0.0%) |
| Total | 15,382 (90.5%) | 1,621 (9.5%) |
Health Insurance Coverage by Citizenship Status in Hernando
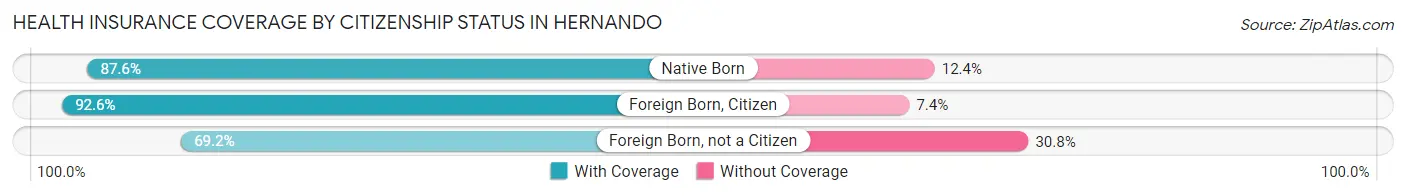
| Citizenship Status | With Coverage | Without Coverage |
| Native Born | 1,507 (87.6%) | 213 (12.4%) |
| Foreign Born, Citizen | 2,751 (92.6%) | 220 (7.4%) |
| Foreign Born, not a Citizen | 939 (69.2%) | 418 (30.8%) |
Health Insurance Coverage by Household Income in Hernando
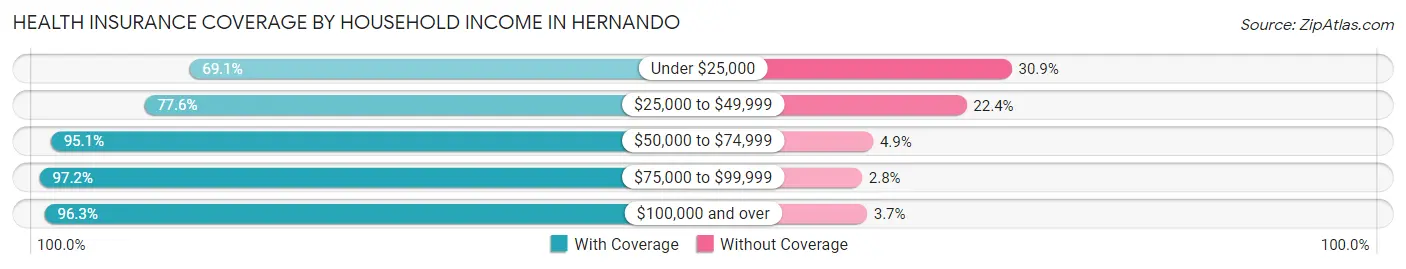
| Household Income | With Coverage | Without Coverage |
| Under $25,000 | 1,387 (69.1%) | 619 (30.9%) |
| $25,000 to $49,999 | 1,818 (77.6%) | 525 (22.4%) |
| $50,000 to $74,999 | 2,443 (95.1%) | 126 (4.9%) |
| $75,000 to $99,999 | 2,654 (97.2%) | 77 (2.8%) |
| $100,000 and over | 7,054 (96.3%) | 274 (3.7%) |
Public vs Private Health Insurance Coverage by Age in Hernando
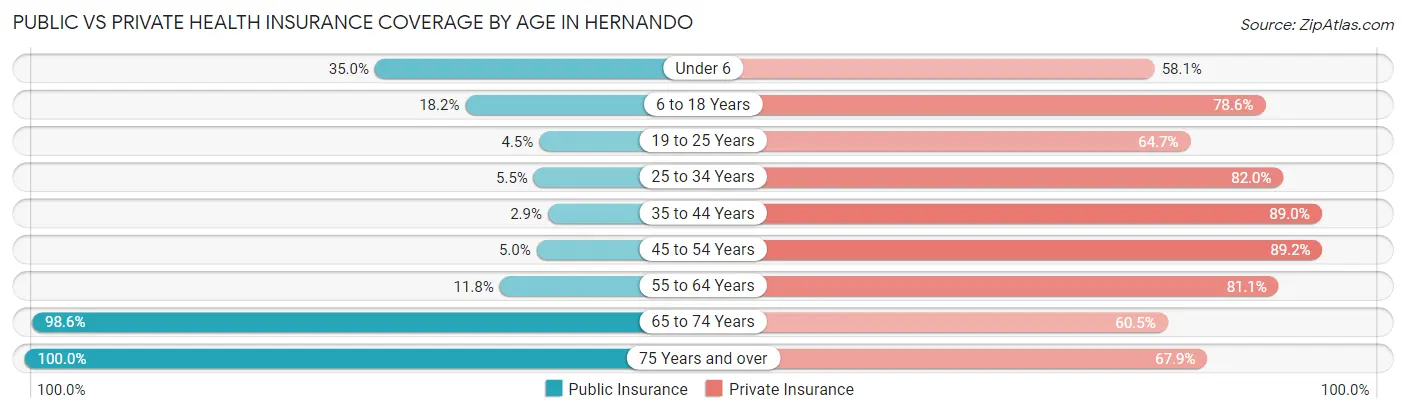
| Age Bracket | Public Insurance | Private Insurance |
| Under 6 | 602 (35.0%) | 999 (58.1%) |
| 6 to 18 Years | 541 (18.2%) | 2,335 (78.6%) |
| 19 to 25 Years | 61 (4.5%) | 878 (64.7%) |
| 25 to 34 Years | 117 (5.5%) | 1,739 (82.0%) |
| 35 to 44 Years | 65 (2.9%) | 2,004 (89.0%) |
| 45 to 54 Years | 94 (5.0%) | 1,687 (89.2%) |
| 55 to 64 Years | 186 (11.8%) | 1,274 (81.1%) |
| 65 to 74 Years | 2,135 (98.6%) | 1,309 (60.5%) |
| 75 Years and over | 955 (100.0%) | 648 (67.8%) |
| Total | 4,756 (28.0%) | 12,873 (75.7%) |
Disability Status by Sex by Age in Hernando
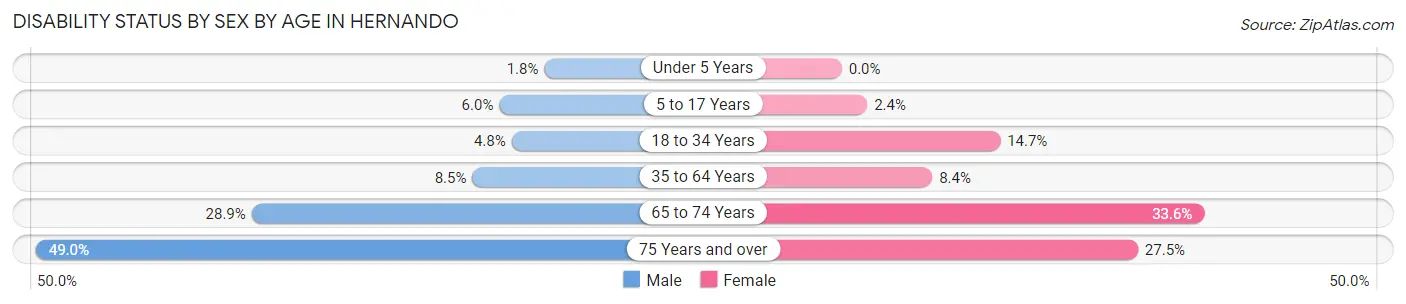
| Age Bracket | Male | Female |
| Under 5 Years | 15 (1.8%) | 0 (0.0%) |
| 5 to 17 Years | 90 (5.9%) | 35 (2.4%) |
| 18 to 34 Years | 73 (4.8%) | 299 (14.7%) |
| 35 to 64 Years | 242 (8.5%) | 239 (8.4%) |
| 65 to 74 Years | 241 (28.9%) | 448 (33.6%) |
| 75 Years and over | 236 (49.0%) | 130 (27.5%) |
Disability Class by Sex by Age in Hernando
Disability Class: Hearing Difficulty
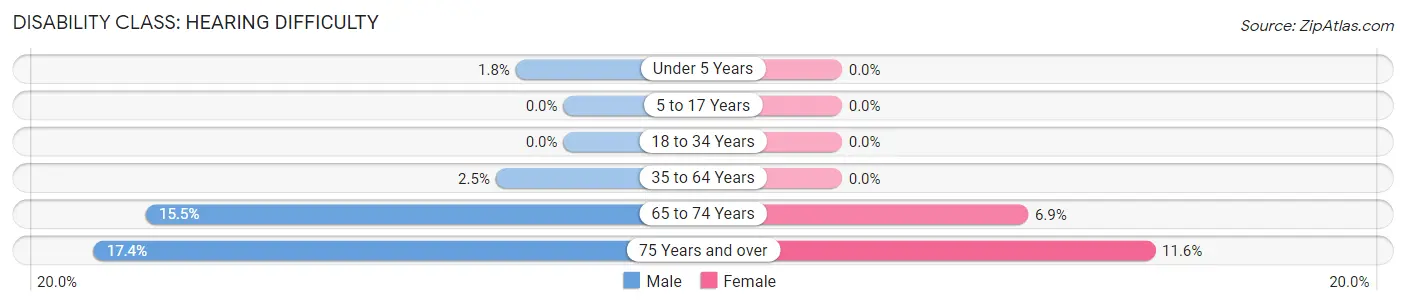
| Age Bracket | Male | Female |
| Under 5 Years | 15 (1.8%) | 0 (0.0%) |
| 5 to 17 Years | 0 (0.0%) | 0 (0.0%) |
| 18 to 34 Years | 0 (0.0%) | 0 (0.0%) |
| 35 to 64 Years | 72 (2.5%) | 0 (0.0%) |
| 65 to 74 Years | 129 (15.5%) | 92 (6.9%) |
| 75 Years and over | 84 (17.4%) | 55 (11.6%) |
Disability Class: Vision Difficulty
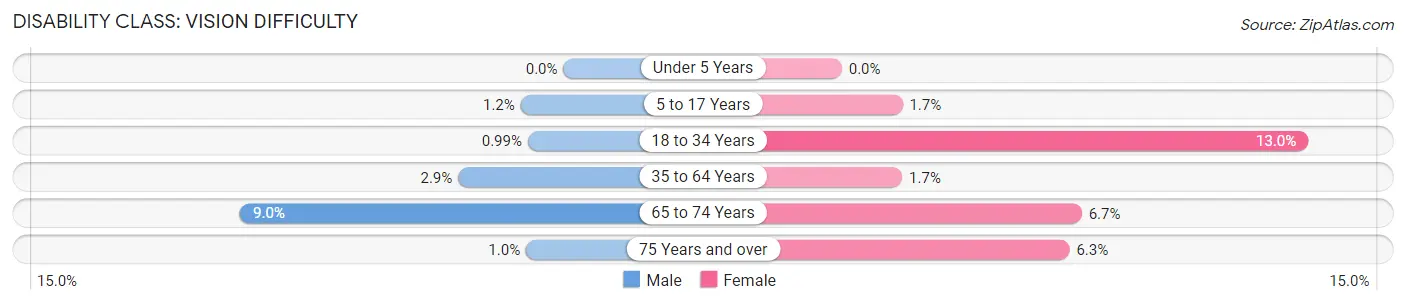
| Age Bracket | Male | Female |
| Under 5 Years | 0 (0.0%) | 0 (0.0%) |
| 5 to 17 Years | 18 (1.2%) | 25 (1.7%) |
| 18 to 34 Years | 15 (1.0%) | 264 (13.0%) |
| 35 to 64 Years | 84 (2.9%) | 48 (1.7%) |
| 65 to 74 Years | 75 (9.0%) | 89 (6.7%) |
| 75 Years and over | 5 (1.0%) | 30 (6.3%) |
Disability Class: Cognitive Difficulty
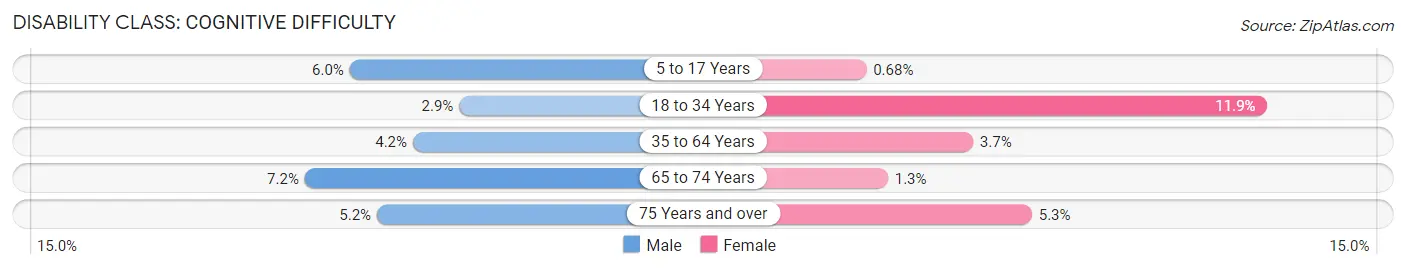
| Age Bracket | Male | Female |
| 5 to 17 Years | 90 (5.9%) | 10 (0.7%) |
| 18 to 34 Years | 44 (2.9%) | 241 (11.8%) |
| 35 to 64 Years | 120 (4.2%) | 104 (3.6%) |
| 65 to 74 Years | 60 (7.2%) | 17 (1.3%) |
| 75 Years and over | 25 (5.2%) | 25 (5.3%) |
Disability Class: Ambulatory Difficulty
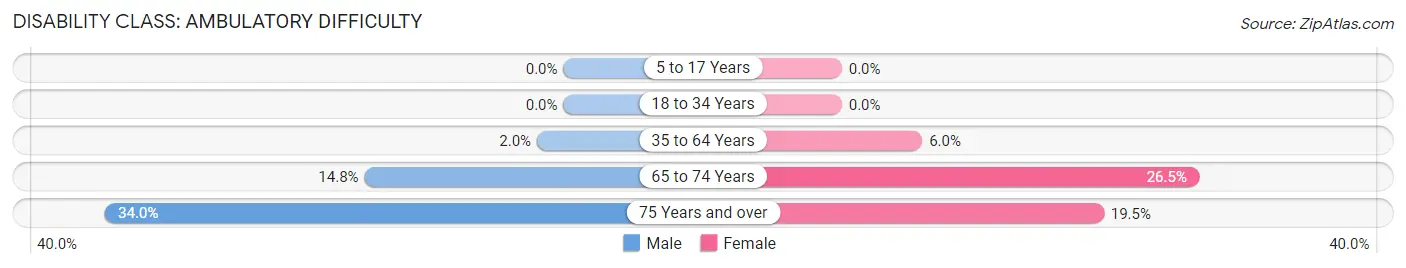
| Age Bracket | Male | Female |
| 5 to 17 Years | 0 (0.0%) | 0 (0.0%) |
| 18 to 34 Years | 0 (0.0%) | 0 (0.0%) |
| 35 to 64 Years | 56 (2.0%) | 170 (6.0%) |
| 65 to 74 Years | 123 (14.8%) | 353 (26.5%) |
| 75 Years and over | 164 (34.0%) | 92 (19.5%) |
Disability Class: Self-Care Difficulty
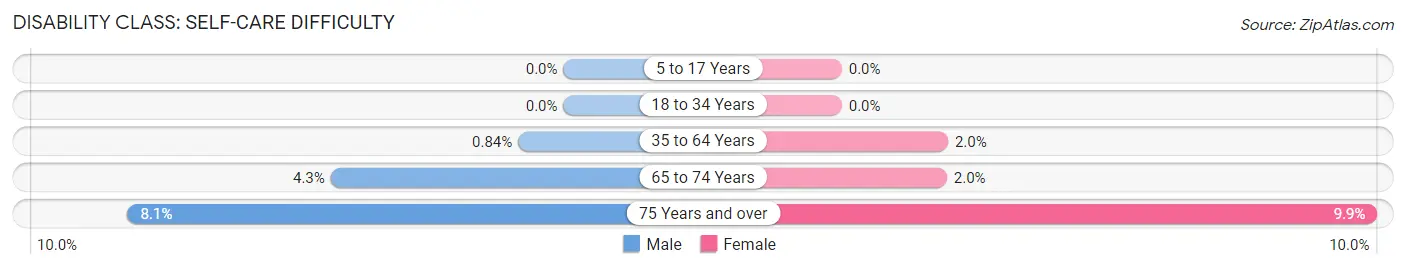
| Age Bracket | Male | Female |
| 5 to 17 Years | 0 (0.0%) | 0 (0.0%) |
| 18 to 34 Years | 0 (0.0%) | 0 (0.0%) |
| 35 to 64 Years | 24 (0.8%) | 56 (2.0%) |
| 65 to 74 Years | 36 (4.3%) | 26 (1.9%) |
| 75 Years and over | 39 (8.1%) | 47 (9.9%) |
Technology Access in Hernando
Computing Device Access in Hernando
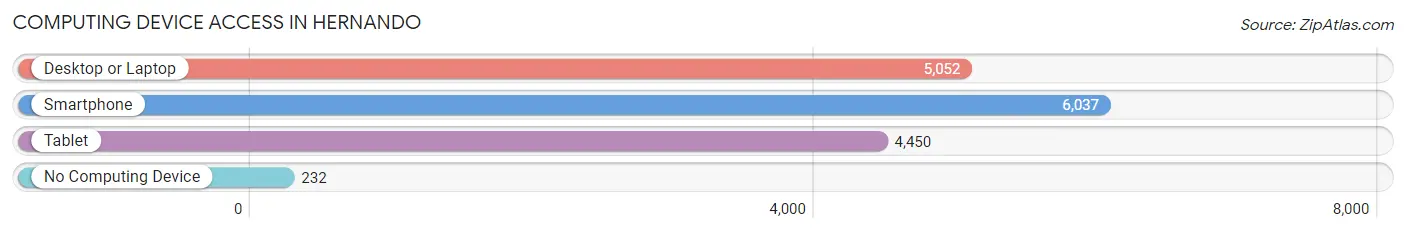
| Device Type | # Households | % Households |
| Desktop or Laptop | 5,052 | 75.2% |
| Smartphone | 6,037 | 89.9% |
| Tablet | 4,450 | 66.3% |
| No Computing Device | 232 | 3.5% |
| Total | 6,715 | 100.0% |
Internet Access in Hernando
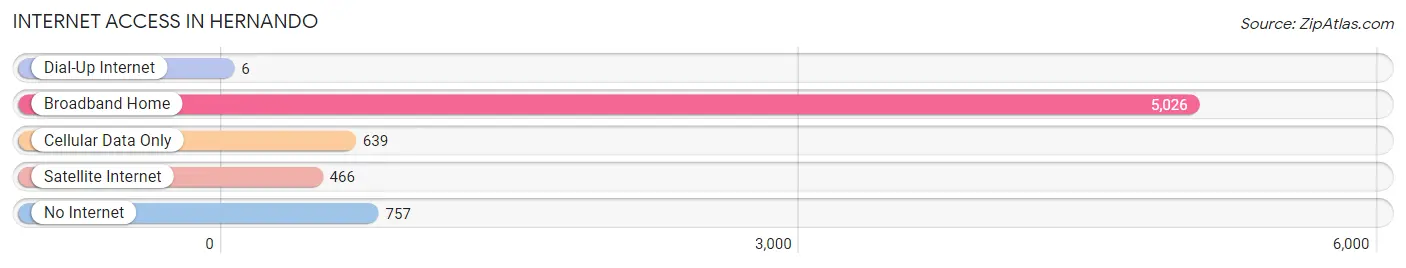
| Internet Type | # Households | % Households |
| Dial-Up Internet | 6 | 0.1% |
| Broadband Home | 5,026 | 74.9% |
| Cellular Data Only | 639 | 9.5% |
| Satellite Internet | 466 | 6.9% |
| No Internet | 757 | 11.3% |
| Total | 6,715 | 100.0% |
Hernando Summary
Hernando, Mississippi is a small city located in DeSoto County, Mississippi. It is situated in the northwest corner of the state, just south of Memphis, Tennessee. The city has a population of approximately 14,000 people and is the county seat of DeSoto County.
History
Hernando was founded in 1836 and named after the Spanish explorer Hernando de Soto. The city was originally part of the Chickasaw Nation and was part of the Chickasaw Cession of 1832. The city was incorporated in 1858 and was the first city in DeSoto County.
During the Civil War, Hernando was a major supply center for the Confederate Army. The city was also the site of a major battle in 1864, when Union forces attempted to capture the city. The Union forces were unsuccessful and the city remained in Confederate hands.
After the Civil War, Hernando experienced a period of growth and prosperity. The city was home to several cotton mills and other industries. The city also became a popular tourist destination, with many people visiting the city to take advantage of its natural beauty.
Geography
Hernando is located in the northwest corner of Mississippi, just south of Memphis, Tennessee. The city is situated on the banks of the Coldwater River and is surrounded by rolling hills and forests. The city has a total area of 8.3 square miles, with a population density of 1,717 people per square mile.
The climate in Hernando is humid subtropical, with hot, humid summers and mild winters. The average annual temperature is 64 degrees Fahrenheit, with an average high of 87 degrees in the summer and an average low of 41 degrees in the winter.
Economy
Hernando’s economy is largely based on agriculture and manufacturing. The city is home to several large agricultural operations, including cotton, soybeans, corn, and wheat. The city is also home to several manufacturing companies, including furniture, automotive, and electronics.
The city is also home to several retail stores, restaurants, and other businesses. The city is home to several large employers, including the DeSoto County School District, the DeSoto County Hospital, and the DeSoto County Courthouse.
Demographics
As of the 2010 census, Hernando had a population of 14,090 people. The racial makeup of the city was 79.3% White, 17.2% African American, 0.3% Native American, 0.7% Asian, 0.1% Pacific Islander, 1.2% from other races, and 1.4% from two or more races. Hispanic or Latino of any race were 3.2% of the population.
The median income for a household in Hernando was $41,945, and the median income for a family was $50,945. The per capita income for the city was $20,945. About 11.2% of families and 14.2% of the population were below the poverty line, including 19.2% of those under age 18 and 10.2% of those age 65 or over.
Hernando is a small city with a rich history and a diverse economy. The city is home to several large employers and is a popular tourist destination. The city has a diverse population and a strong sense of community.
Common Questions
What is Per Capita Income in Hernando?
Per Capita income in Hernando is $35,172.
What is the Median Family Income in Hernando?
Median Family Income in Hernando is $87,135.
What is the Median Household income in Hernando?
Median Household Income in Hernando is $69,761.
What is Income or Wage Gap in Hernando?
Income or Wage Gap in Hernando is 6.7%.
Women in Hernando earn 93.3 cents for every dollar earned by a man.
What is Inequality or Gini Index in Hernando?
Inequality or Gini Index in Hernando is 0.44.
What is the Total Population of Hernando?
Total Population of Hernando is 17,262.
What is the Total Male Population of Hernando?
Total Male Population of Hernando is 8,305.
What is the Total Female Population of Hernando?
Total Female Population of Hernando is 8,957.
What is the Ratio of Males per 100 Females in Hernando?
There are 92.72 Males per 100 Females in Hernando.
What is the Ratio of Females per 100 Males in Hernando?
There are 107.85 Females per 100 Males in Hernando.
What is the Median Population Age in Hernando?
Median Population Age in Hernando is 36.1 Years.
What is the Average Family Size in Hernando
Average Family Size in Hernando is 2.9 People.
What is the Average Household Size in Hernando
Average Household Size in Hernando is 2.5 People.
How Large is the Labor Force in Hernando?
There are 8,234 People in the Labor Forcein in Hernando.
What is the Percentage of People in the Labor Force in Hernando?
63.2% of People are in the Labor Force in Hernando.
What is the Unemployment Rate in Hernando?
Unemployment Rate in Hernando is 2.2%.