Area Code 769 Map & Demographics
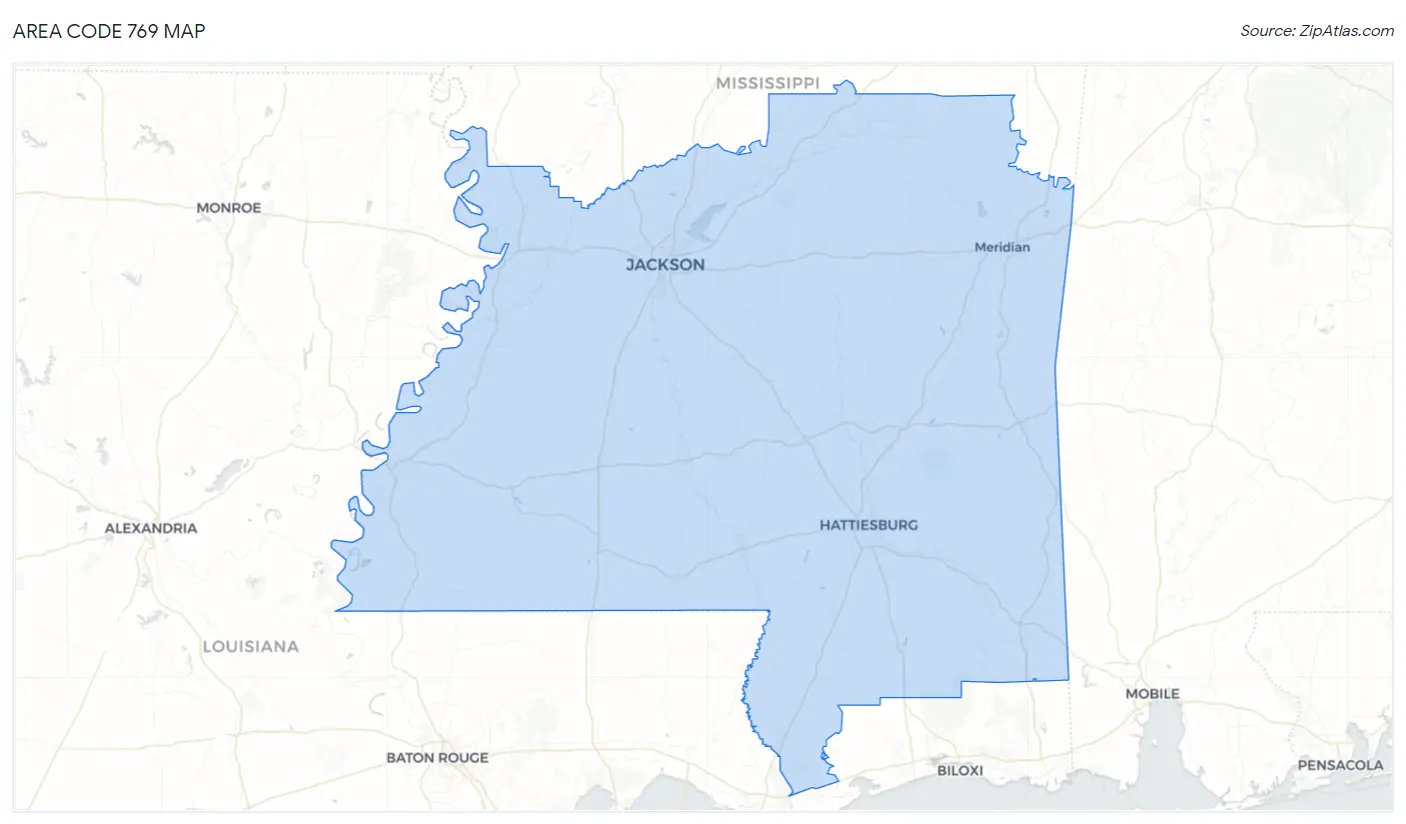
Area Code 769 Map
Area Code 769 Overview
$28,040
PER CAPITA INCOME
$67,326
AVG FAMILY INCOME
$52,284
AVG HOUSEHOLD INCOME
31.3%
WAGE / INCOME GAP [ % ]
68.7¢/ $1
WAGE / INCOME GAP [ $ ]
$11,356
FAMILY INCOME DEFICIT
21.40
INEQUALITY / GINI INDEX
582,094
TOTAL POPULATION
281,090
MALE POPULATION
301,004
FEMALE POPULATION
93.38
MALES / 100 FEMALES
107.08
FEMALES / 100 MALES
40.5
MEDIAN AGE
3.2
AVG FAMILY SIZE
2.5
AVG HOUSEHOLD SIZE
251,773
LABOR FORCE [ PEOPLE ]
54.5%
PERCENT IN LABOR FORCE
6.2%
UNEMPLOYMENT RATE
Income in Area Code 769
Income Overview in Area Code 769
Per Capita Income in Area Code 769 is $28,040, while median incomes of families and households are $67,326 and $52,284 respectively.
| Characteristic | Number | Measure |
| Per Capita Income | 582,094 | $28,040 |
| Median Family Income | 146,316 | $67,326 |
| Mean Family Income | 146,316 | $3,878,053 |
| Median Household Income | 220,741 | $52,284 |
| Mean Household Income | 220,741 | $3,304,301 |
| Income Deficit | 146,316 | $11,356 |
| Wage / Income Gap (%) | 582,094 | 31.34% |
| Wage / Income Gap ($) | 582,094 | 68.66¢ per $1 |
| Gini / Inequality Index | 582,094 | 21.40 |
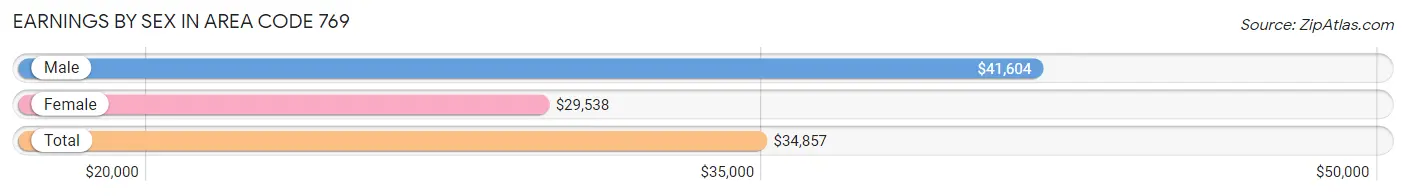
Earnings by Sex in Area Code 769
Average Earnings in Area Code 769 are $34,857, $41,604 for men and $29,538 for women, a difference of 29.0%.
| Sex | Number | Average Earnings |
| Male | 141,833 (50.5%) | $41,604 |
| Female | 138,990 (49.5%) | $29,538 |
| Total | 280,823 (100.0%) | $34,857 |
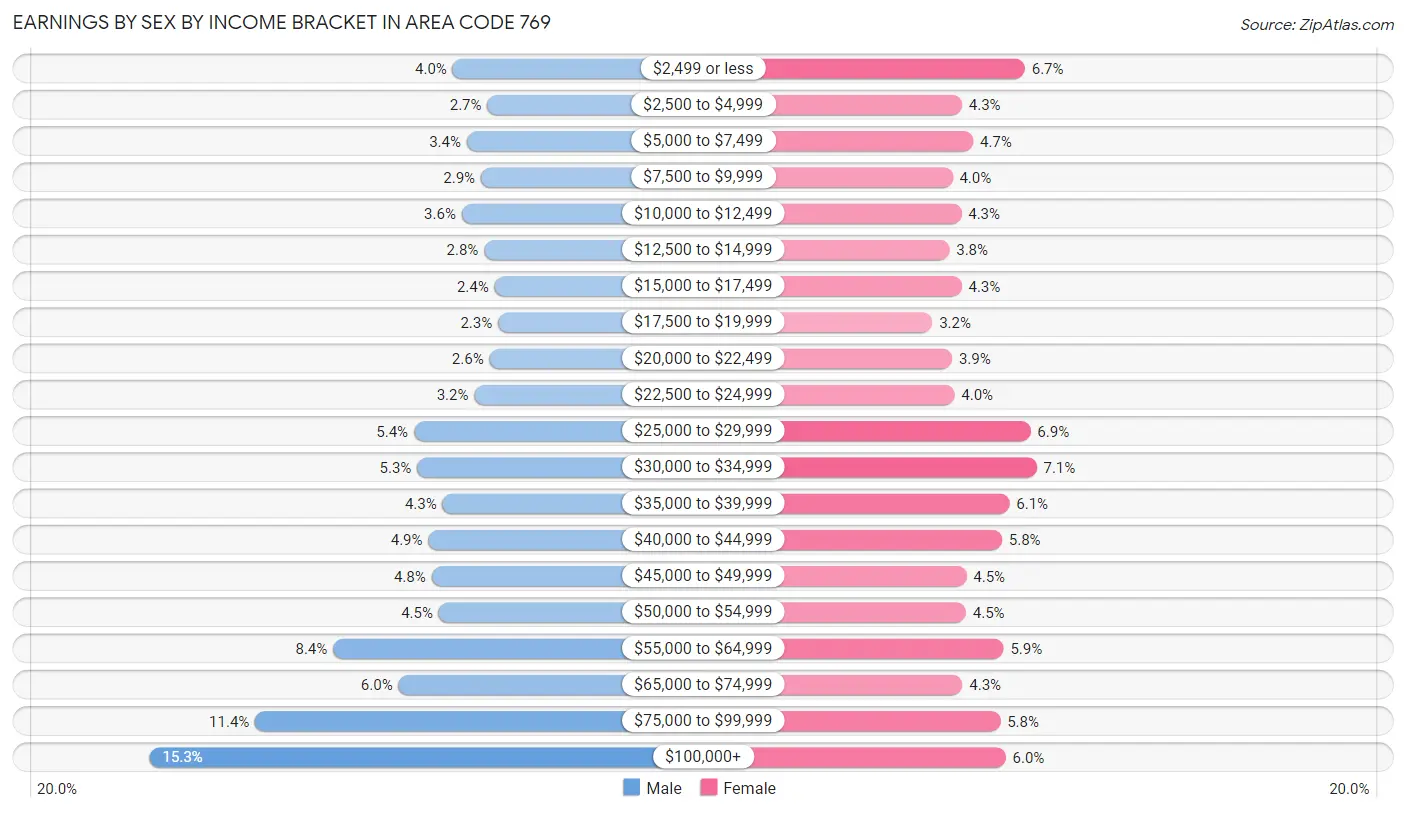
Earnings by Sex by Income Bracket in Area Code 769
The most common earnings brackets in Area Code 769 are $100,000+ for men (21,726 | 15.3%) and $30,000 to $34,999 for women (9,880 | 7.1%).
| Income | Male | Female |
| $2,499 or less | 5,618 (4.0%) | 9,270 (6.7%) |
| $2,500 to $4,999 | 3,778 (2.7%) | 5,991 (4.3%) |
| $5,000 to $7,499 | 4,865 (3.4%) | 6,578 (4.7%) |
| $7,500 to $9,999 | 4,118 (2.9%) | 5,505 (4.0%) |
| $10,000 to $12,499 | 5,132 (3.6%) | 5,965 (4.3%) |
| $12,500 to $14,999 | 3,946 (2.8%) | 5,335 (3.8%) |
| $15,000 to $17,499 | 3,395 (2.4%) | 5,972 (4.3%) |
| $17,500 to $19,999 | 3,204 (2.3%) | 4,446 (3.2%) |
| $20,000 to $22,499 | 3,666 (2.6%) | 5,471 (3.9%) |
| $22,500 to $24,999 | 4,474 (3.2%) | 5,607 (4.0%) |
| $25,000 to $29,999 | 7,671 (5.4%) | 9,558 (6.9%) |
| $30,000 to $34,999 | 7,496 (5.3%) | 9,880 (7.1%) |
| $35,000 to $39,999 | 6,159 (4.3%) | 8,458 (6.1%) |
| $40,000 to $44,999 | 6,914 (4.9%) | 8,070 (5.8%) |
| $45,000 to $49,999 | 6,734 (4.8%) | 6,233 (4.5%) |
| $50,000 to $54,999 | 6,358 (4.5%) | 6,203 (4.5%) |
| $55,000 to $64,999 | 11,972 (8.4%) | 8,162 (5.9%) |
| $65,000 to $74,999 | 8,499 (6.0%) | 6,024 (4.3%) |
| $75,000 to $99,999 | 16,108 (11.4%) | 7,991 (5.8%) |
| $100,000+ | 21,726 (15.3%) | 8,271 (5.9%) |
| Total | 141,833 (100.0%) | 138,990 (100.0%) |
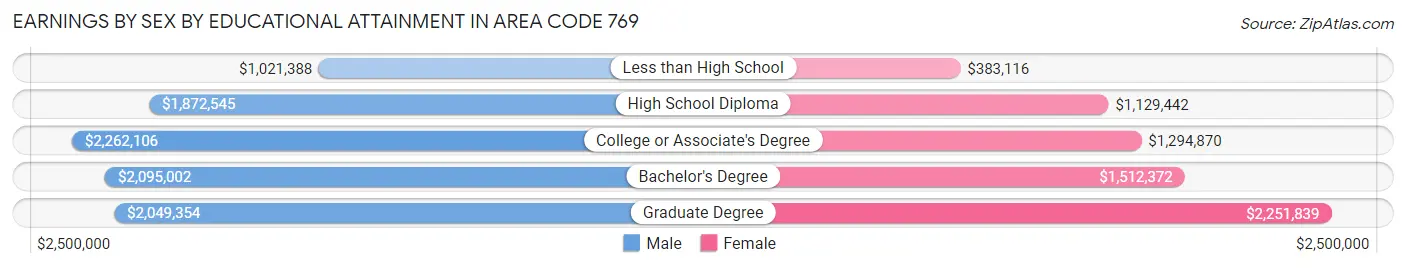
Earnings by Sex by Educational Attainment in Area Code 769
Average earnings in Area Code 769 are $2,026,793 for men and $1,532,337 for women, a difference of 24.4%. Men with an educational attainment of college or associate's degree enjoy the highest average annual earnings of $2,262,106, while those with less than high school education earn the least with $1,021,388. Women with an educational attainment of graduate degree earn the most with the average annual earnings of $2,251,839, while those with less than high school education have the smallest earnings of $383,116.
| Educational Attainment | Male Income | Female Income |
| Less than High School | $1,021,388 | $383,116 |
| High School Diploma | $1,872,545 | $1,129,442 |
| College or Associate's Degree | $2,262,106 | $1,294,870 |
| Bachelor's Degree | $2,095,002 | $1,512,372 |
| Graduate Degree | $2,049,354 | $2,251,839 |
| Total | $2,026,793 | $1,532,337 |
Family Income in Area Code 769
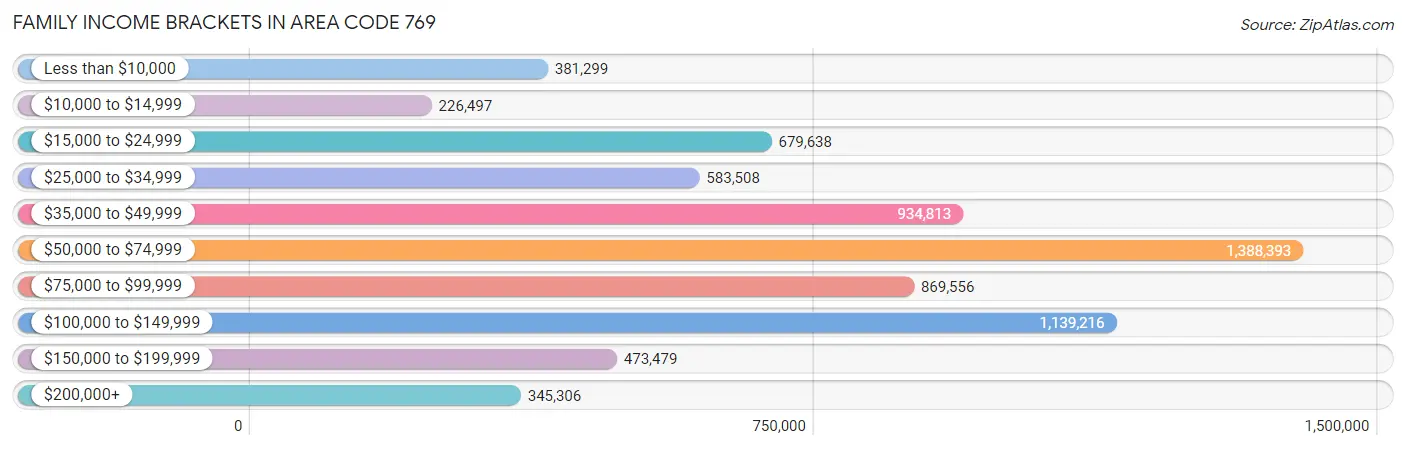
Family Income Brackets in Area Code 769
According to the Area Code 769 family income data, there are 1,388,393 families falling into the $50,000 to $74,999 income range, which is the most common income bracket and makes up 948.9% of all families. Conversely, the $10,000 to $14,999 income bracket is the least frequent group with only 226,497 families (154.8%) belonging to this category.
| Income Bracket | # Families | % Families |
| Less than $10,000 | 381,299 | 260.6% |
| $10,000 to $14,999 | 226,497 | 154.8% |
| $15,000 to $24,999 | 679,638 | 464.5% |
| $25,000 to $34,999 | 583,508 | 398.8% |
| $35,000 to $49,999 | 934,813 | 638.9% |
| $50,000 to $74,999 | 1,388,393 | 948.9% |
| $75,000 to $99,999 | 869,556 | 594.3% |
| $100,000 to $149,999 | 1,139,216 | 778.6% |
| $150,000 to $199,999 | 473,479 | 323.6% |
| $200,000+ | 345,306 | 236.0% |
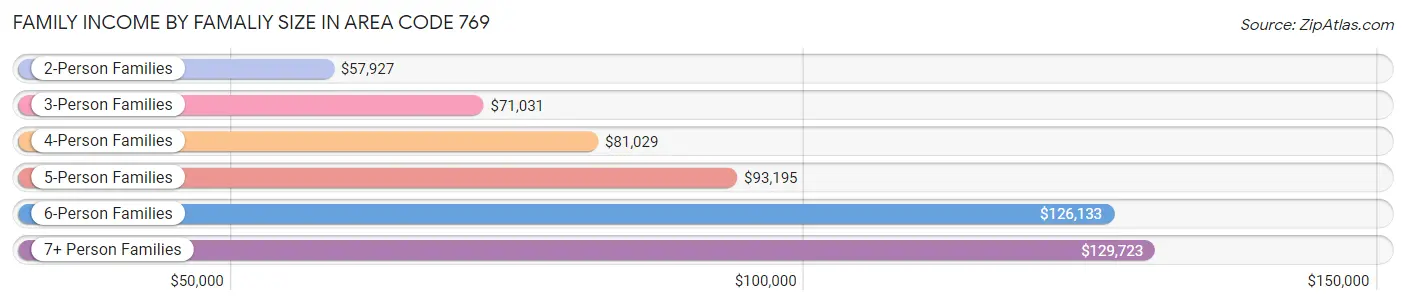
Family Income by Famaliy Size in Area Code 769
7+ person families (1,479 | 1.0%) account for the highest median family income in Area Code 769 with $129,723 per family, while 2-person families (71,044 | 48.6%) have the highest median income of $28,963 per family member.
| Income Bracket | # Families | Median Income |
| 2-Person Families | 71,044 (48.6%) | $57,927 |
| 3-Person Families | 31,763 (21.7%) | $71,031 |
| 4-Person Families | 26,499 (18.1%) | $81,029 |
| 5-Person Families | 11,492 (7.9%) | $93,195 |
| 6-Person Families | 4,039 (2.8%) | $126,133 |
| 7+ Person Families | 1,479 (1.0%) | $129,723 |
| Total | 146,316 (100.0%) | $67,326 |
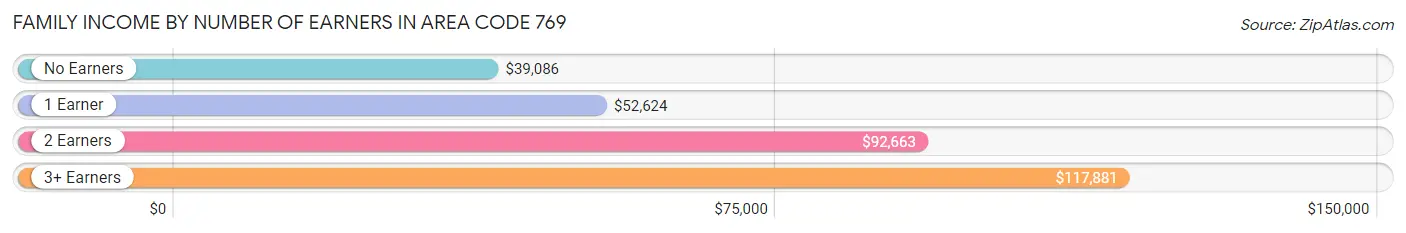
Family Income by Number of Earners in Area Code 769
The median family income in Area Code 769 is $67,326, with families comprising 3+ earners (12,813) having the highest median family income of $117,881, while families with no earners (25,742) have the lowest median family income of $39,086, accounting for 8.8% and 17.6% of families, respectively.
| Number of Earners | # Families | Median Income |
| No Earners | 25,742 (17.6%) | $39,086 |
| 1 Earner | 49,441 (33.8%) | $52,624 |
| 2 Earners | 58,320 (39.9%) | $92,663 |
| 3+ Earners | 12,813 (8.8%) | $117,881 |
| Total | 146,316 (100.0%) | $67,326 |
Household Income in Area Code 769
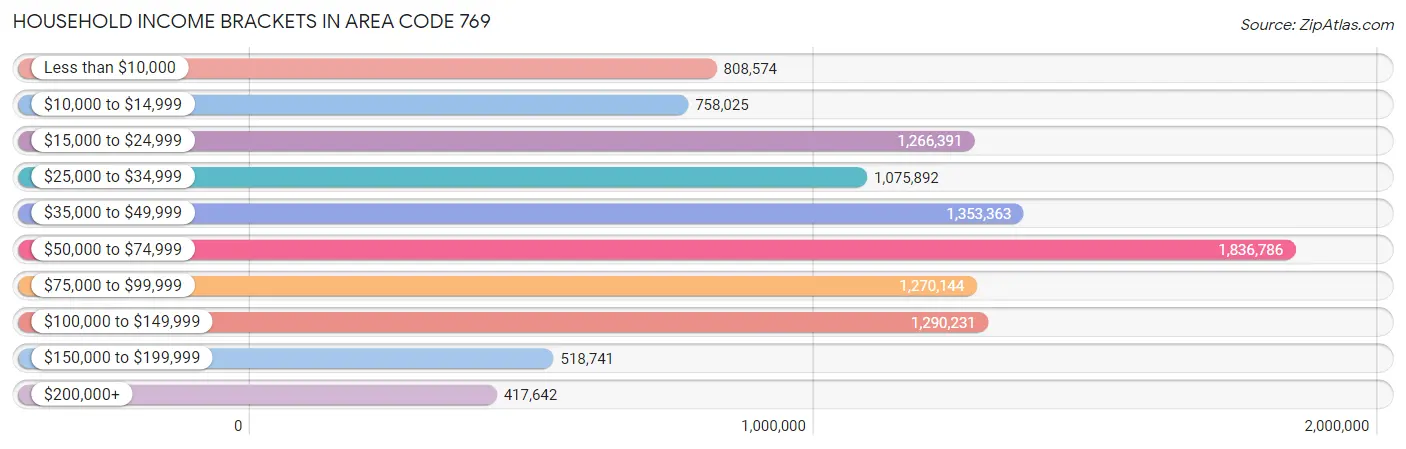
Household Income Brackets in Area Code 769
With 1,836,786 households falling in the category, the $50,000 to $74,999 income range is the most frequent in Area Code 769, accounting for 832.1% of all households. In contrast, only 417,642 households (189.2%) fall into the $200,000+ income bracket, making it the least populous group.
| Income Bracket | # Households | % Households |
| Less than $10,000 | 808,574 | 366.3% |
| $10,000 to $14,999 | 758,025 | 343.4% |
| $15,000 to $24,999 | 1,266,391 | 573.7% |
| $25,000 to $34,999 | 1,075,892 | 487.4% |
| $35,000 to $49,999 | 1,353,363 | 613.1% |
| $50,000 to $74,999 | 1,836,786 | 832.1% |
| $75,000 to $99,999 | 1,270,144 | 575.4% |
| $100,000 to $149,999 | 1,290,231 | 584.5% |
| $150,000 to $199,999 | 518,741 | 235.0% |
| $200,000+ | 417,642 | 189.2% |
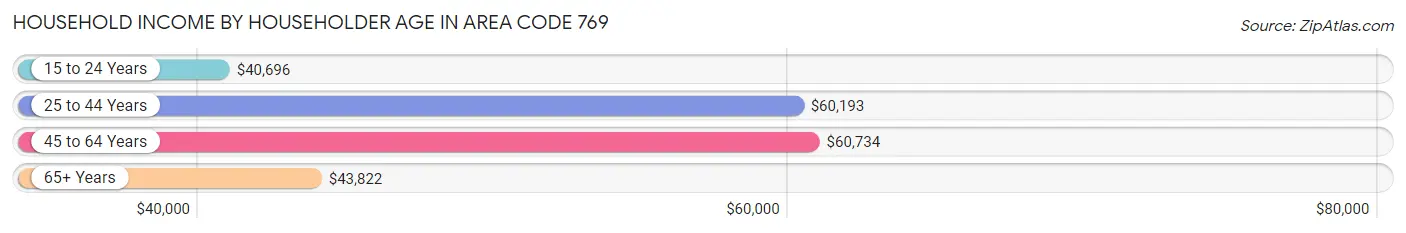
Household Income by Householder Age in Area Code 769
The median household income in Area Code 769 is $52,284, with the highest median household income of $60,734 found in the 45 to 64 years age bracket for the primary householder. A total of 83,569 households (37.9%) fall into this category. Meanwhile, the 15 to 24 years age bracket for the primary householder has the lowest median household income of $40,696, with 9,057 households (4.1%) in this group.
| Income Bracket | # Households | Median Income |
| 15 to 24 Years | 9,057 (4.1%) | $40,696 |
| 25 to 44 Years | 69,284 (31.4%) | $60,193 |
| 45 to 64 Years | 83,569 (37.9%) | $60,734 |
| 65+ Years | 58,831 (26.7%) | $43,822 |
| Total | 220,741 (100.0%) | $52,284 |
Poverty in Area Code 769
Income Below Poverty by Sex and Age in Area Code 769
With 16.1% poverty level for males and 20.3% for females among the residents of Area Code 769, under 5 year old males and 18 to 24 year old females are the most vulnerable to poverty, with 5,699 males (31.8%) and 8,779 females (32.5%) in their respective age groups living below the poverty level.
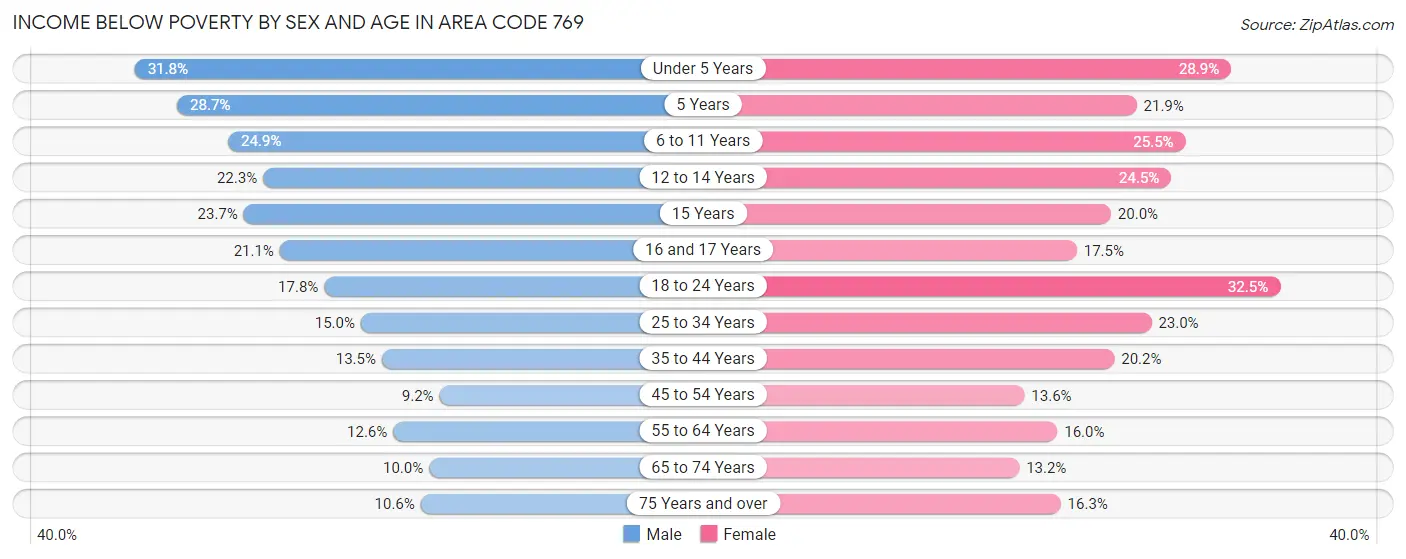
| Age Bracket | Male | Female |
| Under 5 Years | 5,699 (31.8%) | 4,947 (28.9%) |
| 5 Years | 933 (28.7%) | 749 (21.9%) |
| 6 to 11 Years | 5,421 (24.9%) | 5,764 (25.5%) |
| 12 to 14 Years | 2,921 (22.3%) | 3,000 (24.4%) |
| 15 Years | 766 (23.7%) | 761 (20.0%) |
| 16 and 17 Years | 1,759 (21.1%) | 1,299 (17.4%) |
| 18 to 24 Years | 4,388 (17.8%) | 8,779 (32.5%) |
| 25 to 34 Years | 5,026 (15.0%) | 8,514 (23.0%) |
| 35 to 44 Years | 4,744 (13.5%) | 7,596 (20.2%) |
| 45 to 54 Years | 3,067 (9.2%) | 4,963 (13.6%) |
| 55 to 64 Years | 4,413 (12.6%) | 6,320 (16.0%) |
| 65 to 74 Years | 2,540 (10.0%) | 3,882 (13.2%) |
| 75 Years and over | 1,573 (10.6%) | 3,662 (16.3%) |
| Total | 43,250 (16.1%) | 60,236 (20.3%) |
Income Above Poverty by Sex and Age in Area Code 769
According to the poverty statistics in Area Code 769, males aged 45 to 54 years and females aged 65 to 74 years are the age groups that are most secure financially, with 90.8% of males and 86.8% of females in these age groups living above the poverty line.
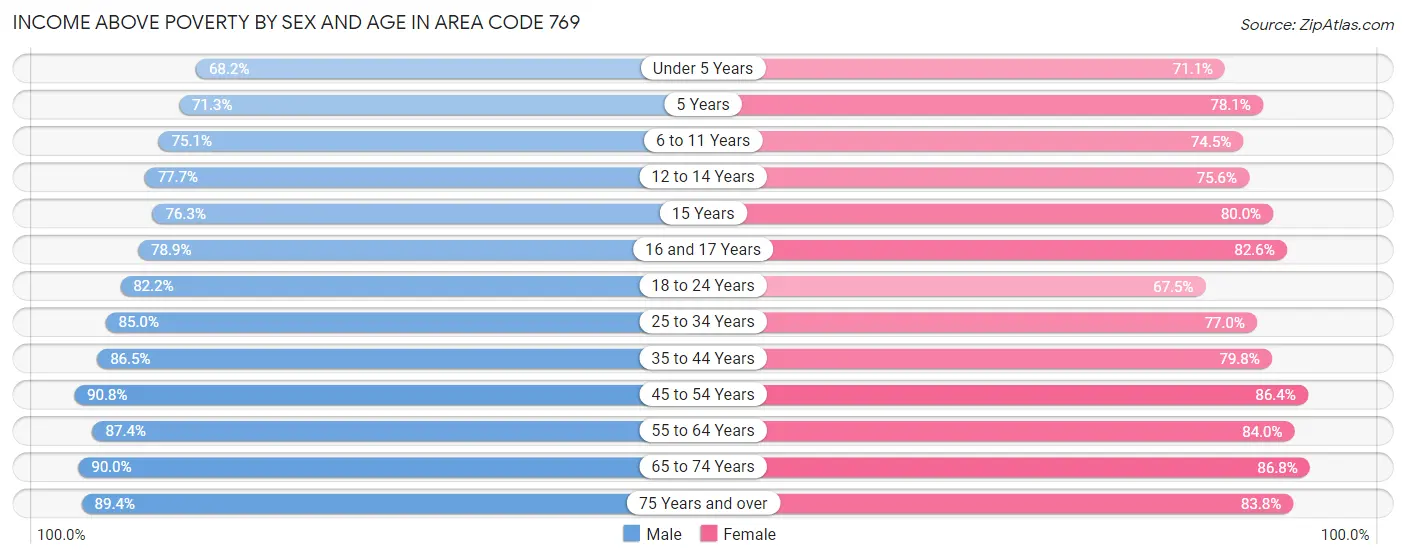
| Age Bracket | Male | Female |
| Under 5 Years | 12,210 (68.2%) | 12,170 (71.1%) |
| 5 Years | 2,321 (71.3%) | 2,673 (78.1%) |
| 6 to 11 Years | 16,359 (75.1%) | 16,830 (74.5%) |
| 12 to 14 Years | 10,175 (77.7%) | 9,272 (75.5%) |
| 15 Years | 2,460 (76.3%) | 3,048 (80.0%) |
| 16 and 17 Years | 6,594 (78.9%) | 6,143 (82.6%) |
| 18 to 24 Years | 20,318 (82.2%) | 18,205 (67.5%) |
| 25 to 34 Years | 28,381 (85.0%) | 28,518 (77.0%) |
| 35 to 44 Years | 30,451 (86.5%) | 29,946 (79.8%) |
| 45 to 54 Years | 30,262 (90.8%) | 31,642 (86.4%) |
| 55 to 64 Years | 30,506 (87.4%) | 33,176 (84.0%) |
| 65 to 74 Years | 22,942 (90.0%) | 25,596 (86.8%) |
| 75 Years and over | 13,263 (89.4%) | 18,880 (83.8%) |
| Total | 226,242 (84.0%) | 236,099 (79.7%) |
Income Below Poverty Among Married-Couple Families in Area Code 769
The poverty statistics for married-couple families in Area Code 769 show that 5.7% or 5,881 of the total 103,631 families live below the poverty line. Families with 5 or more children have the highest poverty rate of 27.6%, comprising of 118 families. On the other hand, families with no children have the lowest poverty rate of 4.6%, which includes 2,784 families.
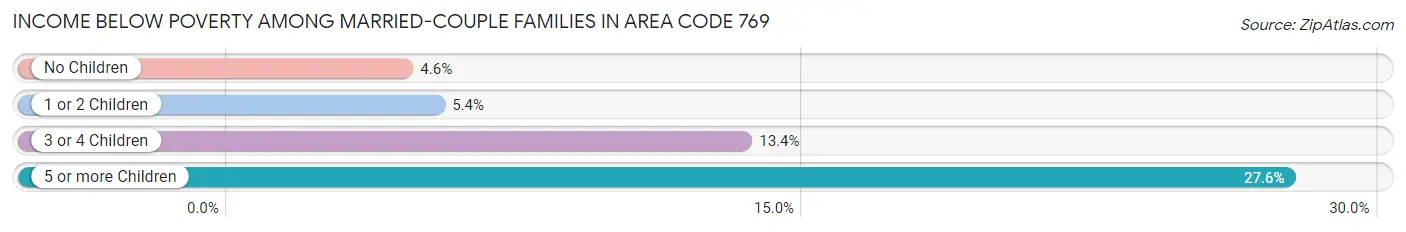
| Children | Above Poverty | Below Poverty |
| No Children | 58,038 (95.4%) | 2,784 (4.6%) |
| 1 or 2 Children | 31,987 (94.6%) | 1,829 (5.4%) |
| 3 or 4 Children | 7,416 (86.6%) | 1,150 (13.4%) |
| 5 or more Children | 309 (72.4%) | 118 (27.6%) |
| Total | 97,750 (94.3%) | 5,881 (5.7%) |
Income Below Poverty Among Single-Parent Households in Area Code 769
According to the poverty data in Area Code 769, 17.0% or 1,426 single-father households and 36.0% or 12,347 single-mother households are living below the poverty line. Among single-father households, those with 5 or more children have the highest poverty rate, with 72 households (72.7%) experiencing poverty. Likewise, among single-mother households, those with 5 or more children have the highest poverty rate, with 277 households (100.0%) falling below the poverty line.
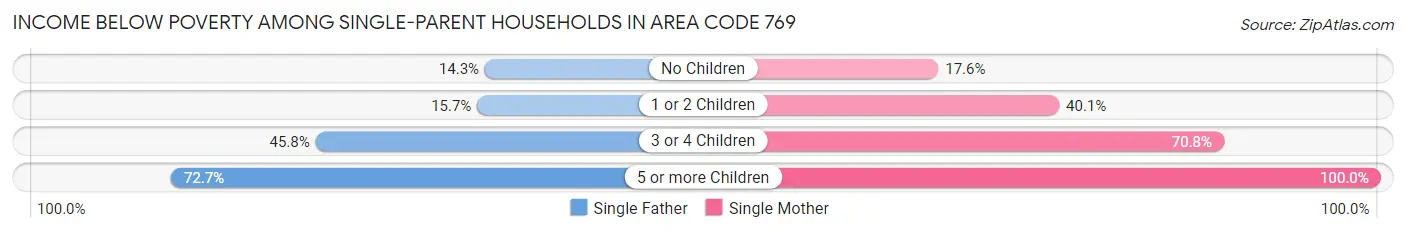
| Children | Single Father | Single Mother |
| No Children | 573 (14.2%) | 2,276 (17.6%) |
| 1 or 2 Children | 617 (15.7%) | 6,733 (40.1%) |
| 3 or 4 Children | 164 (45.8%) | 3,061 (70.8%) |
| 5 or more Children | 72 (72.7%) | 277 (100.0%) |
| Total | 1,426 (17.0%) | 12,347 (36.0%) |
Income Below Poverty Among Married-Couple vs Single-Parent Households in Area Code 769
The poverty data for Area Code 769 shows that 5,881 of the married-couple family households (5.7%) and 13,773 of the single-parent households (32.3%) are living below the poverty level. Within the married-couple family households, those with 5 or more children have the highest poverty rate, with 118 households (27.6%) falling below the poverty line. Among the single-parent households, those with 5 or more children have the highest poverty rate, with 349 household (92.8%) living below poverty.
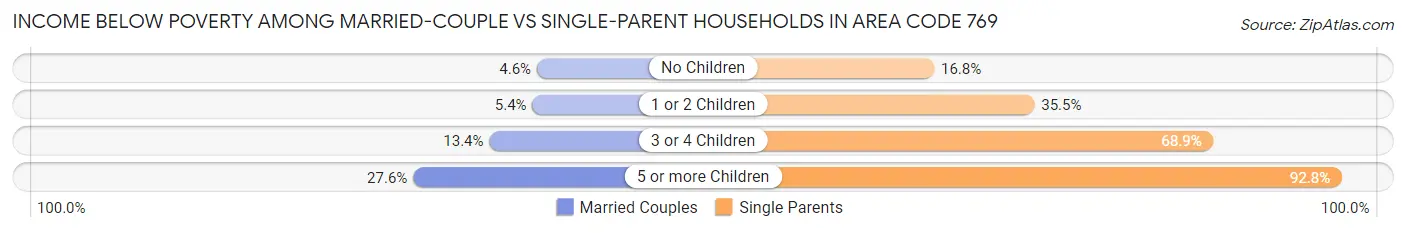
| Children | Married-Couple Families | Single-Parent Households |
| No Children | 2,784 (4.6%) | 2,849 (16.8%) |
| 1 or 2 Children | 1,829 (5.4%) | 7,350 (35.5%) |
| 3 or 4 Children | 1,150 (13.4%) | 3,225 (68.9%) |
| 5 or more Children | 118 (27.6%) | 349 (92.8%) |
| Total | 5,881 (5.7%) | 13,773 (32.3%) |
Race in Area Code 769
The most populous races in Area Code 769 are White / Caucasian (349,546 | 60.1%), Black / African American (199,056 | 34.2%), and Hispanic or Latino (16,276 | 2.8%).
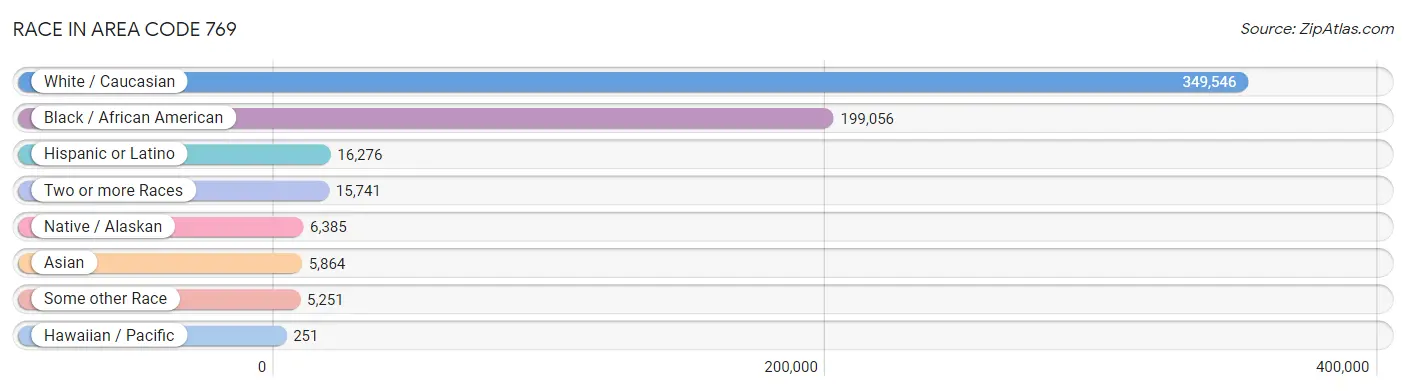
| Race | # Population | % Population |
| Asian | 5,864 | 1.0% |
| Black / African American | 199,056 | 34.2% |
| Hawaiian / Pacific | 251 | 0.0% |
| Hispanic or Latino | 16,276 | 2.8% |
| Native / Alaskan | 6,385 | 1.1% |
| White / Caucasian | 349,546 | 60.1% |
| Two or more Races | 15,741 | 2.7% |
| Some other Race | 5,251 | 0.9% |
| Total | 582,094 | 100.0% |
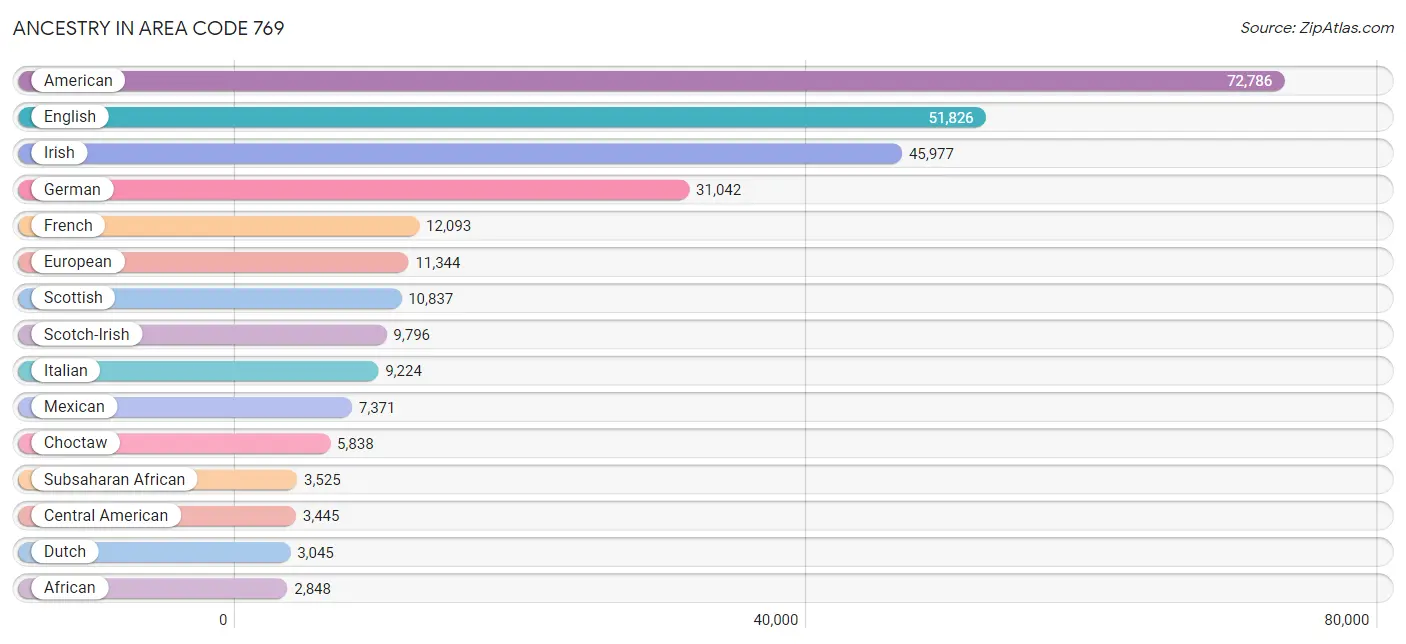
Ancestry in Area Code 769
The most populous ancestries reported in Area Code 769 are American (72,786 | 12.5%), English (51,826 | 8.9%), Irish (45,977 | 7.9%), German (31,042 | 5.3%), and French (12,093 | 2.1%), together accounting for 36.7% of all Area Code 769 residents.
| Ancestry | # Population | % Population |
| African | 2,848 | 0.5% |
| Albanian | 20 | 0.0% |
| American | 72,786 | 12.5% |
| Apache | 73 | 0.0% |
| Arab | 2,042 | 0.4% |
| Arapaho | 7 | 0.0% |
| Argentinean | 97 | 0.0% |
| Armenian | 102 | 0.0% |
| Australian | 39 | 0.0% |
| Austrian | 200 | 0.0% |
| Basque | 93 | 0.0% |
| Belgian | 101 | 0.0% |
| Bhutanese | 461 | 0.1% |
| Blackfeet | 144 | 0.0% |
| Bolivian | 14 | 0.0% |
| Brazilian | 135 | 0.0% |
| British | 2,707 | 0.5% |
| Bulgarian | 20 | 0.0% |
| Burmese | 653 | 0.1% |
| Cajun | 846 | 0.2% |
| Canadian | 149 | 0.0% |
| Carpatho Rusyn | 31 | 0.0% |
| Celtic | 37 | 0.0% |
| Central American | 3,445 | 0.6% |
| Central American Indian | 234 | 0.0% |
| Cherokee | 869 | 0.2% |
| Cheyenne | 152 | 0.0% |
| Chickasaw | 35 | 0.0% |
| Choctaw | 5,838 | 1.0% |
| Colombian | 385 | 0.1% |
| Comanche | 5 | 0.0% |
| Costa Rican | 125 | 0.0% |
| Creek | 17 | 0.0% |
| Croatian | 119 | 0.0% |
| Crow | 10 | 0.0% |
| Cuban | 795 | 0.1% |
| Cypriot | 46 | 0.0% |
| Czech | 239 | 0.0% |
| Czechoslovakian | 53 | 0.0% |
| Danish | 298 | 0.1% |
| Dominican | 184 | 0.0% |
| Dutch | 3,045 | 0.5% |
| Dutch West Indian | 80 | 0.0% |
| Eastern European | 197 | 0.0% |
| Ecuadorian | 62 | 0.0% |
| Egyptian | 43 | 0.0% |
| English | 51,826 | 8.9% |
| Ethiopian | 66 | 0.0% |
| European | 11,344 | 1.9% |
| Fijian | 155 | 0.0% |
| Filipino | 10 | 0.0% |
| Finnish | 96 | 0.0% |
| French | 12,093 | 2.1% |
| French American Indian | 23 | 0.0% |
| French Canadian | 941 | 0.2% |
| German | 31,042 | 5.3% |
| Ghanaian | 49 | 0.0% |
| Greek | 1,140 | 0.2% |
| Guatemalan | 2,073 | 0.4% |
| Haitian | 207 | 0.0% |
| Honduran | 741 | 0.1% |
| Houma | 78 | 0.0% |
| Hungarian | 366 | 0.1% |
| Icelander | 60 | 0.0% |
| Indian (Asian) | 1,674 | 0.3% |
| Iranian | 262 | 0.1% |
| Irish | 45,977 | 7.9% |
| Iroquois | 13 | 0.0% |
| Israeli | 7 | 0.0% |
| Italian | 9,224 | 1.6% |
| Jamaican | 146 | 0.0% |
| Japanese | 54 | 0.0% |
| Jordanian | 26 | 0.0% |
| Kiowa | 1 | 0.0% |
| Korean | 1,137 | 0.2% |
| Laotian | 73 | 0.0% |
| Lebanese | 853 | 0.2% |
| Lithuanian | 70 | 0.0% |
| Malaysian | 25 | 0.0% |
| Maltese | 18 | 0.0% |
| Mexican | 7,371 | 1.3% |
| Mexican American Indian | 257 | 0.0% |
| Mongolian | 42 | 0.0% |
| Moroccan | 7 | 0.0% |
| Native Hawaiian | 294 | 0.1% |
| Navajo | 59 | 0.0% |
| New Zealander | 6 | 0.0% |
| Nicaraguan | 208 | 0.0% |
| Nigerian | 462 | 0.1% |
| Northern European | 863 | 0.2% |
| Norwegian | 1,643 | 0.3% |
| Osage | 9 | 0.0% |
| Pakistani | 114 | 0.0% |
| Palestinian | 122 | 0.0% |
| Panamanian | 160 | 0.0% |
| Paraguayan | 61 | 0.0% |
| Pennsylvania German | 138 | 0.0% |
| Peruvian | 282 | 0.1% |
| Pima | 94 | 0.0% |
| Polish | 2,187 | 0.4% |
| Portuguese | 123 | 0.0% |
| Pueblo | 3 | 0.0% |
| Puerto Rican | 1,477 | 0.3% |
| Romanian | 33 | 0.0% |
| Russian | 481 | 0.1% |
| Salvadoran | 135 | 0.0% |
| Samoan | 16 | 0.0% |
| Scandinavian | 571 | 0.1% |
| Scotch-Irish | 9,796 | 1.7% |
| Scottish | 10,837 | 1.9% |
| Seminole | 111 | 0.0% |
| Serbian | 20 | 0.0% |
| Shoshone | 18 | 0.0% |
| Sierra Leonean | 13 | 0.0% |
| Sioux | 25 | 0.0% |
| Slavic | 94 | 0.0% |
| Slovak | 68 | 0.0% |
| Slovene | 13 | 0.0% |
| South African | 45 | 0.0% |
| South American | 935 | 0.2% |
| South American Indian | 15 | 0.0% |
| Spaniard | 411 | 0.1% |
| Spanish | 720 | 0.1% |
| Spanish American | 29 | 0.0% |
| Spanish American Indian | 2 | 0.0% |
| Sri Lankan | 1,575 | 0.3% |
| Subsaharan African | 3,525 | 0.6% |
| Sudanese | 3 | 0.0% |
| Swedish | 1,704 | 0.3% |
| Swiss | 232 | 0.0% |
| Syrian | 16 | 0.0% |
| Thai | 1,926 | 0.3% |
| Tlingit-Haida | 3 | 0.0% |
| Ukrainian | 170 | 0.0% |
| Venezuelan | 34 | 0.0% |
| Vietnamese | 12 | 0.0% |
| Welsh | 2,124 | 0.4% |
| West Indian | 49 | 0.0% |
| Yugoslavian | 187 | 0.0% | View All 139 Rows |
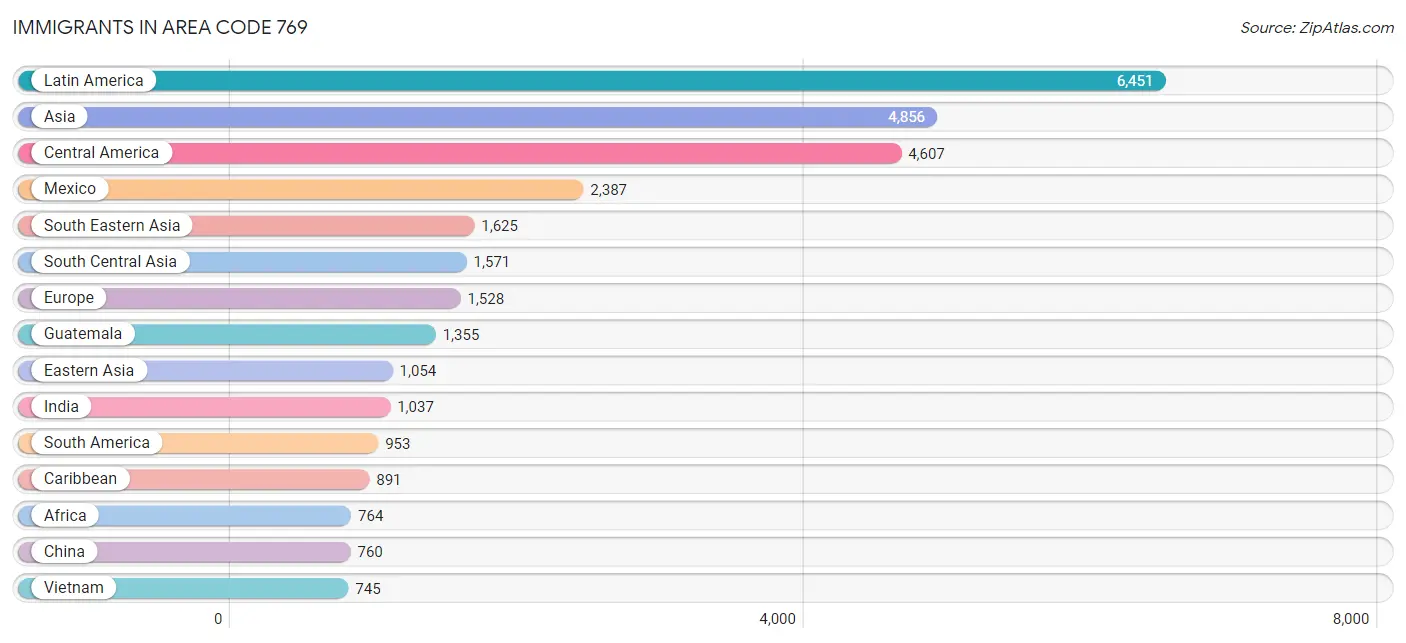
Immigrants in Area Code 769
The most numerous immigrant groups reported in Area Code 769 came from Latin America (6,451 | 1.1%), Asia (4,856 | 0.8%), Central America (4,607 | 0.8%), Mexico (2,387 | 0.4%), and South Eastern Asia (1,625 | 0.3%), together accounting for 3.4% of all Area Code 769 residents.
| Immigration Origin | # Population | % Population |
| Africa | 764 | 0.1% |
| Albania | 13 | 0.0% |
| Argentina | 9 | 0.0% |
| Asia | 4,856 | 0.8% |
| Australia | 39 | 0.0% |
| Austria | 29 | 0.0% |
| Bangladesh | 13 | 0.0% |
| Belarus | 10 | 0.0% |
| Belize | 11 | 0.0% |
| Bolivia | 14 | 0.0% |
| Brazil | 174 | 0.0% |
| Bulgaria | 20 | 0.0% |
| Cameroon | 44 | 0.0% |
| Canada | 302 | 0.1% |
| Caribbean | 891 | 0.2% |
| Central America | 4,607 | 0.8% |
| China | 760 | 0.1% |
| Colombia | 304 | 0.1% |
| Congo | 1 | 0.0% |
| Costa Rica | 21 | 0.0% |
| Cuba | 436 | 0.1% |
| Denmark | 8 | 0.0% |
| Dominican Republic | 204 | 0.0% |
| Eastern Africa | 182 | 0.0% |
| Eastern Asia | 1,054 | 0.2% |
| Eastern Europe | 242 | 0.0% |
| Ecuador | 16 | 0.0% |
| Egypt | 17 | 0.0% |
| El Salvador | 98 | 0.0% |
| England | 119 | 0.0% |
| Eritrea | 27 | 0.0% |
| Ethiopia | 72 | 0.0% |
| Europe | 1,528 | 0.3% |
| France | 25 | 0.0% |
| Germany | 434 | 0.1% |
| Ghana | 136 | 0.0% |
| Greece | 16 | 0.0% |
| Guatemala | 1,355 | 0.2% |
| Guyana | 69 | 0.0% |
| Haiti | 109 | 0.0% |
| Honduras | 528 | 0.1% |
| Hungary | 25 | 0.0% |
| India | 1,037 | 0.2% |
| Indonesia | 14 | 0.0% |
| Iran | 210 | 0.0% |
| Ireland | 89 | 0.0% |
| Israel | 13 | 0.0% |
| Italy | 42 | 0.0% |
| Jamaica | 139 | 0.0% |
| Japan | 171 | 0.0% |
| Jordan | 21 | 0.0% |
| Kazakhstan | 7 | 0.0% |
| Korea | 123 | 0.0% |
| Kuwait | 22 | 0.0% |
| Laos | 45 | 0.0% |
| Latin America | 6,451 | 1.1% |
| Liberia | 24 | 0.0% |
| Malaysia | 12 | 0.0% |
| Mexico | 2,387 | 0.4% |
| Middle Africa | 63 | 0.0% |
| Moldova | 12 | 0.0% |
| Nepal | 56 | 0.0% |
| Netherlands | 51 | 0.0% |
| Nicaragua | 168 | 0.0% |
| Nigeria | 137 | 0.0% |
| Northern Africa | 114 | 0.0% |
| Northern Europe | 644 | 0.1% |
| Oceania | 253 | 0.0% |
| Pakistan | 248 | 0.0% |
| Panama | 39 | 0.0% |
| Peru | 264 | 0.1% |
| Philippines | 595 | 0.1% |
| Poland | 47 | 0.0% |
| Portugal | 16 | 0.0% |
| Russia | 55 | 0.0% |
| Scotland | 90 | 0.0% |
| Serbia | 10 | 0.0% |
| Somalia | 26 | 0.0% |
| South Africa | 39 | 0.0% |
| South America | 953 | 0.2% |
| South Central Asia | 1,571 | 0.3% |
| South Eastern Asia | 1,625 | 0.3% |
| Southern Europe | 103 | 0.0% |
| Spain | 29 | 0.0% |
| Sudan | 75 | 0.0% |
| Syria | 183 | 0.0% |
| Taiwan | 10 | 0.0% |
| Thailand | 214 | 0.0% |
| Uganda | 7 | 0.0% |
| Ukraine | 50 | 0.0% |
| Venezuela | 42 | 0.0% |
| Vietnam | 745 | 0.1% |
| Western Africa | 345 | 0.1% |
| Western Asia | 521 | 0.1% |
| Western Europe | 539 | 0.1% |
| Yemen | 252 | 0.0% | View All 96 Rows |
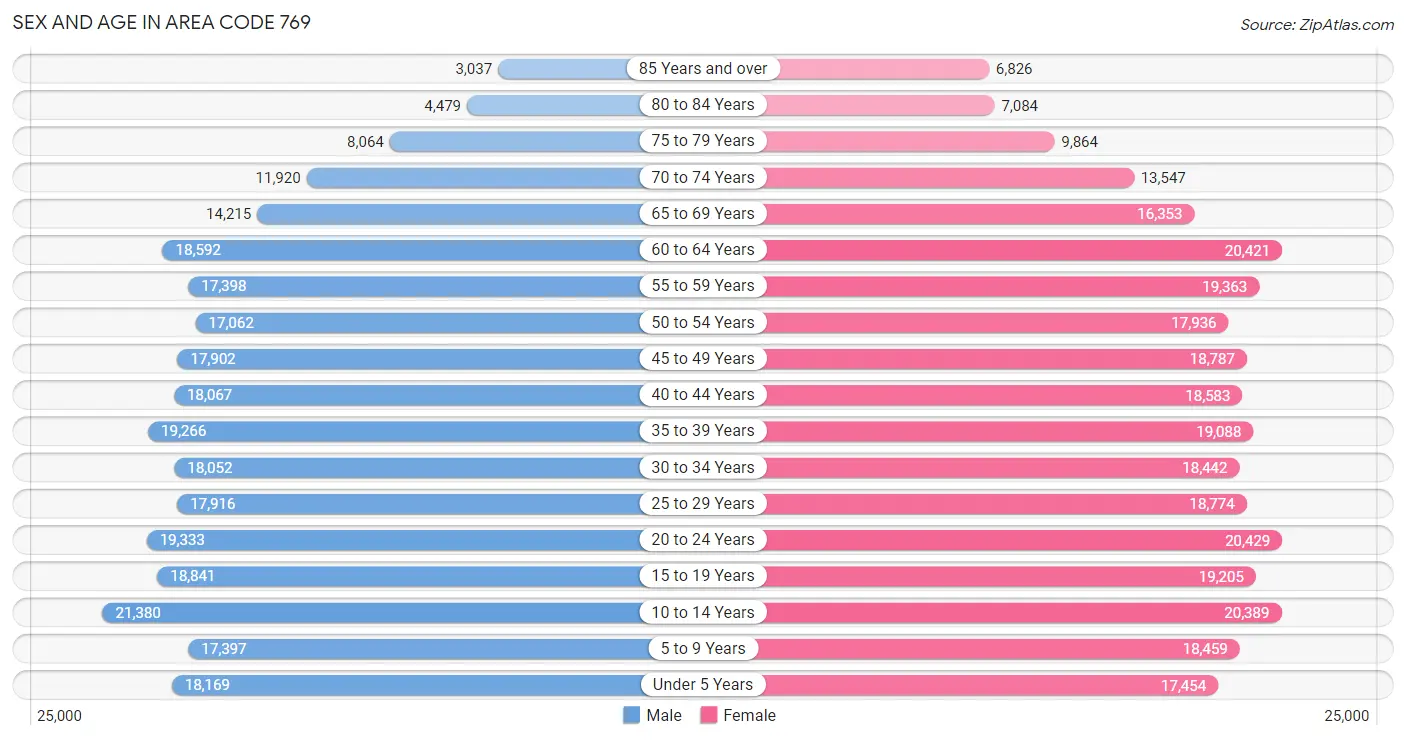
Sex and Age in Area Code 769
Sex and Age in Area Code 769
The most populous age groups in Area Code 769 are 10 to 14 Years (21,380 | 7.6%) for men and 20 to 24 Years (20,429 | 6.8%) for women.
| Age Bracket | Male | Female |
| Under 5 Years | 18,169 (6.5%) | 17,454 (5.8%) |
| 5 to 9 Years | 17,397 (6.2%) | 18,459 (6.1%) |
| 10 to 14 Years | 21,380 (7.6%) | 20,389 (6.8%) |
| 15 to 19 Years | 18,841 (6.7%) | 19,205 (6.4%) |
| 20 to 24 Years | 19,333 (6.9%) | 20,429 (6.8%) |
| 25 to 29 Years | 17,916 (6.4%) | 18,774 (6.2%) |
| 30 to 34 Years | 18,052 (6.4%) | 18,442 (6.1%) |
| 35 to 39 Years | 19,266 (6.9%) | 19,088 (6.3%) |
| 40 to 44 Years | 18,067 (6.4%) | 18,583 (6.2%) |
| 45 to 49 Years | 17,902 (6.4%) | 18,787 (6.2%) |
| 50 to 54 Years | 17,062 (6.1%) | 17,936 (6.0%) |
| 55 to 59 Years | 17,398 (6.2%) | 19,363 (6.4%) |
| 60 to 64 Years | 18,592 (6.6%) | 20,421 (6.8%) |
| 65 to 69 Years | 14,215 (5.1%) | 16,353 (5.4%) |
| 70 to 74 Years | 11,920 (4.2%) | 13,547 (4.5%) |
| 75 to 79 Years | 8,064 (2.9%) | 9,864 (3.3%) |
| 80 to 84 Years | 4,479 (1.6%) | 7,084 (2.4%) |
| 85 Years and over | 3,037 (1.1%) | 6,826 (2.3%) |
| Total | 281,090 (100.0%) | 301,004 (100.0%) |
Families and Households in Area Code 769
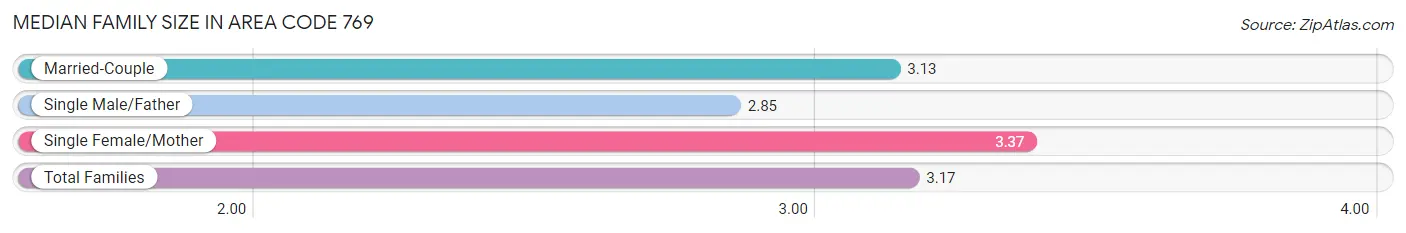
Median Family Size in Area Code 769
The median family size in Area Code 769 is 3.17 persons per family, with single female/mother families (34,279 | 23.4%) accounting for the largest median family size of 3.37479 persons per family. On the other hand, single male/father families (8,406 | 5.8%) represent the smallest median family size with 2.85 persons per family.
| Family Type | # Families | Family Size |
| Married-Couple | 103,631 (70.8%) | 3.13 |
| Single Male/Father | 8,406 (5.8%) | 2.85 |
| Single Female/Mother | 34,279 (23.4%) | 3.37 |
| Total Families | 146,316 (100.0%) | 3.17 |
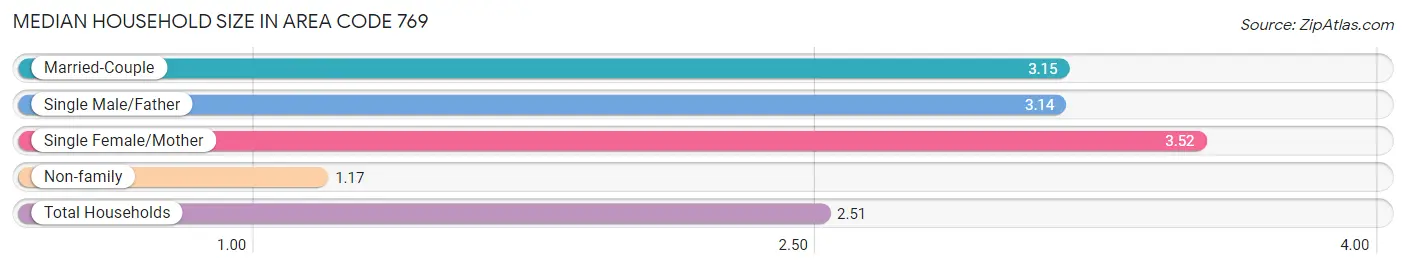
Median Household Size in Area Code 769
The median household size in Area Code 769 is 2.51 persons per household, with single female/mother households (34,279 | 15.5%) accounting for the largest median household size of 3.51708 persons per household. non-family households (74,425 | 33.7%) represent the smallest median household size with 1.17 persons per household.
| Household Type | # Households | Household Size |
| Married-Couple | 103,631 (46.9%) | 3.15 |
| Single Male/Father | 8,406 (3.8%) | 3.14 |
| Single Female/Mother | 34,279 (15.5%) | 3.52 |
| Non-family | 74,425 (33.7%) | 1.17 |
| Total Households | 220,741 (100.0%) | 2.51 |
Household Size by Marriage Status in Area Code 769
Out of a total of 220,741 households in Area Code 769, 146,316 (66.3%) are family households, while 74,425 (33.7%) are nonfamily households. The most numerous type of family households are 2-person households, comprising 68,032, and the most common type of nonfamily households are 1-person households, comprising 63,683.
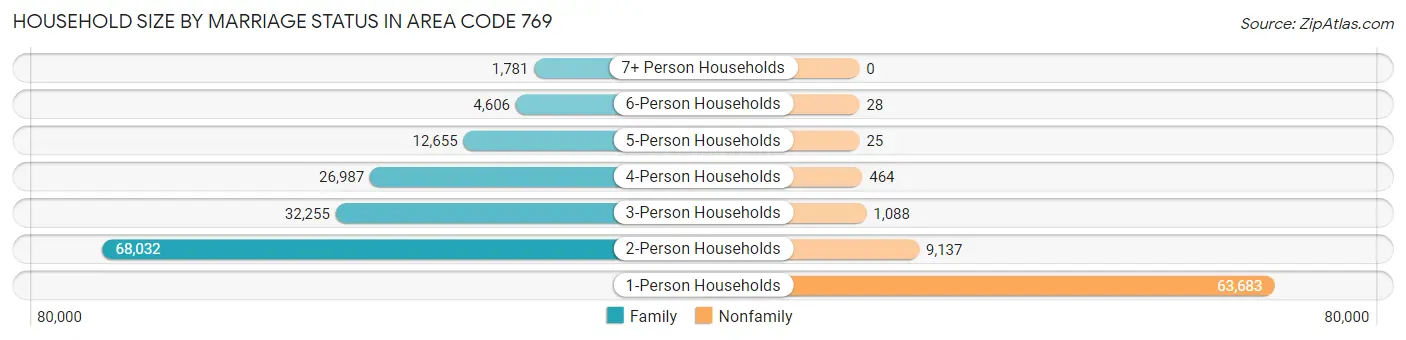
| Household Size | Family Households | Nonfamily Households |
| 1-Person Households | - | 63,683 (28.8%) |
| 2-Person Households | 68,032 (30.8%) | 9,137 (4.1%) |
| 3-Person Households | 32,255 (14.6%) | 1,088 (0.5%) |
| 4-Person Households | 26,987 (12.2%) | 464 (0.2%) |
| 5-Person Households | 12,655 (5.7%) | 25 (0.0%) |
| 6-Person Households | 4,606 (2.1%) | 28 (0.0%) |
| 7+ Person Households | 1,781 (0.8%) | 0 (0.0%) |
| Total | 146,316 (66.3%) | 74,425 (33.7%) |
Female Fertility in Area Code 769
Fertility by Age in Area Code 769
Average fertility rate in Area Code 769 is 67.5 births per 1,000 women. Women in the age bracket of 20 to 34 years have the highest fertility rate with 135.3 births per 1,000 women. Women in the age bracket of 20 to 34 years acount for 77.4% of all women with births.
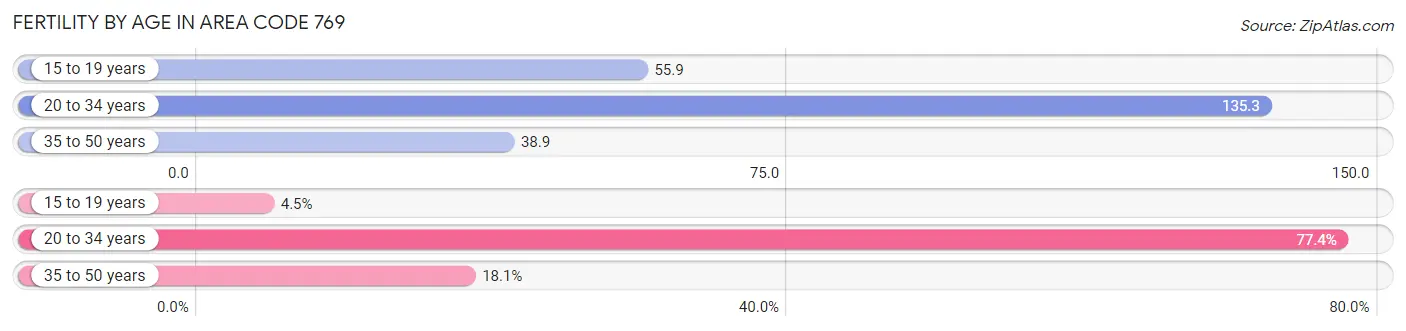
| Age Bracket | Women with Births | Births / 1,000 Women |
| 15 to 19 years | 373 (4.5%) | 55.9 |
| 20 to 34 years | 6,480 (77.4%) | 135.3 |
| 35 to 50 years | 1,518 (18.1%) | 38.9 |
| Total | 8,371 (100.0%) | 67.5 |
Fertility by Age by Marriage Status in Area Code 769
52.3% of women with births (8,371) in Area Code 769 are married. The highest percentage of unmarried women with births falls into 15 to 19 years age bracket with 100.0% of them unmarried at the time of birth, while the lowest percentage of unmarried women with births belong to 20 to 34 years age bracket with 53.9% of them unmarried.
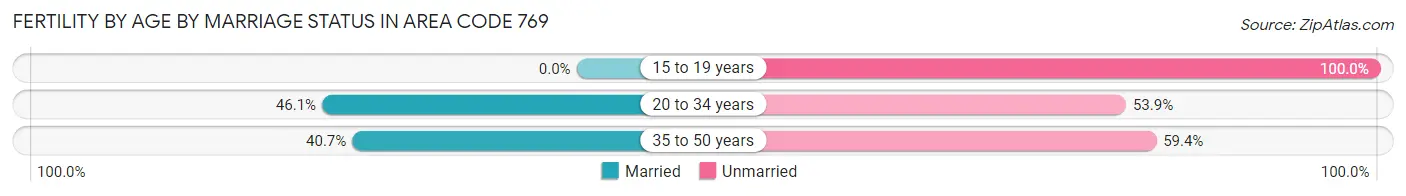
| Age Bracket | Married | Unmarried |
| 15 to 19 years | 0 (0.0%) | 373 (100.0%) |
| 20 to 34 years | 2,989 (46.1%) | 3,491 (53.9%) |
| 35 to 50 years | 617 (40.6%) | 901 (59.4%) |
| Total | 4,382 (52.3%) | 3,989 (47.6%) |
Fertility by Education in Area Code 769
Average fertility rate in Area Code 769 is 67.5 births per 1,000 women. Women with the education attainment of graduate degree have the highest fertility rate of 190.7 births per 1,000 women, while women with the education attainment of high school diploma have the lowest fertility at 79.5 births per 1,000 women. Women with the education attainment of college or associate's degree represent 37.9% of all women with births.
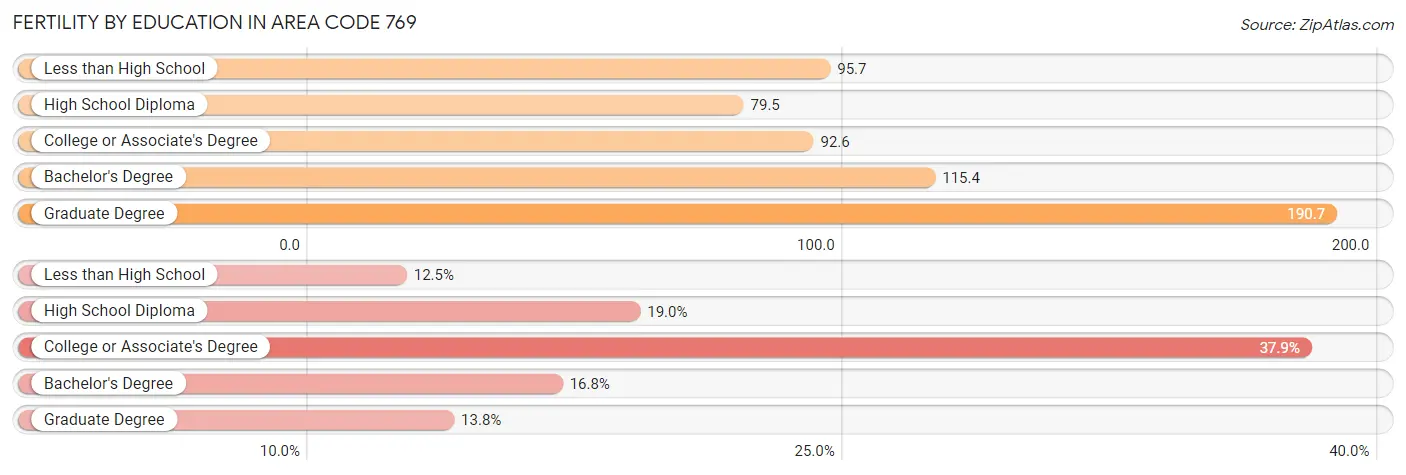
| Educational Attainment | Women with Births | Births / 1,000 Women |
| Less than High School | 1,043 (12.5%) | 95.7 |
| High School Diploma | 1,592 (19.0%) | 79.5 |
| College or Associate's Degree | 3,172 (37.9%) | 92.6 |
| Bachelor's Degree | 1,410 (16.8%) | 115.4 |
| Graduate Degree | 1,154 (13.8%) | 190.7 |
| Total | 8,371 (100.0%) | 67.5 |
Fertility by Education by Marriage Status in Area Code 769
47.6% of women with births in Area Code 769 are unmarried. Women with the educational attainment of college or associate's degree are most likely to be married with 42.4% of them married at childbirth, while women with the educational attainment of high school diploma are least likely to be married with 88.2% of them unmarried at childbirth.
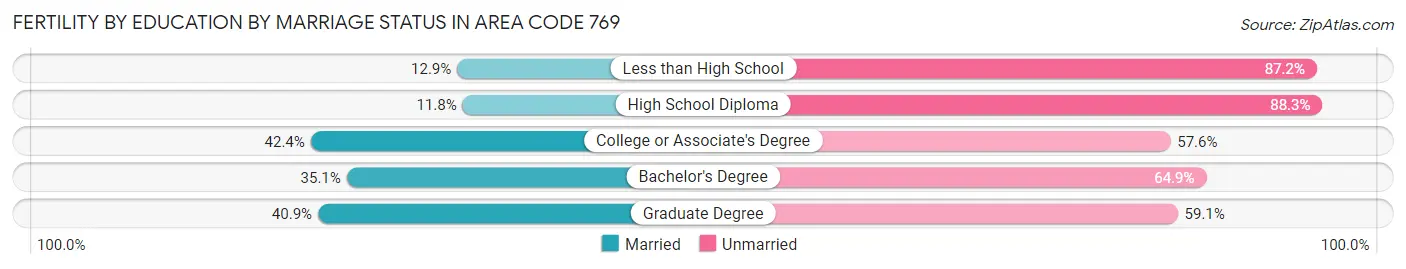
| Educational Attainment | Married | Unmarried |
| Less than High School | 134 (12.9%) | 909 (87.2%) |
| High School Diploma | 187 (11.7%) | 1,405 (88.2%) |
| College or Associate's Degree | 1,344 (42.4%) | 1,828 (57.6%) |
| Bachelor's Degree | 495 (35.1%) | 915 (64.9%) |
| Graduate Degree | 472 (40.9%) | 682 (59.1%) |
| Total | 4,382 (52.3%) | 3,989 (47.6%) |
Employment Characteristics in Area Code 769
Employment by Class of Employer in Area Code 769
Among the 251,110 employed individuals in Area Code 769, private company employees (163,900 | 65.3%), state government employees (21,858 | 8.7%), and local government employees (16,780 | 6.7%) make up the most common classes of employment.
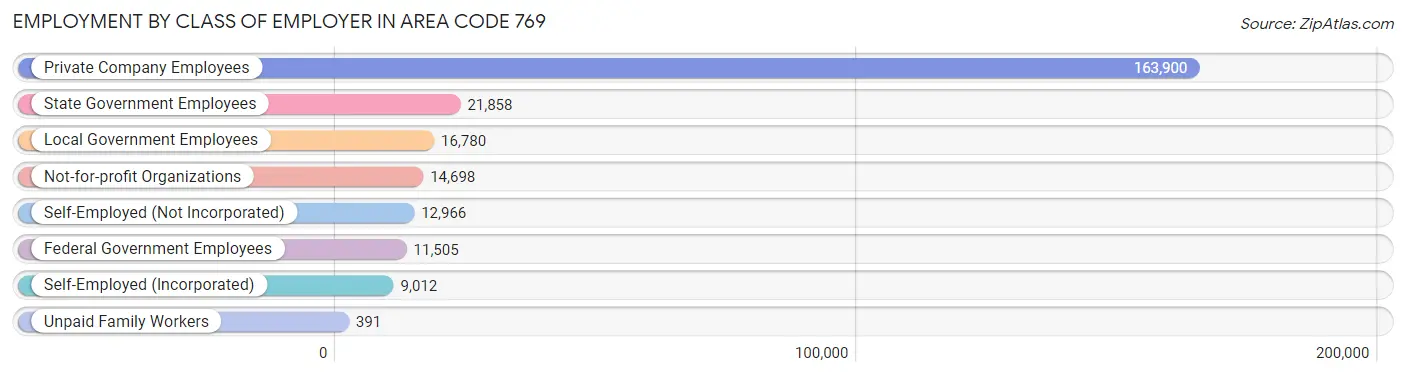
| Employer Class | # Employees | % Employees |
| Private Company Employees | 163,900 | 65.3% |
| Self-Employed (Incorporated) | 9,012 | 3.6% |
| Self-Employed (Not Incorporated) | 12,966 | 5.2% |
| Not-for-profit Organizations | 14,698 | 5.9% |
| Local Government Employees | 16,780 | 6.7% |
| State Government Employees | 21,858 | 8.7% |
| Federal Government Employees | 11,505 | 4.6% |
| Unpaid Family Workers | 391 | 0.2% |
| Total | 251,110 | 100.0% |
Employment Status by Age in Area Code 769
According to the labor force statistics for Area Code 769, out of the total population over 16 years of age (461,775), 54.5% or 251,760 individuals are in the labor force, with 6.2% or 15,534 of them unemployed. The age group with the highest labor force participation rate is 30 to 34 years, with 76.0% or 27,728 individuals in the labor force. Within the labor force, the 16 to 19 years age range has the highest percentage of unemployed individuals, with 872.3% or 96,703 of them being unemployed.
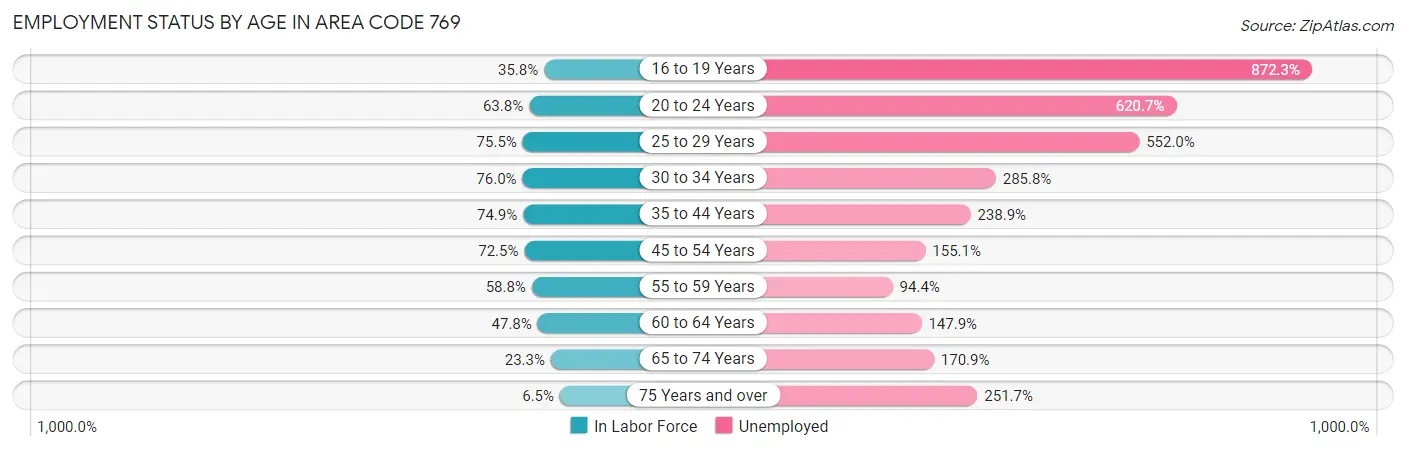
| Age Bracket | In Labor Force | Unemployed |
| 16 to 19 Years | 11,086 (35.8%) | 96,703 (872.3%) |
| 20 to 24 Years | 25,352 (63.8%) | 157,360 (620.7%) |
| 25 to 29 Years | 27,715 (75.5%) | 152,992 (552.0%) |
| 30 to 34 Years | 27,727 (76.0%) | 79,247 (285.8%) |
| 35 to 44 Years | 56,139 (74.9%) | 134,118 (238.9%) |
| 45 to 54 Years | 51,960 (72.5%) | 80,588 (155.1%) |
| 55 to 59 Years | 21,601 (58.8%) | 20,391 (94.4%) |
| 60 to 64 Years | 18,648 (47.8%) | 27,580 (147.9%) |
| 65 to 74 Years | 13,048 (23.3%) | 22,304 (170.9%) |
| 75 Years and over | 2,543 (6.5%) | 6,398 (251.7%) |
| Total | 251,773 (54.5%) | 15,527 (6.2%) |
Employment Status by Educational Attainment in Area Code 769
According to labor force statistics for Area Code 769, 68.6% of individuals (202,904) out of the total population between 25 and 64 years of age (295,649) are in the labor force, with 238.3% or 483,520 of them being unemployed. The group with the highest labor force participation rate are those with the educational attainment of bachelor's degree or higher, with 79.7% or 69,729 individuals in the labor force. Within the labor force, individuals with less than high school education have the highest percentage of unemployment, with 602.8% or 92,940 of them being unemployed.
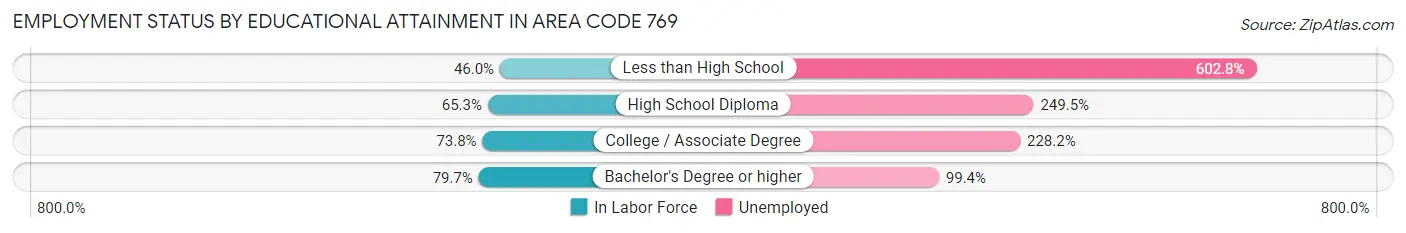
| Educational Attainment | In Labor Force | Unemployed |
| Less than High School | 15,419 (46.0%) | 202,004 (602.8%) |
| High School Diploma | 50,172 (65.3%) | 191,606 (249.5%) |
| College / Associate Degree | 72,252 (73.8%) | 223,401 (228.2%) |
| Bachelor's Degree or higher | 69,728 (79.7%) | 86,920 (99.4%) |
| Total | 202,914 (68.6%) | 704,532 (238.3%) |
Employment Occupations by Sex in Area Code 769
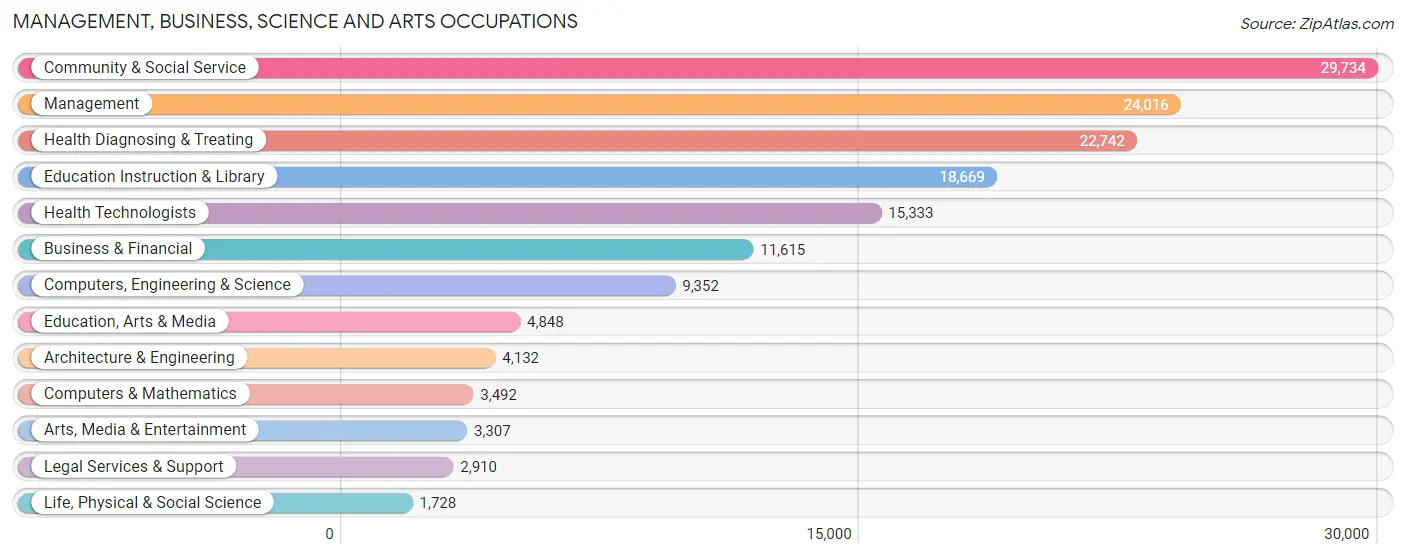
Management, Business, Science and Arts Occupations
The most common Management, Business, Science and Arts occupations in Area Code 769 are Community & Social Service (29,734 | 11.7%), Management (24,016 | 9.4%), Health Diagnosing & Treating (22,742 | 8.9%), Education Instruction & Library (18,669 | 7.3%), and Health Technologists (15,333 | 6.0%).
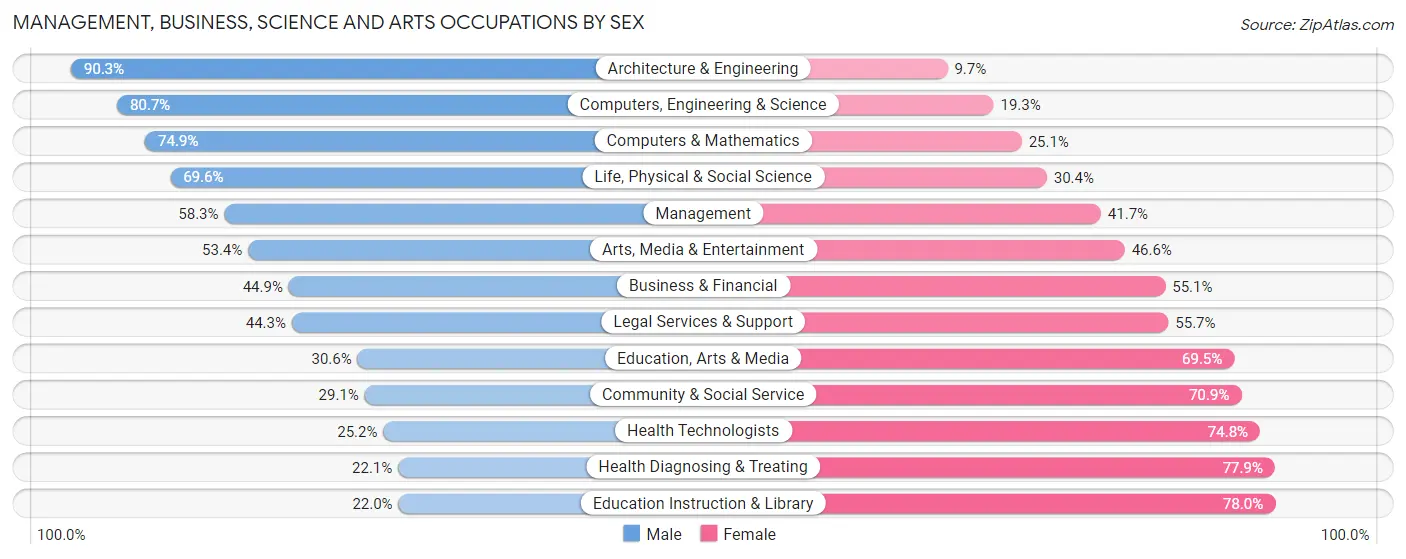
Management, Business, Science and Arts Occupations by Sex
Within the Management, Business, Science and Arts occupations in Area Code 769, the most male-oriented occupations are Architecture & Engineering (90.3%), Computers, Engineering & Science (80.7%), and Computers & Mathematics (74.9%), while the most female-oriented occupations are Education Instruction & Library (78.0%), Health Diagnosing & Treating (77.9%), and Health Technologists (74.8%).
| Occupation | Male | Female |
| Management | 14,008 (58.3%) | 10,008 (41.7%) |
| Business & Financial | 5,215 (44.9%) | 6,400 (55.1%) |
| Computers, Engineering & Science | 7,550 (80.7%) | 1,802 (19.3%) |
| Computers & Mathematics | 2,614 (74.9%) | 878 (25.1%) |
| Architecture & Engineering | 3,733 (90.3%) | 399 (9.7%) |
| Life, Physical & Social Science | 1,203 (69.6%) | 525 (30.4%) |
| Community & Social Service | 8,643 (29.1%) | 21,091 (70.9%) |
| Education, Arts & Media | 1,481 (30.5%) | 3,367 (69.5%) |
| Legal Services & Support | 1,288 (44.3%) | 1,622 (55.7%) |
| Education Instruction & Library | 4,109 (22.0%) | 14,560 (78.0%) |
| Arts, Media & Entertainment | 1,765 (53.4%) | 1,542 (46.6%) |
| Health Diagnosing & Treating | 5,022 (22.1%) | 17,720 (77.9%) |
| Health Technologists | 3,860 (25.2%) | 11,473 (74.8%) |
| Total (Category) | 40,438 (41.5%) | 57,021 (58.5%) |
| Total (Overall) | 127,954 (50.3%) | 126,438 (49.7%) |
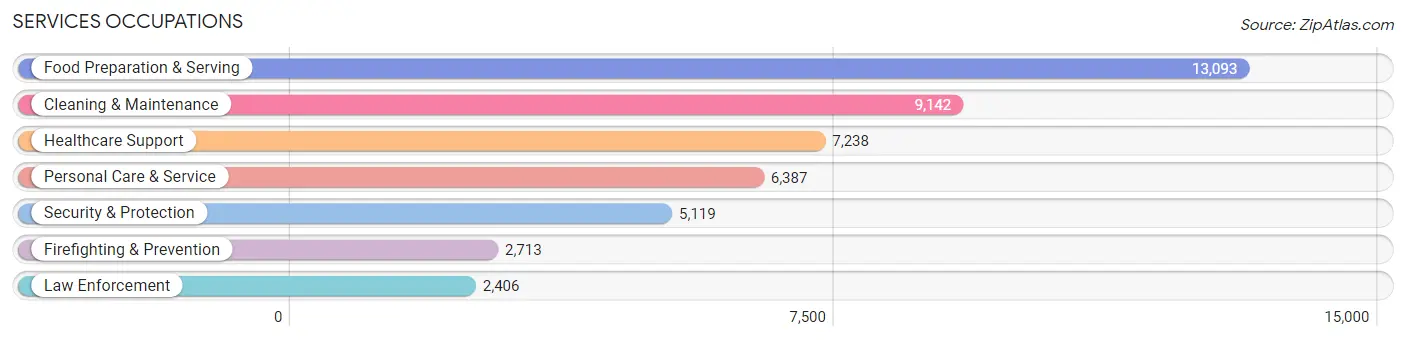
Services Occupations
The most common Services occupations in Area Code 769 are Food Preparation & Serving (13,093 | 5.1%), Cleaning & Maintenance (9,142 | 3.6%), Healthcare Support (7,238 | 2.9%), Personal Care & Service (6,387 | 2.5%), and Security & Protection (5,119 | 2.0%).
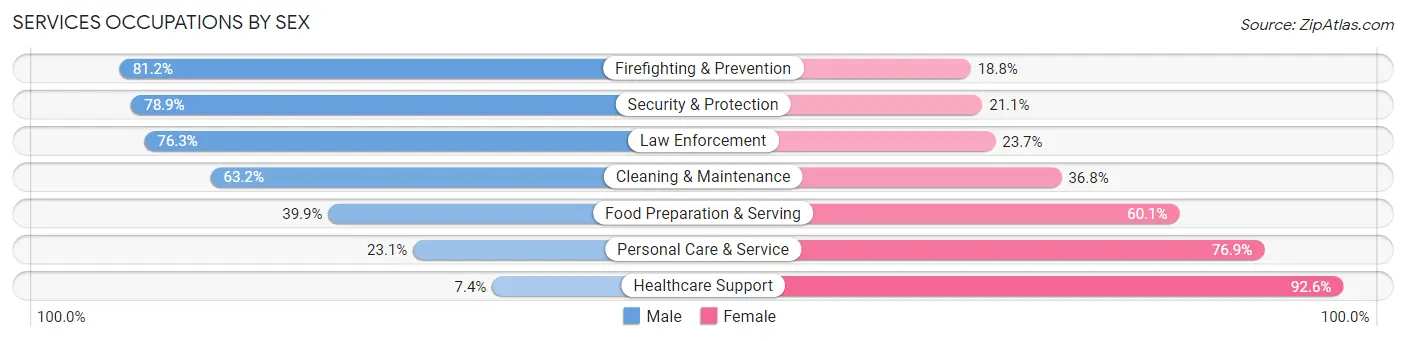
Services Occupations by Sex
Within the Services occupations in Area Code 769, the most male-oriented occupations are Firefighting & Prevention (81.2%), Security & Protection (78.9%), and Law Enforcement (76.3%), while the most female-oriented occupations are Healthcare Support (92.6%), Personal Care & Service (76.9%), and Food Preparation & Serving (60.1%).
| Occupation | Male | Female |
| Healthcare Support | 536 (7.4%) | 6,702 (92.6%) |
| Security & Protection | 4,037 (78.9%) | 1,082 (21.1%) |
| Firefighting & Prevention | 2,202 (81.2%) | 511 (18.8%) |
| Law Enforcement | 1,835 (76.3%) | 571 (23.7%) |
| Food Preparation & Serving | 5,219 (39.9%) | 7,874 (60.1%) |
| Cleaning & Maintenance | 5,776 (63.2%) | 3,366 (36.8%) |
| Personal Care & Service | 1,473 (23.1%) | 4,914 (76.9%) |
| Total (Category) | 17,041 (41.6%) | 23,938 (58.4%) |
| Total (Overall) | 127,954 (50.3%) | 126,438 (49.7%) |
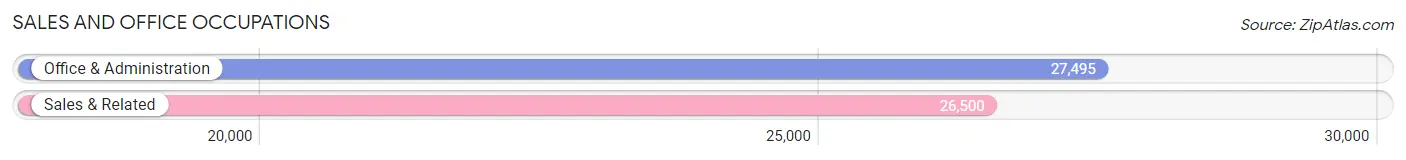
Sales and Office Occupations
The most common Sales and Office occupations in Area Code 769 are Office & Administration (27,495 | 10.8%), and Sales & Related (26,500 | 10.4%).
Sales and Office Occupations by Sex
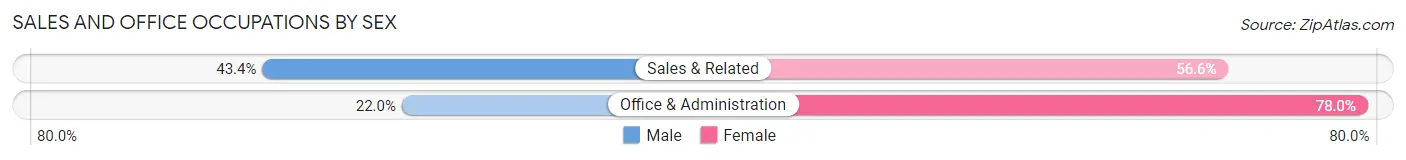
| Occupation | Male | Female |
| Sales & Related | 11,510 (43.4%) | 14,990 (56.6%) |
| Office & Administration | 6,041 (22.0%) | 21,454 (78.0%) |
| Total (Category) | 17,551 (32.5%) | 36,444 (67.5%) |
| Total (Overall) | 127,954 (50.3%) | 126,438 (49.7%) |
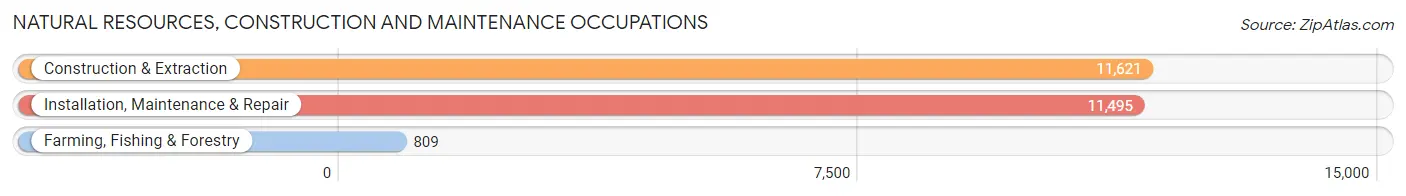
Natural Resources, Construction and Maintenance Occupations
The most common Natural Resources, Construction and Maintenance occupations in Area Code 769 are Construction & Extraction (11,621 | 4.6%), Installation, Maintenance & Repair (11,495 | 4.5%), and Farming, Fishing & Forestry (809 | 0.3%).
Natural Resources, Construction and Maintenance Occupations by Sex
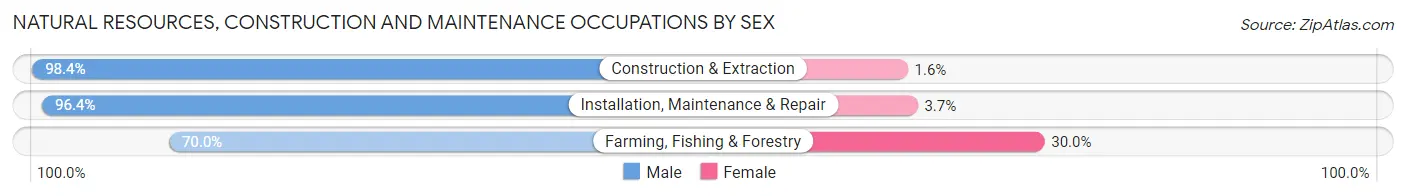
| Occupation | Male | Female |
| Farming, Fishing & Forestry | 566 (70.0%) | 243 (30.0%) |
| Construction & Extraction | 11,435 (98.4%) | 186 (1.6%) |
| Installation, Maintenance & Repair | 11,075 (96.4%) | 420 (3.6%) |
| Total (Category) | 23,076 (96.5%) | 849 (3.5%) |
| Total (Overall) | 127,954 (50.3%) | 126,438 (49.7%) |
Production, Transportation and Moving Occupations
The most common Production, Transportation and Moving occupations in Area Code 769 are Production (17,320 | 6.8%), Transportation (11,235 | 4.4%), and Material Moving (9,479 | 3.7%).
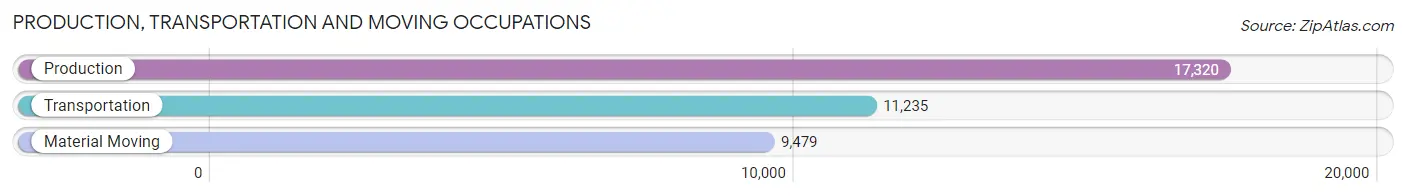
Production, Transportation and Moving Occupations by Sex
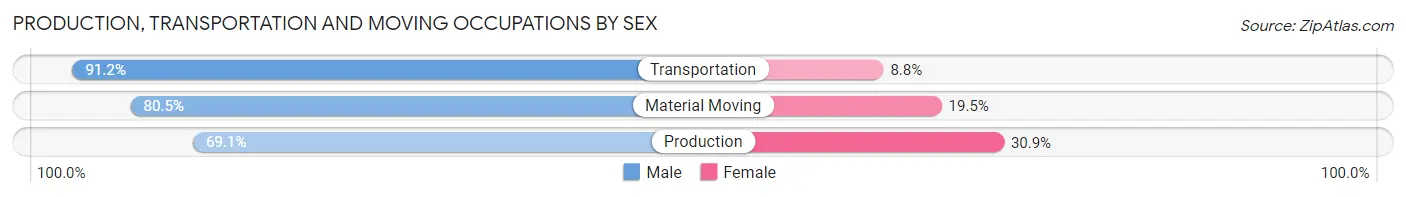
| Occupation | Male | Female |
| Production | 11,968 (69.1%) | 5,352 (30.9%) |
| Transportation | 10,247 (91.2%) | 988 (8.8%) |
| Material Moving | 7,633 (80.5%) | 1,846 (19.5%) |
| Total (Category) | 29,848 (78.5%) | 8,186 (21.5%) |
| Total (Overall) | 127,954 (50.3%) | 126,438 (49.7%) |
Employment Industries by Sex in Area Code 769
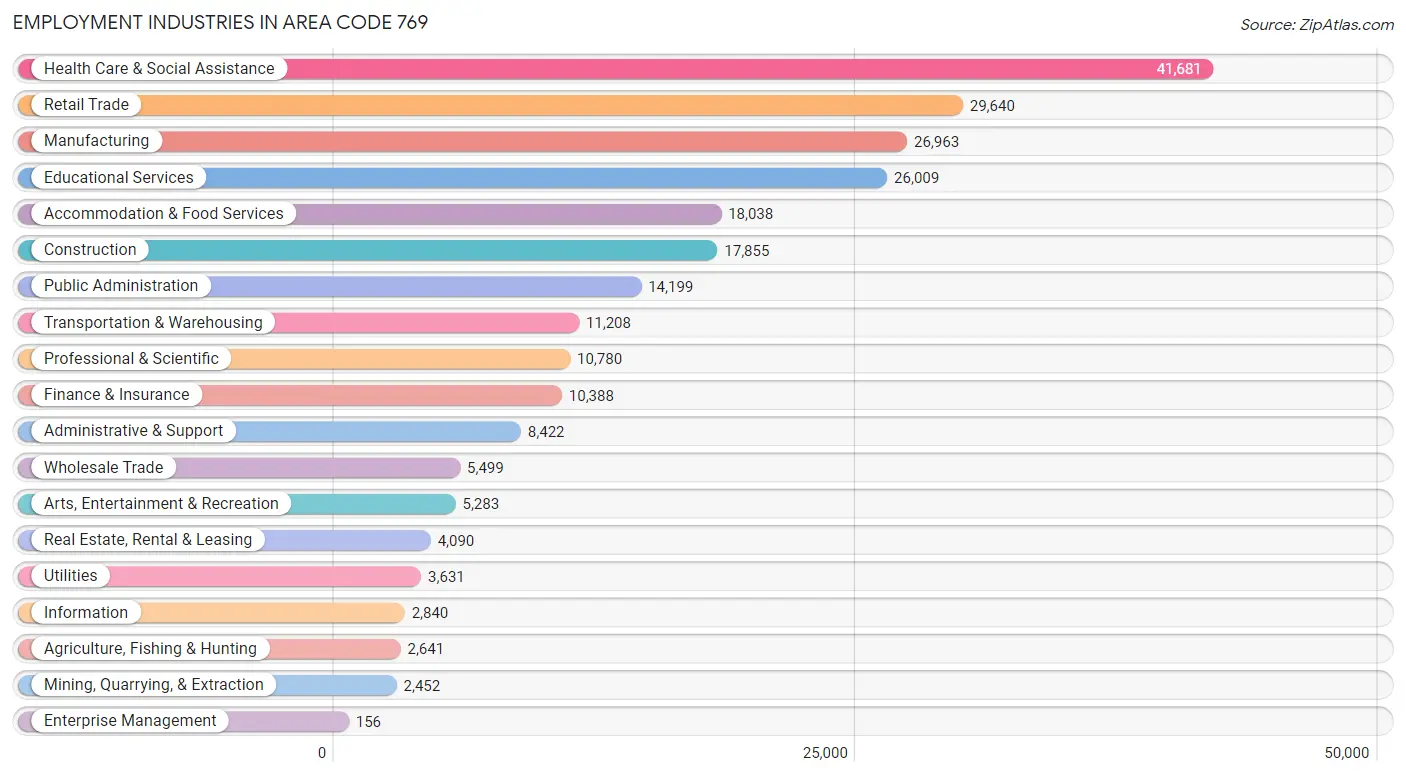
Employment Industries in Area Code 769
The major employment industries in Area Code 769 include Health Care & Social Assistance (41,681 | 16.4%), Retail Trade (29,640 | 11.7%), Manufacturing (26,963 | 10.6%), Educational Services (26,009 | 10.2%), and Accommodation & Food Services (18,038 | 7.1%).
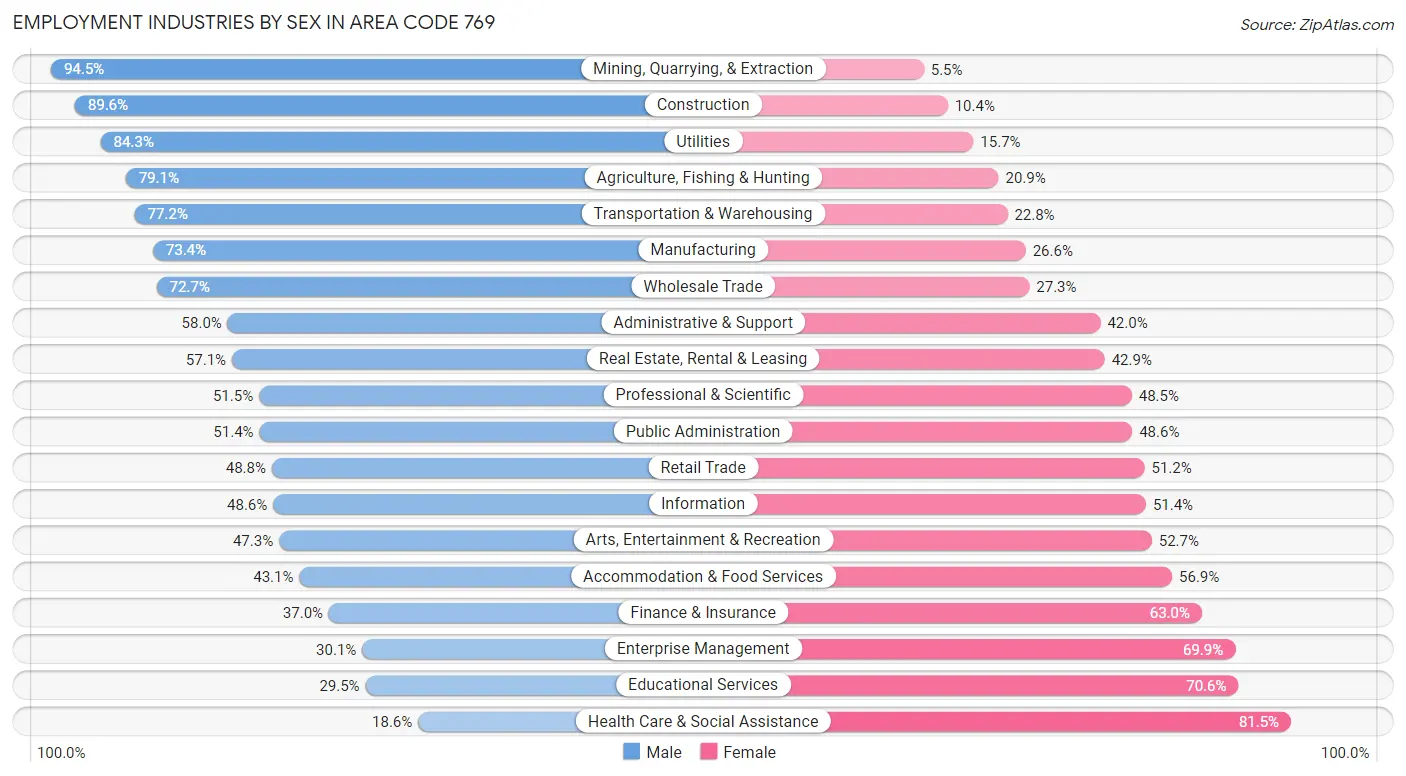
Employment Industries by Sex in Area Code 769
The Area Code 769 industries that see more men than women are Mining, Quarrying, & Extraction (94.5%), Construction (89.6%), and Utilities (84.3%), whereas the industries that tend to have a higher number of women are Health Care & Social Assistance (81.5%), Educational Services (70.6%), and Enterprise Management (69.9%).
| Industry | Male | Female |
| Agriculture, Fishing & Hunting | 2,088 (79.1%) | 553 (20.9%) |
| Mining, Quarrying, & Extraction | 2,318 (94.5%) | 134 (5.5%) |
| Construction | 15,997 (89.6%) | 1,858 (10.4%) |
| Manufacturing | 19,802 (73.4%) | 7,161 (26.6%) |
| Wholesale Trade | 3,997 (72.7%) | 1,502 (27.3%) |
| Retail Trade | 14,477 (48.8%) | 15,163 (51.2%) |
| Transportation & Warehousing | 8,656 (77.2%) | 2,552 (22.8%) |
| Utilities | 3,060 (84.3%) | 571 (15.7%) |
| Information | 1,379 (48.6%) | 1,461 (51.4%) |
| Finance & Insurance | 3,845 (37.0%) | 6,543 (63.0%) |
| Real Estate, Rental & Leasing | 2,335 (57.1%) | 1,755 (42.9%) |
| Professional & Scientific | 5,550 (51.5%) | 5,230 (48.5%) |
| Enterprise Management | 47 (30.1%) | 109 (69.9%) |
| Administrative & Support | 4,882 (58.0%) | 3,540 (42.0%) |
| Educational Services | 7,659 (29.4%) | 18,350 (70.6%) |
| Health Care & Social Assistance | 7,733 (18.5%) | 33,948 (81.5%) |
| Arts, Entertainment & Recreation | 2,501 (47.3%) | 2,782 (52.7%) |
| Accommodation & Food Services | 7,781 (43.1%) | 10,257 (56.9%) |
| Public Administration | 7,298 (51.4%) | 6,901 (48.6%) |
| Total | 127,954 (50.3%) | 126,438 (49.7%) |
Education in Area Code 769
School Enrollment in Area Code 769
The most common levels of schooling among the 141,169 students in Area Code 769 are middle school (31,910 | 22.6%), high school (29,959 | 21.2%), and elementary school (29,283 | 20.7%).
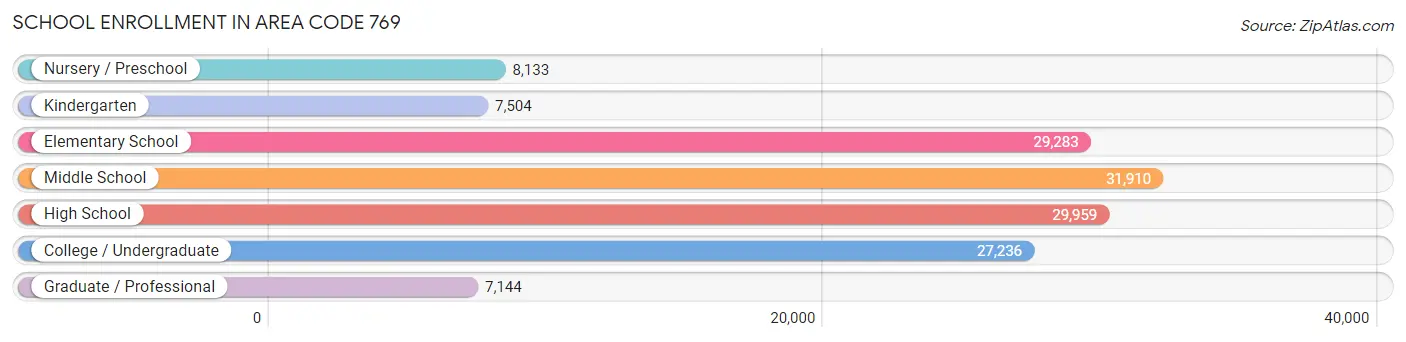
| School Level | # Students | % Students |
| Nursery / Preschool | 8,133 | 5.8% |
| Kindergarten | 7,504 | 5.3% |
| Elementary School | 29,283 | 20.7% |
| Middle School | 31,910 | 22.6% |
| High School | 29,959 | 21.2% |
| College / Undergraduate | 27,236 | 19.3% |
| Graduate / Professional | 7,144 | 5.1% |
| Total | 141,169 | 100.0% |
School Enrollment by Age by Funding Source in Area Code 769
Out of a total of 141,169 students who are enrolled in schools in Area Code 769, 25,677 (18.2%) attend a private institution, while the remaining 115,492 (81.8%) are enrolled in public schools. The age group of 3 to 4 year olds has the highest likelihood of being enrolled in private schools, with 3,229 (45.6% in the age bracket) enrolled. Conversely, the age group of 18 to 19 year olds has the lowest likelihood of being enrolled in a private school, with 9,597 (86.4% in the age bracket) attending a public institution.
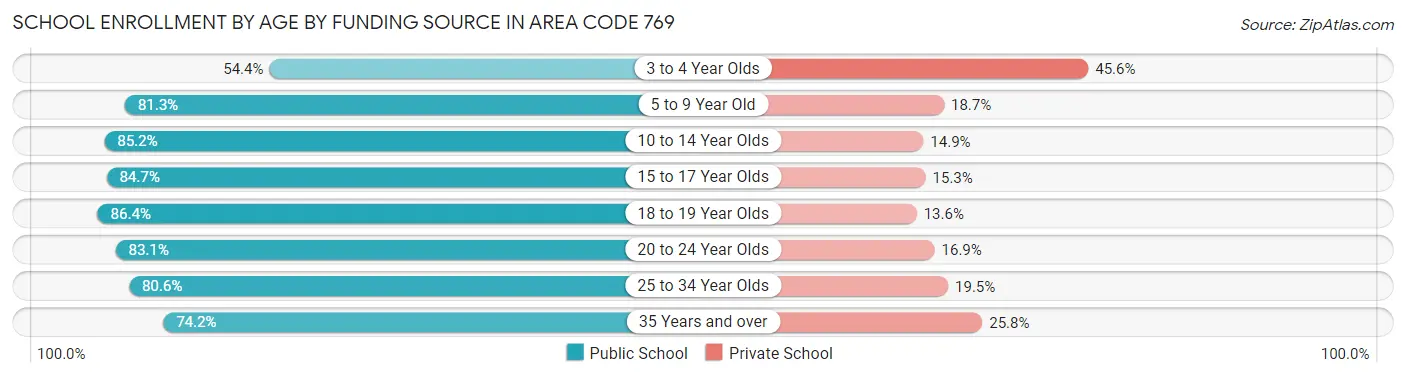
| Age Bracket | Public School | Private School |
| 3 to 4 Year Olds | 3,857 (54.4%) | 3,229 (45.6%) |
| 5 to 9 Year Old | 26,560 (81.3%) | 6,105 (18.7%) |
| 10 to 14 Year Olds | 34,164 (85.2%) | 5,957 (14.8%) |
| 15 to 17 Year Olds | 18,196 (84.7%) | 3,277 (15.3%) |
| 18 to 19 Year Olds | 9,597 (86.4%) | 1,512 (13.6%) |
| 20 to 24 Year Olds | 12,307 (83.1%) | 2,510 (16.9%) |
| 25 to 34 Year Olds | 6,418 (80.5%) | 1,550 (19.5%) |
| 35 Years and over | 4,399 (74.2%) | 1,531 (25.8%) |
| Total | 115,492 (81.8%) | 25,677 (18.2%) |
Educational Attainment by Field of Study in Area Code 769
Business (26,449 | 22.2%), education (20,503 | 17.2%), science & technology (15,812 | 13.3%), arts & humanities (8,632 | 7.2%), and bio, nature & agricultural (7,857 | 6.6%) are the most common fields of study among 119,237 individuals in Area Code 769 who have obtained a bachelor's degree or higher.
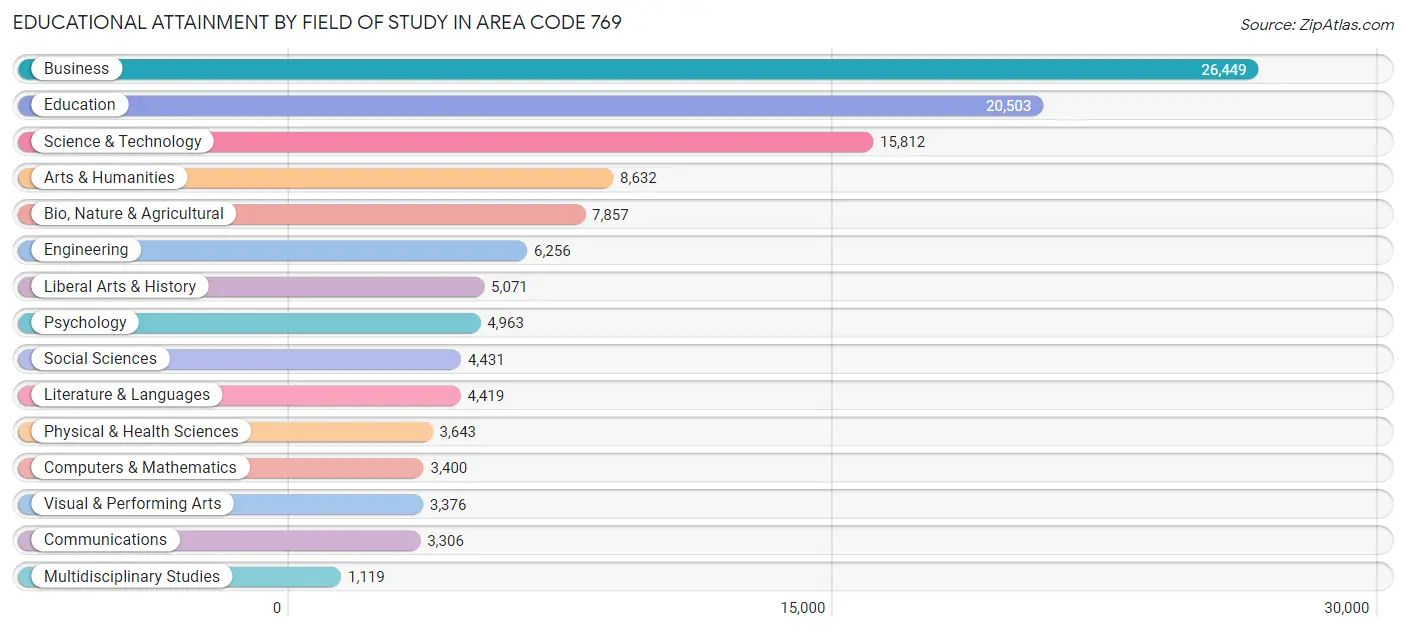
| Field of Study | # Graduates | % Graduates |
| Computers & Mathematics | 3,400 | 2.9% |
| Bio, Nature & Agricultural | 7,857 | 6.6% |
| Physical & Health Sciences | 3,643 | 3.1% |
| Psychology | 4,963 | 4.2% |
| Social Sciences | 4,431 | 3.7% |
| Engineering | 6,256 | 5.2% |
| Multidisciplinary Studies | 1,119 | 0.9% |
| Science & Technology | 15,812 | 13.3% |
| Business | 26,449 | 22.2% |
| Education | 20,503 | 17.2% |
| Literature & Languages | 4,419 | 3.7% |
| Liberal Arts & History | 5,071 | 4.3% |
| Visual & Performing Arts | 3,376 | 2.8% |
| Communications | 3,306 | 2.8% |
| Arts & Humanities | 8,632 | 7.2% |
| Total | 119,237 | 100.0% |
Transportation & Commute in Area Code 769
Vehicle Availability by Sex in Area Code 769
The most prevalent vehicle ownership categories in Area Code 769 are males with 2 vehicles (52,711, accounting for 41.5%) and females with 2 vehicles (48,114, making up 42.7%).
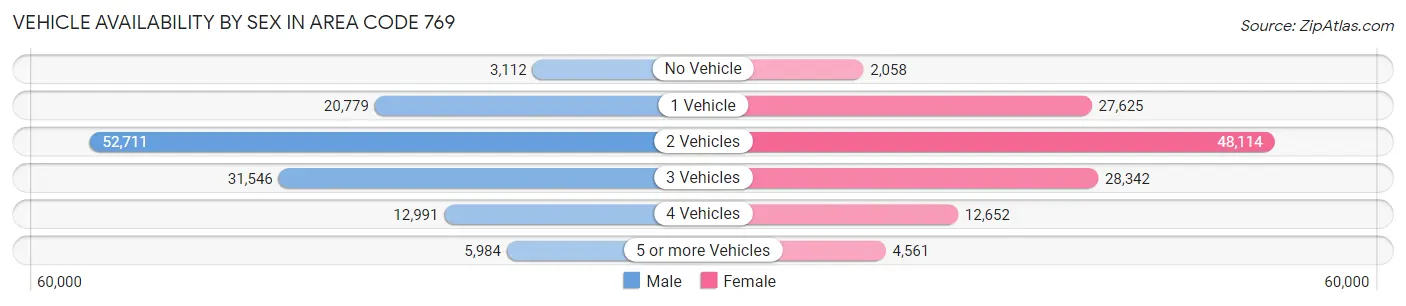
| Vehicles Available | Male | Female |
| No Vehicle | 3,112 (2.5%) | 2,058 (1.7%) |
| 1 Vehicle | 20,779 (16.4%) | 27,625 (22.4%) |
| 2 Vehicles | 52,711 (41.5%) | 48,114 (39.0%) |
| 3 Vehicles | 31,546 (24.8%) | 28,342 (23.0%) |
| 4 Vehicles | 12,991 (10.2%) | 12,652 (10.3%) |
| 5 or more Vehicles | 5,984 (4.7%) | 4,561 (3.7%) |
| Total | 127,123 (100.0%) | 123,352 (100.0%) |
Commute Time in Area Code 769
The most frequently occuring commute durations in Area Code 769 are 15 to 19 minutes (39,635 commuters, 16.5%), 10 to 14 minutes (37,205 commuters, 15.4%), and 30 to 34 minutes (34,477 commuters, 14.3%).
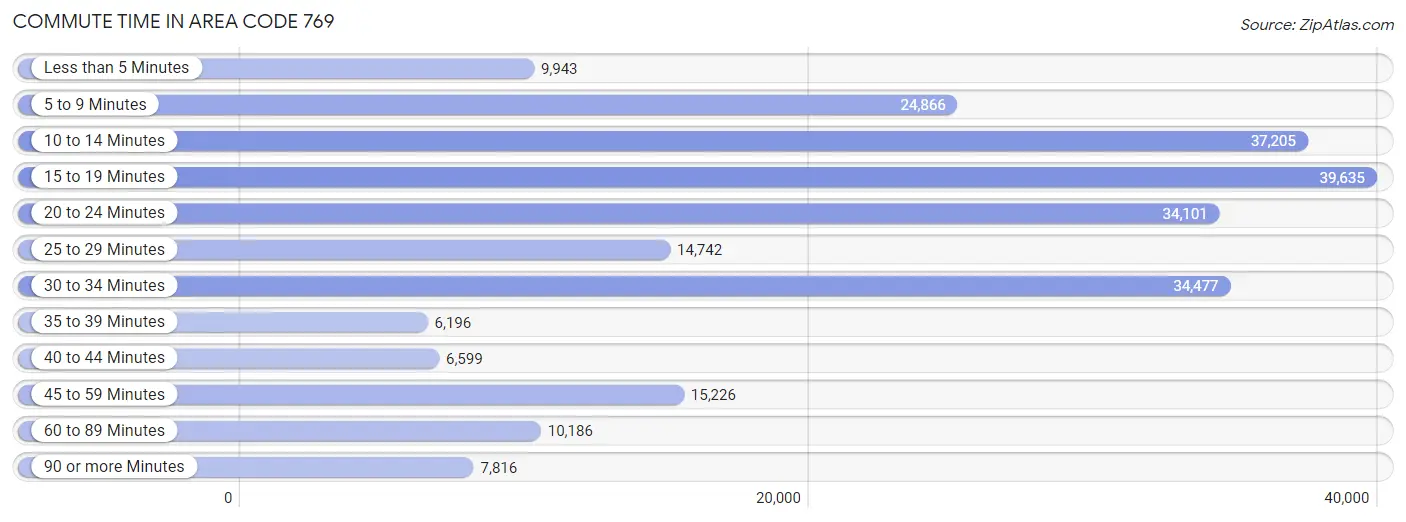
| Commute Time | # Commuters | % Commuters |
| Less than 5 Minutes | 9,943 | 4.1% |
| 5 to 9 Minutes | 24,866 | 10.3% |
| 10 to 14 Minutes | 37,205 | 15.4% |
| 15 to 19 Minutes | 39,635 | 16.5% |
| 20 to 24 Minutes | 34,101 | 14.1% |
| 25 to 29 Minutes | 14,742 | 6.1% |
| 30 to 34 Minutes | 34,477 | 14.3% |
| 35 to 39 Minutes | 6,196 | 2.6% |
| 40 to 44 Minutes | 6,599 | 2.7% |
| 45 to 59 Minutes | 15,226 | 6.3% |
| 60 to 89 Minutes | 10,186 | 4.2% |
| 90 or more Minutes | 7,816 | 3.2% |
Commute Time by Sex in Area Code 769
The most common commute times in Area Code 769 are 15 to 19 minutes (19,469 commuters, 15.9%) for males and 15 to 19 minutes (20,166 commuters, 17.1%) for females.
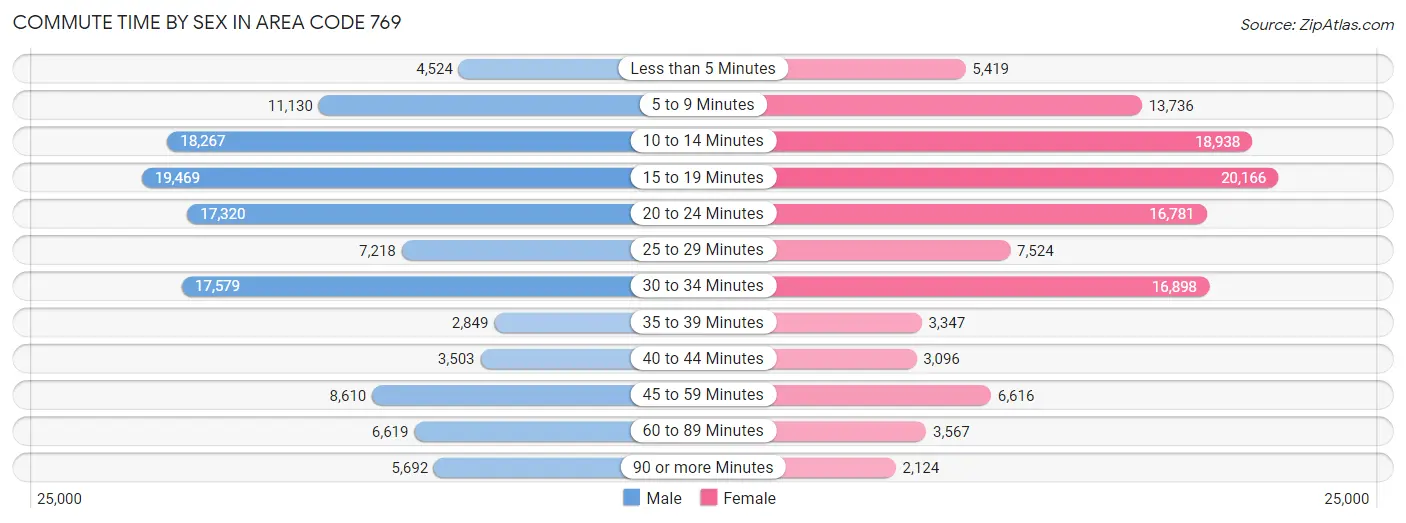
| Commute Time | Male | Female |
| Less than 5 Minutes | 4,524 (3.7%) | 5,419 (4.6%) |
| 5 to 9 Minutes | 11,130 (9.1%) | 13,736 (11.6%) |
| 10 to 14 Minutes | 18,267 (14.9%) | 18,938 (16.0%) |
| 15 to 19 Minutes | 19,469 (15.9%) | 20,166 (17.1%) |
| 20 to 24 Minutes | 17,320 (14.1%) | 16,781 (14.2%) |
| 25 to 29 Minutes | 7,218 (5.9%) | 7,524 (6.4%) |
| 30 to 34 Minutes | 17,579 (14.3%) | 16,898 (14.3%) |
| 35 to 39 Minutes | 2,849 (2.3%) | 3,347 (2.8%) |
| 40 to 44 Minutes | 3,503 (2.9%) | 3,096 (2.6%) |
| 45 to 59 Minutes | 8,610 (7.0%) | 6,616 (5.6%) |
| 60 to 89 Minutes | 6,619 (5.4%) | 3,567 (3.0%) |
| 90 or more Minutes | 5,692 (4.6%) | 2,124 (1.8%) |
Time of Departure to Work by Sex in Area Code 769
The most frequent times of departure to work in Area Code 769 are 7:00 AM to 7:29 AM (18,820, 15.3%) for males and 7:00 AM to 7:29 AM (23,150, 19.6%) for females.
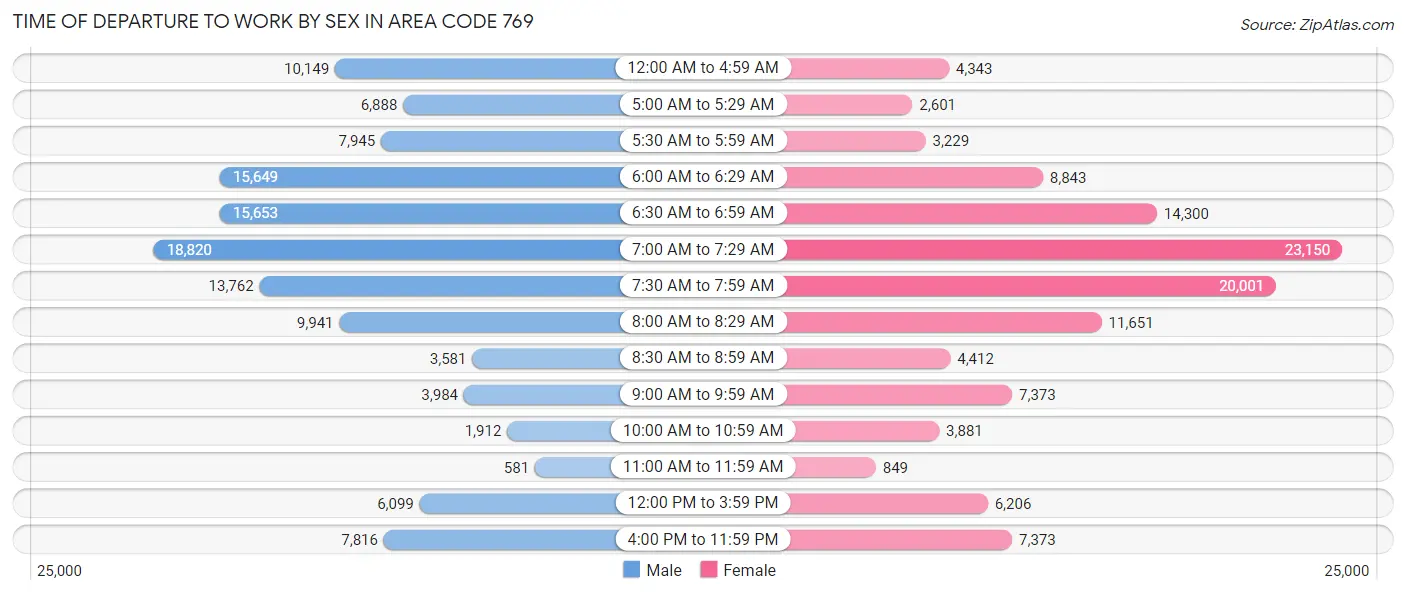
| Time of Departure | Male | Female |
| 12:00 AM to 4:59 AM | 10,149 (8.3%) | 4,343 (3.7%) |
| 5:00 AM to 5:29 AM | 6,888 (5.6%) | 2,601 (2.2%) |
| 5:30 AM to 5:59 AM | 7,945 (6.5%) | 3,229 (2.7%) |
| 6:00 AM to 6:29 AM | 15,649 (12.8%) | 8,843 (7.5%) |
| 6:30 AM to 6:59 AM | 15,653 (12.8%) | 14,300 (12.1%) |
| 7:00 AM to 7:29 AM | 18,820 (15.3%) | 23,150 (19.6%) |
| 7:30 AM to 7:59 AM | 13,762 (11.2%) | 20,001 (16.9%) |
| 8:00 AM to 8:29 AM | 9,941 (8.1%) | 11,651 (9.9%) |
| 8:30 AM to 8:59 AM | 3,581 (2.9%) | 4,412 (3.7%) |
| 9:00 AM to 9:59 AM | 3,984 (3.2%) | 7,373 (6.2%) |
| 10:00 AM to 10:59 AM | 1,912 (1.6%) | 3,881 (3.3%) |
| 11:00 AM to 11:59 AM | 581 (0.5%) | 849 (0.7%) |
| 12:00 PM to 3:59 PM | 6,099 (5.0%) | 6,206 (5.2%) |
| 4:00 PM to 11:59 PM | 7,816 (6.4%) | 7,373 (6.2%) |
| Total | 122,780 (100.0%) | 118,212 (100.0%) |
Housing Occupancy in Area Code 769
Occupancy by Ownership in Area Code 769
Of the total 220,741 dwellings in Area Code 769, owner-occupied units account for 158,471 (71.8%), while renter-occupied units make up 62,270 (28.2%).
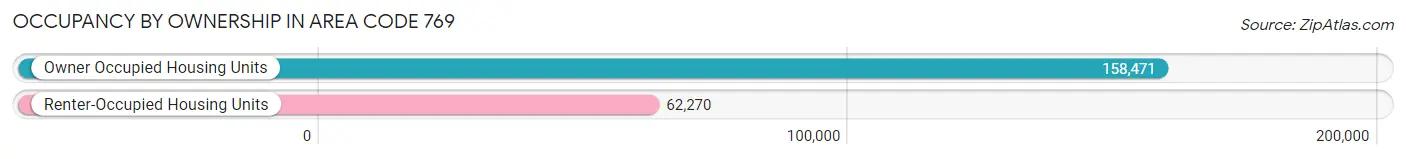
| Occupancy | # Housing Units | % Housing Units |
| Owner Occupied Housing Units | 158,471 | 71.8% |
| Renter-Occupied Housing Units | 62,270 | 28.2% |
| Total Occupied Housing Units | 220,741 | 100.0% |
Occupancy by Household Size in Area Code 769
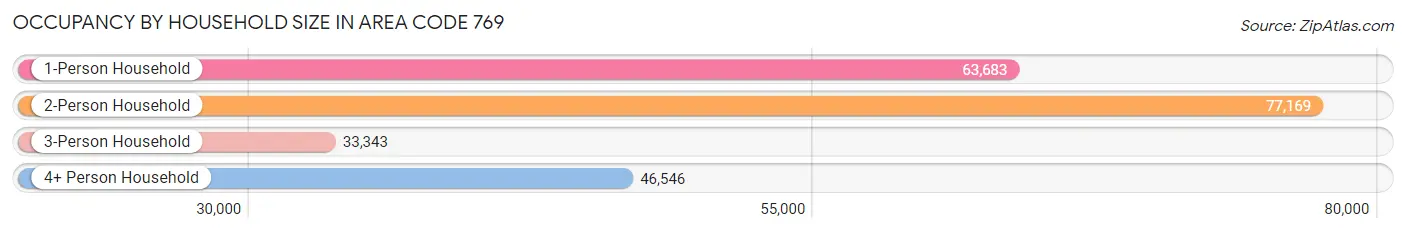
| Household Size | # Housing Units | % Housing Units |
| 1-Person Household | 63,683 | 28.8% |
| 2-Person Household | 77,169 | 35.0% |
| 3-Person Household | 33,343 | 15.1% |
| 4+ Person Household | 46,546 | 21.1% |
| Total Housing Units | 220,741 | 100.0% |
Occupancy by Ownership by Household Size in Area Code 769
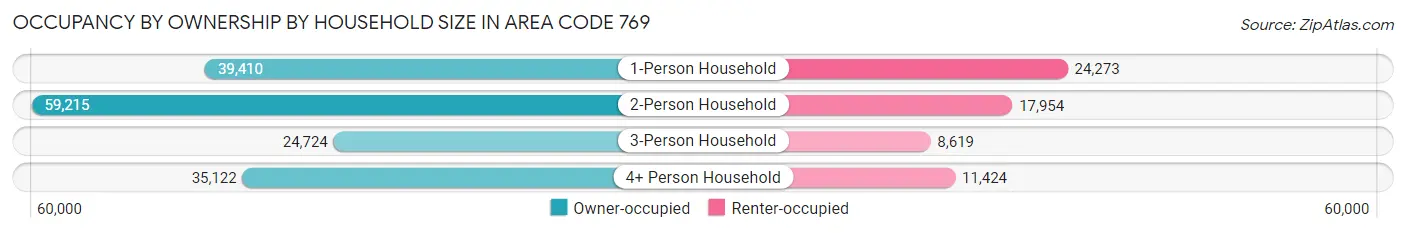
| Household Size | Owner-occupied | Renter-occupied |
| 1-Person Household | 39,410 (61.9%) | 24,273 (38.1%) |
| 2-Person Household | 59,215 (76.7%) | 17,954 (23.3%) |
| 3-Person Household | 24,724 (74.2%) | 8,619 (25.9%) |
| 4+ Person Household | 35,122 (75.5%) | 11,424 (24.5%) |
| Total Housing Units | 158,471 (71.8%) | 62,270 (28.2%) |
Occupancy by Educational Attainment in Area Code 769
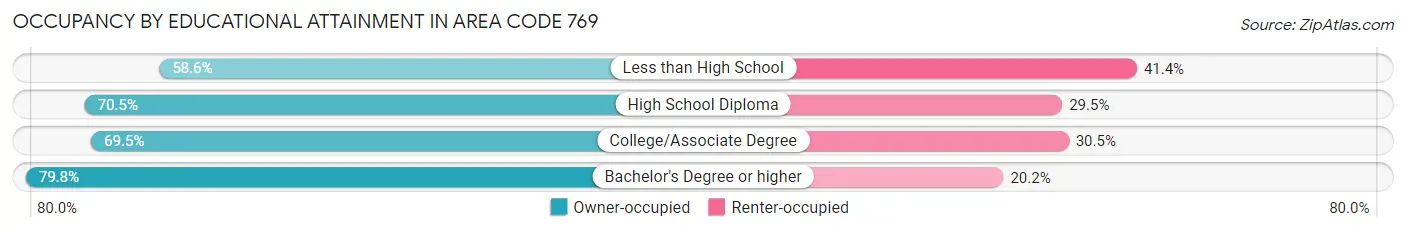
| Household Size | Owner-occupied | Renter-occupied |
| Less than High School | 13,332 (58.6%) | 9,405 (41.4%) |
| High School Diploma | 38,595 (70.5%) | 16,155 (29.5%) |
| College/Associate Degree | 52,285 (69.5%) | 22,985 (30.5%) |
| Bachelor's Degree or higher | 54,259 (79.8%) | 13,725 (20.2%) |
Occupancy by Age of Householder in Area Code 769
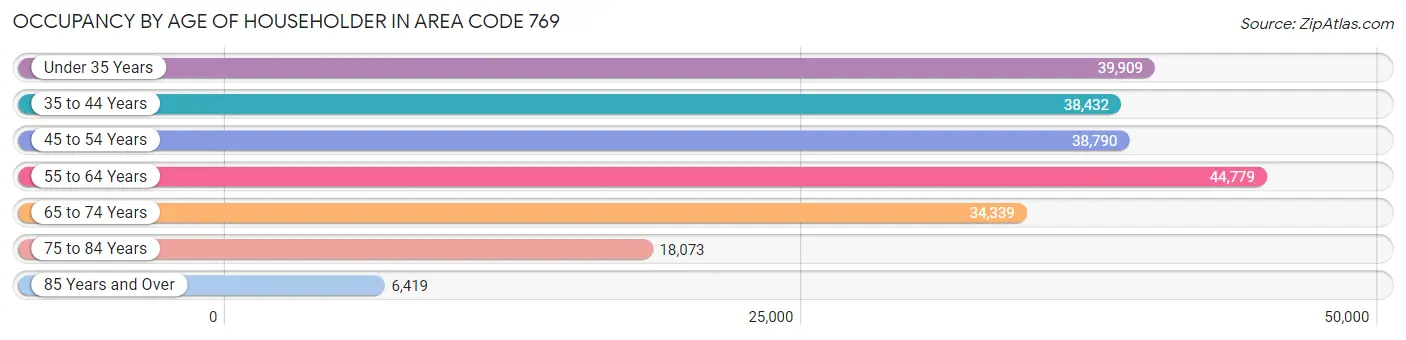
| Age Bracket | # Households | % Households |
| Under 35 Years | 39,909 | 18.1% |
| 35 to 44 Years | 38,432 | 17.4% |
| 45 to 54 Years | 38,790 | 17.6% |
| 55 to 64 Years | 44,779 | 20.3% |
| 65 to 74 Years | 34,339 | 15.6% |
| 75 to 84 Years | 18,073 | 8.2% |
| 85 Years and Over | 6,419 | 2.9% |
| Total | 220,741 | 100.0% |
Housing Finances in Area Code 769
Median Income by Occupancy in Area Code 769
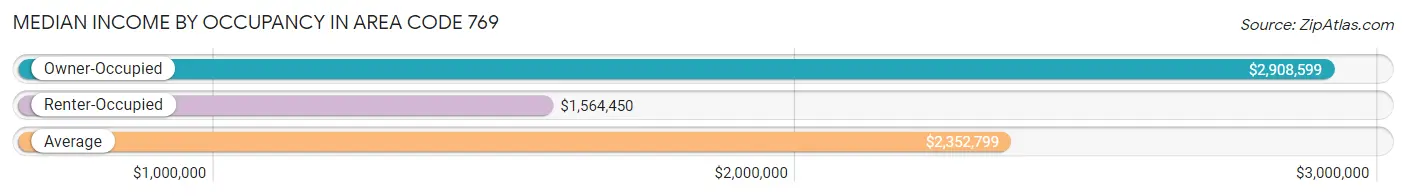
| Occupancy Type | # Households | Median Income |
| Owner-Occupied | 158,471 (71.8%) | $2,908,599 |
| Renter-Occupied | 62,270 (28.2%) | $1,564,450 |
| Average | 220,741 (100.0%) | $2,352,799 |
Occupancy by Householder Income Bracket in Area Code 769
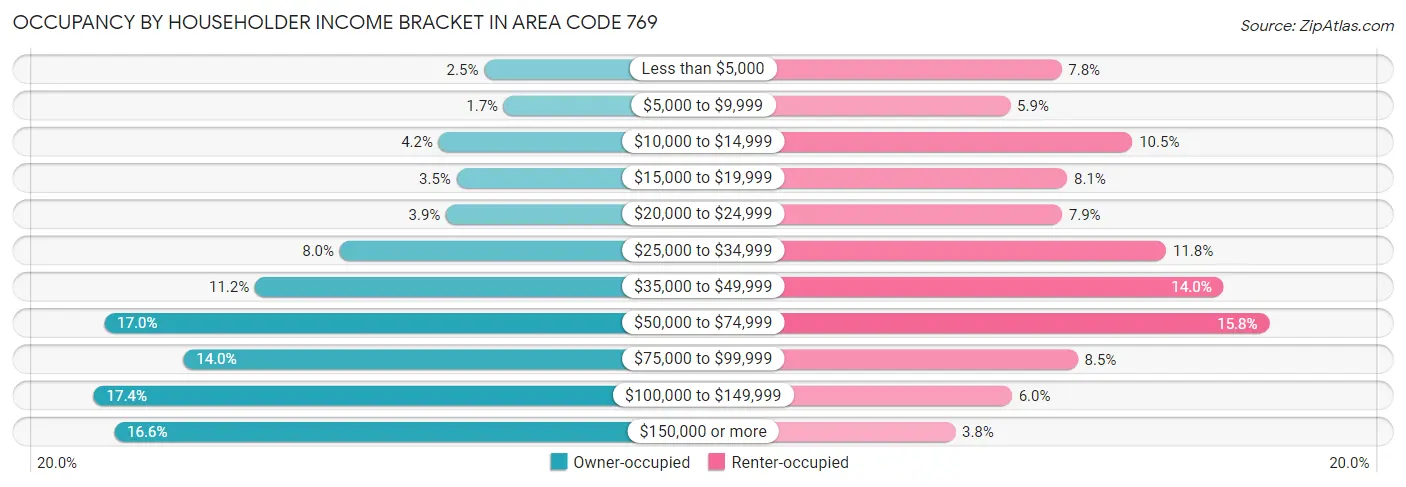
| Income Bracket | Owner-occupied | Renter-occupied |
| Less than $5,000 | 3,948 (2.5%) | 4,885 (7.8%) |
| $5,000 to $9,999 | 2,753 (1.7%) | 3,669 (5.9%) |
| $10,000 to $14,999 | 6,692 (4.2%) | 6,564 (10.5%) |
| $15,000 to $19,999 | 5,616 (3.5%) | 5,022 (8.1%) |
| $20,000 to $24,999 | 6,241 (3.9%) | 4,894 (7.9%) |
| $25,000 to $34,999 | 12,656 (8.0%) | 7,366 (11.8%) |
| $35,000 to $49,999 | 17,776 (11.2%) | 8,729 (14.0%) |
| $50,000 to $74,999 | 26,885 (17.0%) | 9,815 (15.8%) |
| $75,000 to $99,999 | 22,099 (14.0%) | 5,265 (8.5%) |
| $100,000 to $149,999 | 27,522 (17.4%) | 3,702 (5.9%) |
| $150,000 or more | 26,283 (16.6%) | 2,359 (3.8%) |
| Total | 158,471 (100.0%) | 62,270 (100.0%) |
Monthly Housing Cost Tiers in Area Code 769
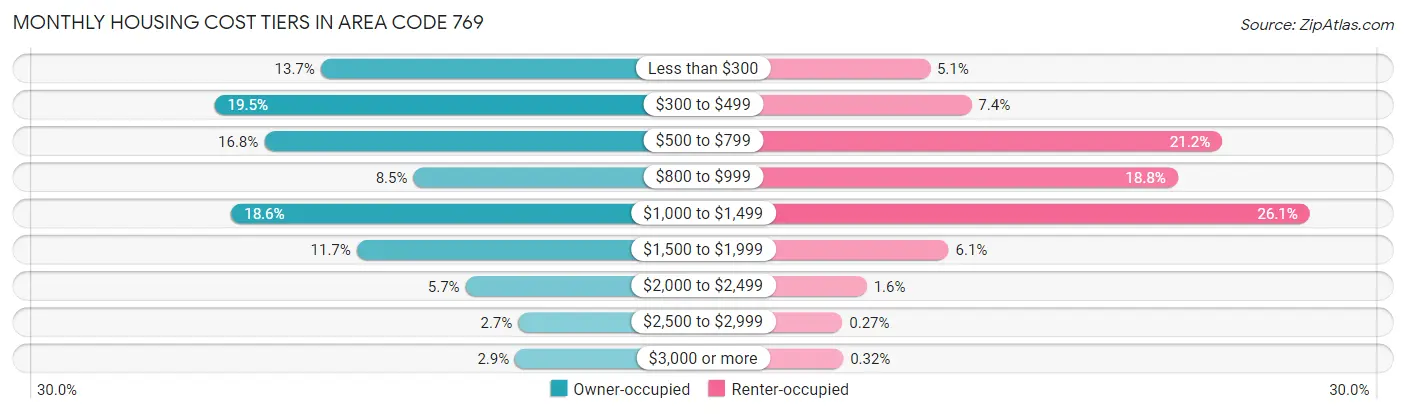
| Monthly Cost | Owner-occupied | Renter-occupied |
| Less than $300 | 21,627 (13.7%) | 3,182 (5.1%) |
| $300 to $499 | 30,899 (19.5%) | 4,607 (7.4%) |
| $500 to $799 | 26,581 (16.8%) | 13,228 (21.2%) |
| $800 to $999 | 13,510 (8.5%) | 11,699 (18.8%) |
| $1,000 to $1,499 | 29,451 (18.6%) | 16,241 (26.1%) |
| $1,500 to $1,999 | 18,480 (11.7%) | 3,824 (6.1%) |
| $2,000 to $2,499 | 8,956 (5.7%) | 1,006 (1.6%) |
| $2,500 to $2,999 | 4,350 (2.7%) | 166 (0.3%) |
| $3,000 or more | 4,617 (2.9%) | 198 (0.3%) |
| Total | 158,471 (100.0%) | 62,270 (100.0%) |
Physical Housing Characteristics in Area Code 769
Housing Structures in Area Code 769
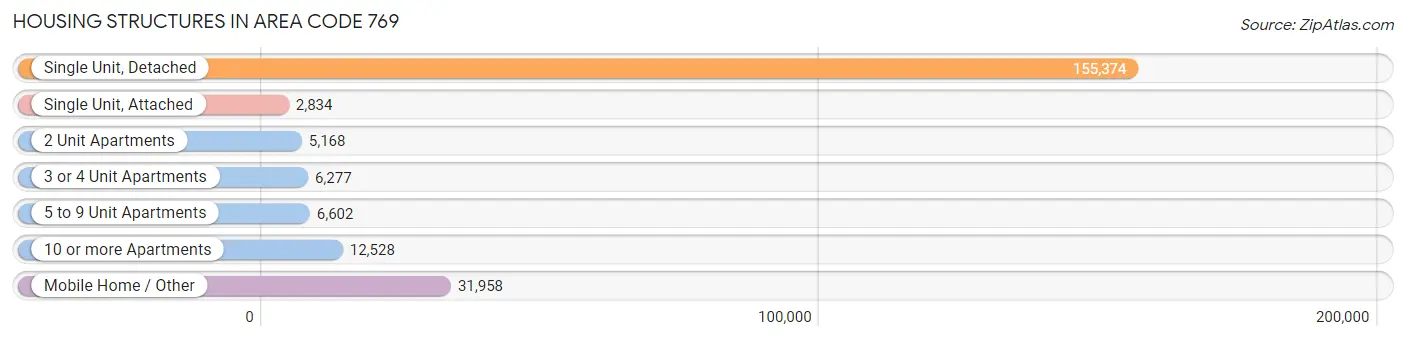
| Structure Type | # Housing Units | % Housing Units |
| Single Unit, Detached | 155,374 | 70.4% |
| Single Unit, Attached | 2,834 | 1.3% |
| 2 Unit Apartments | 5,168 | 2.3% |
| 3 or 4 Unit Apartments | 6,277 | 2.8% |
| 5 to 9 Unit Apartments | 6,602 | 3.0% |
| 10 or more Apartments | 12,528 | 5.7% |
| Mobile Home / Other | 31,958 | 14.5% |
| Total | 220,741 | 100.0% |
Housing Structures by Occupancy in Area Code 769
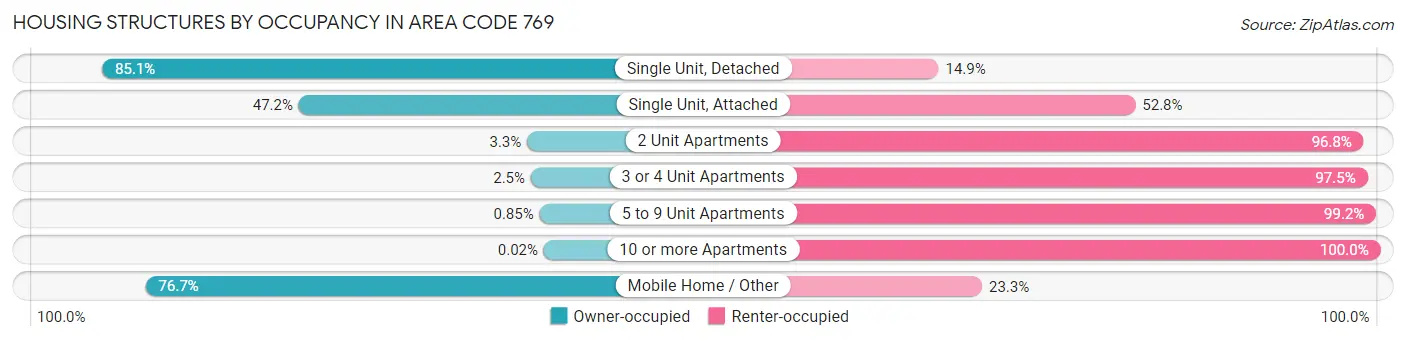
| Structure Type | Owner-occupied | Renter-occupied |
| Single Unit, Detached | 132,226 (85.1%) | 23,148 (14.9%) |
| Single Unit, Attached | 1,338 (47.2%) | 1,496 (52.8%) |
| 2 Unit Apartments | 168 (3.3%) | 5,000 (96.8%) |
| 3 or 4 Unit Apartments | 158 (2.5%) | 6,119 (97.5%) |
| 5 to 9 Unit Apartments | 56 (0.9%) | 6,546 (99.2%) |
| 10 or more Apartments | 3 (0.0%) | 12,525 (100.0%) |
| Mobile Home / Other | 24,522 (76.7%) | 7,436 (23.3%) |
| Total | 158,471 (71.8%) | 62,270 (28.2%) |
Housing Structures by Number of Rooms in Area Code 769
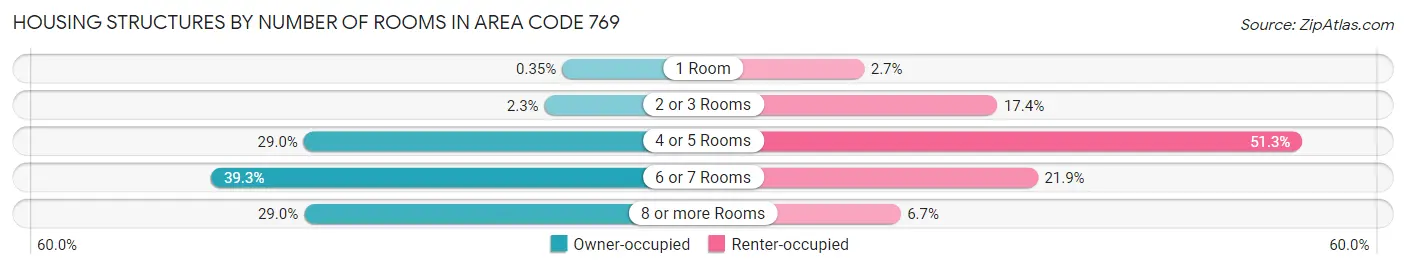
| Number of Rooms | Owner-occupied | Renter-occupied |
| 1 Room | 556 (0.4%) | 1,653 (2.6%) |
| 2 or 3 Rooms | 3,667 (2.3%) | 10,854 (17.4%) |
| 4 or 5 Rooms | 46,007 (29.0%) | 31,944 (51.3%) |
| 6 or 7 Rooms | 62,302 (39.3%) | 13,652 (21.9%) |
| 8 or more Rooms | 45,939 (29.0%) | 4,167 (6.7%) |
| Total | 158,471 (100.0%) | 62,270 (100.0%) |
Housing Structure by Heating Type in Area Code 769
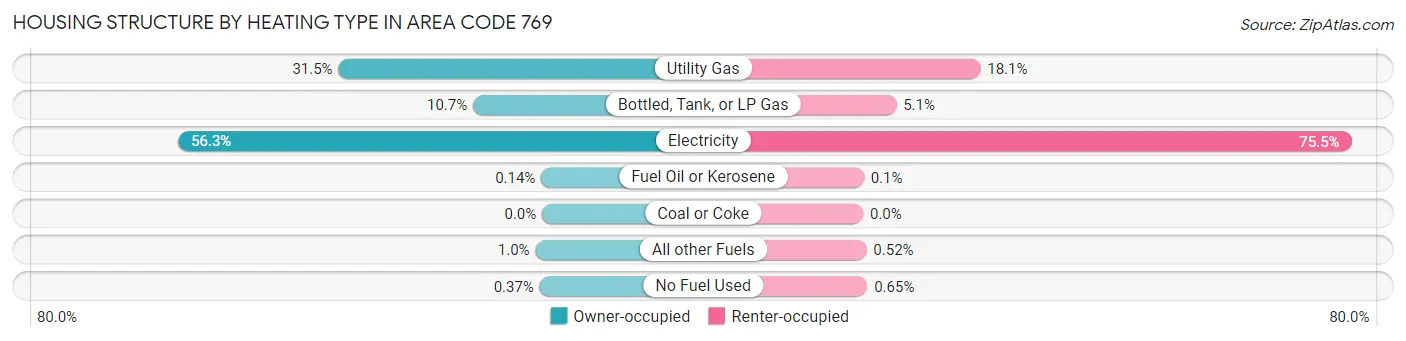
| Heating Type | Owner-occupied | Renter-occupied |
| Utility Gas | 49,887 (31.5%) | 11,282 (18.1%) |
| Bottled, Tank, or LP Gas | 16,929 (10.7%) | 3,192 (5.1%) |
| Electricity | 89,205 (56.3%) | 47,009 (75.5%) |
| Fuel Oil or Kerosene | 229 (0.1%) | 60 (0.1%) |
| Coal or Coke | 0 (0.0%) | 0 (0.0%) |
| All other Fuels | 1,633 (1.0%) | 321 (0.5%) |
| No Fuel Used | 588 (0.4%) | 406 (0.6%) |
| Total | 158,471 (100.0%) | 62,270 (100.0%) |
Household Vehicle Usage in Area Code 769
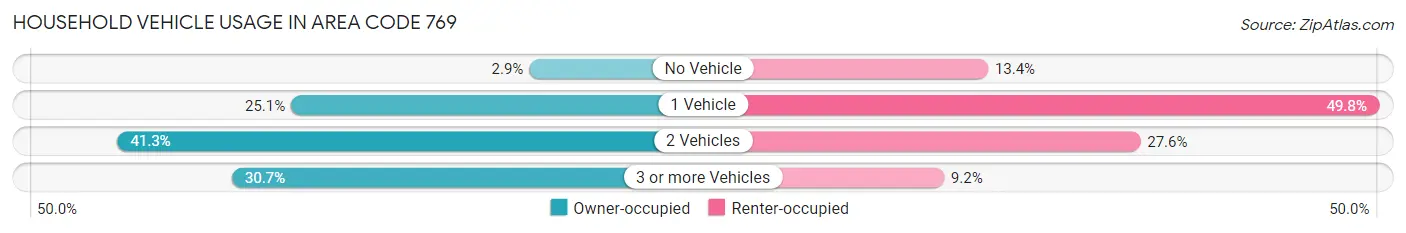
| Vehicles per Household | Owner-occupied | Renter-occupied |
| No Vehicle | 4,589 (2.9%) | 8,316 (13.4%) |
| 1 Vehicle | 39,816 (25.1%) | 31,030 (49.8%) |
| 2 Vehicles | 65,497 (41.3%) | 17,169 (27.6%) |
| 3 or more Vehicles | 48,569 (30.6%) | 5,755 (9.2%) |
| Total | 158,471 (100.0%) | 62,270 (100.0%) |
Real Estate & Mortgages in Area Code 769
Real Estate and Mortgage Overview in Area Code 769
| Characteristic | Without Mortgage | With Mortgage |
| Housing Units | 76,196 | 82,275 |
| Median Property Value | $4,734,800 | $6,948,000 |
| Median Household Income | $2,154,291 | $18,663 |
| Monthly Housing Costs | $18,625 | $4,489 |
| Real Estate Taxes | $32,532 | $11,534 |
Property Value by Mortgage Status in Area Code 769
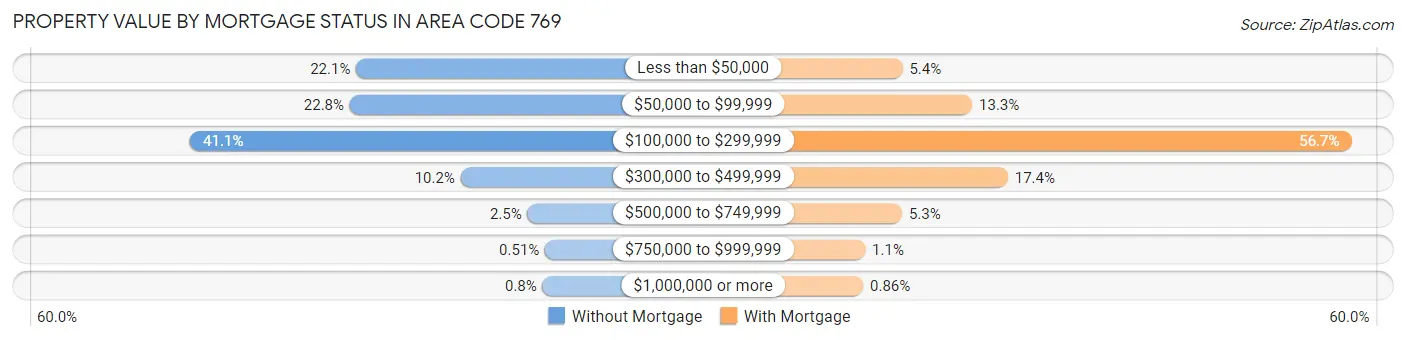
| Property Value | Without Mortgage | With Mortgage |
| Less than $50,000 | 16,836 (22.1%) | 4,411 (5.4%) |
| $50,000 to $99,999 | 17,394 (22.8%) | 10,957 (13.3%) |
| $100,000 to $299,999 | 31,299 (41.1%) | 46,609 (56.7%) |
| $300,000 to $499,999 | 7,740 (10.2%) | 14,317 (17.4%) |
| $500,000 to $749,999 | 1,923 (2.5%) | 4,368 (5.3%) |
| $750,000 to $999,999 | 391 (0.5%) | 902 (1.1%) |
| $1,000,000 or more | 613 (0.8%) | 711 (0.9%) |
| Total | 76,196 (100.0%) | 82,275 (100.0%) |
Household Income by Mortgage Status in Area Code 769
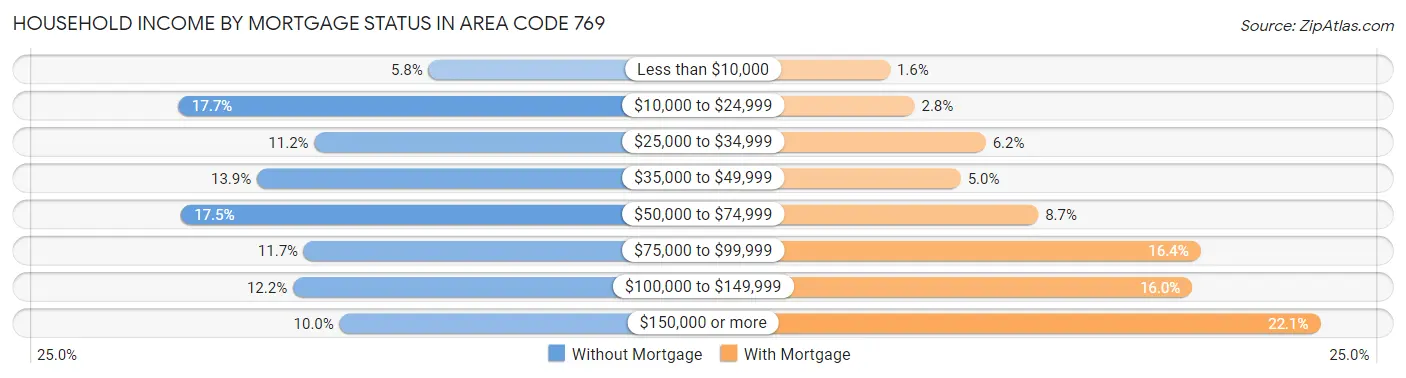
| Household Income | Without Mortgage | With Mortgage |
| Less than $10,000 | 4,389 (5.8%) | 1,348 (1.6%) |
| $10,000 to $24,999 | 13,448 (17.6%) | 2,312 (2.8%) |
| $25,000 to $34,999 | 8,534 (11.2%) | 5,101 (6.2%) |
| $35,000 to $49,999 | 10,615 (13.9%) | 4,122 (5.0%) |
| $50,000 to $74,999 | 13,365 (17.5%) | 7,161 (8.7%) |
| $75,000 to $99,999 | 8,913 (11.7%) | 13,520 (16.4%) |
| $100,000 to $149,999 | 9,312 (12.2%) | 13,186 (16.0%) |
| $150,000 or more | 7,620 (10.0%) | 18,210 (22.1%) |
| Total | 76,196 (100.0%) | 82,275 (100.0%) |
Property Value to Household Income Ratio in Area Code 769
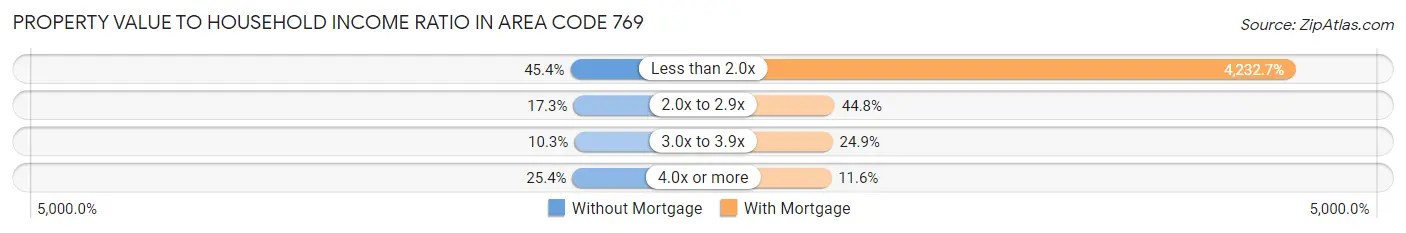
| Value-to-Income Ratio | Without Mortgage | With Mortgage |
| Less than 2.0x | 34,589 (45.4%) | 3,482,460 (4,232.7%) |
| 2.0x to 2.9x | 13,187 (17.3%) | 36,825 (44.8%) |
| 3.0x to 3.9x | 7,818 (10.3%) | 20,520 (24.9%) |
| 4.0x or more | 19,352 (25.4%) | 9,548 (11.6%) |
| Total | 76,196 (100.0%) | 82,275 (100.0%) |
Real Estate Taxes by Mortgage Status in Area Code 769
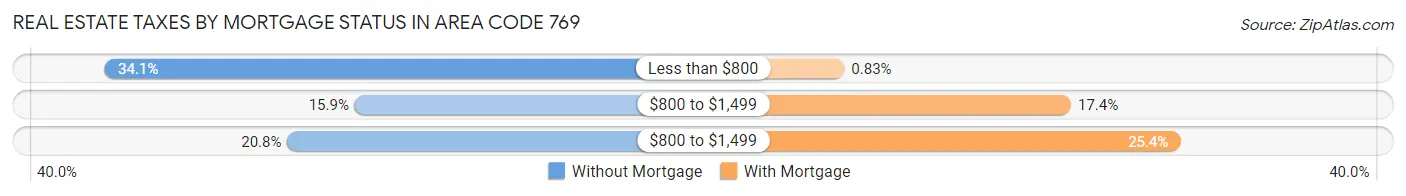
| Property Taxes | Without Mortgage | With Mortgage |
| Less than $800 | 26,001 (34.1%) | 683 (0.8%) |
| $800 to $1,499 | 12,099 (15.9%) | 14,307 (17.4%) |
| $800 to $1,499 | 15,853 (20.8%) | 20,868 (25.4%) |
| Total | 76,196 (100.0%) | 82,275 (100.0%) |
Health & Disability in Area Code 769
Health Insurance Coverage by Age in Area Code 769
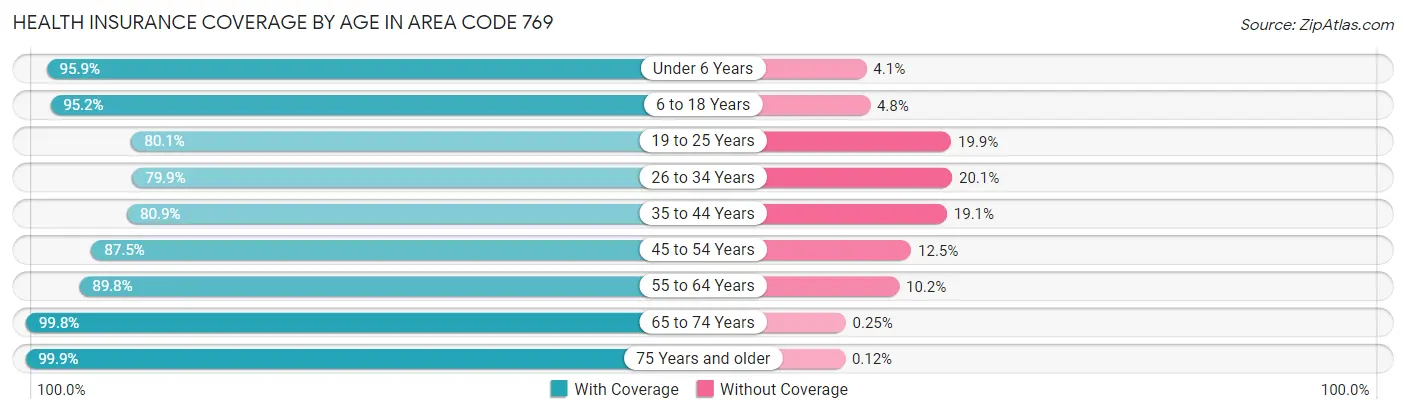
| Age Bracket | With Coverage | Without Coverage |
| Under 6 Years | 40,707 (95.9%) | 1,748 (4.1%) |
| 6 to 18 Years | 96,692 (95.2%) | 4,859 (4.8%) |
| 19 to 25 Years | 42,316 (80.1%) | 10,526 (19.9%) |
| 26 to 34 Years | 50,001 (79.9%) | 12,572 (20.1%) |
| 35 to 44 Years | 58,249 (80.9%) | 13,779 (19.1%) |
| 45 to 54 Years | 60,999 (87.5%) | 8,684 (12.5%) |
| 55 to 64 Years | 66,814 (89.8%) | 7,598 (10.2%) |
| 65 to 74 Years | 54,823 (99.8%) | 137 (0.3%) |
| 75 Years and older | 37,334 (99.9%) | 44 (0.1%) |
| Total | 507,935 (89.4%) | 59,947 (10.6%) |
Health Insurance Coverage by Citizenship Status in Area Code 769
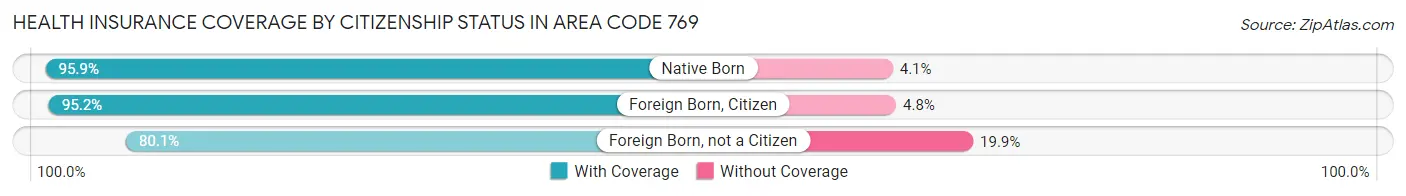
| Citizenship Status | With Coverage | Without Coverage |
| Native Born | 40,707 (95.9%) | 1,748 (4.1%) |
| Foreign Born, Citizen | 96,692 (95.2%) | 4,859 (4.8%) |
| Foreign Born, not a Citizen | 42,316 (80.1%) | 10,526 (19.9%) |
Health Insurance Coverage by Household Income in Area Code 769
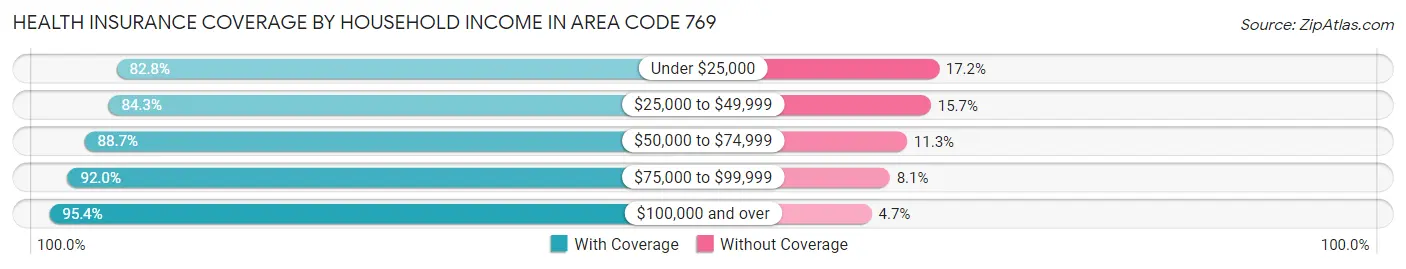
| Household Income | With Coverage | Without Coverage |
| Under $25,000 | 80,685 (82.8%) | 16,802 (17.2%) |
| $25,000 to $49,999 | 92,401 (84.3%) | 17,257 (15.7%) |
| $50,000 to $74,999 | 82,793 (88.7%) | 10,501 (11.3%) |
| $75,000 to $99,999 | 69,008 (91.9%) | 6,039 (8.1%) |
| $100,000 and over | 179,747 (95.4%) | 8,760 (4.6%) |
Public vs Private Health Insurance Coverage by Age in Area Code 769
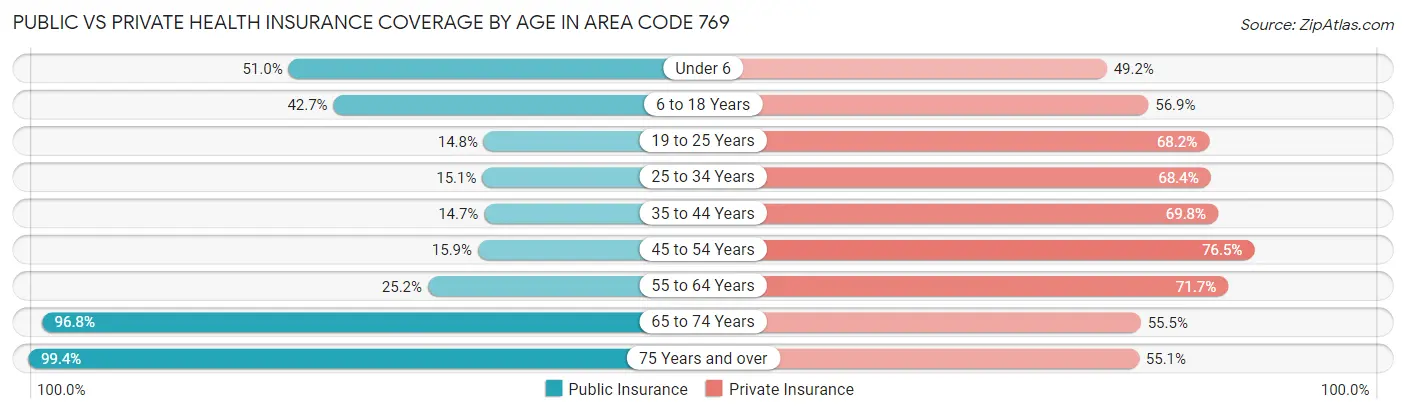
| Age Bracket | Public Insurance | Private Insurance |
| Under 6 | 21,660 (51.0%) | 20,875 (49.2%) |
| 6 to 18 Years | 43,331 (42.7%) | 57,776 (56.9%) |
| 19 to 25 Years | 7,797 (14.8%) | 36,013 (68.1%) |
| 25 to 34 Years | 9,418 (15.0%) | 42,828 (68.4%) |
| 35 to 44 Years | 10,580 (14.7%) | 50,277 (69.8%) |
| 45 to 54 Years | 11,057 (15.9%) | 53,334 (76.5%) |
| 55 to 64 Years | 18,714 (25.2%) | 53,335 (71.7%) |
| 65 to 74 Years | 53,221 (96.8%) | 30,496 (55.5%) |
| 75 Years and over | 37,143 (99.4%) | 20,611 (55.1%) |
| Total | 212,921 (37.5%) | 365,545 (64.4%) |
Disability Status by Sex by Age in Area Code 769
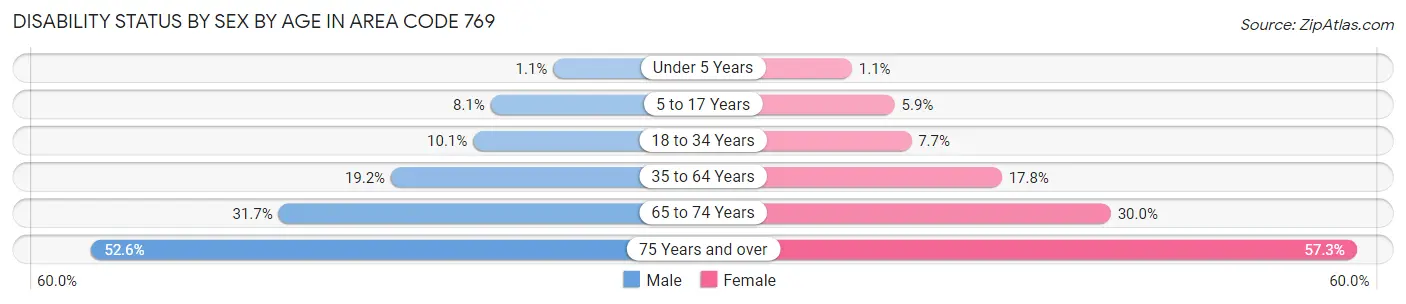
| Age Bracket | Male | Female |
| Under 5 Years | 205 (1.1%) | 195 (1.1%) |
| 5 to 17 Years | 4,079 (8.1%) | 2,947 (5.9%) |
| 18 to 34 Years | 5,863 (10.1%) | 5,024 (7.7%) |
| 35 to 64 Years | 19,699 (19.2%) | 20,217 (17.8%) |
| 65 to 74 Years | 8,084 (31.7%) | 8,828 (29.9%) |
| 75 Years and over | 7,800 (52.6%) | 12,924 (57.3%) |
Disability Class by Sex by Age in Area Code 769
Disability Class: Hearing Difficulty
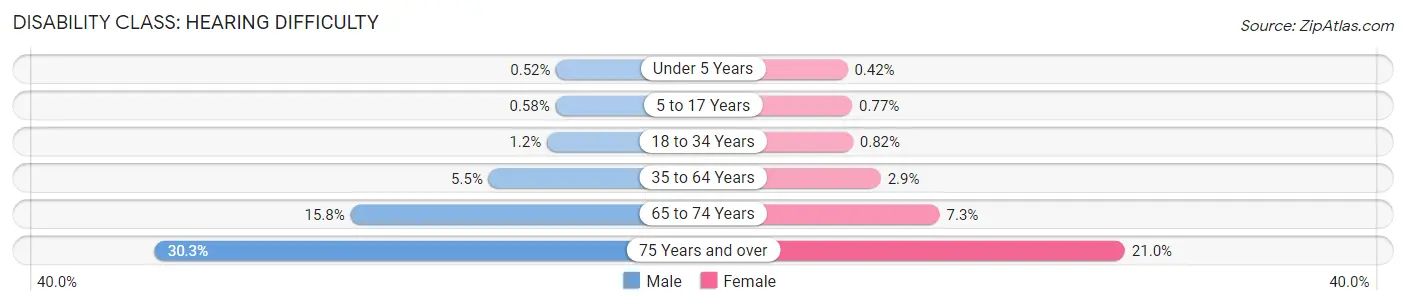
| Age Bracket | Male | Female |
| Under 5 Years | 95 (0.5%) | 74 (0.4%) |
| 5 to 17 Years | 294 (0.6%) | 385 (0.8%) |
| 18 to 34 Years | 708 (1.2%) | 533 (0.8%) |
| 35 to 64 Years | 5,679 (5.5%) | 3,282 (2.9%) |
| 65 to 74 Years | 4,025 (15.8%) | 2,141 (7.3%) |
| 75 Years and over | 4,500 (30.3%) | 4,739 (21.0%) |
Disability Class: Vision Difficulty
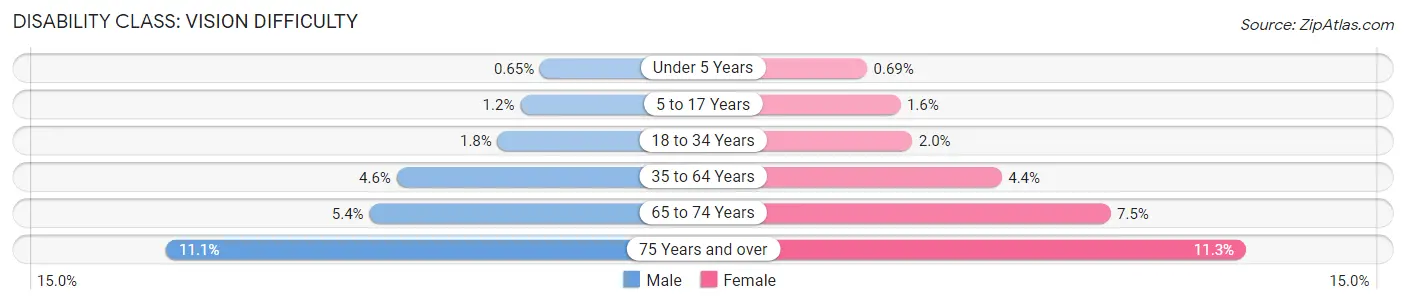
| Age Bracket | Male | Female |
| Under 5 Years | 119 (0.6%) | 121 (0.7%) |
| 5 to 17 Years | 604 (1.2%) | 810 (1.6%) |
| 18 to 34 Years | 1,070 (1.8%) | 1,267 (1.9%) |
| 35 to 64 Years | 4,759 (4.6%) | 5,044 (4.4%) |
| 65 to 74 Years | 1,376 (5.4%) | 2,201 (7.5%) |
| 75 Years and over | 1,641 (11.1%) | 2,535 (11.3%) |
Disability Class: Cognitive Difficulty
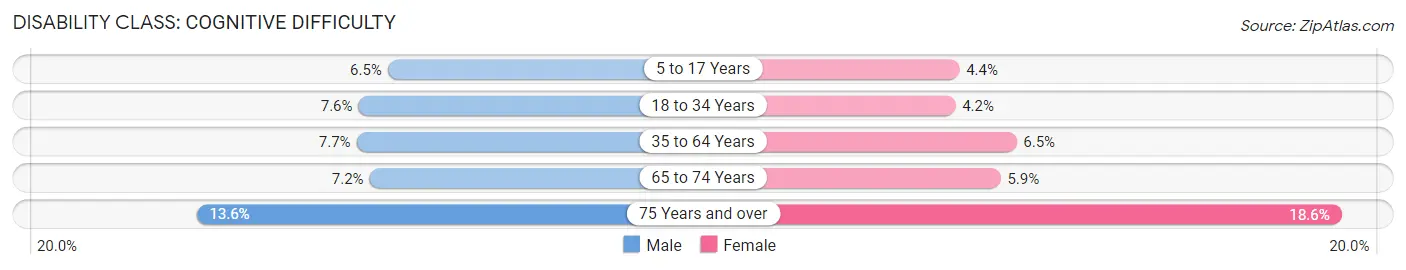
| Age Bracket | Male | Female |
| 5 to 17 Years | 3,284 (6.5%) | 2,183 (4.4%) |
| 18 to 34 Years | 4,439 (7.6%) | 2,737 (4.2%) |
| 35 to 64 Years | 7,883 (7.7%) | 7,361 (6.5%) |
| 65 to 74 Years | 1,834 (7.2%) | 1,737 (5.9%) |
| 75 Years and over | 2,020 (13.6%) | 4,181 (18.5%) |
Disability Class: Ambulatory Difficulty
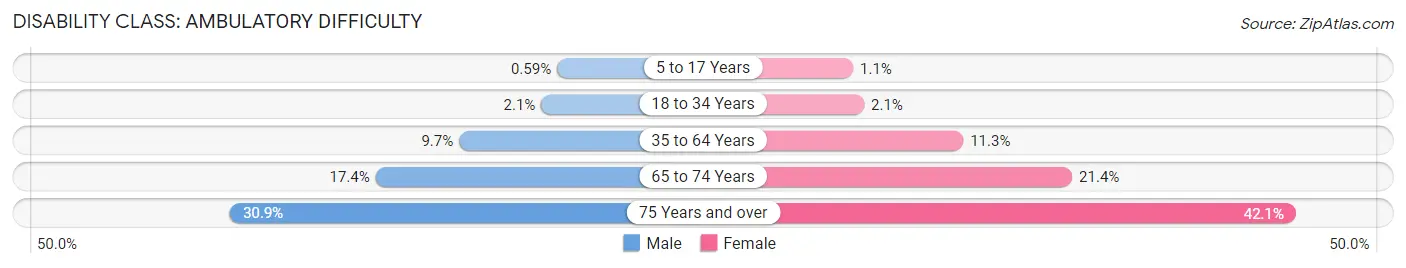
| Age Bracket | Male | Female |
| 5 to 17 Years | 299 (0.6%) | 527 (1.1%) |
| 18 to 34 Years | 1,200 (2.1%) | 1,348 (2.1%) |
| 35 to 64 Years | 9,931 (9.7%) | 12,795 (11.3%) |
| 65 to 74 Years | 4,442 (17.4%) | 6,301 (21.4%) |
| 75 Years and over | 4,591 (30.9%) | 9,496 (42.1%) |
Disability Class: Self-Care Difficulty
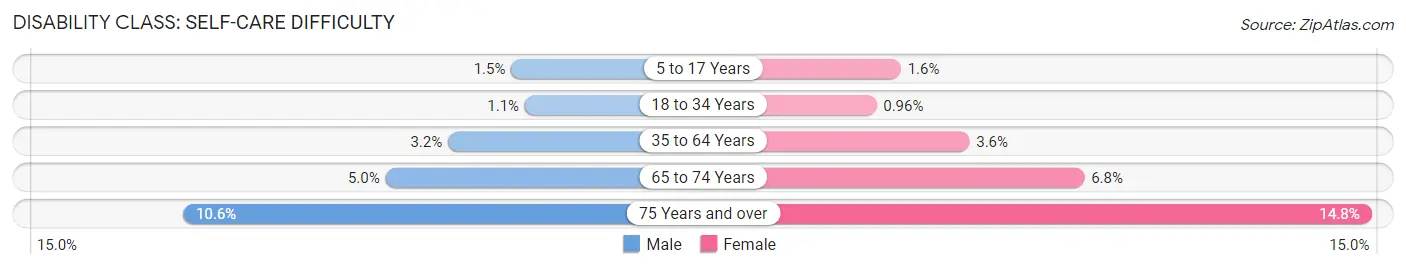
| Age Bracket | Male | Female |
| 5 to 17 Years | 729 (1.5%) | 823 (1.6%) |
| 18 to 34 Years | 623 (1.1%) | 621 (1.0%) |
| 35 to 64 Years | 3,297 (3.2%) | 4,034 (3.5%) |
| 65 to 74 Years | 1,262 (5.0%) | 1,989 (6.8%) |
| 75 Years and over | 1,571 (10.6%) | 3,324 (14.7%) |
Technology Access in Area Code 769
Computing Device Access in Area Code 769
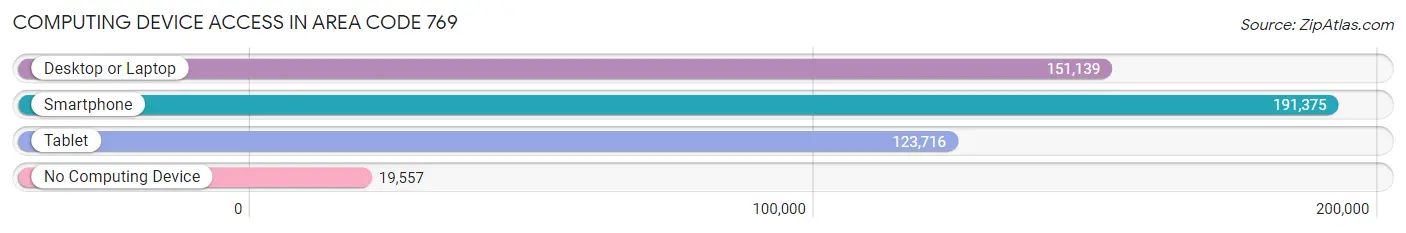
| Device Type | # Households | % Households |
| Desktop or Laptop | 151,139 | 68.5% |
| Smartphone | 191,375 | 86.7% |
| Tablet | 123,716 | 56.0% |
| No Computing Device | 19,557 | 8.9% |
| Total | 220,741 | 100.0% |
Internet Access in Area Code 769
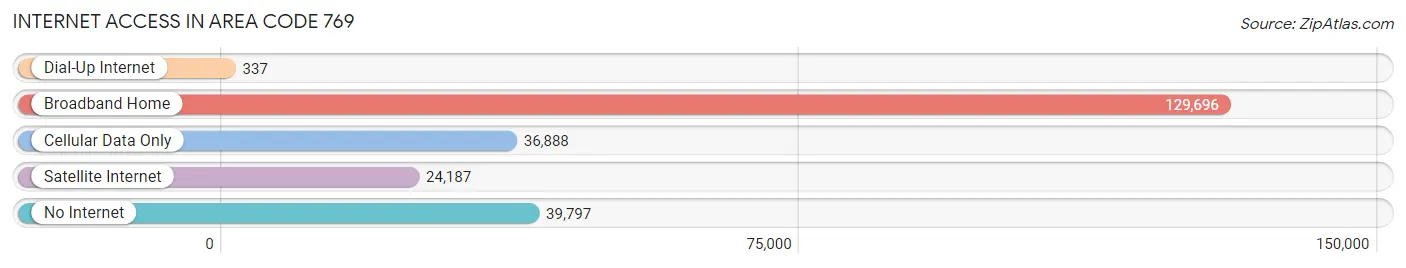
| Internet Type | # Households | % Households |
| Dial-Up Internet | 337 | 0.2% |
| Broadband Home | 129,696 | 58.8% |
| Cellular Data Only | 36,888 | 16.7% |
| Satellite Internet | 24,187 | 11.0% |
| No Internet | 39,797 | 18.0% |
| Total | 220,741 | 100.0% |
Area Code 769 Summary
Geography
Area code 769 is located in the state of Mississippi. It covers the central and southern parts of the state, including the cities of Jackson, Hattiesburg, Meridian, and Natchez.
Social
Area code 769 is home to a diverse population of people from all walks of life. The area is known for its friendly and welcoming atmosphere, and its residents are proud of their southern heritage.
Economics
Area code 769 is home to a thriving economy. The area is home to a number of large businesses, including healthcare, manufacturing, and technology companies. The area also has a strong agricultural sector, with many farms and ranches located in the area.
Demographics
Area code 769 is home to a population of over 1.2 million people. The population is largely made up of African Americans, with a smaller percentage of whites and other ethnicities. The median household income in the area is around $40,000, and the unemployment rate is slightly higher than the national average.
Common Questions
What is Per Capita Income in Area Code 769?
Per Capita income in Area Code 769 is $28,040.
What is the Median Family Income in Area Code 769?
Median Family Income in Area Code 769 is $67,326.
What is the Median Household income in Area Code 769?
Median Household Income in Area Code 769 is $52,284.
What is Income or Wage Gap in Area Code 769?
Income or Wage Gap in Area Code 769 is 31.3%.
Women in Area Code 769 earn 68.7 cents for every dollar earned by a man.
What is Family Income Deficit in Area Code 769?
Family Income Deficit in Area Code 769 is $11,356.
Families that are below poverty line in Area Code 769 earn $11,356 less on average than the poverty threshold level.
What is Inequality or Gini Index in Area Code 769?
Inequality or Gini Index in Area Code 769 is 21.40.
What is the Total Population of Area Code 769?
Total Population of Area Code 769 is 582,094.
What is the Total Male Population of Area Code 769?
Total Male Population of Area Code 769 is 281,090.
What is the Total Female Population of Area Code 769?
Total Female Population of Area Code 769 is 301,004.
What is the Ratio of Males per 100 Females in Area Code 769?
There are 93.38 Males per 100 Females in Area Code 769.
What is the Ratio of Females per 100 Males in Area Code 769?
There are 107.08 Females per 100 Males in Area Code 769.
What is the Median Population Age in Area Code 769?
Median Population Age in Area Code 769 is 40.5 Years.
What is the Average Family Size in Area Code 769
Average Family Size in Area Code 769 is 3.2 People.
What is the Average Household Size in Area Code 769
Average Household Size in Area Code 769 is 2.5 People.
How Large is the Labor Force in Area Code 769?
There are 251,773 People in the Labor Forcein in Area Code 769.
What is the Percentage of People in the Labor Force in Area Code 769?
54.5% of People are in the Labor Force in Area Code 769.
What is the Unemployment Rate in Area Code 769?
Unemployment Rate in Area Code 769 is 6.2%.