Columbus, MS Map & Demographics
Columbus Map
Columbus Overview
$26,874
PER CAPITA INCOME
$55,016
AVG FAMILY INCOME
$38,954
AVG HOUSEHOLD INCOME
19.9%
WAGE / INCOME GAP [ % ]
80.1¢/ $1
WAGE / INCOME GAP [ $ ]
$13,369
FAMILY INCOME DEFICIT
0.53
INEQUALITY / GINI INDEX
23,896
TOTAL POPULATION
11,011
MALE POPULATION
12,885
FEMALE POPULATION
85.46
MALES / 100 FEMALES
117.02
FEMALES / 100 MALES
38.5
MEDIAN AGE
3.2
AVG FAMILY SIZE
2.3
AVG HOUSEHOLD SIZE
10,404
LABOR FORCE [ PEOPLE ]
53.2%
PERCENT IN LABOR FORCE
9.8%
UNEMPLOYMENT RATE
Columbus Area Codes
Income in Columbus
Income Overview in Columbus
Per Capita Income in Columbus is $26,874, while median incomes of families and households are $55,016 and $38,954 respectively.
| Characteristic | Number | Measure |
| Per Capita Income | 23,896 | $26,874 |
| Median Family Income | 4,943 | $55,016 |
| Mean Family Income | 4,943 | $80,730 |
| Median Household Income | 9,865 | $38,954 |
| Mean Household Income | 9,865 | $59,984 |
| Income Deficit | 4,943 | $13,369 |
| Wage / Income Gap (%) | 23,896 | 19.94% |
| Wage / Income Gap ($) | 23,896 | 80.06¢ per $1 |
| Gini / Inequality Index | 23,896 | 0.53 |
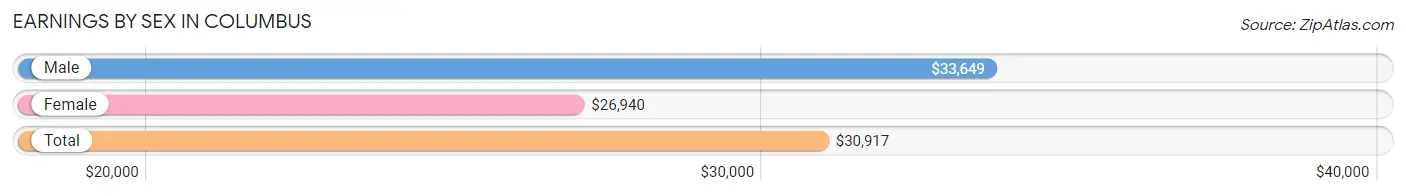
Earnings by Sex in Columbus
Average Earnings in Columbus are $30,917, $33,649 for men and $26,940 for women, a difference of 19.9%.
| Sex | Number | Average Earnings |
| Male | 5,058 (48.4%) | $33,649 |
| Female | 5,383 (51.6%) | $26,940 |
| Total | 10,441 (100.0%) | $30,917 |
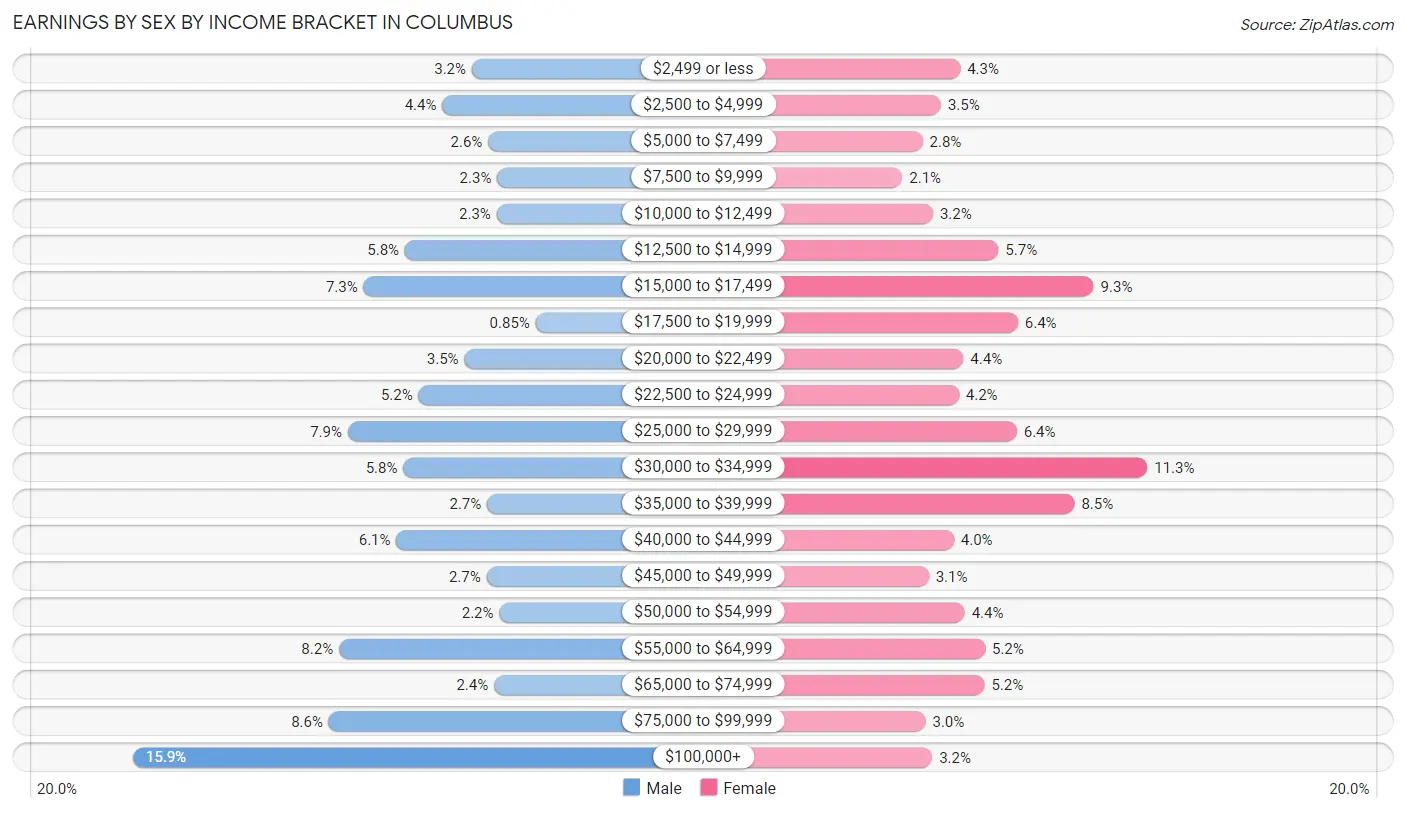
Earnings by Sex by Income Bracket in Columbus
The most common earnings brackets in Columbus are $100,000+ for men (806 | 15.9%) and $30,000 to $34,999 for women (606 | 11.3%).
| Income | Male | Female |
| $2,499 or less | 164 (3.2%) | 229 (4.3%) |
| $2,500 to $4,999 | 220 (4.3%) | 190 (3.5%) |
| $5,000 to $7,499 | 133 (2.6%) | 153 (2.8%) |
| $7,500 to $9,999 | 116 (2.3%) | 112 (2.1%) |
| $10,000 to $12,499 | 117 (2.3%) | 174 (3.2%) |
| $12,500 to $14,999 | 291 (5.8%) | 306 (5.7%) |
| $15,000 to $17,499 | 369 (7.3%) | 498 (9.2%) |
| $17,500 to $19,999 | 43 (0.9%) | 345 (6.4%) |
| $20,000 to $22,499 | 178 (3.5%) | 235 (4.4%) |
| $22,500 to $24,999 | 265 (5.2%) | 226 (4.2%) |
| $25,000 to $29,999 | 399 (7.9%) | 343 (6.4%) |
| $30,000 to $34,999 | 294 (5.8%) | 606 (11.3%) |
| $35,000 to $39,999 | 135 (2.7%) | 459 (8.5%) |
| $40,000 to $44,999 | 307 (6.1%) | 216 (4.0%) |
| $45,000 to $49,999 | 136 (2.7%) | 165 (3.1%) |
| $50,000 to $54,999 | 112 (2.2%) | 238 (4.4%) |
| $55,000 to $64,999 | 416 (8.2%) | 279 (5.2%) |
| $65,000 to $74,999 | 122 (2.4%) | 278 (5.2%) |
| $75,000 to $99,999 | 435 (8.6%) | 159 (2.9%) |
| $100,000+ | 806 (15.9%) | 172 (3.2%) |
| Total | 5,058 (100.0%) | 5,383 (100.0%) |
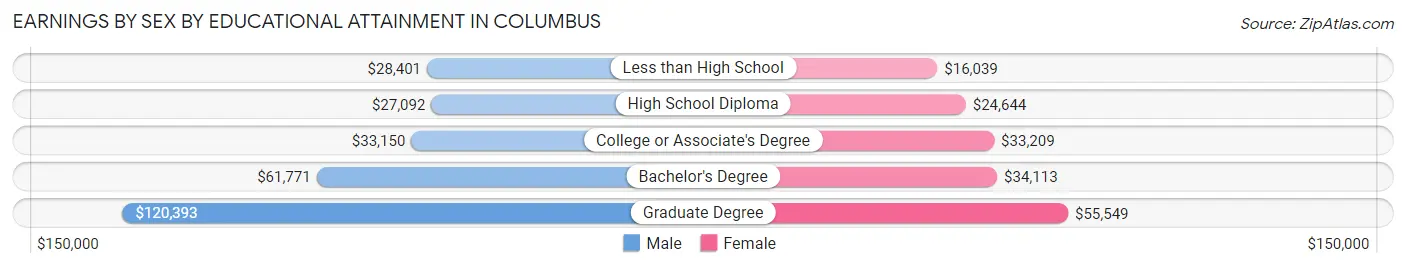
Earnings by Sex by Educational Attainment in Columbus
Average earnings in Columbus are $38,375 for men and $33,129 for women, a difference of 13.7%. Men with an educational attainment of graduate degree enjoy the highest average annual earnings of $120,393, while those with high school diploma education earn the least with $27,092. Women with an educational attainment of graduate degree earn the most with the average annual earnings of $55,549, while those with less than high school education have the smallest earnings of $16,039.
| Educational Attainment | Male Income | Female Income |
| Less than High School | $28,401 | $16,039 |
| High School Diploma | $27,092 | $24,644 |
| College or Associate's Degree | $33,150 | $33,209 |
| Bachelor's Degree | $61,771 | $34,113 |
| Graduate Degree | $120,393 | $55,549 |
| Total | $38,375 | $33,129 |
Family Income in Columbus
Family Income Brackets in Columbus
According to the Columbus family income data, there are 1,023 families falling into the $50,000 to $74,999 income range, which is the most common income bracket and makes up 20.7% of all families. Conversely, the $150,000 to $199,999 income bracket is the least frequent group with only 203 families (4.1%) belonging to this category.
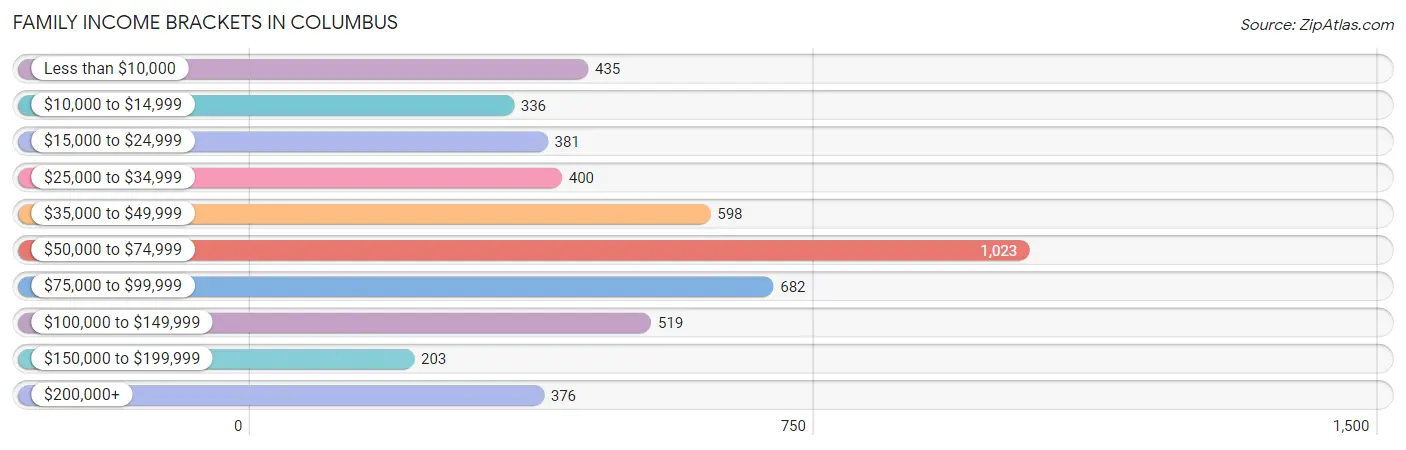
| Income Bracket | # Families | % Families |
| Less than $10,000 | 435 | 8.8% |
| $10,000 to $14,999 | 336 | 6.8% |
| $15,000 to $24,999 | 381 | 7.7% |
| $25,000 to $34,999 | 400 | 8.1% |
| $35,000 to $49,999 | 598 | 12.1% |
| $50,000 to $74,999 | 1,023 | 20.7% |
| $75,000 to $99,999 | 682 | 13.8% |
| $100,000 to $149,999 | 519 | 10.5% |
| $150,000 to $199,999 | 203 | 4.1% |
| $200,000+ | 376 | 7.6% |
Family Income by Famaliy Size in Columbus
6-person families (185 | 3.7%) account for the highest median family income in Columbus with $68,369 per family, while 2-person families (2,623 | 53.1%) have the highest median income of $28,438 per family member.
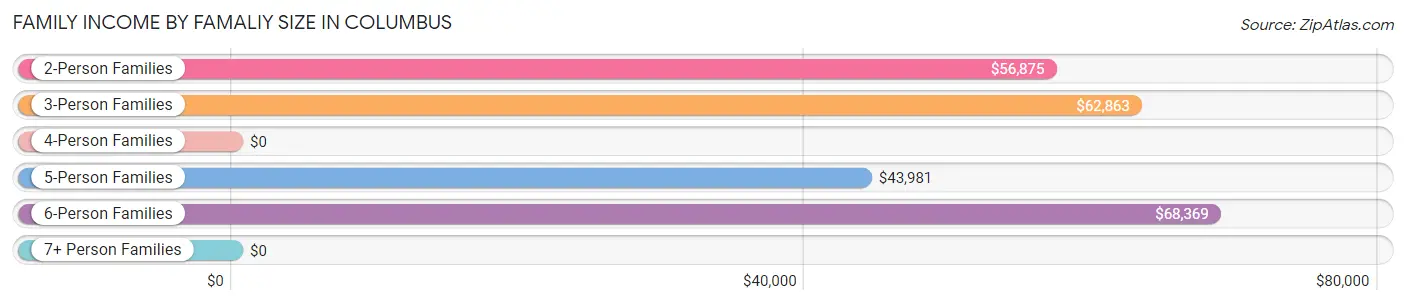
| Income Bracket | # Families | Median Income |
| 2-Person Families | 2,623 (53.1%) | $56,875 |
| 3-Person Families | 1,161 (23.5%) | $62,863 |
| 4-Person Families | 620 (12.5%) | $0 |
| 5-Person Families | 323 (6.5%) | $43,981 |
| 6-Person Families | 185 (3.7%) | $68,369 |
| 7+ Person Families | 31 (0.6%) | $0 |
| Total | 4,943 (100.0%) | $55,016 |
Family Income by Number of Earners in Columbus
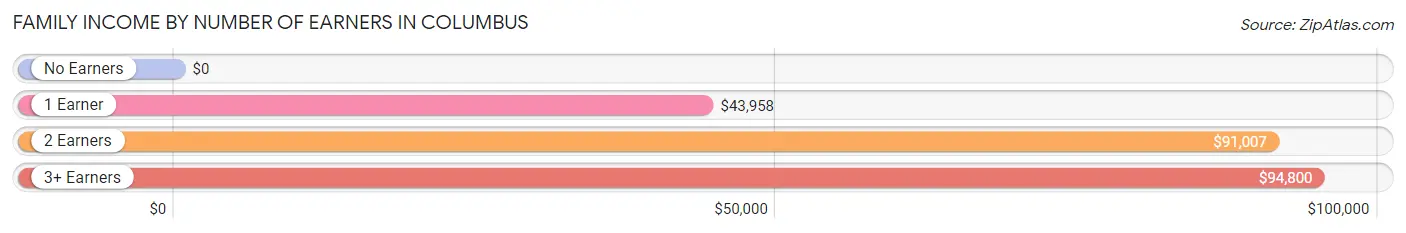
| Number of Earners | # Families | Median Income |
| No Earners | 1,112 (22.5%) | $0 |
| 1 Earner | 2,143 (43.3%) | $43,958 |
| 2 Earners | 1,508 (30.5%) | $91,007 |
| 3+ Earners | 180 (3.6%) | $94,800 |
| Total | 4,943 (100.0%) | $55,016 |
Household Income in Columbus
Household Income Brackets in Columbus
With 1,707 households falling in the category, the $50,000 to $74,999 income range is the most frequent in Columbus, accounting for 17.3% of all households. In contrast, only 326 households (3.3%) fall into the $150,000 to $199,999 income bracket, making it the least populous group.
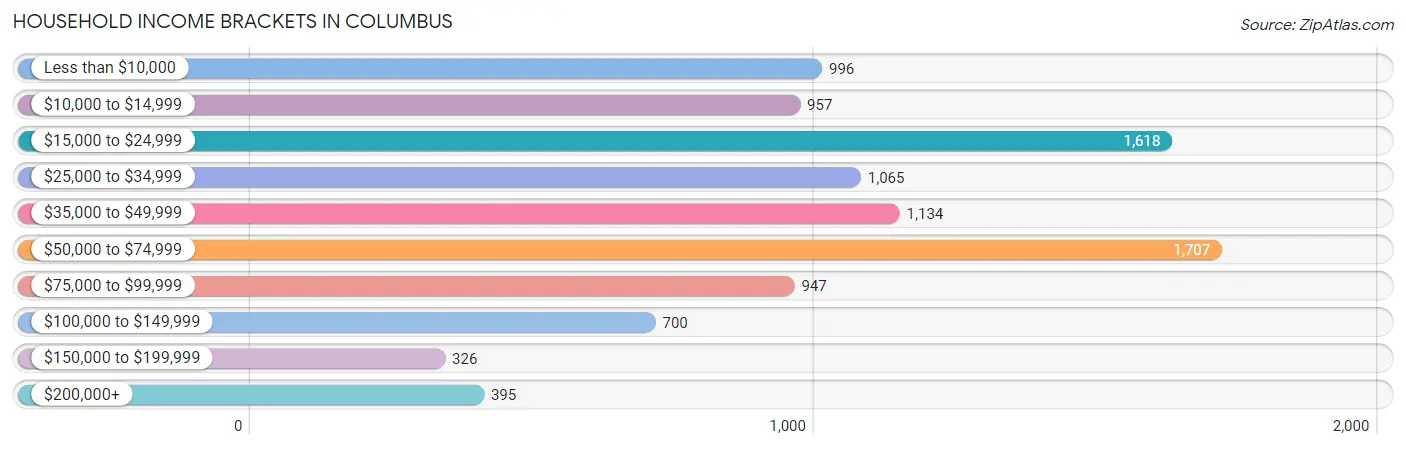
| Income Bracket | # Households | % Households |
| Less than $10,000 | 996 | 10.1% |
| $10,000 to $14,999 | 957 | 9.7% |
| $15,000 to $24,999 | 1,618 | 16.4% |
| $25,000 to $34,999 | 1,065 | 10.8% |
| $35,000 to $49,999 | 1,134 | 11.5% |
| $50,000 to $74,999 | 1,707 | 17.3% |
| $75,000 to $99,999 | 947 | 9.6% |
| $100,000 to $149,999 | 700 | 7.1% |
| $150,000 to $199,999 | 326 | 3.3% |
| $200,000+ | 395 | 4.0% |
Household Income by Householder Age in Columbus
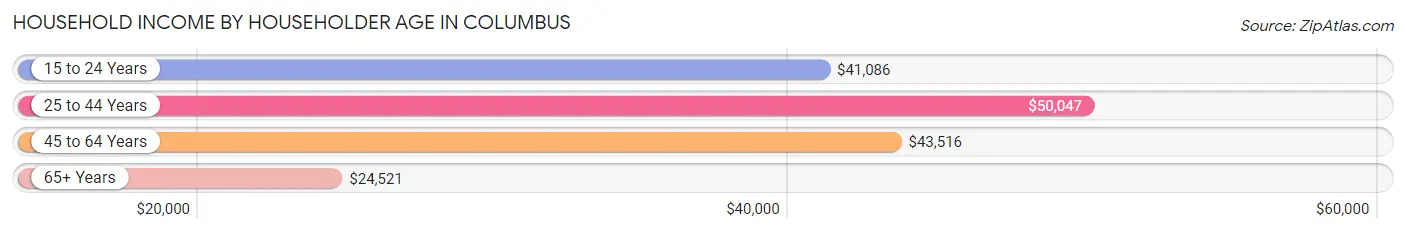
The median household income in Columbus is $38,954, with the highest median household income of $50,047 found in the 25 to 44 years age bracket for the primary householder. A total of 2,824 households (28.6%) fall into this category. Meanwhile, the 65+ years age bracket for the primary householder has the lowest median household income of $24,521, with 3,030 households (30.7%) in this group.
| Income Bracket | # Households | Median Income |
| 15 to 24 Years | 401 (4.1%) | $41,086 |
| 25 to 44 Years | 2,824 (28.6%) | $50,047 |
| 45 to 64 Years | 3,610 (36.6%) | $43,516 |
| 65+ Years | 3,030 (30.7%) | $24,521 |
| Total | 9,865 (100.0%) | $38,954 |
Poverty in Columbus
Income Below Poverty by Sex and Age in Columbus
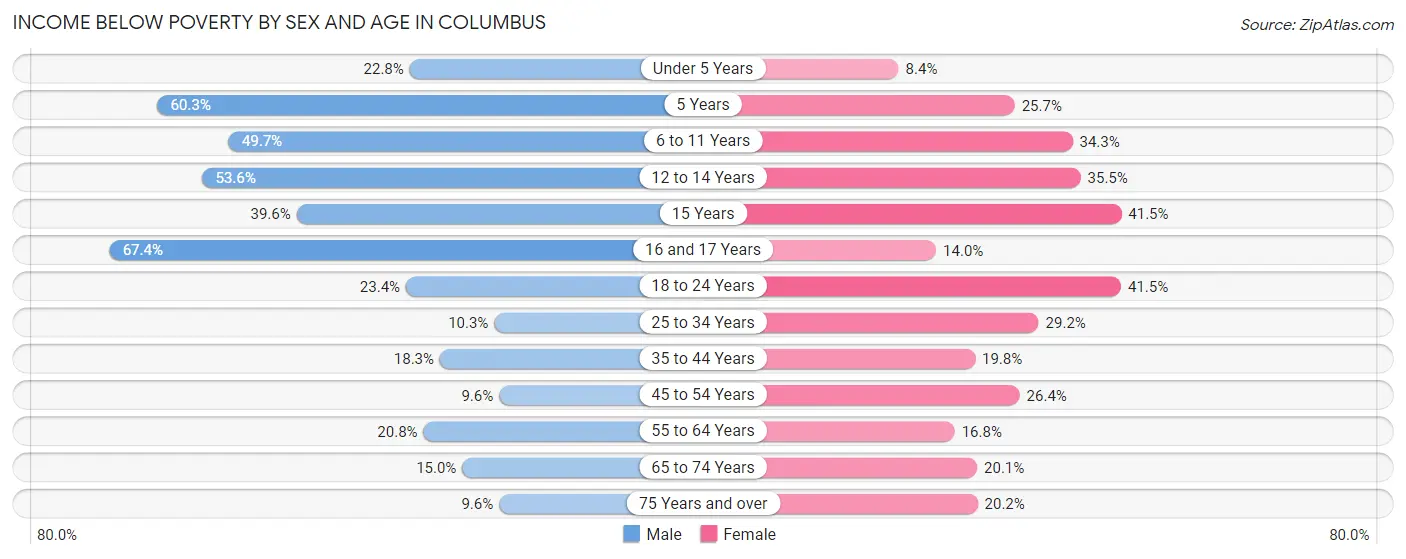
With 22.3% poverty level for males and 24.7% for females among the residents of Columbus, 16 and 17 year old males and 15 year old females are the most vulnerable to poverty, with 163 males (67.4%) and 22 females (41.5%) in their respective age groups living below the poverty level.
| Age Bracket | Male | Female |
| Under 5 Years | 116 (22.8%) | 52 (8.4%) |
| 5 Years | 94 (60.3%) | 19 (25.7%) |
| 6 to 11 Years | 370 (49.7%) | 283 (34.3%) |
| 12 to 14 Years | 277 (53.6%) | 161 (35.5%) |
| 15 Years | 42 (39.6%) | 22 (41.5%) |
| 16 and 17 Years | 163 (67.4%) | 22 (14.0%) |
| 18 to 24 Years | 270 (23.4%) | 479 (41.5%) |
| 25 to 34 Years | 162 (10.3%) | 554 (29.2%) |
| 35 to 44 Years | 170 (18.3%) | 218 (19.8%) |
| 45 to 54 Years | 120 (9.6%) | 309 (26.4%) |
| 55 to 64 Years | 297 (20.8%) | 311 (16.8%) |
| 65 to 74 Years | 157 (15.0%) | 254 (20.1%) |
| 75 Years and over | 61 (9.6%) | 257 (20.2%) |
| Total | 2,299 (22.3%) | 2,941 (24.7%) |
Income Above Poverty by Sex and Age in Columbus
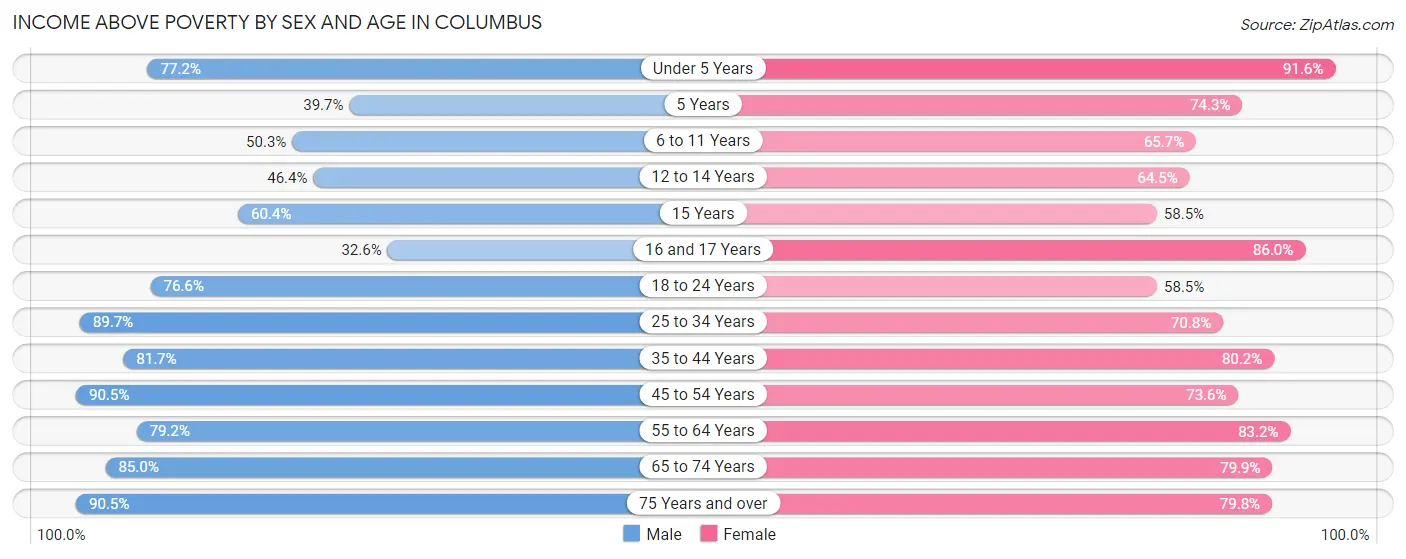
According to the poverty statistics in Columbus, males aged 45 to 54 years and females aged under 5 years are the age groups that are most secure financially, with 90.4% of males and 91.6% of females in these age groups living above the poverty line.
| Age Bracket | Male | Female |
| Under 5 Years | 392 (77.2%) | 564 (91.6%) |
| 5 Years | 62 (39.7%) | 55 (74.3%) |
| 6 to 11 Years | 375 (50.3%) | 543 (65.7%) |
| 12 to 14 Years | 240 (46.4%) | 293 (64.5%) |
| 15 Years | 64 (60.4%) | 31 (58.5%) |
| 16 and 17 Years | 79 (32.6%) | 135 (86.0%) |
| 18 to 24 Years | 885 (76.6%) | 676 (58.5%) |
| 25 to 34 Years | 1,416 (89.7%) | 1,341 (70.8%) |
| 35 to 44 Years | 757 (81.7%) | 884 (80.2%) |
| 45 to 54 Years | 1,136 (90.4%) | 861 (73.6%) |
| 55 to 64 Years | 1,132 (79.2%) | 1,543 (83.2%) |
| 65 to 74 Years | 888 (85.0%) | 1,010 (79.9%) |
| 75 Years and over | 578 (90.4%) | 1,017 (79.8%) |
| Total | 8,004 (77.7%) | 8,953 (75.3%) |
Income Below Poverty Among Married-Couple Families in Columbus
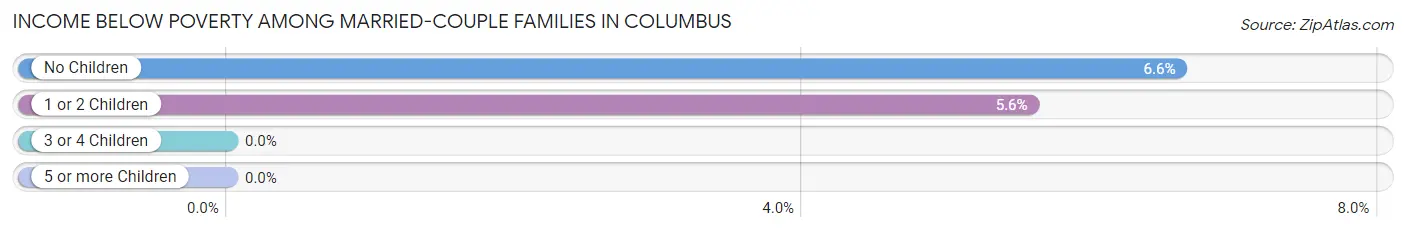
The poverty statistics for married-couple families in Columbus show that 6.2% or 164 of the total 2,650 families live below the poverty line. Families with no children have the highest poverty rate of 6.6%, comprising of 132 families. On the other hand, families with 3 or 4 children have the lowest poverty rate of 0.0%, which includes 0 families.
| Children | Above Poverty | Below Poverty |
| No Children | 1,865 (93.4%) | 132 (6.6%) |
| 1 or 2 Children | 541 (94.4%) | 32 (5.6%) |
| 3 or 4 Children | 80 (100.0%) | 0 (0.0%) |
| 5 or more Children | 0 (0.0%) | 0 (0.0%) |
| Total | 2,486 (93.8%) | 164 (6.2%) |
Income Below Poverty Among Single-Parent Households in Columbus
According to the poverty data in Columbus, 18.1% or 44 single-father households and 44.3% or 909 single-mother households are living below the poverty line. Among single-father households, those with 5 or more children have the highest poverty rate, with 12 households (100.0%) experiencing poverty. Likewise, among single-mother households, those with 3 or 4 children have the highest poverty rate, with 298 households (83.2%) falling below the poverty line.
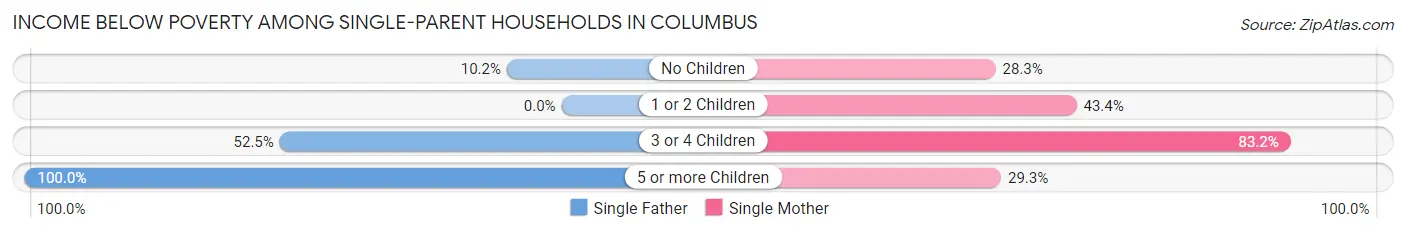
| Children | Single Father | Single Mother |
| No Children | 11 (10.2%) | 200 (28.3%) |
| 1 or 2 Children | 0 (0.0%) | 377 (43.4%) |
| 3 or 4 Children | 21 (52.5%) | 298 (83.2%) |
| 5 or more Children | 12 (100.0%) | 34 (29.3%) |
| Total | 44 (18.1%) | 909 (44.3%) |
Income Below Poverty Among Married-Couple vs Single-Parent Households in Columbus
The poverty data for Columbus shows that 164 of the married-couple family households (6.2%) and 953 of the single-parent households (41.6%) are living below the poverty level. Within the married-couple family households, those with no children have the highest poverty rate, with 132 households (6.6%) falling below the poverty line. Among the single-parent households, those with 3 or 4 children have the highest poverty rate, with 319 household (80.1%) living below poverty.
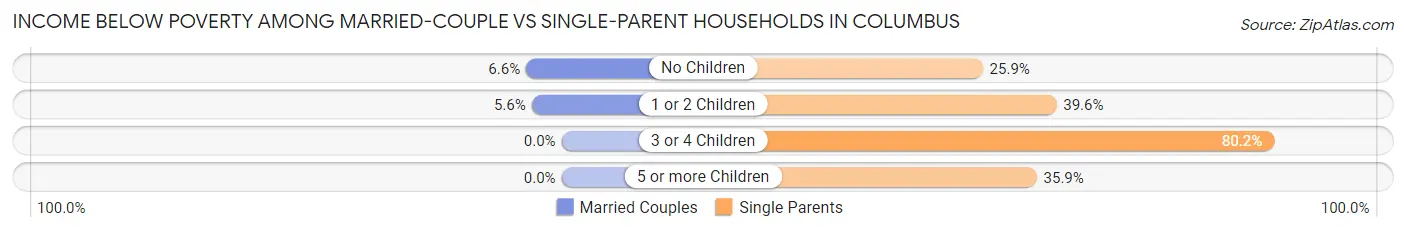
| Children | Married-Couple Families | Single-Parent Households |
| No Children | 132 (6.6%) | 211 (25.9%) |
| 1 or 2 Children | 32 (5.6%) | 377 (39.6%) |
| 3 or 4 Children | 0 (0.0%) | 319 (80.1%) |
| 5 or more Children | 0 (0.0%) | 46 (35.9%) |
| Total | 164 (6.2%) | 953 (41.6%) |
Race in Columbus
The most populous races in Columbus are Black / African American (15,262 | 63.9%), White / Caucasian (7,457 | 31.2%), and Two or more Races (554 | 2.3%).
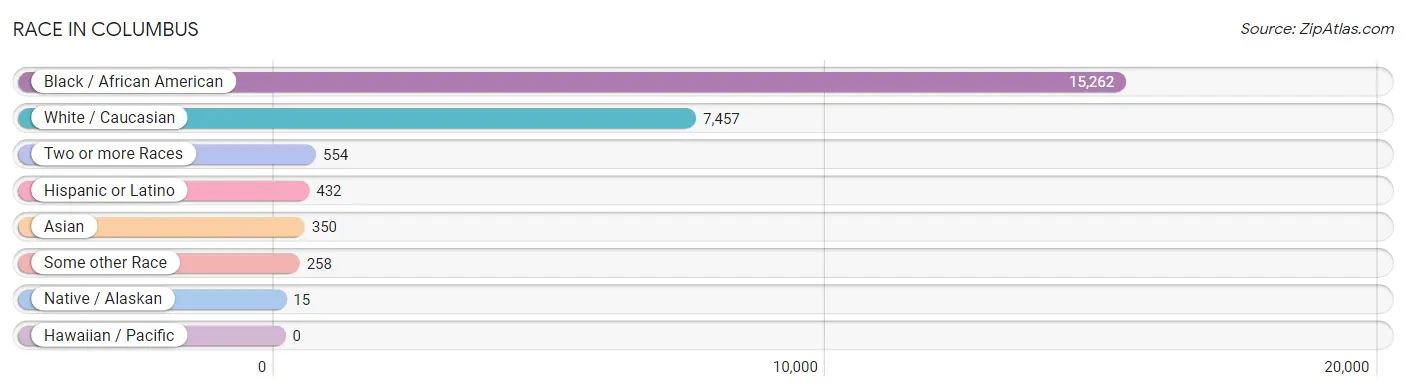
| Race | # Population | % Population |
| Asian | 350 | 1.5% |
| Black / African American | 15,262 | 63.9% |
| Hawaiian / Pacific | 0 | 0.0% |
| Hispanic or Latino | 432 | 1.8% |
| Native / Alaskan | 15 | 0.1% |
| White / Caucasian | 7,457 | 31.2% |
| Two or more Races | 554 | 2.3% |
| Some other Race | 258 | 1.1% |
| Total | 23,896 | 100.0% |
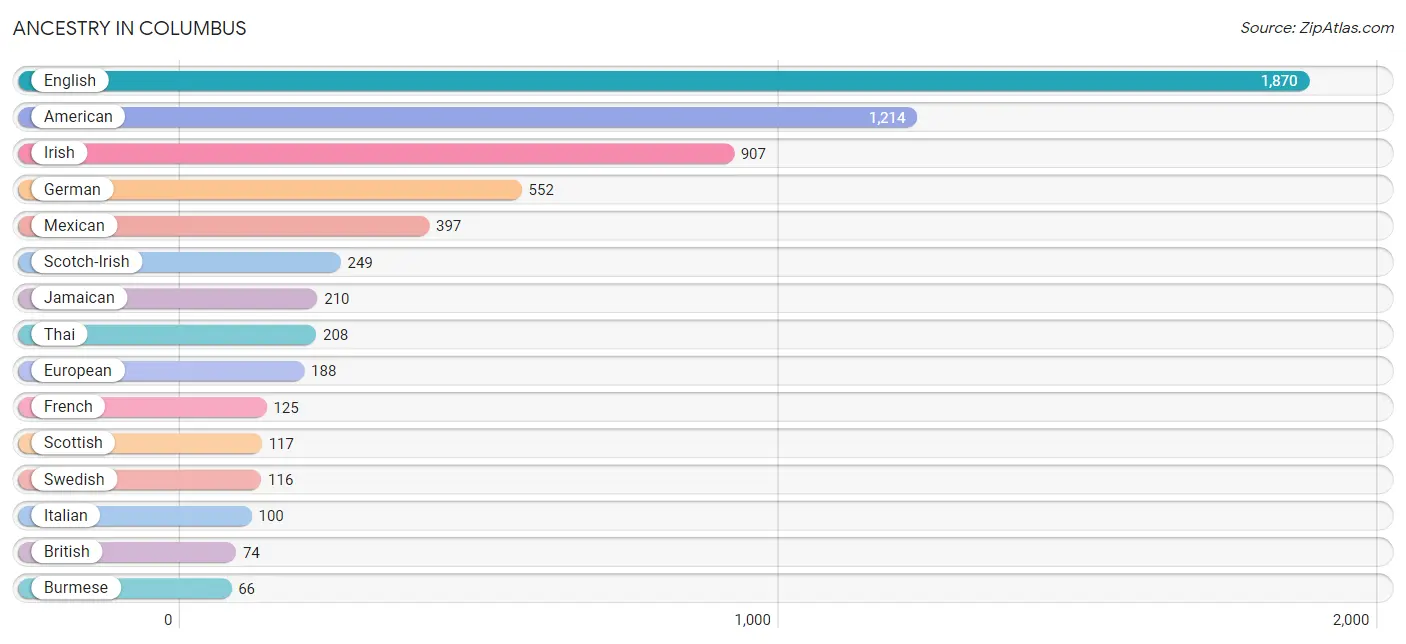
Ancestry in Columbus
The most populous ancestries reported in Columbus are English (1,870 | 7.8%), American (1,214 | 5.1%), Irish (907 | 3.8%), German (552 | 2.3%), and Mexican (397 | 1.7%), together accounting for 20.7% of all Columbus residents.
| Ancestry | # Population | % Population |
| African | 13 | 0.1% |
| American | 1,214 | 5.1% |
| Arab | 15 | 0.1% |
| Argentinean | 35 | 0.2% |
| Australian | 5 | 0.0% |
| Brazilian | 11 | 0.1% |
| British | 74 | 0.3% |
| Burmese | 66 | 0.3% |
| Cherokee | 20 | 0.1% |
| Choctaw | 2 | 0.0% |
| Croatian | 2 | 0.0% |
| Czech | 63 | 0.3% |
| Danish | 58 | 0.2% |
| Dutch | 62 | 0.3% |
| English | 1,870 | 7.8% |
| European | 188 | 0.8% |
| French | 125 | 0.5% |
| French Canadian | 12 | 0.1% |
| German | 552 | 2.3% |
| Greek | 15 | 0.1% |
| Indian (Asian) | 34 | 0.1% |
| Irish | 907 | 3.8% |
| Italian | 100 | 0.4% |
| Jamaican | 210 | 0.9% |
| Korean | 29 | 0.1% |
| Mexican | 397 | 1.7% |
| Nigerian | 30 | 0.1% |
| Norwegian | 43 | 0.2% |
| Polish | 23 | 0.1% |
| Russian | 6 | 0.0% |
| Scandinavian | 12 | 0.1% |
| Scotch-Irish | 249 | 1.0% |
| Scottish | 117 | 0.5% |
| Seminole | 4 | 0.0% |
| South American | 35 | 0.2% |
| Sri Lankan | 21 | 0.1% |
| Subsaharan African | 43 | 0.2% |
| Swedish | 116 | 0.5% |
| Syrian | 15 | 0.1% |
| Thai | 208 | 0.9% |
| Welsh | 15 | 0.1% | View All 41 Rows |
Immigrants in Columbus
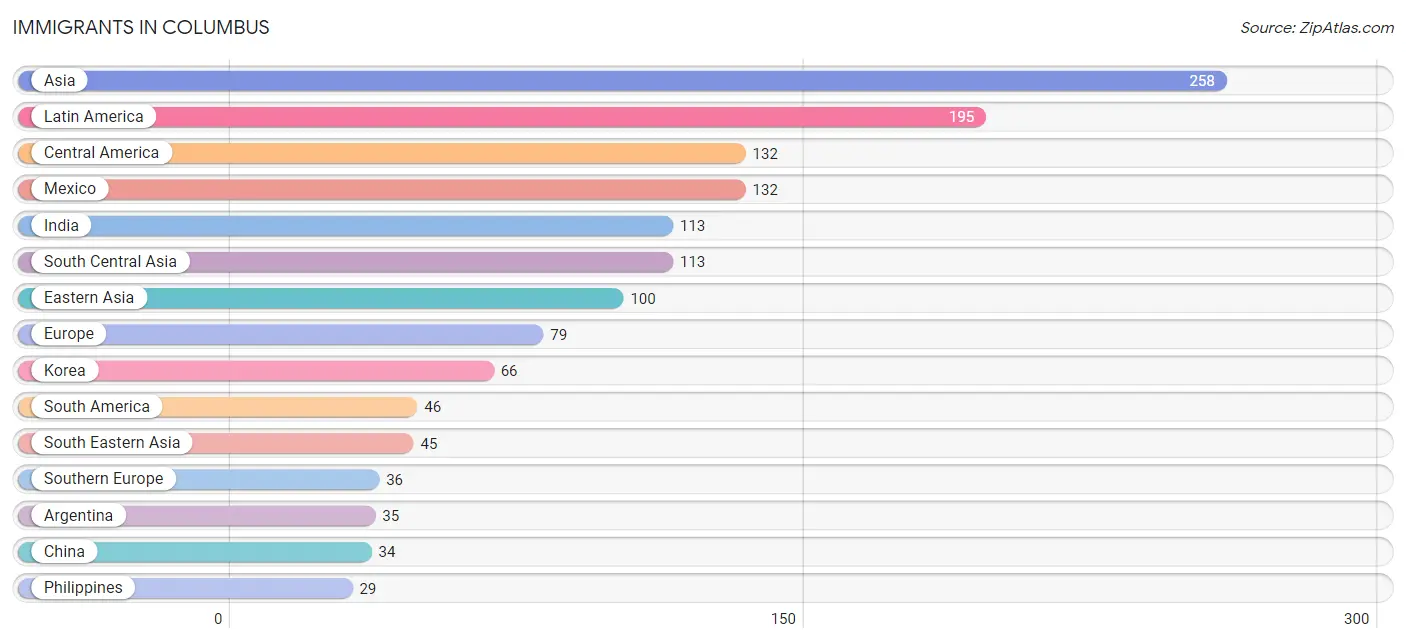
The most numerous immigrant groups reported in Columbus came from Asia (258 | 1.1%), Latin America (195 | 0.8%), Central America (132 | 0.5%), Mexico (132 | 0.5%), and India (113 | 0.5%), together accounting for 3.5% of all Columbus residents.
| Immigration Origin | # Population | % Population |
| Argentina | 35 | 0.2% |
| Asia | 258 | 1.1% |
| Brazil | 11 | 0.1% |
| Canada | 8 | 0.0% |
| Caribbean | 17 | 0.1% |
| Central America | 132 | 0.5% |
| China | 34 | 0.1% |
| Eastern Asia | 100 | 0.4% |
| Eastern Europe | 6 | 0.0% |
| Europe | 79 | 0.3% |
| France | 14 | 0.1% |
| Greece | 9 | 0.0% |
| Haiti | 5 | 0.0% |
| Hong Kong | 17 | 0.1% |
| India | 113 | 0.5% |
| Italy | 27 | 0.1% |
| Jamaica | 12 | 0.1% |
| Korea | 66 | 0.3% |
| Latin America | 195 | 0.8% |
| Mexico | 132 | 0.5% |
| Northern Europe | 23 | 0.1% |
| Philippines | 29 | 0.1% |
| Russia | 6 | 0.0% |
| South America | 46 | 0.2% |
| South Central Asia | 113 | 0.5% |
| South Eastern Asia | 45 | 0.2% |
| Southern Europe | 36 | 0.2% |
| Vietnam | 16 | 0.1% |
| Western Europe | 14 | 0.1% | View All 29 Rows |
Sex and Age in Columbus
Sex and Age in Columbus
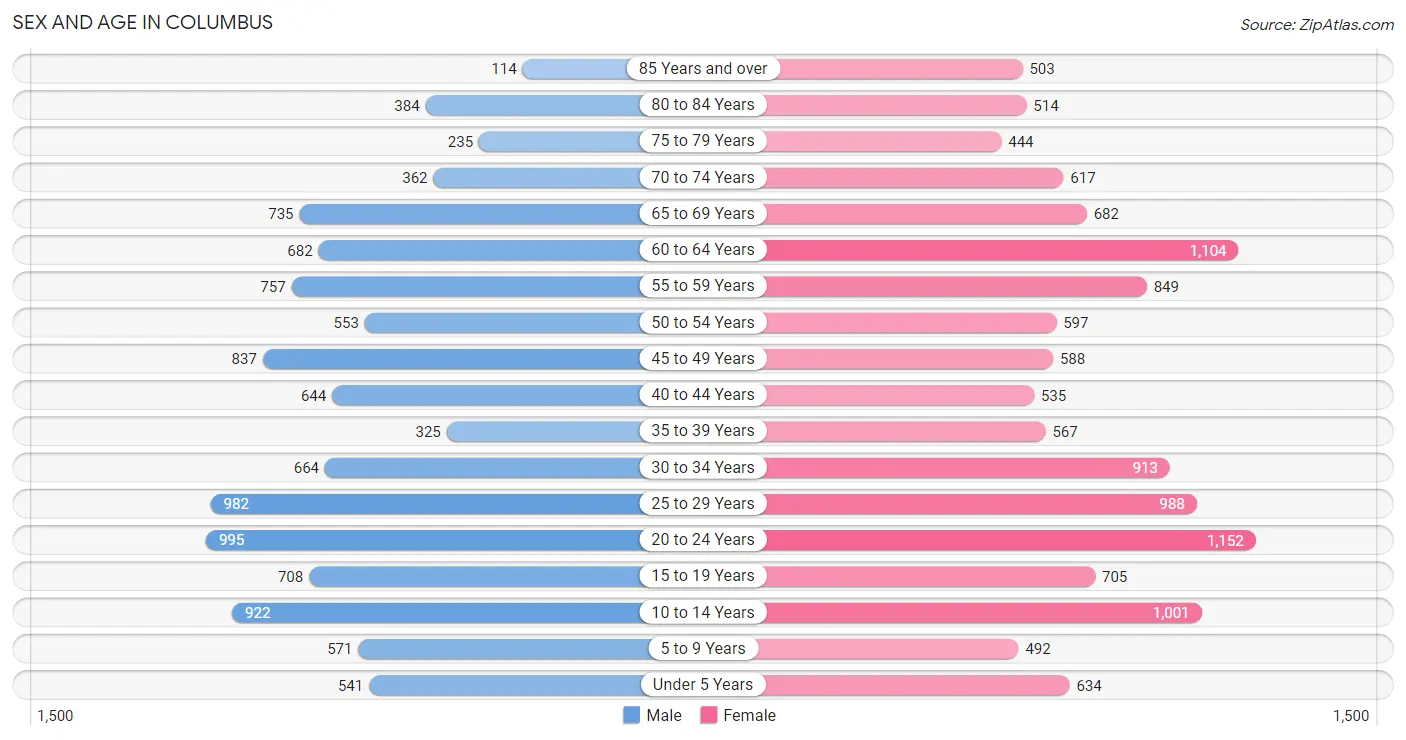
The most populous age groups in Columbus are 20 to 24 Years (995 | 9.0%) for men and 20 to 24 Years (1,152 | 8.9%) for women.
| Age Bracket | Male | Female |
| Under 5 Years | 541 (4.9%) | 634 (4.9%) |
| 5 to 9 Years | 571 (5.2%) | 492 (3.8%) |
| 10 to 14 Years | 922 (8.4%) | 1,001 (7.8%) |
| 15 to 19 Years | 708 (6.4%) | 705 (5.5%) |
| 20 to 24 Years | 995 (9.0%) | 1,152 (8.9%) |
| 25 to 29 Years | 982 (8.9%) | 988 (7.7%) |
| 30 to 34 Years | 664 (6.0%) | 913 (7.1%) |
| 35 to 39 Years | 325 (2.9%) | 567 (4.4%) |
| 40 to 44 Years | 644 (5.9%) | 535 (4.2%) |
| 45 to 49 Years | 837 (7.6%) | 588 (4.6%) |
| 50 to 54 Years | 553 (5.0%) | 597 (4.6%) |
| 55 to 59 Years | 757 (6.9%) | 849 (6.6%) |
| 60 to 64 Years | 682 (6.2%) | 1,104 (8.6%) |
| 65 to 69 Years | 735 (6.7%) | 682 (5.3%) |
| 70 to 74 Years | 362 (3.3%) | 617 (4.8%) |
| 75 to 79 Years | 235 (2.1%) | 444 (3.5%) |
| 80 to 84 Years | 384 (3.5%) | 514 (4.0%) |
| 85 Years and over | 114 (1.0%) | 503 (3.9%) |
| Total | 11,011 (100.0%) | 12,885 (100.0%) |
Families and Households in Columbus
Median Family Size in Columbus
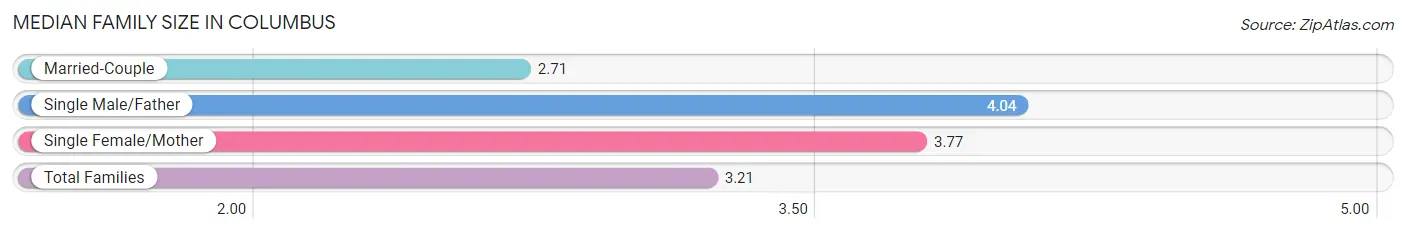
The median family size in Columbus is 3.21 persons per family, with single male/father families (243 | 4.9%) accounting for the largest median family size of 4.04 persons per family. On the other hand, married-couple families (2,650 | 53.6%) represent the smallest median family size with 2.71 persons per family.
| Family Type | # Families | Family Size |
| Married-Couple | 2,650 (53.6%) | 2.71 |
| Single Male/Father | 243 (4.9%) | 4.04 |
| Single Female/Mother | 2,050 (41.5%) | 3.77 |
| Total Families | 4,943 (100.0%) | 3.21 |
Median Household Size in Columbus
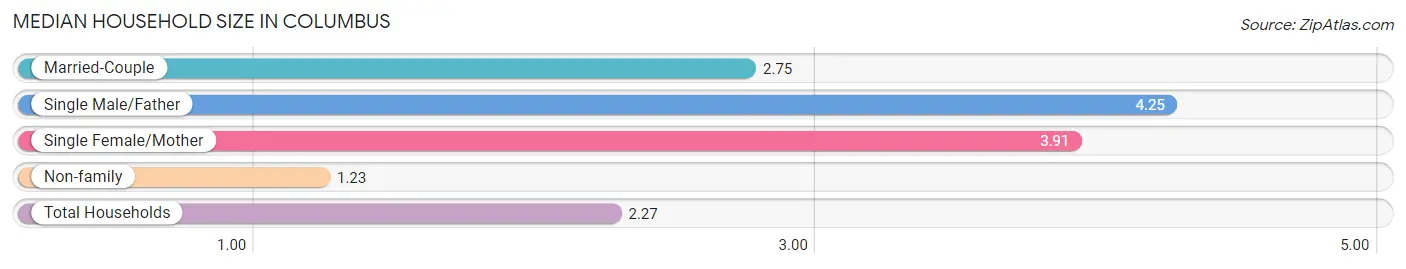
The median household size in Columbus is 2.27 persons per household, with single male/father households (243 | 2.5%) accounting for the largest median household size of 4.25 persons per household. non-family households (4,922 | 49.9%) represent the smallest median household size with 1.23 persons per household.
| Household Type | # Households | Household Size |
| Married-Couple | 2,650 (26.9%) | 2.75 |
| Single Male/Father | 243 (2.5%) | 4.25 |
| Single Female/Mother | 2,050 (20.8%) | 3.91 |
| Non-family | 4,922 (49.9%) | 1.23 |
| Total Households | 9,865 (100.0%) | 2.27 |
Household Size by Marriage Status in Columbus
Out of a total of 9,865 households in Columbus, 4,943 (50.1%) are family households, while 4,922 (49.9%) are nonfamily households. The most numerous type of family households are 2-person households, comprising 2,422, and the most common type of nonfamily households are 1-person households, comprising 4,315.
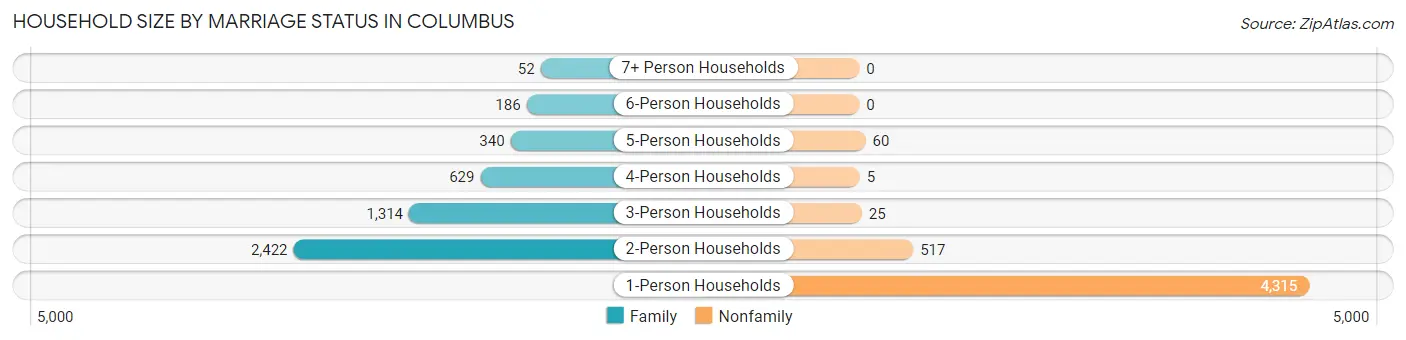
| Household Size | Family Households | Nonfamily Households |
| 1-Person Households | - | 4,315 (43.7%) |
| 2-Person Households | 2,422 (24.5%) | 517 (5.2%) |
| 3-Person Households | 1,314 (13.3%) | 25 (0.3%) |
| 4-Person Households | 629 (6.4%) | 5 (0.1%) |
| 5-Person Households | 340 (3.5%) | 60 (0.6%) |
| 6-Person Households | 186 (1.9%) | 0 (0.0%) |
| 7+ Person Households | 52 (0.5%) | 0 (0.0%) |
| Total | 4,943 (50.1%) | 4,922 (49.9%) |
Female Fertility in Columbus
Fertility by Age in Columbus
Average fertility rate in Columbus is 61.0 births per 1,000 women. Women in the age bracket of 15 to 19 years have the highest fertility rate with 85.0 births per 1,000 women. Women in the age bracket of 20 to 34 years acount for 53.0% of all women with births.
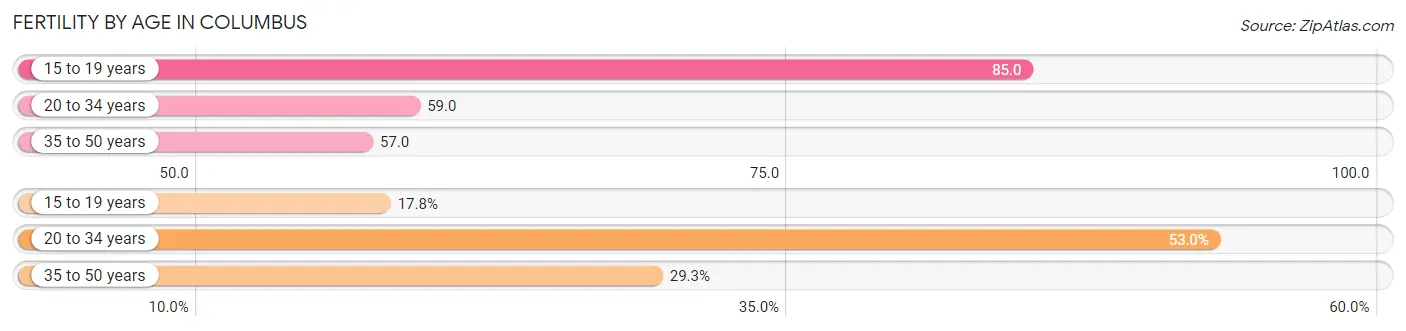
| Age Bracket | Women with Births | Births / 1,000 Women |
| 15 to 19 years | 60 (17.7%) | 85.0 |
| 20 to 34 years | 179 (53.0%) | 59.0 |
| 35 to 50 years | 99 (29.3%) | 57.0 |
| Total | 338 (100.0%) | 61.0 |
Fertility by Age by Marriage Status in Columbus
56.5% of women with births (338) in Columbus are married. The highest percentage of unmarried women with births falls into 15 to 19 years age bracket with 100.0% of them unmarried at the time of birth, while the lowest percentage of unmarried women with births belong to 20 to 34 years age bracket with 10.6% of them unmarried.
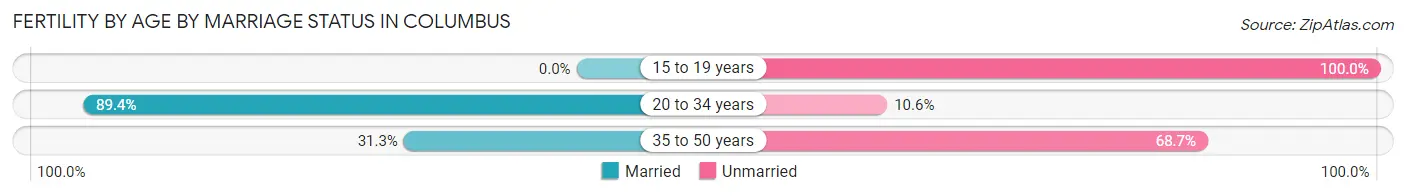
| Age Bracket | Married | Unmarried |
| 15 to 19 years | 0 (0.0%) | 60 (100.0%) |
| 20 to 34 years | 160 (89.4%) | 19 (10.6%) |
| 35 to 50 years | 31 (31.3%) | 68 (68.7%) |
| Total | 191 (56.5%) | 147 (43.5%) |
Fertility by Education in Columbus
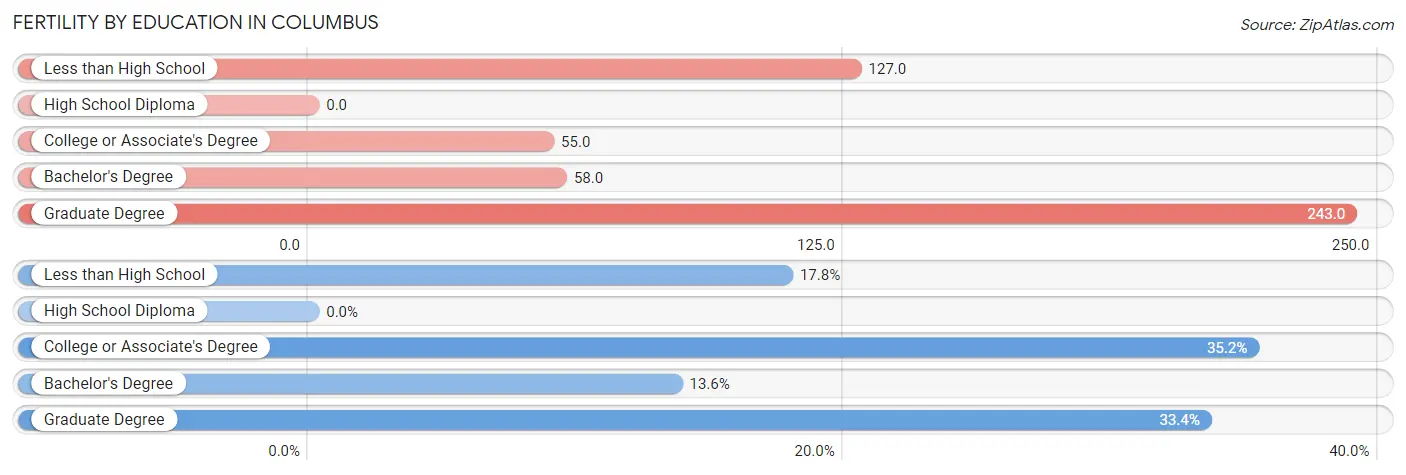
| Educational Attainment | Women with Births | Births / 1,000 Women |
| Less than High School | 60 (17.7%) | 127.0 |
| High School Diploma | 0 (0.0%) | 0.0 |
| College or Associate's Degree | 119 (35.2%) | 55.0 |
| Bachelor's Degree | 46 (13.6%) | 58.0 |
| Graduate Degree | 113 (33.4%) | 243.0 |
| Total | 338 (100.0%) | 61.0 |
Fertility by Education by Marriage Status in Columbus
43.5% of women with births in Columbus are unmarried. Women with the educational attainment of bachelor's degree are most likely to be married with 100.0% of them married at childbirth, while women with the educational attainment of less than high school are least likely to be married with 100.0% of them unmarried at childbirth.
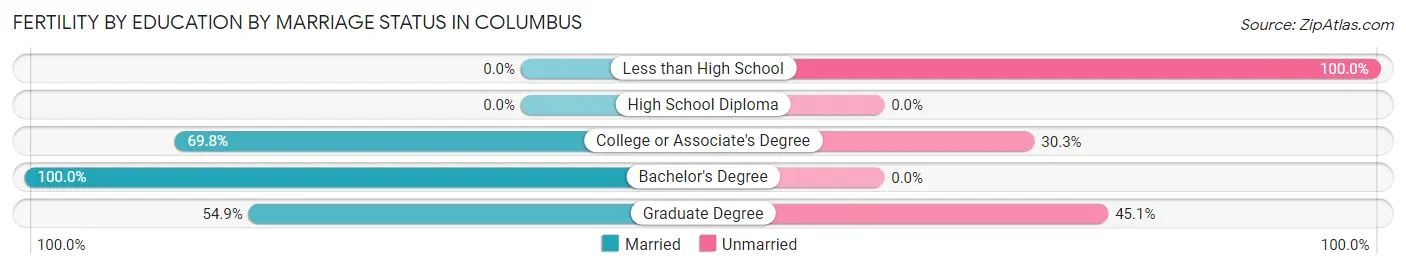
| Educational Attainment | Married | Unmarried |
| Less than High School | 0 (0.0%) | 60 (100.0%) |
| High School Diploma | 0 (0.0%) | 0 (0.0%) |
| College or Associate's Degree | 83 (69.8%) | 36 (30.2%) |
| Bachelor's Degree | 46 (100.0%) | 0 (0.0%) |
| Graduate Degree | 62 (54.9%) | 51 (45.1%) |
| Total | 191 (56.5%) | 147 (43.5%) |
Employment Characteristics in Columbus
Employment by Class of Employer in Columbus
Among the 9,162 employed individuals in Columbus, private company employees (6,118 | 66.8%), state government employees (764 | 8.3%), and federal government employees (645 | 7.0%) make up the most common classes of employment.
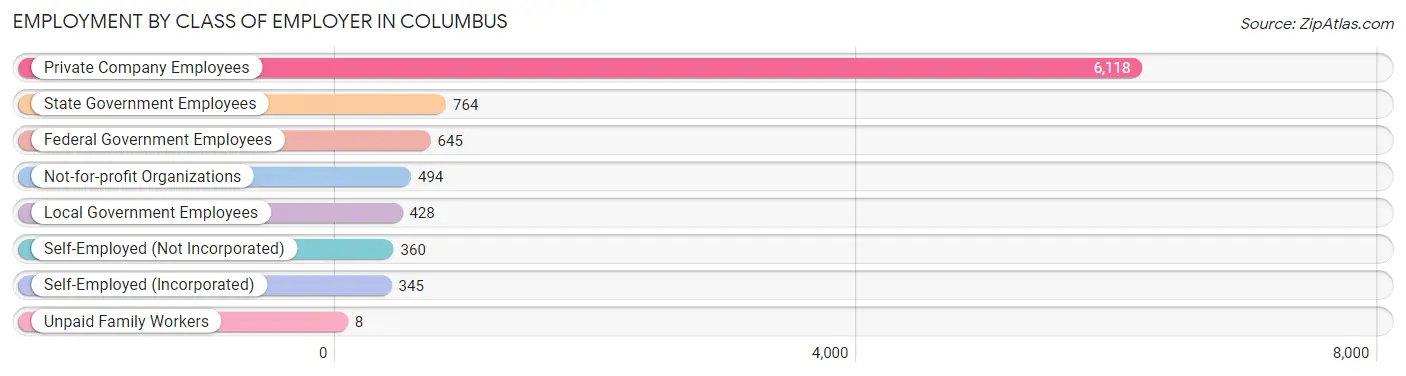
| Employer Class | # Employees | % Employees |
| Private Company Employees | 6,118 | 66.8% |
| Self-Employed (Incorporated) | 345 | 3.8% |
| Self-Employed (Not Incorporated) | 360 | 3.9% |
| Not-for-profit Organizations | 494 | 5.4% |
| Local Government Employees | 428 | 4.7% |
| State Government Employees | 764 | 8.3% |
| Federal Government Employees | 645 | 7.0% |
| Unpaid Family Workers | 8 | 0.1% |
| Total | 9,162 | 100.0% |
Employment Status by Age in Columbus
According to the labor force statistics for Columbus, out of the total population over 16 years of age (19,556), 53.2% or 10,404 individuals are in the labor force, with 9.8% or 1,020 of them unemployed. The age group with the highest labor force participation rate is 30 to 34 years, with 89.2% or 1,407 individuals in the labor force. Within the labor force, the 55 to 59 years age range has the highest percentage of unemployed individuals, with 21.4% or 187 of them being unemployed.
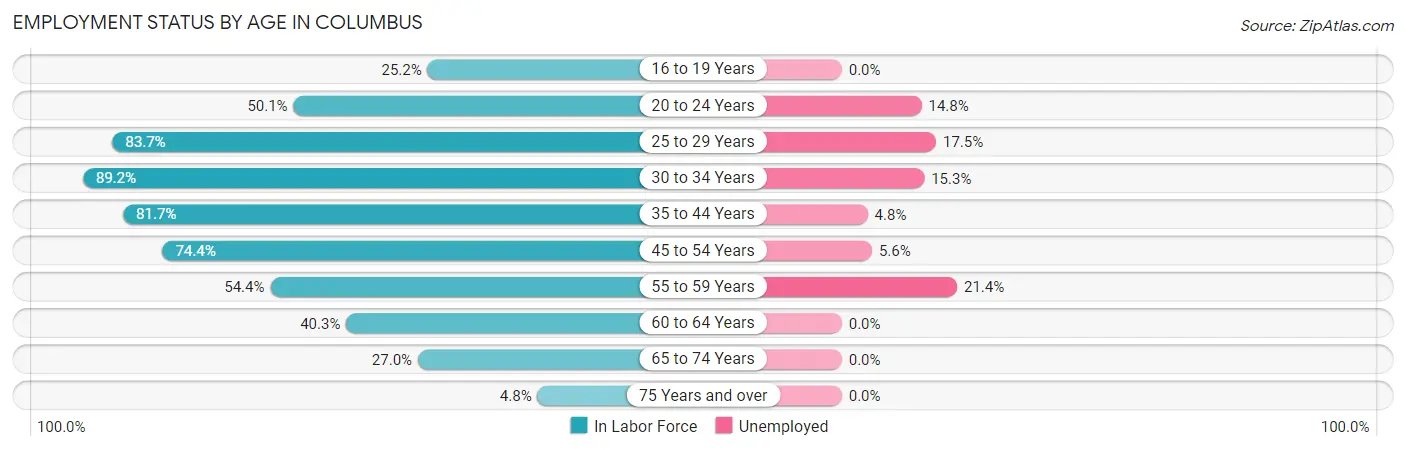
| Age Bracket | In Labor Force | Unemployed |
| 16 to 19 Years | 311 (25.2%) | 0 (0.0%) |
| 20 to 24 Years | 1,076 (50.1%) | 159 (14.8%) |
| 25 to 29 Years | 1,649 (83.7%) | 289 (17.5%) |
| 30 to 34 Years | 1,407 (89.2%) | 215 (15.3%) |
| 35 to 44 Years | 1,692 (81.7%) | 81 (4.8%) |
| 45 to 54 Years | 1,916 (74.4%) | 107 (5.6%) |
| 55 to 59 Years | 874 (54.4%) | 187 (21.4%) |
| 60 to 64 Years | 720 (40.3%) | 0 (0.0%) |
| 65 to 74 Years | 647 (27.0%) | 0 (0.0%) |
| 75 Years and over | 105 (4.8%) | 0 (0.0%) |
| Total | 10,404 (53.2%) | 1,020 (9.8%) |
Employment Status by Educational Attainment in Columbus
According to labor force statistics for Columbus, 71.3% of individuals (8,260) out of the total population between 25 and 64 years of age (11,585) are in the labor force, with 10.5% or 867 of them being unemployed. The group with the highest labor force participation rate are those with the educational attainment of college / associate degree, with 80.9% or 2,935 individuals in the labor force. Within the labor force, individuals with less than high school education have the highest percentage of unemployment, with 17.0% or 63 of them being unemployed.
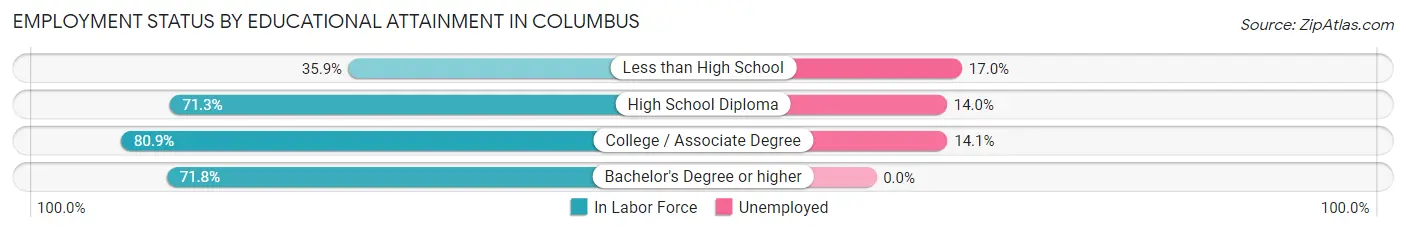
| Educational Attainment | In Labor Force | Unemployed |
| Less than High School | 371 (35.9%) | 176 (17.0%) |
| High School Diploma | 2,801 (71.3%) | 550 (14.0%) |
| College / Associate Degree | 2,935 (80.9%) | 512 (14.1%) |
| Bachelor's Degree or higher | 2,150 (71.8%) | 0 (0.0%) |
| Total | 8,260 (71.3%) | 1,216 (10.5%) |
Employment Occupations by Sex in Columbus
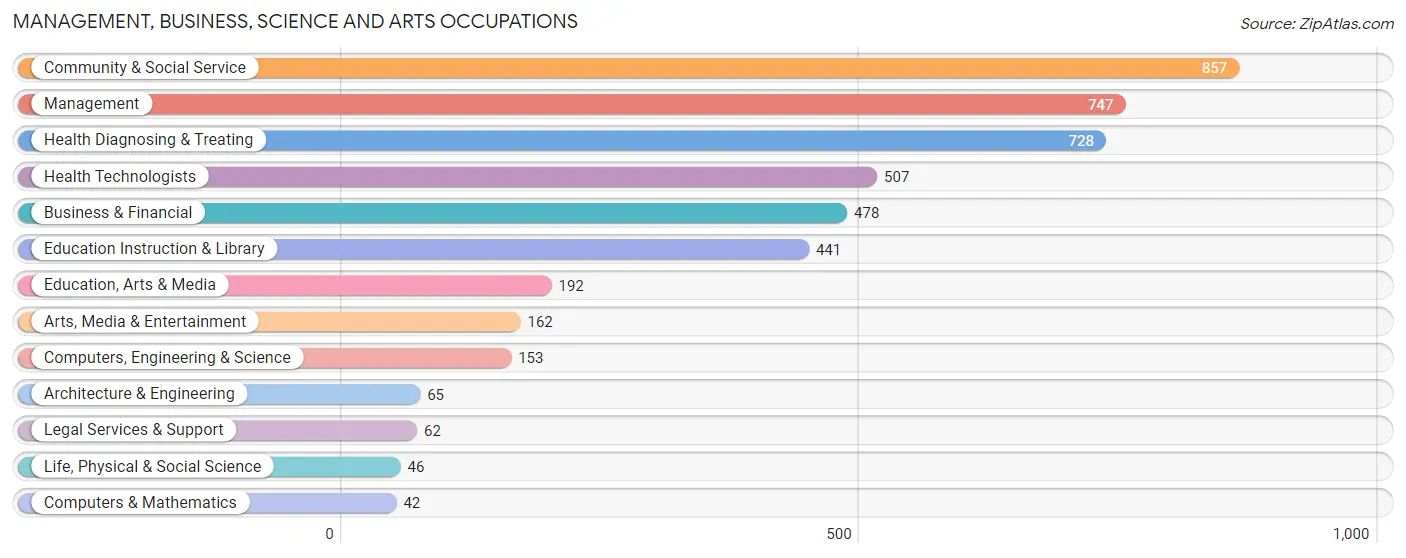
Management, Business, Science and Arts Occupations
The most common Management, Business, Science and Arts occupations in Columbus are Community & Social Service (857 | 9.4%), Management (747 | 8.2%), Health Diagnosing & Treating (728 | 8.0%), Health Technologists (507 | 5.6%), and Business & Financial (478 | 5.2%).
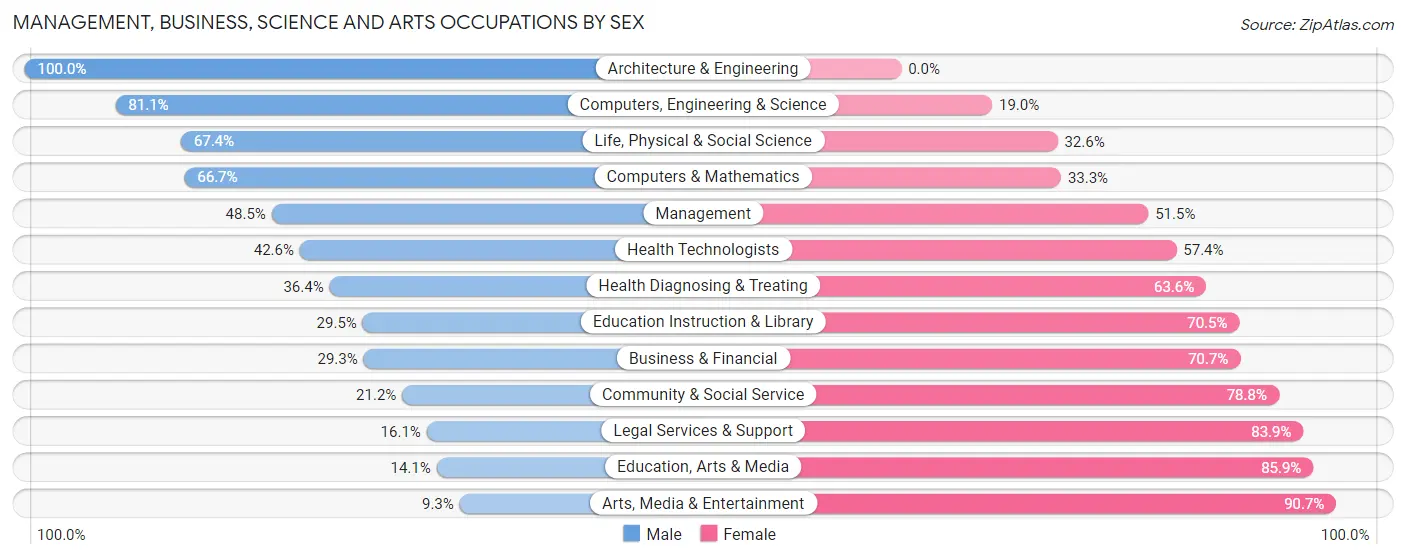
Management, Business, Science and Arts Occupations by Sex
Within the Management, Business, Science and Arts occupations in Columbus, the most male-oriented occupations are Architecture & Engineering (100.0%), Computers, Engineering & Science (81.0%), and Life, Physical & Social Science (67.4%), while the most female-oriented occupations are Arts, Media & Entertainment (90.7%), Education, Arts & Media (85.9%), and Legal Services & Support (83.9%).
| Occupation | Male | Female |
| Management | 362 (48.5%) | 385 (51.5%) |
| Business & Financial | 140 (29.3%) | 338 (70.7%) |
| Computers, Engineering & Science | 124 (81.0%) | 29 (19.0%) |
| Computers & Mathematics | 28 (66.7%) | 14 (33.3%) |
| Architecture & Engineering | 65 (100.0%) | 0 (0.0%) |
| Life, Physical & Social Science | 31 (67.4%) | 15 (32.6%) |
| Community & Social Service | 182 (21.2%) | 675 (78.8%) |
| Education, Arts & Media | 27 (14.1%) | 165 (85.9%) |
| Legal Services & Support | 10 (16.1%) | 52 (83.9%) |
| Education Instruction & Library | 130 (29.5%) | 311 (70.5%) |
| Arts, Media & Entertainment | 15 (9.3%) | 147 (90.7%) |
| Health Diagnosing & Treating | 265 (36.4%) | 463 (63.6%) |
| Health Technologists | 216 (42.6%) | 291 (57.4%) |
| Total (Category) | 1,073 (36.2%) | 1,890 (63.8%) |
| Total (Overall) | 4,345 (47.5%) | 4,794 (52.5%) |
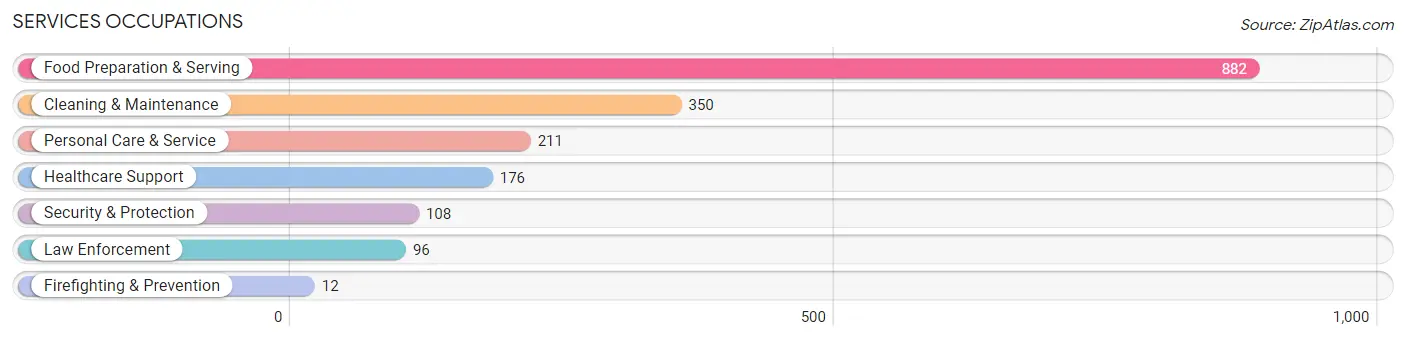
Services Occupations
The most common Services occupations in Columbus are Food Preparation & Serving (882 | 9.7%), Cleaning & Maintenance (350 | 3.8%), Personal Care & Service (211 | 2.3%), Healthcare Support (176 | 1.9%), and Security & Protection (108 | 1.2%).
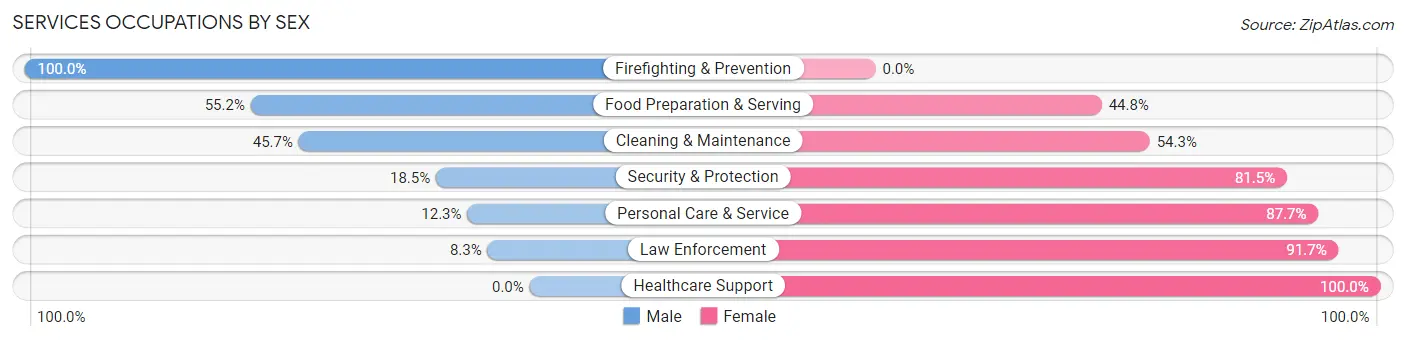
Services Occupations by Sex
Within the Services occupations in Columbus, the most male-oriented occupations are Firefighting & Prevention (100.0%), Food Preparation & Serving (55.2%), and Cleaning & Maintenance (45.7%), while the most female-oriented occupations are Healthcare Support (100.0%), Law Enforcement (91.7%), and Personal Care & Service (87.7%).
| Occupation | Male | Female |
| Healthcare Support | 0 (0.0%) | 176 (100.0%) |
| Security & Protection | 20 (18.5%) | 88 (81.5%) |
| Firefighting & Prevention | 12 (100.0%) | 0 (0.0%) |
| Law Enforcement | 8 (8.3%) | 88 (91.7%) |
| Food Preparation & Serving | 487 (55.2%) | 395 (44.8%) |
| Cleaning & Maintenance | 160 (45.7%) | 190 (54.3%) |
| Personal Care & Service | 26 (12.3%) | 185 (87.7%) |
| Total (Category) | 693 (40.1%) | 1,034 (59.9%) |
| Total (Overall) | 4,345 (47.5%) | 4,794 (52.5%) |
Sales and Office Occupations
The most common Sales and Office occupations in Columbus are Sales & Related (1,056 | 11.6%), and Office & Administration (832 | 9.1%).
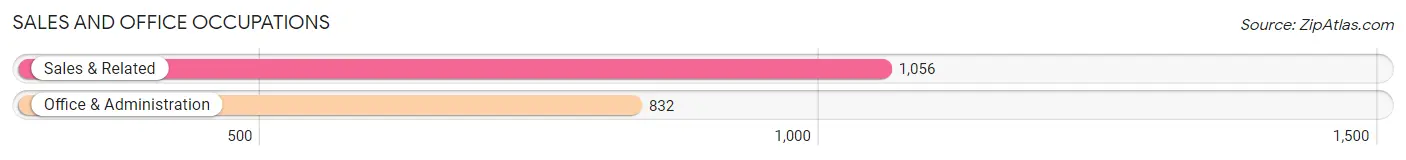
Sales and Office Occupations by Sex

| Occupation | Male | Female |
| Sales & Related | 257 (24.3%) | 799 (75.7%) |
| Office & Administration | 152 (18.3%) | 680 (81.7%) |
| Total (Category) | 409 (21.7%) | 1,479 (78.3%) |
| Total (Overall) | 4,345 (47.5%) | 4,794 (52.5%) |
Natural Resources, Construction and Maintenance Occupations
The most common Natural Resources, Construction and Maintenance occupations in Columbus are Installation, Maintenance & Repair (269 | 2.9%), and Construction & Extraction (227 | 2.5%).
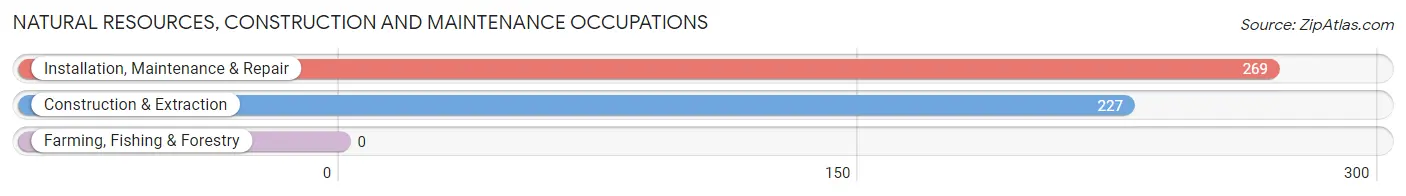
Natural Resources, Construction and Maintenance Occupations by Sex
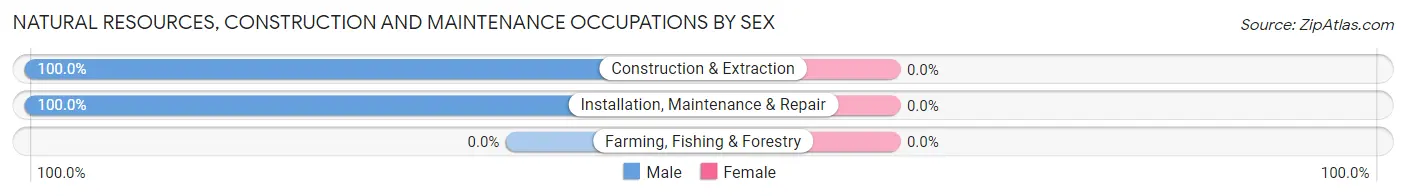
| Occupation | Male | Female |
| Farming, Fishing & Forestry | 0 (0.0%) | 0 (0.0%) |
| Construction & Extraction | 227 (100.0%) | 0 (0.0%) |
| Installation, Maintenance & Repair | 269 (100.0%) | 0 (0.0%) |
| Total (Category) | 496 (100.0%) | 0 (0.0%) |
| Total (Overall) | 4,345 (47.5%) | 4,794 (52.5%) |
Production, Transportation and Moving Occupations
The most common Production, Transportation and Moving occupations in Columbus are Production (787 | 8.6%), Transportation (771 | 8.4%), and Material Moving (507 | 5.6%).
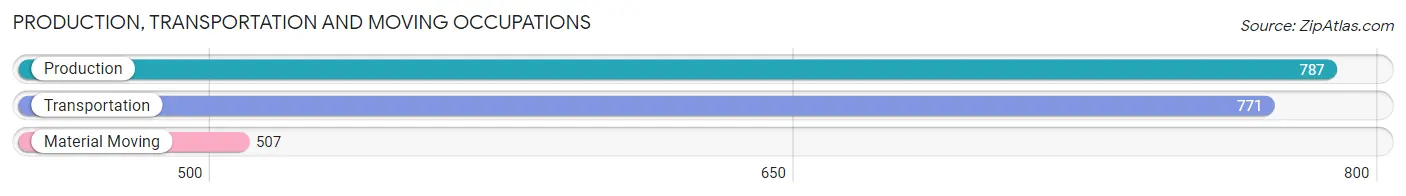
Production, Transportation and Moving Occupations by Sex
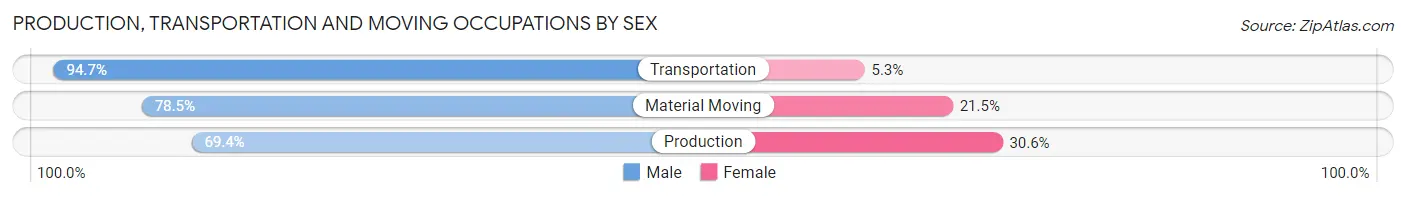
| Occupation | Male | Female |
| Production | 546 (69.4%) | 241 (30.6%) |
| Transportation | 730 (94.7%) | 41 (5.3%) |
| Material Moving | 398 (78.5%) | 109 (21.5%) |
| Total (Category) | 1,674 (81.1%) | 391 (18.9%) |
| Total (Overall) | 4,345 (47.5%) | 4,794 (52.5%) |
Employment Industries by Sex in Columbus
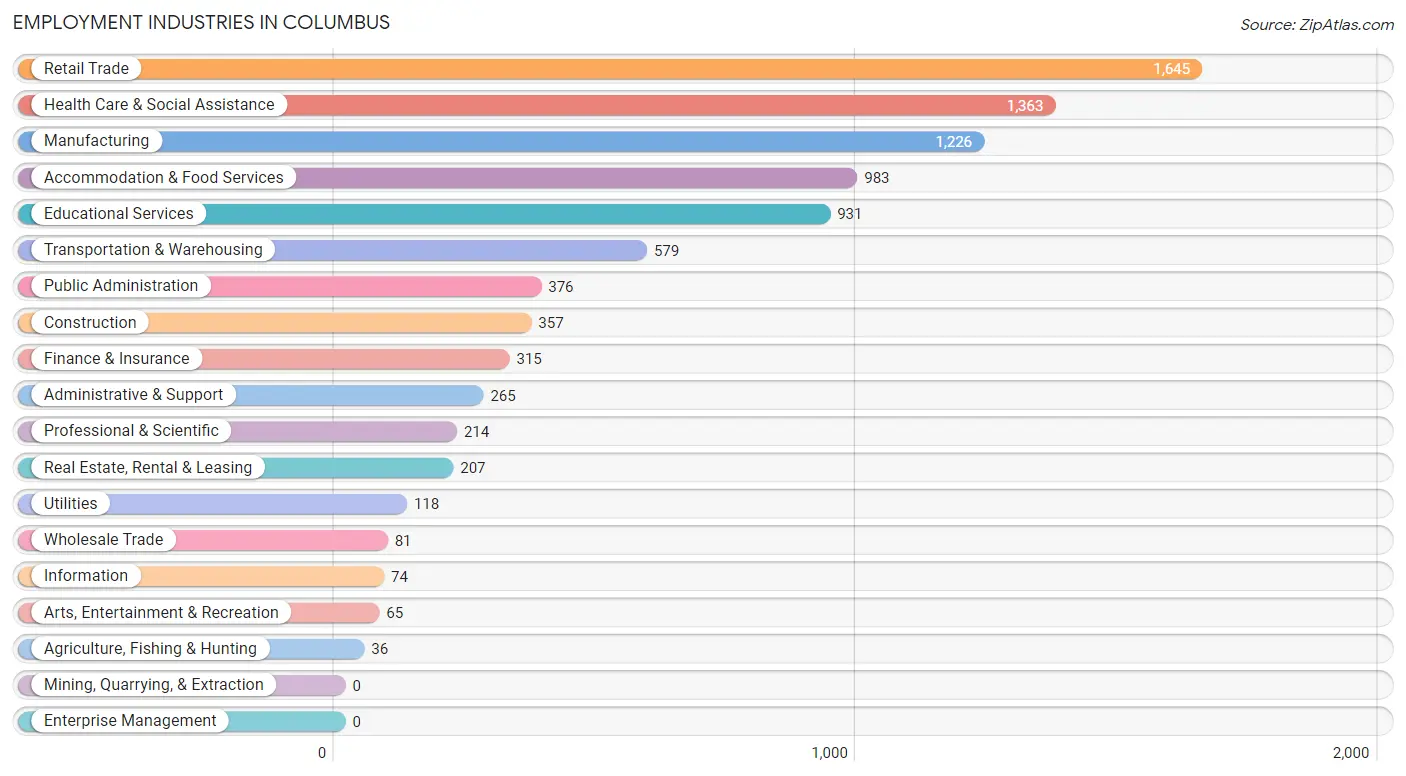
Employment Industries in Columbus
The major employment industries in Columbus include Retail Trade (1,645 | 18.0%), Health Care & Social Assistance (1,363 | 14.9%), Manufacturing (1,226 | 13.4%), Accommodation & Food Services (983 | 10.8%), and Educational Services (931 | 10.2%).
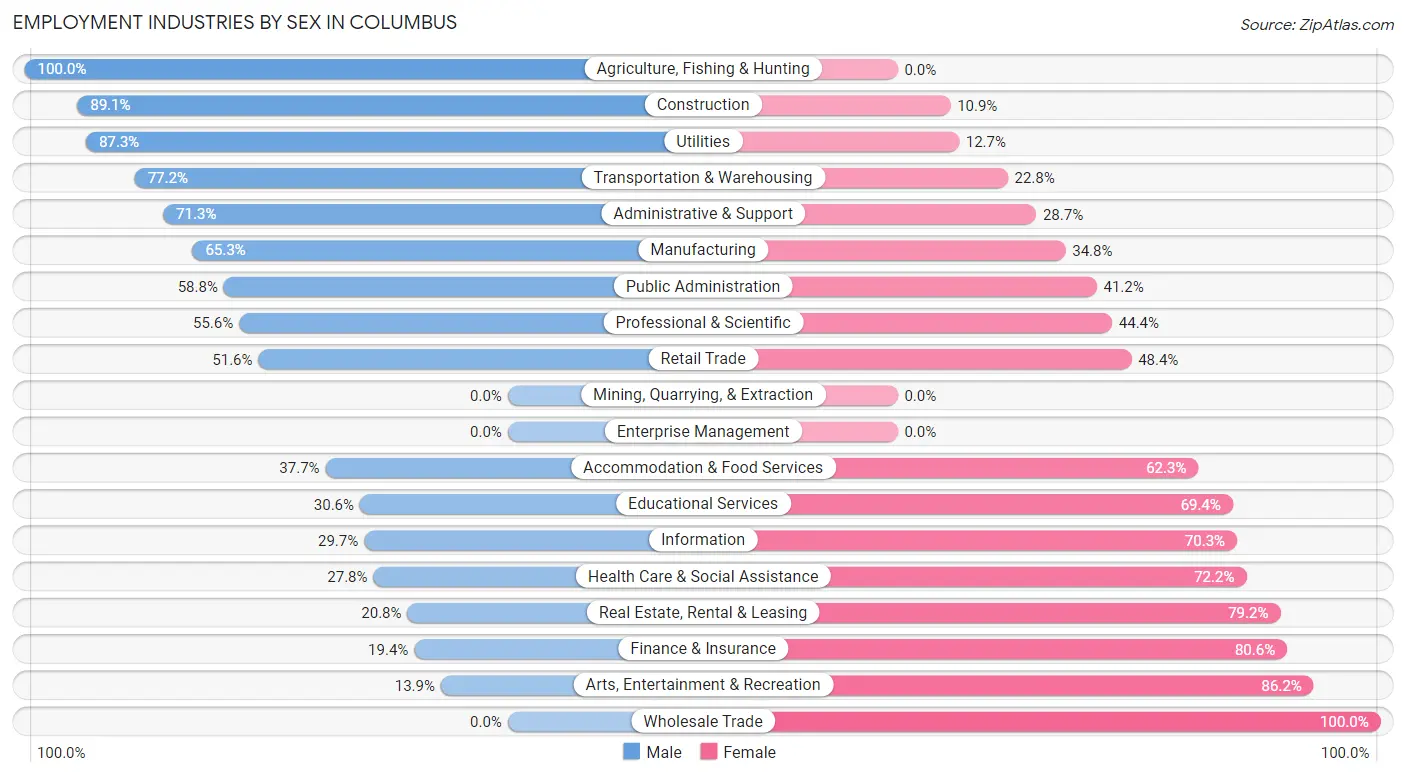
Employment Industries by Sex in Columbus
The Columbus industries that see more men than women are Agriculture, Fishing & Hunting (100.0%), Construction (89.1%), and Utilities (87.3%), whereas the industries that tend to have a higher number of women are Wholesale Trade (100.0%), Arts, Entertainment & Recreation (86.2%), and Finance & Insurance (80.6%).
| Industry | Male | Female |
| Agriculture, Fishing & Hunting | 36 (100.0%) | 0 (0.0%) |
| Mining, Quarrying, & Extraction | 0 (0.0%) | 0 (0.0%) |
| Construction | 318 (89.1%) | 39 (10.9%) |
| Manufacturing | 800 (65.2%) | 426 (34.7%) |
| Wholesale Trade | 0 (0.0%) | 81 (100.0%) |
| Retail Trade | 849 (51.6%) | 796 (48.4%) |
| Transportation & Warehousing | 447 (77.2%) | 132 (22.8%) |
| Utilities | 103 (87.3%) | 15 (12.7%) |
| Information | 22 (29.7%) | 52 (70.3%) |
| Finance & Insurance | 61 (19.4%) | 254 (80.6%) |
| Real Estate, Rental & Leasing | 43 (20.8%) | 164 (79.2%) |
| Professional & Scientific | 119 (55.6%) | 95 (44.4%) |
| Enterprise Management | 0 (0.0%) | 0 (0.0%) |
| Administrative & Support | 189 (71.3%) | 76 (28.7%) |
| Educational Services | 285 (30.6%) | 646 (69.4%) |
| Health Care & Social Assistance | 379 (27.8%) | 984 (72.2%) |
| Arts, Entertainment & Recreation | 9 (13.9%) | 56 (86.2%) |
| Accommodation & Food Services | 371 (37.7%) | 612 (62.3%) |
| Public Administration | 221 (58.8%) | 155 (41.2%) |
| Total | 4,345 (47.5%) | 4,794 (52.5%) |
Education in Columbus
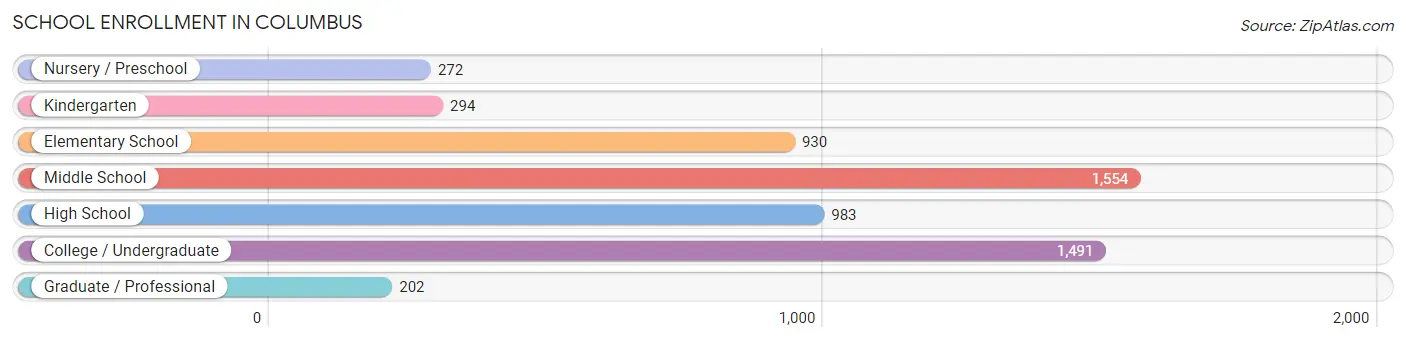
School Enrollment in Columbus
The most common levels of schooling among the 5,726 students in Columbus are middle school (1,554 | 27.1%), college / undergraduate (1,491 | 26.0%), and high school (983 | 17.2%).
| School Level | # Students | % Students |
| Nursery / Preschool | 272 | 4.8% |
| Kindergarten | 294 | 5.1% |
| Elementary School | 930 | 16.2% |
| Middle School | 1,554 | 27.1% |
| High School | 983 | 17.2% |
| College / Undergraduate | 1,491 | 26.0% |
| Graduate / Professional | 202 | 3.5% |
| Total | 5,726 | 100.0% |
School Enrollment by Age by Funding Source in Columbus
Out of a total of 5,726 students who are enrolled in schools in Columbus, 429 (7.5%) attend a private institution, while the remaining 5,297 (92.5%) are enrolled in public schools. The age group of 35 years and over has the highest likelihood of being enrolled in private schools, with 24 (22.2% in the age bracket) enrolled. Conversely, the age group of 18 to 19 year olds has the lowest likelihood of being enrolled in a private school, with 599 (100.0% in the age bracket) attending a public institution.
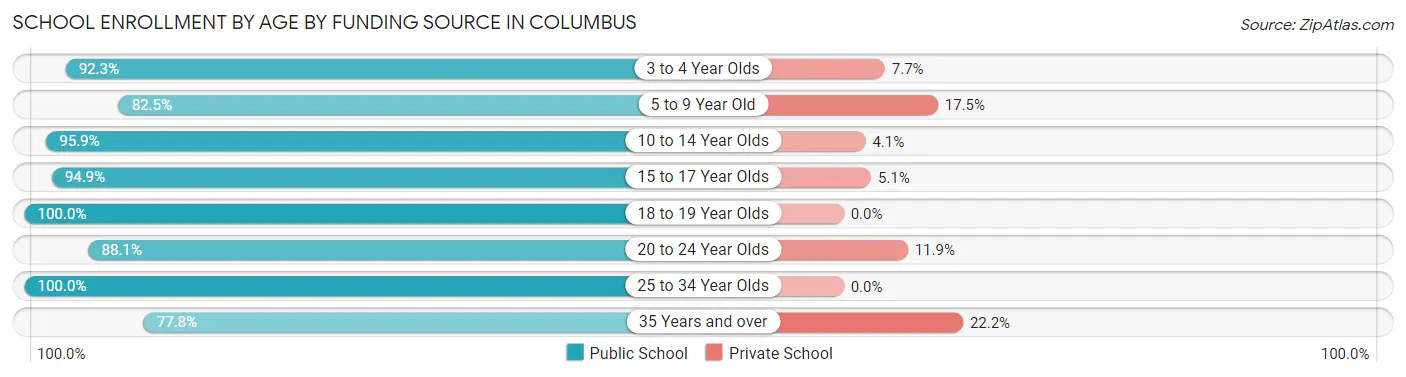
| Age Bracket | Public School | Private School |
| 3 to 4 Year Olds | 289 (92.3%) | 24 (7.7%) |
| 5 to 9 Year Old | 846 (82.5%) | 180 (17.5%) |
| 10 to 14 Year Olds | 1,845 (95.9%) | 78 (4.1%) |
| 15 to 17 Year Olds | 561 (94.9%) | 30 (5.1%) |
| 18 to 19 Year Olds | 599 (100.0%) | 0 (0.0%) |
| 20 to 24 Year Olds | 694 (88.1%) | 94 (11.9%) |
| 25 to 34 Year Olds | 378 (100.0%) | 0 (0.0%) |
| 35 Years and over | 84 (77.8%) | 24 (22.2%) |
| Total | 5,297 (92.5%) | 429 (7.5%) |
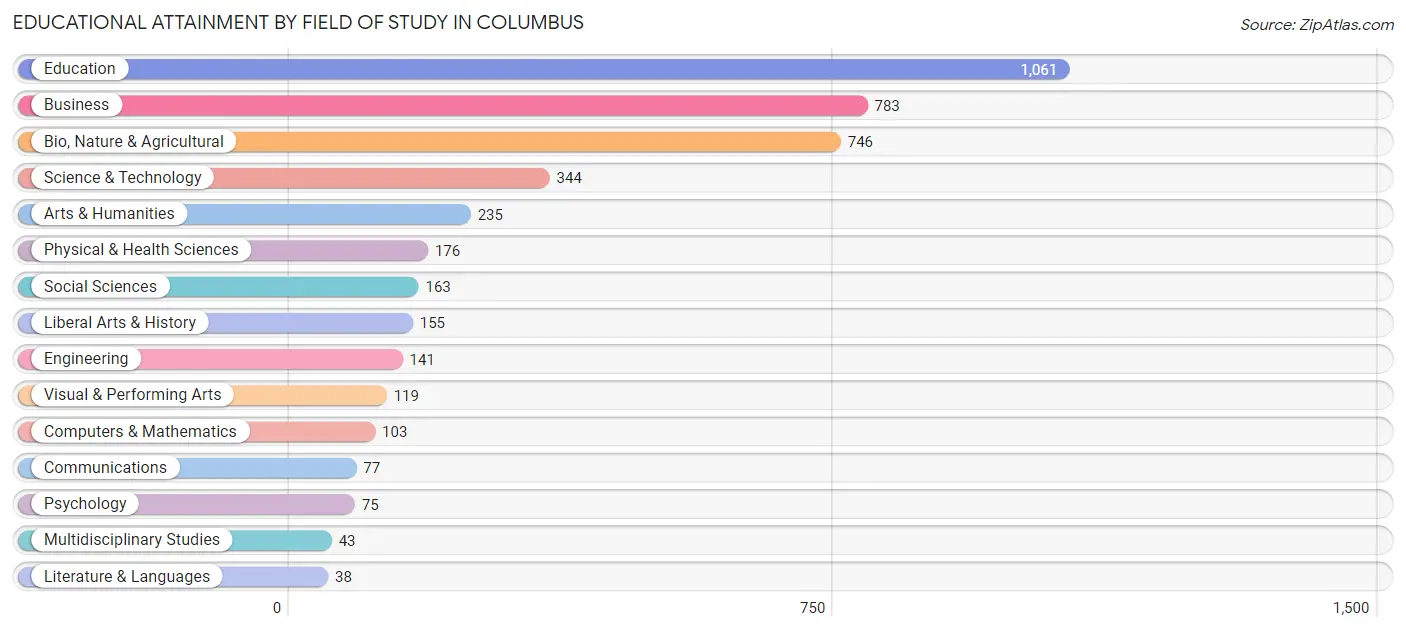
Educational Attainment by Field of Study in Columbus
Education (1,061 | 24.9%), business (783 | 18.4%), bio, nature & agricultural (746 | 17.5%), science & technology (344 | 8.1%), and arts & humanities (235 | 5.5%) are the most common fields of study among 4,259 individuals in Columbus who have obtained a bachelor's degree or higher.
| Field of Study | # Graduates | % Graduates |
| Computers & Mathematics | 103 | 2.4% |
| Bio, Nature & Agricultural | 746 | 17.5% |
| Physical & Health Sciences | 176 | 4.1% |
| Psychology | 75 | 1.8% |
| Social Sciences | 163 | 3.8% |
| Engineering | 141 | 3.3% |
| Multidisciplinary Studies | 43 | 1.0% |
| Science & Technology | 344 | 8.1% |
| Business | 783 | 18.4% |
| Education | 1,061 | 24.9% |
| Literature & Languages | 38 | 0.9% |
| Liberal Arts & History | 155 | 3.6% |
| Visual & Performing Arts | 119 | 2.8% |
| Communications | 77 | 1.8% |
| Arts & Humanities | 235 | 5.5% |
| Total | 4,259 | 100.0% |
Transportation & Commute in Columbus
Vehicle Availability by Sex in Columbus
The most prevalent vehicle ownership categories in Columbus are males with 2 vehicles (1,813, accounting for 40.0%) and females with 2 vehicles (1,825, making up 40.5%).
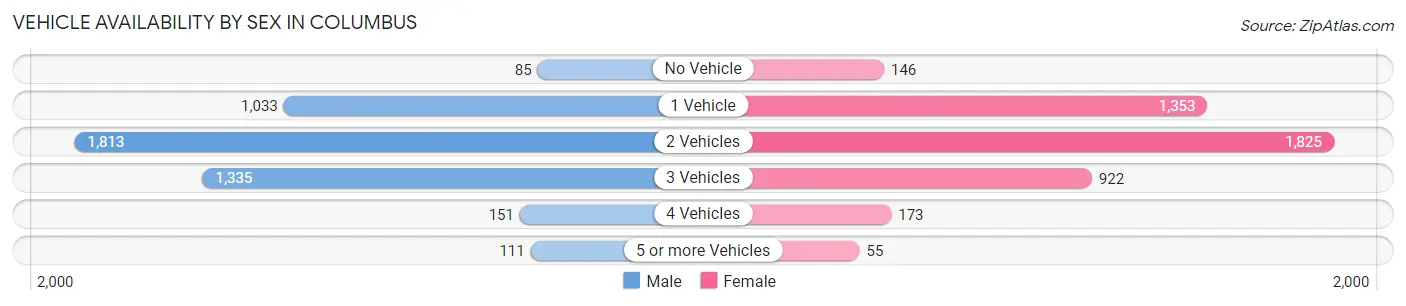
| Vehicles Available | Male | Female |
| No Vehicle | 85 (1.9%) | 146 (3.3%) |
| 1 Vehicle | 1,033 (22.8%) | 1,353 (30.2%) |
| 2 Vehicles | 1,813 (40.0%) | 1,825 (40.8%) |
| 3 Vehicles | 1,335 (29.5%) | 922 (20.6%) |
| 4 Vehicles | 151 (3.3%) | 173 (3.9%) |
| 5 or more Vehicles | 111 (2.5%) | 55 (1.2%) |
| Total | 4,528 (100.0%) | 4,474 (100.0%) |
Commute Time in Columbus
The most frequently occuring commute durations in Columbus are 10 to 14 minutes (2,298 commuters, 26.5%), 15 to 19 minutes (2,122 commuters, 24.5%), and 5 to 9 minutes (1,245 commuters, 14.3%).
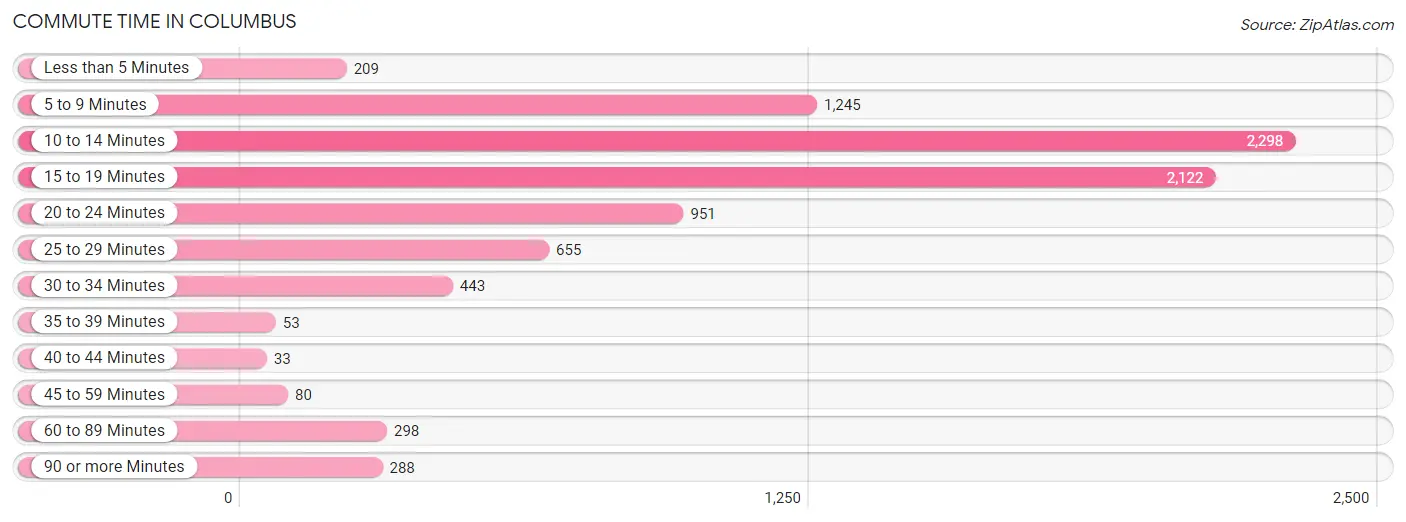
| Commute Time | # Commuters | % Commuters |
| Less than 5 Minutes | 209 | 2.4% |
| 5 to 9 Minutes | 1,245 | 14.3% |
| 10 to 14 Minutes | 2,298 | 26.5% |
| 15 to 19 Minutes | 2,122 | 24.5% |
| 20 to 24 Minutes | 951 | 11.0% |
| 25 to 29 Minutes | 655 | 7.5% |
| 30 to 34 Minutes | 443 | 5.1% |
| 35 to 39 Minutes | 53 | 0.6% |
| 40 to 44 Minutes | 33 | 0.4% |
| 45 to 59 Minutes | 80 | 0.9% |
| 60 to 89 Minutes | 298 | 3.4% |
| 90 or more Minutes | 288 | 3.3% |
Commute Time by Sex in Columbus
The most common commute times in Columbus are 15 to 19 minutes (1,065 commuters, 24.8%) for males and 10 to 14 minutes (1,252 commuters, 28.5%) for females.
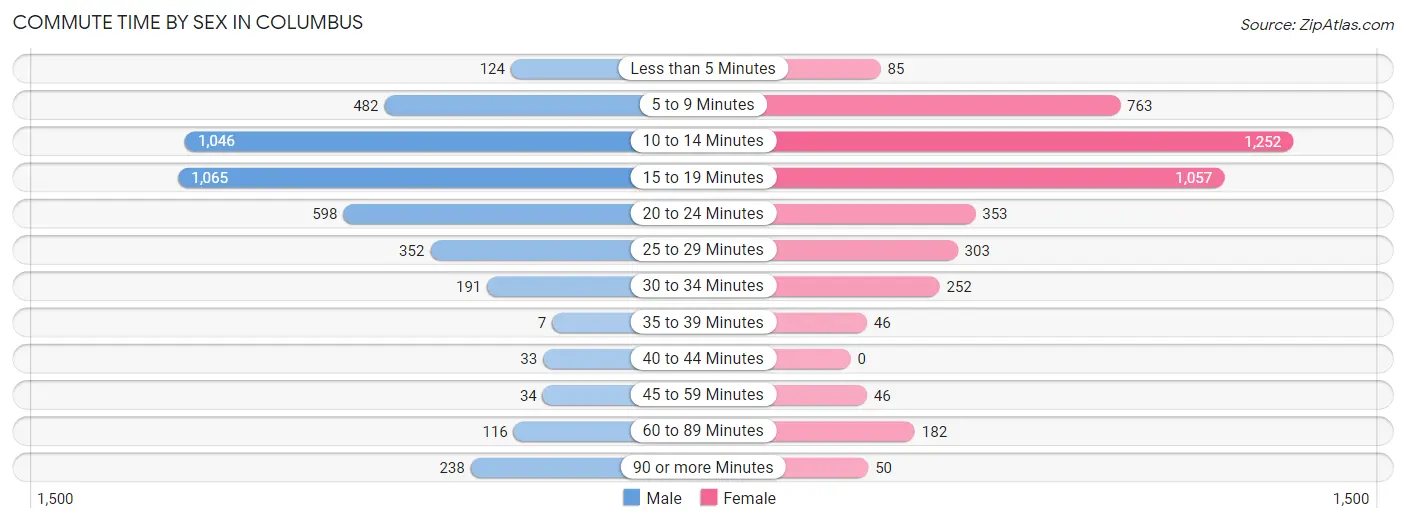
| Commute Time | Male | Female |
| Less than 5 Minutes | 124 (2.9%) | 85 (1.9%) |
| 5 to 9 Minutes | 482 (11.3%) | 763 (17.4%) |
| 10 to 14 Minutes | 1,046 (24.4%) | 1,252 (28.5%) |
| 15 to 19 Minutes | 1,065 (24.8%) | 1,057 (24.1%) |
| 20 to 24 Minutes | 598 (14.0%) | 353 (8.0%) |
| 25 to 29 Minutes | 352 (8.2%) | 303 (6.9%) |
| 30 to 34 Minutes | 191 (4.5%) | 252 (5.7%) |
| 35 to 39 Minutes | 7 (0.2%) | 46 (1.1%) |
| 40 to 44 Minutes | 33 (0.8%) | 0 (0.0%) |
| 45 to 59 Minutes | 34 (0.8%) | 46 (1.1%) |
| 60 to 89 Minutes | 116 (2.7%) | 182 (4.2%) |
| 90 or more Minutes | 238 (5.6%) | 50 (1.1%) |
Time of Departure to Work by Sex in Columbus
The most frequent times of departure to work in Columbus are 7:30 AM to 7:59 AM (737, 17.2%) for males and 7:30 AM to 7:59 AM (998, 22.7%) for females.
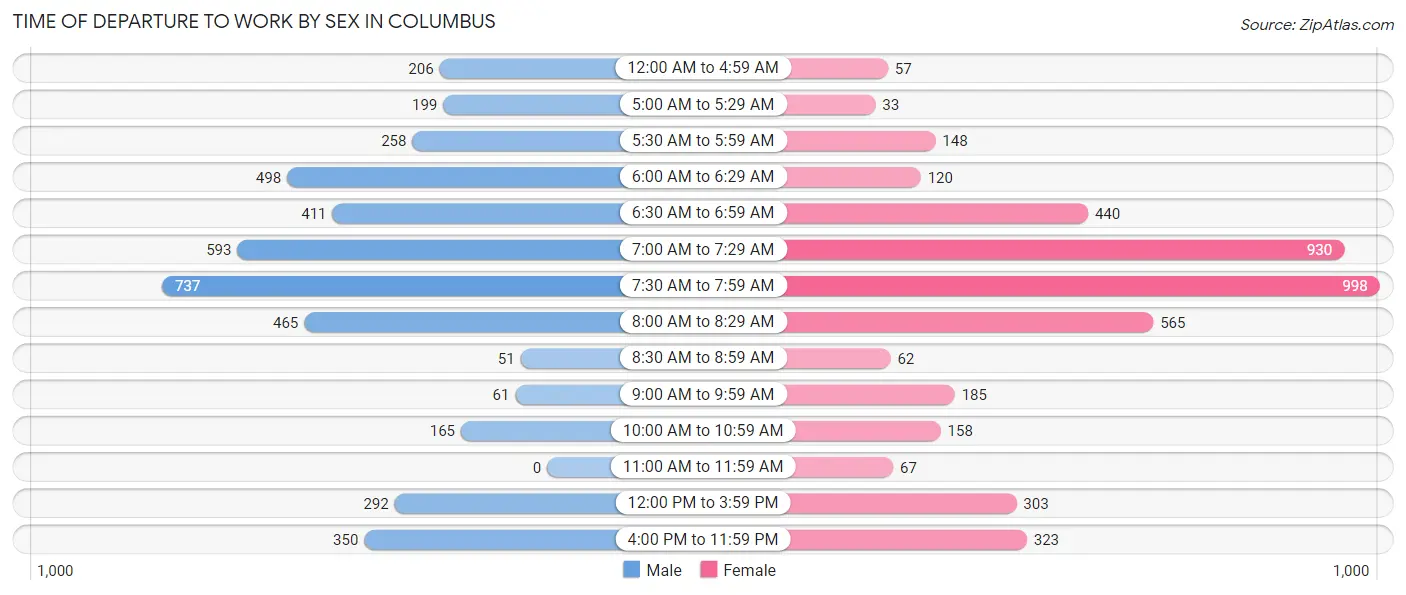
| Time of Departure | Male | Female |
| 12:00 AM to 4:59 AM | 206 (4.8%) | 57 (1.3%) |
| 5:00 AM to 5:29 AM | 199 (4.6%) | 33 (0.7%) |
| 5:30 AM to 5:59 AM | 258 (6.0%) | 148 (3.4%) |
| 6:00 AM to 6:29 AM | 498 (11.6%) | 120 (2.7%) |
| 6:30 AM to 6:59 AM | 411 (9.6%) | 440 (10.0%) |
| 7:00 AM to 7:29 AM | 593 (13.8%) | 930 (21.2%) |
| 7:30 AM to 7:59 AM | 737 (17.2%) | 998 (22.7%) |
| 8:00 AM to 8:29 AM | 465 (10.8%) | 565 (12.9%) |
| 8:30 AM to 8:59 AM | 51 (1.2%) | 62 (1.4%) |
| 9:00 AM to 9:59 AM | 61 (1.4%) | 185 (4.2%) |
| 10:00 AM to 10:59 AM | 165 (3.8%) | 158 (3.6%) |
| 11:00 AM to 11:59 AM | 0 (0.0%) | 67 (1.5%) |
| 12:00 PM to 3:59 PM | 292 (6.8%) | 303 (6.9%) |
| 4:00 PM to 11:59 PM | 350 (8.2%) | 323 (7.4%) |
| Total | 4,286 (100.0%) | 4,389 (100.0%) |
Housing Occupancy in Columbus
Occupancy by Ownership in Columbus
Of the total 9,865 dwellings in Columbus, owner-occupied units account for 4,563 (46.3%), while renter-occupied units make up 5,302 (53.7%).
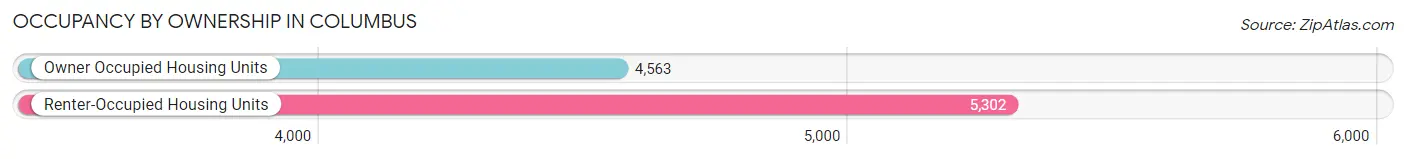
| Occupancy | # Housing Units | % Housing Units |
| Owner Occupied Housing Units | 4,563 | 46.3% |
| Renter-Occupied Housing Units | 5,302 | 53.7% |
| Total Occupied Housing Units | 9,865 | 100.0% |
Occupancy by Household Size in Columbus
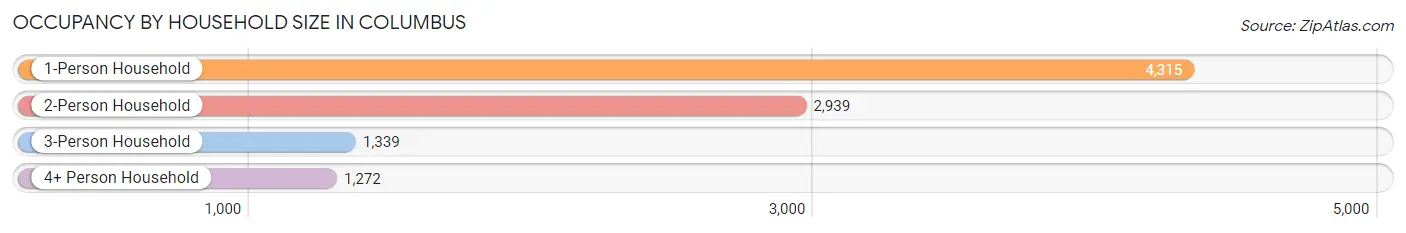
| Household Size | # Housing Units | % Housing Units |
| 1-Person Household | 4,315 | 43.7% |
| 2-Person Household | 2,939 | 29.8% |
| 3-Person Household | 1,339 | 13.6% |
| 4+ Person Household | 1,272 | 12.9% |
| Total Housing Units | 9,865 | 100.0% |
Occupancy by Ownership by Household Size in Columbus
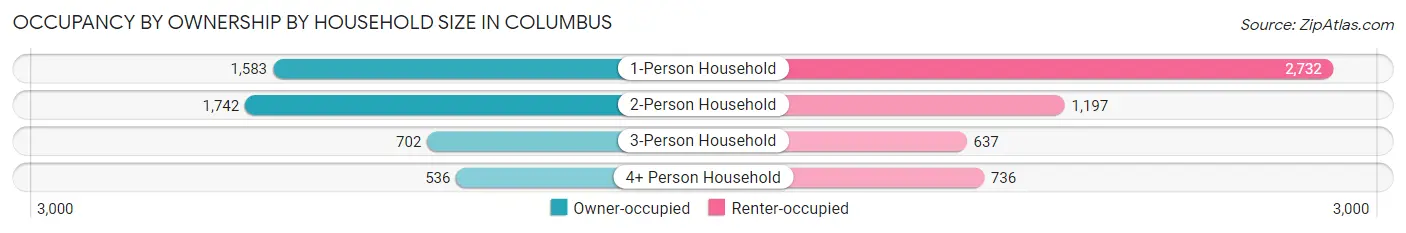
| Household Size | Owner-occupied | Renter-occupied |
| 1-Person Household | 1,583 (36.7%) | 2,732 (63.3%) |
| 2-Person Household | 1,742 (59.3%) | 1,197 (40.7%) |
| 3-Person Household | 702 (52.4%) | 637 (47.6%) |
| 4+ Person Household | 536 (42.1%) | 736 (57.9%) |
| Total Housing Units | 4,563 (46.3%) | 5,302 (53.7%) |
Occupancy by Educational Attainment in Columbus
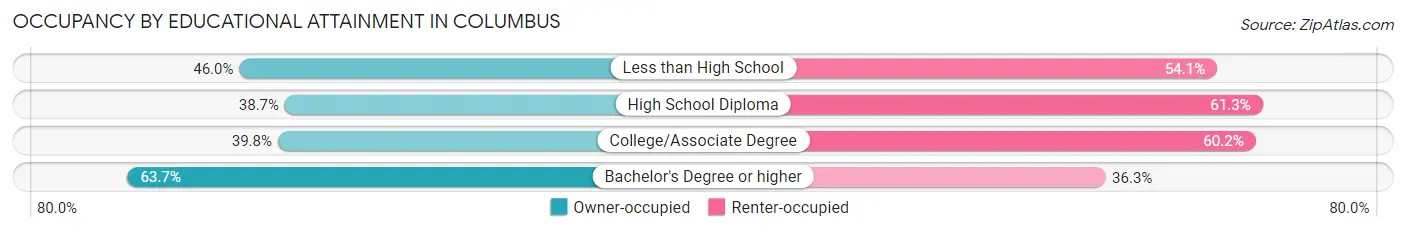
| Household Size | Owner-occupied | Renter-occupied |
| Less than High School | 658 (46.0%) | 774 (54.0%) |
| High School Diploma | 1,183 (38.7%) | 1,872 (61.3%) |
| College/Associate Degree | 1,174 (39.8%) | 1,773 (60.2%) |
| Bachelor's Degree or higher | 1,548 (63.7%) | 883 (36.3%) |
Occupancy by Age of Householder in Columbus
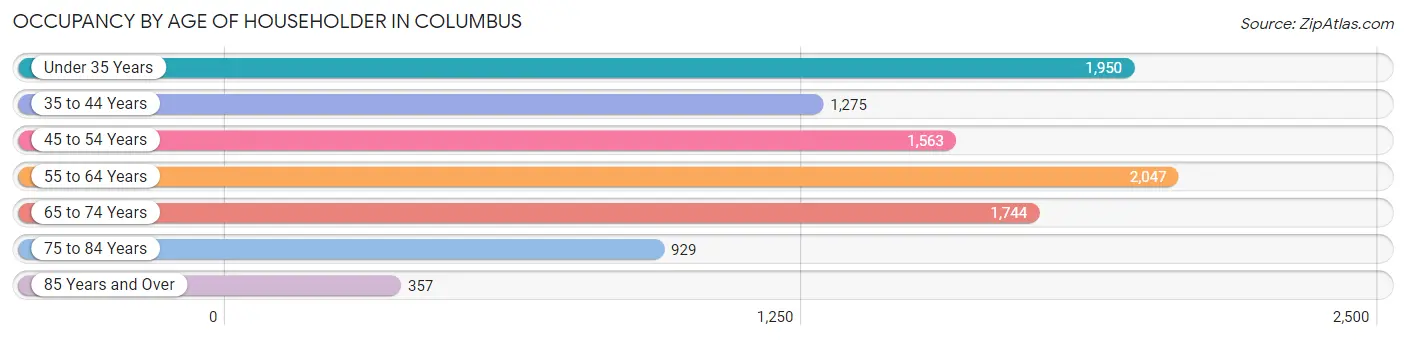
| Age Bracket | # Households | % Households |
| Under 35 Years | 1,950 | 19.8% |
| 35 to 44 Years | 1,275 | 12.9% |
| 45 to 54 Years | 1,563 | 15.8% |
| 55 to 64 Years | 2,047 | 20.7% |
| 65 to 74 Years | 1,744 | 17.7% |
| 75 to 84 Years | 929 | 9.4% |
| 85 Years and Over | 357 | 3.6% |
| Total | 9,865 | 100.0% |
Housing Finances in Columbus
Median Income by Occupancy in Columbus
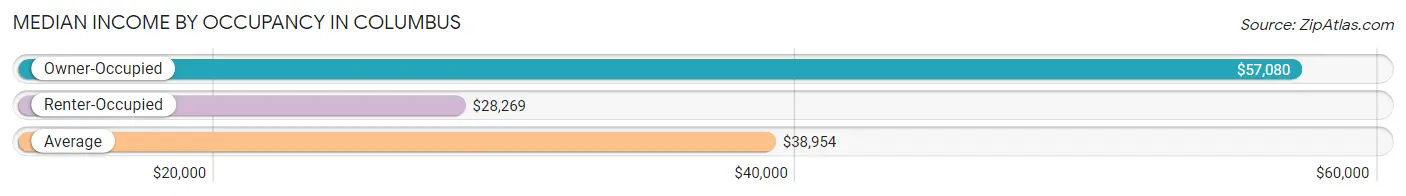
| Occupancy Type | # Households | Median Income |
| Owner-Occupied | 4,563 (46.3%) | $57,080 |
| Renter-Occupied | 5,302 (53.7%) | $28,269 |
| Average | 9,865 (100.0%) | $38,954 |
Occupancy by Householder Income Bracket in Columbus
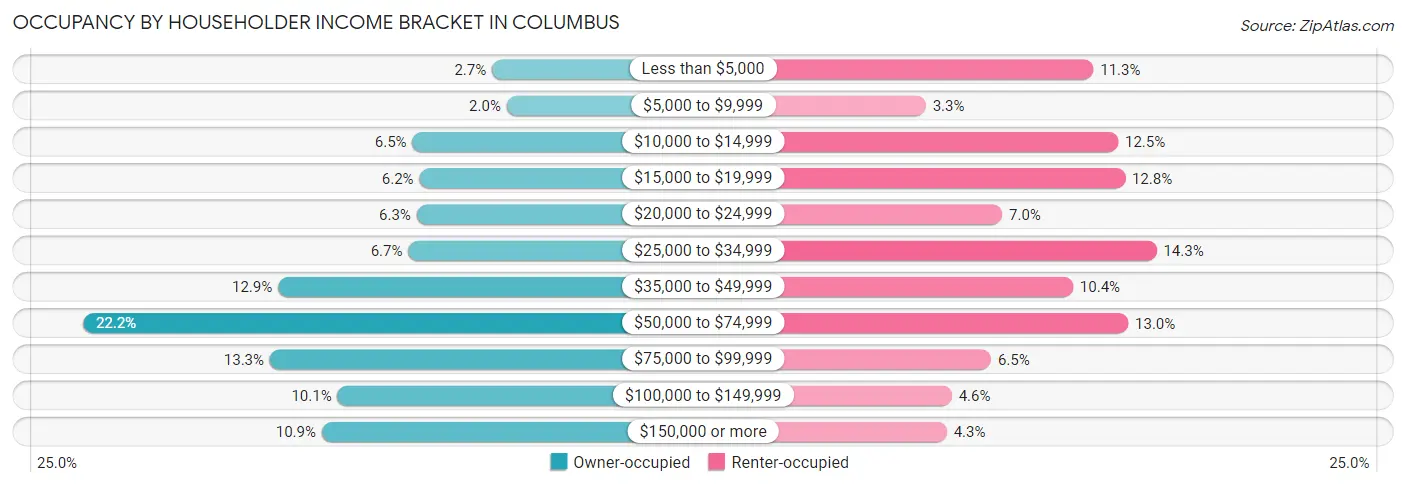
| Income Bracket | Owner-occupied | Renter-occupied |
| Less than $5,000 | 125 (2.7%) | 600 (11.3%) |
| $5,000 to $9,999 | 93 (2.0%) | 177 (3.3%) |
| $10,000 to $14,999 | 298 (6.5%) | 663 (12.5%) |
| $15,000 to $19,999 | 283 (6.2%) | 680 (12.8%) |
| $20,000 to $24,999 | 289 (6.3%) | 370 (7.0%) |
| $25,000 to $34,999 | 307 (6.7%) | 760 (14.3%) |
| $35,000 to $49,999 | 590 (12.9%) | 549 (10.3%) |
| $50,000 to $74,999 | 1,014 (22.2%) | 688 (13.0%) |
| $75,000 to $99,999 | 608 (13.3%) | 342 (6.5%) |
| $100,000 to $149,999 | 461 (10.1%) | 243 (4.6%) |
| $150,000 or more | 495 (10.8%) | 230 (4.3%) |
| Total | 4,563 (100.0%) | 5,302 (100.0%) |
Monthly Housing Cost Tiers in Columbus
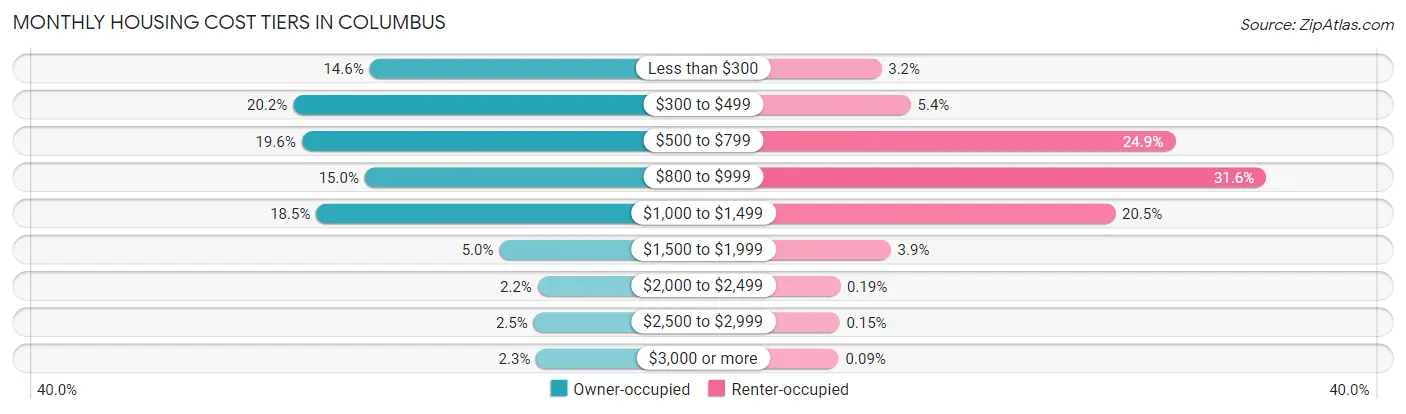
| Monthly Cost | Owner-occupied | Renter-occupied |
| Less than $300 | 666 (14.6%) | 171 (3.2%) |
| $300 to $499 | 923 (20.2%) | 286 (5.4%) |
| $500 to $799 | 895 (19.6%) | 1,318 (24.9%) |
| $800 to $999 | 682 (14.9%) | 1,674 (31.6%) |
| $1,000 to $1,499 | 845 (18.5%) | 1,084 (20.4%) |
| $1,500 to $1,999 | 230 (5.0%) | 208 (3.9%) |
| $2,000 to $2,499 | 101 (2.2%) | 10 (0.2%) |
| $2,500 to $2,999 | 115 (2.5%) | 8 (0.2%) |
| $3,000 or more | 106 (2.3%) | 5 (0.1%) |
| Total | 4,563 (100.0%) | 5,302 (100.0%) |
Physical Housing Characteristics in Columbus
Housing Structures in Columbus
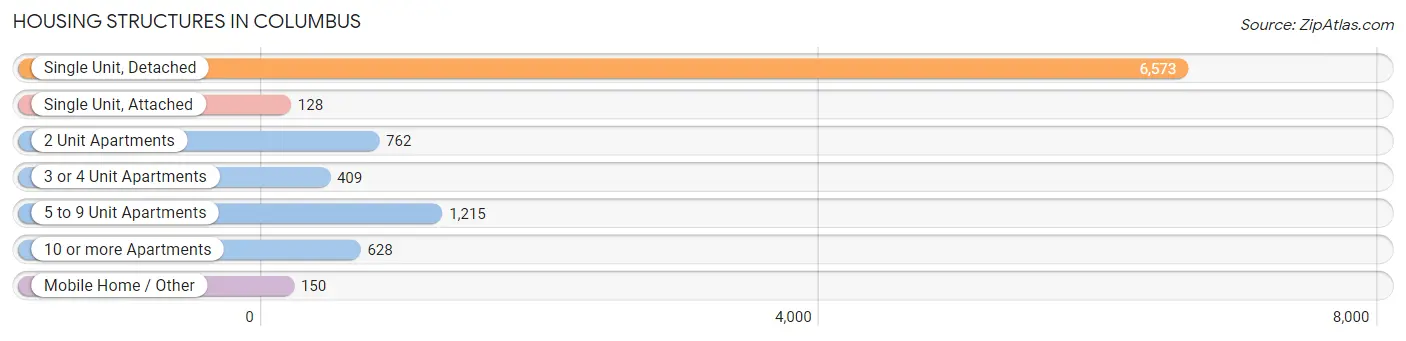
| Structure Type | # Housing Units | % Housing Units |
| Single Unit, Detached | 6,573 | 66.6% |
| Single Unit, Attached | 128 | 1.3% |
| 2 Unit Apartments | 762 | 7.7% |
| 3 or 4 Unit Apartments | 409 | 4.2% |
| 5 to 9 Unit Apartments | 1,215 | 12.3% |
| 10 or more Apartments | 628 | 6.4% |
| Mobile Home / Other | 150 | 1.5% |
| Total | 9,865 | 100.0% |
Housing Structures by Occupancy in Columbus
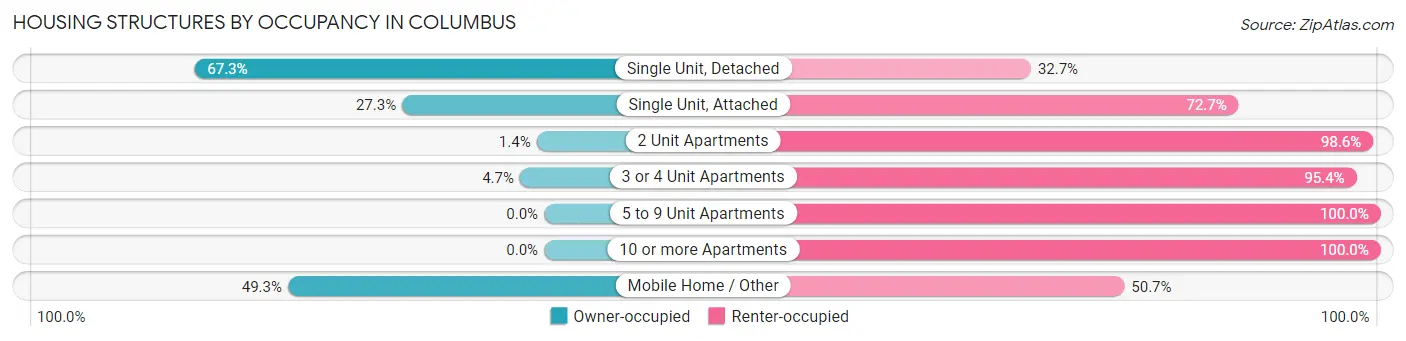
| Structure Type | Owner-occupied | Renter-occupied |
| Single Unit, Detached | 4,424 (67.3%) | 2,149 (32.7%) |
| Single Unit, Attached | 35 (27.3%) | 93 (72.7%) |
| 2 Unit Apartments | 11 (1.4%) | 751 (98.6%) |
| 3 or 4 Unit Apartments | 19 (4.6%) | 390 (95.4%) |
| 5 to 9 Unit Apartments | 0 (0.0%) | 1,215 (100.0%) |
| 10 or more Apartments | 0 (0.0%) | 628 (100.0%) |
| Mobile Home / Other | 74 (49.3%) | 76 (50.7%) |
| Total | 4,563 (46.3%) | 5,302 (53.7%) |
Housing Structures by Number of Rooms in Columbus
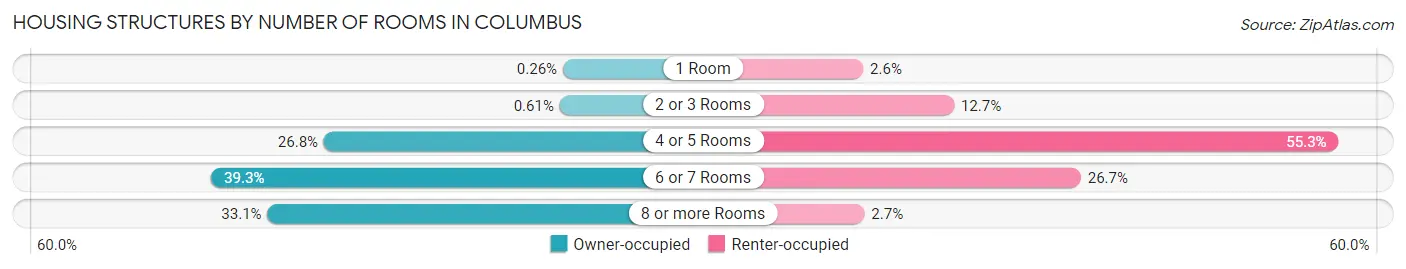
| Number of Rooms | Owner-occupied | Renter-occupied |
| 1 Room | 12 (0.3%) | 137 (2.6%) |
| 2 or 3 Rooms | 28 (0.6%) | 671 (12.7%) |
| 4 or 5 Rooms | 1,222 (26.8%) | 2,933 (55.3%) |
| 6 or 7 Rooms | 1,793 (39.3%) | 1,417 (26.7%) |
| 8 or more Rooms | 1,508 (33.1%) | 144 (2.7%) |
| Total | 4,563 (100.0%) | 5,302 (100.0%) |
Housing Structure by Heating Type in Columbus
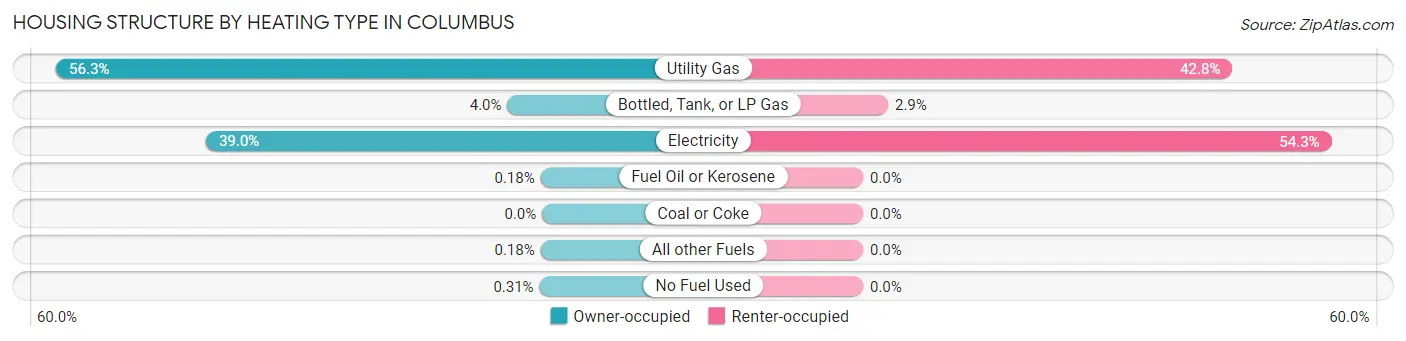
| Heating Type | Owner-occupied | Renter-occupied |
| Utility Gas | 2,571 (56.3%) | 2,269 (42.8%) |
| Bottled, Tank, or LP Gas | 184 (4.0%) | 154 (2.9%) |
| Electricity | 1,778 (39.0%) | 2,879 (54.3%) |
| Fuel Oil or Kerosene | 8 (0.2%) | 0 (0.0%) |
| Coal or Coke | 0 (0.0%) | 0 (0.0%) |
| All other Fuels | 8 (0.2%) | 0 (0.0%) |
| No Fuel Used | 14 (0.3%) | 0 (0.0%) |
| Total | 4,563 (100.0%) | 5,302 (100.0%) |
Household Vehicle Usage in Columbus
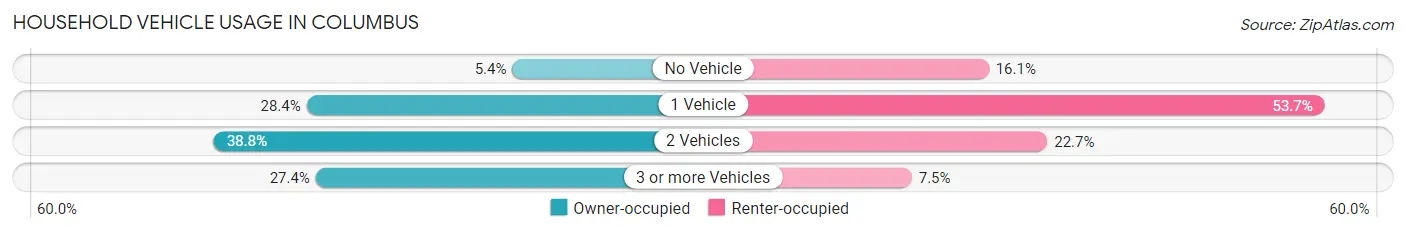
| Vehicles per Household | Owner-occupied | Renter-occupied |
| No Vehicle | 245 (5.4%) | 854 (16.1%) |
| 1 Vehicle | 1,297 (28.4%) | 2,849 (53.7%) |
| 2 Vehicles | 1,771 (38.8%) | 1,202 (22.7%) |
| 3 or more Vehicles | 1,250 (27.4%) | 397 (7.5%) |
| Total | 4,563 (100.0%) | 5,302 (100.0%) |
Real Estate & Mortgages in Columbus
Real Estate and Mortgage Overview in Columbus
| Characteristic | Without Mortgage | With Mortgage |
| Housing Units | 2,185 | 2,378 |
| Median Property Value | $106,400 | $124,800 |
| Median Household Income | $46,477 | $261 |
| Monthly Housing Costs | $392 | $106 |
| Real Estate Taxes | $1,478 | $476 |
Property Value by Mortgage Status in Columbus
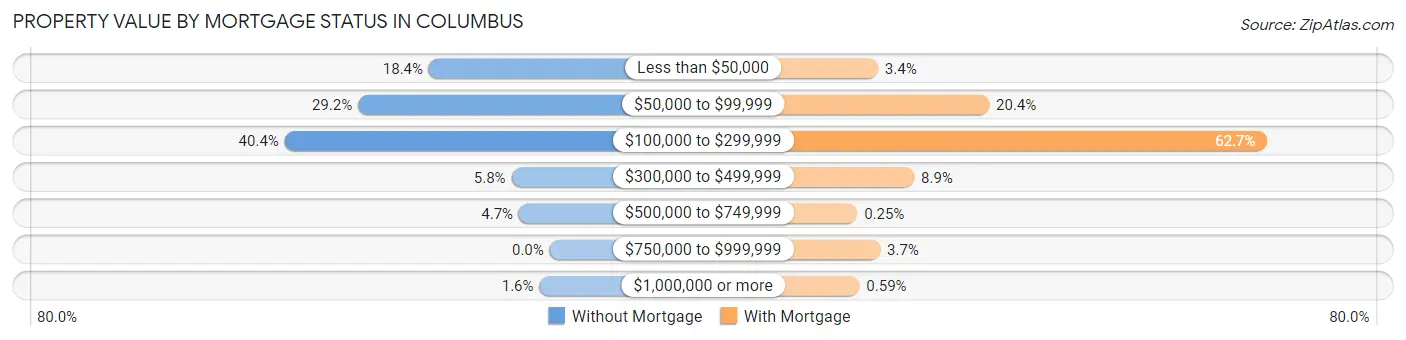
| Property Value | Without Mortgage | With Mortgage |
| Less than $50,000 | 402 (18.4%) | 81 (3.4%) |
| $50,000 to $99,999 | 638 (29.2%) | 484 (20.3%) |
| $100,000 to $299,999 | 882 (40.4%) | 1,492 (62.7%) |
| $300,000 to $499,999 | 127 (5.8%) | 212 (8.9%) |
| $500,000 to $749,999 | 102 (4.7%) | 6 (0.3%) |
| $750,000 to $999,999 | 0 (0.0%) | 89 (3.7%) |
| $1,000,000 or more | 34 (1.6%) | 14 (0.6%) |
| Total | 2,185 (100.0%) | 2,378 (100.0%) |
Household Income by Mortgage Status in Columbus
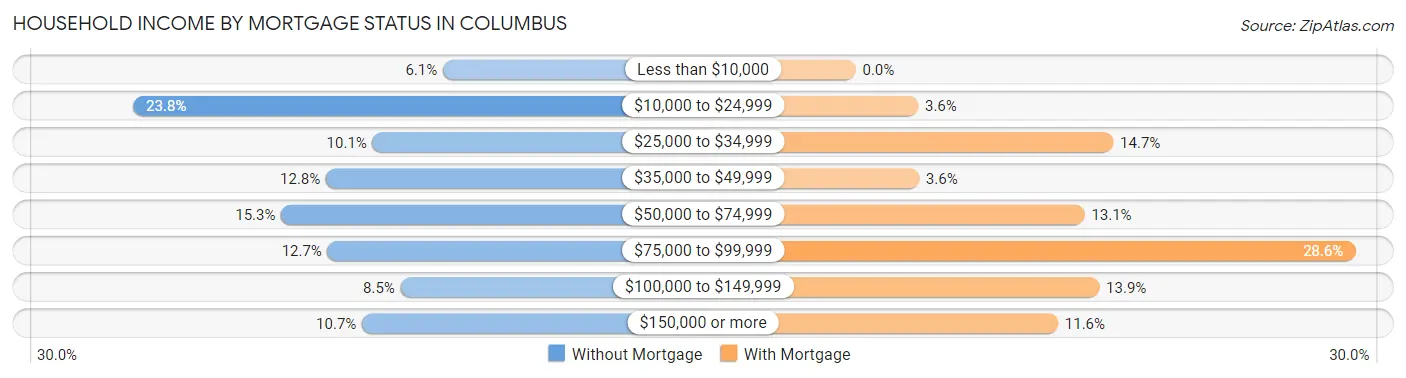
| Household Income | Without Mortgage | With Mortgage |
| Less than $10,000 | 133 (6.1%) | 0 (0.0%) |
| $10,000 to $24,999 | 520 (23.8%) | 85 (3.6%) |
| $25,000 to $34,999 | 221 (10.1%) | 350 (14.7%) |
| $35,000 to $49,999 | 279 (12.8%) | 86 (3.6%) |
| $50,000 to $74,999 | 335 (15.3%) | 311 (13.1%) |
| $75,000 to $99,999 | 277 (12.7%) | 679 (28.5%) |
| $100,000 to $149,999 | 186 (8.5%) | 331 (13.9%) |
| $150,000 or more | 234 (10.7%) | 275 (11.6%) |
| Total | 2,185 (100.0%) | 2,378 (100.0%) |
Property Value to Household Income Ratio in Columbus
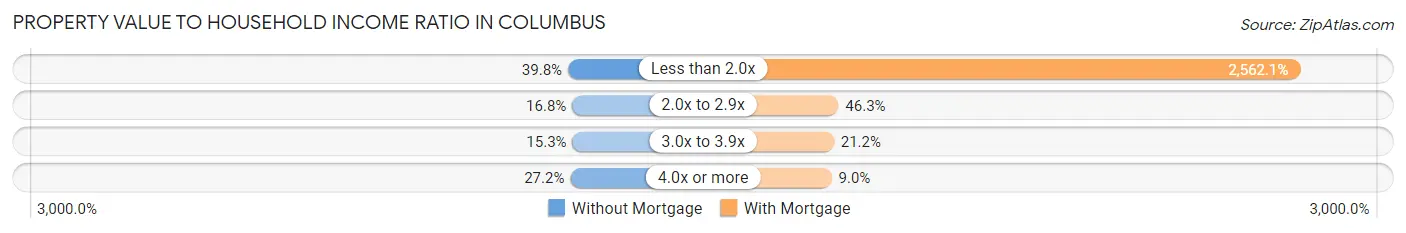
| Value-to-Income Ratio | Without Mortgage | With Mortgage |
| Less than 2.0x | 870 (39.8%) | 60,927 (2,562.1%) |
| 2.0x to 2.9x | 366 (16.8%) | 1,100 (46.3%) |
| 3.0x to 3.9x | 334 (15.3%) | 504 (21.2%) |
| 4.0x or more | 595 (27.2%) | 214 (9.0%) |
| Total | 2,185 (100.0%) | 2,378 (100.0%) |
Real Estate Taxes by Mortgage Status in Columbus
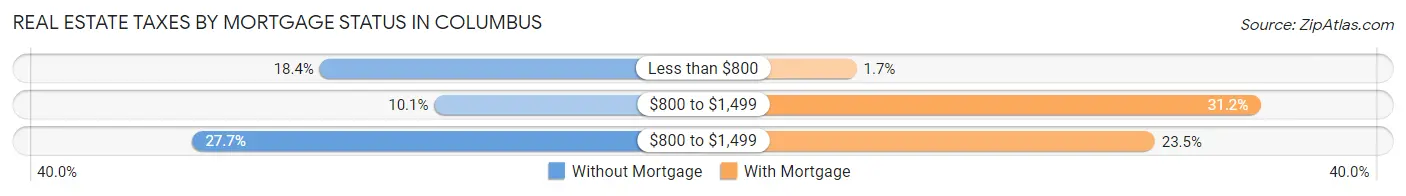
| Property Taxes | Without Mortgage | With Mortgage |
| Less than $800 | 403 (18.4%) | 41 (1.7%) |
| $800 to $1,499 | 220 (10.1%) | 742 (31.2%) |
| $800 to $1,499 | 606 (27.7%) | 559 (23.5%) |
| Total | 2,185 (100.0%) | 2,378 (100.0%) |
Health & Disability in Columbus
Health Insurance Coverage by Age in Columbus
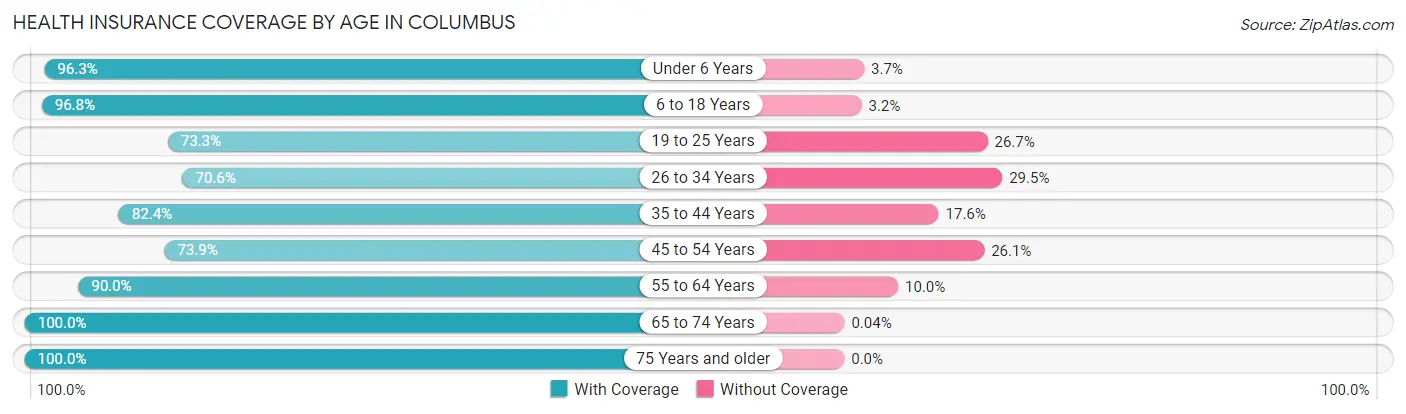
| Age Bracket | With Coverage | Without Coverage |
| Under 6 Years | 1,353 (96.3%) | 52 (3.7%) |
| 6 to 18 Years | 3,497 (96.8%) | 116 (3.2%) |
| 19 to 25 Years | 1,978 (73.3%) | 721 (26.7%) |
| 26 to 34 Years | 2,190 (70.6%) | 914 (29.4%) |
| 35 to 44 Years | 1,672 (82.4%) | 357 (17.6%) |
| 45 to 54 Years | 1,793 (73.9%) | 633 (26.1%) |
| 55 to 64 Years | 2,954 (90.0%) | 329 (10.0%) |
| 65 to 74 Years | 2,308 (100.0%) | 1 (0.0%) |
| 75 Years and older | 1,913 (100.0%) | 0 (0.0%) |
| Total | 19,658 (86.3%) | 3,123 (13.7%) |
Health Insurance Coverage by Citizenship Status in Columbus
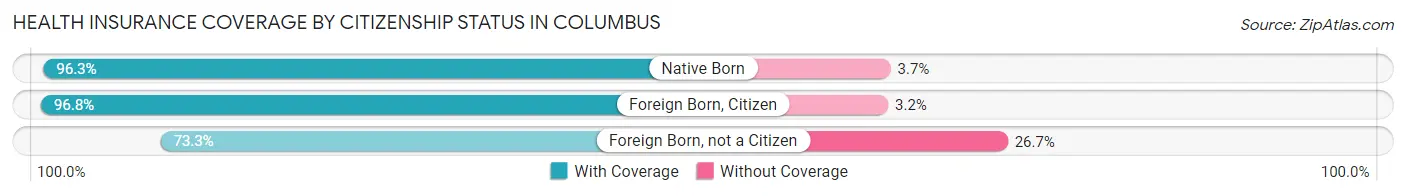
| Citizenship Status | With Coverage | Without Coverage |
| Native Born | 1,353 (96.3%) | 52 (3.7%) |
| Foreign Born, Citizen | 3,497 (96.8%) | 116 (3.2%) |
| Foreign Born, not a Citizen | 1,978 (73.3%) | 721 (26.7%) |
Health Insurance Coverage by Household Income in Columbus
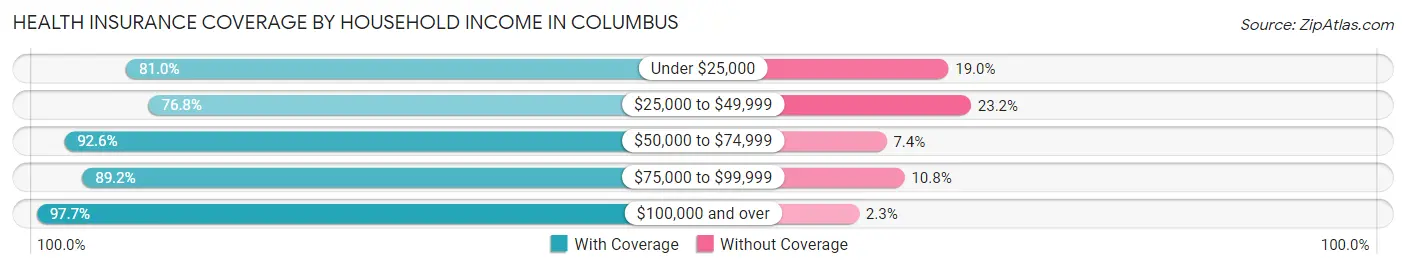
| Household Income | With Coverage | Without Coverage |
| Under $25,000 | 4,814 (81.0%) | 1,131 (19.0%) |
| $25,000 to $49,999 | 3,870 (76.8%) | 1,172 (23.2%) |
| $50,000 to $74,999 | 4,538 (92.6%) | 364 (7.4%) |
| $75,000 to $99,999 | 2,096 (89.2%) | 254 (10.8%) |
| $100,000 and over | 3,796 (97.7%) | 88 (2.3%) |
Public vs Private Health Insurance Coverage by Age in Columbus
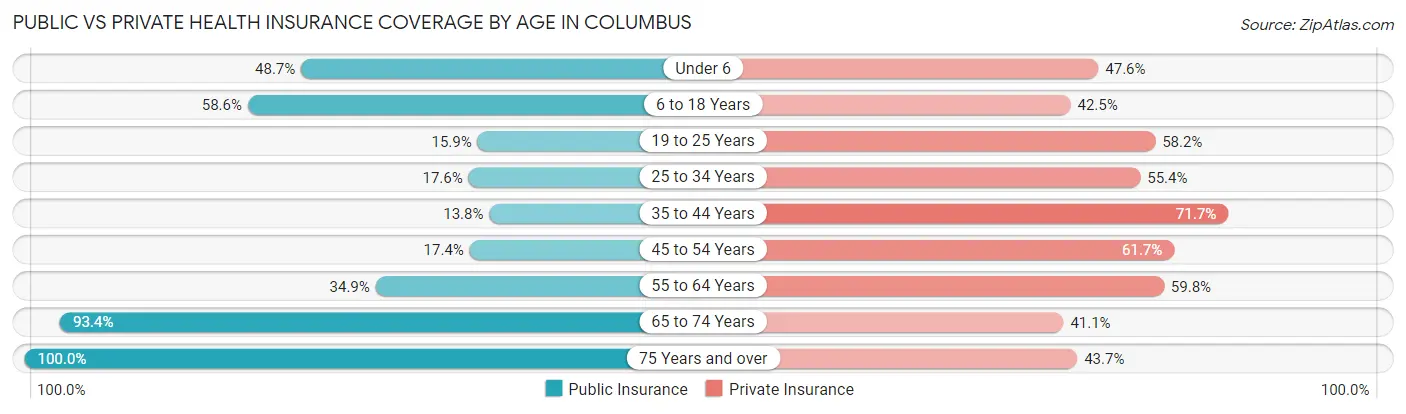
| Age Bracket | Public Insurance | Private Insurance |
| Under 6 | 684 (48.7%) | 669 (47.6%) |
| 6 to 18 Years | 2,116 (58.6%) | 1,534 (42.5%) |
| 19 to 25 Years | 430 (15.9%) | 1,570 (58.2%) |
| 25 to 34 Years | 546 (17.6%) | 1,720 (55.4%) |
| 35 to 44 Years | 279 (13.8%) | 1,455 (71.7%) |
| 45 to 54 Years | 422 (17.4%) | 1,496 (61.7%) |
| 55 to 64 Years | 1,144 (34.8%) | 1,963 (59.8%) |
| 65 to 74 Years | 2,157 (93.4%) | 950 (41.1%) |
| 75 Years and over | 1,913 (100.0%) | 836 (43.7%) |
| Total | 9,691 (42.5%) | 12,193 (53.5%) |
Disability Status by Sex by Age in Columbus
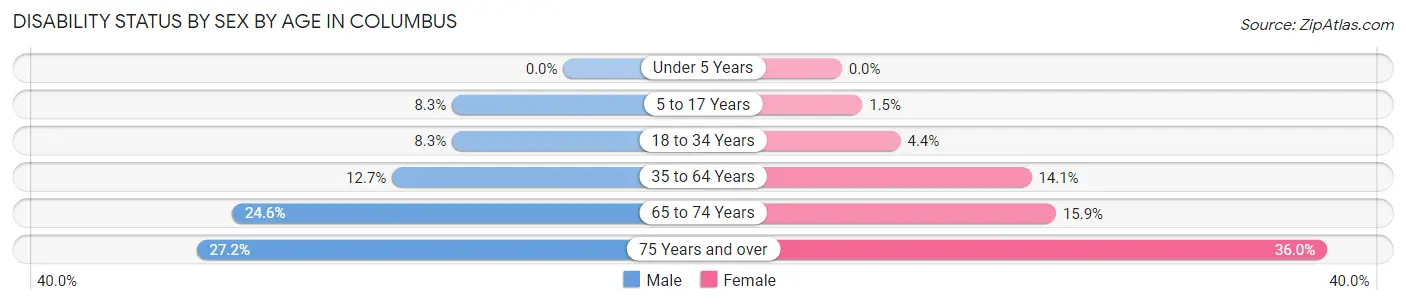
| Age Bracket | Male | Female |
| Under 5 Years | 0 (0.0%) | 0 (0.0%) |
| 5 to 17 Years | 152 (8.3%) | 26 (1.5%) |
| 18 to 34 Years | 212 (8.3%) | 154 (4.4%) |
| 35 to 64 Years | 459 (12.7%) | 581 (14.1%) |
| 65 to 74 Years | 257 (24.6%) | 201 (15.9%) |
| 75 Years and over | 174 (27.2%) | 459 (36.0%) |
Disability Class by Sex by Age in Columbus
Disability Class: Hearing Difficulty
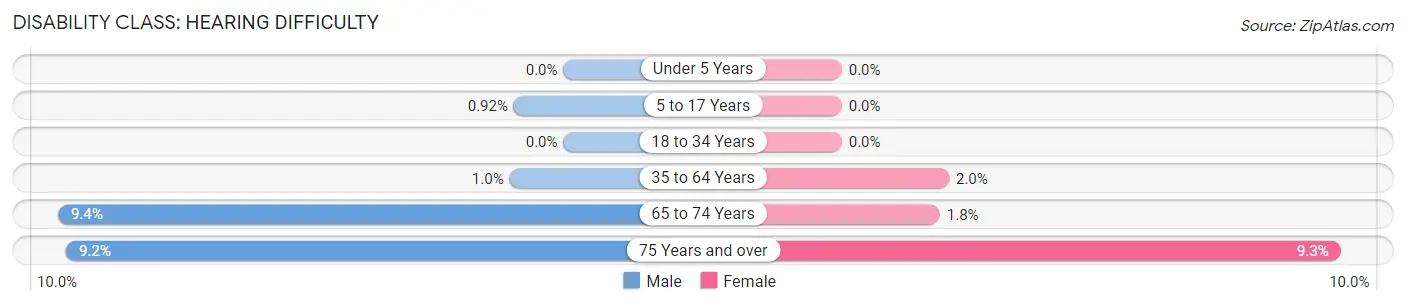
| Age Bracket | Male | Female |
| Under 5 Years | 0 (0.0%) | 0 (0.0%) |
| 5 to 17 Years | 17 (0.9%) | 0 (0.0%) |
| 18 to 34 Years | 0 (0.0%) | 0 (0.0%) |
| 35 to 64 Years | 36 (1.0%) | 82 (2.0%) |
| 65 to 74 Years | 98 (9.4%) | 23 (1.8%) |
| 75 Years and over | 59 (9.2%) | 118 (9.3%) |
Disability Class: Vision Difficulty
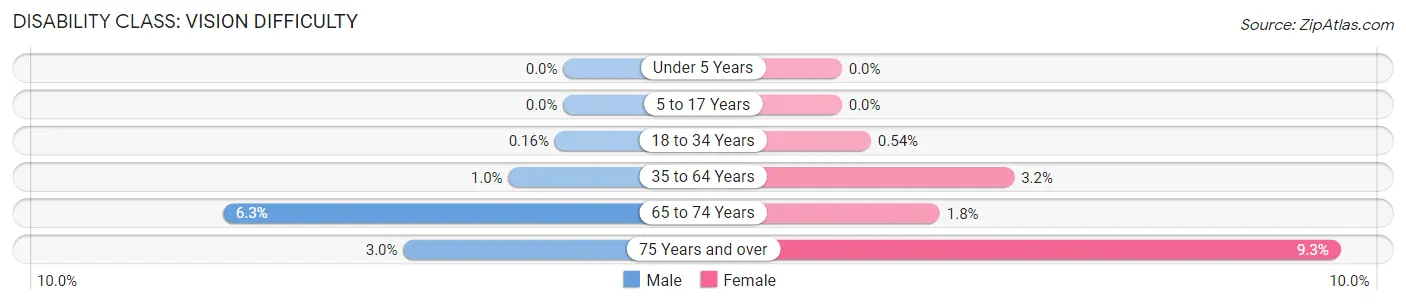
| Age Bracket | Male | Female |
| Under 5 Years | 0 (0.0%) | 0 (0.0%) |
| 5 to 17 Years | 0 (0.0%) | 0 (0.0%) |
| 18 to 34 Years | 4 (0.2%) | 19 (0.5%) |
| 35 to 64 Years | 37 (1.0%) | 132 (3.2%) |
| 65 to 74 Years | 66 (6.3%) | 23 (1.8%) |
| 75 Years and over | 19 (3.0%) | 118 (9.3%) |
Disability Class: Cognitive Difficulty
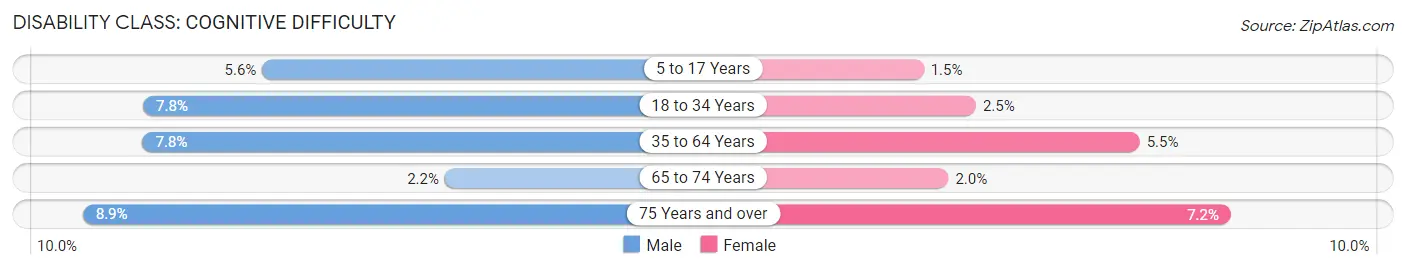
| Age Bracket | Male | Female |
| 5 to 17 Years | 103 (5.6%) | 26 (1.5%) |
| 18 to 34 Years | 200 (7.8%) | 88 (2.5%) |
| 35 to 64 Years | 282 (7.8%) | 228 (5.5%) |
| 65 to 74 Years | 23 (2.2%) | 25 (2.0%) |
| 75 Years and over | 57 (8.9%) | 92 (7.2%) |
Disability Class: Ambulatory Difficulty
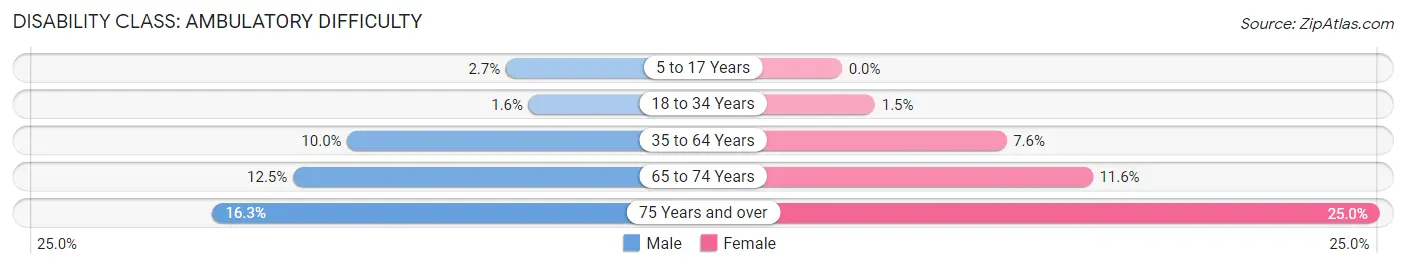
| Age Bracket | Male | Female |
| 5 to 17 Years | 49 (2.7%) | 0 (0.0%) |
| 18 to 34 Years | 41 (1.6%) | 54 (1.5%) |
| 35 to 64 Years | 362 (10.0%) | 315 (7.6%) |
| 65 to 74 Years | 131 (12.5%) | 147 (11.6%) |
| 75 Years and over | 104 (16.3%) | 318 (25.0%) |
Disability Class: Self-Care Difficulty
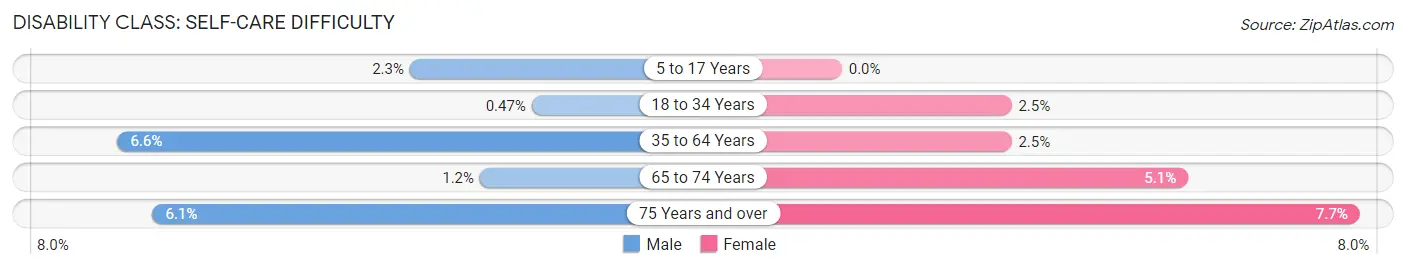
| Age Bracket | Male | Female |
| 5 to 17 Years | 42 (2.3%) | 0 (0.0%) |
| 18 to 34 Years | 12 (0.5%) | 89 (2.5%) |
| 35 to 64 Years | 239 (6.6%) | 104 (2.5%) |
| 65 to 74 Years | 13 (1.2%) | 65 (5.1%) |
| 75 Years and over | 39 (6.1%) | 98 (7.7%) |
Technology Access in Columbus
Computing Device Access in Columbus
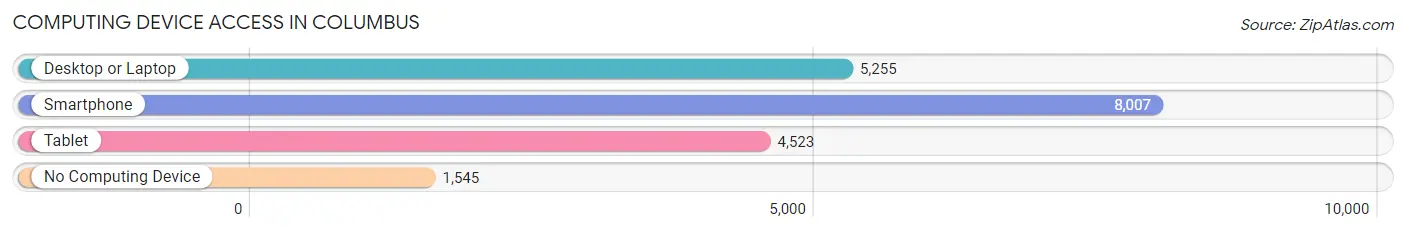
| Device Type | # Households | % Households |
| Desktop or Laptop | 5,255 | 53.3% |
| Smartphone | 8,007 | 81.2% |
| Tablet | 4,523 | 45.9% |
| No Computing Device | 1,545 | 15.7% |
| Total | 9,865 | 100.0% |
Internet Access in Columbus
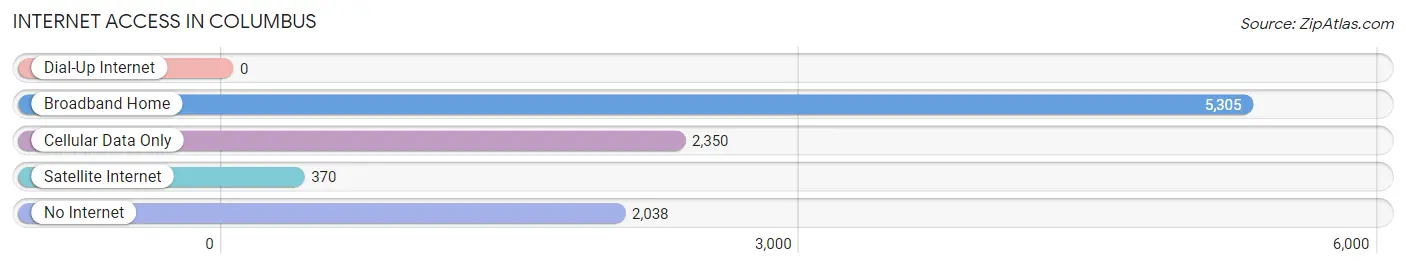
| Internet Type | # Households | % Households |
| Dial-Up Internet | 0 | 0.0% |
| Broadband Home | 5,305 | 53.8% |
| Cellular Data Only | 2,350 | 23.8% |
| Satellite Internet | 370 | 3.7% |
| No Internet | 2,038 | 20.7% |
| Total | 9,865 | 100.0% |
Columbus Summary
Columbus, Mississippi is a city located in Lowndes County in the northeastern part of the state. It is the county seat and the largest city in the county. The city is situated on the banks of the Tombigbee River and is part of the Golden Triangle region of Mississippi, which includes the cities of Starkville and West Point. The city is home to Mississippi University for Women, Mississippi State University-Meridian, and East Mississippi Community College.
History
The area that is now Columbus was first inhabited by the Choctaw Indians. The first European settlers arrived in the area in the early 1800s. The city was founded in 1821 and named after Christopher Columbus. It was incorporated in 1822 and became the county seat of Lowndes County in 1825.
During the Civil War, Columbus was a major supply center for the Confederate Army. The city was the site of several battles, including the Battle of Shiloh in 1862. After the war, the city experienced a period of growth and prosperity. The city was home to several large industries, including a cotton mill, a lumber mill, and a brick factory.
In the late 19th century, the city was a major railroad hub. The city was also home to several large cotton plantations. In the early 20th century, the city experienced a period of decline due to the boll weevil infestation and the Great Depression.
Geography
Columbus is located in northeastern Mississippi, approximately 100 miles northeast of Jackson. The city is situated on the banks of the Tombigbee River and is part of the Golden Triangle region of Mississippi, which includes the cities of Starkville and West Point. The city is located in the Black Belt region of the state, which is characterized by its rich, fertile soil.
The city has a total area of 24.3 square miles, of which 24.2 square miles is land and 0.1 square miles is water. The city is located in the humid subtropical climate zone, with hot, humid summers and mild winters.
Economy
The economy of Columbus is largely based on manufacturing, healthcare, and education. The city is home to several large manufacturing companies, including Columbus Castings, a steel foundry, and Columbus Coated Fabrics, a textile manufacturer. The city is also home to several healthcare facilities, including Baptist Memorial Hospital-Golden Triangle and the Columbus VA Medical Center.
The city is home to several educational institutions, including Mississippi University for Women, Mississippi State University-Meridian, and East Mississippi Community College. The city is also home to several large employers, including the Columbus Air Force Base and the Columbus-Lowndes County Industrial Park.
Demographics
As of the 2010 census, the population of Columbus was 25,944. The racial makeup of the city was 57.3% White, 39.3% African American, 0.3% Native American, 0.7% Asian, 0.1% Pacific Islander, 1.2% from other races, and 1.2% from two or more races. Hispanic or Latino of any race were 2.7% of the population.
The median household income in the city was $33,945, and the median family income was $41,919. The per capita income in the city was $19,845. About 19.3% of the population was below the poverty line.
Common Questions
What is Per Capita Income in Columbus?
Per Capita income in Columbus is $26,874.
What is the Median Family Income in Columbus?
Median Family Income in Columbus is $55,016.
What is the Median Household income in Columbus?
Median Household Income in Columbus is $38,954.
What is Income or Wage Gap in Columbus?
Income or Wage Gap in Columbus is 19.9%.
Women in Columbus earn 80.1 cents for every dollar earned by a man.
What is Family Income Deficit in Columbus?
Family Income Deficit in Columbus is $13,369.
Families that are below poverty line in Columbus earn $13,369 less on average than the poverty threshold level.
What is Inequality or Gini Index in Columbus?
Inequality or Gini Index in Columbus is 0.53.
What is the Total Population of Columbus?
Total Population of Columbus is 23,896.
What is the Total Male Population of Columbus?
Total Male Population of Columbus is 11,011.
What is the Total Female Population of Columbus?
Total Female Population of Columbus is 12,885.
What is the Ratio of Males per 100 Females in Columbus?
There are 85.46 Males per 100 Females in Columbus.
What is the Ratio of Females per 100 Males in Columbus?
There are 117.02 Females per 100 Males in Columbus.
What is the Median Population Age in Columbus?
Median Population Age in Columbus is 38.5 Years.
What is the Average Family Size in Columbus
Average Family Size in Columbus is 3.2 People.
What is the Average Household Size in Columbus
Average Household Size in Columbus is 2.3 People.
How Large is the Labor Force in Columbus?
There are 10,404 People in the Labor Forcein in Columbus.
What is the Percentage of People in the Labor Force in Columbus?
53.2% of People are in the Labor Force in Columbus.
What is the Unemployment Rate in Columbus?
Unemployment Rate in Columbus is 9.8%.