Vicksburg, MS Map & Demographics
Vicksburg Map
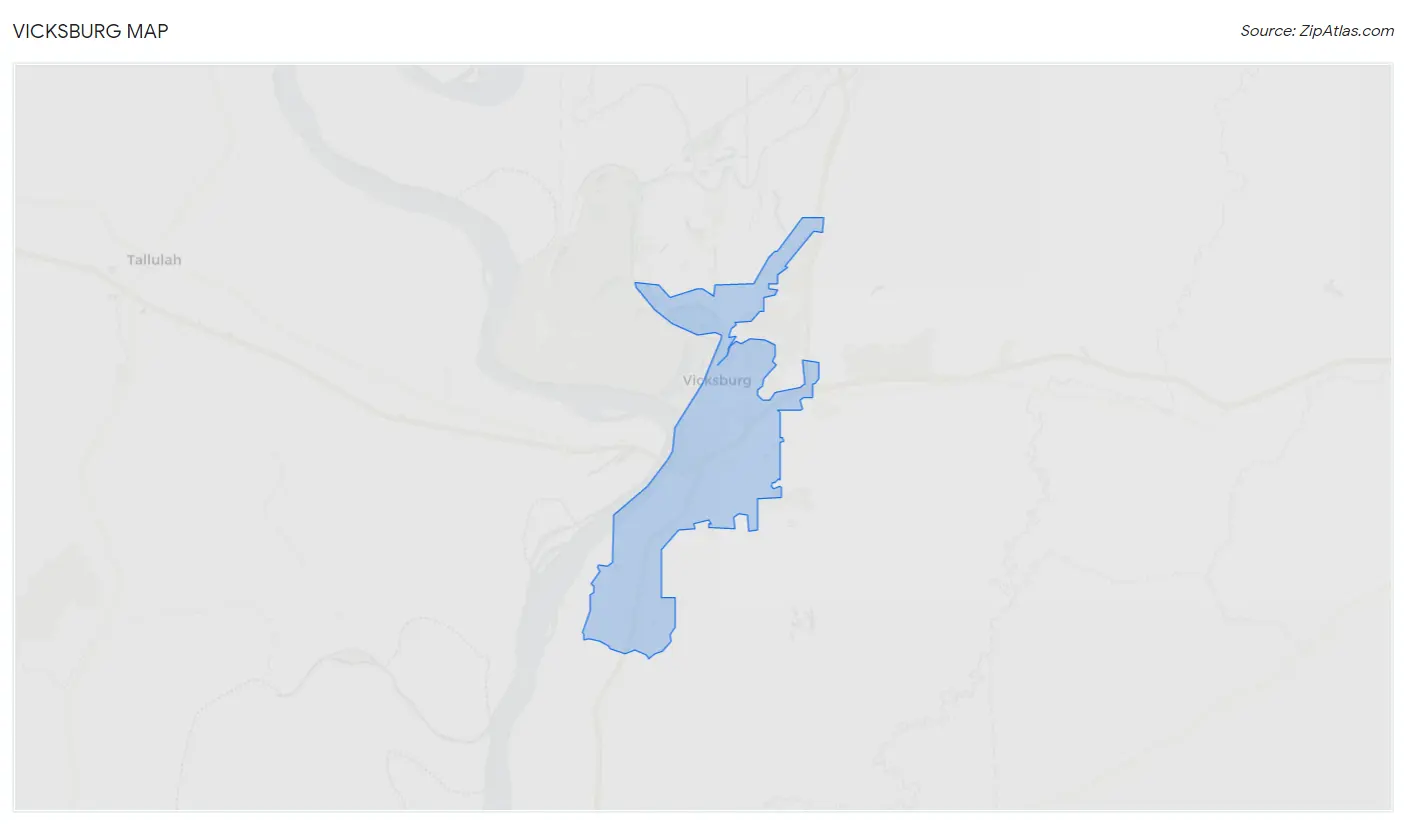
Vicksburg Overview
$27,816
PER CAPITA INCOME
$57,337
AVG FAMILY INCOME
$45,147
AVG HOUSEHOLD INCOME
18.8%
WAGE / INCOME GAP [ % ]
81.2¢/ $1
WAGE / INCOME GAP [ $ ]
$11,526
FAMILY INCOME DEFICIT
0.52
INEQUALITY / GINI INDEX
21,337
TOTAL POPULATION
10,226
MALE POPULATION
11,111
FEMALE POPULATION
92.03
MALES / 100 FEMALES
108.65
FEMALES / 100 MALES
37.6
MEDIAN AGE
3.6
AVG FAMILY SIZE
2.6
AVG HOUSEHOLD SIZE
9,233
LABOR FORCE [ PEOPLE ]
55.7%
PERCENT IN LABOR FORCE
6.7%
UNEMPLOYMENT RATE
Income in Vicksburg
Income Overview in Vicksburg
Per Capita Income in Vicksburg is $27,816, while median incomes of families and households are $57,337 and $45,147 respectively.
| Characteristic | Number | Measure |
| Per Capita Income | 21,337 | $27,816 |
| Median Family Income | 4,441 | $57,337 |
| Mean Family Income | 4,441 | $82,272 |
| Median Household Income | 8,092 | $45,147 |
| Mean Household Income | 8,092 | $67,863 |
| Income Deficit | 4,441 | $11,526 |
| Wage / Income Gap (%) | 21,337 | 18.85% |
| Wage / Income Gap ($) | 21,337 | 81.15¢ per $1 |
| Gini / Inequality Index | 21,337 | 0.52 |
Earnings by Sex in Vicksburg
Average Earnings in Vicksburg are $30,013, $34,346 for men and $27,872 for women, a difference of 18.9%.
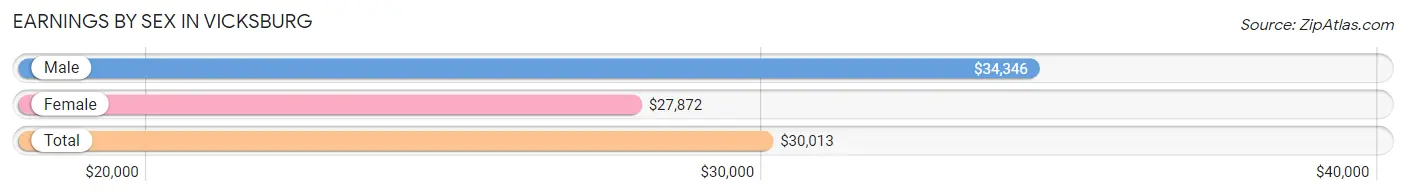
| Sex | Number | Average Earnings |
| Male | 4,586 (47.4%) | $34,346 |
| Female | 5,081 (52.6%) | $27,872 |
| Total | 9,667 (100.0%) | $30,013 |
Earnings by Sex by Income Bracket in Vicksburg
The most common earnings brackets in Vicksburg are $100,000+ for men (610 | 13.3%) and $2,499 or less for women (516 | 10.2%).
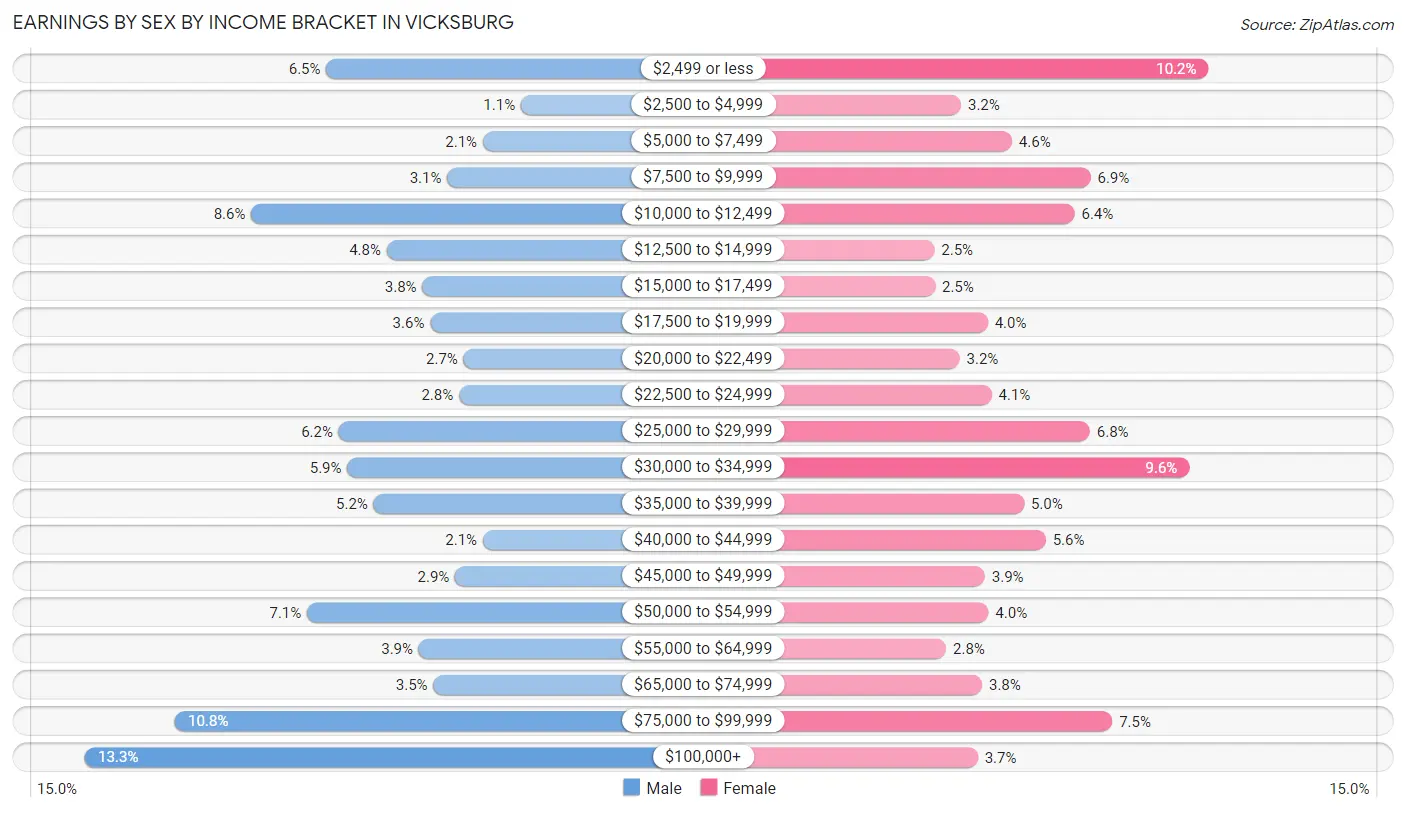
| Income | Male | Female |
| $2,499 or less | 299 (6.5%) | 516 (10.2%) |
| $2,500 to $4,999 | 48 (1.1%) | 163 (3.2%) |
| $5,000 to $7,499 | 97 (2.1%) | 236 (4.6%) |
| $7,500 to $9,999 | 143 (3.1%) | 348 (6.9%) |
| $10,000 to $12,499 | 396 (8.6%) | 325 (6.4%) |
| $12,500 to $14,999 | 221 (4.8%) | 125 (2.5%) |
| $15,000 to $17,499 | 175 (3.8%) | 126 (2.5%) |
| $17,500 to $19,999 | 165 (3.6%) | 201 (4.0%) |
| $20,000 to $22,499 | 122 (2.7%) | 161 (3.2%) |
| $22,500 to $24,999 | 128 (2.8%) | 207 (4.1%) |
| $25,000 to $29,999 | 283 (6.2%) | 347 (6.8%) |
| $30,000 to $34,999 | 272 (5.9%) | 489 (9.6%) |
| $35,000 to $39,999 | 238 (5.2%) | 253 (5.0%) |
| $40,000 to $44,999 | 97 (2.1%) | 284 (5.6%) |
| $45,000 to $49,999 | 133 (2.9%) | 197 (3.9%) |
| $50,000 to $54,999 | 324 (7.1%) | 202 (4.0%) |
| $55,000 to $64,999 | 180 (3.9%) | 142 (2.8%) |
| $65,000 to $74,999 | 161 (3.5%) | 193 (3.8%) |
| $75,000 to $99,999 | 494 (10.8%) | 379 (7.5%) |
| $100,000+ | 610 (13.3%) | 187 (3.7%) |
| Total | 4,586 (100.0%) | 5,081 (100.0%) |
Earnings by Sex by Educational Attainment in Vicksburg
Average earnings in Vicksburg are $36,590 for men and $30,251 for women, a difference of 17.3%. Men with an educational attainment of bachelor's degree enjoy the highest average annual earnings of $85,640, while those with less than high school education earn the least with $14,896. Women with an educational attainment of graduate degree earn the most with the average annual earnings of $54,432, while those with high school diploma education have the smallest earnings of $20,110.
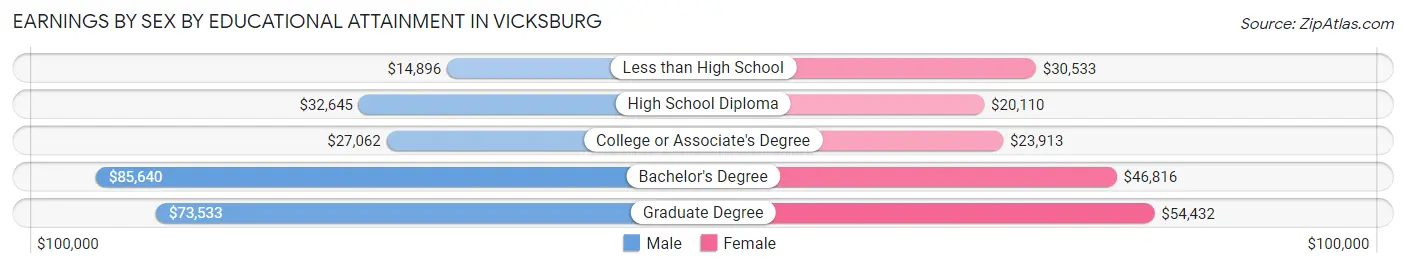
| Educational Attainment | Male Income | Female Income |
| Less than High School | $14,896 | $30,533 |
| High School Diploma | $32,645 | $20,110 |
| College or Associate's Degree | $27,062 | $23,913 |
| Bachelor's Degree | $85,640 | $46,816 |
| Graduate Degree | $73,533 | $54,432 |
| Total | $36,590 | $30,251 |
Family Income in Vicksburg
Family Income Brackets in Vicksburg
According to the Vicksburg family income data, there are 768 families falling into the $50,000 to $74,999 income range, which is the most common income bracket and makes up 17.3% of all families. Conversely, the $10,000 to $14,999 income bracket is the least frequent group with only 231 families (5.2%) belonging to this category.
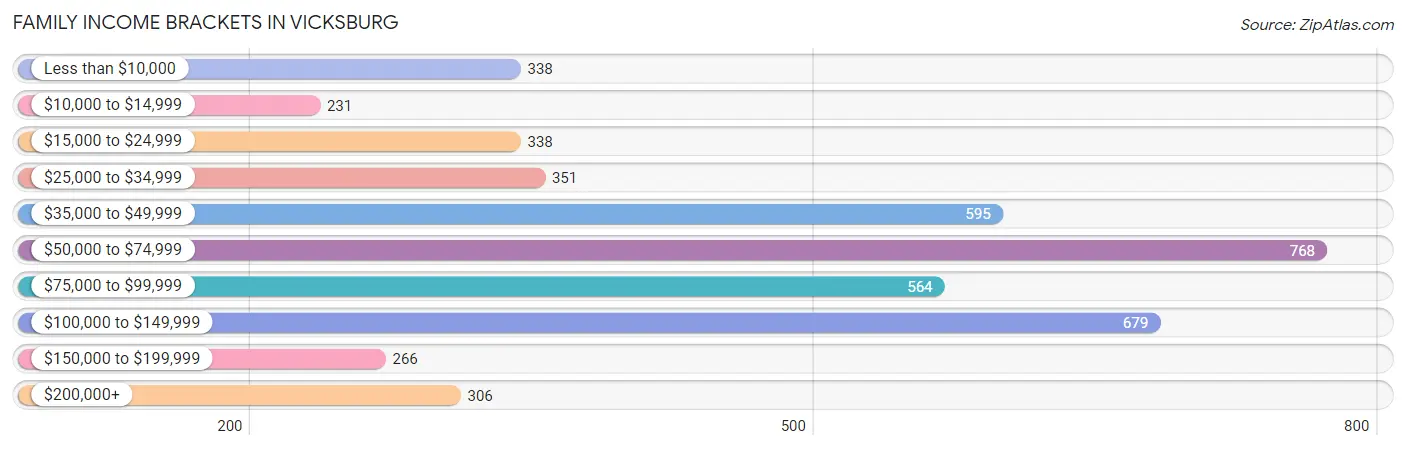
| Income Bracket | # Families | % Families |
| Less than $10,000 | 338 | 7.6% |
| $10,000 to $14,999 | 231 | 5.2% |
| $15,000 to $24,999 | 338 | 7.6% |
| $25,000 to $34,999 | 351 | 7.9% |
| $35,000 to $49,999 | 595 | 13.4% |
| $50,000 to $74,999 | 768 | 17.3% |
| $75,000 to $99,999 | 564 | 12.7% |
| $100,000 to $149,999 | 679 | 15.3% |
| $150,000 to $199,999 | 266 | 6.0% |
| $200,000+ | 306 | 6.9% |
Family Income by Famaliy Size in Vicksburg
6-person families (118 | 2.7%) account for the highest median family income in Vicksburg with $131,938 per family, while 2-person families (2,223 | 50.1%) have the highest median income of $28,556 per family member.
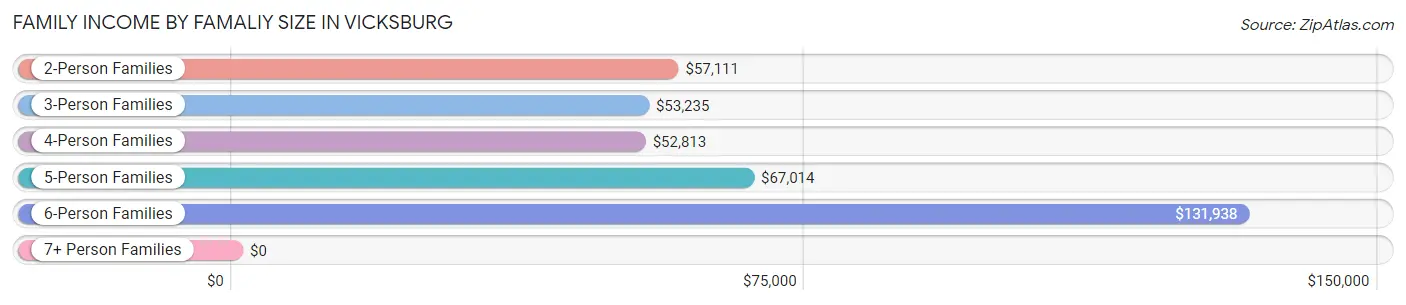
| Income Bracket | # Families | Median Income |
| 2-Person Families | 2,223 (50.1%) | $57,111 |
| 3-Person Families | 1,106 (24.9%) | $53,235 |
| 4-Person Families | 706 (15.9%) | $52,813 |
| 5-Person Families | 261 (5.9%) | $67,014 |
| 6-Person Families | 118 (2.7%) | $131,938 |
| 7+ Person Families | 27 (0.6%) | $0 |
| Total | 4,441 (100.0%) | $57,337 |
Family Income by Number of Earners in Vicksburg
The median family income in Vicksburg is $57,337, with families comprising 2 earners (1,171) having the highest median family income of $113,854, while families with 1 earner (1,847) have the lowest median family income of $39,688, accounting for 26.4% and 41.6% of families, respectively.
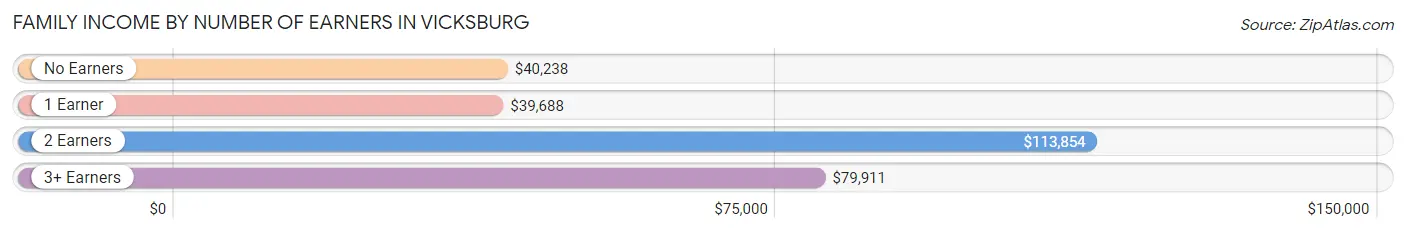
| Number of Earners | # Families | Median Income |
| No Earners | 924 (20.8%) | $40,238 |
| 1 Earner | 1,847 (41.6%) | $39,688 |
| 2 Earners | 1,171 (26.4%) | $113,854 |
| 3+ Earners | 499 (11.2%) | $79,911 |
| Total | 4,441 (100.0%) | $57,337 |
Household Income in Vicksburg
Household Income Brackets in Vicksburg
With 1,392 households falling in the category, the $50,000 to $74,999 income range is the most frequent in Vicksburg, accounting for 17.2% of all households. In contrast, only 388 households (4.8%) fall into the $200,000+ income bracket, making it the least populous group.
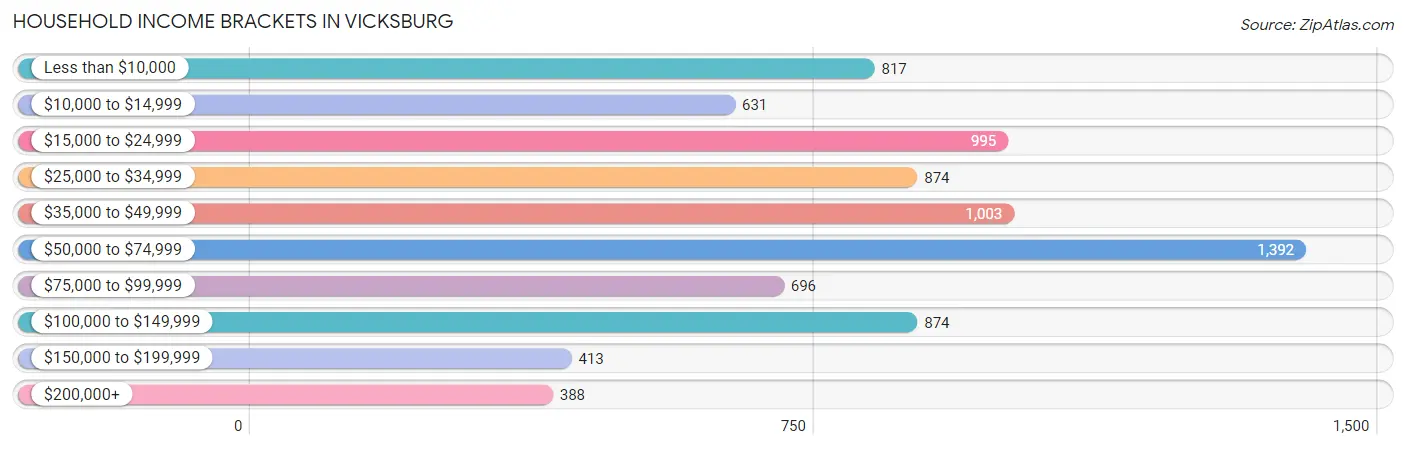
| Income Bracket | # Households | % Households |
| Less than $10,000 | 817 | 10.1% |
| $10,000 to $14,999 | 631 | 7.8% |
| $15,000 to $24,999 | 995 | 12.3% |
| $25,000 to $34,999 | 874 | 10.8% |
| $35,000 to $49,999 | 1,003 | 12.4% |
| $50,000 to $74,999 | 1,392 | 17.2% |
| $75,000 to $99,999 | 696 | 8.6% |
| $100,000 to $149,999 | 874 | 10.8% |
| $150,000 to $199,999 | 413 | 5.1% |
| $200,000+ | 388 | 4.8% |
Household Income by Householder Age in Vicksburg
The median household income in Vicksburg is $45,147, with the highest median household income of $46,399 found in the 45 to 64 years age bracket for the primary householder. A total of 3,159 households (39.0%) fall into this category. Meanwhile, the 15 to 24 years age bracket for the primary householder has the lowest median household income of $0, with 127 households (1.6%) in this group.
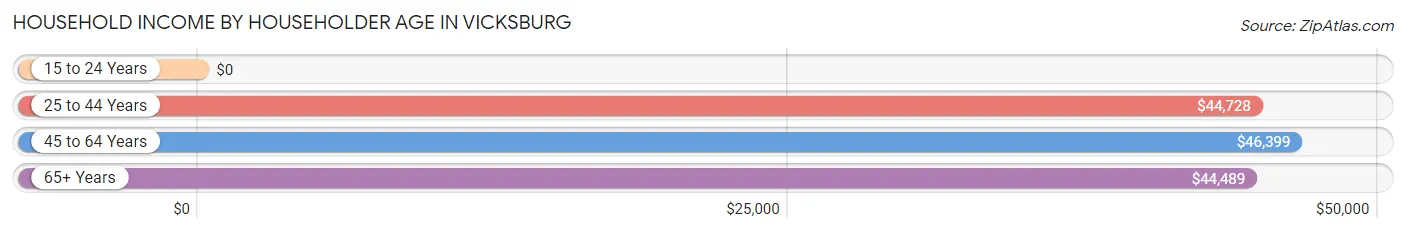
| Income Bracket | # Households | Median Income |
| 15 to 24 Years | 127 (1.6%) | $0 |
| 25 to 44 Years | 2,577 (31.9%) | $44,728 |
| 45 to 64 Years | 3,159 (39.0%) | $46,399 |
| 65+ Years | 2,229 (27.6%) | $44,489 |
| Total | 8,092 (100.0%) | $45,147 |
Poverty in Vicksburg
Income Below Poverty by Sex and Age in Vicksburg
With 23.7% poverty level for males and 27.2% for females among the residents of Vicksburg, 5 year old males and under 5 year old females are the most vulnerable to poverty, with 168 males (49.7%) and 358 females (55.3%) in their respective age groups living below the poverty level.
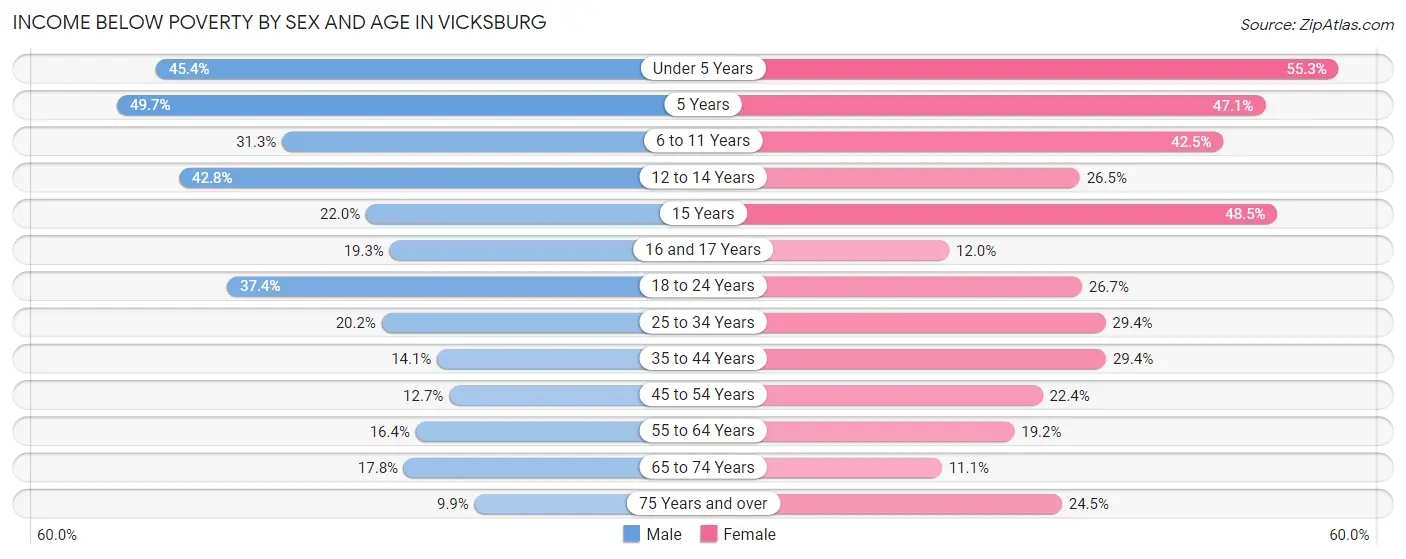
| Age Bracket | Male | Female |
| Under 5 Years | 342 (45.4%) | 358 (55.3%) |
| 5 Years | 168 (49.7%) | 33 (47.1%) |
| 6 to 11 Years | 201 (31.3%) | 368 (42.5%) |
| 12 to 14 Years | 282 (42.8%) | 84 (26.5%) |
| 15 Years | 29 (22.0%) | 98 (48.5%) |
| 16 and 17 Years | 53 (19.3%) | 41 (11.9%) |
| 18 to 24 Years | 255 (37.4%) | 267 (26.7%) |
| 25 to 34 Years | 215 (20.2%) | 468 (29.4%) |
| 35 to 44 Years | 218 (14.1%) | 368 (29.4%) |
| 45 to 54 Years | 132 (12.7%) | 300 (22.4%) |
| 55 to 64 Years | 232 (16.4%) | 296 (19.2%) |
| 65 to 74 Years | 171 (17.8%) | 112 (11.1%) |
| 75 Years and over | 34 (9.9%) | 195 (24.5%) |
| Total | 2,332 (23.7%) | 2,988 (27.2%) |
Income Above Poverty by Sex and Age in Vicksburg
According to the poverty statistics in Vicksburg, males aged 75 years and over and females aged 65 to 74 years are the age groups that are most secure financially, with 90.1% of males and 88.9% of females in these age groups living above the poverty line.
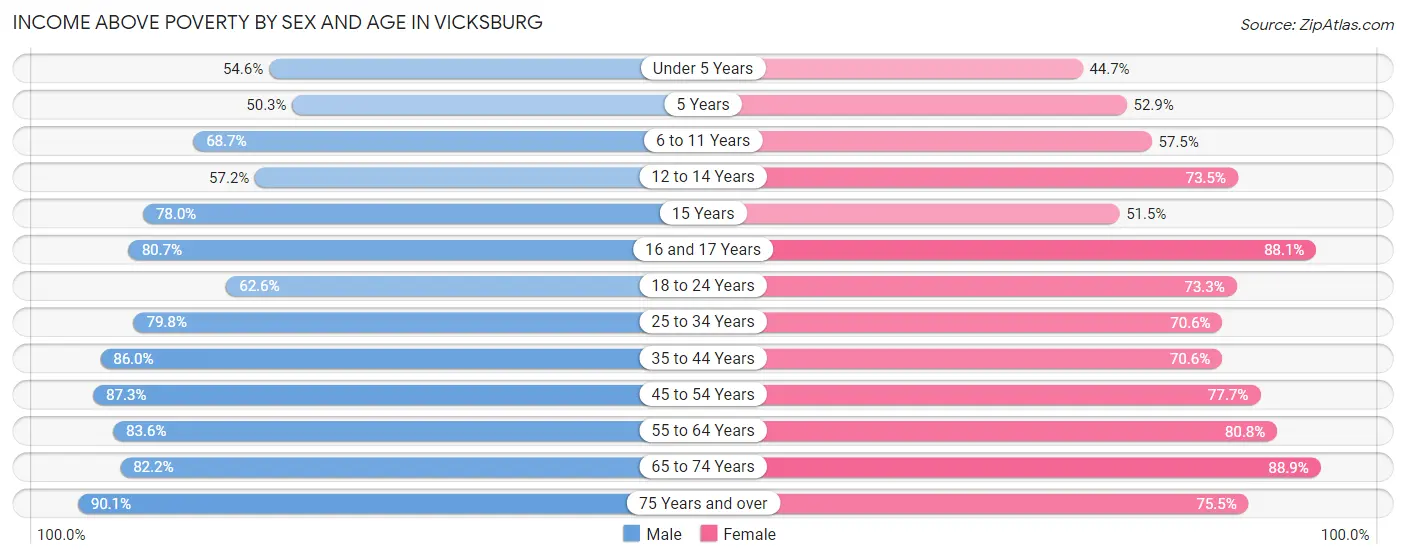
| Age Bracket | Male | Female |
| Under 5 Years | 412 (54.6%) | 289 (44.7%) |
| 5 Years | 170 (50.3%) | 37 (52.9%) |
| 6 to 11 Years | 441 (68.7%) | 498 (57.5%) |
| 12 to 14 Years | 377 (57.2%) | 233 (73.5%) |
| 15 Years | 103 (78.0%) | 104 (51.5%) |
| 16 and 17 Years | 221 (80.7%) | 302 (88.0%) |
| 18 to 24 Years | 426 (62.6%) | 732 (73.3%) |
| 25 to 34 Years | 848 (79.8%) | 1,126 (70.6%) |
| 35 to 44 Years | 1,334 (86.0%) | 883 (70.6%) |
| 45 to 54 Years | 906 (87.3%) | 1,042 (77.6%) |
| 55 to 64 Years | 1,179 (83.6%) | 1,245 (80.8%) |
| 65 to 74 Years | 792 (82.2%) | 894 (88.9%) |
| 75 Years and over | 310 (90.1%) | 601 (75.5%) |
| Total | 7,519 (76.3%) | 7,986 (72.8%) |
Income Below Poverty Among Married-Couple Families in Vicksburg
The poverty statistics for married-couple families in Vicksburg show that 8.8% or 203 of the total 2,312 families live below the poverty line. Families with 5 or more children have the highest poverty rate of 100.0%, comprising of 10 families. On the other hand, families with 3 or 4 children have the lowest poverty rate of 0.0%, which includes 0 families.
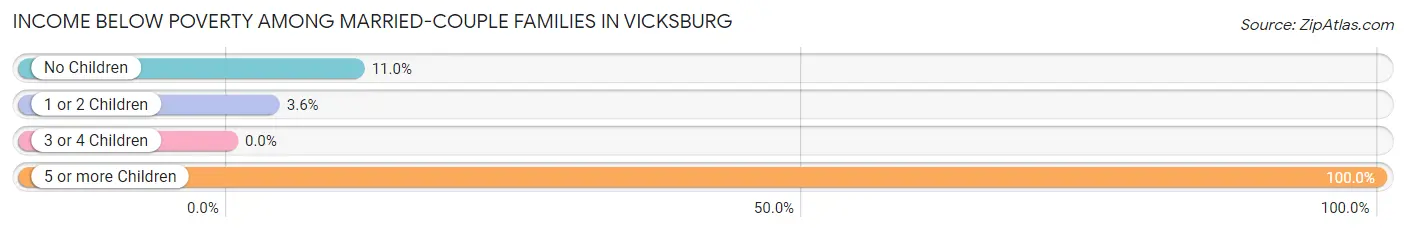
| Children | Above Poverty | Below Poverty |
| No Children | 1,404 (89.0%) | 174 (11.0%) |
| 1 or 2 Children | 503 (96.4%) | 19 (3.6%) |
| 3 or 4 Children | 202 (100.0%) | 0 (0.0%) |
| 5 or more Children | 0 (0.0%) | 10 (100.0%) |
| Total | 2,109 (91.2%) | 203 (8.8%) |
Income Below Poverty Among Single-Parent Households in Vicksburg
According to the poverty data in Vicksburg, 14.0% or 40 single-father households and 34.6% or 638 single-mother households are living below the poverty line. Among single-father households, those with no children have the highest poverty rate, with 31 households (17.5%) experiencing poverty. Likewise, among single-mother households, those with 5 or more children have the highest poverty rate, with 16 households (100.0%) falling below the poverty line.
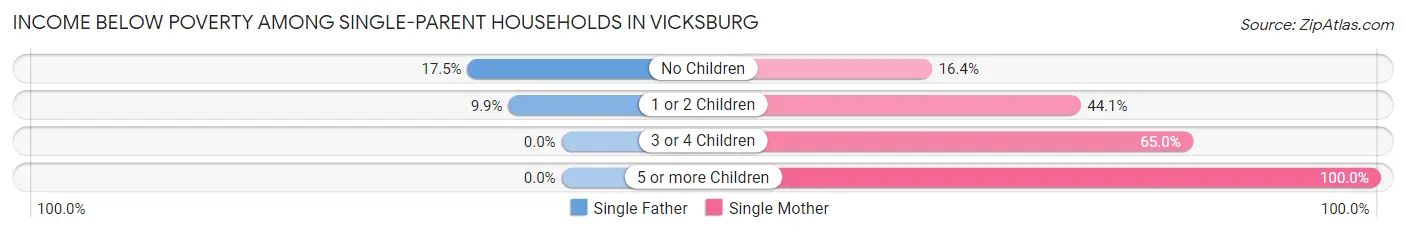
| Children | Single Father | Single Mother |
| No Children | 31 (17.5%) | 133 (16.4%) |
| 1 or 2 Children | 9 (9.9%) | 361 (44.1%) |
| 3 or 4 Children | 0 (0.0%) | 128 (65.0%) |
| 5 or more Children | 0 (0.0%) | 16 (100.0%) |
| Total | 40 (14.0%) | 638 (34.6%) |
Income Below Poverty Among Married-Couple vs Single-Parent Households in Vicksburg
The poverty data for Vicksburg shows that 203 of the married-couple family households (8.8%) and 678 of the single-parent households (31.9%) are living below the poverty level. Within the married-couple family households, those with 5 or more children have the highest poverty rate, with 10 households (100.0%) falling below the poverty line. Among the single-parent households, those with 5 or more children have the highest poverty rate, with 16 household (100.0%) living below poverty.
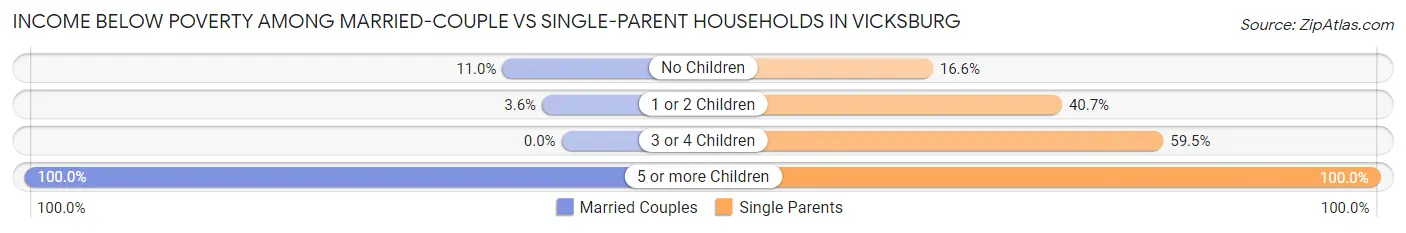
| Children | Married-Couple Families | Single-Parent Households |
| No Children | 174 (11.0%) | 164 (16.6%) |
| 1 or 2 Children | 19 (3.6%) | 370 (40.7%) |
| 3 or 4 Children | 0 (0.0%) | 128 (59.5%) |
| 5 or more Children | 10 (100.0%) | 16 (100.0%) |
| Total | 203 (8.8%) | 678 (31.9%) |
Race in Vicksburg
The most populous races in Vicksburg are Black / African American (14,659 | 68.7%), White / Caucasian (5,931 | 27.8%), and Two or more Races (614 | 2.9%).
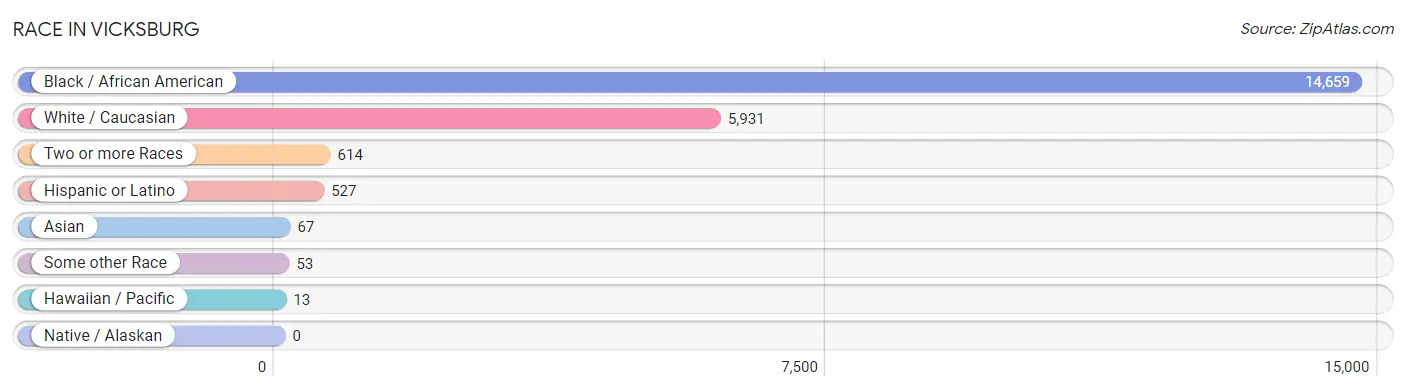
| Race | # Population | % Population |
| Asian | 67 | 0.3% |
| Black / African American | 14,659 | 68.7% |
| Hawaiian / Pacific | 13 | 0.1% |
| Hispanic or Latino | 527 | 2.5% |
| Native / Alaskan | 0 | 0.0% |
| White / Caucasian | 5,931 | 27.8% |
| Two or more Races | 614 | 2.9% |
| Some other Race | 53 | 0.3% |
| Total | 21,337 | 100.0% |
Ancestry in Vicksburg
The most populous ancestries reported in Vicksburg are American (1,521 | 7.1%), English (1,176 | 5.5%), Irish (714 | 3.4%), German (643 | 3.0%), and Italian (349 | 1.6%), together accounting for 20.6% of all Vicksburg residents.
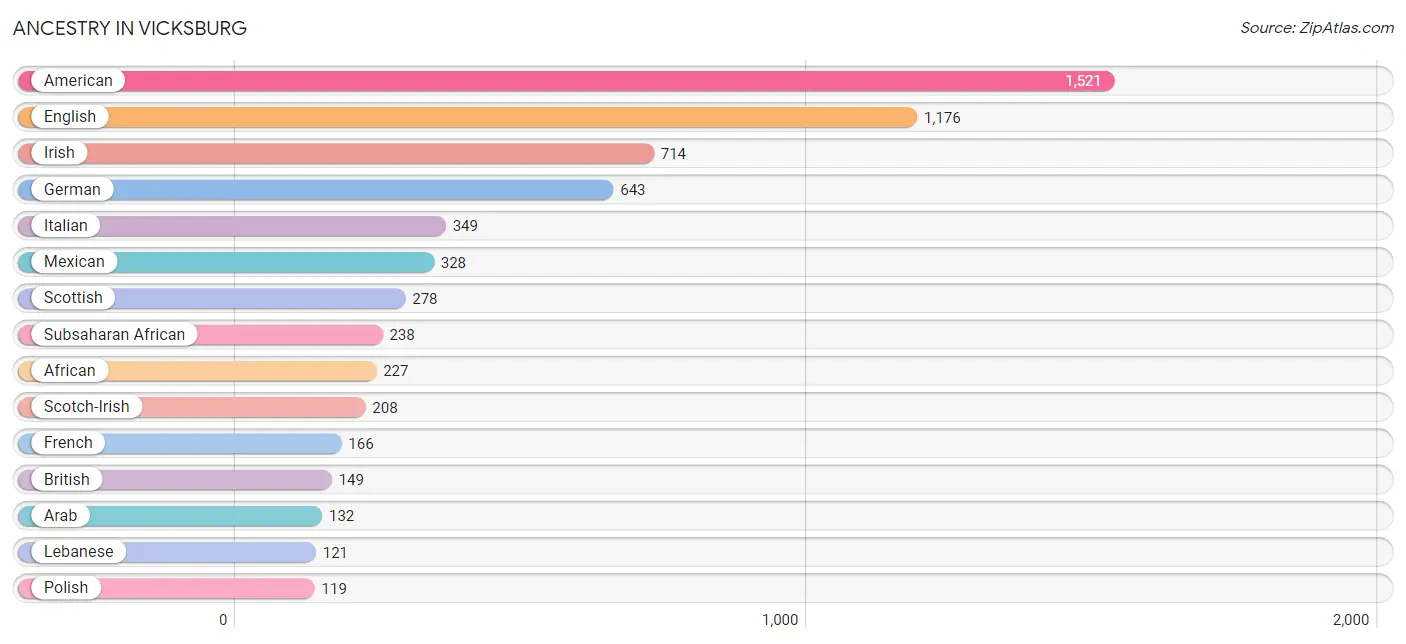
| Ancestry | # Population | % Population |
| African | 227 | 1.1% |
| American | 1,521 | 7.1% |
| Arab | 132 | 0.6% |
| Austrian | 6 | 0.0% |
| Blackfeet | 46 | 0.2% |
| British | 149 | 0.7% |
| Burmese | 6 | 0.0% |
| Canadian | 9 | 0.0% |
| Central American | 67 | 0.3% |
| Cherokee | 82 | 0.4% |
| Choctaw | 29 | 0.1% |
| Cuban | 25 | 0.1% |
| Cypriot | 46 | 0.2% |
| Czechoslovakian | 11 | 0.1% |
| Dominican | 21 | 0.1% |
| Dutch | 70 | 0.3% |
| English | 1,176 | 5.5% |
| European | 106 | 0.5% |
| Finnish | 30 | 0.1% |
| French | 166 | 0.8% |
| French Canadian | 18 | 0.1% |
| German | 643 | 3.0% |
| Greek | 63 | 0.3% |
| Guatemalan | 67 | 0.3% |
| Haitian | 38 | 0.2% |
| Indian (Asian) | 7 | 0.0% |
| Irish | 714 | 3.4% |
| Italian | 349 | 1.6% |
| Korean | 17 | 0.1% |
| Lebanese | 121 | 0.6% |
| Lithuanian | 18 | 0.1% |
| Mexican | 328 | 1.5% |
| Native Hawaiian | 4 | 0.0% |
| Nigerian | 11 | 0.1% |
| Northern European | 29 | 0.1% |
| Norwegian | 15 | 0.1% |
| Polish | 119 | 0.6% |
| Portuguese | 16 | 0.1% |
| Puerto Rican | 47 | 0.2% |
| Russian | 5 | 0.0% |
| Samoan | 9 | 0.0% |
| Scotch-Irish | 208 | 1.0% |
| Scottish | 278 | 1.3% |
| Sioux | 1 | 0.0% |
| Slavic | 6 | 0.0% |
| Spanish | 18 | 0.1% |
| Sri Lankan | 16 | 0.1% |
| Subsaharan African | 238 | 1.1% |
| Swedish | 38 | 0.2% |
| Swiss | 31 | 0.2% |
| Syrian | 11 | 0.1% |
| Thai | 43 | 0.2% |
| Welsh | 20 | 0.1% | View All 53 Rows |
Immigrants in Vicksburg
The most numerous immigrant groups reported in Vicksburg came from Latin America (312 | 1.5%), Europe (242 | 1.1%), Central America (222 | 1.0%), Northern Europe (209 | 1.0%), and Mexico (155 | 0.7%), together accounting for 5.3% of all Vicksburg residents.
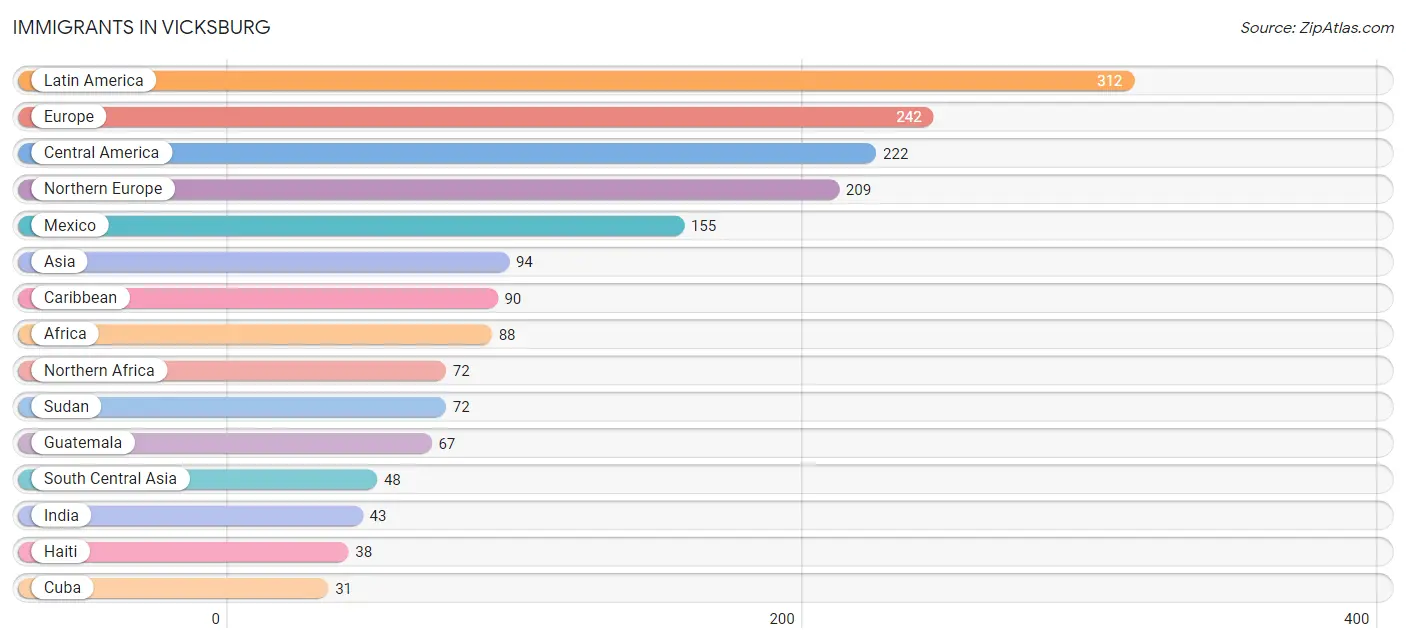
| Immigration Origin | # Population | % Population |
| Africa | 88 | 0.4% |
| Asia | 94 | 0.4% |
| Canada | 9 | 0.0% |
| Caribbean | 90 | 0.4% |
| Central America | 222 | 1.0% |
| China | 4 | 0.0% |
| Cuba | 31 | 0.2% |
| Dominican Republic | 21 | 0.1% |
| Eastern Africa | 1 | 0.0% |
| Eastern Asia | 4 | 0.0% |
| Europe | 242 | 1.1% |
| Germany | 7 | 0.0% |
| Guatemala | 67 | 0.3% |
| Haiti | 38 | 0.2% |
| India | 43 | 0.2% |
| Ireland | 7 | 0.0% |
| Kazakhstan | 5 | 0.0% |
| Latin America | 312 | 1.5% |
| Liberia | 1 | 0.0% |
| Mexico | 155 | 0.7% |
| Netherlands | 10 | 0.1% |
| Nigeria | 11 | 0.1% |
| Northern Africa | 72 | 0.3% |
| Northern Europe | 209 | 1.0% |
| Oceania | 9 | 0.0% |
| Philippines | 11 | 0.1% |
| Portugal | 16 | 0.1% |
| South Africa | 3 | 0.0% |
| South Central Asia | 48 | 0.2% |
| South Eastern Asia | 11 | 0.1% |
| Southern Europe | 16 | 0.1% |
| Sudan | 72 | 0.3% |
| Western Africa | 12 | 0.1% |
| Western Asia | 31 | 0.2% |
| Western Europe | 17 | 0.1% |
| Yemen | 6 | 0.0% | View All 36 Rows |
Sex and Age in Vicksburg
Sex and Age in Vicksburg
The most populous age groups in Vicksburg are 10 to 14 Years (991 | 9.7%) for men and 15 to 19 Years (914 | 8.2%) for women.
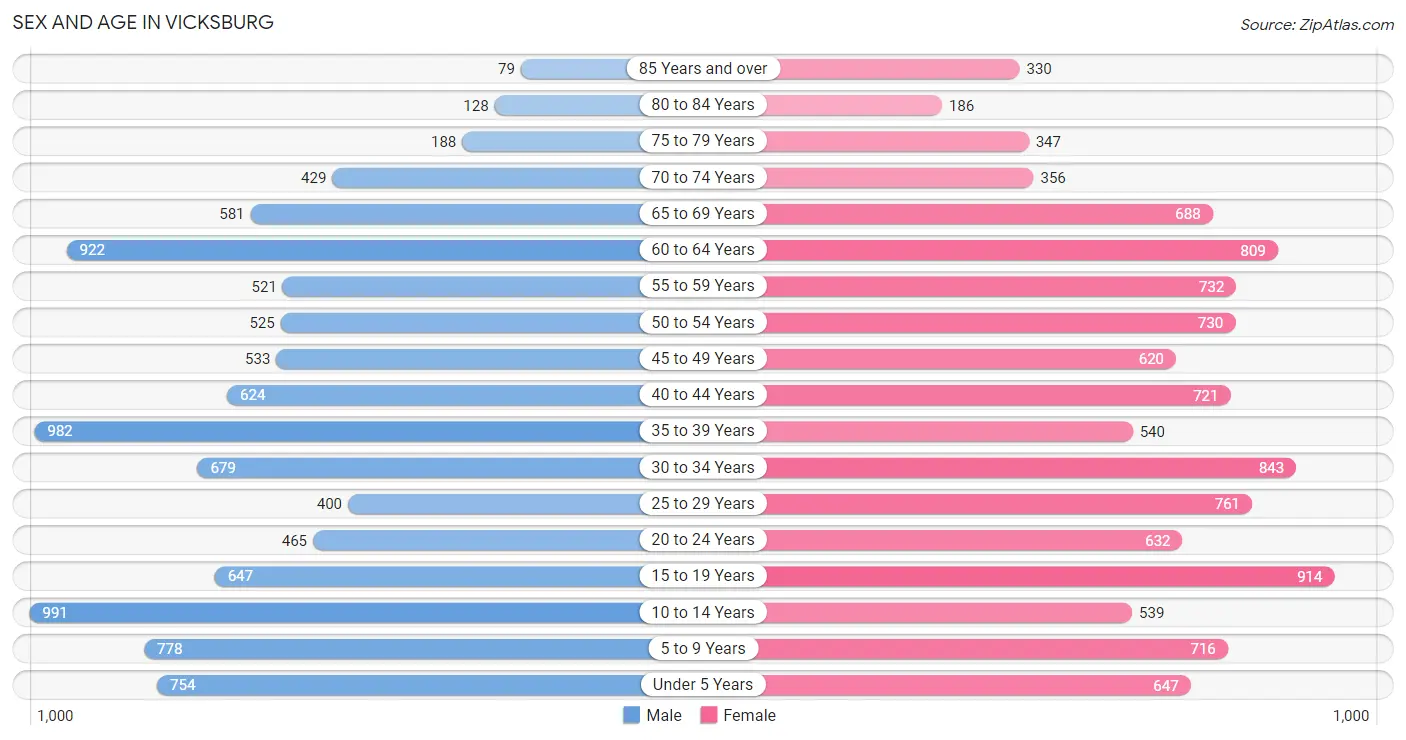
| Age Bracket | Male | Female |
| Under 5 Years | 754 (7.4%) | 647 (5.8%) |
| 5 to 9 Years | 778 (7.6%) | 716 (6.4%) |
| 10 to 14 Years | 991 (9.7%) | 539 (4.9%) |
| 15 to 19 Years | 647 (6.3%) | 914 (8.2%) |
| 20 to 24 Years | 465 (4.5%) | 632 (5.7%) |
| 25 to 29 Years | 400 (3.9%) | 761 (6.9%) |
| 30 to 34 Years | 679 (6.6%) | 843 (7.6%) |
| 35 to 39 Years | 982 (9.6%) | 540 (4.9%) |
| 40 to 44 Years | 624 (6.1%) | 721 (6.5%) |
| 45 to 49 Years | 533 (5.2%) | 620 (5.6%) |
| 50 to 54 Years | 525 (5.1%) | 730 (6.6%) |
| 55 to 59 Years | 521 (5.1%) | 732 (6.6%) |
| 60 to 64 Years | 922 (9.0%) | 809 (7.3%) |
| 65 to 69 Years | 581 (5.7%) | 688 (6.2%) |
| 70 to 74 Years | 429 (4.2%) | 356 (3.2%) |
| 75 to 79 Years | 188 (1.8%) | 347 (3.1%) |
| 80 to 84 Years | 128 (1.3%) | 186 (1.7%) |
| 85 Years and over | 79 (0.8%) | 330 (3.0%) |
| Total | 10,226 (100.0%) | 11,111 (100.0%) |
Families and Households in Vicksburg
Median Family Size in Vicksburg
The median family size in Vicksburg is 3.61 persons per family, with single male/father families (286 | 6.4%) accounting for the largest median family size of 4.04 persons per family. On the other hand, married-couple families (2,312 | 52.1%) represent the smallest median family size with 3.39 persons per family.
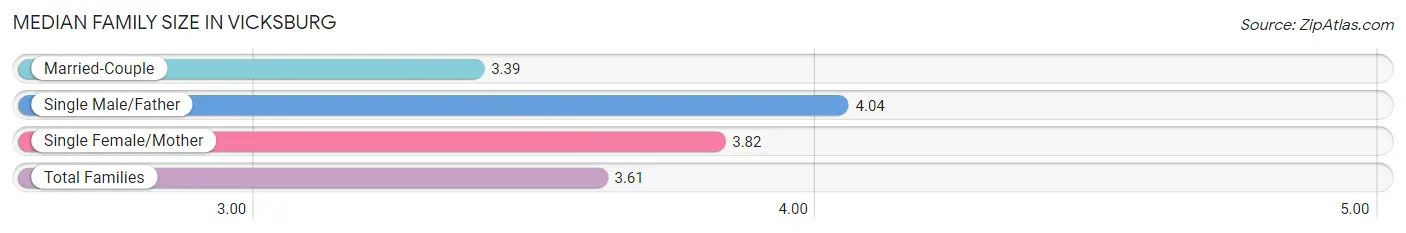
| Family Type | # Families | Family Size |
| Married-Couple | 2,312 (52.1%) | 3.39 |
| Single Male/Father | 286 (6.4%) | 4.04 |
| Single Female/Mother | 1,843 (41.5%) | 3.82 |
| Total Families | 4,441 (100.0%) | 3.61 |
Median Household Size in Vicksburg
The median household size in Vicksburg is 2.57 persons per household, with single male/father households (286 | 3.5%) accounting for the largest median household size of 4.2 persons per household. non-family households (3,651 | 45.1%) represent the smallest median household size with 1.21 persons per household.
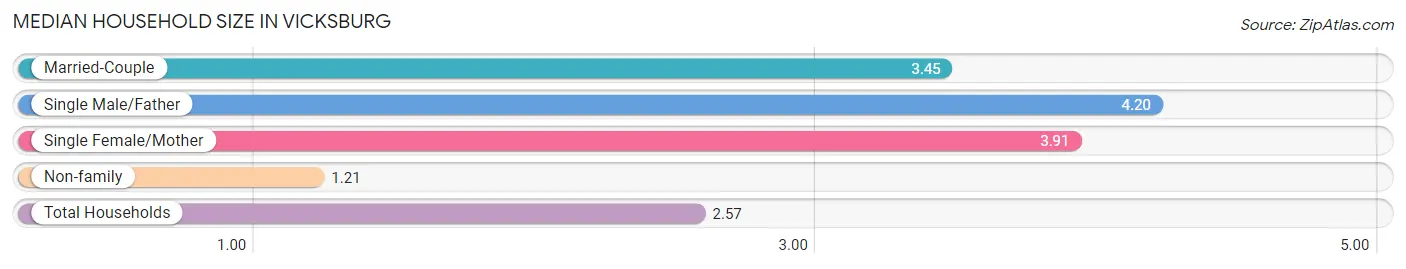
| Household Type | # Households | Household Size |
| Married-Couple | 2,312 (28.6%) | 3.45 |
| Single Male/Father | 286 (3.5%) | 4.20 |
| Single Female/Mother | 1,843 (22.8%) | 3.91 |
| Non-family | 3,651 (45.1%) | 1.21 |
| Total Households | 8,092 (100.0%) | 2.57 |
Household Size by Marriage Status in Vicksburg
Out of a total of 8,092 households in Vicksburg, 4,441 (54.9%) are family households, while 3,651 (45.1%) are nonfamily households. The most numerous type of family households are 2-person households, comprising 2,139, and the most common type of nonfamily households are 1-person households, comprising 3,089.
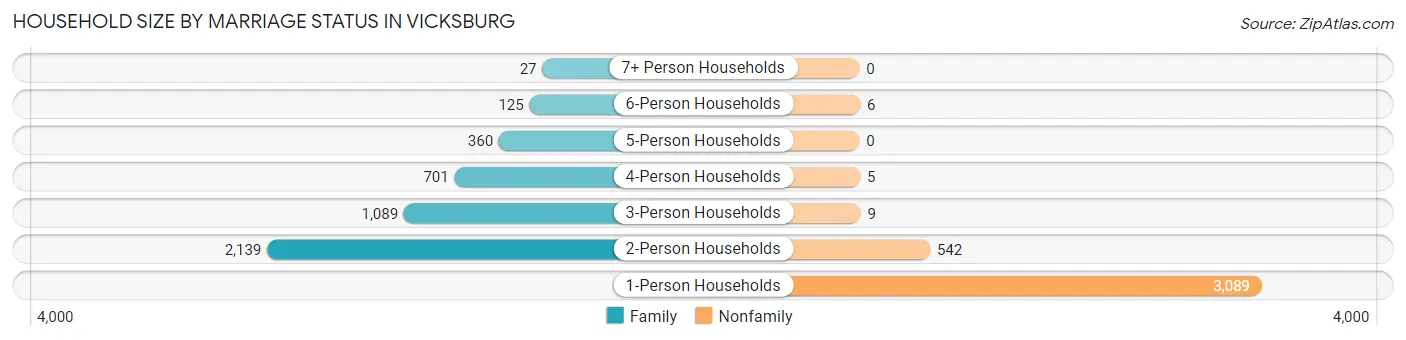
| Household Size | Family Households | Nonfamily Households |
| 1-Person Households | - | 3,089 (38.2%) |
| 2-Person Households | 2,139 (26.4%) | 542 (6.7%) |
| 3-Person Households | 1,089 (13.5%) | 9 (0.1%) |
| 4-Person Households | 701 (8.7%) | 5 (0.1%) |
| 5-Person Households | 360 (4.4%) | 0 (0.0%) |
| 6-Person Households | 125 (1.5%) | 6 (0.1%) |
| 7+ Person Households | 27 (0.3%) | 0 (0.0%) |
| Total | 4,441 (54.9%) | 3,651 (45.1%) |
Female Fertility in Vicksburg
Fertility by Age in Vicksburg
Average fertility rate in Vicksburg is 37.0 births per 1,000 women. Women in the age bracket of 20 to 34 years have the highest fertility rate with 64.0 births per 1,000 women. Women in the age bracket of 20 to 34 years acount for 73.3% of all women with births.
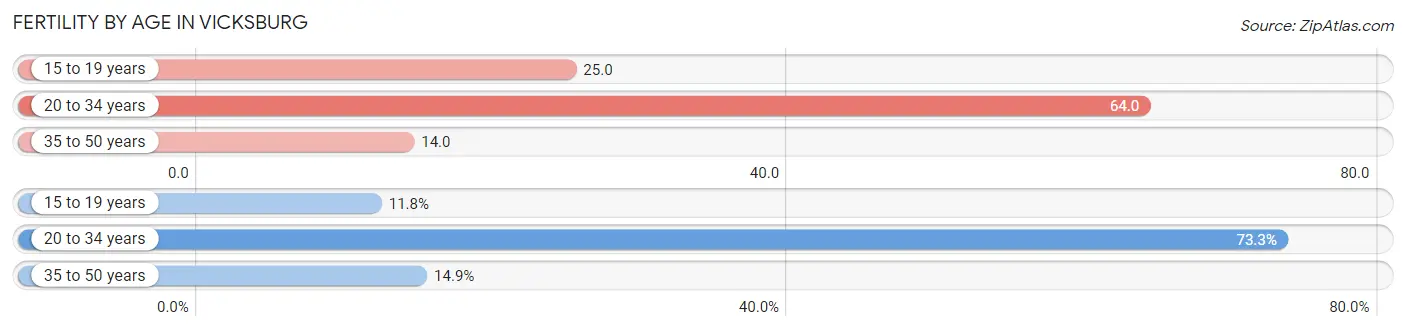
| Age Bracket | Women with Births | Births / 1,000 Women |
| 15 to 19 years | 23 (11.8%) | 25.0 |
| 20 to 34 years | 143 (73.3%) | 64.0 |
| 35 to 50 years | 29 (14.9%) | 14.0 |
| Total | 195 (100.0%) | 37.0 |
Fertility by Age by Marriage Status in Vicksburg
43.1% of women with births (195) in Vicksburg are married. The highest percentage of unmarried women with births falls into 15 to 19 years age bracket with 100.0% of them unmarried at the time of birth, while the lowest percentage of unmarried women with births belong to 35 to 50 years age bracket with 0.0% of them unmarried.
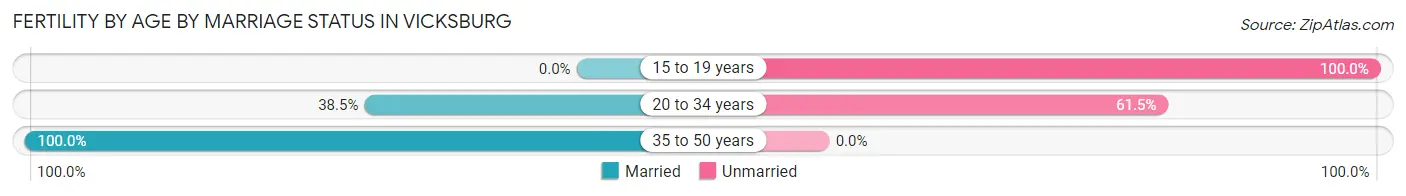
| Age Bracket | Married | Unmarried |
| 15 to 19 years | 0 (0.0%) | 23 (100.0%) |
| 20 to 34 years | 55 (38.5%) | 88 (61.5%) |
| 35 to 50 years | 29 (100.0%) | 0 (0.0%) |
| Total | 84 (43.1%) | 111 (56.9%) |
Fertility by Education in Vicksburg
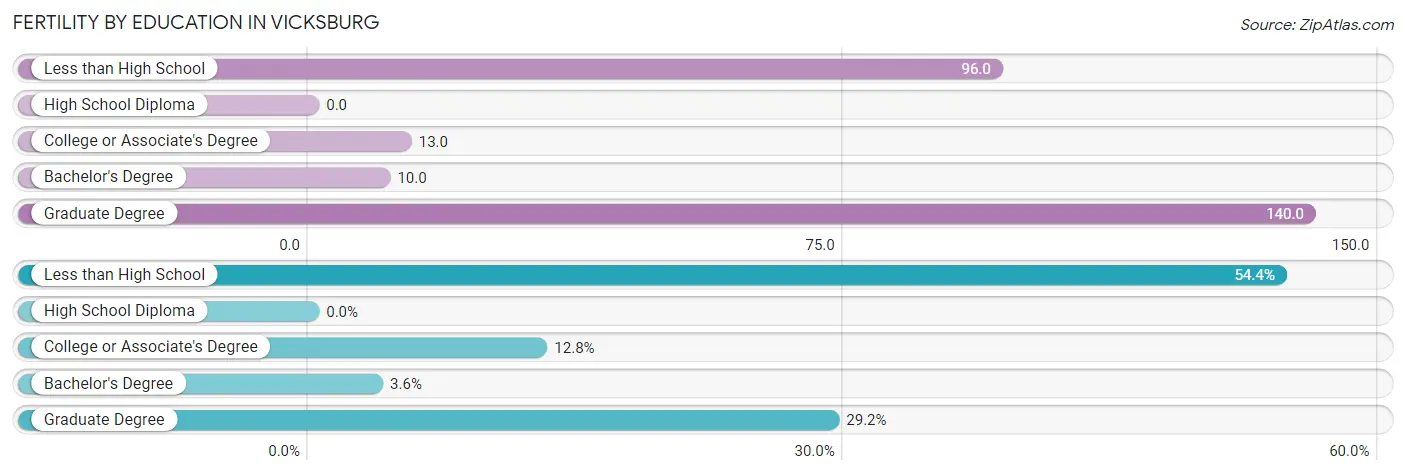
| Educational Attainment | Women with Births | Births / 1,000 Women |
| Less than High School | 106 (54.4%) | 96.0 |
| High School Diploma | 0 (0.0%) | 0.0 |
| College or Associate's Degree | 25 (12.8%) | 13.0 |
| Bachelor's Degree | 7 (3.6%) | 10.0 |
| Graduate Degree | 57 (29.2%) | 140.0 |
| Total | 195 (100.0%) | 37.0 |
Fertility by Education by Marriage Status in Vicksburg
56.9% of women with births in Vicksburg are unmarried. Women with the educational attainment of bachelor's degree are most likely to be married with 100.0% of them married at childbirth, while women with the educational attainment of less than high school are least likely to be married with 100.0% of them unmarried at childbirth.
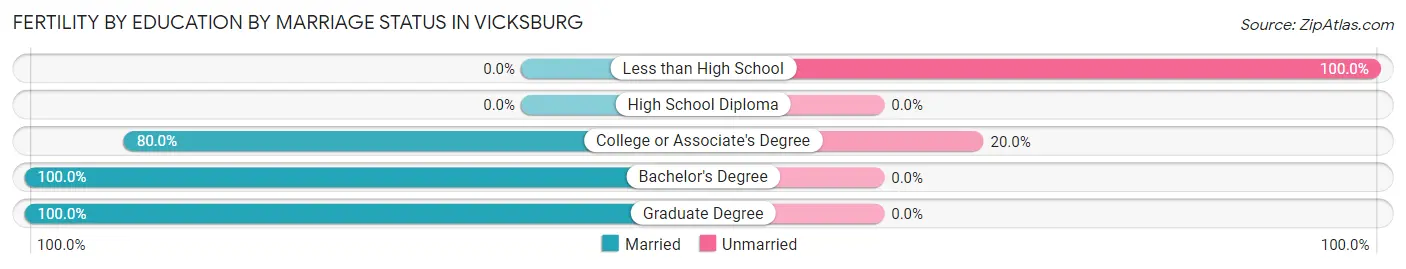
| Educational Attainment | Married | Unmarried |
| Less than High School | 0 (0.0%) | 106 (100.0%) |
| High School Diploma | 0 (0.0%) | 0 (0.0%) |
| College or Associate's Degree | 20 (80.0%) | 5 (20.0%) |
| Bachelor's Degree | 7 (100.0%) | 0 (0.0%) |
| Graduate Degree | 57 (100.0%) | 0 (0.0%) |
| Total | 84 (43.1%) | 111 (56.9%) |
Employment Characteristics in Vicksburg
Employment by Class of Employer in Vicksburg
Among the 8,541 employed individuals in Vicksburg, private company employees (5,582 | 65.4%), federal government employees (853 | 10.0%), and local government employees (536 | 6.3%) make up the most common classes of employment.
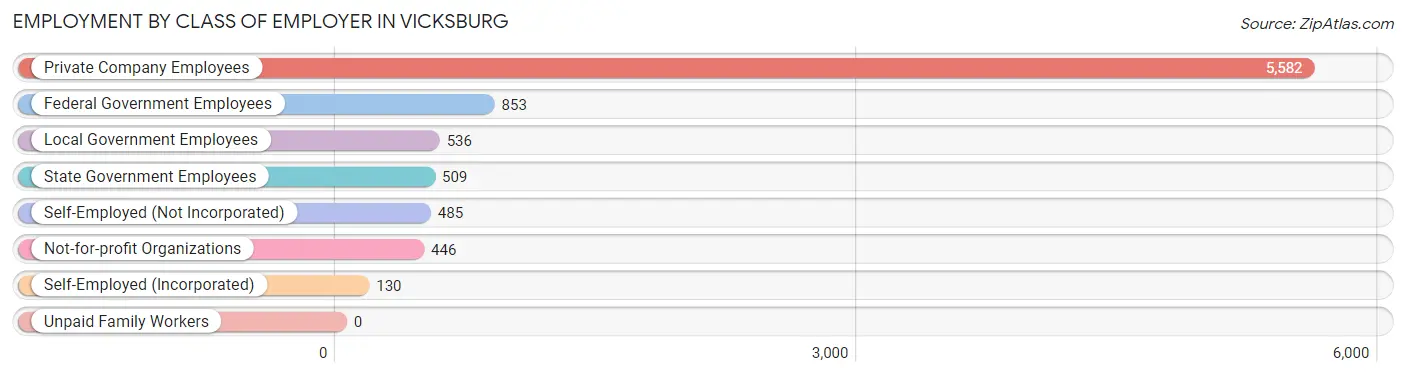
| Employer Class | # Employees | % Employees |
| Private Company Employees | 5,582 | 65.4% |
| Self-Employed (Incorporated) | 130 | 1.5% |
| Self-Employed (Not Incorporated) | 485 | 5.7% |
| Not-for-profit Organizations | 446 | 5.2% |
| Local Government Employees | 536 | 6.3% |
| State Government Employees | 509 | 6.0% |
| Federal Government Employees | 853 | 10.0% |
| Unpaid Family Workers | 0 | 0.0% |
| Total | 8,541 | 100.0% |
Employment Status by Age in Vicksburg
According to the labor force statistics for Vicksburg, out of the total population over 16 years of age (16,577), 55.7% or 9,233 individuals are in the labor force, with 6.7% or 619 of them unemployed. The age group with the highest labor force participation rate is 30 to 34 years, with 82.7% or 1,259 individuals in the labor force. Within the labor force, the 60 to 64 years age range has the highest percentage of unemployed individuals, with 16.1% or 118 of them being unemployed.
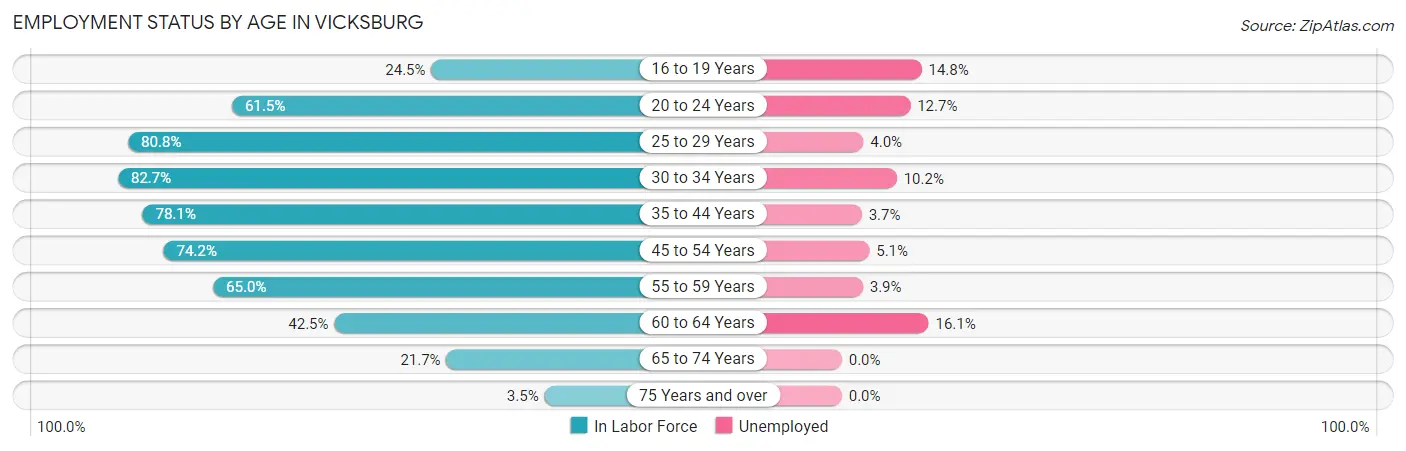
| Age Bracket | In Labor Force | Unemployed |
| 16 to 19 Years | 300 (24.5%) | 44 (14.8%) |
| 20 to 24 Years | 675 (61.5%) | 86 (12.7%) |
| 25 to 29 Years | 938 (80.8%) | 38 (4.0%) |
| 30 to 34 Years | 1,259 (82.7%) | 128 (10.2%) |
| 35 to 44 Years | 2,239 (78.1%) | 83 (3.7%) |
| 45 to 54 Years | 1,787 (74.2%) | 91 (5.1%) |
| 55 to 59 Years | 814 (65.0%) | 32 (3.9%) |
| 60 to 64 Years | 736 (42.5%) | 118 (16.1%) |
| 65 to 74 Years | 446 (21.7%) | 0 (0.0%) |
| 75 Years and over | 44 (3.5%) | 0 (0.0%) |
| Total | 9,233 (55.7%) | 619 (6.7%) |
Employment Status by Educational Attainment in Vicksburg
According to labor force statistics for Vicksburg, 71.0% of individuals (7,769) out of the total population between 25 and 64 years of age (10,942) are in the labor force, with 6.3% or 489 of them being unemployed. The group with the highest labor force participation rate are those with the educational attainment of bachelor's degree or higher, with 82.0% or 2,274 individuals in the labor force. Within the labor force, individuals with high school diploma education have the highest percentage of unemployment, with 10.3% or 197 of them being unemployed.
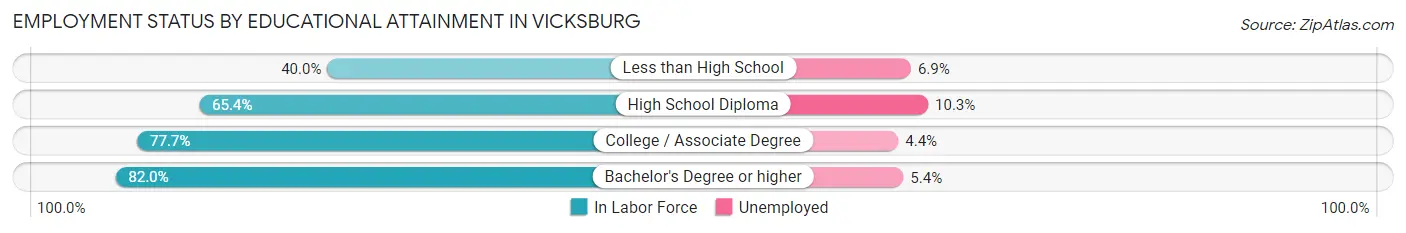
| Educational Attainment | In Labor Force | Unemployed |
| Less than High School | 520 (40.0%) | 90 (6.9%) |
| High School Diploma | 1,916 (65.4%) | 302 (10.3%) |
| College / Associate Degree | 3,060 (77.7%) | 173 (4.4%) |
| Bachelor's Degree or higher | 2,274 (82.0%) | 150 (5.4%) |
| Total | 7,769 (71.0%) | 689 (6.3%) |
Employment Occupations by Sex in Vicksburg
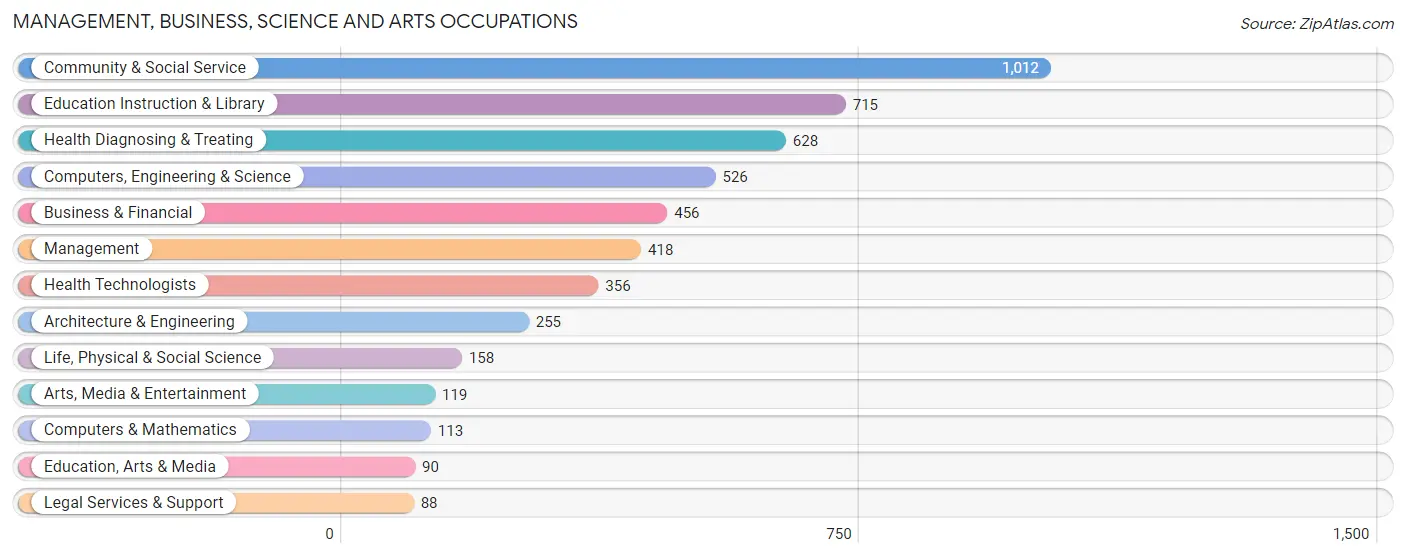
Management, Business, Science and Arts Occupations
The most common Management, Business, Science and Arts occupations in Vicksburg are Community & Social Service (1,012 | 11.9%), Education Instruction & Library (715 | 8.4%), Health Diagnosing & Treating (628 | 7.4%), Computers, Engineering & Science (526 | 6.2%), and Business & Financial (456 | 5.3%).
Management, Business, Science and Arts Occupations by Sex
Within the Management, Business, Science and Arts occupations in Vicksburg, the most male-oriented occupations are Architecture & Engineering (88.2%), Legal Services & Support (85.2%), and Computers, Engineering & Science (72.8%), while the most female-oriented occupations are Business & Financial (76.3%), Health Diagnosing & Treating (74.0%), and Education Instruction & Library (72.9%).
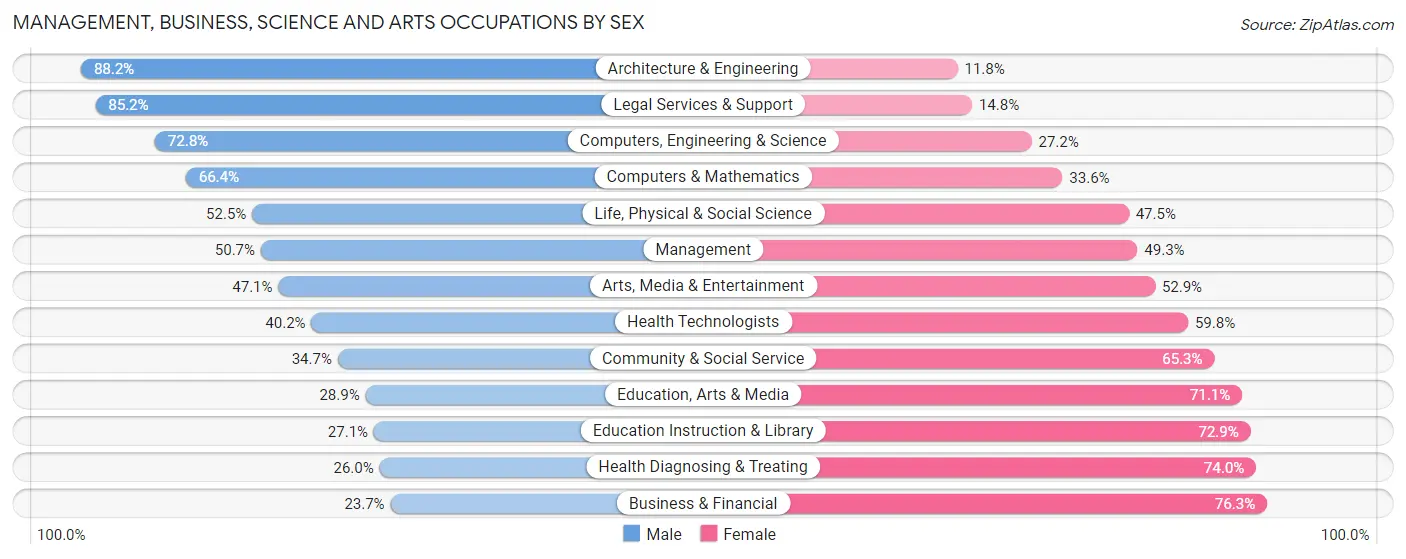
| Occupation | Male | Female |
| Management | 212 (50.7%) | 206 (49.3%) |
| Business & Financial | 108 (23.7%) | 348 (76.3%) |
| Computers, Engineering & Science | 383 (72.8%) | 143 (27.2%) |
| Computers & Mathematics | 75 (66.4%) | 38 (33.6%) |
| Architecture & Engineering | 225 (88.2%) | 30 (11.8%) |
| Life, Physical & Social Science | 83 (52.5%) | 75 (47.5%) |
| Community & Social Service | 351 (34.7%) | 661 (65.3%) |
| Education, Arts & Media | 26 (28.9%) | 64 (71.1%) |
| Legal Services & Support | 75 (85.2%) | 13 (14.8%) |
| Education Instruction & Library | 194 (27.1%) | 521 (72.9%) |
| Arts, Media & Entertainment | 56 (47.1%) | 63 (52.9%) |
| Health Diagnosing & Treating | 163 (26.0%) | 465 (74.0%) |
| Health Technologists | 143 (40.2%) | 213 (59.8%) |
| Total (Category) | 1,217 (40.0%) | 1,823 (60.0%) |
| Total (Overall) | 4,025 (47.3%) | 4,491 (52.7%) |
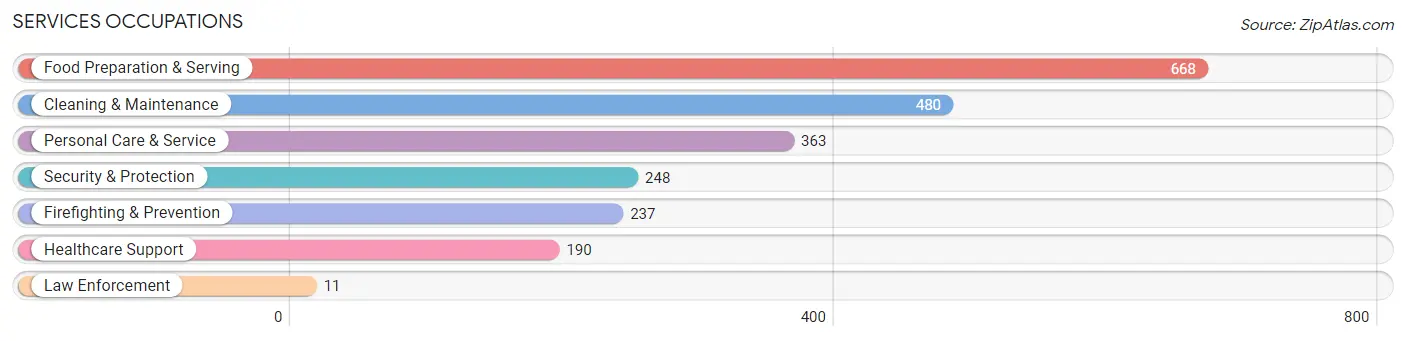
Services Occupations
The most common Services occupations in Vicksburg are Food Preparation & Serving (668 | 7.8%), Cleaning & Maintenance (480 | 5.6%), Personal Care & Service (363 | 4.3%), Security & Protection (248 | 2.9%), and Firefighting & Prevention (237 | 2.8%).
Services Occupations by Sex
Within the Services occupations in Vicksburg, the most male-oriented occupations are Law Enforcement (100.0%), Cleaning & Maintenance (84.2%), and Security & Protection (82.3%), while the most female-oriented occupations are Healthcare Support (100.0%), Personal Care & Service (88.7%), and Food Preparation & Serving (61.1%).
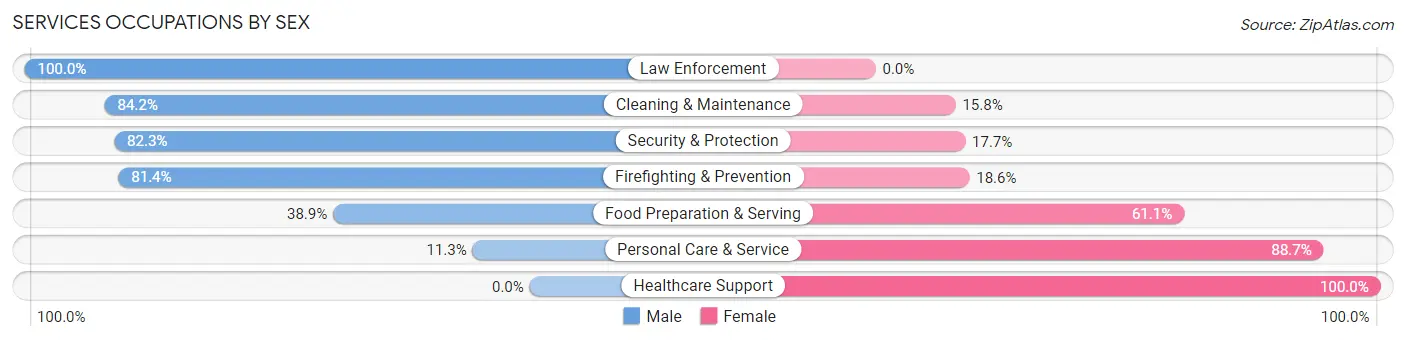
| Occupation | Male | Female |
| Healthcare Support | 0 (0.0%) | 190 (100.0%) |
| Security & Protection | 204 (82.3%) | 44 (17.7%) |
| Firefighting & Prevention | 193 (81.4%) | 44 (18.6%) |
| Law Enforcement | 11 (100.0%) | 0 (0.0%) |
| Food Preparation & Serving | 260 (38.9%) | 408 (61.1%) |
| Cleaning & Maintenance | 404 (84.2%) | 76 (15.8%) |
| Personal Care & Service | 41 (11.3%) | 322 (88.7%) |
| Total (Category) | 909 (46.6%) | 1,040 (53.4%) |
| Total (Overall) | 4,025 (47.3%) | 4,491 (52.7%) |
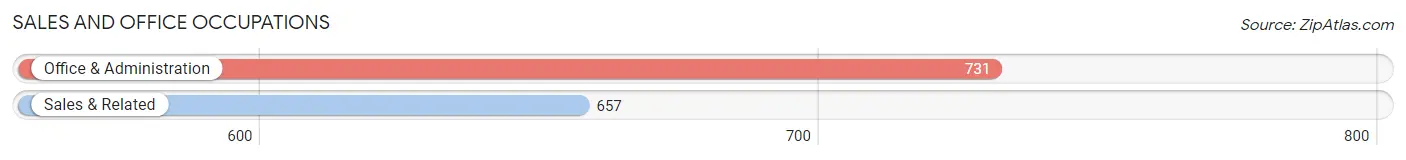
Sales and Office Occupations
The most common Sales and Office occupations in Vicksburg are Office & Administration (731 | 8.6%), and Sales & Related (657 | 7.7%).
Sales and Office Occupations by Sex
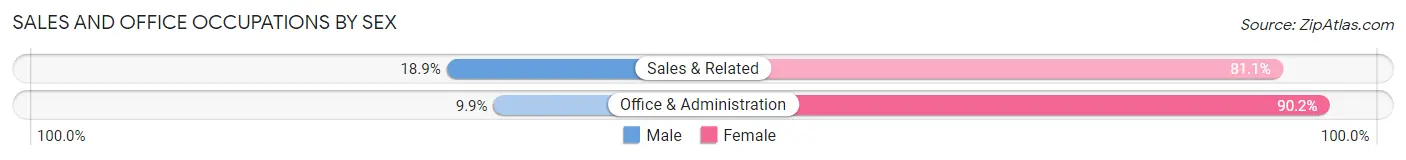
| Occupation | Male | Female |
| Sales & Related | 124 (18.9%) | 533 (81.1%) |
| Office & Administration | 72 (9.9%) | 659 (90.1%) |
| Total (Category) | 196 (14.1%) | 1,192 (85.9%) |
| Total (Overall) | 4,025 (47.3%) | 4,491 (52.7%) |
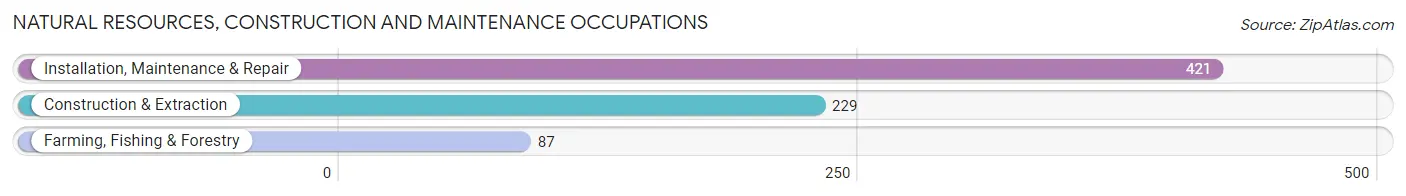
Natural Resources, Construction and Maintenance Occupations
The most common Natural Resources, Construction and Maintenance occupations in Vicksburg are Installation, Maintenance & Repair (421 | 4.9%), Construction & Extraction (229 | 2.7%), and Farming, Fishing & Forestry (87 | 1.0%).
Natural Resources, Construction and Maintenance Occupations by Sex
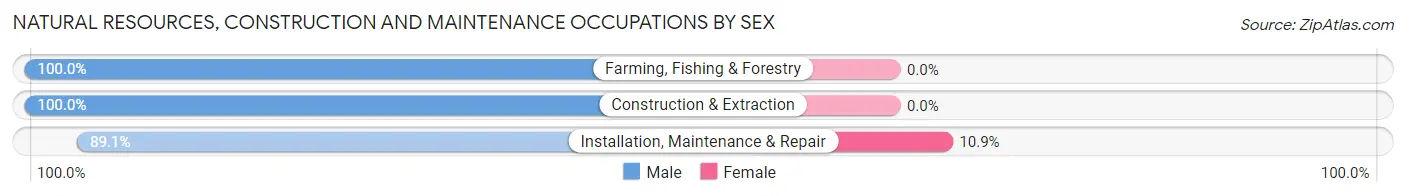
| Occupation | Male | Female |
| Farming, Fishing & Forestry | 87 (100.0%) | 0 (0.0%) |
| Construction & Extraction | 229 (100.0%) | 0 (0.0%) |
| Installation, Maintenance & Repair | 375 (89.1%) | 46 (10.9%) |
| Total (Category) | 691 (93.8%) | 46 (6.2%) |
| Total (Overall) | 4,025 (47.3%) | 4,491 (52.7%) |
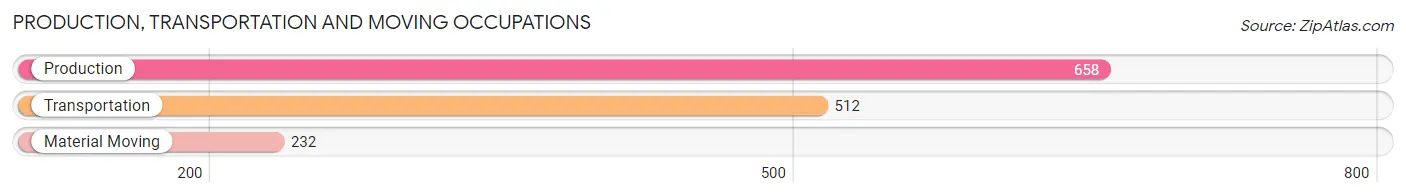
Production, Transportation and Moving Occupations
The most common Production, Transportation and Moving occupations in Vicksburg are Production (658 | 7.7%), Transportation (512 | 6.0%), and Material Moving (232 | 2.7%).
Production, Transportation and Moving Occupations by Sex
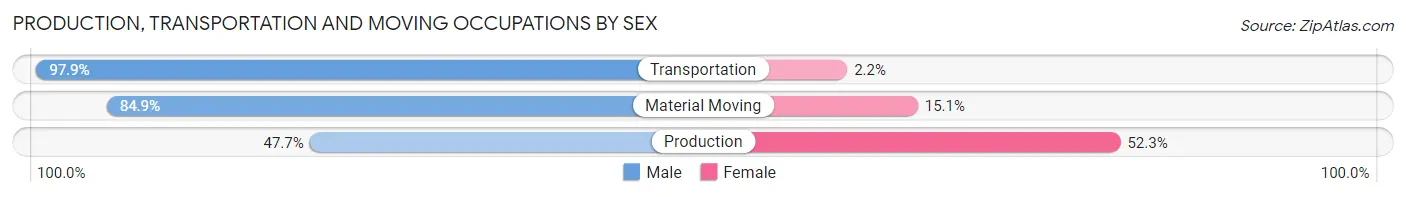
| Occupation | Male | Female |
| Production | 314 (47.7%) | 344 (52.3%) |
| Transportation | 501 (97.9%) | 11 (2.1%) |
| Material Moving | 197 (84.9%) | 35 (15.1%) |
| Total (Category) | 1,012 (72.2%) | 390 (27.8%) |
| Total (Overall) | 4,025 (47.3%) | 4,491 (52.7%) |
Employment Industries by Sex in Vicksburg
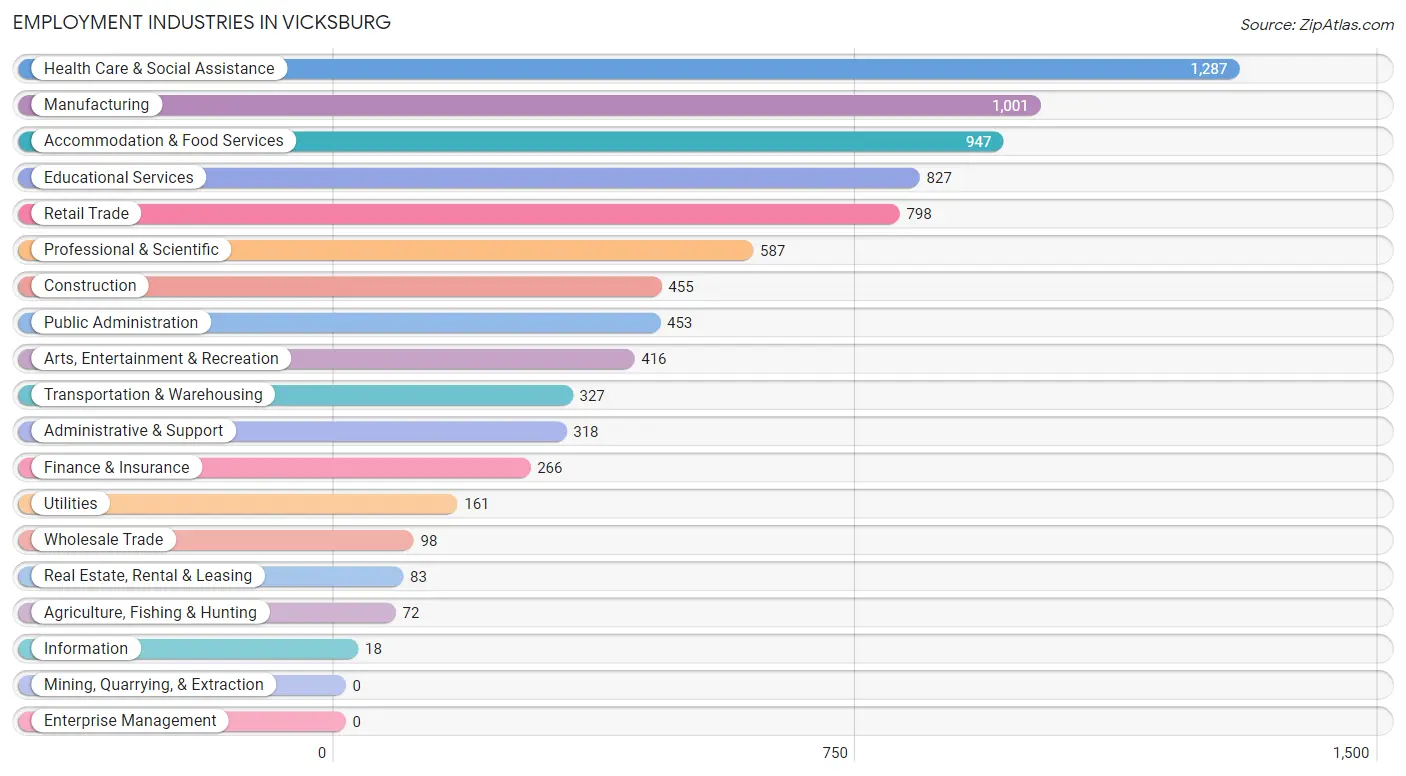
Employment Industries in Vicksburg
The major employment industries in Vicksburg include Health Care & Social Assistance (1,287 | 15.1%), Manufacturing (1,001 | 11.7%), Accommodation & Food Services (947 | 11.1%), Educational Services (827 | 9.7%), and Retail Trade (798 | 9.4%).
Employment Industries by Sex in Vicksburg
The Vicksburg industries that see more men than women are Construction (95.2%), Transportation & Warehousing (85.3%), and Utilities (77.6%), whereas the industries that tend to have a higher number of women are Information (100.0%), Finance & Insurance (93.6%), and Health Care & Social Assistance (78.1%).
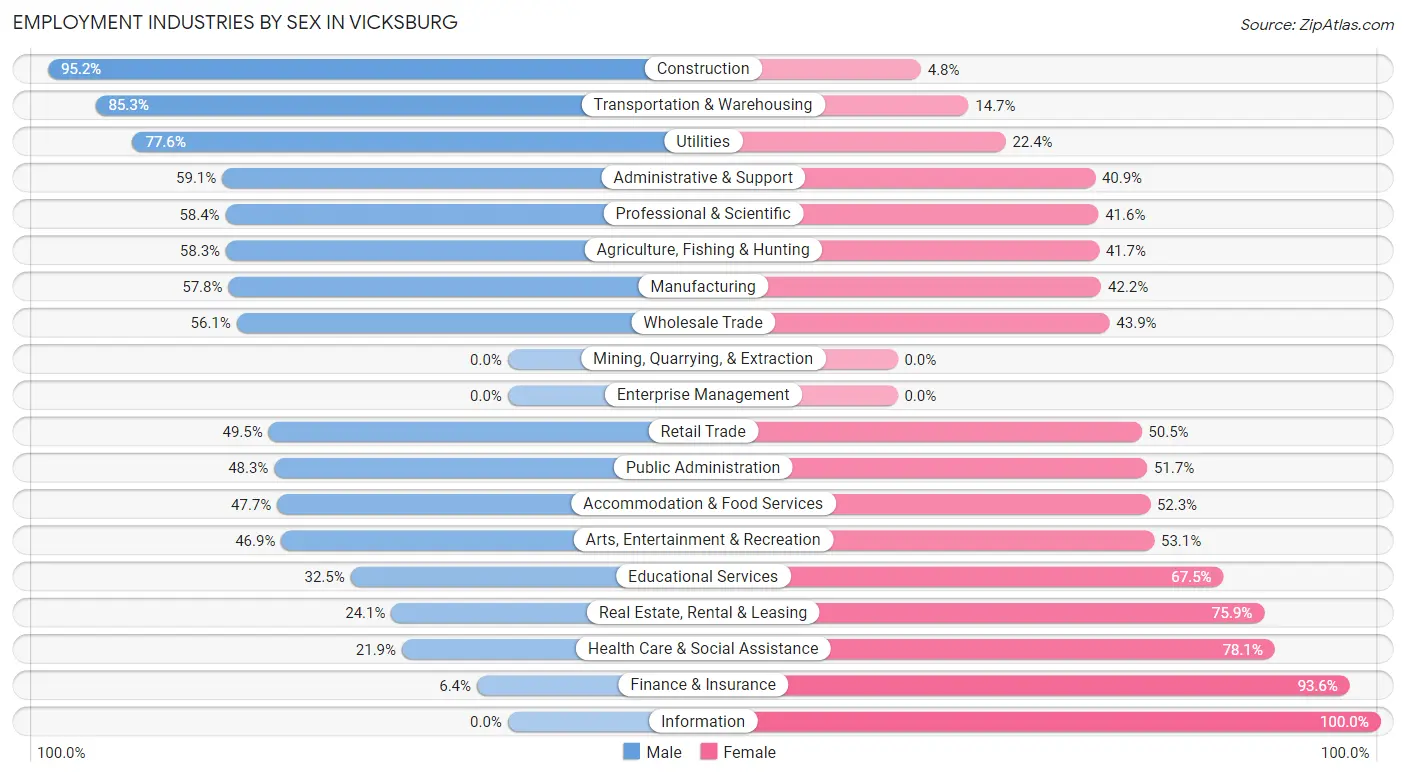
| Industry | Male | Female |
| Agriculture, Fishing & Hunting | 42 (58.3%) | 30 (41.7%) |
| Mining, Quarrying, & Extraction | 0 (0.0%) | 0 (0.0%) |
| Construction | 433 (95.2%) | 22 (4.8%) |
| Manufacturing | 579 (57.8%) | 422 (42.2%) |
| Wholesale Trade | 55 (56.1%) | 43 (43.9%) |
| Retail Trade | 395 (49.5%) | 403 (50.5%) |
| Transportation & Warehousing | 279 (85.3%) | 48 (14.7%) |
| Utilities | 125 (77.6%) | 36 (22.4%) |
| Information | 0 (0.0%) | 18 (100.0%) |
| Finance & Insurance | 17 (6.4%) | 249 (93.6%) |
| Real Estate, Rental & Leasing | 20 (24.1%) | 63 (75.9%) |
| Professional & Scientific | 343 (58.4%) | 244 (41.6%) |
| Enterprise Management | 0 (0.0%) | 0 (0.0%) |
| Administrative & Support | 188 (59.1%) | 130 (40.9%) |
| Educational Services | 269 (32.5%) | 558 (67.5%) |
| Health Care & Social Assistance | 282 (21.9%) | 1,005 (78.1%) |
| Arts, Entertainment & Recreation | 195 (46.9%) | 221 (53.1%) |
| Accommodation & Food Services | 452 (47.7%) | 495 (52.3%) |
| Public Administration | 219 (48.3%) | 234 (51.7%) |
| Total | 4,025 (47.3%) | 4,491 (52.7%) |
Education in Vicksburg
School Enrollment in Vicksburg
The most common levels of schooling among the 5,631 students in Vicksburg are middle school (1,219 | 21.6%), high school (1,187 | 21.1%), and elementary school (988 | 17.5%).
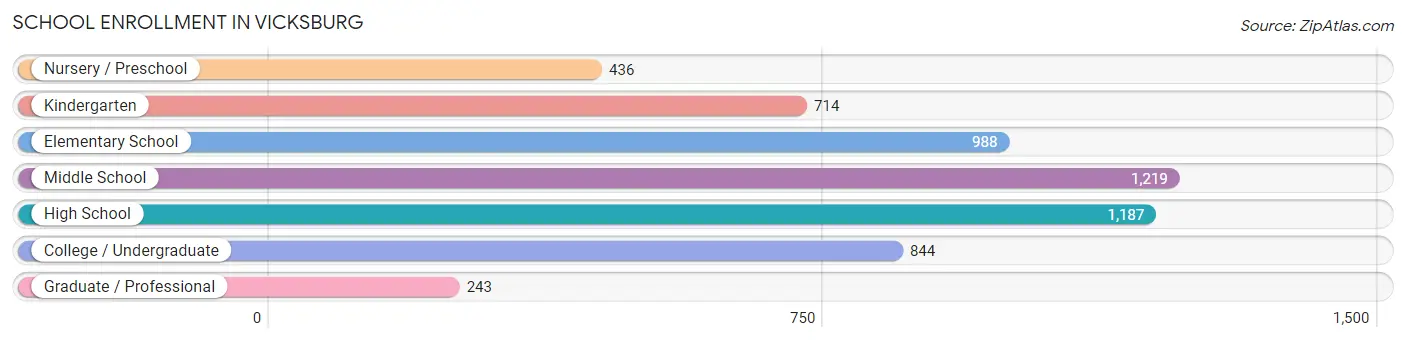
| School Level | # Students | % Students |
| Nursery / Preschool | 436 | 7.7% |
| Kindergarten | 714 | 12.7% |
| Elementary School | 988 | 17.5% |
| Middle School | 1,219 | 21.6% |
| High School | 1,187 | 21.1% |
| College / Undergraduate | 844 | 15.0% |
| Graduate / Professional | 243 | 4.3% |
| Total | 5,631 | 100.0% |
School Enrollment by Age by Funding Source in Vicksburg
Out of a total of 5,631 students who are enrolled in schools in Vicksburg, 417 (7.4%) attend a private institution, while the remaining 5,214 (92.6%) are enrolled in public schools. The age group of 20 to 24 year olds has the highest likelihood of being enrolled in private schools, with 93 (29.5% in the age bracket) enrolled. Conversely, the age group of 5 to 9 year old has the lowest likelihood of being enrolled in a private school, with 1,442 (97.7% in the age bracket) attending a public institution.
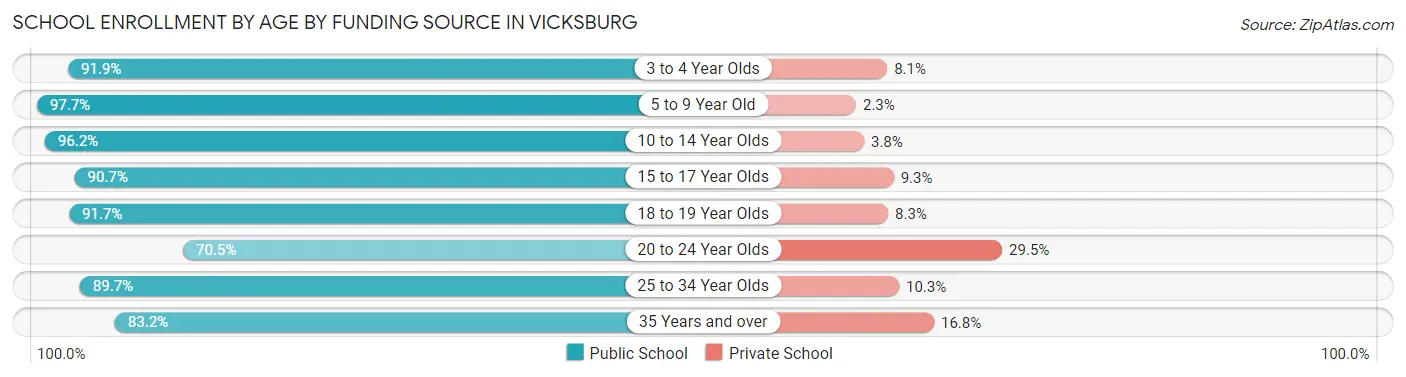
| Age Bracket | Public School | Private School |
| 3 to 4 Year Olds | 374 (91.9%) | 33 (8.1%) |
| 5 to 9 Year Old | 1,442 (97.7%) | 34 (2.3%) |
| 10 to 14 Year Olds | 1,472 (96.2%) | 58 (3.8%) |
| 15 to 17 Year Olds | 866 (90.7%) | 89 (9.3%) |
| 18 to 19 Year Olds | 376 (91.7%) | 34 (8.3%) |
| 20 to 24 Year Olds | 222 (70.5%) | 93 (29.5%) |
| 25 to 34 Year Olds | 200 (89.7%) | 23 (10.3%) |
| 35 Years and over | 262 (83.2%) | 53 (16.8%) |
| Total | 5,214 (92.6%) | 417 (7.4%) |
Educational Attainment by Field of Study in Vicksburg
Business (710 | 18.2%), education (674 | 17.3%), engineering (357 | 9.1%), arts & humanities (327 | 8.4%), and bio, nature & agricultural (289 | 7.4%) are the most common fields of study among 3,903 individuals in Vicksburg who have obtained a bachelor's degree or higher.
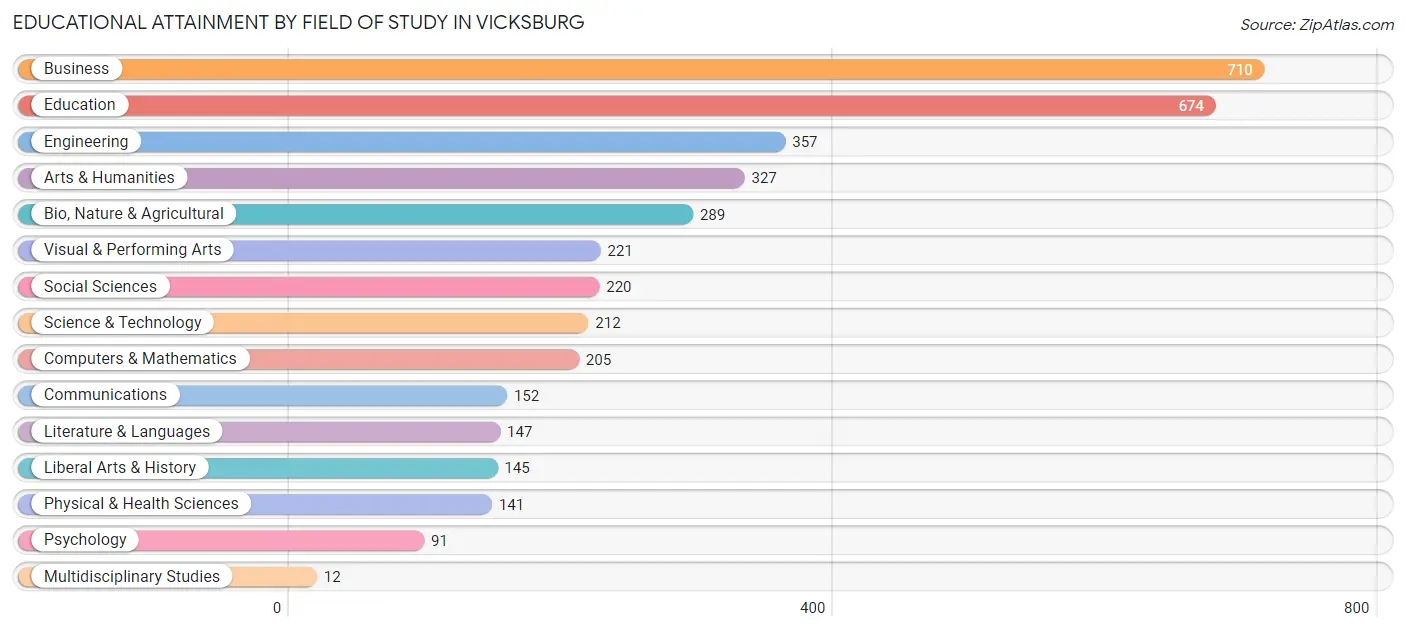
| Field of Study | # Graduates | % Graduates |
| Computers & Mathematics | 205 | 5.2% |
| Bio, Nature & Agricultural | 289 | 7.4% |
| Physical & Health Sciences | 141 | 3.6% |
| Psychology | 91 | 2.3% |
| Social Sciences | 220 | 5.6% |
| Engineering | 357 | 9.1% |
| Multidisciplinary Studies | 12 | 0.3% |
| Science & Technology | 212 | 5.4% |
| Business | 710 | 18.2% |
| Education | 674 | 17.3% |
| Literature & Languages | 147 | 3.8% |
| Liberal Arts & History | 145 | 3.7% |
| Visual & Performing Arts | 221 | 5.7% |
| Communications | 152 | 3.9% |
| Arts & Humanities | 327 | 8.4% |
| Total | 3,903 | 100.0% |
Transportation & Commute in Vicksburg
Vehicle Availability by Sex in Vicksburg
The most prevalent vehicle ownership categories in Vicksburg are males with 2 vehicles (1,274, accounting for 31.8%) and females with 2 vehicles (1,753, making up 28.2%).
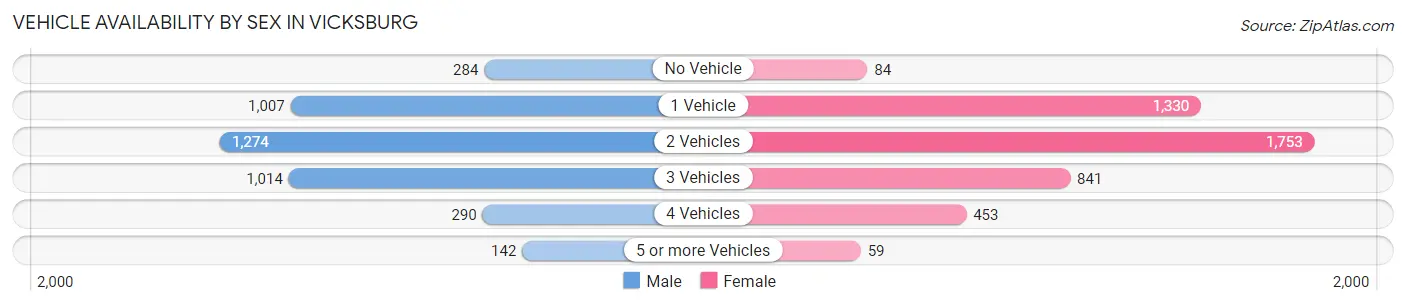
| Vehicles Available | Male | Female |
| No Vehicle | 284 (7.1%) | 84 (1.9%) |
| 1 Vehicle | 1,007 (25.1%) | 1,330 (29.4%) |
| 2 Vehicles | 1,274 (31.8%) | 1,753 (38.8%) |
| 3 Vehicles | 1,014 (25.3%) | 841 (18.6%) |
| 4 Vehicles | 290 (7.2%) | 453 (10.0%) |
| 5 or more Vehicles | 142 (3.5%) | 59 (1.3%) |
| Total | 4,011 (100.0%) | 4,520 (100.0%) |
Commute Time in Vicksburg
The most frequently occuring commute durations in Vicksburg are 10 to 14 minutes (2,246 commuters, 26.5%), 15 to 19 minutes (2,135 commuters, 25.2%), and 5 to 9 minutes (1,484 commuters, 17.5%).
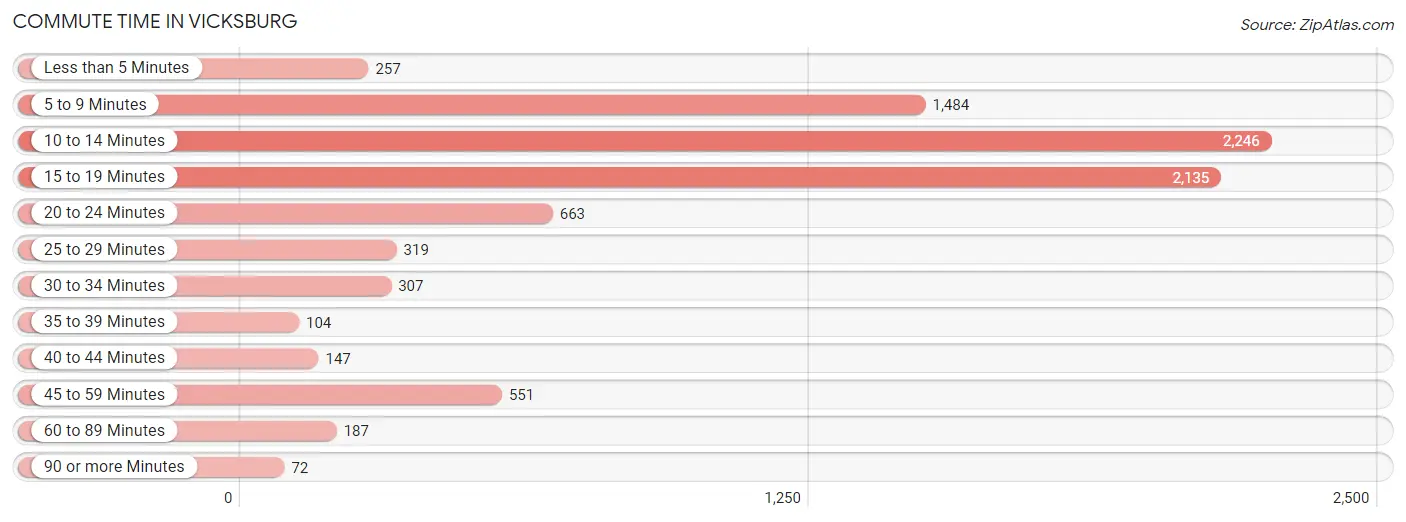
| Commute Time | # Commuters | % Commuters |
| Less than 5 Minutes | 257 | 3.0% |
| 5 to 9 Minutes | 1,484 | 17.5% |
| 10 to 14 Minutes | 2,246 | 26.5% |
| 15 to 19 Minutes | 2,135 | 25.2% |
| 20 to 24 Minutes | 663 | 7.8% |
| 25 to 29 Minutes | 319 | 3.8% |
| 30 to 34 Minutes | 307 | 3.6% |
| 35 to 39 Minutes | 104 | 1.2% |
| 40 to 44 Minutes | 147 | 1.7% |
| 45 to 59 Minutes | 551 | 6.5% |
| 60 to 89 Minutes | 187 | 2.2% |
| 90 or more Minutes | 72 | 0.9% |
Commute Time by Sex in Vicksburg
The most common commute times in Vicksburg are 10 to 14 minutes (1,147 commuters, 28.8%) for males and 15 to 19 minutes (1,345 commuters, 30.0%) for females.
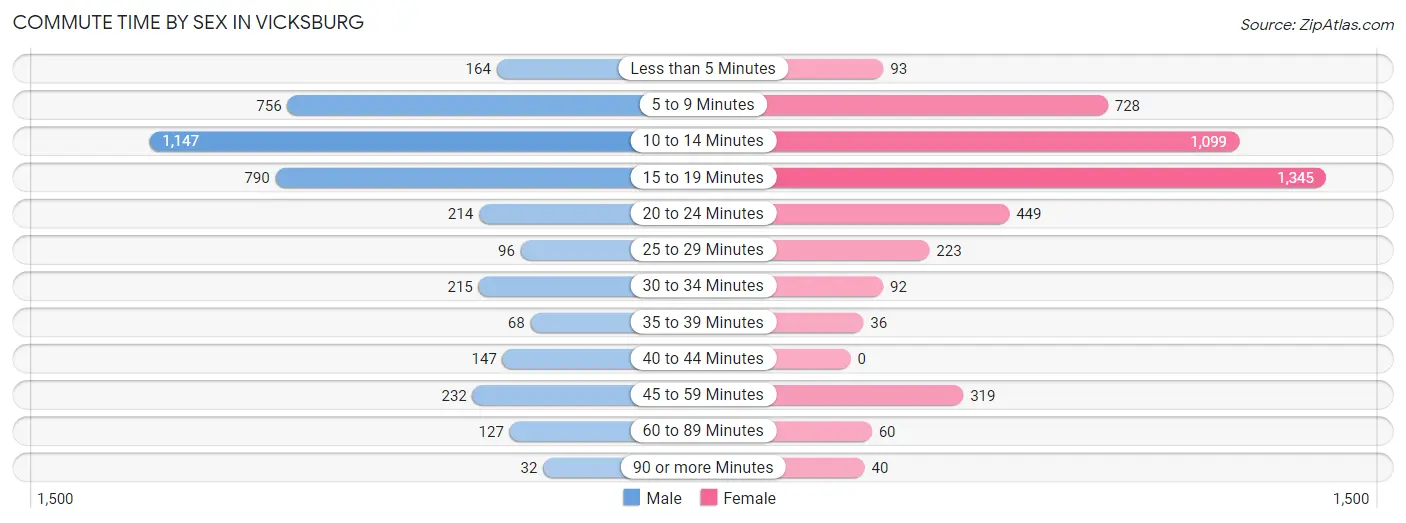
| Commute Time | Male | Female |
| Less than 5 Minutes | 164 (4.1%) | 93 (2.1%) |
| 5 to 9 Minutes | 756 (19.0%) | 728 (16.2%) |
| 10 to 14 Minutes | 1,147 (28.8%) | 1,099 (24.5%) |
| 15 to 19 Minutes | 790 (19.8%) | 1,345 (30.0%) |
| 20 to 24 Minutes | 214 (5.4%) | 449 (10.0%) |
| 25 to 29 Minutes | 96 (2.4%) | 223 (5.0%) |
| 30 to 34 Minutes | 215 (5.4%) | 92 (2.1%) |
| 35 to 39 Minutes | 68 (1.7%) | 36 (0.8%) |
| 40 to 44 Minutes | 147 (3.7%) | 0 (0.0%) |
| 45 to 59 Minutes | 232 (5.8%) | 319 (7.1%) |
| 60 to 89 Minutes | 127 (3.2%) | 60 (1.3%) |
| 90 or more Minutes | 32 (0.8%) | 40 (0.9%) |
Time of Departure to Work by Sex in Vicksburg
The most frequent times of departure to work in Vicksburg are 7:30 AM to 7:59 AM (686, 17.2%) for males and 6:30 AM to 6:59 AM (631, 14.1%) for females.
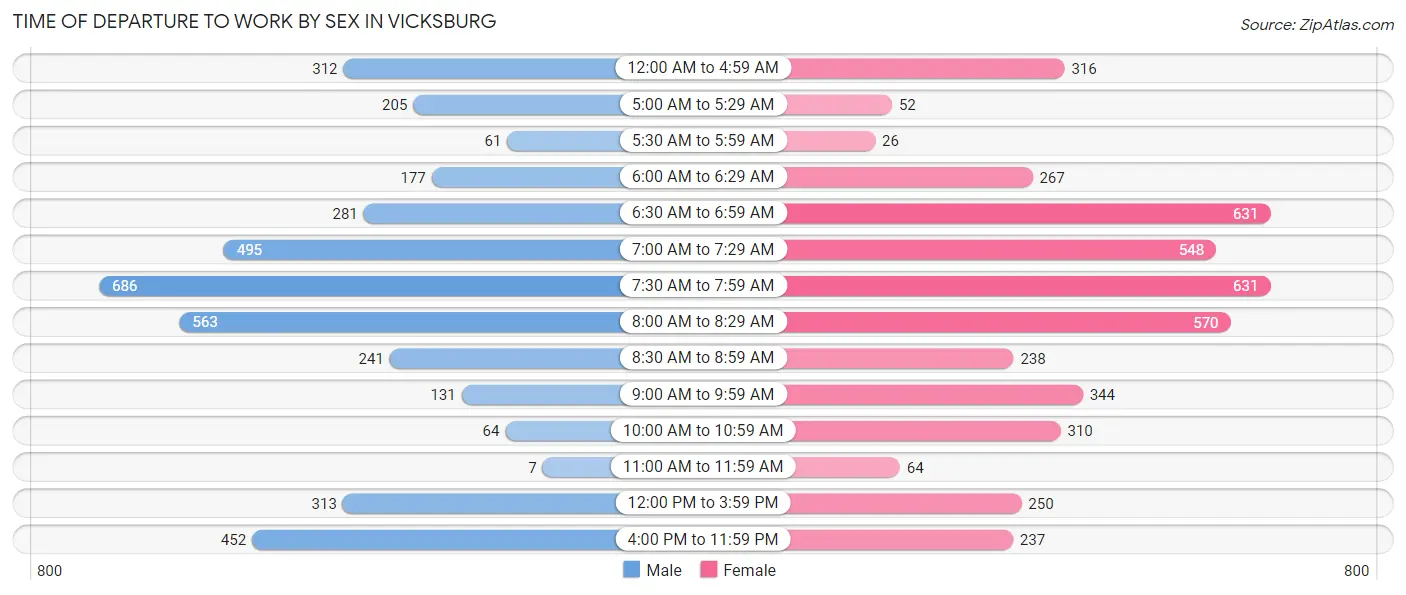
| Time of Departure | Male | Female |
| 12:00 AM to 4:59 AM | 312 (7.8%) | 316 (7.0%) |
| 5:00 AM to 5:29 AM | 205 (5.1%) | 52 (1.2%) |
| 5:30 AM to 5:59 AM | 61 (1.5%) | 26 (0.6%) |
| 6:00 AM to 6:29 AM | 177 (4.4%) | 267 (5.9%) |
| 6:30 AM to 6:59 AM | 281 (7.0%) | 631 (14.1%) |
| 7:00 AM to 7:29 AM | 495 (12.4%) | 548 (12.2%) |
| 7:30 AM to 7:59 AM | 686 (17.2%) | 631 (14.1%) |
| 8:00 AM to 8:29 AM | 563 (14.1%) | 570 (12.7%) |
| 8:30 AM to 8:59 AM | 241 (6.0%) | 238 (5.3%) |
| 9:00 AM to 9:59 AM | 131 (3.3%) | 344 (7.7%) |
| 10:00 AM to 10:59 AM | 64 (1.6%) | 310 (6.9%) |
| 11:00 AM to 11:59 AM | 7 (0.2%) | 64 (1.4%) |
| 12:00 PM to 3:59 PM | 313 (7.9%) | 250 (5.6%) |
| 4:00 PM to 11:59 PM | 452 (11.3%) | 237 (5.3%) |
| Total | 3,988 (100.0%) | 4,484 (100.0%) |
Housing Occupancy in Vicksburg
Occupancy by Ownership in Vicksburg
Of the total 8,092 dwellings in Vicksburg, owner-occupied units account for 4,923 (60.8%), while renter-occupied units make up 3,169 (39.2%).
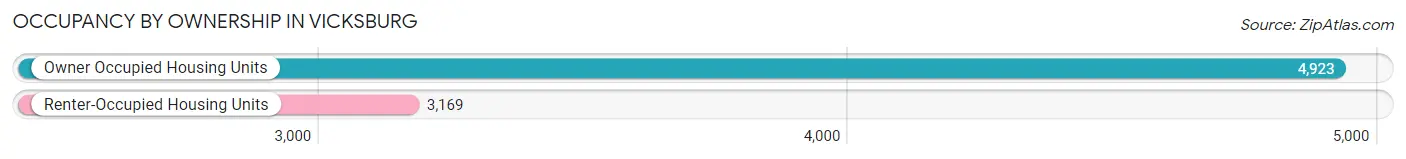
| Occupancy | # Housing Units | % Housing Units |
| Owner Occupied Housing Units | 4,923 | 60.8% |
| Renter-Occupied Housing Units | 3,169 | 39.2% |
| Total Occupied Housing Units | 8,092 | 100.0% |
Occupancy by Household Size in Vicksburg
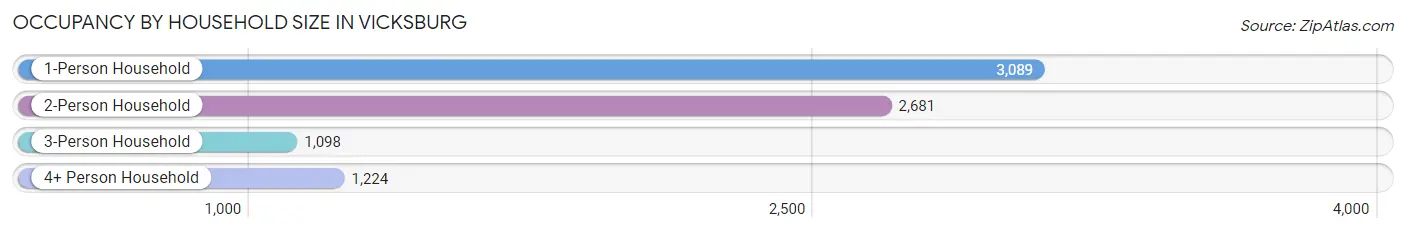
| Household Size | # Housing Units | % Housing Units |
| 1-Person Household | 3,089 | 38.2% |
| 2-Person Household | 2,681 | 33.1% |
| 3-Person Household | 1,098 | 13.6% |
| 4+ Person Household | 1,224 | 15.1% |
| Total Housing Units | 8,092 | 100.0% |
Occupancy by Ownership by Household Size in Vicksburg
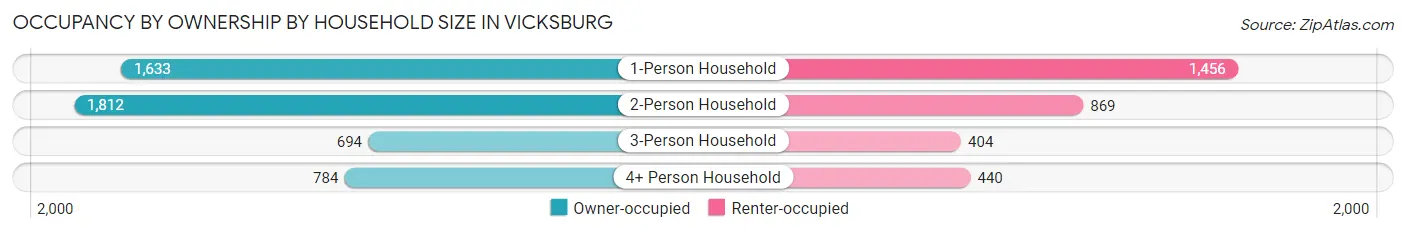
| Household Size | Owner-occupied | Renter-occupied |
| 1-Person Household | 1,633 (52.9%) | 1,456 (47.1%) |
| 2-Person Household | 1,812 (67.6%) | 869 (32.4%) |
| 3-Person Household | 694 (63.2%) | 404 (36.8%) |
| 4+ Person Household | 784 (64.0%) | 440 (35.9%) |
| Total Housing Units | 4,923 (60.8%) | 3,169 (39.2%) |
Occupancy by Educational Attainment in Vicksburg
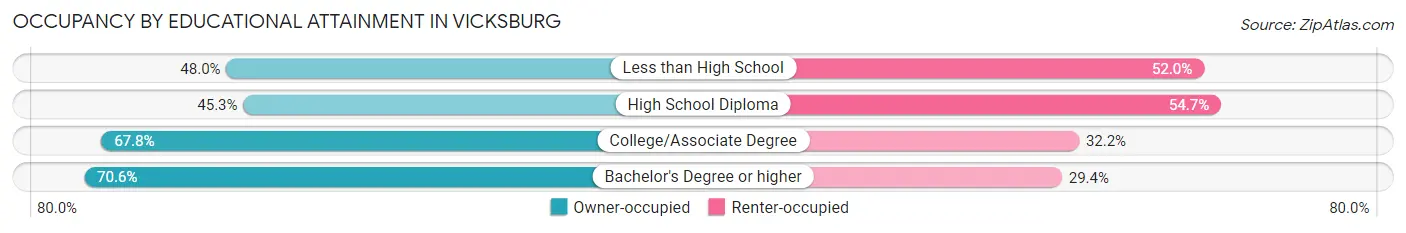
| Household Size | Owner-occupied | Renter-occupied |
| Less than High School | 526 (48.0%) | 570 (52.0%) |
| High School Diploma | 824 (45.3%) | 995 (54.7%) |
| College/Associate Degree | 1,989 (67.8%) | 943 (32.2%) |
| Bachelor's Degree or higher | 1,584 (70.6%) | 661 (29.4%) |
Occupancy by Age of Householder in Vicksburg
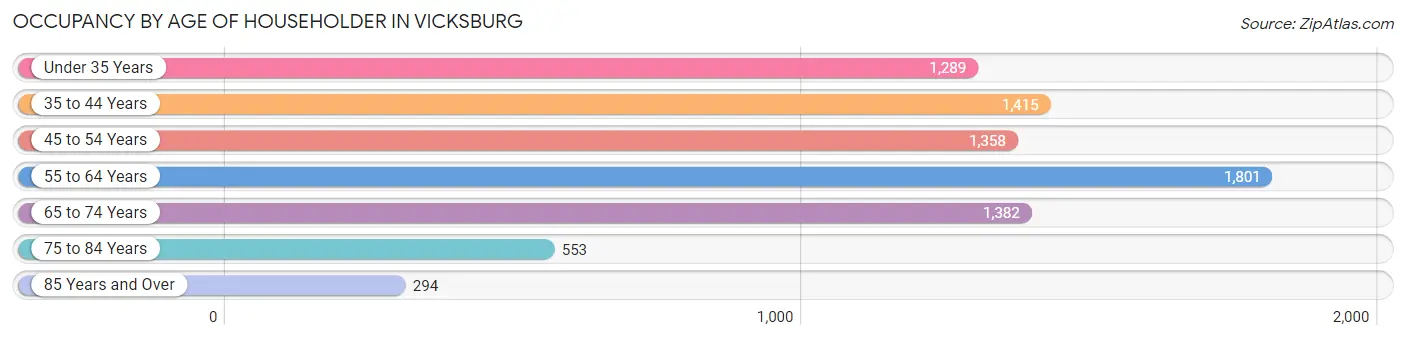
| Age Bracket | # Households | % Households |
| Under 35 Years | 1,289 | 15.9% |
| 35 to 44 Years | 1,415 | 17.5% |
| 45 to 54 Years | 1,358 | 16.8% |
| 55 to 64 Years | 1,801 | 22.3% |
| 65 to 74 Years | 1,382 | 17.1% |
| 75 to 84 Years | 553 | 6.8% |
| 85 Years and Over | 294 | 3.6% |
| Total | 8,092 | 100.0% |
Housing Finances in Vicksburg
Median Income by Occupancy in Vicksburg
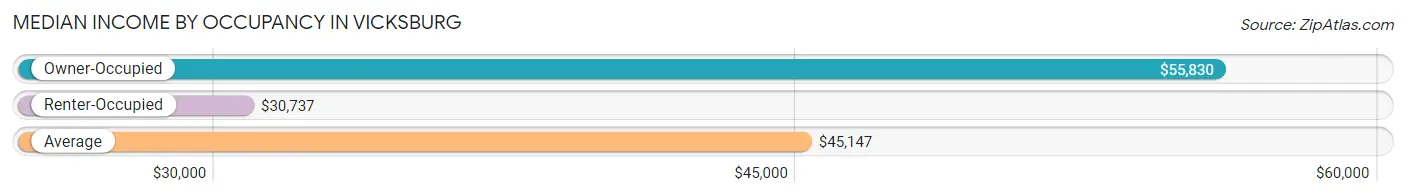
| Occupancy Type | # Households | Median Income |
| Owner-Occupied | 4,923 (60.8%) | $55,830 |
| Renter-Occupied | 3,169 (39.2%) | $30,737 |
| Average | 8,092 (100.0%) | $45,147 |
Occupancy by Householder Income Bracket in Vicksburg
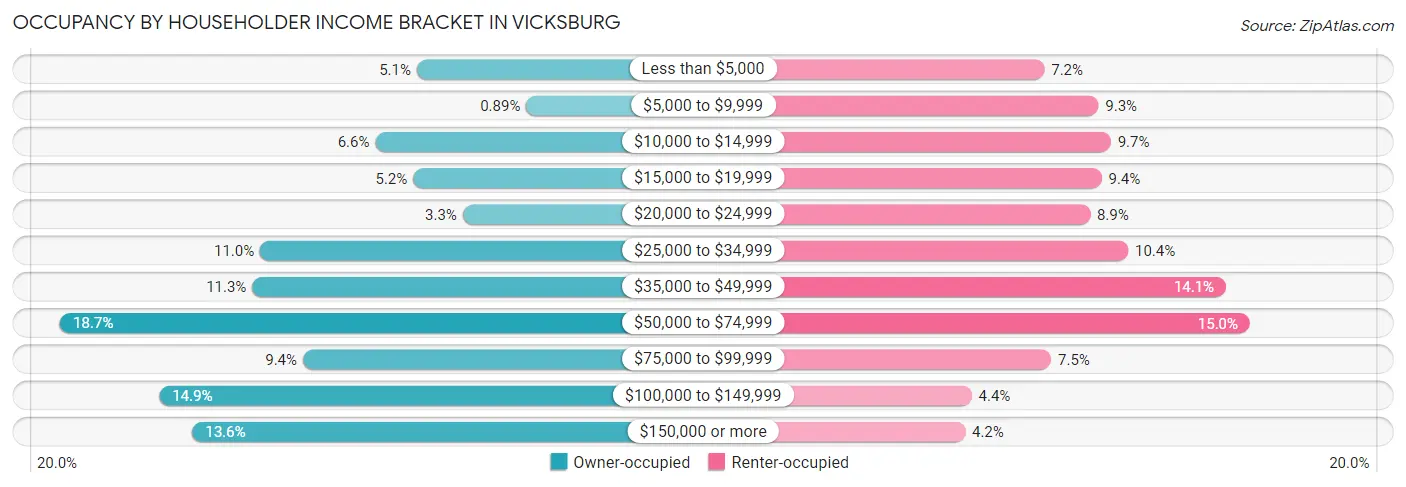
| Income Bracket | Owner-occupied | Renter-occupied |
| Less than $5,000 | 249 (5.1%) | 228 (7.2%) |
| $5,000 to $9,999 | 44 (0.9%) | 293 (9.2%) |
| $10,000 to $14,999 | 327 (6.6%) | 308 (9.7%) |
| $15,000 to $19,999 | 256 (5.2%) | 297 (9.4%) |
| $20,000 to $24,999 | 163 (3.3%) | 283 (8.9%) |
| $25,000 to $34,999 | 543 (11.0%) | 329 (10.4%) |
| $35,000 to $49,999 | 558 (11.3%) | 447 (14.1%) |
| $50,000 to $74,999 | 918 (18.6%) | 476 (15.0%) |
| $75,000 to $99,999 | 463 (9.4%) | 236 (7.4%) |
| $100,000 to $149,999 | 732 (14.9%) | 140 (4.4%) |
| $150,000 or more | 670 (13.6%) | 132 (4.2%) |
| Total | 4,923 (100.0%) | 3,169 (100.0%) |
Monthly Housing Cost Tiers in Vicksburg
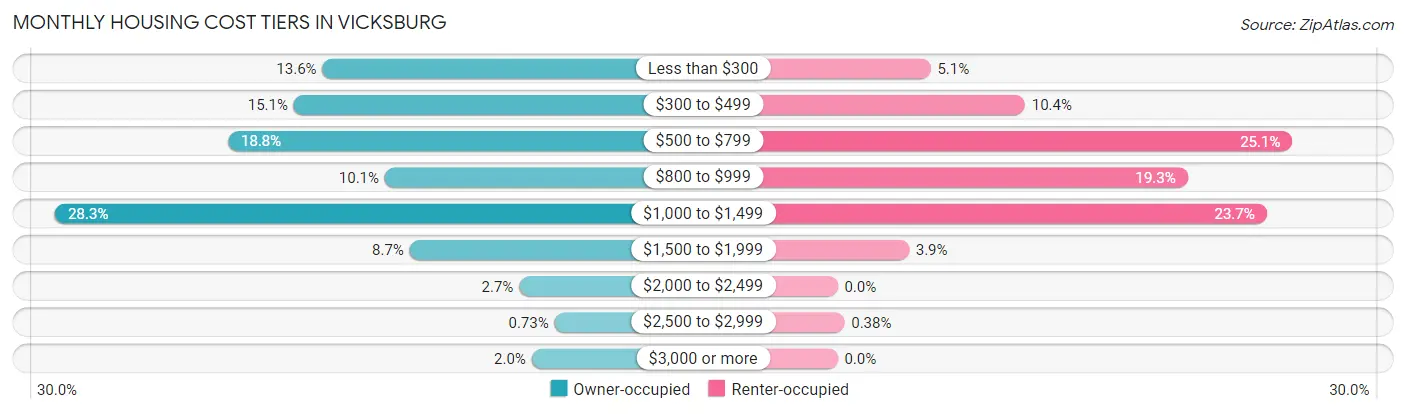
| Monthly Cost | Owner-occupied | Renter-occupied |
| Less than $300 | 667 (13.6%) | 163 (5.1%) |
| $300 to $499 | 745 (15.1%) | 328 (10.3%) |
| $500 to $799 | 924 (18.8%) | 796 (25.1%) |
| $800 to $999 | 497 (10.1%) | 613 (19.3%) |
| $1,000 to $1,499 | 1,394 (28.3%) | 751 (23.7%) |
| $1,500 to $1,999 | 430 (8.7%) | 125 (3.9%) |
| $2,000 to $2,499 | 132 (2.7%) | 0 (0.0%) |
| $2,500 to $2,999 | 36 (0.7%) | 12 (0.4%) |
| $3,000 or more | 98 (2.0%) | 0 (0.0%) |
| Total | 4,923 (100.0%) | 3,169 (100.0%) |
Physical Housing Characteristics in Vicksburg
Housing Structures in Vicksburg
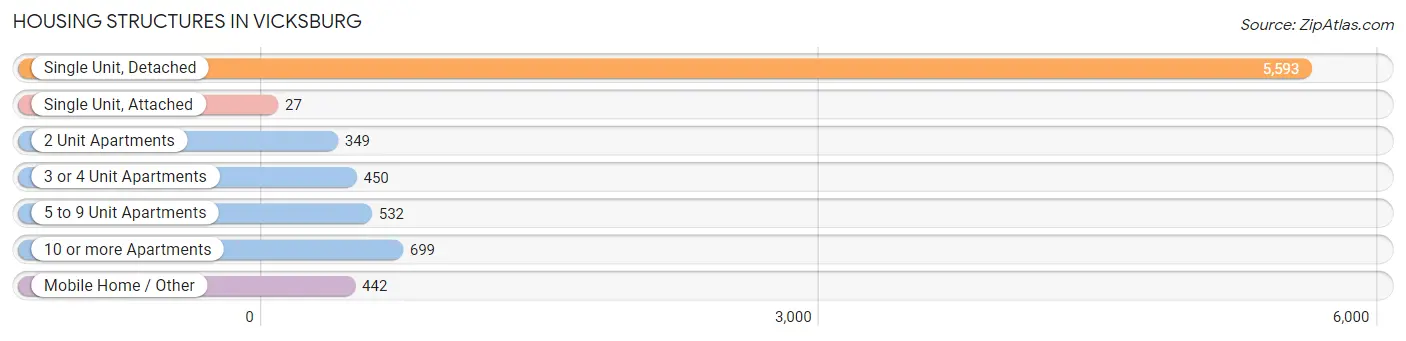
| Structure Type | # Housing Units | % Housing Units |
| Single Unit, Detached | 5,593 | 69.1% |
| Single Unit, Attached | 27 | 0.3% |
| 2 Unit Apartments | 349 | 4.3% |
| 3 or 4 Unit Apartments | 450 | 5.6% |
| 5 to 9 Unit Apartments | 532 | 6.6% |
| 10 or more Apartments | 699 | 8.6% |
| Mobile Home / Other | 442 | 5.5% |
| Total | 8,092 | 100.0% |
Housing Structures by Occupancy in Vicksburg
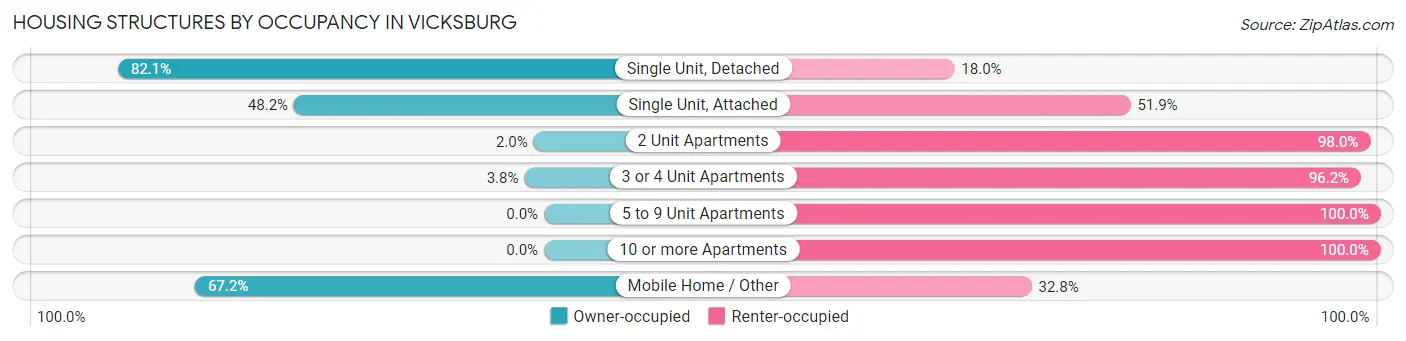
| Structure Type | Owner-occupied | Renter-occupied |
| Single Unit, Detached | 4,589 (82.1%) | 1,004 (17.9%) |
| Single Unit, Attached | 13 (48.1%) | 14 (51.8%) |
| 2 Unit Apartments | 7 (2.0%) | 342 (98.0%) |
| 3 or 4 Unit Apartments | 17 (3.8%) | 433 (96.2%) |
| 5 to 9 Unit Apartments | 0 (0.0%) | 532 (100.0%) |
| 10 or more Apartments | 0 (0.0%) | 699 (100.0%) |
| Mobile Home / Other | 297 (67.2%) | 145 (32.8%) |
| Total | 4,923 (60.8%) | 3,169 (39.2%) |
Housing Structures by Number of Rooms in Vicksburg
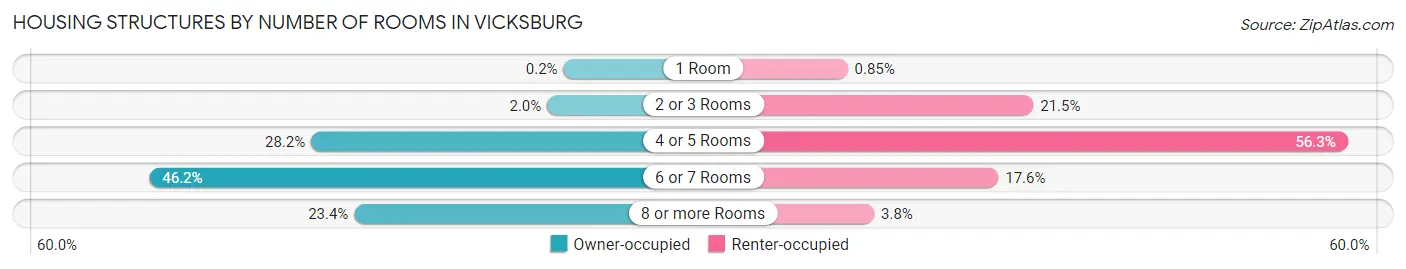
| Number of Rooms | Owner-occupied | Renter-occupied |
| 1 Room | 10 (0.2%) | 27 (0.9%) |
| 2 or 3 Rooms | 99 (2.0%) | 680 (21.5%) |
| 4 or 5 Rooms | 1,389 (28.2%) | 1,785 (56.3%) |
| 6 or 7 Rooms | 2,272 (46.2%) | 557 (17.6%) |
| 8 or more Rooms | 1,153 (23.4%) | 120 (3.8%) |
| Total | 4,923 (100.0%) | 3,169 (100.0%) |
Housing Structure by Heating Type in Vicksburg
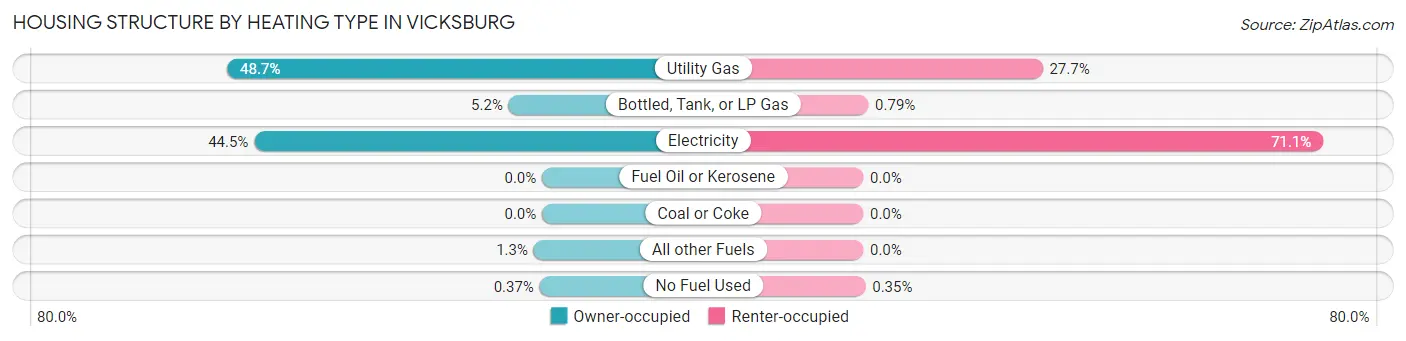
| Heating Type | Owner-occupied | Renter-occupied |
| Utility Gas | 2,397 (48.7%) | 879 (27.7%) |
| Bottled, Tank, or LP Gas | 254 (5.2%) | 25 (0.8%) |
| Electricity | 2,191 (44.5%) | 2,254 (71.1%) |
| Fuel Oil or Kerosene | 0 (0.0%) | 0 (0.0%) |
| Coal or Coke | 0 (0.0%) | 0 (0.0%) |
| All other Fuels | 63 (1.3%) | 0 (0.0%) |
| No Fuel Used | 18 (0.4%) | 11 (0.4%) |
| Total | 4,923 (100.0%) | 3,169 (100.0%) |
Household Vehicle Usage in Vicksburg
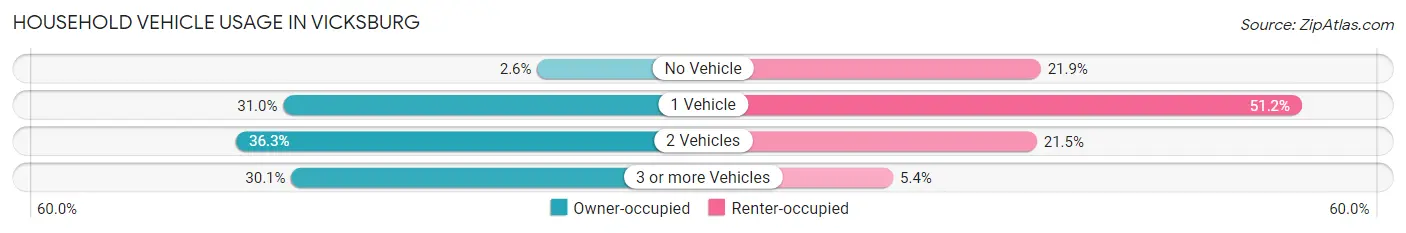
| Vehicles per Household | Owner-occupied | Renter-occupied |
| No Vehicle | 126 (2.6%) | 695 (21.9%) |
| 1 Vehicle | 1,527 (31.0%) | 1,622 (51.2%) |
| 2 Vehicles | 1,787 (36.3%) | 681 (21.5%) |
| 3 or more Vehicles | 1,483 (30.1%) | 171 (5.4%) |
| Total | 4,923 (100.0%) | 3,169 (100.0%) |
Real Estate & Mortgages in Vicksburg
Real Estate and Mortgage Overview in Vicksburg
| Characteristic | Without Mortgage | With Mortgage |
| Housing Units | 1,987 | 2,936 |
| Median Property Value | $109,700 | $123,600 |
| Median Household Income | $53,155 | $397 |
| Monthly Housing Costs | $368 | $94 |
| Real Estate Taxes | $954 | $1,055 |
Property Value by Mortgage Status in Vicksburg
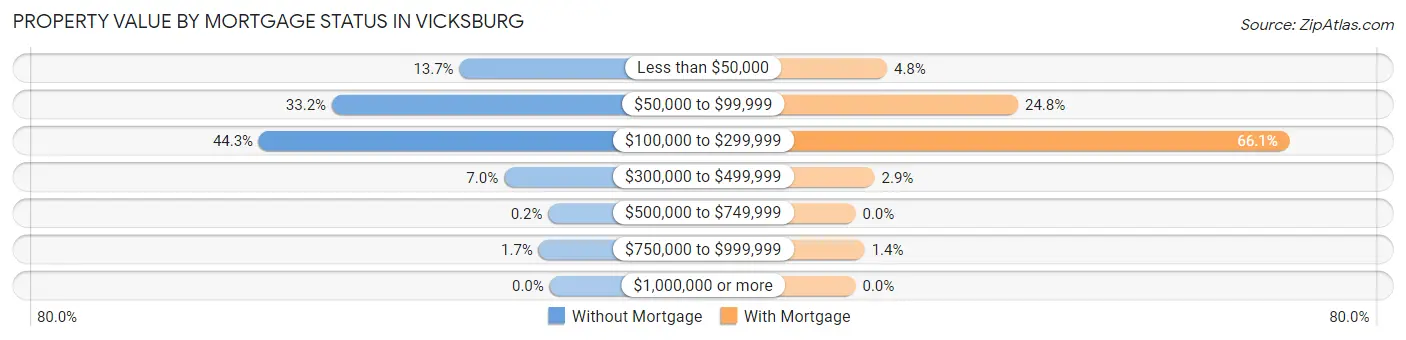
| Property Value | Without Mortgage | With Mortgage |
| Less than $50,000 | 273 (13.7%) | 141 (4.8%) |
| $50,000 to $99,999 | 659 (33.2%) | 727 (24.8%) |
| $100,000 to $299,999 | 880 (44.3%) | 1,942 (66.1%) |
| $300,000 to $499,999 | 138 (7.0%) | 85 (2.9%) |
| $500,000 to $749,999 | 4 (0.2%) | 0 (0.0%) |
| $750,000 to $999,999 | 33 (1.7%) | 41 (1.4%) |
| $1,000,000 or more | 0 (0.0%) | 0 (0.0%) |
| Total | 1,987 (100.0%) | 2,936 (100.0%) |
Household Income by Mortgage Status in Vicksburg
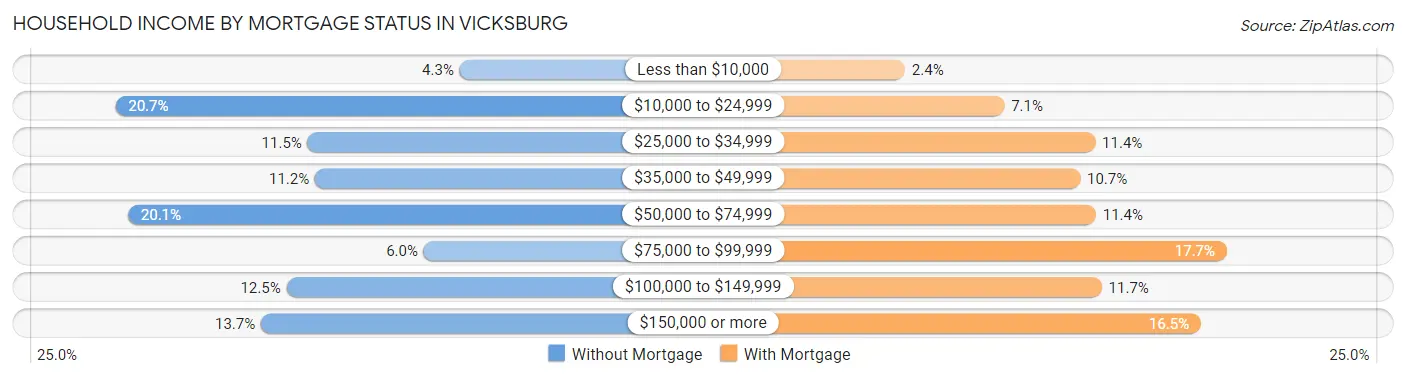
| Household Income | Without Mortgage | With Mortgage |
| Less than $10,000 | 85 (4.3%) | 69 (2.4%) |
| $10,000 to $24,999 | 411 (20.7%) | 208 (7.1%) |
| $25,000 to $34,999 | 229 (11.5%) | 335 (11.4%) |
| $35,000 to $49,999 | 222 (11.2%) | 314 (10.7%) |
| $50,000 to $74,999 | 399 (20.1%) | 336 (11.4%) |
| $75,000 to $99,999 | 119 (6.0%) | 519 (17.7%) |
| $100,000 to $149,999 | 249 (12.5%) | 344 (11.7%) |
| $150,000 or more | 273 (13.7%) | 483 (16.5%) |
| Total | 1,987 (100.0%) | 2,936 (100.0%) |
Property Value to Household Income Ratio in Vicksburg
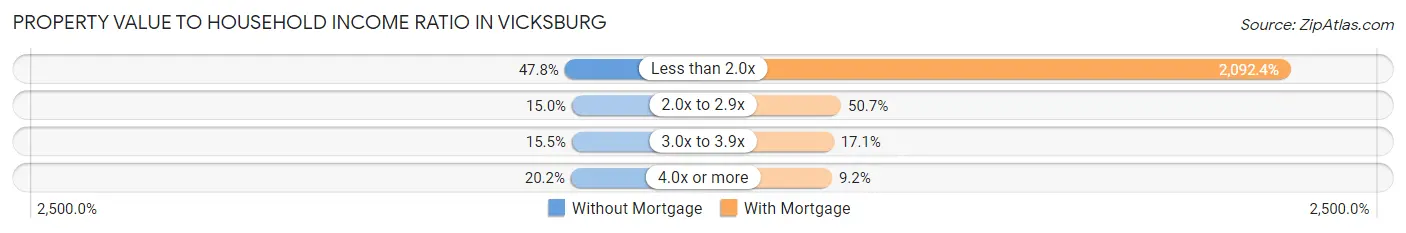
| Value-to-Income Ratio | Without Mortgage | With Mortgage |
| Less than 2.0x | 949 (47.8%) | 61,433 (2,092.4%) |
| 2.0x to 2.9x | 297 (14.9%) | 1,488 (50.7%) |
| 3.0x to 3.9x | 307 (15.4%) | 503 (17.1%) |
| 4.0x or more | 401 (20.2%) | 271 (9.2%) |
| Total | 1,987 (100.0%) | 2,936 (100.0%) |
Real Estate Taxes by Mortgage Status in Vicksburg
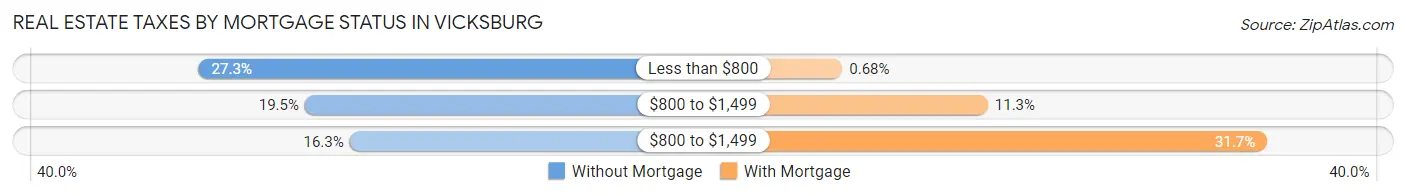
| Property Taxes | Without Mortgage | With Mortgage |
| Less than $800 | 542 (27.3%) | 20 (0.7%) |
| $800 to $1,499 | 388 (19.5%) | 332 (11.3%) |
| $800 to $1,499 | 323 (16.3%) | 931 (31.7%) |
| Total | 1,987 (100.0%) | 2,936 (100.0%) |
Health & Disability in Vicksburg
Health Insurance Coverage by Age in Vicksburg
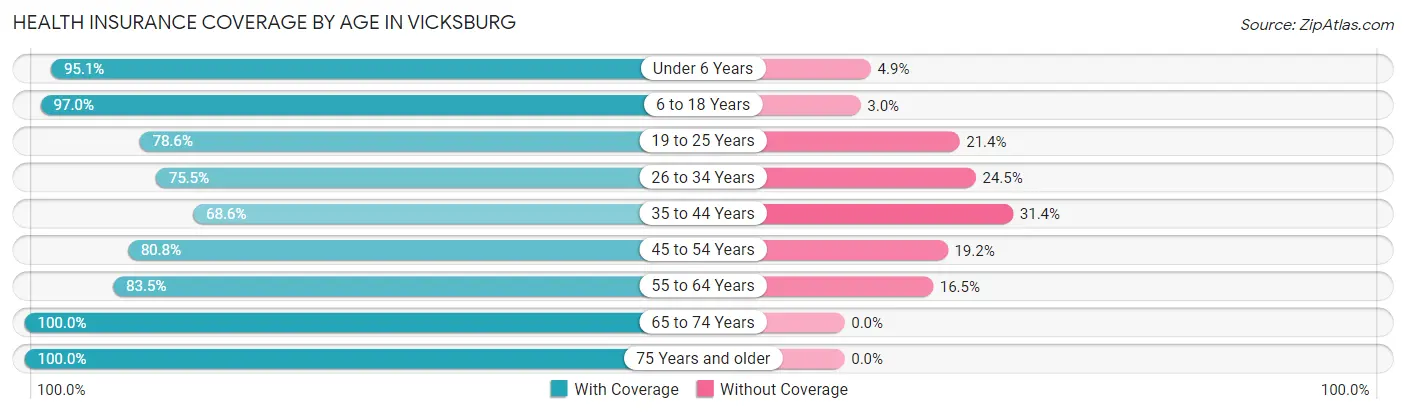
| Age Bracket | With Coverage | Without Coverage |
| Under 6 Years | 1,779 (95.1%) | 92 (4.9%) |
| 6 to 18 Years | 3,575 (97.0%) | 110 (3.0%) |
| 19 to 25 Years | 1,187 (78.6%) | 324 (21.4%) |
| 26 to 34 Years | 1,966 (75.5%) | 637 (24.5%) |
| 35 to 44 Years | 1,885 (68.6%) | 864 (31.4%) |
| 45 to 54 Years | 1,922 (80.8%) | 458 (19.2%) |
| 55 to 64 Years | 2,465 (83.5%) | 487 (16.5%) |
| 65 to 74 Years | 1,969 (100.0%) | 0 (0.0%) |
| 75 Years and older | 1,140 (100.0%) | 0 (0.0%) |
| Total | 17,888 (85.8%) | 2,972 (14.2%) |
Health Insurance Coverage by Citizenship Status in Vicksburg
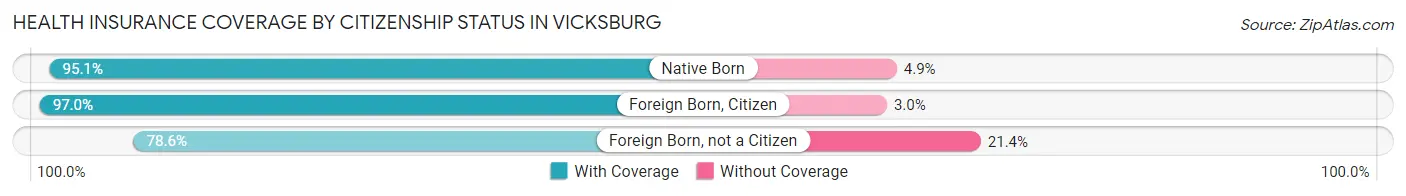
| Citizenship Status | With Coverage | Without Coverage |
| Native Born | 1,779 (95.1%) | 92 (4.9%) |
| Foreign Born, Citizen | 3,575 (97.0%) | 110 (3.0%) |
| Foreign Born, not a Citizen | 1,187 (78.6%) | 324 (21.4%) |
Health Insurance Coverage by Household Income in Vicksburg
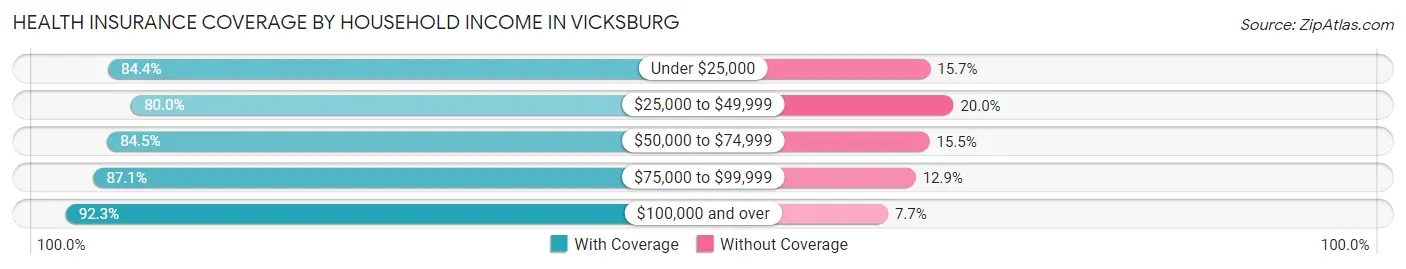
| Household Income | With Coverage | Without Coverage |
| Under $25,000 | 4,464 (84.4%) | 828 (15.7%) |
| $25,000 to $49,999 | 3,524 (80.0%) | 880 (20.0%) |
| $50,000 to $74,999 | 2,852 (84.5%) | 523 (15.5%) |
| $75,000 to $99,999 | 2,125 (87.1%) | 315 (12.9%) |
| $100,000 and over | 4,778 (92.3%) | 400 (7.7%) |
Public vs Private Health Insurance Coverage by Age in Vicksburg
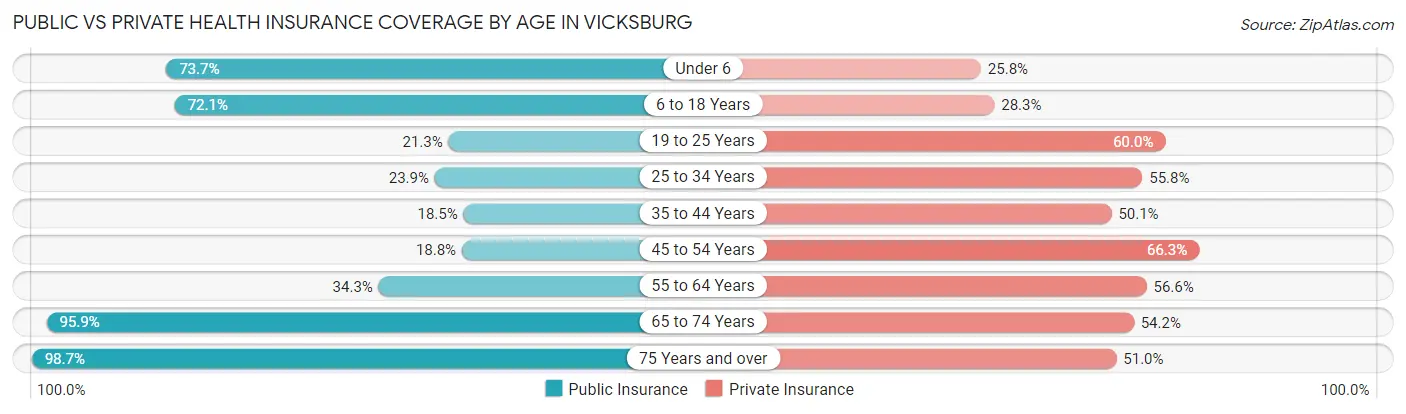
| Age Bracket | Public Insurance | Private Insurance |
| Under 6 | 1,379 (73.7%) | 483 (25.8%) |
| 6 to 18 Years | 2,658 (72.1%) | 1,043 (28.3%) |
| 19 to 25 Years | 322 (21.3%) | 907 (60.0%) |
| 25 to 34 Years | 621 (23.9%) | 1,452 (55.8%) |
| 35 to 44 Years | 509 (18.5%) | 1,376 (50.0%) |
| 45 to 54 Years | 448 (18.8%) | 1,578 (66.3%) |
| 55 to 64 Years | 1,012 (34.3%) | 1,670 (56.6%) |
| 65 to 74 Years | 1,889 (95.9%) | 1,067 (54.2%) |
| 75 Years and over | 1,125 (98.7%) | 581 (51.0%) |
| Total | 9,963 (47.8%) | 10,157 (48.7%) |
Disability Status by Sex by Age in Vicksburg
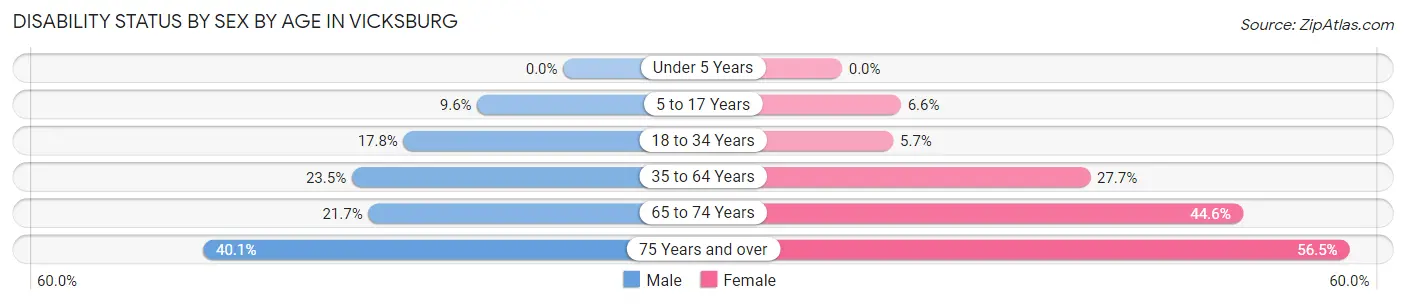
| Age Bracket | Male | Female |
| Under 5 Years | 0 (0.0%) | 0 (0.0%) |
| 5 to 17 Years | 208 (9.6%) | 118 (6.6%) |
| 18 to 34 Years | 306 (17.8%) | 147 (5.7%) |
| 35 to 64 Years | 942 (23.5%) | 1,128 (27.7%) |
| 65 to 74 Years | 209 (21.7%) | 449 (44.6%) |
| 75 Years and over | 138 (40.1%) | 450 (56.5%) |
Disability Class by Sex by Age in Vicksburg
Disability Class: Hearing Difficulty
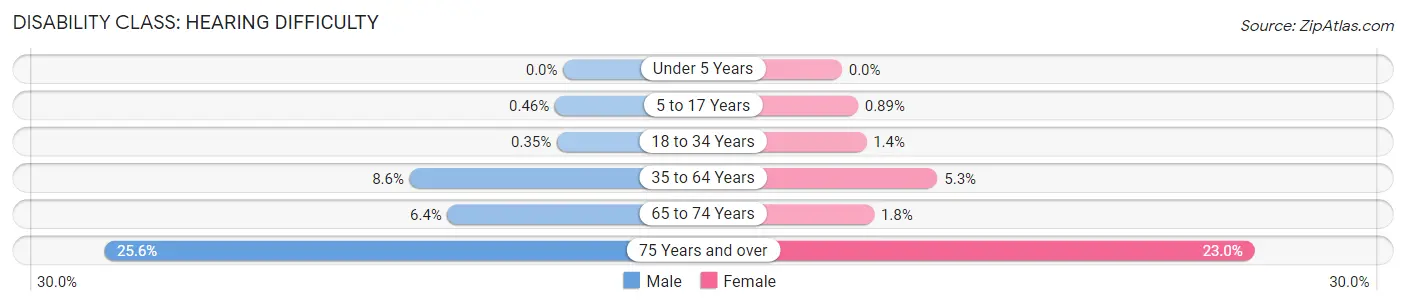
| Age Bracket | Male | Female |
| Under 5 Years | 0 (0.0%) | 0 (0.0%) |
| 5 to 17 Years | 10 (0.5%) | 16 (0.9%) |
| 18 to 34 Years | 6 (0.4%) | 35 (1.4%) |
| 35 to 64 Years | 342 (8.6%) | 217 (5.3%) |
| 65 to 74 Years | 62 (6.4%) | 18 (1.8%) |
| 75 Years and over | 88 (25.6%) | 183 (23.0%) |
Disability Class: Vision Difficulty
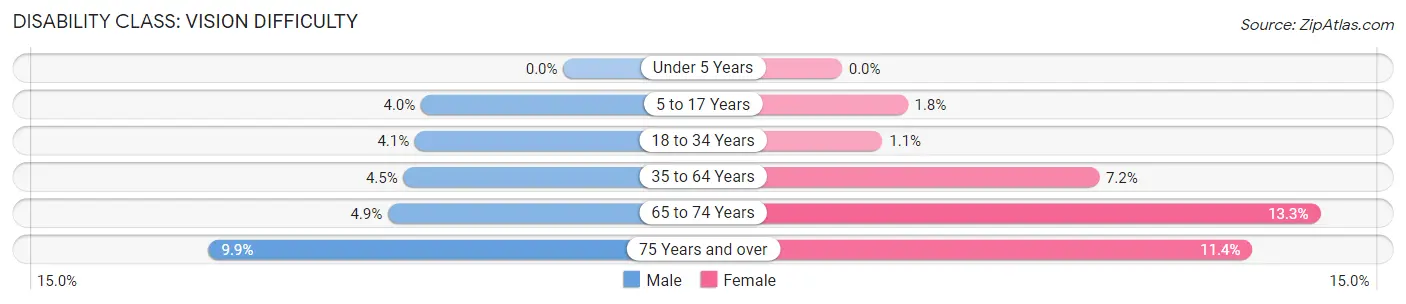
| Age Bracket | Male | Female |
| Under 5 Years | 0 (0.0%) | 0 (0.0%) |
| 5 to 17 Years | 86 (4.0%) | 33 (1.8%) |
| 18 to 34 Years | 71 (4.1%) | 29 (1.1%) |
| 35 to 64 Years | 178 (4.4%) | 292 (7.2%) |
| 65 to 74 Years | 47 (4.9%) | 134 (13.3%) |
| 75 Years and over | 34 (9.9%) | 91 (11.4%) |
Disability Class: Cognitive Difficulty
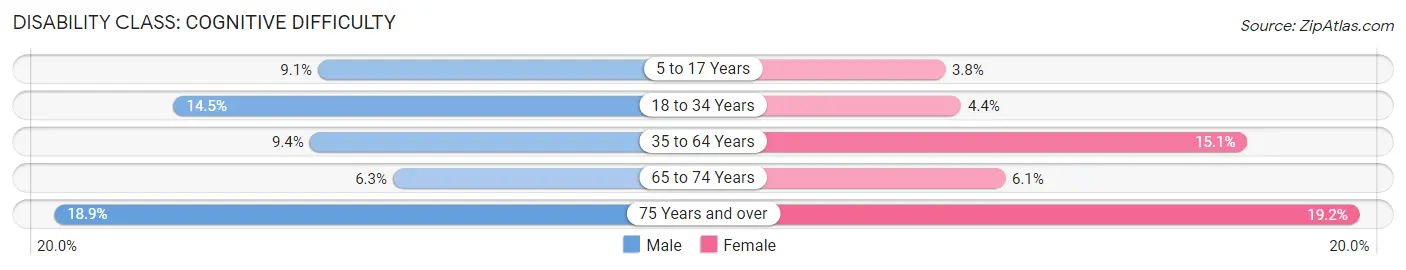
| Age Bracket | Male | Female |
| 5 to 17 Years | 198 (9.1%) | 69 (3.8%) |
| 18 to 34 Years | 249 (14.5%) | 114 (4.4%) |
| 35 to 64 Years | 377 (9.4%) | 614 (15.0%) |
| 65 to 74 Years | 61 (6.3%) | 61 (6.1%) |
| 75 Years and over | 65 (18.9%) | 153 (19.2%) |
Disability Class: Ambulatory Difficulty
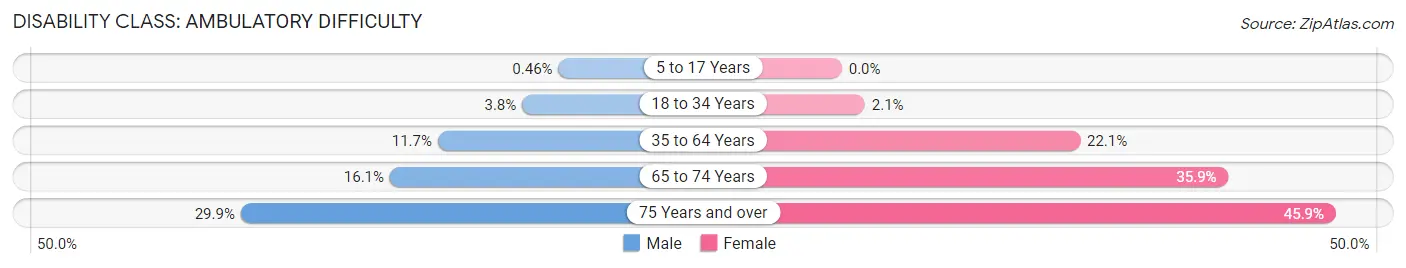
| Age Bracket | Male | Female |
| 5 to 17 Years | 10 (0.5%) | 0 (0.0%) |
| 18 to 34 Years | 66 (3.8%) | 55 (2.1%) |
| 35 to 64 Years | 466 (11.7%) | 902 (22.1%) |
| 65 to 74 Years | 155 (16.1%) | 361 (35.9%) |
| 75 Years and over | 103 (29.9%) | 365 (45.9%) |
Disability Class: Self-Care Difficulty
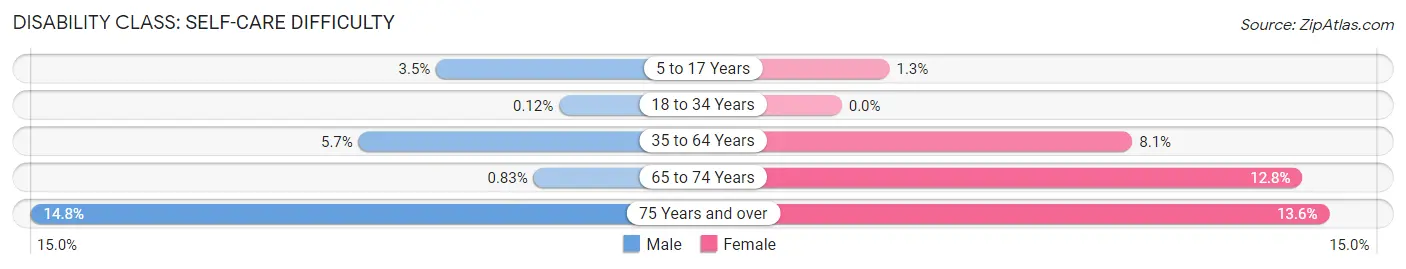
| Age Bracket | Male | Female |
| 5 to 17 Years | 77 (3.5%) | 24 (1.3%) |
| 18 to 34 Years | 2 (0.1%) | 0 (0.0%) |
| 35 to 64 Years | 228 (5.7%) | 330 (8.1%) |
| 65 to 74 Years | 8 (0.8%) | 129 (12.8%) |
| 75 Years and over | 51 (14.8%) | 108 (13.6%) |
Technology Access in Vicksburg
Computing Device Access in Vicksburg
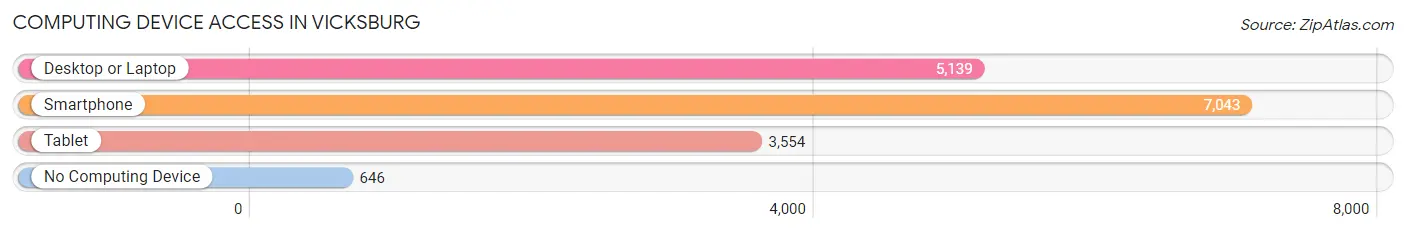
| Device Type | # Households | % Households |
| Desktop or Laptop | 5,139 | 63.5% |
| Smartphone | 7,043 | 87.0% |
| Tablet | 3,554 | 43.9% |
| No Computing Device | 646 | 8.0% |
| Total | 8,092 | 100.0% |
Internet Access in Vicksburg
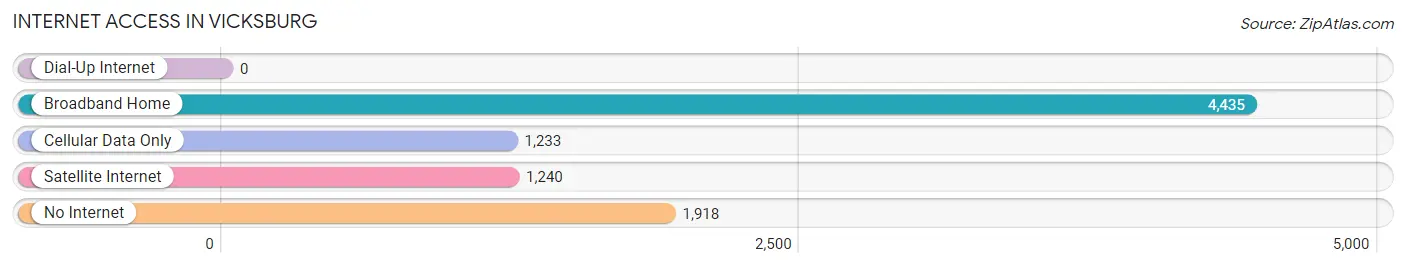
| Internet Type | # Households | % Households |
| Dial-Up Internet | 0 | 0.0% |
| Broadband Home | 4,435 | 54.8% |
| Cellular Data Only | 1,233 | 15.2% |
| Satellite Internet | 1,240 | 15.3% |
| No Internet | 1,918 | 23.7% |
| Total | 8,092 | 100.0% |
Vicksburg Summary
Vicksburg, Mississippi is a city located in Warren County, Mississippi, United States. It is situated on the Mississippi River, near the border of Louisiana. The city is the county seat of Warren County and is part of the Jackson metropolitan area. As of the 2010 census, the city had a population of 23,856.
History
Vicksburg was founded in 1811 by New Englanders who had moved south to the area. The city was named after Newitt Vick, a prominent local landowner. During the Civil War, Vicksburg was the site of a major battle between the Union and Confederate forces. The city was besieged for 47 days, and the Union forces eventually won the battle. After the war, Vicksburg became a major port city and a center of industry.
Geography
Vicksburg is located at 32°19'N 90°52'W. It is situated on the Mississippi River, near the border of Louisiana. The city is located in the Yazoo-Mississippi Delta region of Mississippi. The city has a total area of 24.2 square miles, of which 23.2 square miles is land and 1.0 square mile is water.
Economy
Vicksburg’s economy is largely based on tourism, manufacturing, and agriculture. The city is home to several major industries, including paper and wood products, chemicals, and food processing. The city is also home to several casinos, which attract tourists from all over the country.
Demographics
As of the 2010 census, the city had a population of 23,856. The racial makeup of the city was 57.2% African American, 37.7% White, 0.3% Native American, 0.7% Asian, 0.1% Pacific Islander, and 4.0% from other races. The median household income was $30,912, and the median family income was $37,845.
Conclusion
Vicksburg, Mississippi is a city located in Warren County, Mississippi, United States. It is situated on the Mississippi River, near the border of Louisiana. The city is the county seat of Warren County and is part of the Jackson metropolitan area. As of the 2010 census, the city had a population of 23,856. Vicksburg’s economy is largely based on tourism, manufacturing, and agriculture. The city is home to several major industries, including paper and wood products, chemicals, and food processing. The racial makeup of the city was 57.2% African American, 37.7% White, 0.3% Native American, 0.7% Asian, 0.1% Pacific Islander, and 4.0% from other races. Vicksburg is a vibrant city with a rich history and a bright future.
Common Questions
What is Per Capita Income in Vicksburg?
Per Capita income in Vicksburg is $27,816.
What is the Median Family Income in Vicksburg?
Median Family Income in Vicksburg is $57,337.
What is the Median Household income in Vicksburg?
Median Household Income in Vicksburg is $45,147.
What is Income or Wage Gap in Vicksburg?
Income or Wage Gap in Vicksburg is 18.8%.
Women in Vicksburg earn 81.2 cents for every dollar earned by a man.
What is Family Income Deficit in Vicksburg?
Family Income Deficit in Vicksburg is $11,526.
Families that are below poverty line in Vicksburg earn $11,526 less on average than the poverty threshold level.
What is Inequality or Gini Index in Vicksburg?
Inequality or Gini Index in Vicksburg is 0.52.
What is the Total Population of Vicksburg?
Total Population of Vicksburg is 21,337.
What is the Total Male Population of Vicksburg?
Total Male Population of Vicksburg is 10,226.
What is the Total Female Population of Vicksburg?
Total Female Population of Vicksburg is 11,111.
What is the Ratio of Males per 100 Females in Vicksburg?
There are 92.03 Males per 100 Females in Vicksburg.
What is the Ratio of Females per 100 Males in Vicksburg?
There are 108.65 Females per 100 Males in Vicksburg.
What is the Median Population Age in Vicksburg?
Median Population Age in Vicksburg is 37.6 Years.
What is the Average Family Size in Vicksburg
Average Family Size in Vicksburg is 3.6 People.
What is the Average Household Size in Vicksburg
Average Household Size in Vicksburg is 2.6 People.
How Large is the Labor Force in Vicksburg?
There are 9,233 People in the Labor Forcein in Vicksburg.
What is the Percentage of People in the Labor Force in Vicksburg?
55.7% of People are in the Labor Force in Vicksburg.
What is the Unemployment Rate in Vicksburg?
Unemployment Rate in Vicksburg is 6.7%.