Sheridan, WY Map & Demographics
Sheridan Map
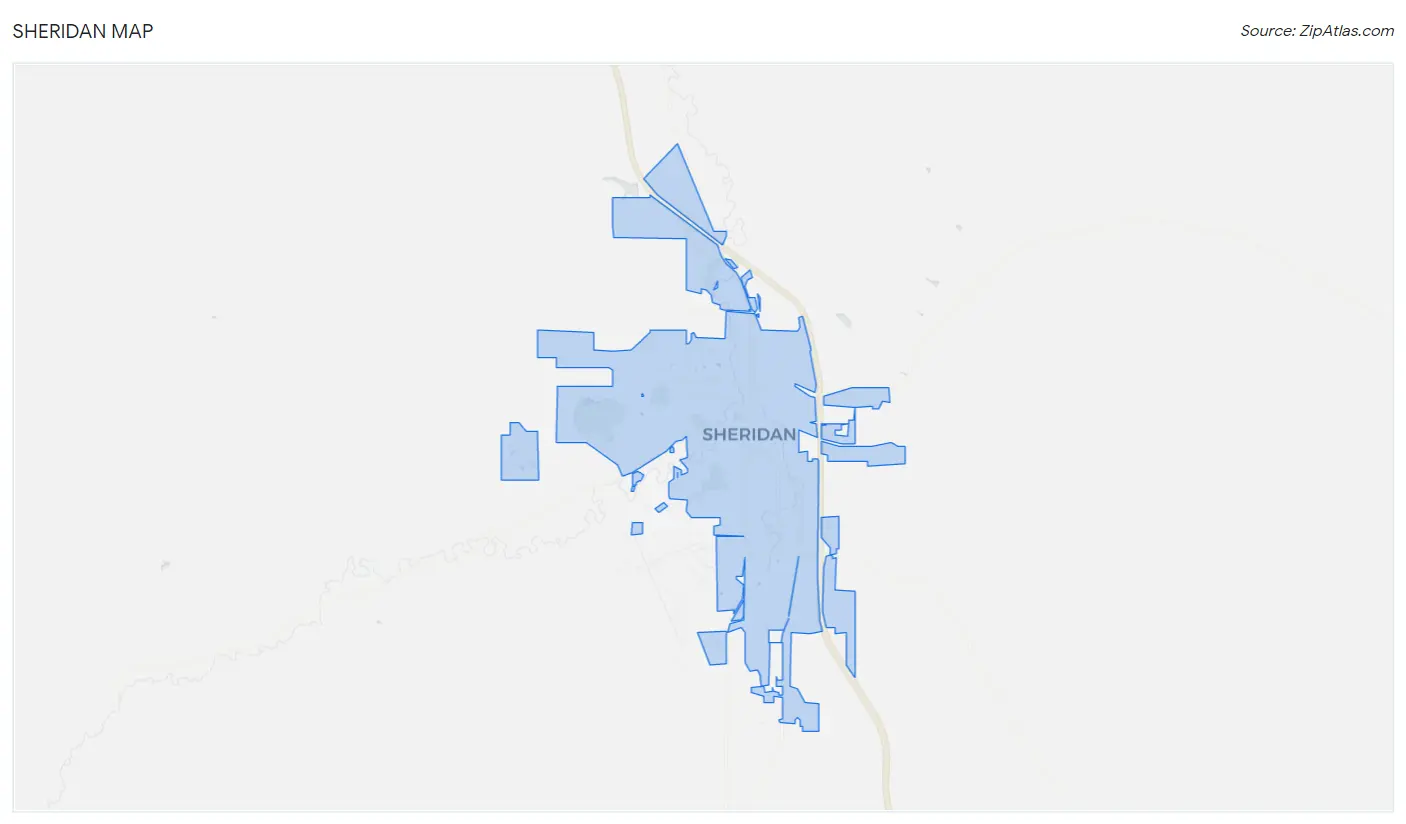
Sheridan Overview
$38,554
PER CAPITA INCOME
$99,655
AVG FAMILY INCOME
$57,667
AVG HOUSEHOLD INCOME
38.3%
WAGE / INCOME GAP [ % ]
61.7¢/ $1
WAGE / INCOME GAP [ $ ]
$14,628
FAMILY INCOME DEFICIT
0.47
INEQUALITY / GINI INDEX
18,807
TOTAL POPULATION
9,405
MALE POPULATION
9,402
FEMALE POPULATION
100.03
MALES / 100 FEMALES
99.97
FEMALES / 100 MALES
39.7
MEDIAN AGE
3.1
AVG FAMILY SIZE
2.2
AVG HOUSEHOLD SIZE
9,540
LABOR FORCE [ PEOPLE ]
63.5%
PERCENT IN LABOR FORCE
3.4%
UNEMPLOYMENT RATE
Sheridan Zip Codes
Sheridan Area Codes
Income in Sheridan
Income Overview in Sheridan
Per Capita Income in Sheridan is $38,554, while median incomes of families and households are $99,655 and $57,667 respectively.
| Characteristic | Number | Measure |
| Per Capita Income | 18,807 | $38,554 |
| Median Family Income | 4,234 | $99,655 |
| Mean Family Income | 4,234 | $112,694 |
| Median Household Income | 8,254 | $57,667 |
| Mean Household Income | 8,254 | $82,489 |
| Income Deficit | 4,234 | $14,628 |
| Wage / Income Gap (%) | 18,807 | 38.28% |
| Wage / Income Gap ($) | 18,807 | 61.72¢ per $1 |
| Gini / Inequality Index | 18,807 | 0.47 |
Earnings by Sex in Sheridan
Average Earnings in Sheridan are $39,278, $53,436 for men and $32,982 for women, a difference of 38.3%.
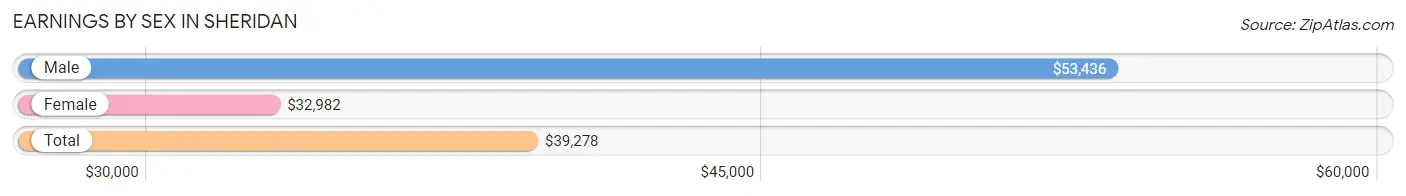
| Sex | Number | Average Earnings |
| Male | 5,437 (53.0%) | $53,436 |
| Female | 4,828 (47.0%) | $32,982 |
| Total | 10,265 (100.0%) | $39,278 |
Earnings by Sex by Income Bracket in Sheridan
The most common earnings brackets in Sheridan are $100,000+ for men (887 | 16.3%) and $55,000 to $64,999 for women (424 | 8.8%).
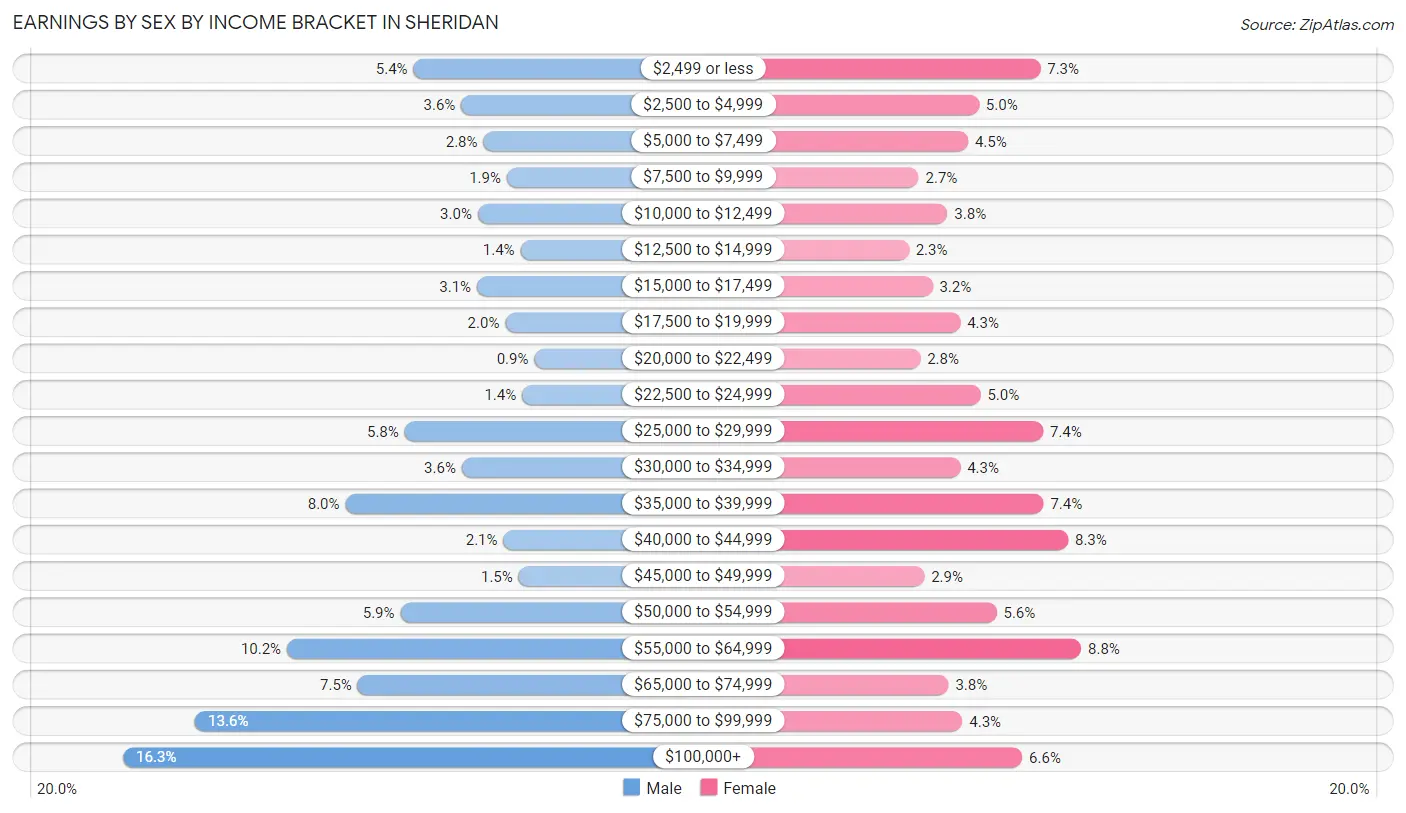
| Income | Male | Female |
| $2,499 or less | 295 (5.4%) | 350 (7.2%) |
| $2,500 to $4,999 | 198 (3.6%) | 239 (5.0%) |
| $5,000 to $7,499 | 153 (2.8%) | 219 (4.5%) |
| $7,500 to $9,999 | 105 (1.9%) | 130 (2.7%) |
| $10,000 to $12,499 | 164 (3.0%) | 182 (3.8%) |
| $12,500 to $14,999 | 77 (1.4%) | 112 (2.3%) |
| $15,000 to $17,499 | 166 (3.0%) | 155 (3.2%) |
| $17,500 to $19,999 | 108 (2.0%) | 205 (4.3%) |
| $20,000 to $22,499 | 49 (0.9%) | 133 (2.8%) |
| $22,500 to $24,999 | 74 (1.4%) | 242 (5.0%) |
| $25,000 to $29,999 | 313 (5.8%) | 355 (7.3%) |
| $30,000 to $34,999 | 197 (3.6%) | 205 (4.3%) |
| $35,000 to $39,999 | 434 (8.0%) | 356 (7.4%) |
| $40,000 to $44,999 | 112 (2.1%) | 400 (8.3%) |
| $45,000 to $49,999 | 81 (1.5%) | 140 (2.9%) |
| $50,000 to $54,999 | 322 (5.9%) | 271 (5.6%) |
| $55,000 to $64,999 | 553 (10.2%) | 424 (8.8%) |
| $65,000 to $74,999 | 409 (7.5%) | 184 (3.8%) |
| $75,000 to $99,999 | 740 (13.6%) | 209 (4.3%) |
| $100,000+ | 887 (16.3%) | 317 (6.6%) |
| Total | 5,437 (100.0%) | 4,828 (100.0%) |
Earnings by Sex by Educational Attainment in Sheridan
Average earnings in Sheridan are $60,710 for men and $39,561 for women, a difference of 34.8%. Men with an educational attainment of bachelor's degree enjoy the highest average annual earnings of $85,665, while those with high school diploma education earn the least with $53,780. Women with an educational attainment of graduate degree earn the most with the average annual earnings of $63,830, while those with less than high school education have the smallest earnings of $24,213.
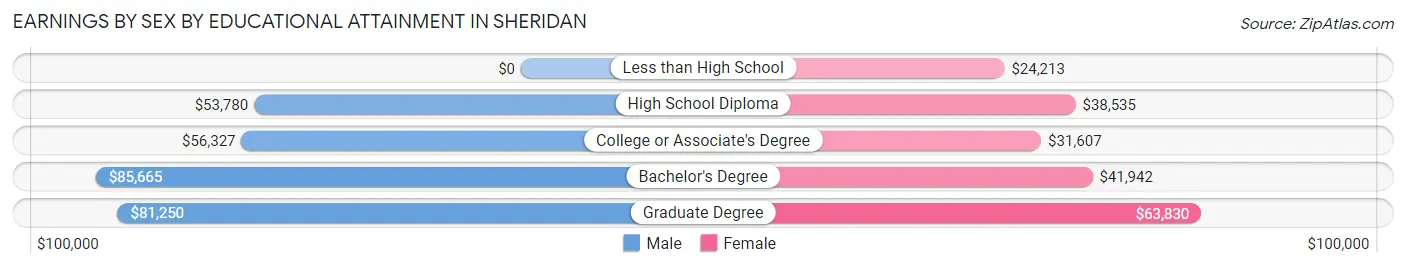
| Educational Attainment | Male Income | Female Income |
| Less than High School | - | - |
| High School Diploma | $53,780 | $38,535 |
| College or Associate's Degree | $56,327 | $31,607 |
| Bachelor's Degree | $85,665 | $41,942 |
| Graduate Degree | $81,250 | $63,830 |
| Total | $60,710 | $39,561 |
Family Income in Sheridan
Family Income Brackets in Sheridan
According to the Sheridan family income data, there are 1,207 families falling into the $100,000 to $149,999 income range, which is the most common income bracket and makes up 28.5% of all families. Conversely, the less than $10,000 income bracket is the least frequent group with only 89 families (2.1%) belonging to this category.
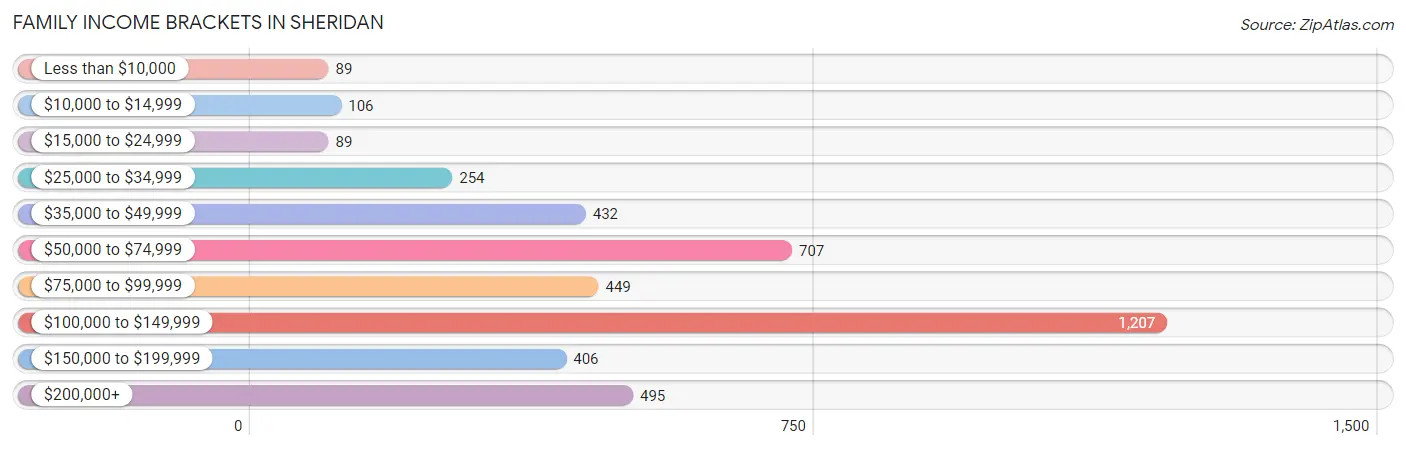
| Income Bracket | # Families | % Families |
| Less than $10,000 | 89 | 2.1% |
| $10,000 to $14,999 | 106 | 2.5% |
| $15,000 to $24,999 | 89 | 2.1% |
| $25,000 to $34,999 | 254 | 6.0% |
| $35,000 to $49,999 | 432 | 10.2% |
| $50,000 to $74,999 | 707 | 16.7% |
| $75,000 to $99,999 | 449 | 10.6% |
| $100,000 to $149,999 | 1,207 | 28.5% |
| $150,000 to $199,999 | 406 | 9.6% |
| $200,000+ | 495 | 11.7% |
Family Income by Famaliy Size in Sheridan
6-person families (93 | 2.2%) account for the highest median family income in Sheridan with $141,434 per family, while 2-person families (2,213 | 52.3%) have the highest median income of $42,244 per family member.
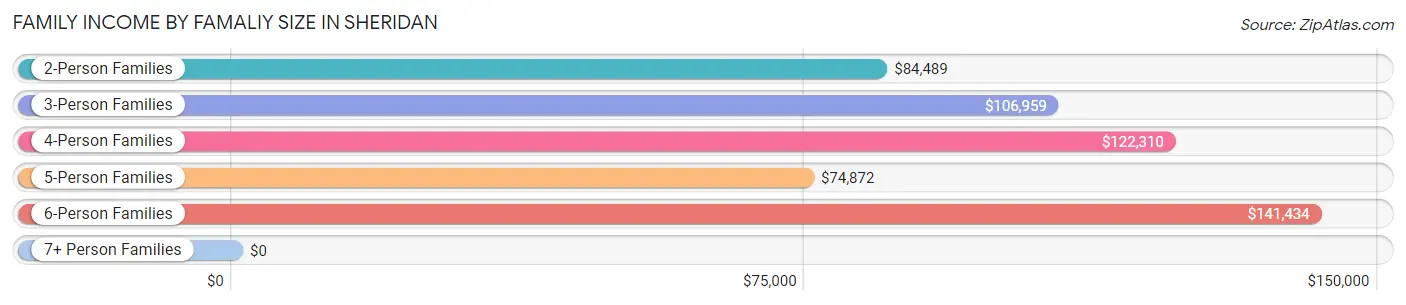
| Income Bracket | # Families | Median Income |
| 2-Person Families | 2,213 (52.3%) | $84,489 |
| 3-Person Families | 862 (20.4%) | $106,959 |
| 4-Person Families | 779 (18.4%) | $122,310 |
| 5-Person Families | 275 (6.5%) | $74,872 |
| 6-Person Families | 93 (2.2%) | $141,434 |
| 7+ Person Families | 12 (0.3%) | $0 |
| Total | 4,234 (100.0%) | $99,655 |
Family Income by Number of Earners in Sheridan
The median family income in Sheridan is $99,655, with families comprising 3+ earners (303) having the highest median family income of $138,854, while families with 1 earner (1,033) have the lowest median family income of $50,104, accounting for 7.2% and 24.4% of families, respectively.
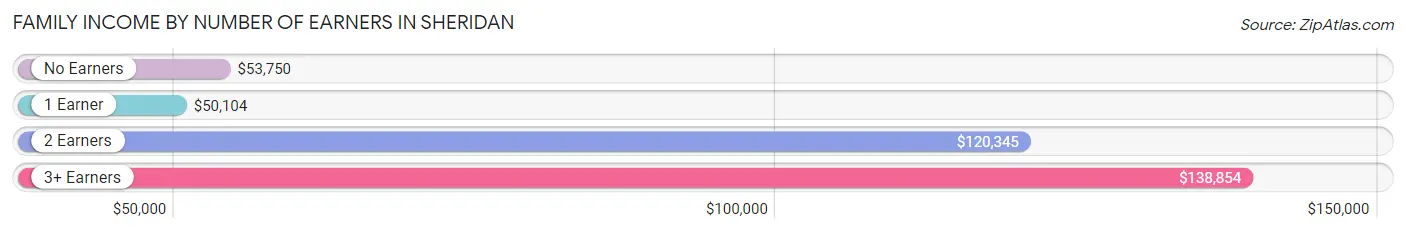
| Number of Earners | # Families | Median Income |
| No Earners | 686 (16.2%) | $53,750 |
| 1 Earner | 1,033 (24.4%) | $50,104 |
| 2 Earners | 2,212 (52.2%) | $120,345 |
| 3+ Earners | 303 (7.2%) | $138,854 |
| Total | 4,234 (100.0%) | $99,655 |
Household Income in Sheridan
Household Income Brackets in Sheridan
With 1,494 households falling in the category, the $100,000 to $149,999 income range is the most frequent in Sheridan, accounting for 18.1% of all households. In contrast, only 454 households (5.5%) fall into the $150,000 to $199,999 income bracket, making it the least populous group.
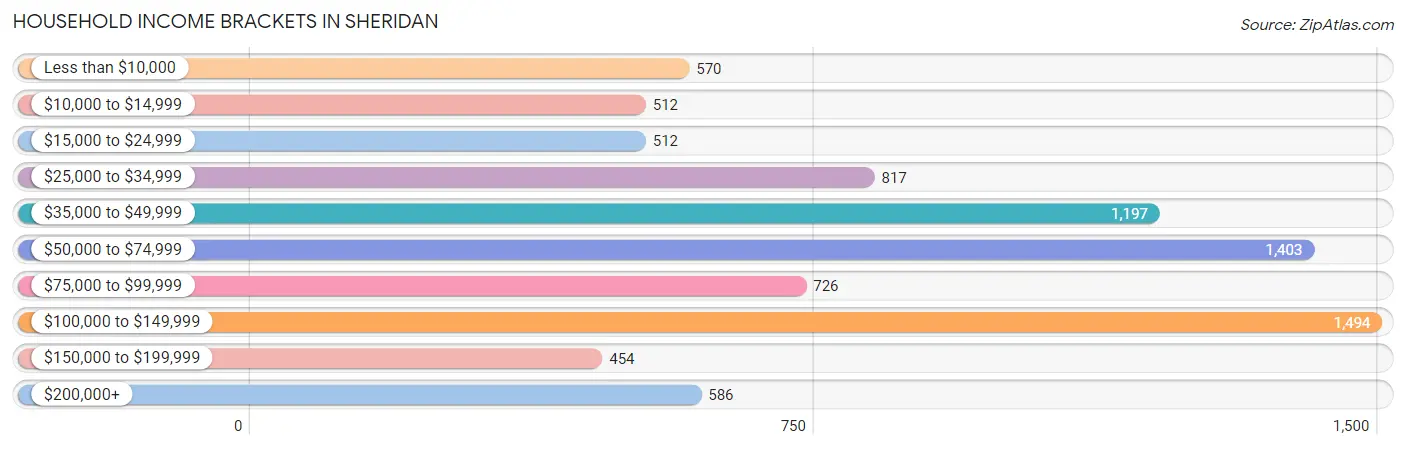
| Income Bracket | # Households | % Households |
| Less than $10,000 | 570 | 6.9% |
| $10,000 to $14,999 | 512 | 6.2% |
| $15,000 to $24,999 | 512 | 6.2% |
| $25,000 to $34,999 | 817 | 9.9% |
| $35,000 to $49,999 | 1,197 | 14.5% |
| $50,000 to $74,999 | 1,403 | 17.0% |
| $75,000 to $99,999 | 726 | 8.8% |
| $100,000 to $149,999 | 1,494 | 18.1% |
| $150,000 to $199,999 | 454 | 5.5% |
| $200,000+ | 586 | 7.1% |
Household Income by Householder Age in Sheridan
The median household income in Sheridan is $57,667, with the highest median household income of $78,203 found in the 25 to 44 years age bracket for the primary householder. A total of 2,495 households (30.2%) fall into this category. Meanwhile, the 15 to 24 years age bracket for the primary householder has the lowest median household income of $37,115, with 486 households (5.9%) in this group.
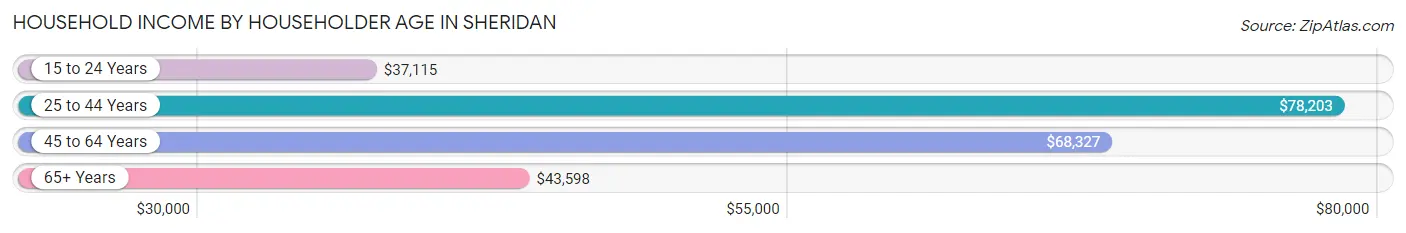
| Income Bracket | # Households | Median Income |
| 15 to 24 Years | 486 (5.9%) | $37,115 |
| 25 to 44 Years | 2,495 (30.2%) | $78,203 |
| 45 to 64 Years | 2,643 (32.0%) | $68,327 |
| 65+ Years | 2,630 (31.9%) | $43,598 |
| Total | 8,254 (100.0%) | $57,667 |
Poverty in Sheridan
Income Below Poverty by Sex and Age in Sheridan
With 9.2% poverty level for males and 12.5% for females among the residents of Sheridan, 75 year old and over males and 18 to 24 year old females are the most vulnerable to poverty, with 151 males (23.4%) and 203 females (25.3%) in their respective age groups living below the poverty level.
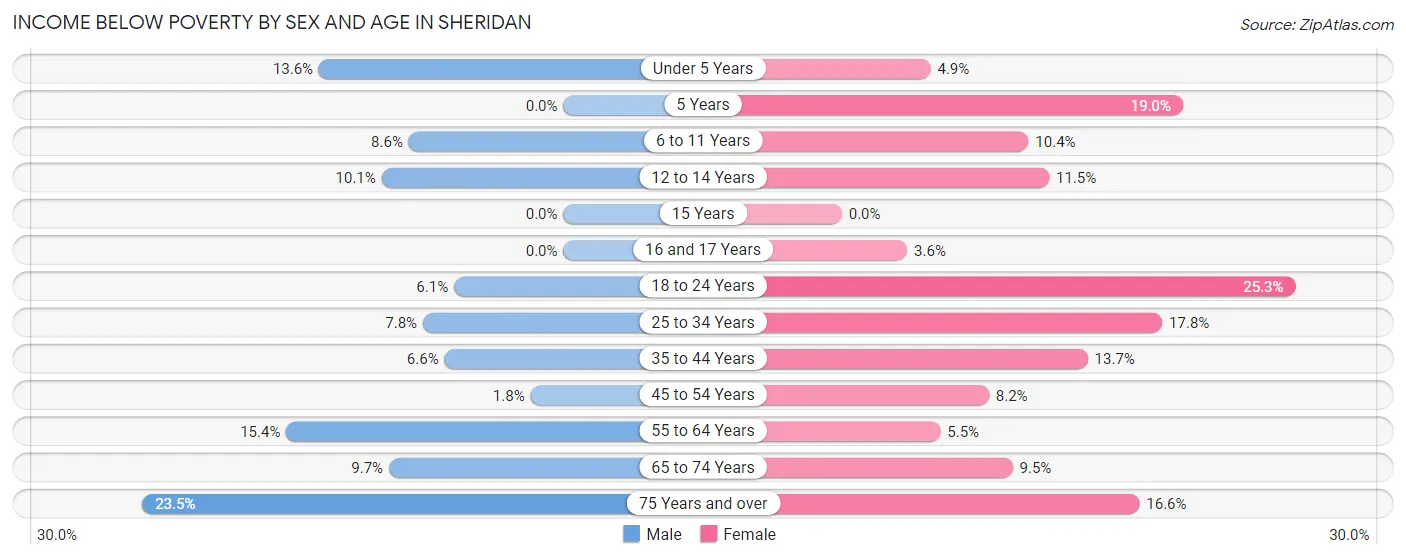
| Age Bracket | Male | Female |
| Under 5 Years | 63 (13.6%) | 24 (4.9%) |
| 5 Years | 0 (0.0%) | 34 (19.0%) |
| 6 to 11 Years | 76 (8.6%) | 96 (10.4%) |
| 12 to 14 Years | 34 (10.1%) | 24 (11.5%) |
| 15 Years | 0 (0.0%) | 0 (0.0%) |
| 16 and 17 Years | 0 (0.0%) | 6 (3.6%) |
| 18 to 24 Years | 42 (6.1%) | 203 (25.3%) |
| 25 to 34 Years | 92 (7.8%) | 187 (17.8%) |
| 35 to 44 Years | 69 (6.6%) | 150 (13.7%) |
| 45 to 54 Years | 20 (1.8%) | 81 (8.2%) |
| 55 to 64 Years | 197 (15.4%) | 54 (5.5%) |
| 65 to 74 Years | 95 (9.7%) | 98 (9.5%) |
| 75 Years and over | 151 (23.4%) | 165 (16.6%) |
| Total | 839 (9.2%) | 1,122 (12.5%) |
Income Above Poverty by Sex and Age in Sheridan
According to the poverty statistics in Sheridan, males aged 5 years and females aged 15 years are the age groups that are most secure financially, with 100.0% of males and 100.0% of females in these age groups living above the poverty line.
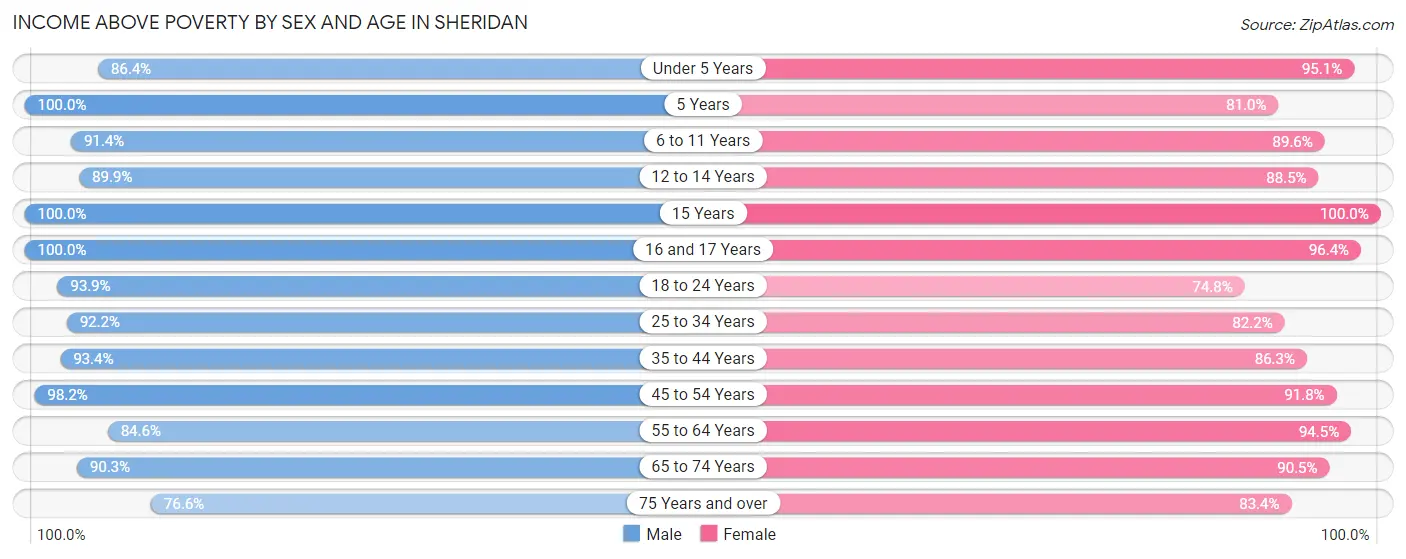
| Age Bracket | Male | Female |
| Under 5 Years | 400 (86.4%) | 462 (95.1%) |
| 5 Years | 68 (100.0%) | 145 (81.0%) |
| 6 to 11 Years | 807 (91.4%) | 828 (89.6%) |
| 12 to 14 Years | 302 (89.9%) | 184 (88.5%) |
| 15 Years | 87 (100.0%) | 92 (100.0%) |
| 16 and 17 Years | 337 (100.0%) | 159 (96.4%) |
| 18 to 24 Years | 648 (93.9%) | 601 (74.8%) |
| 25 to 34 Years | 1,085 (92.2%) | 861 (82.2%) |
| 35 to 44 Years | 974 (93.4%) | 946 (86.3%) |
| 45 to 54 Years | 1,074 (98.2%) | 908 (91.8%) |
| 55 to 64 Years | 1,080 (84.6%) | 929 (94.5%) |
| 65 to 74 Years | 883 (90.3%) | 932 (90.5%) |
| 75 Years and over | 493 (76.5%) | 831 (83.4%) |
| Total | 8,238 (90.8%) | 7,878 (87.5%) |
Income Below Poverty Among Married-Couple Families in Sheridan
The poverty statistics for married-couple families in Sheridan show that 1.7% or 60 of the total 3,505 families live below the poverty line. Families with 3 or 4 children have the highest poverty rate of 5.1%, comprising of 15 families. On the other hand, families with 5 or more children have the lowest poverty rate of 0.0%, which includes 0 families.
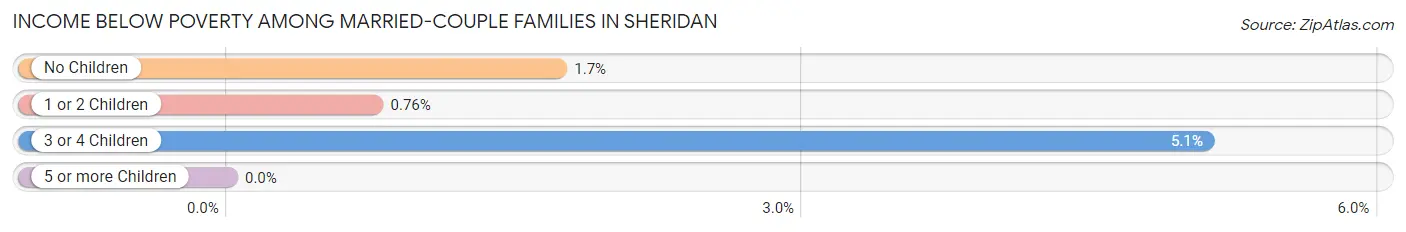
| Children | Above Poverty | Below Poverty |
| No Children | 2,111 (98.3%) | 37 (1.7%) |
| 1 or 2 Children | 1,043 (99.2%) | 8 (0.8%) |
| 3 or 4 Children | 279 (94.9%) | 15 (5.1%) |
| 5 or more Children | 12 (100.0%) | 0 (0.0%) |
| Total | 3,445 (98.3%) | 60 (1.7%) |
Income Below Poverty Among Single-Parent Households in Sheridan
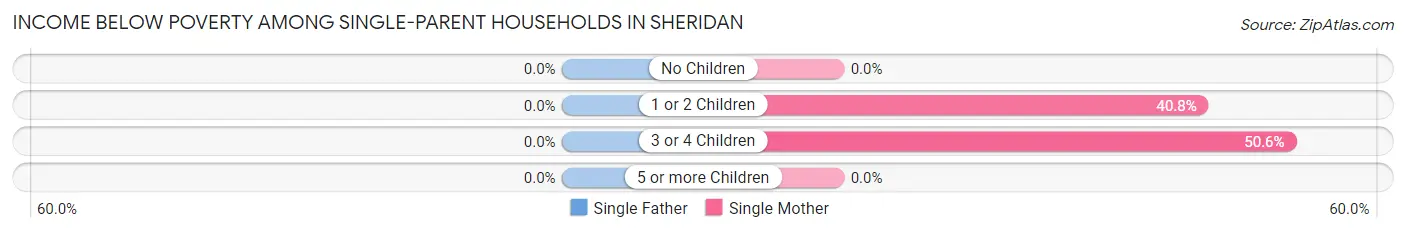
| Children | Single Father | Single Mother |
| No Children | 0 (0.0%) | 0 (0.0%) |
| 1 or 2 Children | 0 (0.0%) | 115 (40.8%) |
| 3 or 4 Children | 0 (0.0%) | 43 (50.6%) |
| 5 or more Children | 0 (0.0%) | 0 (0.0%) |
| Total | 0 (0.0%) | 158 (31.1%) |
Income Below Poverty Among Married-Couple vs Single-Parent Households in Sheridan
The poverty data for Sheridan shows that 60 of the married-couple family households (1.7%) and 158 of the single-parent households (21.7%) are living below the poverty level. Within the married-couple family households, those with 3 or 4 children have the highest poverty rate, with 15 households (5.1%) falling below the poverty line. Among the single-parent households, those with 3 or 4 children have the highest poverty rate, with 43 household (50.6%) living below poverty.
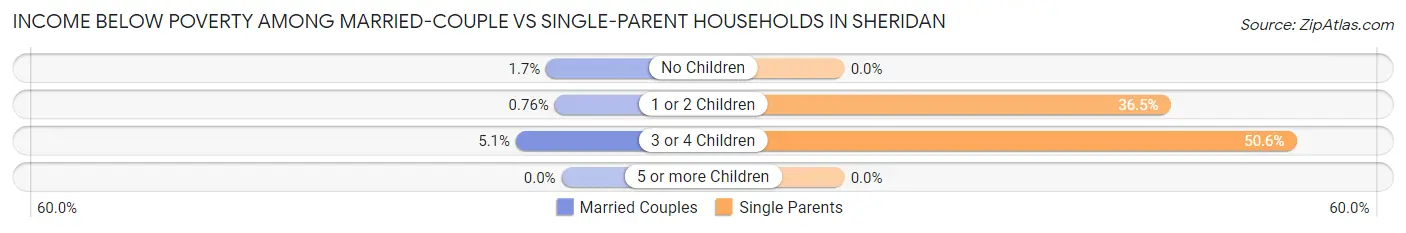
| Children | Married-Couple Families | Single-Parent Households |
| No Children | 37 (1.7%) | 0 (0.0%) |
| 1 or 2 Children | 8 (0.8%) | 115 (36.5%) |
| 3 or 4 Children | 15 (5.1%) | 43 (50.6%) |
| 5 or more Children | 0 (0.0%) | 0 (0.0%) |
| Total | 60 (1.7%) | 158 (21.7%) |
Race in Sheridan
The most populous races in Sheridan are White / Caucasian (17,350 | 92.2%), Hispanic or Latino (1,186 | 6.3%), and Two or more Races (651 | 3.5%).
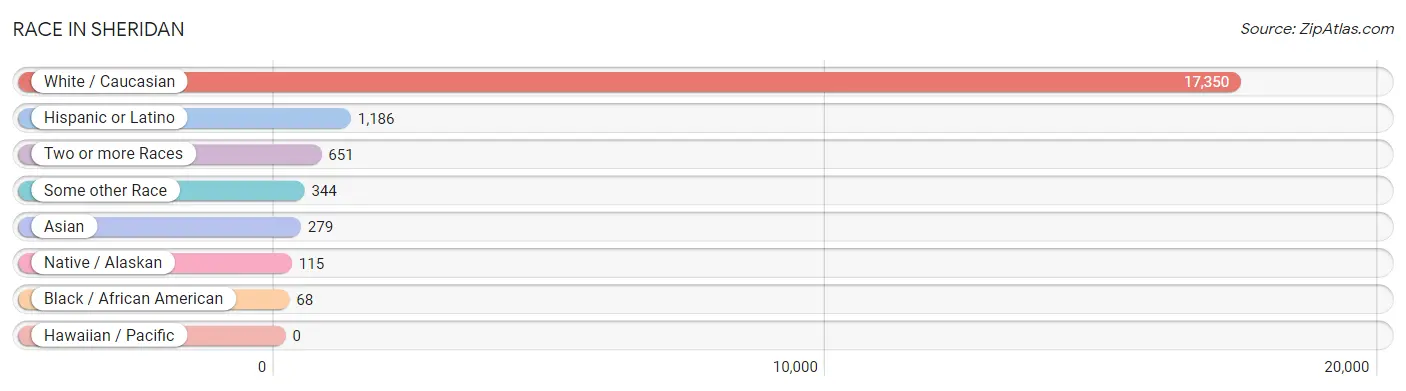
| Race | # Population | % Population |
| Asian | 279 | 1.5% |
| Black / African American | 68 | 0.4% |
| Hawaiian / Pacific | 0 | 0.0% |
| Hispanic or Latino | 1,186 | 6.3% |
| Native / Alaskan | 115 | 0.6% |
| White / Caucasian | 17,350 | 92.2% |
| Two or more Races | 651 | 3.5% |
| Some other Race | 344 | 1.8% |
| Total | 18,807 | 100.0% |
Ancestry in Sheridan
The most populous ancestries reported in Sheridan are German (3,898 | 20.7%), English (2,213 | 11.8%), Irish (1,800 | 9.6%), Norwegian (883 | 4.7%), and Mexican (821 | 4.4%), together accounting for 51.1% of all Sheridan residents.
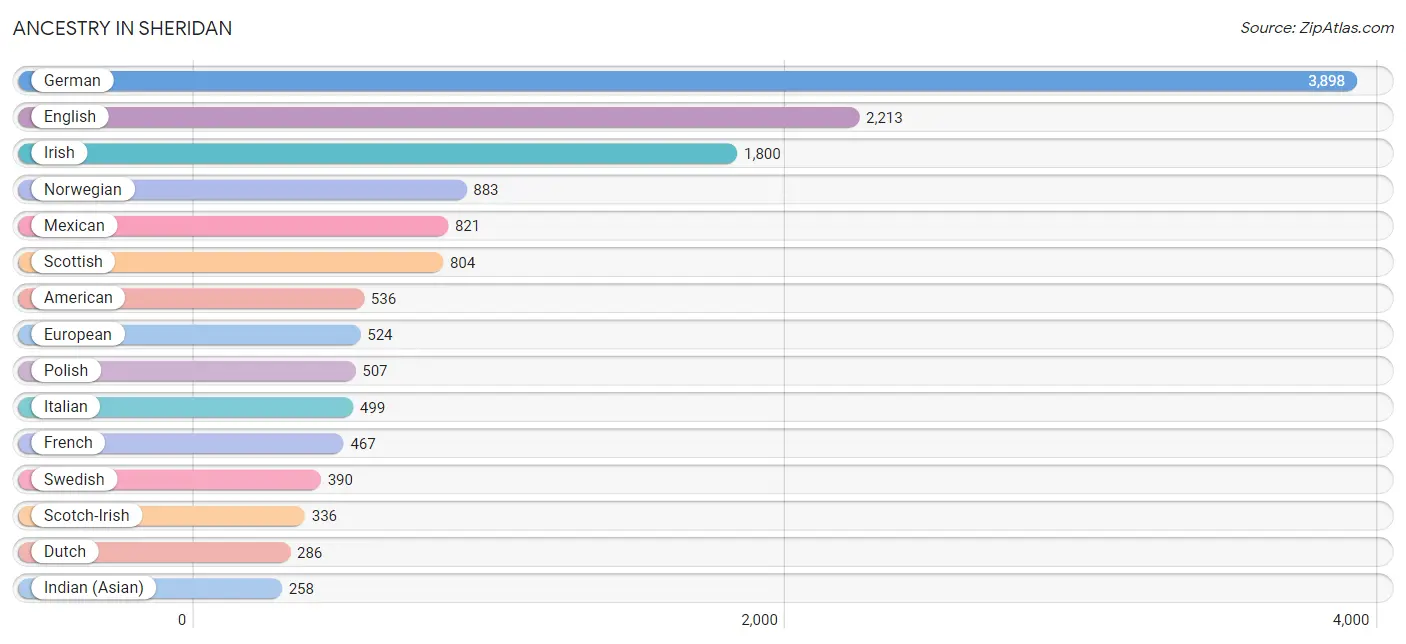
| Ancestry | # Population | % Population |
| African | 49 | 0.3% |
| American | 536 | 2.9% |
| Apache | 6 | 0.0% |
| Arapaho | 28 | 0.2% |
| Argentinean | 11 | 0.1% |
| Armenian | 6 | 0.0% |
| Austrian | 81 | 0.4% |
| Basque | 6 | 0.0% |
| Belgian | 23 | 0.1% |
| Bhutanese | 47 | 0.3% |
| Blackfeet | 7 | 0.0% |
| British | 168 | 0.9% |
| Burmese | 22 | 0.1% |
| Canadian | 9 | 0.1% |
| Central American | 16 | 0.1% |
| Cherokee | 66 | 0.4% |
| Cheyenne | 1 | 0.0% |
| Chippewa | 9 | 0.1% |
| Croatian | 64 | 0.3% |
| Crow | 27 | 0.1% |
| Czech | 79 | 0.4% |
| Czechoslovakian | 21 | 0.1% |
| Danish | 151 | 0.8% |
| Dutch | 286 | 1.5% |
| Eastern European | 4 | 0.0% |
| English | 2,213 | 11.8% |
| European | 524 | 2.8% |
| Finnish | 204 | 1.1% |
| French | 467 | 2.5% |
| French Canadian | 59 | 0.3% |
| German | 3,898 | 20.7% |
| Ghanaian | 8 | 0.0% |
| Greek | 19 | 0.1% |
| Haitian | 1 | 0.0% |
| Hungarian | 16 | 0.1% |
| Indian (Asian) | 258 | 1.4% |
| Irish | 1,800 | 9.6% |
| Italian | 499 | 2.6% |
| Korean | 18 | 0.1% |
| Mexican | 821 | 4.4% |
| Northern European | 97 | 0.5% |
| Norwegian | 883 | 4.7% |
| Pakistani | 14 | 0.1% |
| Polish | 507 | 2.7% |
| Puerto Rican | 88 | 0.5% |
| Russian | 180 | 1.0% |
| Salvadoran | 16 | 0.1% |
| Scandinavian | 193 | 1.0% |
| Scotch-Irish | 336 | 1.8% |
| Scottish | 804 | 4.3% |
| Serbian | 8 | 0.0% |
| Shoshone | 2 | 0.0% |
| Sioux | 31 | 0.2% |
| Slavic | 2 | 0.0% |
| Slovene | 10 | 0.1% |
| South American | 82 | 0.4% |
| Spaniard | 47 | 0.3% |
| Spanish | 47 | 0.3% |
| Subsaharan African | 57 | 0.3% |
| Swedish | 390 | 2.1% |
| Swiss | 55 | 0.3% |
| Thai | 3 | 0.0% |
| Welsh | 230 | 1.2% |
| West Indian | 2 | 0.0% |
| Yugoslavian | 33 | 0.2% | View All 65 Rows |
Immigrants in Sheridan
The most numerous immigrant groups reported in Sheridan came from Europe (142 | 0.8%), Latin America (131 | 0.7%), Central America (120 | 0.6%), Mexico (120 | 0.6%), and Canada (90 | 0.5%), together accounting for 3.2% of all Sheridan residents.
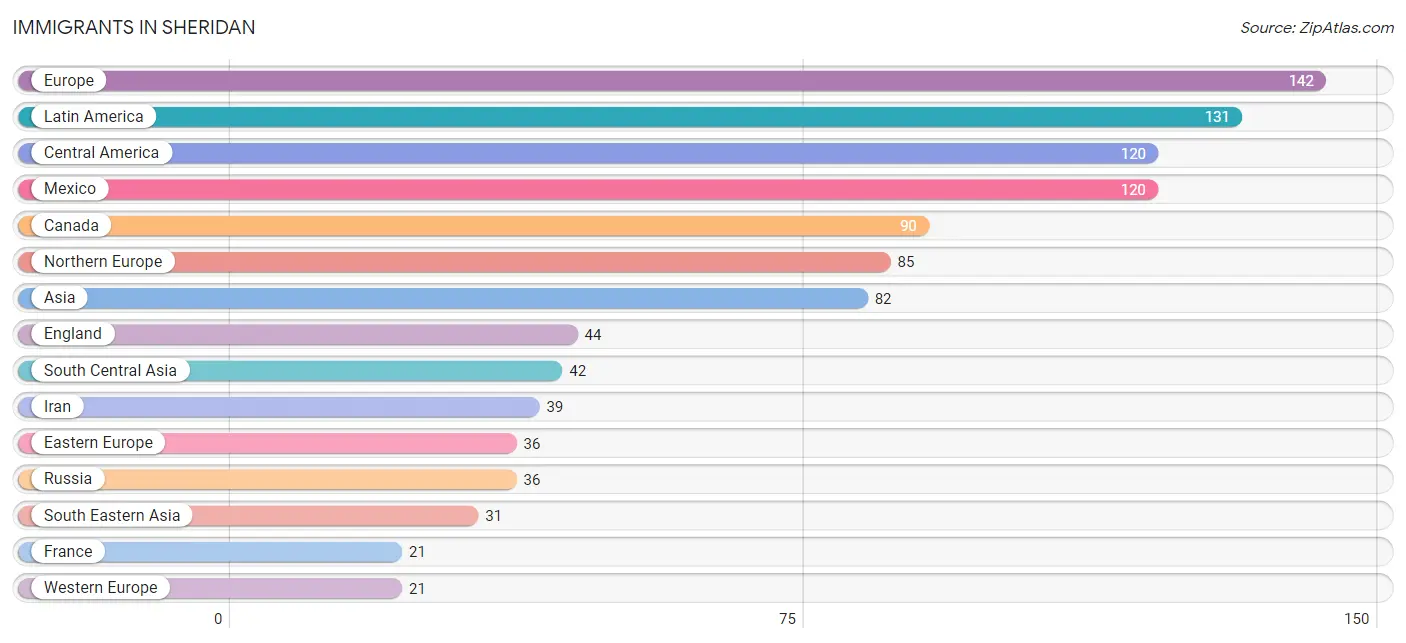
| Immigration Origin | # Population | % Population |
| Africa | 13 | 0.1% |
| Argentina | 11 | 0.1% |
| Asia | 82 | 0.4% |
| Canada | 90 | 0.5% |
| Central America | 120 | 0.6% |
| Eastern Africa | 13 | 0.1% |
| Eastern Asia | 9 | 0.1% |
| Eastern Europe | 36 | 0.2% |
| England | 44 | 0.2% |
| Europe | 142 | 0.8% |
| France | 21 | 0.1% |
| India | 3 | 0.0% |
| Iran | 39 | 0.2% |
| Korea | 9 | 0.1% |
| Latin America | 131 | 0.7% |
| Mexico | 120 | 0.6% |
| Northern Europe | 85 | 0.4% |
| Philippines | 17 | 0.1% |
| Russia | 36 | 0.2% |
| South America | 11 | 0.1% |
| South Central Asia | 42 | 0.2% |
| South Eastern Asia | 31 | 0.2% |
| Thailand | 14 | 0.1% |
| Uganda | 13 | 0.1% |
| Western Europe | 21 | 0.1% | View All 25 Rows |
Sex and Age in Sheridan
Sex and Age in Sheridan
The most populous age groups in Sheridan are 60 to 64 Years (714 | 7.6%) for men and 20 to 24 Years (771 | 8.2%) for women.
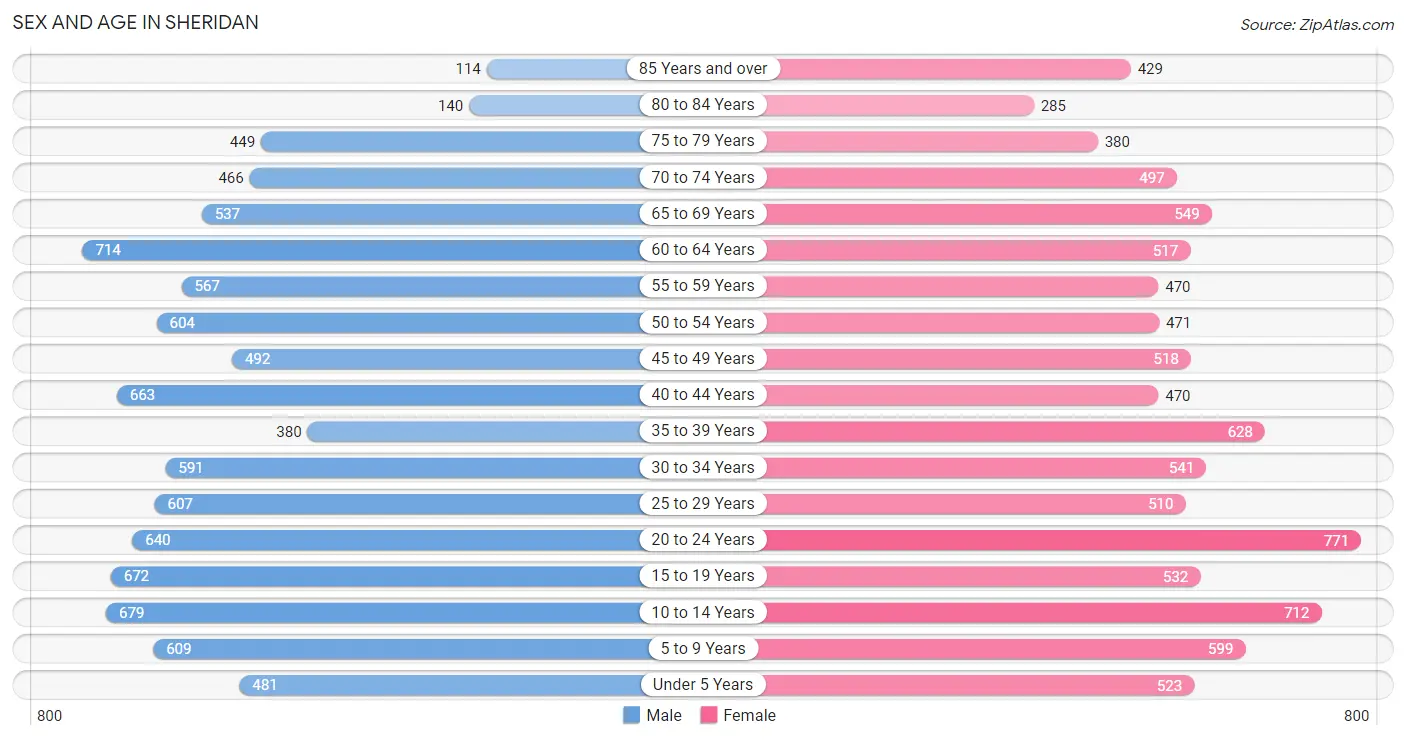
| Age Bracket | Male | Female |
| Under 5 Years | 481 (5.1%) | 523 (5.6%) |
| 5 to 9 Years | 609 (6.5%) | 599 (6.4%) |
| 10 to 14 Years | 679 (7.2%) | 712 (7.6%) |
| 15 to 19 Years | 672 (7.1%) | 532 (5.7%) |
| 20 to 24 Years | 640 (6.8%) | 771 (8.2%) |
| 25 to 29 Years | 607 (6.5%) | 510 (5.4%) |
| 30 to 34 Years | 591 (6.3%) | 541 (5.8%) |
| 35 to 39 Years | 380 (4.0%) | 628 (6.7%) |
| 40 to 44 Years | 663 (7.0%) | 470 (5.0%) |
| 45 to 49 Years | 492 (5.2%) | 518 (5.5%) |
| 50 to 54 Years | 604 (6.4%) | 471 (5.0%) |
| 55 to 59 Years | 567 (6.0%) | 470 (5.0%) |
| 60 to 64 Years | 714 (7.6%) | 517 (5.5%) |
| 65 to 69 Years | 537 (5.7%) | 549 (5.8%) |
| 70 to 74 Years | 466 (5.0%) | 497 (5.3%) |
| 75 to 79 Years | 449 (4.8%) | 380 (4.0%) |
| 80 to 84 Years | 140 (1.5%) | 285 (3.0%) |
| 85 Years and over | 114 (1.2%) | 429 (4.6%) |
| Total | 9,405 (100.0%) | 9,402 (100.0%) |
Families and Households in Sheridan
Median Family Size in Sheridan
The median family size in Sheridan is 3.11 persons per family, with married-couple families (3,505 | 82.8%) accounting for the largest median family size of 3.16 persons per family. On the other hand, single male/father families (221 | 5.2%) represent the smallest median family size with 2.60 persons per family.
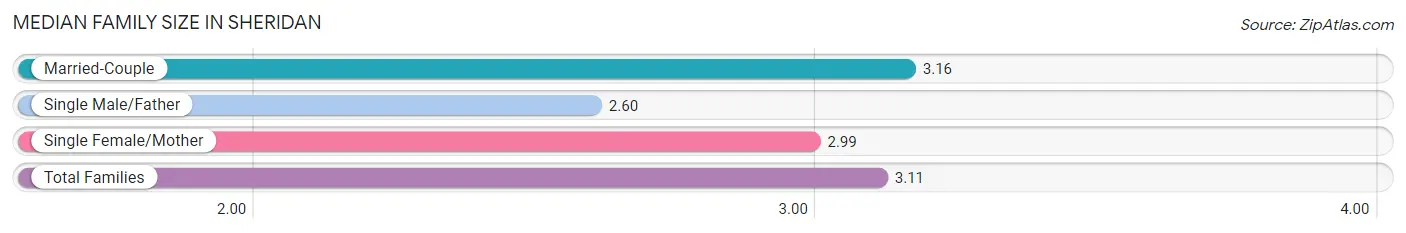
| Family Type | # Families | Family Size |
| Married-Couple | 3,505 (82.8%) | 3.16 |
| Single Male/Father | 221 (5.2%) | 2.60 |
| Single Female/Mother | 508 (12.0%) | 2.99 |
| Total Families | 4,234 (100.0%) | 3.11 |
Median Household Size in Sheridan
The median household size in Sheridan is 2.19 persons per household, with married-couple households (3,505 | 42.5%) accounting for the largest median household size of 3.21 persons per household. non-family households (4,020 | 48.7%) represent the smallest median household size with 1.14 persons per household.
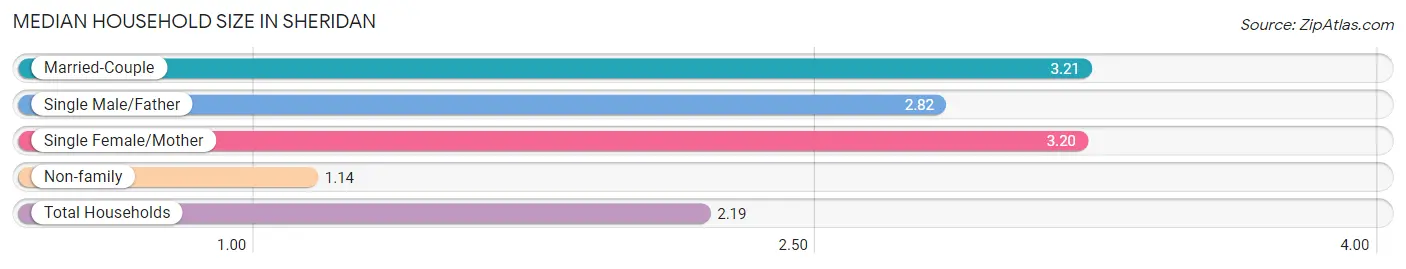
| Household Type | # Households | Household Size |
| Married-Couple | 3,505 (42.5%) | 3.21 |
| Single Male/Father | 221 (2.7%) | 2.82 |
| Single Female/Mother | 508 (6.1%) | 3.20 |
| Non-family | 4,020 (48.7%) | 1.14 |
| Total Households | 8,254 (100.0%) | 2.19 |
Household Size by Marriage Status in Sheridan
Out of a total of 8,254 households in Sheridan, 4,234 (51.3%) are family households, while 4,020 (48.7%) are nonfamily households. The most numerous type of family households are 2-person households, comprising 2,178, and the most common type of nonfamily households are 1-person households, comprising 3,620.
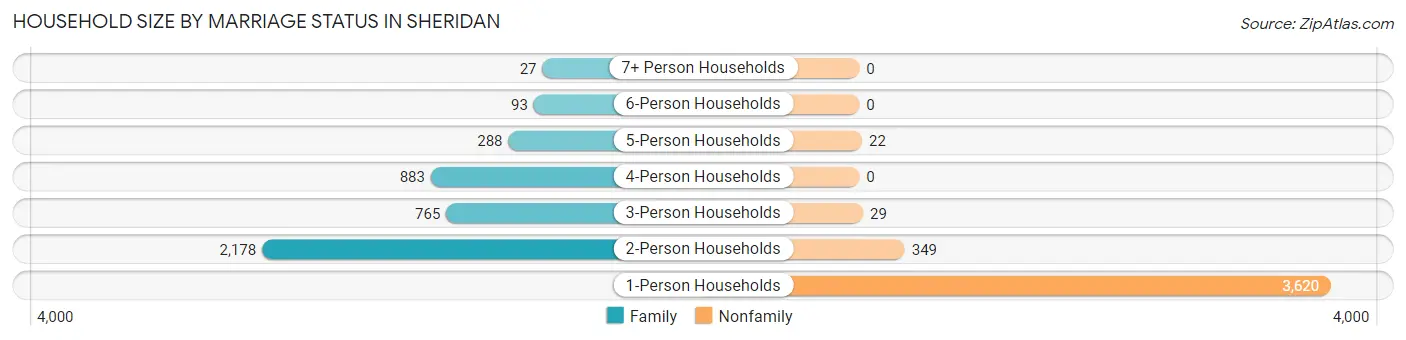
| Household Size | Family Households | Nonfamily Households |
| 1-Person Households | - | 3,620 (43.9%) |
| 2-Person Households | 2,178 (26.4%) | 349 (4.2%) |
| 3-Person Households | 765 (9.3%) | 29 (0.4%) |
| 4-Person Households | 883 (10.7%) | 0 (0.0%) |
| 5-Person Households | 288 (3.5%) | 22 (0.3%) |
| 6-Person Households | 93 (1.1%) | 0 (0.0%) |
| 7+ Person Households | 27 (0.3%) | 0 (0.0%) |
| Total | 4,234 (51.3%) | 4,020 (48.7%) |
Female Fertility in Sheridan
Fertility by Age in Sheridan
Average fertility rate in Sheridan is 47.0 births per 1,000 women. Women in the age bracket of 20 to 34 years have the highest fertility rate with 73.0 births per 1,000 women. Women in the age bracket of 20 to 34 years acount for 70.7% of all women with births.
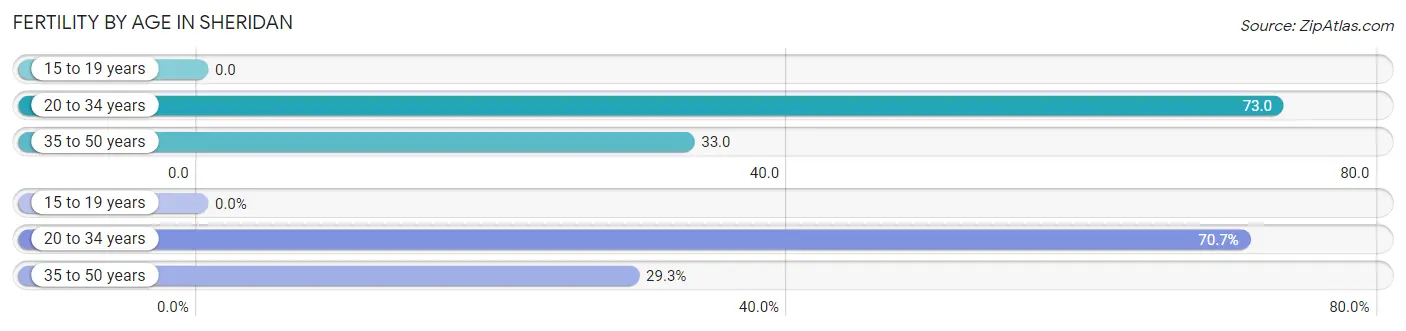
| Age Bracket | Women with Births | Births / 1,000 Women |
| 15 to 19 years | 0 (0.0%) | 0.0 |
| 20 to 34 years | 133 (70.7%) | 73.0 |
| 35 to 50 years | 55 (29.3%) | 33.0 |
| Total | 188 (100.0%) | 47.0 |
Fertility by Age by Marriage Status in Sheridan
61.7% of women with births (188) in Sheridan are married. The highest percentage of unmarried women with births falls into 20 to 34 years age bracket with 54.1% of them unmarried at the time of birth, while the lowest percentage of unmarried women with births belong to 35 to 50 years age bracket with 0.0% of them unmarried.
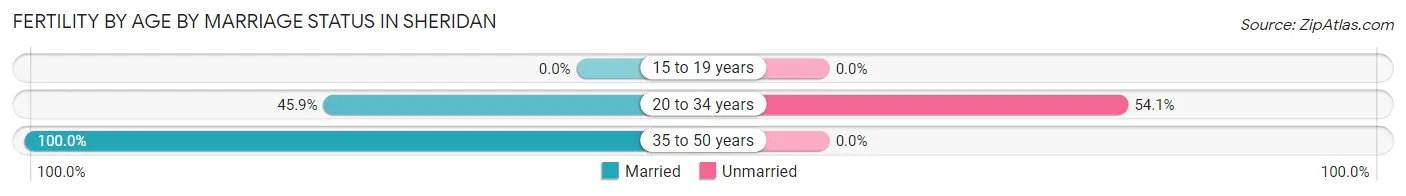
| Age Bracket | Married | Unmarried |
| 15 to 19 years | 0 (0.0%) | 0 (0.0%) |
| 20 to 34 years | 61 (45.9%) | 72 (54.1%) |
| 35 to 50 years | 55 (100.0%) | 0 (0.0%) |
| Total | 116 (61.7%) | 72 (38.3%) |
Fertility by Education in Sheridan
Average fertility rate in Sheridan is 47.0 births per 1,000 women. Women with the education attainment of graduate degree have the highest fertility rate of 92.0 births per 1,000 women, while women with the education attainment of high school diploma have the lowest fertility at 15.0 births per 1,000 women. Women with the education attainment of college or associate's degree represent 32.5% of all women with births.
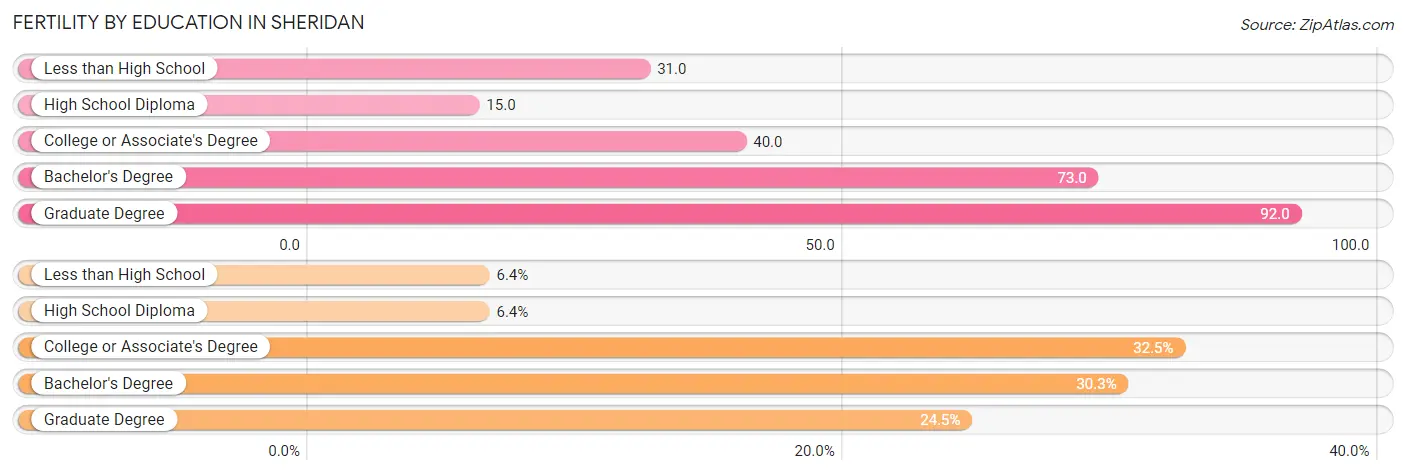
| Educational Attainment | Women with Births | Births / 1,000 Women |
| Less than High School | 12 (6.4%) | 31.0 |
| High School Diploma | 12 (6.4%) | 15.0 |
| College or Associate's Degree | 61 (32.5%) | 40.0 |
| Bachelor's Degree | 57 (30.3%) | 73.0 |
| Graduate Degree | 46 (24.5%) | 92.0 |
| Total | 188 (100.0%) | 47.0 |
Fertility by Education by Marriage Status in Sheridan
38.3% of women with births in Sheridan are unmarried. Women with the educational attainment of less than high school are most likely to be married with 100.0% of them married at childbirth, while women with the educational attainment of high school diploma are least likely to be married with 100.0% of them unmarried at childbirth.
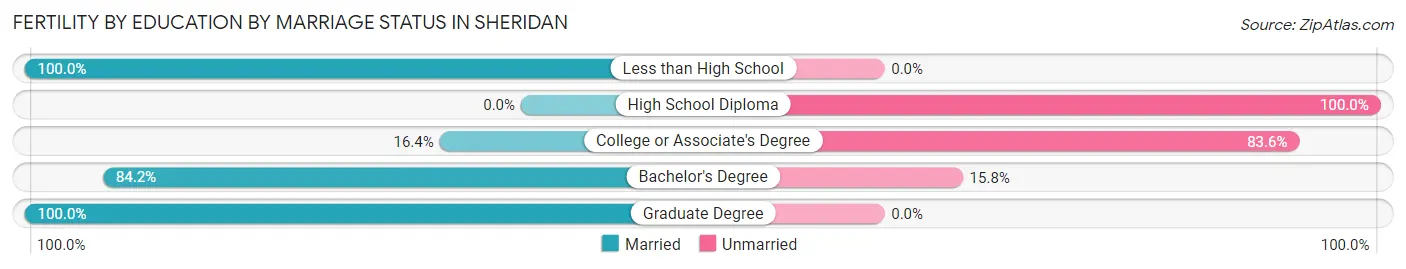
| Educational Attainment | Married | Unmarried |
| Less than High School | 12 (100.0%) | 0 (0.0%) |
| High School Diploma | 0 (0.0%) | 12 (100.0%) |
| College or Associate's Degree | 10 (16.4%) | 51 (83.6%) |
| Bachelor's Degree | 48 (84.2%) | 9 (15.8%) |
| Graduate Degree | 46 (100.0%) | 0 (0.0%) |
| Total | 116 (61.7%) | 72 (38.3%) |
Employment Characteristics in Sheridan
Employment by Class of Employer in Sheridan
Among the 9,066 employed individuals in Sheridan, private company employees (5,287 | 58.3%), local government employees (985 | 10.9%), and not-for-profit organizations (972 | 10.7%) make up the most common classes of employment.
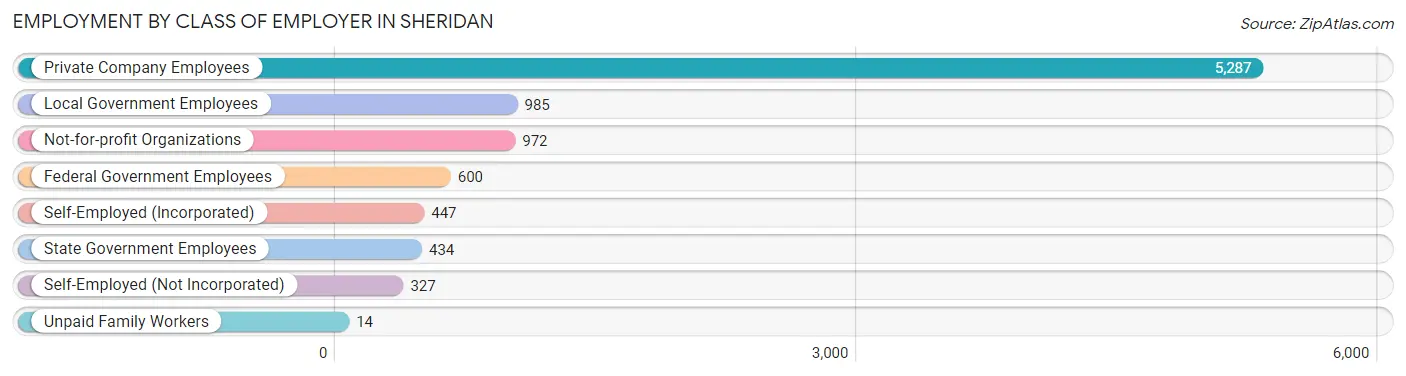
| Employer Class | # Employees | % Employees |
| Private Company Employees | 5,287 | 58.3% |
| Self-Employed (Incorporated) | 447 | 4.9% |
| Self-Employed (Not Incorporated) | 327 | 3.6% |
| Not-for-profit Organizations | 972 | 10.7% |
| Local Government Employees | 985 | 10.9% |
| State Government Employees | 434 | 4.8% |
| Federal Government Employees | 600 | 6.6% |
| Unpaid Family Workers | 14 | 0.2% |
| Total | 9,066 | 100.0% |
Employment Status by Age in Sheridan
According to the labor force statistics for Sheridan, out of the total population over 16 years of age (15,023), 63.5% or 9,540 individuals are in the labor force, with 3.4% or 324 of them unemployed. The age group with the highest labor force participation rate is 35 to 44 years, with 90.9% or 1,946 individuals in the labor force. Within the labor force, the 60 to 64 years age range has the highest percentage of unemployed individuals, with 12.0% or 105 of them being unemployed.
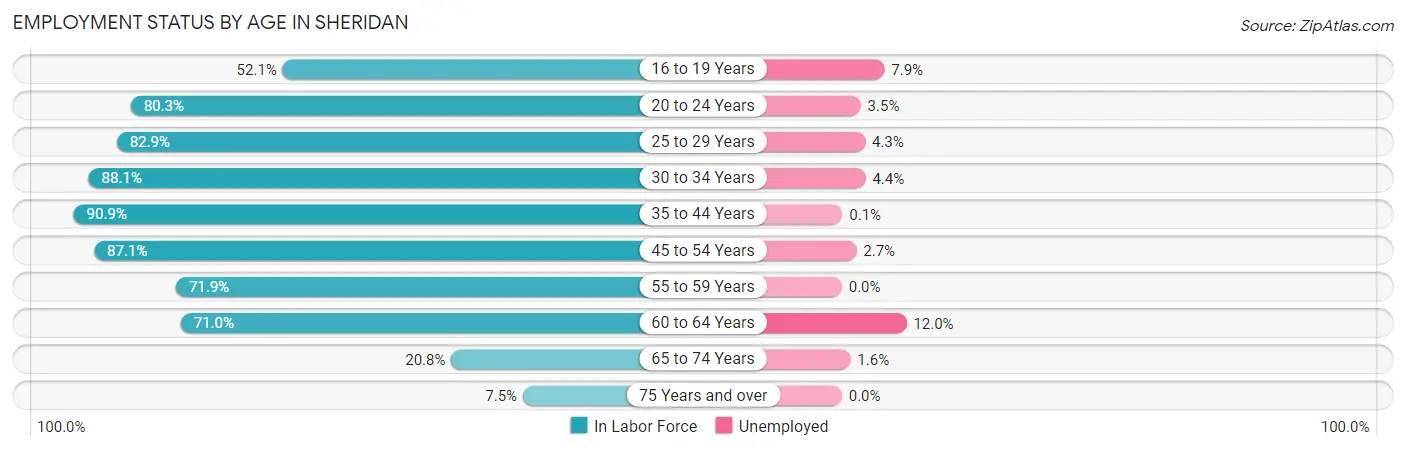
| Age Bracket | In Labor Force | Unemployed |
| 16 to 19 Years | 533 (52.1%) | 42 (7.9%) |
| 20 to 24 Years | 1,133 (80.3%) | 40 (3.5%) |
| 25 to 29 Years | 926 (82.9%) | 40 (4.3%) |
| 30 to 34 Years | 997 (88.1%) | 44 (4.4%) |
| 35 to 44 Years | 1,946 (90.9%) | 2 (0.1%) |
| 45 to 54 Years | 1,816 (87.1%) | 49 (2.7%) |
| 55 to 59 Years | 746 (71.9%) | 0 (0.0%) |
| 60 to 64 Years | 874 (71.0%) | 105 (12.0%) |
| 65 to 74 Years | 426 (20.8%) | 7 (1.6%) |
| 75 Years and over | 135 (7.5%) | 0 (0.0%) |
| Total | 9,540 (63.5%) | 324 (3.4%) |
Employment Status by Educational Attainment in Sheridan
According to labor force statistics for Sheridan, 83.6% of individuals (7,309) out of the total population between 25 and 64 years of age (8,743) are in the labor force, with 3.3% or 241 of them being unemployed. The group with the highest labor force participation rate are those with the educational attainment of bachelor's degree or higher, with 90.6% or 2,739 individuals in the labor force. Within the labor force, individuals with high school diploma education have the highest percentage of unemployment, with 9.2% or 176 of them being unemployed.
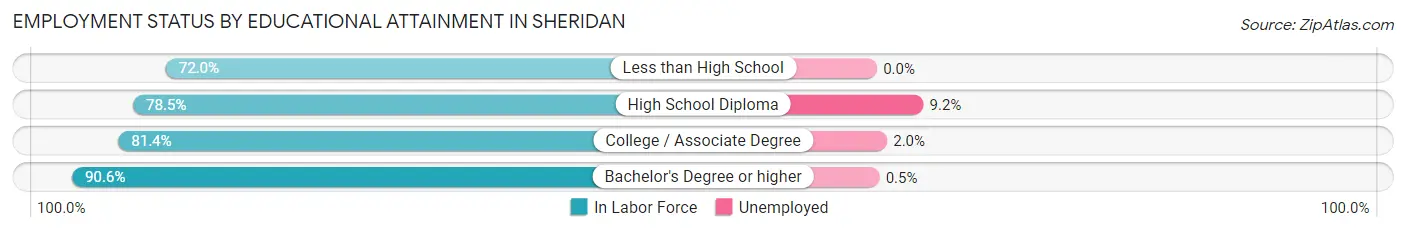
| Educational Attainment | In Labor Force | Unemployed |
| Less than High School | 157 (72.0%) | 0 (0.0%) |
| High School Diploma | 1,913 (78.5%) | 224 (9.2%) |
| College / Associate Degree | 2,495 (81.4%) | 61 (2.0%) |
| Bachelor's Degree or higher | 2,739 (90.6%) | 15 (0.5%) |
| Total | 7,309 (83.6%) | 289 (3.3%) |
Employment Occupations by Sex in Sheridan
Management, Business, Science and Arts Occupations
The most common Management, Business, Science and Arts occupations in Sheridan are Community & Social Service (1,075 | 11.7%), Management (979 | 10.7%), Education Instruction & Library (716 | 7.8%), Health Diagnosing & Treating (691 | 7.5%), and Computers, Engineering & Science (432 | 4.7%).
Management, Business, Science and Arts Occupations by Sex
Within the Management, Business, Science and Arts occupations in Sheridan, the most male-oriented occupations are Legal Services & Support (88.4%), Architecture & Engineering (82.9%), and Computers & Mathematics (76.3%), while the most female-oriented occupations are Business & Financial (83.3%), Health Diagnosing & Treating (83.1%), and Health Technologists (77.5%).
| Occupation | Male | Female |
| Management | 568 (58.0%) | 411 (42.0%) |
| Business & Financial | 54 (16.7%) | 269 (83.3%) |
| Computers, Engineering & Science | 270 (62.5%) | 162 (37.5%) |
| Computers & Mathematics | 71 (76.3%) | 22 (23.7%) |
| Architecture & Engineering | 136 (82.9%) | 28 (17.1%) |
| Life, Physical & Social Science | 63 (36.0%) | 112 (64.0%) |
| Community & Social Service | 426 (39.6%) | 649 (60.4%) |
| Education, Arts & Media | 48 (24.0%) | 152 (76.0%) |
| Legal Services & Support | 99 (88.4%) | 13 (11.6%) |
| Education Instruction & Library | 267 (37.3%) | 449 (62.7%) |
| Arts, Media & Entertainment | 12 (25.5%) | 35 (74.5%) |
| Health Diagnosing & Treating | 117 (16.9%) | 574 (83.1%) |
| Health Technologists | 95 (22.5%) | 328 (77.5%) |
| Total (Category) | 1,435 (41.0%) | 2,065 (59.0%) |
| Total (Overall) | 4,822 (52.5%) | 4,363 (47.5%) |
Services Occupations
The most common Services occupations in Sheridan are Food Preparation & Serving (652 | 7.1%), Cleaning & Maintenance (362 | 3.9%), Personal Care & Service (320 | 3.5%), Healthcare Support (305 | 3.3%), and Security & Protection (221 | 2.4%).
Services Occupations by Sex
Within the Services occupations in Sheridan, the most male-oriented occupations are Firefighting & Prevention (100.0%), Security & Protection (90.0%), and Law Enforcement (87.4%), while the most female-oriented occupations are Healthcare Support (100.0%), Personal Care & Service (81.2%), and Food Preparation & Serving (62.6%).
| Occupation | Male | Female |
| Healthcare Support | 0 (0.0%) | 305 (100.0%) |
| Security & Protection | 199 (90.0%) | 22 (10.0%) |
| Firefighting & Prevention | 46 (100.0%) | 0 (0.0%) |
| Law Enforcement | 153 (87.4%) | 22 (12.6%) |
| Food Preparation & Serving | 244 (37.4%) | 408 (62.6%) |
| Cleaning & Maintenance | 293 (80.9%) | 69 (19.1%) |
| Personal Care & Service | 60 (18.8%) | 260 (81.2%) |
| Total (Category) | 796 (42.8%) | 1,064 (57.2%) |
| Total (Overall) | 4,822 (52.5%) | 4,363 (47.5%) |
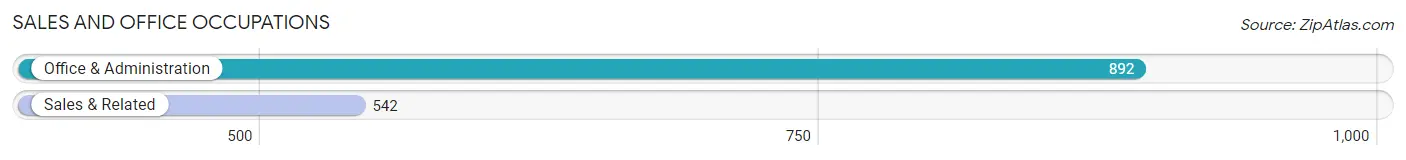
Sales and Office Occupations
The most common Sales and Office occupations in Sheridan are Office & Administration (892 | 9.7%), and Sales & Related (542 | 5.9%).
Sales and Office Occupations by Sex
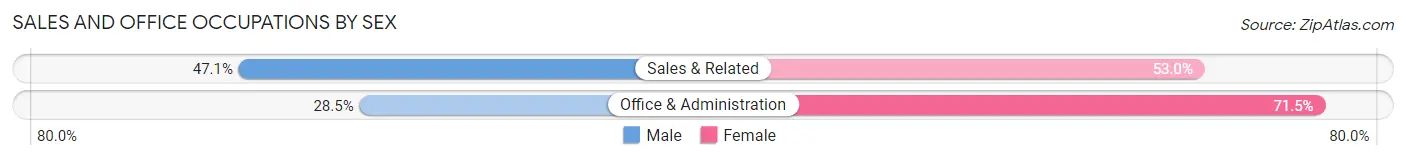
| Occupation | Male | Female |
| Sales & Related | 255 (47.0%) | 287 (52.9%) |
| Office & Administration | 254 (28.5%) | 638 (71.5%) |
| Total (Category) | 509 (35.5%) | 925 (64.5%) |
| Total (Overall) | 4,822 (52.5%) | 4,363 (47.5%) |
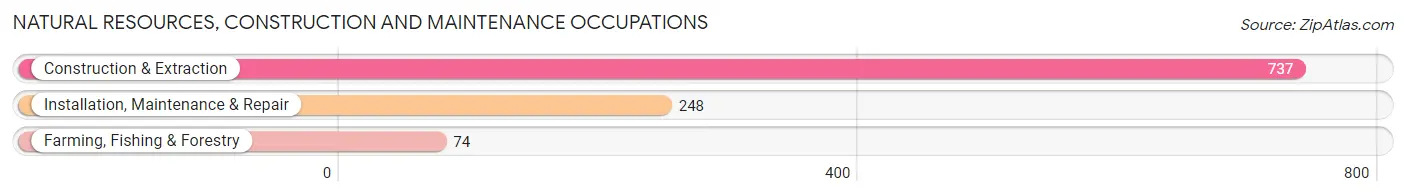
Natural Resources, Construction and Maintenance Occupations
The most common Natural Resources, Construction and Maintenance occupations in Sheridan are Construction & Extraction (737 | 8.0%), Installation, Maintenance & Repair (248 | 2.7%), and Farming, Fishing & Forestry (74 | 0.8%).
Natural Resources, Construction and Maintenance Occupations by Sex
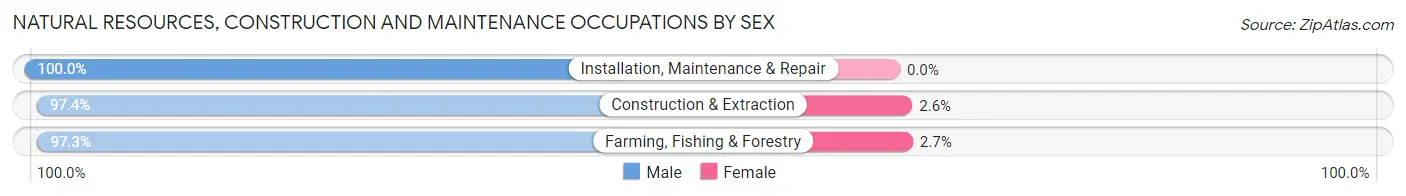
| Occupation | Male | Female |
| Farming, Fishing & Forestry | 72 (97.3%) | 2 (2.7%) |
| Construction & Extraction | 718 (97.4%) | 19 (2.6%) |
| Installation, Maintenance & Repair | 248 (100.0%) | 0 (0.0%) |
| Total (Category) | 1,038 (98.0%) | 21 (2.0%) |
| Total (Overall) | 4,822 (52.5%) | 4,363 (47.5%) |
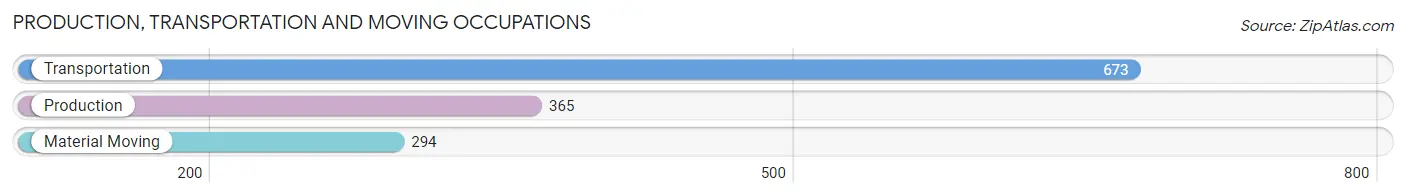
Production, Transportation and Moving Occupations
The most common Production, Transportation and Moving occupations in Sheridan are Transportation (673 | 7.3%), Production (365 | 4.0%), and Material Moving (294 | 3.2%).
Production, Transportation and Moving Occupations by Sex
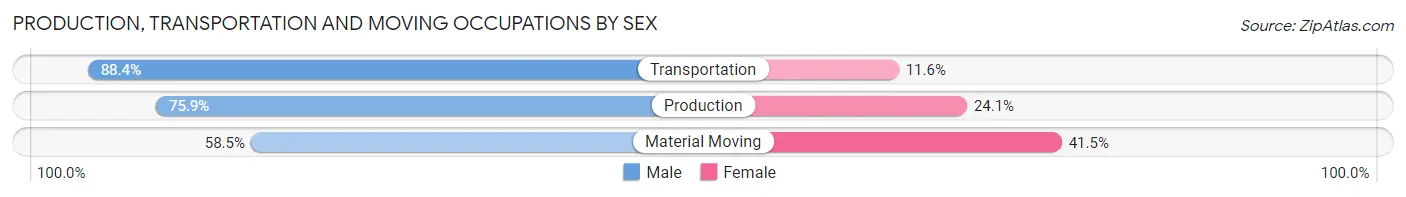
| Occupation | Male | Female |
| Production | 277 (75.9%) | 88 (24.1%) |
| Transportation | 595 (88.4%) | 78 (11.6%) |
| Material Moving | 172 (58.5%) | 122 (41.5%) |
| Total (Category) | 1,044 (78.4%) | 288 (21.6%) |
| Total (Overall) | 4,822 (52.5%) | 4,363 (47.5%) |
Employment Industries by Sex in Sheridan
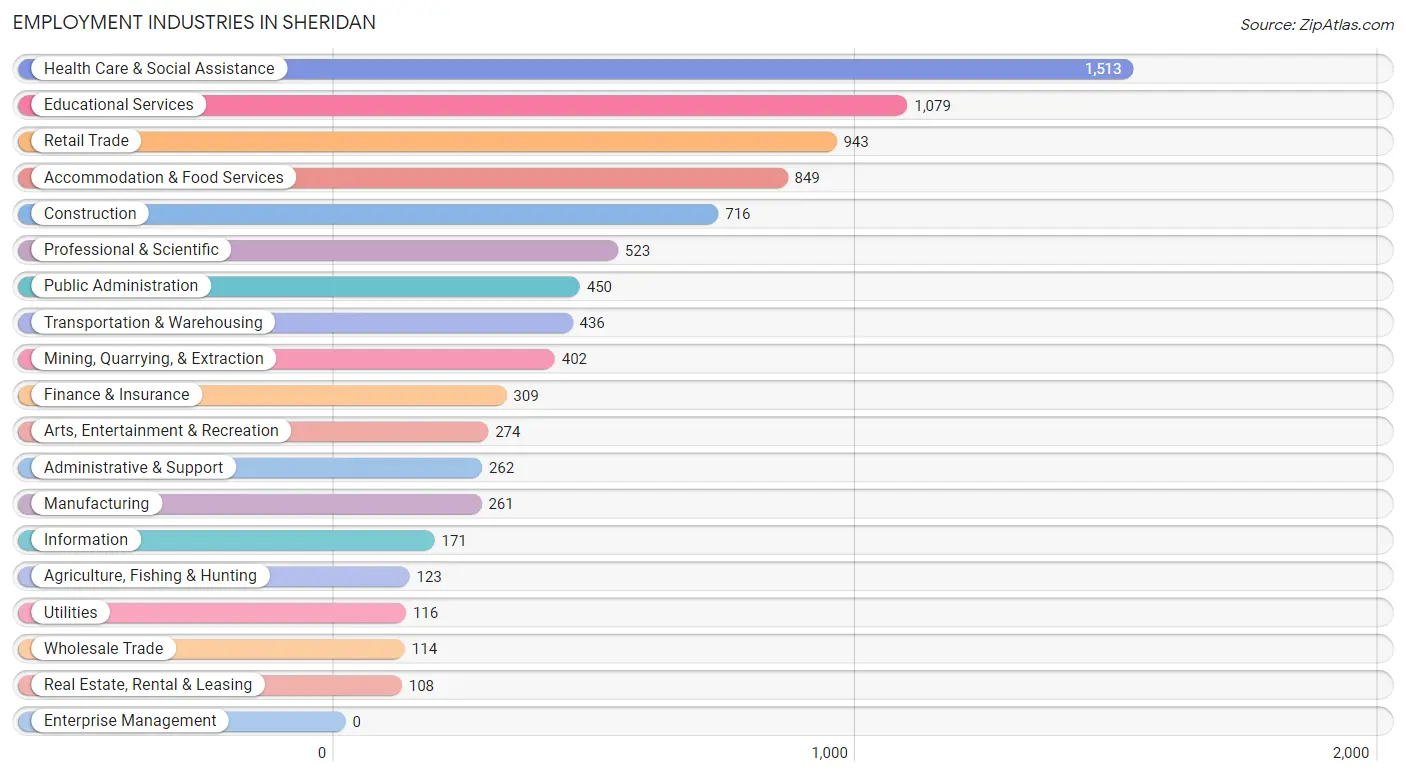
Employment Industries in Sheridan
The major employment industries in Sheridan include Health Care & Social Assistance (1,513 | 16.5%), Educational Services (1,079 | 11.7%), Retail Trade (943 | 10.3%), Accommodation & Food Services (849 | 9.2%), and Construction (716 | 7.8%).
Employment Industries by Sex in Sheridan
The Sheridan industries that see more men than women are Utilities (100.0%), Mining, Quarrying, & Extraction (92.3%), and Manufacturing (89.3%), whereas the industries that tend to have a higher number of women are Finance & Insurance (82.9%), Health Care & Social Assistance (82.8%), and Educational Services (56.1%).
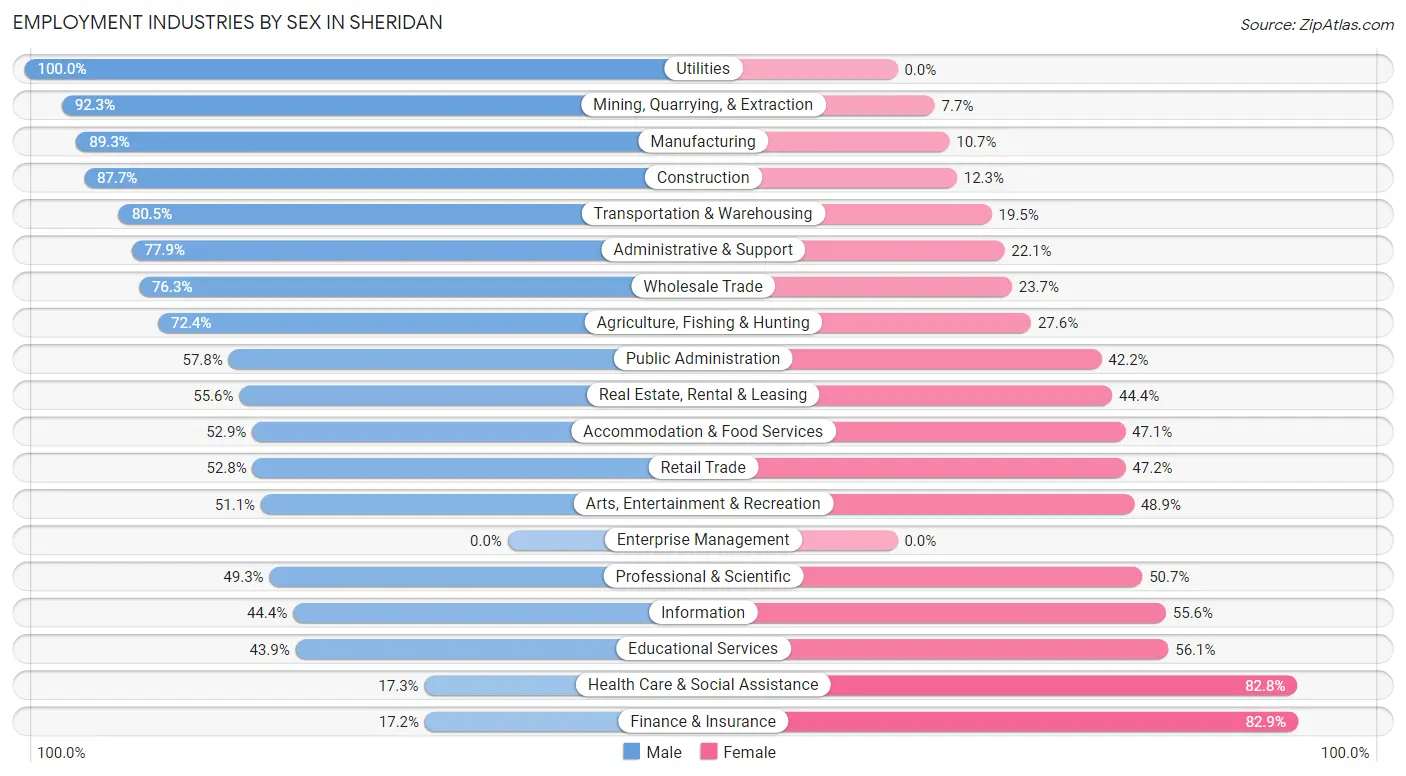
| Industry | Male | Female |
| Agriculture, Fishing & Hunting | 89 (72.4%) | 34 (27.6%) |
| Mining, Quarrying, & Extraction | 371 (92.3%) | 31 (7.7%) |
| Construction | 628 (87.7%) | 88 (12.3%) |
| Manufacturing | 233 (89.3%) | 28 (10.7%) |
| Wholesale Trade | 87 (76.3%) | 27 (23.7%) |
| Retail Trade | 498 (52.8%) | 445 (47.2%) |
| Transportation & Warehousing | 351 (80.5%) | 85 (19.5%) |
| Utilities | 116 (100.0%) | 0 (0.0%) |
| Information | 76 (44.4%) | 95 (55.6%) |
| Finance & Insurance | 53 (17.2%) | 256 (82.9%) |
| Real Estate, Rental & Leasing | 60 (55.6%) | 48 (44.4%) |
| Professional & Scientific | 258 (49.3%) | 265 (50.7%) |
| Enterprise Management | 0 (0.0%) | 0 (0.0%) |
| Administrative & Support | 204 (77.9%) | 58 (22.1%) |
| Educational Services | 474 (43.9%) | 605 (56.1%) |
| Health Care & Social Assistance | 261 (17.2%) | 1,252 (82.8%) |
| Arts, Entertainment & Recreation | 140 (51.1%) | 134 (48.9%) |
| Accommodation & Food Services | 449 (52.9%) | 400 (47.1%) |
| Public Administration | 260 (57.8%) | 190 (42.2%) |
| Total | 4,822 (52.5%) | 4,363 (47.5%) |
Education in Sheridan
School Enrollment in Sheridan
The most common levels of schooling among the 4,760 students in Sheridan are college / undergraduate (1,117 | 23.5%), middle school (1,063 | 22.3%), and elementary school (1,060 | 22.3%).
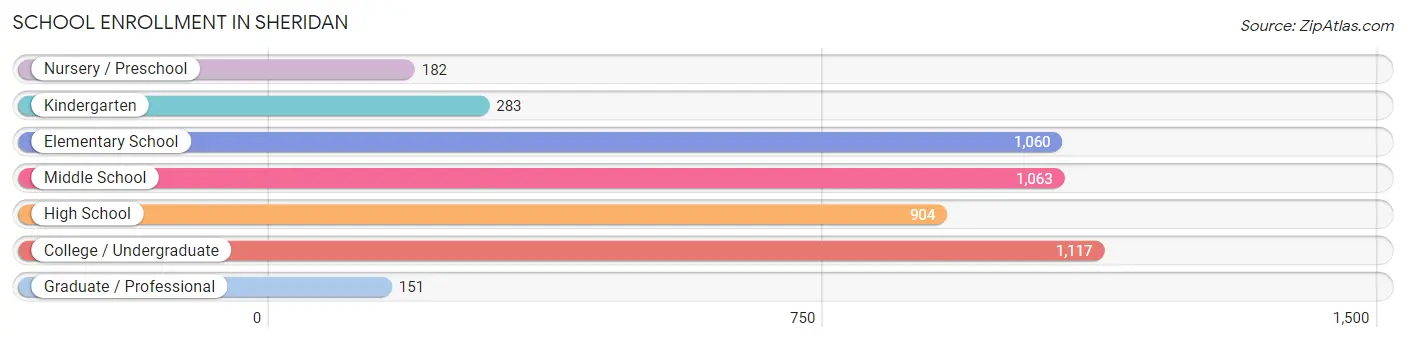
| School Level | # Students | % Students |
| Nursery / Preschool | 182 | 3.8% |
| Kindergarten | 283 | 5.9% |
| Elementary School | 1,060 | 22.3% |
| Middle School | 1,063 | 22.3% |
| High School | 904 | 19.0% |
| College / Undergraduate | 1,117 | 23.5% |
| Graduate / Professional | 151 | 3.2% |
| Total | 4,760 | 100.0% |
School Enrollment by Age by Funding Source in Sheridan
Out of a total of 4,760 students who are enrolled in schools in Sheridan, 543 (11.4%) attend a private institution, while the remaining 4,217 (88.6%) are enrolled in public schools. The age group of 3 to 4 year olds has the highest likelihood of being enrolled in private schools, with 145 (79.7% in the age bracket) enrolled. Conversely, the age group of 20 to 24 year olds has the lowest likelihood of being enrolled in a private school, with 717 (100.0% in the age bracket) attending a public institution.
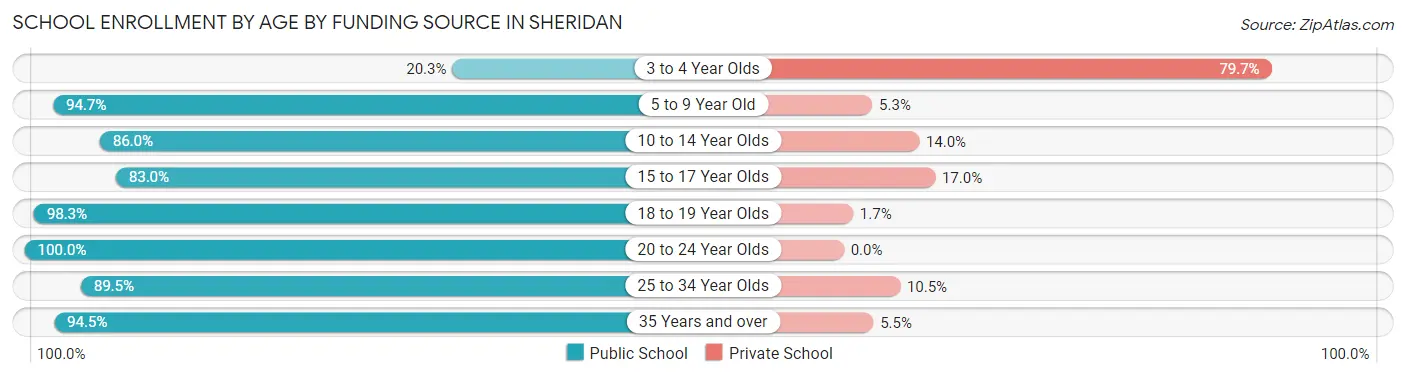
| Age Bracket | Public School | Private School |
| 3 to 4 Year Olds | 37 (20.3%) | 145 (79.7%) |
| 5 to 9 Year Old | 1,069 (94.7%) | 60 (5.3%) |
| 10 to 14 Year Olds | 1,196 (86.0%) | 195 (14.0%) |
| 15 to 17 Year Olds | 556 (83.0%) | 114 (17.0%) |
| 18 to 19 Year Olds | 342 (98.3%) | 6 (1.7%) |
| 20 to 24 Year Olds | 717 (100.0%) | 0 (0.0%) |
| 25 to 34 Year Olds | 94 (89.5%) | 11 (10.5%) |
| 35 Years and over | 206 (94.5%) | 12 (5.5%) |
| Total | 4,217 (88.6%) | 543 (11.4%) |
Educational Attainment by Field of Study in Sheridan
Education (775 | 16.2%), business (740 | 15.4%), arts & humanities (481 | 10.0%), social sciences (453 | 9.5%), and bio, nature & agricultural (414 | 8.6%) are the most common fields of study among 4,796 individuals in Sheridan who have obtained a bachelor's degree or higher.
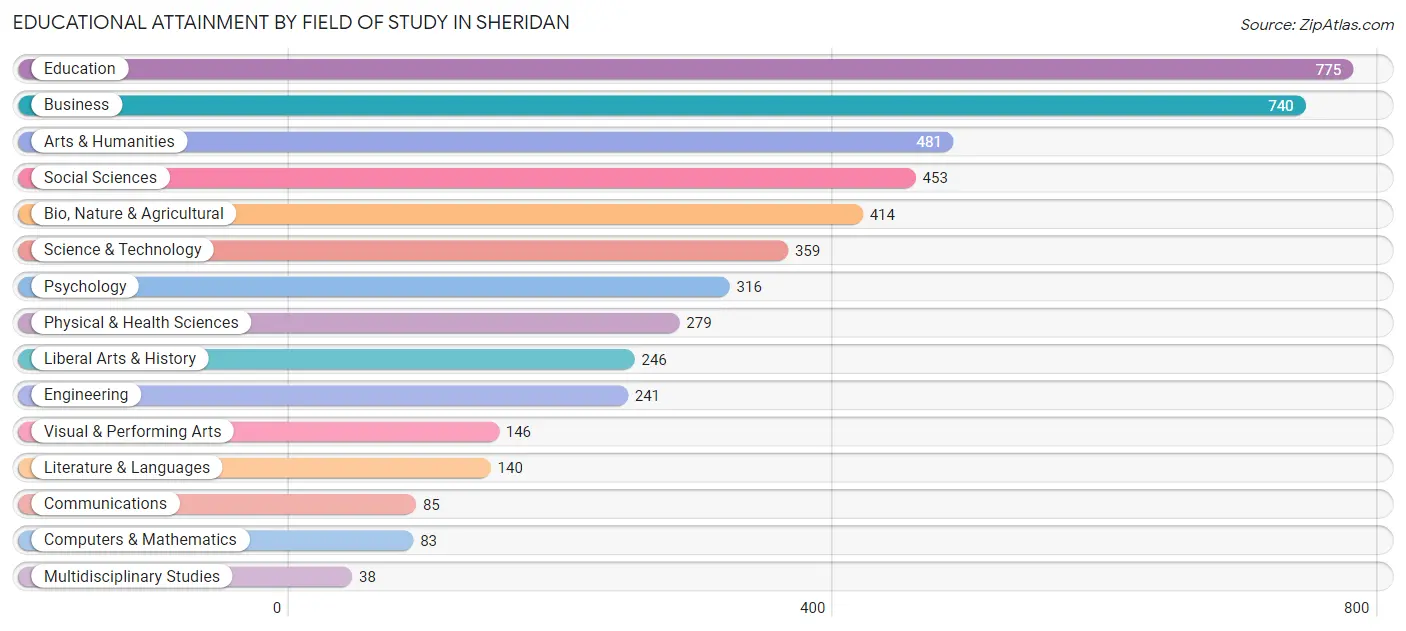
| Field of Study | # Graduates | % Graduates |
| Computers & Mathematics | 83 | 1.7% |
| Bio, Nature & Agricultural | 414 | 8.6% |
| Physical & Health Sciences | 279 | 5.8% |
| Psychology | 316 | 6.6% |
| Social Sciences | 453 | 9.5% |
| Engineering | 241 | 5.0% |
| Multidisciplinary Studies | 38 | 0.8% |
| Science & Technology | 359 | 7.5% |
| Business | 740 | 15.4% |
| Education | 775 | 16.2% |
| Literature & Languages | 140 | 2.9% |
| Liberal Arts & History | 246 | 5.1% |
| Visual & Performing Arts | 146 | 3.0% |
| Communications | 85 | 1.8% |
| Arts & Humanities | 481 | 10.0% |
| Total | 4,796 | 100.0% |
Transportation & Commute in Sheridan
Vehicle Availability by Sex in Sheridan
The most prevalent vehicle ownership categories in Sheridan are males with 2 vehicles (1,998, accounting for 43.2%) and females with 2 vehicles (1,556, making up 47.6%).
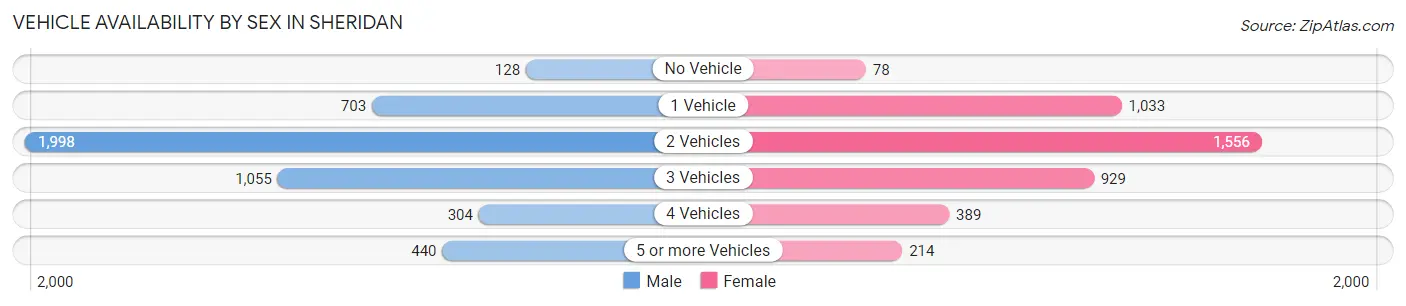
| Vehicles Available | Male | Female |
| No Vehicle | 128 (2.8%) | 78 (1.9%) |
| 1 Vehicle | 703 (15.2%) | 1,033 (24.6%) |
| 2 Vehicles | 1,998 (43.2%) | 1,556 (37.1%) |
| 3 Vehicles | 1,055 (22.8%) | 929 (22.1%) |
| 4 Vehicles | 304 (6.6%) | 389 (9.3%) |
| 5 or more Vehicles | 440 (9.5%) | 214 (5.1%) |
| Total | 4,628 (100.0%) | 4,199 (100.0%) |
Commute Time in Sheridan
The most frequently occuring commute durations in Sheridan are 5 to 9 minutes (3,428 commuters, 39.5%), 10 to 14 minutes (2,360 commuters, 27.2%), and 15 to 19 minutes (1,286 commuters, 14.8%).
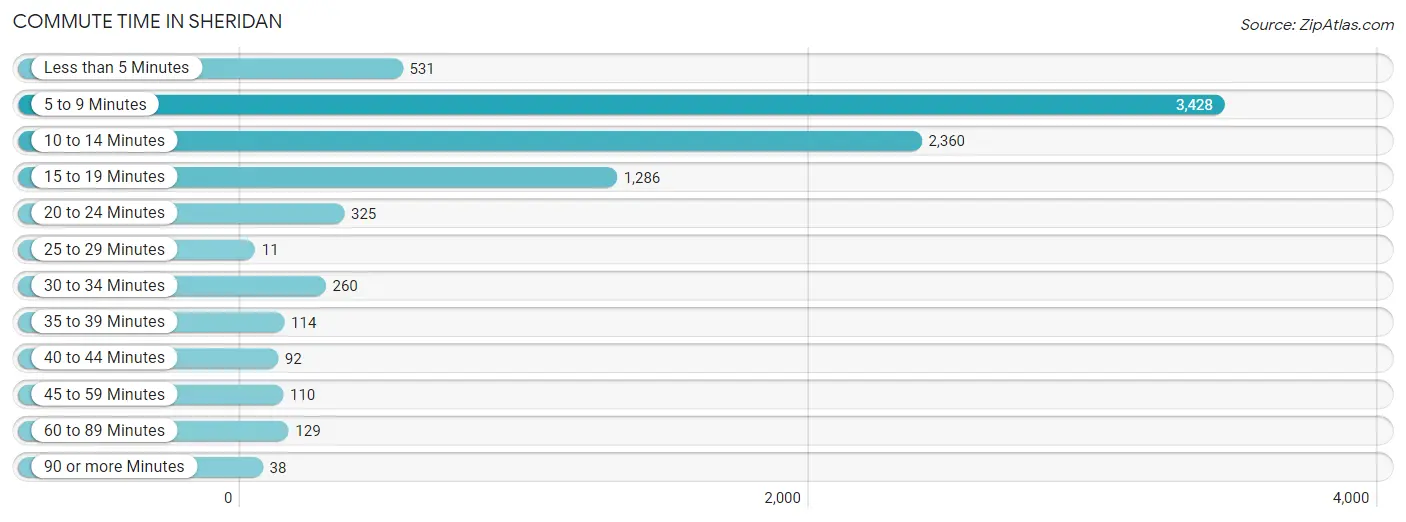
| Commute Time | # Commuters | % Commuters |
| Less than 5 Minutes | 531 | 6.1% |
| 5 to 9 Minutes | 3,428 | 39.5% |
| 10 to 14 Minutes | 2,360 | 27.2% |
| 15 to 19 Minutes | 1,286 | 14.8% |
| 20 to 24 Minutes | 325 | 3.7% |
| 25 to 29 Minutes | 11 | 0.1% |
| 30 to 34 Minutes | 260 | 3.0% |
| 35 to 39 Minutes | 114 | 1.3% |
| 40 to 44 Minutes | 92 | 1.1% |
| 45 to 59 Minutes | 110 | 1.3% |
| 60 to 89 Minutes | 129 | 1.5% |
| 90 or more Minutes | 38 | 0.4% |
Commute Time by Sex in Sheridan
The most common commute times in Sheridan are 5 to 9 minutes (1,651 commuters, 35.8%) for males and 5 to 9 minutes (1,777 commuters, 43.6%) for females.
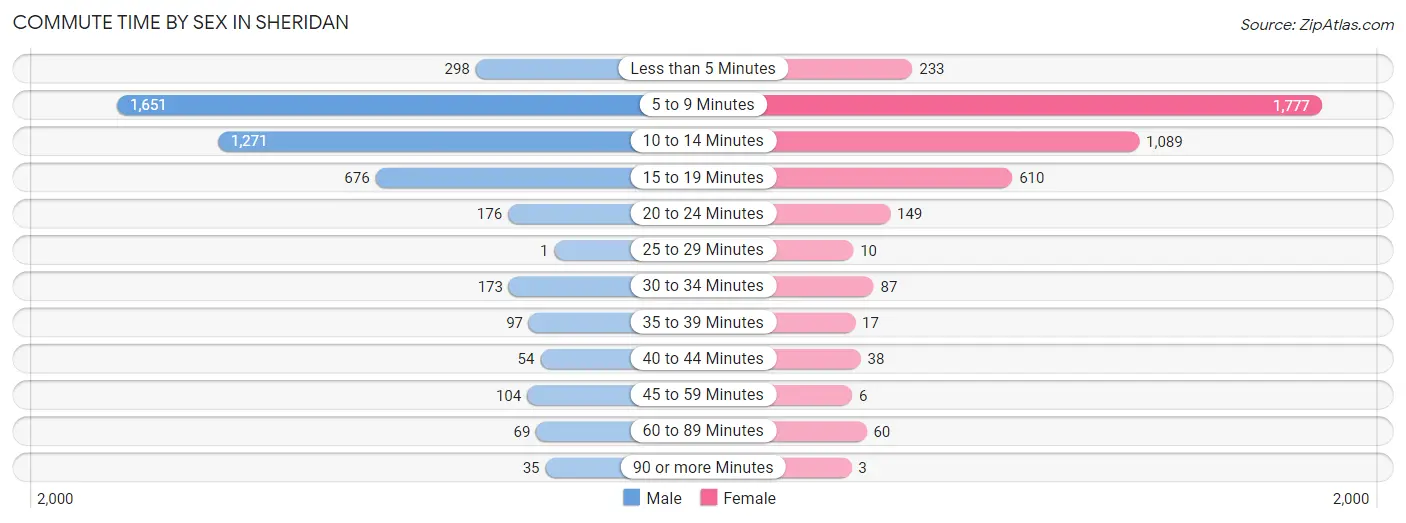
| Commute Time | Male | Female |
| Less than 5 Minutes | 298 (6.5%) | 233 (5.7%) |
| 5 to 9 Minutes | 1,651 (35.8%) | 1,777 (43.6%) |
| 10 to 14 Minutes | 1,271 (27.6%) | 1,089 (26.7%) |
| 15 to 19 Minutes | 676 (14.7%) | 610 (14.9%) |
| 20 to 24 Minutes | 176 (3.8%) | 149 (3.6%) |
| 25 to 29 Minutes | 1 (0.0%) | 10 (0.3%) |
| 30 to 34 Minutes | 173 (3.8%) | 87 (2.1%) |
| 35 to 39 Minutes | 97 (2.1%) | 17 (0.4%) |
| 40 to 44 Minutes | 54 (1.2%) | 38 (0.9%) |
| 45 to 59 Minutes | 104 (2.3%) | 6 (0.2%) |
| 60 to 89 Minutes | 69 (1.5%) | 60 (1.5%) |
| 90 or more Minutes | 35 (0.8%) | 3 (0.1%) |
Time of Departure to Work by Sex in Sheridan
The most frequent times of departure to work in Sheridan are 7:30 AM to 7:59 AM (909, 19.7%) for males and 7:30 AM to 7:59 AM (815, 20.0%) for females.
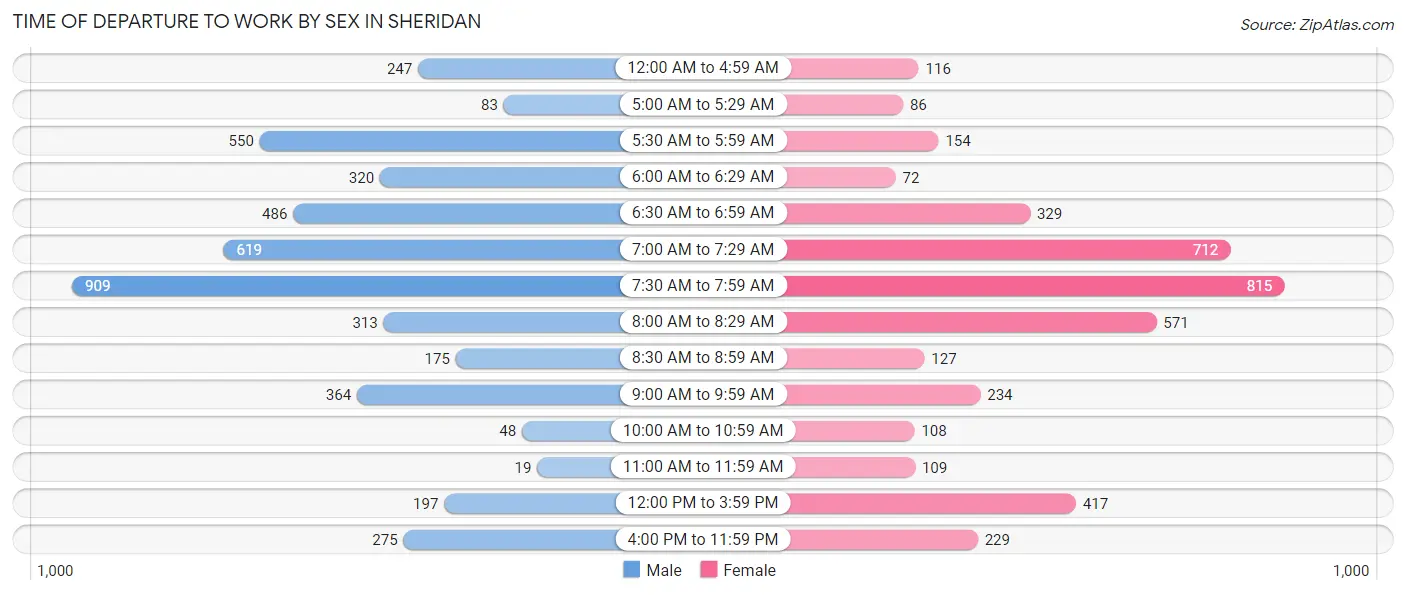
| Time of Departure | Male | Female |
| 12:00 AM to 4:59 AM | 247 (5.4%) | 116 (2.8%) |
| 5:00 AM to 5:29 AM | 83 (1.8%) | 86 (2.1%) |
| 5:30 AM to 5:59 AM | 550 (11.9%) | 154 (3.8%) |
| 6:00 AM to 6:29 AM | 320 (7.0%) | 72 (1.8%) |
| 6:30 AM to 6:59 AM | 486 (10.5%) | 329 (8.1%) |
| 7:00 AM to 7:29 AM | 619 (13.4%) | 712 (17.5%) |
| 7:30 AM to 7:59 AM | 909 (19.7%) | 815 (20.0%) |
| 8:00 AM to 8:29 AM | 313 (6.8%) | 571 (14.0%) |
| 8:30 AM to 8:59 AM | 175 (3.8%) | 127 (3.1%) |
| 9:00 AM to 9:59 AM | 364 (7.9%) | 234 (5.7%) |
| 10:00 AM to 10:59 AM | 48 (1.0%) | 108 (2.6%) |
| 11:00 AM to 11:59 AM | 19 (0.4%) | 109 (2.7%) |
| 12:00 PM to 3:59 PM | 197 (4.3%) | 417 (10.2%) |
| 4:00 PM to 11:59 PM | 275 (6.0%) | 229 (5.6%) |
| Total | 4,605 (100.0%) | 4,079 (100.0%) |
Housing Occupancy in Sheridan
Occupancy by Ownership in Sheridan
Of the total 8,254 dwellings in Sheridan, owner-occupied units account for 4,988 (60.4%), while renter-occupied units make up 3,266 (39.6%).
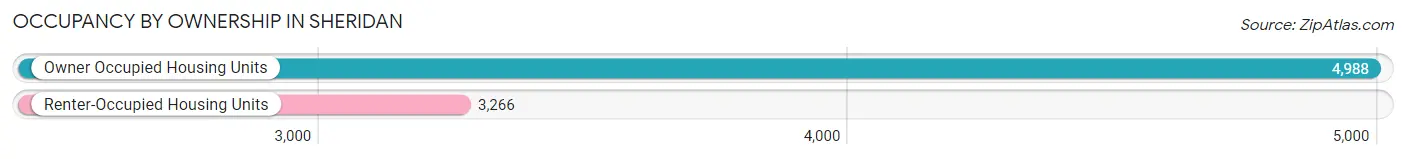
| Occupancy | # Housing Units | % Housing Units |
| Owner Occupied Housing Units | 4,988 | 60.4% |
| Renter-Occupied Housing Units | 3,266 | 39.6% |
| Total Occupied Housing Units | 8,254 | 100.0% |
Occupancy by Household Size in Sheridan
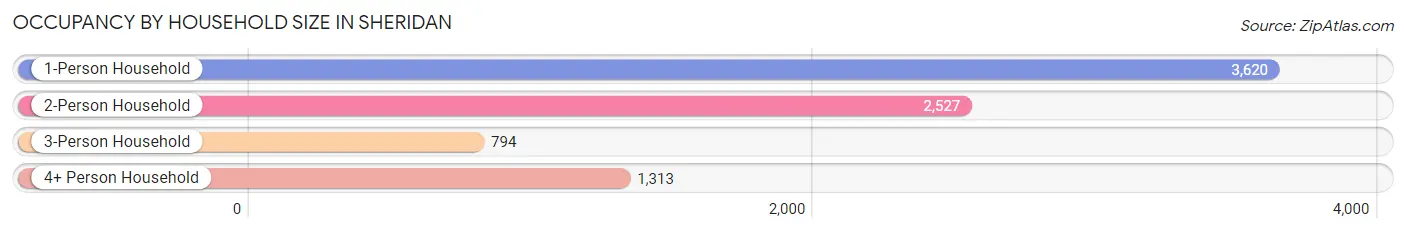
| Household Size | # Housing Units | % Housing Units |
| 1-Person Household | 3,620 | 43.9% |
| 2-Person Household | 2,527 | 30.6% |
| 3-Person Household | 794 | 9.6% |
| 4+ Person Household | 1,313 | 15.9% |
| Total Housing Units | 8,254 | 100.0% |
Occupancy by Ownership by Household Size in Sheridan
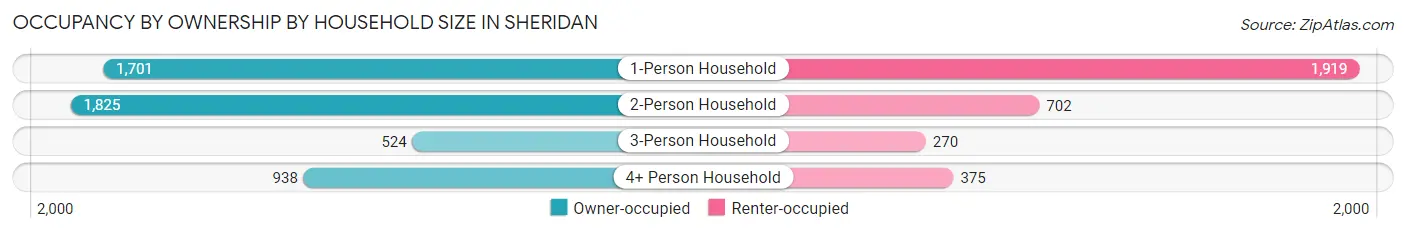
| Household Size | Owner-occupied | Renter-occupied |
| 1-Person Household | 1,701 (47.0%) | 1,919 (53.0%) |
| 2-Person Household | 1,825 (72.2%) | 702 (27.8%) |
| 3-Person Household | 524 (66.0%) | 270 (34.0%) |
| 4+ Person Household | 938 (71.4%) | 375 (28.6%) |
| Total Housing Units | 4,988 (60.4%) | 3,266 (39.6%) |
Occupancy by Educational Attainment in Sheridan
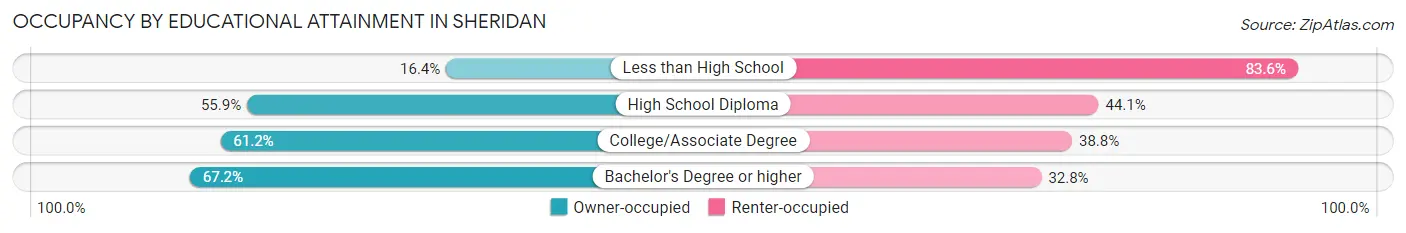
| Household Size | Owner-occupied | Renter-occupied |
| Less than High School | 46 (16.4%) | 234 (83.6%) |
| High School Diploma | 1,268 (55.9%) | 1,000 (44.1%) |
| College/Associate Degree | 1,635 (61.2%) | 1,038 (38.8%) |
| Bachelor's Degree or higher | 2,039 (67.2%) | 994 (32.8%) |
Occupancy by Age of Householder in Sheridan
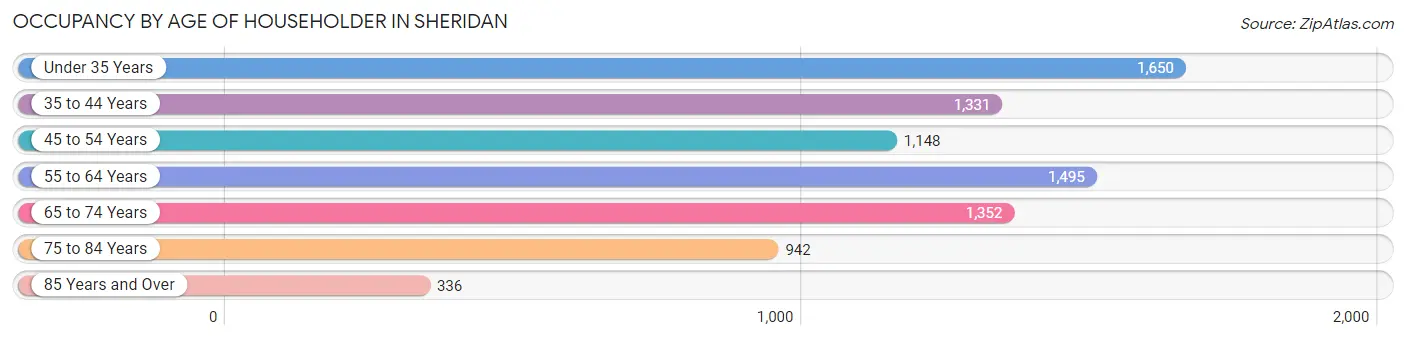
| Age Bracket | # Households | % Households |
| Under 35 Years | 1,650 | 20.0% |
| 35 to 44 Years | 1,331 | 16.1% |
| 45 to 54 Years | 1,148 | 13.9% |
| 55 to 64 Years | 1,495 | 18.1% |
| 65 to 74 Years | 1,352 | 16.4% |
| 75 to 84 Years | 942 | 11.4% |
| 85 Years and Over | 336 | 4.1% |
| Total | 8,254 | 100.0% |
Housing Finances in Sheridan
Median Income by Occupancy in Sheridan
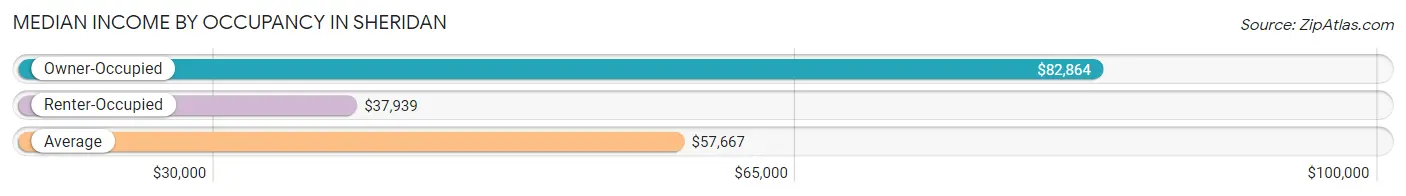
| Occupancy Type | # Households | Median Income |
| Owner-Occupied | 4,988 (60.4%) | $82,864 |
| Renter-Occupied | 3,266 (39.6%) | $37,939 |
| Average | 8,254 (100.0%) | $57,667 |
Occupancy by Householder Income Bracket in Sheridan
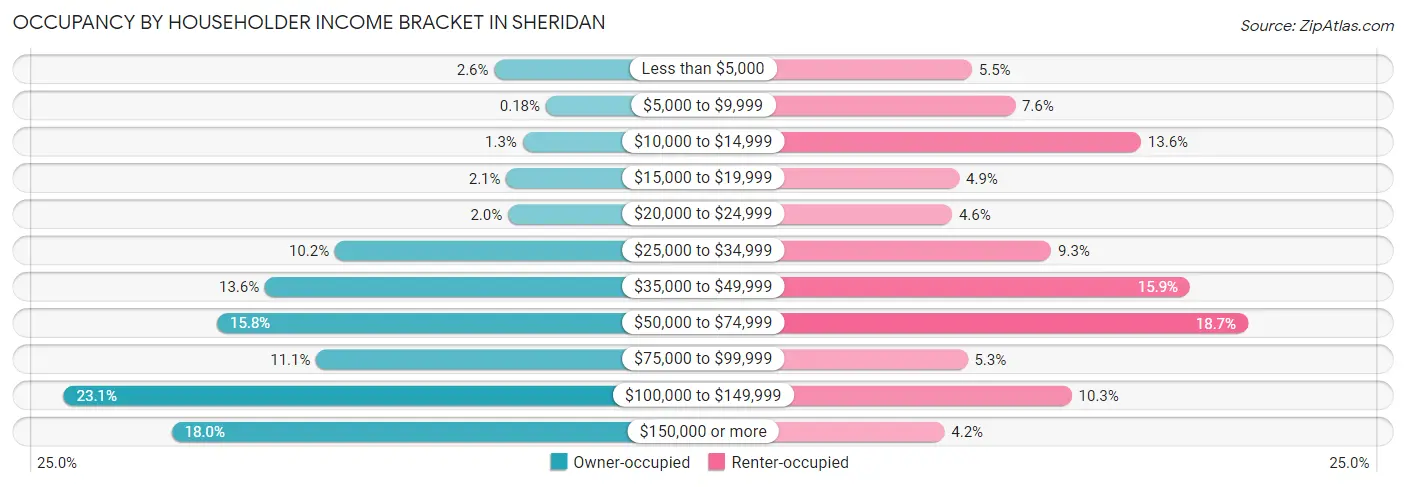
| Income Bracket | Owner-occupied | Renter-occupied |
| Less than $5,000 | 131 (2.6%) | 181 (5.5%) |
| $5,000 to $9,999 | 9 (0.2%) | 248 (7.6%) |
| $10,000 to $14,999 | 64 (1.3%) | 444 (13.6%) |
| $15,000 to $19,999 | 103 (2.1%) | 161 (4.9%) |
| $20,000 to $24,999 | 99 (2.0%) | 150 (4.6%) |
| $25,000 to $34,999 | 510 (10.2%) | 304 (9.3%) |
| $35,000 to $49,999 | 676 (13.6%) | 520 (15.9%) |
| $50,000 to $74,999 | 790 (15.8%) | 610 (18.7%) |
| $75,000 to $99,999 | 554 (11.1%) | 174 (5.3%) |
| $100,000 to $149,999 | 1,154 (23.1%) | 336 (10.3%) |
| $150,000 or more | 898 (18.0%) | 138 (4.2%) |
| Total | 4,988 (100.0%) | 3,266 (100.0%) |
Monthly Housing Cost Tiers in Sheridan
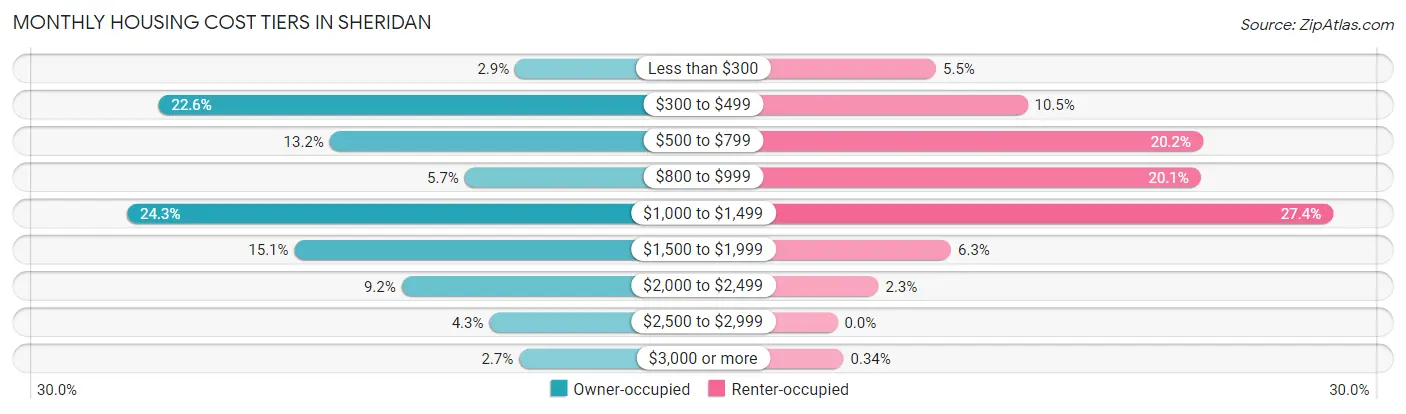
| Monthly Cost | Owner-occupied | Renter-occupied |
| Less than $300 | 145 (2.9%) | 178 (5.4%) |
| $300 to $499 | 1,128 (22.6%) | 343 (10.5%) |
| $500 to $799 | 656 (13.2%) | 659 (20.2%) |
| $800 to $999 | 284 (5.7%) | 655 (20.1%) |
| $1,000 to $1,499 | 1,214 (24.3%) | 894 (27.4%) |
| $1,500 to $1,999 | 753 (15.1%) | 205 (6.3%) |
| $2,000 to $2,499 | 458 (9.2%) | 74 (2.3%) |
| $2,500 to $2,999 | 216 (4.3%) | 0 (0.0%) |
| $3,000 or more | 134 (2.7%) | 11 (0.3%) |
| Total | 4,988 (100.0%) | 3,266 (100.0%) |
Physical Housing Characteristics in Sheridan
Housing Structures in Sheridan
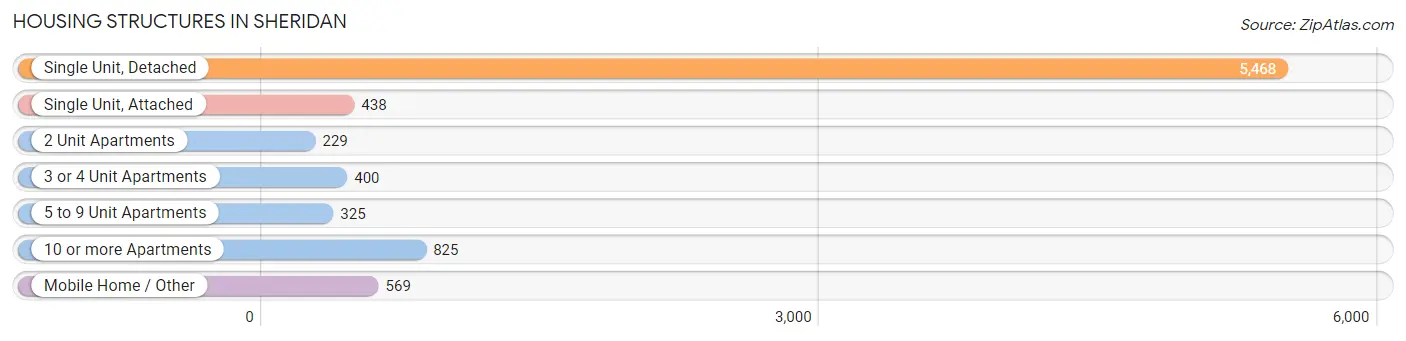
| Structure Type | # Housing Units | % Housing Units |
| Single Unit, Detached | 5,468 | 66.2% |
| Single Unit, Attached | 438 | 5.3% |
| 2 Unit Apartments | 229 | 2.8% |
| 3 or 4 Unit Apartments | 400 | 4.9% |
| 5 to 9 Unit Apartments | 325 | 3.9% |
| 10 or more Apartments | 825 | 10.0% |
| Mobile Home / Other | 569 | 6.9% |
| Total | 8,254 | 100.0% |
Housing Structures by Occupancy in Sheridan
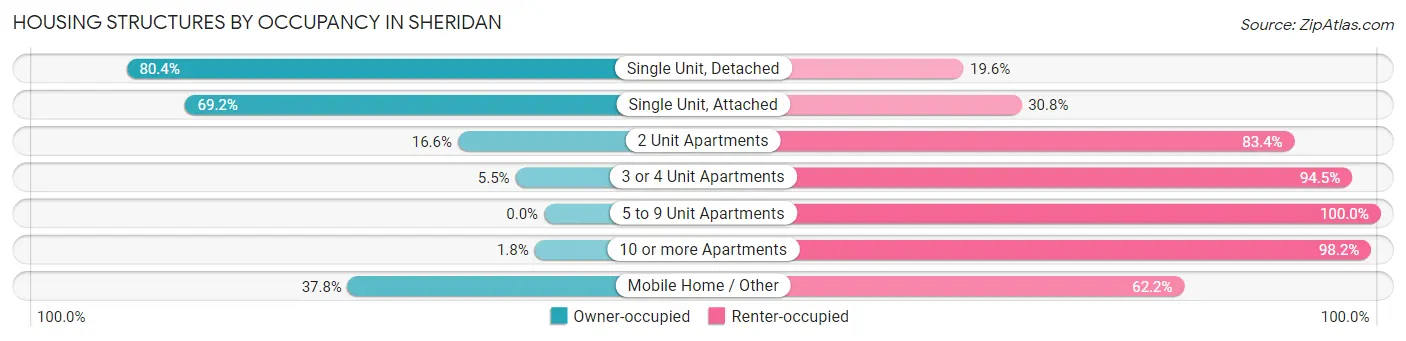
| Structure Type | Owner-occupied | Renter-occupied |
| Single Unit, Detached | 4,395 (80.4%) | 1,073 (19.6%) |
| Single Unit, Attached | 303 (69.2%) | 135 (30.8%) |
| 2 Unit Apartments | 38 (16.6%) | 191 (83.4%) |
| 3 or 4 Unit Apartments | 22 (5.5%) | 378 (94.5%) |
| 5 to 9 Unit Apartments | 0 (0.0%) | 325 (100.0%) |
| 10 or more Apartments | 15 (1.8%) | 810 (98.2%) |
| Mobile Home / Other | 215 (37.8%) | 354 (62.2%) |
| Total | 4,988 (60.4%) | 3,266 (39.6%) |
Housing Structures by Number of Rooms in Sheridan
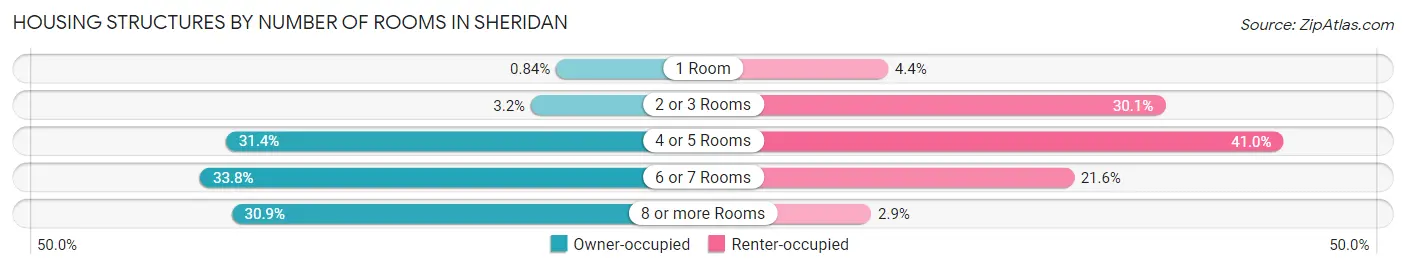
| Number of Rooms | Owner-occupied | Renter-occupied |
| 1 Room | 42 (0.8%) | 145 (4.4%) |
| 2 or 3 Rooms | 158 (3.2%) | 982 (30.1%) |
| 4 or 5 Rooms | 1,565 (31.4%) | 1,339 (41.0%) |
| 6 or 7 Rooms | 1,684 (33.8%) | 706 (21.6%) |
| 8 or more Rooms | 1,539 (30.8%) | 94 (2.9%) |
| Total | 4,988 (100.0%) | 3,266 (100.0%) |
Housing Structure by Heating Type in Sheridan
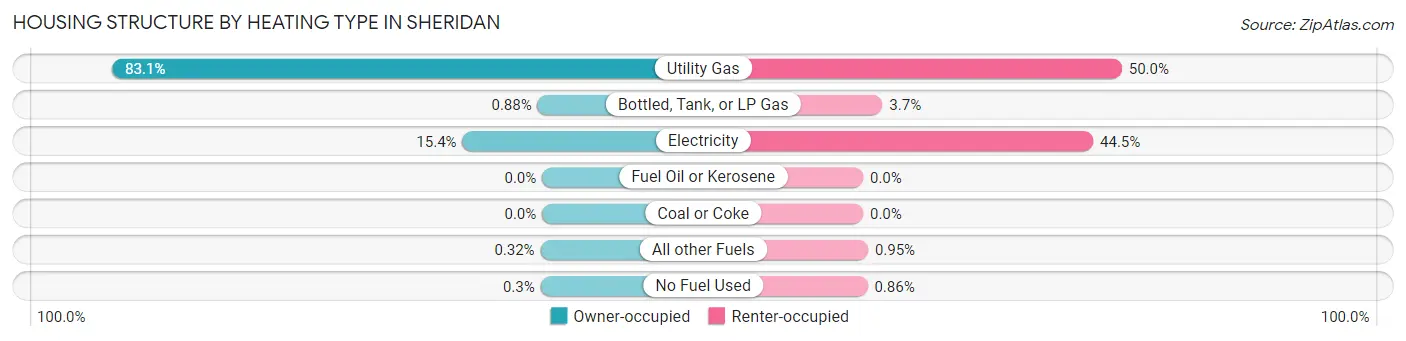
| Heating Type | Owner-occupied | Renter-occupied |
| Utility Gas | 4,145 (83.1%) | 1,633 (50.0%) |
| Bottled, Tank, or LP Gas | 44 (0.9%) | 122 (3.7%) |
| Electricity | 768 (15.4%) | 1,452 (44.5%) |
| Fuel Oil or Kerosene | 0 (0.0%) | 0 (0.0%) |
| Coal or Coke | 0 (0.0%) | 0 (0.0%) |
| All other Fuels | 16 (0.3%) | 31 (0.9%) |
| No Fuel Used | 15 (0.3%) | 28 (0.9%) |
| Total | 4,988 (100.0%) | 3,266 (100.0%) |
Household Vehicle Usage in Sheridan
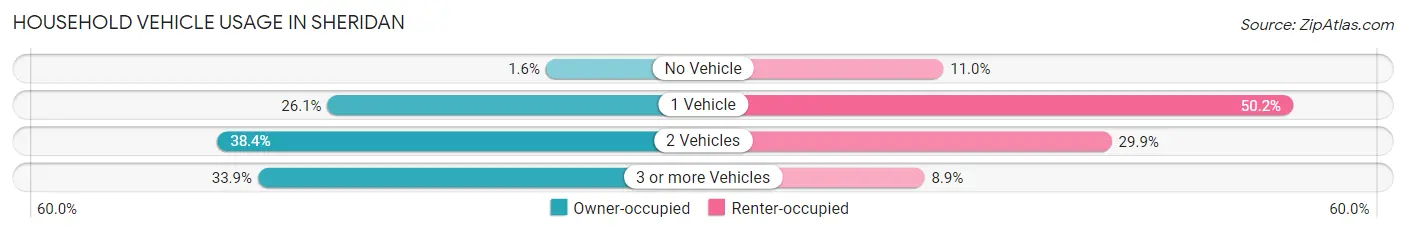
| Vehicles per Household | Owner-occupied | Renter-occupied |
| No Vehicle | 81 (1.6%) | 360 (11.0%) |
| 1 Vehicle | 1,301 (26.1%) | 1,639 (50.2%) |
| 2 Vehicles | 1,916 (38.4%) | 976 (29.9%) |
| 3 or more Vehicles | 1,690 (33.9%) | 291 (8.9%) |
| Total | 4,988 (100.0%) | 3,266 (100.0%) |
Real Estate & Mortgages in Sheridan
Real Estate and Mortgage Overview in Sheridan
| Characteristic | Without Mortgage | With Mortgage |
| Housing Units | 2,080 | 2,908 |
| Median Property Value | $224,800 | $320,500 |
| Median Household Income | $56,630 | $627 |
| Monthly Housing Costs | $460 | $134 |
| Real Estate Taxes | $1,383 | $158 |
Property Value by Mortgage Status in Sheridan
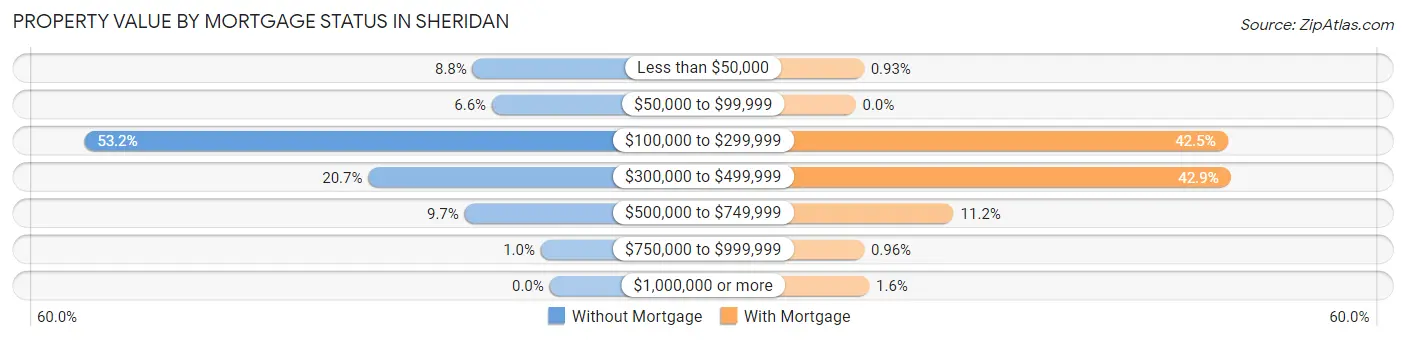
| Property Value | Without Mortgage | With Mortgage |
| Less than $50,000 | 183 (8.8%) | 27 (0.9%) |
| $50,000 to $99,999 | 137 (6.6%) | 0 (0.0%) |
| $100,000 to $299,999 | 1,106 (53.2%) | 1,236 (42.5%) |
| $300,000 to $499,999 | 431 (20.7%) | 1,246 (42.8%) |
| $500,000 to $749,999 | 202 (9.7%) | 326 (11.2%) |
| $750,000 to $999,999 | 21 (1.0%) | 28 (1.0%) |
| $1,000,000 or more | 0 (0.0%) | 45 (1.5%) |
| Total | 2,080 (100.0%) | 2,908 (100.0%) |
Household Income by Mortgage Status in Sheridan
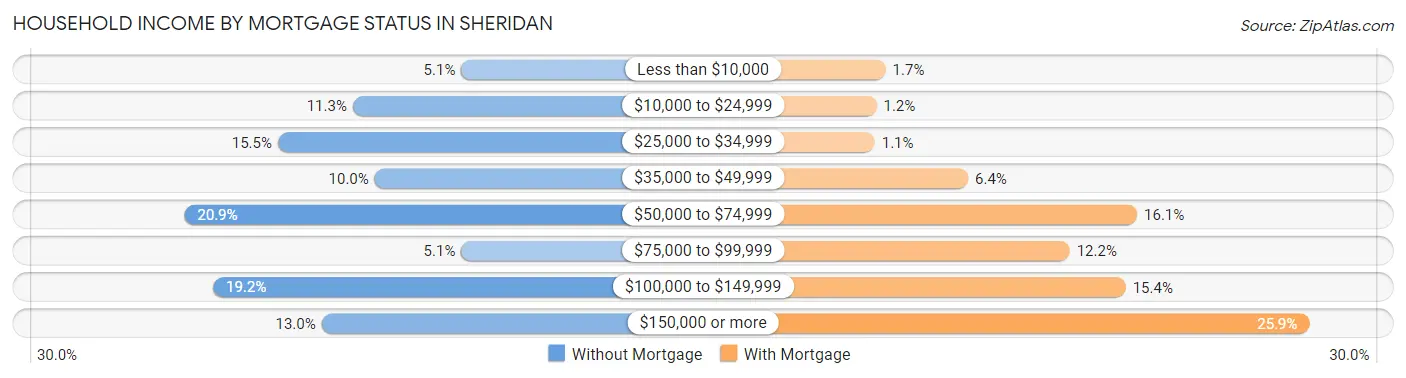
| Household Income | Without Mortgage | With Mortgage |
| Less than $10,000 | 105 (5.1%) | 50 (1.7%) |
| $10,000 to $24,999 | 234 (11.3%) | 35 (1.2%) |
| $25,000 to $34,999 | 323 (15.5%) | 32 (1.1%) |
| $35,000 to $49,999 | 208 (10.0%) | 187 (6.4%) |
| $50,000 to $74,999 | 434 (20.9%) | 468 (16.1%) |
| $75,000 to $99,999 | 105 (5.1%) | 356 (12.2%) |
| $100,000 to $149,999 | 400 (19.2%) | 449 (15.4%) |
| $150,000 or more | 271 (13.0%) | 754 (25.9%) |
| Total | 2,080 (100.0%) | 2,908 (100.0%) |
Property Value to Household Income Ratio in Sheridan
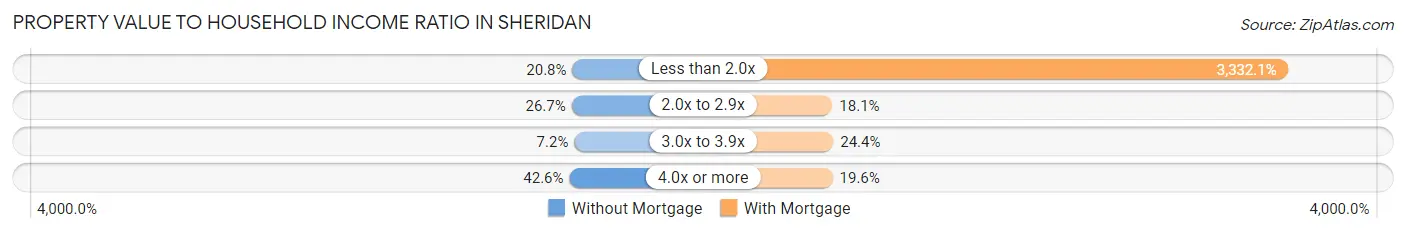
| Value-to-Income Ratio | Without Mortgage | With Mortgage |
| Less than 2.0x | 433 (20.8%) | 96,898 (3,332.1%) |
| 2.0x to 2.9x | 556 (26.7%) | 526 (18.1%) |
| 3.0x to 3.9x | 149 (7.2%) | 708 (24.3%) |
| 4.0x or more | 885 (42.5%) | 571 (19.6%) |
| Total | 2,080 (100.0%) | 2,908 (100.0%) |
Real Estate Taxes by Mortgage Status in Sheridan
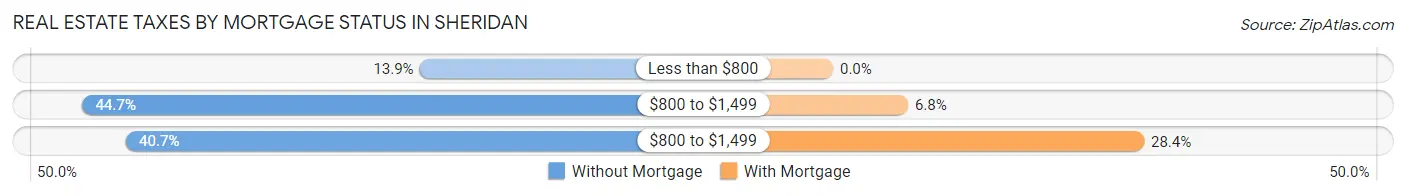
| Property Taxes | Without Mortgage | With Mortgage |
| Less than $800 | 290 (13.9%) | 0 (0.0%) |
| $800 to $1,499 | 930 (44.7%) | 199 (6.8%) |
| $800 to $1,499 | 847 (40.7%) | 826 (28.4%) |
| Total | 2,080 (100.0%) | 2,908 (100.0%) |
Health & Disability in Sheridan
Health Insurance Coverage by Age in Sheridan
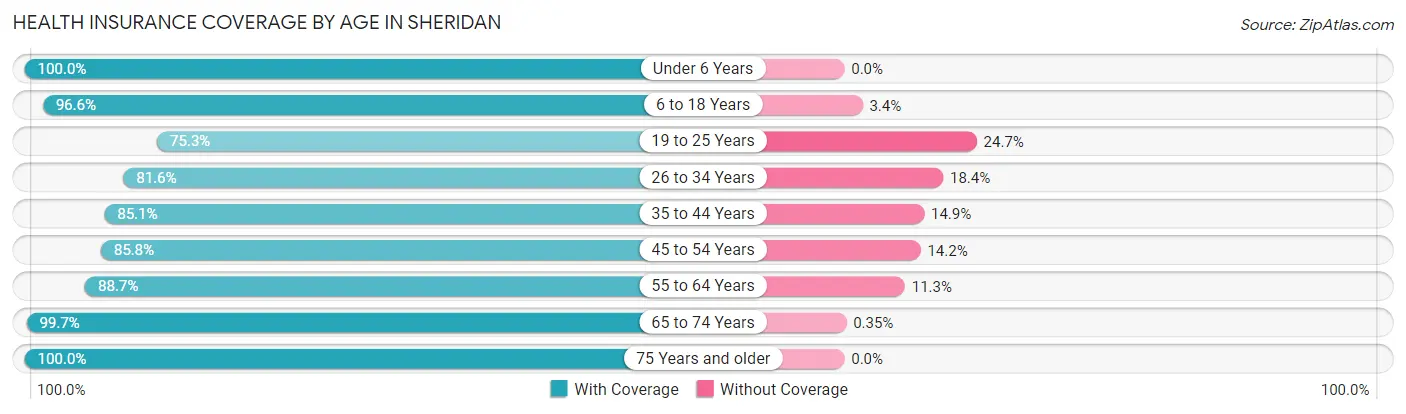
| Age Bracket | With Coverage | Without Coverage |
| Under 6 Years | 1,251 (100.0%) | 0 (0.0%) |
| 6 to 18 Years | 3,136 (96.6%) | 110 (3.4%) |
| 19 to 25 Years | 1,450 (75.3%) | 475 (24.7%) |
| 26 to 34 Years | 1,600 (81.6%) | 361 (18.4%) |
| 35 to 44 Years | 1,821 (85.1%) | 318 (14.9%) |
| 45 to 54 Years | 1,787 (85.8%) | 296 (14.2%) |
| 55 to 64 Years | 2,005 (88.7%) | 255 (11.3%) |
| 65 to 74 Years | 2,001 (99.7%) | 7 (0.4%) |
| 75 Years and older | 1,640 (100.0%) | 0 (0.0%) |
| Total | 16,691 (90.2%) | 1,822 (9.8%) |
Health Insurance Coverage by Citizenship Status in Sheridan
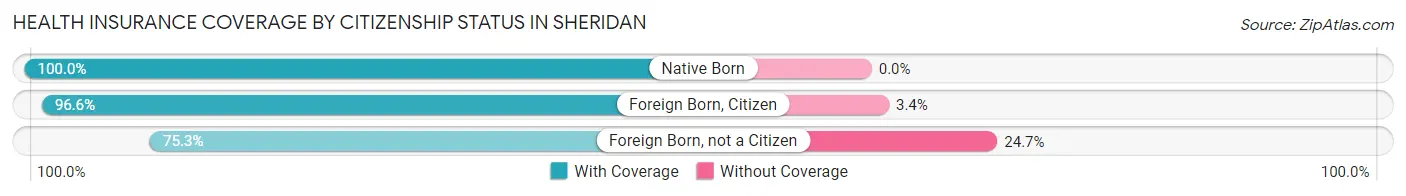
| Citizenship Status | With Coverage | Without Coverage |
| Native Born | 1,251 (100.0%) | 0 (0.0%) |
| Foreign Born, Citizen | 3,136 (96.6%) | 110 (3.4%) |
| Foreign Born, not a Citizen | 1,450 (75.3%) | 475 (24.7%) |
Health Insurance Coverage by Household Income in Sheridan
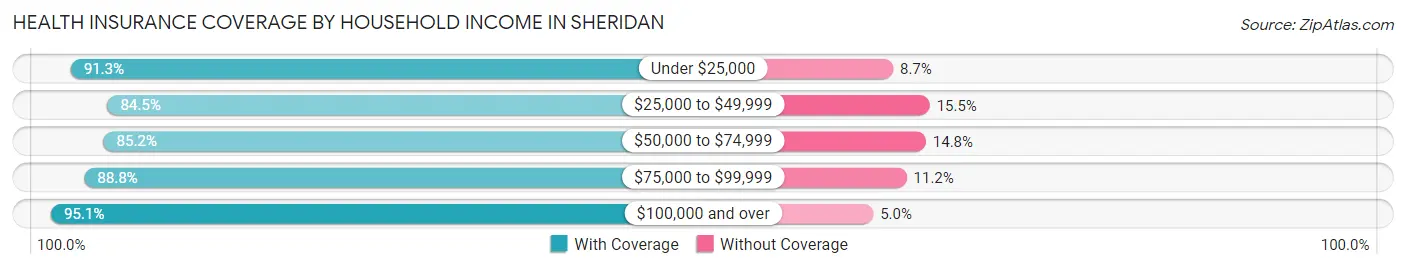
| Household Income | With Coverage | Without Coverage |
| Under $25,000 | 1,835 (91.3%) | 174 (8.7%) |
| $25,000 to $49,999 | 2,773 (84.5%) | 510 (15.5%) |
| $50,000 to $74,999 | 2,600 (85.2%) | 452 (14.8%) |
| $75,000 to $99,999 | 1,814 (88.8%) | 229 (11.2%) |
| $100,000 and over | 7,297 (95.1%) | 380 (5.0%) |
Public vs Private Health Insurance Coverage by Age in Sheridan
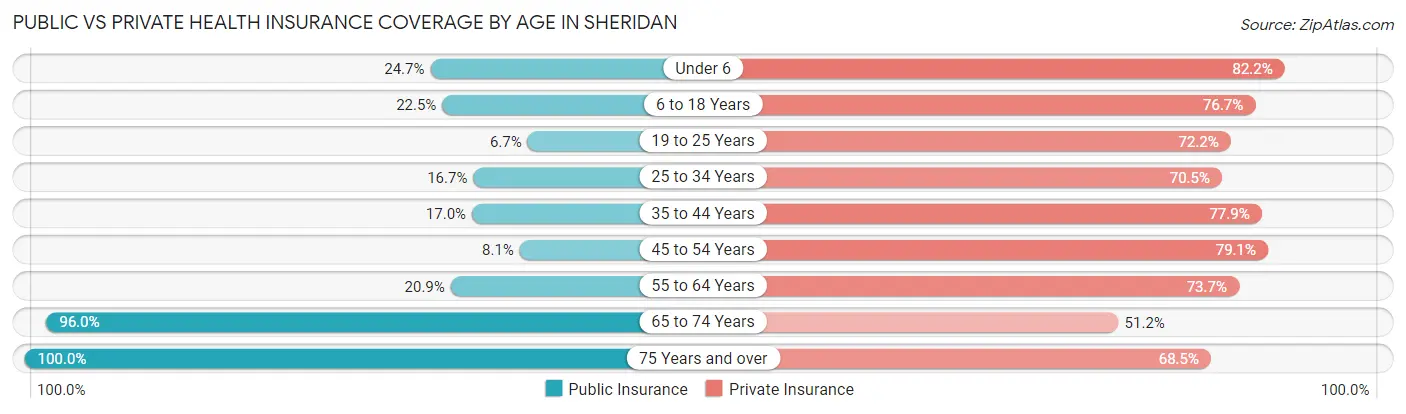
| Age Bracket | Public Insurance | Private Insurance |
| Under 6 | 309 (24.7%) | 1,028 (82.2%) |
| 6 to 18 Years | 730 (22.5%) | 2,490 (76.7%) |
| 19 to 25 Years | 128 (6.7%) | 1,389 (72.2%) |
| 25 to 34 Years | 328 (16.7%) | 1,383 (70.5%) |
| 35 to 44 Years | 363 (17.0%) | 1,666 (77.9%) |
| 45 to 54 Years | 169 (8.1%) | 1,647 (79.1%) |
| 55 to 64 Years | 473 (20.9%) | 1,665 (73.7%) |
| 65 to 74 Years | 1,927 (96.0%) | 1,028 (51.2%) |
| 75 Years and over | 1,640 (100.0%) | 1,123 (68.5%) |
| Total | 6,067 (32.8%) | 13,419 (72.5%) |
Disability Status by Sex by Age in Sheridan
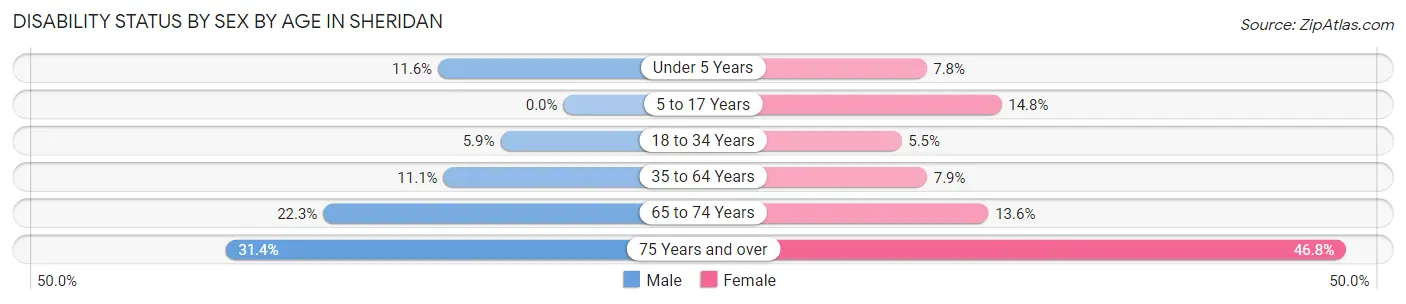
| Age Bracket | Male | Female |
| Under 5 Years | 56 (11.6%) | 41 (7.8%) |
| 5 to 17 Years | 0 (0.0%) | 232 (14.8%) |
| 18 to 34 Years | 119 (5.9%) | 114 (5.5%) |
| 35 to 64 Years | 380 (11.1%) | 242 (7.9%) |
| 65 to 74 Years | 218 (22.3%) | 140 (13.6%) |
| 75 Years and over | 202 (31.4%) | 466 (46.8%) |
Disability Class by Sex by Age in Sheridan
Disability Class: Hearing Difficulty
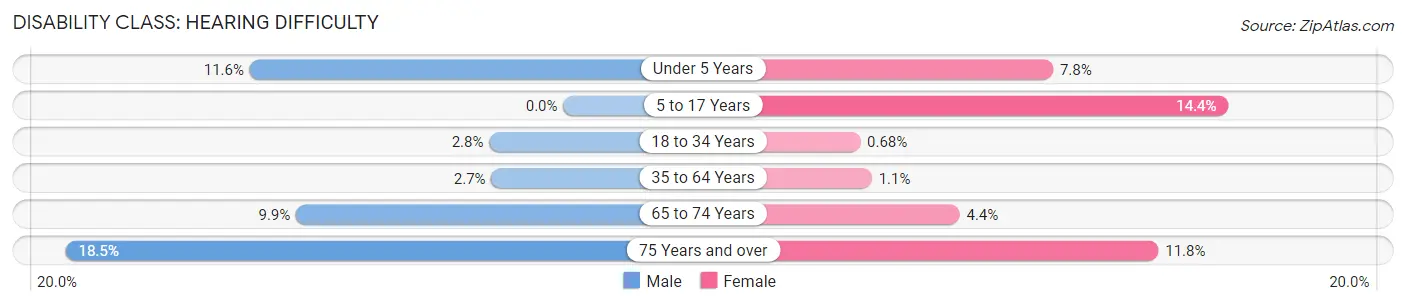
| Age Bracket | Male | Female |
| Under 5 Years | 56 (11.6%) | 41 (7.8%) |
| 5 to 17 Years | 0 (0.0%) | 225 (14.3%) |
| 18 to 34 Years | 56 (2.8%) | 14 (0.7%) |
| 35 to 64 Years | 91 (2.7%) | 34 (1.1%) |
| 65 to 74 Years | 97 (9.9%) | 45 (4.4%) |
| 75 Years and over | 119 (18.5%) | 117 (11.7%) |
Disability Class: Vision Difficulty
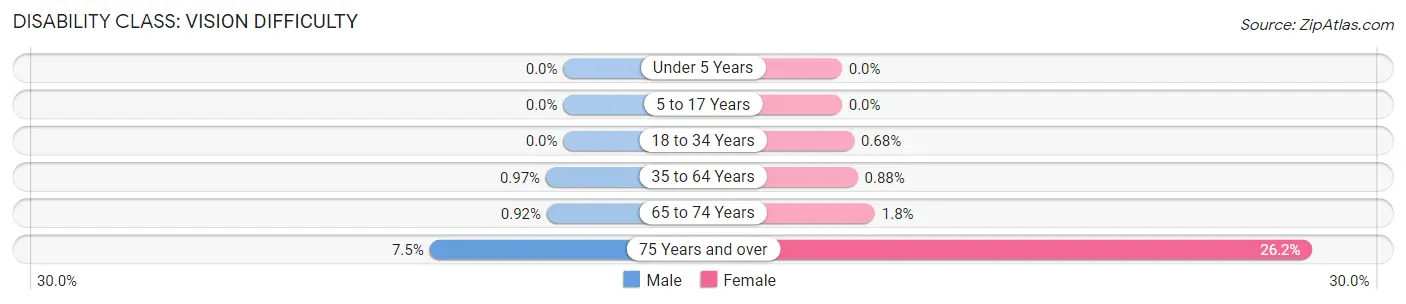
| Age Bracket | Male | Female |
| Under 5 Years | 0 (0.0%) | 0 (0.0%) |
| 5 to 17 Years | 0 (0.0%) | 0 (0.0%) |
| 18 to 34 Years | 0 (0.0%) | 14 (0.7%) |
| 35 to 64 Years | 33 (1.0%) | 27 (0.9%) |
| 65 to 74 Years | 9 (0.9%) | 19 (1.8%) |
| 75 Years and over | 48 (7.4%) | 261 (26.2%) |
Disability Class: Cognitive Difficulty
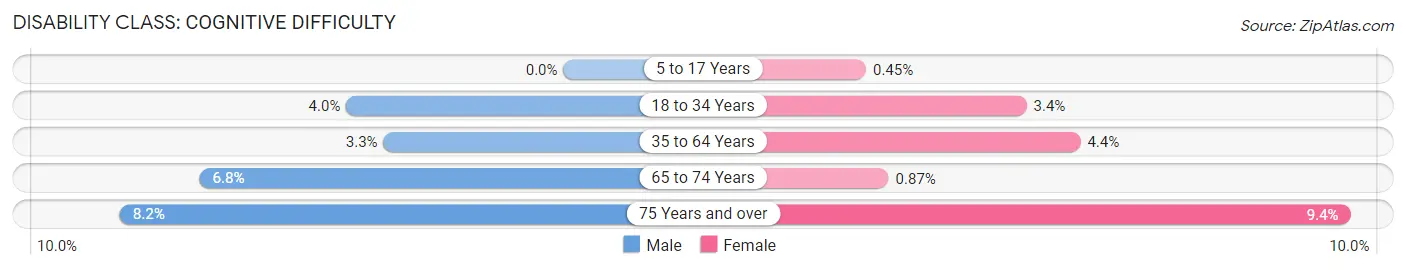
| Age Bracket | Male | Female |
| 5 to 17 Years | 0 (0.0%) | 7 (0.4%) |
| 18 to 34 Years | 82 (4.0%) | 71 (3.4%) |
| 35 to 64 Years | 114 (3.3%) | 136 (4.4%) |
| 65 to 74 Years | 66 (6.8%) | 9 (0.9%) |
| 75 Years and over | 53 (8.2%) | 94 (9.4%) |
Disability Class: Ambulatory Difficulty
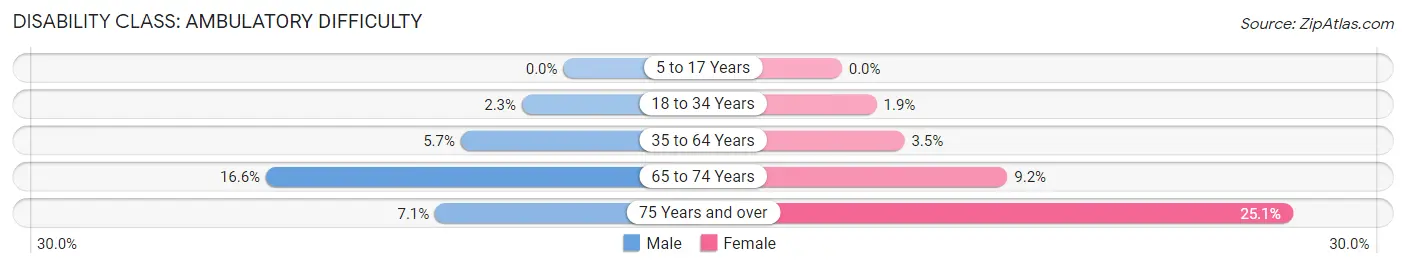
| Age Bracket | Male | Female |
| 5 to 17 Years | 0 (0.0%) | 0 (0.0%) |
| 18 to 34 Years | 47 (2.3%) | 40 (1.9%) |
| 35 to 64 Years | 195 (5.7%) | 107 (3.5%) |
| 65 to 74 Years | 162 (16.6%) | 95 (9.2%) |
| 75 Years and over | 46 (7.1%) | 250 (25.1%) |
Disability Class: Self-Care Difficulty
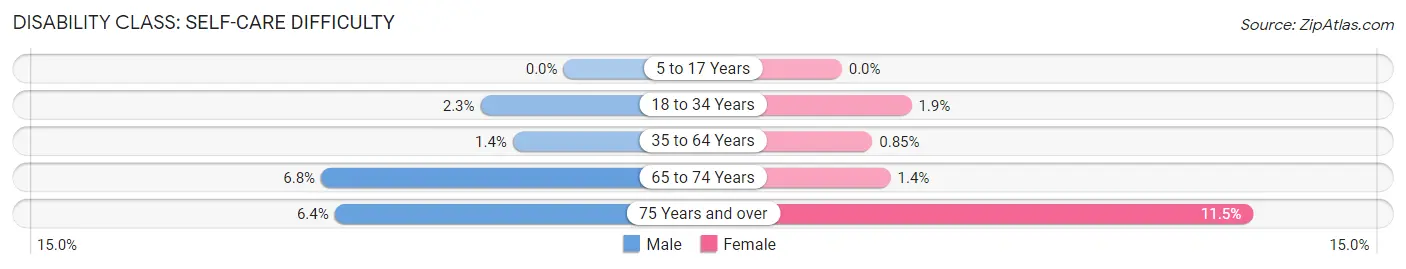
| Age Bracket | Male | Female |
| 5 to 17 Years | 0 (0.0%) | 0 (0.0%) |
| 18 to 34 Years | 47 (2.3%) | 40 (1.9%) |
| 35 to 64 Years | 48 (1.4%) | 26 (0.9%) |
| 65 to 74 Years | 66 (6.8%) | 14 (1.4%) |
| 75 Years and over | 41 (6.4%) | 114 (11.5%) |
Technology Access in Sheridan
Computing Device Access in Sheridan
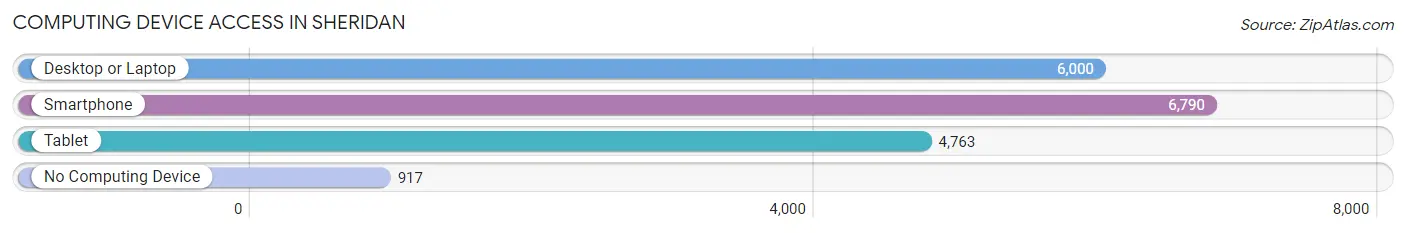
| Device Type | # Households | % Households |
| Desktop or Laptop | 6,000 | 72.7% |
| Smartphone | 6,790 | 82.3% |
| Tablet | 4,763 | 57.7% |
| No Computing Device | 917 | 11.1% |
| Total | 8,254 | 100.0% |
Internet Access in Sheridan
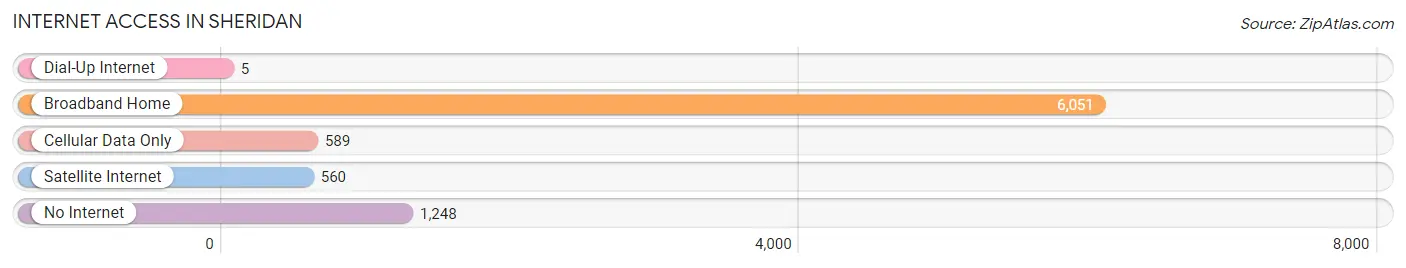
| Internet Type | # Households | % Households |
| Dial-Up Internet | 5 | 0.1% |
| Broadband Home | 6,051 | 73.3% |
| Cellular Data Only | 589 | 7.1% |
| Satellite Internet | 560 | 6.8% |
| No Internet | 1,248 | 15.1% |
| Total | 8,254 | 100.0% |
Sheridan Summary
Sheridan, Wyoming is a city located in the northern part of the state, in Sheridan County. It is the county seat and the largest city in the county. The city is situated in the Big Horn Basin, at the foot of the Big Horn Mountains. The city is located at the intersection of Interstate 90 and US Route 14. The city has a population of 17,444, according to the 2010 census.
History
The area that is now Sheridan was first inhabited by Native American tribes, including the Crow, Cheyenne, and Arapaho. The first white settlers arrived in the area in the late 1800s, and the town of Sheridan was founded in 1882. The town was named after General Philip Sheridan, a Civil War hero.
The city was incorporated in 1888, and the first mayor was elected in 1889. The city quickly grew, and by the early 1900s, it had become a major center for the cattle industry. The city was also a major stop on the Chicago, Burlington and Quincy Railroad.
In the early 1900s, the city was a major center for the oil industry. The city was also home to a large military base, Camp Carlin, which was established in 1941. The base was used to train soldiers for World War II.
Geography
Sheridan is located in the northern part of Wyoming, in Sheridan County. The city is situated in the Big Horn Basin, at the foot of the Big Horn Mountains. The city is located at the intersection of Interstate 90 and US Route 14.
The city has a total area of 8.3 square miles, of which 8.2 square miles is land and 0.1 square miles is water. The city is located at an elevation of 4,067 feet above sea level.
Economy
The economy of Sheridan is largely based on agriculture, tourism, and energy production. The city is home to several large agricultural operations, including cattle ranches, wheat farms, and sugar beet farms.
The city is also a major tourist destination, with many visitors coming to the area to enjoy the outdoor activities, such as fishing, hunting, and camping. The city is also home to several museums, including the Sheridan County Museum and the Sheridan County Historical Society.
The city is also home to several energy production facilities, including coal-fired power plants and natural gas processing plants.
Demographics
According to the 2010 census, the population of Sheridan was 17,444. The racial makeup of the city was 91.3% White, 0.7% African American, 0.7% Native American, 0.7% Asian, 0.1% Pacific Islander, 4.3% from other races, and 2.2% from two or more races. Hispanic or Latino of any race were 8.3% of the population.
The median income for a household in the city was $41,945, and the median income for a family was $50,945. The per capita income for the city was $21,945. About 11.3% of families and 14.3% of the population were below the poverty line, including 19.3% of those under age 18 and 8.3% of those age 65 or over.
Common Questions
What is Per Capita Income in Sheridan?
Per Capita income in Sheridan is $38,554.
What is the Median Family Income in Sheridan?
Median Family Income in Sheridan is $99,655.
What is the Median Household income in Sheridan?
Median Household Income in Sheridan is $57,667.
What is Income or Wage Gap in Sheridan?
Income or Wage Gap in Sheridan is 38.3%.
Women in Sheridan earn 61.7 cents for every dollar earned by a man.
What is Family Income Deficit in Sheridan?
Family Income Deficit in Sheridan is $14,628.
Families that are below poverty line in Sheridan earn $14,628 less on average than the poverty threshold level.
What is Inequality or Gini Index in Sheridan?
Inequality or Gini Index in Sheridan is 0.47.
What is the Total Population of Sheridan?
Total Population of Sheridan is 18,807.
What is the Total Male Population of Sheridan?
Total Male Population of Sheridan is 9,405.
What is the Total Female Population of Sheridan?
Total Female Population of Sheridan is 9,402.
What is the Ratio of Males per 100 Females in Sheridan?
There are 100.03 Males per 100 Females in Sheridan.
What is the Ratio of Females per 100 Males in Sheridan?
There are 99.97 Females per 100 Males in Sheridan.
What is the Median Population Age in Sheridan?
Median Population Age in Sheridan is 39.7 Years.
What is the Average Family Size in Sheridan
Average Family Size in Sheridan is 3.1 People.
What is the Average Household Size in Sheridan
Average Household Size in Sheridan is 2.2 People.
How Large is the Labor Force in Sheridan?
There are 9,540 People in the Labor Forcein in Sheridan.
What is the Percentage of People in the Labor Force in Sheridan?
63.5% of People are in the Labor Force in Sheridan.
What is the Unemployment Rate in Sheridan?
Unemployment Rate in Sheridan is 3.4%.