Casper, WY Map & Demographics
Casper Map
Casper Overview
$40,686
PER CAPITA INCOME
$88,278
AVG FAMILY INCOME
$67,011
AVG HOUSEHOLD INCOME
29.5%
WAGE / INCOME GAP [ % ]
70.5¢/ $1
WAGE / INCOME GAP [ $ ]
$9,753
FAMILY INCOME DEFICIT
0.45
INEQUALITY / GINI INDEX
58,631
TOTAL POPULATION
29,285
MALE POPULATION
29,346
FEMALE POPULATION
99.79
MALES / 100 FEMALES
100.21
FEMALES / 100 MALES
36.6
MEDIAN AGE
3.0
AVG FAMILY SIZE
2.3
AVG HOUSEHOLD SIZE
31,546
LABOR FORCE [ PEOPLE ]
68.5%
PERCENT IN LABOR FORCE
3.3%
UNEMPLOYMENT RATE
Casper Area Codes
Income in Casper
Income Overview in Casper
Per Capita Income in Casper is $40,686, while median incomes of families and households are $88,278 and $67,011 respectively.
| Characteristic | Number | Measure |
| Per Capita Income | 58,631 | $40,686 |
| Median Family Income | 14,876 | $88,278 |
| Mean Family Income | 14,876 | $113,625 |
| Median Household Income | 25,096 | $67,011 |
| Mean Household Income | 25,096 | $92,561 |
| Income Deficit | 14,876 | $9,753 |
| Wage / Income Gap (%) | 58,631 | 29.48% |
| Wage / Income Gap ($) | 58,631 | 70.52¢ per $1 |
| Gini / Inequality Index | 58,631 | 0.45 |
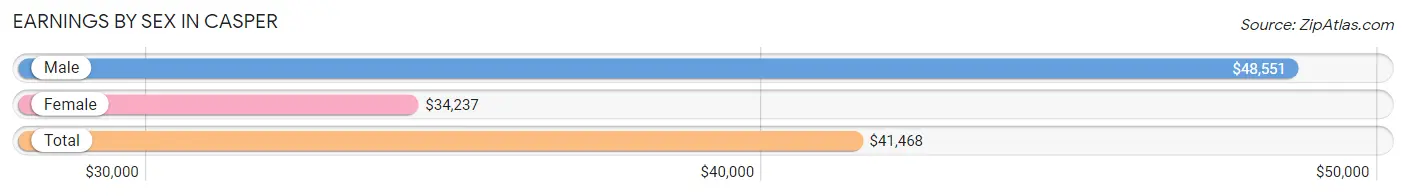
Earnings by Sex in Casper
Average Earnings in Casper are $41,468, $48,551 for men and $34,237 for women, a difference of 29.5%.
| Sex | Number | Average Earnings |
| Male | 17,780 (53.6%) | $48,551 |
| Female | 15,412 (46.4%) | $34,237 |
| Total | 33,192 (100.0%) | $41,468 |
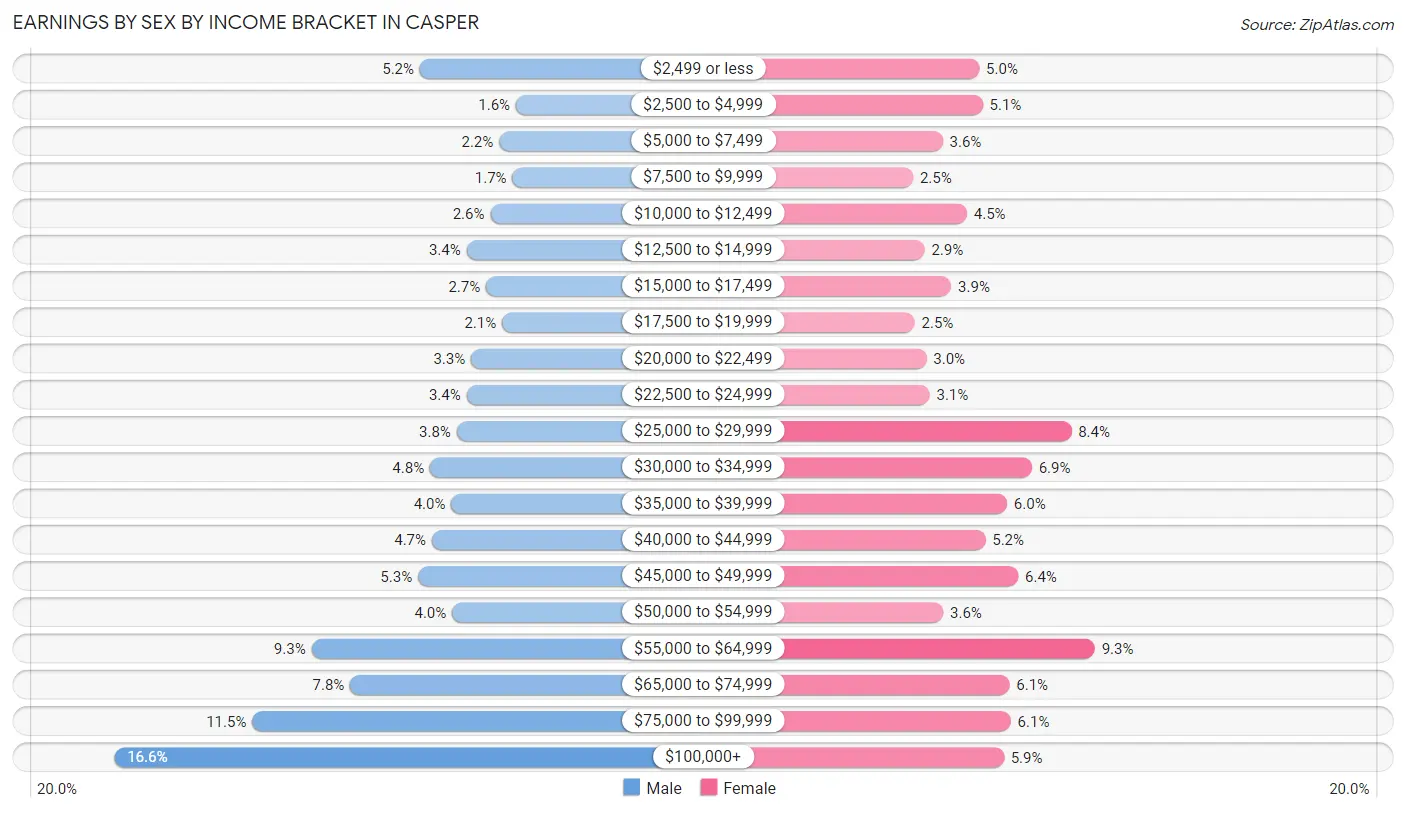
Earnings by Sex by Income Bracket in Casper
The most common earnings brackets in Casper are $100,000+ for men (2,958 | 16.6%) and $55,000 to $64,999 for women (1,432 | 9.3%).
| Income | Male | Female |
| $2,499 or less | 922 (5.2%) | 764 (5.0%) |
| $2,500 to $4,999 | 282 (1.6%) | 784 (5.1%) |
| $5,000 to $7,499 | 395 (2.2%) | 553 (3.6%) |
| $7,500 to $9,999 | 305 (1.7%) | 382 (2.5%) |
| $10,000 to $12,499 | 454 (2.5%) | 693 (4.5%) |
| $12,500 to $14,999 | 611 (3.4%) | 448 (2.9%) |
| $15,000 to $17,499 | 481 (2.7%) | 602 (3.9%) |
| $17,500 to $19,999 | 375 (2.1%) | 391 (2.5%) |
| $20,000 to $22,499 | 582 (3.3%) | 459 (3.0%) |
| $22,500 to $24,999 | 612 (3.4%) | 478 (3.1%) |
| $25,000 to $29,999 | 678 (3.8%) | 1,296 (8.4%) |
| $30,000 to $34,999 | 855 (4.8%) | 1,068 (6.9%) |
| $35,000 to $39,999 | 713 (4.0%) | 924 (6.0%) |
| $40,000 to $44,999 | 843 (4.7%) | 800 (5.2%) |
| $45,000 to $49,999 | 935 (5.3%) | 990 (6.4%) |
| $50,000 to $54,999 | 707 (4.0%) | 556 (3.6%) |
| $55,000 to $64,999 | 1,645 (9.2%) | 1,432 (9.3%) |
| $65,000 to $74,999 | 1,387 (7.8%) | 939 (6.1%) |
| $75,000 to $99,999 | 2,040 (11.5%) | 947 (6.1%) |
| $100,000+ | 2,958 (16.6%) | 906 (5.9%) |
| Total | 17,780 (100.0%) | 15,412 (100.0%) |
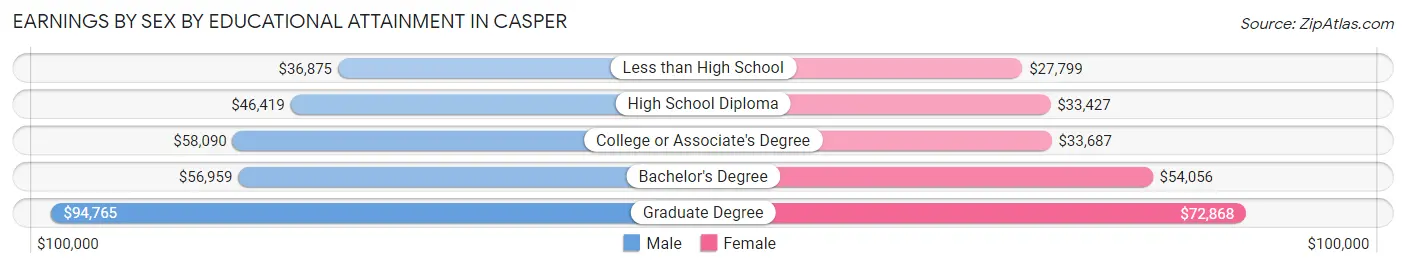
Earnings by Sex by Educational Attainment in Casper
Average earnings in Casper are $57,157 for men and $39,897 for women, a difference of 30.2%. Men with an educational attainment of graduate degree enjoy the highest average annual earnings of $94,765, while those with less than high school education earn the least with $36,875. Women with an educational attainment of graduate degree earn the most with the average annual earnings of $72,868, while those with less than high school education have the smallest earnings of $27,799.
| Educational Attainment | Male Income | Female Income |
| Less than High School | $36,875 | $27,799 |
| High School Diploma | $46,419 | $33,427 |
| College or Associate's Degree | $58,090 | $33,687 |
| Bachelor's Degree | $56,959 | $54,056 |
| Graduate Degree | $94,765 | $72,868 |
| Total | $57,157 | $39,897 |
Family Income in Casper
Family Income Brackets in Casper
According to the Casper family income data, there are 3,183 families falling into the $100,000 to $149,999 income range, which is the most common income bracket and makes up 21.4% of all families. Conversely, the $10,000 to $14,999 income bracket is the least frequent group with only 253 families (1.7%) belonging to this category.
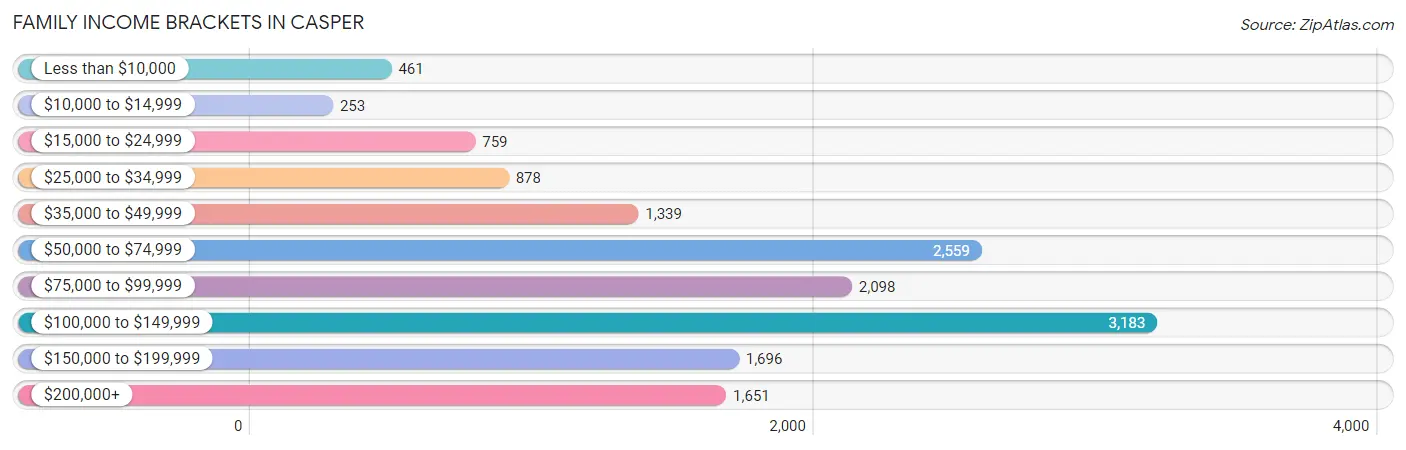
| Income Bracket | # Families | % Families |
| Less than $10,000 | 461 | 3.1% |
| $10,000 to $14,999 | 253 | 1.7% |
| $15,000 to $24,999 | 759 | 5.1% |
| $25,000 to $34,999 | 878 | 5.9% |
| $35,000 to $49,999 | 1,339 | 9.0% |
| $50,000 to $74,999 | 2,559 | 17.2% |
| $75,000 to $99,999 | 2,098 | 14.1% |
| $100,000 to $149,999 | 3,183 | 21.4% |
| $150,000 to $199,999 | 1,696 | 11.4% |
| $200,000+ | 1,651 | 11.1% |
Family Income by Famaliy Size in Casper
4-person families (2,354 | 15.8%) account for the highest median family income in Casper with $112,656 per family, while 2-person families (7,442 | 50.0%) have the highest median income of $39,860 per family member.
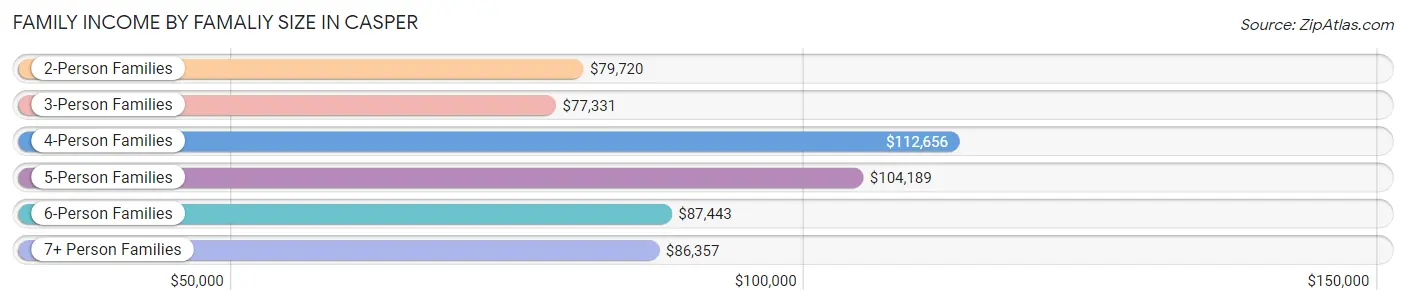
| Income Bracket | # Families | Median Income |
| 2-Person Families | 7,442 (50.0%) | $79,720 |
| 3-Person Families | 3,506 (23.6%) | $77,331 |
| 4-Person Families | 2,354 (15.8%) | $112,656 |
| 5-Person Families | 998 (6.7%) | $104,189 |
| 6-Person Families | 380 (2.5%) | $87,443 |
| 7+ Person Families | 196 (1.3%) | $86,357 |
| Total | 14,876 (100.0%) | $88,278 |
Family Income by Number of Earners in Casper
The median family income in Casper is $88,278, with families comprising 3+ earners (1,323) having the highest median family income of $138,717, while families with no earners (1,723) have the lowest median family income of $55,195, accounting for 8.9% and 11.6% of families, respectively.
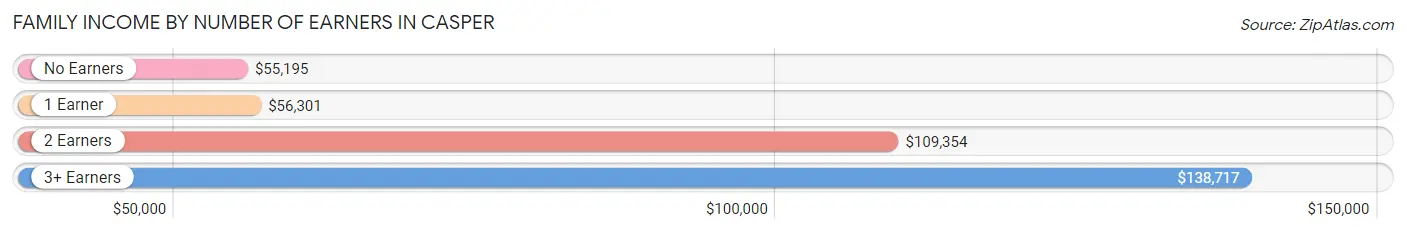
| Number of Earners | # Families | Median Income |
| No Earners | 1,723 (11.6%) | $55,195 |
| 1 Earner | 5,060 (34.0%) | $56,301 |
| 2 Earners | 6,770 (45.5%) | $109,354 |
| 3+ Earners | 1,323 (8.9%) | $138,717 |
| Total | 14,876 (100.0%) | $88,278 |
Household Income in Casper
Household Income Brackets in Casper
With 5,069 households falling in the category, the $50,000 to $74,999 income range is the most frequent in Casper, accounting for 20.2% of all households. In contrast, only 778 households (3.1%) fall into the $10,000 to $14,999 income bracket, making it the least populous group.
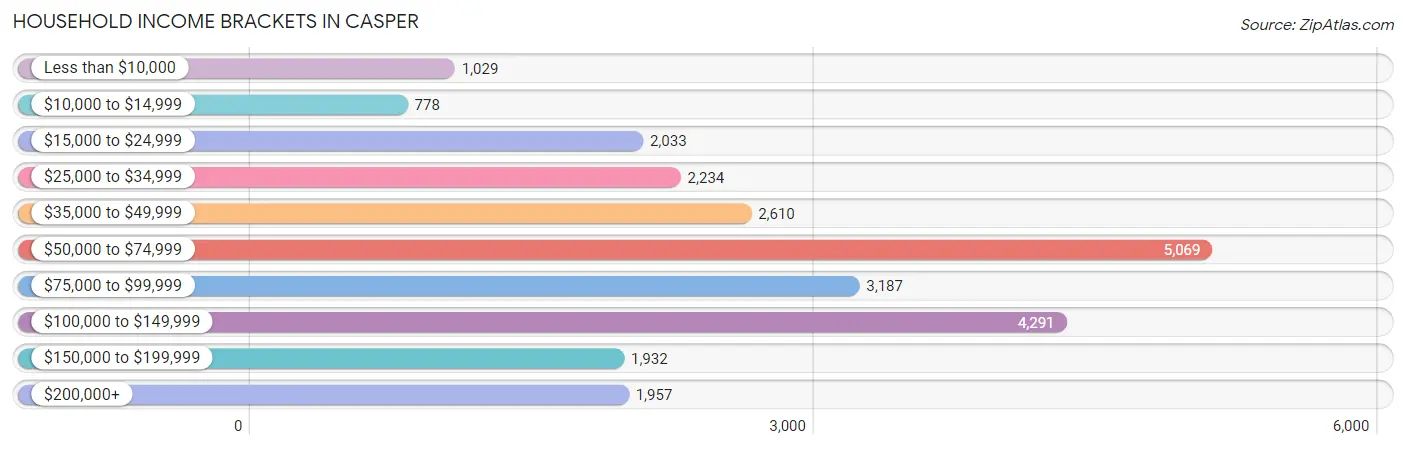
| Income Bracket | # Households | % Households |
| Less than $10,000 | 1,029 | 4.1% |
| $10,000 to $14,999 | 778 | 3.1% |
| $15,000 to $24,999 | 2,033 | 8.1% |
| $25,000 to $34,999 | 2,234 | 8.9% |
| $35,000 to $49,999 | 2,610 | 10.4% |
| $50,000 to $74,999 | 5,069 | 20.2% |
| $75,000 to $99,999 | 3,187 | 12.7% |
| $100,000 to $149,999 | 4,291 | 17.1% |
| $150,000 to $199,999 | 1,932 | 7.7% |
| $200,000+ | 1,957 | 7.8% |
Household Income by Householder Age in Casper
The median household income in Casper is $67,011, with the highest median household income of $93,839 found in the 45 to 64 years age bracket for the primary householder. A total of 7,848 households (31.3%) fall into this category. Meanwhile, the 15 to 24 years age bracket for the primary householder has the lowest median household income of $37,823, with 1,583 households (6.3%) in this group.
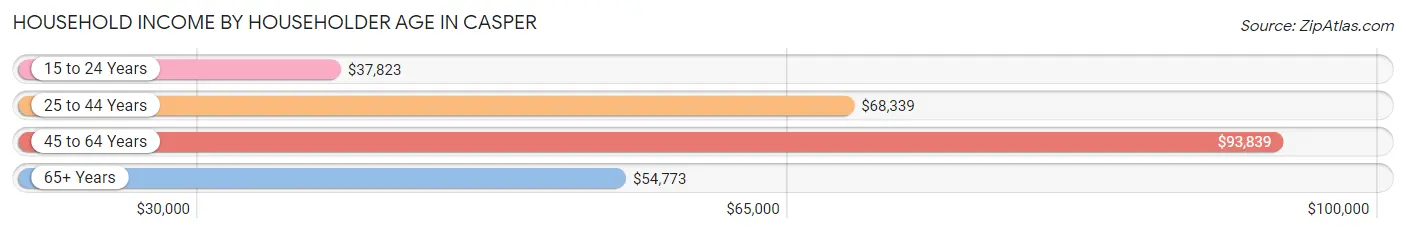
| Income Bracket | # Households | Median Income |
| 15 to 24 Years | 1,583 (6.3%) | $37,823 |
| 25 to 44 Years | 9,236 (36.8%) | $68,339 |
| 45 to 64 Years | 7,848 (31.3%) | $93,839 |
| 65+ Years | 6,429 (25.6%) | $54,773 |
| Total | 25,096 (100.0%) | $67,011 |
Poverty in Casper
Income Below Poverty by Sex and Age in Casper
With 9.1% poverty level for males and 12.1% for females among the residents of Casper, 5 year old males and 18 to 24 year old females are the most vulnerable to poverty, with 85 males (22.8%) and 682 females (30.1%) in their respective age groups living below the poverty level.
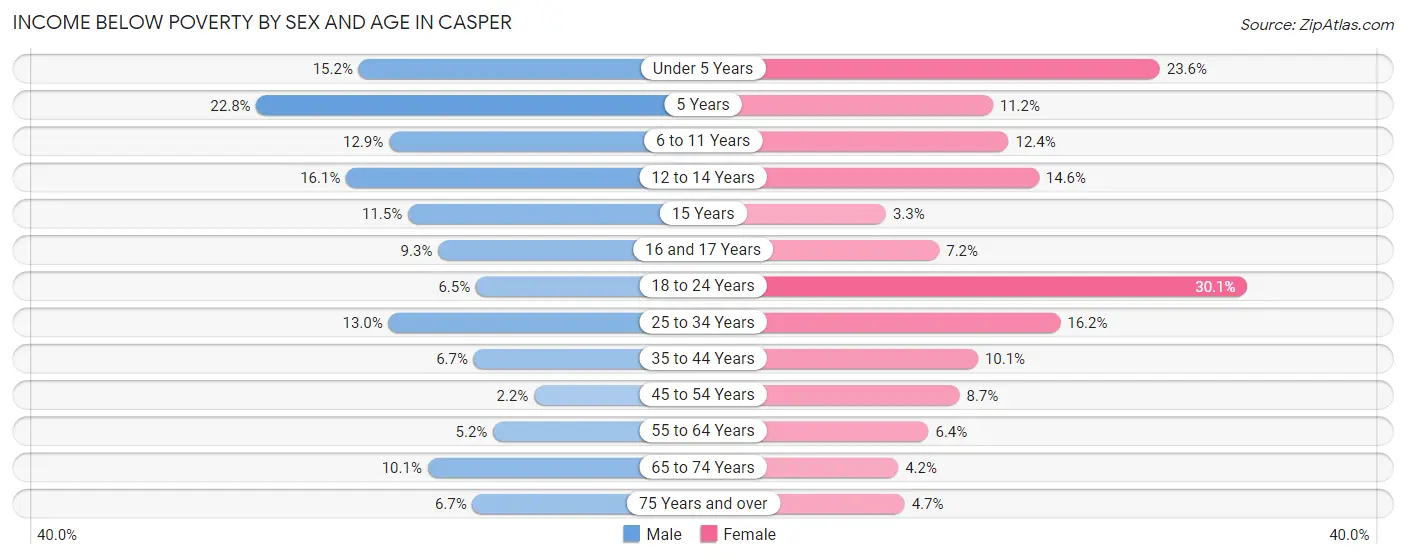
| Age Bracket | Male | Female |
| Under 5 Years | 299 (15.2%) | 471 (23.6%) |
| 5 Years | 85 (22.8%) | 25 (11.2%) |
| 6 to 11 Years | 309 (12.9%) | 276 (12.4%) |
| 12 to 14 Years | 211 (16.1%) | 164 (14.6%) |
| 15 Years | 37 (11.5%) | 15 (3.3%) |
| 16 and 17 Years | 82 (9.3%) | 51 (7.2%) |
| 18 to 24 Years | 170 (6.5%) | 682 (30.1%) |
| 25 to 34 Years | 571 (13.0%) | 672 (16.2%) |
| 35 to 44 Years | 265 (6.7%) | 389 (10.1%) |
| 45 to 54 Years | 70 (2.2%) | 281 (8.7%) |
| 55 to 64 Years | 173 (5.2%) | 220 (6.4%) |
| 65 to 74 Years | 267 (10.1%) | 120 (4.2%) |
| 75 Years and over | 94 (6.7%) | 104 (4.7%) |
| Total | 2,633 (9.1%) | 3,470 (12.1%) |
Income Above Poverty by Sex and Age in Casper
According to the poverty statistics in Casper, males aged 45 to 54 years and females aged 15 years are the age groups that are most secure financially, with 97.8% of males and 96.7% of females in these age groups living above the poverty line.
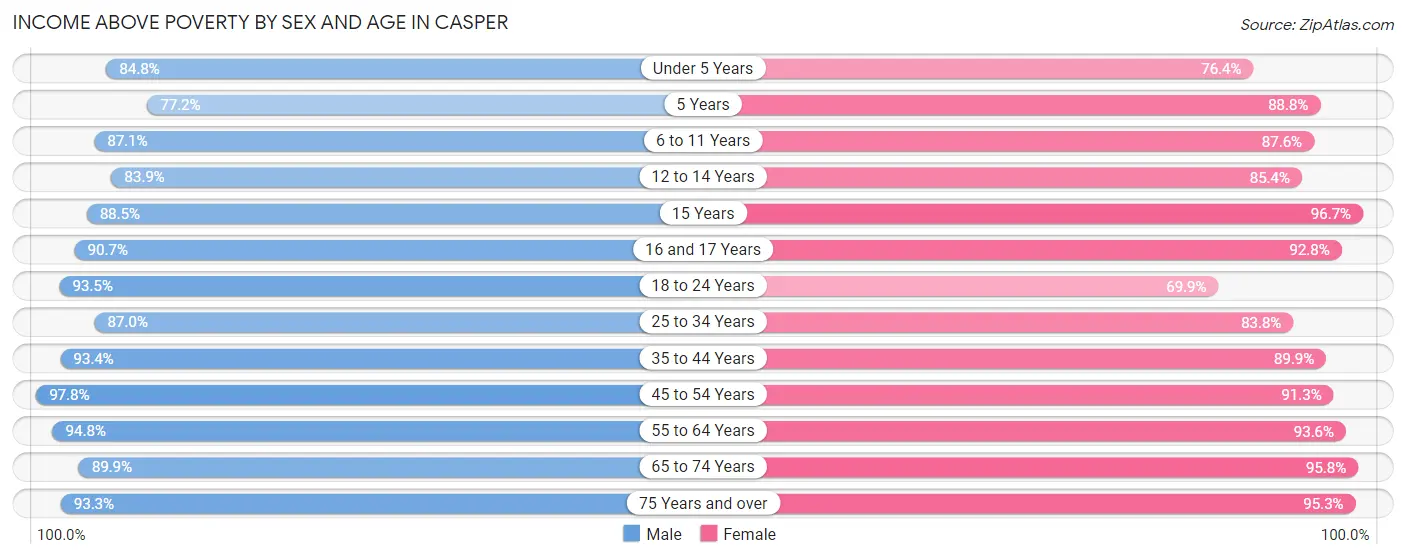
| Age Bracket | Male | Female |
| Under 5 Years | 1,670 (84.8%) | 1,524 (76.4%) |
| 5 Years | 288 (77.2%) | 198 (88.8%) |
| 6 to 11 Years | 2,079 (87.1%) | 1,953 (87.6%) |
| 12 to 14 Years | 1,098 (83.9%) | 957 (85.4%) |
| 15 Years | 284 (88.5%) | 443 (96.7%) |
| 16 and 17 Years | 801 (90.7%) | 653 (92.8%) |
| 18 to 24 Years | 2,453 (93.5%) | 1,583 (69.9%) |
| 25 to 34 Years | 3,827 (87.0%) | 3,470 (83.8%) |
| 35 to 44 Years | 3,722 (93.3%) | 3,458 (89.9%) |
| 45 to 54 Years | 3,151 (97.8%) | 2,934 (91.3%) |
| 55 to 64 Years | 3,147 (94.8%) | 3,196 (93.6%) |
| 65 to 74 Years | 2,384 (89.9%) | 2,747 (95.8%) |
| 75 Years and over | 1,301 (93.3%) | 2,125 (95.3%) |
| Total | 26,205 (90.9%) | 25,241 (87.9%) |
Income Below Poverty Among Married-Couple Families in Casper
The poverty statistics for married-couple families in Casper show that 3.1% or 338 of the total 10,895 families live below the poverty line. Families with 3 or 4 children have the highest poverty rate of 9.4%, comprising of 111 families. On the other hand, families with 5 or more children have the lowest poverty rate of 0.0%, which includes 0 families.
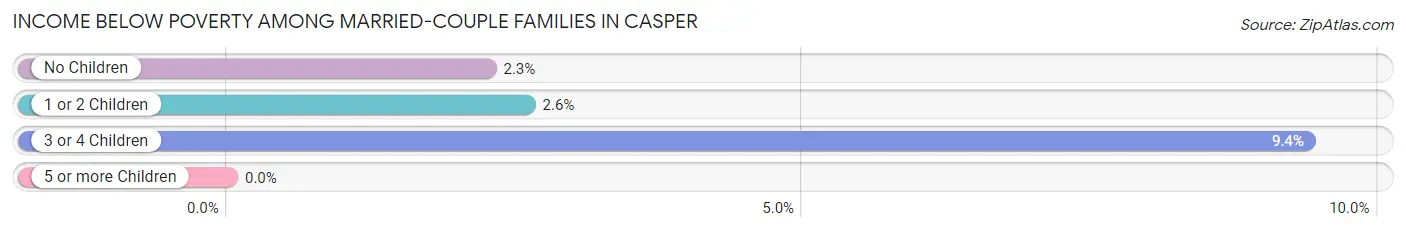
| Children | Above Poverty | Below Poverty |
| No Children | 6,353 (97.8%) | 146 (2.2%) |
| 1 or 2 Children | 3,044 (97.4%) | 81 (2.6%) |
| 3 or 4 Children | 1,073 (90.6%) | 111 (9.4%) |
| 5 or more Children | 87 (100.0%) | 0 (0.0%) |
| Total | 10,557 (96.9%) | 338 (3.1%) |
Income Below Poverty Among Single-Parent Households in Casper
According to the poverty data in Casper, 21.6% or 267 single-father households and 23.9% or 655 single-mother households are living below the poverty line. Among single-father households, those with 1 or 2 children have the highest poverty rate, with 244 households (30.8%) experiencing poverty. Likewise, among single-mother households, those with 3 or 4 children have the highest poverty rate, with 46 households (65.7%) falling below the poverty line.
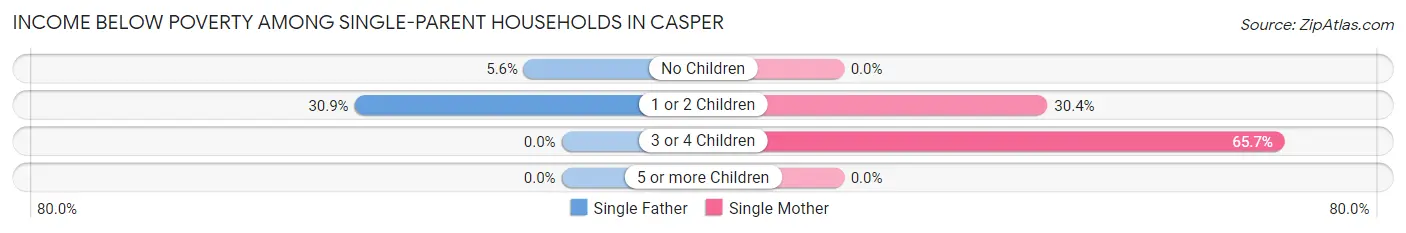
| Children | Single Father | Single Mother |
| No Children | 23 (5.6%) | 0 (0.0%) |
| 1 or 2 Children | 244 (30.8%) | 609 (30.4%) |
| 3 or 4 Children | 0 (0.0%) | 46 (65.7%) |
| 5 or more Children | 0 (0.0%) | 0 (0.0%) |
| Total | 267 (21.6%) | 655 (23.9%) |
Income Below Poverty Among Married-Couple vs Single-Parent Households in Casper
The poverty data for Casper shows that 338 of the married-couple family households (3.1%) and 922 of the single-parent households (23.2%) are living below the poverty level. Within the married-couple family households, those with 3 or 4 children have the highest poverty rate, with 111 households (9.4%) falling below the poverty line. Among the single-parent households, those with 3 or 4 children have the highest poverty rate, with 46 household (43.8%) living below poverty.
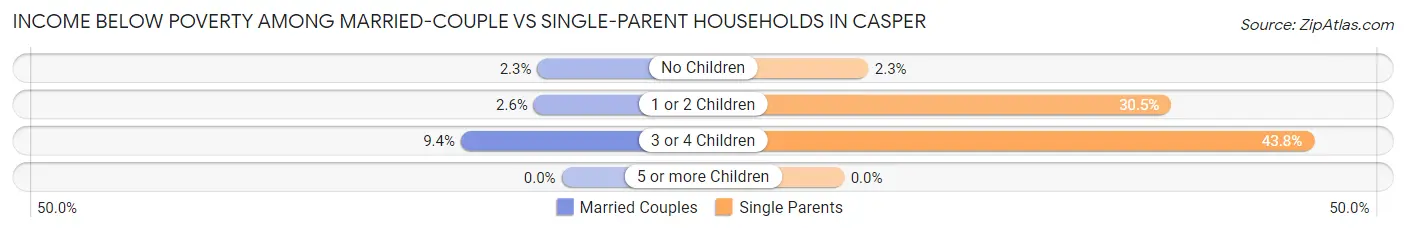
| Children | Married-Couple Families | Single-Parent Households |
| No Children | 146 (2.2%) | 23 (2.2%) |
| 1 or 2 Children | 81 (2.6%) | 853 (30.5%) |
| 3 or 4 Children | 111 (9.4%) | 46 (43.8%) |
| 5 or more Children | 0 (0.0%) | 0 (0.0%) |
| Total | 338 (3.1%) | 922 (23.2%) |
Race in Casper
The most populous races in Casper are White / Caucasian (53,776 | 91.7%), Hispanic or Latino (5,241 | 8.9%), and Two or more Races (2,719 | 4.6%).
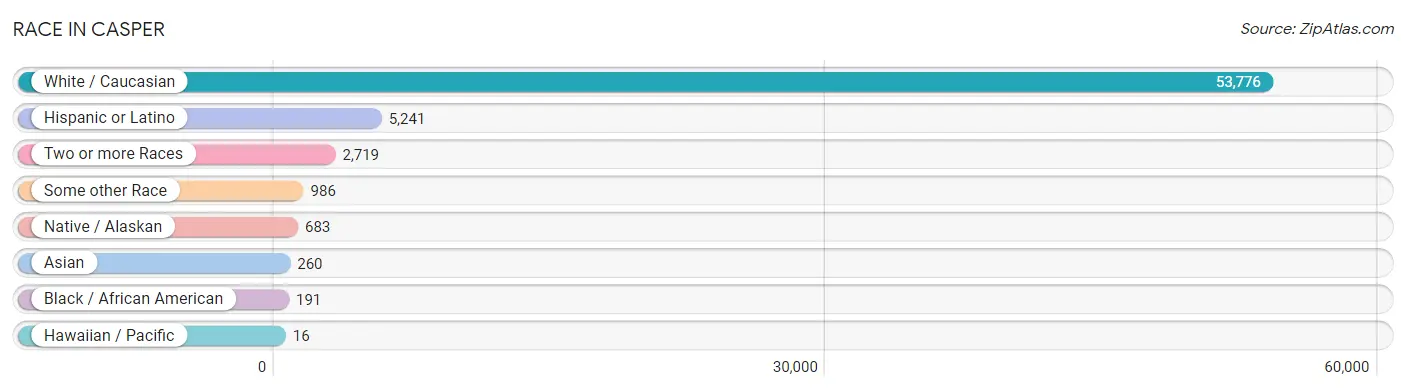
| Race | # Population | % Population |
| Asian | 260 | 0.4% |
| Black / African American | 191 | 0.3% |
| Hawaiian / Pacific | 16 | 0.0% |
| Hispanic or Latino | 5,241 | 8.9% |
| Native / Alaskan | 683 | 1.2% |
| White / Caucasian | 53,776 | 91.7% |
| Two or more Races | 2,719 | 4.6% |
| Some other Race | 986 | 1.7% |
| Total | 58,631 | 100.0% |
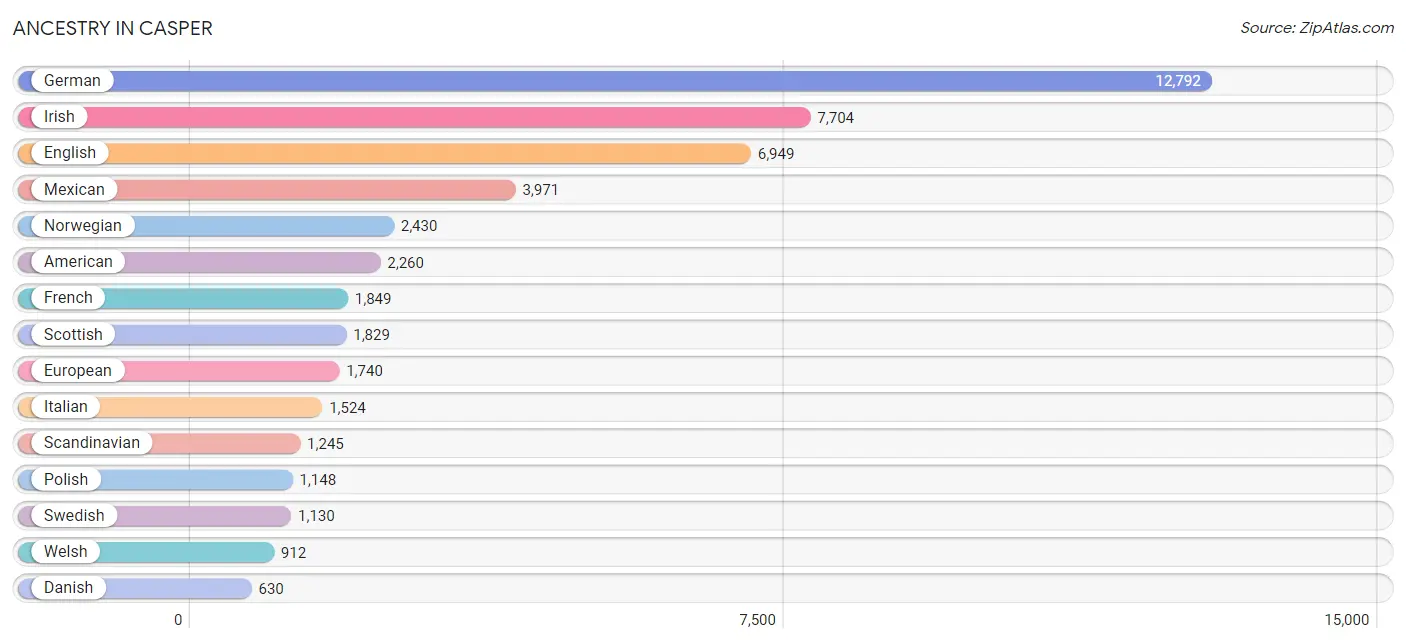
Ancestry in Casper
The most populous ancestries reported in Casper are German (12,792 | 21.8%), Irish (7,704 | 13.1%), English (6,949 | 11.8%), Mexican (3,971 | 6.8%), and Norwegian (2,430 | 4.1%), together accounting for 57.7% of all Casper residents.
| Ancestry | # Population | % Population |
| African | 12 | 0.0% |
| Alaska Native | 5 | 0.0% |
| American | 2,260 | 3.8% |
| Arab | 49 | 0.1% |
| Arapaho | 83 | 0.1% |
| Austrian | 318 | 0.5% |
| Belgian | 211 | 0.4% |
| Belizean | 73 | 0.1% |
| Bhutanese | 352 | 0.6% |
| Blackfeet | 52 | 0.1% |
| British | 535 | 0.9% |
| Burmese | 97 | 0.2% |
| Canadian | 87 | 0.2% |
| Celtic | 22 | 0.0% |
| Central American | 56 | 0.1% |
| Central American Indian | 14 | 0.0% |
| Cherokee | 122 | 0.2% |
| Cheyenne | 3 | 0.0% |
| Chickasaw | 13 | 0.0% |
| Chinese | 38 | 0.1% |
| Chippewa | 10 | 0.0% |
| Colombian | 11 | 0.0% |
| Cree | 32 | 0.1% |
| Croatian | 108 | 0.2% |
| Cuban | 83 | 0.1% |
| Czech | 345 | 0.6% |
| Czechoslovakian | 31 | 0.1% |
| Danish | 630 | 1.1% |
| Dominican | 34 | 0.1% |
| Dutch | 516 | 0.9% |
| Eastern European | 307 | 0.5% |
| English | 6,949 | 11.8% |
| European | 1,740 | 3.0% |
| Finnish | 183 | 0.3% |
| French | 1,849 | 3.2% |
| French American Indian | 5 | 0.0% |
| French Canadian | 228 | 0.4% |
| German | 12,792 | 21.8% |
| Greek | 219 | 0.4% |
| Guatemalan | 9 | 0.0% |
| Hungarian | 119 | 0.2% |
| Icelander | 34 | 0.1% |
| Indian (Asian) | 43 | 0.1% |
| Irish | 7,704 | 13.1% |
| Italian | 1,524 | 2.6% |
| Korean | 227 | 0.4% |
| Latvian | 41 | 0.1% |
| Lithuanian | 126 | 0.2% |
| Mexican | 3,971 | 6.8% |
| Mexican American Indian | 14 | 0.0% |
| Native Hawaiian | 144 | 0.3% |
| Navajo | 58 | 0.1% |
| Nicaraguan | 6 | 0.0% |
| Nigerian | 17 | 0.0% |
| Northern European | 161 | 0.3% |
| Norwegian | 2,430 | 4.1% |
| Osage | 25 | 0.0% |
| Ottawa | 11 | 0.0% |
| Pakistani | 7 | 0.0% |
| Pennsylvania German | 20 | 0.0% |
| Polish | 1,148 | 2.0% |
| Portuguese | 51 | 0.1% |
| Puerto Rican | 167 | 0.3% |
| Russian | 290 | 0.5% |
| Salvadoran | 41 | 0.1% |
| Samoan | 20 | 0.0% |
| Scandinavian | 1,245 | 2.1% |
| Scotch-Irish | 465 | 0.8% |
| Scottish | 1,829 | 3.1% |
| Seminole | 8 | 0.0% |
| Serbian | 76 | 0.1% |
| Shoshone | 50 | 0.1% |
| Sioux | 158 | 0.3% |
| Slavic | 45 | 0.1% |
| Slovak | 23 | 0.0% |
| Slovene | 15 | 0.0% |
| South American | 11 | 0.0% |
| Spaniard | 91 | 0.2% |
| Spanish | 344 | 0.6% |
| Subsaharan African | 29 | 0.1% |
| Swedish | 1,130 | 1.9% |
| Swiss | 87 | 0.2% |
| Thai | 45 | 0.1% |
| Ukrainian | 14 | 0.0% |
| Welsh | 912 | 1.6% |
| Yugoslavian | 197 | 0.3% |
| Yup'ik | 11 | 0.0% | View All 87 Rows |
Immigrants in Casper
The most numerous immigrant groups reported in Casper came from Central America (553 | 0.9%), Latin America (553 | 0.9%), Mexico (489 | 0.8%), Europe (279 | 0.5%), and Asia (215 | 0.4%), together accounting for 3.6% of all Casper residents.
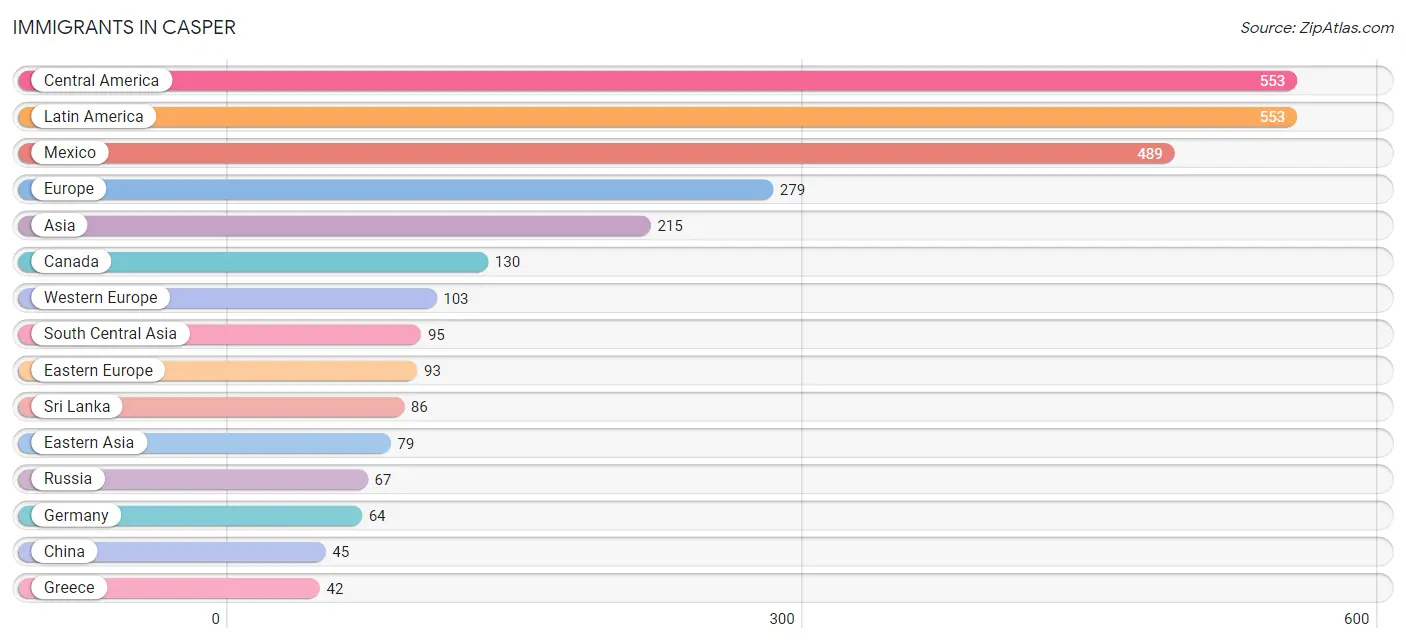
| Immigration Origin | # Population | % Population |
| Africa | 6 | 0.0% |
| Asia | 215 | 0.4% |
| Australia | 9 | 0.0% |
| Canada | 130 | 0.2% |
| Central America | 553 | 0.9% |
| China | 45 | 0.1% |
| Costa Rica | 32 | 0.1% |
| Croatia | 26 | 0.0% |
| Denmark | 12 | 0.0% |
| Eastern Asia | 79 | 0.1% |
| Eastern Europe | 93 | 0.2% |
| El Salvador | 17 | 0.0% |
| England | 29 | 0.1% |
| Europe | 279 | 0.5% |
| France | 39 | 0.1% |
| Germany | 64 | 0.1% |
| Greece | 42 | 0.1% |
| Guatemala | 11 | 0.0% |
| Hong Kong | 11 | 0.0% |
| India | 9 | 0.0% |
| Japan | 25 | 0.0% |
| Korea | 9 | 0.0% |
| Latin America | 553 | 0.9% |
| Mexico | 489 | 0.8% |
| Morocco | 6 | 0.0% |
| Northern Africa | 6 | 0.0% |
| Northern Europe | 41 | 0.1% |
| Oceania | 9 | 0.0% |
| Panama | 4 | 0.0% |
| Philippines | 41 | 0.1% |
| Russia | 67 | 0.1% |
| South Central Asia | 95 | 0.2% |
| South Eastern Asia | 41 | 0.1% |
| Southern Europe | 42 | 0.1% |
| Sri Lanka | 86 | 0.2% |
| Western Europe | 103 | 0.2% | View All 36 Rows |
Sex and Age in Casper
Sex and Age in Casper
The most populous age groups in Casper are 30 to 34 Years (2,437 | 8.3%) for men and 30 to 34 Years (2,199 | 7.5%) for women.
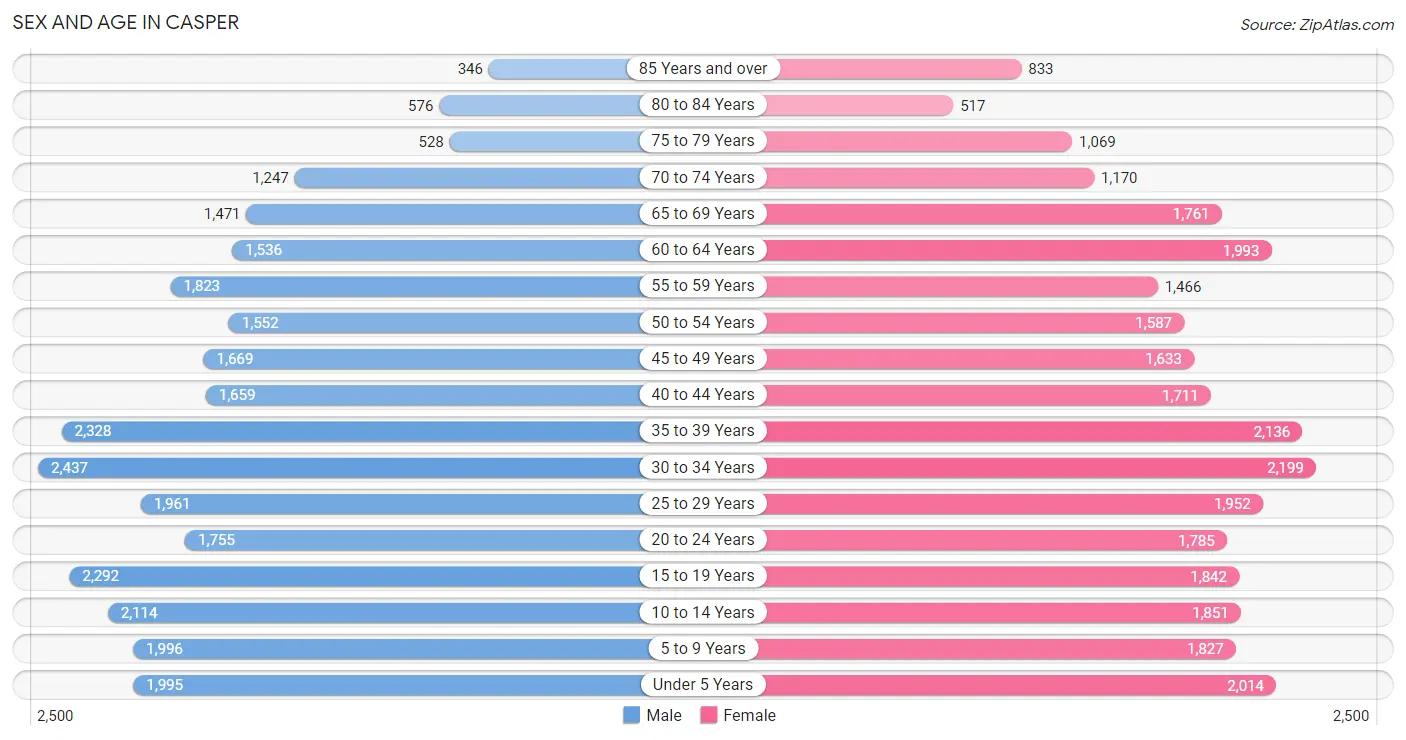
| Age Bracket | Male | Female |
| Under 5 Years | 1,995 (6.8%) | 2,014 (6.9%) |
| 5 to 9 Years | 1,996 (6.8%) | 1,827 (6.2%) |
| 10 to 14 Years | 2,114 (7.2%) | 1,851 (6.3%) |
| 15 to 19 Years | 2,292 (7.8%) | 1,842 (6.3%) |
| 20 to 24 Years | 1,755 (6.0%) | 1,785 (6.1%) |
| 25 to 29 Years | 1,961 (6.7%) | 1,952 (6.7%) |
| 30 to 34 Years | 2,437 (8.3%) | 2,199 (7.5%) |
| 35 to 39 Years | 2,328 (8.0%) | 2,136 (7.3%) |
| 40 to 44 Years | 1,659 (5.7%) | 1,711 (5.8%) |
| 45 to 49 Years | 1,669 (5.7%) | 1,633 (5.6%) |
| 50 to 54 Years | 1,552 (5.3%) | 1,587 (5.4%) |
| 55 to 59 Years | 1,823 (6.2%) | 1,466 (5.0%) |
| 60 to 64 Years | 1,536 (5.2%) | 1,993 (6.8%) |
| 65 to 69 Years | 1,471 (5.0%) | 1,761 (6.0%) |
| 70 to 74 Years | 1,247 (4.3%) | 1,170 (4.0%) |
| 75 to 79 Years | 528 (1.8%) | 1,069 (3.6%) |
| 80 to 84 Years | 576 (2.0%) | 517 (1.8%) |
| 85 Years and over | 346 (1.2%) | 833 (2.8%) |
| Total | 29,285 (100.0%) | 29,346 (100.0%) |
Families and Households in Casper
Median Family Size in Casper
The median family size in Casper is 2.97 persons per family, with married-couple families (10,895 | 73.2%) accounting for the largest median family size of 3.07 persons per family. On the other hand, single male/father families (1,237 | 8.3%) represent the smallest median family size with 2.52 persons per family.
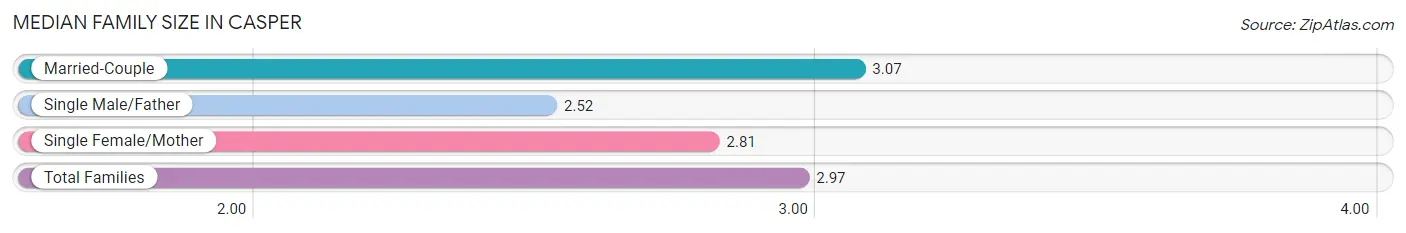
| Family Type | # Families | Family Size |
| Married-Couple | 10,895 (73.2%) | 3.07 |
| Single Male/Father | 1,237 (8.3%) | 2.52 |
| Single Female/Mother | 2,744 (18.4%) | 2.81 |
| Total Families | 14,876 (100.0%) | 2.97 |
Median Household Size in Casper
The median household size in Casper is 2.29 persons per household, with married-couple households (10,895 | 43.4%) accounting for the largest median household size of 3.07 persons per household. non-family households (10,220 | 40.7%) represent the smallest median household size with 1.21 persons per household.
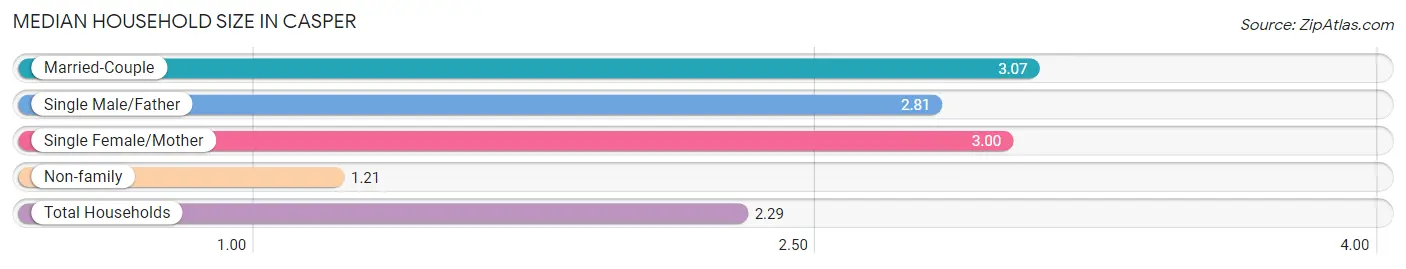
| Household Type | # Households | Household Size |
| Married-Couple | 10,895 (43.4%) | 3.07 |
| Single Male/Father | 1,237 (4.9%) | 2.81 |
| Single Female/Mother | 2,744 (10.9%) | 3.00 |
| Non-family | 10,220 (40.7%) | 1.21 |
| Total Households | 25,096 (100.0%) | 2.29 |
Household Size by Marriage Status in Casper
Out of a total of 25,096 households in Casper, 14,876 (59.3%) are family households, while 10,220 (40.7%) are nonfamily households. The most numerous type of family households are 2-person households, comprising 6,939, and the most common type of nonfamily households are 1-person households, comprising 8,519.
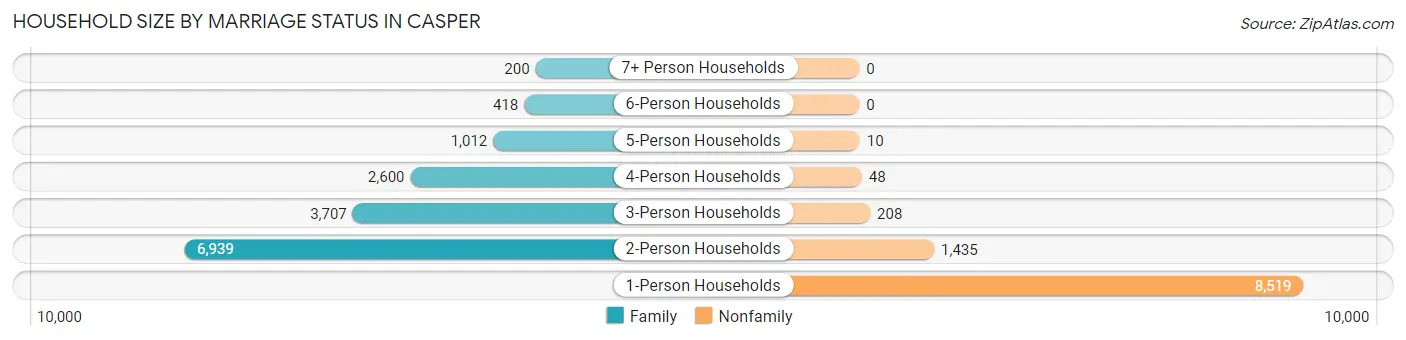
| Household Size | Family Households | Nonfamily Households |
| 1-Person Households | - | 8,519 (34.0%) |
| 2-Person Households | 6,939 (27.7%) | 1,435 (5.7%) |
| 3-Person Households | 3,707 (14.8%) | 208 (0.8%) |
| 4-Person Households | 2,600 (10.4%) | 48 (0.2%) |
| 5-Person Households | 1,012 (4.0%) | 10 (0.0%) |
| 6-Person Households | 418 (1.7%) | 0 (0.0%) |
| 7+ Person Households | 200 (0.8%) | 0 (0.0%) |
| Total | 14,876 (59.3%) | 10,220 (40.7%) |
Female Fertility in Casper
Fertility by Age in Casper
Average fertility rate in Casper is 67.0 births per 1,000 women. Women in the age bracket of 20 to 34 years have the highest fertility rate with 111.0 births per 1,000 women. Women in the age bracket of 20 to 34 years acount for 72.1% of all women with births.
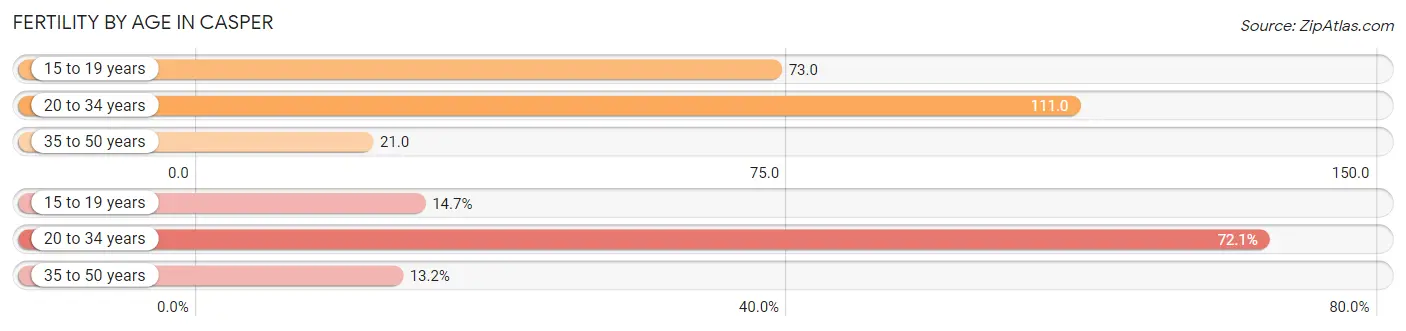
| Age Bracket | Women with Births | Births / 1,000 Women |
| 15 to 19 years | 135 (14.7%) | 73.0 |
| 20 to 34 years | 660 (72.1%) | 111.0 |
| 35 to 50 years | 121 (13.2%) | 21.0 |
| Total | 916 (100.0%) | 67.0 |
Fertility by Age by Marriage Status in Casper
70.4% of women with births (916) in Casper are married. The highest percentage of unmarried women with births falls into 15 to 19 years age bracket with 100.0% of them unmarried at the time of birth, while the lowest percentage of unmarried women with births belong to 35 to 50 years age bracket with 0.0% of them unmarried.
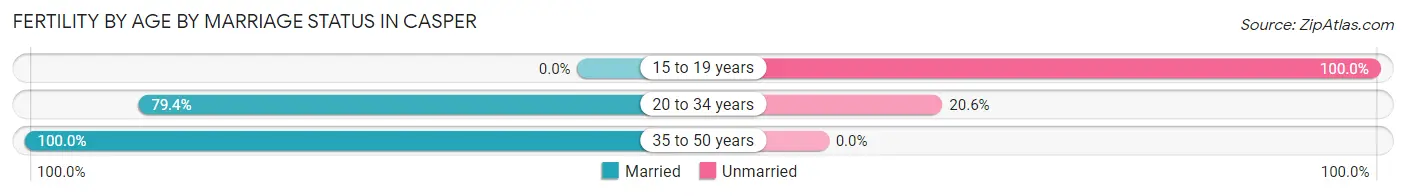
| Age Bracket | Married | Unmarried |
| 15 to 19 years | 0 (0.0%) | 135 (100.0%) |
| 20 to 34 years | 524 (79.4%) | 136 (20.6%) |
| 35 to 50 years | 121 (100.0%) | 0 (0.0%) |
| Total | 645 (70.4%) | 271 (29.6%) |
Fertility by Education in Casper
Average fertility rate in Casper is 67.0 births per 1,000 women. Women with the education attainment of less than high school have the highest fertility rate of 97.0 births per 1,000 women, while women with the education attainment of graduate degree have the lowest fertility at 28.0 births per 1,000 women. Women with the education attainment of high school diploma represent 28.4% of all women with births.
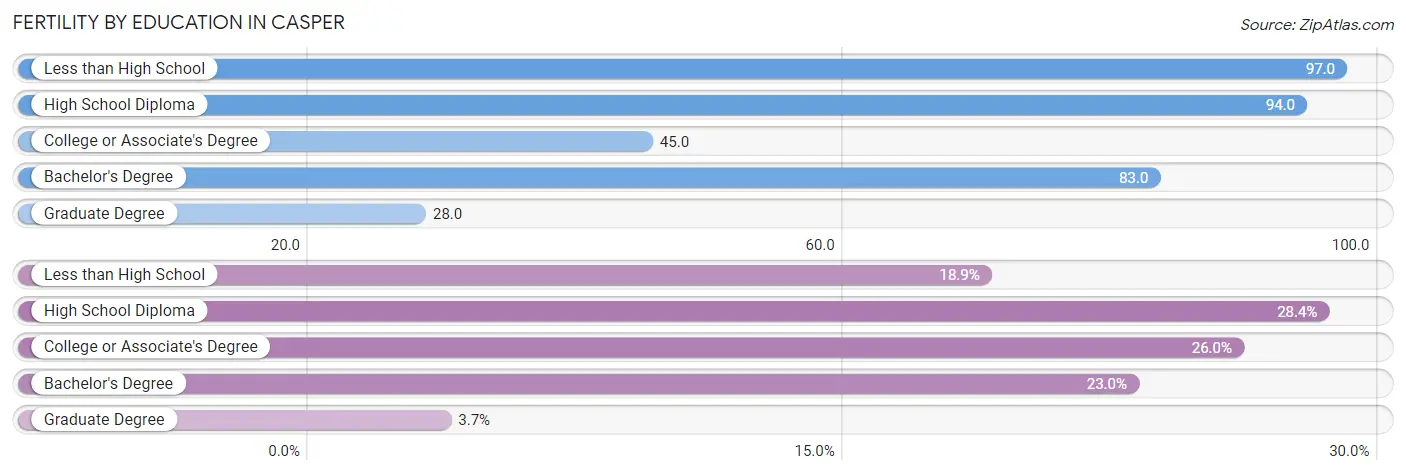
| Educational Attainment | Women with Births | Births / 1,000 Women |
| Less than High School | 173 (18.9%) | 97.0 |
| High School Diploma | 260 (28.4%) | 94.0 |
| College or Associate's Degree | 238 (26.0%) | 45.0 |
| Bachelor's Degree | 211 (23.0%) | 83.0 |
| Graduate Degree | 34 (3.7%) | 28.0 |
| Total | 916 (100.0%) | 67.0 |
Fertility by Education by Marriage Status in Casper
29.6% of women with births in Casper are unmarried. Women with the educational attainment of bachelor's degree are most likely to be married with 100.0% of them married at childbirth, while women with the educational attainment of less than high school are least likely to be married with 92.5% of them unmarried at childbirth.
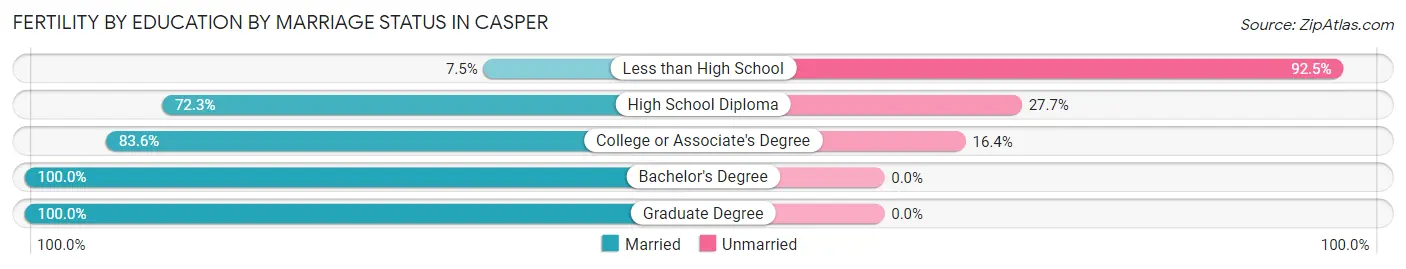
| Educational Attainment | Married | Unmarried |
| Less than High School | 13 (7.5%) | 160 (92.5%) |
| High School Diploma | 188 (72.3%) | 72 (27.7%) |
| College or Associate's Degree | 199 (83.6%) | 39 (16.4%) |
| Bachelor's Degree | 211 (100.0%) | 0 (0.0%) |
| Graduate Degree | 34 (100.0%) | 0 (0.0%) |
| Total | 645 (70.4%) | 271 (29.6%) |
Employment Characteristics in Casper
Employment by Class of Employer in Casper
Among the 30,155 employed individuals in Casper, private company employees (19,678 | 65.3%), local government employees (2,903 | 9.6%), and not-for-profit organizations (2,227 | 7.4%) make up the most common classes of employment.
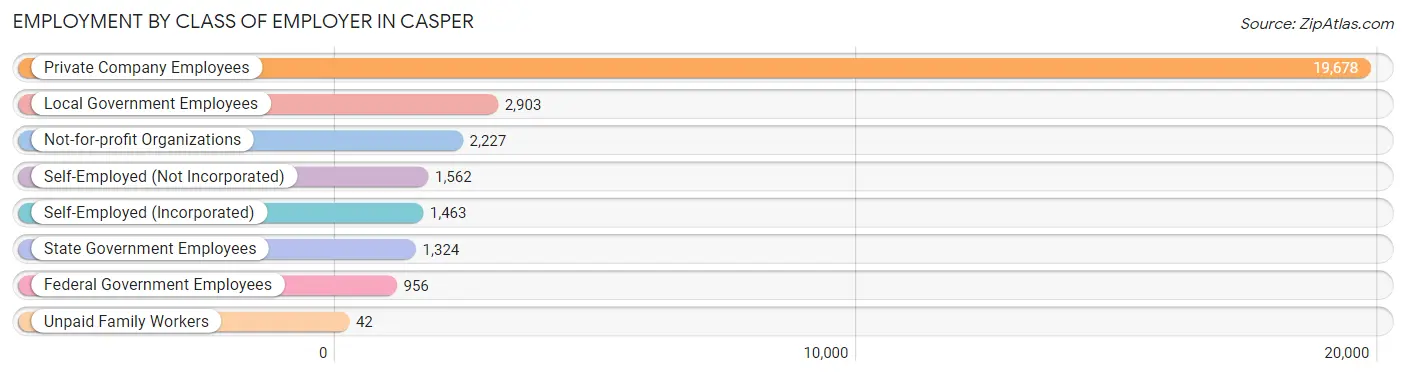
| Employer Class | # Employees | % Employees |
| Private Company Employees | 19,678 | 65.3% |
| Self-Employed (Incorporated) | 1,463 | 4.9% |
| Self-Employed (Not Incorporated) | 1,562 | 5.2% |
| Not-for-profit Organizations | 2,227 | 7.4% |
| Local Government Employees | 2,903 | 9.6% |
| State Government Employees | 1,324 | 4.4% |
| Federal Government Employees | 956 | 3.2% |
| Unpaid Family Workers | 42 | 0.1% |
| Total | 30,155 | 100.0% |
Employment Status by Age in Casper
According to the labor force statistics for Casper, out of the total population over 16 years of age (46,052), 68.5% or 31,546 individuals are in the labor force, with 3.3% or 1,041 of them unemployed. The age group with the highest labor force participation rate is 35 to 44 years, with 92.8% or 7,270 individuals in the labor force. Within the labor force, the 20 to 24 years age range has the highest percentage of unemployed individuals, with 7.8% or 222 of them being unemployed.
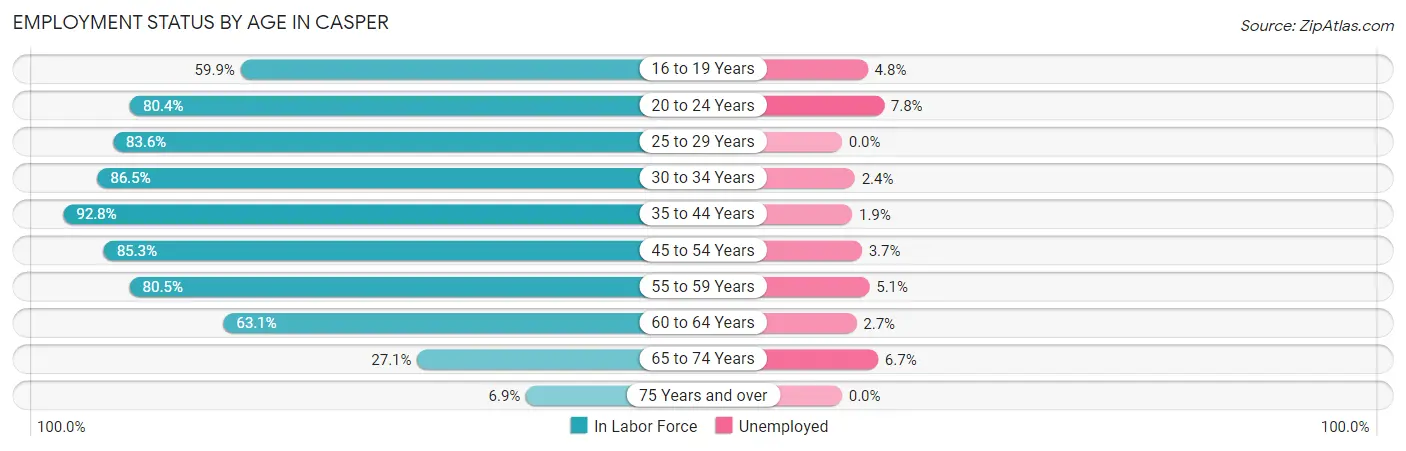
| Age Bracket | In Labor Force | Unemployed |
| 16 to 19 Years | 2,008 (59.9%) | 96 (4.8%) |
| 20 to 24 Years | 2,846 (80.4%) | 222 (7.8%) |
| 25 to 29 Years | 3,271 (83.6%) | 0 (0.0%) |
| 30 to 34 Years | 4,010 (86.5%) | 96 (2.4%) |
| 35 to 44 Years | 7,270 (92.8%) | 138 (1.9%) |
| 45 to 54 Years | 5,494 (85.3%) | 203 (3.7%) |
| 55 to 59 Years | 2,648 (80.5%) | 135 (5.1%) |
| 60 to 64 Years | 2,227 (63.1%) | 60 (2.7%) |
| 65 to 74 Years | 1,531 (27.1%) | 103 (6.7%) |
| 75 Years and over | 267 (6.9%) | 0 (0.0%) |
| Total | 31,546 (68.5%) | 1,041 (3.3%) |
Employment Status by Educational Attainment in Casper
According to labor force statistics for Casper, 84.1% of individuals (24,929) out of the total population between 25 and 64 years of age (29,642) are in the labor force, with 2.5% or 623 of them being unemployed. The group with the highest labor force participation rate are those with the educational attainment of bachelor's degree or higher, with 87.6% or 7,493 individuals in the labor force. Within the labor force, individuals with less than high school education have the highest percentage of unemployment, with 4.1% or 46 of them being unemployed.
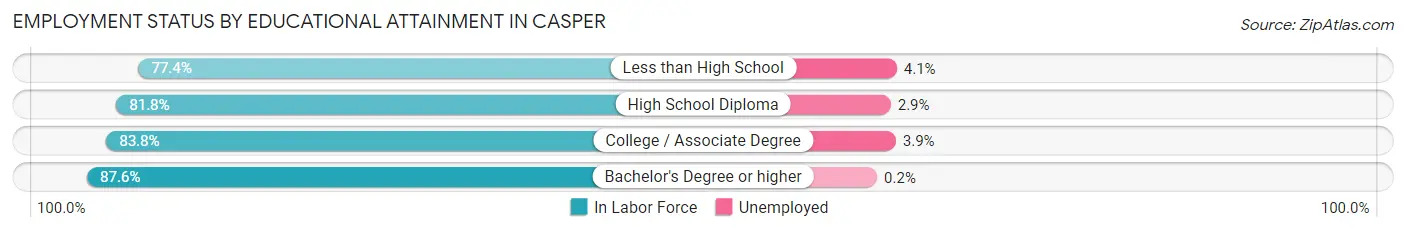
| Educational Attainment | In Labor Force | Unemployed |
| Less than High School | 1,117 (77.4%) | 59 (4.1%) |
| High School Diploma | 6,315 (81.8%) | 224 (2.9%) |
| College / Associate Degree | 9,993 (83.8%) | 465 (3.9%) |
| Bachelor's Degree or higher | 7,493 (87.6%) | 17 (0.2%) |
| Total | 24,929 (84.1%) | 741 (2.5%) |
Employment Occupations by Sex in Casper
Management, Business, Science and Arts Occupations
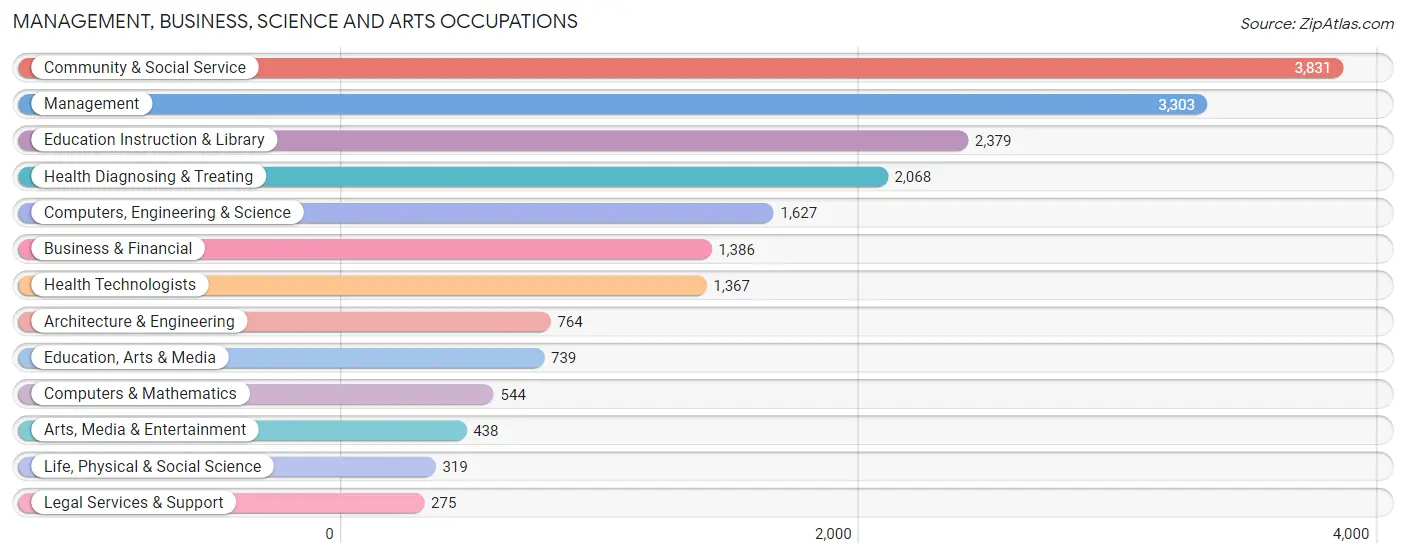
The most common Management, Business, Science and Arts occupations in Casper are Community & Social Service (3,831 | 12.6%), Management (3,303 | 10.9%), Education Instruction & Library (2,379 | 7.8%), Health Diagnosing & Treating (2,068 | 6.8%), and Computers, Engineering & Science (1,627 | 5.3%).
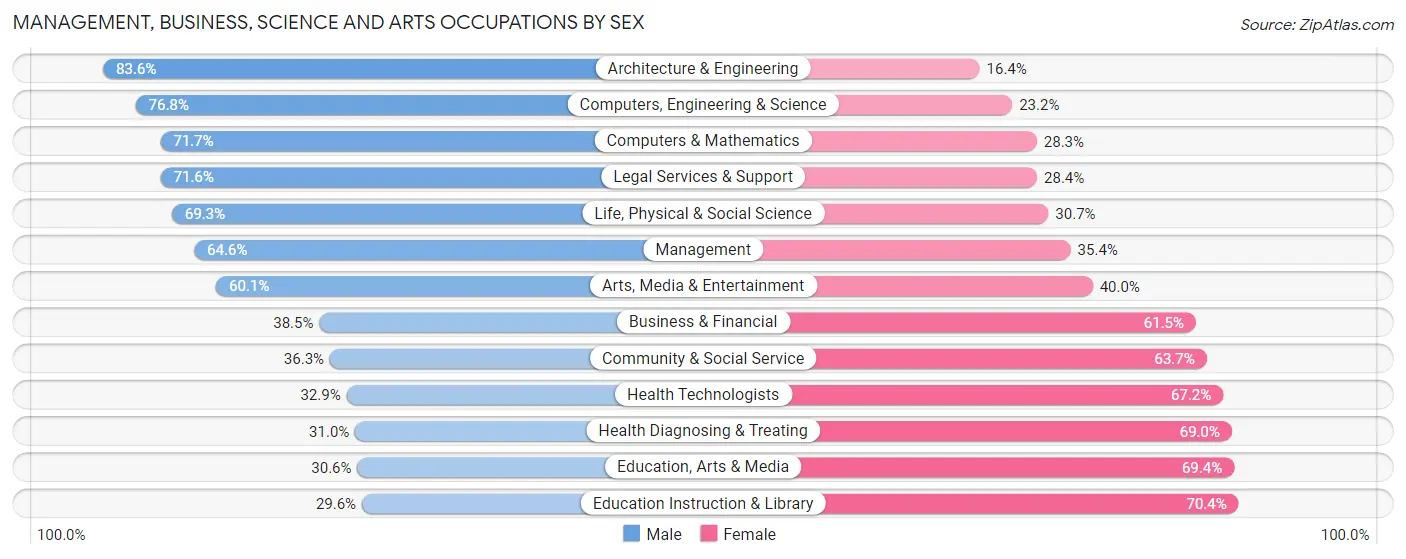
Management, Business, Science and Arts Occupations by Sex
Within the Management, Business, Science and Arts occupations in Casper, the most male-oriented occupations are Architecture & Engineering (83.6%), Computers, Engineering & Science (76.8%), and Computers & Mathematics (71.7%), while the most female-oriented occupations are Education Instruction & Library (70.4%), Education, Arts & Media (69.4%), and Health Diagnosing & Treating (69.0%).
| Occupation | Male | Female |
| Management | 2,135 (64.6%) | 1,168 (35.4%) |
| Business & Financial | 534 (38.5%) | 852 (61.5%) |
| Computers, Engineering & Science | 1,250 (76.8%) | 377 (23.2%) |
| Computers & Mathematics | 390 (71.7%) | 154 (28.3%) |
| Architecture & Engineering | 639 (83.6%) | 125 (16.4%) |
| Life, Physical & Social Science | 221 (69.3%) | 98 (30.7%) |
| Community & Social Service | 1,391 (36.3%) | 2,440 (63.7%) |
| Education, Arts & Media | 226 (30.6%) | 513 (69.4%) |
| Legal Services & Support | 197 (71.6%) | 78 (28.4%) |
| Education Instruction & Library | 705 (29.6%) | 1,674 (70.4%) |
| Arts, Media & Entertainment | 263 (60.1%) | 175 (40.0%) |
| Health Diagnosing & Treating | 642 (31.0%) | 1,426 (69.0%) |
| Health Technologists | 449 (32.9%) | 918 (67.1%) |
| Total (Category) | 5,952 (48.7%) | 6,263 (51.3%) |
| Total (Overall) | 16,323 (53.7%) | 14,069 (46.3%) |
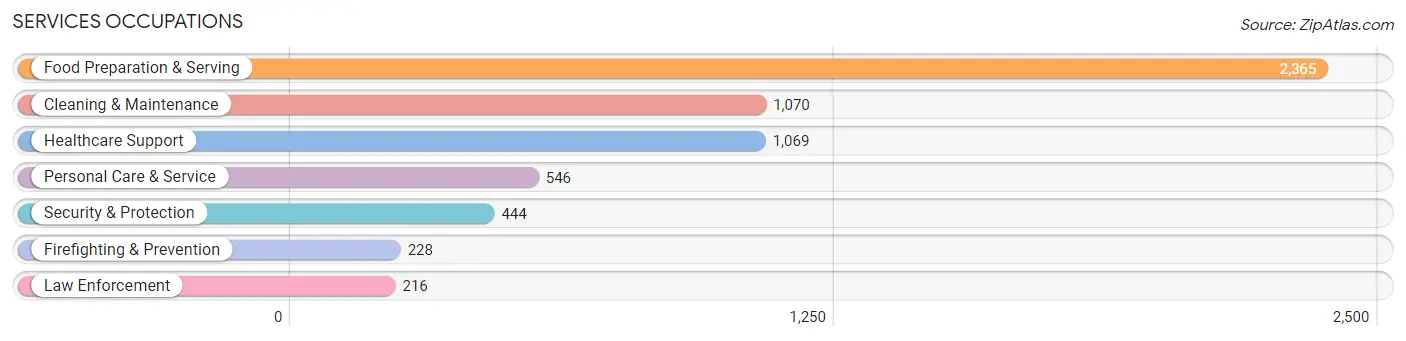
Services Occupations
The most common Services occupations in Casper are Food Preparation & Serving (2,365 | 7.8%), Cleaning & Maintenance (1,070 | 3.5%), Healthcare Support (1,069 | 3.5%), Personal Care & Service (546 | 1.8%), and Security & Protection (444 | 1.5%).
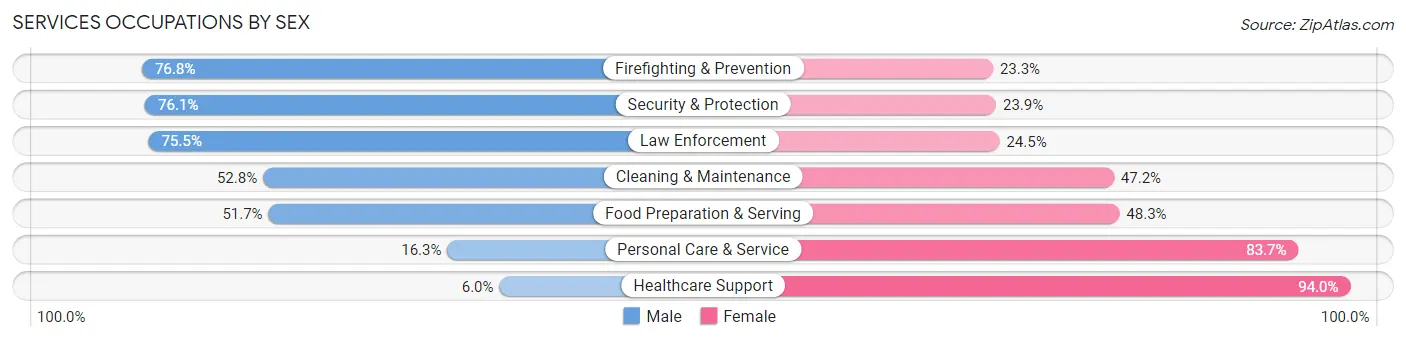
Services Occupations by Sex
Within the Services occupations in Casper, the most male-oriented occupations are Firefighting & Prevention (76.7%), Security & Protection (76.1%), and Law Enforcement (75.5%), while the most female-oriented occupations are Healthcare Support (94.0%), Personal Care & Service (83.7%), and Food Preparation & Serving (48.3%).
| Occupation | Male | Female |
| Healthcare Support | 64 (6.0%) | 1,005 (94.0%) |
| Security & Protection | 338 (76.1%) | 106 (23.9%) |
| Firefighting & Prevention | 175 (76.7%) | 53 (23.3%) |
| Law Enforcement | 163 (75.5%) | 53 (24.5%) |
| Food Preparation & Serving | 1,223 (51.7%) | 1,142 (48.3%) |
| Cleaning & Maintenance | 565 (52.8%) | 505 (47.2%) |
| Personal Care & Service | 89 (16.3%) | 457 (83.7%) |
| Total (Category) | 2,279 (41.5%) | 3,215 (58.5%) |
| Total (Overall) | 16,323 (53.7%) | 14,069 (46.3%) |
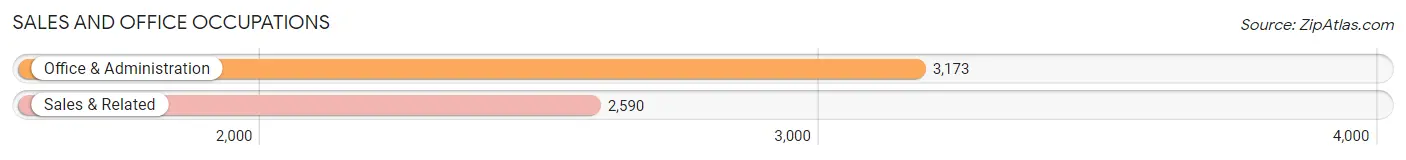
Sales and Office Occupations
The most common Sales and Office occupations in Casper are Office & Administration (3,173 | 10.4%), and Sales & Related (2,590 | 8.5%).
Sales and Office Occupations by Sex
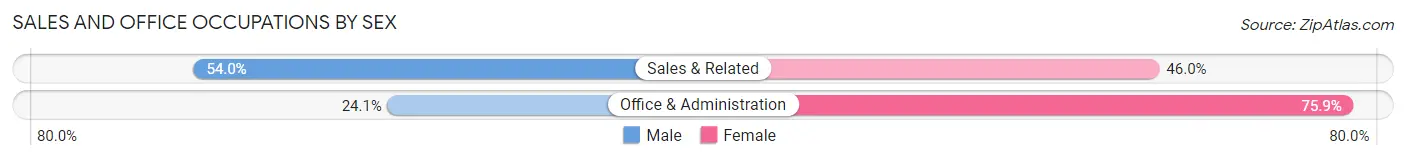
| Occupation | Male | Female |
| Sales & Related | 1,399 (54.0%) | 1,191 (46.0%) |
| Office & Administration | 766 (24.1%) | 2,407 (75.9%) |
| Total (Category) | 2,165 (37.6%) | 3,598 (62.4%) |
| Total (Overall) | 16,323 (53.7%) | 14,069 (46.3%) |
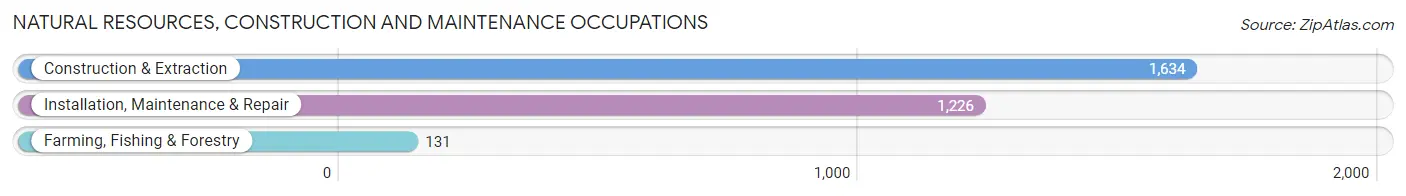
Natural Resources, Construction and Maintenance Occupations
The most common Natural Resources, Construction and Maintenance occupations in Casper are Construction & Extraction (1,634 | 5.4%), Installation, Maintenance & Repair (1,226 | 4.0%), and Farming, Fishing & Forestry (131 | 0.4%).
Natural Resources, Construction and Maintenance Occupations by Sex
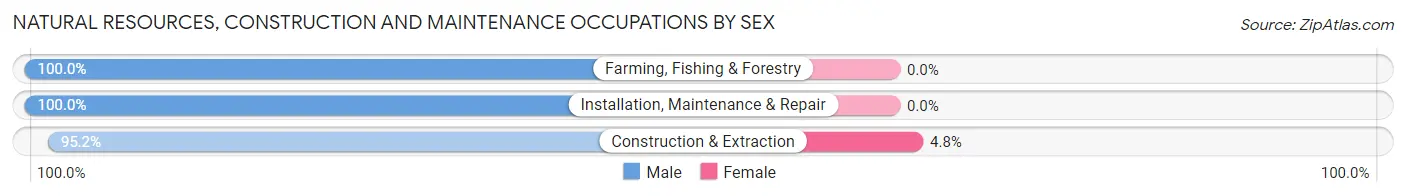
| Occupation | Male | Female |
| Farming, Fishing & Forestry | 131 (100.0%) | 0 (0.0%) |
| Construction & Extraction | 1,555 (95.2%) | 79 (4.8%) |
| Installation, Maintenance & Repair | 1,226 (100.0%) | 0 (0.0%) |
| Total (Category) | 2,912 (97.4%) | 79 (2.6%) |
| Total (Overall) | 16,323 (53.7%) | 14,069 (46.3%) |
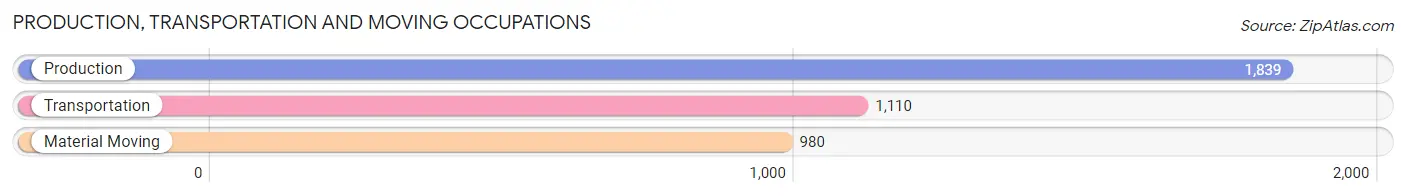
Production, Transportation and Moving Occupations
The most common Production, Transportation and Moving occupations in Casper are Production (1,839 | 6.0%), Transportation (1,110 | 3.6%), and Material Moving (980 | 3.2%).
Production, Transportation and Moving Occupations by Sex
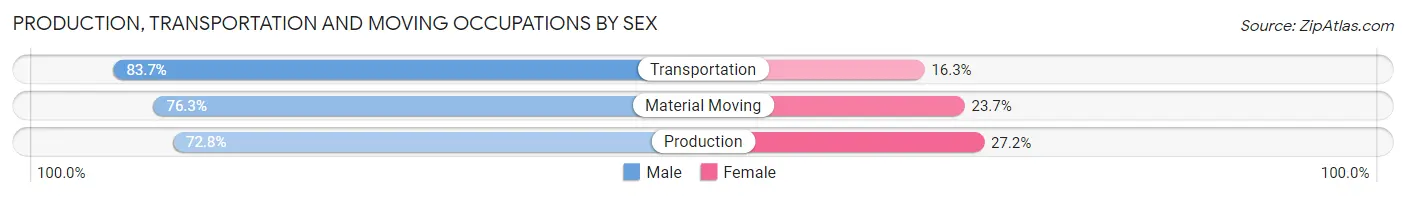
| Occupation | Male | Female |
| Production | 1,338 (72.8%) | 501 (27.2%) |
| Transportation | 929 (83.7%) | 181 (16.3%) |
| Material Moving | 748 (76.3%) | 232 (23.7%) |
| Total (Category) | 3,015 (76.7%) | 914 (23.3%) |
| Total (Overall) | 16,323 (53.7%) | 14,069 (46.3%) |
Employment Industries by Sex in Casper
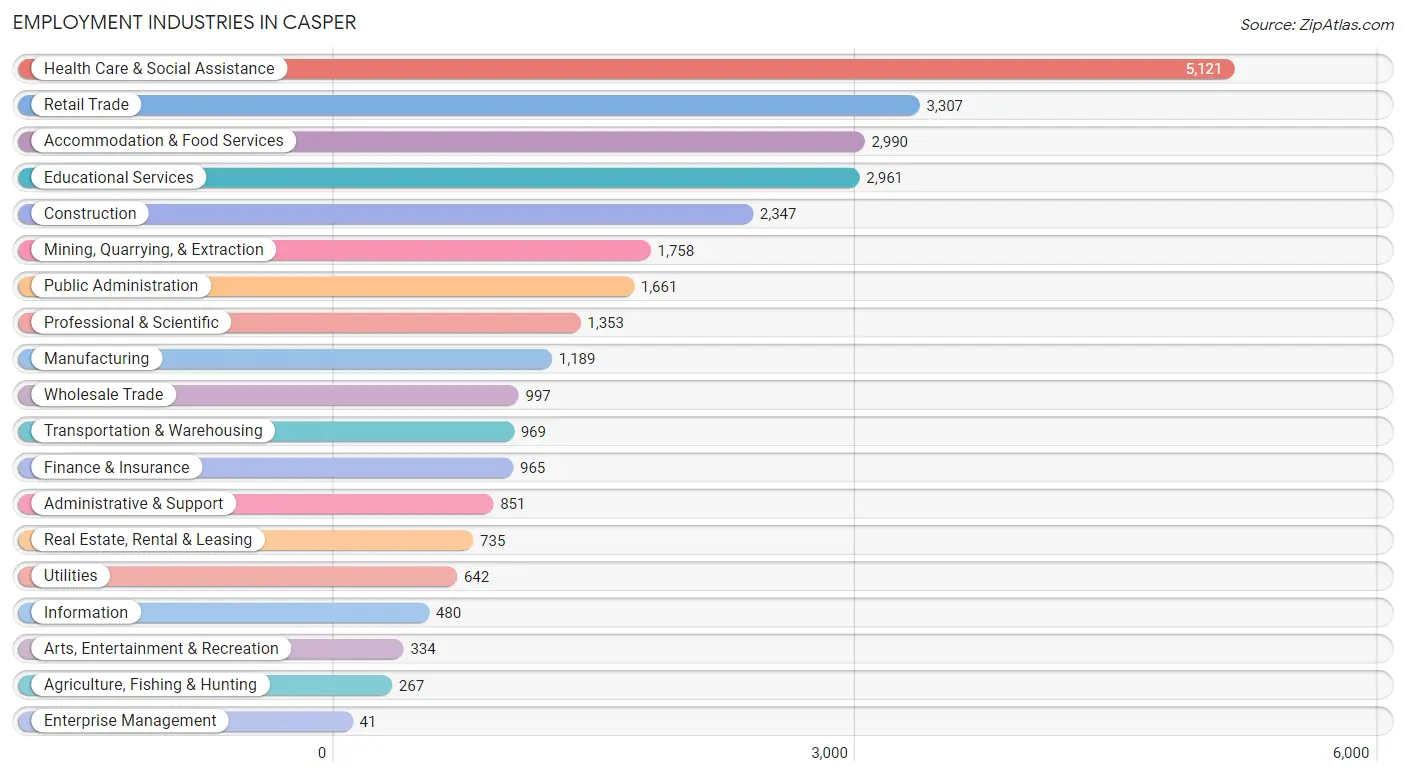
Employment Industries in Casper
The major employment industries in Casper include Health Care & Social Assistance (5,121 | 16.9%), Retail Trade (3,307 | 10.9%), Accommodation & Food Services (2,990 | 9.8%), Educational Services (2,961 | 9.7%), and Construction (2,347 | 7.7%).
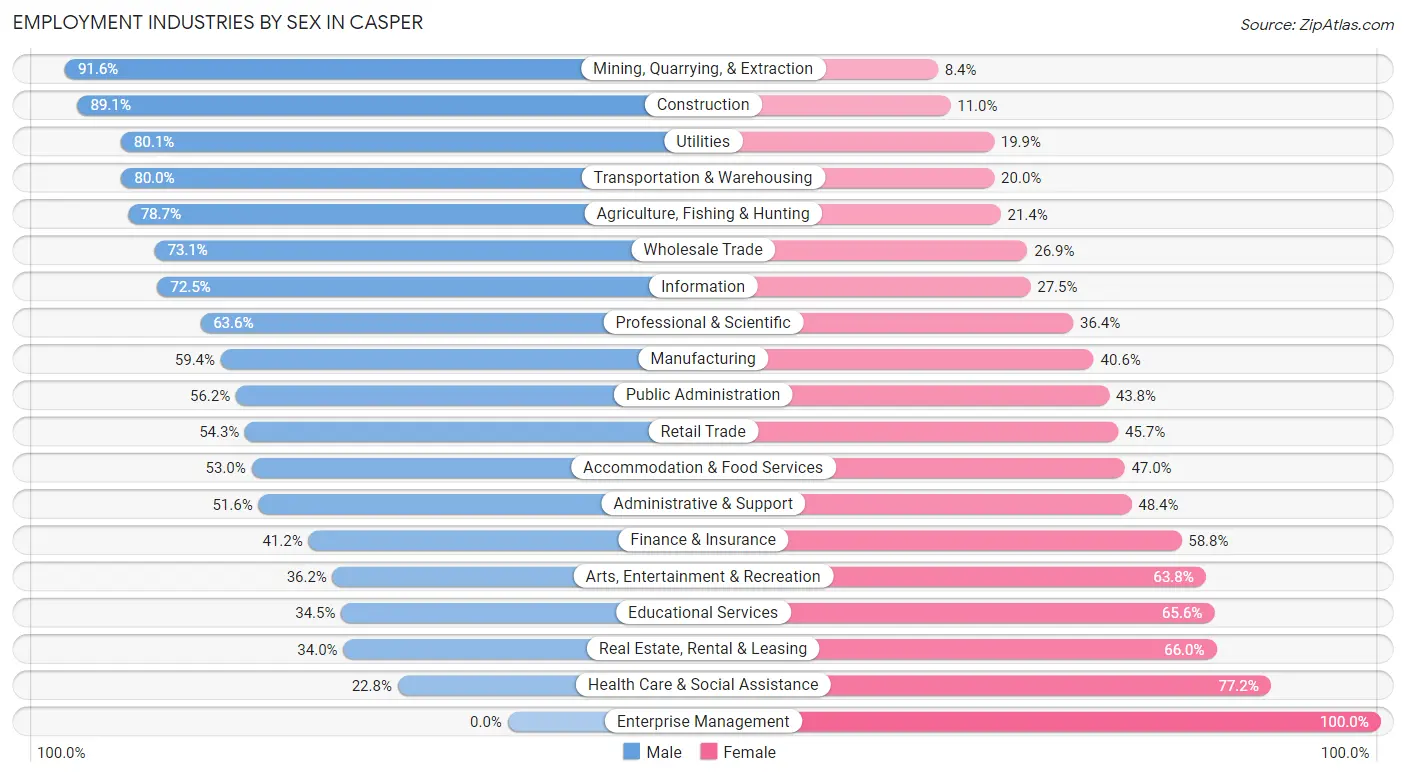
Employment Industries by Sex in Casper
The Casper industries that see more men than women are Mining, Quarrying, & Extraction (91.6%), Construction (89.0%), and Utilities (80.1%), whereas the industries that tend to have a higher number of women are Enterprise Management (100.0%), Health Care & Social Assistance (77.2%), and Real Estate, Rental & Leasing (66.0%).
| Industry | Male | Female |
| Agriculture, Fishing & Hunting | 210 (78.6%) | 57 (21.3%) |
| Mining, Quarrying, & Extraction | 1,611 (91.6%) | 147 (8.4%) |
| Construction | 2,090 (89.0%) | 257 (11.0%) |
| Manufacturing | 706 (59.4%) | 483 (40.6%) |
| Wholesale Trade | 729 (73.1%) | 268 (26.9%) |
| Retail Trade | 1,797 (54.3%) | 1,510 (45.7%) |
| Transportation & Warehousing | 775 (80.0%) | 194 (20.0%) |
| Utilities | 514 (80.1%) | 128 (19.9%) |
| Information | 348 (72.5%) | 132 (27.5%) |
| Finance & Insurance | 398 (41.2%) | 567 (58.8%) |
| Real Estate, Rental & Leasing | 250 (34.0%) | 485 (66.0%) |
| Professional & Scientific | 861 (63.6%) | 492 (36.4%) |
| Enterprise Management | 0 (0.0%) | 41 (100.0%) |
| Administrative & Support | 439 (51.6%) | 412 (48.4%) |
| Educational Services | 1,020 (34.4%) | 1,941 (65.5%) |
| Health Care & Social Assistance | 1,166 (22.8%) | 3,955 (77.2%) |
| Arts, Entertainment & Recreation | 121 (36.2%) | 213 (63.8%) |
| Accommodation & Food Services | 1,585 (53.0%) | 1,405 (47.0%) |
| Public Administration | 934 (56.2%) | 727 (43.8%) |
| Total | 16,323 (53.7%) | 14,069 (46.3%) |
Education in Casper
School Enrollment in Casper
The most common levels of schooling among the 14,563 students in Casper are elementary school (3,202 | 22.0%), high school (3,189 | 21.9%), and college / undergraduate (3,061 | 21.0%).
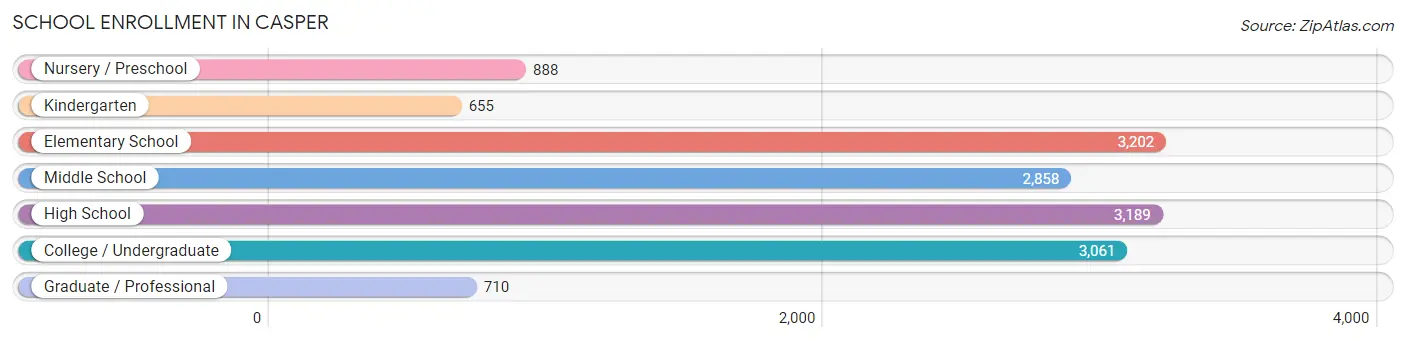
| School Level | # Students | % Students |
| Nursery / Preschool | 888 | 6.1% |
| Kindergarten | 655 | 4.5% |
| Elementary School | 3,202 | 22.0% |
| Middle School | 2,858 | 19.6% |
| High School | 3,189 | 21.9% |
| College / Undergraduate | 3,061 | 21.0% |
| Graduate / Professional | 710 | 4.9% |
| Total | 14,563 | 100.0% |
School Enrollment by Age by Funding Source in Casper
Out of a total of 14,563 students who are enrolled in schools in Casper, 1,427 (9.8%) attend a private institution, while the remaining 13,136 (90.2%) are enrolled in public schools. The age group of 3 to 4 year olds has the highest likelihood of being enrolled in private schools, with 171 (26.4% in the age bracket) enrolled. Conversely, the age group of 15 to 17 year olds has the lowest likelihood of being enrolled in a private school, with 2,213 (96.5% in the age bracket) attending a public institution.
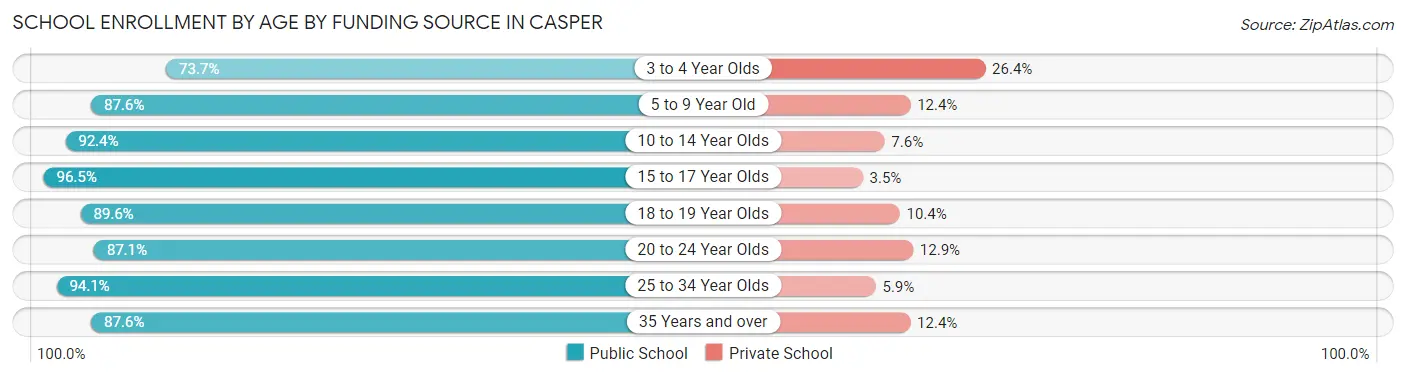
| Age Bracket | Public School | Private School |
| 3 to 4 Year Olds | 478 (73.7%) | 171 (26.4%) |
| 5 to 9 Year Old | 3,232 (87.6%) | 457 (12.4%) |
| 10 to 14 Year Olds | 3,580 (92.4%) | 294 (7.6%) |
| 15 to 17 Year Olds | 2,213 (96.5%) | 81 (3.5%) |
| 18 to 19 Year Olds | 973 (89.6%) | 113 (10.4%) |
| 20 to 24 Year Olds | 999 (87.1%) | 148 (12.9%) |
| 25 to 34 Year Olds | 903 (94.1%) | 57 (5.9%) |
| 35 Years and over | 757 (87.6%) | 107 (12.4%) |
| Total | 13,136 (90.2%) | 1,427 (9.8%) |
Educational Attainment by Field of Study in Casper
Education (2,723 | 22.1%), business (1,678 | 13.6%), science & technology (1,192 | 9.7%), bio, nature & agricultural (1,001 | 8.1%), and engineering (896 | 7.3%) are the most common fields of study among 12,344 individuals in Casper who have obtained a bachelor's degree or higher.
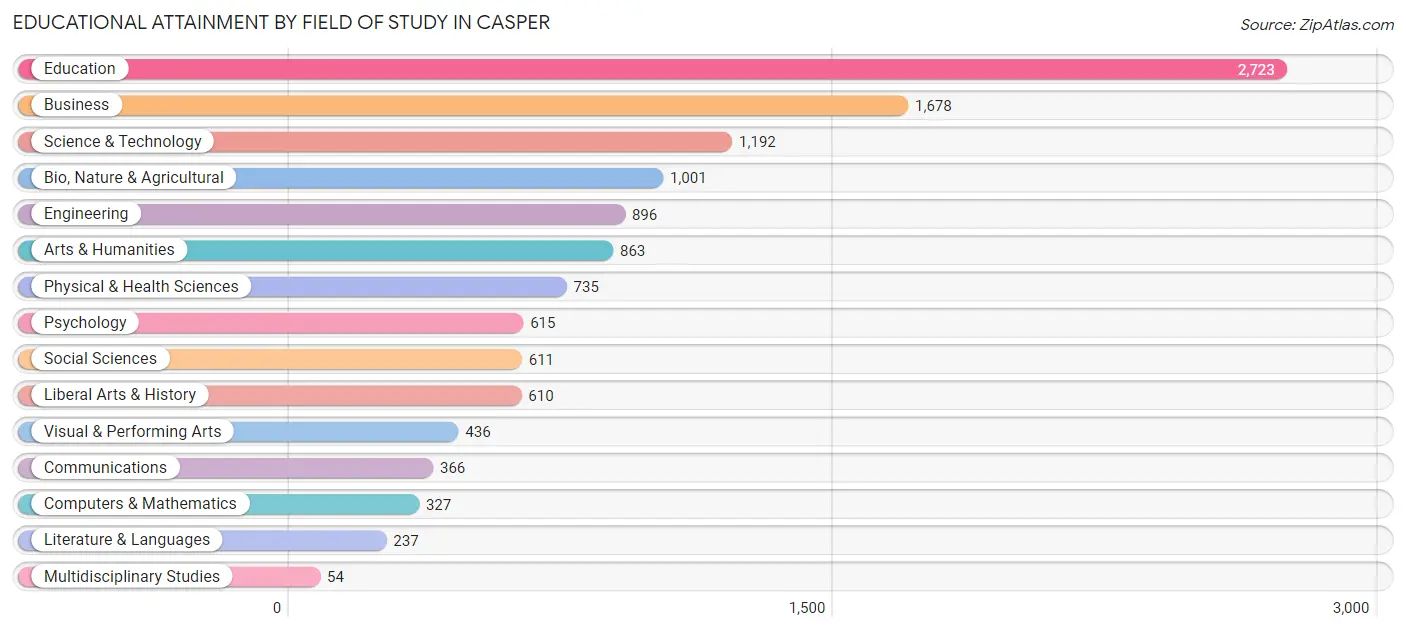
| Field of Study | # Graduates | % Graduates |
| Computers & Mathematics | 327 | 2.6% |
| Bio, Nature & Agricultural | 1,001 | 8.1% |
| Physical & Health Sciences | 735 | 5.9% |
| Psychology | 615 | 5.0% |
| Social Sciences | 611 | 5.0% |
| Engineering | 896 | 7.3% |
| Multidisciplinary Studies | 54 | 0.4% |
| Science & Technology | 1,192 | 9.7% |
| Business | 1,678 | 13.6% |
| Education | 2,723 | 22.1% |
| Literature & Languages | 237 | 1.9% |
| Liberal Arts & History | 610 | 4.9% |
| Visual & Performing Arts | 436 | 3.5% |
| Communications | 366 | 3.0% |
| Arts & Humanities | 863 | 7.0% |
| Total | 12,344 | 100.0% |
Transportation & Commute in Casper
Vehicle Availability by Sex in Casper
The most prevalent vehicle ownership categories in Casper are males with 2 vehicles (6,772, accounting for 42.1%) and females with 2 vehicles (4,967, making up 48.9%).
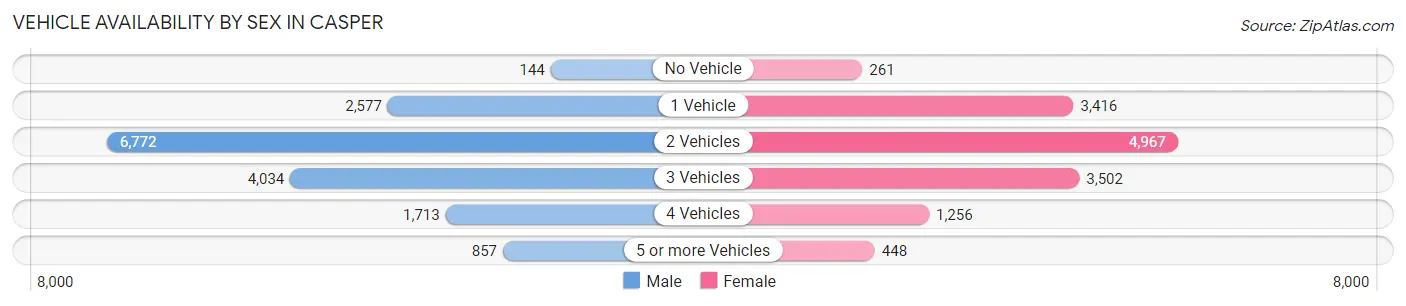
| Vehicles Available | Male | Female |
| No Vehicle | 144 (0.9%) | 261 (1.9%) |
| 1 Vehicle | 2,577 (16.0%) | 3,416 (24.7%) |
| 2 Vehicles | 6,772 (42.1%) | 4,967 (35.9%) |
| 3 Vehicles | 4,034 (25.1%) | 3,502 (25.3%) |
| 4 Vehicles | 1,713 (10.6%) | 1,256 (9.1%) |
| 5 or more Vehicles | 857 (5.3%) | 448 (3.2%) |
| Total | 16,097 (100.0%) | 13,850 (100.0%) |
Commute Time in Casper
The most frequently occuring commute durations in Casper are 10 to 14 minutes (7,648 commuters, 27.6%), 15 to 19 minutes (7,232 commuters, 26.1%), and 5 to 9 minutes (5,132 commuters, 18.5%).
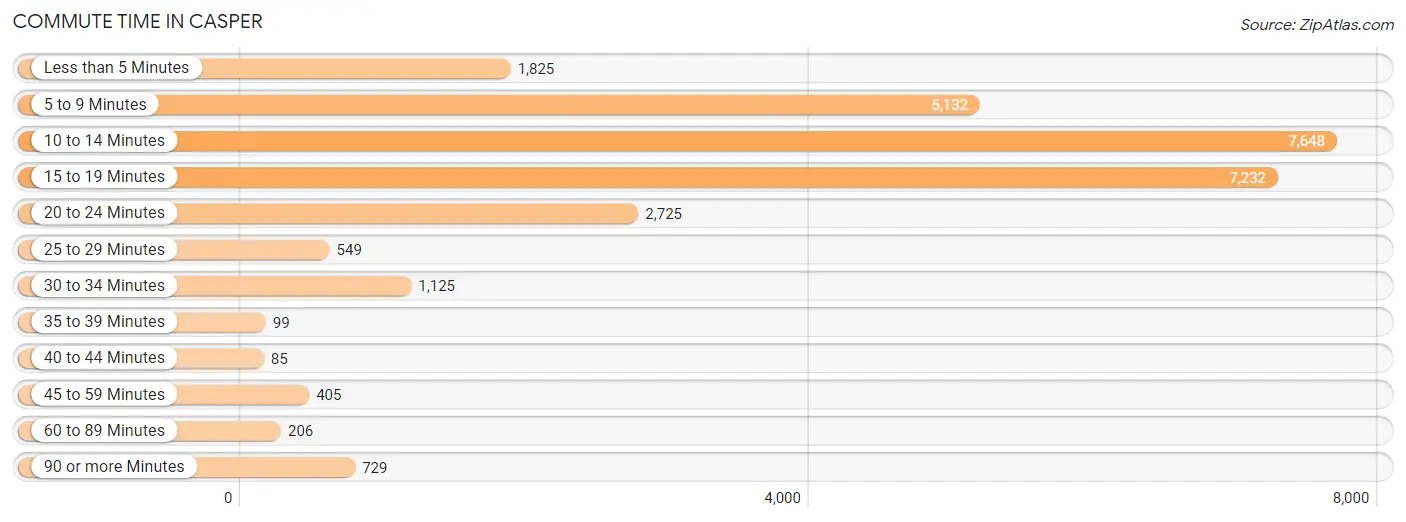
| Commute Time | # Commuters | % Commuters |
| Less than 5 Minutes | 1,825 | 6.6% |
| 5 to 9 Minutes | 5,132 | 18.5% |
| 10 to 14 Minutes | 7,648 | 27.6% |
| 15 to 19 Minutes | 7,232 | 26.1% |
| 20 to 24 Minutes | 2,725 | 9.8% |
| 25 to 29 Minutes | 549 | 2.0% |
| 30 to 34 Minutes | 1,125 | 4.1% |
| 35 to 39 Minutes | 99 | 0.4% |
| 40 to 44 Minutes | 85 | 0.3% |
| 45 to 59 Minutes | 405 | 1.5% |
| 60 to 89 Minutes | 206 | 0.7% |
| 90 or more Minutes | 729 | 2.6% |
Commute Time by Sex in Casper
The most common commute times in Casper are 15 to 19 minutes (3,846 commuters, 25.7%) for males and 10 to 14 minutes (3,920 commuters, 30.6%) for females.
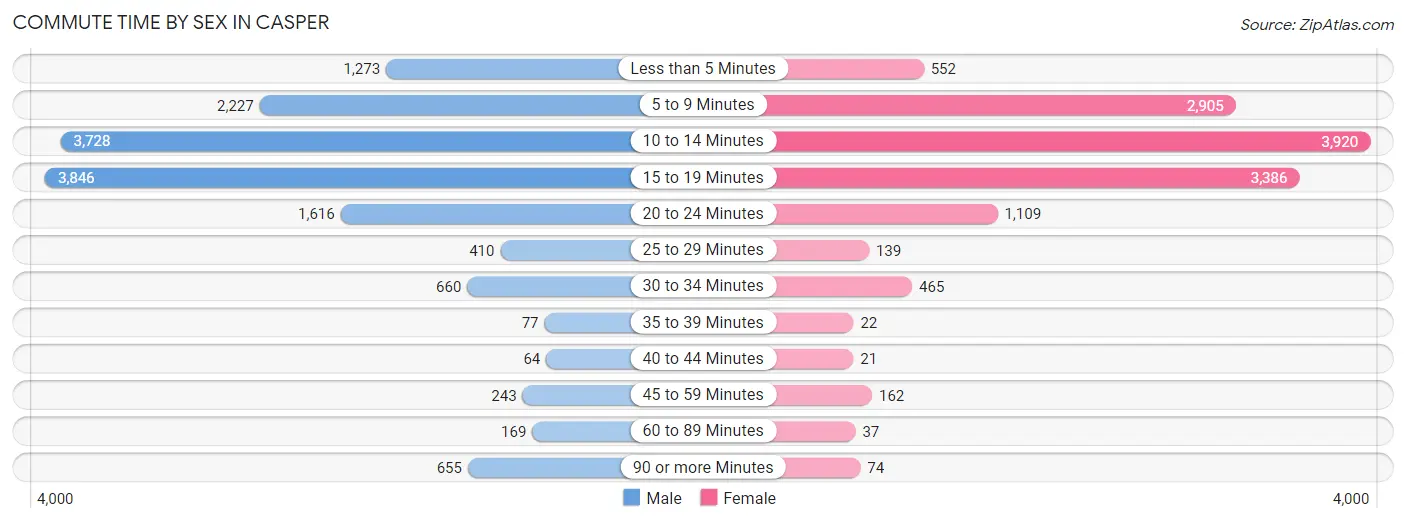
| Commute Time | Male | Female |
| Less than 5 Minutes | 1,273 (8.5%) | 552 (4.3%) |
| 5 to 9 Minutes | 2,227 (14.9%) | 2,905 (22.7%) |
| 10 to 14 Minutes | 3,728 (24.9%) | 3,920 (30.6%) |
| 15 to 19 Minutes | 3,846 (25.7%) | 3,386 (26.5%) |
| 20 to 24 Minutes | 1,616 (10.8%) | 1,109 (8.7%) |
| 25 to 29 Minutes | 410 (2.7%) | 139 (1.1%) |
| 30 to 34 Minutes | 660 (4.4%) | 465 (3.6%) |
| 35 to 39 Minutes | 77 (0.5%) | 22 (0.2%) |
| 40 to 44 Minutes | 64 (0.4%) | 21 (0.2%) |
| 45 to 59 Minutes | 243 (1.6%) | 162 (1.3%) |
| 60 to 89 Minutes | 169 (1.1%) | 37 (0.3%) |
| 90 or more Minutes | 655 (4.4%) | 74 (0.6%) |
Time of Departure to Work by Sex in Casper
The most frequent times of departure to work in Casper are 7:30 AM to 7:59 AM (3,549, 23.7%) for males and 7:30 AM to 7:59 AM (3,302, 25.8%) for females.
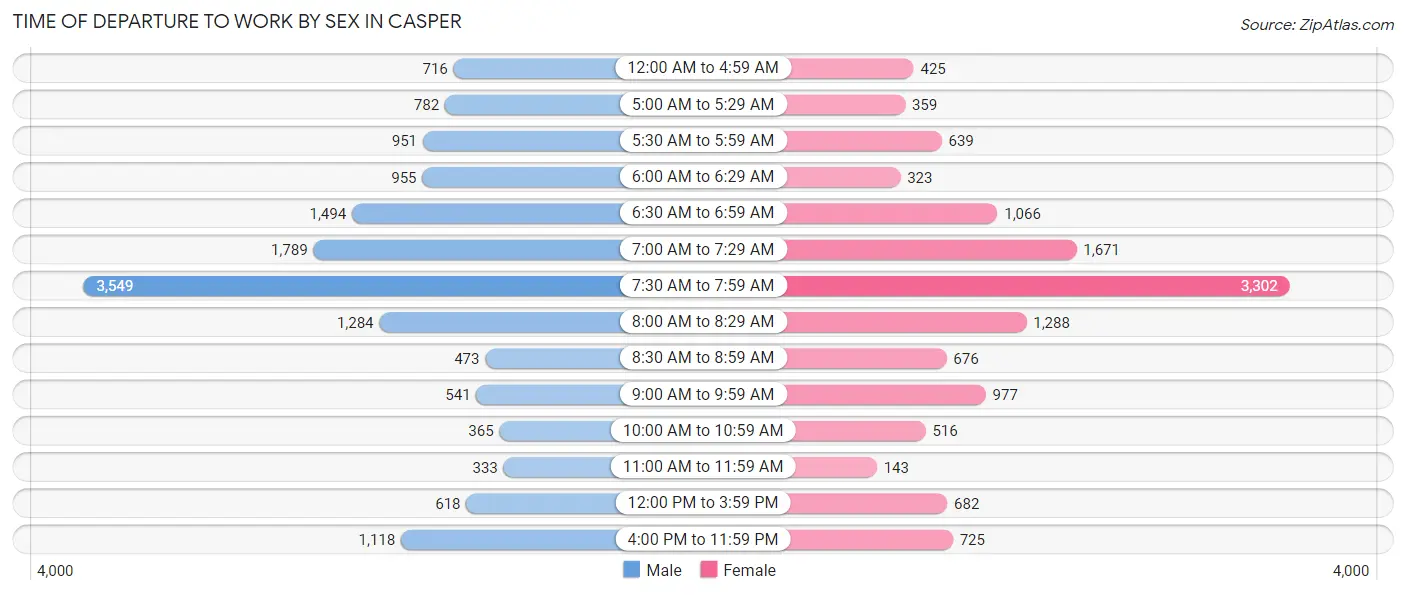
| Time of Departure | Male | Female |
| 12:00 AM to 4:59 AM | 716 (4.8%) | 425 (3.3%) |
| 5:00 AM to 5:29 AM | 782 (5.2%) | 359 (2.8%) |
| 5:30 AM to 5:59 AM | 951 (6.4%) | 639 (5.0%) |
| 6:00 AM to 6:29 AM | 955 (6.4%) | 323 (2.5%) |
| 6:30 AM to 6:59 AM | 1,494 (10.0%) | 1,066 (8.3%) |
| 7:00 AM to 7:29 AM | 1,789 (11.9%) | 1,671 (13.1%) |
| 7:30 AM to 7:59 AM | 3,549 (23.7%) | 3,302 (25.8%) |
| 8:00 AM to 8:29 AM | 1,284 (8.6%) | 1,288 (10.1%) |
| 8:30 AM to 8:59 AM | 473 (3.2%) | 676 (5.3%) |
| 9:00 AM to 9:59 AM | 541 (3.6%) | 977 (7.6%) |
| 10:00 AM to 10:59 AM | 365 (2.4%) | 516 (4.0%) |
| 11:00 AM to 11:59 AM | 333 (2.2%) | 143 (1.1%) |
| 12:00 PM to 3:59 PM | 618 (4.1%) | 682 (5.3%) |
| 4:00 PM to 11:59 PM | 1,118 (7.5%) | 725 (5.7%) |
| Total | 14,968 (100.0%) | 12,792 (100.0%) |
Housing Occupancy in Casper
Occupancy by Ownership in Casper
Of the total 25,096 dwellings in Casper, owner-occupied units account for 17,473 (69.6%), while renter-occupied units make up 7,623 (30.4%).
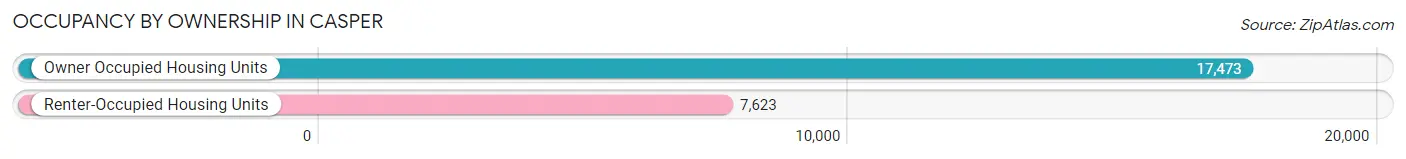
| Occupancy | # Housing Units | % Housing Units |
| Owner Occupied Housing Units | 17,473 | 69.6% |
| Renter-Occupied Housing Units | 7,623 | 30.4% |
| Total Occupied Housing Units | 25,096 | 100.0% |
Occupancy by Household Size in Casper
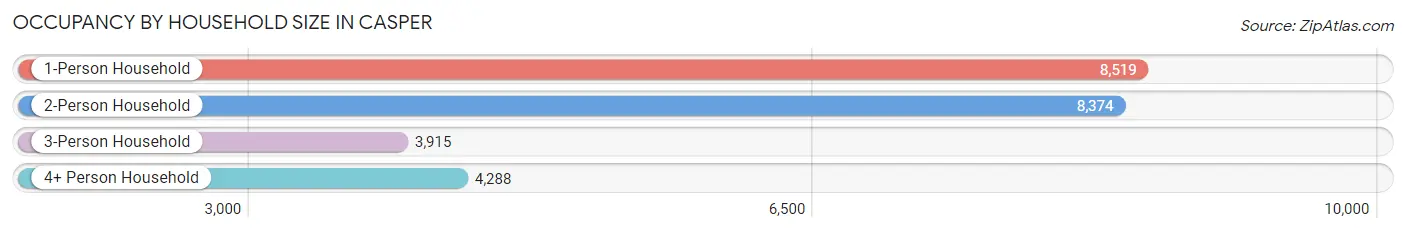
| Household Size | # Housing Units | % Housing Units |
| 1-Person Household | 8,519 | 34.0% |
| 2-Person Household | 8,374 | 33.4% |
| 3-Person Household | 3,915 | 15.6% |
| 4+ Person Household | 4,288 | 17.1% |
| Total Housing Units | 25,096 | 100.0% |
Occupancy by Ownership by Household Size in Casper
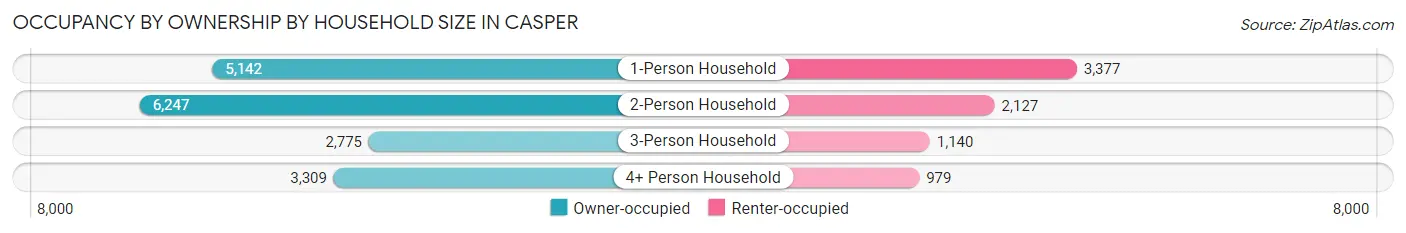
| Household Size | Owner-occupied | Renter-occupied |
| 1-Person Household | 5,142 (60.4%) | 3,377 (39.6%) |
| 2-Person Household | 6,247 (74.6%) | 2,127 (25.4%) |
| 3-Person Household | 2,775 (70.9%) | 1,140 (29.1%) |
| 4+ Person Household | 3,309 (77.2%) | 979 (22.8%) |
| Total Housing Units | 17,473 (69.6%) | 7,623 (30.4%) |
Occupancy by Educational Attainment in Casper
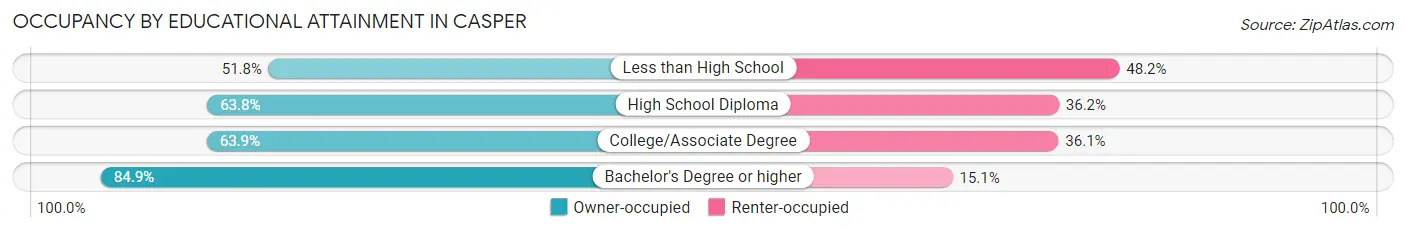
| Household Size | Owner-occupied | Renter-occupied |
| Less than High School | 583 (51.8%) | 543 (48.2%) |
| High School Diploma | 3,901 (63.8%) | 2,215 (36.2%) |
| College/Associate Degree | 6,579 (63.9%) | 3,721 (36.1%) |
| Bachelor's Degree or higher | 6,410 (84.9%) | 1,144 (15.1%) |
Occupancy by Age of Householder in Casper
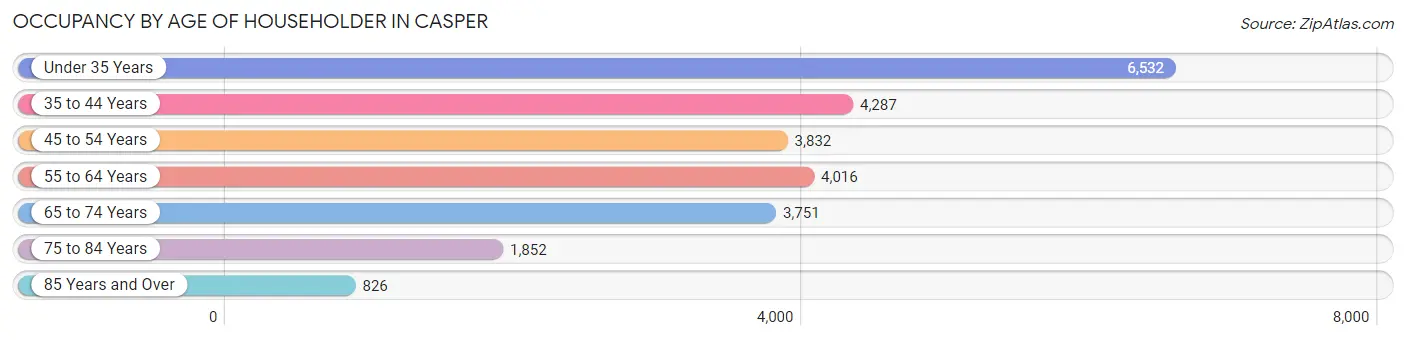
| Age Bracket | # Households | % Households |
| Under 35 Years | 6,532 | 26.0% |
| 35 to 44 Years | 4,287 | 17.1% |
| 45 to 54 Years | 3,832 | 15.3% |
| 55 to 64 Years | 4,016 | 16.0% |
| 65 to 74 Years | 3,751 | 14.9% |
| 75 to 84 Years | 1,852 | 7.4% |
| 85 Years and Over | 826 | 3.3% |
| Total | 25,096 | 100.0% |
Housing Finances in Casper
Median Income by Occupancy in Casper
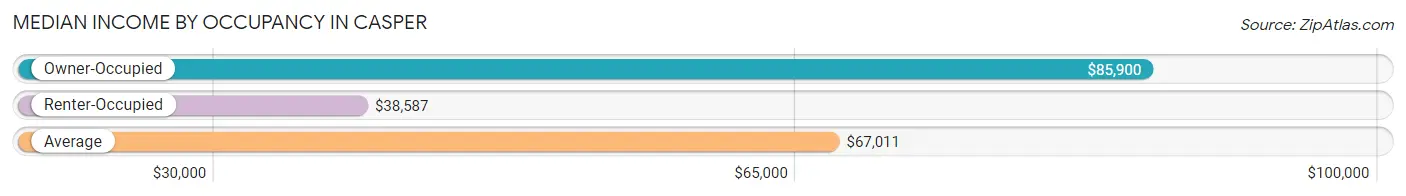
| Occupancy Type | # Households | Median Income |
| Owner-Occupied | 17,473 (69.6%) | $85,900 |
| Renter-Occupied | 7,623 (30.4%) | $38,587 |
| Average | 25,096 (100.0%) | $67,011 |
Occupancy by Householder Income Bracket in Casper
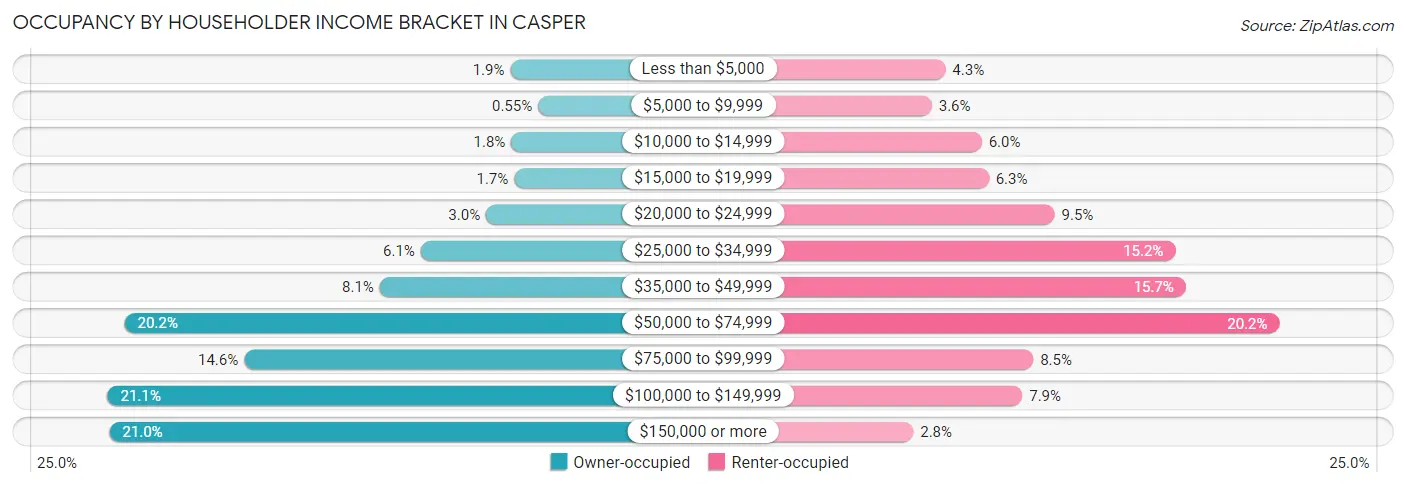
| Income Bracket | Owner-occupied | Renter-occupied |
| Less than $5,000 | 327 (1.9%) | 326 (4.3%) |
| $5,000 to $9,999 | 96 (0.5%) | 277 (3.6%) |
| $10,000 to $14,999 | 320 (1.8%) | 458 (6.0%) |
| $15,000 to $19,999 | 295 (1.7%) | 483 (6.3%) |
| $20,000 to $24,999 | 529 (3.0%) | 723 (9.5%) |
| $25,000 to $34,999 | 1,073 (6.1%) | 1,160 (15.2%) |
| $35,000 to $49,999 | 1,414 (8.1%) | 1,198 (15.7%) |
| $50,000 to $74,999 | 3,537 (20.2%) | 1,538 (20.2%) |
| $75,000 to $99,999 | 2,542 (14.5%) | 645 (8.5%) |
| $100,000 to $149,999 | 3,678 (21.0%) | 605 (7.9%) |
| $150,000 or more | 3,662 (21.0%) | 210 (2.8%) |
| Total | 17,473 (100.0%) | 7,623 (100.0%) |
Monthly Housing Cost Tiers in Casper
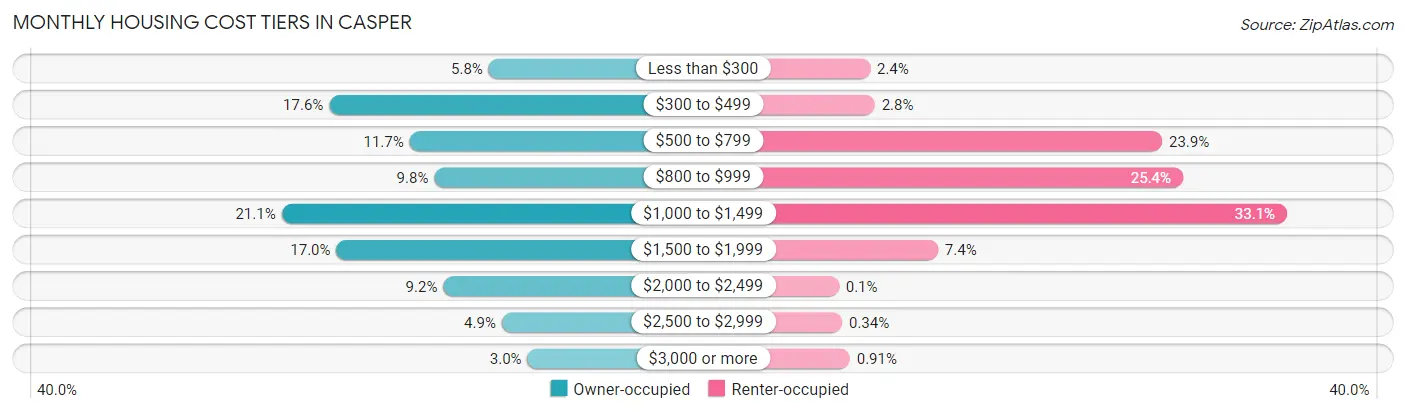
| Monthly Cost | Owner-occupied | Renter-occupied |
| Less than $300 | 1,017 (5.8%) | 183 (2.4%) |
| $300 to $499 | 3,070 (17.6%) | 210 (2.8%) |
| $500 to $799 | 2,036 (11.7%) | 1,823 (23.9%) |
| $800 to $999 | 1,717 (9.8%) | 1,939 (25.4%) |
| $1,000 to $1,499 | 3,684 (21.1%) | 2,523 (33.1%) |
| $1,500 to $1,999 | 2,978 (17.0%) | 564 (7.4%) |
| $2,000 to $2,499 | 1,603 (9.2%) | 8 (0.1%) |
| $2,500 to $2,999 | 849 (4.9%) | 26 (0.3%) |
| $3,000 or more | 519 (3.0%) | 69 (0.9%) |
| Total | 17,473 (100.0%) | 7,623 (100.0%) |
Physical Housing Characteristics in Casper
Housing Structures in Casper
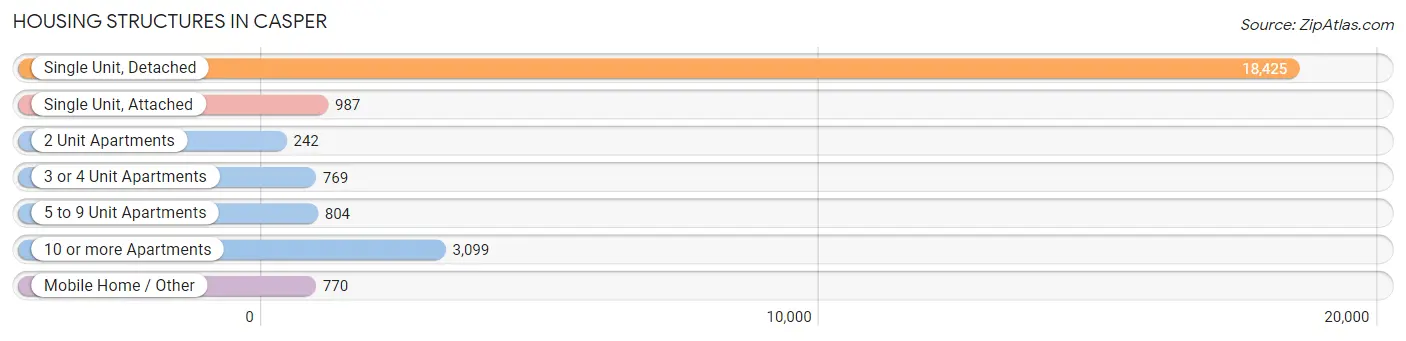
| Structure Type | # Housing Units | % Housing Units |
| Single Unit, Detached | 18,425 | 73.4% |
| Single Unit, Attached | 987 | 3.9% |
| 2 Unit Apartments | 242 | 1.0% |
| 3 or 4 Unit Apartments | 769 | 3.1% |
| 5 to 9 Unit Apartments | 804 | 3.2% |
| 10 or more Apartments | 3,099 | 12.3% |
| Mobile Home / Other | 770 | 3.1% |
| Total | 25,096 | 100.0% |
Housing Structures by Occupancy in Casper
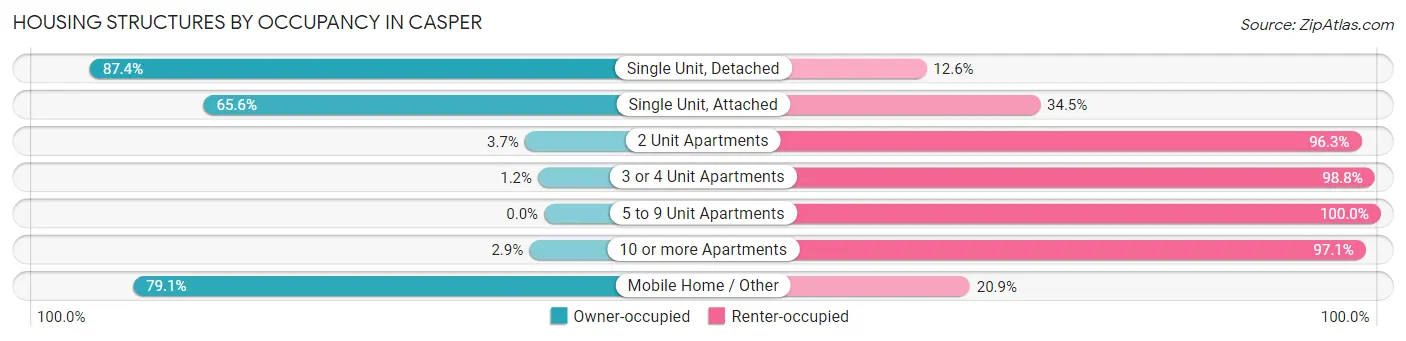
| Structure Type | Owner-occupied | Renter-occupied |
| Single Unit, Detached | 16,110 (87.4%) | 2,315 (12.6%) |
| Single Unit, Attached | 647 (65.5%) | 340 (34.4%) |
| 2 Unit Apartments | 9 (3.7%) | 233 (96.3%) |
| 3 or 4 Unit Apartments | 9 (1.2%) | 760 (98.8%) |
| 5 to 9 Unit Apartments | 0 (0.0%) | 804 (100.0%) |
| 10 or more Apartments | 89 (2.9%) | 3,010 (97.1%) |
| Mobile Home / Other | 609 (79.1%) | 161 (20.9%) |
| Total | 17,473 (69.6%) | 7,623 (30.4%) |
Housing Structures by Number of Rooms in Casper
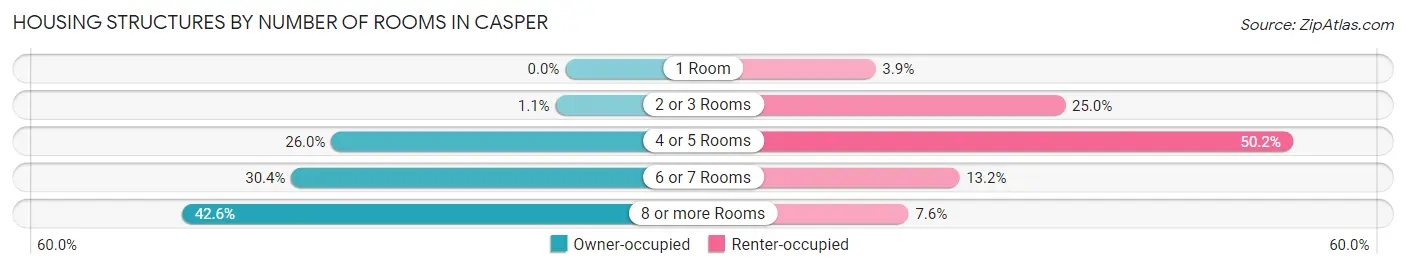
| Number of Rooms | Owner-occupied | Renter-occupied |
| 1 Room | 0 (0.0%) | 300 (3.9%) |
| 2 or 3 Rooms | 190 (1.1%) | 1,904 (25.0%) |
| 4 or 5 Rooms | 4,536 (26.0%) | 3,830 (50.2%) |
| 6 or 7 Rooms | 5,311 (30.4%) | 1,009 (13.2%) |
| 8 or more Rooms | 7,436 (42.6%) | 580 (7.6%) |
| Total | 17,473 (100.0%) | 7,623 (100.0%) |
Housing Structure by Heating Type in Casper
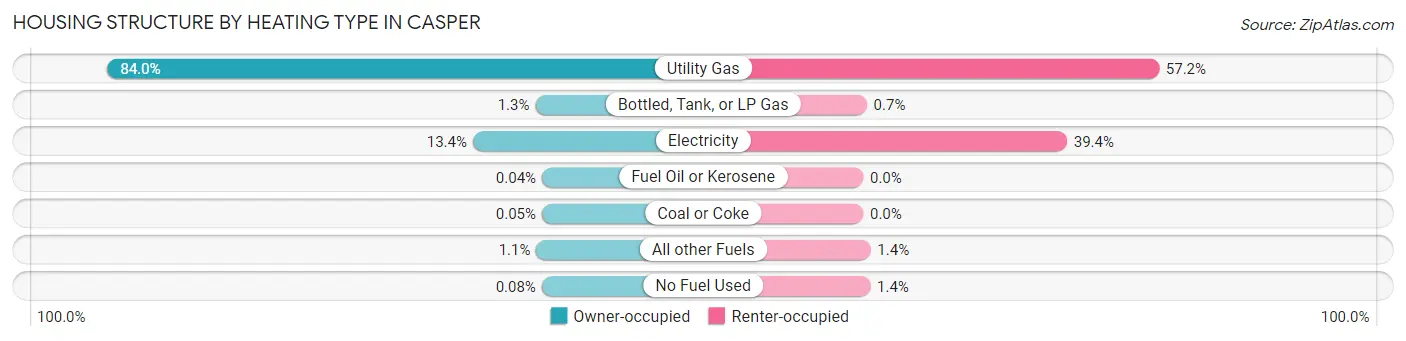
| Heating Type | Owner-occupied | Renter-occupied |
| Utility Gas | 14,680 (84.0%) | 4,357 (57.2%) |
| Bottled, Tank, or LP Gas | 229 (1.3%) | 53 (0.7%) |
| Electricity | 2,339 (13.4%) | 3,001 (39.4%) |
| Fuel Oil or Kerosene | 7 (0.0%) | 0 (0.0%) |
| Coal or Coke | 8 (0.1%) | 0 (0.0%) |
| All other Fuels | 196 (1.1%) | 108 (1.4%) |
| No Fuel Used | 14 (0.1%) | 104 (1.4%) |
| Total | 17,473 (100.0%) | 7,623 (100.0%) |
Household Vehicle Usage in Casper
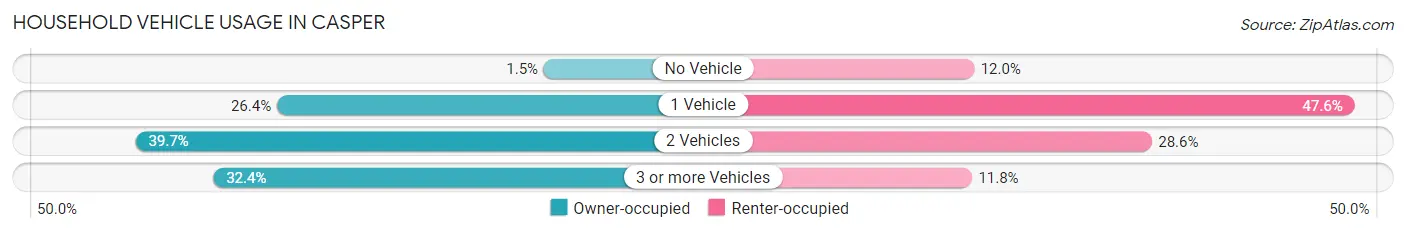
| Vehicles per Household | Owner-occupied | Renter-occupied |
| No Vehicle | 265 (1.5%) | 916 (12.0%) |
| 1 Vehicle | 4,620 (26.4%) | 3,627 (47.6%) |
| 2 Vehicles | 6,928 (39.7%) | 2,180 (28.6%) |
| 3 or more Vehicles | 5,660 (32.4%) | 900 (11.8%) |
| Total | 17,473 (100.0%) | 7,623 (100.0%) |
Real Estate & Mortgages in Casper
Real Estate and Mortgage Overview in Casper
| Characteristic | Without Mortgage | With Mortgage |
| Housing Units | 6,201 | 11,272 |
| Median Property Value | $240,700 | $244,000 |
| Median Household Income | $67,177 | $2,491 |
| Monthly Housing Costs | $451 | $486 |
| Real Estate Taxes | $1,577 | $261 |
Property Value by Mortgage Status in Casper
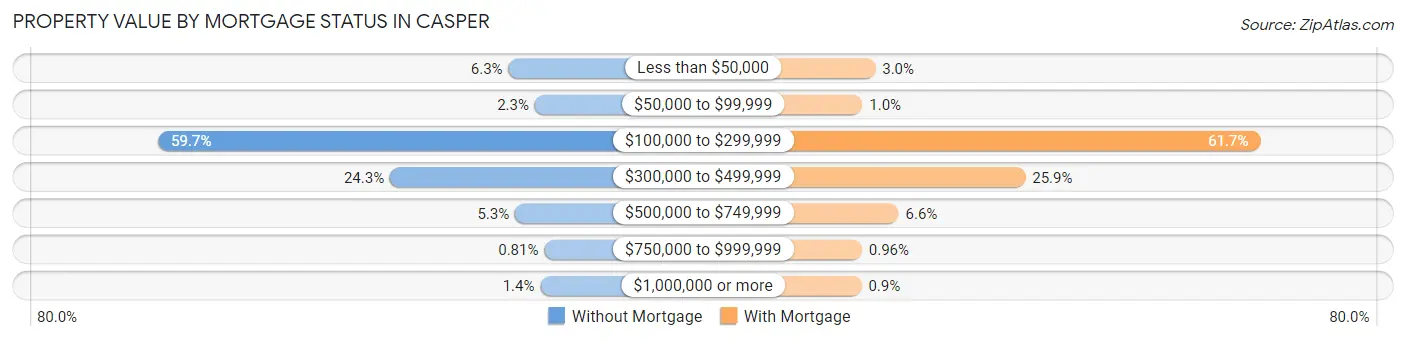
| Property Value | Without Mortgage | With Mortgage |
| Less than $50,000 | 389 (6.3%) | 339 (3.0%) |
| $50,000 to $99,999 | 140 (2.3%) | 117 (1.0%) |
| $100,000 to $299,999 | 3,700 (59.7%) | 6,952 (61.7%) |
| $300,000 to $499,999 | 1,508 (24.3%) | 2,916 (25.9%) |
| $500,000 to $749,999 | 326 (5.3%) | 739 (6.6%) |
| $750,000 to $999,999 | 50 (0.8%) | 108 (1.0%) |
| $1,000,000 or more | 88 (1.4%) | 101 (0.9%) |
| Total | 6,201 (100.0%) | 11,272 (100.0%) |
Household Income by Mortgage Status in Casper
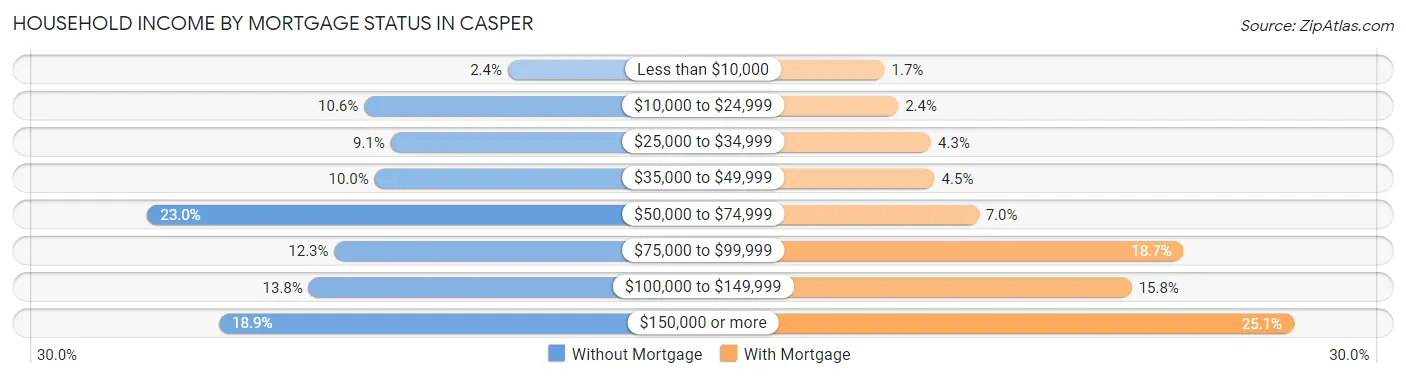
| Household Income | Without Mortgage | With Mortgage |
| Less than $10,000 | 148 (2.4%) | 187 (1.7%) |
| $10,000 to $24,999 | 657 (10.6%) | 275 (2.4%) |
| $25,000 to $34,999 | 563 (9.1%) | 487 (4.3%) |
| $35,000 to $49,999 | 620 (10.0%) | 510 (4.5%) |
| $50,000 to $74,999 | 1,425 (23.0%) | 794 (7.0%) |
| $75,000 to $99,999 | 763 (12.3%) | 2,112 (18.7%) |
| $100,000 to $149,999 | 854 (13.8%) | 1,779 (15.8%) |
| $150,000 or more | 1,171 (18.9%) | 2,824 (25.1%) |
| Total | 6,201 (100.0%) | 11,272 (100.0%) |
Property Value to Household Income Ratio in Casper
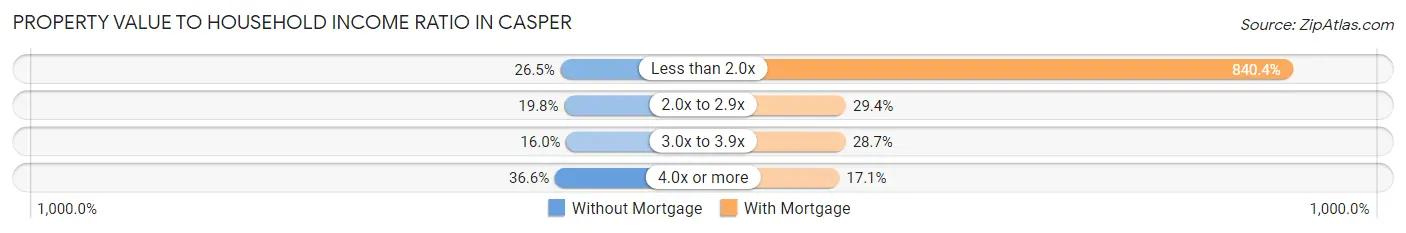
| Value-to-Income Ratio | Without Mortgage | With Mortgage |
| Less than 2.0x | 1,643 (26.5%) | 94,729 (840.4%) |
| 2.0x to 2.9x | 1,226 (19.8%) | 3,308 (29.3%) |
| 3.0x to 3.9x | 992 (16.0%) | 3,233 (28.7%) |
| 4.0x or more | 2,269 (36.6%) | 1,931 (17.1%) |
| Total | 6,201 (100.0%) | 11,272 (100.0%) |
Real Estate Taxes by Mortgage Status in Casper
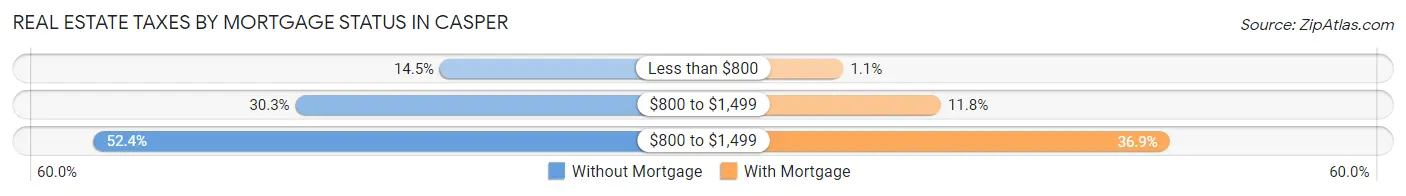
| Property Taxes | Without Mortgage | With Mortgage |
| Less than $800 | 898 (14.5%) | 129 (1.1%) |
| $800 to $1,499 | 1,880 (30.3%) | 1,333 (11.8%) |
| $800 to $1,499 | 3,251 (52.4%) | 4,158 (36.9%) |
| Total | 6,201 (100.0%) | 11,272 (100.0%) |
Health & Disability in Casper
Health Insurance Coverage by Age in Casper
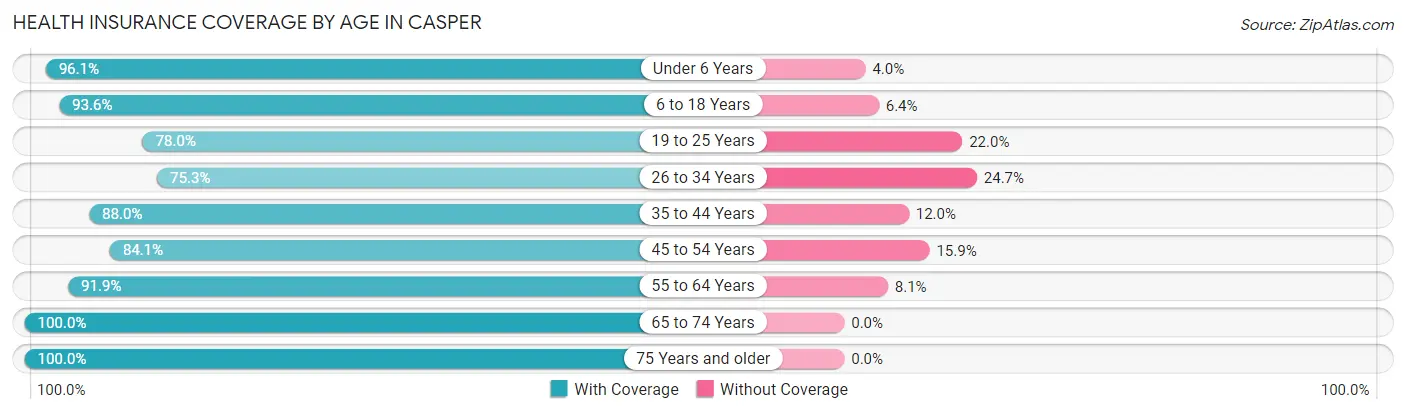
| Age Bracket | With Coverage | Without Coverage |
| Under 6 Years | 4,423 (96.1%) | 182 (4.0%) |
| 6 to 18 Years | 9,732 (93.6%) | 669 (6.4%) |
| 19 to 25 Years | 3,955 (78.0%) | 1,115 (22.0%) |
| 26 to 34 Years | 5,874 (75.3%) | 1,929 (24.7%) |
| 35 to 44 Years | 6,881 (88.0%) | 941 (12.0%) |
| 45 to 54 Years | 5,379 (84.1%) | 1,016 (15.9%) |
| 55 to 64 Years | 6,189 (91.9%) | 547 (8.1%) |
| 65 to 74 Years | 5,518 (100.0%) | 0 (0.0%) |
| 75 Years and older | 3,624 (100.0%) | 0 (0.0%) |
| Total | 51,575 (89.0%) | 6,399 (11.0%) |
Health Insurance Coverage by Citizenship Status in Casper

| Citizenship Status | With Coverage | Without Coverage |
| Native Born | 4,423 (96.1%) | 182 (4.0%) |
| Foreign Born, Citizen | 9,732 (93.6%) | 669 (6.4%) |
| Foreign Born, not a Citizen | 3,955 (78.0%) | 1,115 (22.0%) |
Health Insurance Coverage by Household Income in Casper
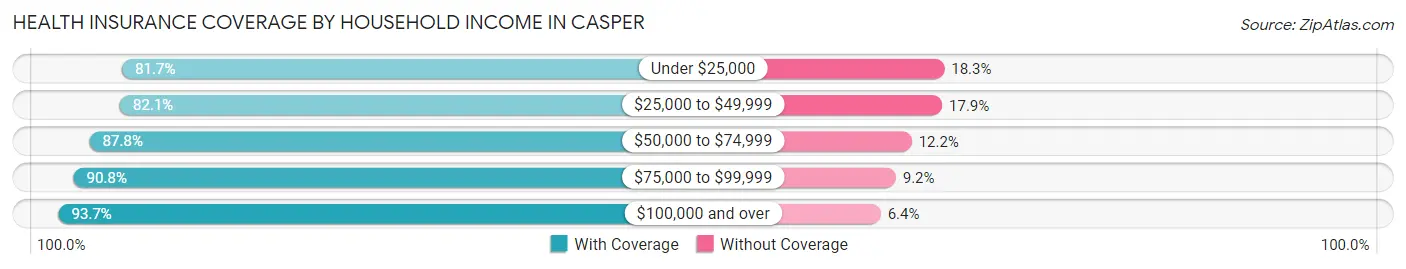
| Household Income | With Coverage | Without Coverage |
| Under $25,000 | 4,863 (81.7%) | 1,087 (18.3%) |
| $25,000 to $49,999 | 7,574 (82.1%) | 1,647 (17.9%) |
| $50,000 to $74,999 | 8,948 (87.8%) | 1,239 (12.2%) |
| $75,000 to $99,999 | 7,429 (90.8%) | 751 (9.2%) |
| $100,000 and over | 22,362 (93.6%) | 1,517 (6.4%) |
Public vs Private Health Insurance Coverage by Age in Casper
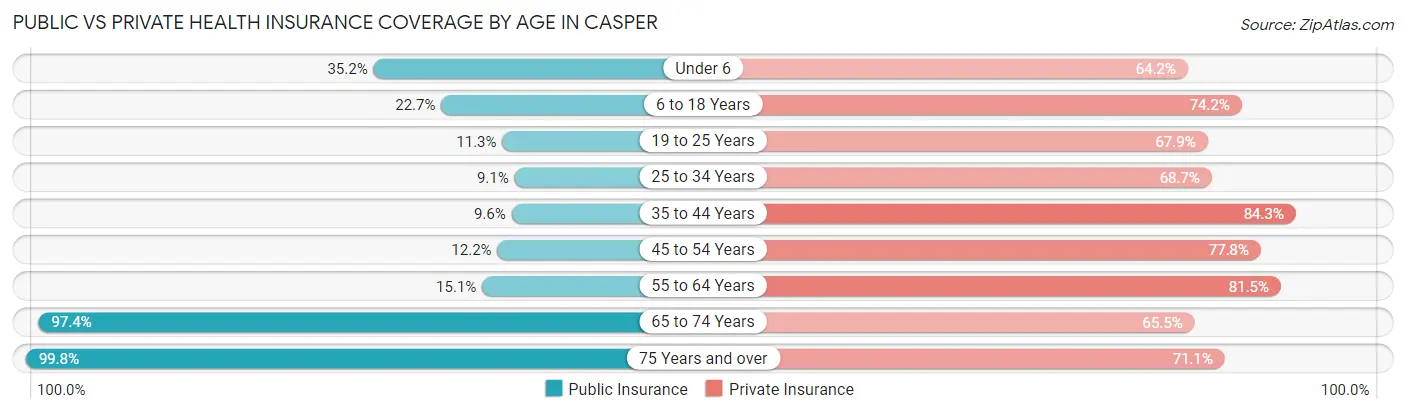
| Age Bracket | Public Insurance | Private Insurance |
| Under 6 | 1,623 (35.2%) | 2,958 (64.2%) |
| 6 to 18 Years | 2,356 (22.7%) | 7,720 (74.2%) |
| 19 to 25 Years | 574 (11.3%) | 3,441 (67.9%) |
| 25 to 34 Years | 707 (9.1%) | 5,357 (68.6%) |
| 35 to 44 Years | 752 (9.6%) | 6,590 (84.3%) |
| 45 to 54 Years | 783 (12.2%) | 4,974 (77.8%) |
| 55 to 64 Years | 1,015 (15.1%) | 5,489 (81.5%) |
| 65 to 74 Years | 5,376 (97.4%) | 3,614 (65.5%) |
| 75 Years and over | 3,616 (99.8%) | 2,576 (71.1%) |
| Total | 16,802 (29.0%) | 42,719 (73.7%) |
Disability Status by Sex by Age in Casper
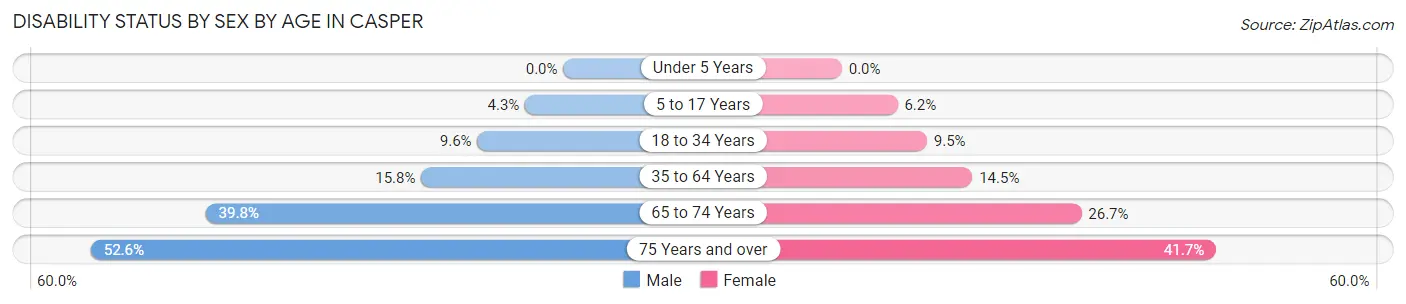
| Age Bracket | Male | Female |
| Under 5 Years | 0 (0.0%) | 0 (0.0%) |
| 5 to 17 Years | 225 (4.3%) | 299 (6.2%) |
| 18 to 34 Years | 688 (9.6%) | 621 (9.5%) |
| 35 to 64 Years | 1,657 (15.8%) | 1,522 (14.5%) |
| 65 to 74 Years | 1,056 (39.8%) | 765 (26.7%) |
| 75 Years and over | 734 (52.6%) | 929 (41.7%) |
Disability Class by Sex by Age in Casper
Disability Class: Hearing Difficulty
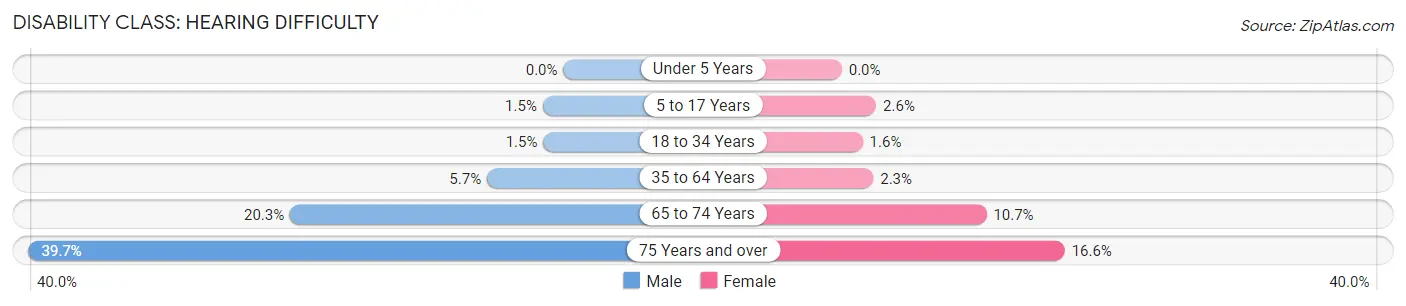
| Age Bracket | Male | Female |
| Under 5 Years | 0 (0.0%) | 0 (0.0%) |
| 5 to 17 Years | 81 (1.5%) | 123 (2.5%) |
| 18 to 34 Years | 107 (1.5%) | 102 (1.5%) |
| 35 to 64 Years | 594 (5.7%) | 245 (2.3%) |
| 65 to 74 Years | 538 (20.3%) | 308 (10.7%) |
| 75 Years and over | 554 (39.7%) | 369 (16.6%) |
Disability Class: Vision Difficulty
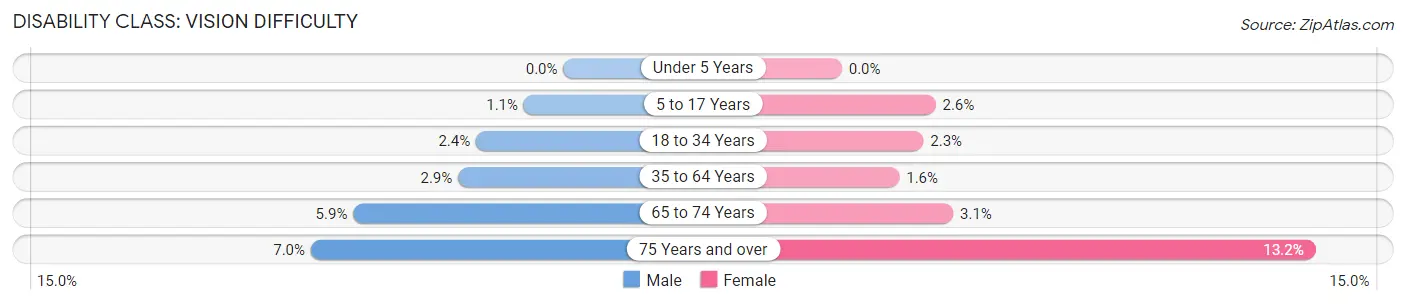
| Age Bracket | Male | Female |
| Under 5 Years | 0 (0.0%) | 0 (0.0%) |
| 5 to 17 Years | 58 (1.1%) | 126 (2.6%) |
| 18 to 34 Years | 175 (2.4%) | 149 (2.3%) |
| 35 to 64 Years | 307 (2.9%) | 168 (1.6%) |
| 65 to 74 Years | 155 (5.9%) | 89 (3.1%) |
| 75 Years and over | 98 (7.0%) | 294 (13.2%) |
Disability Class: Cognitive Difficulty
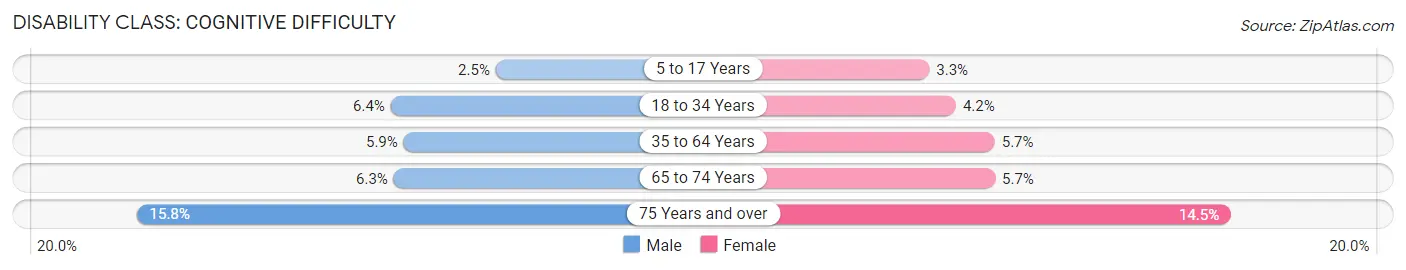
| Age Bracket | Male | Female |
| 5 to 17 Years | 133 (2.5%) | 157 (3.3%) |
| 18 to 34 Years | 461 (6.4%) | 278 (4.2%) |
| 35 to 64 Years | 621 (5.9%) | 595 (5.7%) |
| 65 to 74 Years | 167 (6.3%) | 163 (5.7%) |
| 75 Years and over | 221 (15.8%) | 322 (14.4%) |
Disability Class: Ambulatory Difficulty
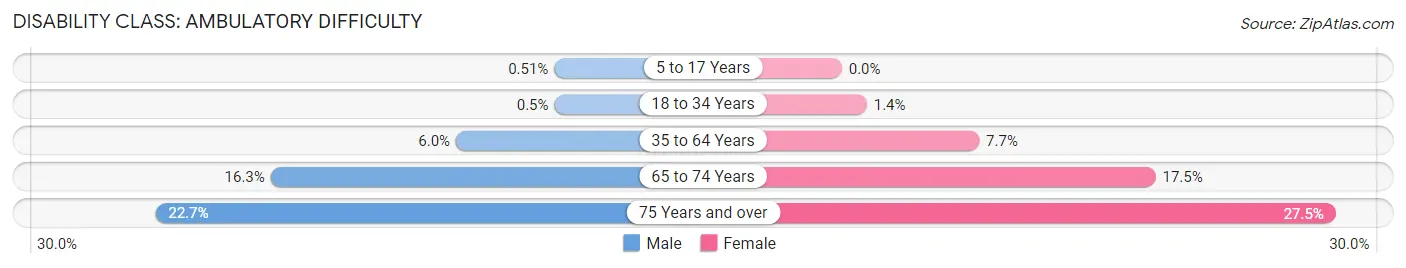
| Age Bracket | Male | Female |
| 5 to 17 Years | 27 (0.5%) | 0 (0.0%) |
| 18 to 34 Years | 36 (0.5%) | 91 (1.4%) |
| 35 to 64 Years | 626 (6.0%) | 802 (7.6%) |
| 65 to 74 Years | 432 (16.3%) | 501 (17.5%) |
| 75 Years and over | 317 (22.7%) | 613 (27.5%) |
Disability Class: Self-Care Difficulty
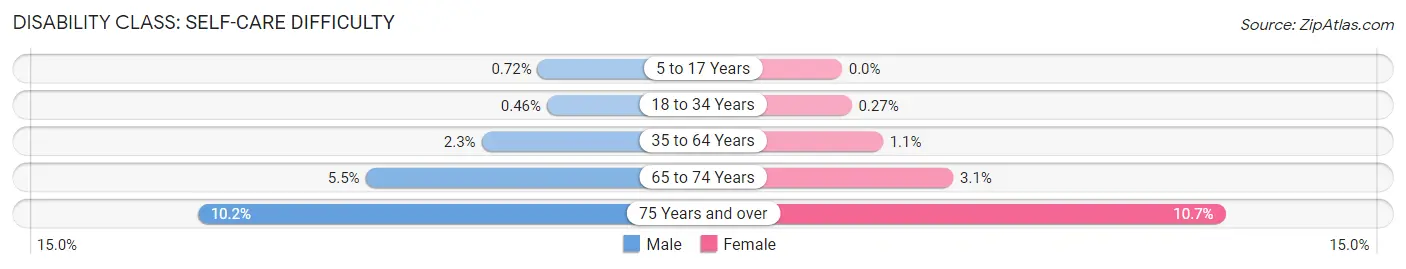
| Age Bracket | Male | Female |
| 5 to 17 Years | 38 (0.7%) | 0 (0.0%) |
| 18 to 34 Years | 33 (0.5%) | 18 (0.3%) |
| 35 to 64 Years | 239 (2.3%) | 119 (1.1%) |
| 65 to 74 Years | 146 (5.5%) | 89 (3.1%) |
| 75 Years and over | 142 (10.2%) | 238 (10.7%) |
Technology Access in Casper
Computing Device Access in Casper
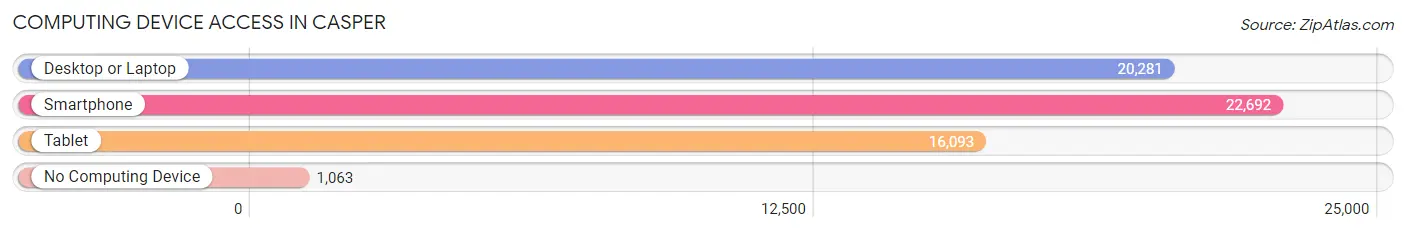
| Device Type | # Households | % Households |
| Desktop or Laptop | 20,281 | 80.8% |
| Smartphone | 22,692 | 90.4% |
| Tablet | 16,093 | 64.1% |
| No Computing Device | 1,063 | 4.2% |
| Total | 25,096 | 100.0% |
Internet Access in Casper
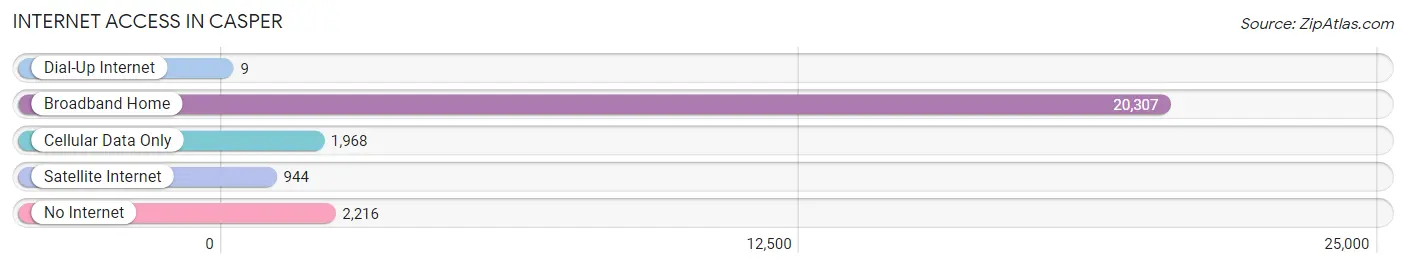
| Internet Type | # Households | % Households |
| Dial-Up Internet | 9 | 0.0% |
| Broadband Home | 20,307 | 80.9% |
| Cellular Data Only | 1,968 | 7.8% |
| Satellite Internet | 944 | 3.8% |
| No Internet | 2,216 | 8.8% |
| Total | 25,096 | 100.0% |
Casper Summary
Casper, Wyoming is a city located in Natrona County in the central part of the state. It is the county seat and the second largest city in Wyoming, with a population of approximately 55,000 people. Casper is located in the high plains of Wyoming, at an elevation of 5,150 feet. The city is situated on the North Platte River, and is surrounded by the Laramie Mountains to the east and the Casper Mountains to the west.
History
The area that is now Casper was first inhabited by Native American tribes, including the Arapaho, Shoshone, and Cheyenne. The first Europeans to explore the area were fur trappers, who arrived in the early 1800s. The first permanent settlement in the area was established in 1859, when Louis Guinard built a trading post near the present-day city. The town was named Casper in honor of Fort Caspar, which was built nearby in 1859.
In the late 1800s, Casper began to grow as a center for the cattle industry. The city was incorporated in 1888, and the first railroad arrived in 1891. The city continued to grow throughout the early 1900s, and by the 1950s, Casper had become an important center for oil and gas production.
Geography
Casper is located in the high plains of Wyoming, at an elevation of 5,150 feet. The city is situated on the North Platte River, and is surrounded by the Laramie Mountains to the east and the Casper Mountains to the west. The city covers an area of approximately 25 square miles, and is located approximately 200 miles northwest of Cheyenne, the state capital.
The climate in Casper is semi-arid, with hot summers and cold winters. The average high temperature in July is 85°F, and the average low temperature in January is 11°F. The city receives an average of 13 inches of precipitation per year, with most of it falling in the spring and summer months.
Economy
Casper’s economy is largely based on the energy industry, with oil and gas production being the primary source of employment. The city is also home to several manufacturing companies, including a large paper mill and a plastics plant. The city is also a regional center for healthcare, education, and retail.
The largest employers in Casper are the Natrona County School District, the Wyoming Medical Center, and the City of Casper. Other major employers include the Wyoming Department of Transportation, the Wyoming Department of Corrections, and the Wyoming Department of Health.
Demographics
As of the 2010 census, the population of Casper was 55,316. The racial makeup of the city was 90.2% White, 2.3% African American, 1.2% Native American, 1.2% Asian, 0.2% Pacific Islander, 3.2% from other races, and 1.9% from two or more races. Hispanic or Latino of any race were 8.2% of the population.
The median household income in Casper was $50,837, and the median family income was $60,945. The per capita income for the city was $25,845. About 11.2% of families and 14.3% of the population were below the poverty line, including 19.2% of those under age 18 and 8.2% of those age 65 or over.
Common Questions
What is Per Capita Income in Casper?
Per Capita income in Casper is $40,686.
What is the Median Family Income in Casper?
Median Family Income in Casper is $88,278.
What is the Median Household income in Casper?
Median Household Income in Casper is $67,011.
What is Income or Wage Gap in Casper?
Income or Wage Gap in Casper is 29.5%.
Women in Casper earn 70.5 cents for every dollar earned by a man.
What is Family Income Deficit in Casper?
Family Income Deficit in Casper is $9,753.
Families that are below poverty line in Casper earn $9,753 less on average than the poverty threshold level.
What is Inequality or Gini Index in Casper?
Inequality or Gini Index in Casper is 0.45.
What is the Total Population of Casper?
Total Population of Casper is 58,631.
What is the Total Male Population of Casper?
Total Male Population of Casper is 29,285.
What is the Total Female Population of Casper?
Total Female Population of Casper is 29,346.
What is the Ratio of Males per 100 Females in Casper?
There are 99.79 Males per 100 Females in Casper.
What is the Ratio of Females per 100 Males in Casper?
There are 100.21 Females per 100 Males in Casper.
What is the Median Population Age in Casper?
Median Population Age in Casper is 36.6 Years.
What is the Average Family Size in Casper
Average Family Size in Casper is 3.0 People.
What is the Average Household Size in Casper
Average Household Size in Casper is 2.3 People.
How Large is the Labor Force in Casper?
There are 31,546 People in the Labor Forcein in Casper.
What is the Percentage of People in the Labor Force in Casper?
68.5% of People are in the Labor Force in Casper.
What is the Unemployment Rate in Casper?
Unemployment Rate in Casper is 3.3%.