Laramie, WY Map & Demographics
Laramie Map
Laramie Overview
$31,959
PER CAPITA INCOME
$88,676
AVG FAMILY INCOME
$50,539
AVG HOUSEHOLD INCOME
35.3%
WAGE / INCOME GAP [ % ]
64.7¢/ $1
WAGE / INCOME GAP [ $ ]
$8,276
FAMILY INCOME DEFICIT
0.48
INEQUALITY / GINI INDEX
31,735
TOTAL POPULATION
16,726
MALE POPULATION
15,009
FEMALE POPULATION
111.44
MALES / 100 FEMALES
89.73
FEMALES / 100 MALES
26.6
MEDIAN AGE
2.7
AVG FAMILY SIZE
2.1
AVG HOUSEHOLD SIZE
19,564
LABOR FORCE [ PEOPLE ]
70.4%
PERCENT IN LABOR FORCE
4.7%
UNEMPLOYMENT RATE
Laramie Area Codes
Income in Laramie
Income Overview in Laramie
Per Capita Income in Laramie is $31,959, while median incomes of families and households are $88,676 and $50,539 respectively.
| Characteristic | Number | Measure |
| Per Capita Income | 31,735 | $31,959 |
| Median Family Income | 6,470 | $88,676 |
| Mean Family Income | 6,470 | $105,251 |
| Median Household Income | 13,943 | $50,539 |
| Mean Household Income | 13,943 | $72,568 |
| Income Deficit | 6,470 | $8,276 |
| Wage / Income Gap (%) | 31,735 | 35.28% |
| Wage / Income Gap ($) | 31,735 | 64.72¢ per $1 |
| Gini / Inequality Index | 31,735 | 0.48 |
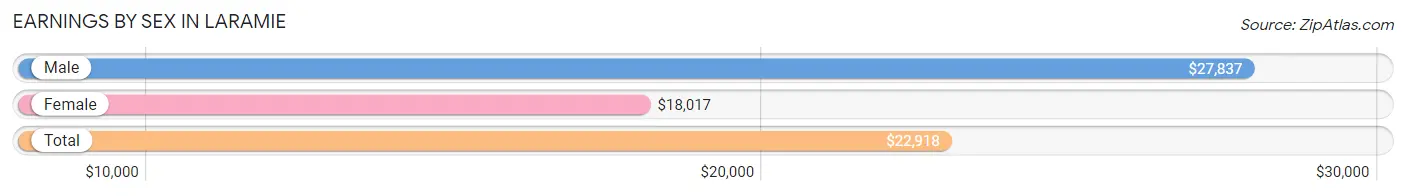
Earnings by Sex in Laramie
Average Earnings in Laramie are $22,918, $27,837 for men and $18,017 for women, a difference of 35.3%.
| Sex | Number | Average Earnings |
| Male | 12,351 (54.8%) | $27,837 |
| Female | 10,167 (45.2%) | $18,017 |
| Total | 22,518 (100.0%) | $22,918 |
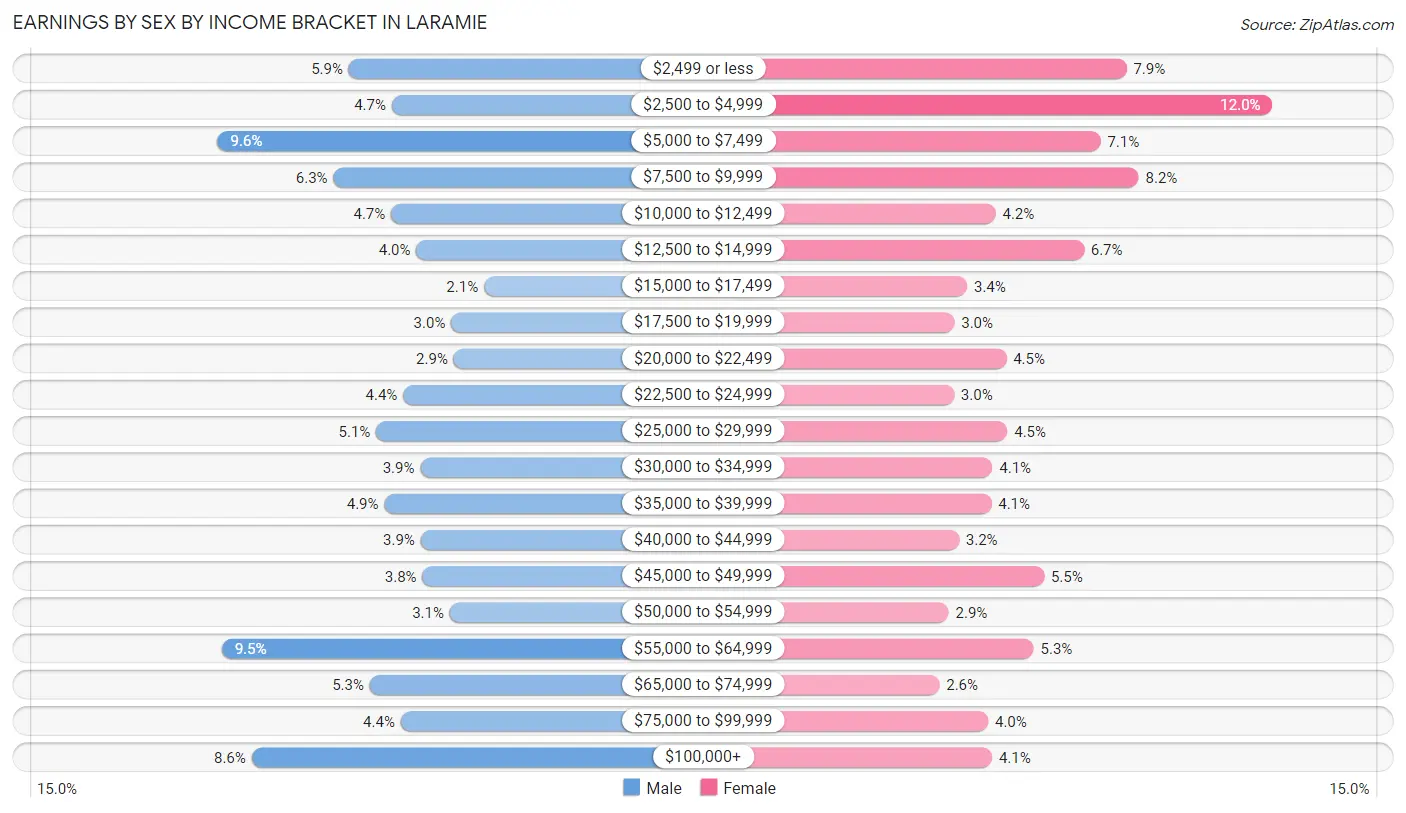
Earnings by Sex by Income Bracket in Laramie
The most common earnings brackets in Laramie are $5,000 to $7,499 for men (1,183 | 9.6%) and $2,500 to $4,999 for women (1,216 | 12.0%).
| Income | Male | Female |
| $2,499 or less | 727 (5.9%) | 799 (7.9%) |
| $2,500 to $4,999 | 578 (4.7%) | 1,216 (12.0%) |
| $5,000 to $7,499 | 1,183 (9.6%) | 725 (7.1%) |
| $7,500 to $9,999 | 781 (6.3%) | 834 (8.2%) |
| $10,000 to $12,499 | 581 (4.7%) | 425 (4.2%) |
| $12,500 to $14,999 | 493 (4.0%) | 677 (6.7%) |
| $15,000 to $17,499 | 258 (2.1%) | 344 (3.4%) |
| $17,500 to $19,999 | 372 (3.0%) | 307 (3.0%) |
| $20,000 to $22,499 | 363 (2.9%) | 455 (4.5%) |
| $22,500 to $24,999 | 538 (4.4%) | 306 (3.0%) |
| $25,000 to $29,999 | 632 (5.1%) | 459 (4.5%) |
| $30,000 to $34,999 | 479 (3.9%) | 416 (4.1%) |
| $35,000 to $39,999 | 604 (4.9%) | 413 (4.1%) |
| $40,000 to $44,999 | 478 (3.9%) | 320 (3.2%) |
| $45,000 to $49,999 | 472 (3.8%) | 563 (5.5%) |
| $50,000 to $54,999 | 377 (3.0%) | 291 (2.9%) |
| $55,000 to $64,999 | 1,168 (9.5%) | 534 (5.2%) |
| $65,000 to $74,999 | 655 (5.3%) | 264 (2.6%) |
| $75,000 to $99,999 | 547 (4.4%) | 404 (4.0%) |
| $100,000+ | 1,065 (8.6%) | 415 (4.1%) |
| Total | 12,351 (100.0%) | 10,167 (100.0%) |
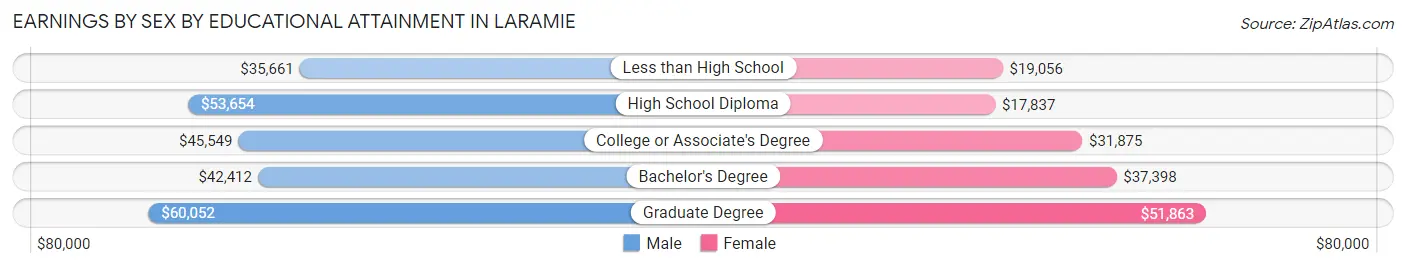
Earnings by Sex by Educational Attainment in Laramie
Average earnings in Laramie are $49,122 for men and $37,450 for women, a difference of 23.8%. Men with an educational attainment of graduate degree enjoy the highest average annual earnings of $60,052, while those with less than high school education earn the least with $35,661. Women with an educational attainment of graduate degree earn the most with the average annual earnings of $51,863, while those with high school diploma education have the smallest earnings of $17,837.
| Educational Attainment | Male Income | Female Income |
| Less than High School | $35,661 | $19,056 |
| High School Diploma | $53,654 | $17,837 |
| College or Associate's Degree | $45,549 | $31,875 |
| Bachelor's Degree | $42,412 | $37,398 |
| Graduate Degree | $60,052 | $51,863 |
| Total | $49,122 | $37,450 |
Family Income in Laramie
Family Income Brackets in Laramie
According to the Laramie family income data, there are 1,740 families falling into the $100,000 to $149,999 income range, which is the most common income bracket and makes up 26.9% of all families. Conversely, the $10,000 to $14,999 income bracket is the least frequent group with only 162 families (2.5%) belonging to this category.
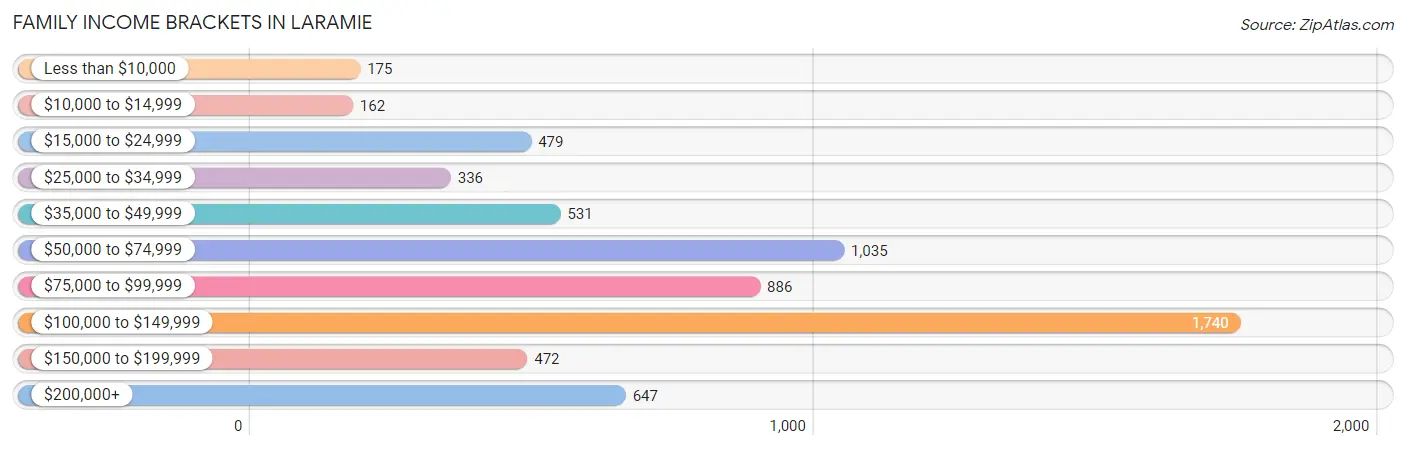
| Income Bracket | # Families | % Families |
| Less than $10,000 | 175 | 2.7% |
| $10,000 to $14,999 | 162 | 2.5% |
| $15,000 to $24,999 | 479 | 7.4% |
| $25,000 to $34,999 | 336 | 5.2% |
| $35,000 to $49,999 | 531 | 8.2% |
| $50,000 to $74,999 | 1,035 | 16.0% |
| $75,000 to $99,999 | 886 | 13.7% |
| $100,000 to $149,999 | 1,740 | 26.9% |
| $150,000 to $199,999 | 472 | 7.3% |
| $200,000+ | 647 | 10.0% |
Family Income by Famaliy Size in Laramie
6-person families (38 | 0.6%) account for the highest median family income in Laramie with $250,001 per family, while 6-person families (38 | 0.6%) have the highest median income of $41,667 per family member.
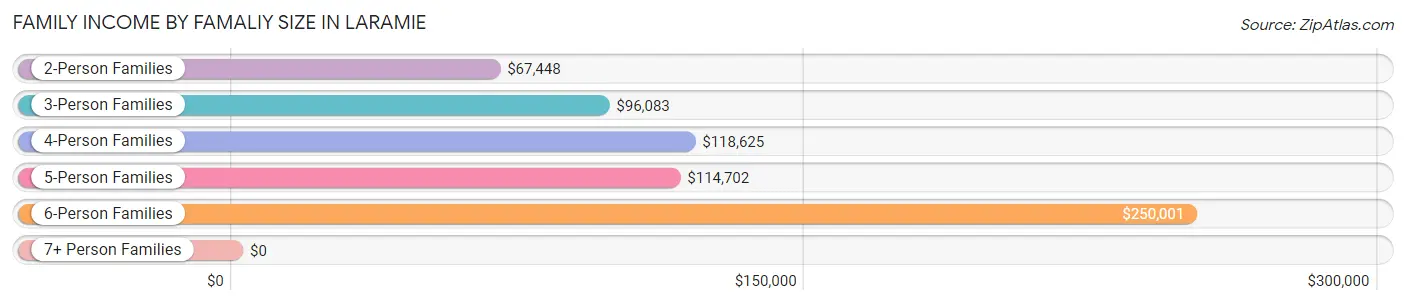
| Income Bracket | # Families | Median Income |
| 2-Person Families | 3,378 (52.2%) | $67,448 |
| 3-Person Families | 1,603 (24.8%) | $96,083 |
| 4-Person Families | 1,003 (15.5%) | $118,625 |
| 5-Person Families | 380 (5.9%) | $114,702 |
| 6-Person Families | 38 (0.6%) | $250,001 |
| 7+ Person Families | 68 (1.1%) | $0 |
| Total | 6,470 (100.0%) | $88,676 |
Family Income by Number of Earners in Laramie
The median family income in Laramie is $88,676, with families comprising 3+ earners (551) having the highest median family income of $118,483, while families with 1 earner (1,803) have the lowest median family income of $61,760, accounting for 8.5% and 27.9% of families, respectively.
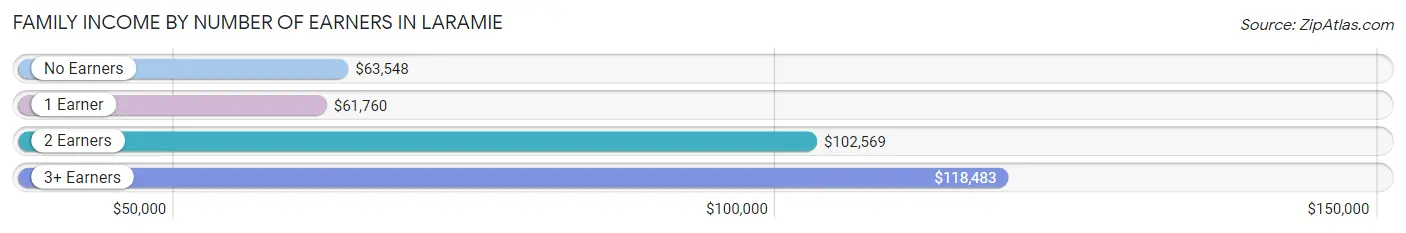
| Number of Earners | # Families | Median Income |
| No Earners | 488 (7.5%) | $63,548 |
| 1 Earner | 1,803 (27.9%) | $61,760 |
| 2 Earners | 3,628 (56.1%) | $102,569 |
| 3+ Earners | 551 (8.5%) | $118,483 |
| Total | 6,470 (100.0%) | $88,676 |
Household Income in Laramie
Household Income Brackets in Laramie
With 2,217 households falling in the category, the $100,000 to $149,999 income range is the most frequent in Laramie, accounting for 15.9% of all households. In contrast, only 572 households (4.1%) fall into the $150,000 to $199,999 income bracket, making it the least populous group.
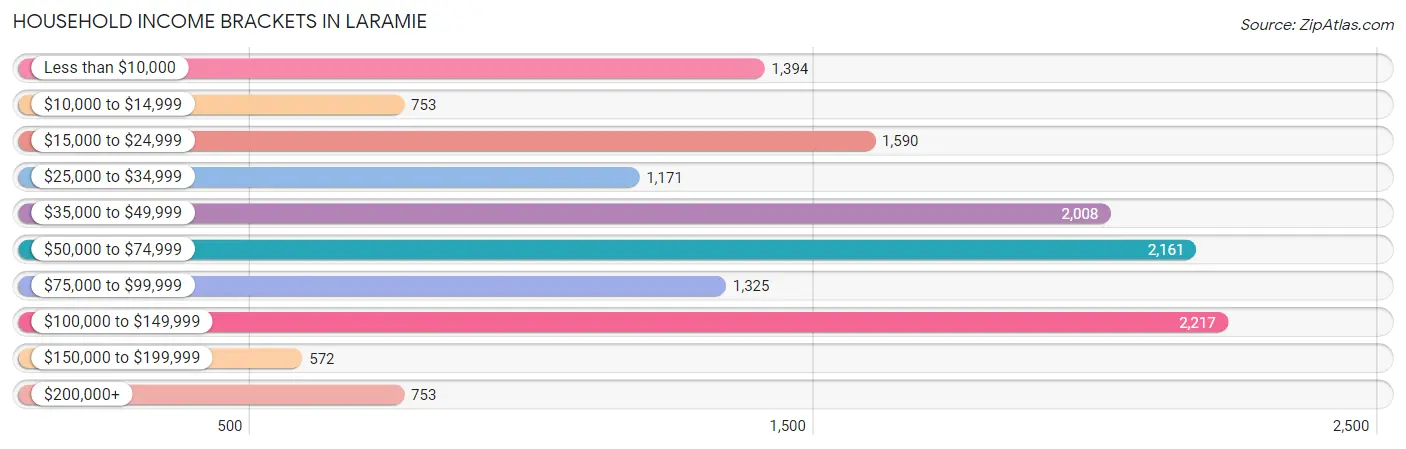
| Income Bracket | # Households | % Households |
| Less than $10,000 | 1,394 | 10.0% |
| $10,000 to $14,999 | 753 | 5.4% |
| $15,000 to $24,999 | 1,590 | 11.4% |
| $25,000 to $34,999 | 1,171 | 8.4% |
| $35,000 to $49,999 | 2,008 | 14.4% |
| $50,000 to $74,999 | 2,161 | 15.5% |
| $75,000 to $99,999 | 1,325 | 9.5% |
| $100,000 to $149,999 | 2,217 | 15.9% |
| $150,000 to $199,999 | 572 | 4.1% |
| $200,000+ | 753 | 5.4% |
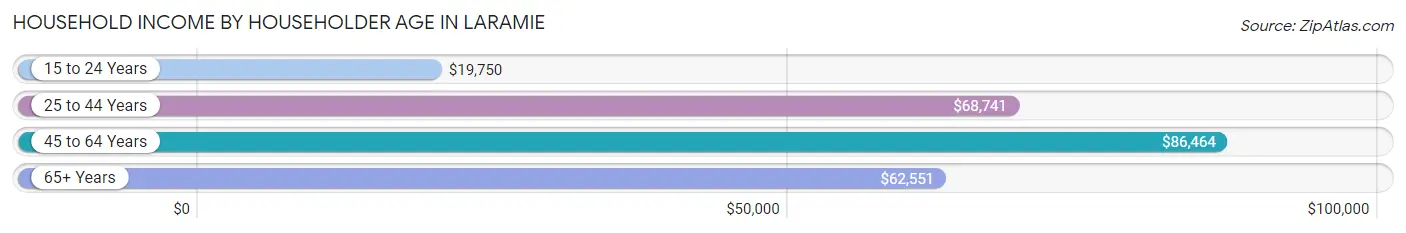
Household Income by Householder Age in Laramie
The median household income in Laramie is $50,539, with the highest median household income of $86,464 found in the 45 to 64 years age bracket for the primary householder. A total of 2,720 households (19.5%) fall into this category. Meanwhile, the 15 to 24 years age bracket for the primary householder has the lowest median household income of $19,750, with 3,955 households (28.4%) in this group.
| Income Bracket | # Households | Median Income |
| 15 to 24 Years | 3,955 (28.4%) | $19,750 |
| 25 to 44 Years | 5,109 (36.6%) | $68,741 |
| 45 to 64 Years | 2,720 (19.5%) | $86,464 |
| 65+ Years | 2,159 (15.5%) | $62,551 |
| Total | 13,943 (100.0%) | $50,539 |
Poverty in Laramie
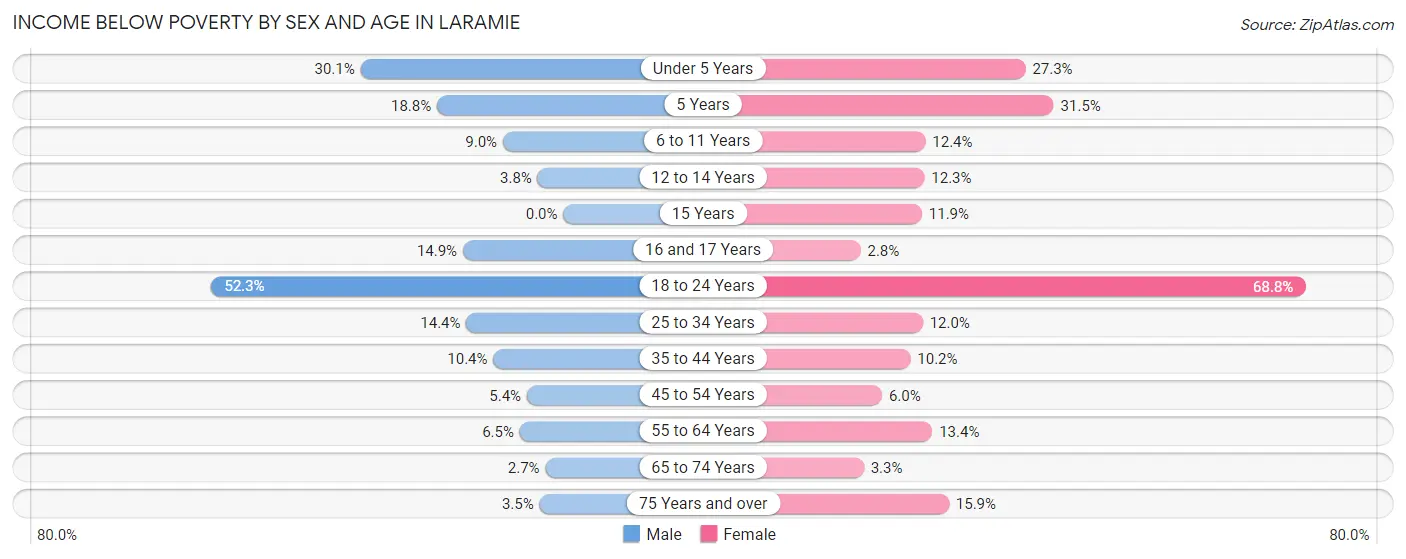
Income Below Poverty by Sex and Age in Laramie
With 22.2% poverty level for males and 27.7% for females among the residents of Laramie, 18 to 24 year old males and 18 to 24 year old females are the most vulnerable to poverty, with 2,249 males (52.3%) and 2,671 females (68.8%) in their respective age groups living below the poverty level.
| Age Bracket | Male | Female |
| Under 5 Years | 197 (30.1%) | 156 (27.3%) |
| 5 Years | 18 (18.8%) | 28 (31.5%) |
| 6 to 11 Years | 69 (9.0%) | 107 (12.4%) |
| 12 to 14 Years | 11 (3.8%) | 26 (12.3%) |
| 15 Years | 0 (0.0%) | 17 (11.9%) |
| 16 and 17 Years | 48 (14.9%) | 5 (2.8%) |
| 18 to 24 Years | 2,249 (52.3%) | 2,671 (68.8%) |
| 25 to 34 Years | 469 (14.4%) | 283 (12.0%) |
| 35 to 44 Years | 186 (10.4%) | 156 (10.2%) |
| 45 to 54 Years | 66 (5.4%) | 62 (6.0%) |
| 55 to 64 Years | 72 (6.5%) | 174 (13.4%) |
| 65 to 74 Years | 29 (2.7%) | 33 (3.3%) |
| 75 Years and over | 15 (3.5%) | 100 (15.9%) |
| Total | 3,429 (22.2%) | 3,818 (27.7%) |
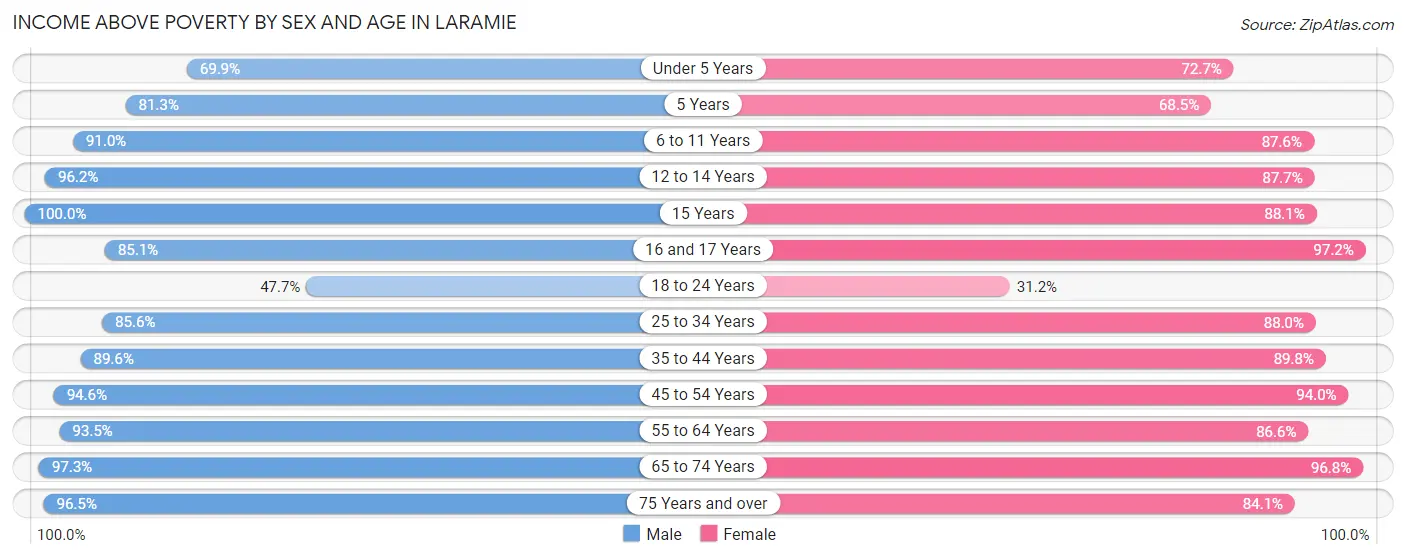
Income Above Poverty by Sex and Age in Laramie
According to the poverty statistics in Laramie, males aged 15 years and females aged 16 and 17 years are the age groups that are most secure financially, with 100.0% of males and 97.2% of females in these age groups living above the poverty line.
| Age Bracket | Male | Female |
| Under 5 Years | 457 (69.9%) | 416 (72.7%) |
| 5 Years | 78 (81.2%) | 61 (68.5%) |
| 6 to 11 Years | 700 (91.0%) | 755 (87.6%) |
| 12 to 14 Years | 278 (96.2%) | 186 (87.7%) |
| 15 Years | 136 (100.0%) | 126 (88.1%) |
| 16 and 17 Years | 274 (85.1%) | 175 (97.2%) |
| 18 to 24 Years | 2,054 (47.7%) | 1,211 (31.2%) |
| 25 to 34 Years | 2,788 (85.6%) | 2,073 (88.0%) |
| 35 to 44 Years | 1,604 (89.6%) | 1,376 (89.8%) |
| 45 to 54 Years | 1,155 (94.6%) | 976 (94.0%) |
| 55 to 64 Years | 1,040 (93.5%) | 1,122 (86.6%) |
| 65 to 74 Years | 1,063 (97.3%) | 982 (96.8%) |
| 75 Years and over | 410 (96.5%) | 529 (84.1%) |
| Total | 12,037 (77.8%) | 9,988 (72.4%) |
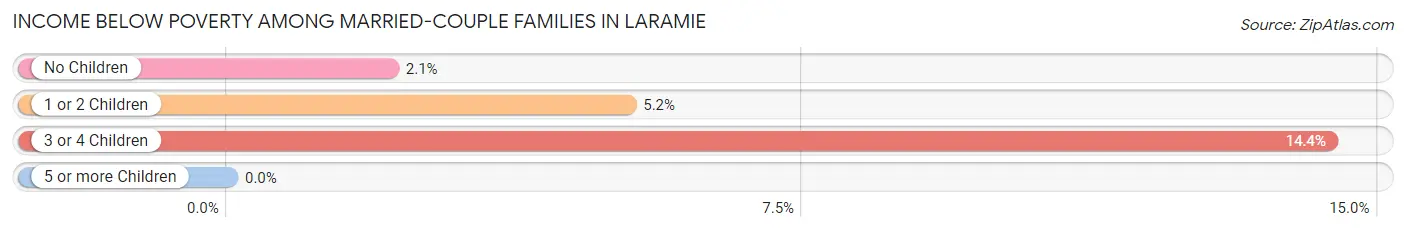
Income Below Poverty Among Married-Couple Families in Laramie
The poverty statistics for married-couple families in Laramie show that 4.1% or 199 of the total 4,829 families live below the poverty line. Families with 3 or 4 children have the highest poverty rate of 14.4%, comprising of 57 families. On the other hand, families with no children have the lowest poverty rate of 2.1%, which includes 60 families.
| Children | Above Poverty | Below Poverty |
| No Children | 2,794 (97.9%) | 60 (2.1%) |
| 1 or 2 Children | 1,496 (94.8%) | 82 (5.2%) |
| 3 or 4 Children | 340 (85.6%) | 57 (14.4%) |
| 5 or more Children | 0 (0.0%) | 0 (0.0%) |
| Total | 4,630 (95.9%) | 199 (4.1%) |
Income Below Poverty Among Single-Parent Households in Laramie
According to the poverty data in Laramie, 18.9% or 135 single-father households and 26.6% or 247 single-mother households are living below the poverty line. Among single-father households, those with 1 or 2 children have the highest poverty rate, with 56 households (26.7%) experiencing poverty. Likewise, among single-mother households, those with 3 or 4 children have the highest poverty rate, with 49 households (69.0%) falling below the poverty line.
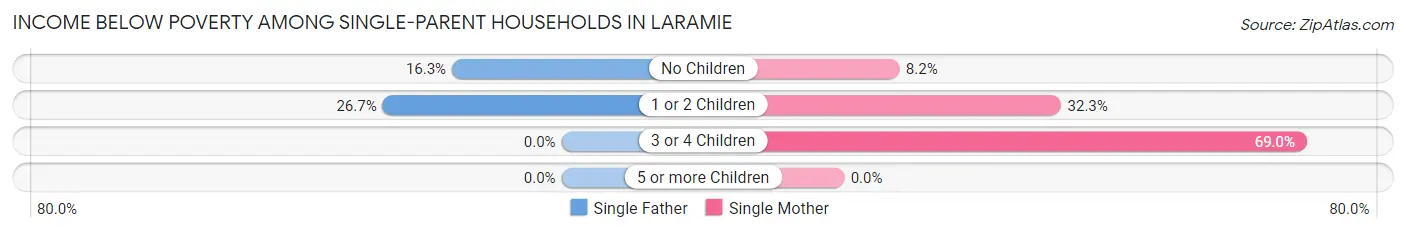
| Children | Single Father | Single Mother |
| No Children | 79 (16.3%) | 27 (8.2%) |
| 1 or 2 Children | 56 (26.7%) | 171 (32.3%) |
| 3 or 4 Children | 0 (0.0%) | 49 (69.0%) |
| 5 or more Children | 0 (0.0%) | 0 (0.0%) |
| Total | 135 (18.9%) | 247 (26.6%) |
Income Below Poverty Among Married-Couple vs Single-Parent Households in Laramie
The poverty data for Laramie shows that 199 of the married-couple family households (4.1%) and 382 of the single-parent households (23.3%) are living below the poverty level. Within the married-couple family households, those with 3 or 4 children have the highest poverty rate, with 57 households (14.4%) falling below the poverty line. Among the single-parent households, those with 3 or 4 children have the highest poverty rate, with 49 household (54.4%) living below poverty.
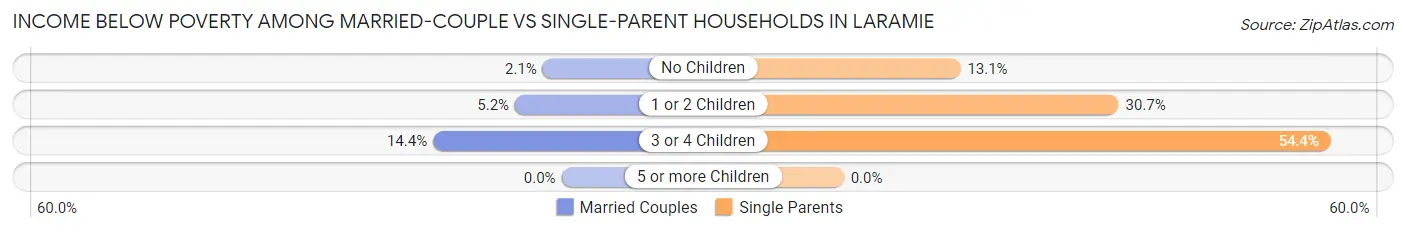
| Children | Married-Couple Families | Single-Parent Households |
| No Children | 60 (2.1%) | 106 (13.1%) |
| 1 or 2 Children | 82 (5.2%) | 227 (30.7%) |
| 3 or 4 Children | 57 (14.4%) | 49 (54.4%) |
| 5 or more Children | 0 (0.0%) | 0 (0.0%) |
| Total | 199 (4.1%) | 382 (23.3%) |
Race in Laramie
The most populous races in Laramie are White / Caucasian (27,177 | 85.6%), Hispanic or Latino (3,449 | 10.9%), and Two or more Races (2,173 | 6.9%).
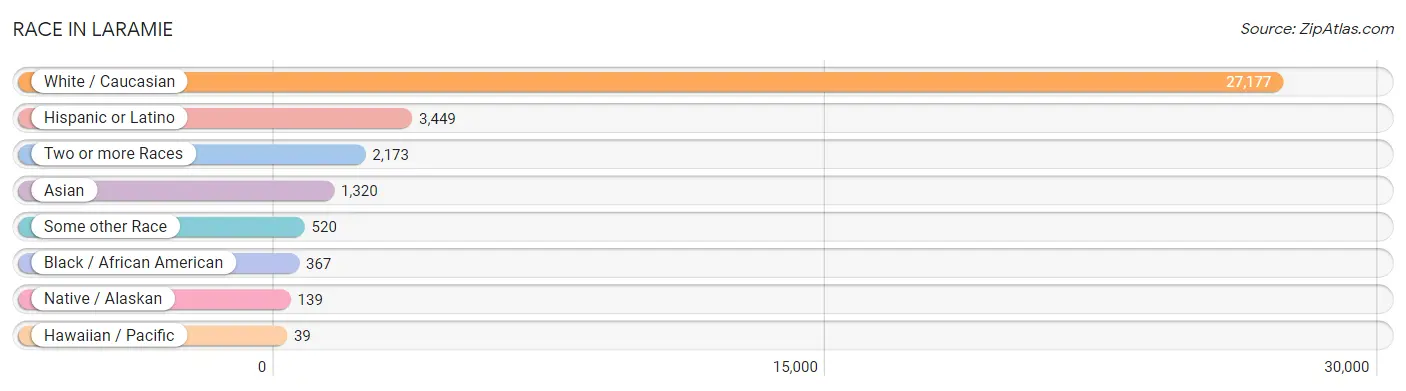
| Race | # Population | % Population |
| Asian | 1,320 | 4.2% |
| Black / African American | 367 | 1.2% |
| Hawaiian / Pacific | 39 | 0.1% |
| Hispanic or Latino | 3,449 | 10.9% |
| Native / Alaskan | 139 | 0.4% |
| White / Caucasian | 27,177 | 85.6% |
| Two or more Races | 2,173 | 6.9% |
| Some other Race | 520 | 1.6% |
| Total | 31,735 | 100.0% |
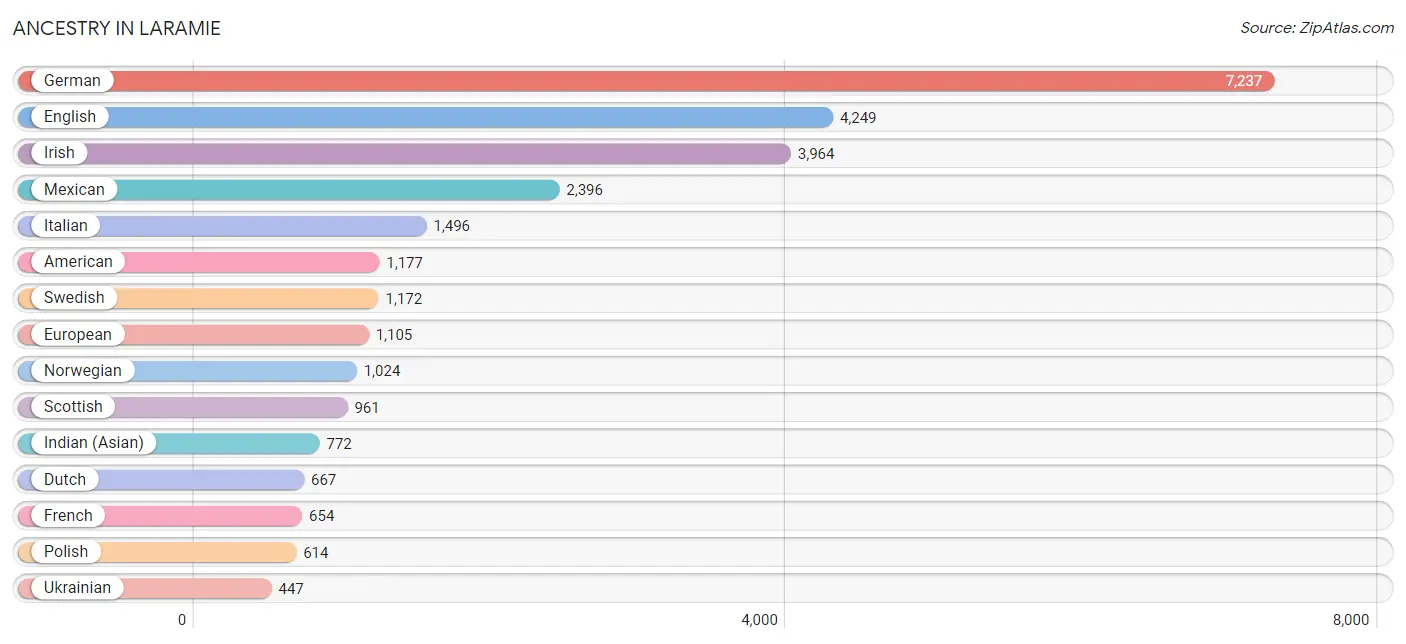
Ancestry in Laramie
The most populous ancestries reported in Laramie are German (7,237 | 22.8%), English (4,249 | 13.4%), Irish (3,964 | 12.5%), Mexican (2,396 | 7.5%), and Italian (1,496 | 4.7%), together accounting for 60.9% of all Laramie residents.
| Ancestry | # Population | % Population |
| African | 2 | 0.0% |
| American | 1,177 | 3.7% |
| Apache | 13 | 0.0% |
| Arab | 181 | 0.6% |
| Arapaho | 39 | 0.1% |
| Armenian | 20 | 0.1% |
| Austrian | 109 | 0.3% |
| Basque | 43 | 0.1% |
| Belgian | 37 | 0.1% |
| Bhutanese | 116 | 0.4% |
| Blackfeet | 20 | 0.1% |
| British | 418 | 1.3% |
| Burmese | 90 | 0.3% |
| Cajun | 47 | 0.2% |
| Canadian | 113 | 0.4% |
| Central American | 34 | 0.1% |
| Cherokee | 101 | 0.3% |
| Cheyenne | 5 | 0.0% |
| Chickasaw | 5 | 0.0% |
| Chippewa | 6 | 0.0% |
| Choctaw | 84 | 0.3% |
| Colombian | 5 | 0.0% |
| Creek | 58 | 0.2% |
| Croatian | 93 | 0.3% |
| Crow | 38 | 0.1% |
| Czech | 216 | 0.7% |
| Czechoslovakian | 19 | 0.1% |
| Danish | 188 | 0.6% |
| Dutch | 667 | 2.1% |
| Dutch West Indian | 5 | 0.0% |
| Eastern European | 114 | 0.4% |
| Ecuadorian | 5 | 0.0% |
| Egyptian | 34 | 0.1% |
| English | 4,249 | 13.4% |
| European | 1,105 | 3.5% |
| Finnish | 74 | 0.2% |
| French | 654 | 2.1% |
| French Canadian | 225 | 0.7% |
| German | 7,237 | 22.8% |
| Ghanaian | 17 | 0.1% |
| Greek | 134 | 0.4% |
| Guamanian / Chamorro | 39 | 0.1% |
| Guatemalan | 2 | 0.0% |
| Honduran | 5 | 0.0% |
| Hungarian | 190 | 0.6% |
| Icelander | 15 | 0.1% |
| Indian (Asian) | 772 | 2.4% |
| Iranian | 25 | 0.1% |
| Irish | 3,964 | 12.5% |
| Israeli | 10 | 0.0% |
| Italian | 1,496 | 4.7% |
| Jamaican | 4 | 0.0% |
| Japanese | 7 | 0.0% |
| Korean | 70 | 0.2% |
| Lebanese | 12 | 0.0% |
| Lithuanian | 31 | 0.1% |
| Luxembourger | 11 | 0.0% |
| Macedonian | 3 | 0.0% |
| Mexican | 2,396 | 7.5% |
| Mexican American Indian | 6 | 0.0% |
| Mongolian | 30 | 0.1% |
| Moroccan | 12 | 0.0% |
| Native Hawaiian | 5 | 0.0% |
| Navajo | 15 | 0.1% |
| New Zealander | 14 | 0.0% |
| Nigerian | 10 | 0.0% |
| Northern European | 122 | 0.4% |
| Norwegian | 1,024 | 3.2% |
| Pakistani | 86 | 0.3% |
| Panamanian | 27 | 0.1% |
| Pennsylvania German | 8 | 0.0% |
| Peruvian | 22 | 0.1% |
| Polish | 614 | 1.9% |
| Portuguese | 126 | 0.4% |
| Puerto Rican | 232 | 0.7% |
| Romanian | 34 | 0.1% |
| Russian | 276 | 0.9% |
| Samoan | 13 | 0.0% |
| Scandinavian | 291 | 0.9% |
| Scotch-Irish | 365 | 1.1% |
| Scottish | 961 | 3.0% |
| Serbian | 96 | 0.3% |
| Shoshone | 40 | 0.1% |
| Sioux | 1 | 0.0% |
| Slavic | 26 | 0.1% |
| Slovak | 50 | 0.2% |
| Slovene | 29 | 0.1% |
| South American | 99 | 0.3% |
| Spaniard | 206 | 0.6% |
| Spanish | 239 | 0.7% |
| Spanish American | 136 | 0.4% |
| Sri Lankan | 35 | 0.1% |
| Subsaharan African | 32 | 0.1% |
| Sudanese | 3 | 0.0% |
| Swedish | 1,172 | 3.7% |
| Swiss | 188 | 0.6% |
| Thai | 413 | 1.3% |
| Trinidadian and Tobagonian | 2 | 0.0% |
| Turkish | 12 | 0.0% |
| Ukrainian | 447 | 1.4% |
| Venezuelan | 67 | 0.2% |
| Vietnamese | 40 | 0.1% |
| Welsh | 227 | 0.7% |
| West Indian | 2 | 0.0% |
| Yaqui | 18 | 0.1% |
| Yugoslavian | 60 | 0.2% | View All 106 Rows |
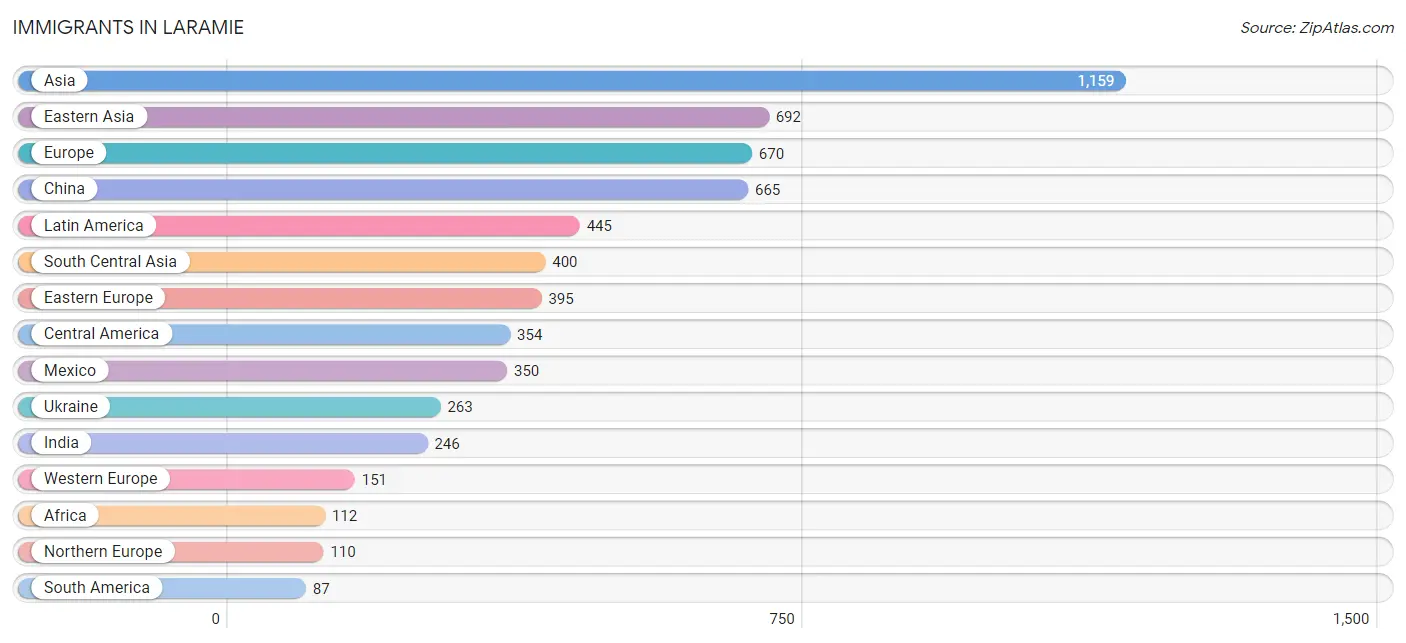
Immigrants in Laramie
The most numerous immigrant groups reported in Laramie came from Asia (1,159 | 3.6%), Eastern Asia (692 | 2.2%), Europe (670 | 2.1%), China (665 | 2.1%), and Latin America (445 | 1.4%), together accounting for 11.4% of all Laramie residents.
| Immigration Origin | # Population | % Population |
| Africa | 112 | 0.4% |
| Argentina | 10 | 0.0% |
| Asia | 1,159 | 3.6% |
| Bangladesh | 45 | 0.1% |
| Canada | 72 | 0.2% |
| Caribbean | 4 | 0.0% |
| Central America | 354 | 1.1% |
| China | 665 | 2.1% |
| Denmark | 2 | 0.0% |
| Eastern Africa | 2 | 0.0% |
| Eastern Asia | 692 | 2.2% |
| Eastern Europe | 395 | 1.2% |
| Ecuador | 6 | 0.0% |
| Egypt | 36 | 0.1% |
| England | 72 | 0.2% |
| Ethiopia | 2 | 0.0% |
| Europe | 670 | 2.1% |
| France | 10 | 0.0% |
| Germany | 83 | 0.3% |
| Ghana | 39 | 0.1% |
| Honduras | 4 | 0.0% |
| Hong Kong | 6 | 0.0% |
| Hungary | 16 | 0.1% |
| India | 246 | 0.8% |
| Iran | 46 | 0.1% |
| Italy | 14 | 0.0% |
| Jamaica | 4 | 0.0% |
| Japan | 2 | 0.0% |
| Korea | 25 | 0.1% |
| Latin America | 445 | 1.4% |
| Mexico | 350 | 1.1% |
| Nepal | 60 | 0.2% |
| Nigeria | 8 | 0.0% |
| Northern Africa | 61 | 0.2% |
| Northern Europe | 110 | 0.4% |
| Pakistan | 3 | 0.0% |
| Peru | 16 | 0.1% |
| Philippines | 14 | 0.0% |
| Poland | 49 | 0.2% |
| Russia | 32 | 0.1% |
| Saudi Arabia | 25 | 0.1% |
| Serbia | 9 | 0.0% |
| South America | 87 | 0.3% |
| South Central Asia | 400 | 1.3% |
| South Eastern Asia | 29 | 0.1% |
| Southern Europe | 14 | 0.0% |
| Sudan | 5 | 0.0% |
| Sweden | 29 | 0.1% |
| Switzerland | 58 | 0.2% |
| Thailand | 3 | 0.0% |
| Turkey | 12 | 0.0% |
| Ukraine | 263 | 0.8% |
| Venezuela | 55 | 0.2% |
| Vietnam | 12 | 0.0% |
| Western Africa | 49 | 0.2% |
| Western Asia | 38 | 0.1% |
| Western Europe | 151 | 0.5% | View All 57 Rows |
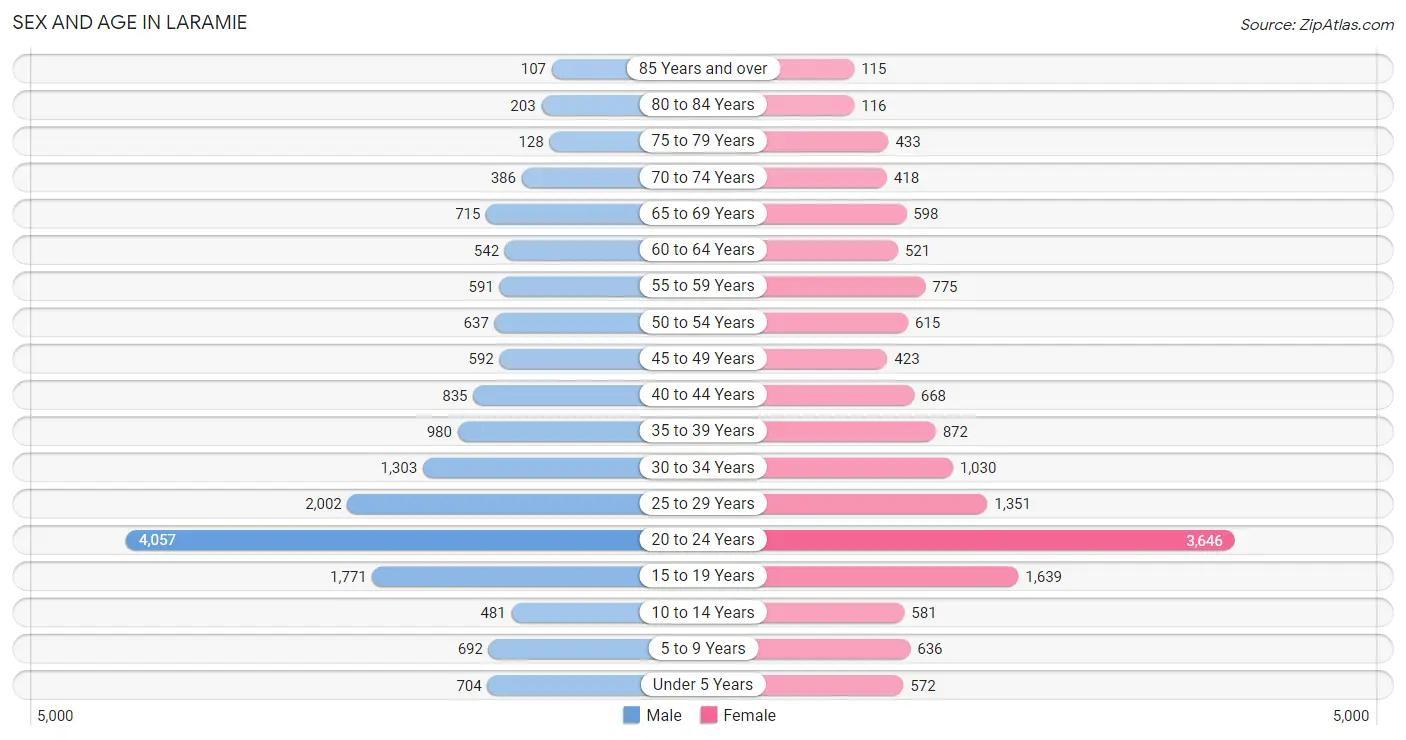
Sex and Age in Laramie
Sex and Age in Laramie
The most populous age groups in Laramie are 20 to 24 Years (4,057 | 24.3%) for men and 20 to 24 Years (3,646 | 24.3%) for women.
| Age Bracket | Male | Female |
| Under 5 Years | 704 (4.2%) | 572 (3.8%) |
| 5 to 9 Years | 692 (4.1%) | 636 (4.2%) |
| 10 to 14 Years | 481 (2.9%) | 581 (3.9%) |
| 15 to 19 Years | 1,771 (10.6%) | 1,639 (10.9%) |
| 20 to 24 Years | 4,057 (24.3%) | 3,646 (24.3%) |
| 25 to 29 Years | 2,002 (12.0%) | 1,351 (9.0%) |
| 30 to 34 Years | 1,303 (7.8%) | 1,030 (6.9%) |
| 35 to 39 Years | 980 (5.9%) | 872 (5.8%) |
| 40 to 44 Years | 835 (5.0%) | 668 (4.4%) |
| 45 to 49 Years | 592 (3.5%) | 423 (2.8%) |
| 50 to 54 Years | 637 (3.8%) | 615 (4.1%) |
| 55 to 59 Years | 591 (3.5%) | 775 (5.2%) |
| 60 to 64 Years | 542 (3.2%) | 521 (3.5%) |
| 65 to 69 Years | 715 (4.3%) | 598 (4.0%) |
| 70 to 74 Years | 386 (2.3%) | 418 (2.8%) |
| 75 to 79 Years | 128 (0.8%) | 433 (2.9%) |
| 80 to 84 Years | 203 (1.2%) | 116 (0.8%) |
| 85 Years and over | 107 (0.6%) | 115 (0.8%) |
| Total | 16,726 (100.0%) | 15,009 (100.0%) |
Families and Households in Laramie
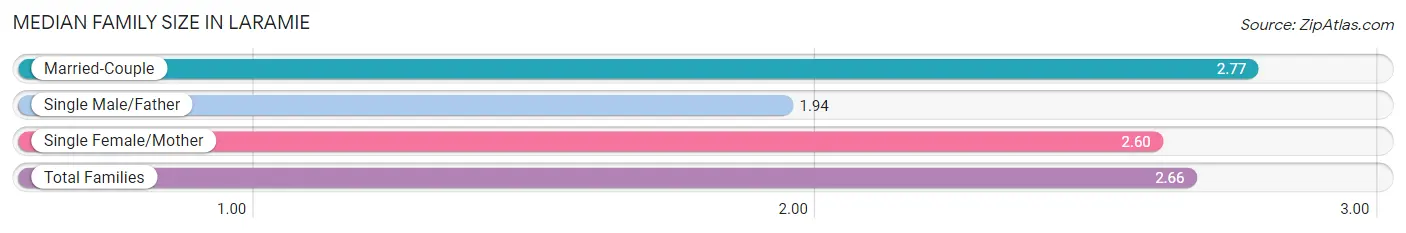
Median Family Size in Laramie
The median family size in Laramie is 2.66 persons per family, with married-couple families (4,829 | 74.6%) accounting for the largest median family size of 2.77 persons per family. On the other hand, single male/father families (713 | 11.0%) represent the smallest median family size with 1.94 persons per family.
| Family Type | # Families | Family Size |
| Married-Couple | 4,829 (74.6%) | 2.77 |
| Single Male/Father | 713 (11.0%) | 1.94 |
| Single Female/Mother | 928 (14.3%) | 2.60 |
| Total Families | 6,470 (100.0%) | 2.66 |
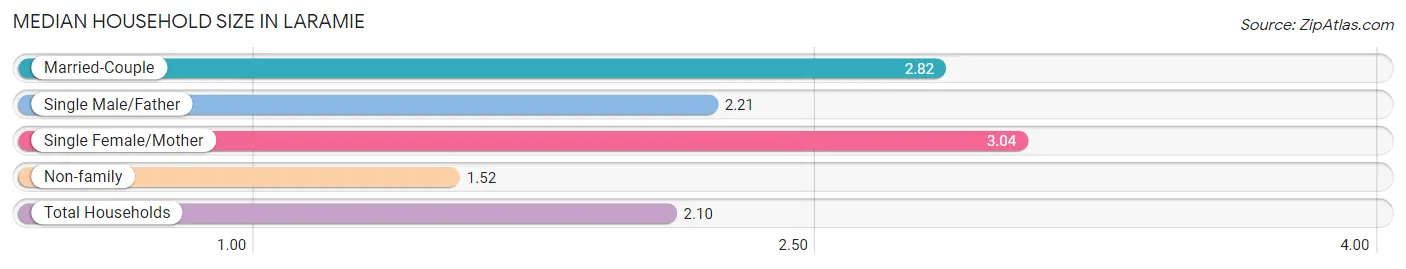
Median Household Size in Laramie
The median household size in Laramie is 2.10 persons per household, with single female/mother households (928 | 6.7%) accounting for the largest median household size of 3.04 persons per household. non-family households (7,473 | 53.6%) represent the smallest median household size with 1.52 persons per household.
| Household Type | # Households | Household Size |
| Married-Couple | 4,829 (34.6%) | 2.82 |
| Single Male/Father | 713 (5.1%) | 2.21 |
| Single Female/Mother | 928 (6.7%) | 3.04 |
| Non-family | 7,473 (53.6%) | 1.52 |
| Total Households | 13,943 (100.0%) | 2.10 |
Household Size by Marriage Status in Laramie
Out of a total of 13,943 households in Laramie, 6,470 (46.4%) are family households, while 7,473 (53.6%) are nonfamily households. The most numerous type of family households are 2-person households, comprising 3,015, and the most common type of nonfamily households are 1-person households, comprising 4,225.
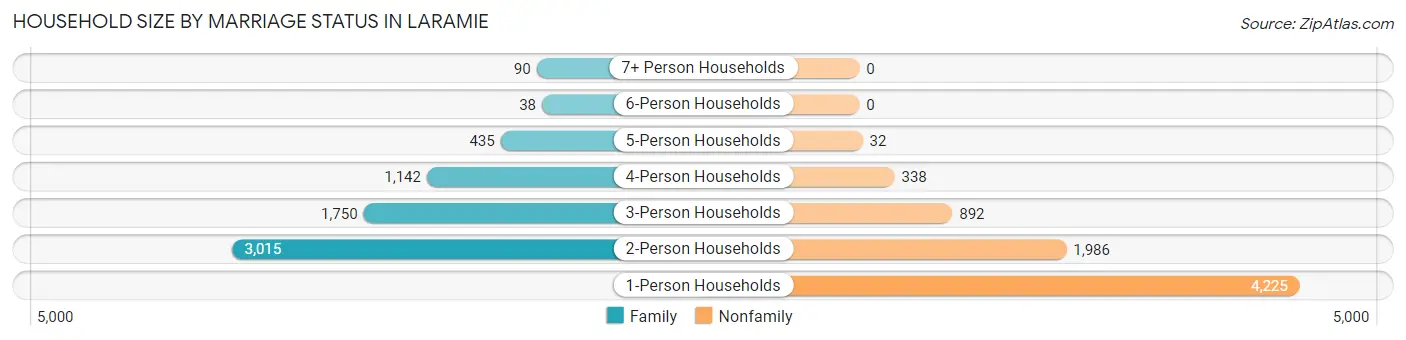
| Household Size | Family Households | Nonfamily Households |
| 1-Person Households | - | 4,225 (30.3%) |
| 2-Person Households | 3,015 (21.6%) | 1,986 (14.2%) |
| 3-Person Households | 1,750 (12.6%) | 892 (6.4%) |
| 4-Person Households | 1,142 (8.2%) | 338 (2.4%) |
| 5-Person Households | 435 (3.1%) | 32 (0.2%) |
| 6-Person Households | 38 (0.3%) | 0 (0.0%) |
| 7+ Person Households | 90 (0.6%) | 0 (0.0%) |
| Total | 6,470 (46.4%) | 7,473 (53.6%) |
Female Fertility in Laramie
Fertility by Age in Laramie
Average fertility rate in Laramie is 37.0 births per 1,000 women. Women in the age bracket of 20 to 34 years have the highest fertility rate with 45.0 births per 1,000 women. Women in the age bracket of 20 to 34 years acount for 75.1% of all women with births.
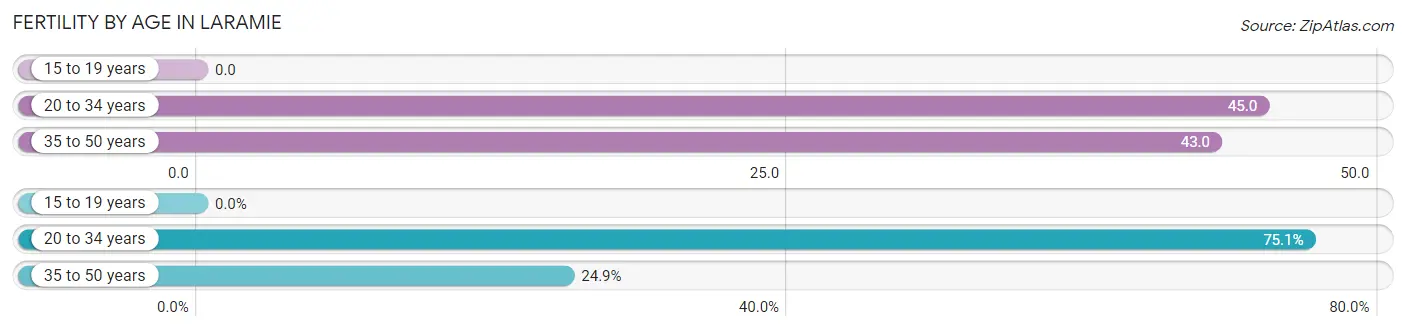
| Age Bracket | Women with Births | Births / 1,000 Women |
| 15 to 19 years | 0 (0.0%) | 0.0 |
| 20 to 34 years | 272 (75.1%) | 45.0 |
| 35 to 50 years | 90 (24.9%) | 43.0 |
| Total | 362 (100.0%) | 37.0 |
Fertility by Age by Marriage Status in Laramie
71.0% of women with births (362) in Laramie are married. The highest percentage of unmarried women with births falls into 20 to 34 years age bracket with 38.6% of them unmarried at the time of birth, while the lowest percentage of unmarried women with births belong to 35 to 50 years age bracket with 0.0% of them unmarried.
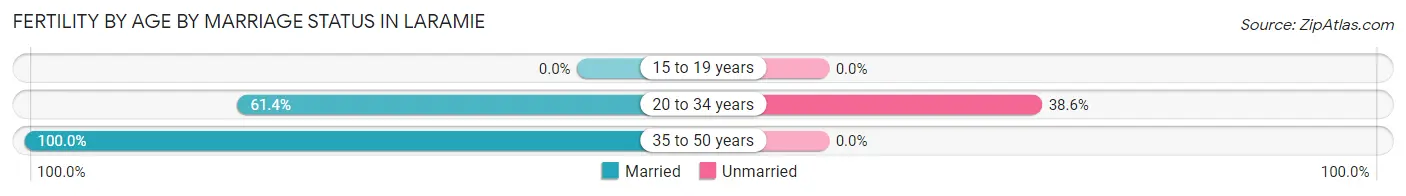
| Age Bracket | Married | Unmarried |
| 15 to 19 years | 0 (0.0%) | 0 (0.0%) |
| 20 to 34 years | 167 (61.4%) | 105 (38.6%) |
| 35 to 50 years | 90 (100.0%) | 0 (0.0%) |
| Total | 257 (71.0%) | 105 (29.0%) |
Fertility by Education in Laramie
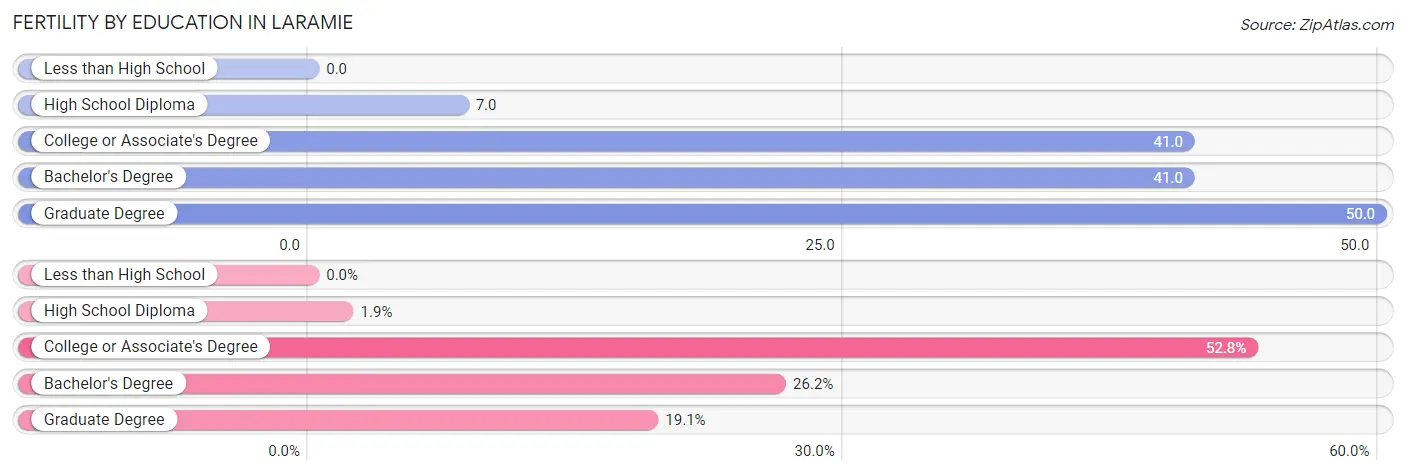
| Educational Attainment | Women with Births | Births / 1,000 Women |
| Less than High School | 0 (0.0%) | 0.0 |
| High School Diploma | 7 (1.9%) | 7.0 |
| College or Associate's Degree | 191 (52.8%) | 41.0 |
| Bachelor's Degree | 95 (26.2%) | 41.0 |
| Graduate Degree | 69 (19.1%) | 50.0 |
| Total | 362 (100.0%) | 37.0 |
Fertility by Education by Marriage Status in Laramie
29.0% of women with births in Laramie are unmarried. Women with the educational attainment of high school diploma are most likely to be married with 100.0% of them married at childbirth, while women with the educational attainment of college or associate's degree are least likely to be married with 51.8% of them unmarried at childbirth.
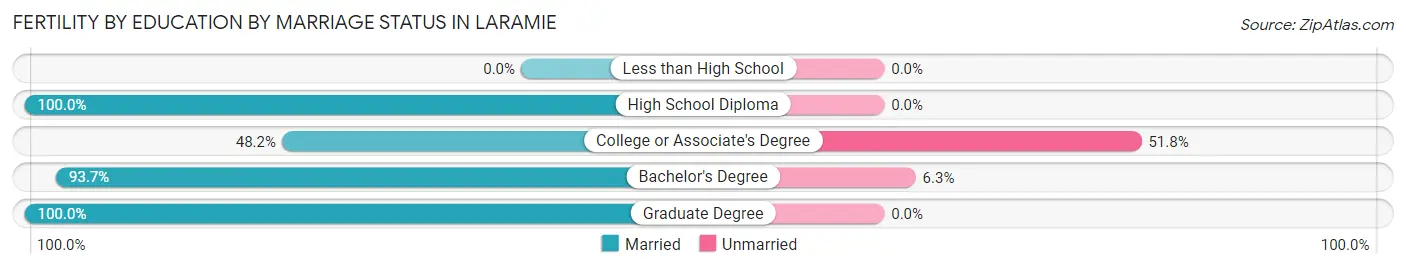
| Educational Attainment | Married | Unmarried |
| Less than High School | 0 (0.0%) | 0 (0.0%) |
| High School Diploma | 7 (100.0%) | 0 (0.0%) |
| College or Associate's Degree | 92 (48.2%) | 99 (51.8%) |
| Bachelor's Degree | 89 (93.7%) | 6 (6.3%) |
| Graduate Degree | 69 (100.0%) | 0 (0.0%) |
| Total | 257 (71.0%) | 105 (29.0%) |
Employment Characteristics in Laramie
Employment by Class of Employer in Laramie
Among the 18,051 employed individuals in Laramie, private company employees (9,194 | 50.9%), state government employees (3,799 | 21.0%), and not-for-profit organizations (1,961 | 10.9%) make up the most common classes of employment.
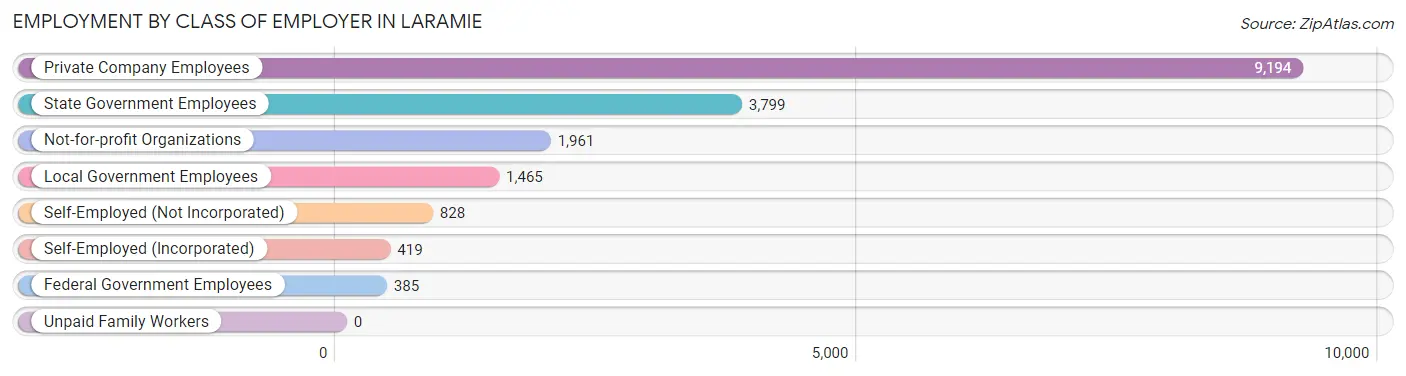
| Employer Class | # Employees | % Employees |
| Private Company Employees | 9,194 | 50.9% |
| Self-Employed (Incorporated) | 419 | 2.3% |
| Self-Employed (Not Incorporated) | 828 | 4.6% |
| Not-for-profit Organizations | 1,961 | 10.9% |
| Local Government Employees | 1,465 | 8.1% |
| State Government Employees | 3,799 | 21.0% |
| Federal Government Employees | 385 | 2.1% |
| Unpaid Family Workers | 0 | 0.0% |
| Total | 18,051 | 100.0% |
Employment Status by Age in Laramie
According to the labor force statistics for Laramie, out of the total population over 16 years of age (27,790), 70.4% or 19,564 individuals are in the labor force, with 4.7% or 920 of them unemployed. The age group with the highest labor force participation rate is 30 to 34 years, with 90.7% or 2,116 individuals in the labor force. Within the labor force, the 16 to 19 years age range has the highest percentage of unemployed individuals, with 18.1% or 268 of them being unemployed.
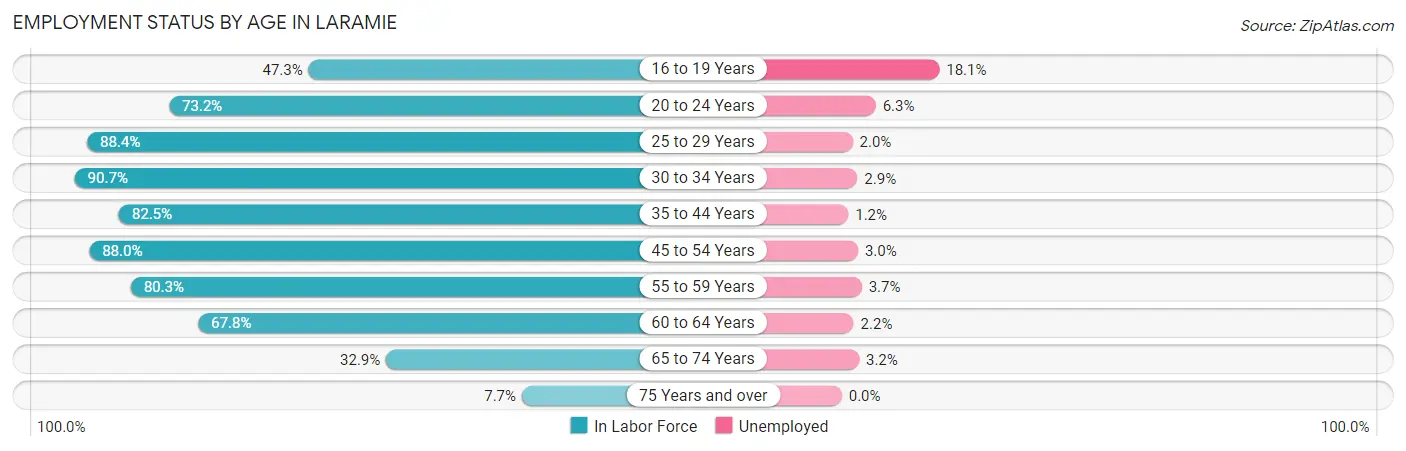
| Age Bracket | In Labor Force | Unemployed |
| 16 to 19 Years | 1,481 (47.3%) | 268 (18.1%) |
| 20 to 24 Years | 5,639 (73.2%) | 355 (6.3%) |
| 25 to 29 Years | 2,964 (88.4%) | 59 (2.0%) |
| 30 to 34 Years | 2,116 (90.7%) | 61 (2.9%) |
| 35 to 44 Years | 2,768 (82.5%) | 33 (1.2%) |
| 45 to 54 Years | 1,995 (88.0%) | 60 (3.0%) |
| 55 to 59 Years | 1,097 (80.3%) | 41 (3.7%) |
| 60 to 64 Years | 721 (67.8%) | 16 (2.2%) |
| 65 to 74 Years | 696 (32.9%) | 22 (3.2%) |
| 75 Years and over | 85 (7.7%) | 0 (0.0%) |
| Total | 19,564 (70.4%) | 920 (4.7%) |
Employment Status by Educational Attainment in Laramie
According to labor force statistics for Laramie, 84.9% of individuals (11,663) out of the total population between 25 and 64 years of age (13,737) are in the labor force, with 2.3% or 268 of them being unemployed. The group with the highest labor force participation rate are those with the educational attainment of bachelor's degree or higher, with 88.7% or 6,898 individuals in the labor force. Within the labor force, individuals with less than high school education have the highest percentage of unemployment, with 12.1% or 47 of them being unemployed.
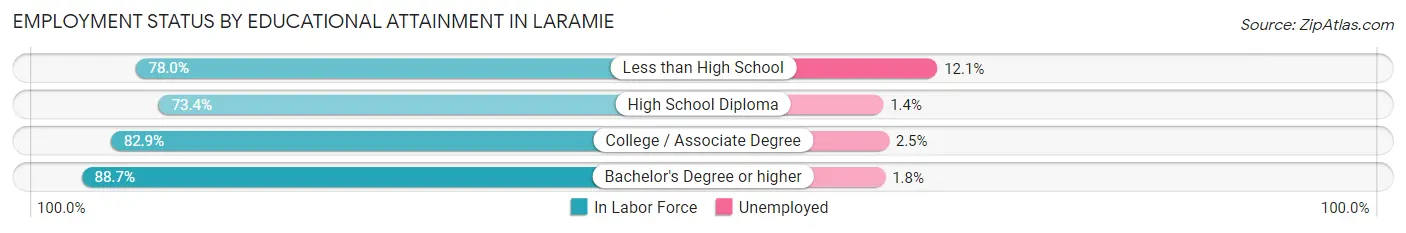
| Educational Attainment | In Labor Force | Unemployed |
| Less than High School | 387 (78.0%) | 60 (12.1%) |
| High School Diploma | 1,212 (73.4%) | 23 (1.4%) |
| College / Associate Degree | 3,161 (82.9%) | 95 (2.5%) |
| Bachelor's Degree or higher | 6,898 (88.7%) | 140 (1.8%) |
| Total | 11,663 (84.9%) | 316 (2.3%) |
Employment Occupations by Sex in Laramie
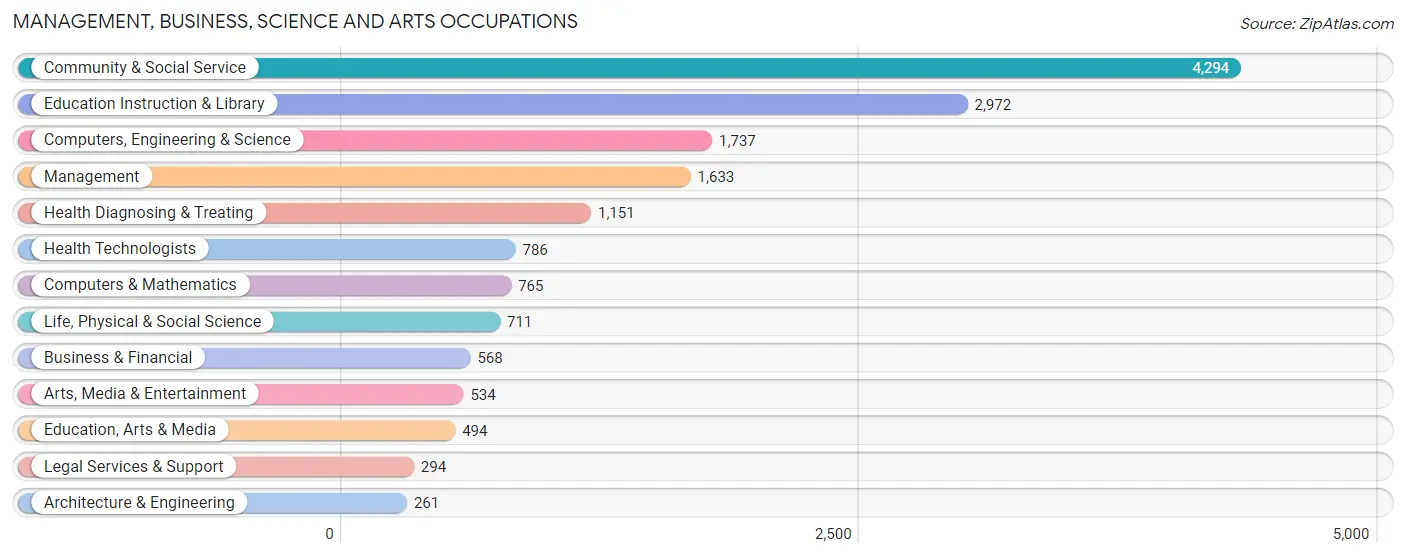
Management, Business, Science and Arts Occupations
The most common Management, Business, Science and Arts occupations in Laramie are Community & Social Service (4,294 | 23.1%), Education Instruction & Library (2,972 | 16.0%), Computers, Engineering & Science (1,737 | 9.3%), Management (1,633 | 8.8%), and Health Diagnosing & Treating (1,151 | 6.2%).
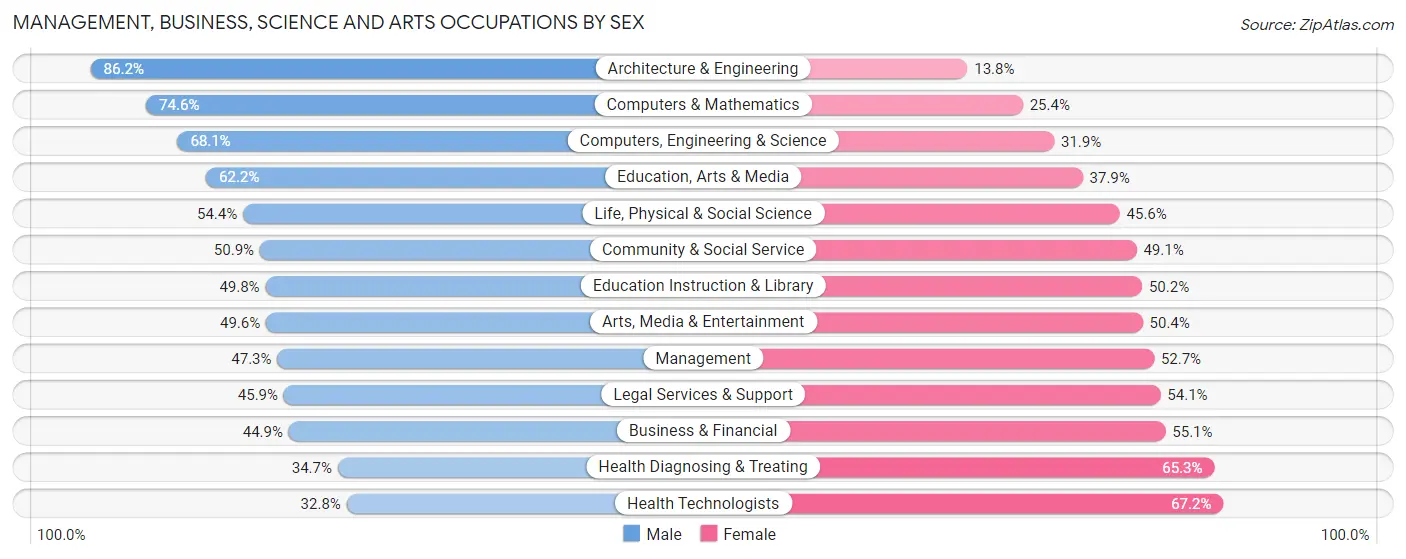
Management, Business, Science and Arts Occupations by Sex
Within the Management, Business, Science and Arts occupations in Laramie, the most male-oriented occupations are Architecture & Engineering (86.2%), Computers & Mathematics (74.6%), and Computers, Engineering & Science (68.1%), while the most female-oriented occupations are Health Technologists (67.2%), Health Diagnosing & Treating (65.3%), and Business & Financial (55.1%).
| Occupation | Male | Female |
| Management | 772 (47.3%) | 861 (52.7%) |
| Business & Financial | 255 (44.9%) | 313 (55.1%) |
| Computers, Engineering & Science | 1,183 (68.1%) | 554 (31.9%) |
| Computers & Mathematics | 571 (74.6%) | 194 (25.4%) |
| Architecture & Engineering | 225 (86.2%) | 36 (13.8%) |
| Life, Physical & Social Science | 387 (54.4%) | 324 (45.6%) |
| Community & Social Service | 2,186 (50.9%) | 2,108 (49.1%) |
| Education, Arts & Media | 307 (62.2%) | 187 (37.9%) |
| Legal Services & Support | 135 (45.9%) | 159 (54.1%) |
| Education Instruction & Library | 1,479 (49.8%) | 1,493 (50.2%) |
| Arts, Media & Entertainment | 265 (49.6%) | 269 (50.4%) |
| Health Diagnosing & Treating | 399 (34.7%) | 752 (65.3%) |
| Health Technologists | 258 (32.8%) | 528 (67.2%) |
| Total (Category) | 4,795 (51.1%) | 4,588 (48.9%) |
| Total (Overall) | 10,146 (54.5%) | 8,459 (45.5%) |
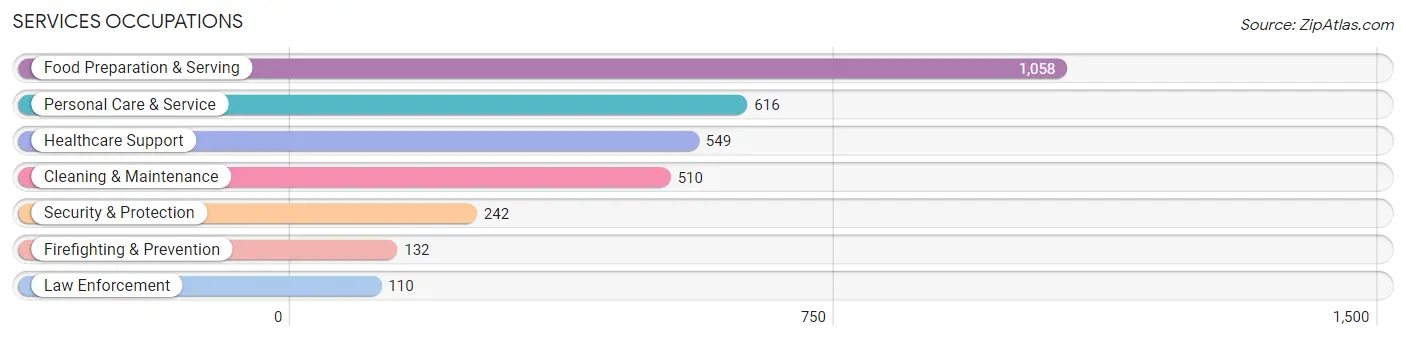
Services Occupations
The most common Services occupations in Laramie are Food Preparation & Serving (1,058 | 5.7%), Personal Care & Service (616 | 3.3%), Healthcare Support (549 | 2.9%), Cleaning & Maintenance (510 | 2.7%), and Security & Protection (242 | 1.3%).
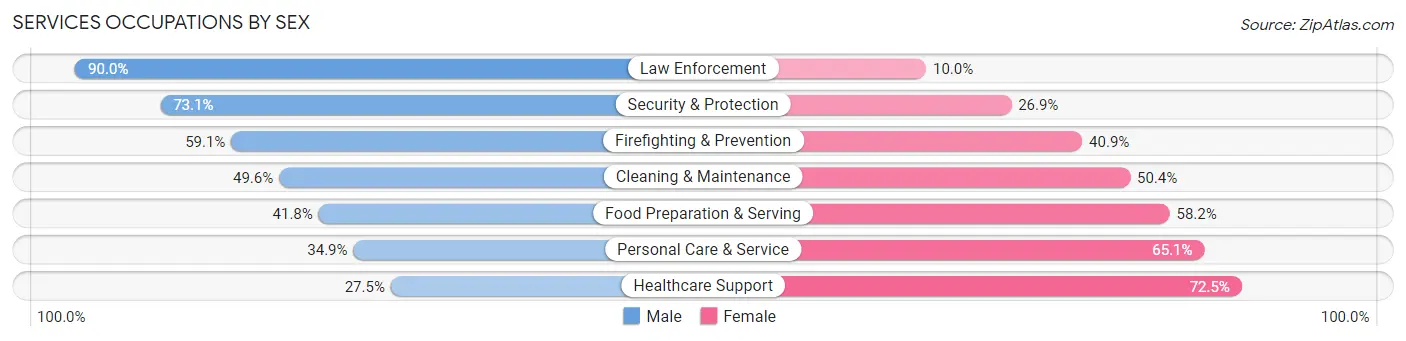
Services Occupations by Sex
Within the Services occupations in Laramie, the most male-oriented occupations are Law Enforcement (90.0%), Security & Protection (73.1%), and Firefighting & Prevention (59.1%), while the most female-oriented occupations are Healthcare Support (72.5%), Personal Care & Service (65.1%), and Food Preparation & Serving (58.2%).
| Occupation | Male | Female |
| Healthcare Support | 151 (27.5%) | 398 (72.5%) |
| Security & Protection | 177 (73.1%) | 65 (26.9%) |
| Firefighting & Prevention | 78 (59.1%) | 54 (40.9%) |
| Law Enforcement | 99 (90.0%) | 11 (10.0%) |
| Food Preparation & Serving | 442 (41.8%) | 616 (58.2%) |
| Cleaning & Maintenance | 253 (49.6%) | 257 (50.4%) |
| Personal Care & Service | 215 (34.9%) | 401 (65.1%) |
| Total (Category) | 1,238 (41.6%) | 1,737 (58.4%) |
| Total (Overall) | 10,146 (54.5%) | 8,459 (45.5%) |
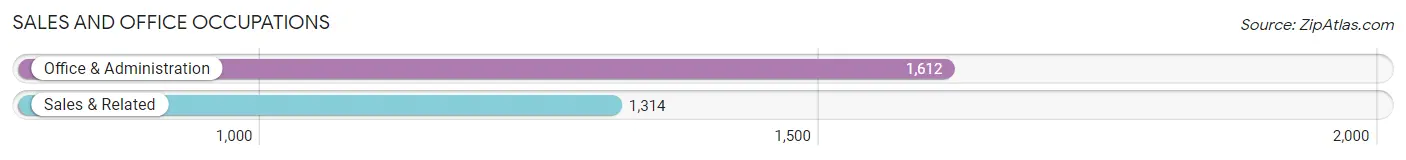
Sales and Office Occupations
The most common Sales and Office occupations in Laramie are Office & Administration (1,612 | 8.7%), and Sales & Related (1,314 | 7.1%).
Sales and Office Occupations by Sex
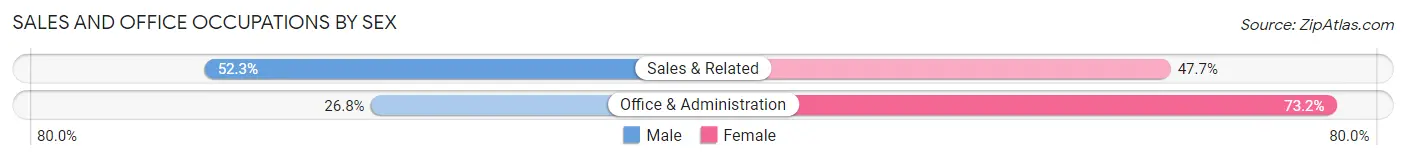
| Occupation | Male | Female |
| Sales & Related | 687 (52.3%) | 627 (47.7%) |
| Office & Administration | 432 (26.8%) | 1,180 (73.2%) |
| Total (Category) | 1,119 (38.2%) | 1,807 (61.8%) |
| Total (Overall) | 10,146 (54.5%) | 8,459 (45.5%) |
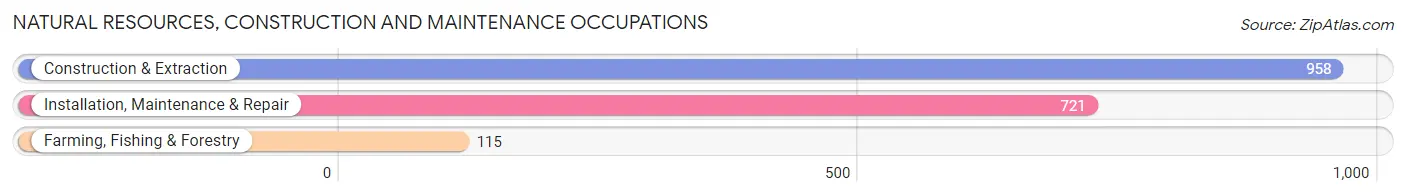
Natural Resources, Construction and Maintenance Occupations
The most common Natural Resources, Construction and Maintenance occupations in Laramie are Construction & Extraction (958 | 5.1%), Installation, Maintenance & Repair (721 | 3.9%), and Farming, Fishing & Forestry (115 | 0.6%).
Natural Resources, Construction and Maintenance Occupations by Sex
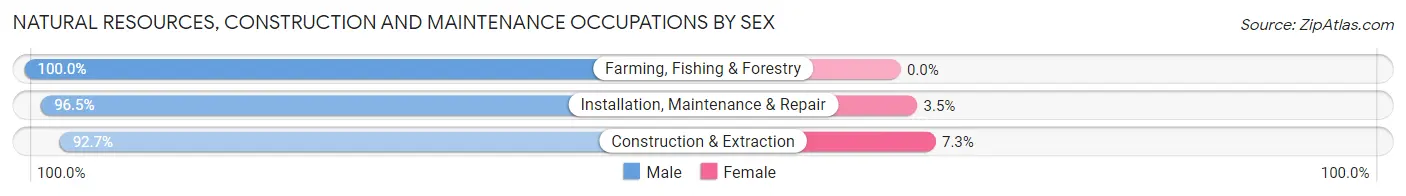
| Occupation | Male | Female |
| Farming, Fishing & Forestry | 115 (100.0%) | 0 (0.0%) |
| Construction & Extraction | 888 (92.7%) | 70 (7.3%) |
| Installation, Maintenance & Repair | 696 (96.5%) | 25 (3.5%) |
| Total (Category) | 1,699 (94.7%) | 95 (5.3%) |
| Total (Overall) | 10,146 (54.5%) | 8,459 (45.5%) |
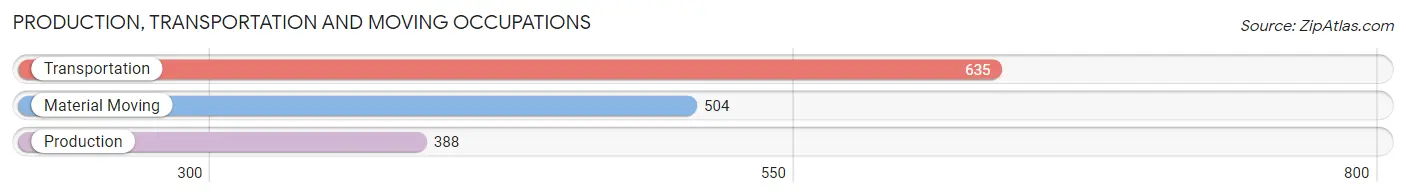
Production, Transportation and Moving Occupations
The most common Production, Transportation and Moving occupations in Laramie are Transportation (635 | 3.4%), Material Moving (504 | 2.7%), and Production (388 | 2.1%).
Production, Transportation and Moving Occupations by Sex
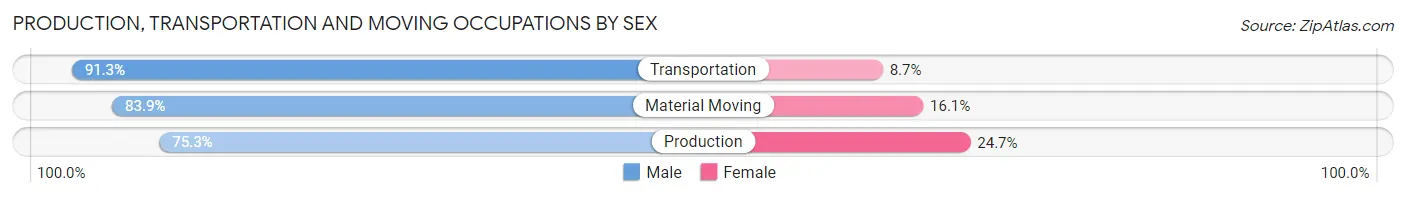
| Occupation | Male | Female |
| Production | 292 (75.3%) | 96 (24.7%) |
| Transportation | 580 (91.3%) | 55 (8.7%) |
| Material Moving | 423 (83.9%) | 81 (16.1%) |
| Total (Category) | 1,295 (84.8%) | 232 (15.2%) |
| Total (Overall) | 10,146 (54.5%) | 8,459 (45.5%) |
Employment Industries by Sex in Laramie
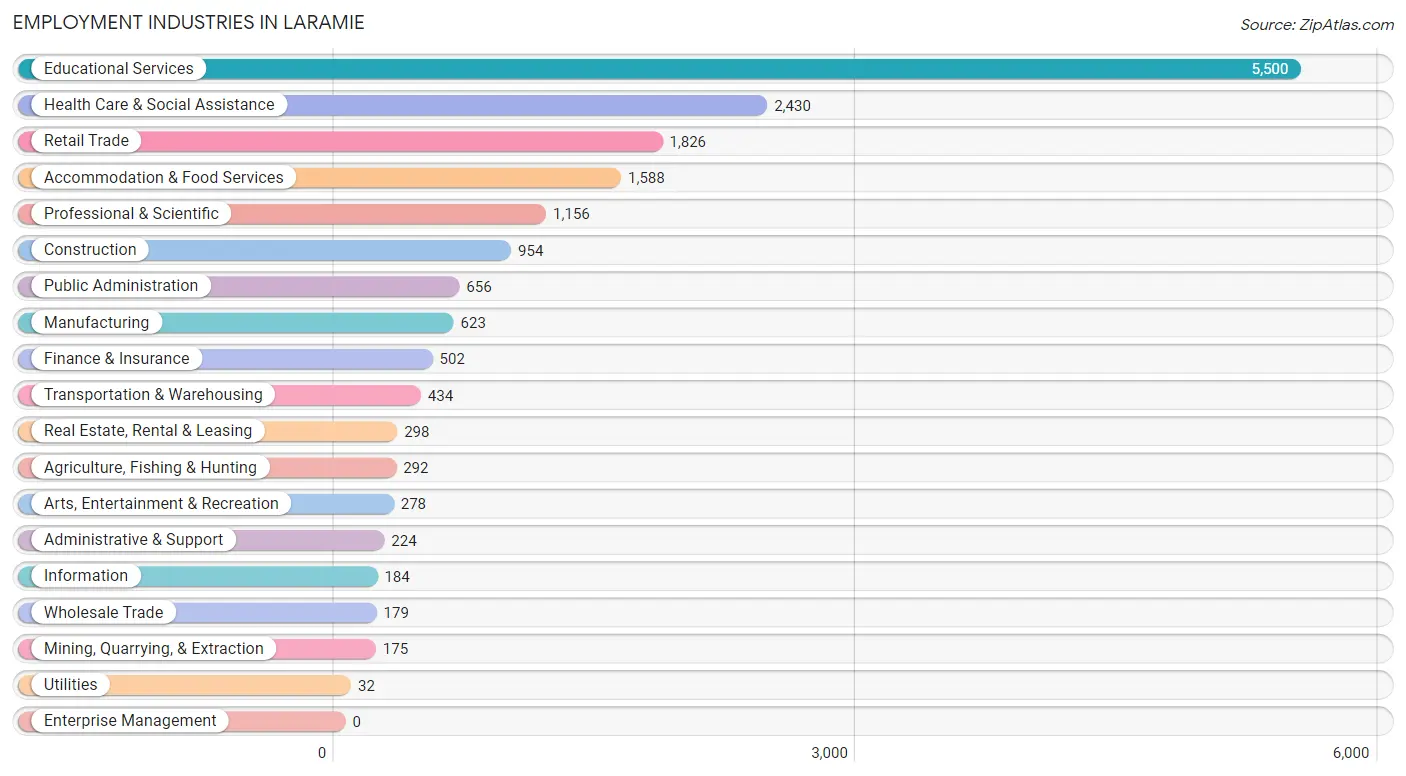
Employment Industries in Laramie
The major employment industries in Laramie include Educational Services (5,500 | 29.6%), Health Care & Social Assistance (2,430 | 13.1%), Retail Trade (1,826 | 9.8%), Accommodation & Food Services (1,588 | 8.5%), and Professional & Scientific (1,156 | 6.2%).
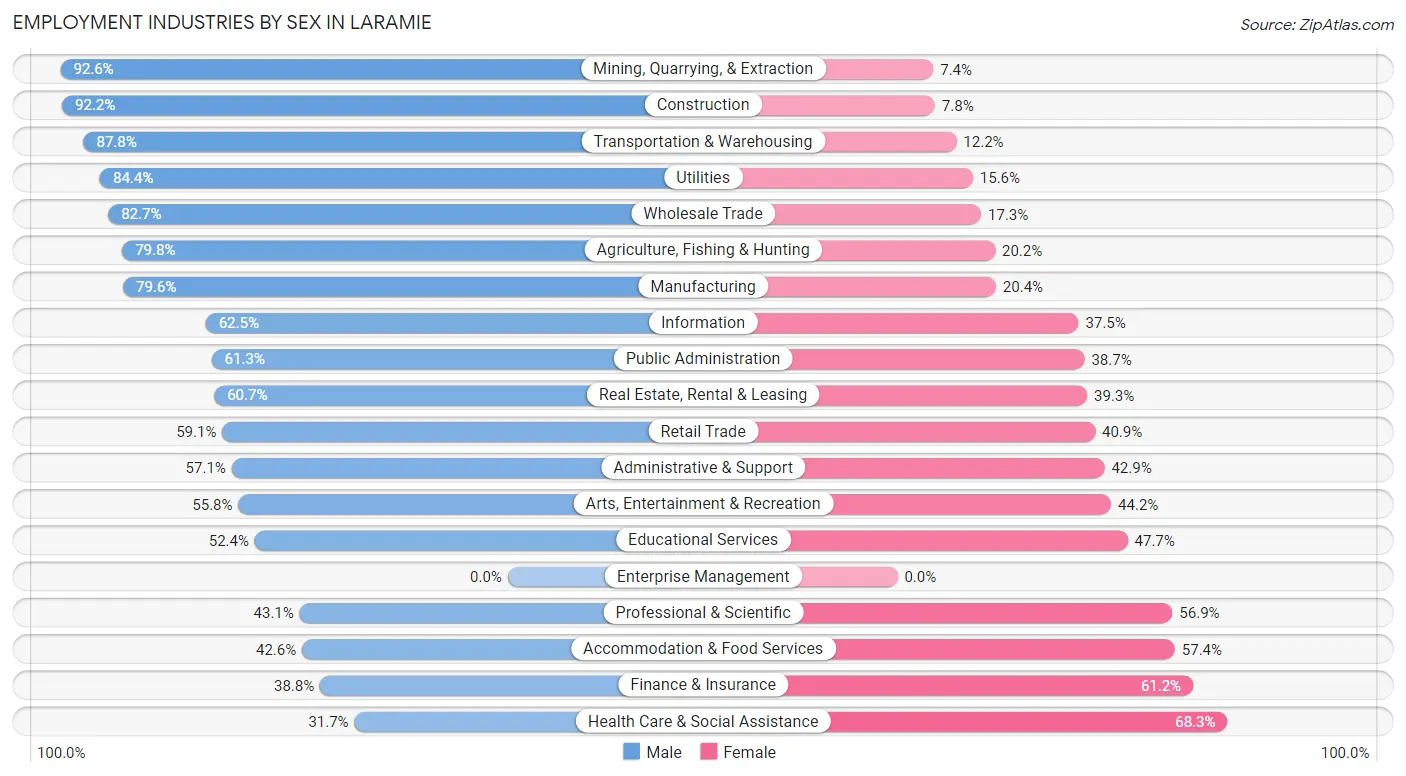
Employment Industries by Sex in Laramie
The Laramie industries that see more men than women are Mining, Quarrying, & Extraction (92.6%), Construction (92.2%), and Transportation & Warehousing (87.8%), whereas the industries that tend to have a higher number of women are Health Care & Social Assistance (68.3%), Finance & Insurance (61.2%), and Accommodation & Food Services (57.4%).
| Industry | Male | Female |
| Agriculture, Fishing & Hunting | 233 (79.8%) | 59 (20.2%) |
| Mining, Quarrying, & Extraction | 162 (92.6%) | 13 (7.4%) |
| Construction | 880 (92.2%) | 74 (7.8%) |
| Manufacturing | 496 (79.6%) | 127 (20.4%) |
| Wholesale Trade | 148 (82.7%) | 31 (17.3%) |
| Retail Trade | 1,079 (59.1%) | 747 (40.9%) |
| Transportation & Warehousing | 381 (87.8%) | 53 (12.2%) |
| Utilities | 27 (84.4%) | 5 (15.6%) |
| Information | 115 (62.5%) | 69 (37.5%) |
| Finance & Insurance | 195 (38.8%) | 307 (61.2%) |
| Real Estate, Rental & Leasing | 181 (60.7%) | 117 (39.3%) |
| Professional & Scientific | 498 (43.1%) | 658 (56.9%) |
| Enterprise Management | 0 (0.0%) | 0 (0.0%) |
| Administrative & Support | 128 (57.1%) | 96 (42.9%) |
| Educational Services | 2,879 (52.3%) | 2,621 (47.6%) |
| Health Care & Social Assistance | 771 (31.7%) | 1,659 (68.3%) |
| Arts, Entertainment & Recreation | 155 (55.8%) | 123 (44.2%) |
| Accommodation & Food Services | 676 (42.6%) | 912 (57.4%) |
| Public Administration | 402 (61.3%) | 254 (38.7%) |
| Total | 10,146 (54.5%) | 8,459 (45.5%) |
Education in Laramie
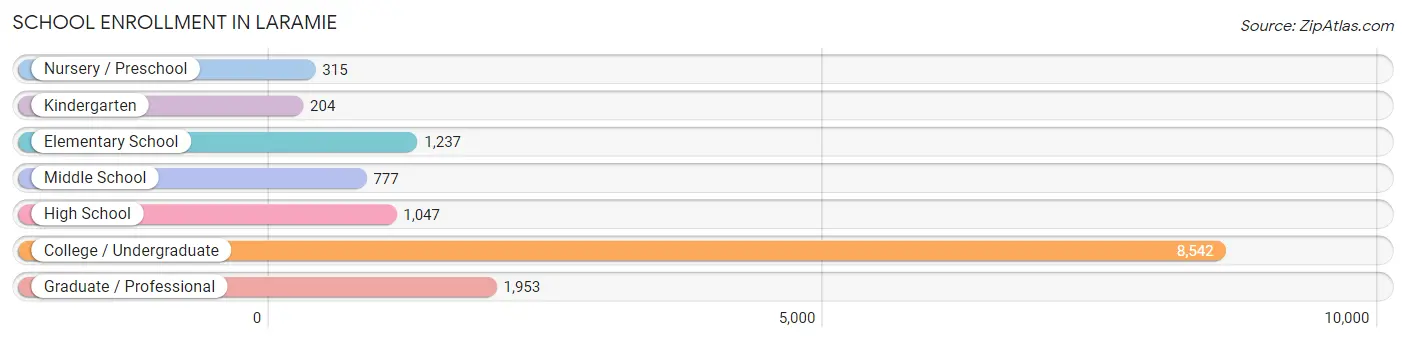
School Enrollment in Laramie
The most common levels of schooling among the 14,075 students in Laramie are college / undergraduate (8,542 | 60.7%), graduate / professional (1,953 | 13.9%), and elementary school (1,237 | 8.8%).
| School Level | # Students | % Students |
| Nursery / Preschool | 315 | 2.2% |
| Kindergarten | 204 | 1.5% |
| Elementary School | 1,237 | 8.8% |
| Middle School | 777 | 5.5% |
| High School | 1,047 | 7.4% |
| College / Undergraduate | 8,542 | 60.7% |
| Graduate / Professional | 1,953 | 13.9% |
| Total | 14,075 | 100.0% |
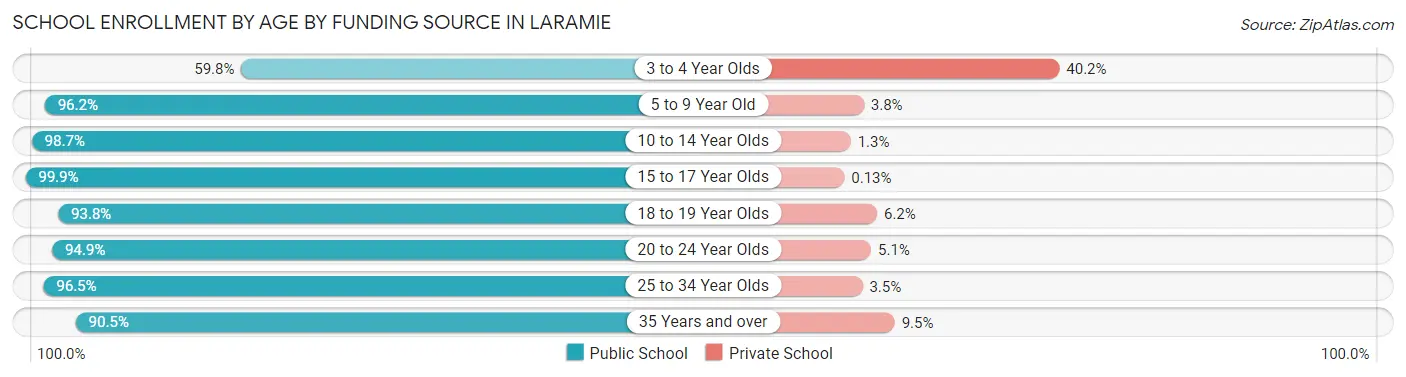
School Enrollment by Age by Funding Source in Laramie
Out of a total of 14,075 students who are enrolled in schools in Laramie, 718 (5.1%) attend a private institution, while the remaining 13,357 (94.9%) are enrolled in public schools. The age group of 3 to 4 year olds has the highest likelihood of being enrolled in private schools, with 90 (40.2% in the age bracket) enrolled. Conversely, the age group of 15 to 17 year olds has the lowest likelihood of being enrolled in a private school, with 795 (99.9% in the age bracket) attending a public institution.
| Age Bracket | Public School | Private School |
| 3 to 4 Year Olds | 134 (59.8%) | 90 (40.2%) |
| 5 to 9 Year Old | 1,254 (96.2%) | 49 (3.8%) |
| 10 to 14 Year Olds | 1,048 (98.7%) | 14 (1.3%) |
| 15 to 17 Year Olds | 795 (99.9%) | 1 (0.1%) |
| 18 to 19 Year Olds | 2,399 (93.8%) | 159 (6.2%) |
| 20 to 24 Year Olds | 5,883 (94.9%) | 317 (5.1%) |
| 25 to 34 Year Olds | 1,570 (96.5%) | 57 (3.5%) |
| 35 Years and over | 276 (90.5%) | 29 (9.5%) |
| Total | 13,357 (94.9%) | 718 (5.1%) |
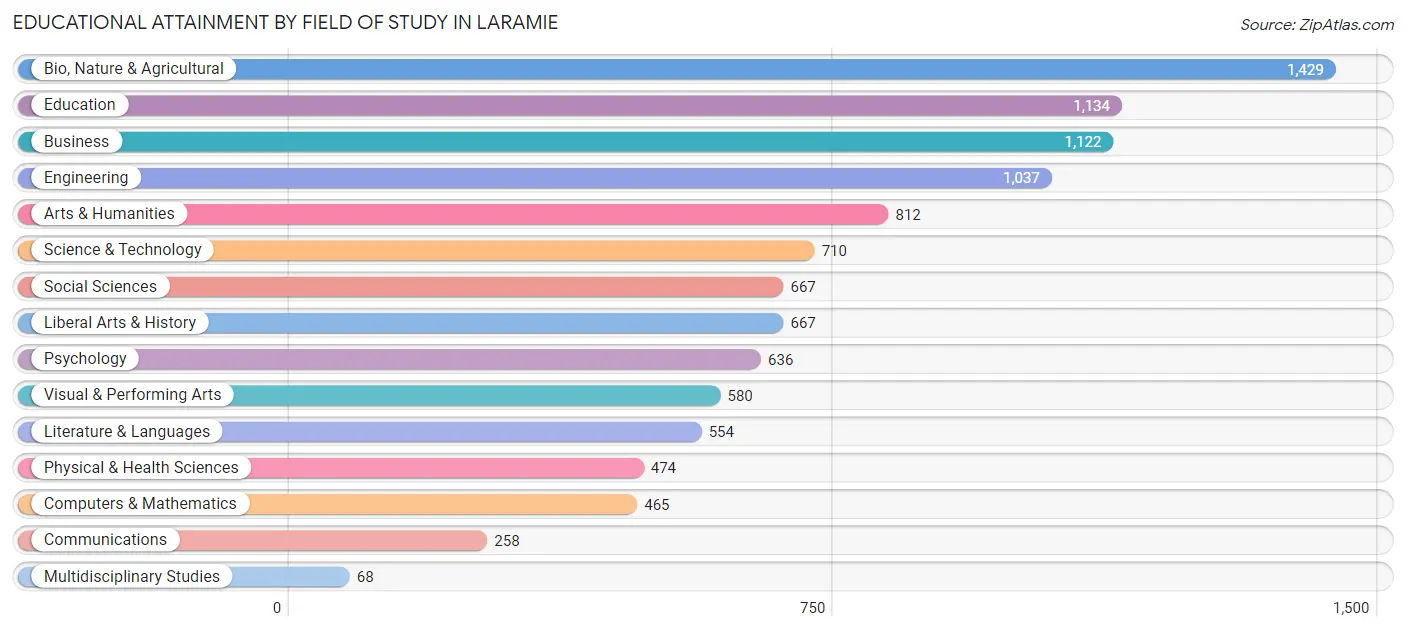
Educational Attainment by Field of Study in Laramie
Bio, nature & agricultural (1,429 | 13.5%), education (1,134 | 10.7%), business (1,122 | 10.6%), engineering (1,037 | 9.8%), and arts & humanities (812 | 7.6%) are the most common fields of study among 10,613 individuals in Laramie who have obtained a bachelor's degree or higher.
| Field of Study | # Graduates | % Graduates |
| Computers & Mathematics | 465 | 4.4% |
| Bio, Nature & Agricultural | 1,429 | 13.5% |
| Physical & Health Sciences | 474 | 4.5% |
| Psychology | 636 | 6.0% |
| Social Sciences | 667 | 6.3% |
| Engineering | 1,037 | 9.8% |
| Multidisciplinary Studies | 68 | 0.6% |
| Science & Technology | 710 | 6.7% |
| Business | 1,122 | 10.6% |
| Education | 1,134 | 10.7% |
| Literature & Languages | 554 | 5.2% |
| Liberal Arts & History | 667 | 6.3% |
| Visual & Performing Arts | 580 | 5.5% |
| Communications | 258 | 2.4% |
| Arts & Humanities | 812 | 7.6% |
| Total | 10,613 | 100.0% |
Transportation & Commute in Laramie
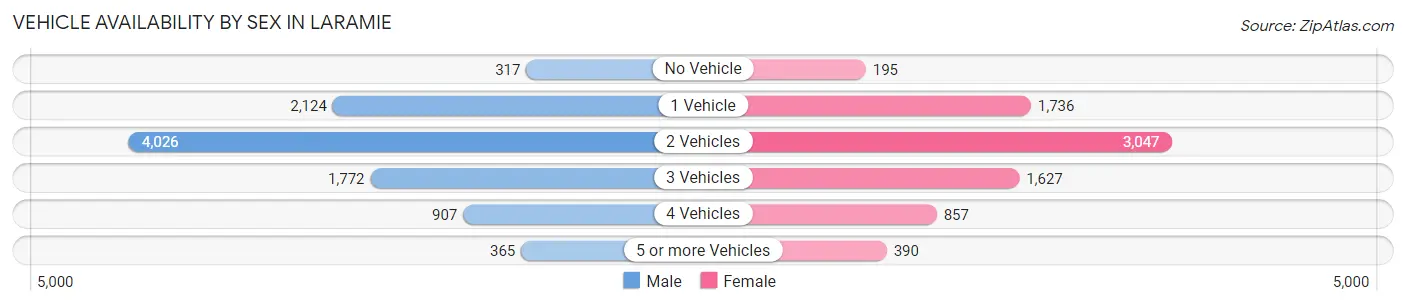
Vehicle Availability by Sex in Laramie
The most prevalent vehicle ownership categories in Laramie are males with 2 vehicles (4,026, accounting for 42.3%) and females with 2 vehicles (3,047, making up 51.3%).
| Vehicles Available | Male | Female |
| No Vehicle | 317 (3.3%) | 195 (2.5%) |
| 1 Vehicle | 2,124 (22.3%) | 1,736 (22.1%) |
| 2 Vehicles | 4,026 (42.3%) | 3,047 (38.8%) |
| 3 Vehicles | 1,772 (18.6%) | 1,627 (20.7%) |
| 4 Vehicles | 907 (9.5%) | 857 (10.9%) |
| 5 or more Vehicles | 365 (3.8%) | 390 (5.0%) |
| Total | 9,511 (100.0%) | 7,852 (100.0%) |
Commute Time in Laramie
The most frequently occuring commute durations in Laramie are 5 to 9 minutes (6,518 commuters, 39.1%), 10 to 14 minutes (5,111 commuters, 30.6%), and 15 to 19 minutes (1,583 commuters, 9.5%).
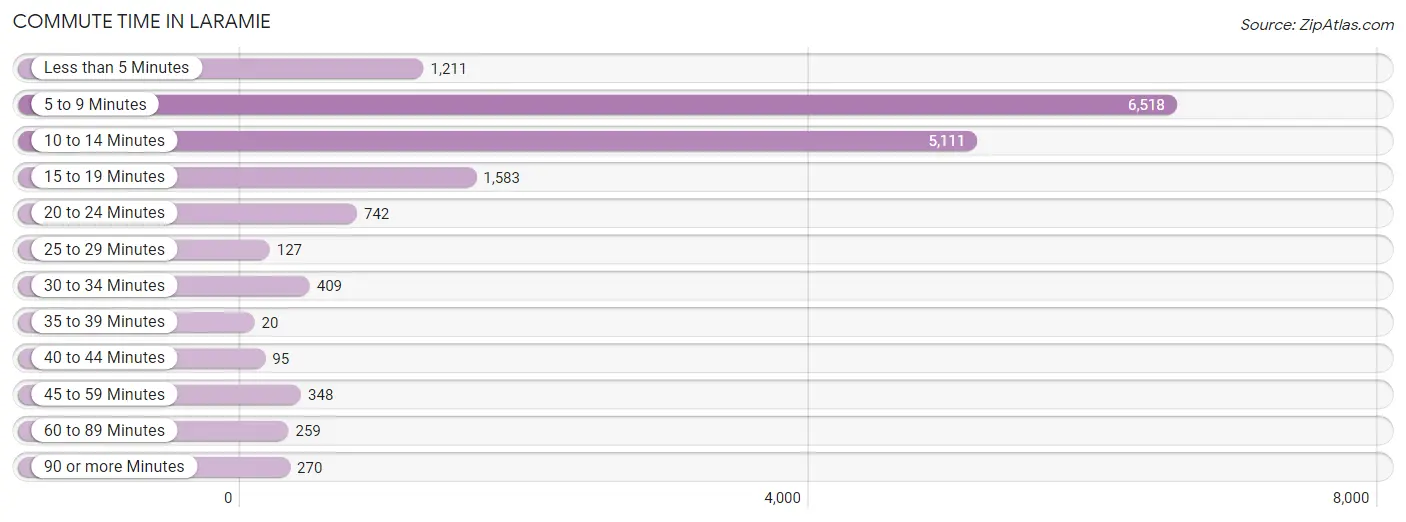
| Commute Time | # Commuters | % Commuters |
| Less than 5 Minutes | 1,211 | 7.2% |
| 5 to 9 Minutes | 6,518 | 39.1% |
| 10 to 14 Minutes | 5,111 | 30.6% |
| 15 to 19 Minutes | 1,583 | 9.5% |
| 20 to 24 Minutes | 742 | 4.4% |
| 25 to 29 Minutes | 127 | 0.8% |
| 30 to 34 Minutes | 409 | 2.5% |
| 35 to 39 Minutes | 20 | 0.1% |
| 40 to 44 Minutes | 95 | 0.6% |
| 45 to 59 Minutes | 348 | 2.1% |
| 60 to 89 Minutes | 259 | 1.5% |
| 90 or more Minutes | 270 | 1.6% |
Commute Time by Sex in Laramie
The most common commute times in Laramie are 5 to 9 minutes (3,428 commuters, 37.4%) for males and 5 to 9 minutes (3,090 commuters, 41.0%) for females.
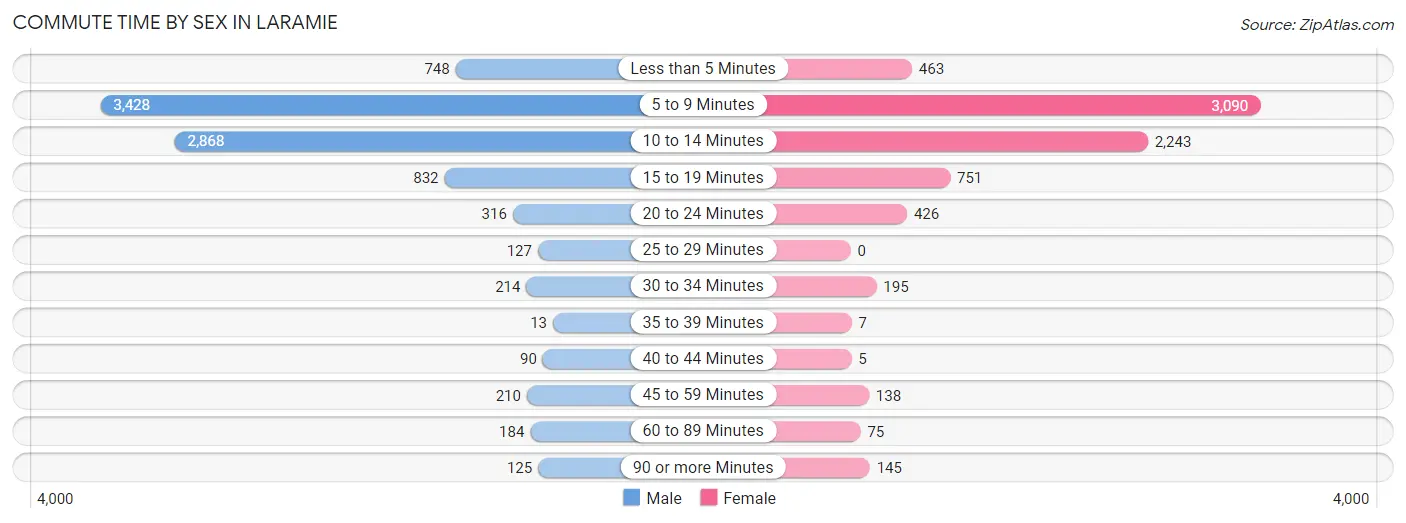
| Commute Time | Male | Female |
| Less than 5 Minutes | 748 (8.2%) | 463 (6.1%) |
| 5 to 9 Minutes | 3,428 (37.4%) | 3,090 (41.0%) |
| 10 to 14 Minutes | 2,868 (31.3%) | 2,243 (29.8%) |
| 15 to 19 Minutes | 832 (9.1%) | 751 (10.0%) |
| 20 to 24 Minutes | 316 (3.5%) | 426 (5.7%) |
| 25 to 29 Minutes | 127 (1.4%) | 0 (0.0%) |
| 30 to 34 Minutes | 214 (2.3%) | 195 (2.6%) |
| 35 to 39 Minutes | 13 (0.1%) | 7 (0.1%) |
| 40 to 44 Minutes | 90 (1.0%) | 5 (0.1%) |
| 45 to 59 Minutes | 210 (2.3%) | 138 (1.8%) |
| 60 to 89 Minutes | 184 (2.0%) | 75 (1.0%) |
| 90 or more Minutes | 125 (1.4%) | 145 (1.9%) |
Time of Departure to Work by Sex in Laramie
The most frequent times of departure to work in Laramie are 7:30 AM to 7:59 AM (1,748, 19.1%) for males and 7:30 AM to 7:59 AM (1,651, 21.9%) for females.
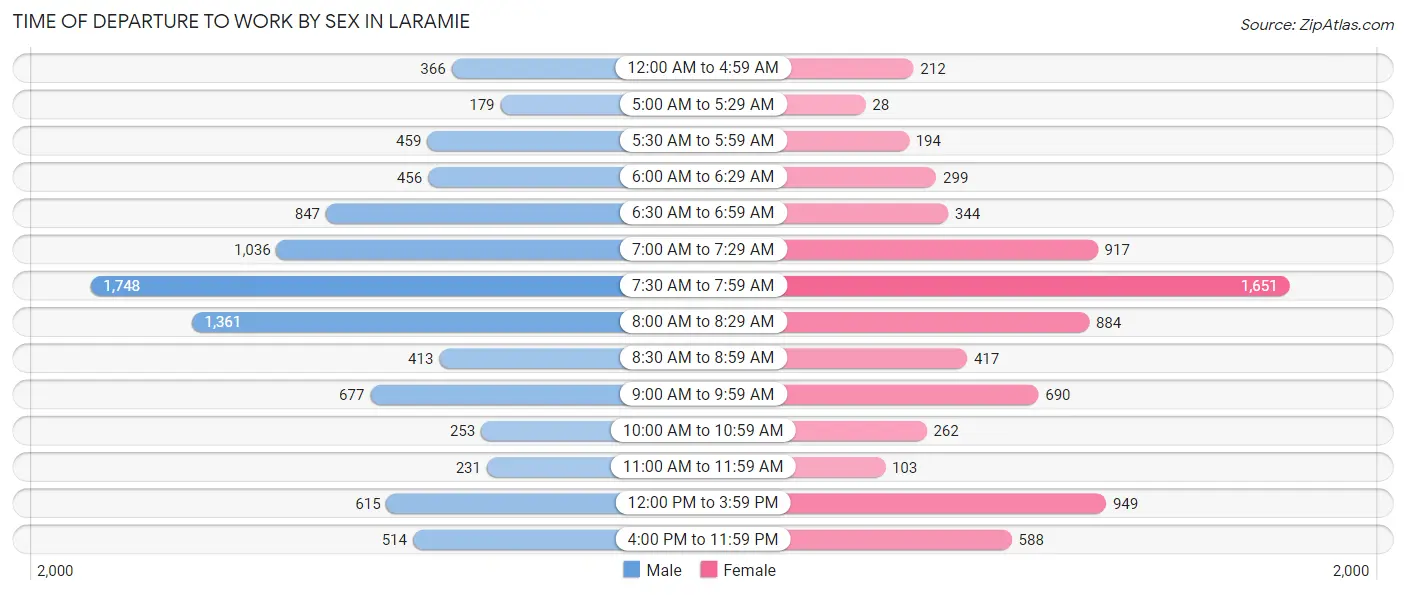
| Time of Departure | Male | Female |
| 12:00 AM to 4:59 AM | 366 (4.0%) | 212 (2.8%) |
| 5:00 AM to 5:29 AM | 179 (2.0%) | 28 (0.4%) |
| 5:30 AM to 5:59 AM | 459 (5.0%) | 194 (2.6%) |
| 6:00 AM to 6:29 AM | 456 (5.0%) | 299 (4.0%) |
| 6:30 AM to 6:59 AM | 847 (9.2%) | 344 (4.6%) |
| 7:00 AM to 7:29 AM | 1,036 (11.3%) | 917 (12.2%) |
| 7:30 AM to 7:59 AM | 1,748 (19.1%) | 1,651 (21.9%) |
| 8:00 AM to 8:29 AM | 1,361 (14.9%) | 884 (11.7%) |
| 8:30 AM to 8:59 AM | 413 (4.5%) | 417 (5.5%) |
| 9:00 AM to 9:59 AM | 677 (7.4%) | 690 (9.1%) |
| 10:00 AM to 10:59 AM | 253 (2.8%) | 262 (3.5%) |
| 11:00 AM to 11:59 AM | 231 (2.5%) | 103 (1.4%) |
| 12:00 PM to 3:59 PM | 615 (6.7%) | 949 (12.6%) |
| 4:00 PM to 11:59 PM | 514 (5.6%) | 588 (7.8%) |
| Total | 9,155 (100.0%) | 7,538 (100.0%) |
Housing Occupancy in Laramie
Occupancy by Ownership in Laramie
Of the total 13,943 dwellings in Laramie, owner-occupied units account for 6,384 (45.8%), while renter-occupied units make up 7,559 (54.2%).
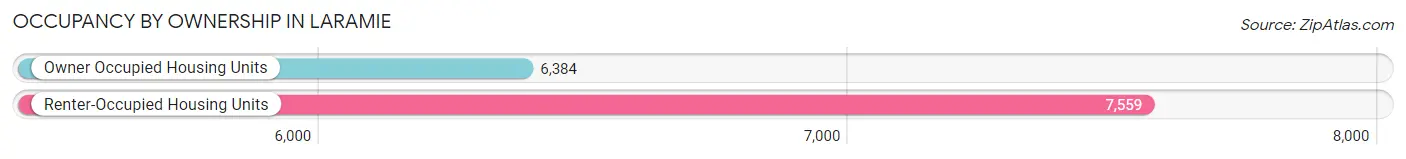
| Occupancy | # Housing Units | % Housing Units |
| Owner Occupied Housing Units | 6,384 | 45.8% |
| Renter-Occupied Housing Units | 7,559 | 54.2% |
| Total Occupied Housing Units | 13,943 | 100.0% |
Occupancy by Household Size in Laramie
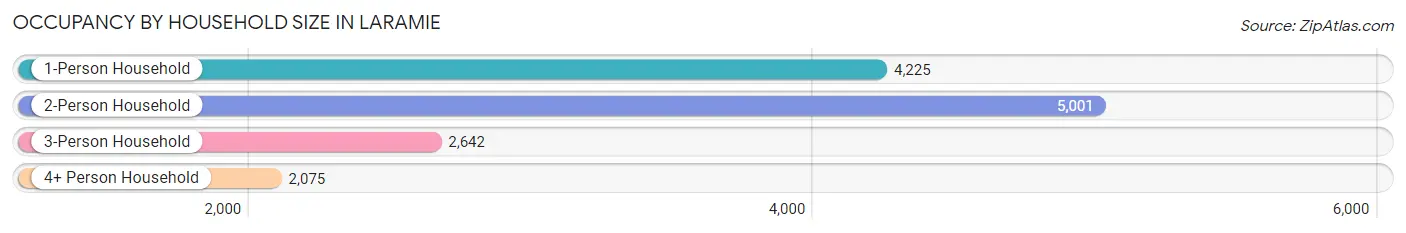
| Household Size | # Housing Units | % Housing Units |
| 1-Person Household | 4,225 | 30.3% |
| 2-Person Household | 5,001 | 35.9% |
| 3-Person Household | 2,642 | 19.0% |
| 4+ Person Household | 2,075 | 14.9% |
| Total Housing Units | 13,943 | 100.0% |
Occupancy by Ownership by Household Size in Laramie
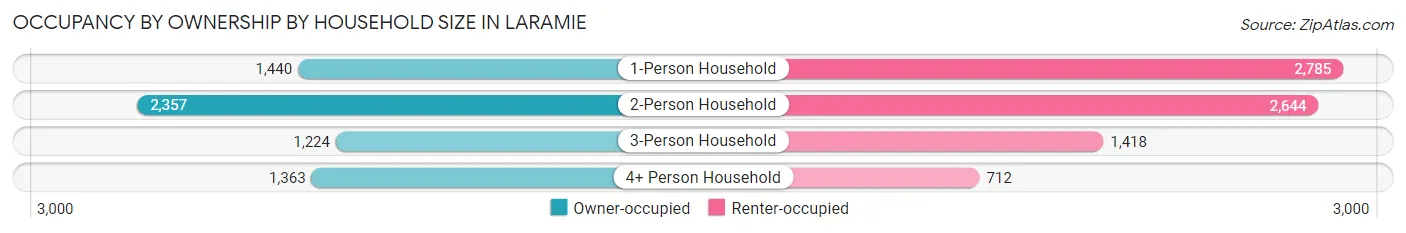
| Household Size | Owner-occupied | Renter-occupied |
| 1-Person Household | 1,440 (34.1%) | 2,785 (65.9%) |
| 2-Person Household | 2,357 (47.1%) | 2,644 (52.9%) |
| 3-Person Household | 1,224 (46.3%) | 1,418 (53.7%) |
| 4+ Person Household | 1,363 (65.7%) | 712 (34.3%) |
| Total Housing Units | 6,384 (45.8%) | 7,559 (54.2%) |
Occupancy by Educational Attainment in Laramie
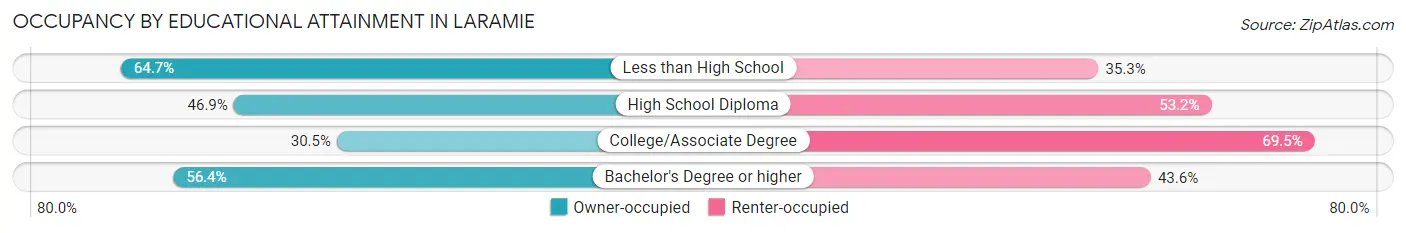
| Household Size | Owner-occupied | Renter-occupied |
| Less than High School | 134 (64.7%) | 73 (35.3%) |
| High School Diploma | 834 (46.9%) | 946 (53.1%) |
| College/Associate Degree | 1,562 (30.5%) | 3,562 (69.5%) |
| Bachelor's Degree or higher | 3,854 (56.4%) | 2,978 (43.6%) |
Occupancy by Age of Householder in Laramie
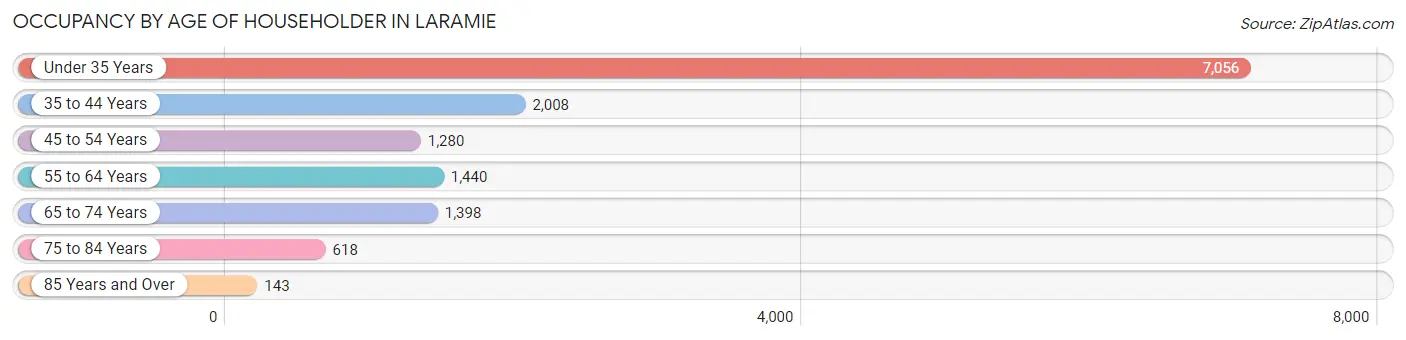
| Age Bracket | # Households | % Households |
| Under 35 Years | 7,056 | 50.6% |
| 35 to 44 Years | 2,008 | 14.4% |
| 45 to 54 Years | 1,280 | 9.2% |
| 55 to 64 Years | 1,440 | 10.3% |
| 65 to 74 Years | 1,398 | 10.0% |
| 75 to 84 Years | 618 | 4.4% |
| 85 Years and Over | 143 | 1.0% |
| Total | 13,943 | 100.0% |
Housing Finances in Laramie
Median Income by Occupancy in Laramie
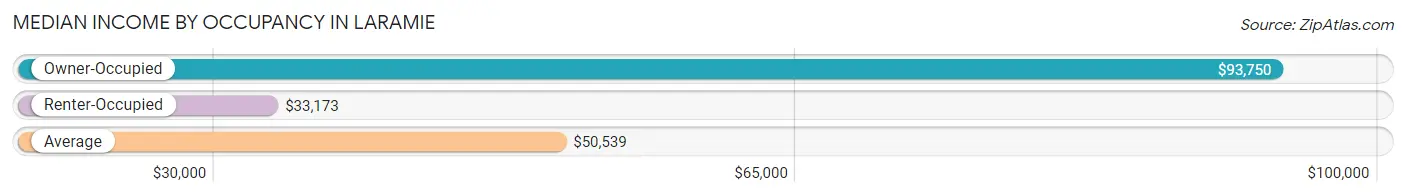
| Occupancy Type | # Households | Median Income |
| Owner-Occupied | 6,384 (45.8%) | $93,750 |
| Renter-Occupied | 7,559 (54.2%) | $33,173 |
| Average | 13,943 (100.0%) | $50,539 |
Occupancy by Householder Income Bracket in Laramie
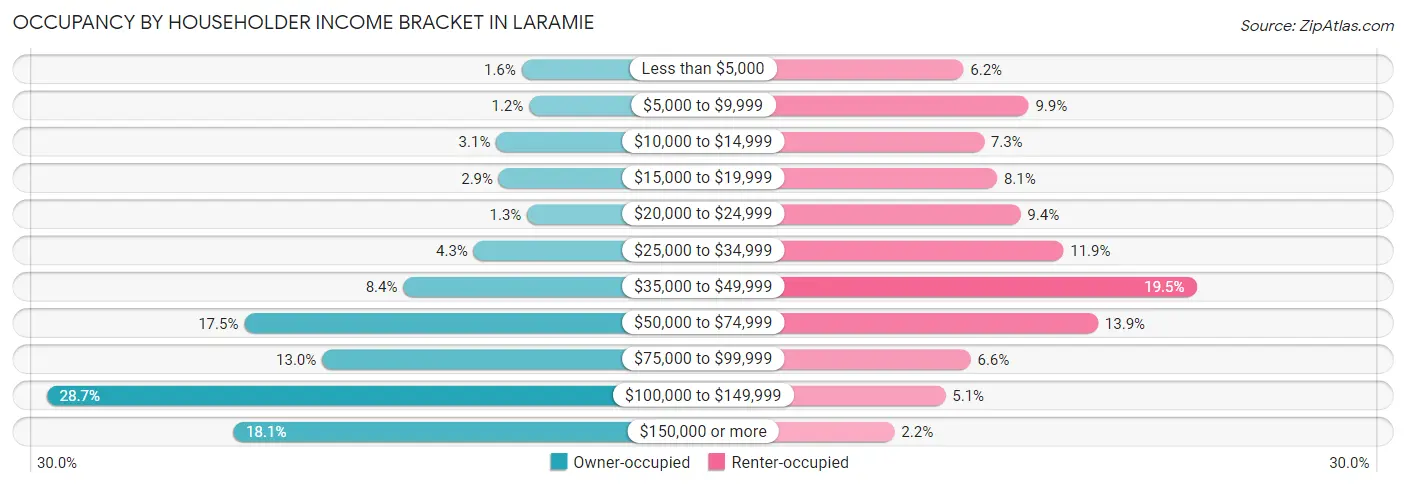
| Income Bracket | Owner-occupied | Renter-occupied |
| Less than $5,000 | 102 (1.6%) | 466 (6.2%) |
| $5,000 to $9,999 | 75 (1.2%) | 747 (9.9%) |
| $10,000 to $14,999 | 195 (3.0%) | 554 (7.3%) |
| $15,000 to $19,999 | 185 (2.9%) | 611 (8.1%) |
| $20,000 to $24,999 | 82 (1.3%) | 712 (9.4%) |
| $25,000 to $34,999 | 277 (4.3%) | 897 (11.9%) |
| $35,000 to $49,999 | 534 (8.4%) | 1,472 (19.5%) |
| $50,000 to $74,999 | 1,114 (17.4%) | 1,047 (13.9%) |
| $75,000 to $99,999 | 830 (13.0%) | 497 (6.6%) |
| $100,000 to $149,999 | 1,835 (28.7%) | 388 (5.1%) |
| $150,000 or more | 1,155 (18.1%) | 168 (2.2%) |
| Total | 6,384 (100.0%) | 7,559 (100.0%) |
Monthly Housing Cost Tiers in Laramie
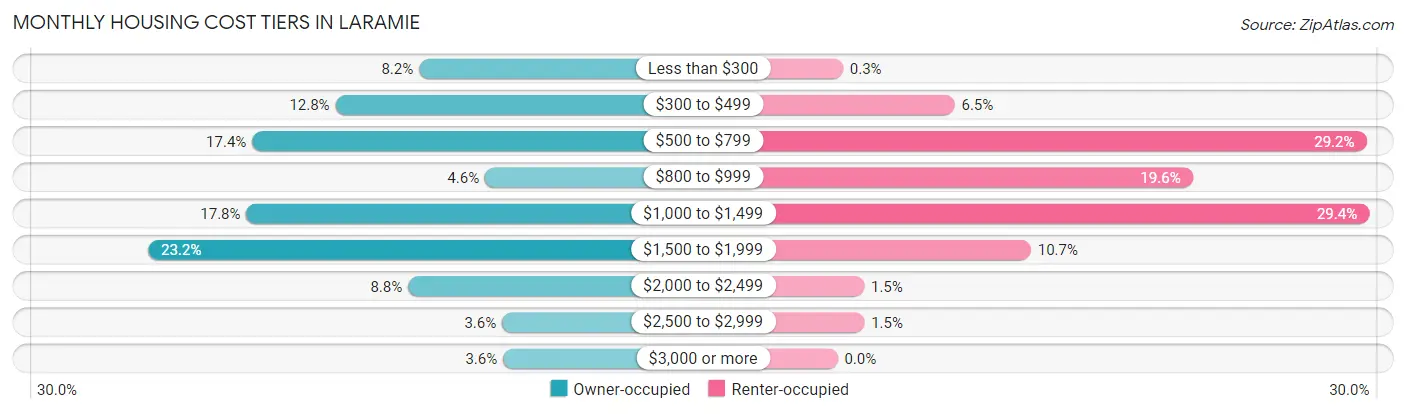
| Monthly Cost | Owner-occupied | Renter-occupied |
| Less than $300 | 524 (8.2%) | 23 (0.3%) |
| $300 to $499 | 819 (12.8%) | 489 (6.5%) |
| $500 to $799 | 1,113 (17.4%) | 2,208 (29.2%) |
| $800 to $999 | 292 (4.6%) | 1,482 (19.6%) |
| $1,000 to $1,499 | 1,133 (17.7%) | 2,219 (29.4%) |
| $1,500 to $1,999 | 1,480 (23.2%) | 807 (10.7%) |
| $2,000 to $2,499 | 563 (8.8%) | 111 (1.5%) |
| $2,500 to $2,999 | 232 (3.6%) | 112 (1.5%) |
| $3,000 or more | 228 (3.6%) | 0 (0.0%) |
| Total | 6,384 (100.0%) | 7,559 (100.0%) |
Physical Housing Characteristics in Laramie
Housing Structures in Laramie
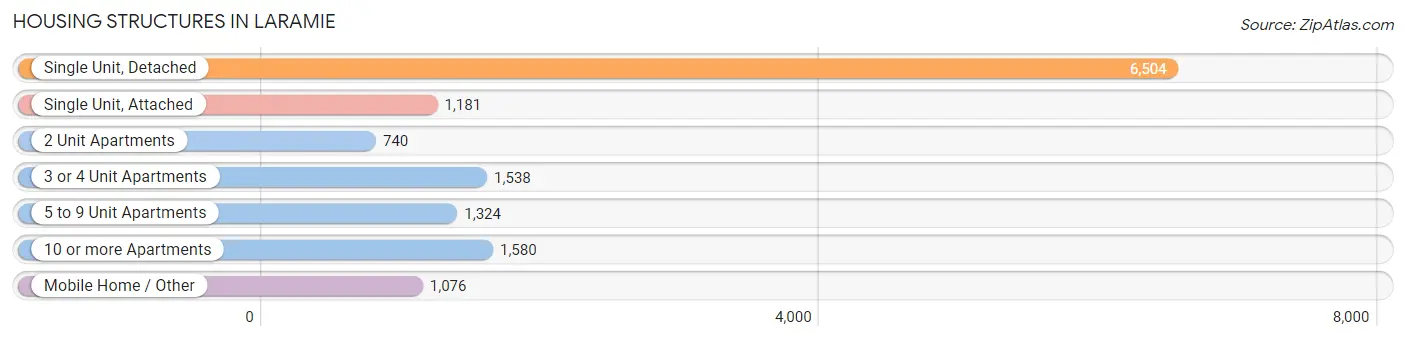
| Structure Type | # Housing Units | % Housing Units |
| Single Unit, Detached | 6,504 | 46.7% |
| Single Unit, Attached | 1,181 | 8.5% |
| 2 Unit Apartments | 740 | 5.3% |
| 3 or 4 Unit Apartments | 1,538 | 11.0% |
| 5 to 9 Unit Apartments | 1,324 | 9.5% |
| 10 or more Apartments | 1,580 | 11.3% |
| Mobile Home / Other | 1,076 | 7.7% |
| Total | 13,943 | 100.0% |
Housing Structures by Occupancy in Laramie
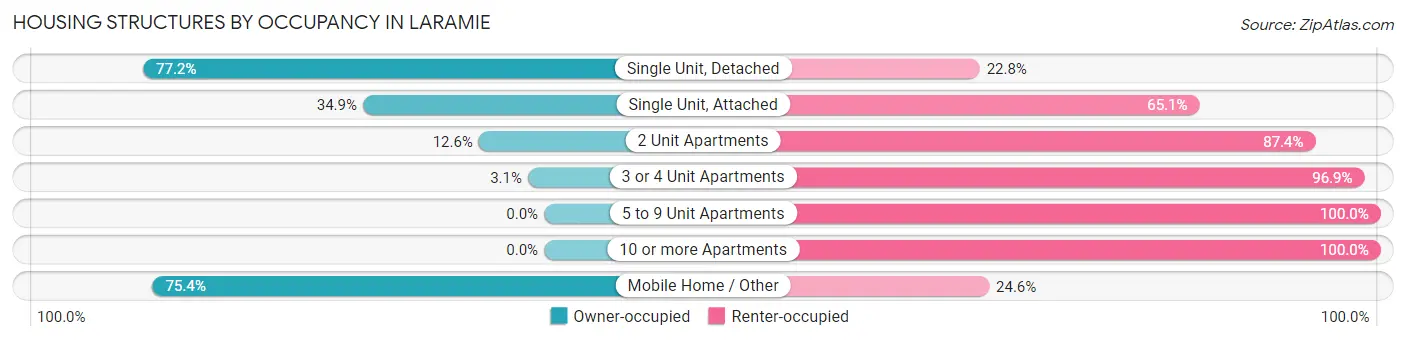
| Structure Type | Owner-occupied | Renter-occupied |
| Single Unit, Detached | 5,020 (77.2%) | 1,484 (22.8%) |
| Single Unit, Attached | 412 (34.9%) | 769 (65.1%) |
| 2 Unit Apartments | 93 (12.6%) | 647 (87.4%) |
| 3 or 4 Unit Apartments | 48 (3.1%) | 1,490 (96.9%) |
| 5 to 9 Unit Apartments | 0 (0.0%) | 1,324 (100.0%) |
| 10 or more Apartments | 0 (0.0%) | 1,580 (100.0%) |
| Mobile Home / Other | 811 (75.4%) | 265 (24.6%) |
| Total | 6,384 (45.8%) | 7,559 (54.2%) |
Housing Structures by Number of Rooms in Laramie
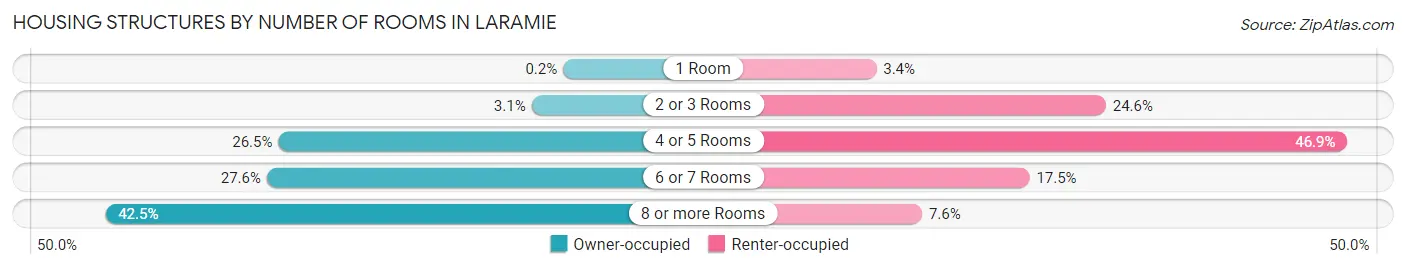
| Number of Rooms | Owner-occupied | Renter-occupied |
| 1 Room | 13 (0.2%) | 254 (3.4%) |
| 2 or 3 Rooms | 199 (3.1%) | 1,859 (24.6%) |
| 4 or 5 Rooms | 1,694 (26.5%) | 3,547 (46.9%) |
| 6 or 7 Rooms | 1,762 (27.6%) | 1,325 (17.5%) |
| 8 or more Rooms | 2,716 (42.5%) | 574 (7.6%) |
| Total | 6,384 (100.0%) | 7,559 (100.0%) |
Housing Structure by Heating Type in Laramie
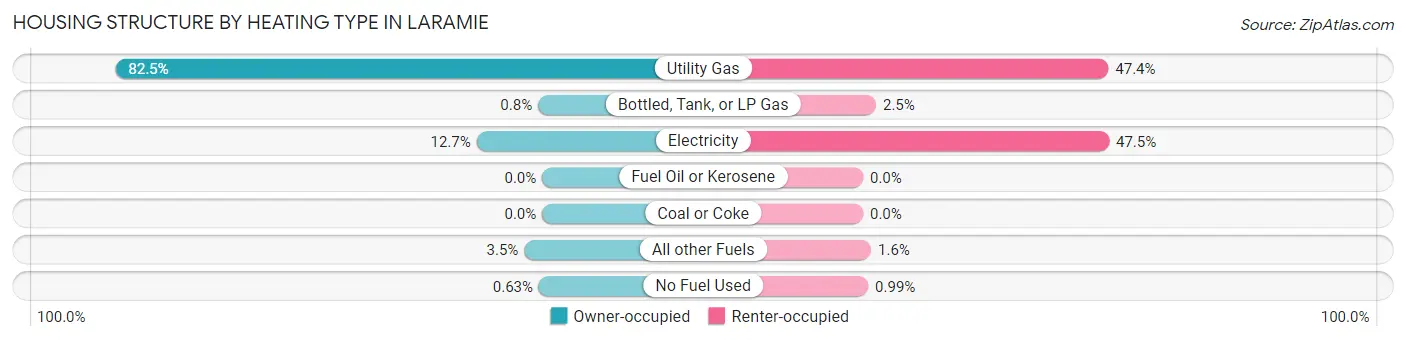
| Heating Type | Owner-occupied | Renter-occupied |
| Utility Gas | 5,264 (82.5%) | 3,583 (47.4%) |
| Bottled, Tank, or LP Gas | 51 (0.8%) | 190 (2.5%) |
| Electricity | 808 (12.7%) | 3,593 (47.5%) |
| Fuel Oil or Kerosene | 0 (0.0%) | 0 (0.0%) |
| Coal or Coke | 0 (0.0%) | 0 (0.0%) |
| All other Fuels | 221 (3.5%) | 118 (1.6%) |
| No Fuel Used | 40 (0.6%) | 75 (1.0%) |
| Total | 6,384 (100.0%) | 7,559 (100.0%) |
Household Vehicle Usage in Laramie
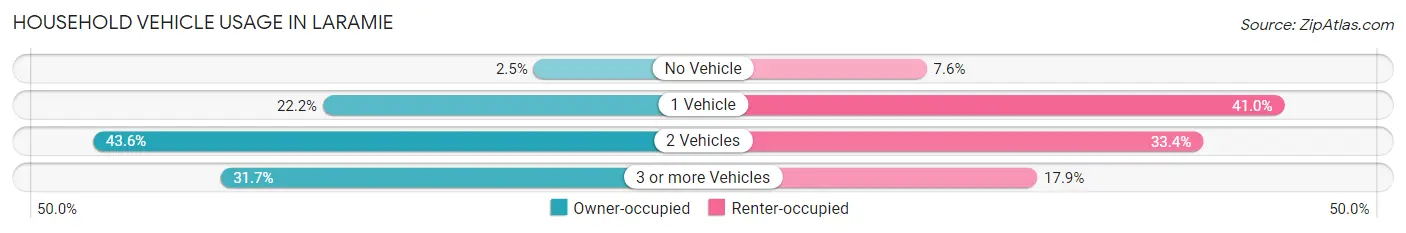
| Vehicles per Household | Owner-occupied | Renter-occupied |
| No Vehicle | 159 (2.5%) | 577 (7.6%) |
| 1 Vehicle | 1,414 (22.2%) | 3,100 (41.0%) |
| 2 Vehicles | 2,785 (43.6%) | 2,526 (33.4%) |
| 3 or more Vehicles | 2,026 (31.7%) | 1,356 (17.9%) |
| Total | 6,384 (100.0%) | 7,559 (100.0%) |
Real Estate & Mortgages in Laramie
Real Estate and Mortgage Overview in Laramie
| Characteristic | Without Mortgage | With Mortgage |
| Housing Units | 2,483 | 3,901 |
| Median Property Value | $238,200 | $291,400 |
| Median Household Income | $65,144 | $816 |
| Monthly Housing Costs | $479 | $223 |
| Real Estate Taxes | $1,446 | $61 |
Property Value by Mortgage Status in Laramie
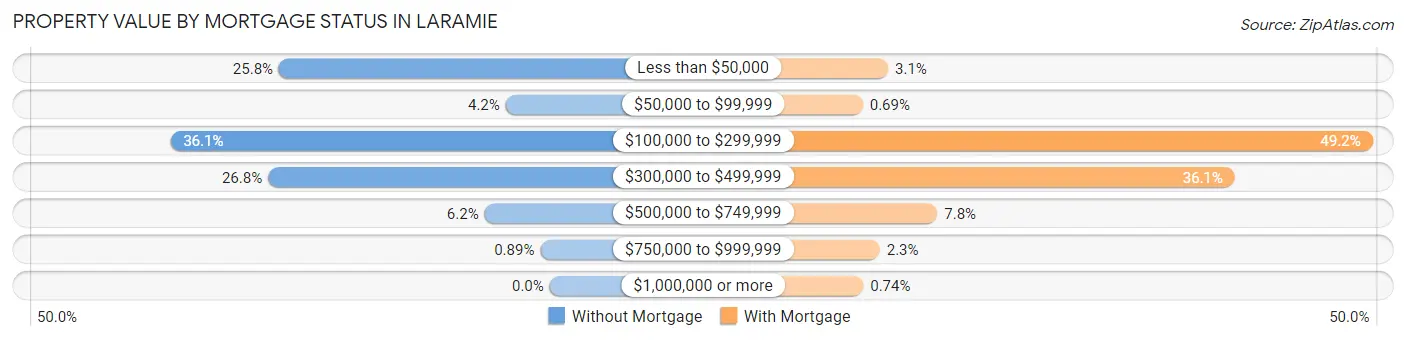
| Property Value | Without Mortgage | With Mortgage |
| Less than $50,000 | 640 (25.8%) | 121 (3.1%) |
| $50,000 to $99,999 | 104 (4.2%) | 27 (0.7%) |
| $100,000 to $299,999 | 897 (36.1%) | 1,921 (49.2%) |
| $300,000 to $499,999 | 666 (26.8%) | 1,409 (36.1%) |
| $500,000 to $749,999 | 154 (6.2%) | 304 (7.8%) |
| $750,000 to $999,999 | 22 (0.9%) | 90 (2.3%) |
| $1,000,000 or more | 0 (0.0%) | 29 (0.7%) |
| Total | 2,483 (100.0%) | 3,901 (100.0%) |
Household Income by Mortgage Status in Laramie
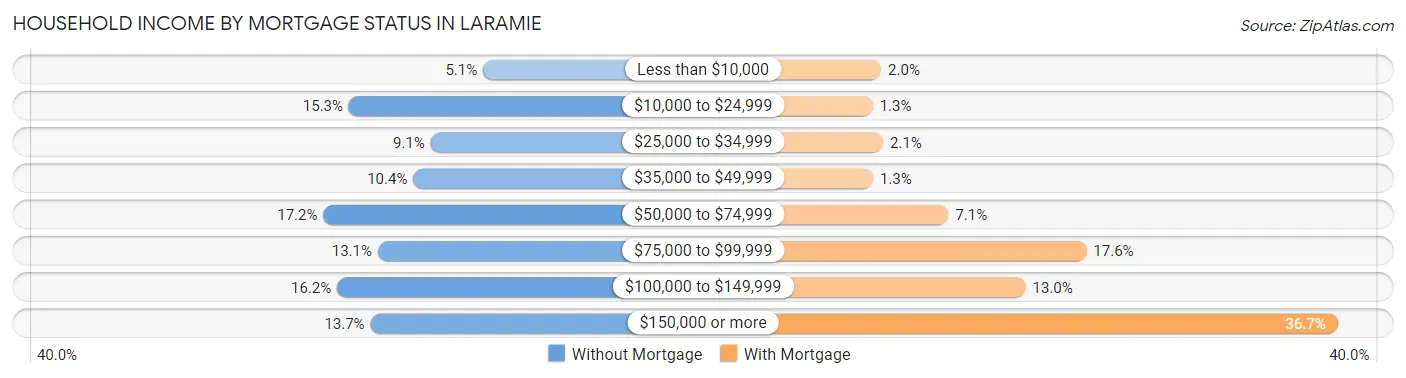
| Household Income | Without Mortgage | With Mortgage |
| Less than $10,000 | 126 (5.1%) | 76 (1.9%) |
| $10,000 to $24,999 | 380 (15.3%) | 51 (1.3%) |
| $25,000 to $34,999 | 225 (9.1%) | 82 (2.1%) |
| $35,000 to $49,999 | 258 (10.4%) | 52 (1.3%) |
| $50,000 to $74,999 | 428 (17.2%) | 276 (7.1%) |
| $75,000 to $99,999 | 325 (13.1%) | 686 (17.6%) |
| $100,000 to $149,999 | 402 (16.2%) | 505 (13.0%) |
| $150,000 or more | 339 (13.7%) | 1,433 (36.7%) |
| Total | 2,483 (100.0%) | 3,901 (100.0%) |
Property Value to Household Income Ratio in Laramie
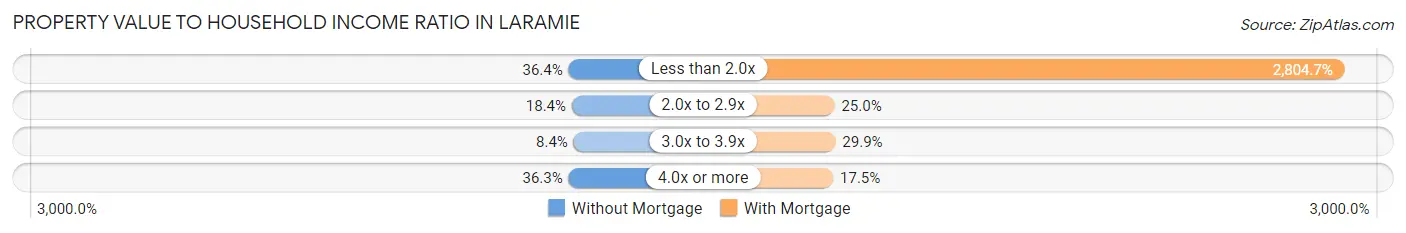
| Value-to-Income Ratio | Without Mortgage | With Mortgage |
| Less than 2.0x | 903 (36.4%) | 109,412 (2,804.7%) |
| 2.0x to 2.9x | 457 (18.4%) | 975 (25.0%) |
| 3.0x to 3.9x | 208 (8.4%) | 1,166 (29.9%) |
| 4.0x or more | 900 (36.2%) | 681 (17.5%) |
| Total | 2,483 (100.0%) | 3,901 (100.0%) |
Real Estate Taxes by Mortgage Status in Laramie
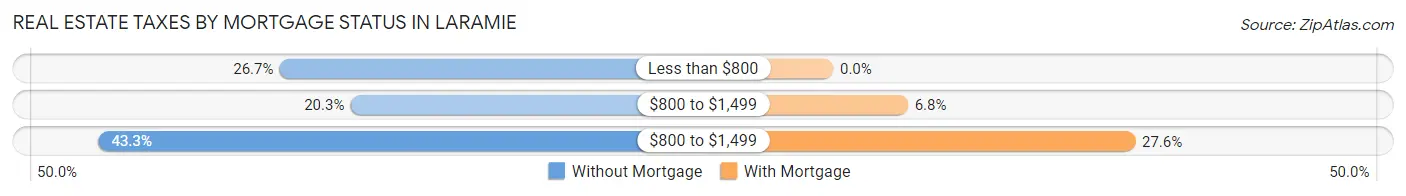
| Property Taxes | Without Mortgage | With Mortgage |
| Less than $800 | 664 (26.7%) | 0 (0.0%) |
| $800 to $1,499 | 503 (20.3%) | 266 (6.8%) |
| $800 to $1,499 | 1,074 (43.2%) | 1,076 (27.6%) |
| Total | 2,483 (100.0%) | 3,901 (100.0%) |
Health & Disability in Laramie
Health Insurance Coverage by Age in Laramie
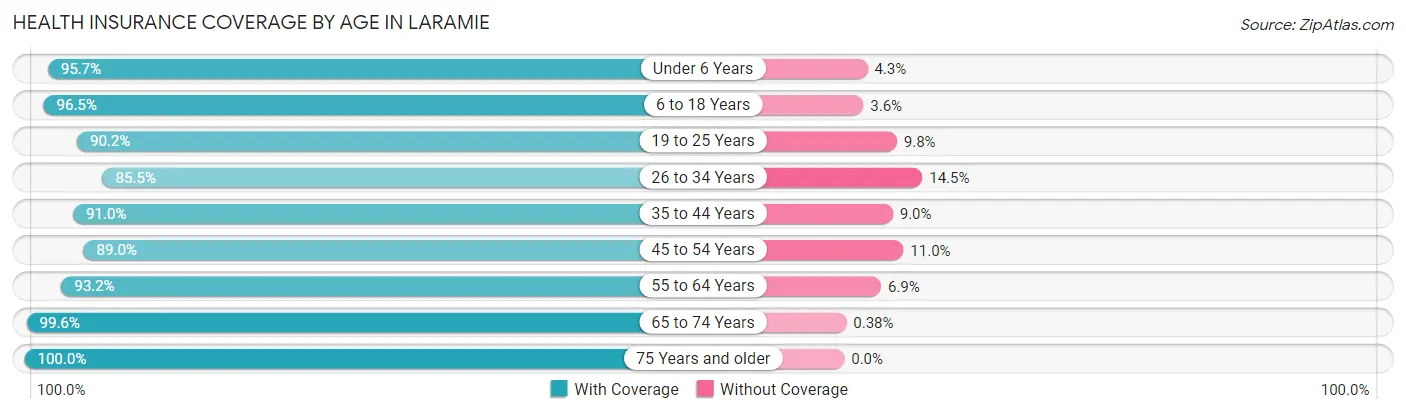
| Age Bracket | With Coverage | Without Coverage |
| Under 6 Years | 1,414 (95.7%) | 64 (4.3%) |
| 6 to 18 Years | 3,835 (96.5%) | 141 (3.5%) |
| 19 to 25 Years | 8,960 (90.2%) | 974 (9.8%) |
| 26 to 34 Years | 4,284 (85.5%) | 729 (14.5%) |
| 35 to 44 Years | 3,039 (91.0%) | 302 (9.0%) |
| 45 to 54 Years | 2,010 (89.0%) | 249 (11.0%) |
| 55 to 64 Years | 2,243 (93.1%) | 165 (6.9%) |
| 65 to 74 Years | 2,099 (99.6%) | 8 (0.4%) |
| 75 Years and older | 1,054 (100.0%) | 0 (0.0%) |
| Total | 28,938 (91.7%) | 2,632 (8.3%) |
Health Insurance Coverage by Citizenship Status in Laramie
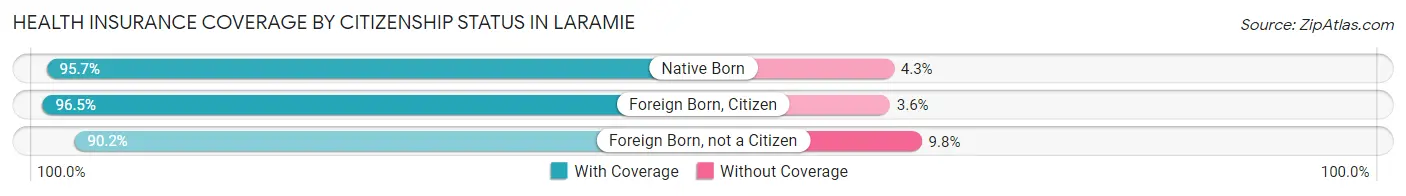
| Citizenship Status | With Coverage | Without Coverage |
| Native Born | 1,414 (95.7%) | 64 (4.3%) |
| Foreign Born, Citizen | 3,835 (96.5%) | 141 (3.5%) |
| Foreign Born, not a Citizen | 8,960 (90.2%) | 974 (9.8%) |
Health Insurance Coverage by Household Income in Laramie

| Household Income | With Coverage | Without Coverage |
| Under $25,000 | 5,281 (87.2%) | 773 (12.8%) |
| $25,000 to $49,999 | 5,274 (89.6%) | 612 (10.4%) |
| $50,000 to $74,999 | 3,812 (87.7%) | 533 (12.3%) |
| $75,000 to $99,999 | 3,073 (95.1%) | 159 (4.9%) |
| $100,000 and over | 9,334 (95.4%) | 446 (4.6%) |
Public vs Private Health Insurance Coverage by Age in Laramie
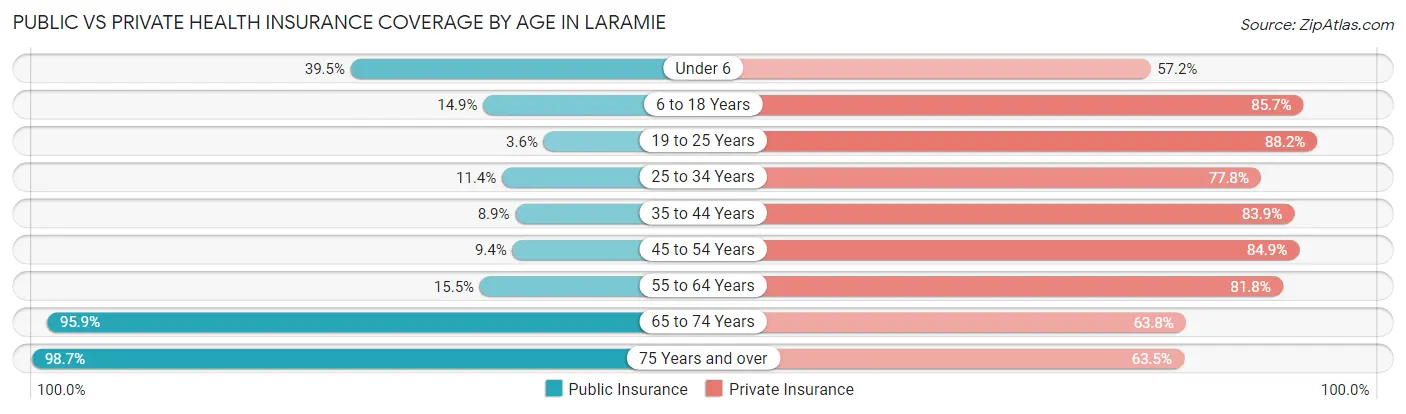
| Age Bracket | Public Insurance | Private Insurance |
| Under 6 | 583 (39.5%) | 846 (57.2%) |
| 6 to 18 Years | 591 (14.9%) | 3,406 (85.7%) |
| 19 to 25 Years | 362 (3.6%) | 8,765 (88.2%) |
| 25 to 34 Years | 570 (11.4%) | 3,899 (77.8%) |
| 35 to 44 Years | 298 (8.9%) | 2,804 (83.9%) |
| 45 to 54 Years | 213 (9.4%) | 1,917 (84.9%) |
| 55 to 64 Years | 373 (15.5%) | 1,970 (81.8%) |
| 65 to 74 Years | 2,020 (95.9%) | 1,345 (63.8%) |
| 75 Years and over | 1,040 (98.7%) | 669 (63.5%) |
| Total | 6,050 (19.2%) | 25,621 (81.2%) |
Disability Status by Sex by Age in Laramie
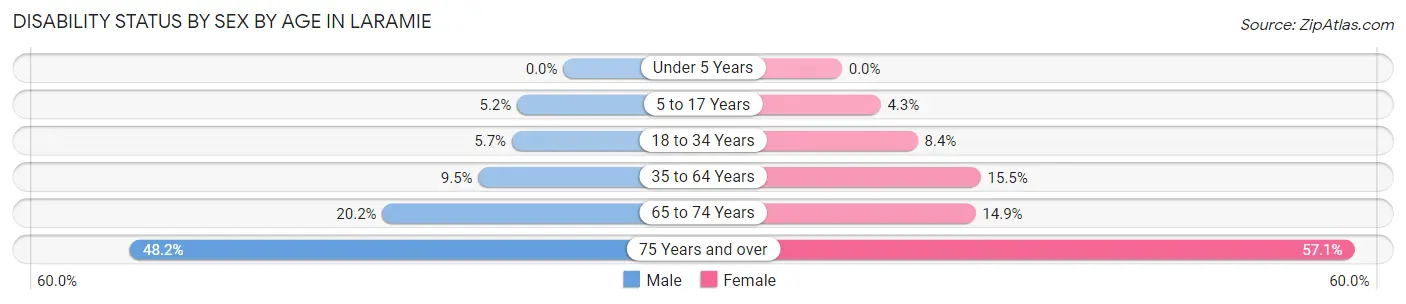
| Age Bracket | Male | Female |
| Under 5 Years | 0 (0.0%) | 0 (0.0%) |
| 5 to 17 Years | 84 (5.1%) | 67 (4.3%) |
| 18 to 34 Years | 494 (5.7%) | 618 (8.4%) |
| 35 to 64 Years | 391 (9.5%) | 599 (15.5%) |
| 65 to 74 Years | 220 (20.2%) | 151 (14.9%) |
| 75 Years and over | 205 (48.2%) | 359 (57.1%) |
Disability Class by Sex by Age in Laramie
Disability Class: Hearing Difficulty
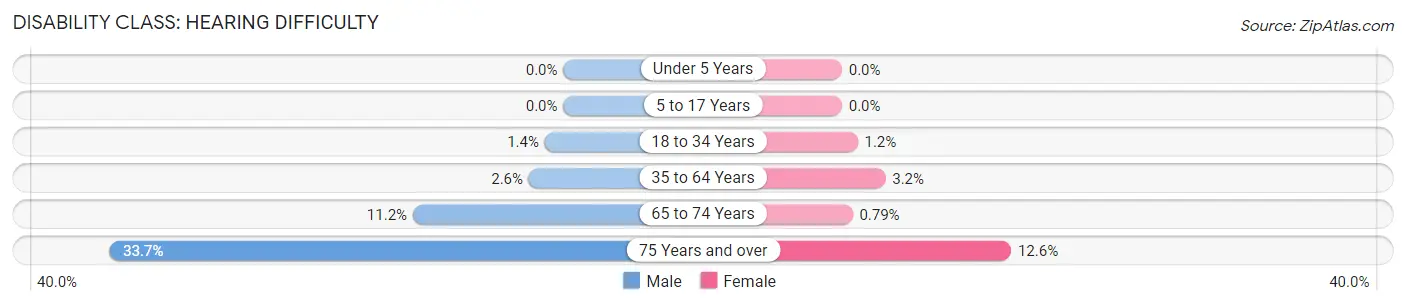
| Age Bracket | Male | Female |
| Under 5 Years | 0 (0.0%) | 0 (0.0%) |
| 5 to 17 Years | 0 (0.0%) | 0 (0.0%) |
| 18 to 34 Years | 119 (1.4%) | 86 (1.2%) |
| 35 to 64 Years | 106 (2.6%) | 125 (3.2%) |
| 65 to 74 Years | 122 (11.2%) | 8 (0.8%) |
| 75 Years and over | 143 (33.7%) | 79 (12.6%) |
Disability Class: Vision Difficulty
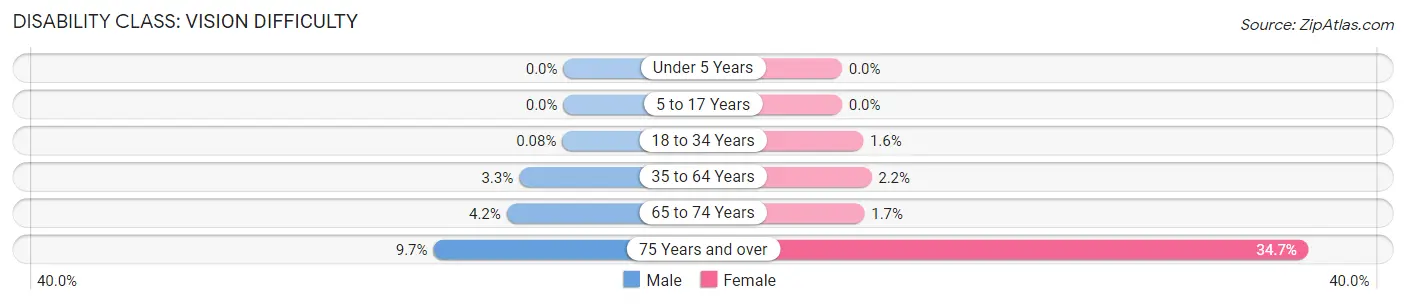
| Age Bracket | Male | Female |
| Under 5 Years | 0 (0.0%) | 0 (0.0%) |
| 5 to 17 Years | 0 (0.0%) | 0 (0.0%) |
| 18 to 34 Years | 7 (0.1%) | 115 (1.6%) |
| 35 to 64 Years | 136 (3.3%) | 85 (2.2%) |
| 65 to 74 Years | 46 (4.2%) | 17 (1.7%) |
| 75 Years and over | 41 (9.7%) | 218 (34.7%) |
Disability Class: Cognitive Difficulty
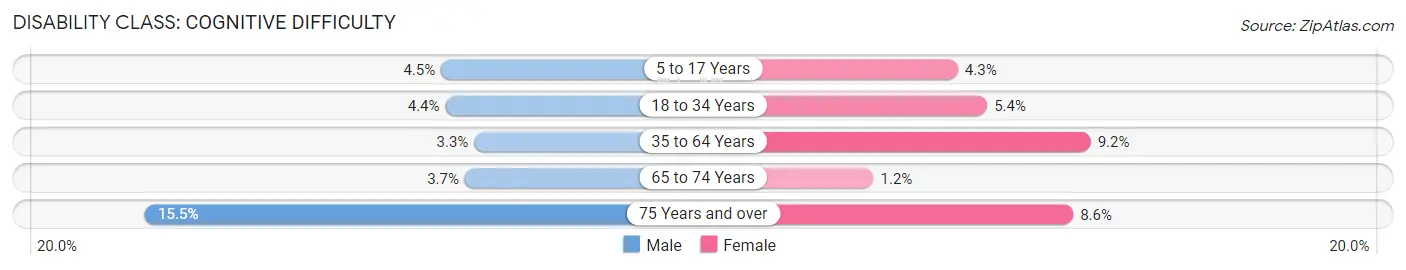
| Age Bracket | Male | Female |
| 5 to 17 Years | 74 (4.5%) | 67 (4.3%) |
| 18 to 34 Years | 378 (4.4%) | 395 (5.4%) |
| 35 to 64 Years | 137 (3.3%) | 358 (9.2%) |
| 65 to 74 Years | 40 (3.7%) | 12 (1.2%) |
| 75 Years and over | 66 (15.5%) | 54 (8.6%) |
Disability Class: Ambulatory Difficulty
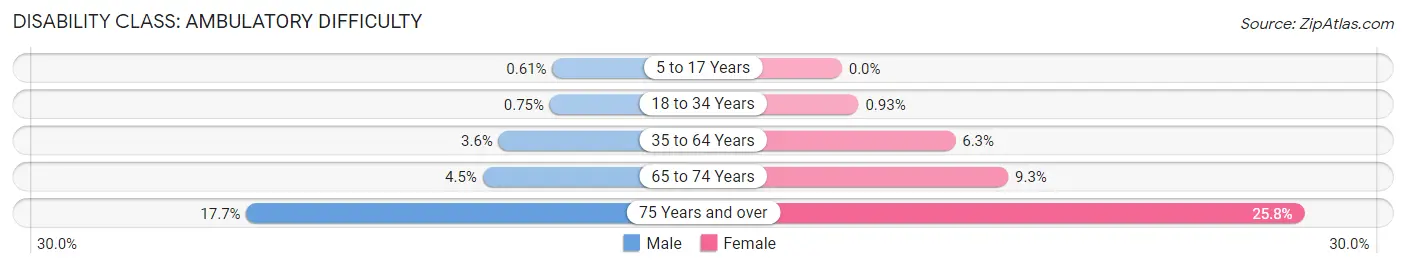
| Age Bracket | Male | Female |
| 5 to 17 Years | 10 (0.6%) | 0 (0.0%) |
| 18 to 34 Years | 65 (0.7%) | 68 (0.9%) |
| 35 to 64 Years | 149 (3.6%) | 245 (6.3%) |
| 65 to 74 Years | 49 (4.5%) | 94 (9.3%) |
| 75 Years and over | 75 (17.6%) | 162 (25.8%) |
Disability Class: Self-Care Difficulty
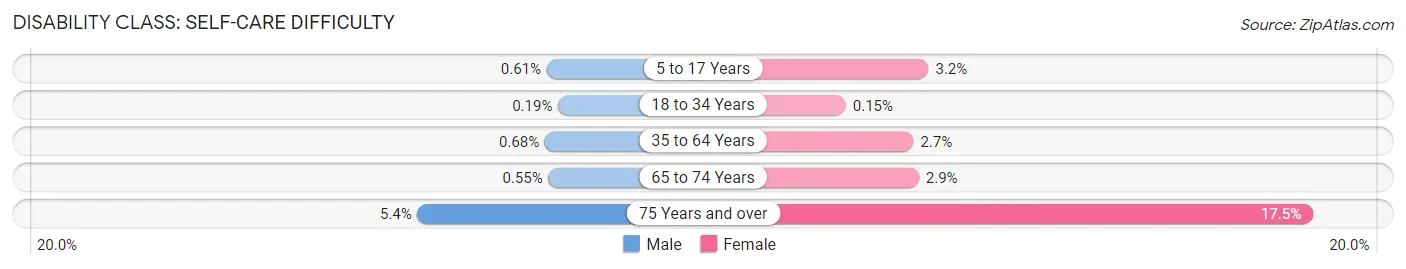
| Age Bracket | Male | Female |
| 5 to 17 Years | 10 (0.6%) | 50 (3.2%) |
| 18 to 34 Years | 16 (0.2%) | 11 (0.2%) |
| 35 to 64 Years | 28 (0.7%) | 103 (2.7%) |
| 65 to 74 Years | 6 (0.5%) | 29 (2.9%) |
| 75 Years and over | 23 (5.4%) | 110 (17.5%) |
Technology Access in Laramie
Computing Device Access in Laramie
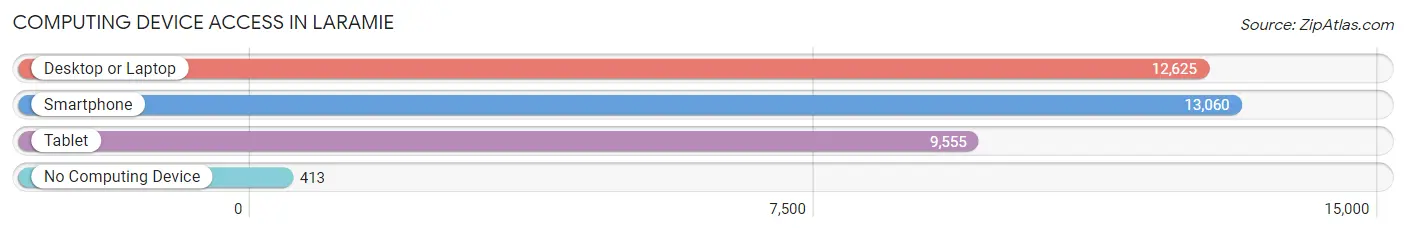
| Device Type | # Households | % Households |
| Desktop or Laptop | 12,625 | 90.5% |
| Smartphone | 13,060 | 93.7% |
| Tablet | 9,555 | 68.5% |
| No Computing Device | 413 | 3.0% |
| Total | 13,943 | 100.0% |
Internet Access in Laramie
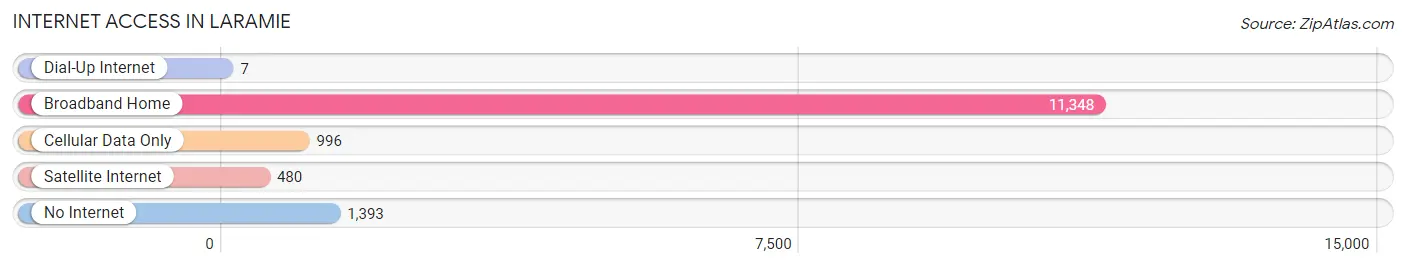
| Internet Type | # Households | % Households |
| Dial-Up Internet | 7 | 0.1% |
| Broadband Home | 11,348 | 81.4% |
| Cellular Data Only | 996 | 7.1% |
| Satellite Internet | 480 | 3.4% |
| No Internet | 1,393 | 10.0% |
| Total | 13,943 | 100.0% |
Laramie Summary
Laramie, Wyoming is a city located in the southeastern corner of the state, in Albany County. It is the county seat and the home of the University of Wyoming. The city is situated at the base of the Laramie Mountains and is surrounded by the Laramie Plains. The city has a population of 30,816 as of the 2010 census, making it the largest city in the state.
History
The area that is now Laramie was first inhabited by the Arapaho and Shoshone tribes. The first Europeans to explore the area were French fur trappers in the early 1800s. The first permanent settlement was established in 1868 when the Union Pacific Railroad chose the area as a stop on its transcontinental route. The city was named after Jacques LaRamie, a French trapper who had been killed in the area in 1821.
The city quickly grew as a center of commerce and transportation. In 1869, the University of Wyoming was established, making Laramie the first city in the state to have a college. The city also became a center for the cattle industry, with the first cattle drive taking place in 1876.
Geography
Laramie is located in southeastern Wyoming, in Albany County. It is situated at the base of the Laramie Mountains and is surrounded by the Laramie Plains. The city is located at the intersection of Interstate 80 and US Highway 287. The city has a total area of 10.3 square miles, of which 10.2 square miles is land and 0.1 square miles is water.
Economy
Laramie’s economy is largely based on education, healthcare, and government services. The University of Wyoming is the largest employer in the city, with over 4,000 employees. Other major employers include Albany County School District, Ivinson Memorial Hospital, and the State of Wyoming.
The city is also home to several manufacturing companies, including Laramie Boomerang, a manufacturer of snowboards and other winter sports equipment. The city is also home to several technology companies, including the software development firm, Laramie Labs.
Demographics
As of the 2010 census, Laramie had a population of 30,816. The racial makeup of the city was 90.2% White, 1.2% African American, 0.9% Native American, 2.2% Asian, 0.1% Pacific Islander, 3.2% from other races, and 2.2% from two or more races. Hispanic or Latino of any race were 8.3% of the population.
The median income for a household in the city was $37,945, and the median income for a family was $50,919. The per capita income for the city was $20,945. About 11.2% of families and 17.2% of the population were below the poverty line, including 22.2% of those under age 18 and 8.2% of those age 65 or over.
Common Questions
What is Per Capita Income in Laramie?
Per Capita income in Laramie is $31,959.
What is the Median Family Income in Laramie?
Median Family Income in Laramie is $88,676.
What is the Median Household income in Laramie?
Median Household Income in Laramie is $50,539.
What is Income or Wage Gap in Laramie?
Income or Wage Gap in Laramie is 35.3%.
Women in Laramie earn 64.7 cents for every dollar earned by a man.
What is Family Income Deficit in Laramie?
Family Income Deficit in Laramie is $8,276.
Families that are below poverty line in Laramie earn $8,276 less on average than the poverty threshold level.
What is Inequality or Gini Index in Laramie?
Inequality or Gini Index in Laramie is 0.48.
What is the Total Population of Laramie?
Total Population of Laramie is 31,735.
What is the Total Male Population of Laramie?
Total Male Population of Laramie is 16,726.
What is the Total Female Population of Laramie?
Total Female Population of Laramie is 15,009.
What is the Ratio of Males per 100 Females in Laramie?
There are 111.44 Males per 100 Females in Laramie.
What is the Ratio of Females per 100 Males in Laramie?
There are 89.73 Females per 100 Males in Laramie.
What is the Median Population Age in Laramie?
Median Population Age in Laramie is 26.6 Years.
What is the Average Family Size in Laramie
Average Family Size in Laramie is 2.7 People.
What is the Average Household Size in Laramie
Average Household Size in Laramie is 2.1 People.
How Large is the Labor Force in Laramie?
There are 19,564 People in the Labor Forcein in Laramie.
What is the Percentage of People in the Labor Force in Laramie?
70.4% of People are in the Labor Force in Laramie.
What is the Unemployment Rate in Laramie?
Unemployment Rate in Laramie is 4.7%.