Evansville, WY Map & Demographics
Evansville Map
Evansville Overview
$30,909
PER CAPITA INCOME
$79,541
AVG FAMILY INCOME
$76,646
AVG HOUSEHOLD INCOME
40.5%
WAGE / INCOME GAP [ % ]
59.5¢/ $1
WAGE / INCOME GAP [ $ ]
0.36
INEQUALITY / GINI INDEX
2,755
TOTAL POPULATION
1,381
MALE POPULATION
1,374
FEMALE POPULATION
100.51
MALES / 100 FEMALES
99.49
FEMALES / 100 MALES
30.0
MEDIAN AGE
3.3
AVG FAMILY SIZE
2.9
AVG HOUSEHOLD SIZE
1,467
LABOR FORCE [ PEOPLE ]
72.9%
PERCENT IN LABOR FORCE
5.4%
UNEMPLOYMENT RATE
Evansville Zip Codes
Evansville Area Codes
Income in Evansville
Income Overview in Evansville
Per Capita Income in Evansville is $30,909, while median incomes of families and households are $79,541 and $76,646 respectively.
| Characteristic | Number | Measure |
| Per Capita Income | 2,755 | $30,909 |
| Median Family Income | 710 | $79,541 |
| Mean Family Income | 710 | $93,345 |
| Median Household Income | 952 | $76,646 |
| Mean Household Income | 952 | $83,182 |
| Income Deficit | 710 | $0 |
| Wage / Income Gap (%) | 2,755 | 40.45% |
| Wage / Income Gap ($) | 2,755 | 59.55¢ per $1 |
| Gini / Inequality Index | 2,755 | 0.36 |
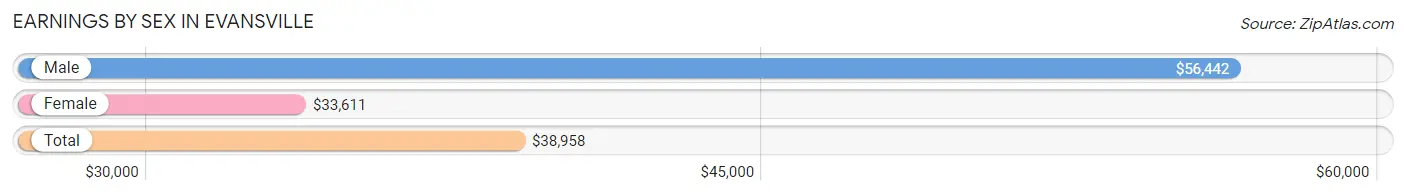
Earnings by Sex in Evansville
Average Earnings in Evansville are $38,958, $56,442 for men and $33,611 for women, a difference of 40.5%.
| Sex | Number | Average Earnings |
| Male | 781 (52.7%) | $56,442 |
| Female | 700 (47.3%) | $33,611 |
| Total | 1,481 (100.0%) | $38,958 |
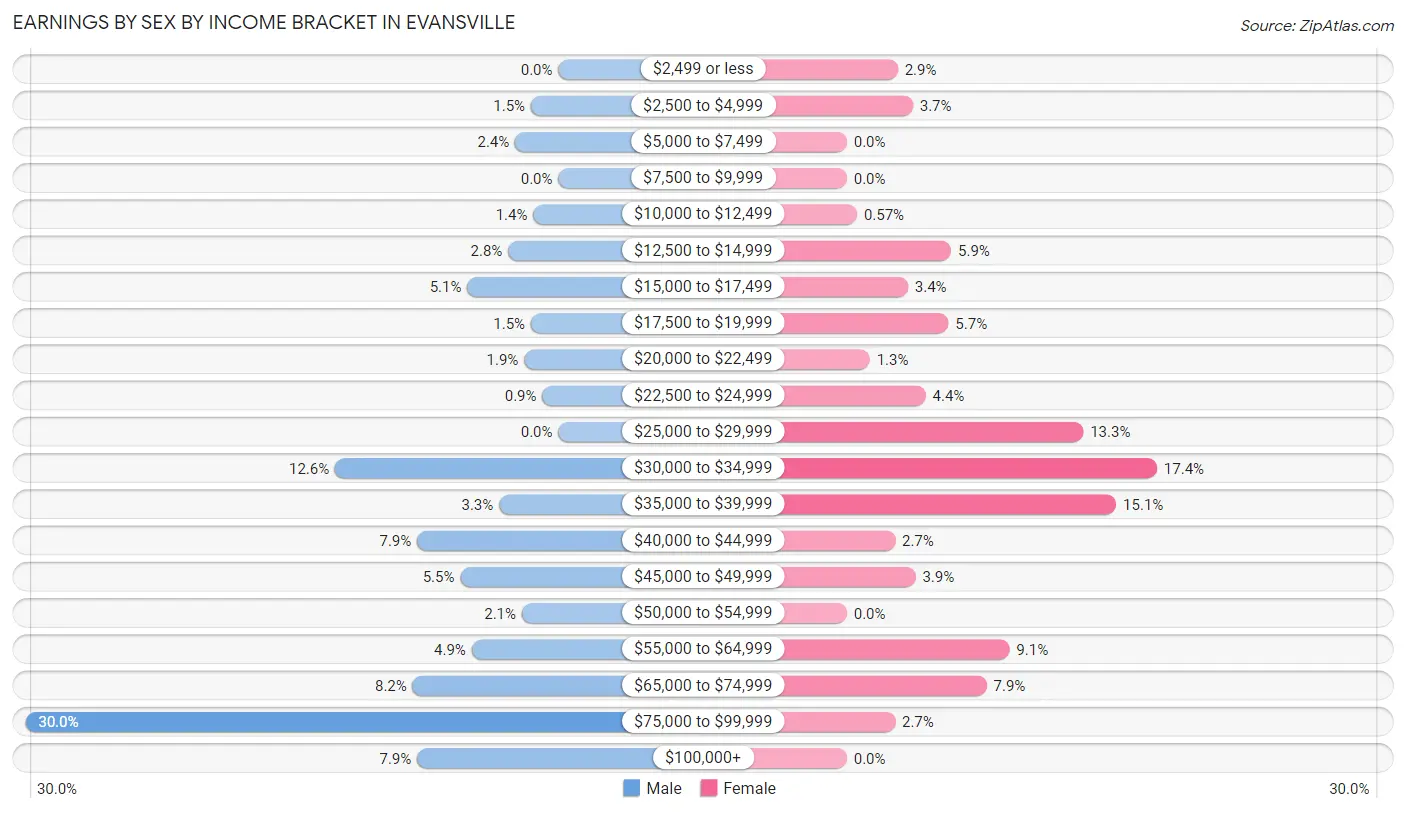
Earnings by Sex by Income Bracket in Evansville
The most common earnings brackets in Evansville are $75,000 to $99,999 for men (234 | 30.0%) and $30,000 to $34,999 for women (122 | 17.4%).
| Income | Male | Female |
| $2,499 or less | 0 (0.0%) | 20 (2.9%) |
| $2,500 to $4,999 | 12 (1.5%) | 26 (3.7%) |
| $5,000 to $7,499 | 19 (2.4%) | 0 (0.0%) |
| $7,500 to $9,999 | 0 (0.0%) | 0 (0.0%) |
| $10,000 to $12,499 | 11 (1.4%) | 4 (0.6%) |
| $12,500 to $14,999 | 22 (2.8%) | 41 (5.9%) |
| $15,000 to $17,499 | 40 (5.1%) | 24 (3.4%) |
| $17,500 to $19,999 | 12 (1.5%) | 40 (5.7%) |
| $20,000 to $22,499 | 15 (1.9%) | 9 (1.3%) |
| $22,500 to $24,999 | 7 (0.9%) | 31 (4.4%) |
| $25,000 to $29,999 | 0 (0.0%) | 93 (13.3%) |
| $30,000 to $34,999 | 98 (12.6%) | 122 (17.4%) |
| $35,000 to $39,999 | 26 (3.3%) | 106 (15.1%) |
| $40,000 to $44,999 | 62 (7.9%) | 19 (2.7%) |
| $45,000 to $49,999 | 43 (5.5%) | 27 (3.9%) |
| $50,000 to $54,999 | 16 (2.1%) | 0 (0.0%) |
| $55,000 to $64,999 | 38 (4.9%) | 64 (9.1%) |
| $65,000 to $74,999 | 64 (8.2%) | 55 (7.9%) |
| $75,000 to $99,999 | 234 (30.0%) | 19 (2.7%) |
| $100,000+ | 62 (7.9%) | 0 (0.0%) |
| Total | 781 (100.0%) | 700 (100.0%) |
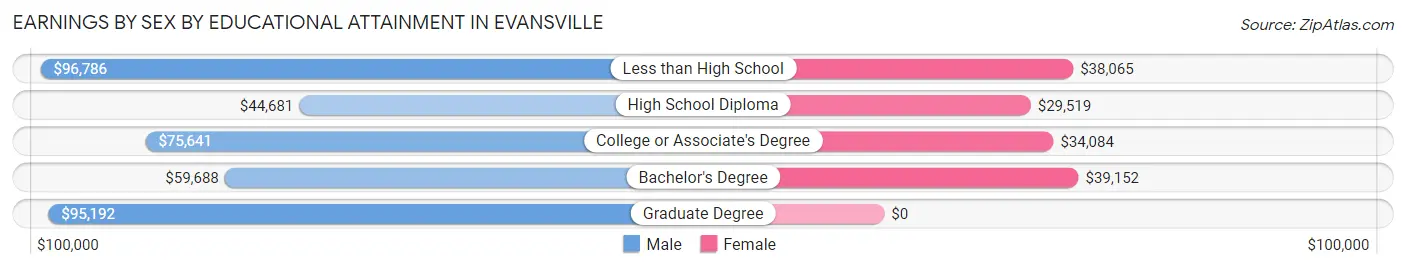
Earnings by Sex by Educational Attainment in Evansville
Average earnings in Evansville are $68,074 for men and $35,000 for women, a difference of 48.6%. Men with an educational attainment of less than high school enjoy the highest average annual earnings of $96,786, while those with high school diploma education earn the least with $44,681. Women with an educational attainment of bachelor's degree earn the most with the average annual earnings of $39,152, while those with high school diploma education have the smallest earnings of $29,519.
| Educational Attainment | Male Income | Female Income |
| Less than High School | $96,786 | $38,065 |
| High School Diploma | $44,681 | $29,519 |
| College or Associate's Degree | $75,641 | $34,084 |
| Bachelor's Degree | $59,688 | $39,152 |
| Graduate Degree | $95,192 | $0 |
| Total | $68,074 | $35,000 |
Family Income in Evansville
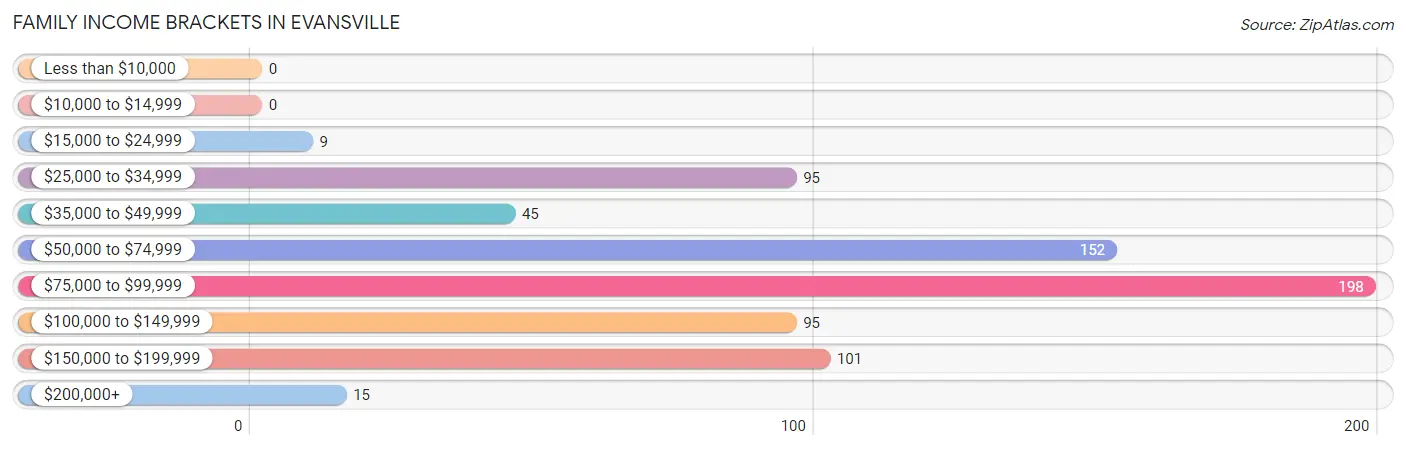
Family Income Brackets in Evansville
According to the Evansville family income data, there are 198 families falling into the $75,000 to $99,999 income range, which is the most common income bracket and makes up 27.9% of all families.
| Income Bracket | # Families | % Families |
| Less than $10,000 | 0 | 0.0% |
| $10,000 to $14,999 | 0 | 0.0% |
| $15,000 to $24,999 | 9 | 1.3% |
| $25,000 to $34,999 | 95 | 13.4% |
| $35,000 to $49,999 | 45 | 6.3% |
| $50,000 to $74,999 | 152 | 21.4% |
| $75,000 to $99,999 | 198 | 27.9% |
| $100,000 to $149,999 | 95 | 13.4% |
| $150,000 to $199,999 | 101 | 14.2% |
| $200,000+ | 15 | 2.1% |
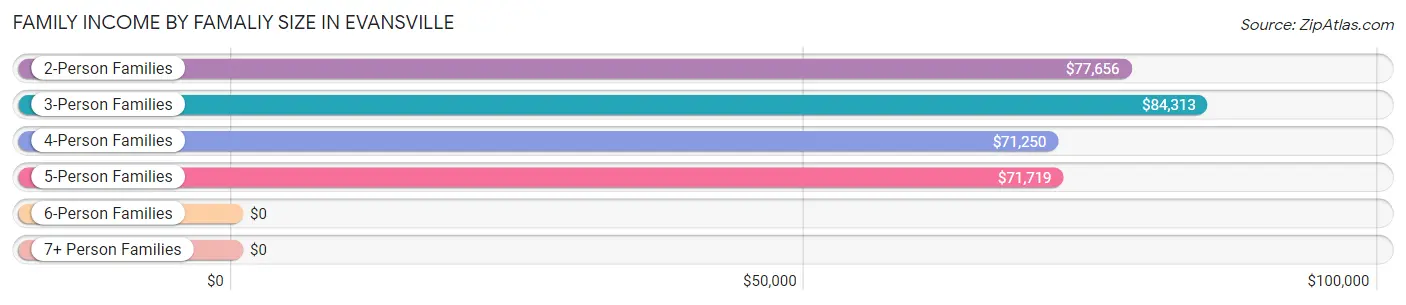
Family Income by Famaliy Size in Evansville
3-person families (129 | 18.2%) account for the highest median family income in Evansville with $84,313 per family, while 2-person families (276 | 38.9%) have the highest median income of $38,828 per family member.
| Income Bracket | # Families | Median Income |
| 2-Person Families | 276 (38.9%) | $77,656 |
| 3-Person Families | 129 (18.2%) | $84,313 |
| 4-Person Families | 211 (29.7%) | $71,250 |
| 5-Person Families | 33 (4.6%) | $71,719 |
| 6-Person Families | 30 (4.2%) | $0 |
| 7+ Person Families | 31 (4.4%) | $0 |
| Total | 710 (100.0%) | $79,541 |
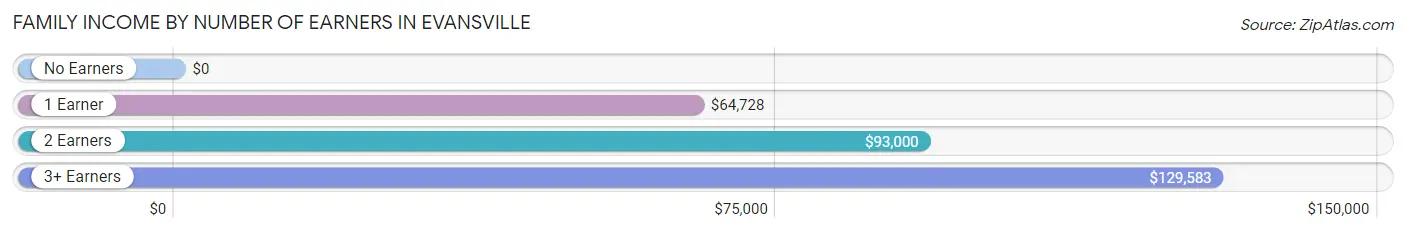
Family Income by Number of Earners in Evansville
| Number of Earners | # Families | Median Income |
| No Earners | 73 (10.3%) | $0 |
| 1 Earner | 273 (38.5%) | $64,728 |
| 2 Earners | 334 (47.0%) | $93,000 |
| 3+ Earners | 30 (4.2%) | $129,583 |
| Total | 710 (100.0%) | $79,541 |
Household Income in Evansville
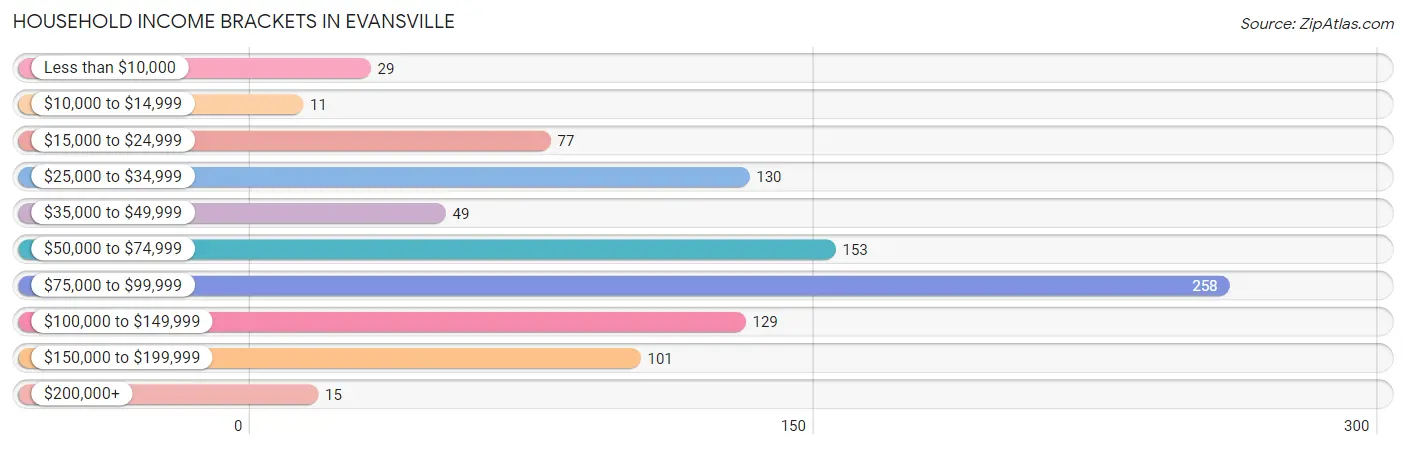
Household Income Brackets in Evansville
With 258 households falling in the category, the $75,000 to $99,999 income range is the most frequent in Evansville, accounting for 27.1% of all households. In contrast, only 11 households (1.2%) fall into the $10,000 to $14,999 income bracket, making it the least populous group.
| Income Bracket | # Households | % Households |
| Less than $10,000 | 29 | 3.0% |
| $10,000 to $14,999 | 11 | 1.2% |
| $15,000 to $24,999 | 77 | 8.1% |
| $25,000 to $34,999 | 130 | 13.7% |
| $35,000 to $49,999 | 49 | 5.1% |
| $50,000 to $74,999 | 153 | 16.1% |
| $75,000 to $99,999 | 258 | 27.1% |
| $100,000 to $149,999 | 129 | 13.6% |
| $150,000 to $199,999 | 101 | 10.6% |
| $200,000+ | 15 | 1.6% |
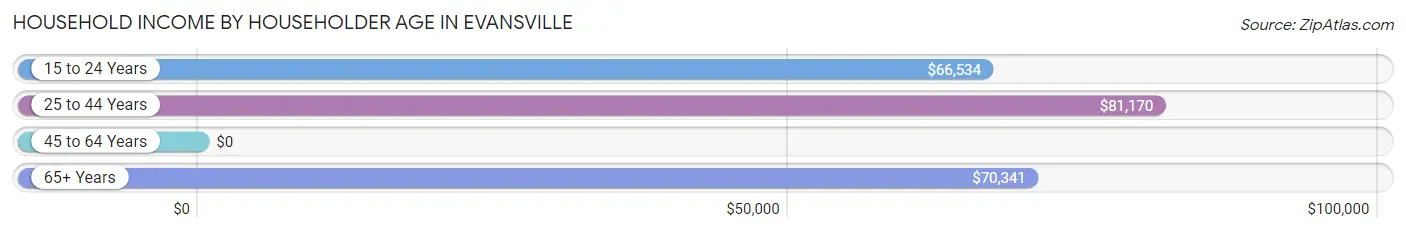
Household Income by Householder Age in Evansville
The median household income in Evansville is $76,646, with the highest median household income of $81,170 found in the 25 to 44 years age bracket for the primary householder. A total of 478 households (50.2%) fall into this category. Meanwhile, the 45 to 64 years age bracket for the primary householder has the lowest median household income of $0, with 197 households (20.7%) in this group.
| Income Bracket | # Households | Median Income |
| 15 to 24 Years | 110 (11.6%) | $66,534 |
| 25 to 44 Years | 478 (50.2%) | $81,170 |
| 45 to 64 Years | 197 (20.7%) | $0 |
| 65+ Years | 167 (17.5%) | $70,341 |
| Total | 952 (100.0%) | $76,646 |
Poverty in Evansville
Income Below Poverty by Sex and Age in Evansville
With 4.2% poverty level for males and 6.2% for females among the residents of Evansville, 45 to 54 year old males and 18 to 24 year old females are the most vulnerable to poverty, with 31 males (29.0%) and 36 females (29.0%) in their respective age groups living below the poverty level.
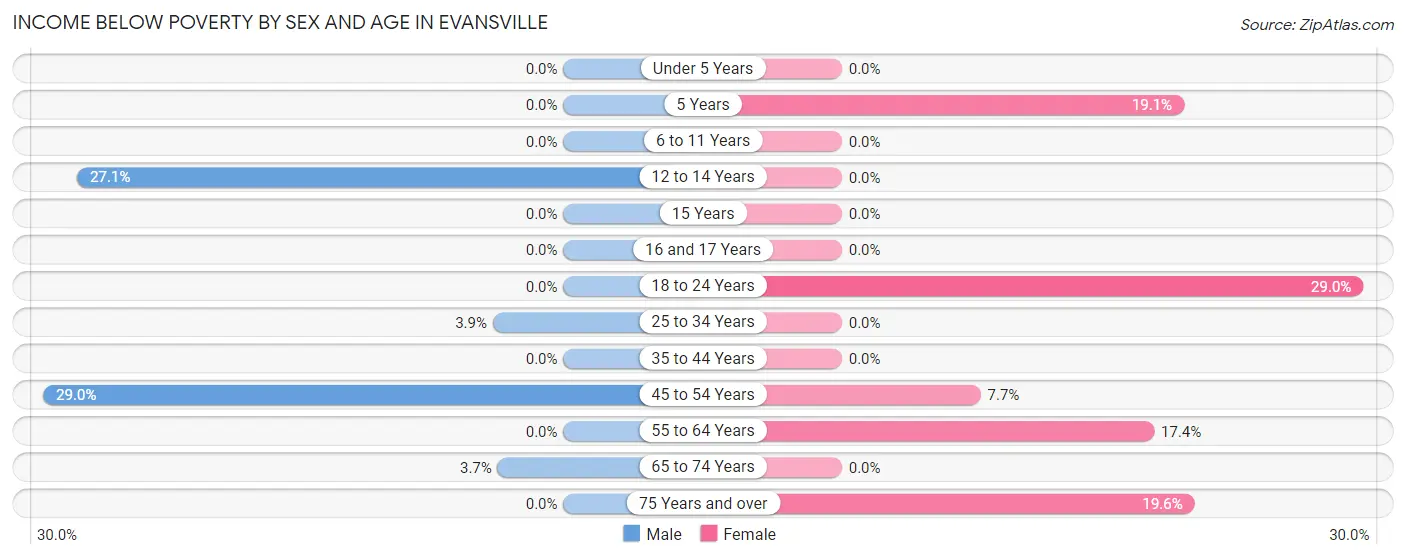
| Age Bracket | Male | Female |
| Under 5 Years | 0 (0.0%) | 0 (0.0%) |
| 5 Years | 0 (0.0%) | 8 (19.1%) |
| 6 to 11 Years | 0 (0.0%) | 0 (0.0%) |
| 12 to 14 Years | 13 (27.1%) | 0 (0.0%) |
| 15 Years | 0 (0.0%) | 0 (0.0%) |
| 16 and 17 Years | 0 (0.0%) | 0 (0.0%) |
| 18 to 24 Years | 0 (0.0%) | 36 (29.0%) |
| 25 to 34 Years | 11 (3.9%) | 0 (0.0%) |
| 35 to 44 Years | 0 (0.0%) | 0 (0.0%) |
| 45 to 54 Years | 31 (29.0%) | 14 (7.7%) |
| 55 to 64 Years | 0 (0.0%) | 16 (17.4%) |
| 65 to 74 Years | 3 (3.7%) | 0 (0.0%) |
| 75 Years and over | 0 (0.0%) | 11 (19.6%) |
| Total | 58 (4.2%) | 85 (6.2%) |
Income Above Poverty by Sex and Age in Evansville
According to the poverty statistics in Evansville, males aged under 5 years and females aged under 5 years are the age groups that are most secure financially, with 100.0% of males and 100.0% of females in these age groups living above the poverty line.
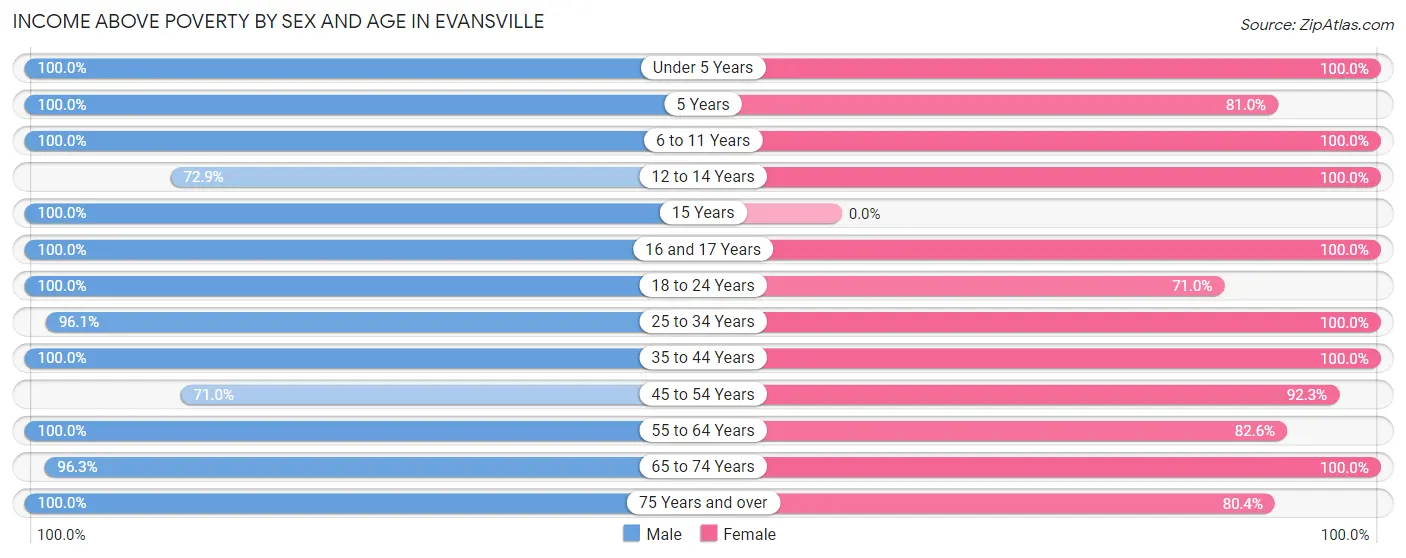
| Age Bracket | Male | Female |
| Under 5 Years | 126 (100.0%) | 162 (100.0%) |
| 5 Years | 27 (100.0%) | 34 (80.9%) |
| 6 to 11 Years | 123 (100.0%) | 158 (100.0%) |
| 12 to 14 Years | 35 (72.9%) | 21 (100.0%) |
| 15 Years | 35 (100.0%) | 0 (0.0%) |
| 16 and 17 Years | 36 (100.0%) | 26 (100.0%) |
| 18 to 24 Years | 131 (100.0%) | 88 (71.0%) |
| 25 to 34 Years | 269 (96.1%) | 307 (100.0%) |
| 35 to 44 Years | 275 (100.0%) | 137 (100.0%) |
| 45 to 54 Years | 76 (71.0%) | 167 (92.3%) |
| 55 to 64 Years | 71 (100.0%) | 76 (82.6%) |
| 65 to 74 Years | 79 (96.3%) | 68 (100.0%) |
| 75 Years and over | 40 (100.0%) | 45 (80.4%) |
| Total | 1,323 (95.8%) | 1,289 (93.8%) |
Income Below Poverty Among Married-Couple Families in Evansville
The poverty statistics for married-couple families in Evansville show that 1.7% or 9 of the total 526 families live below the poverty line. Families with 1 or 2 children have the highest poverty rate of 3.7%, comprising of 9 families. On the other hand, families with no children have the lowest poverty rate of 0.0%, which includes 0 families.
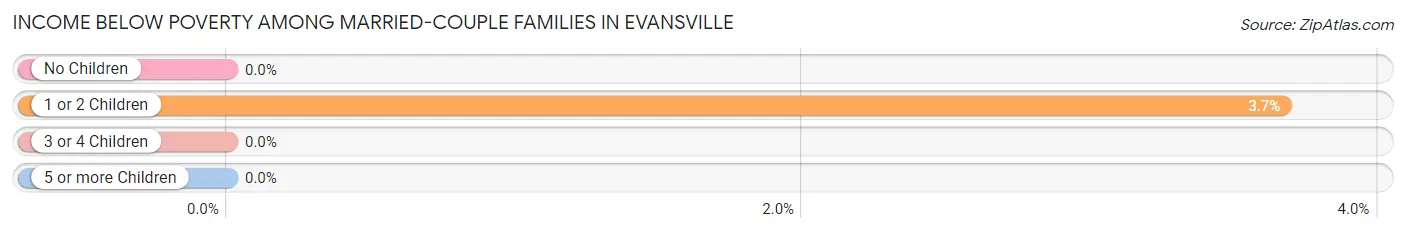
| Children | Above Poverty | Below Poverty |
| No Children | 187 (100.0%) | 0 (0.0%) |
| 1 or 2 Children | 236 (96.3%) | 9 (3.7%) |
| 3 or 4 Children | 63 (100.0%) | 0 (0.0%) |
| 5 or more Children | 31 (100.0%) | 0 (0.0%) |
| Total | 517 (98.3%) | 9 (1.7%) |
Income Below Poverty Among Single-Parent Households in Evansville
| Children | Single Father | Single Mother |
| No Children | 0 (0.0%) | 0 (0.0%) |
| 1 or 2 Children | 0 (0.0%) | 0 (0.0%) |
| 3 or 4 Children | 0 (0.0%) | 0 (0.0%) |
| 5 or more Children | 0 (0.0%) | 0 (0.0%) |
| Total | 0 (0.0%) | 0 (0.0%) |
Income Below Poverty Among Married-Couple vs Single-Parent Households in Evansville
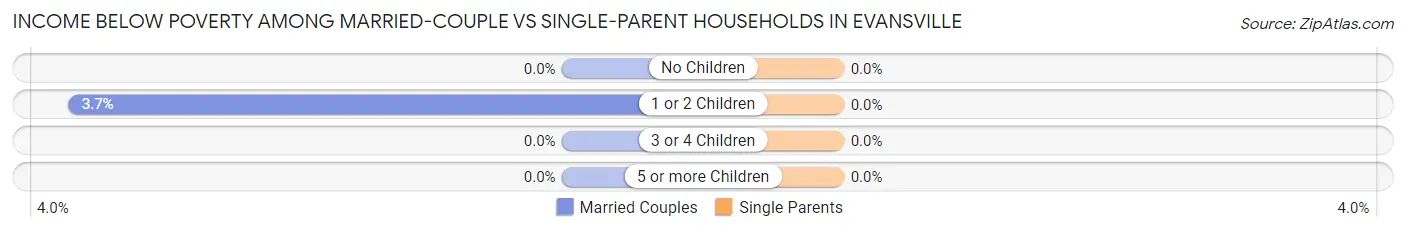
| Children | Married-Couple Families | Single-Parent Households |
| No Children | 0 (0.0%) | 0 (0.0%) |
| 1 or 2 Children | 9 (3.7%) | 0 (0.0%) |
| 3 or 4 Children | 0 (0.0%) | 0 (0.0%) |
| 5 or more Children | 0 (0.0%) | 0 (0.0%) |
| Total | 9 (1.7%) | 0 (0.0%) |
Race in Evansville
The most populous races in Evansville are White / Caucasian (2,358 | 85.6%), Hispanic or Latino (542 | 19.7%), and Two or more Races (244 | 8.9%).
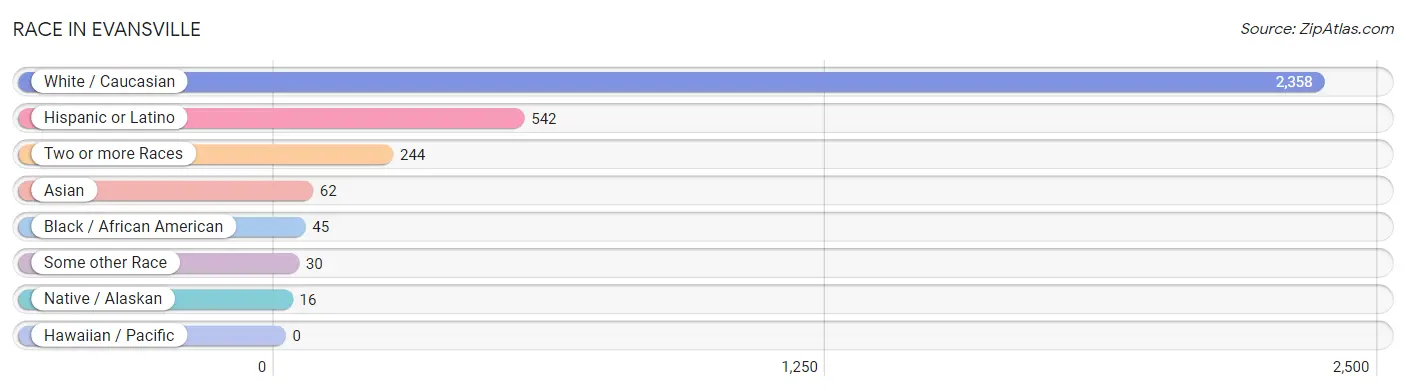
| Race | # Population | % Population |
| Asian | 62 | 2.2% |
| Black / African American | 45 | 1.6% |
| Hawaiian / Pacific | 0 | 0.0% |
| Hispanic or Latino | 542 | 19.7% |
| Native / Alaskan | 16 | 0.6% |
| White / Caucasian | 2,358 | 85.6% |
| Two or more Races | 244 | 8.9% |
| Some other Race | 30 | 1.1% |
| Total | 2,755 | 100.0% |
Ancestry in Evansville
The most populous ancestries reported in Evansville are German (615 | 22.3%), Irish (315 | 11.4%), Mexican (305 | 11.1%), Norwegian (133 | 4.8%), and Korean (62 | 2.2%), together accounting for 51.9% of all Evansville residents.
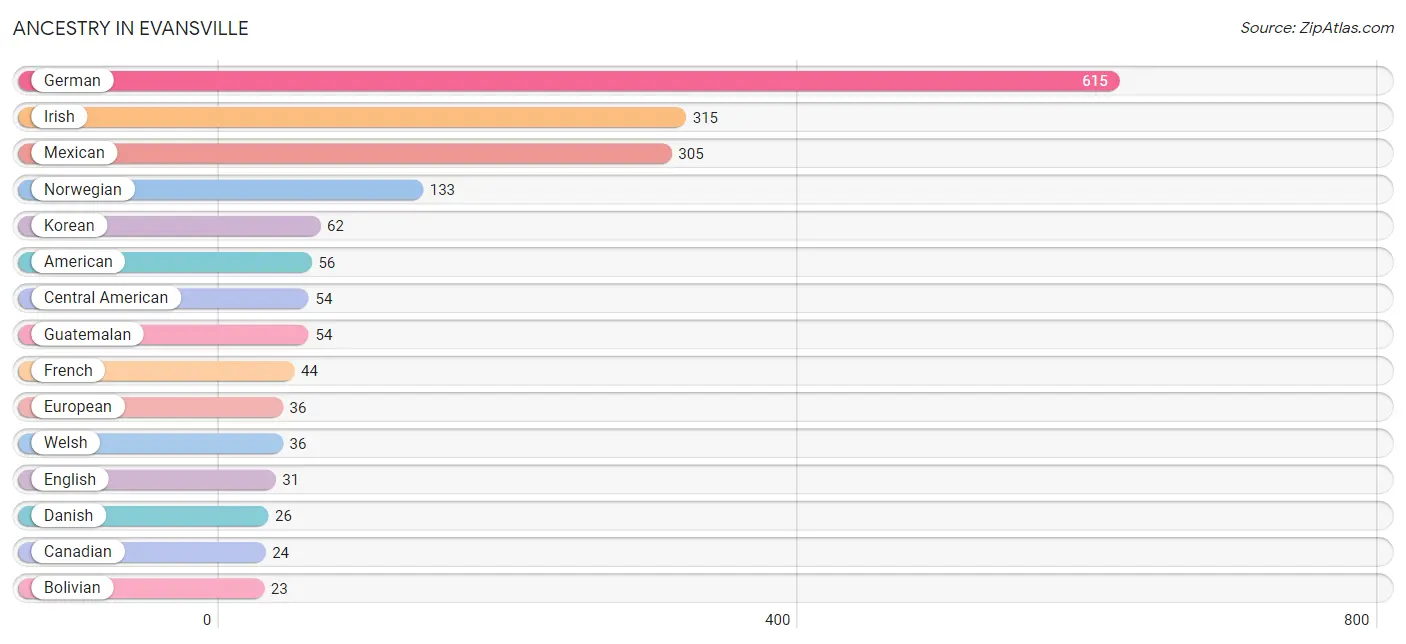
| Ancestry | # Population | % Population |
| American | 56 | 2.0% |
| Austrian | 3 | 0.1% |
| Belgian | 12 | 0.4% |
| Bolivian | 23 | 0.8% |
| Canadian | 24 | 0.9% |
| Central American | 54 | 2.0% |
| Danish | 26 | 0.9% |
| Dutch | 16 | 0.6% |
| English | 31 | 1.1% |
| European | 36 | 1.3% |
| French | 44 | 1.6% |
| German | 615 | 22.3% |
| Greek | 5 | 0.2% |
| Guatemalan | 54 | 2.0% |
| Hungarian | 11 | 0.4% |
| Irish | 315 | 11.4% |
| Italian | 20 | 0.7% |
| Korean | 62 | 2.2% |
| Mexican | 305 | 11.1% |
| Norwegian | 133 | 4.8% |
| Polish | 9 | 0.3% |
| Russian | 13 | 0.5% |
| Scotch-Irish | 11 | 0.4% |
| Scottish | 19 | 0.7% |
| Sioux | 16 | 0.6% |
| South American | 23 | 0.8% |
| Spaniard | 16 | 0.6% |
| Swedish | 21 | 0.8% |
| Welsh | 36 | 1.3% | View All 29 Rows |
Immigrants in Evansville
The most numerous immigrant groups reported in Evansville came from Asia (62 | 2.2%), Central America (55 | 2.0%), Latin America (55 | 2.0%), Mexico (51 | 1.8%), and Eastern Asia (41 | 1.5%), together accounting for 9.6% of all Evansville residents.
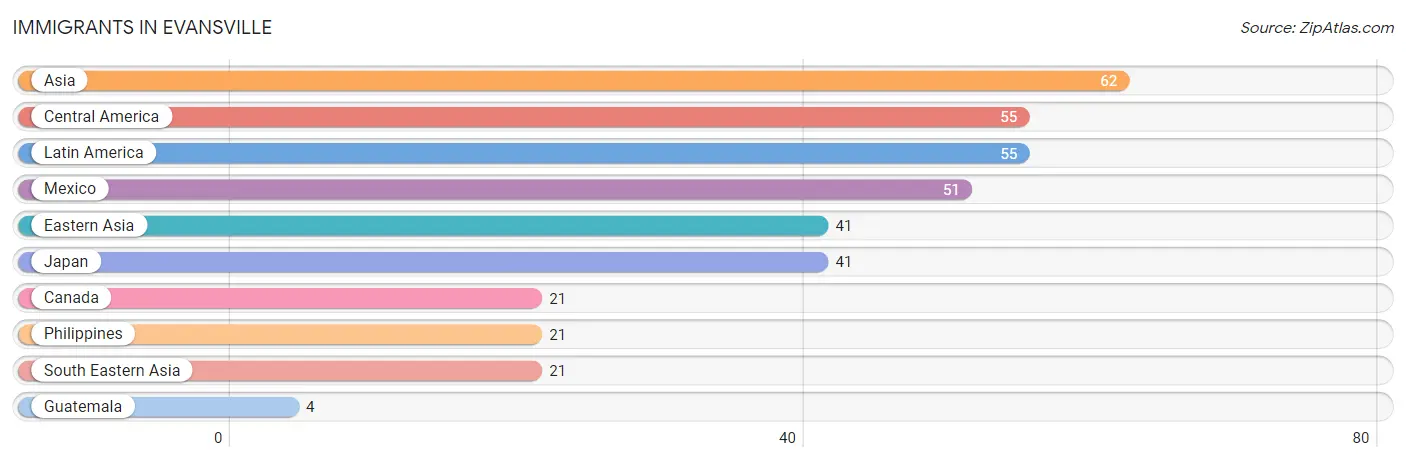
| Immigration Origin | # Population | % Population |
| Asia | 62 | 2.2% |
| Canada | 21 | 0.8% |
| Central America | 55 | 2.0% |
| Eastern Asia | 41 | 1.5% |
| Guatemala | 4 | 0.2% |
| Japan | 41 | 1.5% |
| Latin America | 55 | 2.0% |
| Mexico | 51 | 1.8% |
| Philippines | 21 | 0.8% |
| South Eastern Asia | 21 | 0.8% | View All 10 Rows |
Sex and Age in Evansville
Sex and Age in Evansville
The most populous age groups in Evansville are 30 to 34 Years (165 | 11.9%) for men and 25 to 29 Years (200 | 14.6%) for women.
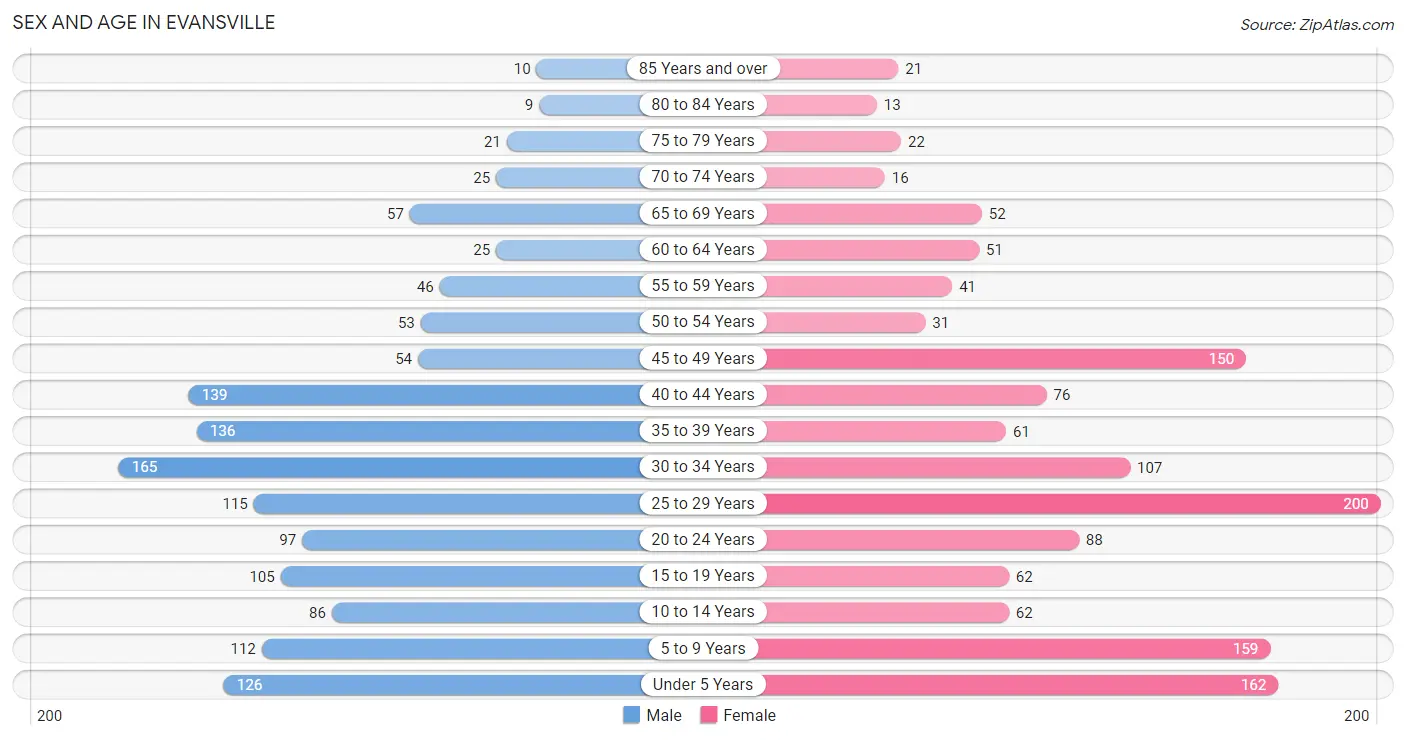
| Age Bracket | Male | Female |
| Under 5 Years | 126 (9.1%) | 162 (11.8%) |
| 5 to 9 Years | 112 (8.1%) | 159 (11.6%) |
| 10 to 14 Years | 86 (6.2%) | 62 (4.5%) |
| 15 to 19 Years | 105 (7.6%) | 62 (4.5%) |
| 20 to 24 Years | 97 (7.0%) | 88 (6.4%) |
| 25 to 29 Years | 115 (8.3%) | 200 (14.6%) |
| 30 to 34 Years | 165 (11.9%) | 107 (7.8%) |
| 35 to 39 Years | 136 (9.9%) | 61 (4.4%) |
| 40 to 44 Years | 139 (10.1%) | 76 (5.5%) |
| 45 to 49 Years | 54 (3.9%) | 150 (10.9%) |
| 50 to 54 Years | 53 (3.8%) | 31 (2.3%) |
| 55 to 59 Years | 46 (3.3%) | 41 (3.0%) |
| 60 to 64 Years | 25 (1.8%) | 51 (3.7%) |
| 65 to 69 Years | 57 (4.1%) | 52 (3.8%) |
| 70 to 74 Years | 25 (1.8%) | 16 (1.2%) |
| 75 to 79 Years | 21 (1.5%) | 22 (1.6%) |
| 80 to 84 Years | 9 (0.6%) | 13 (0.9%) |
| 85 Years and over | 10 (0.7%) | 21 (1.5%) |
| Total | 1,381 (100.0%) | 1,374 (100.0%) |
Families and Households in Evansville
Median Family Size in Evansville
The median family size in Evansville is 3.34 persons per family, with married-couple families (526 | 74.1%) accounting for the largest median family size of 3.44 persons per family. On the other hand, single male/father families (101 | 14.2%) represent the smallest median family size with 3.05 persons per family.
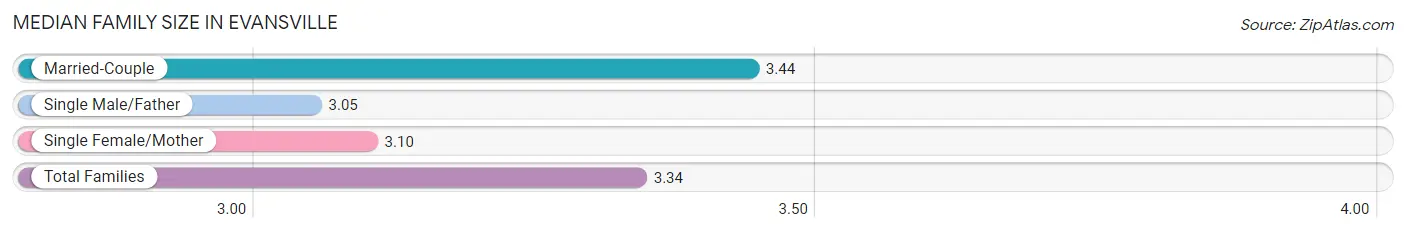
| Family Type | # Families | Family Size |
| Married-Couple | 526 (74.1%) | 3.44 |
| Single Male/Father | 101 (14.2%) | 3.05 |
| Single Female/Mother | 83 (11.7%) | 3.10 |
| Total Families | 710 (100.0%) | 3.34 |
Median Household Size in Evansville
The median household size in Evansville is 2.89 persons per household, with single male/father households (101 | 10.6%) accounting for the largest median household size of 3.74 persons per household. non-family households (242 | 25.4%) represent the smallest median household size with 1.21 persons per household.
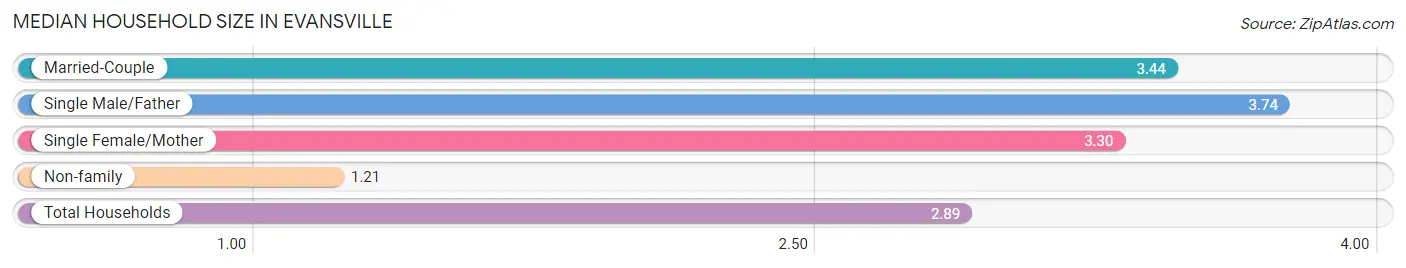
| Household Type | # Households | Household Size |
| Married-Couple | 526 (55.2%) | 3.44 |
| Single Male/Father | 101 (10.6%) | 3.74 |
| Single Female/Mother | 83 (8.7%) | 3.30 |
| Non-family | 242 (25.4%) | 1.21 |
| Total Households | 952 (100.0%) | 2.89 |
Household Size by Marriage Status in Evansville
Out of a total of 952 households in Evansville, 710 (74.6%) are family households, while 242 (25.4%) are nonfamily households. The most numerous type of family households are 2-person households, comprising 210, and the most common type of nonfamily households are 1-person households, comprising 192.
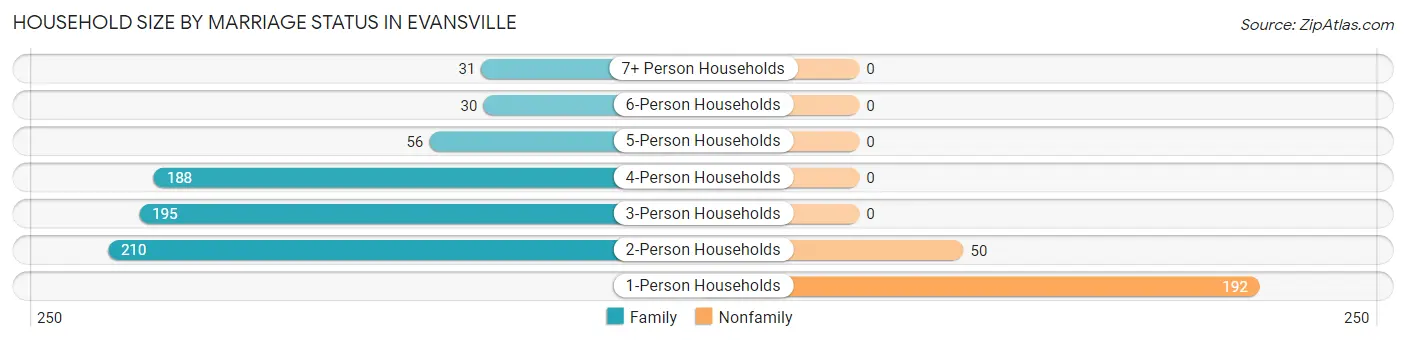
| Household Size | Family Households | Nonfamily Households |
| 1-Person Households | - | 192 (20.2%) |
| 2-Person Households | 210 (22.1%) | 50 (5.2%) |
| 3-Person Households | 195 (20.5%) | 0 (0.0%) |
| 4-Person Households | 188 (19.8%) | 0 (0.0%) |
| 5-Person Households | 56 (5.9%) | 0 (0.0%) |
| 6-Person Households | 30 (3.2%) | 0 (0.0%) |
| 7+ Person Households | 31 (3.3%) | 0 (0.0%) |
| Total | 710 (74.6%) | 242 (25.4%) |
Female Fertility in Evansville
Fertility by Age in Evansville
Average fertility rate in Evansville is 71.0 births per 1,000 women. Women in the age bracket of 35 to 50 years have the highest fertility rate with 96.0 births per 1,000 women. Women in the age bracket of 35 to 50 years acount for 52.8% of all women with births.
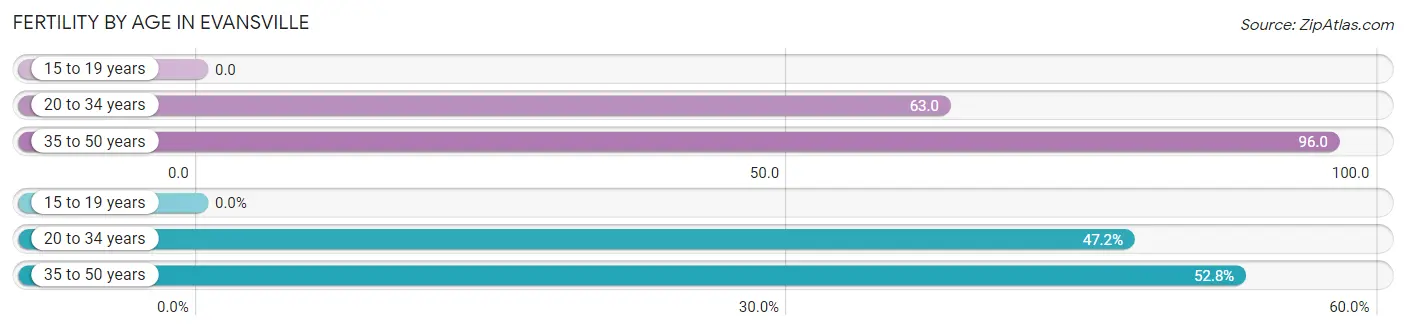
| Age Bracket | Women with Births | Births / 1,000 Women |
| 15 to 19 years | 0 (0.0%) | 0.0 |
| 20 to 34 years | 25 (47.2%) | 63.0 |
| 35 to 50 years | 28 (52.8%) | 96.0 |
| Total | 53 (100.0%) | 71.0 |
Fertility by Age by Marriage Status in Evansville
56.6% of women with births (53) in Evansville are married. The highest percentage of unmarried women with births falls into 35 to 50 years age bracket with 82.1% of them unmarried at the time of birth, while the lowest percentage of unmarried women with births belong to 20 to 34 years age bracket with 0.0% of them unmarried.
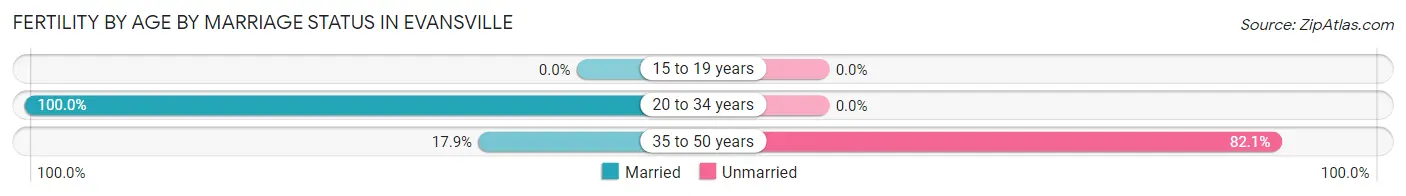
| Age Bracket | Married | Unmarried |
| 15 to 19 years | 0 (0.0%) | 0 (0.0%) |
| 20 to 34 years | 25 (100.0%) | 0 (0.0%) |
| 35 to 50 years | 5 (17.9%) | 23 (82.1%) |
| Total | 30 (56.6%) | 23 (43.4%) |
Fertility by Education in Evansville
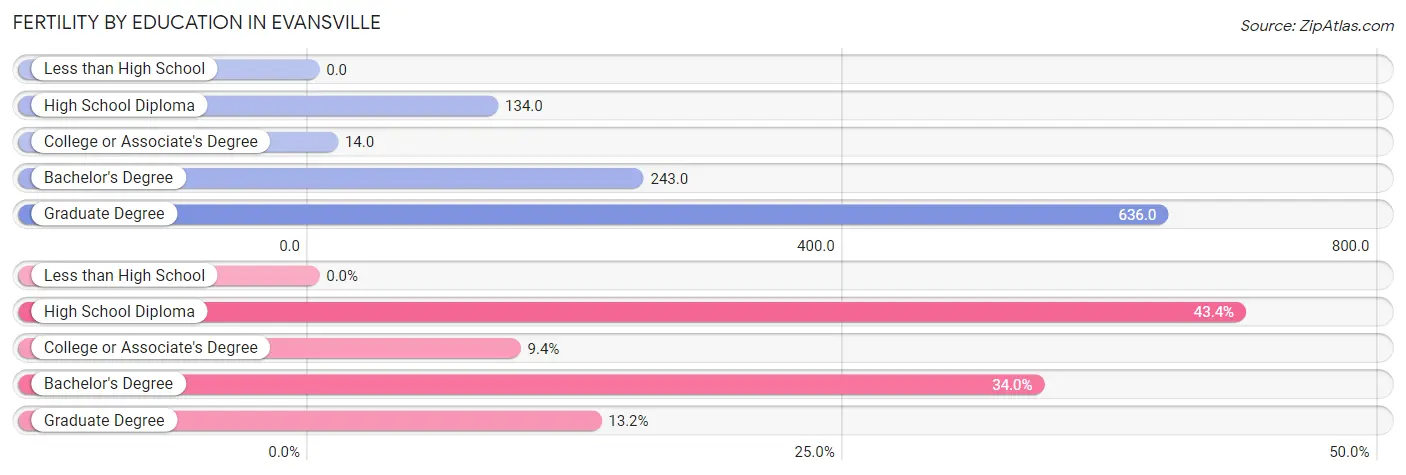
| Educational Attainment | Women with Births | Births / 1,000 Women |
| Less than High School | 0 (0.0%) | 0.0 |
| High School Diploma | 23 (43.4%) | 134.0 |
| College or Associate's Degree | 5 (9.4%) | 14.0 |
| Bachelor's Degree | 18 (34.0%) | 243.0 |
| Graduate Degree | 7 (13.2%) | 636.0 |
| Total | 53 (100.0%) | 71.0 |
Fertility by Education by Marriage Status in Evansville
43.4% of women with births in Evansville are unmarried. Women with the educational attainment of college or associate's degree are most likely to be married with 100.0% of them married at childbirth, while women with the educational attainment of high school diploma are least likely to be married with 100.0% of them unmarried at childbirth.
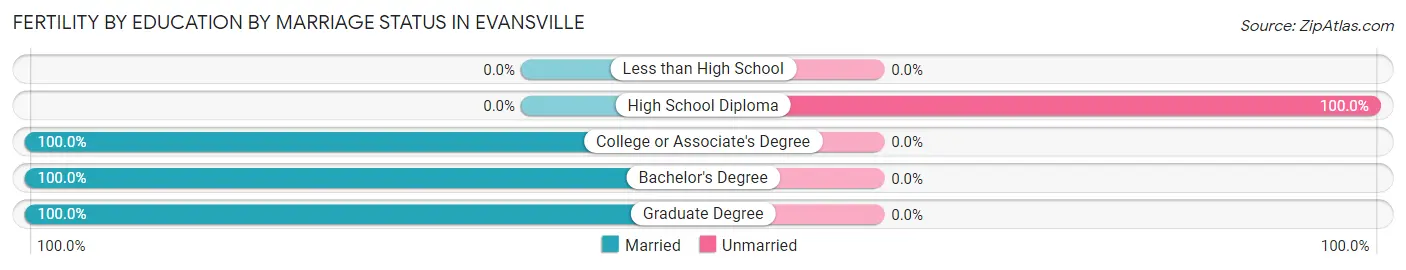
| Educational Attainment | Married | Unmarried |
| Less than High School | 0 (0.0%) | 0 (0.0%) |
| High School Diploma | 0 (0.0%) | 23 (100.0%) |
| College or Associate's Degree | 5 (100.0%) | 0 (0.0%) |
| Bachelor's Degree | 18 (100.0%) | 0 (0.0%) |
| Graduate Degree | 7 (100.0%) | 0 (0.0%) |
| Total | 30 (56.6%) | 23 (43.4%) |
Employment Characteristics in Evansville
Employment by Class of Employer in Evansville
Among the 1,386 employed individuals in Evansville, private company employees (1,045 | 75.4%), local government employees (123 | 8.9%), and not-for-profit organizations (95 | 6.9%) make up the most common classes of employment.
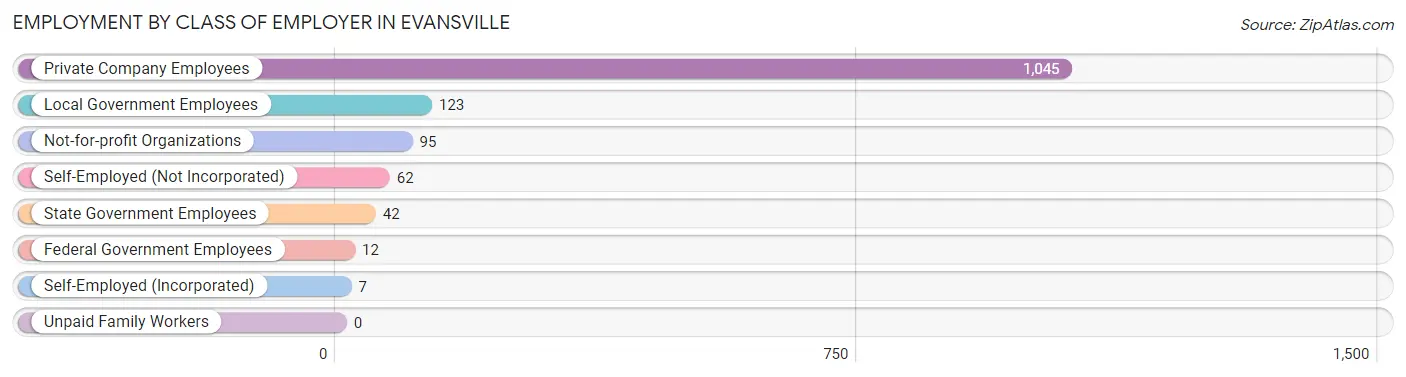
| Employer Class | # Employees | % Employees |
| Private Company Employees | 1,045 | 75.4% |
| Self-Employed (Incorporated) | 7 | 0.5% |
| Self-Employed (Not Incorporated) | 62 | 4.5% |
| Not-for-profit Organizations | 95 | 6.9% |
| Local Government Employees | 123 | 8.9% |
| State Government Employees | 42 | 3.0% |
| Federal Government Employees | 12 | 0.9% |
| Unpaid Family Workers | 0 | 0.0% |
| Total | 1,386 | 100.0% |
Employment Status by Age in Evansville
According to the labor force statistics for Evansville, out of the total population over 16 years of age (2,013), 72.9% or 1,467 individuals are in the labor force, with 5.4% or 79 of them unemployed. The age group with the highest labor force participation rate is 20 to 24 years, with 100.0% or 185 individuals in the labor force. Within the labor force, the 65 to 74 years age range has the highest percentage of unemployed individuals, with 24.0% or 6 of them being unemployed.
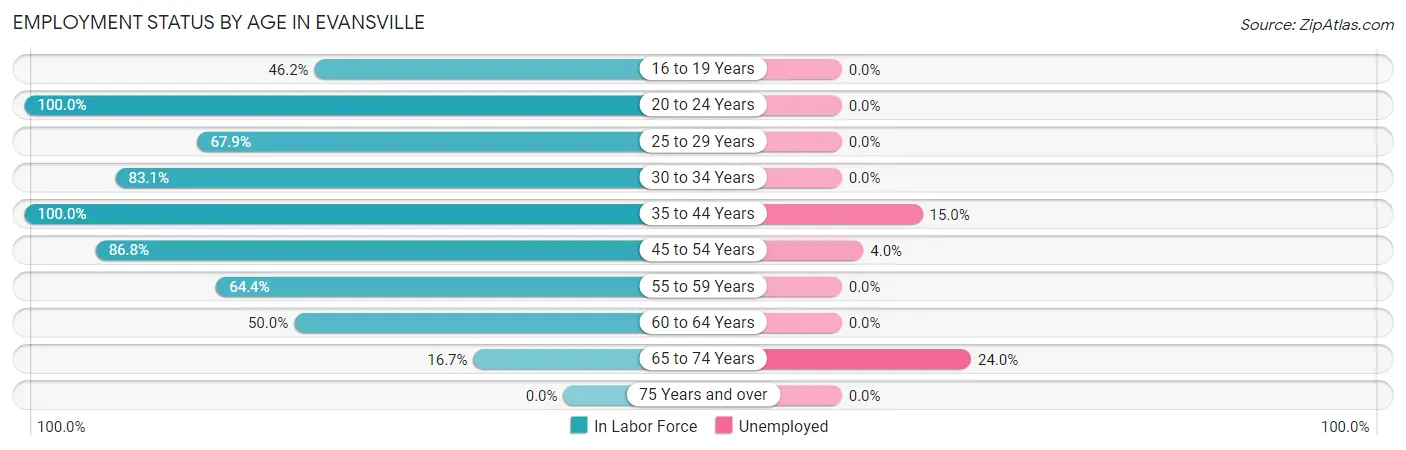
| Age Bracket | In Labor Force | Unemployed |
| 16 to 19 Years | 61 (46.2%) | 0 (0.0%) |
| 20 to 24 Years | 185 (100.0%) | 0 (0.0%) |
| 25 to 29 Years | 214 (67.9%) | 0 (0.0%) |
| 30 to 34 Years | 226 (83.1%) | 0 (0.0%) |
| 35 to 44 Years | 412 (100.0%) | 62 (15.0%) |
| 45 to 54 Years | 250 (86.8%) | 10 (4.0%) |
| 55 to 59 Years | 56 (64.4%) | 0 (0.0%) |
| 60 to 64 Years | 38 (50.0%) | 0 (0.0%) |
| 65 to 74 Years | 25 (16.7%) | 6 (24.0%) |
| 75 Years and over | 0 (0.0%) | 0 (0.0%) |
| Total | 1,467 (72.9%) | 79 (5.4%) |
Employment Status by Educational Attainment in Evansville
According to labor force statistics for Evansville, 82.5% of individuals (1,196) out of the total population between 25 and 64 years of age (1,450) are in the labor force, with 6.1% or 73 of them being unemployed. The group with the highest labor force participation rate are those with the educational attainment of high school diploma, with 94.0% or 406 individuals in the labor force. Within the labor force, individuals with less than high school education have the highest percentage of unemployment, with 43.7% or 62 of them being unemployed.
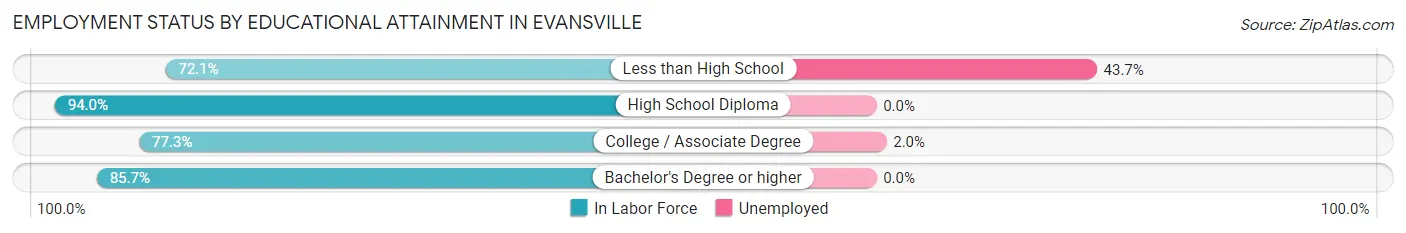
| Educational Attainment | In Labor Force | Unemployed |
| Less than High School | 142 (72.1%) | 86 (43.7%) |
| High School Diploma | 406 (94.0%) | 0 (0.0%) |
| College / Associate Degree | 510 (77.3%) | 13 (2.0%) |
| Bachelor's Degree or higher | 138 (85.7%) | 0 (0.0%) |
| Total | 1,196 (82.5%) | 88 (6.1%) |
Employment Occupations by Sex in Evansville
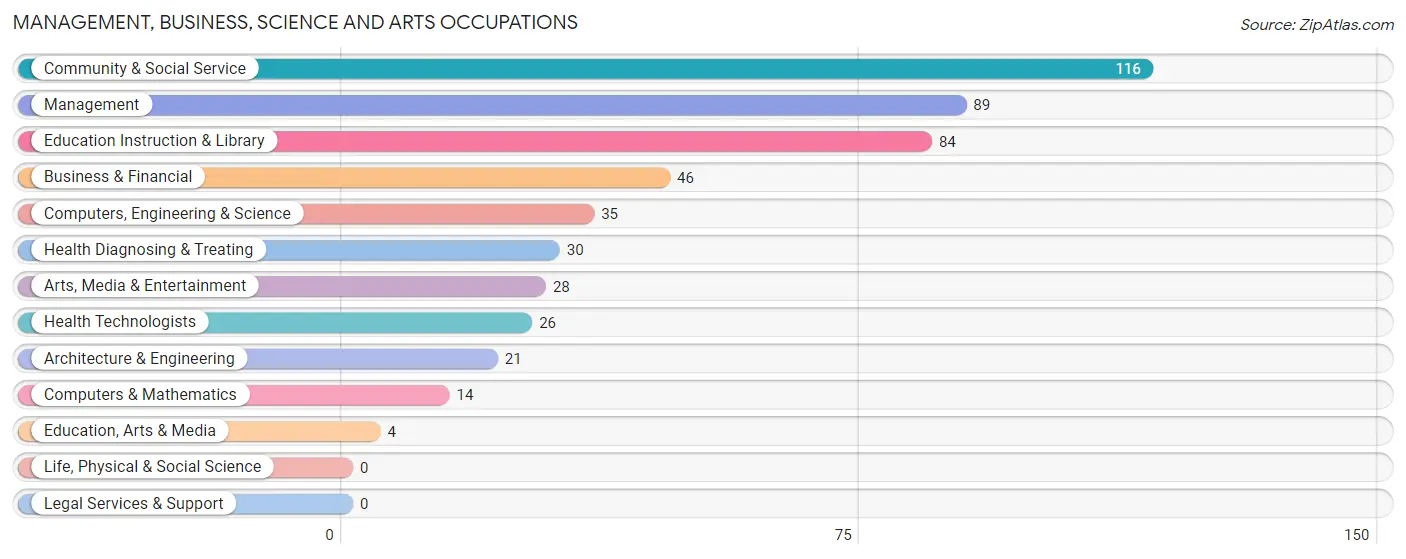
Management, Business, Science and Arts Occupations
The most common Management, Business, Science and Arts occupations in Evansville are Community & Social Service (116 | 8.4%), Management (89 | 6.5%), Education Instruction & Library (84 | 6.1%), Business & Financial (46 | 3.3%), and Computers, Engineering & Science (35 | 2.5%).
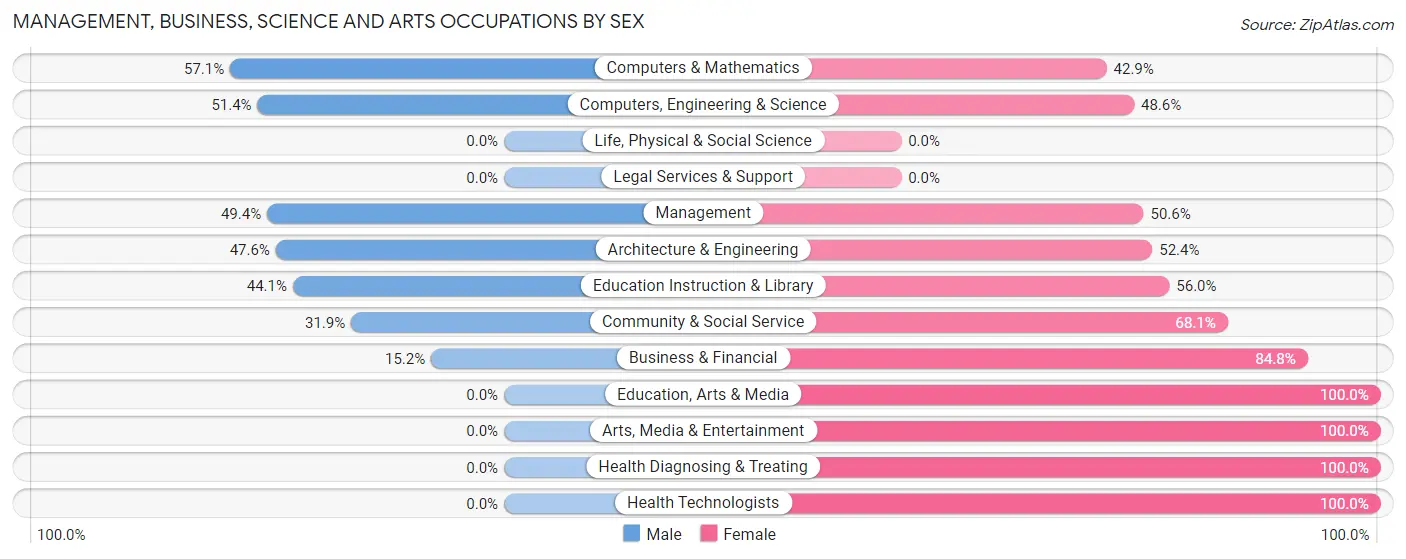
Management, Business, Science and Arts Occupations by Sex
Within the Management, Business, Science and Arts occupations in Evansville, the most male-oriented occupations are Computers & Mathematics (57.1%), Computers, Engineering & Science (51.4%), and Management (49.4%), while the most female-oriented occupations are Education, Arts & Media (100.0%), Arts, Media & Entertainment (100.0%), and Health Diagnosing & Treating (100.0%).
| Occupation | Male | Female |
| Management | 44 (49.4%) | 45 (50.6%) |
| Business & Financial | 7 (15.2%) | 39 (84.8%) |
| Computers, Engineering & Science | 18 (51.4%) | 17 (48.6%) |
| Computers & Mathematics | 8 (57.1%) | 6 (42.9%) |
| Architecture & Engineering | 10 (47.6%) | 11 (52.4%) |
| Life, Physical & Social Science | 0 (0.0%) | 0 (0.0%) |
| Community & Social Service | 37 (31.9%) | 79 (68.1%) |
| Education, Arts & Media | 0 (0.0%) | 4 (100.0%) |
| Legal Services & Support | 0 (0.0%) | 0 (0.0%) |
| Education Instruction & Library | 37 (44.1%) | 47 (55.9%) |
| Arts, Media & Entertainment | 0 (0.0%) | 28 (100.0%) |
| Health Diagnosing & Treating | 0 (0.0%) | 30 (100.0%) |
| Health Technologists | 0 (0.0%) | 26 (100.0%) |
| Total (Category) | 106 (33.5%) | 210 (66.5%) |
| Total (Overall) | 769 (55.8%) | 608 (44.2%) |
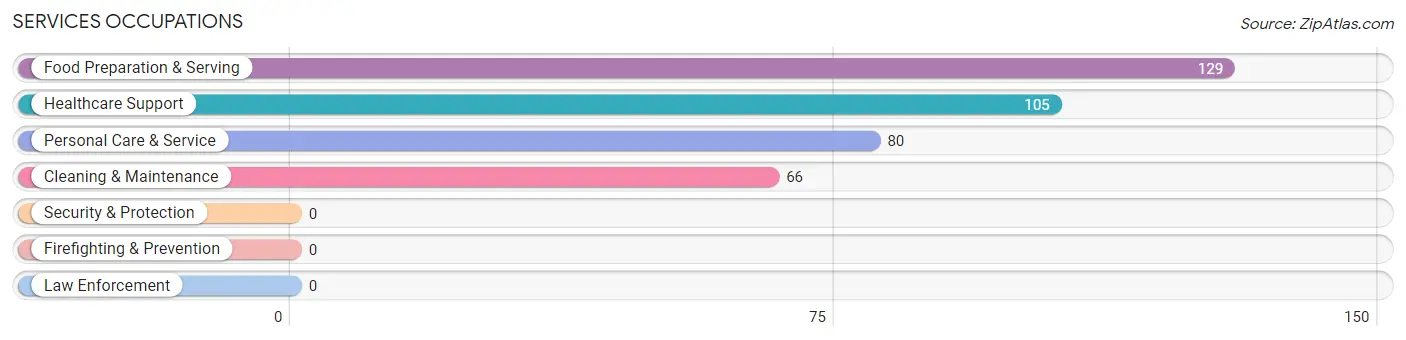
Services Occupations
The most common Services occupations in Evansville are Food Preparation & Serving (129 | 9.4%), Healthcare Support (105 | 7.6%), Personal Care & Service (80 | 5.8%), and Cleaning & Maintenance (66 | 4.8%).
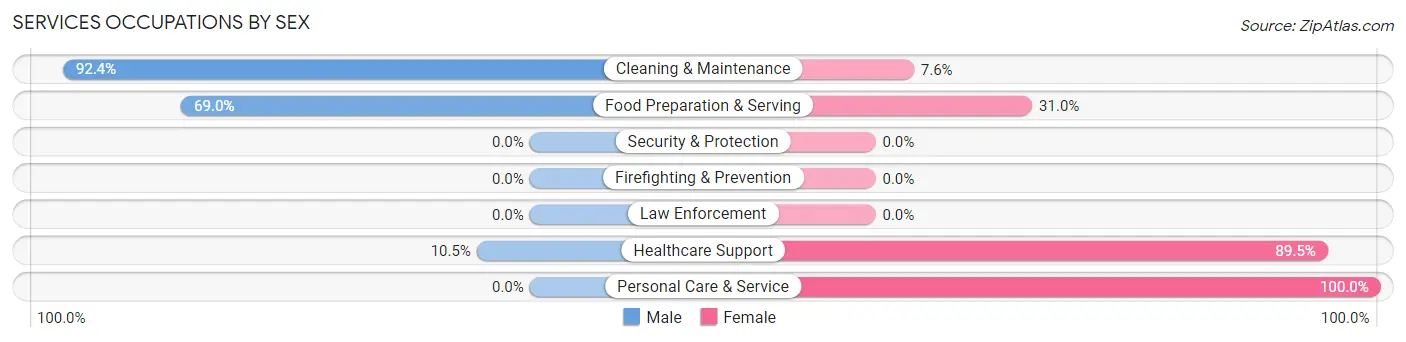
Services Occupations by Sex
Within the Services occupations in Evansville, the most male-oriented occupations are Cleaning & Maintenance (92.4%), Food Preparation & Serving (69.0%), and Healthcare Support (10.5%), while the most female-oriented occupations are Personal Care & Service (100.0%), Healthcare Support (89.5%), and Food Preparation & Serving (31.0%).
| Occupation | Male | Female |
| Healthcare Support | 11 (10.5%) | 94 (89.5%) |
| Security & Protection | 0 (0.0%) | 0 (0.0%) |
| Firefighting & Prevention | 0 (0.0%) | 0 (0.0%) |
| Law Enforcement | 0 (0.0%) | 0 (0.0%) |
| Food Preparation & Serving | 89 (69.0%) | 40 (31.0%) |
| Cleaning & Maintenance | 61 (92.4%) | 5 (7.6%) |
| Personal Care & Service | 0 (0.0%) | 80 (100.0%) |
| Total (Category) | 161 (42.4%) | 219 (57.6%) |
| Total (Overall) | 769 (55.8%) | 608 (44.2%) |
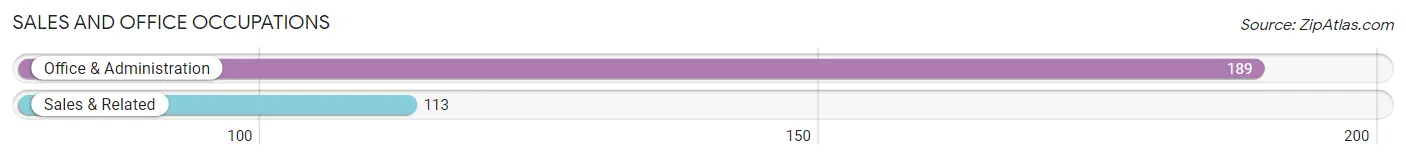
Sales and Office Occupations
The most common Sales and Office occupations in Evansville are Office & Administration (189 | 13.7%), and Sales & Related (113 | 8.2%).
Sales and Office Occupations by Sex
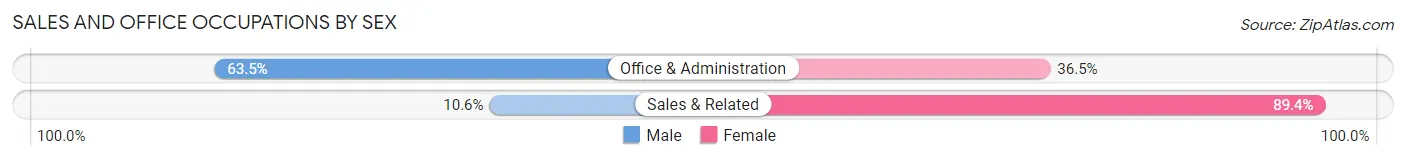
| Occupation | Male | Female |
| Sales & Related | 12 (10.6%) | 101 (89.4%) |
| Office & Administration | 120 (63.5%) | 69 (36.5%) |
| Total (Category) | 132 (43.7%) | 170 (56.3%) |
| Total (Overall) | 769 (55.8%) | 608 (44.2%) |
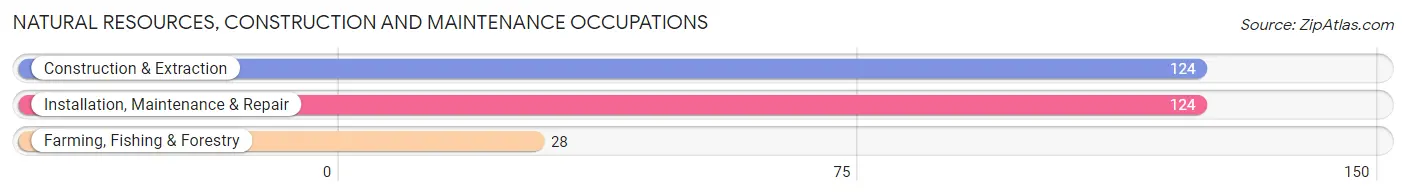
Natural Resources, Construction and Maintenance Occupations
The most common Natural Resources, Construction and Maintenance occupations in Evansville are Construction & Extraction (124 | 9.0%), Installation, Maintenance & Repair (124 | 9.0%), and Farming, Fishing & Forestry (28 | 2.0%).
Natural Resources, Construction and Maintenance Occupations by Sex
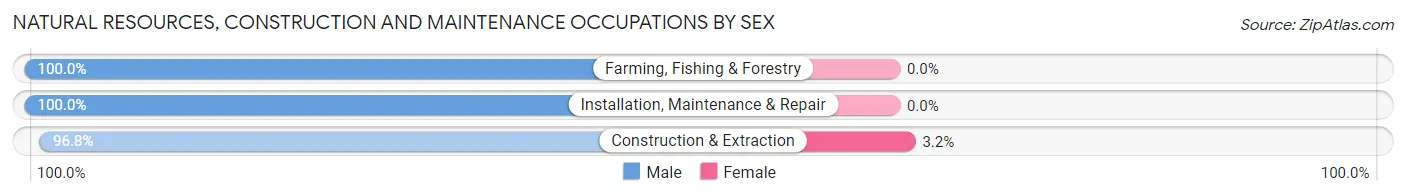
| Occupation | Male | Female |
| Farming, Fishing & Forestry | 28 (100.0%) | 0 (0.0%) |
| Construction & Extraction | 120 (96.8%) | 4 (3.2%) |
| Installation, Maintenance & Repair | 124 (100.0%) | 0 (0.0%) |
| Total (Category) | 272 (98.6%) | 4 (1.5%) |
| Total (Overall) | 769 (55.8%) | 608 (44.2%) |
Production, Transportation and Moving Occupations
The most common Production, Transportation and Moving occupations in Evansville are Transportation (50 | 3.6%), Production (48 | 3.5%), and Material Moving (5 | 0.4%).
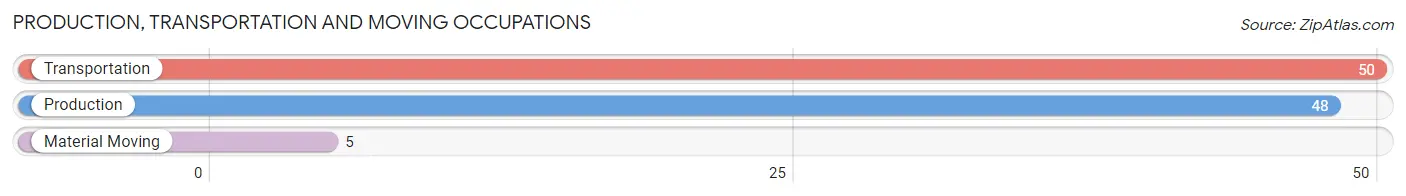
Production, Transportation and Moving Occupations by Sex
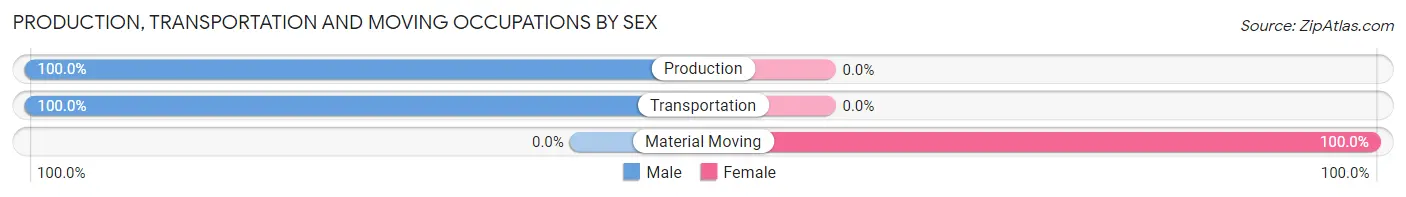
| Occupation | Male | Female |
| Production | 48 (100.0%) | 0 (0.0%) |
| Transportation | 50 (100.0%) | 0 (0.0%) |
| Material Moving | 0 (0.0%) | 5 (100.0%) |
| Total (Category) | 98 (95.2%) | 5 (4.9%) |
| Total (Overall) | 769 (55.8%) | 608 (44.2%) |
Employment Industries by Sex in Evansville
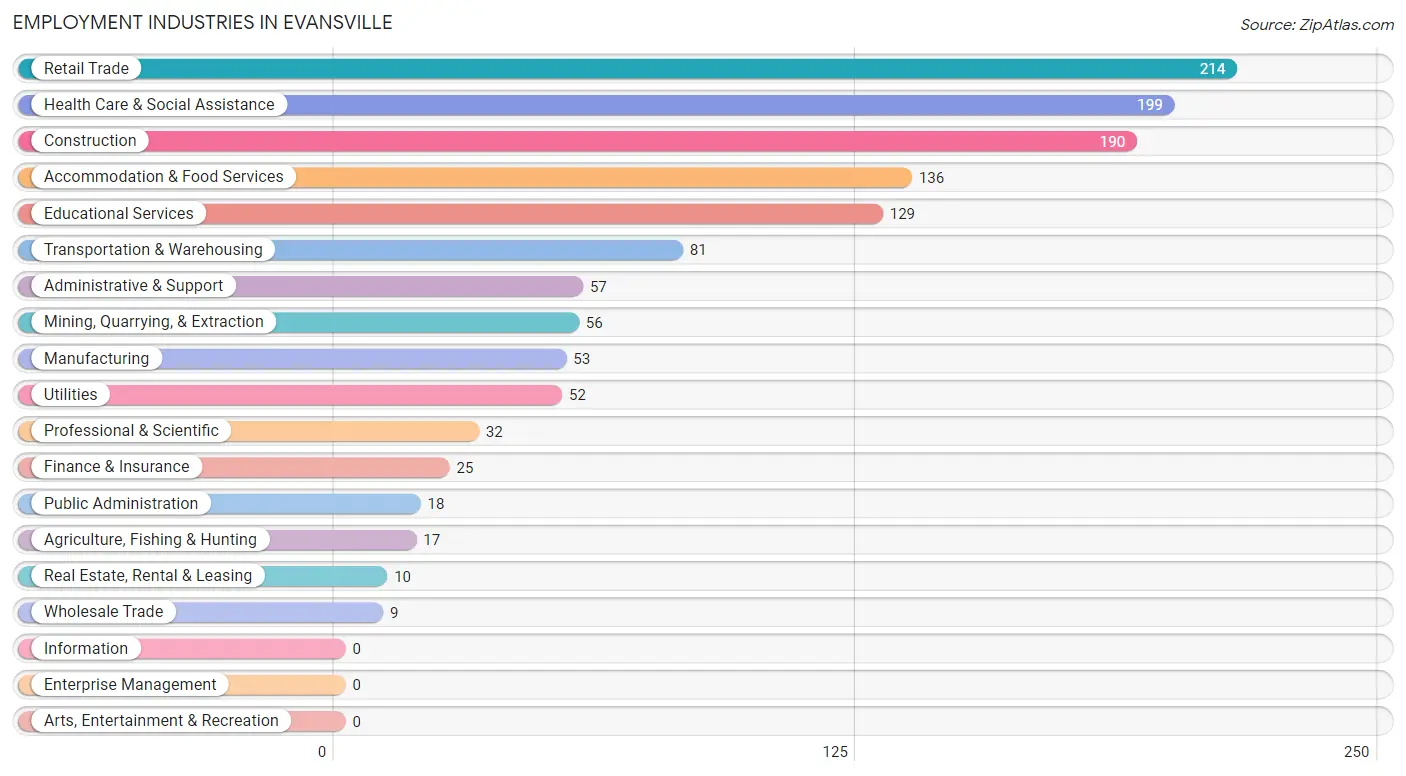
Employment Industries in Evansville
The major employment industries in Evansville include Retail Trade (214 | 15.5%), Health Care & Social Assistance (199 | 14.4%), Construction (190 | 13.8%), Accommodation & Food Services (136 | 9.9%), and Educational Services (129 | 9.4%).
Employment Industries by Sex in Evansville
The Evansville industries that see more men than women are Agriculture, Fishing & Hunting (100.0%), Manufacturing (100.0%), and Real Estate, Rental & Leasing (100.0%), whereas the industries that tend to have a higher number of women are Public Administration (100.0%), Health Care & Social Assistance (92.5%), and Professional & Scientific (84.4%).
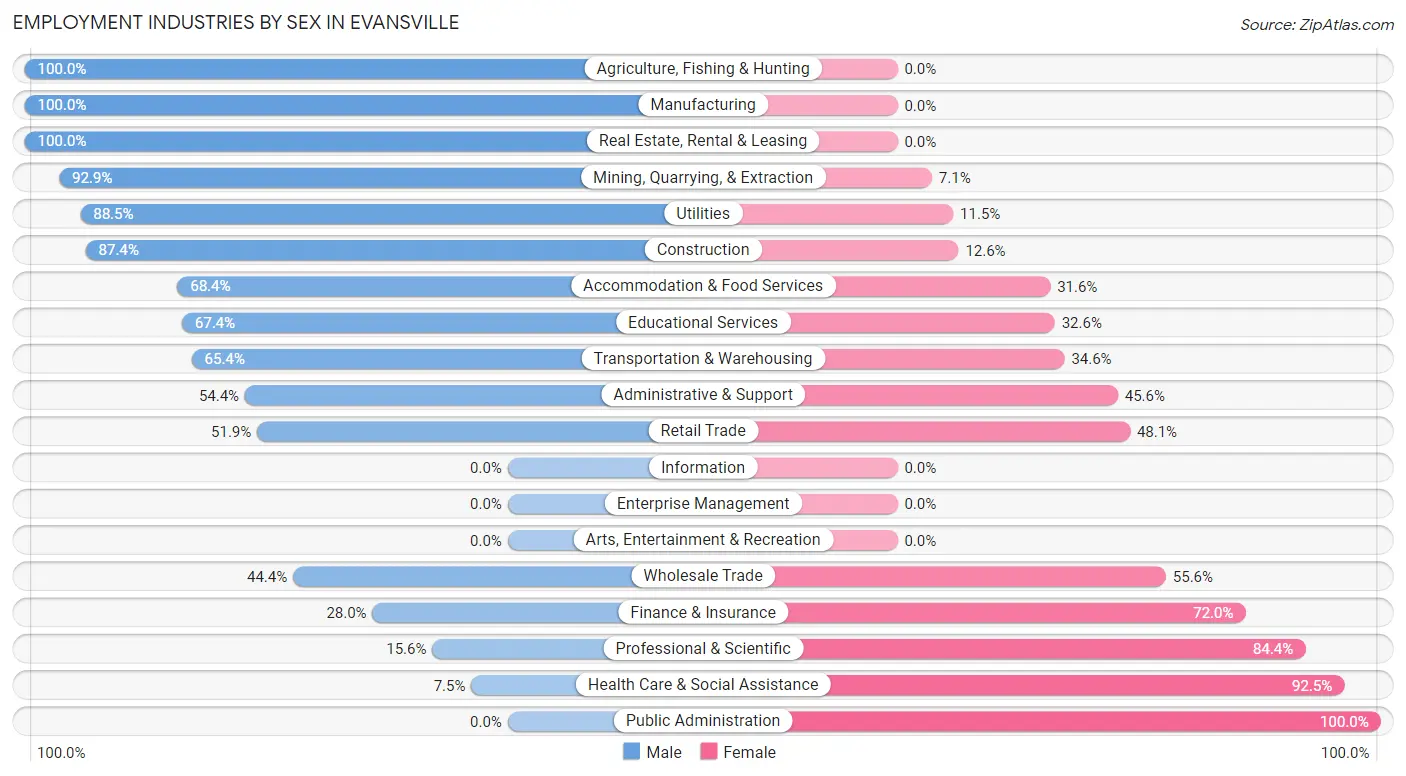
| Industry | Male | Female |
| Agriculture, Fishing & Hunting | 17 (100.0%) | 0 (0.0%) |
| Mining, Quarrying, & Extraction | 52 (92.9%) | 4 (7.1%) |
| Construction | 166 (87.4%) | 24 (12.6%) |
| Manufacturing | 53 (100.0%) | 0 (0.0%) |
| Wholesale Trade | 4 (44.4%) | 5 (55.6%) |
| Retail Trade | 111 (51.9%) | 103 (48.1%) |
| Transportation & Warehousing | 53 (65.4%) | 28 (34.6%) |
| Utilities | 46 (88.5%) | 6 (11.5%) |
| Information | 0 (0.0%) | 0 (0.0%) |
| Finance & Insurance | 7 (28.0%) | 18 (72.0%) |
| Real Estate, Rental & Leasing | 10 (100.0%) | 0 (0.0%) |
| Professional & Scientific | 5 (15.6%) | 27 (84.4%) |
| Enterprise Management | 0 (0.0%) | 0 (0.0%) |
| Administrative & Support | 31 (54.4%) | 26 (45.6%) |
| Educational Services | 87 (67.4%) | 42 (32.6%) |
| Health Care & Social Assistance | 15 (7.5%) | 184 (92.5%) |
| Arts, Entertainment & Recreation | 0 (0.0%) | 0 (0.0%) |
| Accommodation & Food Services | 93 (68.4%) | 43 (31.6%) |
| Public Administration | 0 (0.0%) | 18 (100.0%) |
| Total | 769 (55.8%) | 608 (44.2%) |
Education in Evansville
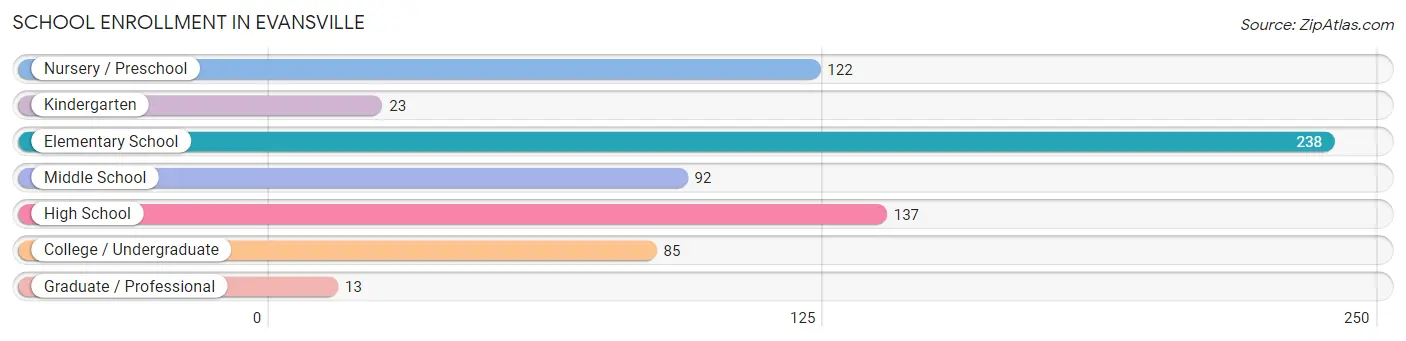
School Enrollment in Evansville
The most common levels of schooling among the 710 students in Evansville are elementary school (238 | 33.5%), high school (137 | 19.3%), and nursery / preschool (122 | 17.2%).
| School Level | # Students | % Students |
| Nursery / Preschool | 122 | 17.2% |
| Kindergarten | 23 | 3.2% |
| Elementary School | 238 | 33.5% |
| Middle School | 92 | 13.0% |
| High School | 137 | 19.3% |
| College / Undergraduate | 85 | 12.0% |
| Graduate / Professional | 13 | 1.8% |
| Total | 710 | 100.0% |
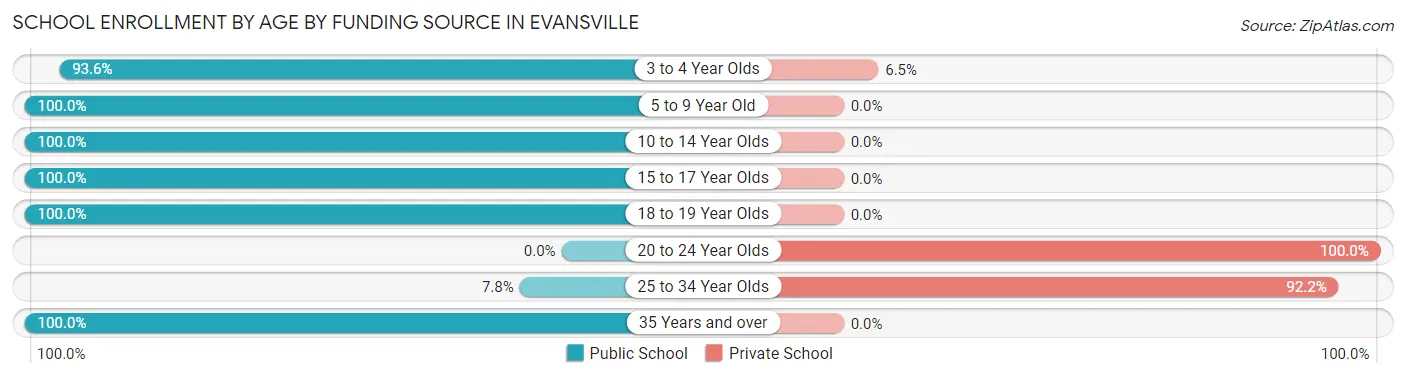
School Enrollment by Age by Funding Source in Evansville
Out of a total of 710 students who are enrolled in schools in Evansville, 84 (11.8%) attend a private institution, while the remaining 626 (88.2%) are enrolled in public schools. The age group of 20 to 24 year olds has the highest likelihood of being enrolled in private schools, with 21 (100.0% in the age bracket) enrolled. Conversely, the age group of 5 to 9 year old has the lowest likelihood of being enrolled in a private school, with 271 (100.0% in the age bracket) attending a public institution.
| Age Bracket | Public School | Private School |
| 3 to 4 Year Olds | 58 (93.5%) | 4 (6.5%) |
| 5 to 9 Year Old | 271 (100.0%) | 0 (0.0%) |
| 10 to 14 Year Olds | 148 (100.0%) | 0 (0.0%) |
| 15 to 17 Year Olds | 97 (100.0%) | 0 (0.0%) |
| 18 to 19 Year Olds | 34 (100.0%) | 0 (0.0%) |
| 20 to 24 Year Olds | 0 (0.0%) | 21 (100.0%) |
| 25 to 34 Year Olds | 5 (7.8%) | 59 (92.2%) |
| 35 Years and over | 13 (100.0%) | 0 (0.0%) |
| Total | 626 (88.2%) | 84 (11.8%) |
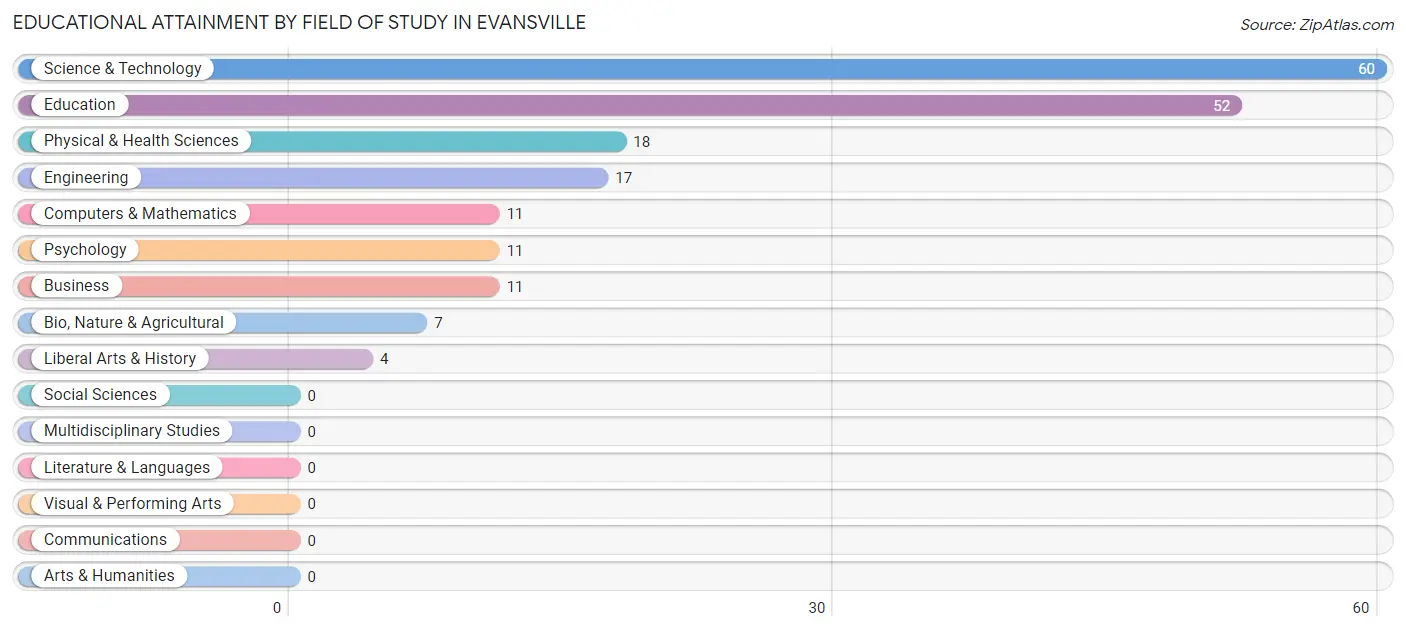
Educational Attainment by Field of Study in Evansville
Science & technology (60 | 31.4%), education (52 | 27.2%), physical & health sciences (18 | 9.4%), engineering (17 | 8.9%), and computers & mathematics (11 | 5.8%) are the most common fields of study among 191 individuals in Evansville who have obtained a bachelor's degree or higher.
| Field of Study | # Graduates | % Graduates |
| Computers & Mathematics | 11 | 5.8% |
| Bio, Nature & Agricultural | 7 | 3.7% |
| Physical & Health Sciences | 18 | 9.4% |
| Psychology | 11 | 5.8% |
| Social Sciences | 0 | 0.0% |
| Engineering | 17 | 8.9% |
| Multidisciplinary Studies | 0 | 0.0% |
| Science & Technology | 60 | 31.4% |
| Business | 11 | 5.8% |
| Education | 52 | 27.2% |
| Literature & Languages | 0 | 0.0% |
| Liberal Arts & History | 4 | 2.1% |
| Visual & Performing Arts | 0 | 0.0% |
| Communications | 0 | 0.0% |
| Arts & Humanities | 0 | 0.0% |
| Total | 191 | 100.0% |
Transportation & Commute in Evansville
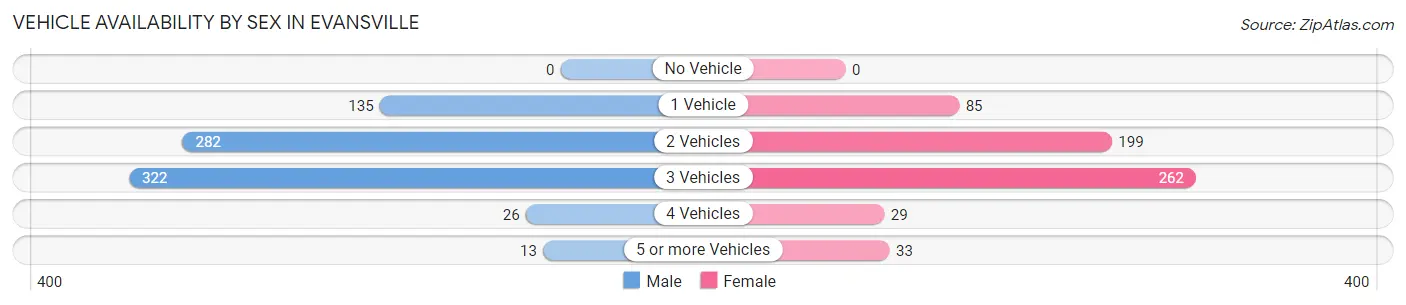
Vehicle Availability by Sex in Evansville
The most prevalent vehicle ownership categories in Evansville are males with 3 vehicles (322, accounting for 41.4%) and females with 3 vehicles (262, making up 53.0%).
| Vehicles Available | Male | Female |
| No Vehicle | 0 (0.0%) | 0 (0.0%) |
| 1 Vehicle | 135 (17.3%) | 85 (14.0%) |
| 2 Vehicles | 282 (36.2%) | 199 (32.7%) |
| 3 Vehicles | 322 (41.4%) | 262 (43.1%) |
| 4 Vehicles | 26 (3.3%) | 29 (4.8%) |
| 5 or more Vehicles | 13 (1.7%) | 33 (5.4%) |
| Total | 778 (100.0%) | 608 (100.0%) |
Commute Time in Evansville
The most frequently occuring commute durations in Evansville are 5 to 9 minutes (416 commuters, 31.3%), 15 to 19 minutes (334 commuters, 25.2%), and 10 to 14 minutes (312 commuters, 23.5%).
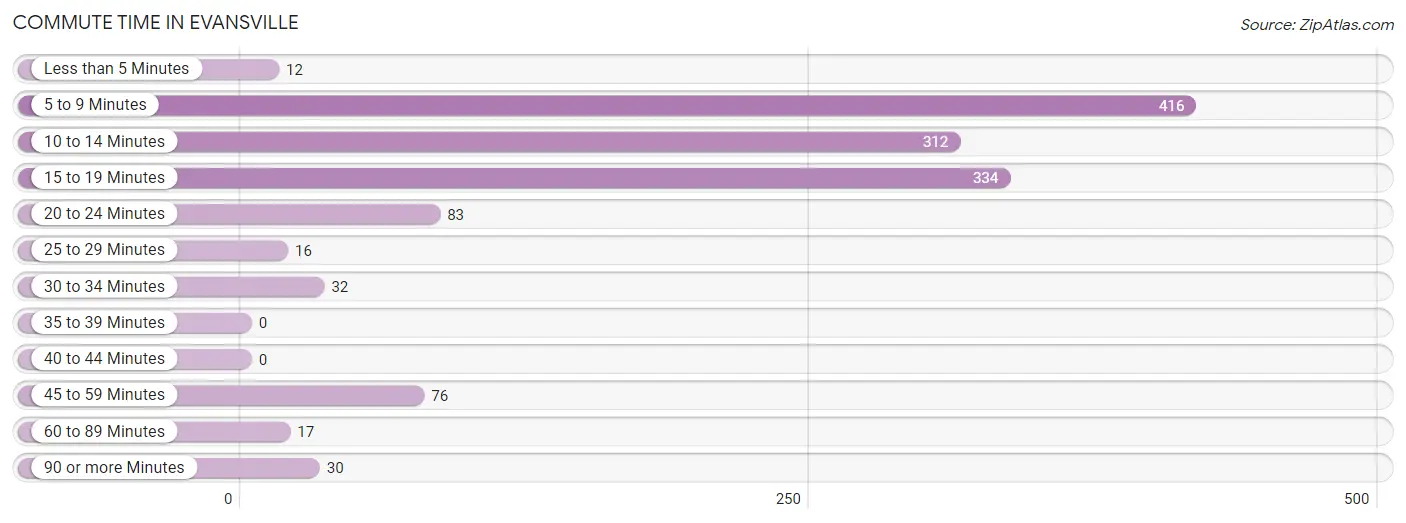
| Commute Time | # Commuters | % Commuters |
| Less than 5 Minutes | 12 | 0.9% |
| 5 to 9 Minutes | 416 | 31.3% |
| 10 to 14 Minutes | 312 | 23.5% |
| 15 to 19 Minutes | 334 | 25.2% |
| 20 to 24 Minutes | 83 | 6.2% |
| 25 to 29 Minutes | 16 | 1.2% |
| 30 to 34 Minutes | 32 | 2.4% |
| 35 to 39 Minutes | 0 | 0.0% |
| 40 to 44 Minutes | 0 | 0.0% |
| 45 to 59 Minutes | 76 | 5.7% |
| 60 to 89 Minutes | 17 | 1.3% |
| 90 or more Minutes | 30 | 2.3% |
Commute Time by Sex in Evansville
The most common commute times in Evansville are 5 to 9 minutes (269 commuters, 35.9%) for males and 10 to 14 minutes (196 commuters, 33.9%) for females.
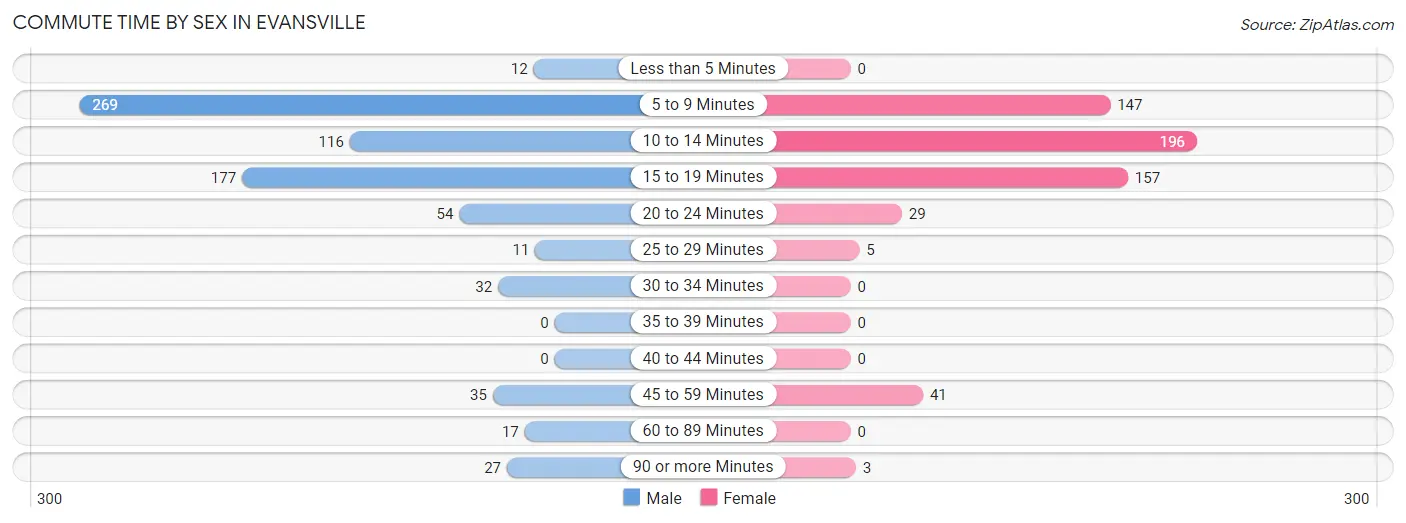
| Commute Time | Male | Female |
| Less than 5 Minutes | 12 (1.6%) | 0 (0.0%) |
| 5 to 9 Minutes | 269 (35.9%) | 147 (25.4%) |
| 10 to 14 Minutes | 116 (15.5%) | 196 (33.9%) |
| 15 to 19 Minutes | 177 (23.6%) | 157 (27.2%) |
| 20 to 24 Minutes | 54 (7.2%) | 29 (5.0%) |
| 25 to 29 Minutes | 11 (1.5%) | 5 (0.9%) |
| 30 to 34 Minutes | 32 (4.3%) | 0 (0.0%) |
| 35 to 39 Minutes | 0 (0.0%) | 0 (0.0%) |
| 40 to 44 Minutes | 0 (0.0%) | 0 (0.0%) |
| 45 to 59 Minutes | 35 (4.7%) | 41 (7.1%) |
| 60 to 89 Minutes | 17 (2.3%) | 0 (0.0%) |
| 90 or more Minutes | 27 (3.6%) | 3 (0.5%) |
Time of Departure to Work by Sex in Evansville
The most frequent times of departure to work in Evansville are 5:30 AM to 5:59 AM (193, 25.7%) for males and 12:00 PM to 3:59 PM (115, 19.9%) for females.
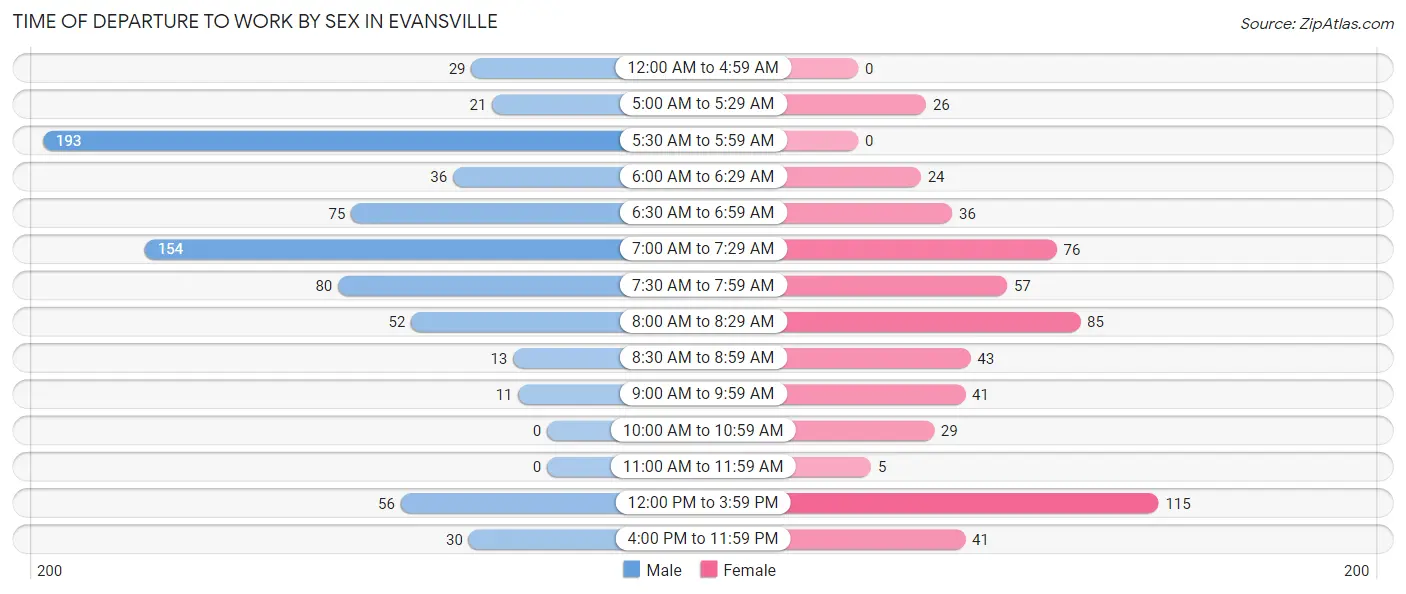
| Time of Departure | Male | Female |
| 12:00 AM to 4:59 AM | 29 (3.9%) | 0 (0.0%) |
| 5:00 AM to 5:29 AM | 21 (2.8%) | 26 (4.5%) |
| 5:30 AM to 5:59 AM | 193 (25.7%) | 0 (0.0%) |
| 6:00 AM to 6:29 AM | 36 (4.8%) | 24 (4.2%) |
| 6:30 AM to 6:59 AM | 75 (10.0%) | 36 (6.2%) |
| 7:00 AM to 7:29 AM | 154 (20.5%) | 76 (13.2%) |
| 7:30 AM to 7:59 AM | 80 (10.7%) | 57 (9.9%) |
| 8:00 AM to 8:29 AM | 52 (6.9%) | 85 (14.7%) |
| 8:30 AM to 8:59 AM | 13 (1.7%) | 43 (7.4%) |
| 9:00 AM to 9:59 AM | 11 (1.5%) | 41 (7.1%) |
| 10:00 AM to 10:59 AM | 0 (0.0%) | 29 (5.0%) |
| 11:00 AM to 11:59 AM | 0 (0.0%) | 5 (0.9%) |
| 12:00 PM to 3:59 PM | 56 (7.5%) | 115 (19.9%) |
| 4:00 PM to 11:59 PM | 30 (4.0%) | 41 (7.1%) |
| Total | 750 (100.0%) | 578 (100.0%) |
Housing Occupancy in Evansville
Occupancy by Ownership in Evansville
Of the total 952 dwellings in Evansville, owner-occupied units account for 623 (65.4%), while renter-occupied units make up 329 (34.6%).
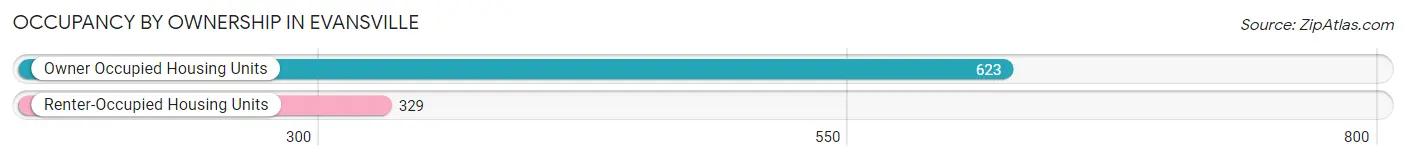
| Occupancy | # Housing Units | % Housing Units |
| Owner Occupied Housing Units | 623 | 65.4% |
| Renter-Occupied Housing Units | 329 | 34.6% |
| Total Occupied Housing Units | 952 | 100.0% |
Occupancy by Household Size in Evansville
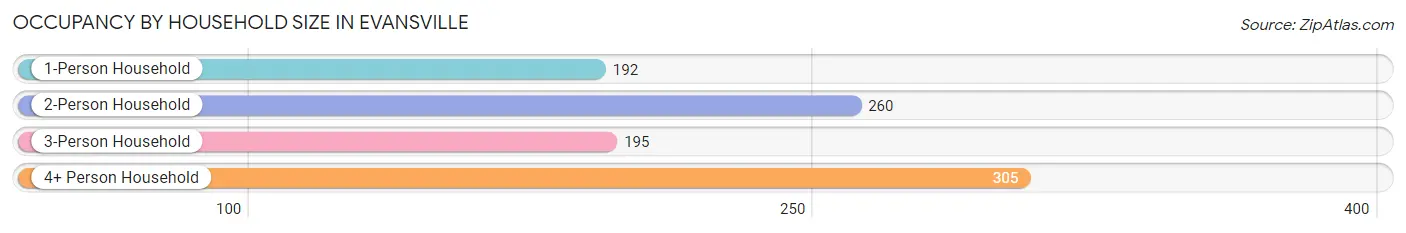
| Household Size | # Housing Units | % Housing Units |
| 1-Person Household | 192 | 20.2% |
| 2-Person Household | 260 | 27.3% |
| 3-Person Household | 195 | 20.5% |
| 4+ Person Household | 305 | 32.0% |
| Total Housing Units | 952 | 100.0% |
Occupancy by Ownership by Household Size in Evansville
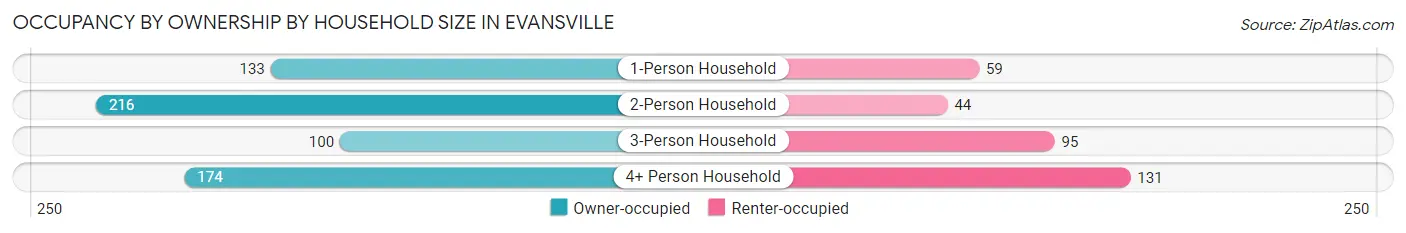
| Household Size | Owner-occupied | Renter-occupied |
| 1-Person Household | 133 (69.3%) | 59 (30.7%) |
| 2-Person Household | 216 (83.1%) | 44 (16.9%) |
| 3-Person Household | 100 (51.3%) | 95 (48.7%) |
| 4+ Person Household | 174 (57.1%) | 131 (42.9%) |
| Total Housing Units | 623 (65.4%) | 329 (34.6%) |
Occupancy by Educational Attainment in Evansville
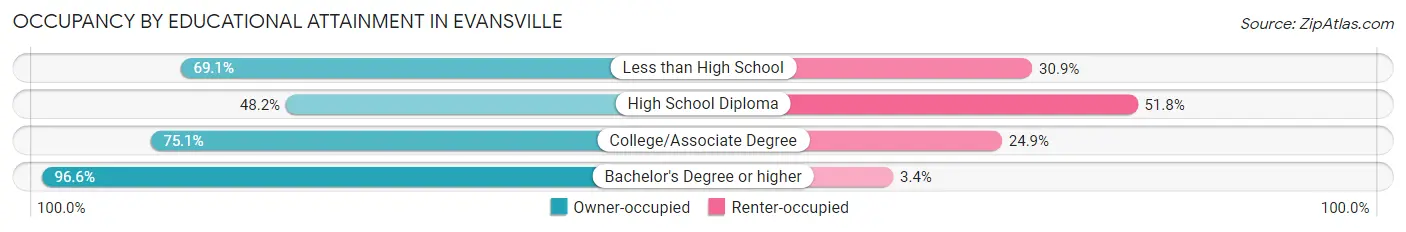
| Household Size | Owner-occupied | Renter-occupied |
| Less than High School | 67 (69.1%) | 30 (30.9%) |
| High School Diploma | 200 (48.2%) | 215 (51.8%) |
| College/Associate Degree | 241 (75.1%) | 80 (24.9%) |
| Bachelor's Degree or higher | 115 (96.6%) | 4 (3.4%) |
Occupancy by Age of Householder in Evansville
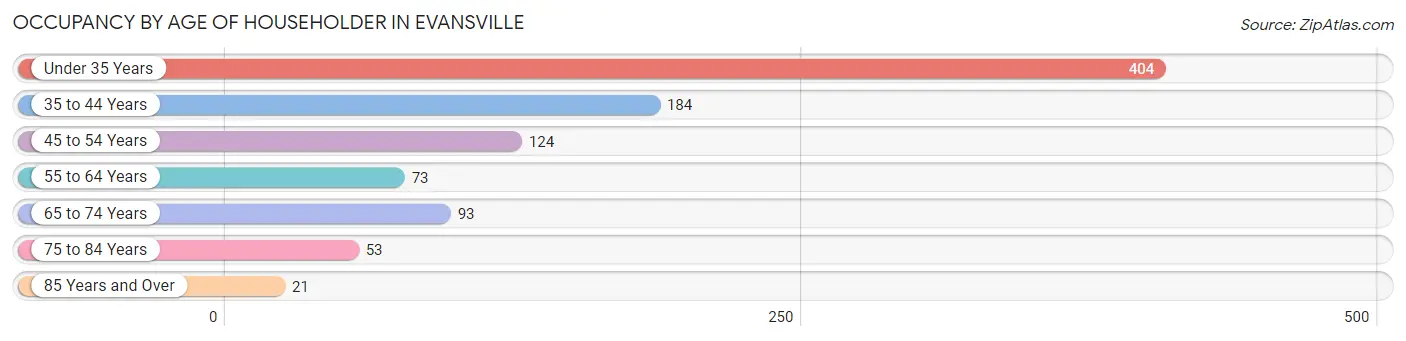
| Age Bracket | # Households | % Households |
| Under 35 Years | 404 | 42.4% |
| 35 to 44 Years | 184 | 19.3% |
| 45 to 54 Years | 124 | 13.0% |
| 55 to 64 Years | 73 | 7.7% |
| 65 to 74 Years | 93 | 9.8% |
| 75 to 84 Years | 53 | 5.6% |
| 85 Years and Over | 21 | 2.2% |
| Total | 952 | 100.0% |
Housing Finances in Evansville
Median Income by Occupancy in Evansville
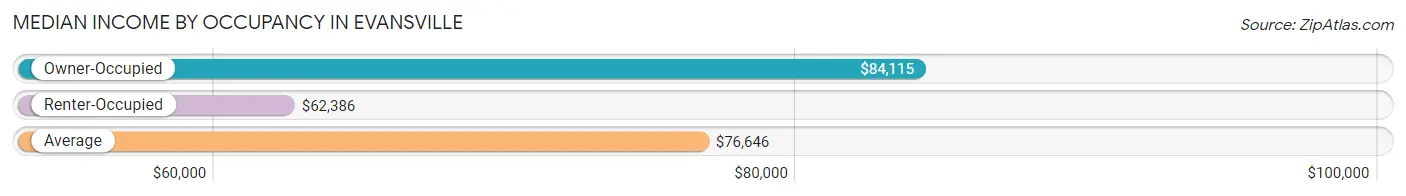
| Occupancy Type | # Households | Median Income |
| Owner-Occupied | 623 (65.4%) | $84,115 |
| Renter-Occupied | 329 (34.6%) | $62,386 |
| Average | 952 (100.0%) | $76,646 |
Occupancy by Householder Income Bracket in Evansville
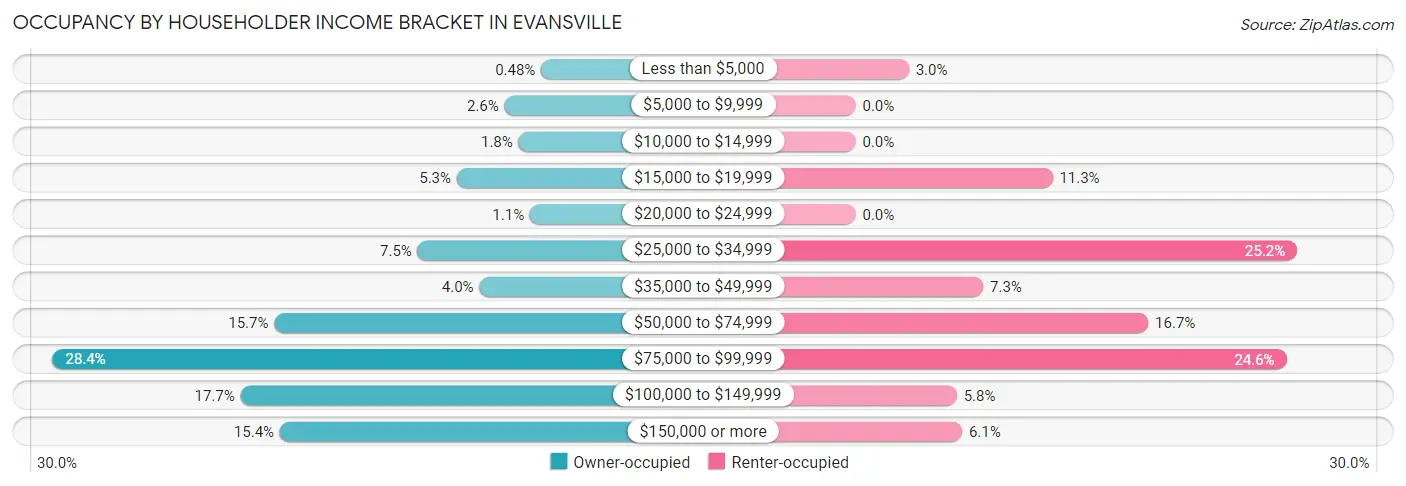
| Income Bracket | Owner-occupied | Renter-occupied |
| Less than $5,000 | 3 (0.5%) | 10 (3.0%) |
| $5,000 to $9,999 | 16 (2.6%) | 0 (0.0%) |
| $10,000 to $14,999 | 11 (1.8%) | 0 (0.0%) |
| $15,000 to $19,999 | 33 (5.3%) | 37 (11.3%) |
| $20,000 to $24,999 | 7 (1.1%) | 0 (0.0%) |
| $25,000 to $34,999 | 47 (7.5%) | 83 (25.2%) |
| $35,000 to $49,999 | 25 (4.0%) | 24 (7.3%) |
| $50,000 to $74,999 | 98 (15.7%) | 55 (16.7%) |
| $75,000 to $99,999 | 177 (28.4%) | 81 (24.6%) |
| $100,000 to $149,999 | 110 (17.7%) | 19 (5.8%) |
| $150,000 or more | 96 (15.4%) | 20 (6.1%) |
| Total | 623 (100.0%) | 329 (100.0%) |
Monthly Housing Cost Tiers in Evansville
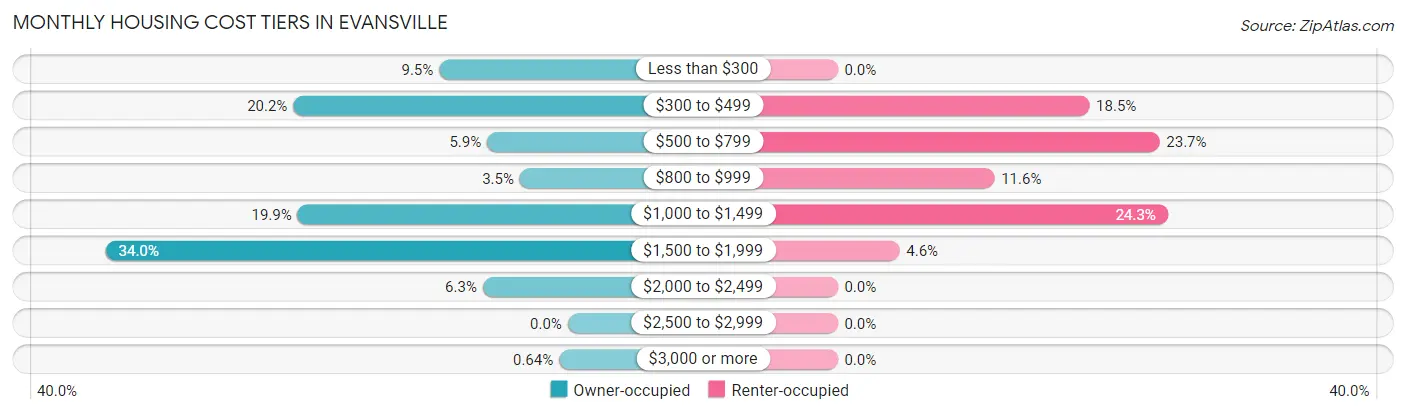
| Monthly Cost | Owner-occupied | Renter-occupied |
| Less than $300 | 59 (9.5%) | 0 (0.0%) |
| $300 to $499 | 126 (20.2%) | 61 (18.5%) |
| $500 to $799 | 37 (5.9%) | 78 (23.7%) |
| $800 to $999 | 22 (3.5%) | 38 (11.6%) |
| $1,000 to $1,499 | 124 (19.9%) | 80 (24.3%) |
| $1,500 to $1,999 | 212 (34.0%) | 15 (4.6%) |
| $2,000 to $2,499 | 39 (6.3%) | 0 (0.0%) |
| $2,500 to $2,999 | 0 (0.0%) | 0 (0.0%) |
| $3,000 or more | 4 (0.6%) | 0 (0.0%) |
| Total | 623 (100.0%) | 329 (100.0%) |
Physical Housing Characteristics in Evansville
Housing Structures in Evansville
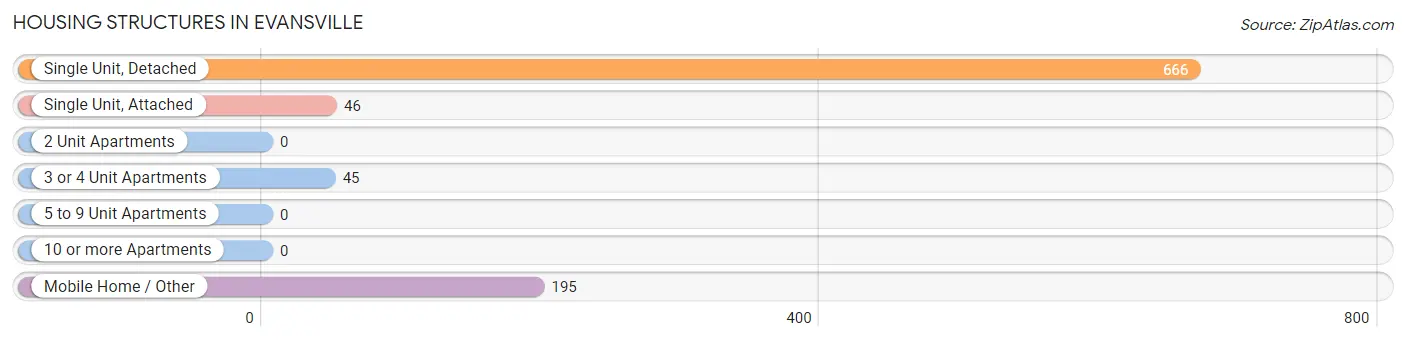
| Structure Type | # Housing Units | % Housing Units |
| Single Unit, Detached | 666 | 70.0% |
| Single Unit, Attached | 46 | 4.8% |
| 2 Unit Apartments | 0 | 0.0% |
| 3 or 4 Unit Apartments | 45 | 4.7% |
| 5 to 9 Unit Apartments | 0 | 0.0% |
| 10 or more Apartments | 0 | 0.0% |
| Mobile Home / Other | 195 | 20.5% |
| Total | 952 | 100.0% |
Housing Structures by Occupancy in Evansville
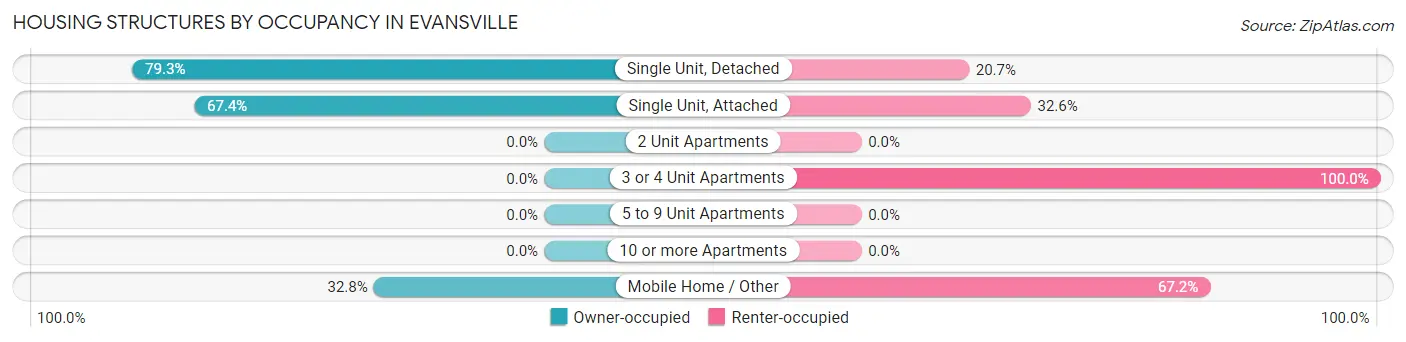
| Structure Type | Owner-occupied | Renter-occupied |
| Single Unit, Detached | 528 (79.3%) | 138 (20.7%) |
| Single Unit, Attached | 31 (67.4%) | 15 (32.6%) |
| 2 Unit Apartments | 0 (0.0%) | 0 (0.0%) |
| 3 or 4 Unit Apartments | 0 (0.0%) | 45 (100.0%) |
| 5 to 9 Unit Apartments | 0 (0.0%) | 0 (0.0%) |
| 10 or more Apartments | 0 (0.0%) | 0 (0.0%) |
| Mobile Home / Other | 64 (32.8%) | 131 (67.2%) |
| Total | 623 (65.4%) | 329 (34.6%) |
Housing Structures by Number of Rooms in Evansville
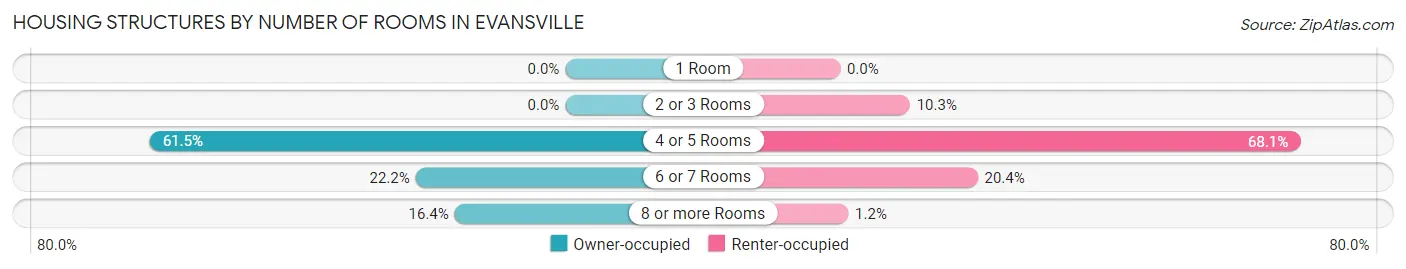
| Number of Rooms | Owner-occupied | Renter-occupied |
| 1 Room | 0 (0.0%) | 0 (0.0%) |
| 2 or 3 Rooms | 0 (0.0%) | 34 (10.3%) |
| 4 or 5 Rooms | 383 (61.5%) | 224 (68.1%) |
| 6 or 7 Rooms | 138 (22.2%) | 67 (20.4%) |
| 8 or more Rooms | 102 (16.4%) | 4 (1.2%) |
| Total | 623 (100.0%) | 329 (100.0%) |
Housing Structure by Heating Type in Evansville
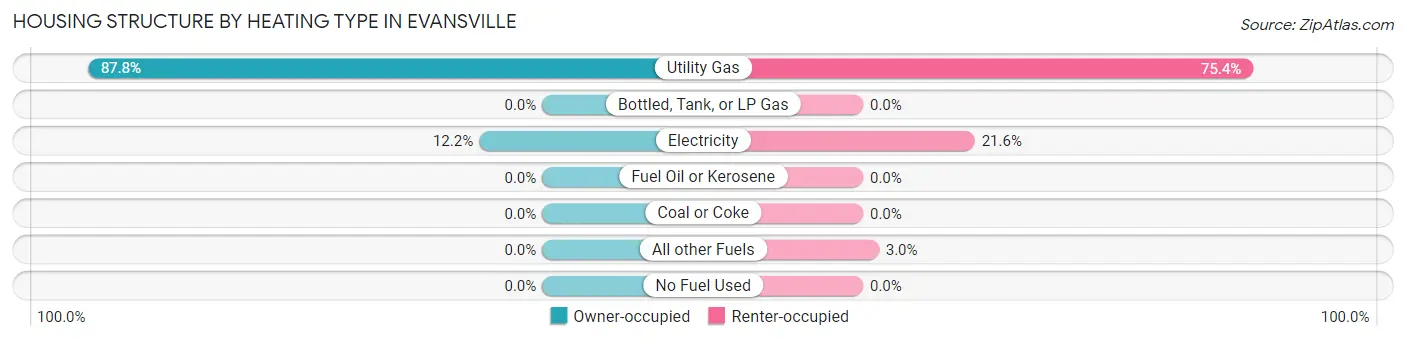
| Heating Type | Owner-occupied | Renter-occupied |
| Utility Gas | 547 (87.8%) | 248 (75.4%) |
| Bottled, Tank, or LP Gas | 0 (0.0%) | 0 (0.0%) |
| Electricity | 76 (12.2%) | 71 (21.6%) |
| Fuel Oil or Kerosene | 0 (0.0%) | 0 (0.0%) |
| Coal or Coke | 0 (0.0%) | 0 (0.0%) |
| All other Fuels | 0 (0.0%) | 10 (3.0%) |
| No Fuel Used | 0 (0.0%) | 0 (0.0%) |
| Total | 623 (100.0%) | 329 (100.0%) |
Household Vehicle Usage in Evansville
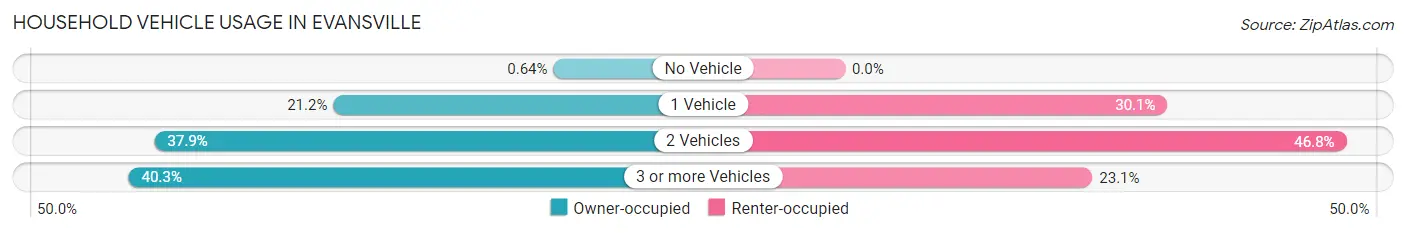
| Vehicles per Household | Owner-occupied | Renter-occupied |
| No Vehicle | 4 (0.6%) | 0 (0.0%) |
| 1 Vehicle | 132 (21.2%) | 99 (30.1%) |
| 2 Vehicles | 236 (37.9%) | 154 (46.8%) |
| 3 or more Vehicles | 251 (40.3%) | 76 (23.1%) |
| Total | 623 (100.0%) | 329 (100.0%) |
Real Estate & Mortgages in Evansville
Real Estate and Mortgage Overview in Evansville
| Characteristic | Without Mortgage | With Mortgage |
| Housing Units | 191 | 432 |
| Median Property Value | $205,900 | $253,700 |
| Median Household Income | $75,875 | $56 |
| Monthly Housing Costs | $332 | $4 |
| Real Estate Taxes | $845 | $12 |
Property Value by Mortgage Status in Evansville
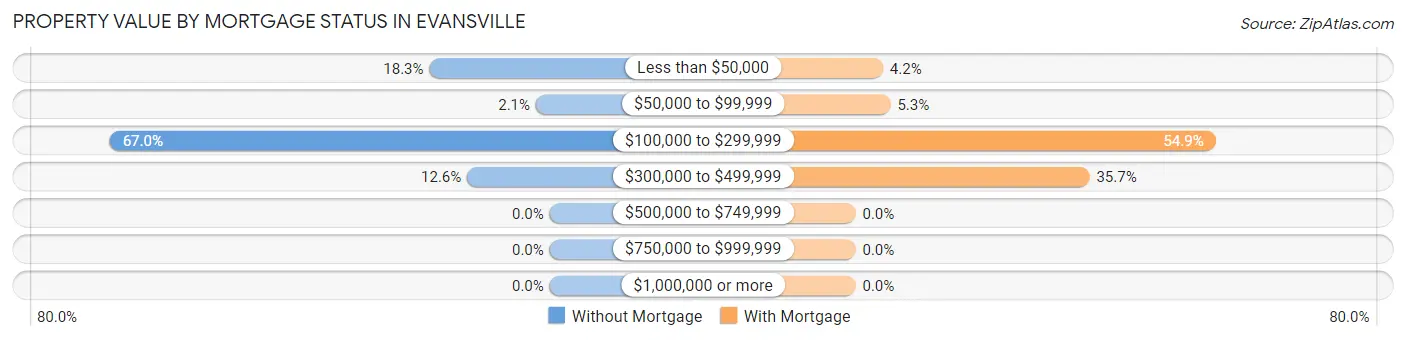
| Property Value | Without Mortgage | With Mortgage |
| Less than $50,000 | 35 (18.3%) | 18 (4.2%) |
| $50,000 to $99,999 | 4 (2.1%) | 23 (5.3%) |
| $100,000 to $299,999 | 128 (67.0%) | 237 (54.9%) |
| $300,000 to $499,999 | 24 (12.6%) | 154 (35.6%) |
| $500,000 to $749,999 | 0 (0.0%) | 0 (0.0%) |
| $750,000 to $999,999 | 0 (0.0%) | 0 (0.0%) |
| $1,000,000 or more | 0 (0.0%) | 0 (0.0%) |
| Total | 191 (100.0%) | 432 (100.0%) |
Household Income by Mortgage Status in Evansville
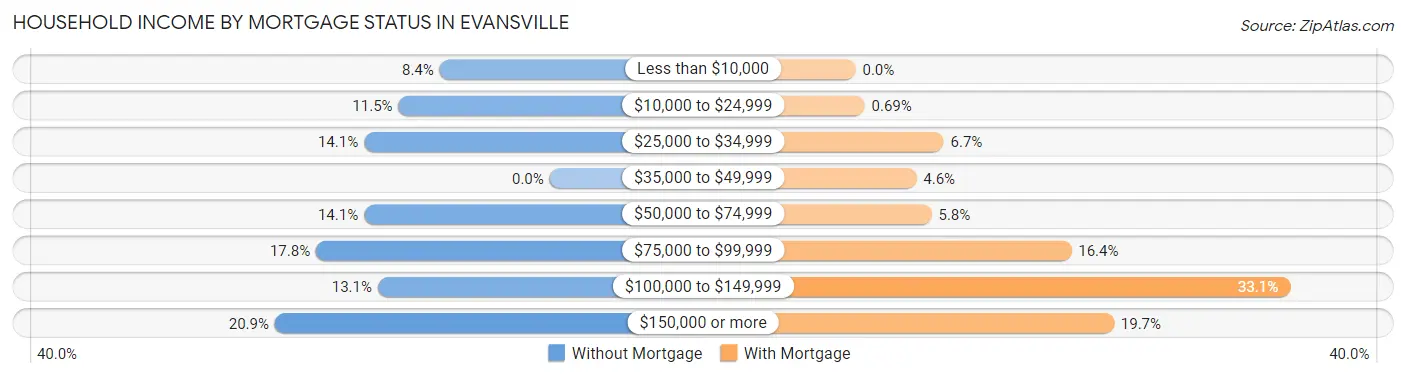
| Household Income | Without Mortgage | With Mortgage |
| Less than $10,000 | 16 (8.4%) | 0 (0.0%) |
| $10,000 to $24,999 | 22 (11.5%) | 3 (0.7%) |
| $25,000 to $34,999 | 27 (14.1%) | 29 (6.7%) |
| $35,000 to $49,999 | 0 (0.0%) | 20 (4.6%) |
| $50,000 to $74,999 | 27 (14.1%) | 25 (5.8%) |
| $75,000 to $99,999 | 34 (17.8%) | 71 (16.4%) |
| $100,000 to $149,999 | 25 (13.1%) | 143 (33.1%) |
| $150,000 or more | 40 (20.9%) | 85 (19.7%) |
| Total | 191 (100.0%) | 432 (100.0%) |
Property Value to Household Income Ratio in Evansville

| Value-to-Income Ratio | Without Mortgage | With Mortgage |
| Less than 2.0x | 104 (54.4%) | 88,661 (20,523.4%) |
| 2.0x to 2.9x | 16 (8.4%) | 111 (25.7%) |
| 3.0x to 3.9x | 14 (7.3%) | 122 (28.2%) |
| 4.0x or more | 57 (29.8%) | 96 (22.2%) |
| Total | 191 (100.0%) | 432 (100.0%) |
Real Estate Taxes by Mortgage Status in Evansville
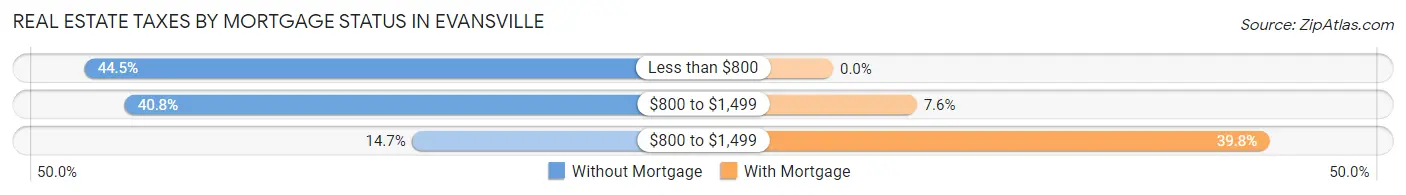
| Property Taxes | Without Mortgage | With Mortgage |
| Less than $800 | 85 (44.5%) | 0 (0.0%) |
| $800 to $1,499 | 78 (40.8%) | 33 (7.6%) |
| $800 to $1,499 | 28 (14.7%) | 172 (39.8%) |
| Total | 191 (100.0%) | 432 (100.0%) |
Health & Disability in Evansville
Health Insurance Coverage by Age in Evansville
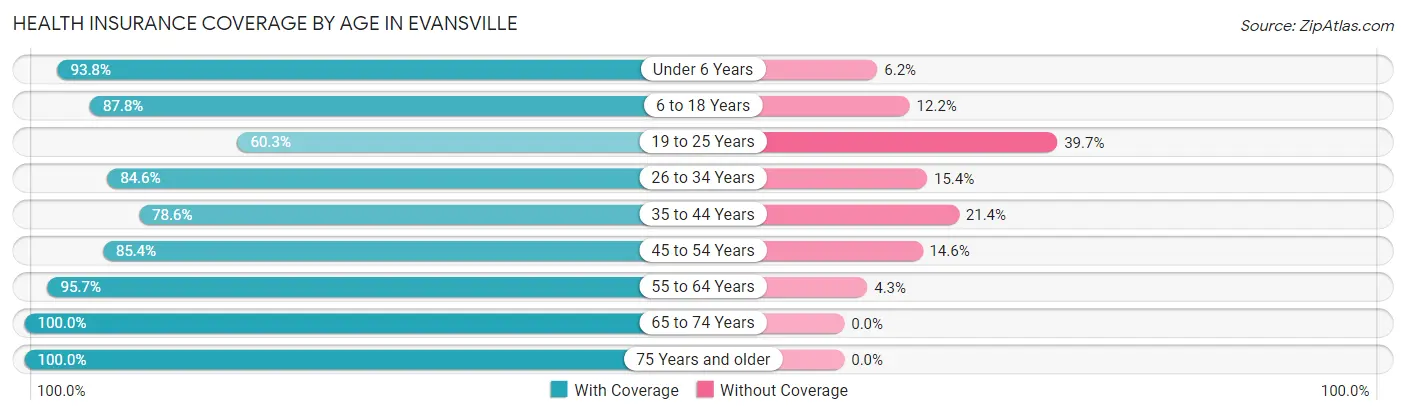
| Age Bracket | With Coverage | Without Coverage |
| Under 6 Years | 335 (93.8%) | 22 (6.2%) |
| 6 to 18 Years | 454 (87.8%) | 63 (12.2%) |
| 19 to 25 Years | 126 (60.3%) | 83 (39.7%) |
| 26 to 34 Years | 466 (84.6%) | 85 (15.4%) |
| 35 to 44 Years | 324 (78.6%) | 88 (21.4%) |
| 45 to 54 Years | 246 (85.4%) | 42 (14.6%) |
| 55 to 64 Years | 156 (95.7%) | 7 (4.3%) |
| 65 to 74 Years | 150 (100.0%) | 0 (0.0%) |
| 75 Years and older | 96 (100.0%) | 0 (0.0%) |
| Total | 2,353 (85.8%) | 390 (14.2%) |
Health Insurance Coverage by Citizenship Status in Evansville
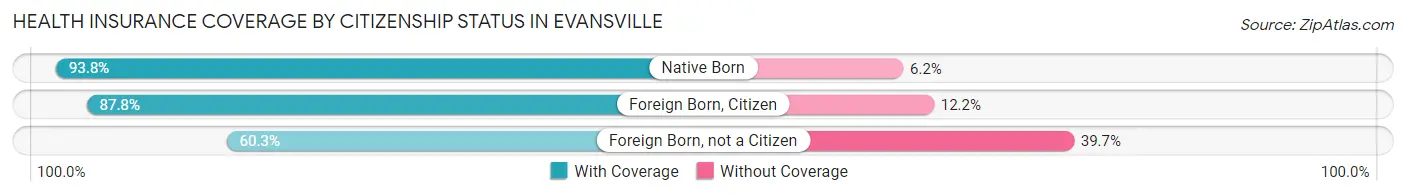
| Citizenship Status | With Coverage | Without Coverage |
| Native Born | 335 (93.8%) | 22 (6.2%) |
| Foreign Born, Citizen | 454 (87.8%) | 63 (12.2%) |
| Foreign Born, not a Citizen | 126 (60.3%) | 83 (39.7%) |
Health Insurance Coverage by Household Income in Evansville
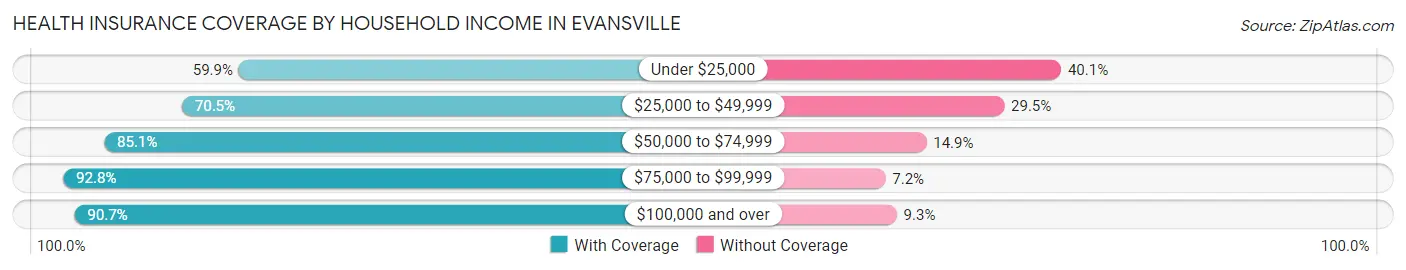
| Household Income | With Coverage | Without Coverage |
| Under $25,000 | 91 (59.9%) | 61 (40.1%) |
| $25,000 to $49,999 | 280 (70.5%) | 117 (29.5%) |
| $50,000 to $74,999 | 377 (85.1%) | 66 (14.9%) |
| $75,000 to $99,999 | 770 (92.8%) | 60 (7.2%) |
| $100,000 and over | 835 (90.7%) | 86 (9.3%) |
Public vs Private Health Insurance Coverage by Age in Evansville
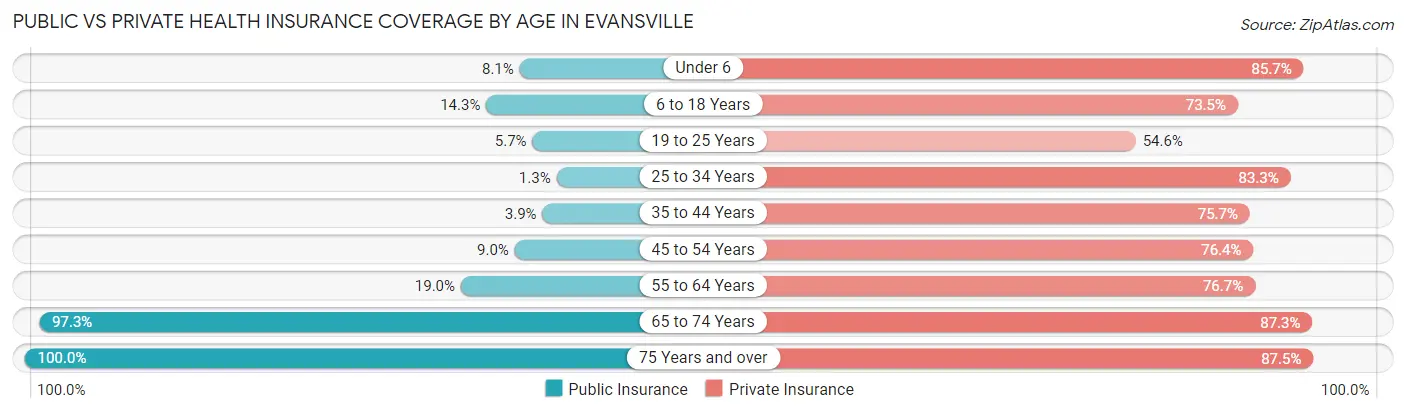
| Age Bracket | Public Insurance | Private Insurance |
| Under 6 | 29 (8.1%) | 306 (85.7%) |
| 6 to 18 Years | 74 (14.3%) | 380 (73.5%) |
| 19 to 25 Years | 12 (5.7%) | 114 (54.5%) |
| 25 to 34 Years | 7 (1.3%) | 459 (83.3%) |
| 35 to 44 Years | 16 (3.9%) | 312 (75.7%) |
| 45 to 54 Years | 26 (9.0%) | 220 (76.4%) |
| 55 to 64 Years | 31 (19.0%) | 125 (76.7%) |
| 65 to 74 Years | 146 (97.3%) | 131 (87.3%) |
| 75 Years and over | 96 (100.0%) | 84 (87.5%) |
| Total | 437 (15.9%) | 2,131 (77.7%) |
Disability Status by Sex by Age in Evansville
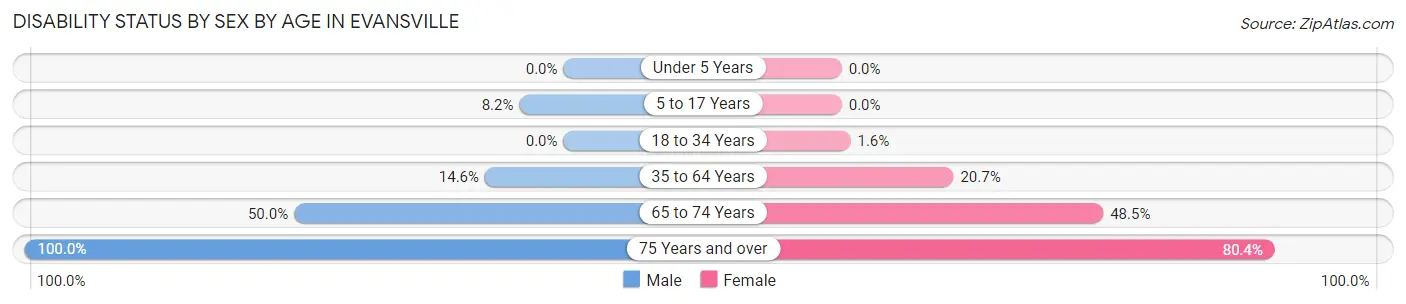
| Age Bracket | Male | Female |
| Under 5 Years | 0 (0.0%) | 0 (0.0%) |
| 5 to 17 Years | 22 (8.2%) | 0 (0.0%) |
| 18 to 34 Years | 0 (0.0%) | 7 (1.6%) |
| 35 to 64 Years | 66 (14.6%) | 85 (20.7%) |
| 65 to 74 Years | 41 (50.0%) | 33 (48.5%) |
| 75 Years and over | 40 (100.0%) | 45 (80.4%) |
Disability Class by Sex by Age in Evansville
Disability Class: Hearing Difficulty
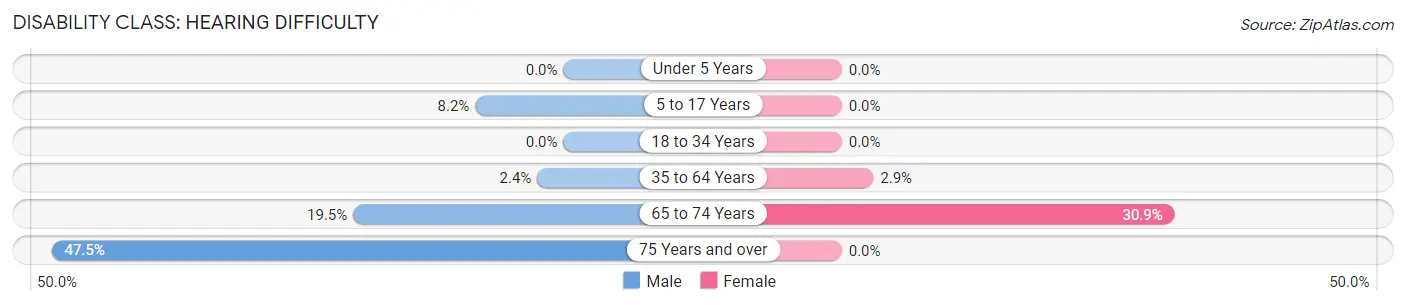
| Age Bracket | Male | Female |
| Under 5 Years | 0 (0.0%) | 0 (0.0%) |
| 5 to 17 Years | 22 (8.2%) | 0 (0.0%) |
| 18 to 34 Years | 0 (0.0%) | 0 (0.0%) |
| 35 to 64 Years | 11 (2.4%) | 12 (2.9%) |
| 65 to 74 Years | 16 (19.5%) | 21 (30.9%) |
| 75 Years and over | 19 (47.5%) | 0 (0.0%) |
Disability Class: Vision Difficulty
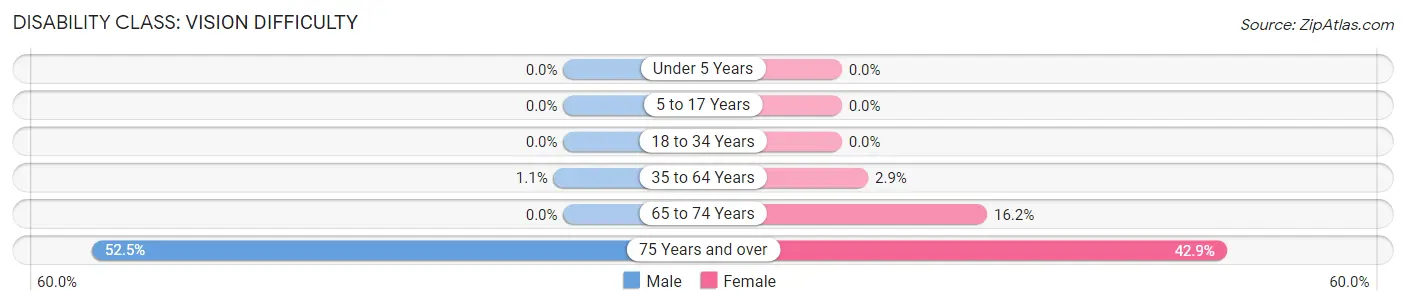
| Age Bracket | Male | Female |
| Under 5 Years | 0 (0.0%) | 0 (0.0%) |
| 5 to 17 Years | 0 (0.0%) | 0 (0.0%) |
| 18 to 34 Years | 0 (0.0%) | 0 (0.0%) |
| 35 to 64 Years | 5 (1.1%) | 12 (2.9%) |
| 65 to 74 Years | 0 (0.0%) | 11 (16.2%) |
| 75 Years and over | 21 (52.5%) | 24 (42.9%) |
Disability Class: Cognitive Difficulty
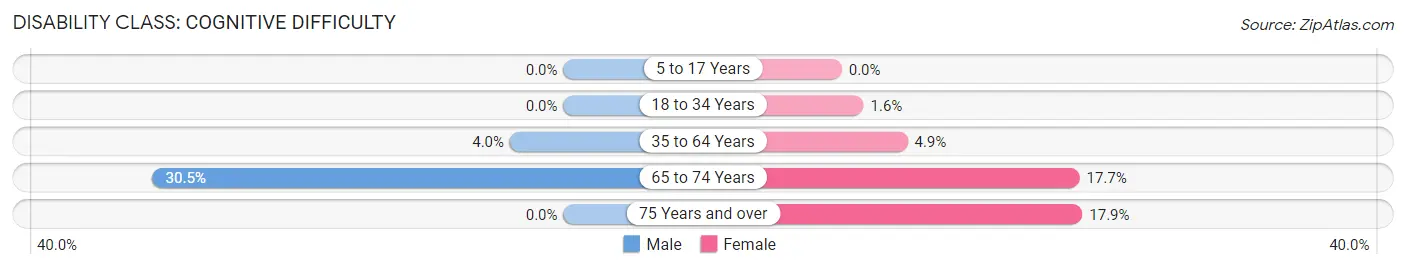
| Age Bracket | Male | Female |
| 5 to 17 Years | 0 (0.0%) | 0 (0.0%) |
| 18 to 34 Years | 0 (0.0%) | 7 (1.6%) |
| 35 to 64 Years | 18 (4.0%) | 20 (4.9%) |
| 65 to 74 Years | 25 (30.5%) | 12 (17.6%) |
| 75 Years and over | 0 (0.0%) | 10 (17.9%) |
Disability Class: Ambulatory Difficulty
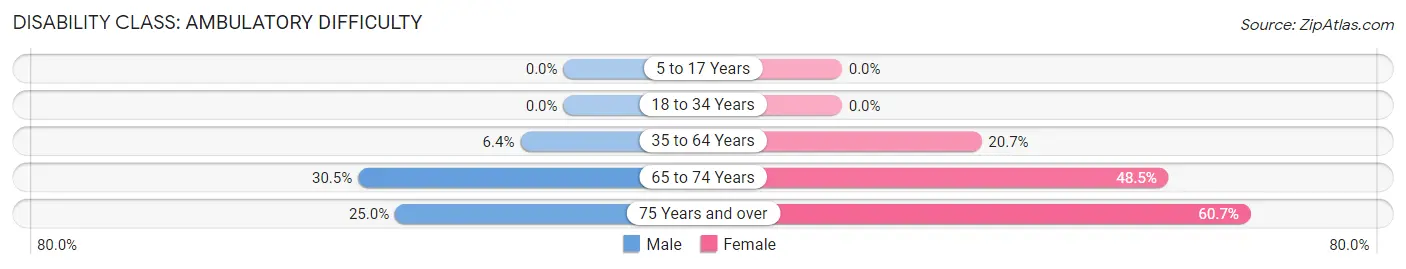
| Age Bracket | Male | Female |
| 5 to 17 Years | 0 (0.0%) | 0 (0.0%) |
| 18 to 34 Years | 0 (0.0%) | 0 (0.0%) |
| 35 to 64 Years | 29 (6.4%) | 85 (20.7%) |
| 65 to 74 Years | 25 (30.5%) | 33 (48.5%) |
| 75 Years and over | 10 (25.0%) | 34 (60.7%) |
Disability Class: Self-Care Difficulty
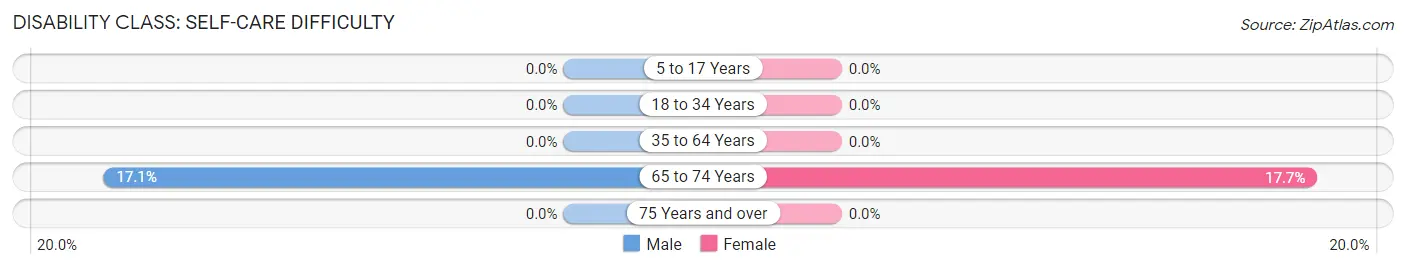
| Age Bracket | Male | Female |
| 5 to 17 Years | 0 (0.0%) | 0 (0.0%) |
| 18 to 34 Years | 0 (0.0%) | 0 (0.0%) |
| 35 to 64 Years | 0 (0.0%) | 0 (0.0%) |
| 65 to 74 Years | 14 (17.1%) | 12 (17.6%) |
| 75 Years and over | 0 (0.0%) | 0 (0.0%) |
Technology Access in Evansville
Computing Device Access in Evansville
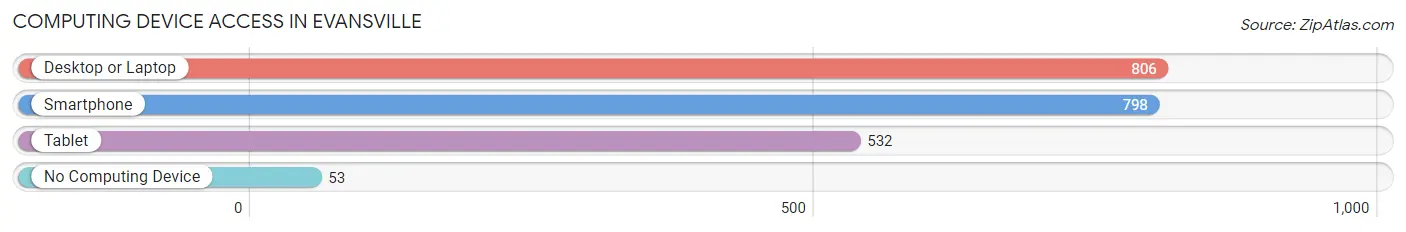
| Device Type | # Households | % Households |
| Desktop or Laptop | 806 | 84.7% |
| Smartphone | 798 | 83.8% |
| Tablet | 532 | 55.9% |
| No Computing Device | 53 | 5.6% |
| Total | 952 | 100.0% |
Internet Access in Evansville
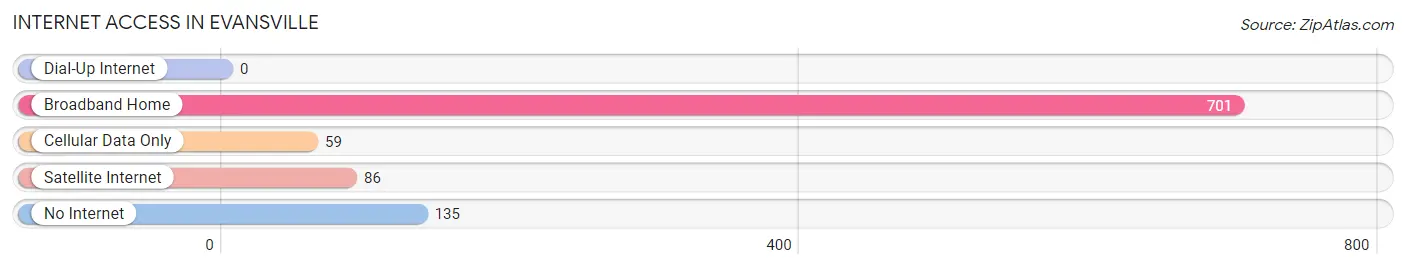
| Internet Type | # Households | % Households |
| Dial-Up Internet | 0 | 0.0% |
| Broadband Home | 701 | 73.6% |
| Cellular Data Only | 59 | 6.2% |
| Satellite Internet | 86 | 9.0% |
| No Internet | 135 | 14.2% |
| Total | 952 | 100.0% |
Evansville Summary
Evansville, Wyoming is a small town located in the southwestern corner of the state, near the Utah border. It is the county seat of Uinta County and is part of the Evanston, Wyoming Micropolitan Statistical Area. The town was founded in 1868 and named after the first postmaster, William Evans. The population of Evansville was 1,072 at the 2010 census.
Geography
Evansville is located at 41°14'17" North, 110°45'45" West (41.238, -110.7625). According to the United States Census Bureau, the town has a total area of 0.7 square miles (1.8 km2), all of it land.
The town is located in the Uinta Basin, a large intermountain basin in the western United States. The basin is bounded by the Uinta Mountains to the east, the Wasatch Range to the west, and the Unita-Wasatch-Cache National Forest to the north. The basin is drained by the Green River, which flows through the town.
Climate
Evansville has a semi-arid climate, with hot summers and cold winters. The average annual temperature is 44.3°F (6.8°C). The average annual precipitation is 11.3 inches (286 mm).
Demographics
As of the census of 2010, there were 1,072 people, 441 households, and 287 families residing in the town. The population density was 1,521.4 people per square mile (586.3/km2). There were 486 housing units at an average density of 690.0 per square mile (266.3/km2). The racial makeup of the town was 95.2% White, 0.2% African American, 0.7% Native American, 0.2% Asian, 0.1% Pacific Islander, 1.7% from other races, and 1.9% from two or more races. Hispanic or Latino of any race were 4.2% of the population.
There were 441 households, out of which 28.2% had children under the age of 18 living with them, 51.6% were married couples living together, 8.6% had a female householder with no husband present, and 35.3% were non-families. 30.2% of all households were made up of individuals, and 13.2% had someone living alone who was 65 years of age or older. The average household size was 2.41 and the average family size was 3.02.
The median age in the town was 39.2 years. 24.2% of residents were under the age of 18; 6.7% were between the ages of 18 and 24; 24.2% were from 25 to 44; 28.2% were from 45 to 64; and 16.7% were 65 years of age or older. The gender makeup of the town was 49.2% male and 50.8% female.
Economy
The economy of Evansville is largely based on agriculture and tourism. The town is home to several farms and ranches, as well as a number of small businesses. The town is also a popular destination for outdoor recreation, such as fishing, hunting, and camping.
The town is served by the Uinta County School District, which operates two elementary schools, one middle school, and one high school. The town is also home to a branch of the University of Wyoming.
Conclusion
Evansville, Wyoming is a small town located in the southwestern corner of the state, near the Utah border. It is the county seat of Uinta County and is part of the Evanston, Wyoming Micropolitan Statistical Area. The town was founded in 1868 and named after the first postmaster, William Evans. The population of Evansville was 1,072 at the 2010 census. The town is located in the Uinta Basin and has a semi-arid climate, with hot summers and cold winters. The economy of Evansville is largely based on agriculture and tourism. The town is served by the Uinta County School District and is home to a branch of the University of Wyoming.
Common Questions
What is Per Capita Income in Evansville?
Per Capita income in Evansville is $30,909.
What is the Median Family Income in Evansville?
Median Family Income in Evansville is $79,541.
What is the Median Household income in Evansville?
Median Household Income in Evansville is $76,646.
What is Income or Wage Gap in Evansville?
Income or Wage Gap in Evansville is 40.5%.
Women in Evansville earn 59.5 cents for every dollar earned by a man.
What is Inequality or Gini Index in Evansville?
Inequality or Gini Index in Evansville is 0.36.
What is the Total Population of Evansville?
Total Population of Evansville is 2,755.
What is the Total Male Population of Evansville?
Total Male Population of Evansville is 1,381.
What is the Total Female Population of Evansville?
Total Female Population of Evansville is 1,374.
What is the Ratio of Males per 100 Females in Evansville?
There are 100.51 Males per 100 Females in Evansville.
What is the Ratio of Females per 100 Males in Evansville?
There are 99.49 Females per 100 Males in Evansville.
What is the Median Population Age in Evansville?
Median Population Age in Evansville is 30.0 Years.
What is the Average Family Size in Evansville
Average Family Size in Evansville is 3.3 People.
What is the Average Household Size in Evansville
Average Household Size in Evansville is 2.9 People.
How Large is the Labor Force in Evansville?
There are 1,467 People in the Labor Forcein in Evansville.
What is the Percentage of People in the Labor Force in Evansville?
72.9% of People are in the Labor Force in Evansville.
What is the Unemployment Rate in Evansville?
Unemployment Rate in Evansville is 5.4%.