Worland, WY Map & Demographics
Worland Map
Worland Overview
$31,980
PER CAPITA INCOME
$79,732
AVG FAMILY INCOME
$59,679
AVG HOUSEHOLD INCOME
38.5%
WAGE / INCOME GAP [ % ]
61.5¢/ $1
WAGE / INCOME GAP [ $ ]
0.38
INEQUALITY / GINI INDEX
4,812
TOTAL POPULATION
2,521
MALE POPULATION
2,291
FEMALE POPULATION
110.04
MALES / 100 FEMALES
90.88
FEMALES / 100 MALES
40.8
MEDIAN AGE
2.9
AVG FAMILY SIZE
2.2
AVG HOUSEHOLD SIZE
2,557
LABOR FORCE [ PEOPLE ]
67.1%
PERCENT IN LABOR FORCE
1.9%
UNEMPLOYMENT RATE
Worland Zip Codes
Worland Area Codes
Income in Worland
Income Overview in Worland
Per Capita Income in Worland is $31,980, while median incomes of families and households are $79,732 and $59,679 respectively.
| Characteristic | Number | Measure |
| Per Capita Income | 4,812 | $31,980 |
| Median Family Income | 1,183 | $79,732 |
| Mean Family Income | 1,183 | $85,063 |
| Median Household Income | 2,174 | $59,679 |
| Mean Household Income | 2,174 | $69,188 |
| Income Deficit | 1,183 | $0 |
| Wage / Income Gap (%) | 4,812 | 38.51% |
| Wage / Income Gap ($) | 4,812 | 61.49¢ per $1 |
| Gini / Inequality Index | 4,812 | 0.38 |
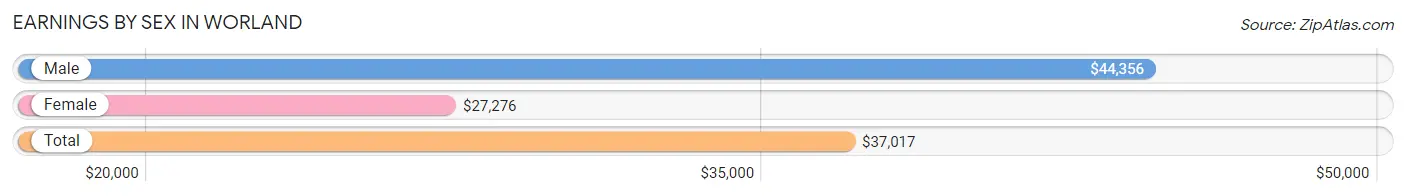
Earnings by Sex in Worland
Average Earnings in Worland are $37,017, $44,356 for men and $27,276 for women, a difference of 38.5%.
| Sex | Number | Average Earnings |
| Male | 1,359 (49.7%) | $44,356 |
| Female | 1,377 (50.3%) | $27,276 |
| Total | 2,736 (100.0%) | $37,017 |
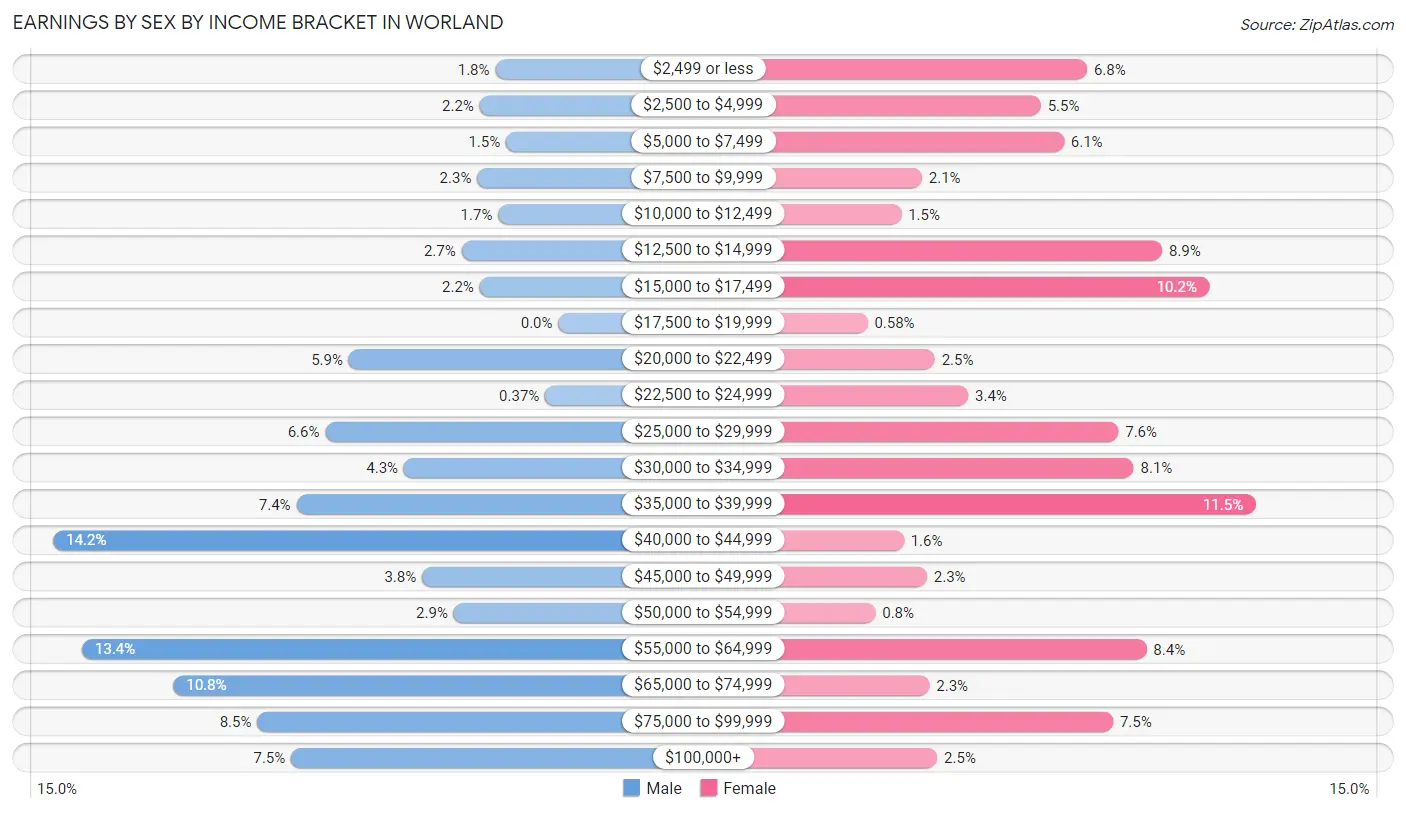
Earnings by Sex by Income Bracket in Worland
The most common earnings brackets in Worland are $40,000 to $44,999 for men (193 | 14.2%) and $35,000 to $39,999 for women (158 | 11.5%).
| Income | Male | Female |
| $2,499 or less | 24 (1.8%) | 93 (6.8%) |
| $2,500 to $4,999 | 30 (2.2%) | 75 (5.4%) |
| $5,000 to $7,499 | 20 (1.5%) | 84 (6.1%) |
| $7,500 to $9,999 | 31 (2.3%) | 29 (2.1%) |
| $10,000 to $12,499 | 23 (1.7%) | 21 (1.5%) |
| $12,500 to $14,999 | 37 (2.7%) | 122 (8.9%) |
| $15,000 to $17,499 | 30 (2.2%) | 140 (10.2%) |
| $17,500 to $19,999 | 0 (0.0%) | 8 (0.6%) |
| $20,000 to $22,499 | 80 (5.9%) | 34 (2.5%) |
| $22,500 to $24,999 | 5 (0.4%) | 47 (3.4%) |
| $25,000 to $29,999 | 89 (6.6%) | 105 (7.6%) |
| $30,000 to $34,999 | 59 (4.3%) | 111 (8.1%) |
| $35,000 to $39,999 | 100 (7.4%) | 158 (11.5%) |
| $40,000 to $44,999 | 193 (14.2%) | 22 (1.6%) |
| $45,000 to $49,999 | 52 (3.8%) | 31 (2.2%) |
| $50,000 to $54,999 | 40 (2.9%) | 11 (0.8%) |
| $55,000 to $64,999 | 182 (13.4%) | 116 (8.4%) |
| $65,000 to $74,999 | 147 (10.8%) | 32 (2.3%) |
| $75,000 to $99,999 | 115 (8.5%) | 103 (7.5%) |
| $100,000+ | 102 (7.5%) | 35 (2.5%) |
| Total | 1,359 (100.0%) | 1,377 (100.0%) |
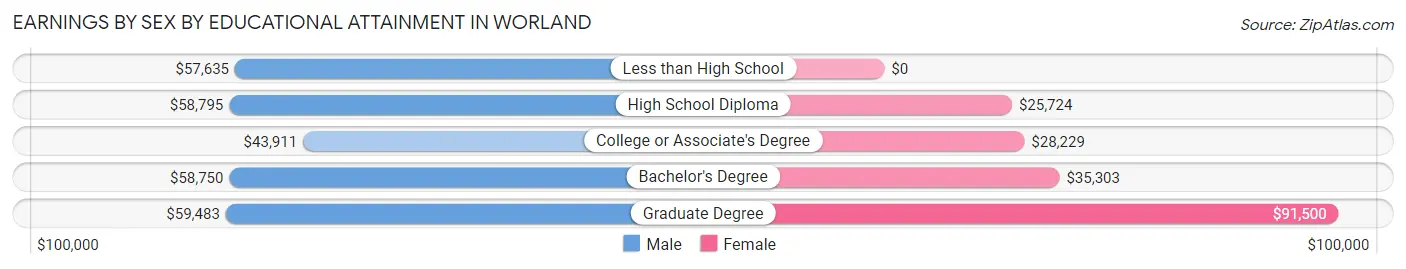
Earnings by Sex by Educational Attainment in Worland
Average earnings in Worland are $51,774 for men and $27,372 for women, a difference of 47.1%. Men with an educational attainment of graduate degree enjoy the highest average annual earnings of $59,483, while those with college or associate's degree education earn the least with $43,911. Women with an educational attainment of graduate degree earn the most with the average annual earnings of $91,500, while those with high school diploma education have the smallest earnings of $25,724.
| Educational Attainment | Male Income | Female Income |
| Less than High School | $57,635 | $0 |
| High School Diploma | $58,795 | $25,724 |
| College or Associate's Degree | $43,911 | $28,229 |
| Bachelor's Degree | $58,750 | $35,303 |
| Graduate Degree | $59,483 | $91,500 |
| Total | $51,774 | $27,372 |
Family Income in Worland
Family Income Brackets in Worland
According to the Worland family income data, there are 278 families falling into the $100,000 to $149,999 income range, which is the most common income bracket and makes up 23.5% of all families. Conversely, the less than $10,000 income bracket is the least frequent group with only 9 families (0.8%) belonging to this category.
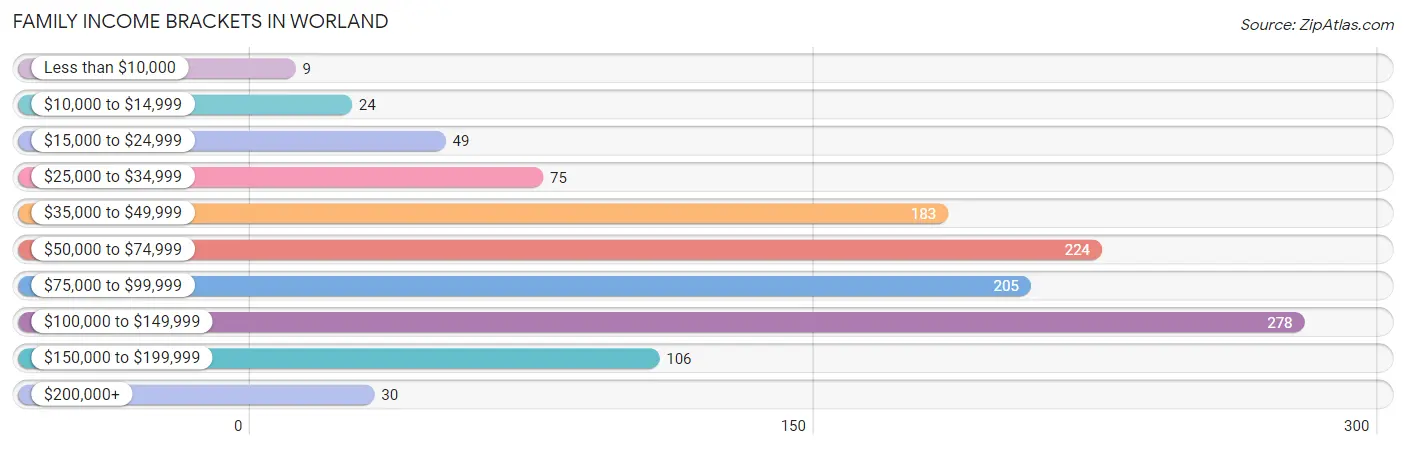
| Income Bracket | # Families | % Families |
| Less than $10,000 | 9 | 0.8% |
| $10,000 to $14,999 | 24 | 2.0% |
| $15,000 to $24,999 | 49 | 4.1% |
| $25,000 to $34,999 | 75 | 6.3% |
| $35,000 to $49,999 | 183 | 15.5% |
| $50,000 to $74,999 | 224 | 18.9% |
| $75,000 to $99,999 | 205 | 17.3% |
| $100,000 to $149,999 | 278 | 23.5% |
| $150,000 to $199,999 | 106 | 9.0% |
| $200,000+ | 30 | 2.5% |
Family Income by Famaliy Size in Worland
6-person families (73 | 6.2%) account for the highest median family income in Worland with $122,188 per family, while 2-person families (626 | 52.9%) have the highest median income of $32,312 per family member.
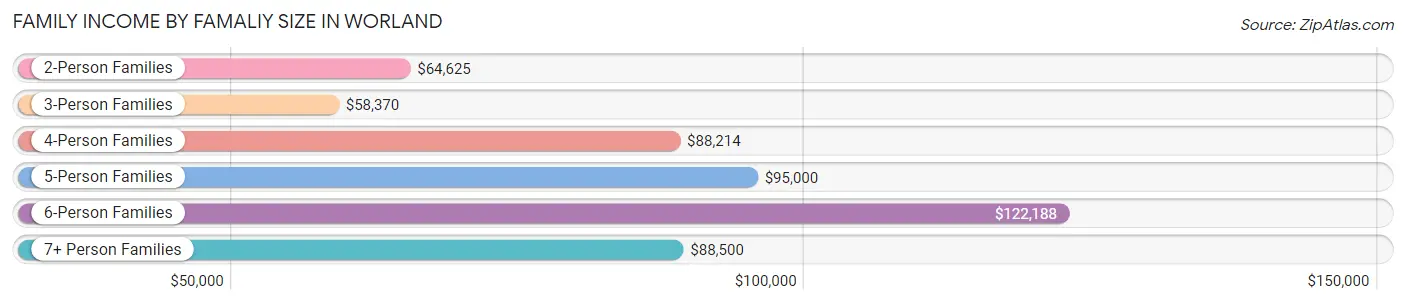
| Income Bracket | # Families | Median Income |
| 2-Person Families | 626 (52.9%) | $64,625 |
| 3-Person Families | 206 (17.4%) | $58,370 |
| 4-Person Families | 164 (13.9%) | $88,214 |
| 5-Person Families | 66 (5.6%) | $95,000 |
| 6-Person Families | 73 (6.2%) | $122,188 |
| 7+ Person Families | 48 (4.1%) | $88,500 |
| Total | 1,183 (100.0%) | $79,732 |
Family Income by Number of Earners in Worland
The median family income in Worland is $79,732, with families comprising 3+ earners (115) having the highest median family income of $100,987, while families with 1 earner (392) have the lowest median family income of $48,750, accounting for 9.7% and 33.1% of families, respectively.

| Number of Earners | # Families | Median Income |
| No Earners | 83 (7.0%) | $72,614 |
| 1 Earner | 392 (33.1%) | $48,750 |
| 2 Earners | 593 (50.1%) | $95,035 |
| 3+ Earners | 115 (9.7%) | $100,987 |
| Total | 1,183 (100.0%) | $79,732 |
Household Income in Worland
Household Income Brackets in Worland
With 424 households falling in the category, the $50,000 to $74,999 income range is the most frequent in Worland, accounting for 19.5% of all households. In contrast, only 43 households (2.0%) fall into the $200,000+ income bracket, making it the least populous group.
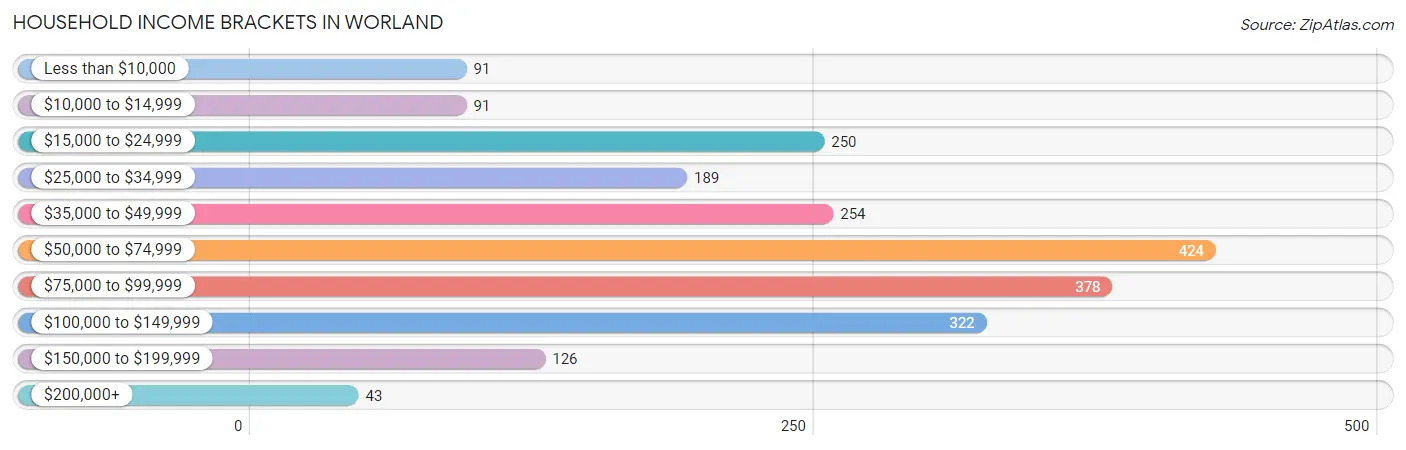
| Income Bracket | # Households | % Households |
| Less than $10,000 | 91 | 4.2% |
| $10,000 to $14,999 | 91 | 4.2% |
| $15,000 to $24,999 | 250 | 11.5% |
| $25,000 to $34,999 | 189 | 8.7% |
| $35,000 to $49,999 | 254 | 11.7% |
| $50,000 to $74,999 | 424 | 19.5% |
| $75,000 to $99,999 | 378 | 17.4% |
| $100,000 to $149,999 | 322 | 14.8% |
| $150,000 to $199,999 | 126 | 5.8% |
| $200,000+ | 43 | 2.0% |
Household Income by Householder Age in Worland
The median household income in Worland is $59,679, with the highest median household income of $67,700 found in the 45 to 64 years age bracket for the primary householder. A total of 680 households (31.3%) fall into this category. Meanwhile, the 15 to 24 years age bracket for the primary householder has the lowest median household income of $48,871, with 164 households (7.5%) in this group.
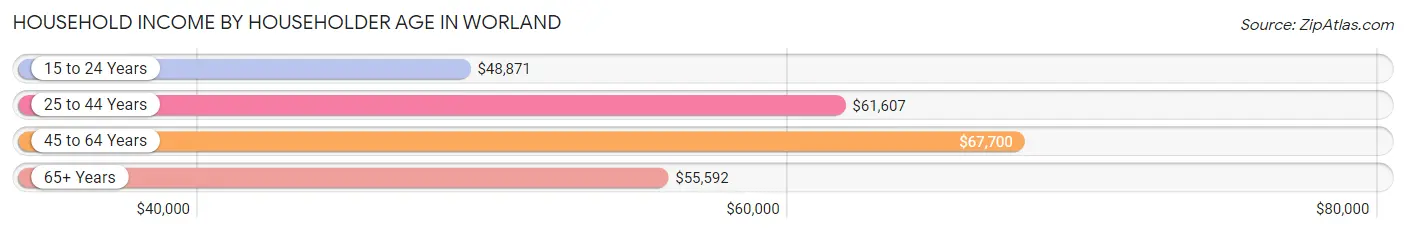
| Income Bracket | # Households | Median Income |
| 15 to 24 Years | 164 (7.5%) | $48,871 |
| 25 to 44 Years | 656 (30.2%) | $61,607 |
| 45 to 64 Years | 680 (31.3%) | $67,700 |
| 65+ Years | 674 (31.0%) | $55,592 |
| Total | 2,174 (100.0%) | $59,679 |
Poverty in Worland
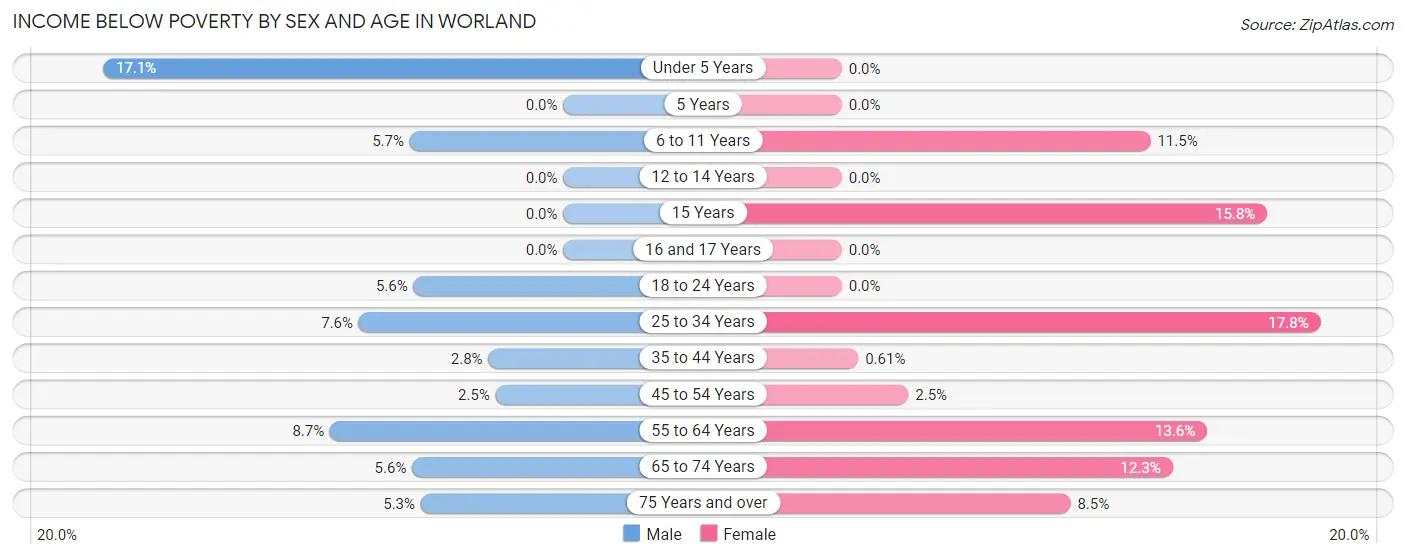
Income Below Poverty by Sex and Age in Worland
With 5.5% poverty level for males and 8.4% for females among the residents of Worland, under 5 year old males and 25 to 34 year old females are the most vulnerable to poverty, with 20 males (17.1%) and 51 females (17.8%) in their respective age groups living below the poverty level.
| Age Bracket | Male | Female |
| Under 5 Years | 20 (17.1%) | 0 (0.0%) |
| 5 Years | 0 (0.0%) | 0 (0.0%) |
| 6 to 11 Years | 18 (5.7%) | 18 (11.5%) |
| 12 to 14 Years | 0 (0.0%) | 0 (0.0%) |
| 15 Years | 0 (0.0%) | 3 (15.8%) |
| 16 and 17 Years | 0 (0.0%) | 0 (0.0%) |
| 18 to 24 Years | 13 (5.6%) | 0 (0.0%) |
| 25 to 34 Years | 22 (7.6%) | 51 (17.8%) |
| 35 to 44 Years | 8 (2.8%) | 2 (0.6%) |
| 45 to 54 Years | 6 (2.5%) | 4 (2.5%) |
| 55 to 64 Years | 22 (8.7%) | 56 (13.6%) |
| 65 to 74 Years | 18 (5.6%) | 28 (12.3%) |
| 75 Years and over | 10 (5.3%) | 23 (8.5%) |
| Total | 137 (5.5%) | 185 (8.4%) |
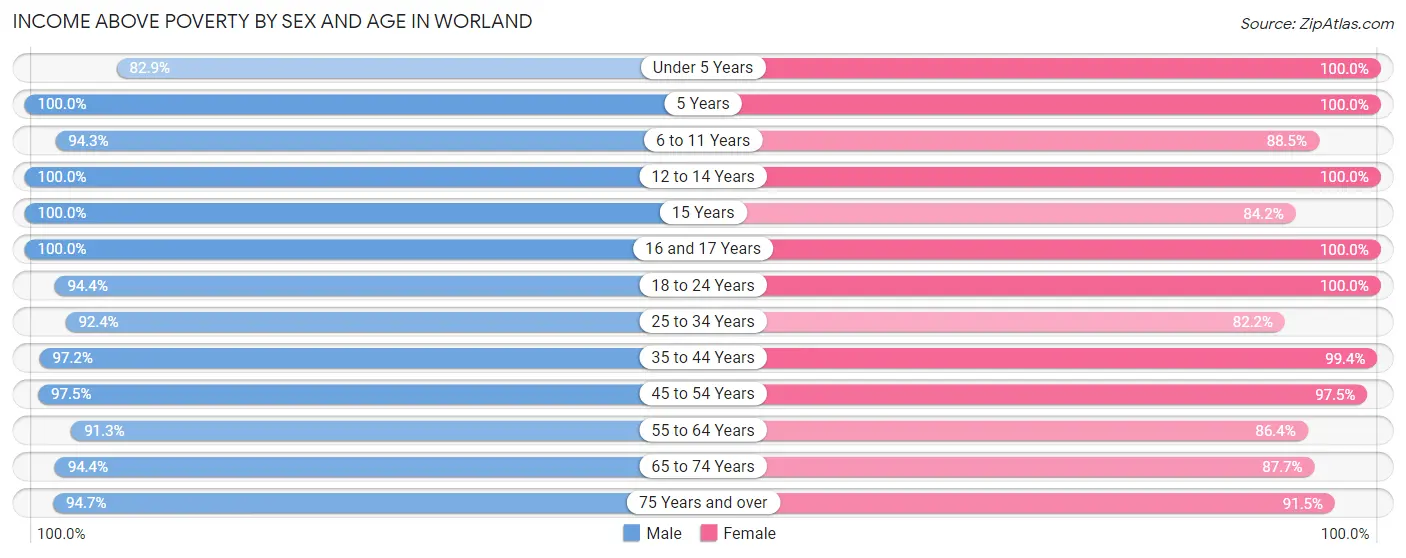
Income Above Poverty by Sex and Age in Worland
According to the poverty statistics in Worland, males aged 5 years and females aged under 5 years are the age groups that are most secure financially, with 100.0% of males and 100.0% of females in these age groups living above the poverty line.
| Age Bracket | Male | Female |
| Under 5 Years | 97 (82.9%) | 129 (100.0%) |
| 5 Years | 78 (100.0%) | 7 (100.0%) |
| 6 to 11 Years | 298 (94.3%) | 139 (88.5%) |
| 12 to 14 Years | 45 (100.0%) | 59 (100.0%) |
| 15 Years | 35 (100.0%) | 16 (84.2%) |
| 16 and 17 Years | 66 (100.0%) | 21 (100.0%) |
| 18 to 24 Years | 221 (94.4%) | 128 (100.0%) |
| 25 to 34 Years | 268 (92.4%) | 236 (82.2%) |
| 35 to 44 Years | 280 (97.2%) | 327 (99.4%) |
| 45 to 54 Years | 233 (97.5%) | 158 (97.5%) |
| 55 to 64 Years | 232 (91.3%) | 357 (86.4%) |
| 65 to 74 Years | 303 (94.4%) | 200 (87.7%) |
| 75 Years and over | 179 (94.7%) | 248 (91.5%) |
| Total | 2,335 (94.5%) | 2,025 (91.6%) |
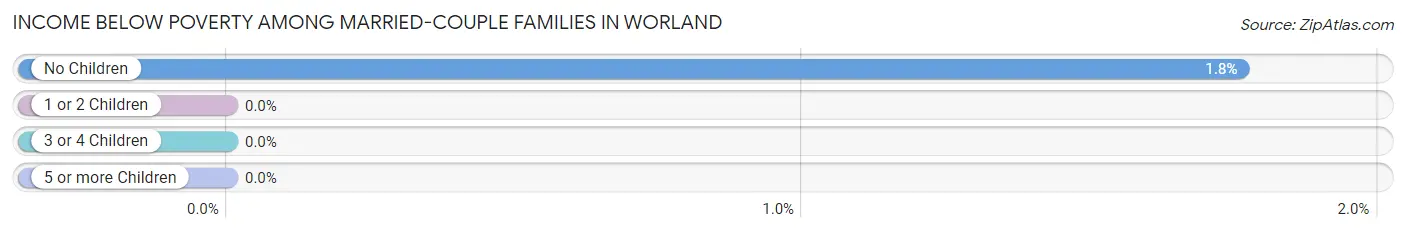
Income Below Poverty Among Married-Couple Families in Worland
The poverty statistics for married-couple families in Worland show that 1.1% or 9 of the total 848 families live below the poverty line. Families with no children have the highest poverty rate of 1.8%, comprising of 9 families. On the other hand, families with 1 or 2 children have the lowest poverty rate of 0.0%, which includes 0 families.
| Children | Above Poverty | Below Poverty |
| No Children | 502 (98.2%) | 9 (1.8%) |
| 1 or 2 Children | 183 (100.0%) | 0 (0.0%) |
| 3 or 4 Children | 106 (100.0%) | 0 (0.0%) |
| 5 or more Children | 48 (100.0%) | 0 (0.0%) |
| Total | 839 (98.9%) | 9 (1.1%) |
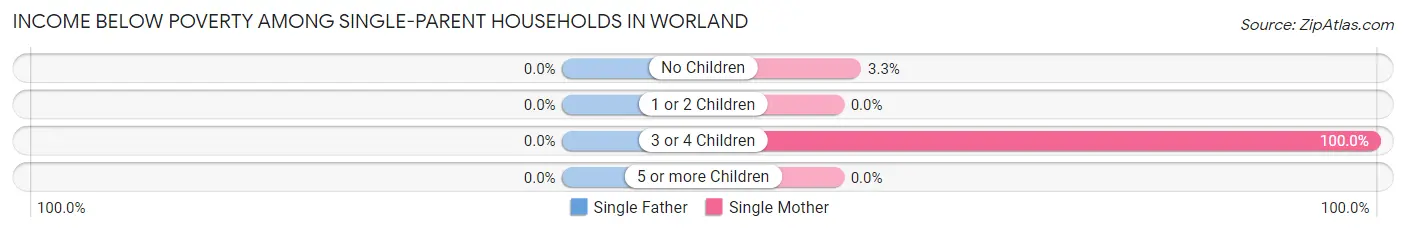
Income Below Poverty Among Single-Parent Households in Worland
| Children | Single Father | Single Mother |
| No Children | 0 (0.0%) | 4 (3.3%) |
| 1 or 2 Children | 0 (0.0%) | 0 (0.0%) |
| 3 or 4 Children | 0 (0.0%) | 20 (100.0%) |
| 5 or more Children | 0 (0.0%) | 0 (0.0%) |
| Total | 0 (0.0%) | 24 (7.8%) |
Income Below Poverty Among Married-Couple vs Single-Parent Households in Worland
The poverty data for Worland shows that 9 of the married-couple family households (1.1%) and 24 of the single-parent households (7.2%) are living below the poverty level. Within the married-couple family households, those with no children have the highest poverty rate, with 9 households (1.8%) falling below the poverty line. Among the single-parent households, those with 3 or 4 children have the highest poverty rate, with 20 household (52.6%) living below poverty.
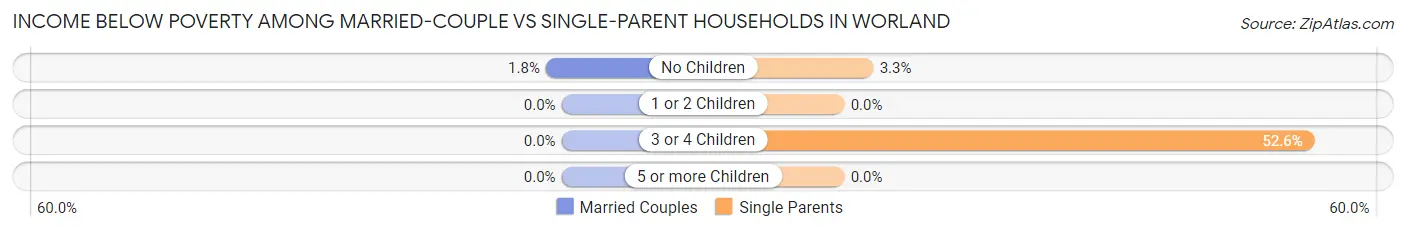
| Children | Married-Couple Families | Single-Parent Households |
| No Children | 9 (1.8%) | 4 (3.3%) |
| 1 or 2 Children | 0 (0.0%) | 0 (0.0%) |
| 3 or 4 Children | 0 (0.0%) | 20 (52.6%) |
| 5 or more Children | 0 (0.0%) | 0 (0.0%) |
| Total | 9 (1.1%) | 24 (7.2%) |
Race in Worland
The most populous races in Worland are White / Caucasian (3,937 | 81.8%), Hispanic or Latino (1,024 | 21.3%), and Two or more Races (563 | 11.7%).
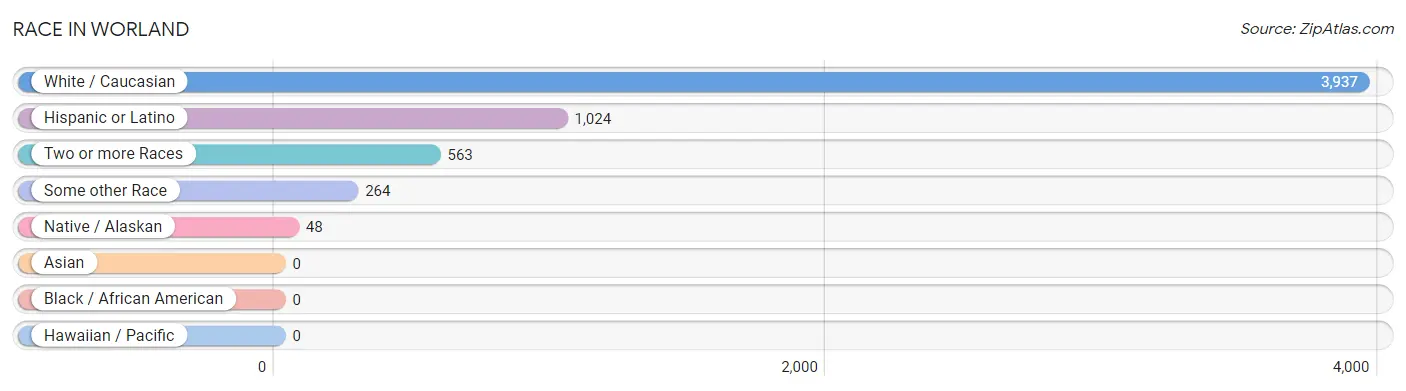
| Race | # Population | % Population |
| Asian | 0 | 0.0% |
| Black / African American | 0 | 0.0% |
| Hawaiian / Pacific | 0 | 0.0% |
| Hispanic or Latino | 1,024 | 21.3% |
| Native / Alaskan | 48 | 1.0% |
| White / Caucasian | 3,937 | 81.8% |
| Two or more Races | 563 | 11.7% |
| Some other Race | 264 | 5.5% |
| Total | 4,812 | 100.0% |
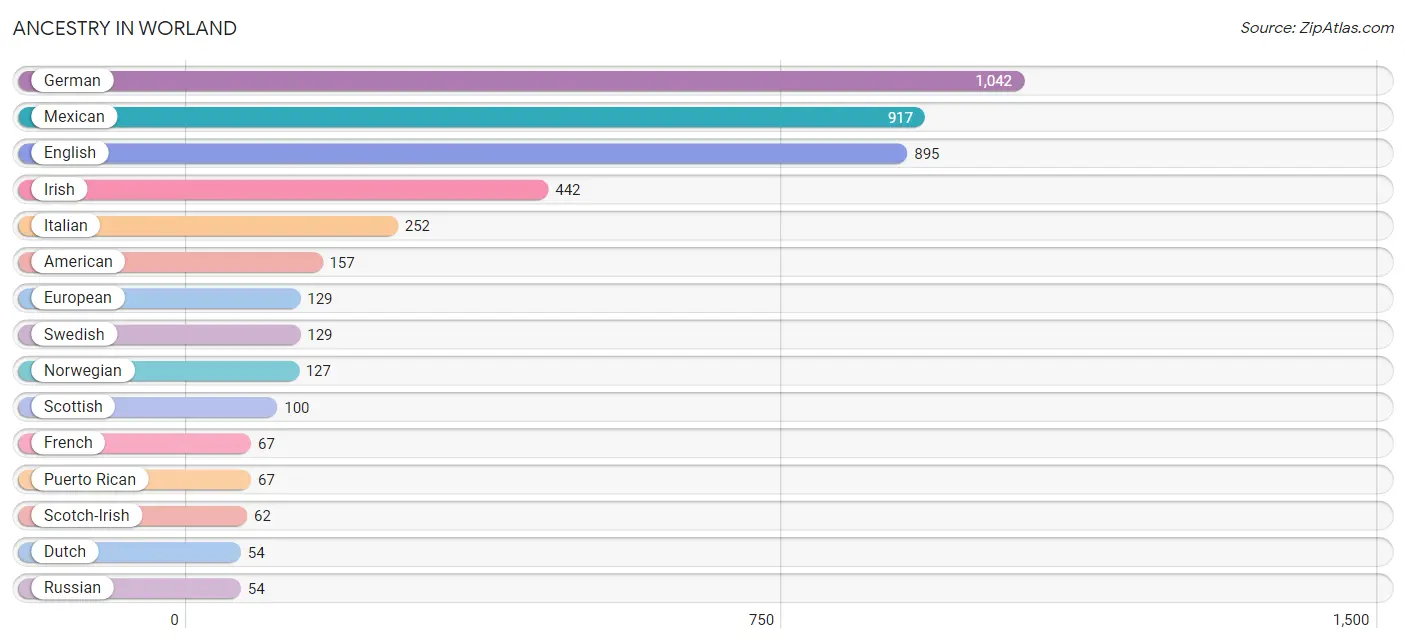
Ancestry in Worland
The most populous ancestries reported in Worland are German (1,042 | 21.6%), Mexican (917 | 19.1%), English (895 | 18.6%), Irish (442 | 9.2%), and Italian (252 | 5.2%), together accounting for 73.7% of all Worland residents.
| Ancestry | # Population | % Population |
| African | 37 | 0.8% |
| American | 157 | 3.3% |
| Arapaho | 6 | 0.1% |
| Basque | 7 | 0.2% |
| Belgian | 10 | 0.2% |
| British | 17 | 0.4% |
| Chilean | 1 | 0.0% |
| Czech | 25 | 0.5% |
| Danish | 23 | 0.5% |
| Dutch | 54 | 1.1% |
| English | 895 | 18.6% |
| European | 129 | 2.7% |
| Finnish | 13 | 0.3% |
| French | 67 | 1.4% |
| French Canadian | 6 | 0.1% |
| German | 1,042 | 21.6% |
| Greek | 14 | 0.3% |
| Hungarian | 7 | 0.2% |
| Irish | 442 | 9.2% |
| Italian | 252 | 5.2% |
| Lithuanian | 16 | 0.3% |
| Mexican | 917 | 19.1% |
| Mexican American Indian | 23 | 0.5% |
| Norwegian | 127 | 2.6% |
| Polish | 52 | 1.1% |
| Portuguese | 53 | 1.1% |
| Puerto Rican | 67 | 1.4% |
| Russian | 54 | 1.1% |
| Samoan | 44 | 0.9% |
| Scandinavian | 16 | 0.3% |
| Scotch-Irish | 62 | 1.3% |
| Scottish | 100 | 2.1% |
| South American | 1 | 0.0% |
| Spaniard | 28 | 0.6% |
| Spanish | 11 | 0.2% |
| Subsaharan African | 37 | 0.8% |
| Swedish | 129 | 2.7% |
| Swiss | 7 | 0.2% |
| Welsh | 4 | 0.1% |
| Yugoslavian | 10 | 0.2% | View All 40 Rows |
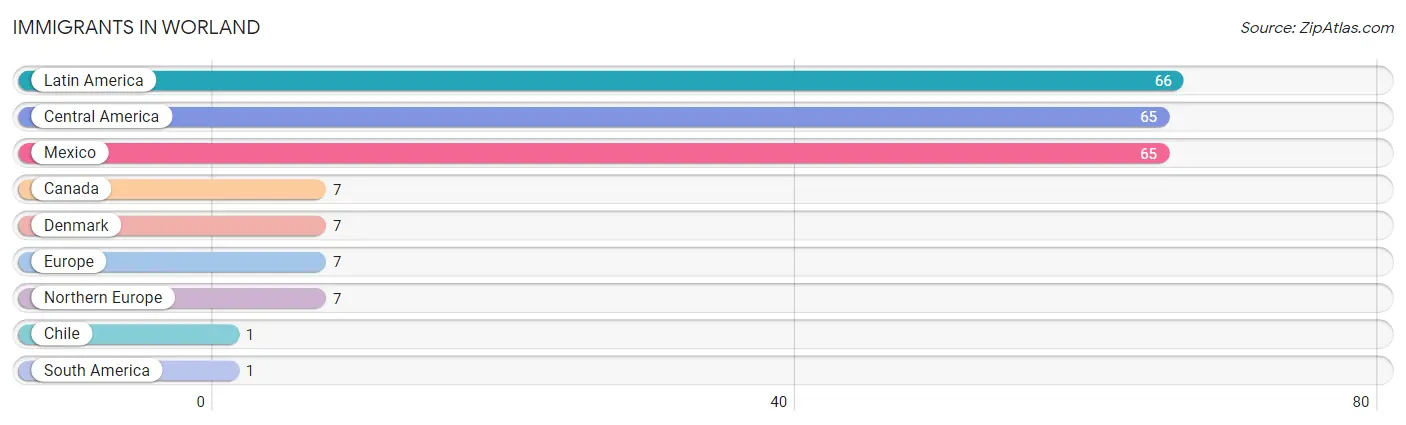
Immigrants in Worland
The most numerous immigrant groups reported in Worland came from Latin America (66 | 1.4%), Central America (65 | 1.3%), Mexico (65 | 1.3%), Canada (7 | 0.2%), and Denmark (7 | 0.2%), together accounting for 4.4% of all Worland residents.
| Immigration Origin | # Population | % Population |
| Canada | 7 | 0.2% |
| Central America | 65 | 1.3% |
| Chile | 1 | 0.0% |
| Denmark | 7 | 0.2% |
| Europe | 7 | 0.2% |
| Latin America | 66 | 1.4% |
| Mexico | 65 | 1.3% |
| Northern Europe | 7 | 0.2% |
| South America | 1 | 0.0% | View All 9 Rows |
Sex and Age in Worland
Sex and Age in Worland
The most populous age groups in Worland are 65 to 69 Years (267 | 10.6%) for men and 60 to 64 Years (264 | 11.5%) for women.
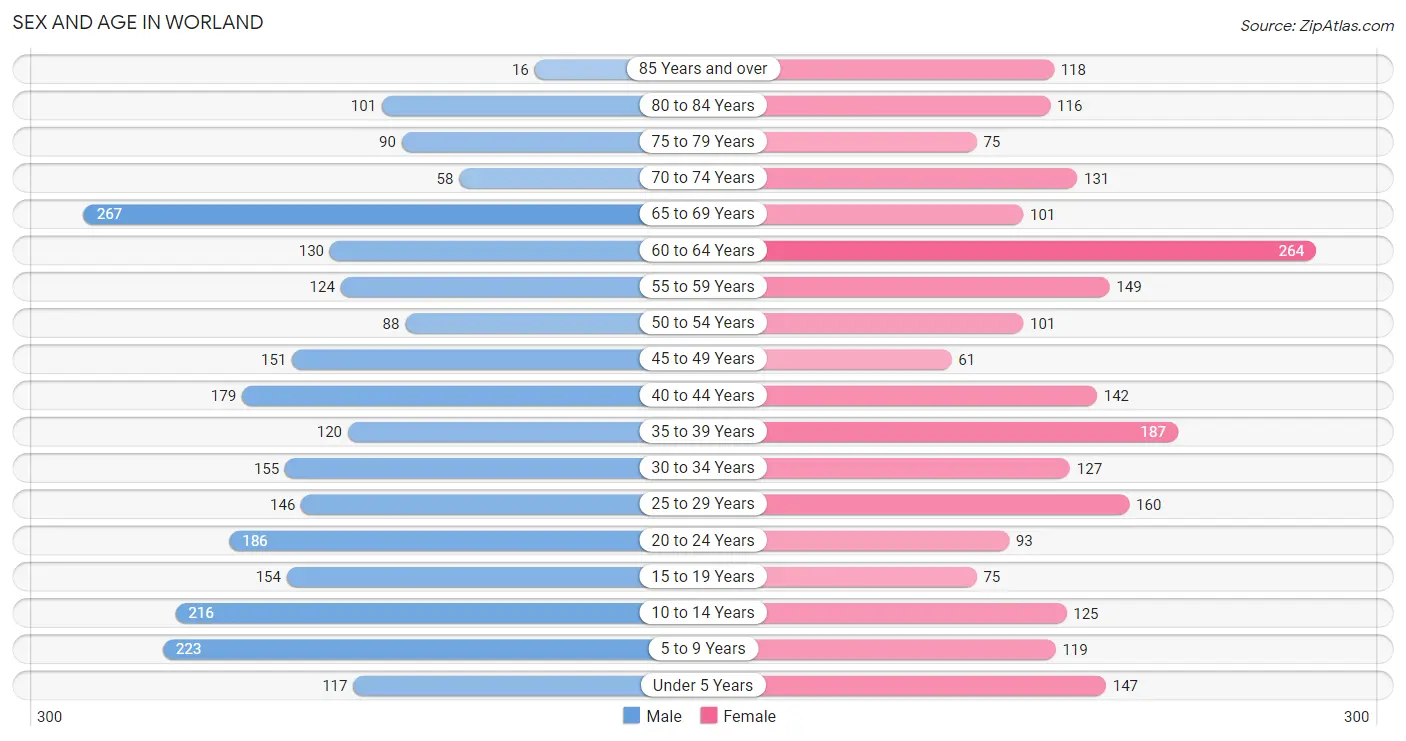
| Age Bracket | Male | Female |
| Under 5 Years | 117 (4.6%) | 147 (6.4%) |
| 5 to 9 Years | 223 (8.8%) | 119 (5.2%) |
| 10 to 14 Years | 216 (8.6%) | 125 (5.5%) |
| 15 to 19 Years | 154 (6.1%) | 75 (3.3%) |
| 20 to 24 Years | 186 (7.4%) | 93 (4.1%) |
| 25 to 29 Years | 146 (5.8%) | 160 (7.0%) |
| 30 to 34 Years | 155 (6.1%) | 127 (5.5%) |
| 35 to 39 Years | 120 (4.8%) | 187 (8.2%) |
| 40 to 44 Years | 179 (7.1%) | 142 (6.2%) |
| 45 to 49 Years | 151 (6.0%) | 61 (2.7%) |
| 50 to 54 Years | 88 (3.5%) | 101 (4.4%) |
| 55 to 59 Years | 124 (4.9%) | 149 (6.5%) |
| 60 to 64 Years | 130 (5.2%) | 264 (11.5%) |
| 65 to 69 Years | 267 (10.6%) | 101 (4.4%) |
| 70 to 74 Years | 58 (2.3%) | 131 (5.7%) |
| 75 to 79 Years | 90 (3.6%) | 75 (3.3%) |
| 80 to 84 Years | 101 (4.0%) | 116 (5.1%) |
| 85 Years and over | 16 (0.6%) | 118 (5.1%) |
| Total | 2,521 (100.0%) | 2,291 (100.0%) |
Families and Households in Worland
Median Family Size in Worland
The median family size in Worland is 2.90 persons per family, with married-couple families (848 | 71.7%) accounting for the largest median family size of 3.16 persons per family. On the other hand, single male/father families (26 | 2.2%) represent the smallest median family size with 2.04 persons per family.
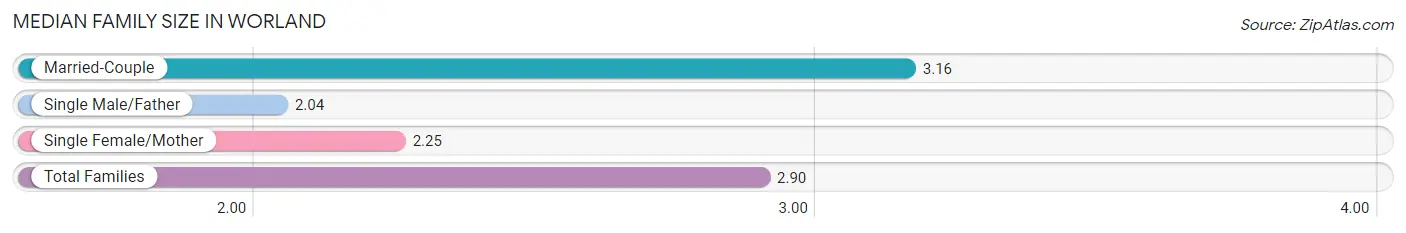
| Family Type | # Families | Family Size |
| Married-Couple | 848 (71.7%) | 3.16 |
| Single Male/Father | 26 (2.2%) | 2.04 |
| Single Female/Mother | 309 (26.1%) | 2.25 |
| Total Families | 1,183 (100.0%) | 2.90 |
Median Household Size in Worland
The median household size in Worland is 2.16 persons per household, with single male/father households (26 | 1.2%) accounting for the largest median household size of 3.96 persons per household. non-family households (991 | 45.6%) represent the smallest median household size with 1.06 persons per household.
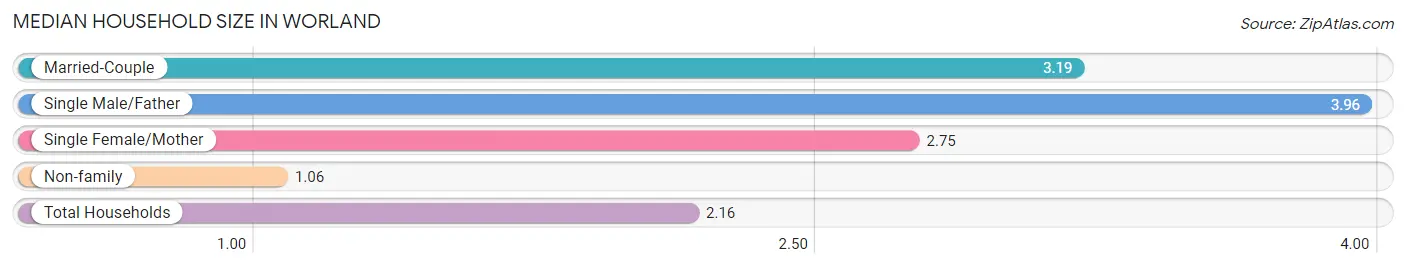
| Household Type | # Households | Household Size |
| Married-Couple | 848 (39.0%) | 3.19 |
| Single Male/Father | 26 (1.2%) | 3.96 |
| Single Female/Mother | 309 (14.2%) | 2.75 |
| Non-family | 991 (45.6%) | 1.06 |
| Total Households | 2,174 (100.0%) | 2.16 |
Household Size by Marriage Status in Worland
Out of a total of 2,174 households in Worland, 1,183 (54.4%) are family households, while 991 (45.6%) are nonfamily households. The most numerous type of family households are 2-person households, comprising 553, and the most common type of nonfamily households are 1-person households, comprising 910.
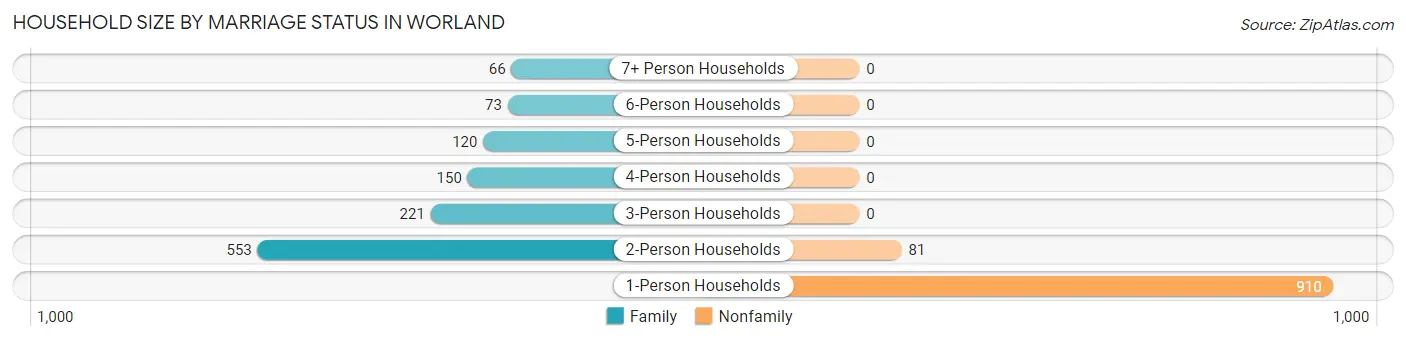
| Household Size | Family Households | Nonfamily Households |
| 1-Person Households | - | 910 (41.9%) |
| 2-Person Households | 553 (25.4%) | 81 (3.7%) |
| 3-Person Households | 221 (10.2%) | 0 (0.0%) |
| 4-Person Households | 150 (6.9%) | 0 (0.0%) |
| 5-Person Households | 120 (5.5%) | 0 (0.0%) |
| 6-Person Households | 73 (3.4%) | 0 (0.0%) |
| 7+ Person Households | 66 (3.0%) | 0 (0.0%) |
| Total | 1,183 (54.4%) | 991 (45.6%) |
Female Fertility in Worland
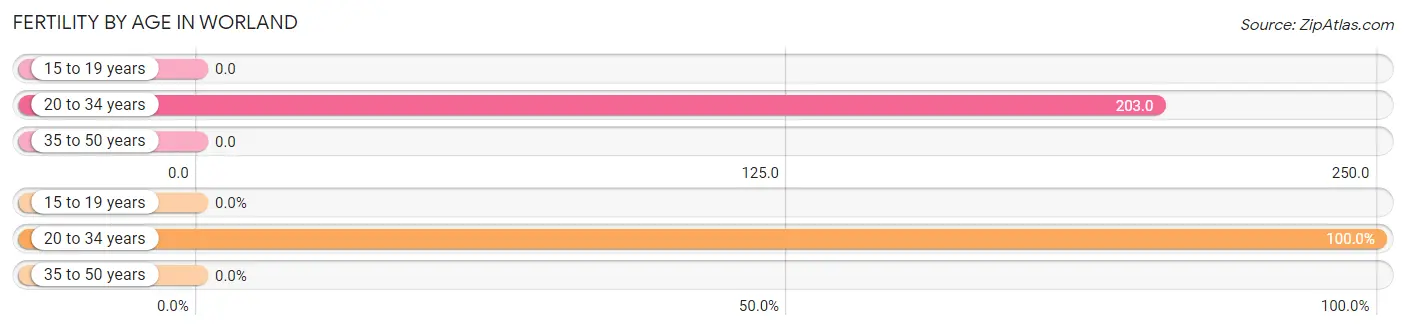
Fertility by Age in Worland
Average fertility rate in Worland is 88.0 births per 1,000 women. Women in the age bracket of 20 to 34 years have the highest fertility rate with 203.0 births per 1,000 women. Women in the age bracket of 20 to 34 years acount for 100.0% of all women with births.
| Age Bracket | Women with Births | Births / 1,000 Women |
| 15 to 19 years | 0 (0.0%) | 0.0 |
| 20 to 34 years | 77 (100.0%) | 203.0 |
| 35 to 50 years | 0 (0.0%) | 0.0 |
| Total | 77 (100.0%) | 88.0 |
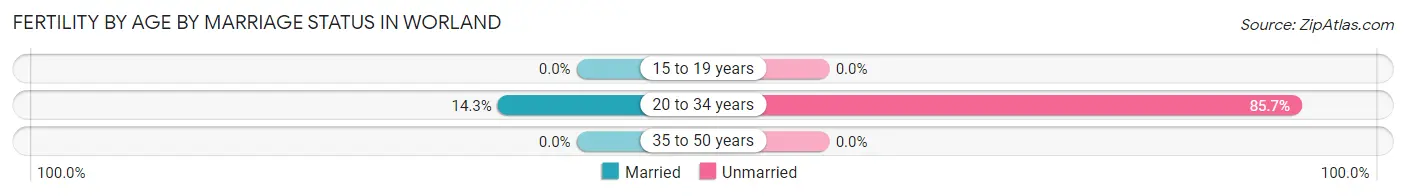
Fertility by Age by Marriage Status in Worland
14.3% of women with births (77) in Worland are married. The highest percentage of unmarried women with births falls into 20 to 34 years age bracket with 85.7% of them unmarried at the time of birth, while the lowest percentage of unmarried women with births belong to 20 to 34 years age bracket with 85.7% of them unmarried.
| Age Bracket | Married | Unmarried |
| 15 to 19 years | 0 (0.0%) | 0 (0.0%) |
| 20 to 34 years | 11 (14.3%) | 66 (85.7%) |
| 35 to 50 years | 0 (0.0%) | 0 (0.0%) |
| Total | 11 (14.3%) | 66 (85.7%) |
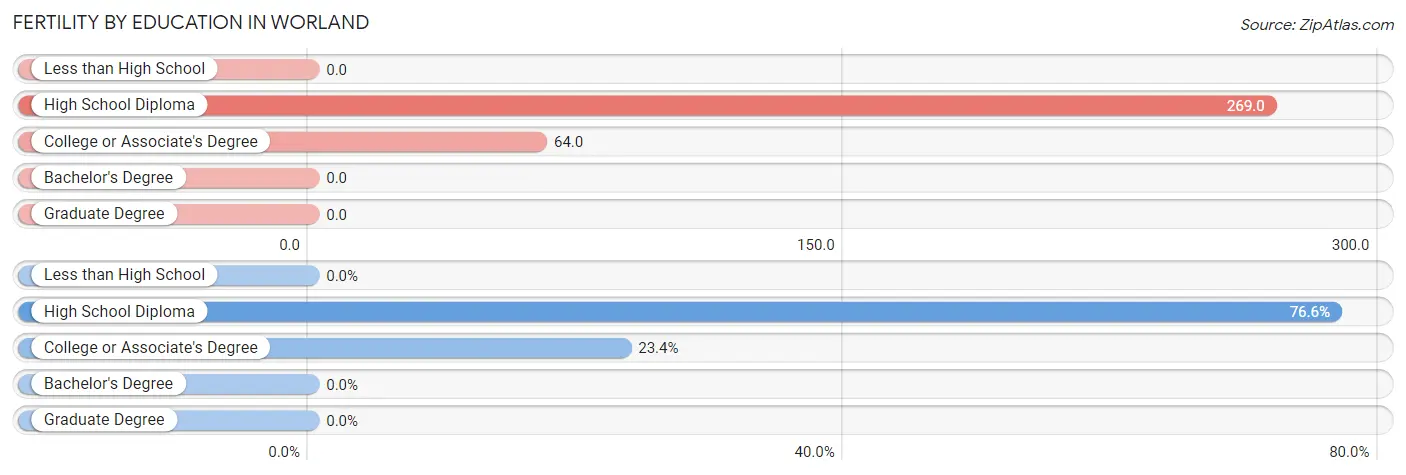
Fertility by Education in Worland
| Educational Attainment | Women with Births | Births / 1,000 Women |
| Less than High School | 0 (0.0%) | 0.0 |
| High School Diploma | 59 (76.6%) | 269.0 |
| College or Associate's Degree | 18 (23.4%) | 64.0 |
| Bachelor's Degree | 0 (0.0%) | 0.0 |
| Graduate Degree | 0 (0.0%) | 0.0 |
| Total | 77 (100.0%) | 88.0 |
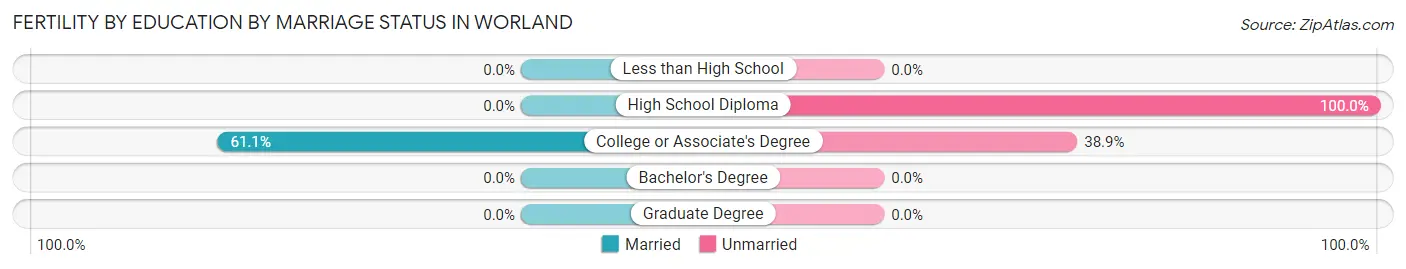
Fertility by Education by Marriage Status in Worland
85.7% of women with births in Worland are unmarried. Women with the educational attainment of college or associate's degree are most likely to be married with 61.1% of them married at childbirth, while women with the educational attainment of high school diploma are least likely to be married with 100.0% of them unmarried at childbirth.
| Educational Attainment | Married | Unmarried |
| Less than High School | 0 (0.0%) | 0 (0.0%) |
| High School Diploma | 0 (0.0%) | 59 (100.0%) |
| College or Associate's Degree | 11 (61.1%) | 7 (38.9%) |
| Bachelor's Degree | 0 (0.0%) | 0 (0.0%) |
| Graduate Degree | 0 (0.0%) | 0 (0.0%) |
| Total | 11 (14.3%) | 66 (85.7%) |
Employment Characteristics in Worland
Employment by Class of Employer in Worland
Among the 2,377 employed individuals in Worland, private company employees (1,414 | 59.5%), local government employees (246 | 10.3%), and not-for-profit organizations (235 | 9.9%) make up the most common classes of employment.
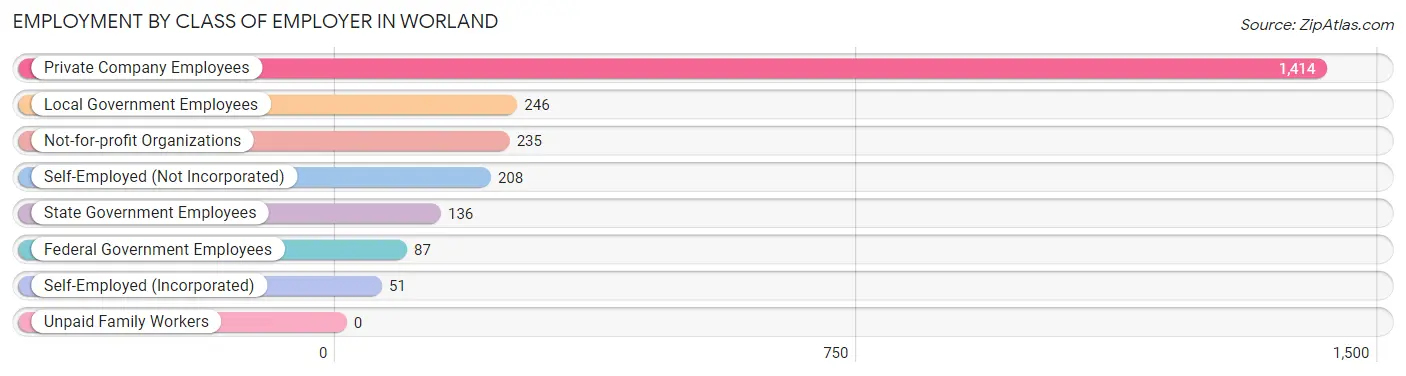
| Employer Class | # Employees | % Employees |
| Private Company Employees | 1,414 | 59.5% |
| Self-Employed (Incorporated) | 51 | 2.1% |
| Self-Employed (Not Incorporated) | 208 | 8.7% |
| Not-for-profit Organizations | 235 | 9.9% |
| Local Government Employees | 246 | 10.3% |
| State Government Employees | 136 | 5.7% |
| Federal Government Employees | 87 | 3.7% |
| Unpaid Family Workers | 0 | 0.0% |
| Total | 2,377 | 100.0% |
Employment Status by Age in Worland
According to the labor force statistics for Worland, out of the total population over 16 years of age (3,811), 67.1% or 2,557 individuals are in the labor force, with 1.9% or 49 of them unemployed. The age group with the highest labor force participation rate is 55 to 59 years, with 99.6% or 272 individuals in the labor force. Within the labor force, the 60 to 64 years age range has the highest percentage of unemployed individuals, with 8.2% or 21 of them being unemployed.
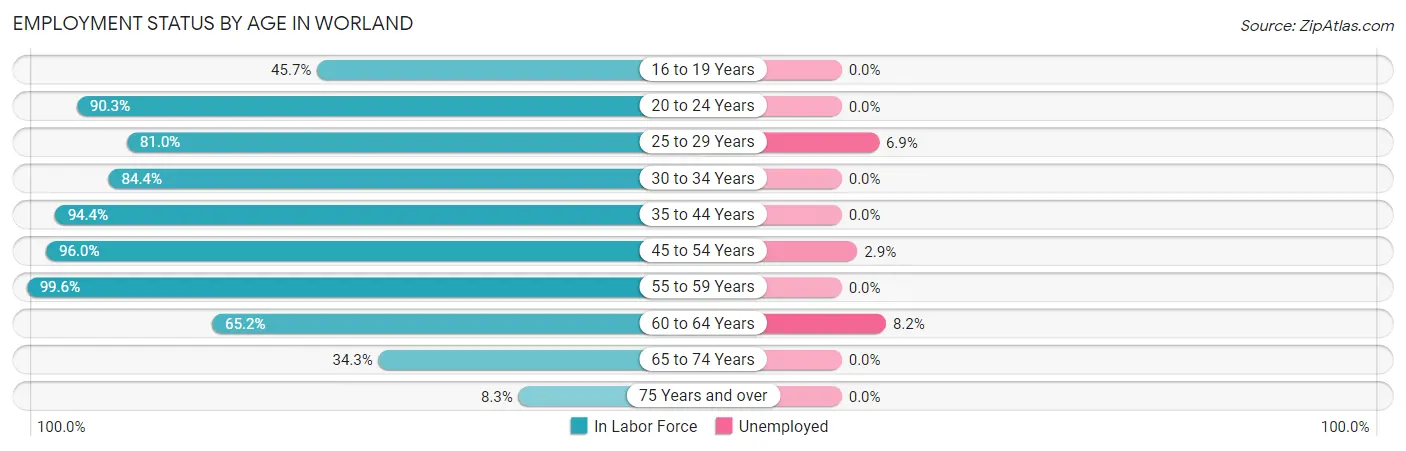
| Age Bracket | In Labor Force | Unemployed |
| 16 to 19 Years | 80 (45.7%) | 0 (0.0%) |
| 20 to 24 Years | 252 (90.3%) | 0 (0.0%) |
| 25 to 29 Years | 248 (81.0%) | 17 (6.9%) |
| 30 to 34 Years | 238 (84.4%) | 0 (0.0%) |
| 35 to 44 Years | 593 (94.4%) | 0 (0.0%) |
| 45 to 54 Years | 385 (96.0%) | 11 (2.9%) |
| 55 to 59 Years | 272 (99.6%) | 0 (0.0%) |
| 60 to 64 Years | 257 (65.2%) | 21 (8.2%) |
| 65 to 74 Years | 191 (34.3%) | 0 (0.0%) |
| 75 Years and over | 43 (8.3%) | 0 (0.0%) |
| Total | 2,557 (67.1%) | 49 (1.9%) |
Employment Status by Educational Attainment in Worland
According to labor force statistics for Worland, 87.3% of individuals (1,994) out of the total population between 25 and 64 years of age (2,284) are in the labor force, with 2.5% or 50 of them being unemployed. The group with the highest labor force participation rate are those with the educational attainment of bachelor's degree or higher, with 90.8% or 443 individuals in the labor force. Within the labor force, individuals with college / associate degree education have the highest percentage of unemployment, with 4.1% or 38 of them being unemployed.
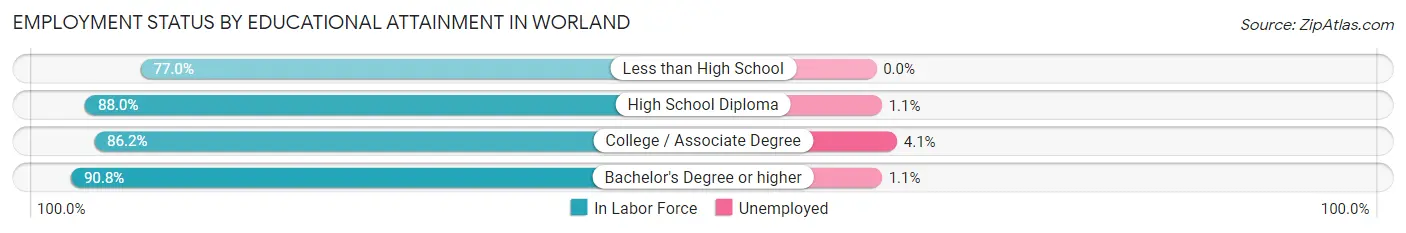
| Educational Attainment | In Labor Force | Unemployed |
| Less than High School | 77 (77.0%) | 0 (0.0%) |
| High School Diploma | 537 (88.0%) | 7 (1.1%) |
| College / Associate Degree | 936 (86.2%) | 45 (4.1%) |
| Bachelor's Degree or higher | 443 (90.8%) | 5 (1.1%) |
| Total | 1,994 (87.3%) | 57 (2.5%) |
Employment Occupations by Sex in Worland
Management, Business, Science and Arts Occupations
The most common Management, Business, Science and Arts occupations in Worland are Community & Social Service (270 | 10.8%), Management (229 | 9.1%), Education Instruction & Library (204 | 8.1%), Health Diagnosing & Treating (191 | 7.6%), and Health Technologists (154 | 6.1%).
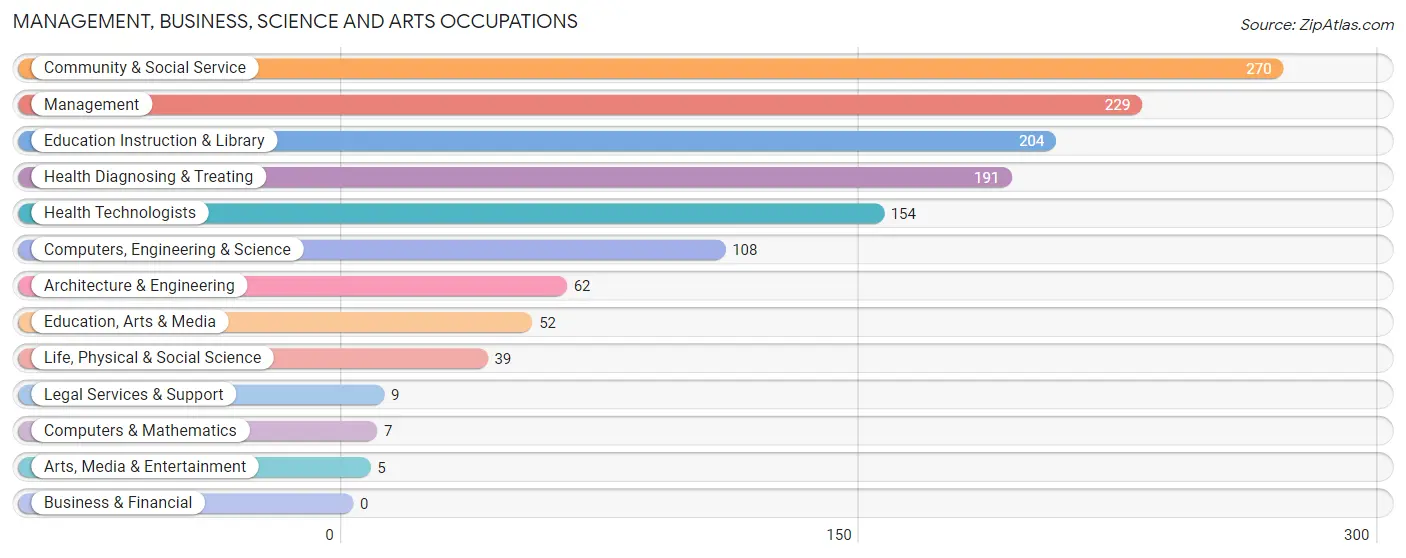
Management, Business, Science and Arts Occupations by Sex
Within the Management, Business, Science and Arts occupations in Worland, the most male-oriented occupations are Computers & Mathematics (100.0%), Architecture & Engineering (100.0%), and Legal Services & Support (100.0%), while the most female-oriented occupations are Arts, Media & Entertainment (100.0%), Health Diagnosing & Treating (100.0%), and Health Technologists (100.0%).
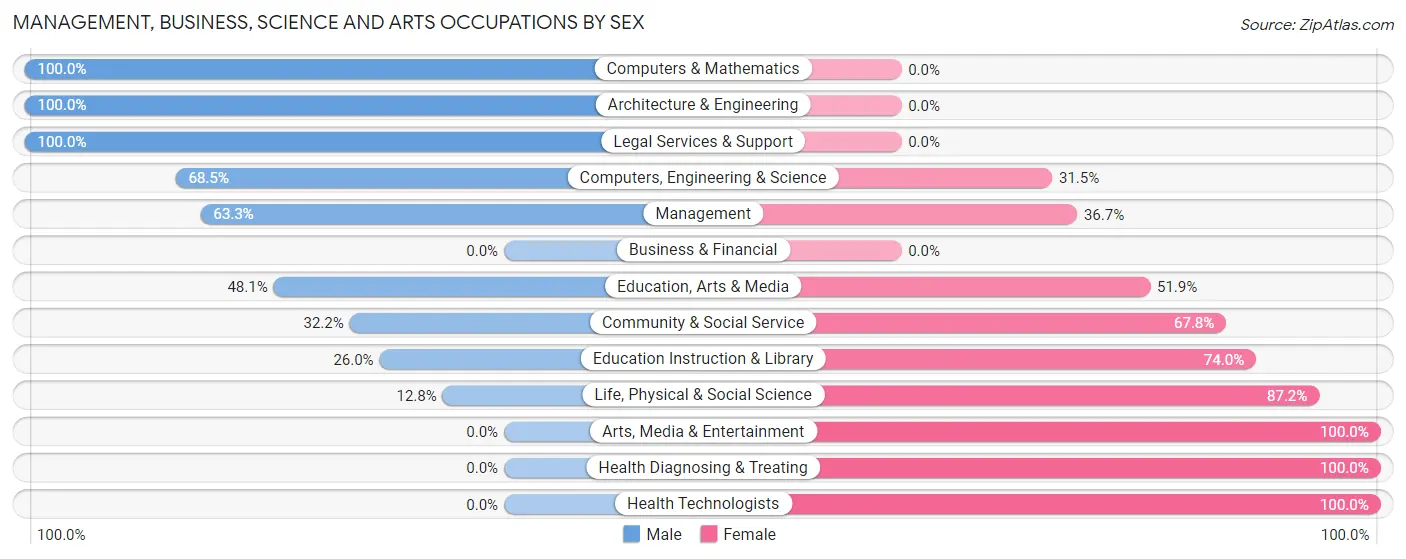
| Occupation | Male | Female |
| Management | 145 (63.3%) | 84 (36.7%) |
| Business & Financial | 0 (0.0%) | 0 (0.0%) |
| Computers, Engineering & Science | 74 (68.5%) | 34 (31.5%) |
| Computers & Mathematics | 7 (100.0%) | 0 (0.0%) |
| Architecture & Engineering | 62 (100.0%) | 0 (0.0%) |
| Life, Physical & Social Science | 5 (12.8%) | 34 (87.2%) |
| Community & Social Service | 87 (32.2%) | 183 (67.8%) |
| Education, Arts & Media | 25 (48.1%) | 27 (51.9%) |
| Legal Services & Support | 9 (100.0%) | 0 (0.0%) |
| Education Instruction & Library | 53 (26.0%) | 151 (74.0%) |
| Arts, Media & Entertainment | 0 (0.0%) | 5 (100.0%) |
| Health Diagnosing & Treating | 0 (0.0%) | 191 (100.0%) |
| Health Technologists | 0 (0.0%) | 154 (100.0%) |
| Total (Category) | 306 (38.4%) | 492 (61.7%) |
| Total (Overall) | 1,203 (47.9%) | 1,307 (52.1%) |
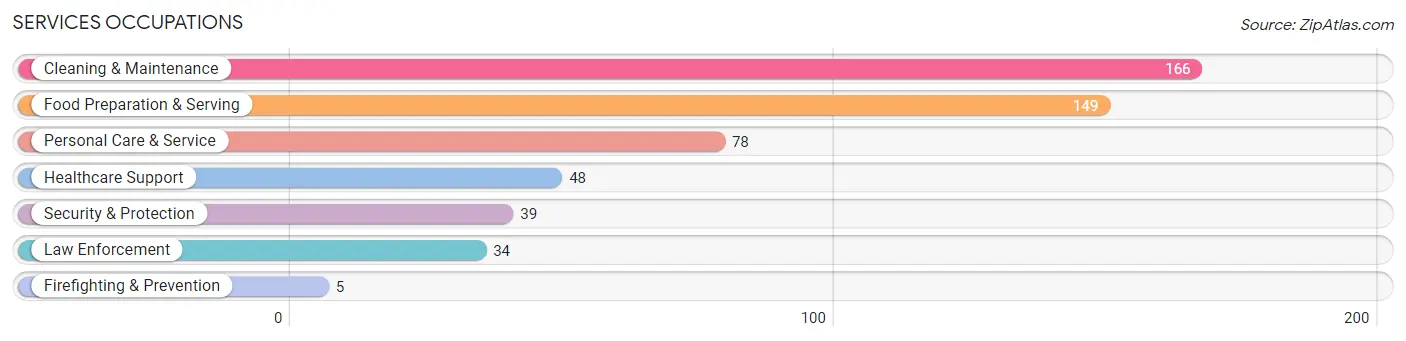
Services Occupations
The most common Services occupations in Worland are Cleaning & Maintenance (166 | 6.6%), Food Preparation & Serving (149 | 5.9%), Personal Care & Service (78 | 3.1%), Healthcare Support (48 | 1.9%), and Security & Protection (39 | 1.5%).
Services Occupations by Sex
Within the Services occupations in Worland, the most male-oriented occupations are Law Enforcement (100.0%), Security & Protection (87.2%), and Cleaning & Maintenance (63.9%), while the most female-oriented occupations are Healthcare Support (100.0%), Firefighting & Prevention (100.0%), and Personal Care & Service (100.0%).
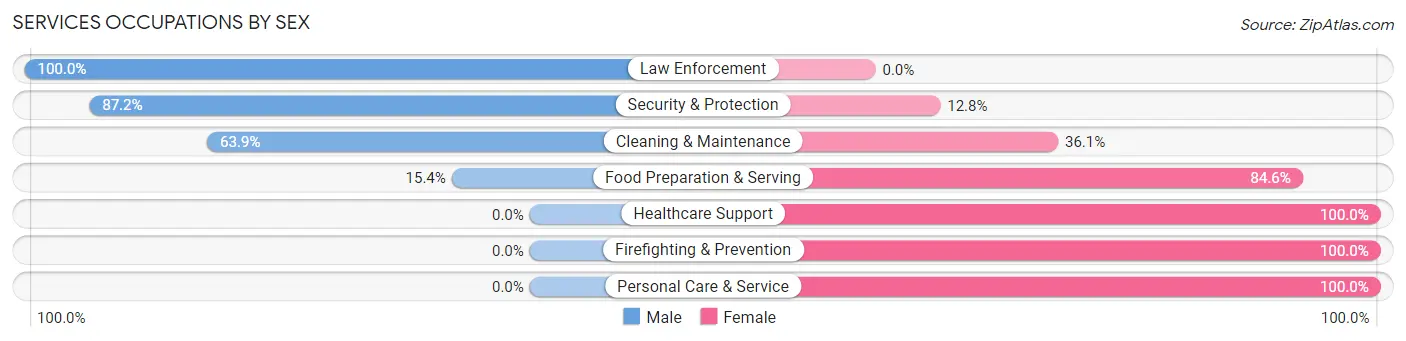
| Occupation | Male | Female |
| Healthcare Support | 0 (0.0%) | 48 (100.0%) |
| Security & Protection | 34 (87.2%) | 5 (12.8%) |
| Firefighting & Prevention | 0 (0.0%) | 5 (100.0%) |
| Law Enforcement | 34 (100.0%) | 0 (0.0%) |
| Food Preparation & Serving | 23 (15.4%) | 126 (84.6%) |
| Cleaning & Maintenance | 106 (63.9%) | 60 (36.1%) |
| Personal Care & Service | 0 (0.0%) | 78 (100.0%) |
| Total (Category) | 163 (34.0%) | 317 (66.0%) |
| Total (Overall) | 1,203 (47.9%) | 1,307 (52.1%) |
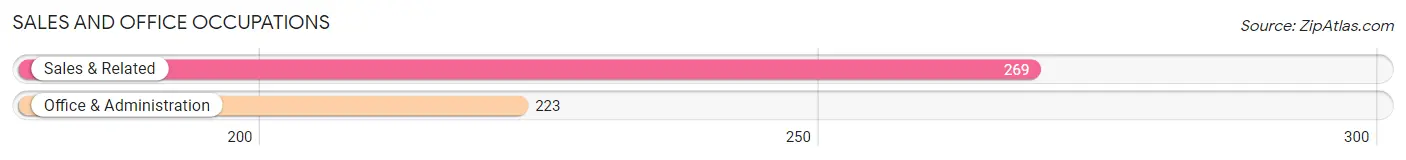
Sales and Office Occupations
The most common Sales and Office occupations in Worland are Sales & Related (269 | 10.7%), and Office & Administration (223 | 8.9%).
Sales and Office Occupations by Sex
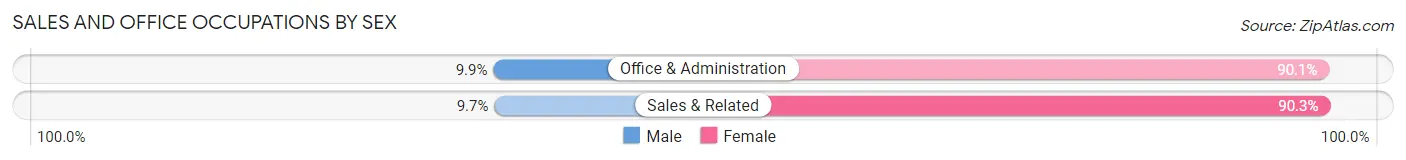
| Occupation | Male | Female |
| Sales & Related | 26 (9.7%) | 243 (90.3%) |
| Office & Administration | 22 (9.9%) | 201 (90.1%) |
| Total (Category) | 48 (9.8%) | 444 (90.2%) |
| Total (Overall) | 1,203 (47.9%) | 1,307 (52.1%) |
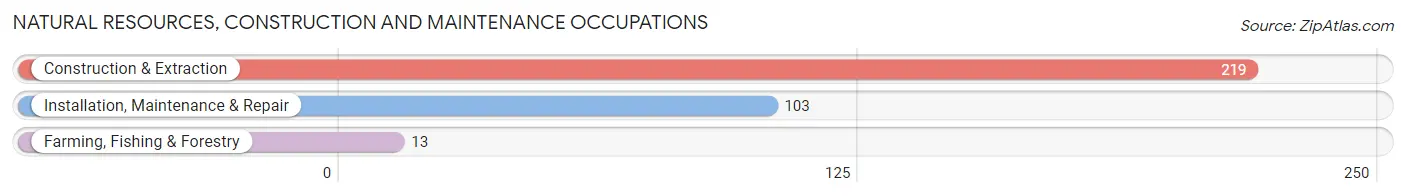
Natural Resources, Construction and Maintenance Occupations
The most common Natural Resources, Construction and Maintenance occupations in Worland are Construction & Extraction (219 | 8.7%), Installation, Maintenance & Repair (103 | 4.1%), and Farming, Fishing & Forestry (13 | 0.5%).
Natural Resources, Construction and Maintenance Occupations by Sex
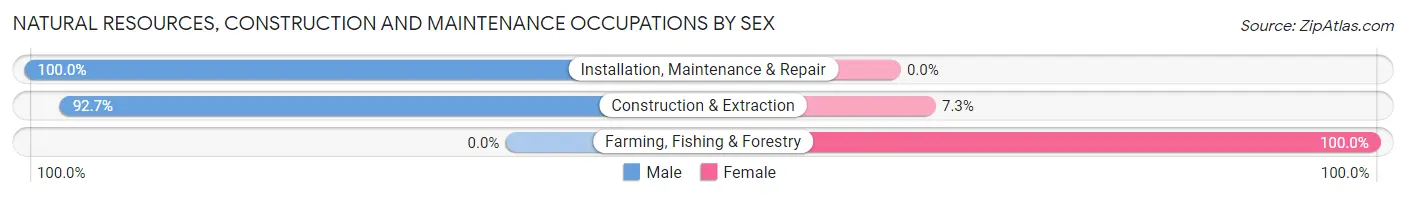
| Occupation | Male | Female |
| Farming, Fishing & Forestry | 0 (0.0%) | 13 (100.0%) |
| Construction & Extraction | 203 (92.7%) | 16 (7.3%) |
| Installation, Maintenance & Repair | 103 (100.0%) | 0 (0.0%) |
| Total (Category) | 306 (91.3%) | 29 (8.7%) |
| Total (Overall) | 1,203 (47.9%) | 1,307 (52.1%) |
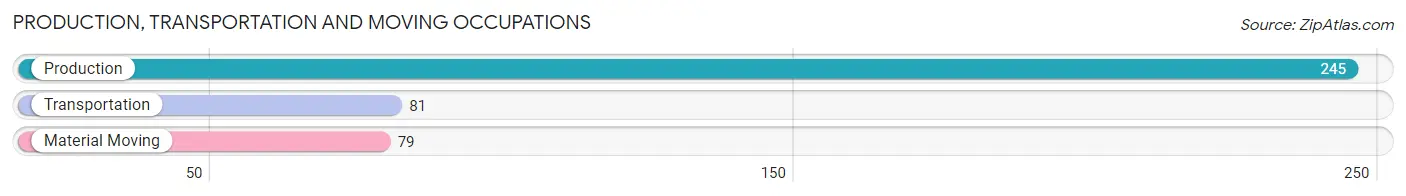
Production, Transportation and Moving Occupations
The most common Production, Transportation and Moving occupations in Worland are Production (245 | 9.8%), Transportation (81 | 3.2%), and Material Moving (79 | 3.2%).
Production, Transportation and Moving Occupations by Sex
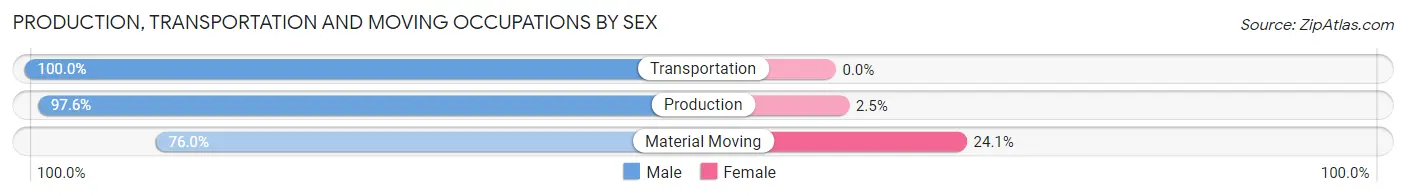
| Occupation | Male | Female |
| Production | 239 (97.6%) | 6 (2.5%) |
| Transportation | 81 (100.0%) | 0 (0.0%) |
| Material Moving | 60 (75.9%) | 19 (24.0%) |
| Total (Category) | 380 (93.8%) | 25 (6.2%) |
| Total (Overall) | 1,203 (47.9%) | 1,307 (52.1%) |
Employment Industries by Sex in Worland
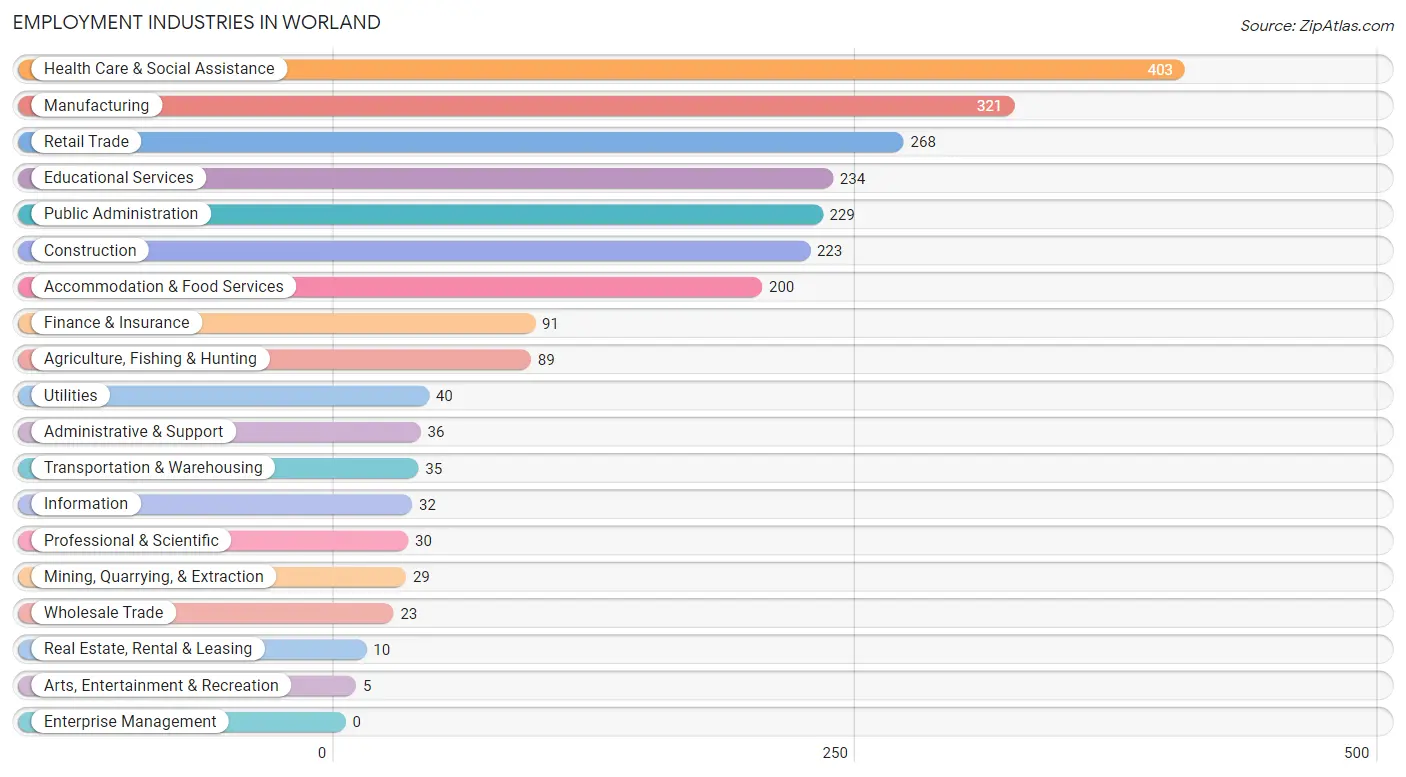
Employment Industries in Worland
The major employment industries in Worland include Health Care & Social Assistance (403 | 16.1%), Manufacturing (321 | 12.8%), Retail Trade (268 | 10.7%), Educational Services (234 | 9.3%), and Public Administration (229 | 9.1%).
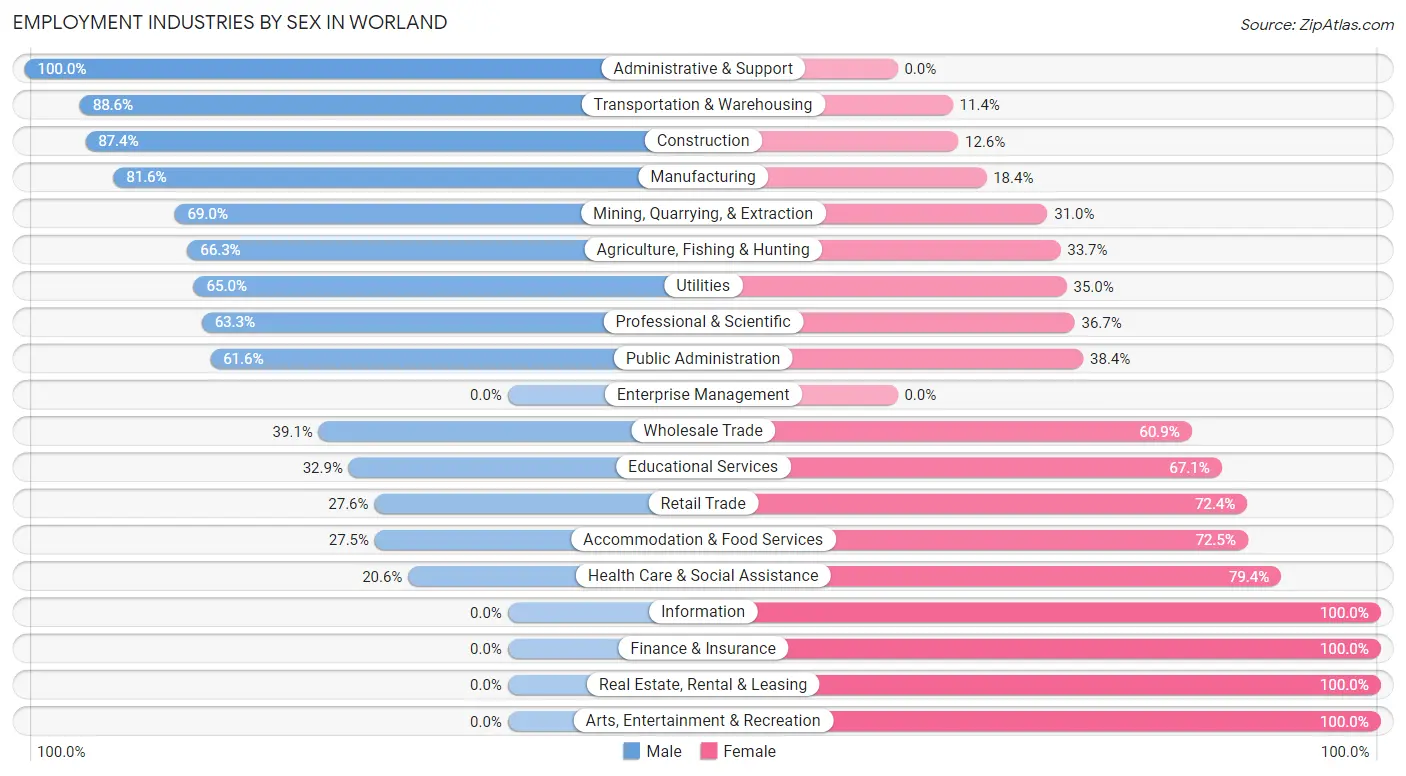
Employment Industries by Sex in Worland
The Worland industries that see more men than women are Administrative & Support (100.0%), Transportation & Warehousing (88.6%), and Construction (87.4%), whereas the industries that tend to have a higher number of women are Information (100.0%), Finance & Insurance (100.0%), and Real Estate, Rental & Leasing (100.0%).
| Industry | Male | Female |
| Agriculture, Fishing & Hunting | 59 (66.3%) | 30 (33.7%) |
| Mining, Quarrying, & Extraction | 20 (69.0%) | 9 (31.0%) |
| Construction | 195 (87.4%) | 28 (12.6%) |
| Manufacturing | 262 (81.6%) | 59 (18.4%) |
| Wholesale Trade | 9 (39.1%) | 14 (60.9%) |
| Retail Trade | 74 (27.6%) | 194 (72.4%) |
| Transportation & Warehousing | 31 (88.6%) | 4 (11.4%) |
| Utilities | 26 (65.0%) | 14 (35.0%) |
| Information | 0 (0.0%) | 32 (100.0%) |
| Finance & Insurance | 0 (0.0%) | 91 (100.0%) |
| Real Estate, Rental & Leasing | 0 (0.0%) | 10 (100.0%) |
| Professional & Scientific | 19 (63.3%) | 11 (36.7%) |
| Enterprise Management | 0 (0.0%) | 0 (0.0%) |
| Administrative & Support | 36 (100.0%) | 0 (0.0%) |
| Educational Services | 77 (32.9%) | 157 (67.1%) |
| Health Care & Social Assistance | 83 (20.6%) | 320 (79.4%) |
| Arts, Entertainment & Recreation | 0 (0.0%) | 5 (100.0%) |
| Accommodation & Food Services | 55 (27.5%) | 145 (72.5%) |
| Public Administration | 141 (61.6%) | 88 (38.4%) |
| Total | 1,203 (47.9%) | 1,307 (52.1%) |
Education in Worland
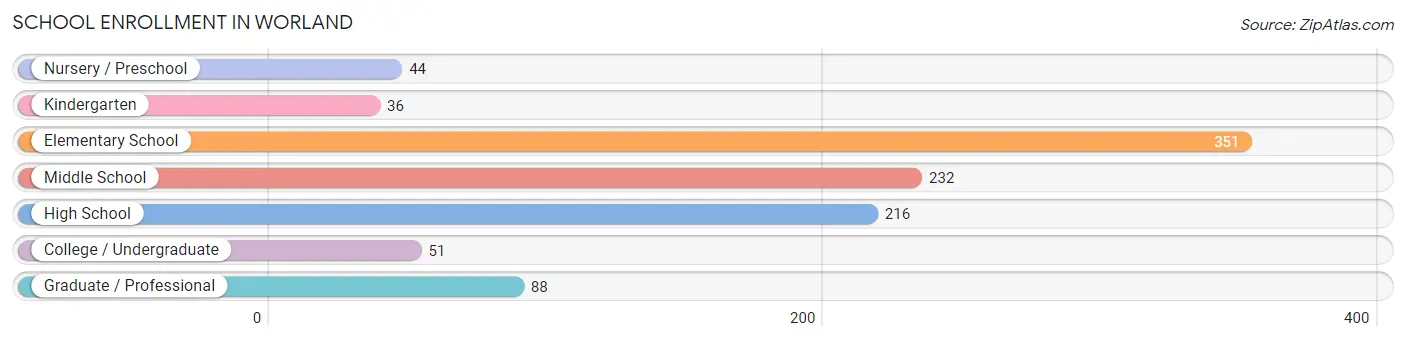
School Enrollment in Worland
The most common levels of schooling among the 1,018 students in Worland are elementary school (351 | 34.5%), middle school (232 | 22.8%), and high school (216 | 21.2%).
| School Level | # Students | % Students |
| Nursery / Preschool | 44 | 4.3% |
| Kindergarten | 36 | 3.5% |
| Elementary School | 351 | 34.5% |
| Middle School | 232 | 22.8% |
| High School | 216 | 21.2% |
| College / Undergraduate | 51 | 5.0% |
| Graduate / Professional | 88 | 8.6% |
| Total | 1,018 | 100.0% |
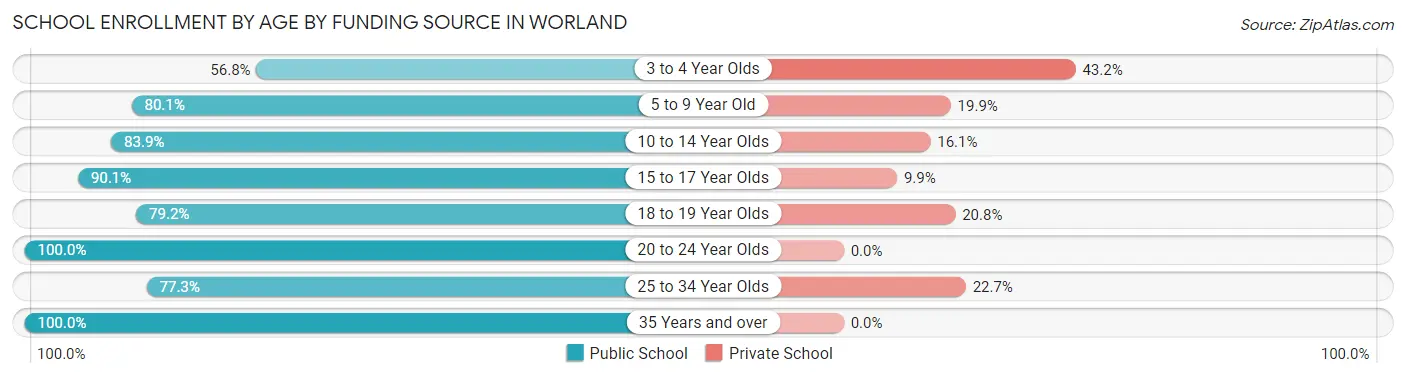
School Enrollment by Age by Funding Source in Worland
Out of a total of 1,018 students who are enrolled in schools in Worland, 164 (16.1%) attend a private institution, while the remaining 854 (83.9%) are enrolled in public schools. The age group of 3 to 4 year olds has the highest likelihood of being enrolled in private schools, with 19 (43.2% in the age bracket) enrolled. Conversely, the age group of 20 to 24 year olds has the lowest likelihood of being enrolled in a private school, with 64 (100.0% in the age bracket) attending a public institution.
| Age Bracket | Public School | Private School |
| 3 to 4 Year Olds | 25 (56.8%) | 19 (43.2%) |
| 5 to 9 Year Old | 221 (80.1%) | 55 (19.9%) |
| 10 to 14 Year Olds | 286 (83.9%) | 55 (16.1%) |
| 15 to 17 Year Olds | 127 (90.1%) | 14 (9.9%) |
| 18 to 19 Year Olds | 61 (79.2%) | 16 (20.8%) |
| 20 to 24 Year Olds | 64 (100.0%) | 0 (0.0%) |
| 25 to 34 Year Olds | 17 (77.3%) | 5 (22.7%) |
| 35 Years and over | 53 (100.0%) | 0 (0.0%) |
| Total | 854 (83.9%) | 164 (16.1%) |
Educational Attainment by Field of Study in Worland
Education (214 | 25.9%), arts & humanities (100 | 12.1%), bio, nature & agricultural (92 | 11.1%), science & technology (92 | 11.1%), and business (67 | 8.1%) are the most common fields of study among 828 individuals in Worland who have obtained a bachelor's degree or higher.
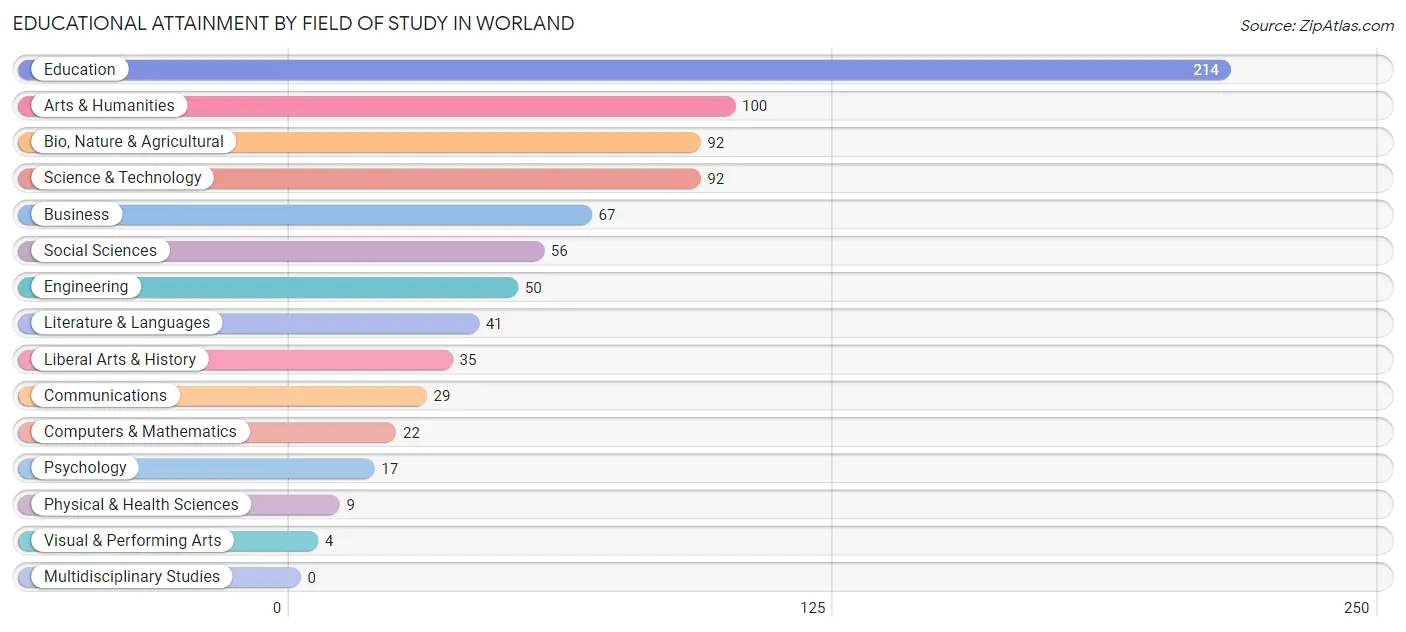
| Field of Study | # Graduates | % Graduates |
| Computers & Mathematics | 22 | 2.7% |
| Bio, Nature & Agricultural | 92 | 11.1% |
| Physical & Health Sciences | 9 | 1.1% |
| Psychology | 17 | 2.1% |
| Social Sciences | 56 | 6.8% |
| Engineering | 50 | 6.0% |
| Multidisciplinary Studies | 0 | 0.0% |
| Science & Technology | 92 | 11.1% |
| Business | 67 | 8.1% |
| Education | 214 | 25.9% |
| Literature & Languages | 41 | 5.0% |
| Liberal Arts & History | 35 | 4.2% |
| Visual & Performing Arts | 4 | 0.5% |
| Communications | 29 | 3.5% |
| Arts & Humanities | 100 | 12.1% |
| Total | 828 | 100.0% |
Transportation & Commute in Worland
Vehicle Availability by Sex in Worland
The most prevalent vehicle ownership categories in Worland are males with 2 vehicles (351, accounting for 32.1%) and females with 2 vehicles (486, making up 27.3%).
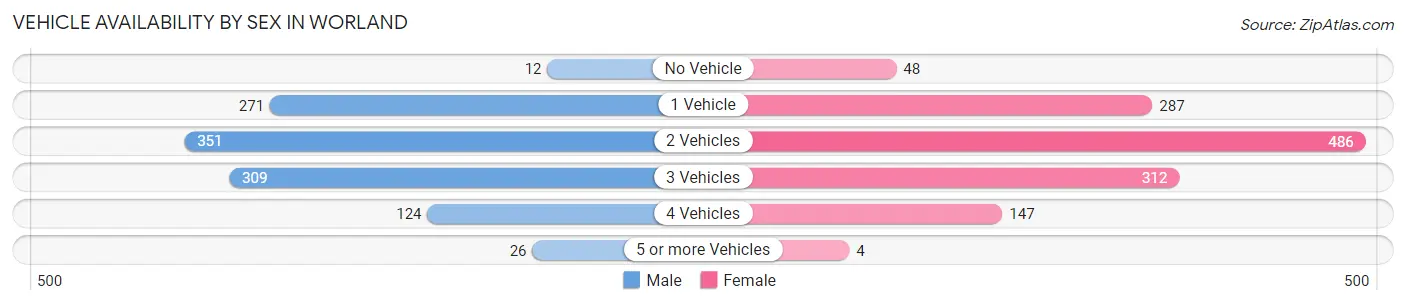
| Vehicles Available | Male | Female |
| No Vehicle | 12 (1.1%) | 48 (3.7%) |
| 1 Vehicle | 271 (24.8%) | 287 (22.4%) |
| 2 Vehicles | 351 (32.1%) | 486 (37.9%) |
| 3 Vehicles | 309 (28.3%) | 312 (24.3%) |
| 4 Vehicles | 124 (11.3%) | 147 (11.5%) |
| 5 or more Vehicles | 26 (2.4%) | 4 (0.3%) |
| Total | 1,093 (100.0%) | 1,284 (100.0%) |
Commute Time in Worland
The most frequently occuring commute durations in Worland are 5 to 9 minutes (1,322 commuters, 55.6%), less than 5 minutes (570 commuters, 24.0%), and 10 to 14 minutes (250 commuters, 10.5%).
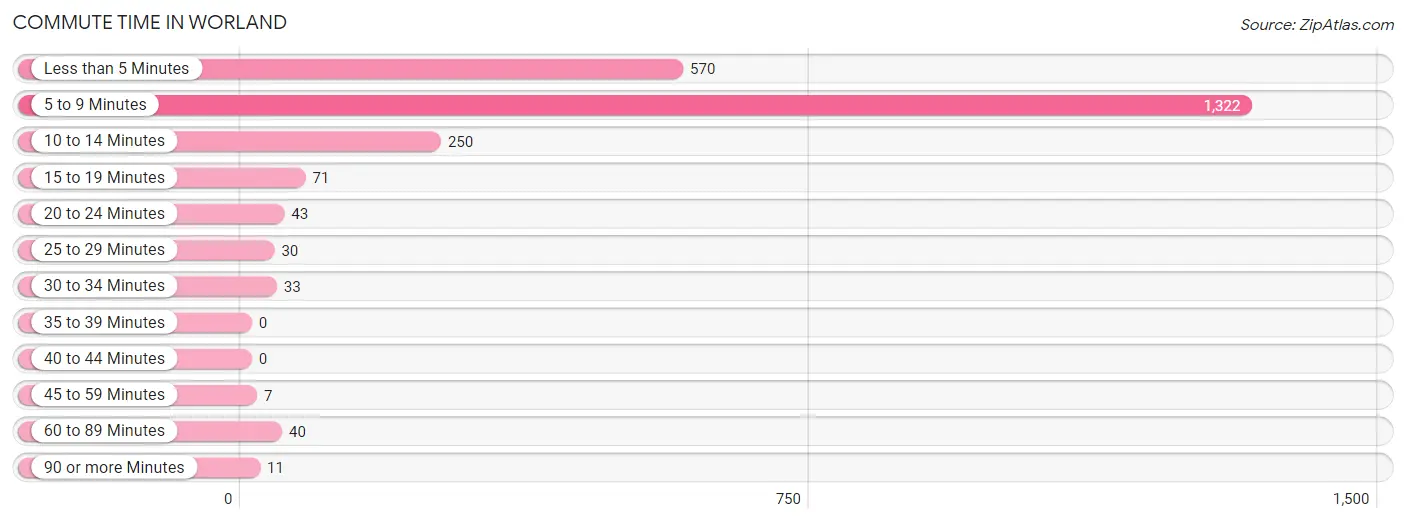
| Commute Time | # Commuters | % Commuters |
| Less than 5 Minutes | 570 | 24.0% |
| 5 to 9 Minutes | 1,322 | 55.6% |
| 10 to 14 Minutes | 250 | 10.5% |
| 15 to 19 Minutes | 71 | 3.0% |
| 20 to 24 Minutes | 43 | 1.8% |
| 25 to 29 Minutes | 30 | 1.3% |
| 30 to 34 Minutes | 33 | 1.4% |
| 35 to 39 Minutes | 0 | 0.0% |
| 40 to 44 Minutes | 0 | 0.0% |
| 45 to 59 Minutes | 7 | 0.3% |
| 60 to 89 Minutes | 40 | 1.7% |
| 90 or more Minutes | 11 | 0.5% |
Commute Time by Sex in Worland
The most common commute times in Worland are 5 to 9 minutes (545 commuters, 49.9%) for males and 5 to 9 minutes (777 commuters, 60.5%) for females.
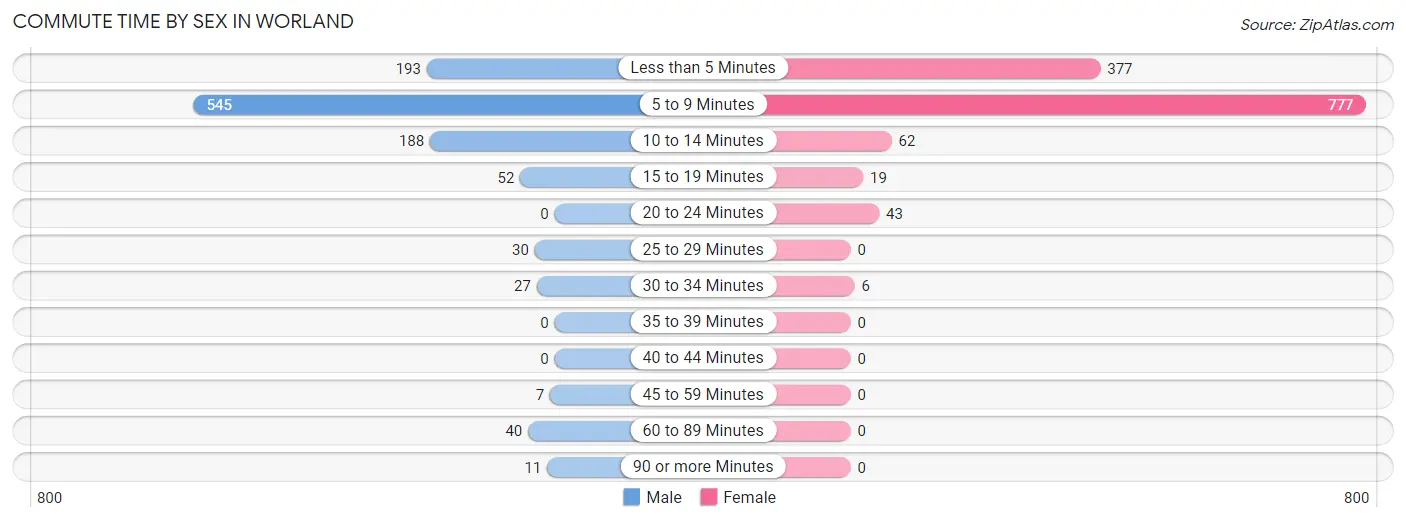
| Commute Time | Male | Female |
| Less than 5 Minutes | 193 (17.7%) | 377 (29.4%) |
| 5 to 9 Minutes | 545 (49.9%) | 777 (60.5%) |
| 10 to 14 Minutes | 188 (17.2%) | 62 (4.8%) |
| 15 to 19 Minutes | 52 (4.8%) | 19 (1.5%) |
| 20 to 24 Minutes | 0 (0.0%) | 43 (3.4%) |
| 25 to 29 Minutes | 30 (2.7%) | 0 (0.0%) |
| 30 to 34 Minutes | 27 (2.5%) | 6 (0.5%) |
| 35 to 39 Minutes | 0 (0.0%) | 0 (0.0%) |
| 40 to 44 Minutes | 0 (0.0%) | 0 (0.0%) |
| 45 to 59 Minutes | 7 (0.6%) | 0 (0.0%) |
| 60 to 89 Minutes | 40 (3.7%) | 0 (0.0%) |
| 90 or more Minutes | 11 (1.0%) | 0 (0.0%) |
Time of Departure to Work by Sex in Worland
The most frequent times of departure to work in Worland are 6:30 AM to 6:59 AM (175, 16.0%) for males and 7:30 AM to 7:59 AM (509, 39.6%) for females.
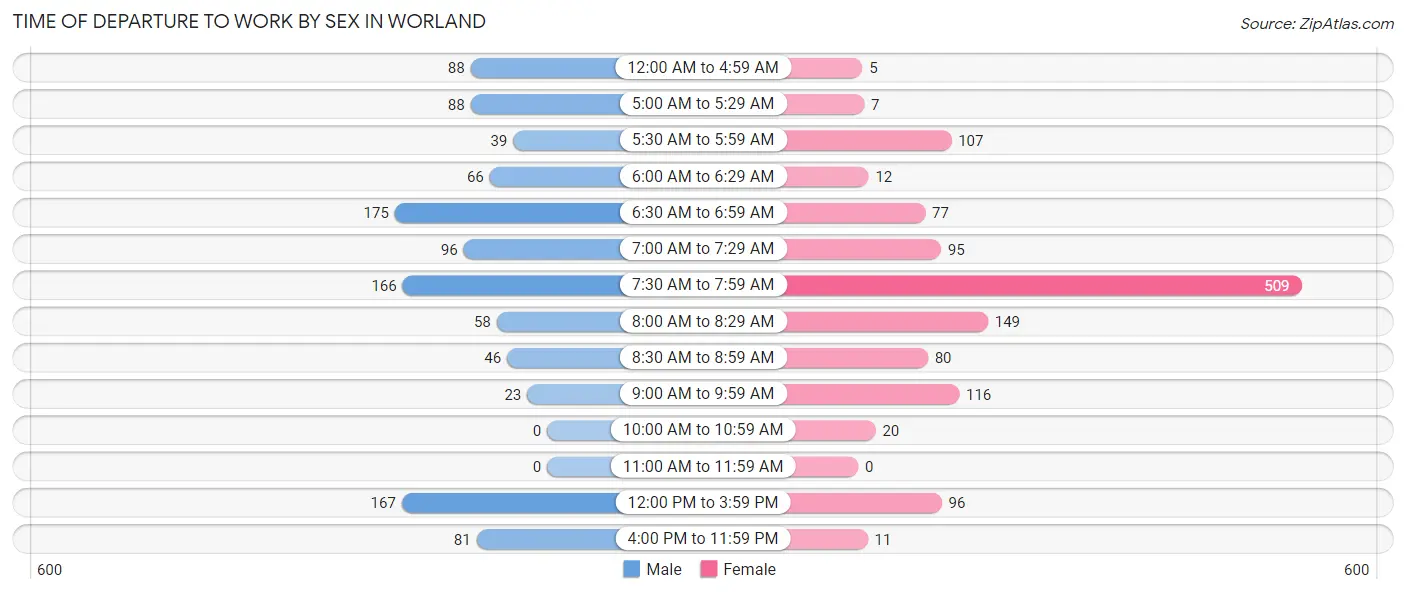
| Time of Departure | Male | Female |
| 12:00 AM to 4:59 AM | 88 (8.1%) | 5 (0.4%) |
| 5:00 AM to 5:29 AM | 88 (8.1%) | 7 (0.5%) |
| 5:30 AM to 5:59 AM | 39 (3.6%) | 107 (8.3%) |
| 6:00 AM to 6:29 AM | 66 (6.0%) | 12 (0.9%) |
| 6:30 AM to 6:59 AM | 175 (16.0%) | 77 (6.0%) |
| 7:00 AM to 7:29 AM | 96 (8.8%) | 95 (7.4%) |
| 7:30 AM to 7:59 AM | 166 (15.2%) | 509 (39.6%) |
| 8:00 AM to 8:29 AM | 58 (5.3%) | 149 (11.6%) |
| 8:30 AM to 8:59 AM | 46 (4.2%) | 80 (6.2%) |
| 9:00 AM to 9:59 AM | 23 (2.1%) | 116 (9.0%) |
| 10:00 AM to 10:59 AM | 0 (0.0%) | 20 (1.6%) |
| 11:00 AM to 11:59 AM | 0 (0.0%) | 0 (0.0%) |
| 12:00 PM to 3:59 PM | 167 (15.3%) | 96 (7.5%) |
| 4:00 PM to 11:59 PM | 81 (7.4%) | 11 (0.9%) |
| Total | 1,093 (100.0%) | 1,284 (100.0%) |
Housing Occupancy in Worland
Occupancy by Ownership in Worland
Of the total 2,174 dwellings in Worland, owner-occupied units account for 1,487 (68.4%), while renter-occupied units make up 687 (31.6%).
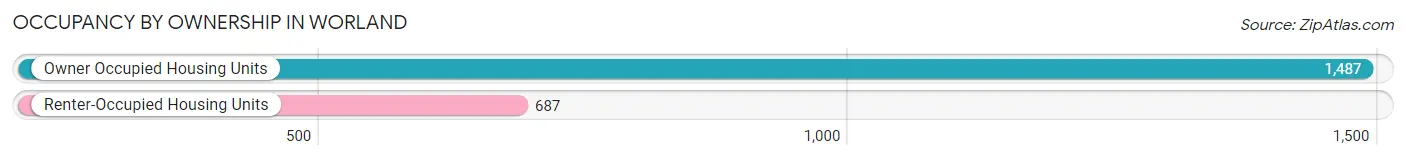
| Occupancy | # Housing Units | % Housing Units |
| Owner Occupied Housing Units | 1,487 | 68.4% |
| Renter-Occupied Housing Units | 687 | 31.6% |
| Total Occupied Housing Units | 2,174 | 100.0% |
Occupancy by Household Size in Worland
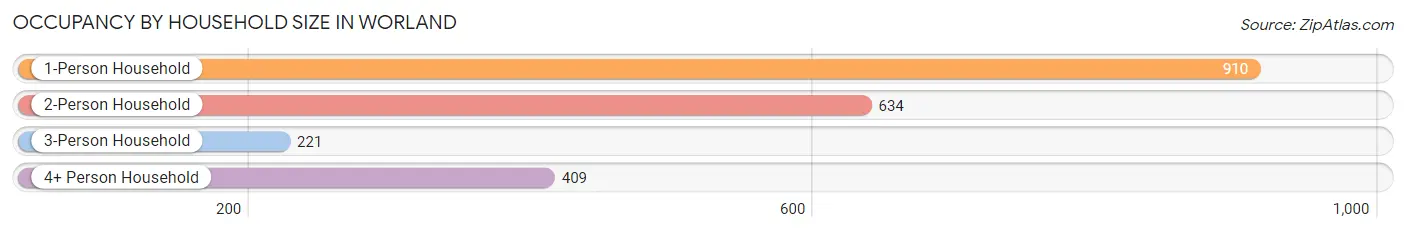
| Household Size | # Housing Units | % Housing Units |
| 1-Person Household | 910 | 41.9% |
| 2-Person Household | 634 | 29.2% |
| 3-Person Household | 221 | 10.2% |
| 4+ Person Household | 409 | 18.8% |
| Total Housing Units | 2,174 | 100.0% |
Occupancy by Ownership by Household Size in Worland
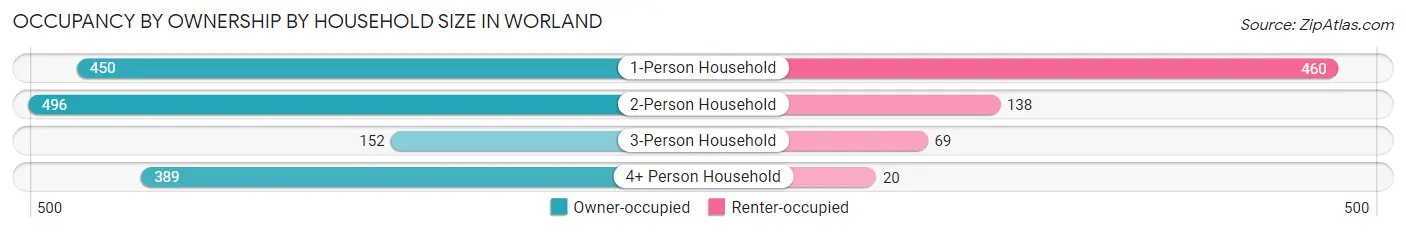
| Household Size | Owner-occupied | Renter-occupied |
| 1-Person Household | 450 (49.4%) | 460 (50.5%) |
| 2-Person Household | 496 (78.2%) | 138 (21.8%) |
| 3-Person Household | 152 (68.8%) | 69 (31.2%) |
| 4+ Person Household | 389 (95.1%) | 20 (4.9%) |
| Total Housing Units | 1,487 (68.4%) | 687 (31.6%) |
Occupancy by Educational Attainment in Worland
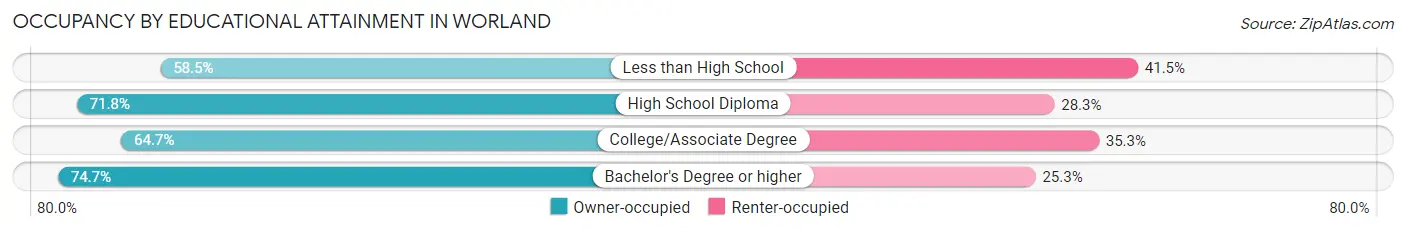
| Household Size | Owner-occupied | Renter-occupied |
| Less than High School | 62 (58.5%) | 44 (41.5%) |
| High School Diploma | 409 (71.8%) | 161 (28.2%) |
| College/Associate Degree | 667 (64.7%) | 364 (35.3%) |
| Bachelor's Degree or higher | 349 (74.7%) | 118 (25.3%) |
Occupancy by Age of Householder in Worland
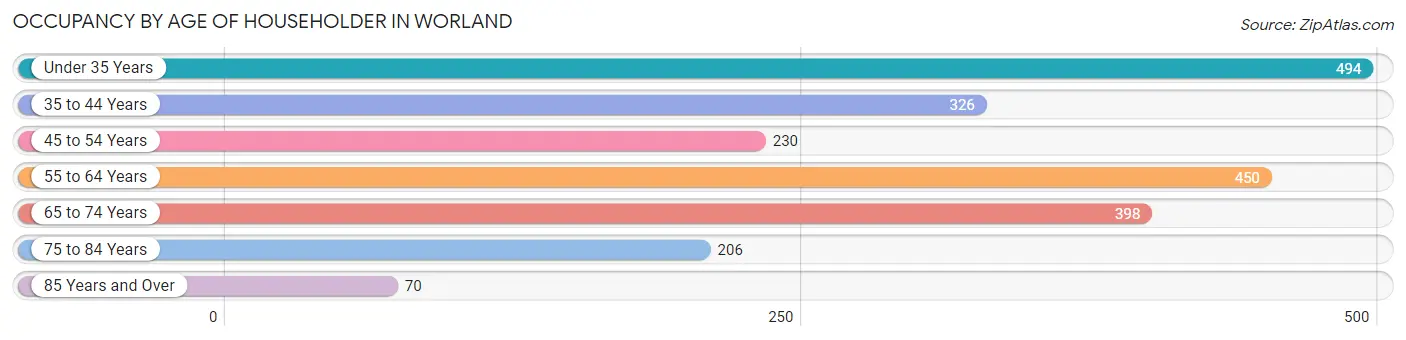
| Age Bracket | # Households | % Households |
| Under 35 Years | 494 | 22.7% |
| 35 to 44 Years | 326 | 15.0% |
| 45 to 54 Years | 230 | 10.6% |
| 55 to 64 Years | 450 | 20.7% |
| 65 to 74 Years | 398 | 18.3% |
| 75 to 84 Years | 206 | 9.5% |
| 85 Years and Over | 70 | 3.2% |
| Total | 2,174 | 100.0% |
Housing Finances in Worland
Median Income by Occupancy in Worland
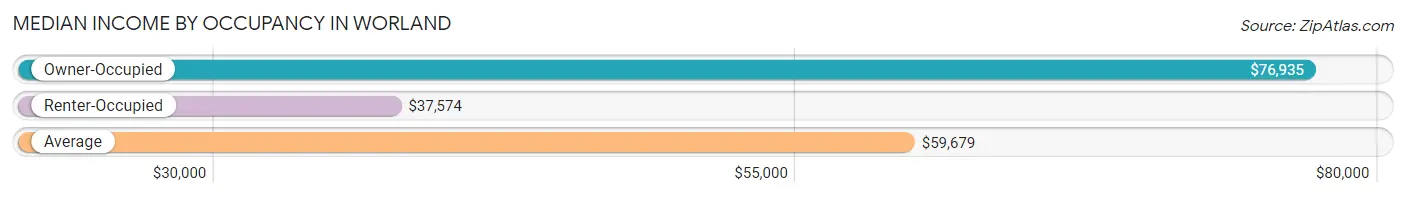
| Occupancy Type | # Households | Median Income |
| Owner-Occupied | 1,487 (68.4%) | $76,935 |
| Renter-Occupied | 687 (31.6%) | $37,574 |
| Average | 2,174 (100.0%) | $59,679 |
Occupancy by Householder Income Bracket in Worland
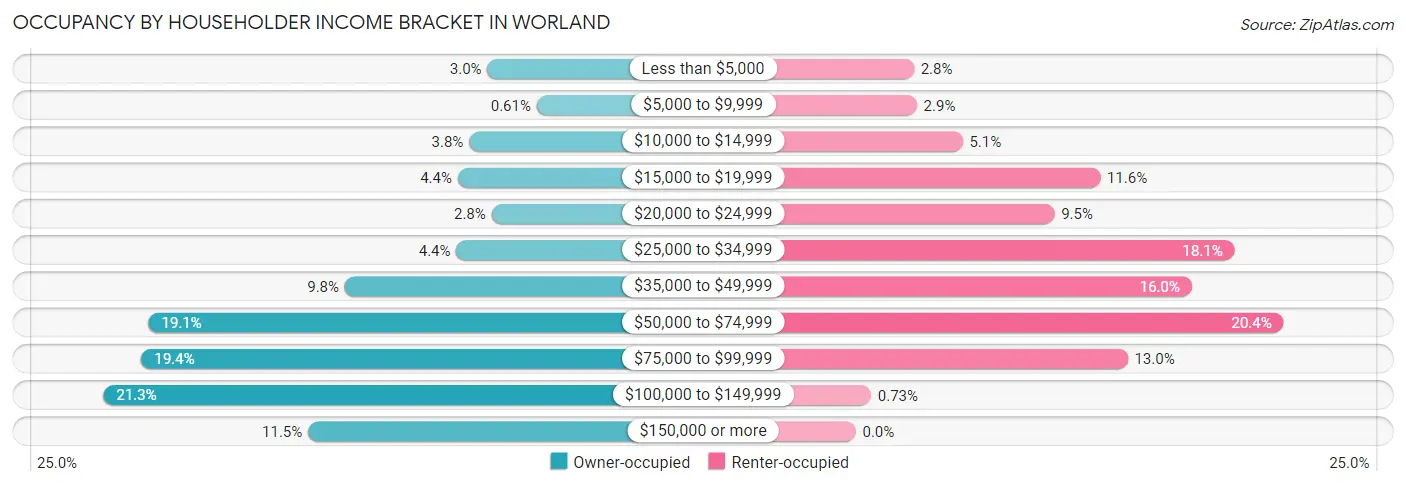
| Income Bracket | Owner-occupied | Renter-occupied |
| Less than $5,000 | 44 (3.0%) | 19 (2.8%) |
| $5,000 to $9,999 | 9 (0.6%) | 20 (2.9%) |
| $10,000 to $14,999 | 57 (3.8%) | 35 (5.1%) |
| $15,000 to $19,999 | 65 (4.4%) | 80 (11.6%) |
| $20,000 to $24,999 | 41 (2.8%) | 65 (9.5%) |
| $25,000 to $34,999 | 66 (4.4%) | 124 (18.0%) |
| $35,000 to $49,999 | 145 (9.8%) | 110 (16.0%) |
| $50,000 to $74,999 | 284 (19.1%) | 140 (20.4%) |
| $75,000 to $99,999 | 289 (19.4%) | 89 (13.0%) |
| $100,000 to $149,999 | 316 (21.2%) | 5 (0.7%) |
| $150,000 or more | 171 (11.5%) | 0 (0.0%) |
| Total | 1,487 (100.0%) | 687 (100.0%) |
Monthly Housing Cost Tiers in Worland
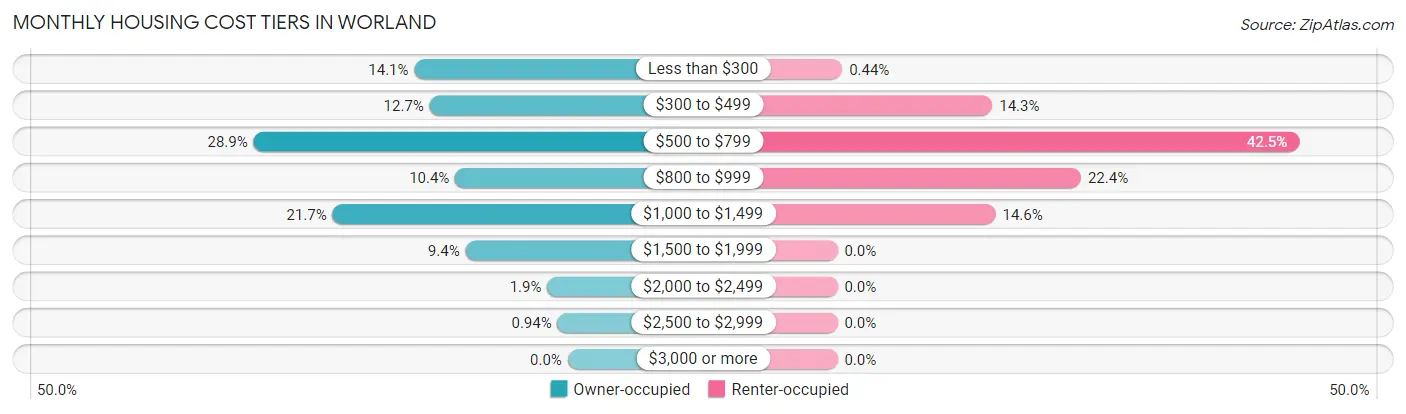
| Monthly Cost | Owner-occupied | Renter-occupied |
| Less than $300 | 210 (14.1%) | 3 (0.4%) |
| $300 to $499 | 189 (12.7%) | 98 (14.3%) |
| $500 to $799 | 430 (28.9%) | 292 (42.5%) |
| $800 to $999 | 154 (10.4%) | 154 (22.4%) |
| $1,000 to $1,499 | 322 (21.6%) | 100 (14.6%) |
| $1,500 to $1,999 | 140 (9.4%) | 0 (0.0%) |
| $2,000 to $2,499 | 28 (1.9%) | 0 (0.0%) |
| $2,500 to $2,999 | 14 (0.9%) | 0 (0.0%) |
| $3,000 or more | 0 (0.0%) | 0 (0.0%) |
| Total | 1,487 (100.0%) | 687 (100.0%) |
Physical Housing Characteristics in Worland
Housing Structures in Worland
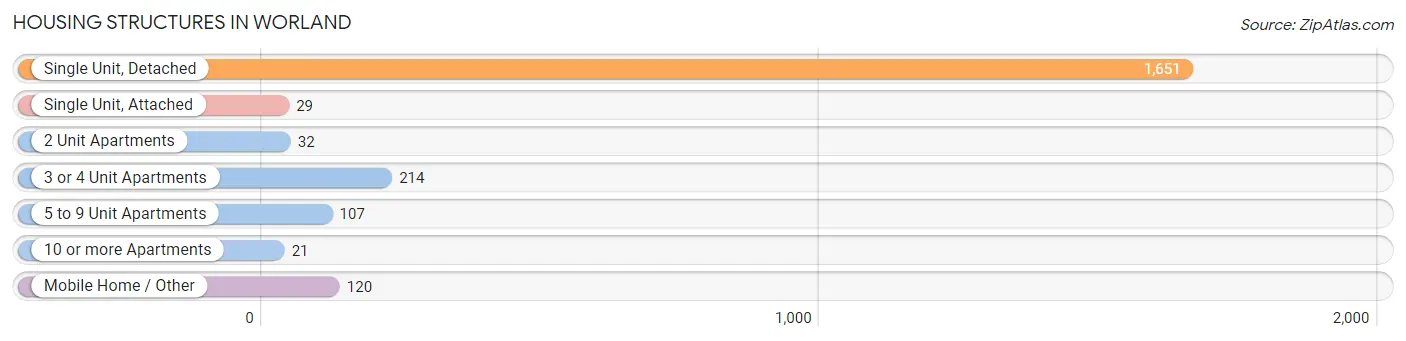
| Structure Type | # Housing Units | % Housing Units |
| Single Unit, Detached | 1,651 | 75.9% |
| Single Unit, Attached | 29 | 1.3% |
| 2 Unit Apartments | 32 | 1.5% |
| 3 or 4 Unit Apartments | 214 | 9.8% |
| 5 to 9 Unit Apartments | 107 | 4.9% |
| 10 or more Apartments | 21 | 1.0% |
| Mobile Home / Other | 120 | 5.5% |
| Total | 2,174 | 100.0% |
Housing Structures by Occupancy in Worland
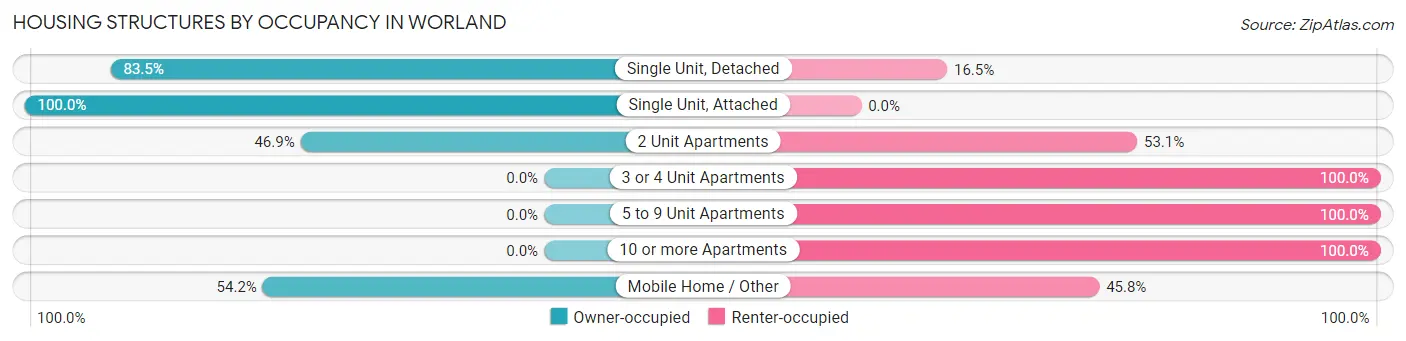
| Structure Type | Owner-occupied | Renter-occupied |
| Single Unit, Detached | 1,378 (83.5%) | 273 (16.5%) |
| Single Unit, Attached | 29 (100.0%) | 0 (0.0%) |
| 2 Unit Apartments | 15 (46.9%) | 17 (53.1%) |
| 3 or 4 Unit Apartments | 0 (0.0%) | 214 (100.0%) |
| 5 to 9 Unit Apartments | 0 (0.0%) | 107 (100.0%) |
| 10 or more Apartments | 0 (0.0%) | 21 (100.0%) |
| Mobile Home / Other | 65 (54.2%) | 55 (45.8%) |
| Total | 1,487 (68.4%) | 687 (31.6%) |
Housing Structures by Number of Rooms in Worland
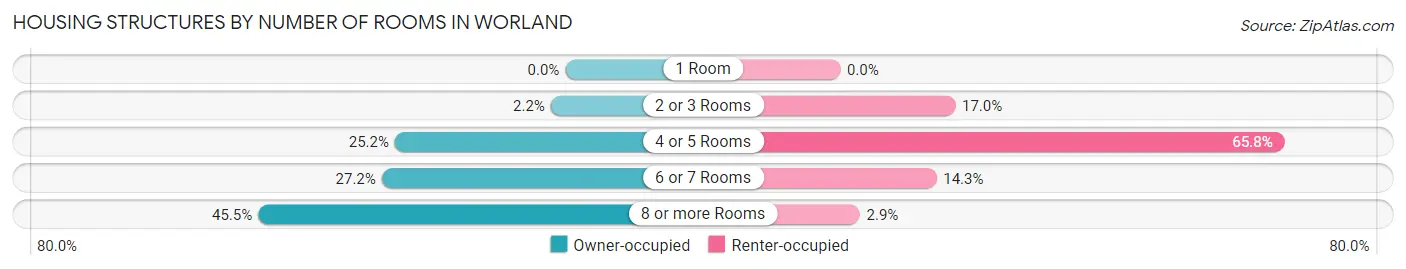
| Number of Rooms | Owner-occupied | Renter-occupied |
| 1 Room | 0 (0.0%) | 0 (0.0%) |
| 2 or 3 Rooms | 32 (2.1%) | 117 (17.0%) |
| 4 or 5 Rooms | 375 (25.2%) | 452 (65.8%) |
| 6 or 7 Rooms | 404 (27.2%) | 98 (14.3%) |
| 8 or more Rooms | 676 (45.5%) | 20 (2.9%) |
| Total | 1,487 (100.0%) | 687 (100.0%) |
Housing Structure by Heating Type in Worland
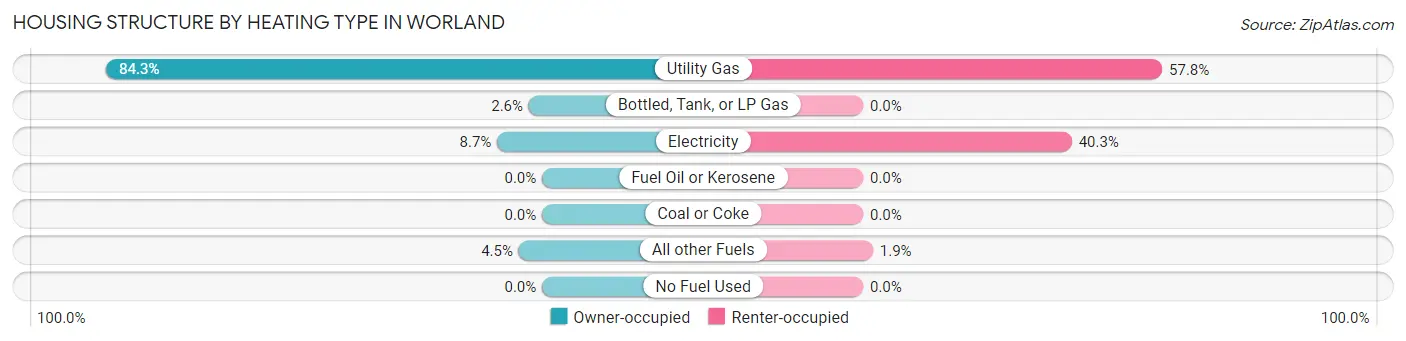
| Heating Type | Owner-occupied | Renter-occupied |
| Utility Gas | 1,253 (84.3%) | 397 (57.8%) |
| Bottled, Tank, or LP Gas | 38 (2.6%) | 0 (0.0%) |
| Electricity | 129 (8.7%) | 277 (40.3%) |
| Fuel Oil or Kerosene | 0 (0.0%) | 0 (0.0%) |
| Coal or Coke | 0 (0.0%) | 0 (0.0%) |
| All other Fuels | 67 (4.5%) | 13 (1.9%) |
| No Fuel Used | 0 (0.0%) | 0 (0.0%) |
| Total | 1,487 (100.0%) | 687 (100.0%) |
Household Vehicle Usage in Worland
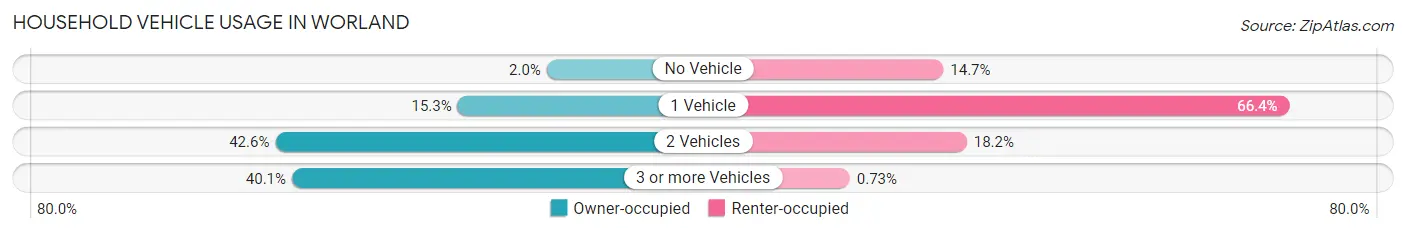
| Vehicles per Household | Owner-occupied | Renter-occupied |
| No Vehicle | 30 (2.0%) | 101 (14.7%) |
| 1 Vehicle | 228 (15.3%) | 456 (66.4%) |
| 2 Vehicles | 633 (42.6%) | 125 (18.2%) |
| 3 or more Vehicles | 596 (40.1%) | 5 (0.7%) |
| Total | 1,487 (100.0%) | 687 (100.0%) |
Real Estate & Mortgages in Worland
Real Estate and Mortgage Overview in Worland
| Characteristic | Without Mortgage | With Mortgage |
| Housing Units | 656 | 831 |
| Median Property Value | $193,000 | $165,300 |
| Median Household Income | $73,393 | $78 |
| Monthly Housing Costs | $455 | $0 |
| Real Estate Taxes | $1,246 | $77 |
Property Value by Mortgage Status in Worland
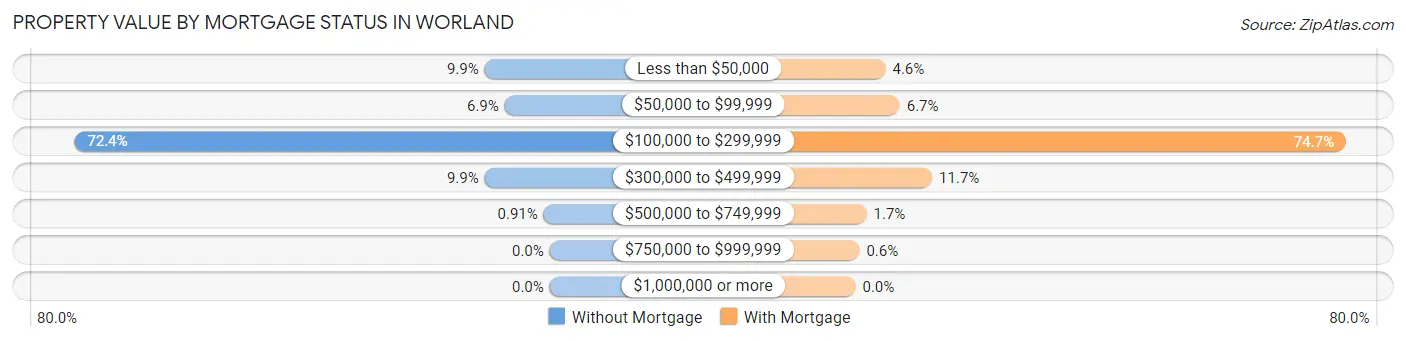
| Property Value | Without Mortgage | With Mortgage |
| Less than $50,000 | 65 (9.9%) | 38 (4.6%) |
| $50,000 to $99,999 | 45 (6.9%) | 56 (6.7%) |
| $100,000 to $299,999 | 475 (72.4%) | 621 (74.7%) |
| $300,000 to $499,999 | 65 (9.9%) | 97 (11.7%) |
| $500,000 to $749,999 | 6 (0.9%) | 14 (1.7%) |
| $750,000 to $999,999 | 0 (0.0%) | 5 (0.6%) |
| $1,000,000 or more | 0 (0.0%) | 0 (0.0%) |
| Total | 656 (100.0%) | 831 (100.0%) |
Household Income by Mortgage Status in Worland
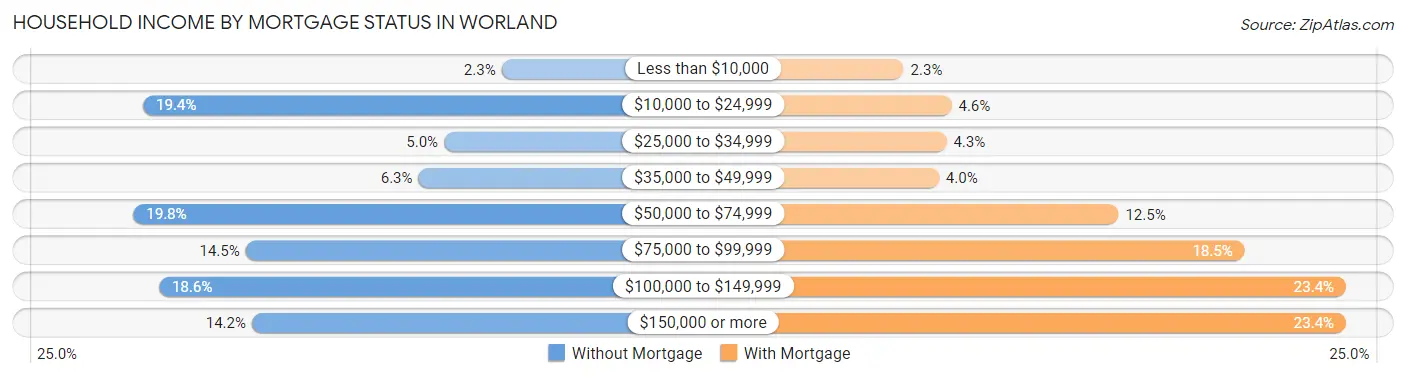
| Household Income | Without Mortgage | With Mortgage |
| Less than $10,000 | 15 (2.3%) | 19 (2.3%) |
| $10,000 to $24,999 | 127 (19.4%) | 38 (4.6%) |
| $25,000 to $34,999 | 33 (5.0%) | 36 (4.3%) |
| $35,000 to $49,999 | 41 (6.2%) | 33 (4.0%) |
| $50,000 to $74,999 | 130 (19.8%) | 104 (12.5%) |
| $75,000 to $99,999 | 95 (14.5%) | 154 (18.5%) |
| $100,000 to $149,999 | 122 (18.6%) | 194 (23.4%) |
| $150,000 or more | 93 (14.2%) | 194 (23.4%) |
| Total | 656 (100.0%) | 831 (100.0%) |
Property Value to Household Income Ratio in Worland
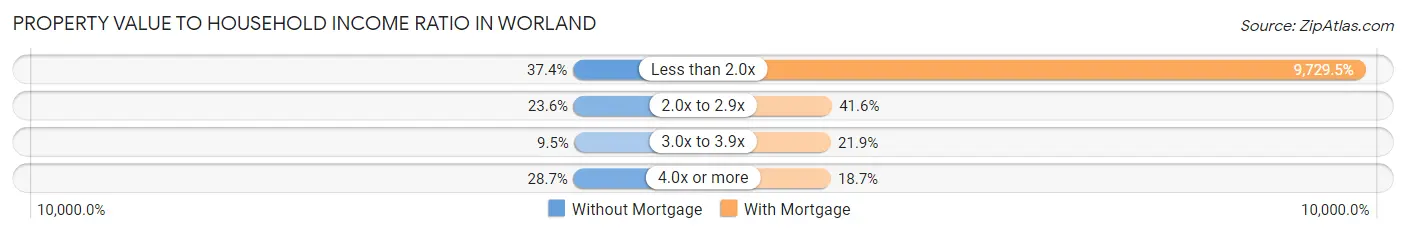
| Value-to-Income Ratio | Without Mortgage | With Mortgage |
| Less than 2.0x | 245 (37.3%) | 80,852 (9,729.5%) |
| 2.0x to 2.9x | 155 (23.6%) | 346 (41.6%) |
| 3.0x to 3.9x | 62 (9.5%) | 182 (21.9%) |
| 4.0x or more | 188 (28.7%) | 155 (18.6%) |
| Total | 656 (100.0%) | 831 (100.0%) |
Real Estate Taxes by Mortgage Status in Worland
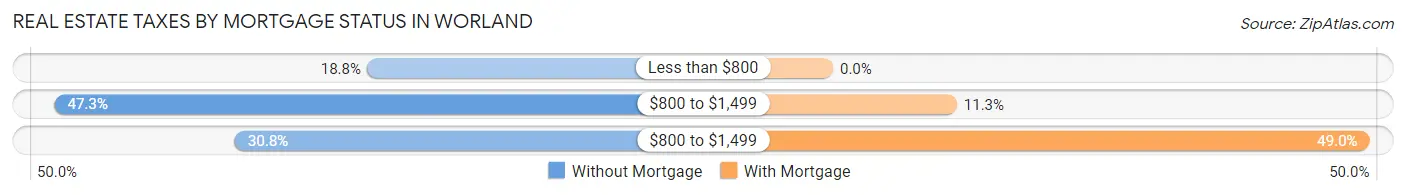
| Property Taxes | Without Mortgage | With Mortgage |
| Less than $800 | 123 (18.8%) | 0 (0.0%) |
| $800 to $1,499 | 310 (47.3%) | 94 (11.3%) |
| $800 to $1,499 | 202 (30.8%) | 407 (49.0%) |
| Total | 656 (100.0%) | 831 (100.0%) |
Health & Disability in Worland
Health Insurance Coverage by Age in Worland
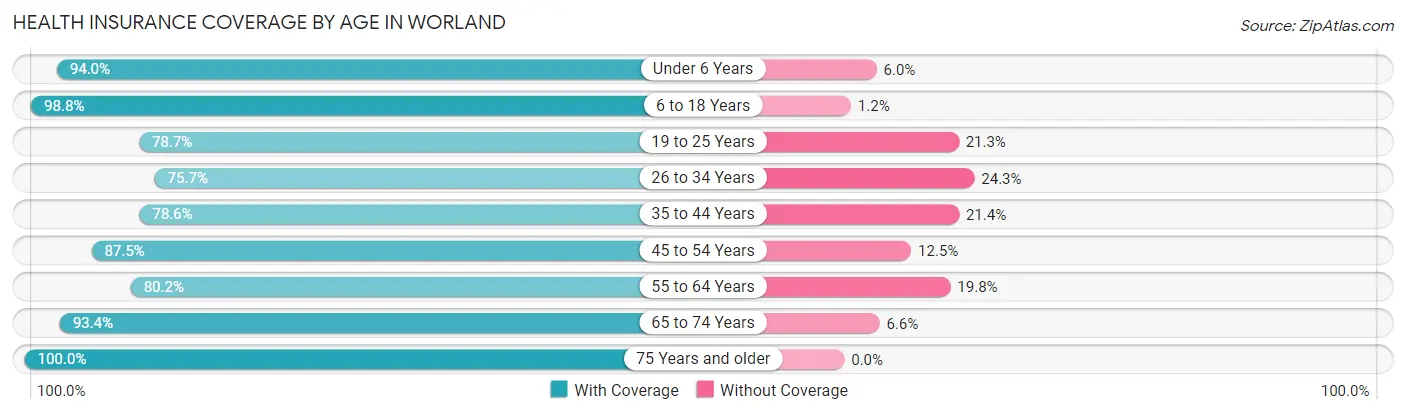
| Age Bracket | With Coverage | Without Coverage |
| Under 6 Years | 328 (94.0%) | 21 (6.0%) |
| 6 to 18 Years | 805 (98.8%) | 10 (1.2%) |
| 19 to 25 Years | 225 (78.7%) | 61 (21.3%) |
| 26 to 34 Years | 437 (75.7%) | 140 (24.3%) |
| 35 to 44 Years | 485 (78.6%) | 132 (21.4%) |
| 45 to 54 Years | 351 (87.5%) | 50 (12.5%) |
| 55 to 64 Years | 535 (80.2%) | 132 (19.8%) |
| 65 to 74 Years | 513 (93.4%) | 36 (6.6%) |
| 75 Years and older | 460 (100.0%) | 0 (0.0%) |
| Total | 4,139 (87.7%) | 582 (12.3%) |
Health Insurance Coverage by Citizenship Status in Worland
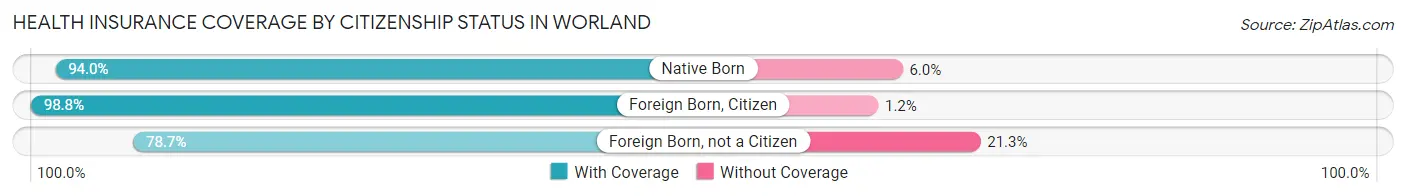
| Citizenship Status | With Coverage | Without Coverage |
| Native Born | 328 (94.0%) | 21 (6.0%) |
| Foreign Born, Citizen | 805 (98.8%) | 10 (1.2%) |
| Foreign Born, not a Citizen | 225 (78.7%) | 61 (21.3%) |
Health Insurance Coverage by Household Income in Worland
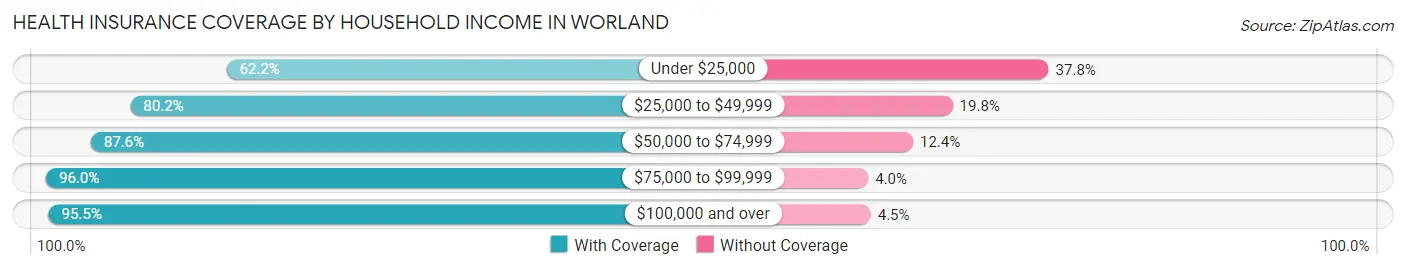
| Household Income | With Coverage | Without Coverage |
| Under $25,000 | 291 (62.2%) | 177 (37.8%) |
| $25,000 to $49,999 | 643 (80.2%) | 159 (19.8%) |
| $50,000 to $74,999 | 1,059 (87.6%) | 150 (12.4%) |
| $75,000 to $99,999 | 858 (96.0%) | 36 (4.0%) |
| $100,000 and over | 1,272 (95.5%) | 60 (4.5%) |
Public vs Private Health Insurance Coverage by Age in Worland
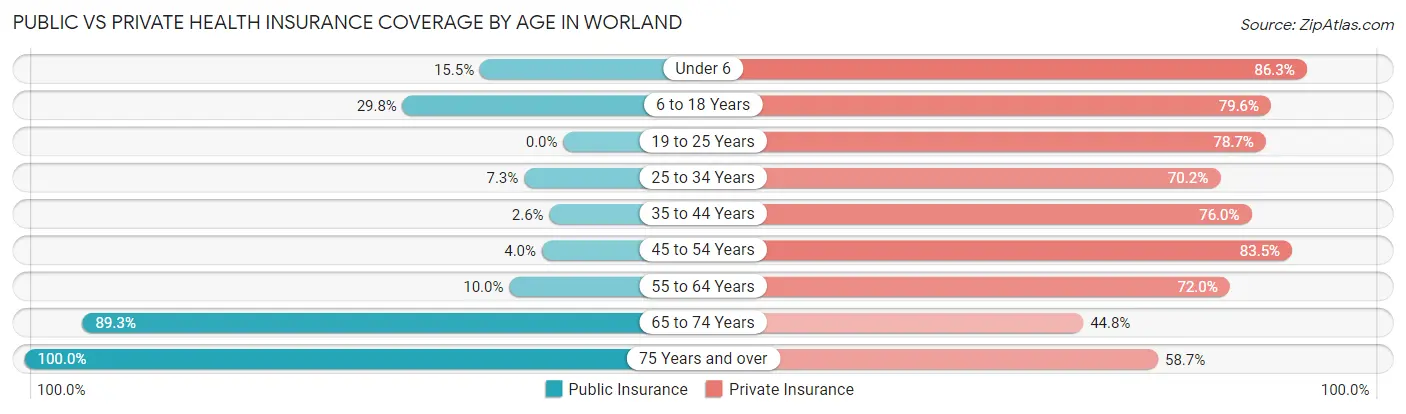
| Age Bracket | Public Insurance | Private Insurance |
| Under 6 | 54 (15.5%) | 301 (86.3%) |
| 6 to 18 Years | 243 (29.8%) | 649 (79.6%) |
| 19 to 25 Years | 0 (0.0%) | 225 (78.7%) |
| 25 to 34 Years | 42 (7.3%) | 405 (70.2%) |
| 35 to 44 Years | 16 (2.6%) | 469 (76.0%) |
| 45 to 54 Years | 16 (4.0%) | 335 (83.5%) |
| 55 to 64 Years | 67 (10.0%) | 480 (72.0%) |
| 65 to 74 Years | 490 (89.2%) | 246 (44.8%) |
| 75 Years and over | 460 (100.0%) | 270 (58.7%) |
| Total | 1,388 (29.4%) | 3,380 (71.6%) |
Disability Status by Sex by Age in Worland
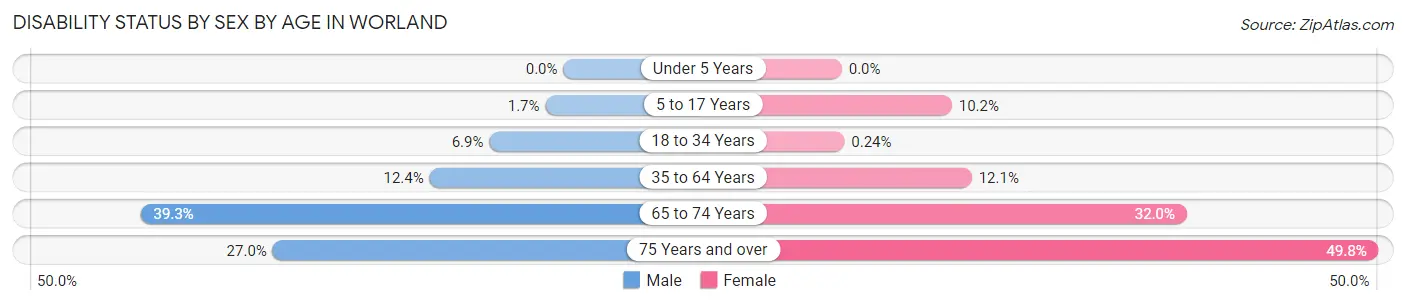
| Age Bracket | Male | Female |
| Under 5 Years | 0 (0.0%) | 0 (0.0%) |
| 5 to 17 Years | 9 (1.7%) | 29 (10.2%) |
| 18 to 34 Years | 36 (6.9%) | 1 (0.2%) |
| 35 to 64 Years | 97 (12.4%) | 109 (12.1%) |
| 65 to 74 Years | 126 (39.3%) | 73 (32.0%) |
| 75 Years and over | 51 (27.0%) | 135 (49.8%) |
Disability Class by Sex by Age in Worland
Disability Class: Hearing Difficulty
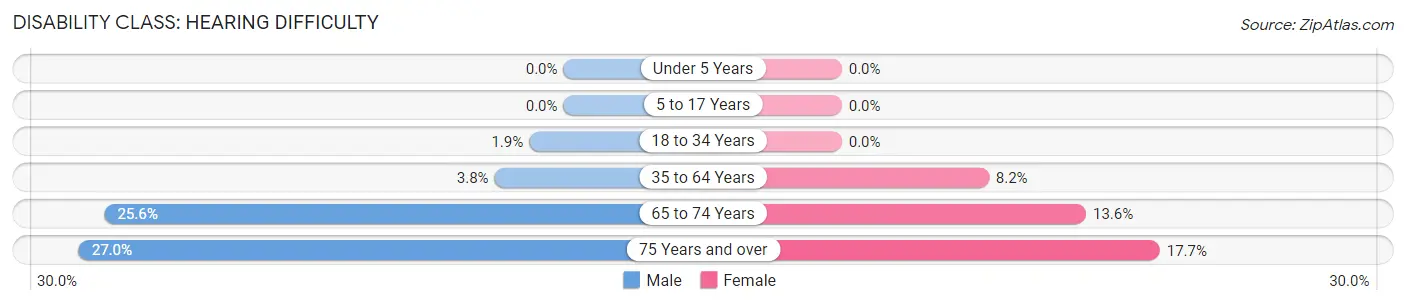
| Age Bracket | Male | Female |
| Under 5 Years | 0 (0.0%) | 0 (0.0%) |
| 5 to 17 Years | 0 (0.0%) | 0 (0.0%) |
| 18 to 34 Years | 10 (1.9%) | 0 (0.0%) |
| 35 to 64 Years | 30 (3.8%) | 74 (8.2%) |
| 65 to 74 Years | 82 (25.6%) | 31 (13.6%) |
| 75 Years and over | 51 (27.0%) | 48 (17.7%) |
Disability Class: Vision Difficulty
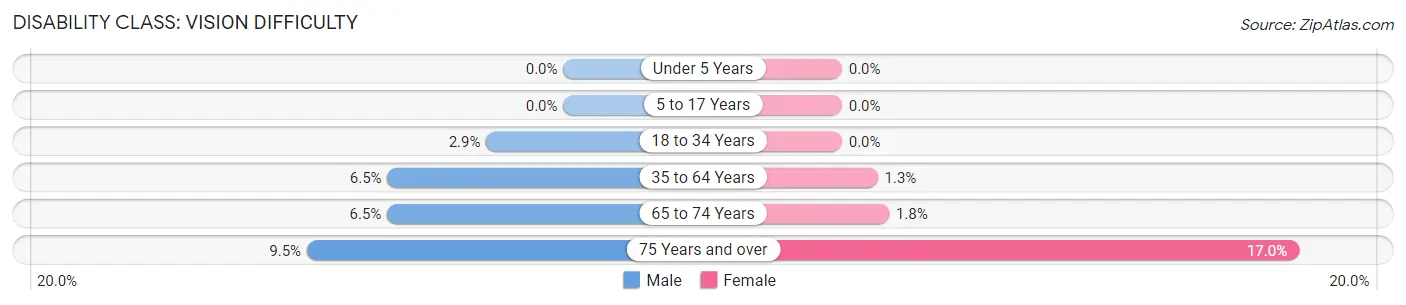
| Age Bracket | Male | Female |
| Under 5 Years | 0 (0.0%) | 0 (0.0%) |
| 5 to 17 Years | 0 (0.0%) | 0 (0.0%) |
| 18 to 34 Years | 15 (2.9%) | 0 (0.0%) |
| 35 to 64 Years | 51 (6.5%) | 12 (1.3%) |
| 65 to 74 Years | 21 (6.5%) | 4 (1.8%) |
| 75 Years and over | 18 (9.5%) | 46 (17.0%) |
Disability Class: Cognitive Difficulty
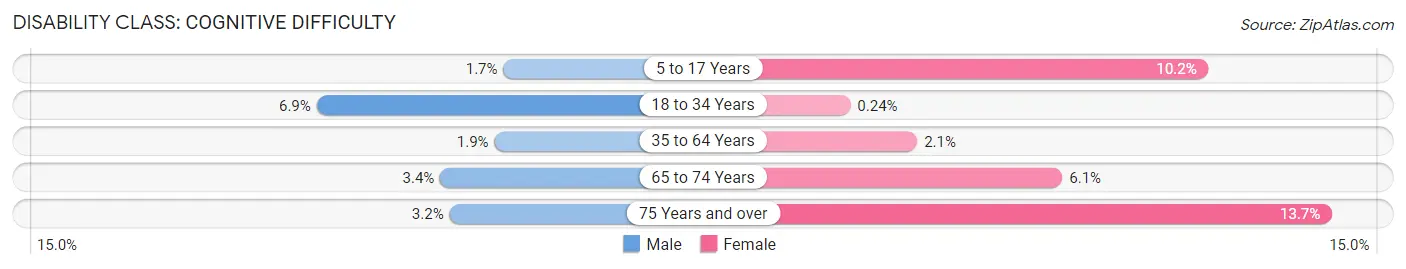
| Age Bracket | Male | Female |
| 5 to 17 Years | 9 (1.7%) | 29 (10.2%) |
| 18 to 34 Years | 36 (6.9%) | 1 (0.2%) |
| 35 to 64 Years | 15 (1.9%) | 19 (2.1%) |
| 65 to 74 Years | 11 (3.4%) | 14 (6.1%) |
| 75 Years and over | 6 (3.2%) | 37 (13.7%) |
Disability Class: Ambulatory Difficulty
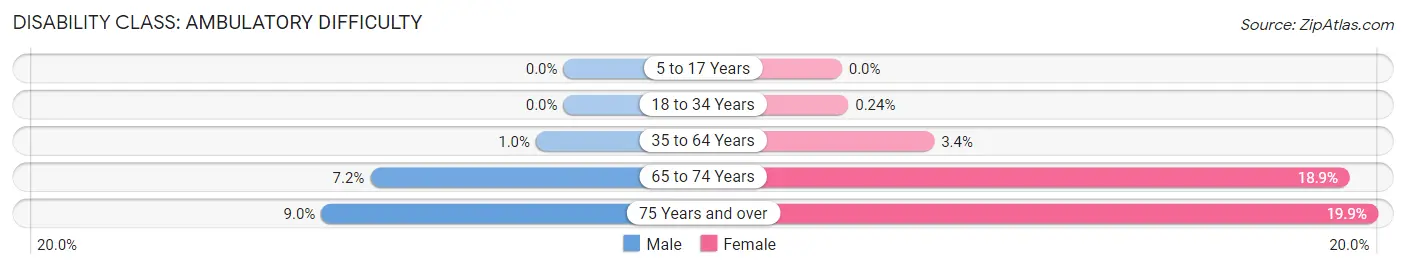
| Age Bracket | Male | Female |
| 5 to 17 Years | 0 (0.0%) | 0 (0.0%) |
| 18 to 34 Years | 0 (0.0%) | 1 (0.2%) |
| 35 to 64 Years | 8 (1.0%) | 31 (3.4%) |
| 65 to 74 Years | 23 (7.2%) | 43 (18.9%) |
| 75 Years and over | 17 (9.0%) | 54 (19.9%) |
Disability Class: Self-Care Difficulty
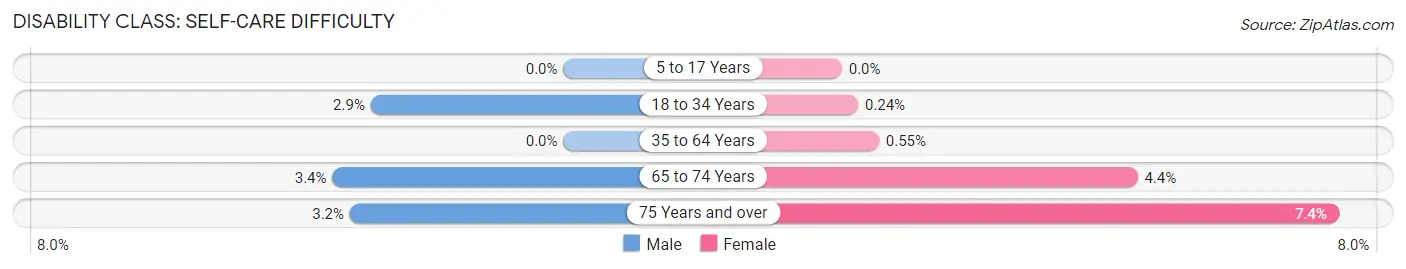
| Age Bracket | Male | Female |
| 5 to 17 Years | 0 (0.0%) | 0 (0.0%) |
| 18 to 34 Years | 15 (2.9%) | 1 (0.2%) |
| 35 to 64 Years | 0 (0.0%) | 5 (0.5%) |
| 65 to 74 Years | 11 (3.4%) | 10 (4.4%) |
| 75 Years and over | 6 (3.2%) | 20 (7.4%) |
Technology Access in Worland
Computing Device Access in Worland
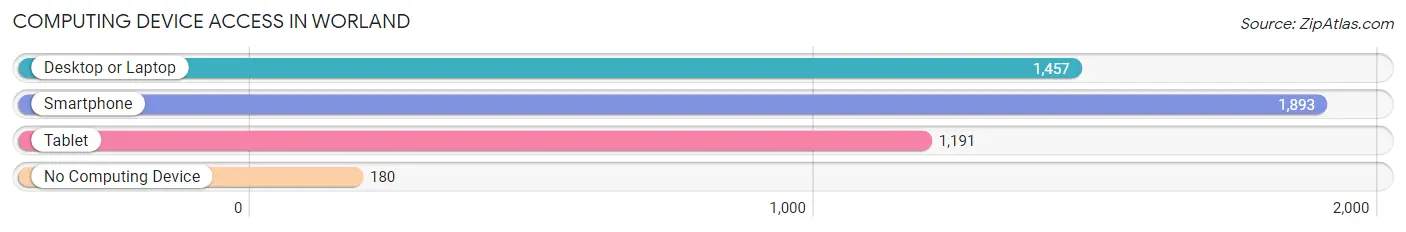
| Device Type | # Households | % Households |
| Desktop or Laptop | 1,457 | 67.0% |
| Smartphone | 1,893 | 87.1% |
| Tablet | 1,191 | 54.8% |
| No Computing Device | 180 | 8.3% |
| Total | 2,174 | 100.0% |
Internet Access in Worland
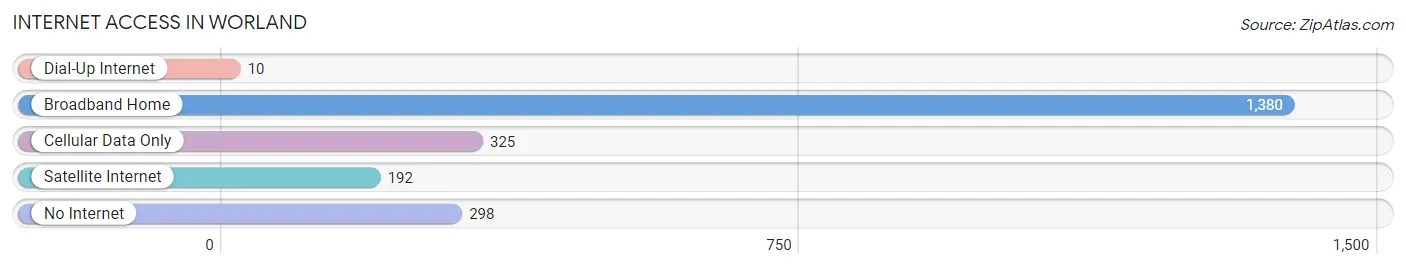
| Internet Type | # Households | % Households |
| Dial-Up Internet | 10 | 0.5% |
| Broadband Home | 1,380 | 63.5% |
| Cellular Data Only | 325 | 14.9% |
| Satellite Internet | 192 | 8.8% |
| No Internet | 298 | 13.7% |
| Total | 2,174 | 100.0% |
Worland Summary
Worland is a city located in Washakie County, Wyoming, United States. The population was 5,489 at the 2010 census. It is the county seat of Washakie County.
History
Worland was founded in 1906 as a railroad town. The town was named after the Worland family, who were early settlers in the area. The town was incorporated in 1910.
In the early 20th century, Worland was a major center for sheep ranching. The town was also home to a large sugar beet processing plant, which closed in the late 1970s.
Geography
Worland is located at the confluence of the Big Horn and Nowood Rivers in the Big Horn Basin of Wyoming. The city is situated at an elevation of 4,092 feet (1,248 m).
The city is located in the semi-arid high desert of the Great Plains. The climate is characterized by hot summers and cold winters. The average annual precipitation is 11.5 inches (292 mm).
Economy
Worland's economy is largely based on agriculture and energy production. The city is home to several large agricultural operations, including a large sugar beet processing plant.
The city is also home to several energy production facilities, including a natural gas processing plant and a coal-fired power plant.
Demographics
As of the 2010 census, there were 5,489 people, 2,093 households, and 1,323 families residing in the city. The population density was 1,092.3 people per square mile (422.2/km2). There were 2,309 housing units at an average density of 462.3 per square mile (178.7/km2). The racial makeup of the city was 92.2% White, 0.3% African American, 0.7% Native American, 0.4% Asian, 0.1% Pacific Islander, 4.3% from other races, and 2.1% from two or more races. Hispanic or Latino of any race were 11.2% of the population.
There were 2,093 households, out of which 33.2% had children under the age of 18 living with them, 48.2% were married couples living together, 11.2% had a female householder with no husband present, and 35.2% were non-families. 30.2% of all households were made up of individuals, and 13.2% had someone living alone who was 65 years of age or older. The average household size was 2.50 and the average family size was 3.12.
In the city, the population was spread out, with 28.2% under the age of 18, 8.2% from 18 to 24, 25.2% from 25 to 44, 22.2% from 45 to 64, and 16.2% who were 65 years of age or older. The median age was 36 years. For every 100 females, there were 95.2 males. For every 100 females age 18 and over, there were 91.2 males.
The median income for a household in the city was $32,813, and the median income for a family was $40,938. Males had a median income of $30,917 versus $20,972 for females. The per capita income for the city was $16,845. About 10.2% of families and 13.2% of the population were below the poverty line, including 17.2% of those under age 18 and 8.2% of those age 65 or over.
Common Questions
What is Per Capita Income in Worland?
Per Capita income in Worland is $31,980.
What is the Median Family Income in Worland?
Median Family Income in Worland is $79,732.
What is the Median Household income in Worland?
Median Household Income in Worland is $59,679.
What is Income or Wage Gap in Worland?
Income or Wage Gap in Worland is 38.5%.
Women in Worland earn 61.5 cents for every dollar earned by a man.
What is Inequality or Gini Index in Worland?
Inequality or Gini Index in Worland is 0.38.
What is the Total Population of Worland?
Total Population of Worland is 4,812.
What is the Total Male Population of Worland?
Total Male Population of Worland is 2,521.
What is the Total Female Population of Worland?
Total Female Population of Worland is 2,291.
What is the Ratio of Males per 100 Females in Worland?
There are 110.04 Males per 100 Females in Worland.
What is the Ratio of Females per 100 Males in Worland?
There are 90.88 Females per 100 Males in Worland.
What is the Median Population Age in Worland?
Median Population Age in Worland is 40.8 Years.
What is the Average Family Size in Worland
Average Family Size in Worland is 2.9 People.
What is the Average Household Size in Worland
Average Household Size in Worland is 2.2 People.
How Large is the Labor Force in Worland?
There are 2,557 People in the Labor Forcein in Worland.
What is the Percentage of People in the Labor Force in Worland?
67.1% of People are in the Labor Force in Worland.
What is the Unemployment Rate in Worland?
Unemployment Rate in Worland is 1.9%.