Powell, WY Map & Demographics
Powell Map
Powell Overview
$33,345
PER CAPITA INCOME
$72,344
AVG FAMILY INCOME
$62,899
AVG HOUSEHOLD INCOME
53.8%
WAGE / INCOME GAP [ % ]
46.2¢/ $1
WAGE / INCOME GAP [ $ ]
0.43
INEQUALITY / GINI INDEX
6,460
TOTAL POPULATION
3,140
MALE POPULATION
3,320
FEMALE POPULATION
94.58
MALES / 100 FEMALES
105.73
FEMALES / 100 MALES
37.0
MEDIAN AGE
2.9
AVG FAMILY SIZE
2.1
AVG HOUSEHOLD SIZE
3,017
LABOR FORCE [ PEOPLE ]
57.3%
PERCENT IN LABOR FORCE
6.4%
UNEMPLOYMENT RATE
Powell Zip Codes
Powell Area Codes
Income in Powell
Income Overview in Powell
Per Capita Income in Powell is $33,345, while median incomes of families and households are $72,344 and $62,899 respectively.
| Characteristic | Number | Measure |
| Per Capita Income | 6,460 | $33,345 |
| Median Family Income | 1,559 | $72,344 |
| Mean Family Income | 1,559 | $87,028 |
| Median Household Income | 2,819 | $62,899 |
| Mean Household Income | 2,819 | $74,515 |
| Income Deficit | 1,559 | $0 |
| Wage / Income Gap (%) | 6,460 | 53.82% |
| Wage / Income Gap ($) | 6,460 | 46.18¢ per $1 |
| Gini / Inequality Index | 6,460 | 0.43 |
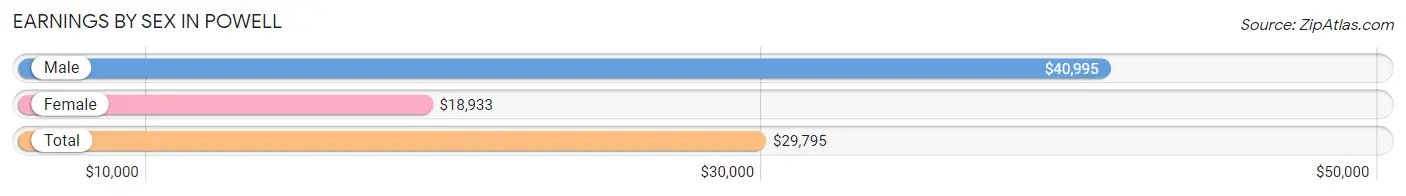
Earnings by Sex in Powell
Average Earnings in Powell are $29,795, $40,995 for men and $18,933 for women, a difference of 53.8%.
| Sex | Number | Average Earnings |
| Male | 1,869 (52.8%) | $40,995 |
| Female | 1,673 (47.2%) | $18,933 |
| Total | 3,542 (100.0%) | $29,795 |
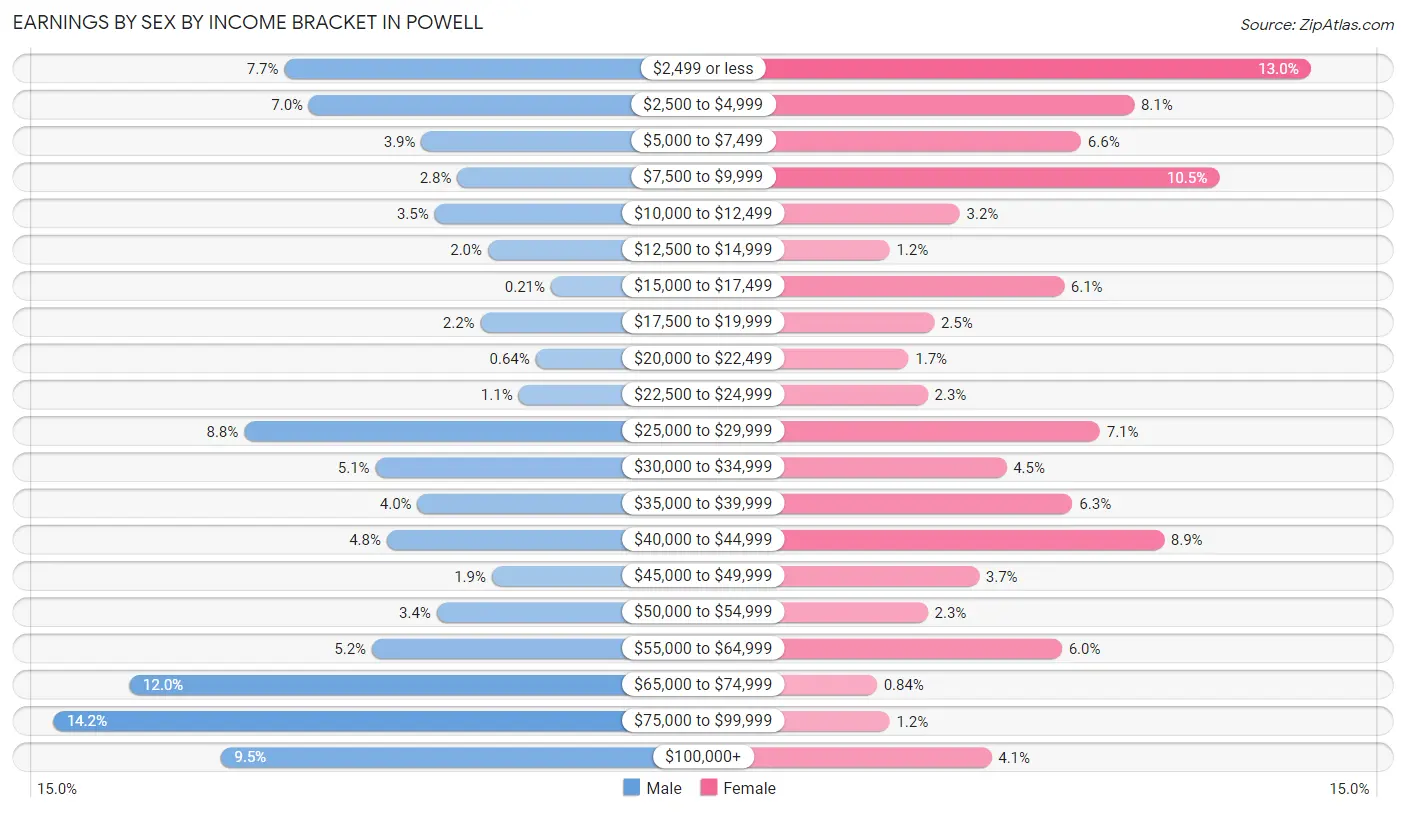
Earnings by Sex by Income Bracket in Powell
The most common earnings brackets in Powell are $75,000 to $99,999 for men (265 | 14.2%) and $2,499 or less for women (218 | 13.0%).
| Income | Male | Female |
| $2,499 or less | 144 (7.7%) | 218 (13.0%) |
| $2,500 to $4,999 | 131 (7.0%) | 135 (8.1%) |
| $5,000 to $7,499 | 72 (3.8%) | 110 (6.6%) |
| $7,500 to $9,999 | 53 (2.8%) | 175 (10.5%) |
| $10,000 to $12,499 | 65 (3.5%) | 53 (3.2%) |
| $12,500 to $14,999 | 37 (2.0%) | 20 (1.2%) |
| $15,000 to $17,499 | 4 (0.2%) | 102 (6.1%) |
| $17,500 to $19,999 | 41 (2.2%) | 41 (2.5%) |
| $20,000 to $22,499 | 12 (0.6%) | 29 (1.7%) |
| $22,500 to $24,999 | 21 (1.1%) | 38 (2.3%) |
| $25,000 to $29,999 | 165 (8.8%) | 119 (7.1%) |
| $30,000 to $34,999 | 96 (5.1%) | 75 (4.5%) |
| $35,000 to $39,999 | 74 (4.0%) | 106 (6.3%) |
| $40,000 to $44,999 | 90 (4.8%) | 149 (8.9%) |
| $45,000 to $49,999 | 35 (1.9%) | 62 (3.7%) |
| $50,000 to $54,999 | 64 (3.4%) | 38 (2.3%) |
| $55,000 to $64,999 | 98 (5.2%) | 101 (6.0%) |
| $65,000 to $74,999 | 225 (12.0%) | 14 (0.8%) |
| $75,000 to $99,999 | 265 (14.2%) | 20 (1.2%) |
| $100,000+ | 177 (9.5%) | 68 (4.1%) |
| Total | 1,869 (100.0%) | 1,673 (100.0%) |
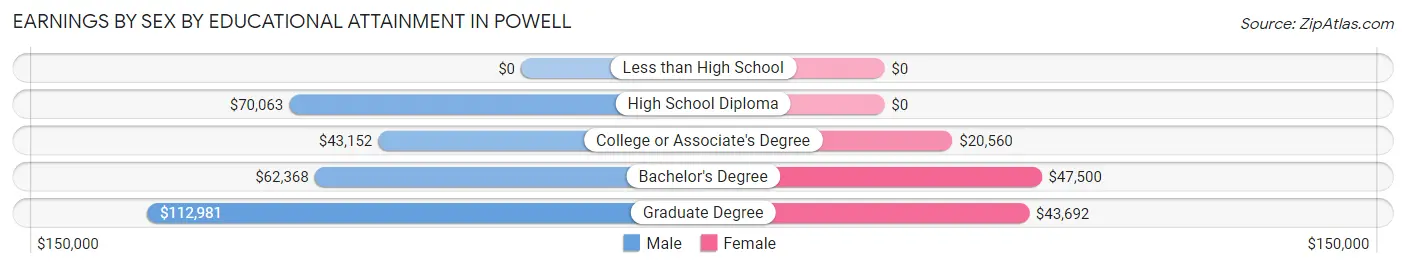
Earnings by Sex by Educational Attainment in Powell
Average earnings in Powell are $61,447 for men and $29,181 for women, a difference of 52.5%. Men with an educational attainment of graduate degree enjoy the highest average annual earnings of $112,981, while those with college or associate's degree education earn the least with $43,152. Women with an educational attainment of bachelor's degree earn the most with the average annual earnings of $47,500, while those with college or associate's degree education have the smallest earnings of $20,560.
| Educational Attainment | Male Income | Female Income |
| Less than High School | - | - |
| High School Diploma | $70,063 | $0 |
| College or Associate's Degree | $43,152 | $20,560 |
| Bachelor's Degree | $62,368 | $47,500 |
| Graduate Degree | $112,981 | $43,692 |
| Total | $61,447 | $29,181 |
Family Income in Powell
Family Income Brackets in Powell
According to the Powell family income data, there are 387 families falling into the $50,000 to $74,999 income range, which is the most common income bracket and makes up 24.8% of all families. Conversely, the $10,000 to $14,999 income bracket is the least frequent group with only 14 families (0.9%) belonging to this category.
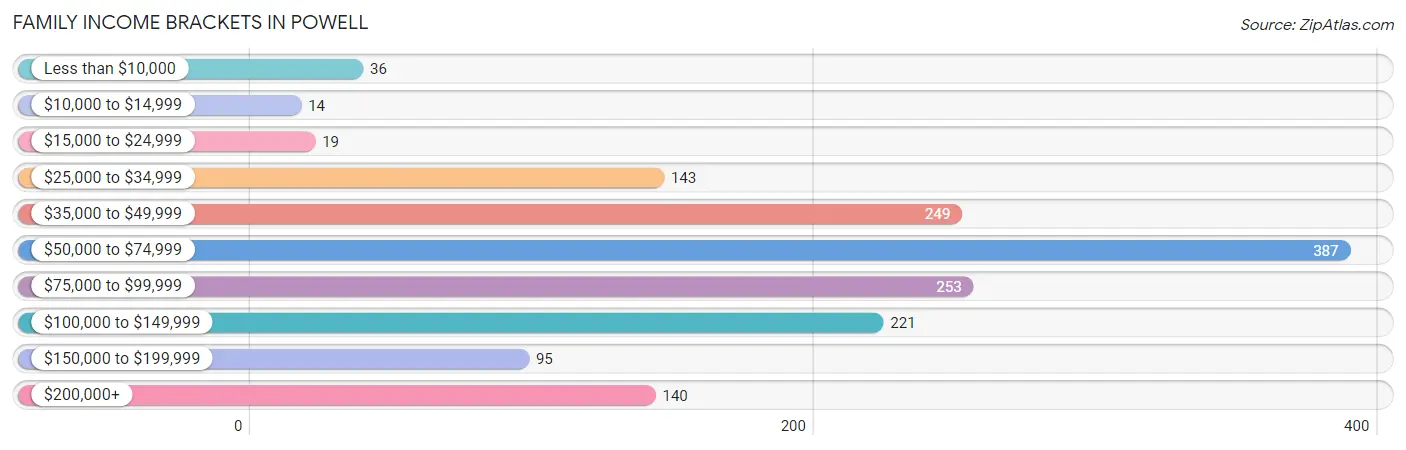
| Income Bracket | # Families | % Families |
| Less than $10,000 | 36 | 2.3% |
| $10,000 to $14,999 | 14 | 0.9% |
| $15,000 to $24,999 | 19 | 1.2% |
| $25,000 to $34,999 | 143 | 9.2% |
| $35,000 to $49,999 | 249 | 16.0% |
| $50,000 to $74,999 | 387 | 24.8% |
| $75,000 to $99,999 | 253 | 16.2% |
| $100,000 to $149,999 | 221 | 14.2% |
| $150,000 to $199,999 | 95 | 6.1% |
| $200,000+ | 140 | 9.0% |
Family Income by Famaliy Size in Powell
2-person families (872 | 55.9%) account for the highest median family income in Powell with $76,838 per family, while 2-person families (872 | 55.9%) have the highest median income of $38,419 per family member.
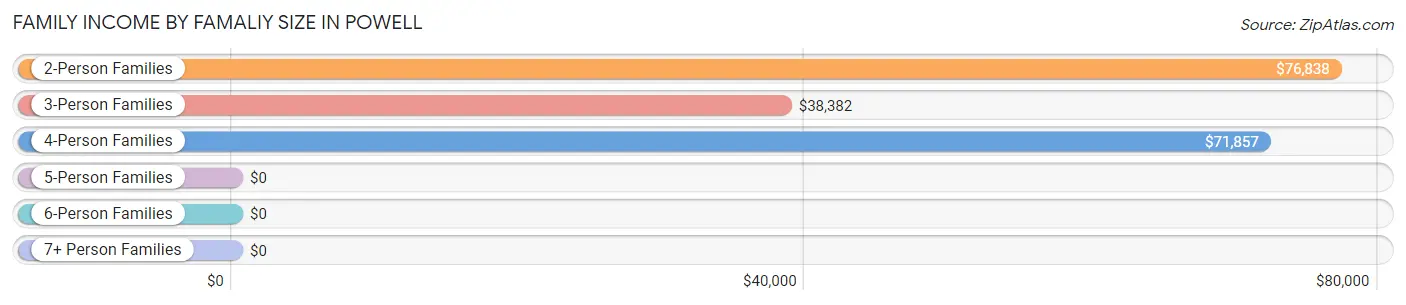
| Income Bracket | # Families | Median Income |
| 2-Person Families | 872 (55.9%) | $76,838 |
| 3-Person Families | 266 (17.1%) | $38,382 |
| 4-Person Families | 222 (14.2%) | $71,857 |
| 5-Person Families | 99 (6.4%) | $0 |
| 6-Person Families | 100 (6.4%) | $0 |
| 7+ Person Families | 0 (0.0%) | $0 |
| Total | 1,559 (100.0%) | $72,344 |
Family Income by Number of Earners in Powell
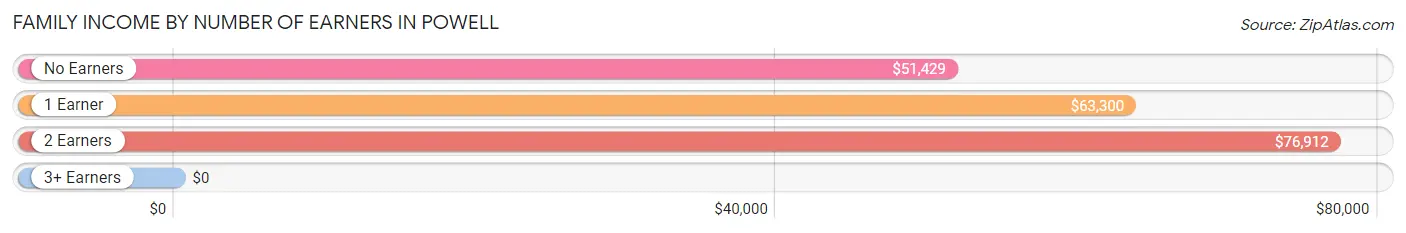
| Number of Earners | # Families | Median Income |
| No Earners | 262 (16.8%) | $51,429 |
| 1 Earner | 464 (29.8%) | $63,300 |
| 2 Earners | 724 (46.4%) | $76,912 |
| 3+ Earners | 109 (7.0%) | $0 |
| Total | 1,559 (100.0%) | $72,344 |
Household Income in Powell
Household Income Brackets in Powell
With 657 households falling in the category, the $50,000 to $74,999 income range is the most frequent in Powell, accounting for 23.3% of all households. In contrast, only 76 households (2.7%) fall into the $10,000 to $14,999 income bracket, making it the least populous group.
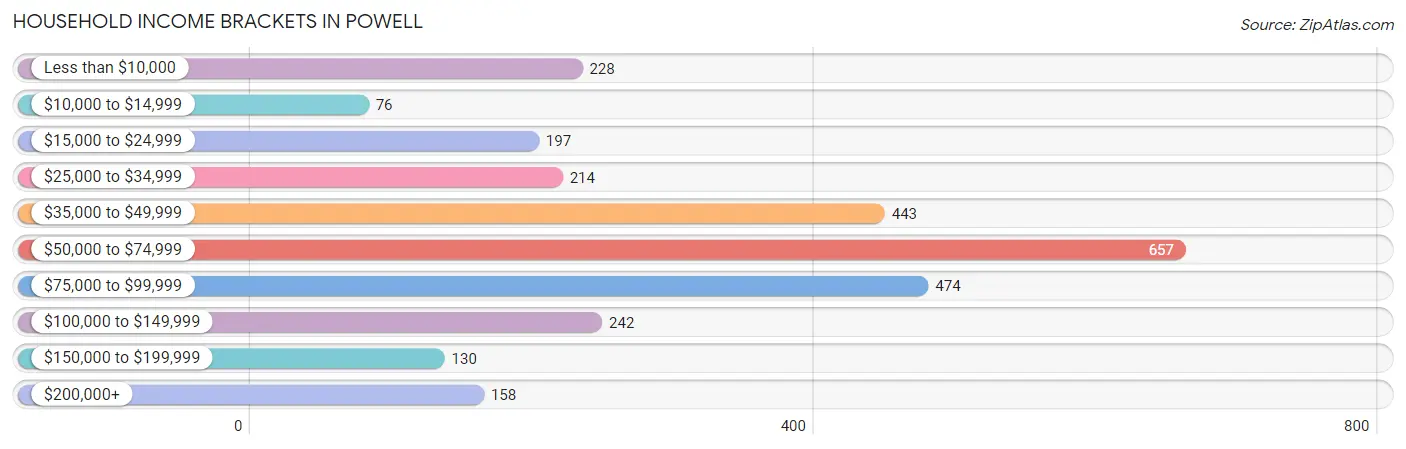
| Income Bracket | # Households | % Households |
| Less than $10,000 | 228 | 8.1% |
| $10,000 to $14,999 | 76 | 2.7% |
| $15,000 to $24,999 | 197 | 7.0% |
| $25,000 to $34,999 | 214 | 7.6% |
| $35,000 to $49,999 | 443 | 15.7% |
| $50,000 to $74,999 | 657 | 23.3% |
| $75,000 to $99,999 | 474 | 16.8% |
| $100,000 to $149,999 | 242 | 8.6% |
| $150,000 to $199,999 | 130 | 4.6% |
| $200,000+ | 158 | 5.6% |
Household Income by Householder Age in Powell
The median household income in Powell is $62,899, with the highest median household income of $68,776 found in the 45 to 64 years age bracket for the primary householder. A total of 934 households (33.1%) fall into this category. Meanwhile, the 15 to 24 years age bracket for the primary householder has the lowest median household income of $41,864, with 151 households (5.4%) in this group.
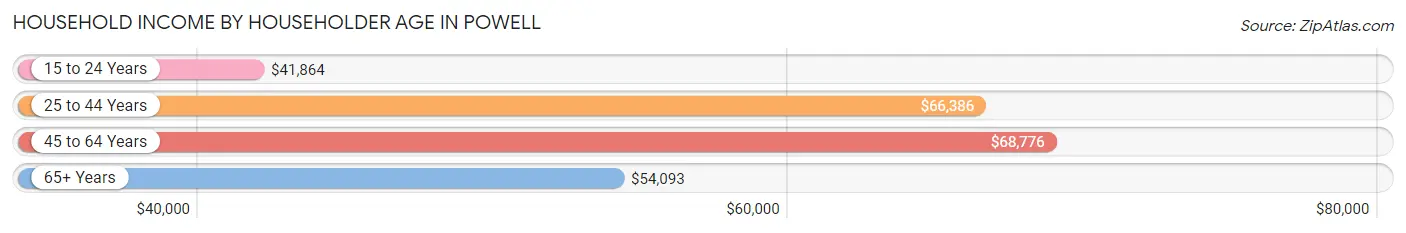
| Income Bracket | # Households | Median Income |
| 15 to 24 Years | 151 (5.4%) | $41,864 |
| 25 to 44 Years | 847 (30.0%) | $66,386 |
| 45 to 64 Years | 934 (33.1%) | $68,776 |
| 65+ Years | 887 (31.5%) | $54,093 |
| Total | 2,819 (100.0%) | $62,899 |
Poverty in Powell
Income Below Poverty by Sex and Age in Powell
With 10.0% poverty level for males and 17.1% for females among the residents of Powell, under 5 year old males and 5 year old females are the most vulnerable to poverty, with 71 males (39.4%) and 64 females (100.0%) in their respective age groups living below the poverty level.
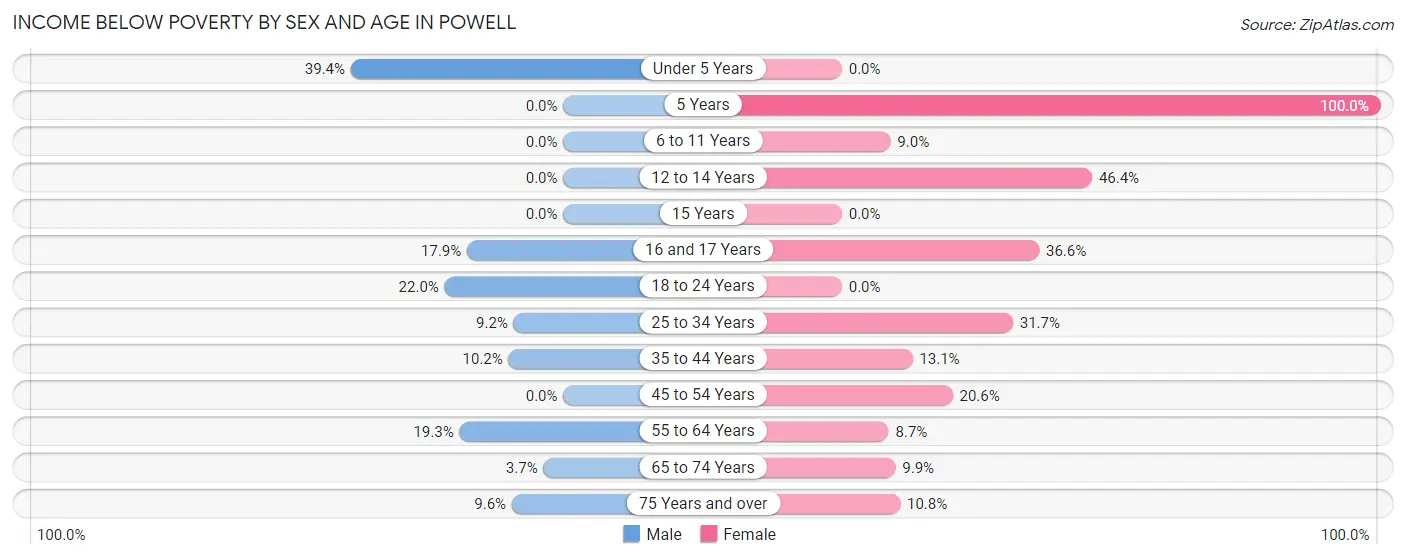
| Age Bracket | Male | Female |
| Under 5 Years | 71 (39.4%) | 0 (0.0%) |
| 5 Years | 0 (0.0%) | 64 (100.0%) |
| 6 to 11 Years | 0 (0.0%) | 23 (9.0%) |
| 12 to 14 Years | 0 (0.0%) | 26 (46.4%) |
| 15 Years | 0 (0.0%) | 0 (0.0%) |
| 16 and 17 Years | 20 (17.9%) | 41 (36.6%) |
| 18 to 24 Years | 50 (22.0%) | 0 (0.0%) |
| 25 to 34 Years | 28 (9.2%) | 159 (31.7%) |
| 35 to 44 Years | 43 (10.2%) | 48 (13.1%) |
| 45 to 54 Years | 0 (0.0%) | 52 (20.5%) |
| 55 to 64 Years | 48 (19.3%) | 38 (8.7%) |
| 65 to 74 Years | 14 (3.7%) | 31 (9.9%) |
| 75 Years and over | 17 (9.6%) | 36 (10.8%) |
| Total | 291 (10.0%) | 518 (17.1%) |
Income Above Poverty by Sex and Age in Powell
According to the poverty statistics in Powell, males aged 6 to 11 years and females aged under 5 years are the age groups that are most secure financially, with 100.0% of males and 100.0% of females in these age groups living above the poverty line.
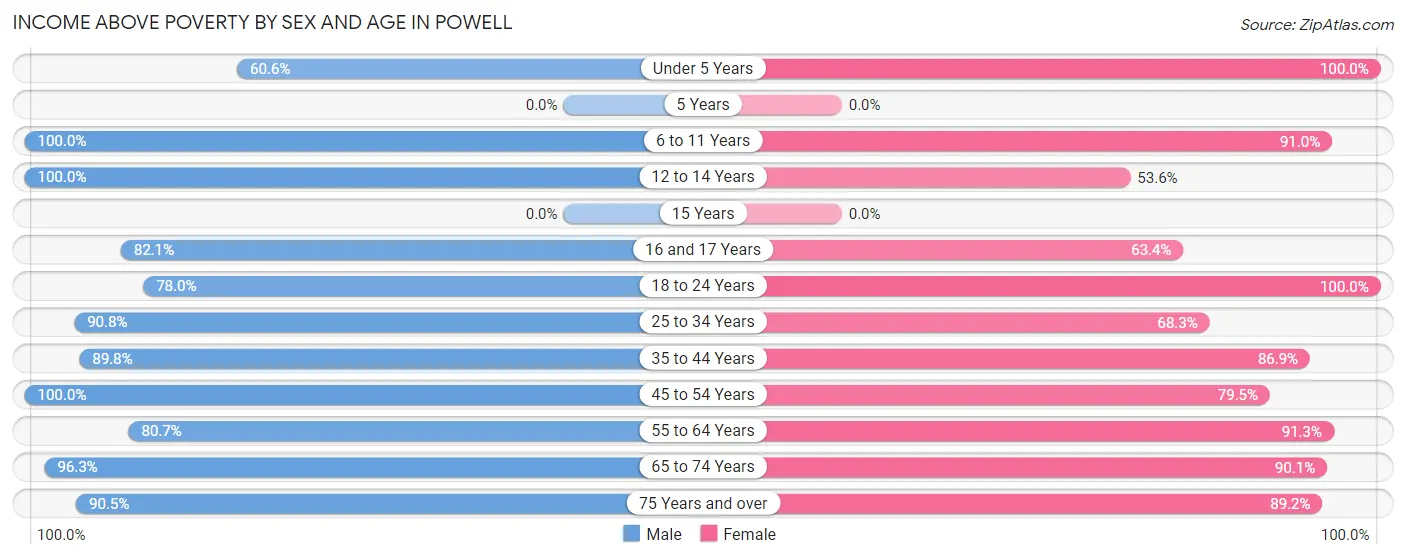
| Age Bracket | Male | Female |
| Under 5 Years | 109 (60.6%) | 157 (100.0%) |
| 5 Years | 0 (0.0%) | 0 (0.0%) |
| 6 to 11 Years | 184 (100.0%) | 232 (91.0%) |
| 12 to 14 Years | 295 (100.0%) | 30 (53.6%) |
| 15 Years | 0 (0.0%) | 0 (0.0%) |
| 16 and 17 Years | 92 (82.1%) | 71 (63.4%) |
| 18 to 24 Years | 177 (78.0%) | 185 (100.0%) |
| 25 to 34 Years | 276 (90.8%) | 342 (68.3%) |
| 35 to 44 Years | 380 (89.8%) | 318 (86.9%) |
| 45 to 54 Years | 394 (100.0%) | 201 (79.4%) |
| 55 to 64 Years | 201 (80.7%) | 400 (91.3%) |
| 65 to 74 Years | 365 (96.3%) | 281 (90.1%) |
| 75 Years and over | 161 (90.4%) | 297 (89.2%) |
| Total | 2,634 (90.0%) | 2,514 (82.9%) |
Income Below Poverty Among Married-Couple Families in Powell
The poverty statistics for married-couple families in Powell show that 4.1% or 49 of the total 1,204 families live below the poverty line. Families with 3 or 4 children have the highest poverty rate of 11.9%, comprising of 16 families. On the other hand, families with no children have the lowest poverty rate of 2.5%, which includes 19 families.
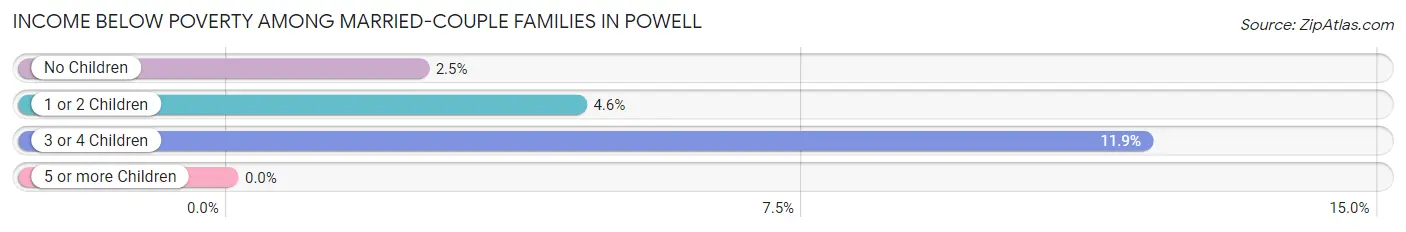
| Children | Above Poverty | Below Poverty |
| No Children | 743 (97.5%) | 19 (2.5%) |
| 1 or 2 Children | 294 (95.5%) | 14 (4.5%) |
| 3 or 4 Children | 118 (88.1%) | 16 (11.9%) |
| 5 or more Children | 0 (0.0%) | 0 (0.0%) |
| Total | 1,155 (95.9%) | 49 (4.1%) |
Income Below Poverty Among Single-Parent Households in Powell
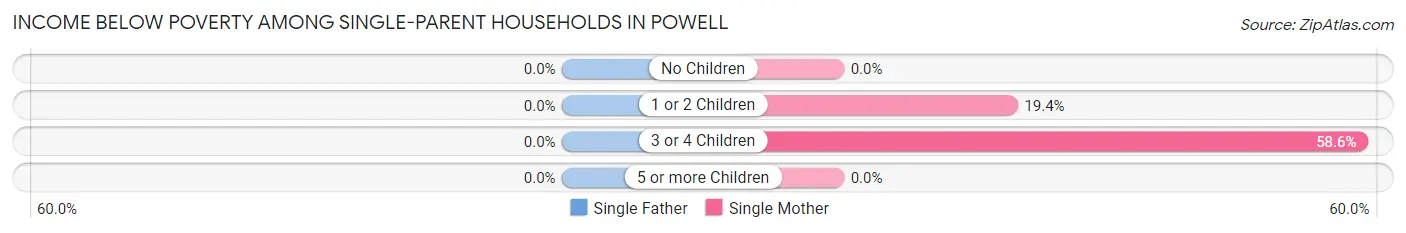
| Children | Single Father | Single Mother |
| No Children | 0 (0.0%) | 0 (0.0%) |
| 1 or 2 Children | 0 (0.0%) | 20 (19.4%) |
| 3 or 4 Children | 0 (0.0%) | 34 (58.6%) |
| 5 or more Children | 0 (0.0%) | 0 (0.0%) |
| Total | 0 (0.0%) | 54 (26.5%) |
Income Below Poverty Among Married-Couple vs Single-Parent Households in Powell
The poverty data for Powell shows that 49 of the married-couple family households (4.1%) and 54 of the single-parent households (15.2%) are living below the poverty level. Within the married-couple family households, those with 3 or 4 children have the highest poverty rate, with 16 households (11.9%) falling below the poverty line. Among the single-parent households, those with 3 or 4 children have the highest poverty rate, with 34 household (58.6%) living below poverty.
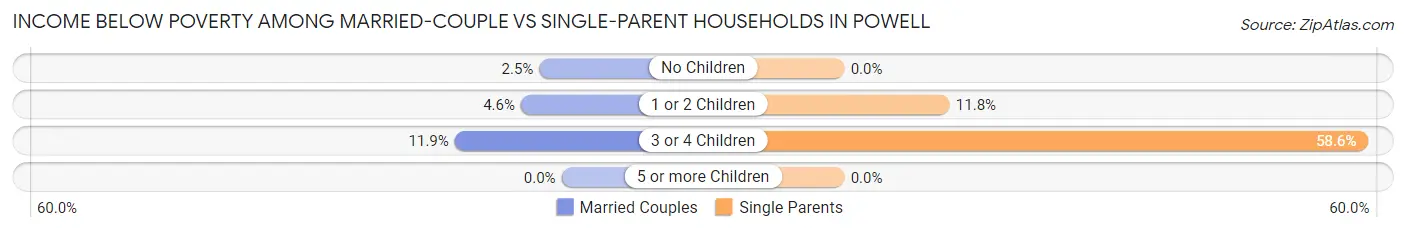
| Children | Married-Couple Families | Single-Parent Households |
| No Children | 19 (2.5%) | 0 (0.0%) |
| 1 or 2 Children | 14 (4.5%) | 20 (11.8%) |
| 3 or 4 Children | 16 (11.9%) | 34 (58.6%) |
| 5 or more Children | 0 (0.0%) | 0 (0.0%) |
| Total | 49 (4.1%) | 54 (15.2%) |
Race in Powell
The most populous races in Powell are White / Caucasian (5,719 | 88.5%), Hispanic or Latino (533 | 8.3%), and Two or more Races (470 | 7.3%).
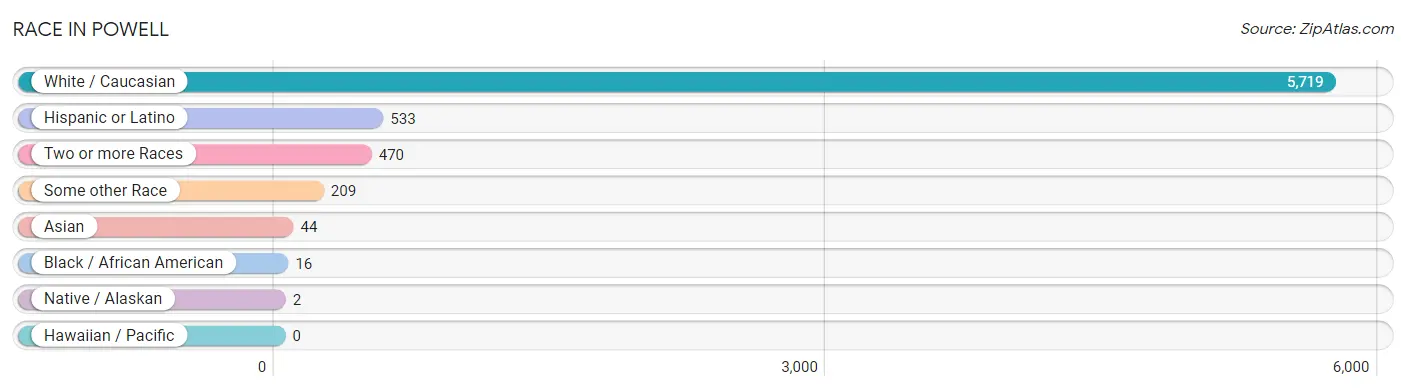
| Race | # Population | % Population |
| Asian | 44 | 0.7% |
| Black / African American | 16 | 0.3% |
| Hawaiian / Pacific | 0 | 0.0% |
| Hispanic or Latino | 533 | 8.3% |
| Native / Alaskan | 2 | 0.0% |
| White / Caucasian | 5,719 | 88.5% |
| Two or more Races | 470 | 7.3% |
| Some other Race | 209 | 3.2% |
| Total | 6,460 | 100.0% |
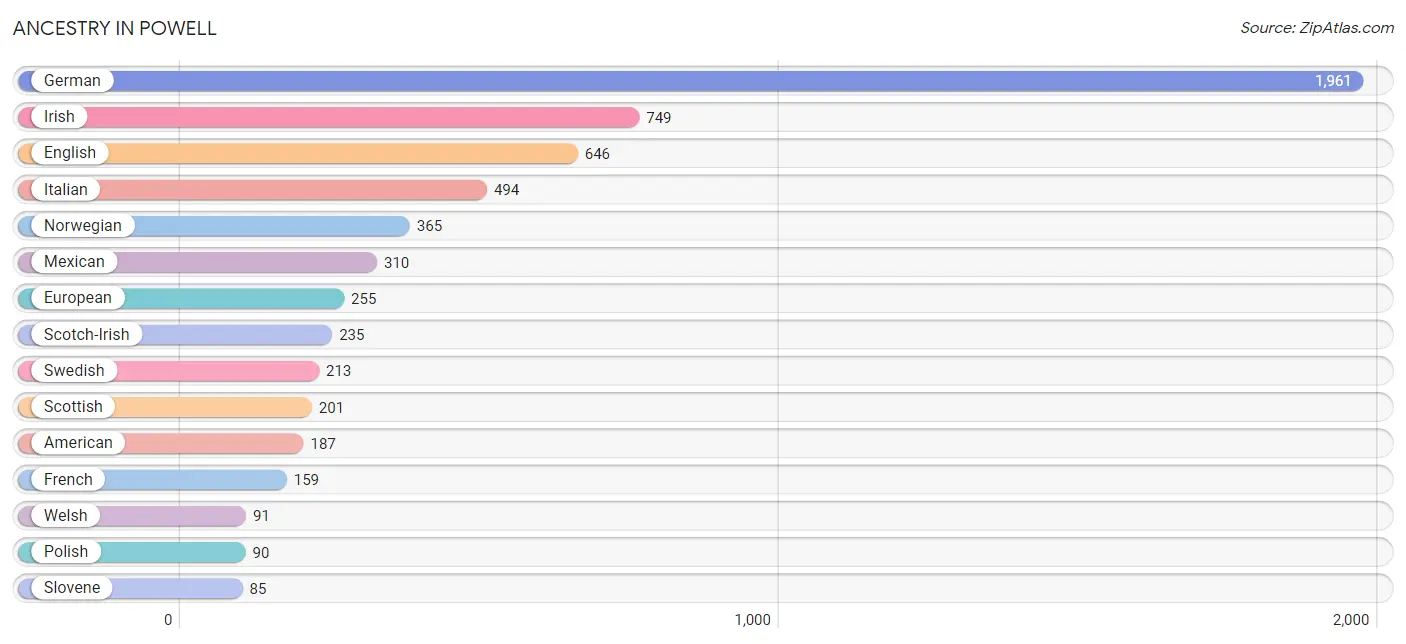
Ancestry in Powell
The most populous ancestries reported in Powell are German (1,961 | 30.4%), Irish (749 | 11.6%), English (646 | 10.0%), Italian (494 | 7.6%), and Norwegian (365 | 5.7%), together accounting for 65.2% of all Powell residents.
| Ancestry | # Population | % Population |
| African | 2 | 0.0% |
| American | 187 | 2.9% |
| Arab | 2 | 0.0% |
| Austrian | 24 | 0.4% |
| Belgian | 2 | 0.0% |
| Bhutanese | 15 | 0.2% |
| Brazilian | 2 | 0.0% |
| British | 29 | 0.4% |
| Burmese | 4 | 0.1% |
| Canadian | 14 | 0.2% |
| Central American | 42 | 0.6% |
| Cheyenne | 2 | 0.0% |
| Croatian | 62 | 1.0% |
| Crow | 7 | 0.1% |
| Czech | 13 | 0.2% |
| Danish | 66 | 1.0% |
| Dutch | 83 | 1.3% |
| Eastern European | 11 | 0.2% |
| English | 646 | 10.0% |
| European | 255 | 4.0% |
| Finnish | 2 | 0.0% |
| French | 159 | 2.5% |
| French Canadian | 6 | 0.1% |
| German | 1,961 | 30.4% |
| German Russian | 48 | 0.7% |
| Greek | 8 | 0.1% |
| Guatemalan | 7 | 0.1% |
| Hungarian | 3 | 0.1% |
| Indian (Asian) | 40 | 0.6% |
| Irish | 749 | 11.6% |
| Italian | 494 | 7.6% |
| Jamaican | 1 | 0.0% |
| Korean | 36 | 0.6% |
| Lebanese | 2 | 0.0% |
| Mexican | 310 | 4.8% |
| Native Hawaiian | 54 | 0.8% |
| Northern European | 12 | 0.2% |
| Norwegian | 365 | 5.7% |
| Panamanian | 35 | 0.5% |
| Pennsylvania German | 14 | 0.2% |
| Polish | 90 | 1.4% |
| Russian | 27 | 0.4% |
| Samoan | 2 | 0.0% |
| Scandinavian | 29 | 0.4% |
| Scotch-Irish | 235 | 3.6% |
| Scottish | 201 | 3.1% |
| Slavic | 4 | 0.1% |
| Slovak | 13 | 0.2% |
| Slovene | 85 | 1.3% |
| Spaniard | 25 | 0.4% |
| Subsaharan African | 4 | 0.1% |
| Swedish | 213 | 3.3% |
| Swiss | 4 | 0.1% |
| Welsh | 91 | 1.4% | View All 54 Rows |
Immigrants in Powell
The most numerous immigrant groups reported in Powell came from Asia (41 | 0.6%), Philippines (36 | 0.6%), South Eastern Asia (36 | 0.6%), Latin America (27 | 0.4%), and Central America (24 | 0.4%), together accounting for 2.5% of all Powell residents.
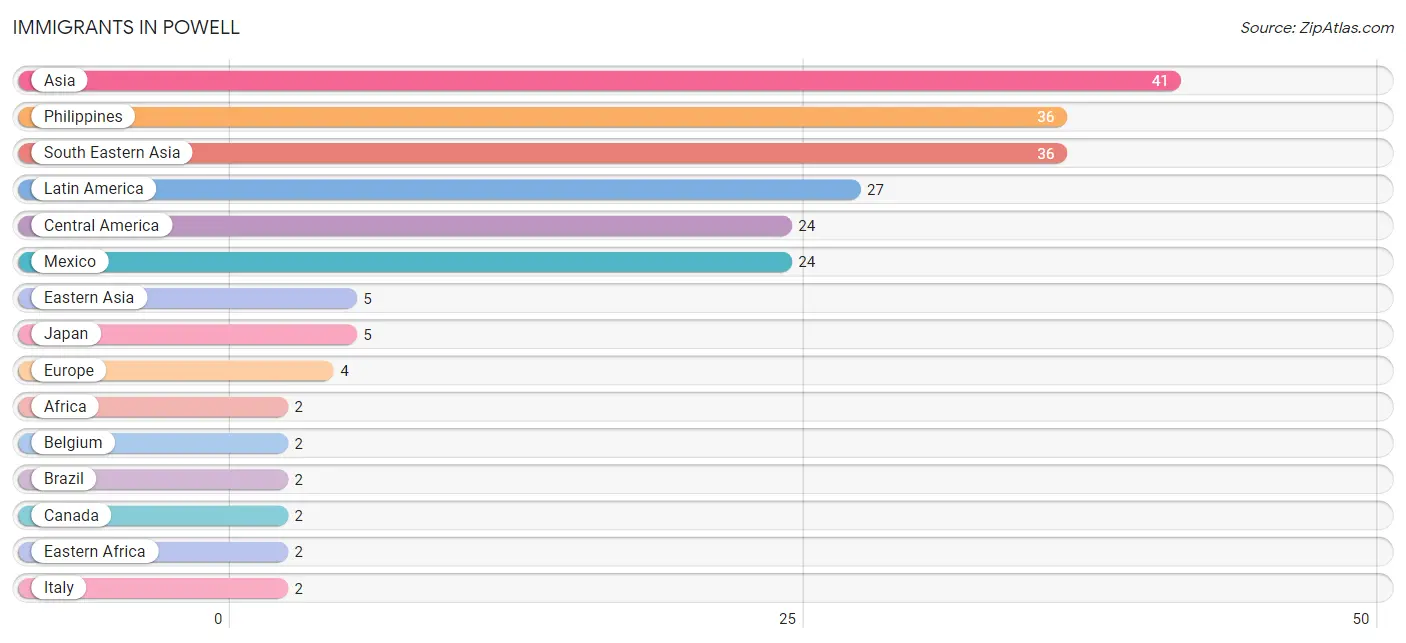
| Immigration Origin | # Population | % Population |
| Africa | 2 | 0.0% |
| Asia | 41 | 0.6% |
| Belgium | 2 | 0.0% |
| Brazil | 2 | 0.0% |
| Canada | 2 | 0.0% |
| Caribbean | 1 | 0.0% |
| Central America | 24 | 0.4% |
| Eastern Africa | 2 | 0.0% |
| Eastern Asia | 5 | 0.1% |
| Europe | 4 | 0.1% |
| Italy | 2 | 0.0% |
| Jamaica | 1 | 0.0% |
| Japan | 5 | 0.1% |
| Latin America | 27 | 0.4% |
| Mexico | 24 | 0.4% |
| Oceania | 2 | 0.0% |
| Philippines | 36 | 0.6% |
| South America | 2 | 0.0% |
| South Eastern Asia | 36 | 0.6% |
| Southern Europe | 2 | 0.0% |
| Western Europe | 2 | 0.0% | View All 21 Rows |
Sex and Age in Powell
Sex and Age in Powell
The most populous age groups in Powell are 15 to 19 Years (348 | 11.1%) for men and 15 to 19 Years (376 | 11.3%) for women.
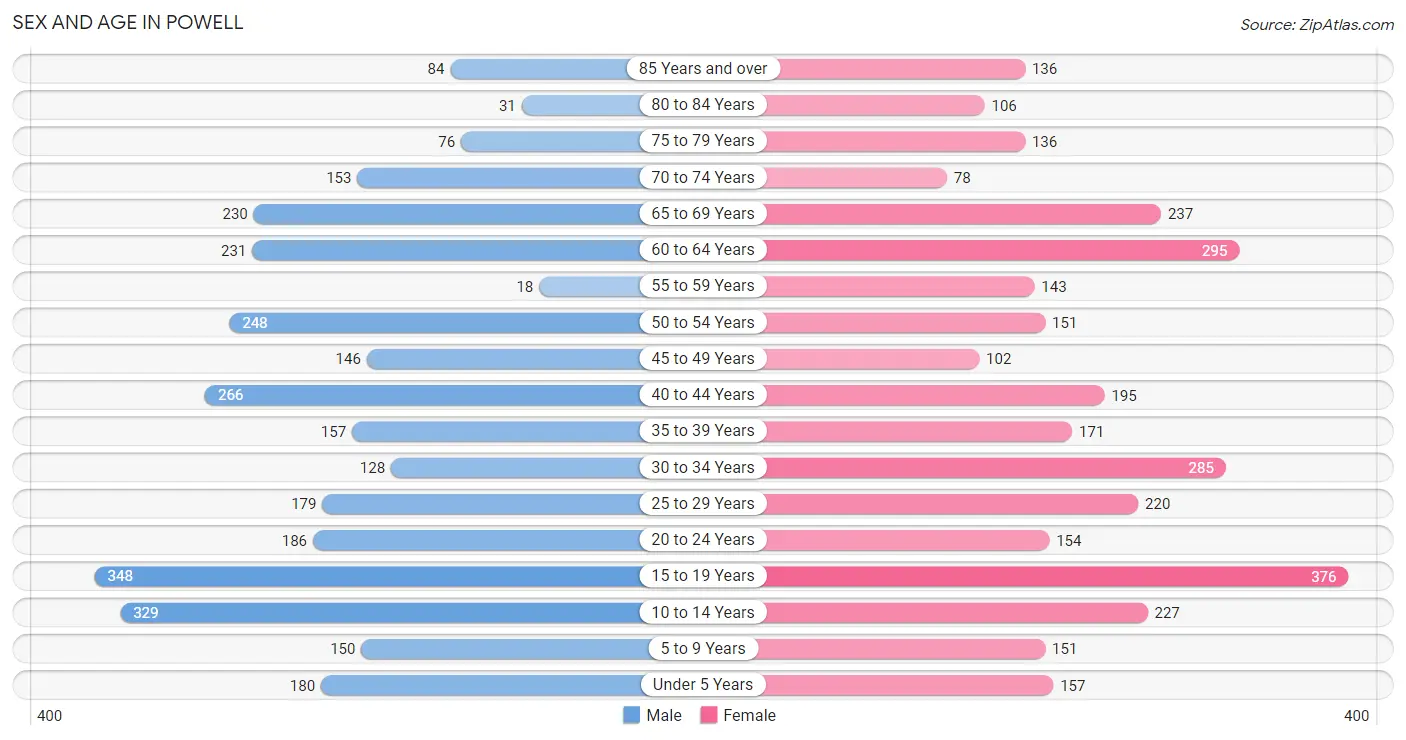
| Age Bracket | Male | Female |
| Under 5 Years | 180 (5.7%) | 157 (4.7%) |
| 5 to 9 Years | 150 (4.8%) | 151 (4.5%) |
| 10 to 14 Years | 329 (10.5%) | 227 (6.8%) |
| 15 to 19 Years | 348 (11.1%) | 376 (11.3%) |
| 20 to 24 Years | 186 (5.9%) | 154 (4.6%) |
| 25 to 29 Years | 179 (5.7%) | 220 (6.6%) |
| 30 to 34 Years | 128 (4.1%) | 285 (8.6%) |
| 35 to 39 Years | 157 (5.0%) | 171 (5.1%) |
| 40 to 44 Years | 266 (8.5%) | 195 (5.9%) |
| 45 to 49 Years | 146 (4.6%) | 102 (3.1%) |
| 50 to 54 Years | 248 (7.9%) | 151 (4.5%) |
| 55 to 59 Years | 18 (0.6%) | 143 (4.3%) |
| 60 to 64 Years | 231 (7.4%) | 295 (8.9%) |
| 65 to 69 Years | 230 (7.3%) | 237 (7.1%) |
| 70 to 74 Years | 153 (4.9%) | 78 (2.4%) |
| 75 to 79 Years | 76 (2.4%) | 136 (4.1%) |
| 80 to 84 Years | 31 (1.0%) | 106 (3.2%) |
| 85 Years and over | 84 (2.7%) | 136 (4.1%) |
| Total | 3,140 (100.0%) | 3,320 (100.0%) |
Families and Households in Powell
Median Family Size in Powell
The median family size in Powell is 2.87 persons per family, with single female/mother families (204 | 13.1%) accounting for the largest median family size of 3.39 persons per family. On the other hand, single male/father families (151 | 9.7%) represent the smallest median family size with 2.77 persons per family.
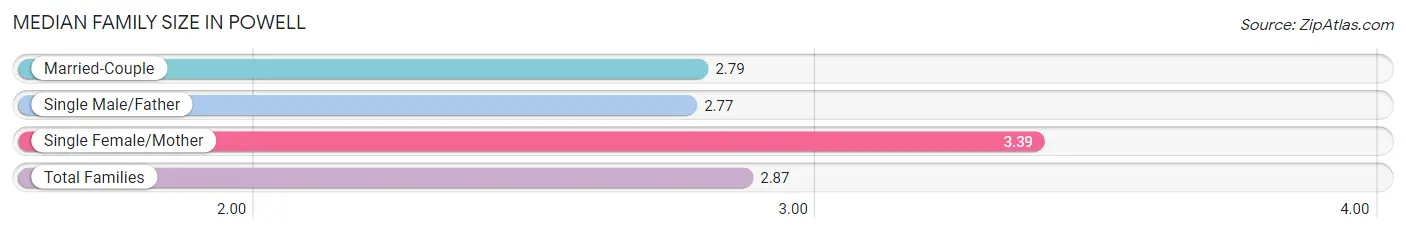
| Family Type | # Families | Family Size |
| Married-Couple | 1,204 (77.2%) | 2.79 |
| Single Male/Father | 151 (9.7%) | 2.77 |
| Single Female/Mother | 204 (13.1%) | 3.39 |
| Total Families | 1,559 (100.0%) | 2.87 |
Median Household Size in Powell
The median household size in Powell is 2.11 persons per household, with single female/mother households (204 | 7.2%) accounting for the largest median household size of 3.7 persons per household. non-family households (1,260 | 44.7%) represent the smallest median household size with 1.07 persons per household.
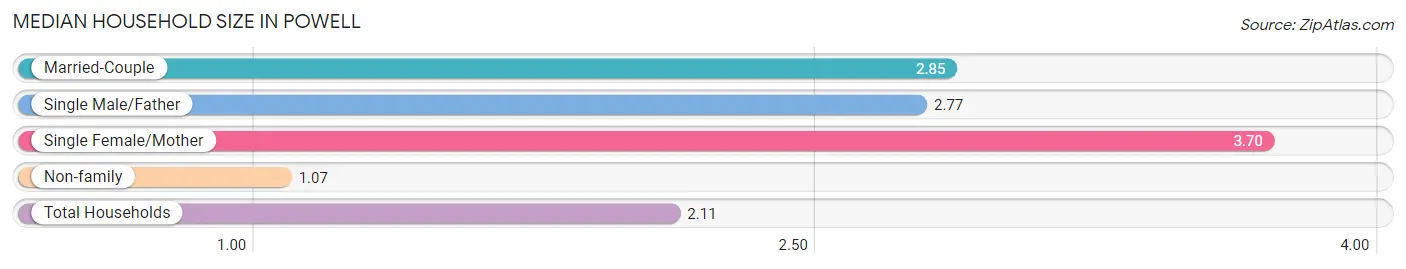
| Household Type | # Households | Household Size |
| Married-Couple | 1,204 (42.7%) | 2.85 |
| Single Male/Father | 151 (5.4%) | 2.77 |
| Single Female/Mother | 204 (7.2%) | 3.70 |
| Non-family | 1,260 (44.7%) | 1.07 |
| Total Households | 2,819 (100.0%) | 2.11 |
Household Size by Marriage Status in Powell
Out of a total of 2,819 households in Powell, 1,559 (55.3%) are family households, while 1,260 (44.7%) are nonfamily households. The most numerous type of family households are 2-person households, comprising 854, and the most common type of nonfamily households are 1-person households, comprising 1,197.
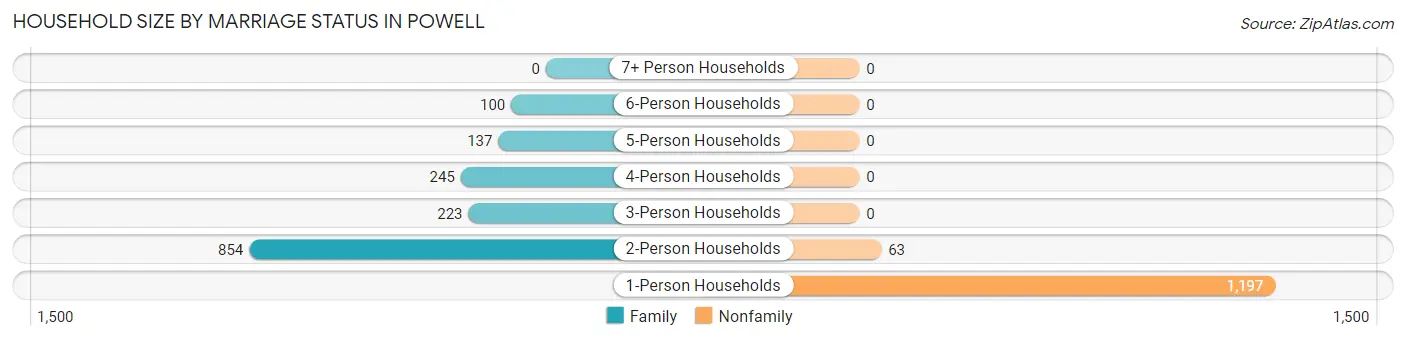
| Household Size | Family Households | Nonfamily Households |
| 1-Person Households | - | 1,197 (42.5%) |
| 2-Person Households | 854 (30.3%) | 63 (2.2%) |
| 3-Person Households | 223 (7.9%) | 0 (0.0%) |
| 4-Person Households | 245 (8.7%) | 0 (0.0%) |
| 5-Person Households | 137 (4.9%) | 0 (0.0%) |
| 6-Person Households | 100 (3.5%) | 0 (0.0%) |
| 7+ Person Households | 0 (0.0%) | 0 (0.0%) |
| Total | 1,559 (55.3%) | 1,260 (44.7%) |
Female Fertility in Powell
Fertility by Age in Powell
Average fertility rate in Powell is 63.0 births per 1,000 women. Women in the age bracket of 20 to 34 years have the highest fertility rate with 146.0 births per 1,000 women. Women in the age bracket of 20 to 34 years acount for 100.0% of all women with births.
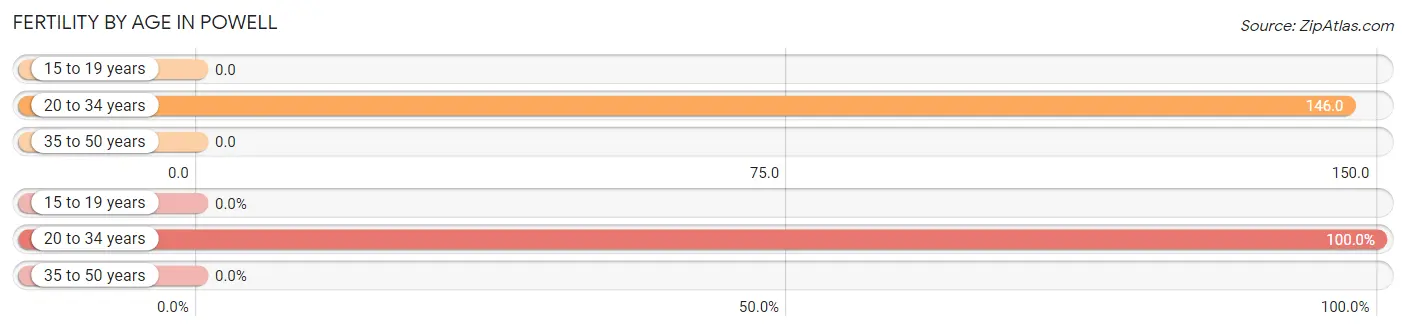
| Age Bracket | Women with Births | Births / 1,000 Women |
| 15 to 19 years | 0 (0.0%) | 0.0 |
| 20 to 34 years | 96 (100.0%) | 146.0 |
| 35 to 50 years | 0 (0.0%) | 0.0 |
| Total | 96 (100.0%) | 63.0 |
Fertility by Age by Marriage Status in Powell
49.0% of women with births (96) in Powell are married. The highest percentage of unmarried women with births falls into 20 to 34 years age bracket with 51.0% of them unmarried at the time of birth, while the lowest percentage of unmarried women with births belong to 20 to 34 years age bracket with 51.0% of them unmarried.
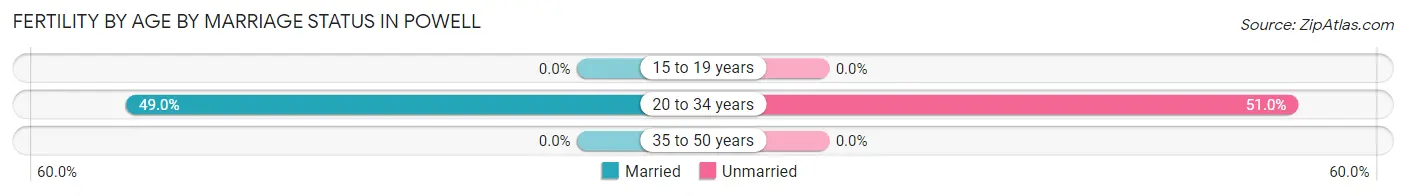
| Age Bracket | Married | Unmarried |
| 15 to 19 years | 0 (0.0%) | 0 (0.0%) |
| 20 to 34 years | 47 (49.0%) | 49 (51.0%) |
| 35 to 50 years | 0 (0.0%) | 0 (0.0%) |
| Total | 47 (49.0%) | 49 (51.0%) |
Fertility by Education in Powell
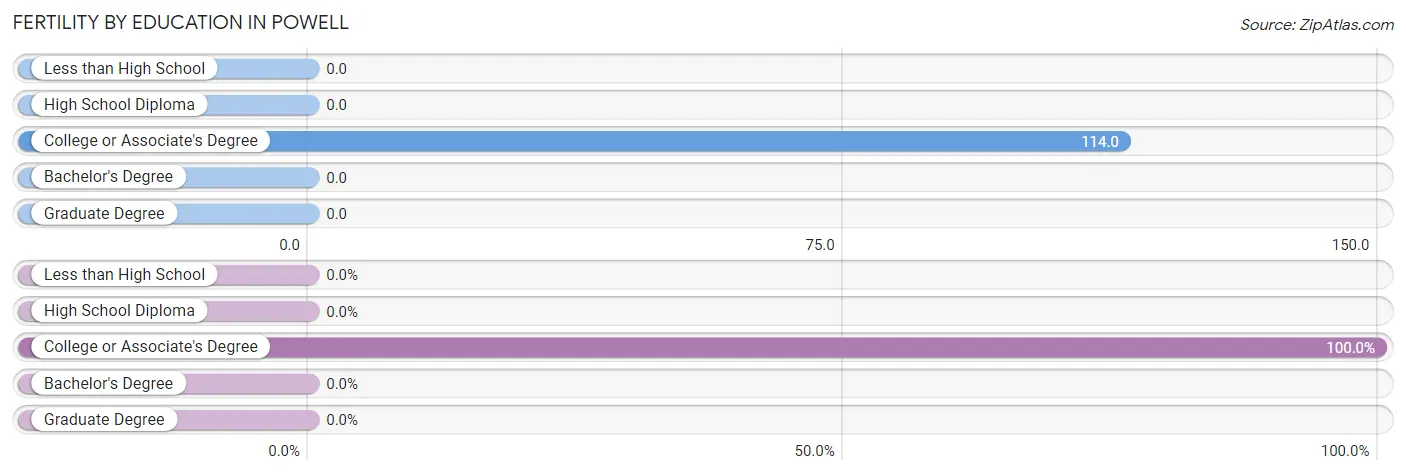
| Educational Attainment | Women with Births | Births / 1,000 Women |
| Less than High School | 0 (0.0%) | 0.0 |
| High School Diploma | 0 (0.0%) | 0.0 |
| College or Associate's Degree | 96 (100.0%) | 114.0 |
| Bachelor's Degree | 0 (0.0%) | 0.0 |
| Graduate Degree | 0 (0.0%) | 0.0 |
| Total | 96 (100.0%) | 63.0 |
Fertility by Education by Marriage Status in Powell
51.0% of women with births in Powell are unmarried. Women with the educational attainment of college or associate's degree are most likely to be married with 49.0% of them married at childbirth, while women with the educational attainment of college or associate's degree are least likely to be married with 51.0% of them unmarried at childbirth.
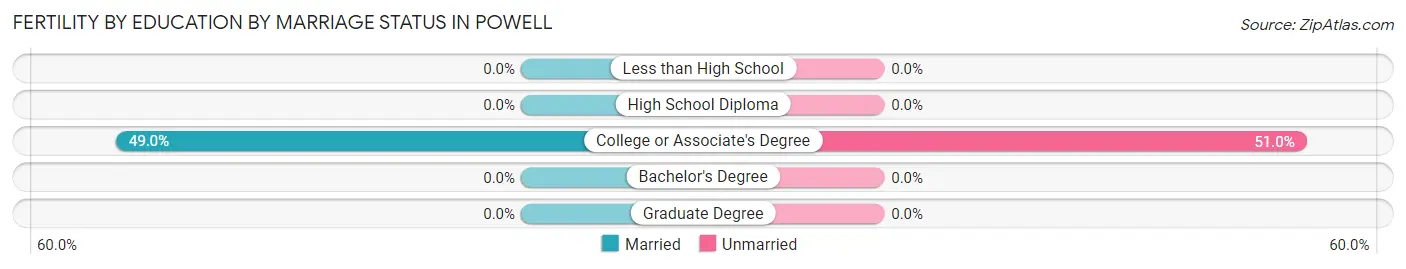
| Educational Attainment | Married | Unmarried |
| Less than High School | 0 (0.0%) | 0 (0.0%) |
| High School Diploma | 0 (0.0%) | 0 (0.0%) |
| College or Associate's Degree | 47 (49.0%) | 49 (51.0%) |
| Bachelor's Degree | 0 (0.0%) | 0 (0.0%) |
| Graduate Degree | 0 (0.0%) | 0 (0.0%) |
| Total | 47 (49.0%) | 49 (51.0%) |
Employment Characteristics in Powell
Employment by Class of Employer in Powell
Among the 2,710 employed individuals in Powell, private company employees (1,390 | 51.3%), local government employees (400 | 14.8%), and state government employees (244 | 9.0%) make up the most common classes of employment.
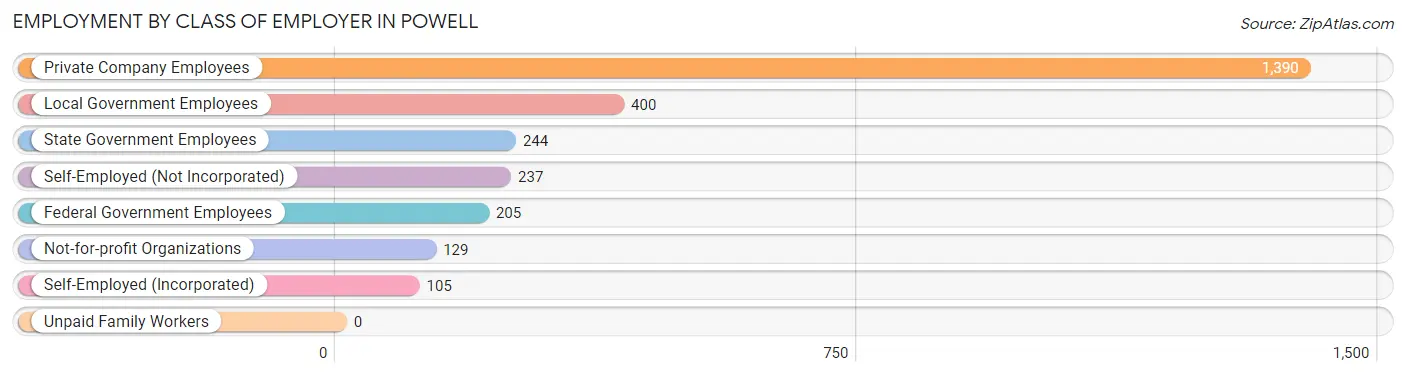
| Employer Class | # Employees | % Employees |
| Private Company Employees | 1,390 | 51.3% |
| Self-Employed (Incorporated) | 105 | 3.9% |
| Self-Employed (Not Incorporated) | 237 | 8.7% |
| Not-for-profit Organizations | 129 | 4.8% |
| Local Government Employees | 400 | 14.8% |
| State Government Employees | 244 | 9.0% |
| Federal Government Employees | 205 | 7.6% |
| Unpaid Family Workers | 0 | 0.0% |
| Total | 2,710 | 100.0% |
Employment Status by Age in Powell
According to the labor force statistics for Powell, out of the total population over 16 years of age (5,266), 57.3% or 3,017 individuals are in the labor force, with 6.4% or 193 of them unemployed. The age group with the highest labor force participation rate is 45 to 54 years, with 94.6% or 612 individuals in the labor force. Within the labor force, the 16 to 19 years age range has the highest percentage of unemployed individuals, with 25.7% or 78 of them being unemployed.
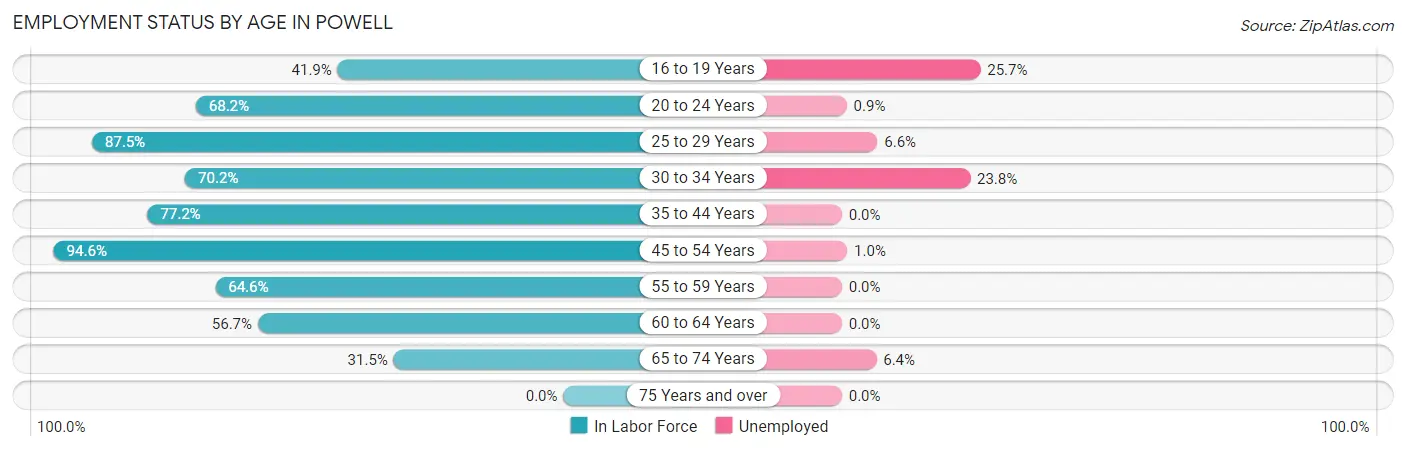
| Age Bracket | In Labor Force | Unemployed |
| 16 to 19 Years | 303 (41.9%) | 78 (25.7%) |
| 20 to 24 Years | 232 (68.2%) | 2 (0.9%) |
| 25 to 29 Years | 349 (87.5%) | 23 (6.6%) |
| 30 to 34 Years | 290 (70.2%) | 69 (23.8%) |
| 35 to 44 Years | 609 (77.2%) | 0 (0.0%) |
| 45 to 54 Years | 612 (94.6%) | 6 (1.0%) |
| 55 to 59 Years | 104 (64.6%) | 0 (0.0%) |
| 60 to 64 Years | 298 (56.7%) | 0 (0.0%) |
| 65 to 74 Years | 220 (31.5%) | 14 (6.4%) |
| 75 Years and over | 0 (0.0%) | 0 (0.0%) |
| Total | 3,017 (57.3%) | 193 (6.4%) |
Employment Status by Educational Attainment in Powell
According to labor force statistics for Powell, 77.1% of individuals (2,263) out of the total population between 25 and 64 years of age (2,935) are in the labor force, with 4.3% or 97 of them being unemployed. The group with the highest labor force participation rate are those with the educational attainment of less than high school, with 100.0% or 134 individuals in the labor force. Within the labor force, individuals with less than high school education have the highest percentage of unemployment, with 51.5% or 69 of them being unemployed.
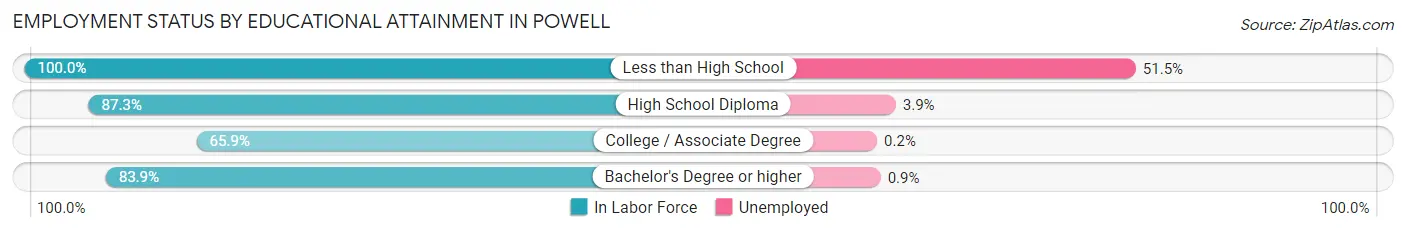
| Educational Attainment | In Labor Force | Unemployed |
| Less than High School | 134 (100.0%) | 69 (51.5%) |
| High School Diploma | 542 (87.3%) | 24 (3.9%) |
| College / Associate Degree | 892 (65.9%) | 3 (0.2%) |
| Bachelor's Degree or higher | 694 (83.9%) | 7 (0.9%) |
| Total | 2,263 (77.1%) | 126 (4.3%) |
Employment Occupations by Sex in Powell
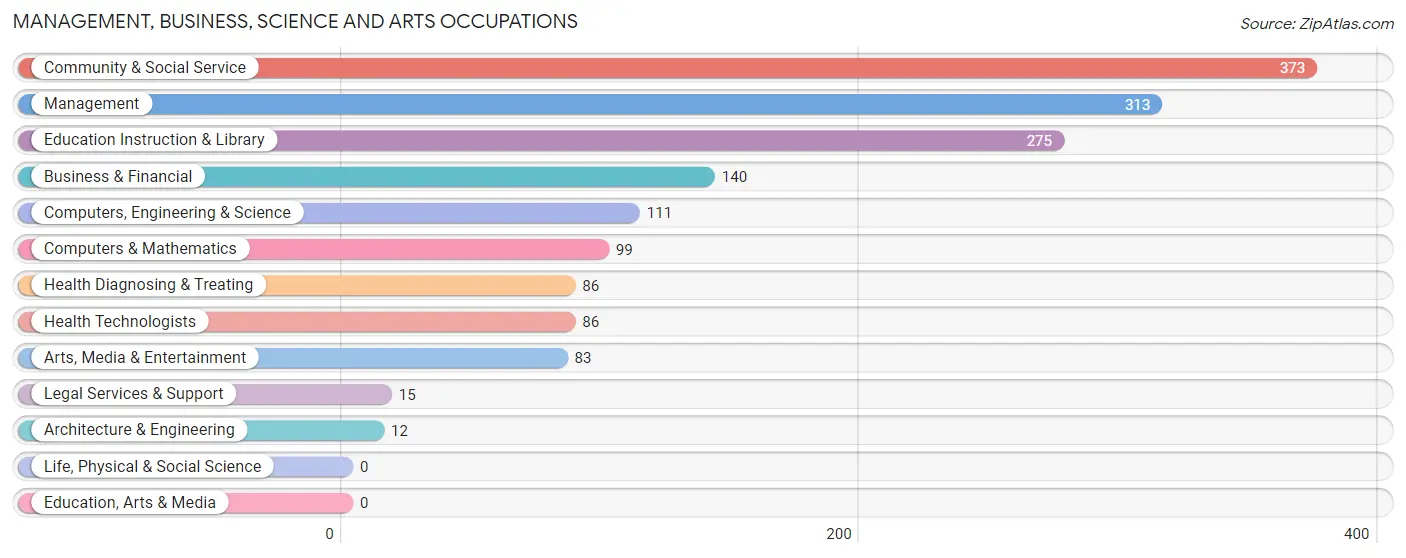
Management, Business, Science and Arts Occupations
The most common Management, Business, Science and Arts occupations in Powell are Community & Social Service (373 | 13.2%), Management (313 | 11.1%), Education Instruction & Library (275 | 9.7%), Business & Financial (140 | 5.0%), and Computers, Engineering & Science (111 | 3.9%).
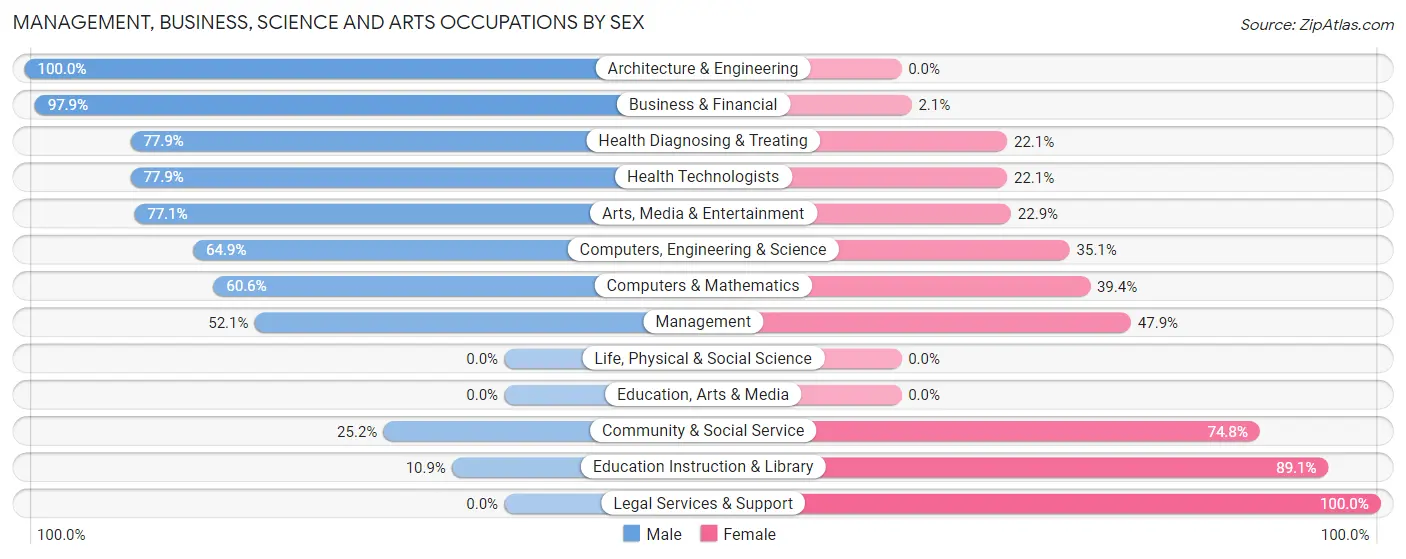
Management, Business, Science and Arts Occupations by Sex
Within the Management, Business, Science and Arts occupations in Powell, the most male-oriented occupations are Architecture & Engineering (100.0%), Business & Financial (97.9%), and Health Diagnosing & Treating (77.9%), while the most female-oriented occupations are Legal Services & Support (100.0%), Education Instruction & Library (89.1%), and Community & Social Service (74.8%).
| Occupation | Male | Female |
| Management | 163 (52.1%) | 150 (47.9%) |
| Business & Financial | 137 (97.9%) | 3 (2.1%) |
| Computers, Engineering & Science | 72 (64.9%) | 39 (35.1%) |
| Computers & Mathematics | 60 (60.6%) | 39 (39.4%) |
| Architecture & Engineering | 12 (100.0%) | 0 (0.0%) |
| Life, Physical & Social Science | 0 (0.0%) | 0 (0.0%) |
| Community & Social Service | 94 (25.2%) | 279 (74.8%) |
| Education, Arts & Media | 0 (0.0%) | 0 (0.0%) |
| Legal Services & Support | 0 (0.0%) | 15 (100.0%) |
| Education Instruction & Library | 30 (10.9%) | 245 (89.1%) |
| Arts, Media & Entertainment | 64 (77.1%) | 19 (22.9%) |
| Health Diagnosing & Treating | 67 (77.9%) | 19 (22.1%) |
| Health Technologists | 67 (77.9%) | 19 (22.1%) |
| Total (Category) | 533 (52.1%) | 490 (47.9%) |
| Total (Overall) | 1,579 (55.9%) | 1,246 (44.1%) |
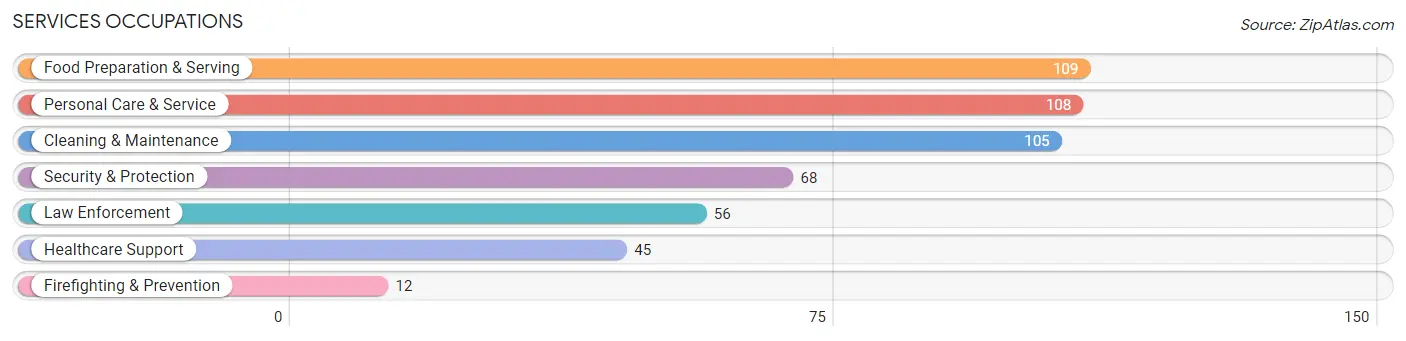
Services Occupations
The most common Services occupations in Powell are Food Preparation & Serving (109 | 3.9%), Personal Care & Service (108 | 3.8%), Cleaning & Maintenance (105 | 3.7%), Security & Protection (68 | 2.4%), and Law Enforcement (56 | 2.0%).
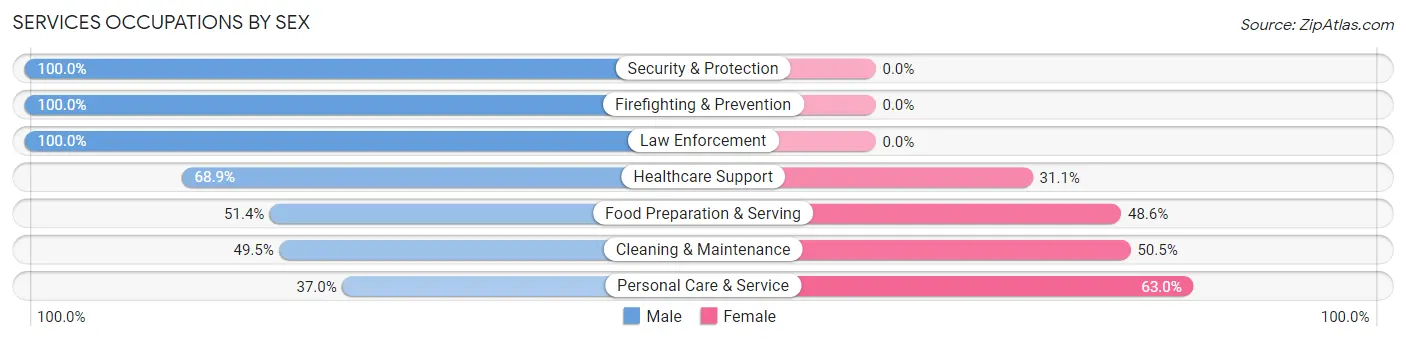
Services Occupations by Sex
Within the Services occupations in Powell, the most male-oriented occupations are Security & Protection (100.0%), Firefighting & Prevention (100.0%), and Law Enforcement (100.0%), while the most female-oriented occupations are Personal Care & Service (63.0%), Cleaning & Maintenance (50.5%), and Food Preparation & Serving (48.6%).
| Occupation | Male | Female |
| Healthcare Support | 31 (68.9%) | 14 (31.1%) |
| Security & Protection | 68 (100.0%) | 0 (0.0%) |
| Firefighting & Prevention | 12 (100.0%) | 0 (0.0%) |
| Law Enforcement | 56 (100.0%) | 0 (0.0%) |
| Food Preparation & Serving | 56 (51.4%) | 53 (48.6%) |
| Cleaning & Maintenance | 52 (49.5%) | 53 (50.5%) |
| Personal Care & Service | 40 (37.0%) | 68 (63.0%) |
| Total (Category) | 247 (56.8%) | 188 (43.2%) |
| Total (Overall) | 1,579 (55.9%) | 1,246 (44.1%) |
Sales and Office Occupations
The most common Sales and Office occupations in Powell are Office & Administration (421 | 14.9%), and Sales & Related (147 | 5.2%).

Sales and Office Occupations by Sex
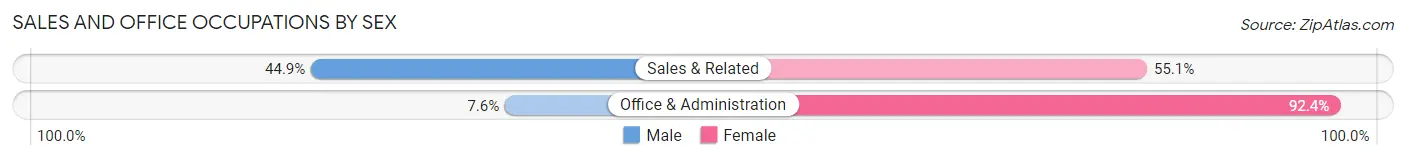
| Occupation | Male | Female |
| Sales & Related | 66 (44.9%) | 81 (55.1%) |
| Office & Administration | 32 (7.6%) | 389 (92.4%) |
| Total (Category) | 98 (17.2%) | 470 (82.8%) |
| Total (Overall) | 1,579 (55.9%) | 1,246 (44.1%) |
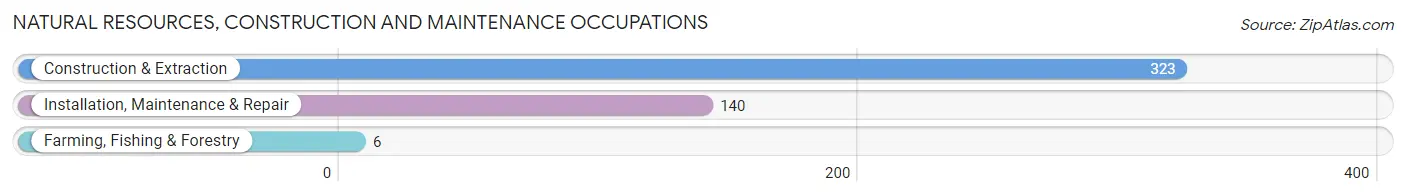
Natural Resources, Construction and Maintenance Occupations
The most common Natural Resources, Construction and Maintenance occupations in Powell are Construction & Extraction (323 | 11.4%), Installation, Maintenance & Repair (140 | 5.0%), and Farming, Fishing & Forestry (6 | 0.2%).
Natural Resources, Construction and Maintenance Occupations by Sex
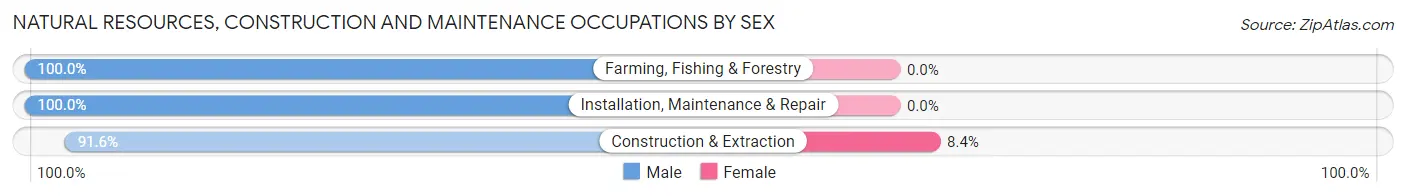
| Occupation | Male | Female |
| Farming, Fishing & Forestry | 6 (100.0%) | 0 (0.0%) |
| Construction & Extraction | 296 (91.6%) | 27 (8.4%) |
| Installation, Maintenance & Repair | 140 (100.0%) | 0 (0.0%) |
| Total (Category) | 442 (94.2%) | 27 (5.8%) |
| Total (Overall) | 1,579 (55.9%) | 1,246 (44.1%) |
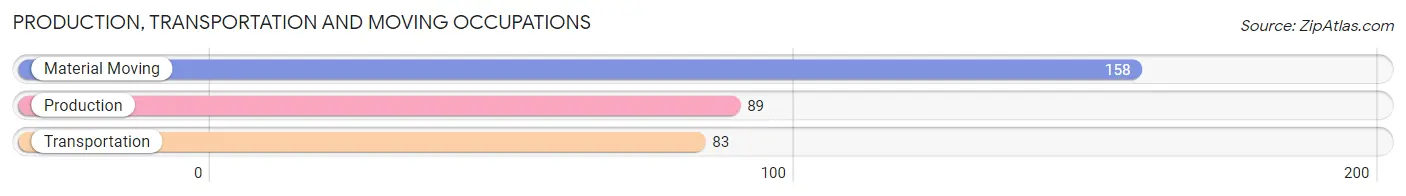
Production, Transportation and Moving Occupations
The most common Production, Transportation and Moving occupations in Powell are Material Moving (158 | 5.6%), Production (89 | 3.2%), and Transportation (83 | 2.9%).
Production, Transportation and Moving Occupations by Sex
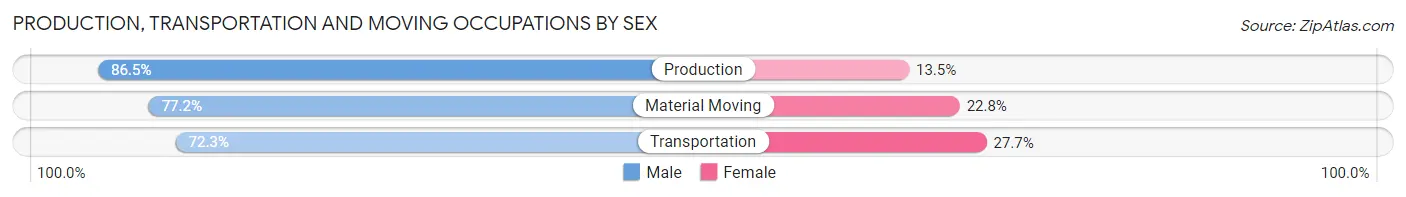
| Occupation | Male | Female |
| Production | 77 (86.5%) | 12 (13.5%) |
| Transportation | 60 (72.3%) | 23 (27.7%) |
| Material Moving | 122 (77.2%) | 36 (22.8%) |
| Total (Category) | 259 (78.5%) | 71 (21.5%) |
| Total (Overall) | 1,579 (55.9%) | 1,246 (44.1%) |
Employment Industries by Sex in Powell
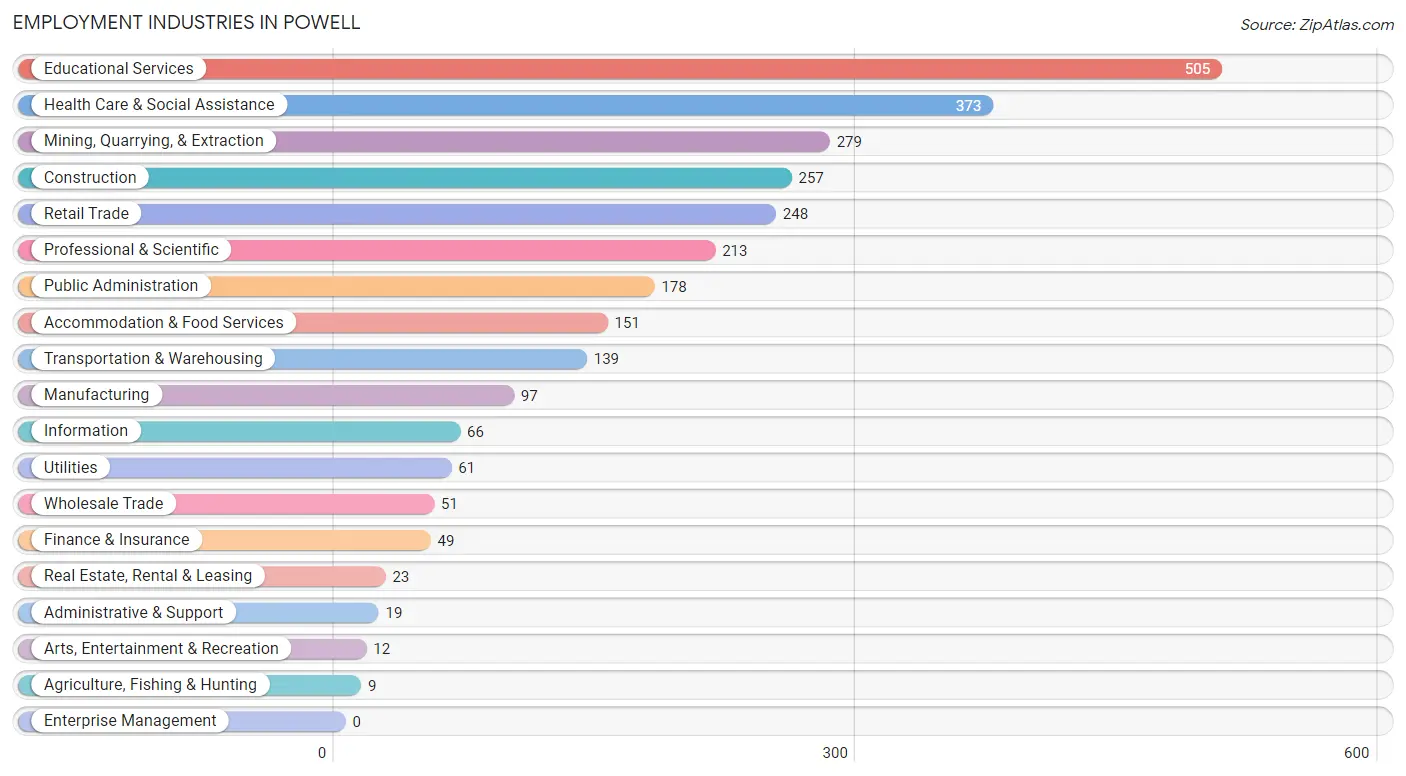
Employment Industries in Powell
The major employment industries in Powell include Educational Services (505 | 17.9%), Health Care & Social Assistance (373 | 13.2%), Mining, Quarrying, & Extraction (279 | 9.9%), Construction (257 | 9.1%), and Retail Trade (248 | 8.8%).
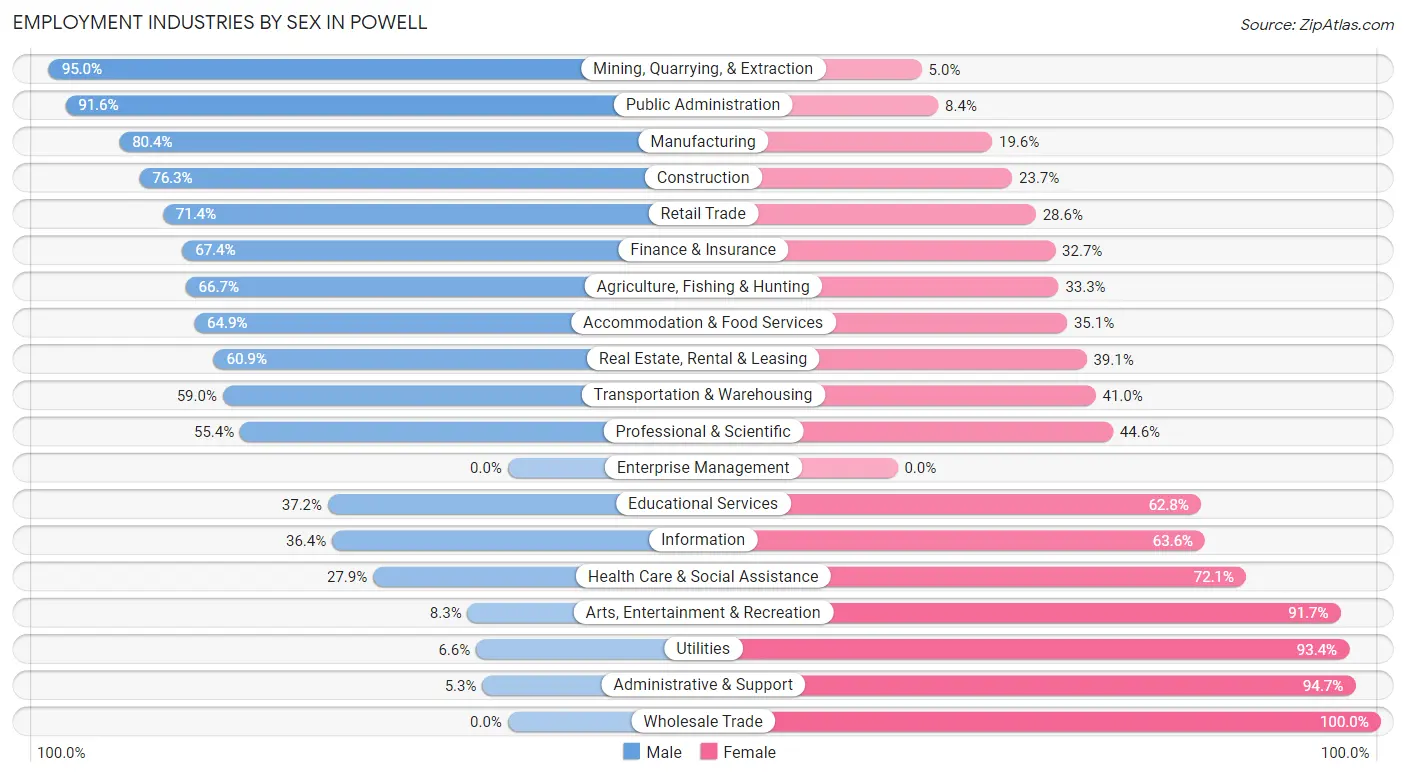
Employment Industries by Sex in Powell
The Powell industries that see more men than women are Mining, Quarrying, & Extraction (95.0%), Public Administration (91.6%), and Manufacturing (80.4%), whereas the industries that tend to have a higher number of women are Wholesale Trade (100.0%), Administrative & Support (94.7%), and Utilities (93.4%).
| Industry | Male | Female |
| Agriculture, Fishing & Hunting | 6 (66.7%) | 3 (33.3%) |
| Mining, Quarrying, & Extraction | 265 (95.0%) | 14 (5.0%) |
| Construction | 196 (76.3%) | 61 (23.7%) |
| Manufacturing | 78 (80.4%) | 19 (19.6%) |
| Wholesale Trade | 0 (0.0%) | 51 (100.0%) |
| Retail Trade | 177 (71.4%) | 71 (28.6%) |
| Transportation & Warehousing | 82 (59.0%) | 57 (41.0%) |
| Utilities | 4 (6.6%) | 57 (93.4%) |
| Information | 24 (36.4%) | 42 (63.6%) |
| Finance & Insurance | 33 (67.3%) | 16 (32.7%) |
| Real Estate, Rental & Leasing | 14 (60.9%) | 9 (39.1%) |
| Professional & Scientific | 118 (55.4%) | 95 (44.6%) |
| Enterprise Management | 0 (0.0%) | 0 (0.0%) |
| Administrative & Support | 1 (5.3%) | 18 (94.7%) |
| Educational Services | 188 (37.2%) | 317 (62.8%) |
| Health Care & Social Assistance | 104 (27.9%) | 269 (72.1%) |
| Arts, Entertainment & Recreation | 1 (8.3%) | 11 (91.7%) |
| Accommodation & Food Services | 98 (64.9%) | 53 (35.1%) |
| Public Administration | 163 (91.6%) | 15 (8.4%) |
| Total | 1,579 (55.9%) | 1,246 (44.1%) |
Education in Powell
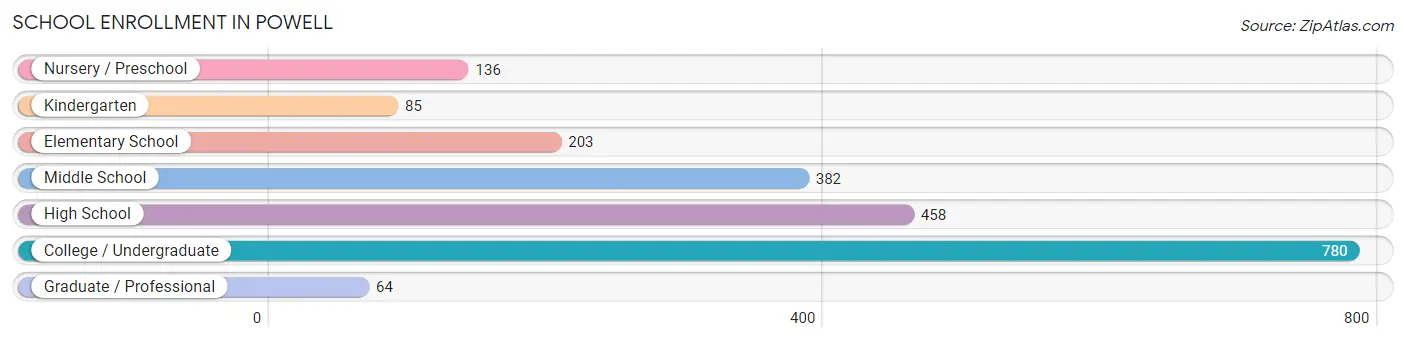
School Enrollment in Powell
The most common levels of schooling among the 2,108 students in Powell are college / undergraduate (780 | 37.0%), high school (458 | 21.7%), and middle school (382 | 18.1%).
| School Level | # Students | % Students |
| Nursery / Preschool | 136 | 6.5% |
| Kindergarten | 85 | 4.0% |
| Elementary School | 203 | 9.6% |
| Middle School | 382 | 18.1% |
| High School | 458 | 21.7% |
| College / Undergraduate | 780 | 37.0% |
| Graduate / Professional | 64 | 3.0% |
| Total | 2,108 | 100.0% |
School Enrollment by Age by Funding Source in Powell
Out of a total of 2,108 students who are enrolled in schools in Powell, 445 (21.1%) attend a private institution, while the remaining 1,663 (78.9%) are enrolled in public schools. The age group of 3 to 4 year olds has the highest likelihood of being enrolled in private schools, with 62 (45.6% in the age bracket) enrolled. Conversely, the age group of 15 to 17 year olds has the lowest likelihood of being enrolled in a private school, with 224 (100.0% in the age bracket) attending a public institution.
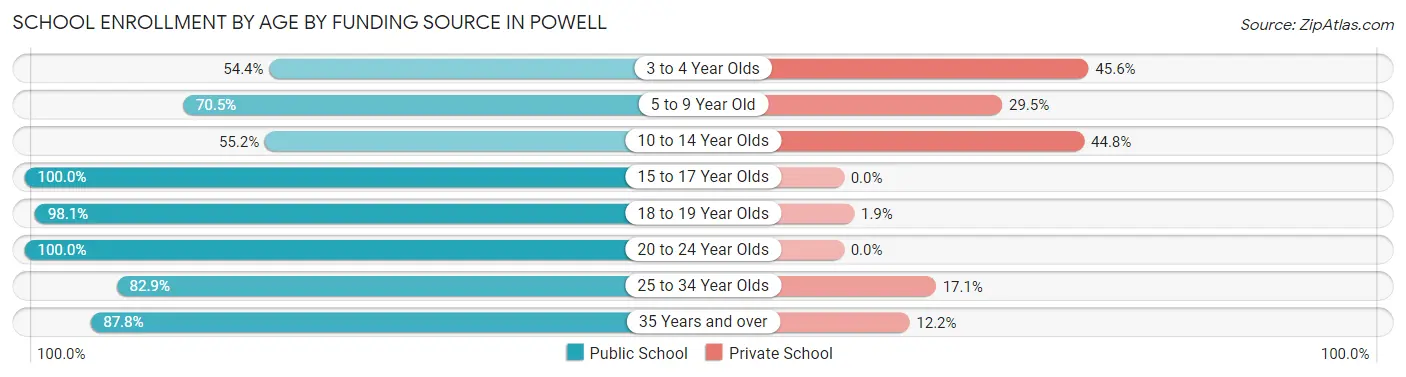
| Age Bracket | Public School | Private School |
| 3 to 4 Year Olds | 74 (54.4%) | 62 (45.6%) |
| 5 to 9 Year Old | 196 (70.5%) | 82 (29.5%) |
| 10 to 14 Year Olds | 307 (55.2%) | 249 (44.8%) |
| 15 to 17 Year Olds | 224 (100.0%) | 0 (0.0%) |
| 18 to 19 Year Olds | 458 (98.1%) | 9 (1.9%) |
| 20 to 24 Year Olds | 160 (100.0%) | 0 (0.0%) |
| 25 to 34 Year Olds | 116 (82.9%) | 24 (17.1%) |
| 35 Years and over | 129 (87.8%) | 18 (12.2%) |
| Total | 1,663 (78.9%) | 445 (21.1%) |
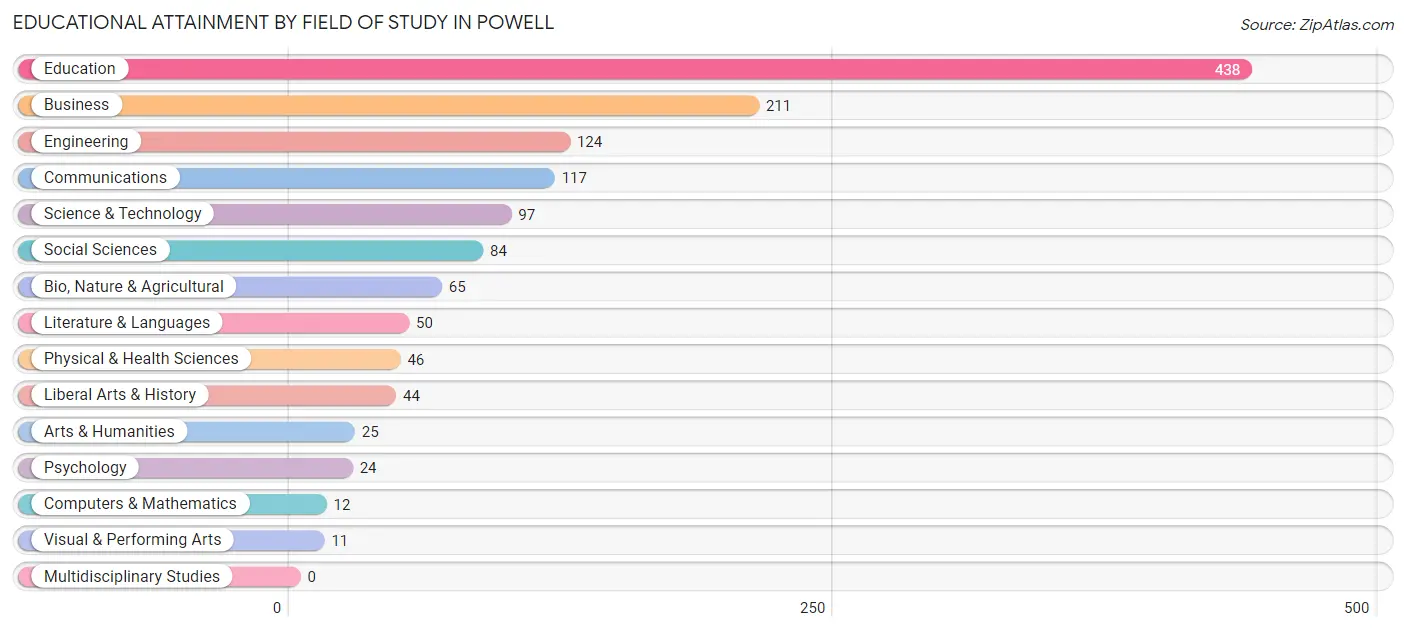
Educational Attainment by Field of Study in Powell
Education (438 | 32.5%), business (211 | 15.7%), engineering (124 | 9.2%), communications (117 | 8.7%), and science & technology (97 | 7.2%) are the most common fields of study among 1,348 individuals in Powell who have obtained a bachelor's degree or higher.
| Field of Study | # Graduates | % Graduates |
| Computers & Mathematics | 12 | 0.9% |
| Bio, Nature & Agricultural | 65 | 4.8% |
| Physical & Health Sciences | 46 | 3.4% |
| Psychology | 24 | 1.8% |
| Social Sciences | 84 | 6.2% |
| Engineering | 124 | 9.2% |
| Multidisciplinary Studies | 0 | 0.0% |
| Science & Technology | 97 | 7.2% |
| Business | 211 | 15.7% |
| Education | 438 | 32.5% |
| Literature & Languages | 50 | 3.7% |
| Liberal Arts & History | 44 | 3.3% |
| Visual & Performing Arts | 11 | 0.8% |
| Communications | 117 | 8.7% |
| Arts & Humanities | 25 | 1.8% |
| Total | 1,348 | 100.0% |
Transportation & Commute in Powell
Vehicle Availability by Sex in Powell
The most prevalent vehicle ownership categories in Powell are males with 2 vehicles (809, accounting for 56.2%) and females with 2 vehicles (345, making up 75.5%).
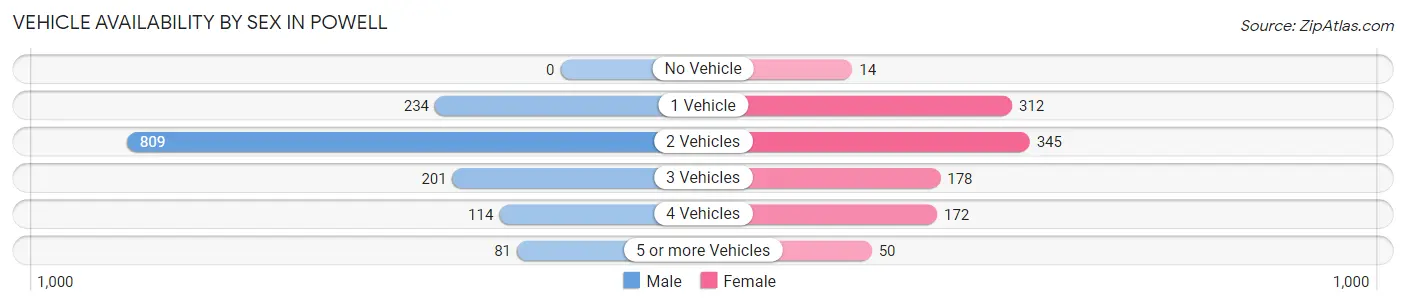
| Vehicles Available | Male | Female |
| No Vehicle | 0 (0.0%) | 14 (1.3%) |
| 1 Vehicle | 234 (16.3%) | 312 (29.1%) |
| 2 Vehicles | 809 (56.2%) | 345 (32.2%) |
| 3 Vehicles | 201 (14.0%) | 178 (16.6%) |
| 4 Vehicles | 114 (7.9%) | 172 (16.1%) |
| 5 or more Vehicles | 81 (5.6%) | 50 (4.7%) |
| Total | 1,439 (100.0%) | 1,071 (100.0%) |
Commute Time in Powell
The most frequently occuring commute durations in Powell are 5 to 9 minutes (921 commuters, 36.2%), less than 5 minutes (770 commuters, 30.3%), and 10 to 14 minutes (273 commuters, 10.7%).
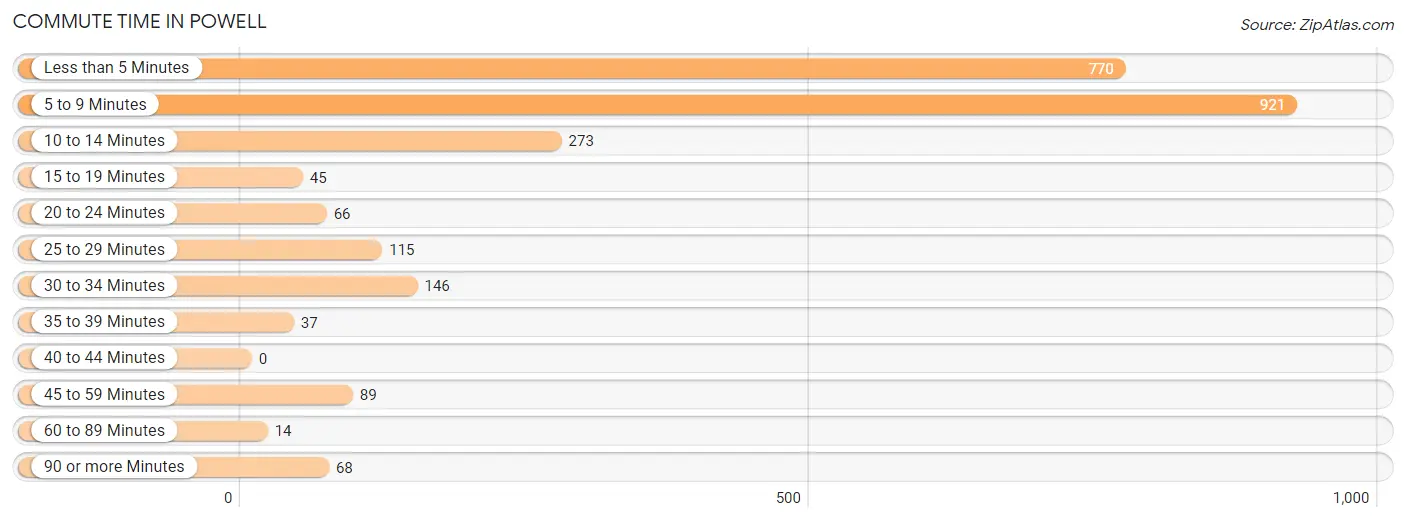
| Commute Time | # Commuters | % Commuters |
| Less than 5 Minutes | 770 | 30.3% |
| 5 to 9 Minutes | 921 | 36.2% |
| 10 to 14 Minutes | 273 | 10.7% |
| 15 to 19 Minutes | 45 | 1.8% |
| 20 to 24 Minutes | 66 | 2.6% |
| 25 to 29 Minutes | 115 | 4.5% |
| 30 to 34 Minutes | 146 | 5.7% |
| 35 to 39 Minutes | 37 | 1.5% |
| 40 to 44 Minutes | 0 | 0.0% |
| 45 to 59 Minutes | 89 | 3.5% |
| 60 to 89 Minutes | 14 | 0.5% |
| 90 or more Minutes | 68 | 2.7% |
Commute Time by Sex in Powell
The most common commute times in Powell are 5 to 9 minutes (475 commuters, 32.0%) for males and 5 to 9 minutes (446 commuters, 42.0%) for females.
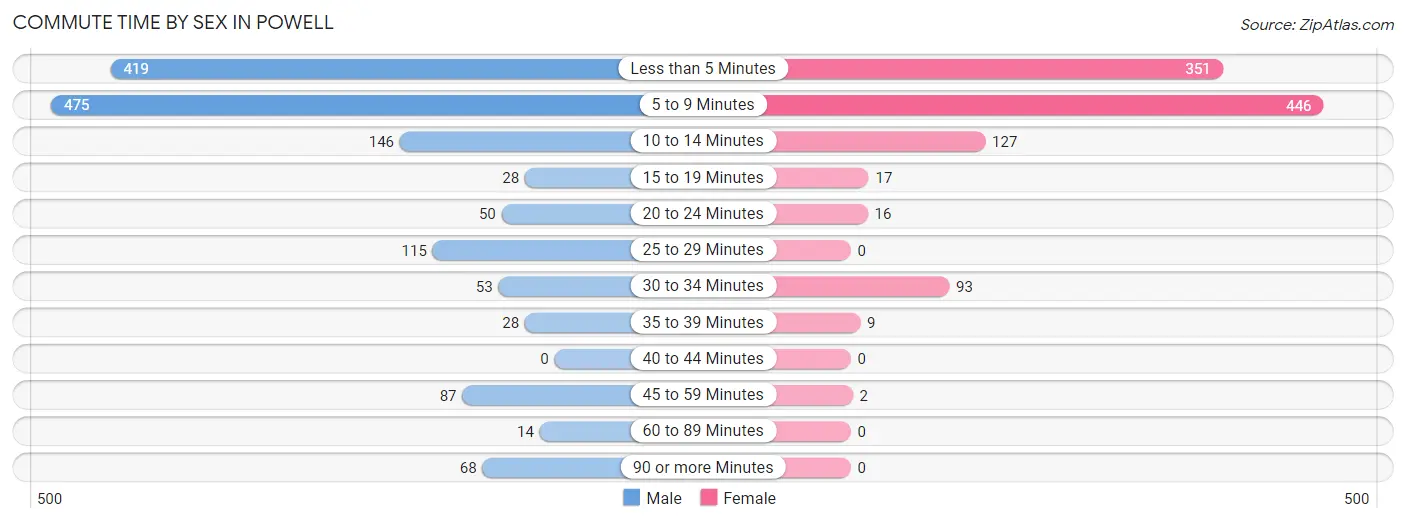
| Commute Time | Male | Female |
| Less than 5 Minutes | 419 (28.2%) | 351 (33.1%) |
| 5 to 9 Minutes | 475 (32.0%) | 446 (42.0%) |
| 10 to 14 Minutes | 146 (9.8%) | 127 (12.0%) |
| 15 to 19 Minutes | 28 (1.9%) | 17 (1.6%) |
| 20 to 24 Minutes | 50 (3.4%) | 16 (1.5%) |
| 25 to 29 Minutes | 115 (7.7%) | 0 (0.0%) |
| 30 to 34 Minutes | 53 (3.6%) | 93 (8.8%) |
| 35 to 39 Minutes | 28 (1.9%) | 9 (0.9%) |
| 40 to 44 Minutes | 0 (0.0%) | 0 (0.0%) |
| 45 to 59 Minutes | 87 (5.9%) | 2 (0.2%) |
| 60 to 89 Minutes | 14 (0.9%) | 0 (0.0%) |
| 90 or more Minutes | 68 (4.6%) | 0 (0.0%) |
Time of Departure to Work by Sex in Powell
The most frequent times of departure to work in Powell are 7:30 AM to 7:59 AM (287, 19.4%) for males and 7:30 AM to 7:59 AM (381, 35.9%) for females.
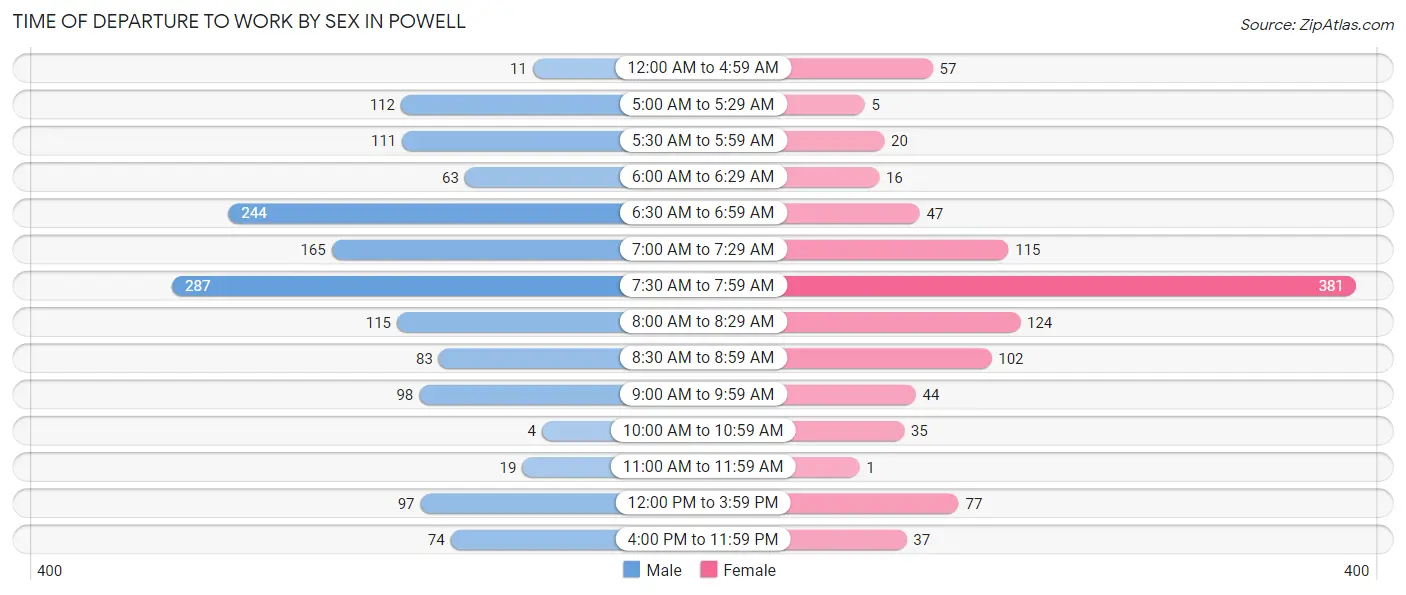
| Time of Departure | Male | Female |
| 12:00 AM to 4:59 AM | 11 (0.7%) | 57 (5.4%) |
| 5:00 AM to 5:29 AM | 112 (7.5%) | 5 (0.5%) |
| 5:30 AM to 5:59 AM | 111 (7.5%) | 20 (1.9%) |
| 6:00 AM to 6:29 AM | 63 (4.3%) | 16 (1.5%) |
| 6:30 AM to 6:59 AM | 244 (16.5%) | 47 (4.4%) |
| 7:00 AM to 7:29 AM | 165 (11.1%) | 115 (10.8%) |
| 7:30 AM to 7:59 AM | 287 (19.4%) | 381 (35.9%) |
| 8:00 AM to 8:29 AM | 115 (7.7%) | 124 (11.7%) |
| 8:30 AM to 8:59 AM | 83 (5.6%) | 102 (9.6%) |
| 9:00 AM to 9:59 AM | 98 (6.6%) | 44 (4.2%) |
| 10:00 AM to 10:59 AM | 4 (0.3%) | 35 (3.3%) |
| 11:00 AM to 11:59 AM | 19 (1.3%) | 1 (0.1%) |
| 12:00 PM to 3:59 PM | 97 (6.5%) | 77 (7.3%) |
| 4:00 PM to 11:59 PM | 74 (5.0%) | 37 (3.5%) |
| Total | 1,483 (100.0%) | 1,061 (100.0%) |
Housing Occupancy in Powell
Occupancy by Ownership in Powell
Of the total 2,819 dwellings in Powell, owner-occupied units account for 1,851 (65.7%), while renter-occupied units make up 968 (34.3%).
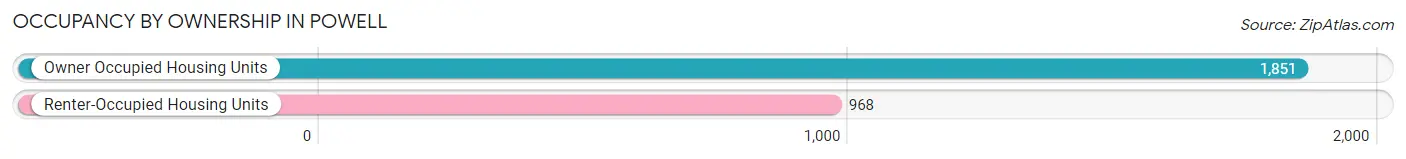
| Occupancy | # Housing Units | % Housing Units |
| Owner Occupied Housing Units | 1,851 | 65.7% |
| Renter-Occupied Housing Units | 968 | 34.3% |
| Total Occupied Housing Units | 2,819 | 100.0% |
Occupancy by Household Size in Powell
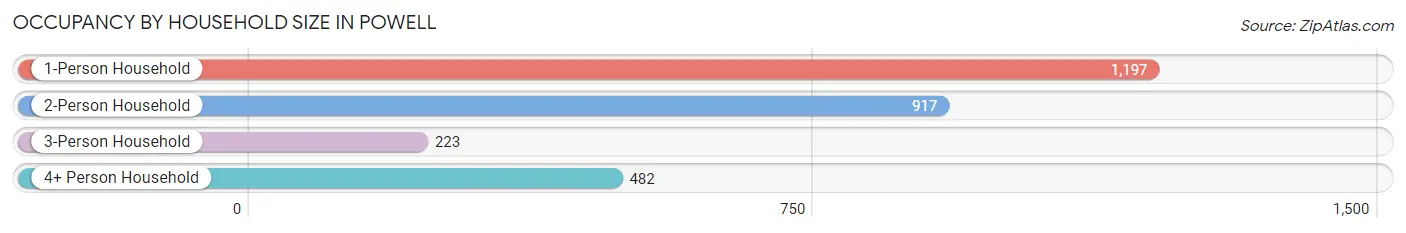
| Household Size | # Housing Units | % Housing Units |
| 1-Person Household | 1,197 | 42.5% |
| 2-Person Household | 917 | 32.5% |
| 3-Person Household | 223 | 7.9% |
| 4+ Person Household | 482 | 17.1% |
| Total Housing Units | 2,819 | 100.0% |
Occupancy by Ownership by Household Size in Powell
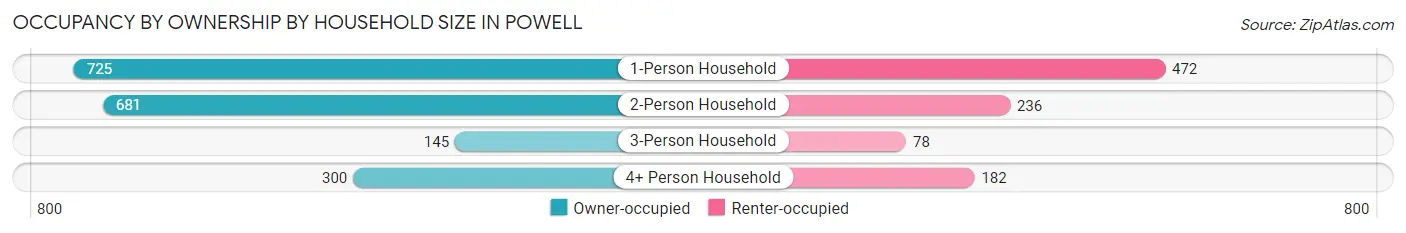
| Household Size | Owner-occupied | Renter-occupied |
| 1-Person Household | 725 (60.6%) | 472 (39.4%) |
| 2-Person Household | 681 (74.3%) | 236 (25.7%) |
| 3-Person Household | 145 (65.0%) | 78 (35.0%) |
| 4+ Person Household | 300 (62.2%) | 182 (37.8%) |
| Total Housing Units | 1,851 (65.7%) | 968 (34.3%) |
Occupancy by Educational Attainment in Powell
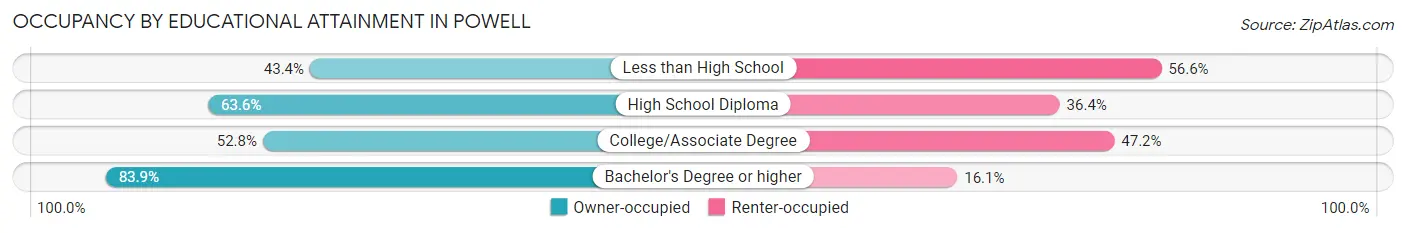
| Household Size | Owner-occupied | Renter-occupied |
| Less than High School | 53 (43.4%) | 69 (56.6%) |
| High School Diploma | 348 (63.6%) | 199 (36.4%) |
| College/Associate Degree | 600 (52.8%) | 537 (47.2%) |
| Bachelor's Degree or higher | 850 (83.9%) | 163 (16.1%) |
Occupancy by Age of Householder in Powell
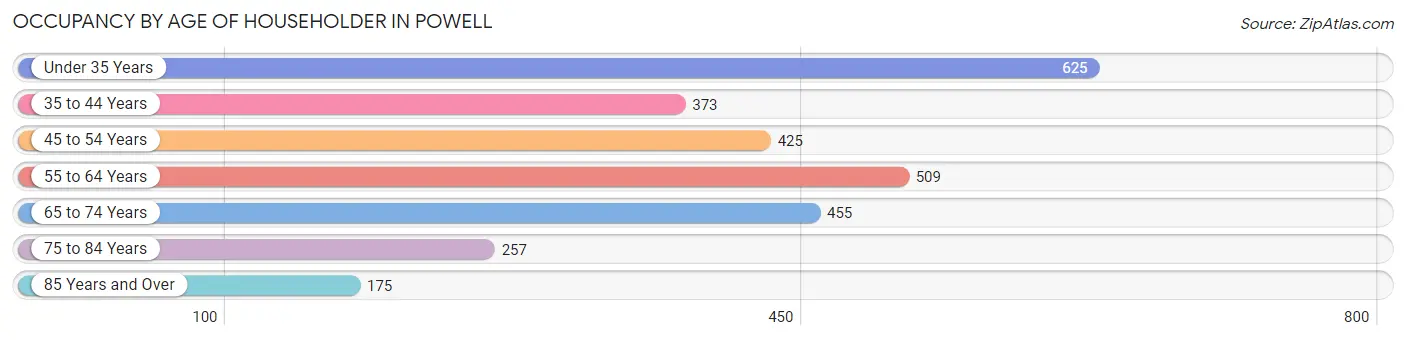
| Age Bracket | # Households | % Households |
| Under 35 Years | 625 | 22.2% |
| 35 to 44 Years | 373 | 13.2% |
| 45 to 54 Years | 425 | 15.1% |
| 55 to 64 Years | 509 | 18.1% |
| 65 to 74 Years | 455 | 16.1% |
| 75 to 84 Years | 257 | 9.1% |
| 85 Years and Over | 175 | 6.2% |
| Total | 2,819 | 100.0% |
Housing Finances in Powell
Median Income by Occupancy in Powell
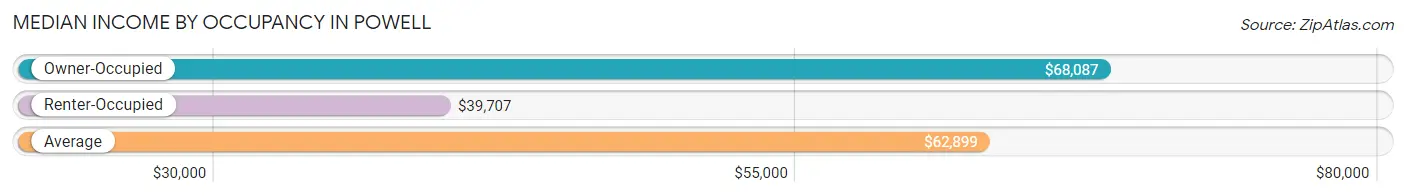
| Occupancy Type | # Households | Median Income |
| Owner-Occupied | 1,851 (65.7%) | $68,087 |
| Renter-Occupied | 968 (34.3%) | $39,707 |
| Average | 2,819 (100.0%) | $62,899 |
Occupancy by Householder Income Bracket in Powell
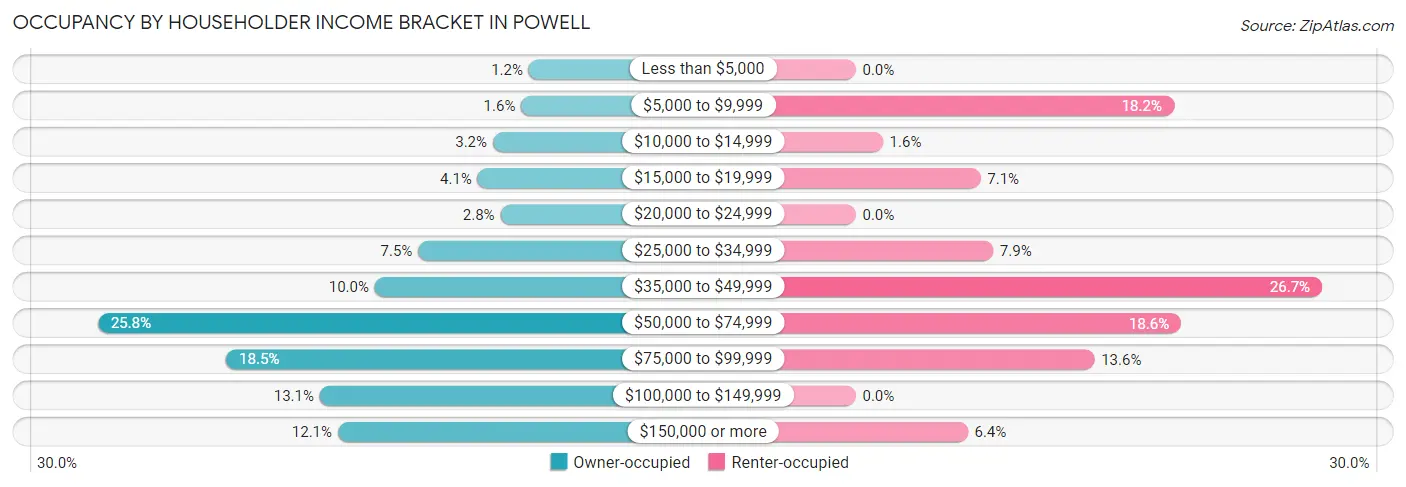
| Income Bracket | Owner-occupied | Renter-occupied |
| Less than $5,000 | 22 (1.2%) | 0 (0.0%) |
| $5,000 to $9,999 | 30 (1.6%) | 176 (18.2%) |
| $10,000 to $14,999 | 60 (3.2%) | 15 (1.5%) |
| $15,000 to $19,999 | 76 (4.1%) | 69 (7.1%) |
| $20,000 to $24,999 | 52 (2.8%) | 0 (0.0%) |
| $25,000 to $34,999 | 139 (7.5%) | 76 (7.9%) |
| $35,000 to $49,999 | 185 (10.0%) | 258 (26.7%) |
| $50,000 to $74,999 | 478 (25.8%) | 180 (18.6%) |
| $75,000 to $99,999 | 342 (18.5%) | 132 (13.6%) |
| $100,000 to $149,999 | 243 (13.1%) | 0 (0.0%) |
| $150,000 or more | 224 (12.1%) | 62 (6.4%) |
| Total | 1,851 (100.0%) | 968 (100.0%) |
Monthly Housing Cost Tiers in Powell
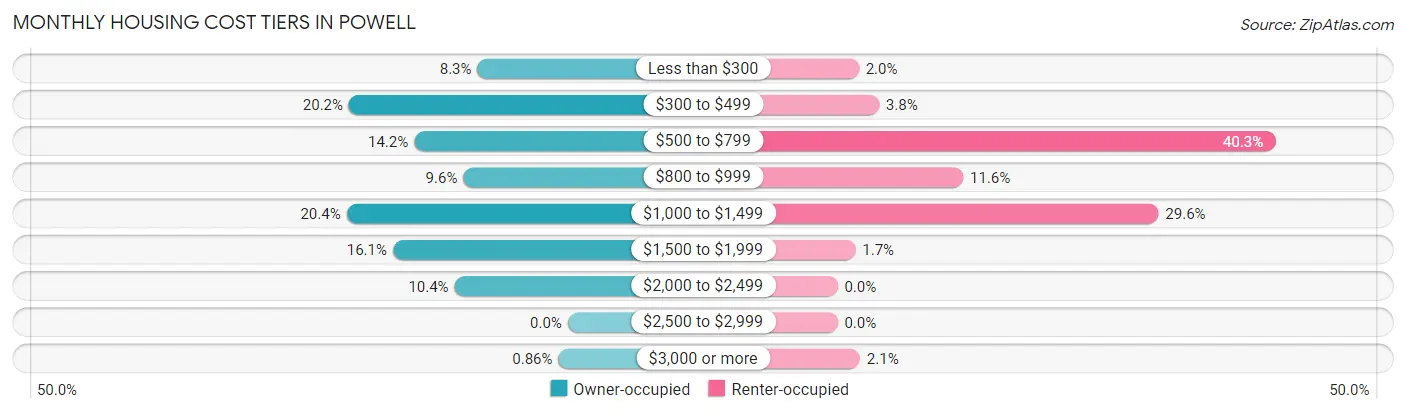
| Monthly Cost | Owner-occupied | Renter-occupied |
| Less than $300 | 154 (8.3%) | 19 (2.0%) |
| $300 to $499 | 373 (20.2%) | 37 (3.8%) |
| $500 to $799 | 262 (14.1%) | 390 (40.3%) |
| $800 to $999 | 178 (9.6%) | 112 (11.6%) |
| $1,000 to $1,499 | 377 (20.4%) | 286 (29.5%) |
| $1,500 to $1,999 | 298 (16.1%) | 16 (1.7%) |
| $2,000 to $2,499 | 193 (10.4%) | 0 (0.0%) |
| $2,500 to $2,999 | 0 (0.0%) | 0 (0.0%) |
| $3,000 or more | 16 (0.9%) | 20 (2.1%) |
| Total | 1,851 (100.0%) | 968 (100.0%) |
Physical Housing Characteristics in Powell
Housing Structures in Powell
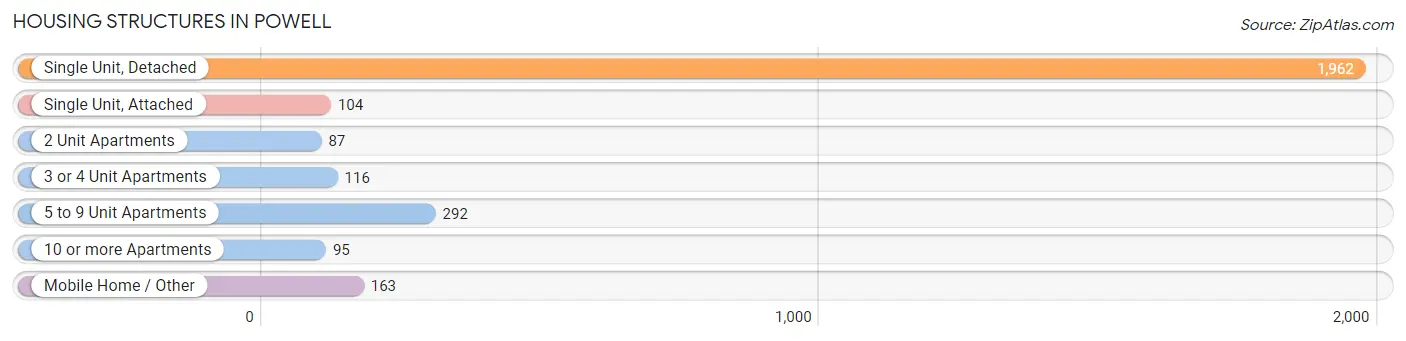
| Structure Type | # Housing Units | % Housing Units |
| Single Unit, Detached | 1,962 | 69.6% |
| Single Unit, Attached | 104 | 3.7% |
| 2 Unit Apartments | 87 | 3.1% |
| 3 or 4 Unit Apartments | 116 | 4.1% |
| 5 to 9 Unit Apartments | 292 | 10.4% |
| 10 or more Apartments | 95 | 3.4% |
| Mobile Home / Other | 163 | 5.8% |
| Total | 2,819 | 100.0% |
Housing Structures by Occupancy in Powell
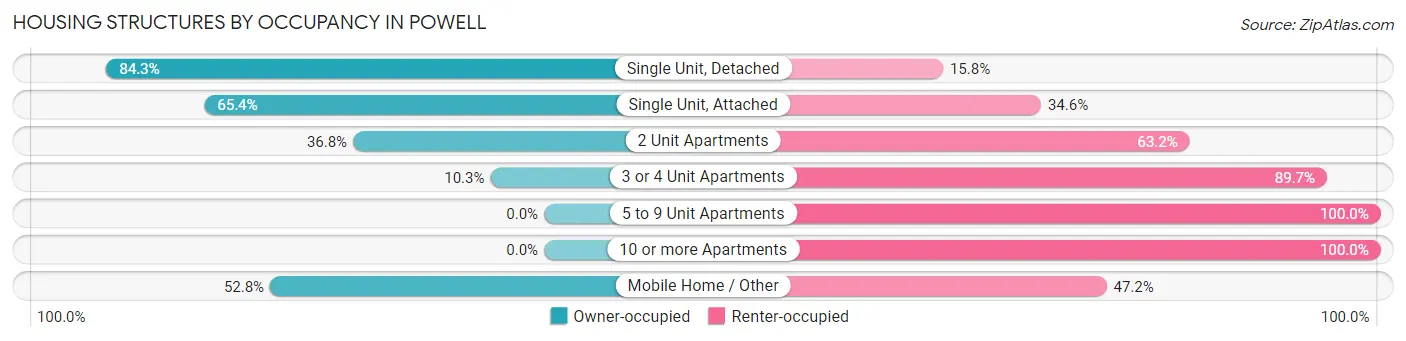
| Structure Type | Owner-occupied | Renter-occupied |
| Single Unit, Detached | 1,653 (84.3%) | 309 (15.8%) |
| Single Unit, Attached | 68 (65.4%) | 36 (34.6%) |
| 2 Unit Apartments | 32 (36.8%) | 55 (63.2%) |
| 3 or 4 Unit Apartments | 12 (10.3%) | 104 (89.7%) |
| 5 to 9 Unit Apartments | 0 (0.0%) | 292 (100.0%) |
| 10 or more Apartments | 0 (0.0%) | 95 (100.0%) |
| Mobile Home / Other | 86 (52.8%) | 77 (47.2%) |
| Total | 1,851 (65.7%) | 968 (34.3%) |
Housing Structures by Number of Rooms in Powell
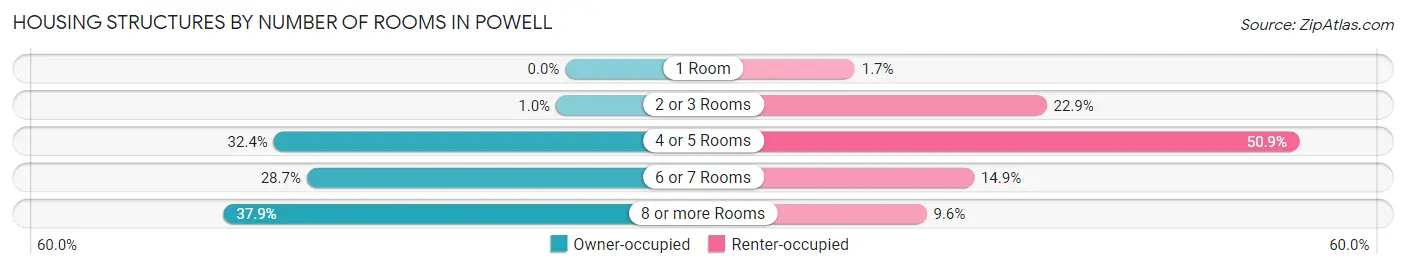
| Number of Rooms | Owner-occupied | Renter-occupied |
| 1 Room | 0 (0.0%) | 16 (1.7%) |
| 2 or 3 Rooms | 19 (1.0%) | 222 (22.9%) |
| 4 or 5 Rooms | 599 (32.4%) | 493 (50.9%) |
| 6 or 7 Rooms | 531 (28.7%) | 144 (14.9%) |
| 8 or more Rooms | 702 (37.9%) | 93 (9.6%) |
| Total | 1,851 (100.0%) | 968 (100.0%) |
Housing Structure by Heating Type in Powell
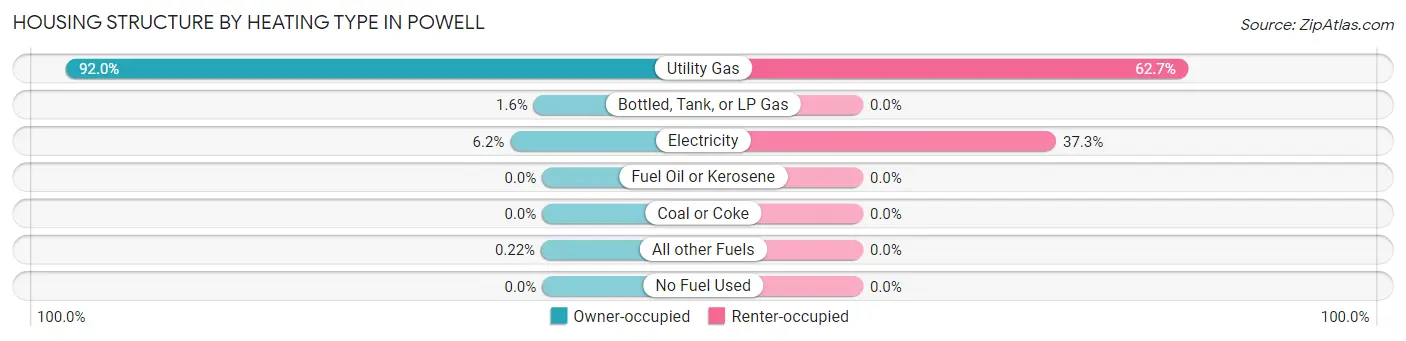
| Heating Type | Owner-occupied | Renter-occupied |
| Utility Gas | 1,703 (92.0%) | 607 (62.7%) |
| Bottled, Tank, or LP Gas | 30 (1.6%) | 0 (0.0%) |
| Electricity | 114 (6.2%) | 361 (37.3%) |
| Fuel Oil or Kerosene | 0 (0.0%) | 0 (0.0%) |
| Coal or Coke | 0 (0.0%) | 0 (0.0%) |
| All other Fuels | 4 (0.2%) | 0 (0.0%) |
| No Fuel Used | 0 (0.0%) | 0 (0.0%) |
| Total | 1,851 (100.0%) | 968 (100.0%) |
Household Vehicle Usage in Powell
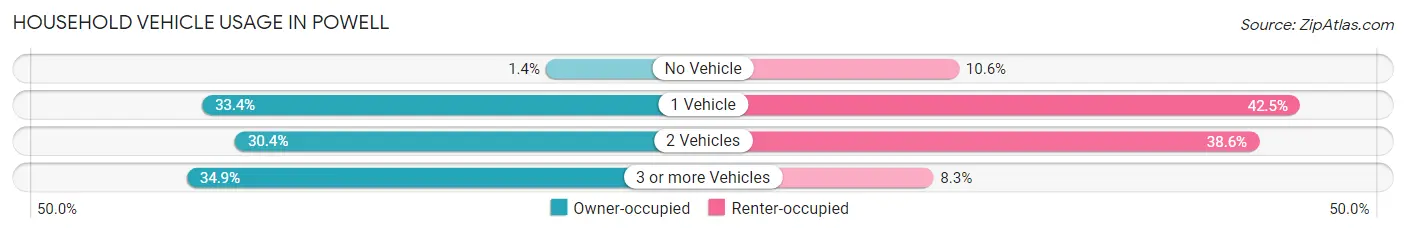
| Vehicles per Household | Owner-occupied | Renter-occupied |
| No Vehicle | 25 (1.3%) | 103 (10.6%) |
| 1 Vehicle | 619 (33.4%) | 411 (42.5%) |
| 2 Vehicles | 562 (30.4%) | 374 (38.6%) |
| 3 or more Vehicles | 645 (34.8%) | 80 (8.3%) |
| Total | 1,851 (100.0%) | 968 (100.0%) |
Real Estate & Mortgages in Powell
Real Estate and Mortgage Overview in Powell
| Characteristic | Without Mortgage | With Mortgage |
| Housing Units | 674 | 1,177 |
| Median Property Value | $224,300 | $247,200 |
| Median Household Income | $53,186 | $172 |
| Monthly Housing Costs | $447 | $16 |
| Real Estate Taxes | $1,424 | $46 |
Property Value by Mortgage Status in Powell
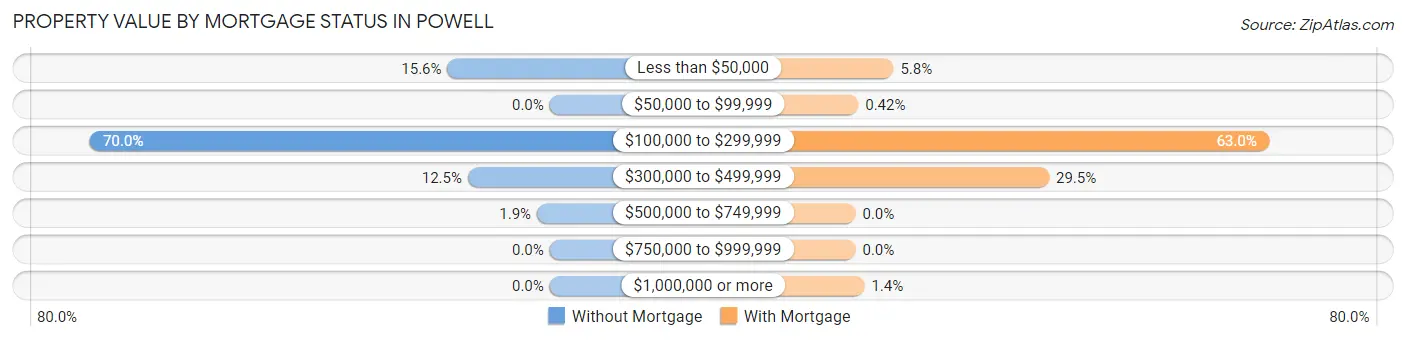
| Property Value | Without Mortgage | With Mortgage |
| Less than $50,000 | 105 (15.6%) | 68 (5.8%) |
| $50,000 to $99,999 | 0 (0.0%) | 5 (0.4%) |
| $100,000 to $299,999 | 472 (70.0%) | 741 (63.0%) |
| $300,000 to $499,999 | 84 (12.5%) | 347 (29.5%) |
| $500,000 to $749,999 | 13 (1.9%) | 0 (0.0%) |
| $750,000 to $999,999 | 0 (0.0%) | 0 (0.0%) |
| $1,000,000 or more | 0 (0.0%) | 16 (1.4%) |
| Total | 674 (100.0%) | 1,177 (100.0%) |
Household Income by Mortgage Status in Powell
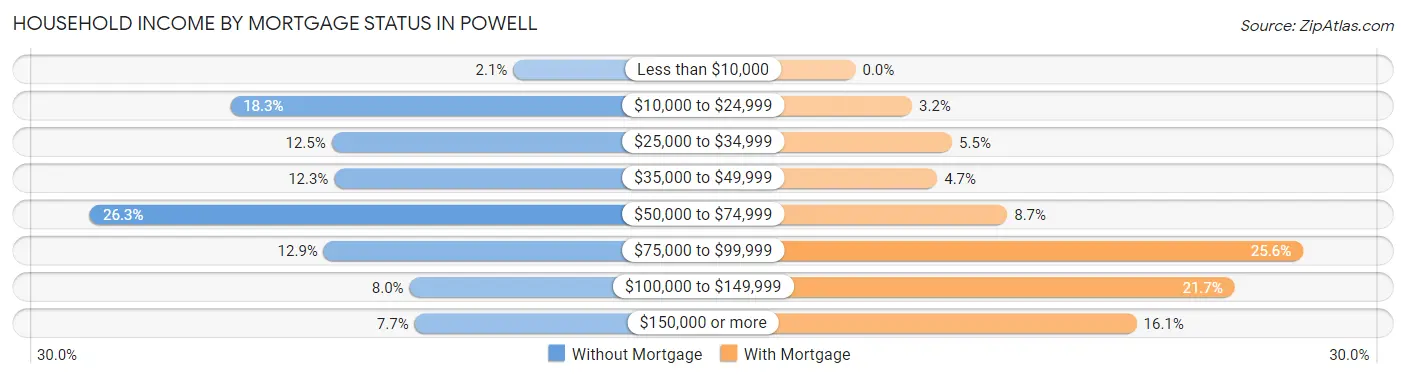
| Household Income | Without Mortgage | With Mortgage |
| Less than $10,000 | 14 (2.1%) | 0 (0.0%) |
| $10,000 to $24,999 | 123 (18.2%) | 38 (3.2%) |
| $25,000 to $34,999 | 84 (12.5%) | 65 (5.5%) |
| $35,000 to $49,999 | 83 (12.3%) | 55 (4.7%) |
| $50,000 to $74,999 | 177 (26.3%) | 102 (8.7%) |
| $75,000 to $99,999 | 87 (12.9%) | 301 (25.6%) |
| $100,000 to $149,999 | 54 (8.0%) | 255 (21.7%) |
| $150,000 or more | 52 (7.7%) | 189 (16.1%) |
| Total | 674 (100.0%) | 1,177 (100.0%) |
Property Value to Household Income Ratio in Powell
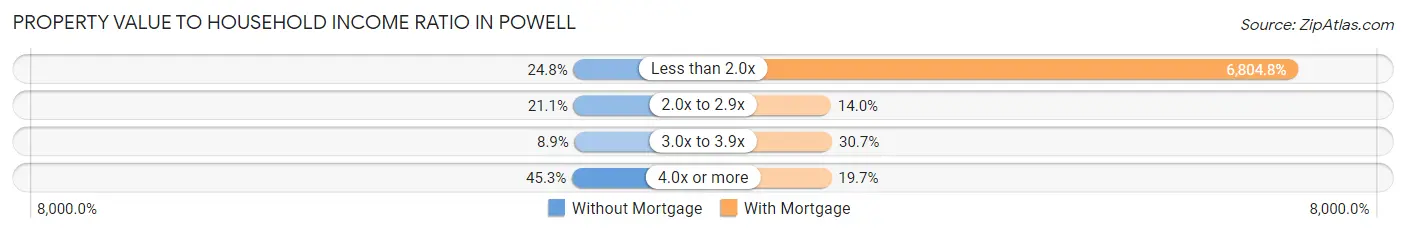
| Value-to-Income Ratio | Without Mortgage | With Mortgage |
| Less than 2.0x | 167 (24.8%) | 80,093 (6,804.8%) |
| 2.0x to 2.9x | 142 (21.1%) | 165 (14.0%) |
| 3.0x to 3.9x | 60 (8.9%) | 361 (30.7%) |
| 4.0x or more | 305 (45.3%) | 232 (19.7%) |
| Total | 674 (100.0%) | 1,177 (100.0%) |
Real Estate Taxes by Mortgage Status in Powell
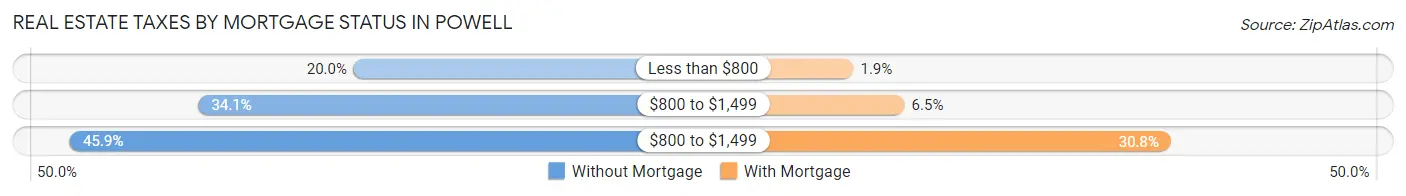
| Property Taxes | Without Mortgage | With Mortgage |
| Less than $800 | 135 (20.0%) | 22 (1.9%) |
| $800 to $1,499 | 230 (34.1%) | 77 (6.5%) |
| $800 to $1,499 | 309 (45.9%) | 363 (30.8%) |
| Total | 674 (100.0%) | 1,177 (100.0%) |
Health & Disability in Powell
Health Insurance Coverage by Age in Powell
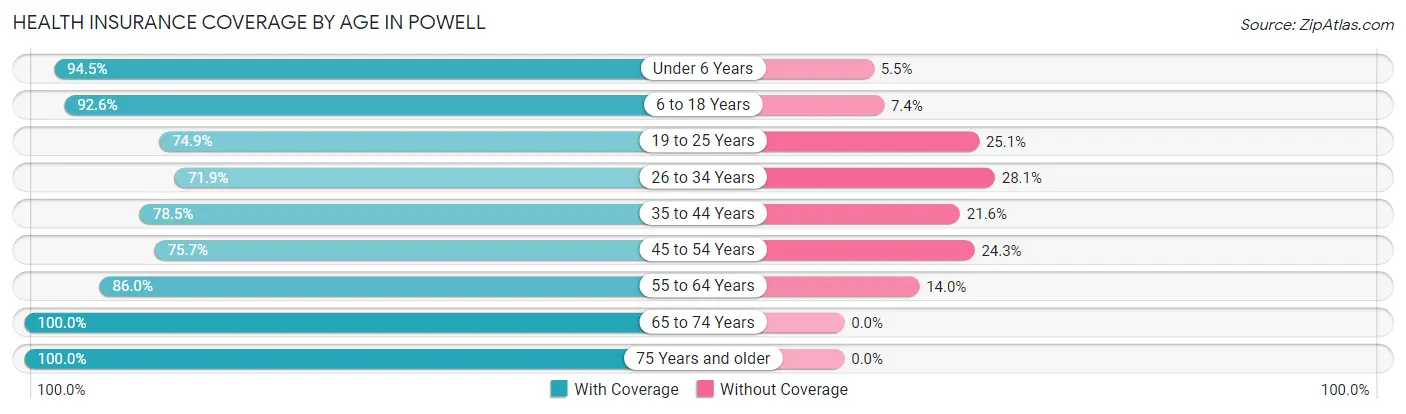
| Age Bracket | With Coverage | Without Coverage |
| Under 6 Years | 379 (94.5%) | 22 (5.5%) |
| 6 to 18 Years | 1,163 (92.6%) | 93 (7.4%) |
| 19 to 25 Years | 501 (74.9%) | 168 (25.1%) |
| 26 to 34 Years | 533 (71.9%) | 208 (28.1%) |
| 35 to 44 Years | 619 (78.4%) | 170 (21.5%) |
| 45 to 54 Years | 490 (75.7%) | 157 (24.3%) |
| 55 to 64 Years | 591 (86.0%) | 96 (14.0%) |
| 65 to 74 Years | 691 (100.0%) | 0 (0.0%) |
| 75 Years and older | 511 (100.0%) | 0 (0.0%) |
| Total | 5,478 (85.7%) | 914 (14.3%) |
Health Insurance Coverage by Citizenship Status in Powell
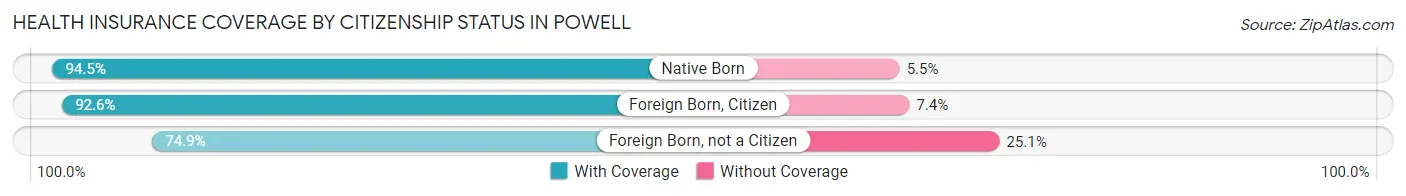
| Citizenship Status | With Coverage | Without Coverage |
| Native Born | 379 (94.5%) | 22 (5.5%) |
| Foreign Born, Citizen | 1,163 (92.6%) | 93 (7.4%) |
| Foreign Born, not a Citizen | 501 (74.9%) | 168 (25.1%) |
Health Insurance Coverage by Household Income in Powell
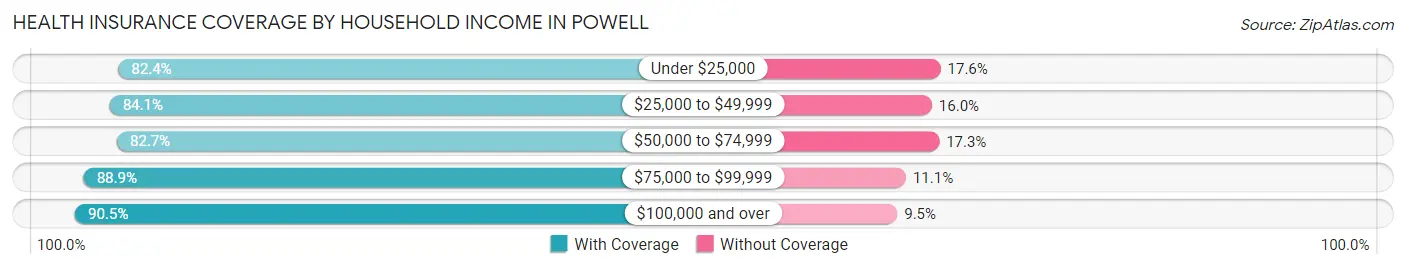
| Household Income | With Coverage | Without Coverage |
| Under $25,000 | 558 (82.4%) | 119 (17.6%) |
| $25,000 to $49,999 | 1,154 (84.1%) | 219 (16.0%) |
| $50,000 to $74,999 | 1,247 (82.7%) | 261 (17.3%) |
| $75,000 to $99,999 | 770 (88.9%) | 96 (11.1%) |
| $100,000 and over | 1,378 (90.5%) | 144 (9.5%) |
Public vs Private Health Insurance Coverage by Age in Powell
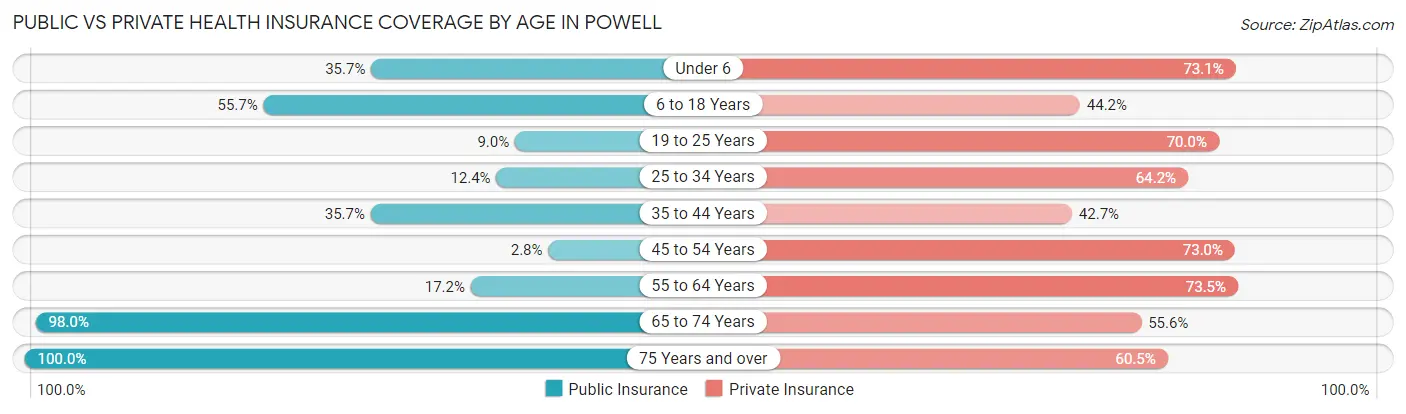
| Age Bracket | Public Insurance | Private Insurance |
| Under 6 | 143 (35.7%) | 293 (73.1%) |
| 6 to 18 Years | 699 (55.6%) | 555 (44.2%) |
| 19 to 25 Years | 60 (9.0%) | 468 (70.0%) |
| 25 to 34 Years | 92 (12.4%) | 476 (64.2%) |
| 35 to 44 Years | 282 (35.7%) | 337 (42.7%) |
| 45 to 54 Years | 18 (2.8%) | 472 (73.0%) |
| 55 to 64 Years | 118 (17.2%) | 505 (73.5%) |
| 65 to 74 Years | 677 (98.0%) | 384 (55.6%) |
| 75 Years and over | 511 (100.0%) | 309 (60.5%) |
| Total | 2,600 (40.7%) | 3,799 (59.4%) |
Disability Status by Sex by Age in Powell
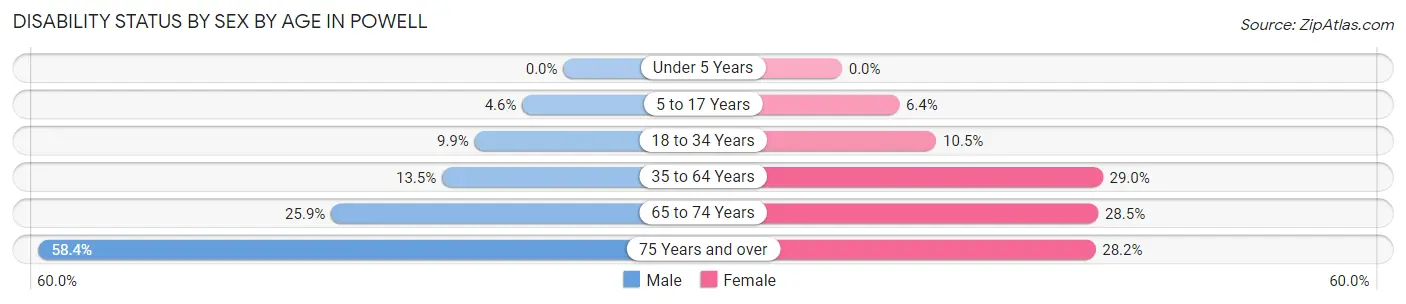
| Age Bracket | Male | Female |
| Under 5 Years | 0 (0.0%) | 0 (0.0%) |
| 5 to 17 Years | 27 (4.6%) | 31 (6.4%) |
| 18 to 34 Years | 72 (9.9%) | 97 (10.5%) |
| 35 to 64 Years | 144 (13.5%) | 307 (29.0%) |
| 65 to 74 Years | 98 (25.9%) | 89 (28.5%) |
| 75 Years and over | 104 (58.4%) | 94 (28.2%) |
Disability Class by Sex by Age in Powell
Disability Class: Hearing Difficulty
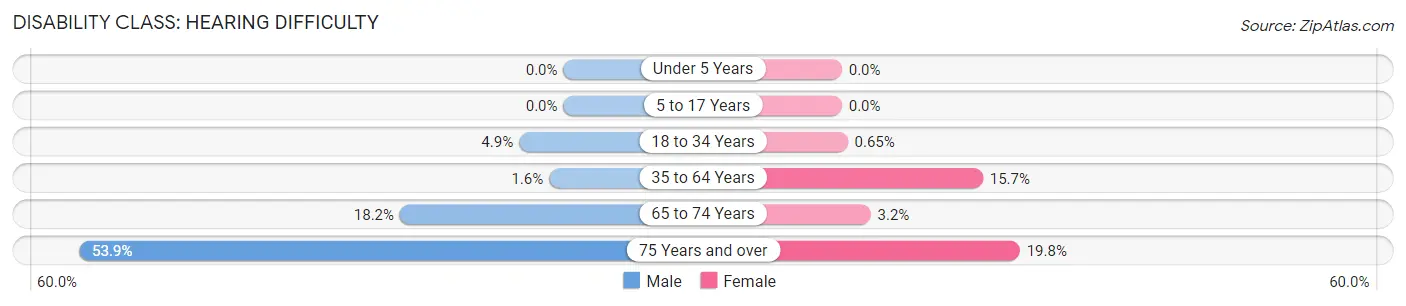
| Age Bracket | Male | Female |
| Under 5 Years | 0 (0.0%) | 0 (0.0%) |
| 5 to 17 Years | 0 (0.0%) | 0 (0.0%) |
| 18 to 34 Years | 36 (4.9%) | 6 (0.6%) |
| 35 to 64 Years | 17 (1.6%) | 166 (15.7%) |
| 65 to 74 Years | 69 (18.2%) | 10 (3.2%) |
| 75 Years and over | 96 (53.9%) | 66 (19.8%) |
Disability Class: Vision Difficulty
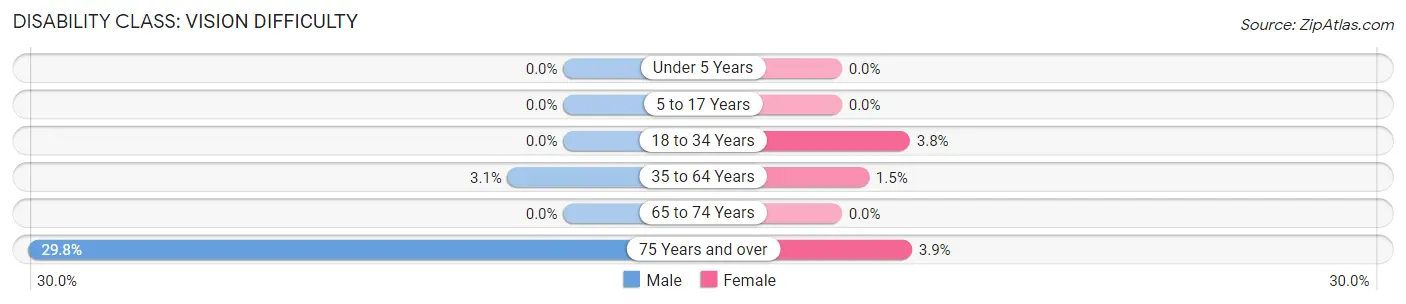
| Age Bracket | Male | Female |
| Under 5 Years | 0 (0.0%) | 0 (0.0%) |
| 5 to 17 Years | 0 (0.0%) | 0 (0.0%) |
| 18 to 34 Years | 0 (0.0%) | 35 (3.8%) |
| 35 to 64 Years | 33 (3.1%) | 16 (1.5%) |
| 65 to 74 Years | 0 (0.0%) | 0 (0.0%) |
| 75 Years and over | 53 (29.8%) | 13 (3.9%) |
Disability Class: Cognitive Difficulty
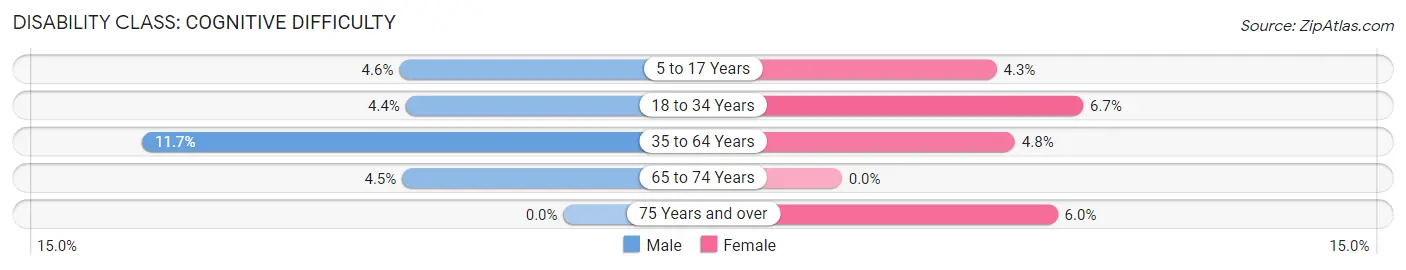
| Age Bracket | Male | Female |
| 5 to 17 Years | 27 (4.6%) | 21 (4.3%) |
| 18 to 34 Years | 32 (4.4%) | 62 (6.7%) |
| 35 to 64 Years | 125 (11.7%) | 51 (4.8%) |
| 65 to 74 Years | 17 (4.5%) | 0 (0.0%) |
| 75 Years and over | 0 (0.0%) | 20 (6.0%) |
Disability Class: Ambulatory Difficulty
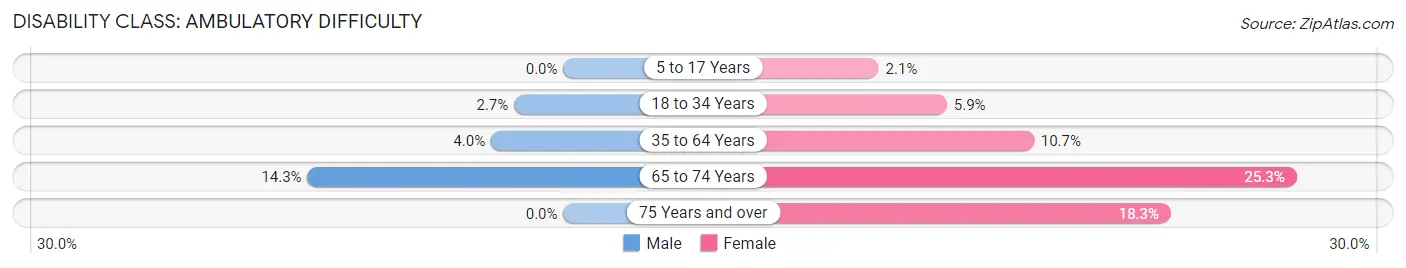
| Age Bracket | Male | Female |
| 5 to 17 Years | 0 (0.0%) | 10 (2.1%) |
| 18 to 34 Years | 20 (2.7%) | 54 (5.9%) |
| 35 to 64 Years | 43 (4.0%) | 113 (10.7%) |
| 65 to 74 Years | 54 (14.2%) | 79 (25.3%) |
| 75 Years and over | 0 (0.0%) | 61 (18.3%) |
Disability Class: Self-Care Difficulty
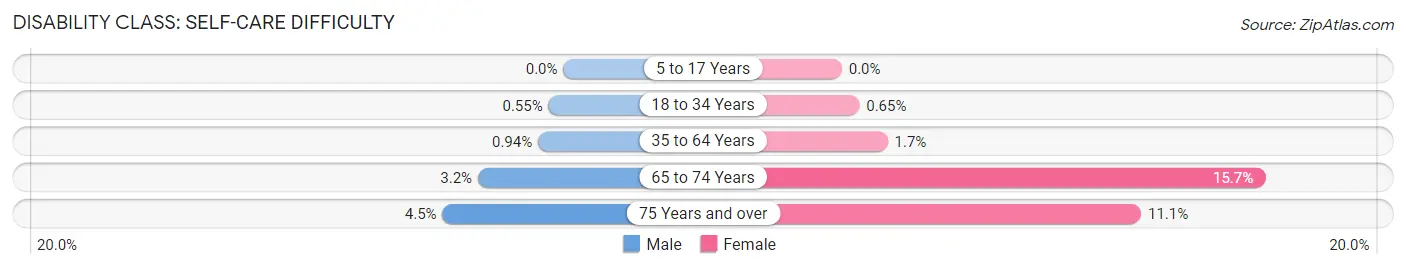
| Age Bracket | Male | Female |
| 5 to 17 Years | 0 (0.0%) | 0 (0.0%) |
| 18 to 34 Years | 4 (0.5%) | 6 (0.6%) |
| 35 to 64 Years | 10 (0.9%) | 18 (1.7%) |
| 65 to 74 Years | 12 (3.2%) | 49 (15.7%) |
| 75 Years and over | 8 (4.5%) | 37 (11.1%) |
Technology Access in Powell
Computing Device Access in Powell
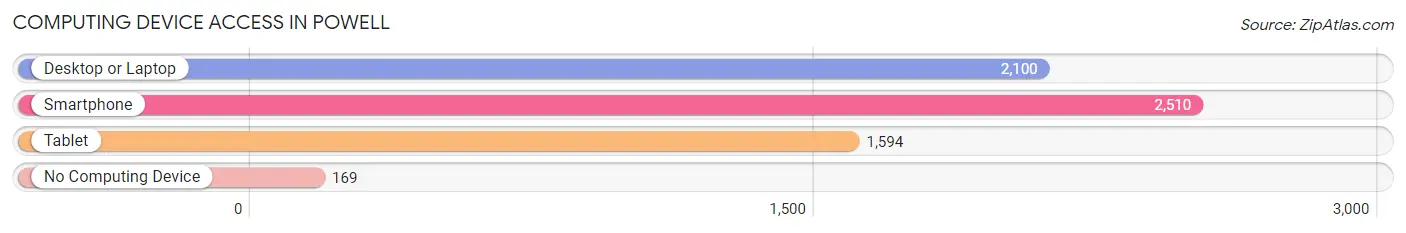
| Device Type | # Households | % Households |
| Desktop or Laptop | 2,100 | 74.5% |
| Smartphone | 2,510 | 89.0% |
| Tablet | 1,594 | 56.5% |
| No Computing Device | 169 | 6.0% |
| Total | 2,819 | 100.0% |
Internet Access in Powell
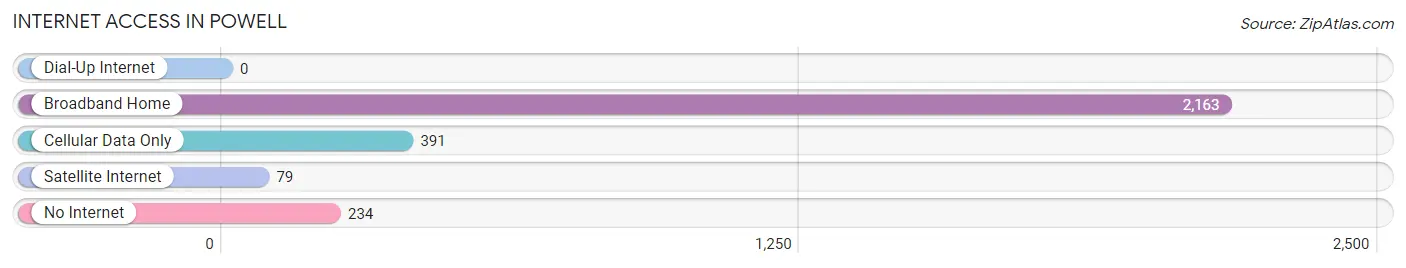
| Internet Type | # Households | % Households |
| Dial-Up Internet | 0 | 0.0% |
| Broadband Home | 2,163 | 76.7% |
| Cellular Data Only | 391 | 13.9% |
| Satellite Internet | 79 | 2.8% |
| No Internet | 234 | 8.3% |
| Total | 2,819 | 100.0% |
Powell Summary
Powell, Wyoming is a small city located in Park County, Wyoming. It is situated in the northwestern corner of the state, near the Montana border. The city is located in the heart of the Big Horn Basin, a region of rolling hills and wide open spaces. The city is home to approximately 6,000 people, making it the largest city in Park County.
History
Powell was founded in 1901 by settlers from the Midwest. The city was named after John Wesley Powell, a famous explorer who had explored the area in the late 1800s. The city was originally a farming and ranching community, but it soon developed into a trading center for the surrounding area. The city was incorporated in 1909.
In the early 1900s, Powell was a bustling town with a variety of businesses, including a bank, a hotel, a newspaper, and a movie theater. The city was also home to a number of churches, including the First Baptist Church, which was founded in 1906.
In the 1950s, Powell began to experience a population boom as people moved to the area to take advantage of the area’s natural resources. The city’s population grew from 1,500 in 1950 to over 6,000 in 2000.
Geography
Powell is located in the northwestern corner of Wyoming, near the Montana border. The city is situated in the heart of the Big Horn Basin, a region of rolling hills and wide open spaces. The city is located at an elevation of 4,890 feet above sea level.
The city is surrounded by the Big Horn Mountains to the west, the Absaroka Range to the east, and the Beartooth Mountains to the north. The city is located near the headwaters of the Shoshone River, which flows through the city and into the Yellowstone River.
Economy
Powell’s economy is largely based on agriculture and tourism. The city is home to a number of farms and ranches, which produce a variety of crops, including wheat, barley, and hay. The city is also home to a number of tourist attractions, including the Heart Mountain Interpretive Center, the Buffalo Bill Center of the West, and the Cody Nite Rodeo.
The city is also home to a number of manufacturing and service businesses, including a lumber mill, a concrete plant, and a number of restaurants and retail stores. The city is also home to a number of government offices, including the Park County Courthouse and the Park County Sheriff’s Office.
Demographics
As of the 2010 census, Powell had a population of 6,314 people. The racial makeup of the city was 94.3% White, 0.7% African American, 0.7% Native American, 0.4% Asian, 0.1% Pacific Islander, 1.7% from other races, and 2.1% from two or more races. Hispanic or Latino of any race were 4.3% of the population.
The median income for a household in the city was $41,944, and the median income for a family was $50,919. The per capita income for the city was $20,945. About 11.2% of families and 14.2% of the population were below the poverty line, including 19.2% of those under age 18 and 8.2% of those age 65 or over.
Powell is a small city with a rich history and a vibrant economy. The city is home to a variety of businesses, attractions, and government offices, and it is a popular destination for tourists and outdoor enthusiasts. The city’s population is diverse, and it is a great place to live, work, and play.
Common Questions
What is Per Capita Income in Powell?
Per Capita income in Powell is $33,345.
What is the Median Family Income in Powell?
Median Family Income in Powell is $72,344.
What is the Median Household income in Powell?
Median Household Income in Powell is $62,899.
What is Income or Wage Gap in Powell?
Income or Wage Gap in Powell is 53.8%.
Women in Powell earn 46.2 cents for every dollar earned by a man.
What is Inequality or Gini Index in Powell?
Inequality or Gini Index in Powell is 0.43.
What is the Total Population of Powell?
Total Population of Powell is 6,460.
What is the Total Male Population of Powell?
Total Male Population of Powell is 3,140.
What is the Total Female Population of Powell?
Total Female Population of Powell is 3,320.
What is the Ratio of Males per 100 Females in Powell?
There are 94.58 Males per 100 Females in Powell.
What is the Ratio of Females per 100 Males in Powell?
There are 105.73 Females per 100 Males in Powell.
What is the Median Population Age in Powell?
Median Population Age in Powell is 37.0 Years.
What is the Average Family Size in Powell
Average Family Size in Powell is 2.9 People.
What is the Average Household Size in Powell
Average Household Size in Powell is 2.1 People.
How Large is the Labor Force in Powell?
There are 3,017 People in the Labor Forcein in Powell.
What is the Percentage of People in the Labor Force in Powell?
57.3% of People are in the Labor Force in Powell.
What is the Unemployment Rate in Powell?
Unemployment Rate in Powell is 6.4%.