Wheatland, WY Map & Demographics
Wheatland Map
Wheatland Overview
$36,033
PER CAPITA INCOME
$95,332
AVG FAMILY INCOME
$53,627
AVG HOUSEHOLD INCOME
19.7%
WAGE / INCOME GAP [ % ]
80.3¢/ $1
WAGE / INCOME GAP [ $ ]
0.47
INEQUALITY / GINI INDEX
3,575
TOTAL POPULATION
1,818
MALE POPULATION
1,757
FEMALE POPULATION
103.47
MALES / 100 FEMALES
96.64
FEMALES / 100 MALES
44.6
MEDIAN AGE
2.9
AVG FAMILY SIZE
2.0
AVG HOUSEHOLD SIZE
1,593
LABOR FORCE [ PEOPLE ]
51.1%
PERCENT IN LABOR FORCE
1.8%
UNEMPLOYMENT RATE
Wheatland Zip Codes
Wheatland Area Codes
Income in Wheatland
Income Overview in Wheatland
Per Capita Income in Wheatland is $36,033, while median incomes of families and households are $95,332 and $53,627 respectively.
| Characteristic | Number | Measure |
| Per Capita Income | 3,575 | $36,033 |
| Median Family Income | 832 | $95,332 |
| Mean Family Income | 832 | $92,702 |
| Median Household Income | 1,704 | $53,627 |
| Mean Household Income | 1,704 | $75,318 |
| Income Deficit | 832 | $0 |
| Wage / Income Gap (%) | 3,575 | 19.68% |
| Wage / Income Gap ($) | 3,575 | 80.32¢ per $1 |
| Gini / Inequality Index | 3,575 | 0.47 |
Earnings by Sex in Wheatland
Average Earnings in Wheatland are $43,129, $50,041 for men and $40,195 for women, a difference of 19.7%.
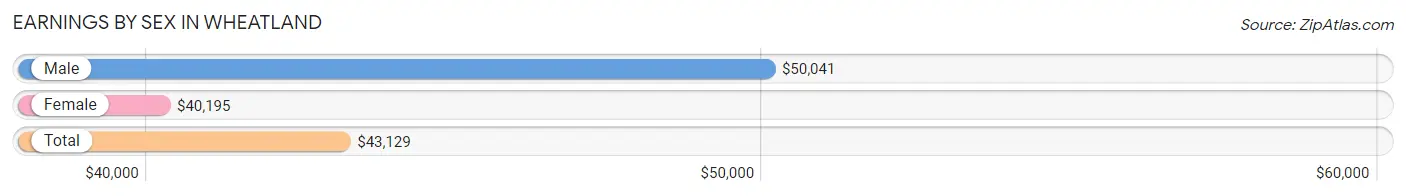
| Sex | Number | Average Earnings |
| Male | 945 (51.9%) | $50,041 |
| Female | 875 (48.1%) | $40,195 |
| Total | 1,820 (100.0%) | $43,129 |
Earnings by Sex by Income Bracket in Wheatland
The most common earnings brackets in Wheatland are $55,000 to $64,999 for men (148 | 15.7%) and $40,000 to $44,999 for women (181 | 20.7%).
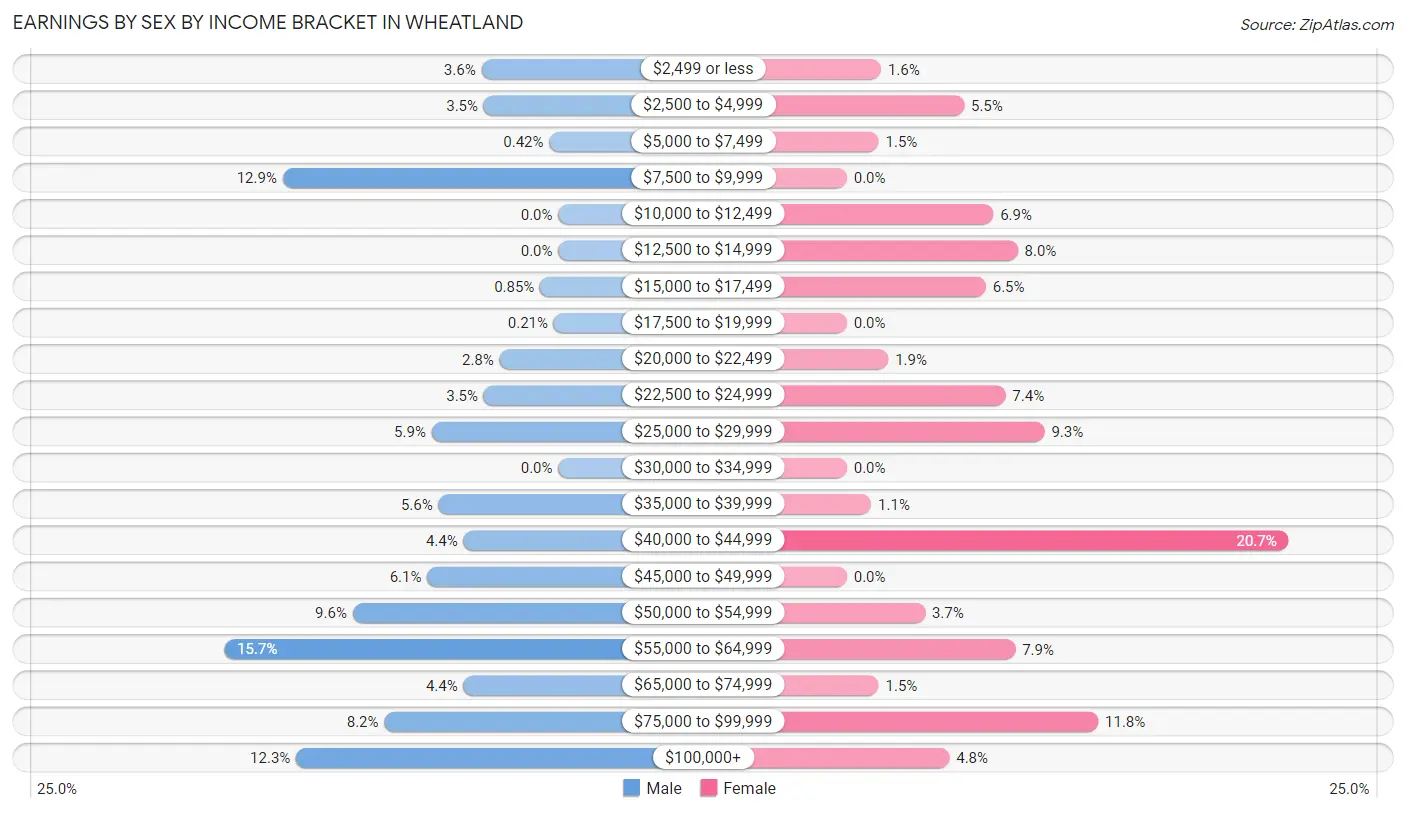
| Income | Male | Female |
| $2,499 or less | 34 (3.6%) | 14 (1.6%) |
| $2,500 to $4,999 | 33 (3.5%) | 48 (5.5%) |
| $5,000 to $7,499 | 4 (0.4%) | 13 (1.5%) |
| $7,500 to $9,999 | 122 (12.9%) | 0 (0.0%) |
| $10,000 to $12,499 | 0 (0.0%) | 60 (6.9%) |
| $12,500 to $14,999 | 0 (0.0%) | 70 (8.0%) |
| $15,000 to $17,499 | 8 (0.9%) | 57 (6.5%) |
| $17,500 to $19,999 | 2 (0.2%) | 0 (0.0%) |
| $20,000 to $22,499 | 26 (2.8%) | 17 (1.9%) |
| $22,500 to $24,999 | 33 (3.5%) | 65 (7.4%) |
| $25,000 to $29,999 | 56 (5.9%) | 81 (9.3%) |
| $30,000 to $34,999 | 0 (0.0%) | 0 (0.0%) |
| $35,000 to $39,999 | 53 (5.6%) | 10 (1.1%) |
| $40,000 to $44,999 | 42 (4.4%) | 181 (20.7%) |
| $45,000 to $49,999 | 58 (6.1%) | 0 (0.0%) |
| $50,000 to $54,999 | 91 (9.6%) | 32 (3.7%) |
| $55,000 to $64,999 | 148 (15.7%) | 69 (7.9%) |
| $65,000 to $74,999 | 42 (4.4%) | 13 (1.5%) |
| $75,000 to $99,999 | 77 (8.2%) | 103 (11.8%) |
| $100,000+ | 116 (12.3%) | 42 (4.8%) |
| Total | 945 (100.0%) | 875 (100.0%) |
Earnings by Sex by Educational Attainment in Wheatland
Average earnings in Wheatland are $50,907 for men and $42,718 for women, a difference of 16.1%. Men with an educational attainment of high school diploma enjoy the highest average annual earnings of $52,212, while those with less than high school education earn the least with $20,962. Women with an educational attainment of bachelor's degree earn the most with the average annual earnings of $70,000, while those with college or associate's degree education have the smallest earnings of $39,375.
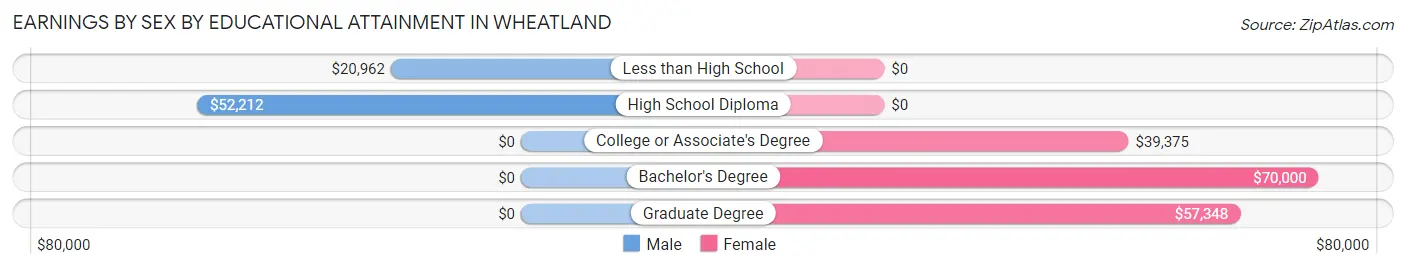
| Educational Attainment | Male Income | Female Income |
| Less than High School | $20,962 | $0 |
| High School Diploma | $52,212 | $0 |
| College or Associate's Degree | - | - |
| Bachelor's Degree | - | - |
| Graduate Degree | - | - |
| Total | $50,907 | $42,718 |
Family Income in Wheatland
Family Income Brackets in Wheatland
According to the Wheatland family income data, there are 211 families falling into the $100,000 to $149,999 income range, which is the most common income bracket and makes up 25.4% of all families. Conversely, the $25,000 to $34,999 income bracket is the least frequent group with only 10 families (1.2%) belonging to this category.
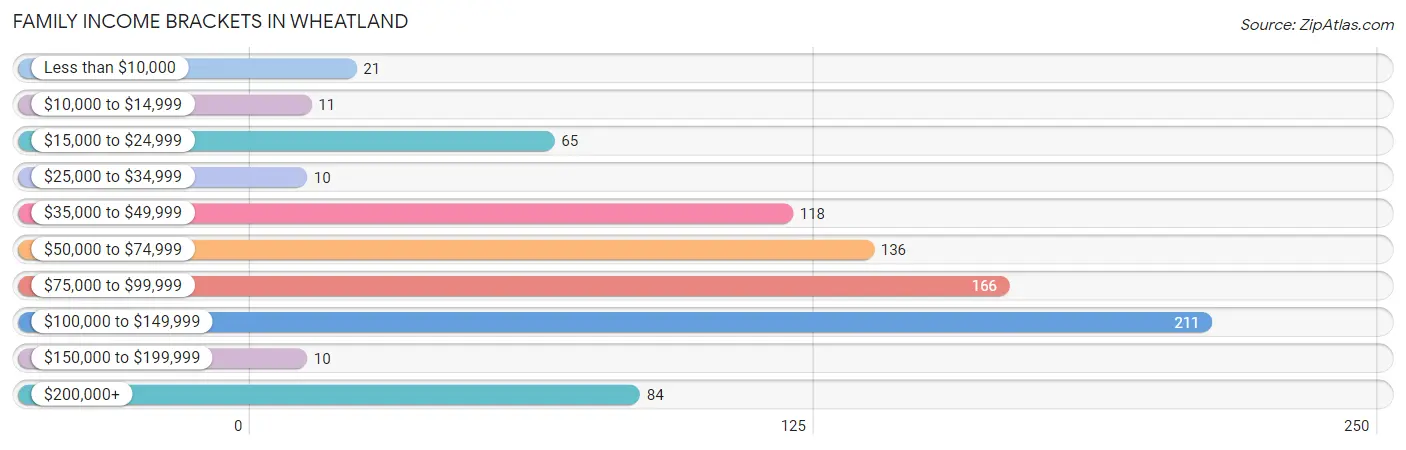
| Income Bracket | # Families | % Families |
| Less than $10,000 | 21 | 2.5% |
| $10,000 to $14,999 | 11 | 1.3% |
| $15,000 to $24,999 | 65 | 7.8% |
| $25,000 to $34,999 | 10 | 1.2% |
| $35,000 to $49,999 | 118 | 14.2% |
| $50,000 to $74,999 | 136 | 16.3% |
| $75,000 to $99,999 | 166 | 20.0% |
| $100,000 to $149,999 | 211 | 25.4% |
| $150,000 to $199,999 | 10 | 1.2% |
| $200,000+ | 84 | 10.1% |
Family Income by Famaliy Size in Wheatland
4-person families (205 | 24.6%) account for the highest median family income in Wheatland with $96,250 per family, while 2-person families (511 | 61.4%) have the highest median income of $34,910 per family member.
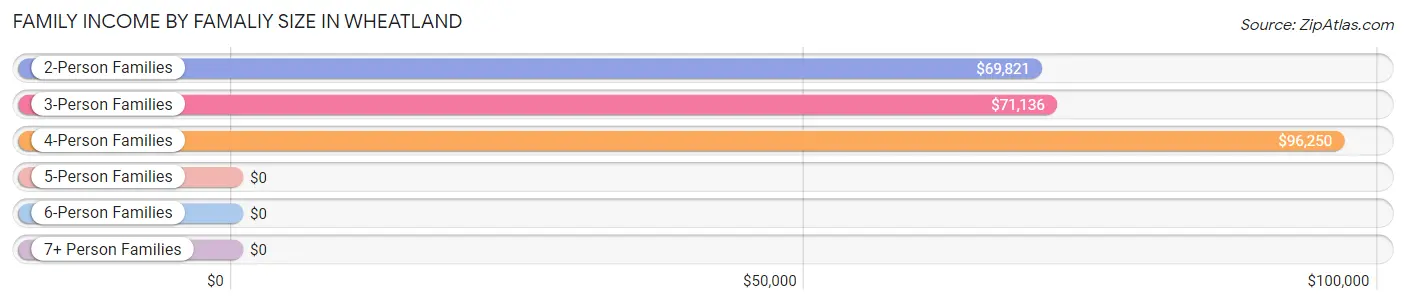
| Income Bracket | # Families | Median Income |
| 2-Person Families | 511 (61.4%) | $69,821 |
| 3-Person Families | 68 (8.2%) | $71,136 |
| 4-Person Families | 205 (24.6%) | $96,250 |
| 5-Person Families | 48 (5.8%) | $0 |
| 6-Person Families | 0 (0.0%) | $0 |
| 7+ Person Families | 0 (0.0%) | $0 |
| Total | 832 (100.0%) | $95,332 |
Family Income by Number of Earners in Wheatland
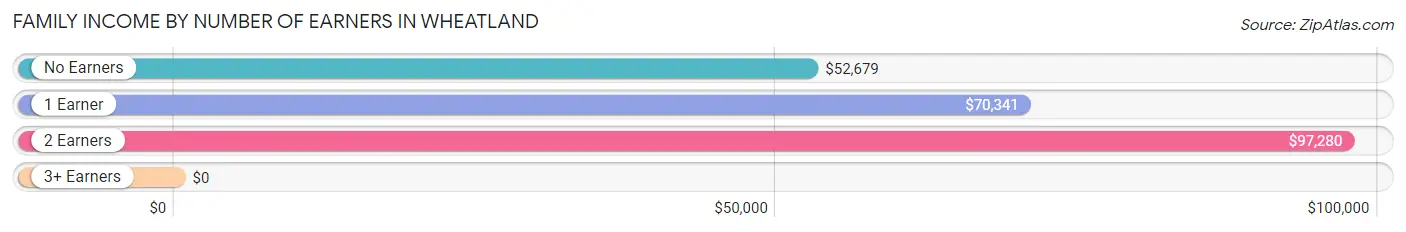
| Number of Earners | # Families | Median Income |
| No Earners | 123 (14.8%) | $52,679 |
| 1 Earner | 390 (46.9%) | $70,341 |
| 2 Earners | 298 (35.8%) | $97,280 |
| 3+ Earners | 21 (2.5%) | $0 |
| Total | 832 (100.0%) | $95,332 |
Household Income in Wheatland
Household Income Brackets in Wheatland
With 285 households falling in the category, the $50,000 to $74,999 income range is the most frequent in Wheatland, accounting for 16.7% of all households. In contrast, only 66 households (3.9%) fall into the $10,000 to $14,999 income bracket, making it the least populous group.
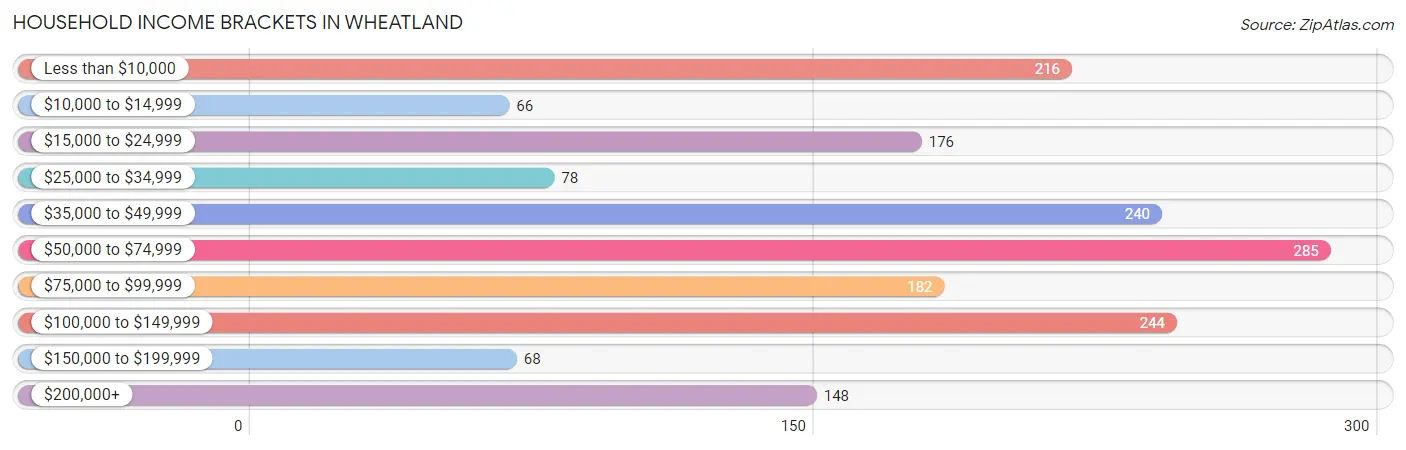
| Income Bracket | # Households | % Households |
| Less than $10,000 | 216 | 12.7% |
| $10,000 to $14,999 | 66 | 3.9% |
| $15,000 to $24,999 | 176 | 10.3% |
| $25,000 to $34,999 | 78 | 4.6% |
| $35,000 to $49,999 | 240 | 14.1% |
| $50,000 to $74,999 | 285 | 16.7% |
| $75,000 to $99,999 | 182 | 10.7% |
| $100,000 to $149,999 | 244 | 14.3% |
| $150,000 to $199,999 | 68 | 4.0% |
| $200,000+ | 148 | 8.7% |
Household Income by Householder Age in Wheatland
The median household income in Wheatland is $53,627, with the highest median household income of $69,208 found in the 45 to 64 years age bracket for the primary householder. A total of 474 households (27.8%) fall into this category. Meanwhile, the 15 to 24 years age bracket for the primary householder has the lowest median household income of $0, with 22 households (1.3%) in this group.
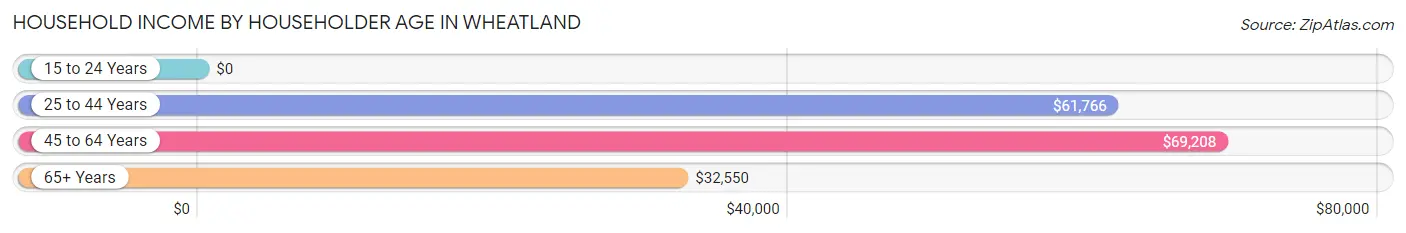
| Income Bracket | # Households | Median Income |
| 15 to 24 Years | 22 (1.3%) | $0 |
| 25 to 44 Years | 639 (37.5%) | $61,766 |
| 45 to 64 Years | 474 (27.8%) | $69,208 |
| 65+ Years | 569 (33.4%) | $32,550 |
| Total | 1,704 (100.0%) | $53,627 |
Poverty in Wheatland
Income Below Poverty by Sex and Age in Wheatland
With 16.1% poverty level for males and 5.8% for females among the residents of Wheatland, 25 to 34 year old males and 55 to 64 year old females are the most vulnerable to poverty, with 122 males (35.5%) and 36 females (14.1%) in their respective age groups living below the poverty level.
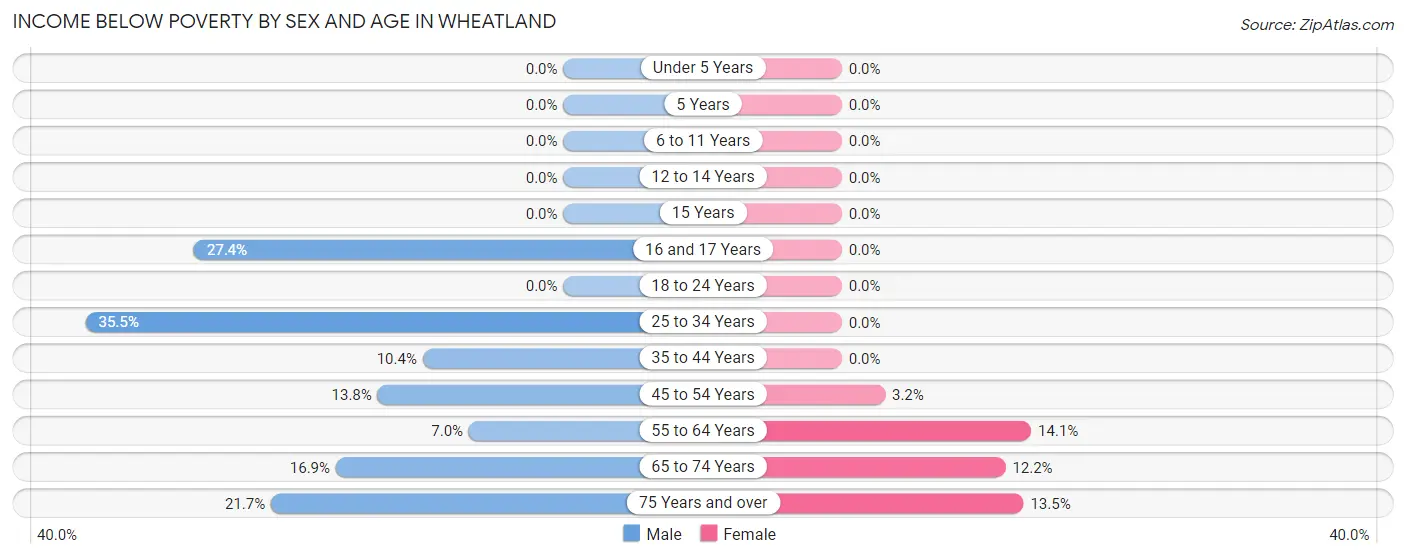
| Age Bracket | Male | Female |
| Under 5 Years | 0 (0.0%) | 0 (0.0%) |
| 5 Years | 0 (0.0%) | 0 (0.0%) |
| 6 to 11 Years | 0 (0.0%) | 0 (0.0%) |
| 12 to 14 Years | 0 (0.0%) | 0 (0.0%) |
| 15 Years | 0 (0.0%) | 0 (0.0%) |
| 16 and 17 Years | 31 (27.4%) | 0 (0.0%) |
| 18 to 24 Years | 0 (0.0%) | 0 (0.0%) |
| 25 to 34 Years | 122 (35.5%) | 0 (0.0%) |
| 35 to 44 Years | 26 (10.4%) | 0 (0.0%) |
| 45 to 54 Years | 28 (13.8%) | 7 (3.2%) |
| 55 to 64 Years | 15 (7.0%) | 36 (14.1%) |
| 65 to 74 Years | 38 (16.9%) | 22 (12.1%) |
| 75 Years and over | 23 (21.7%) | 34 (13.5%) |
| Total | 283 (16.1%) | 99 (5.8%) |
Income Above Poverty by Sex and Age in Wheatland
According to the poverty statistics in Wheatland, males aged under 5 years and females aged under 5 years are the age groups that are most secure financially, with 100.0% of males and 100.0% of females in these age groups living above the poverty line.
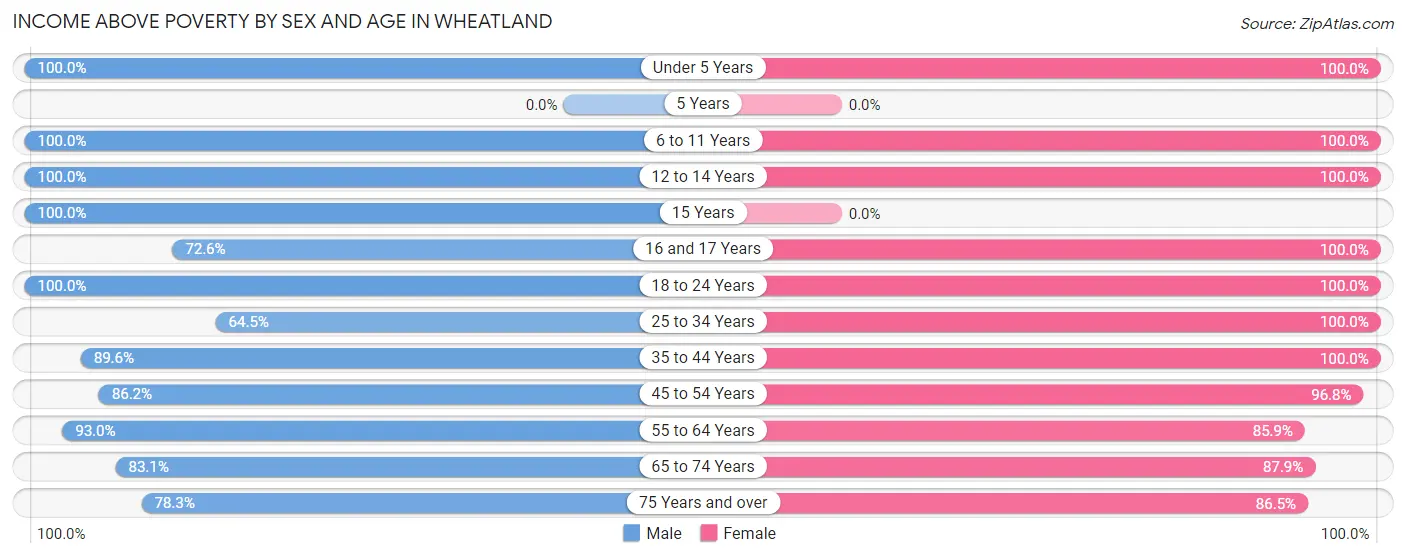
| Age Bracket | Male | Female |
| Under 5 Years | 73 (100.0%) | 49 (100.0%) |
| 5 Years | 0 (0.0%) | 0 (0.0%) |
| 6 to 11 Years | 52 (100.0%) | 54 (100.0%) |
| 12 to 14 Years | 33 (100.0%) | 70 (100.0%) |
| 15 Years | 113 (100.0%) | 0 (0.0%) |
| 16 and 17 Years | 82 (72.6%) | 22 (100.0%) |
| 18 to 24 Years | 32 (100.0%) | 109 (100.0%) |
| 25 to 34 Years | 222 (64.5%) | 207 (100.0%) |
| 35 to 44 Years | 223 (89.6%) | 283 (100.0%) |
| 45 to 54 Years | 175 (86.2%) | 211 (96.8%) |
| 55 to 64 Years | 199 (93.0%) | 220 (85.9%) |
| 65 to 74 Years | 187 (83.1%) | 159 (87.8%) |
| 75 Years and over | 83 (78.3%) | 218 (86.5%) |
| Total | 1,474 (83.9%) | 1,602 (94.2%) |
Income Below Poverty Among Married-Couple Families in Wheatland
The poverty statistics for married-couple families in Wheatland show that 4.5% or 32 of the total 714 families live below the poverty line. Families with no children have the highest poverty rate of 7.0%, comprising of 32 families. On the other hand, families with 1 or 2 children have the lowest poverty rate of 0.0%, which includes 0 families.
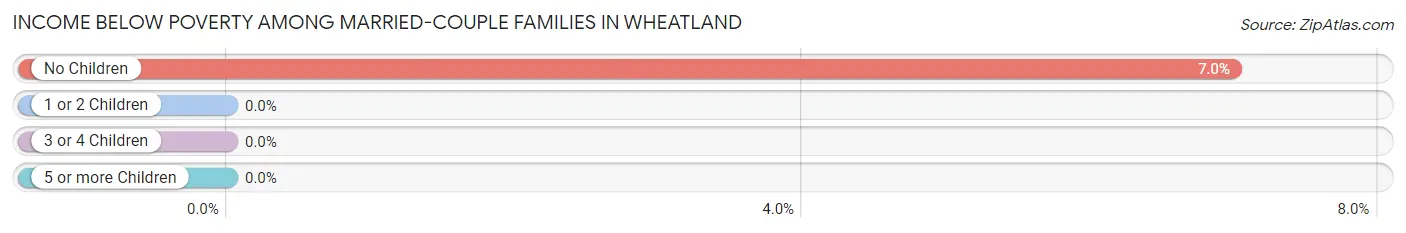
| Children | Above Poverty | Below Poverty |
| No Children | 426 (93.0%) | 32 (7.0%) |
| 1 or 2 Children | 208 (100.0%) | 0 (0.0%) |
| 3 or 4 Children | 48 (100.0%) | 0 (0.0%) |
| 5 or more Children | 0 (0.0%) | 0 (0.0%) |
| Total | 682 (95.5%) | 32 (4.5%) |
Income Below Poverty Among Single-Parent Households in Wheatland
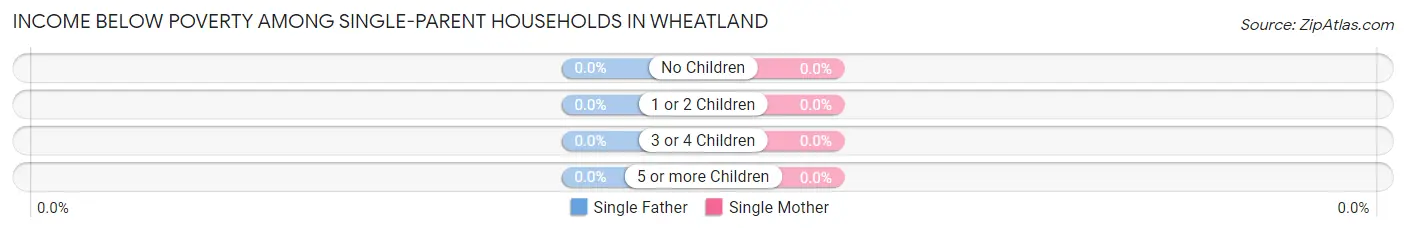
| Children | Single Father | Single Mother |
| No Children | 0 (0.0%) | 0 (0.0%) |
| 1 or 2 Children | 0 (0.0%) | 0 (0.0%) |
| 3 or 4 Children | 0 (0.0%) | 0 (0.0%) |
| 5 or more Children | 0 (0.0%) | 0 (0.0%) |
| Total | 0 (0.0%) | 0 (0.0%) |
Income Below Poverty Among Married-Couple vs Single-Parent Households in Wheatland
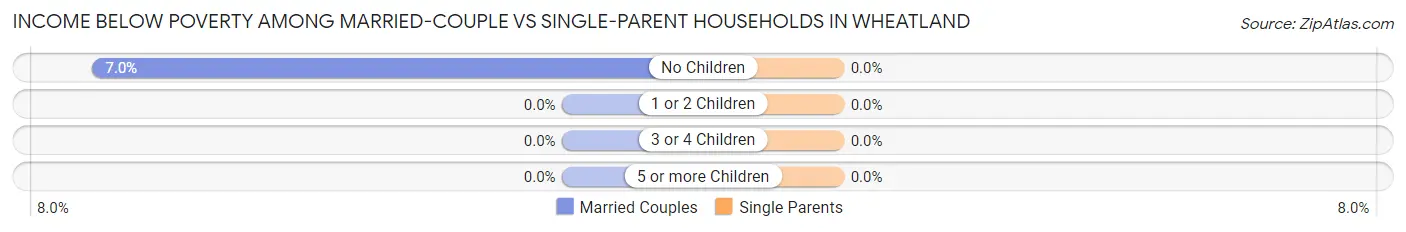
| Children | Married-Couple Families | Single-Parent Households |
| No Children | 32 (7.0%) | 0 (0.0%) |
| 1 or 2 Children | 0 (0.0%) | 0 (0.0%) |
| 3 or 4 Children | 0 (0.0%) | 0 (0.0%) |
| 5 or more Children | 0 (0.0%) | 0 (0.0%) |
| Total | 32 (4.5%) | 0 (0.0%) |
Race in Wheatland
The most populous races in Wheatland are White / Caucasian (2,879 | 80.5%), Two or more Races (684 | 19.1%), and Hispanic or Latino (532 | 14.9%).
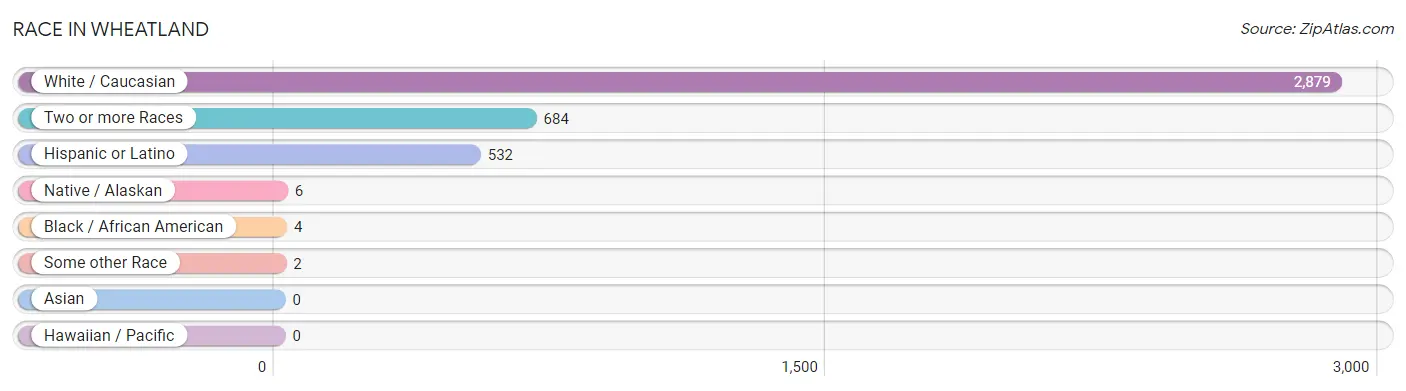
| Race | # Population | % Population |
| Asian | 0 | 0.0% |
| Black / African American | 4 | 0.1% |
| Hawaiian / Pacific | 0 | 0.0% |
| Hispanic or Latino | 532 | 14.9% |
| Native / Alaskan | 6 | 0.2% |
| White / Caucasian | 2,879 | 80.5% |
| Two or more Races | 684 | 19.1% |
| Some other Race | 2 | 0.1% |
| Total | 3,575 | 100.0% |
Ancestry in Wheatland
The most populous ancestries reported in Wheatland are German (993 | 27.8%), English (504 | 14.1%), Swedish (244 | 6.8%), Irish (218 | 6.1%), and Dutch (152 | 4.3%), together accounting for 59.1% of all Wheatland residents.
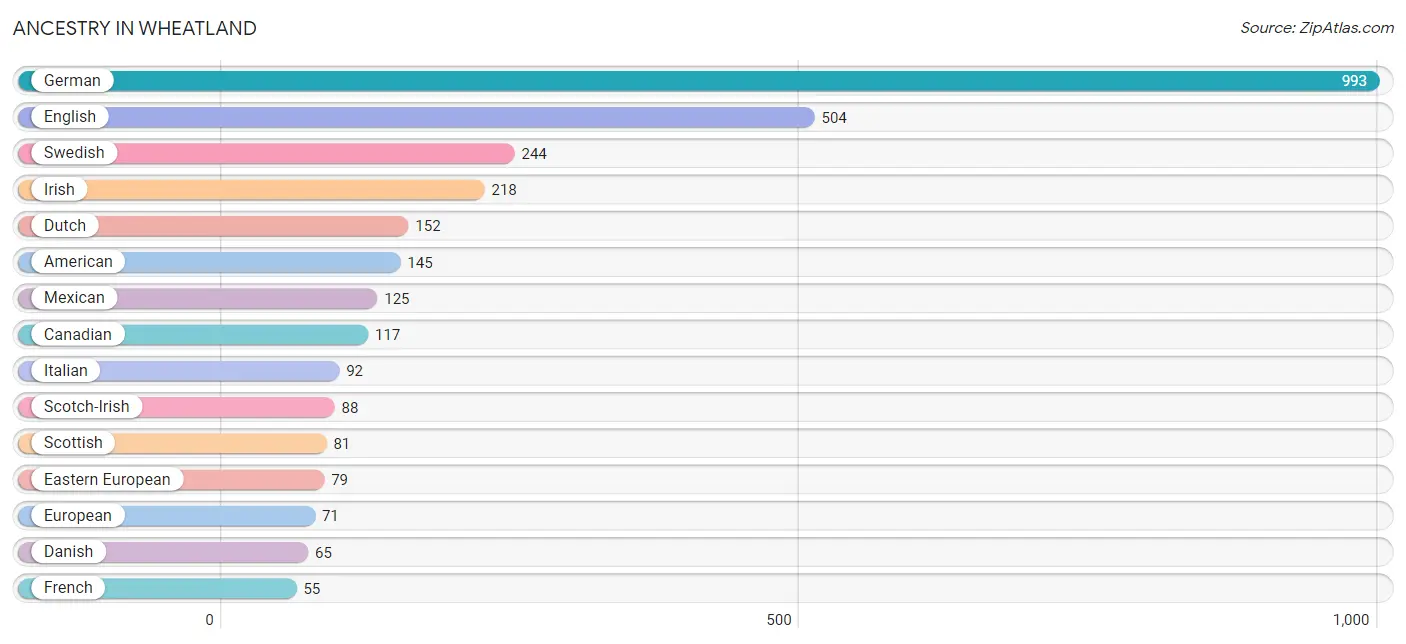
| Ancestry | # Population | % Population |
| American | 145 | 4.1% |
| Arapaho | 6 | 0.2% |
| Canadian | 117 | 3.3% |
| Cherokee | 32 | 0.9% |
| Danish | 65 | 1.8% |
| Dutch | 152 | 4.3% |
| Eastern European | 79 | 2.2% |
| English | 504 | 14.1% |
| European | 71 | 2.0% |
| French | 55 | 1.5% |
| German | 993 | 27.8% |
| Greek | 3 | 0.1% |
| Irish | 218 | 6.1% |
| Italian | 92 | 2.6% |
| Mexican | 125 | 3.5% |
| Norwegian | 53 | 1.5% |
| Scandinavian | 3 | 0.1% |
| Scotch-Irish | 88 | 2.5% |
| Scottish | 81 | 2.3% |
| Slovene | 16 | 0.4% |
| Swedish | 244 | 6.8% | View All 21 Rows |
Immigrants in Wheatland

| Immigration Origin | # Population | % Population | View All 0 Rows |
Sex and Age in Wheatland
Sex and Age in Wheatland
The most populous age groups in Wheatland are 15 to 19 Years (226 | 12.4%) for men and 40 to 44 Years (176 | 10.0%) for women.
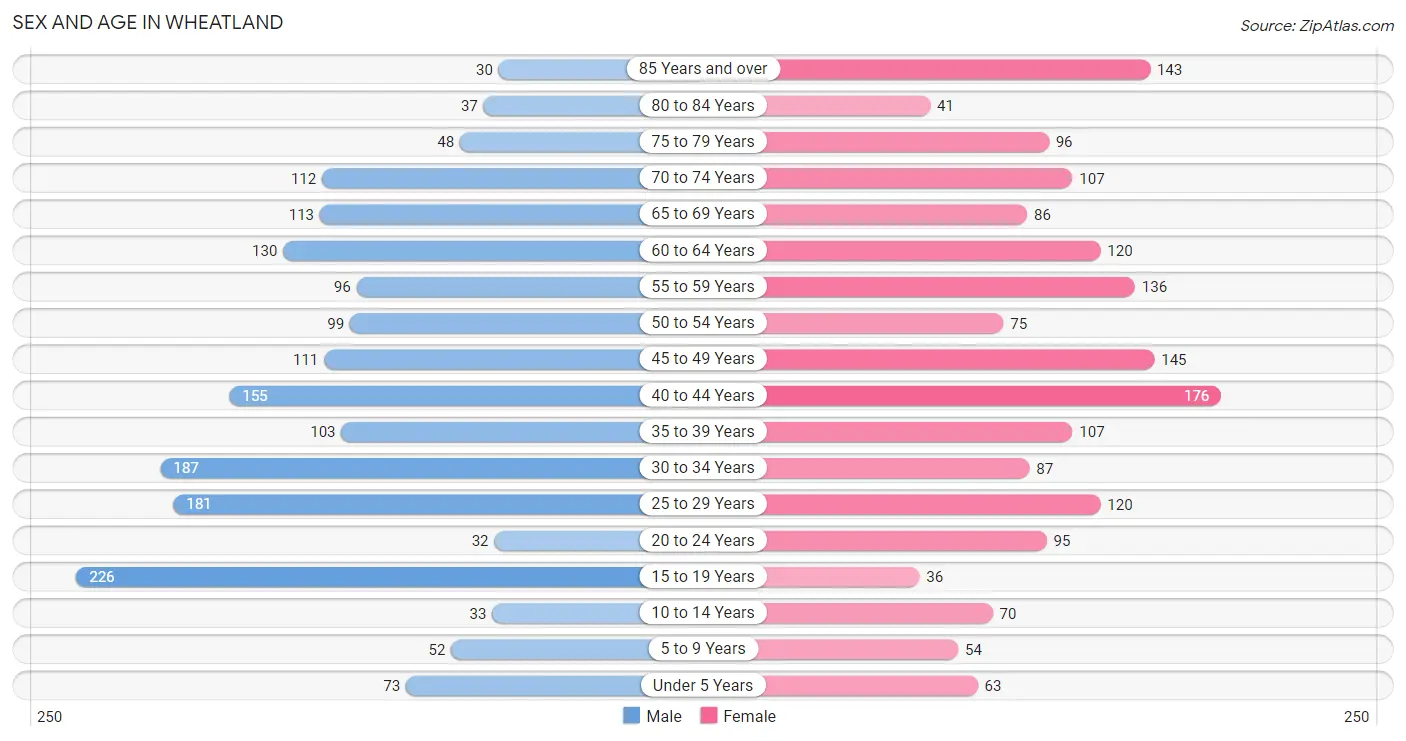
| Age Bracket | Male | Female |
| Under 5 Years | 73 (4.0%) | 63 (3.6%) |
| 5 to 9 Years | 52 (2.9%) | 54 (3.1%) |
| 10 to 14 Years | 33 (1.8%) | 70 (4.0%) |
| 15 to 19 Years | 226 (12.4%) | 36 (2.1%) |
| 20 to 24 Years | 32 (1.8%) | 95 (5.4%) |
| 25 to 29 Years | 181 (10.0%) | 120 (6.8%) |
| 30 to 34 Years | 187 (10.3%) | 87 (5.0%) |
| 35 to 39 Years | 103 (5.7%) | 107 (6.1%) |
| 40 to 44 Years | 155 (8.5%) | 176 (10.0%) |
| 45 to 49 Years | 111 (6.1%) | 145 (8.3%) |
| 50 to 54 Years | 99 (5.4%) | 75 (4.3%) |
| 55 to 59 Years | 96 (5.3%) | 136 (7.7%) |
| 60 to 64 Years | 130 (7.1%) | 120 (6.8%) |
| 65 to 69 Years | 113 (6.2%) | 86 (4.9%) |
| 70 to 74 Years | 112 (6.2%) | 107 (6.1%) |
| 75 to 79 Years | 48 (2.6%) | 96 (5.5%) |
| 80 to 84 Years | 37 (2.0%) | 41 (2.3%) |
| 85 Years and over | 30 (1.7%) | 143 (8.1%) |
| Total | 1,818 (100.0%) | 1,757 (100.0%) |
Families and Households in Wheatland
Median Family Size in Wheatland
The median family size in Wheatland is 2.86 persons per family, with married-couple families (714 | 85.8%) accounting for the largest median family size of 2.99 persons per family. On the other hand, single female/mother families (92 | 11.1%) represent the smallest median family size with 1.84 persons per family.
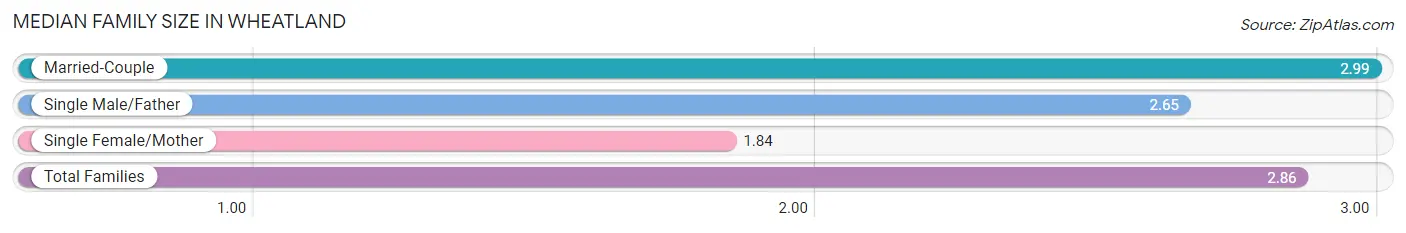
| Family Type | # Families | Family Size |
| Married-Couple | 714 (85.8%) | 2.99 |
| Single Male/Father | 26 (3.1%) | 2.65 |
| Single Female/Mother | 92 (11.1%) | 1.84 |
| Total Families | 832 (100.0%) | 2.86 |
Median Household Size in Wheatland
The median household size in Wheatland is 2.04 persons per household, with single male/father households (26 | 1.5%) accounting for the largest median household size of 3.27 persons per household. non-family households (872 | 51.2%) represent the smallest median household size with 1.12 persons per household.
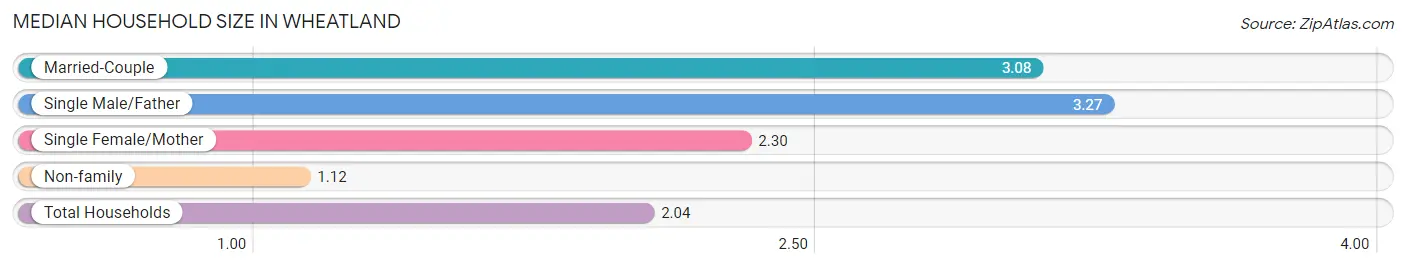
| Household Type | # Households | Household Size |
| Married-Couple | 714 (41.9%) | 3.08 |
| Single Male/Father | 26 (1.5%) | 3.27 |
| Single Female/Mother | 92 (5.4%) | 2.30 |
| Non-family | 872 (51.2%) | 1.12 |
| Total Households | 1,704 (100.0%) | 2.04 |
Household Size by Marriage Status in Wheatland
Out of a total of 1,704 households in Wheatland, 832 (48.8%) are family households, while 872 (51.2%) are nonfamily households. The most numerous type of family households are 2-person households, comprising 411, and the most common type of nonfamily households are 1-person households, comprising 743.
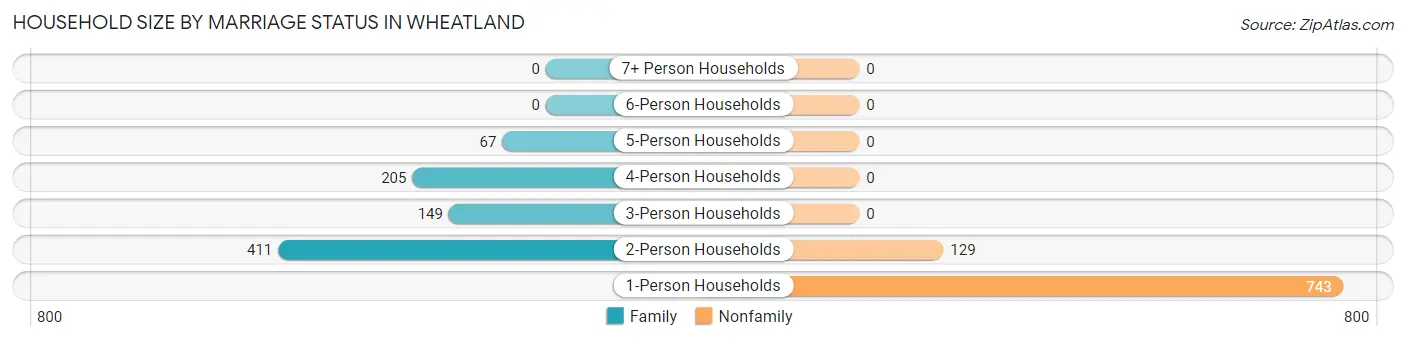
| Household Size | Family Households | Nonfamily Households |
| 1-Person Households | - | 743 (43.6%) |
| 2-Person Households | 411 (24.1%) | 129 (7.6%) |
| 3-Person Households | 149 (8.7%) | 0 (0.0%) |
| 4-Person Households | 205 (12.0%) | 0 (0.0%) |
| 5-Person Households | 67 (3.9%) | 0 (0.0%) |
| 6-Person Households | 0 (0.0%) | 0 (0.0%) |
| 7+ Person Households | 0 (0.0%) | 0 (0.0%) |
| Total | 832 (48.8%) | 872 (51.2%) |
Female Fertility in Wheatland
Fertility by Age in Wheatland
Average fertility rate in Wheatland is 25.0 births per 1,000 women. Women in the age bracket of 20 to 34 years have the highest fertility rate with 63.0 births per 1,000 women. Women in the age bracket of 20 to 34 years acount for 100.0% of all women with births.
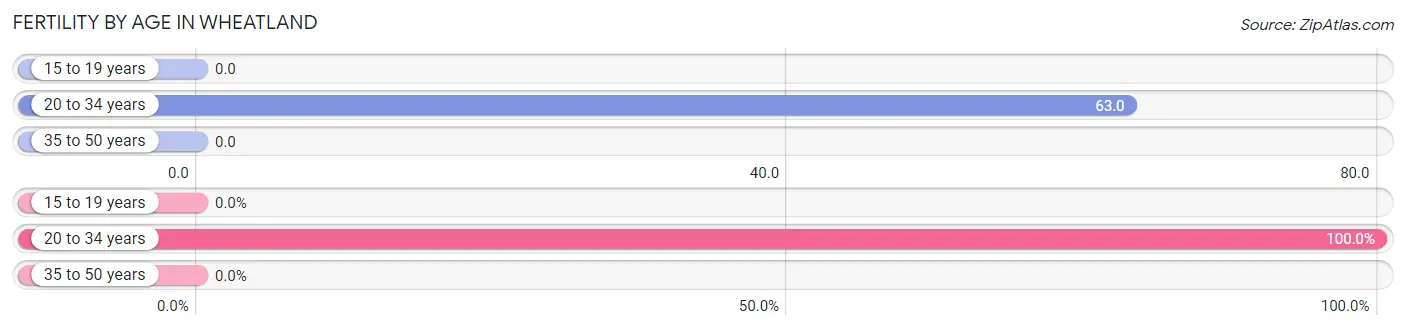
| Age Bracket | Women with Births | Births / 1,000 Women |
| 15 to 19 years | 0 (0.0%) | 0.0 |
| 20 to 34 years | 19 (100.0%) | 63.0 |
| 35 to 50 years | 0 (0.0%) | 0.0 |
| Total | 19 (100.0%) | 25.0 |
Fertility by Age by Marriage Status in Wheatland
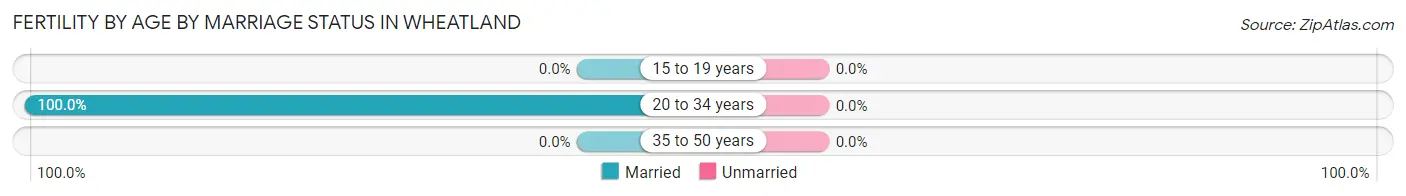
| Age Bracket | Married | Unmarried |
| 15 to 19 years | 0 (0.0%) | 0 (0.0%) |
| 20 to 34 years | 19 (100.0%) | 0 (0.0%) |
| 35 to 50 years | 0 (0.0%) | 0 (0.0%) |
| Total | 19 (100.0%) | 0 (0.0%) |
Fertility by Education in Wheatland
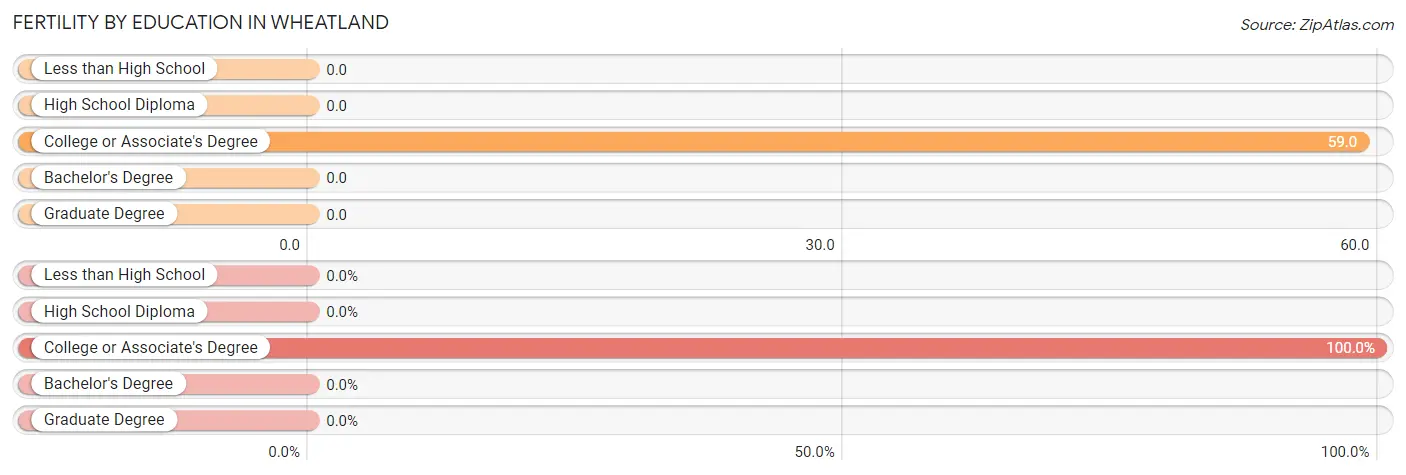
| Educational Attainment | Women with Births | Births / 1,000 Women |
| Less than High School | 0 (0.0%) | 0.0 |
| High School Diploma | 0 (0.0%) | 0.0 |
| College or Associate's Degree | 19 (100.0%) | 59.0 |
| Bachelor's Degree | 0 (0.0%) | 0.0 |
| Graduate Degree | 0 (0.0%) | 0.0 |
| Total | 19 (100.0%) | 25.0 |
Fertility by Education by Marriage Status in Wheatland
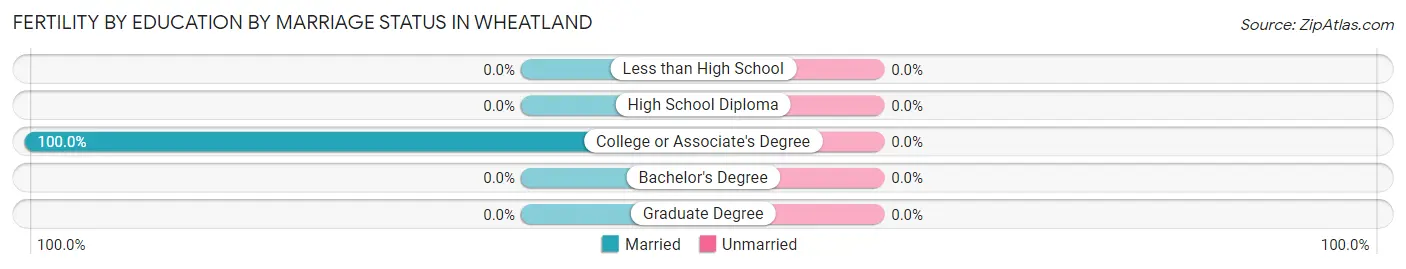
| Educational Attainment | Married | Unmarried |
| Less than High School | 0 (0.0%) | 0 (0.0%) |
| High School Diploma | 0 (0.0%) | 0 (0.0%) |
| College or Associate's Degree | 19 (100.0%) | 0 (0.0%) |
| Bachelor's Degree | 0 (0.0%) | 0 (0.0%) |
| Graduate Degree | 0 (0.0%) | 0 (0.0%) |
| Total | 19 (100.0%) | 0 (0.0%) |
Employment Characteristics in Wheatland
Employment by Class of Employer in Wheatland
Among the 1,542 employed individuals in Wheatland, private company employees (845 | 54.8%), not-for-profit organizations (243 | 15.8%), and self-employed (not incorporated) (237 | 15.4%) make up the most common classes of employment.
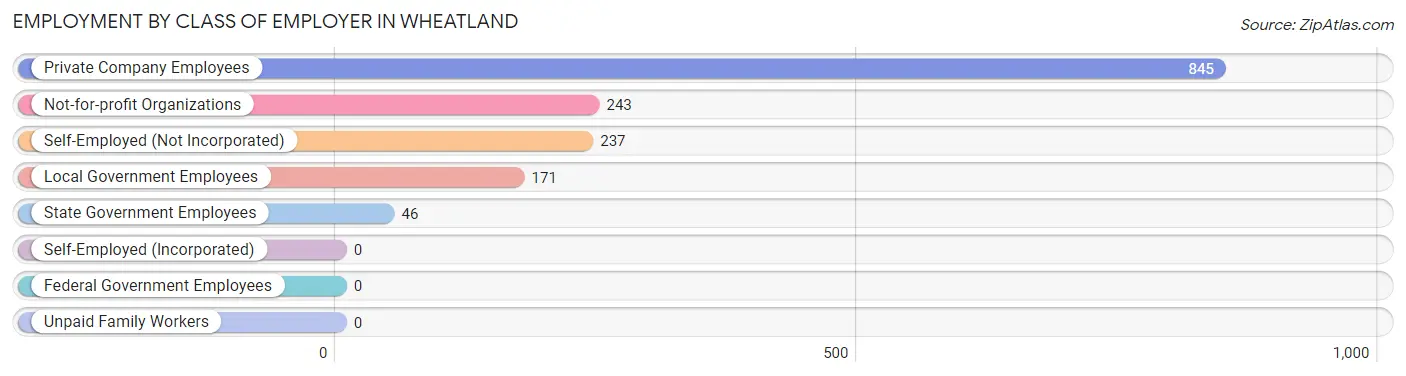
| Employer Class | # Employees | % Employees |
| Private Company Employees | 845 | 54.8% |
| Self-Employed (Incorporated) | 0 | 0.0% |
| Self-Employed (Not Incorporated) | 237 | 15.4% |
| Not-for-profit Organizations | 243 | 15.8% |
| Local Government Employees | 171 | 11.1% |
| State Government Employees | 46 | 3.0% |
| Federal Government Employees | 0 | 0.0% |
| Unpaid Family Workers | 0 | 0.0% |
| Total | 1,542 | 100.0% |
Employment Status by Age in Wheatland
According to the labor force statistics for Wheatland, out of the total population over 16 years of age (3,117), 51.1% or 1,593 individuals are in the labor force, with 1.8% or 29 of them unemployed. The age group with the highest labor force participation rate is 45 to 54 years, with 94.0% or 404 individuals in the labor force. Within the labor force, the 45 to 54 years age range has the highest percentage of unemployed individuals, with 6.9% or 28 of them being unemployed.
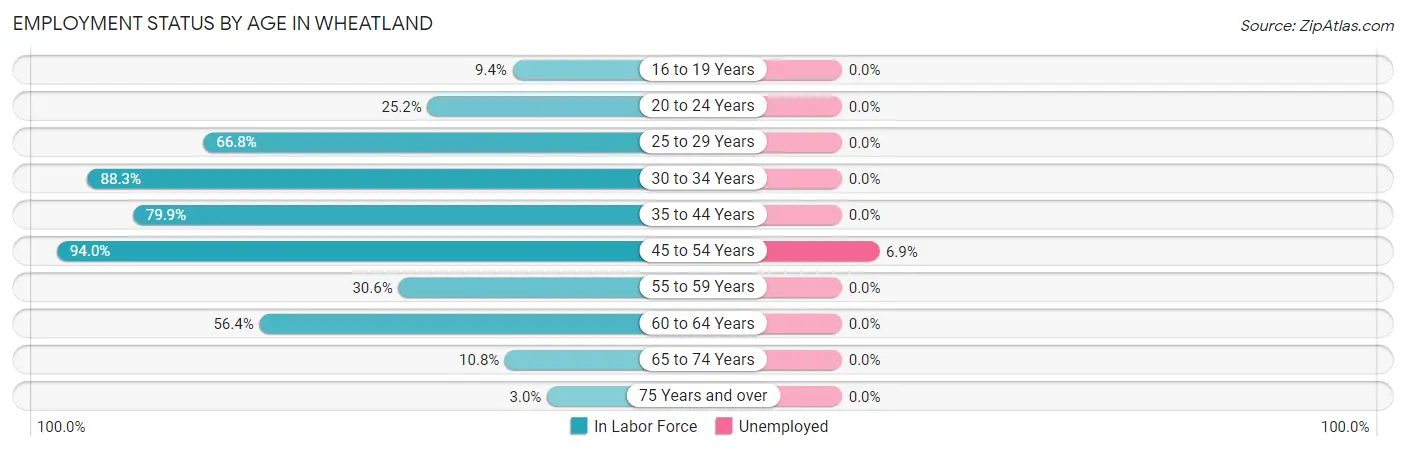
| Age Bracket | In Labor Force | Unemployed |
| 16 to 19 Years | 14 (9.4%) | 0 (0.0%) |
| 20 to 24 Years | 32 (25.2%) | 0 (0.0%) |
| 25 to 29 Years | 201 (66.8%) | 0 (0.0%) |
| 30 to 34 Years | 242 (88.3%) | 0 (0.0%) |
| 35 to 44 Years | 432 (79.9%) | 0 (0.0%) |
| 45 to 54 Years | 404 (94.0%) | 28 (6.9%) |
| 55 to 59 Years | 71 (30.6%) | 0 (0.0%) |
| 60 to 64 Years | 141 (56.4%) | 0 (0.0%) |
| 65 to 74 Years | 45 (10.8%) | 0 (0.0%) |
| 75 Years and over | 12 (3.0%) | 0 (0.0%) |
| Total | 1,593 (51.1%) | 29 (1.8%) |
Employment Status by Educational Attainment in Wheatland
According to labor force statistics for Wheatland, 73.5% of individuals (1,491) out of the total population between 25 and 64 years of age (2,028) are in the labor force, with 1.9% or 28 of them being unemployed. The group with the highest labor force participation rate are those with the educational attainment of college / associate degree, with 82.4% or 695 individuals in the labor force. Within the labor force, individuals with college / associate degree education have the highest percentage of unemployment, with 4.0% or 28 of them being unemployed.
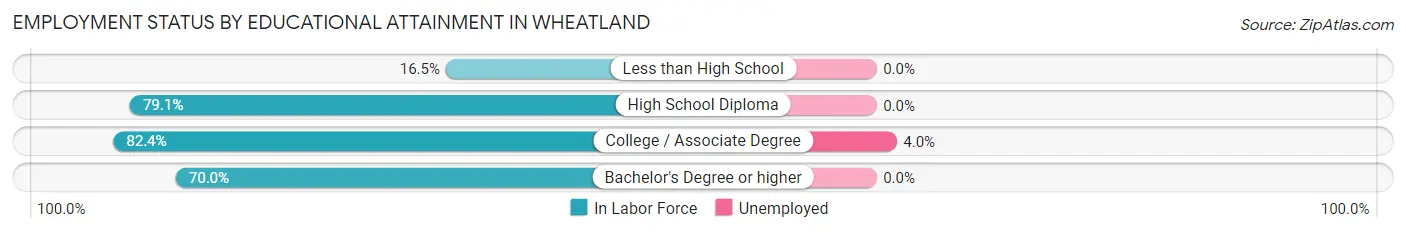
| Educational Attainment | In Labor Force | Unemployed |
| Less than High School | 26 (16.5%) | 0 (0.0%) |
| High School Diploma | 443 (79.1%) | 0 (0.0%) |
| College / Associate Degree | 695 (82.4%) | 34 (4.0%) |
| Bachelor's Degree or higher | 327 (70.0%) | 0 (0.0%) |
| Total | 1,491 (73.5%) | 39 (1.9%) |
Employment Occupations by Sex in Wheatland
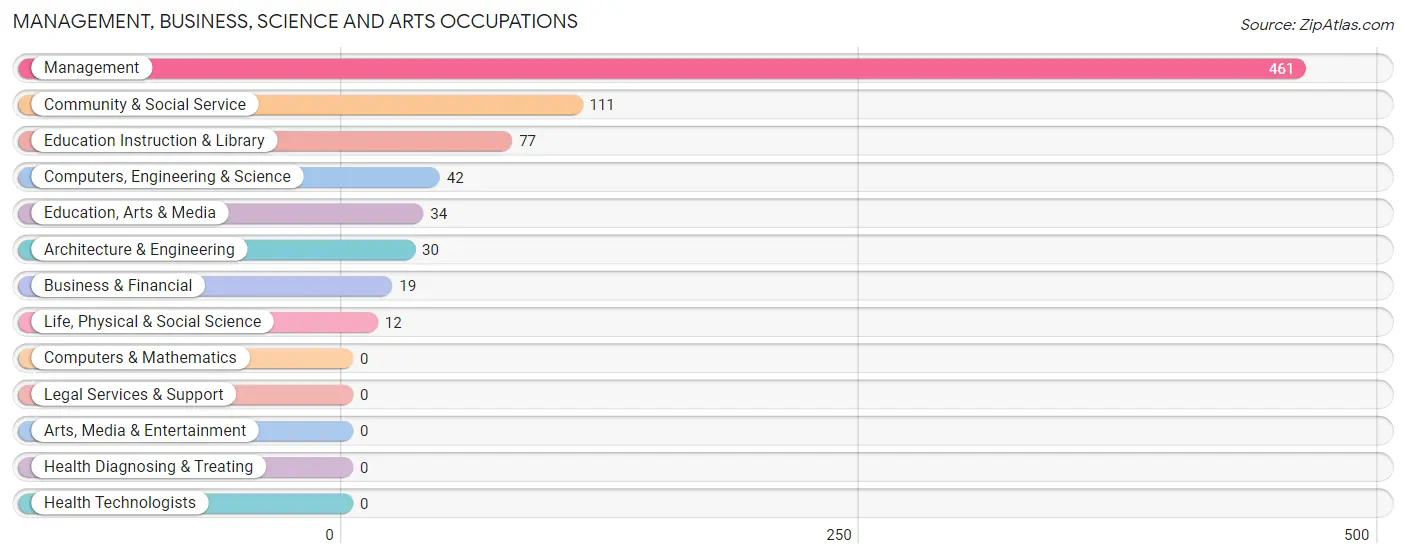
Management, Business, Science and Arts Occupations
The most common Management, Business, Science and Arts occupations in Wheatland are Management (461 | 29.4%), Community & Social Service (111 | 7.1%), Education Instruction & Library (77 | 4.9%), Computers, Engineering & Science (42 | 2.7%), and Education, Arts & Media (34 | 2.2%).
Management, Business, Science and Arts Occupations by Sex
Within the Management, Business, Science and Arts occupations in Wheatland, the most male-oriented occupations are Business & Financial (100.0%), Life, Physical & Social Science (100.0%), and Education, Arts & Media (100.0%), while the most female-oriented occupations are Architecture & Engineering (100.0%), Education Instruction & Library (74.0%), and Computers, Engineering & Science (71.4%).

| Occupation | Male | Female |
| Management | 190 (41.2%) | 271 (58.8%) |
| Business & Financial | 19 (100.0%) | 0 (0.0%) |
| Computers, Engineering & Science | 12 (28.6%) | 30 (71.4%) |
| Computers & Mathematics | 0 (0.0%) | 0 (0.0%) |
| Architecture & Engineering | 0 (0.0%) | 30 (100.0%) |
| Life, Physical & Social Science | 12 (100.0%) | 0 (0.0%) |
| Community & Social Service | 54 (48.6%) | 57 (51.3%) |
| Education, Arts & Media | 34 (100.0%) | 0 (0.0%) |
| Legal Services & Support | 0 (0.0%) | 0 (0.0%) |
| Education Instruction & Library | 20 (26.0%) | 57 (74.0%) |
| Arts, Media & Entertainment | 0 (0.0%) | 0 (0.0%) |
| Health Diagnosing & Treating | 0 (0.0%) | 0 (0.0%) |
| Health Technologists | 0 (0.0%) | 0 (0.0%) |
| Total (Category) | 275 (43.4%) | 358 (56.6%) |
| Total (Overall) | 882 (56.3%) | 684 (43.7%) |
Services Occupations
The most common Services occupations in Wheatland are Cleaning & Maintenance (117 | 7.5%), Food Preparation & Serving (47 | 3.0%), Security & Protection (14 | 0.9%), and Firefighting & Prevention (14 | 0.9%).
Services Occupations by Sex
| Occupation | Male | Female |
| Healthcare Support | 0 (0.0%) | 0 (0.0%) |
| Security & Protection | 0 (0.0%) | 14 (100.0%) |
| Firefighting & Prevention | 0 (0.0%) | 14 (100.0%) |
| Law Enforcement | 0 (0.0%) | 0 (0.0%) |
| Food Preparation & Serving | 0 (0.0%) | 47 (100.0%) |
| Cleaning & Maintenance | 79 (67.5%) | 38 (32.5%) |
| Personal Care & Service | 0 (0.0%) | 0 (0.0%) |
| Total (Category) | 79 (44.4%) | 99 (55.6%) |
| Total (Overall) | 882 (56.3%) | 684 (43.7%) |
Sales and Office Occupations
The most common Sales and Office occupations in Wheatland are Office & Administration (163 | 10.4%), and Sales & Related (148 | 9.5%).
Sales and Office Occupations by Sex
| Occupation | Male | Female |
| Sales & Related | 50 (33.8%) | 98 (66.2%) |
| Office & Administration | 40 (24.5%) | 123 (75.5%) |
| Total (Category) | 90 (28.9%) | 221 (71.1%) |
| Total (Overall) | 882 (56.3%) | 684 (43.7%) |
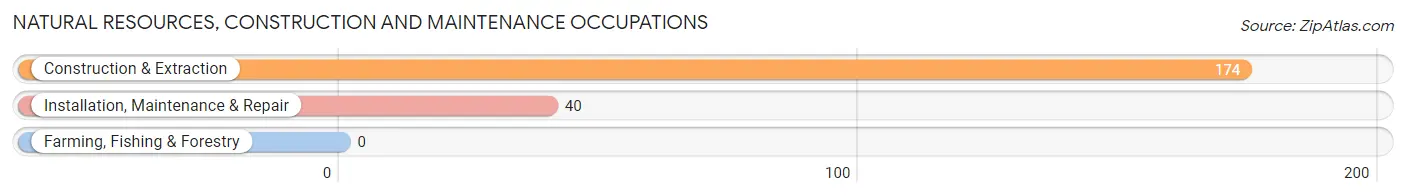
Natural Resources, Construction and Maintenance Occupations
The most common Natural Resources, Construction and Maintenance occupations in Wheatland are Construction & Extraction (174 | 11.1%), and Installation, Maintenance & Repair (40 | 2.5%).
Natural Resources, Construction and Maintenance Occupations by Sex
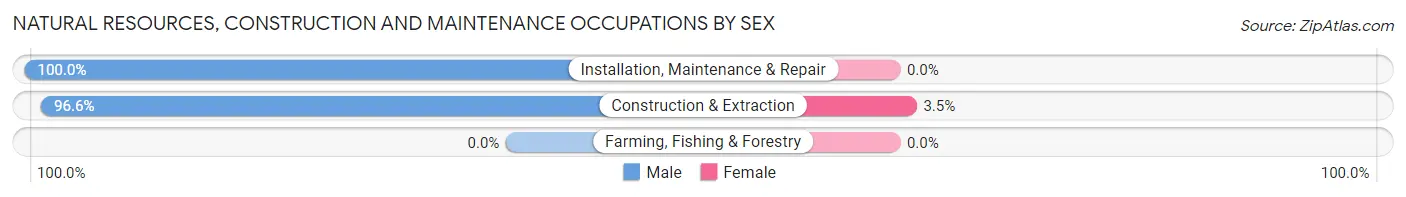
| Occupation | Male | Female |
| Farming, Fishing & Forestry | 0 (0.0%) | 0 (0.0%) |
| Construction & Extraction | 168 (96.6%) | 6 (3.5%) |
| Installation, Maintenance & Repair | 40 (100.0%) | 0 (0.0%) |
| Total (Category) | 208 (97.2%) | 6 (2.8%) |
| Total (Overall) | 882 (56.3%) | 684 (43.7%) |
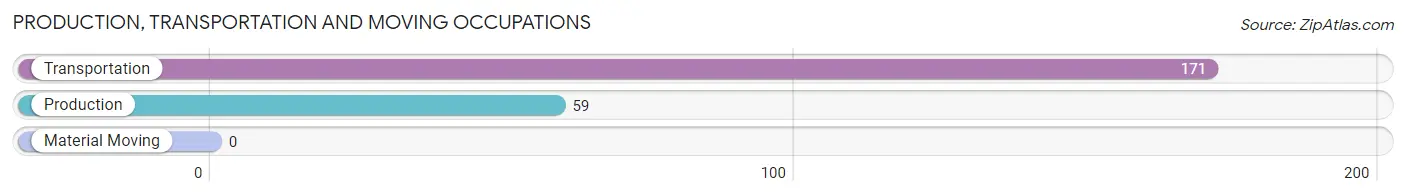
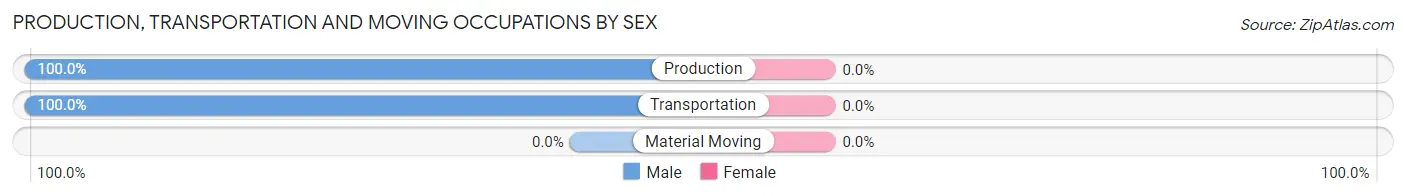
Production, Transportation and Moving Occupations
The most common Production, Transportation and Moving occupations in Wheatland are Transportation (171 | 10.9%), and Production (59 | 3.8%).
Production, Transportation and Moving Occupations by Sex
| Occupation | Male | Female |
| Production | 59 (100.0%) | 0 (0.0%) |
| Transportation | 171 (100.0%) | 0 (0.0%) |
| Material Moving | 0 (0.0%) | 0 (0.0%) |
| Total (Category) | 230 (100.0%) | 0 (0.0%) |
| Total (Overall) | 882 (56.3%) | 684 (43.7%) |
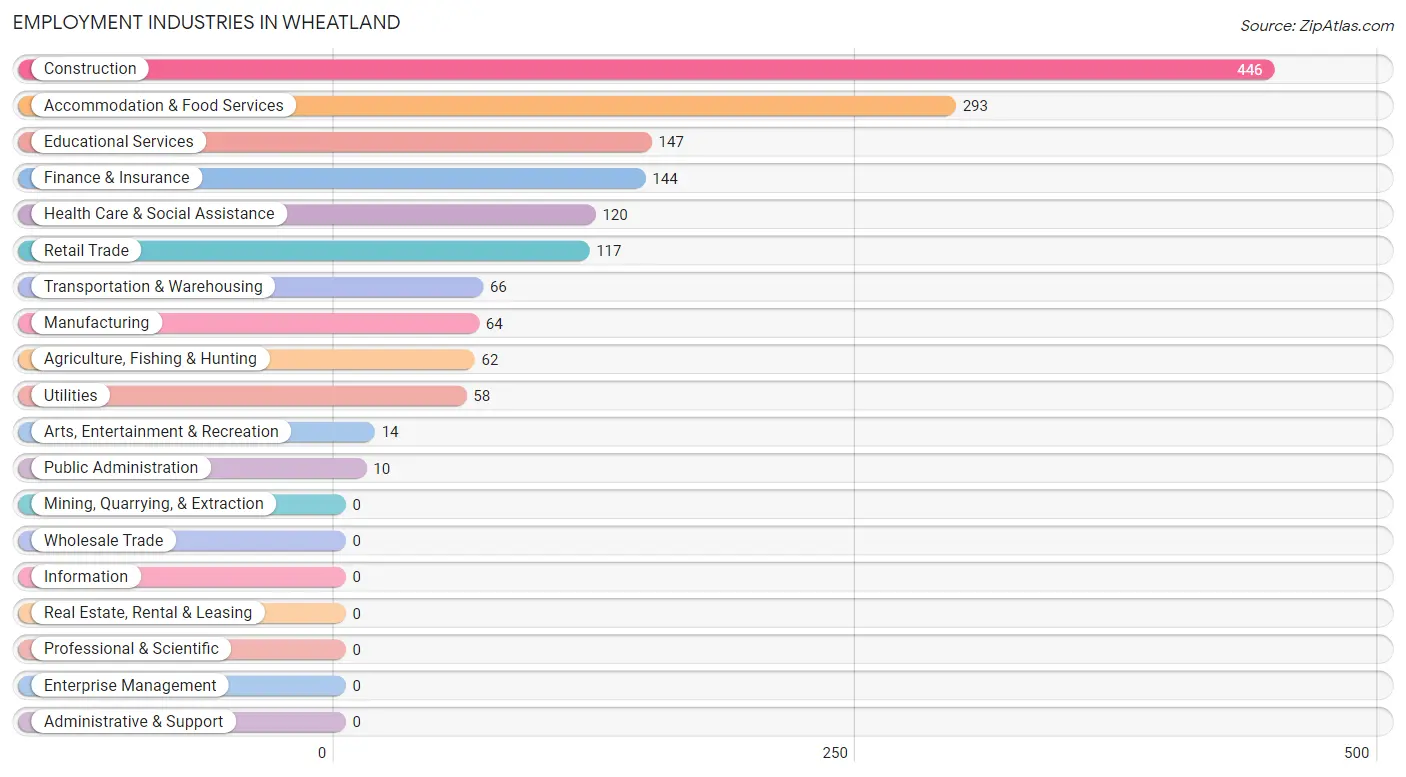
Employment Industries by Sex in Wheatland
Employment Industries in Wheatland
The major employment industries in Wheatland include Construction (446 | 28.5%), Accommodation & Food Services (293 | 18.7%), Educational Services (147 | 9.4%), Finance & Insurance (144 | 9.2%), and Health Care & Social Assistance (120 | 7.7%).
Employment Industries by Sex in Wheatland
The Wheatland industries that see more men than women are Agriculture, Fishing & Hunting (100.0%), Utilities (100.0%), and Transportation & Warehousing (74.2%), whereas the industries that tend to have a higher number of women are Arts, Entertainment & Recreation (100.0%), Public Administration (100.0%), and Finance & Insurance (91.7%).
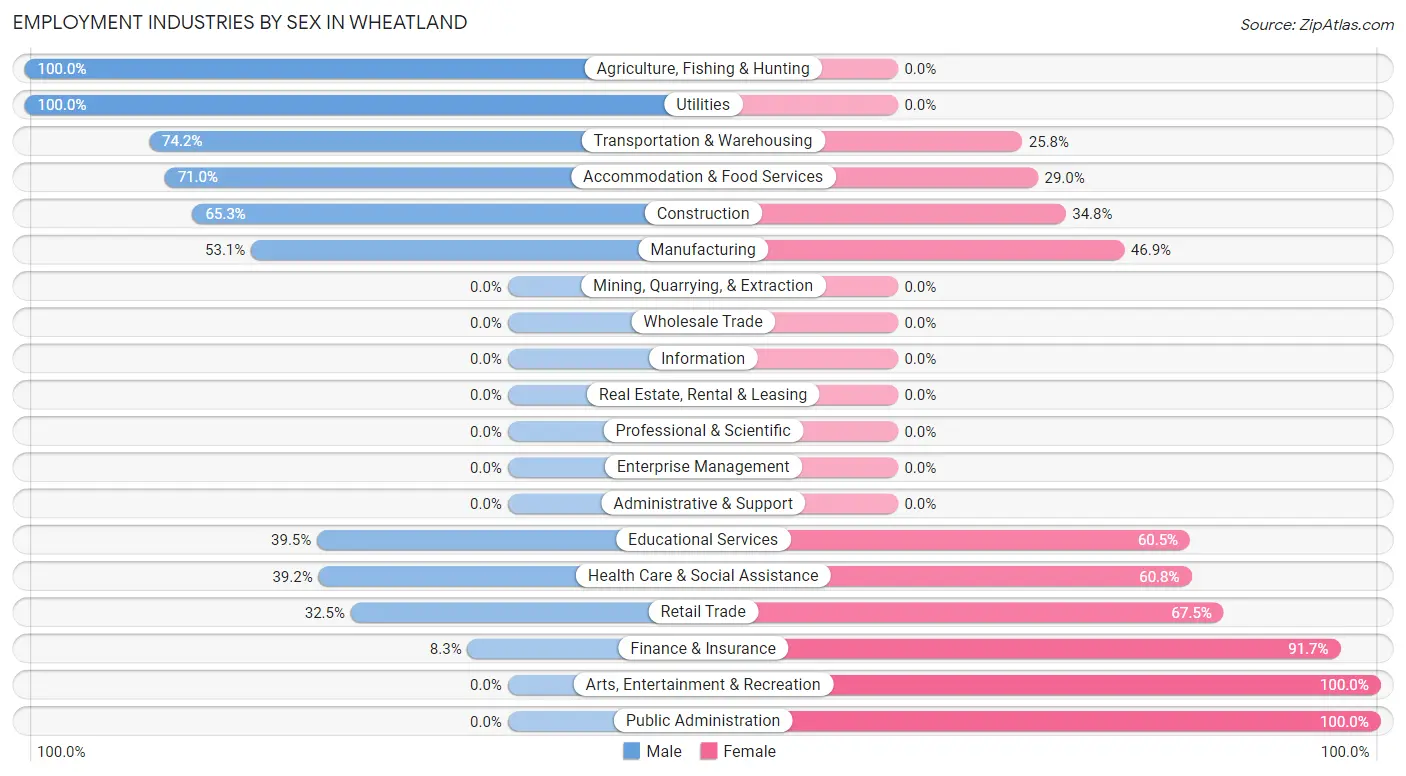
| Industry | Male | Female |
| Agriculture, Fishing & Hunting | 62 (100.0%) | 0 (0.0%) |
| Mining, Quarrying, & Extraction | 0 (0.0%) | 0 (0.0%) |
| Construction | 291 (65.2%) | 155 (34.7%) |
| Manufacturing | 34 (53.1%) | 30 (46.9%) |
| Wholesale Trade | 0 (0.0%) | 0 (0.0%) |
| Retail Trade | 38 (32.5%) | 79 (67.5%) |
| Transportation & Warehousing | 49 (74.2%) | 17 (25.8%) |
| Utilities | 58 (100.0%) | 0 (0.0%) |
| Information | 0 (0.0%) | 0 (0.0%) |
| Finance & Insurance | 12 (8.3%) | 132 (91.7%) |
| Real Estate, Rental & Leasing | 0 (0.0%) | 0 (0.0%) |
| Professional & Scientific | 0 (0.0%) | 0 (0.0%) |
| Enterprise Management | 0 (0.0%) | 0 (0.0%) |
| Administrative & Support | 0 (0.0%) | 0 (0.0%) |
| Educational Services | 58 (39.5%) | 89 (60.5%) |
| Health Care & Social Assistance | 47 (39.2%) | 73 (60.8%) |
| Arts, Entertainment & Recreation | 0 (0.0%) | 14 (100.0%) |
| Accommodation & Food Services | 208 (71.0%) | 85 (29.0%) |
| Public Administration | 0 (0.0%) | 10 (100.0%) |
| Total | 882 (56.3%) | 684 (43.7%) |
Education in Wheatland
School Enrollment in Wheatland
The most common levels of schooling among the 617 students in Wheatland are high school (262 | 42.5%), elementary school (106 | 17.2%), and middle school (103 | 16.7%).
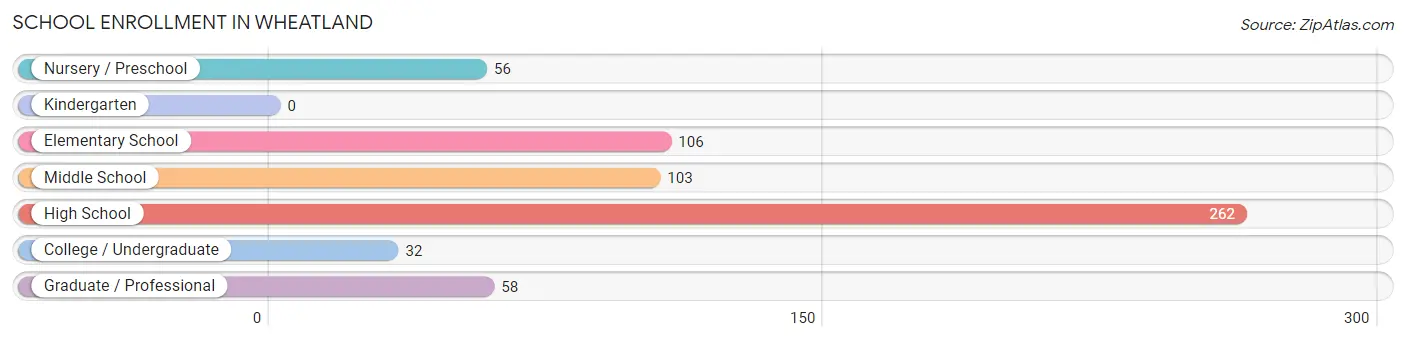
| School Level | # Students | % Students |
| Nursery / Preschool | 56 | 9.1% |
| Kindergarten | 0 | 0.0% |
| Elementary School | 106 | 17.2% |
| Middle School | 103 | 16.7% |
| High School | 262 | 42.5% |
| College / Undergraduate | 32 | 5.2% |
| Graduate / Professional | 58 | 9.4% |
| Total | 617 | 100.0% |
School Enrollment by Age by Funding Source in Wheatland
Out of a total of 617 students who are enrolled in schools in Wheatland, 13 (2.1%) attend a private institution, while the remaining 604 (97.9%) are enrolled in public schools. The age group of 20 to 24 year olds has the highest likelihood of being enrolled in private schools, with 13 (18.3% in the age bracket) enrolled. Conversely, the age group of 3 to 4 year olds has the lowest likelihood of being enrolled in a private school, with 56 (100.0% in the age bracket) attending a public institution.
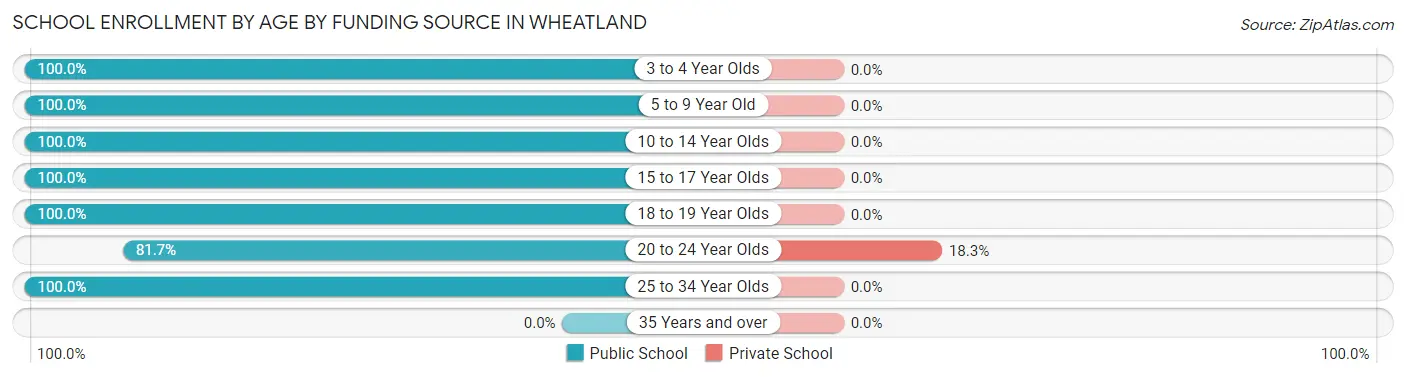
| Age Bracket | Public School | Private School |
| 3 to 4 Year Olds | 56 (100.0%) | 0 (0.0%) |
| 5 to 9 Year Old | 106 (100.0%) | 0 (0.0%) |
| 10 to 14 Year Olds | 103 (100.0%) | 0 (0.0%) |
| 15 to 17 Year Olds | 248 (100.0%) | 0 (0.0%) |
| 18 to 19 Year Olds | 14 (100.0%) | 0 (0.0%) |
| 20 to 24 Year Olds | 58 (81.7%) | 13 (18.3%) |
| 25 to 34 Year Olds | 19 (100.0%) | 0 (0.0%) |
| 35 Years and over | 0 (0.0%) | 0 (0.0%) |
| Total | 604 (97.9%) | 13 (2.1%) |
Educational Attainment by Field of Study in Wheatland
Education (184 | 28.8%), business (99 | 15.5%), science & technology (88 | 13.8%), bio, nature & agricultural (78 | 12.2%), and arts & humanities (69 | 10.8%) are the most common fields of study among 638 individuals in Wheatland who have obtained a bachelor's degree or higher.
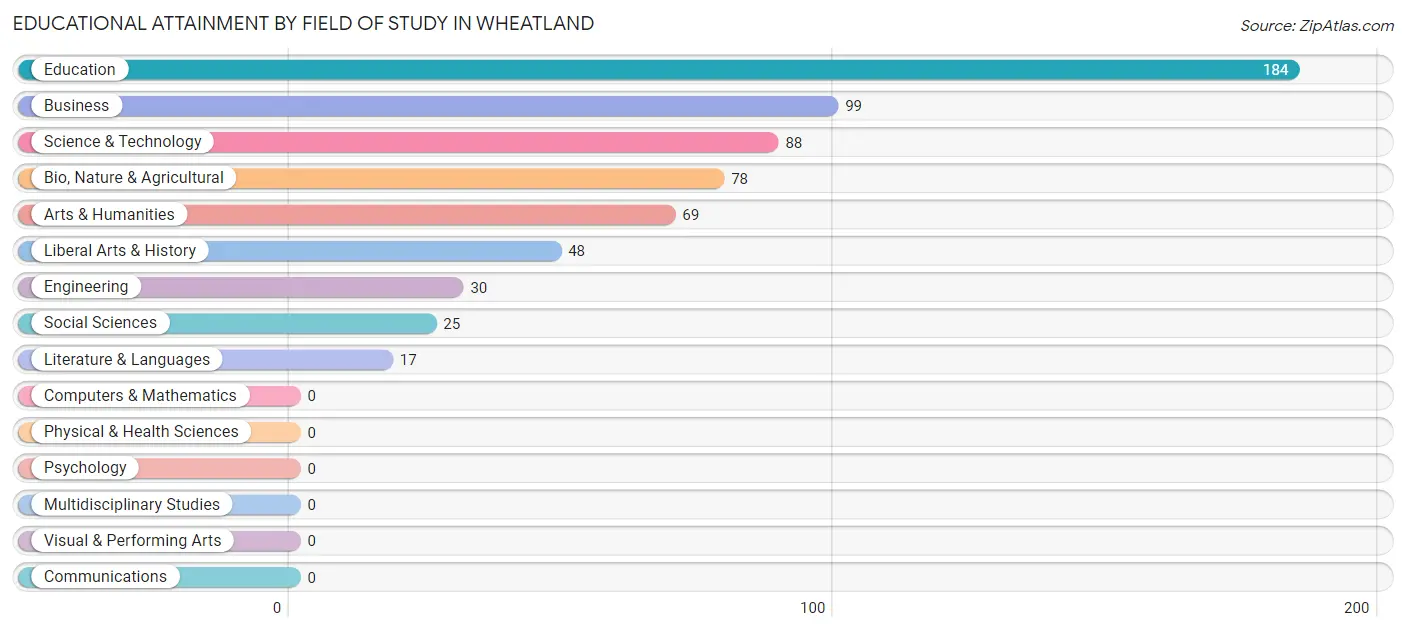
| Field of Study | # Graduates | % Graduates |
| Computers & Mathematics | 0 | 0.0% |
| Bio, Nature & Agricultural | 78 | 12.2% |
| Physical & Health Sciences | 0 | 0.0% |
| Psychology | 0 | 0.0% |
| Social Sciences | 25 | 3.9% |
| Engineering | 30 | 4.7% |
| Multidisciplinary Studies | 0 | 0.0% |
| Science & Technology | 88 | 13.8% |
| Business | 99 | 15.5% |
| Education | 184 | 28.8% |
| Literature & Languages | 17 | 2.7% |
| Liberal Arts & History | 48 | 7.5% |
| Visual & Performing Arts | 0 | 0.0% |
| Communications | 0 | 0.0% |
| Arts & Humanities | 69 | 10.8% |
| Total | 638 | 100.0% |
Transportation & Commute in Wheatland
Vehicle Availability by Sex in Wheatland
The most prevalent vehicle ownership categories in Wheatland are males with 2 vehicles (345, accounting for 40.2%) and females with 2 vehicles (311, making up 50.4%).
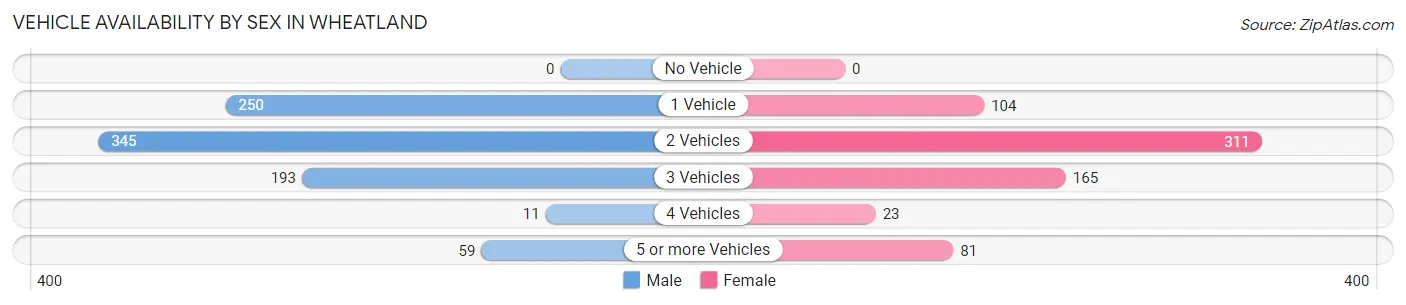
| Vehicles Available | Male | Female |
| No Vehicle | 0 (0.0%) | 0 (0.0%) |
| 1 Vehicle | 250 (29.1%) | 104 (15.2%) |
| 2 Vehicles | 345 (40.2%) | 311 (45.5%) |
| 3 Vehicles | 193 (22.5%) | 165 (24.1%) |
| 4 Vehicles | 11 (1.3%) | 23 (3.4%) |
| 5 or more Vehicles | 59 (6.9%) | 81 (11.8%) |
| Total | 858 (100.0%) | 684 (100.0%) |
Commute Time in Wheatland
The most frequently occuring commute durations in Wheatland are less than 5 minutes (648 commuters, 42.0%), 5 to 9 minutes (427 commuters, 27.7%), and 30 to 34 minutes (141 commuters, 9.1%).
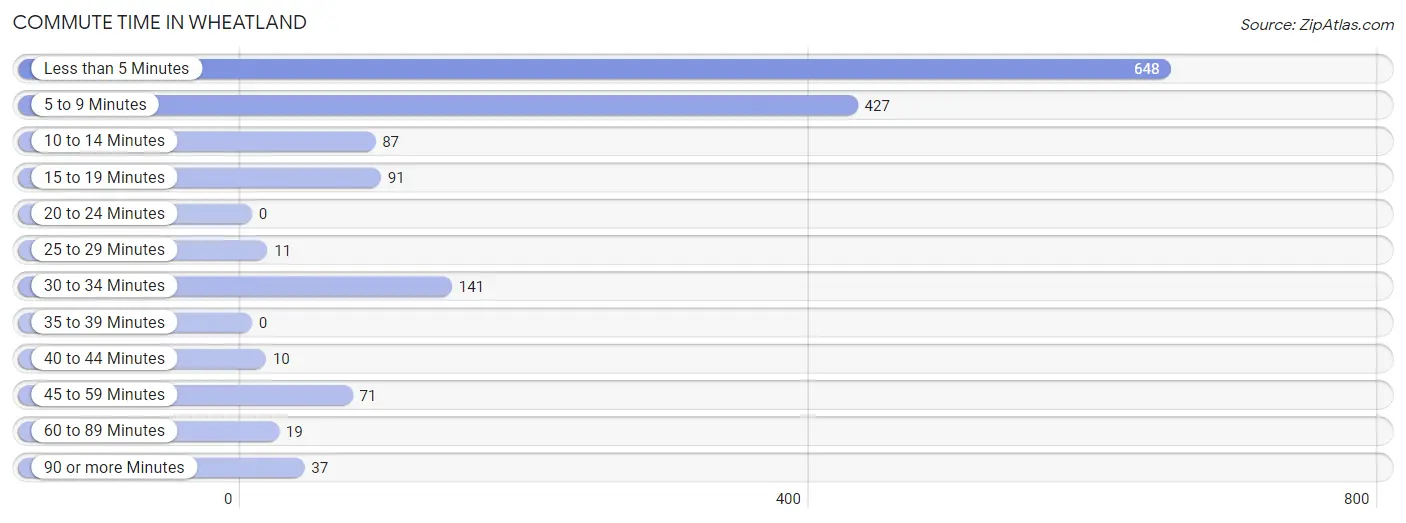
| Commute Time | # Commuters | % Commuters |
| Less than 5 Minutes | 648 | 42.0% |
| 5 to 9 Minutes | 427 | 27.7% |
| 10 to 14 Minutes | 87 | 5.6% |
| 15 to 19 Minutes | 91 | 5.9% |
| 20 to 24 Minutes | 0 | 0.0% |
| 25 to 29 Minutes | 11 | 0.7% |
| 30 to 34 Minutes | 141 | 9.1% |
| 35 to 39 Minutes | 0 | 0.0% |
| 40 to 44 Minutes | 10 | 0.6% |
| 45 to 59 Minutes | 71 | 4.6% |
| 60 to 89 Minutes | 19 | 1.2% |
| 90 or more Minutes | 37 | 2.4% |
Commute Time by Sex in Wheatland
The most common commute times in Wheatland are less than 5 minutes (312 commuters, 36.4%) for males and less than 5 minutes (336 commuters, 49.1%) for females.
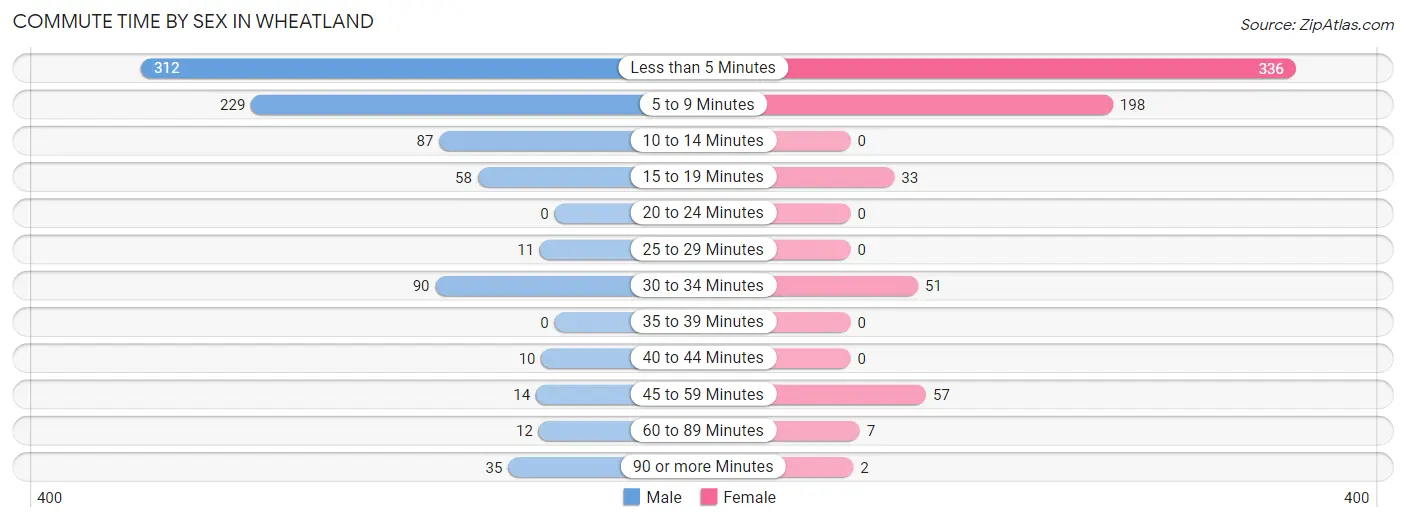
| Commute Time | Male | Female |
| Less than 5 Minutes | 312 (36.4%) | 336 (49.1%) |
| 5 to 9 Minutes | 229 (26.7%) | 198 (28.9%) |
| 10 to 14 Minutes | 87 (10.1%) | 0 (0.0%) |
| 15 to 19 Minutes | 58 (6.8%) | 33 (4.8%) |
| 20 to 24 Minutes | 0 (0.0%) | 0 (0.0%) |
| 25 to 29 Minutes | 11 (1.3%) | 0 (0.0%) |
| 30 to 34 Minutes | 90 (10.5%) | 51 (7.5%) |
| 35 to 39 Minutes | 0 (0.0%) | 0 (0.0%) |
| 40 to 44 Minutes | 10 (1.2%) | 0 (0.0%) |
| 45 to 59 Minutes | 14 (1.6%) | 57 (8.3%) |
| 60 to 89 Minutes | 12 (1.4%) | 7 (1.0%) |
| 90 or more Minutes | 35 (4.1%) | 2 (0.3%) |
Time of Departure to Work by Sex in Wheatland
The most frequent times of departure to work in Wheatland are 6:00 AM to 6:29 AM (202, 23.5%) for males and 6:00 AM to 6:29 AM (204, 29.8%) for females.
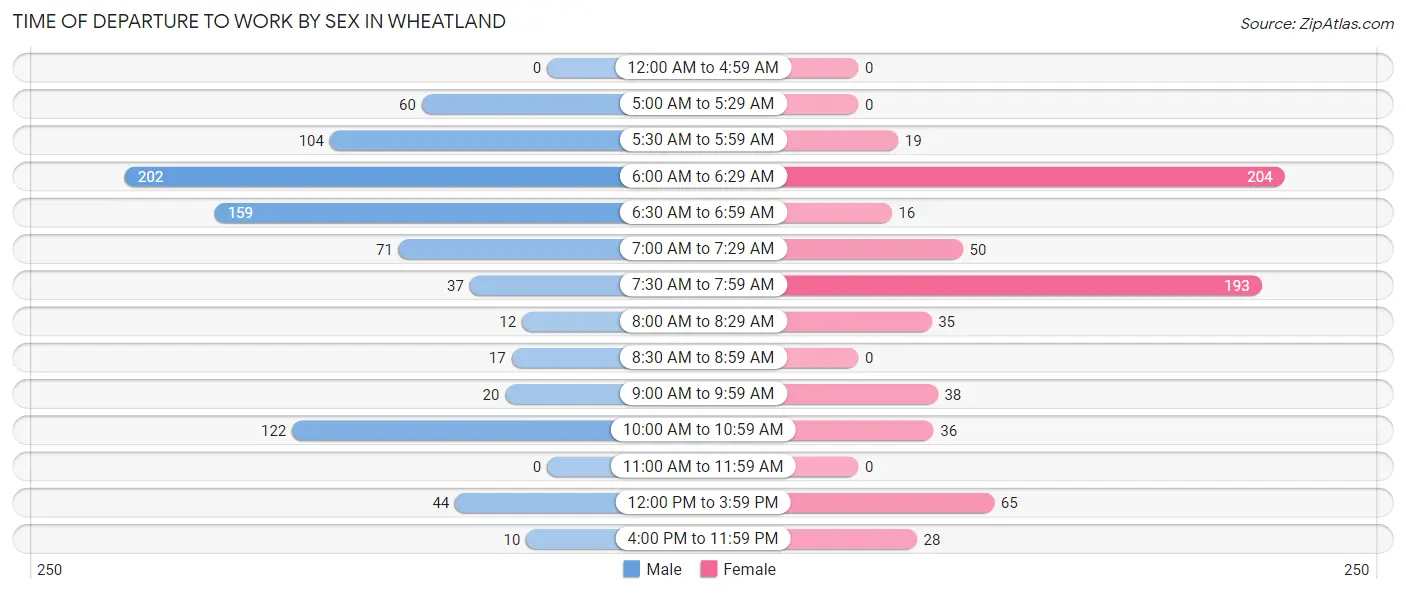
| Time of Departure | Male | Female |
| 12:00 AM to 4:59 AM | 0 (0.0%) | 0 (0.0%) |
| 5:00 AM to 5:29 AM | 60 (7.0%) | 0 (0.0%) |
| 5:30 AM to 5:59 AM | 104 (12.1%) | 19 (2.8%) |
| 6:00 AM to 6:29 AM | 202 (23.5%) | 204 (29.8%) |
| 6:30 AM to 6:59 AM | 159 (18.5%) | 16 (2.3%) |
| 7:00 AM to 7:29 AM | 71 (8.3%) | 50 (7.3%) |
| 7:30 AM to 7:59 AM | 37 (4.3%) | 193 (28.2%) |
| 8:00 AM to 8:29 AM | 12 (1.4%) | 35 (5.1%) |
| 8:30 AM to 8:59 AM | 17 (2.0%) | 0 (0.0%) |
| 9:00 AM to 9:59 AM | 20 (2.3%) | 38 (5.6%) |
| 10:00 AM to 10:59 AM | 122 (14.2%) | 36 (5.3%) |
| 11:00 AM to 11:59 AM | 0 (0.0%) | 0 (0.0%) |
| 12:00 PM to 3:59 PM | 44 (5.1%) | 65 (9.5%) |
| 4:00 PM to 11:59 PM | 10 (1.2%) | 28 (4.1%) |
| Total | 858 (100.0%) | 684 (100.0%) |
Housing Occupancy in Wheatland
Occupancy by Ownership in Wheatland
Of the total 1,704 dwellings in Wheatland, owner-occupied units account for 1,113 (65.3%), while renter-occupied units make up 591 (34.7%).
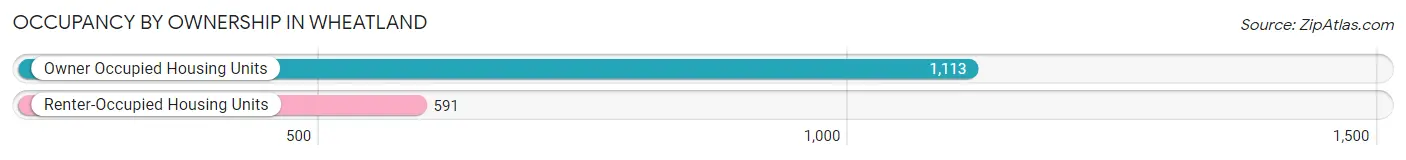
| Occupancy | # Housing Units | % Housing Units |
| Owner Occupied Housing Units | 1,113 | 65.3% |
| Renter-Occupied Housing Units | 591 | 34.7% |
| Total Occupied Housing Units | 1,704 | 100.0% |
Occupancy by Household Size in Wheatland
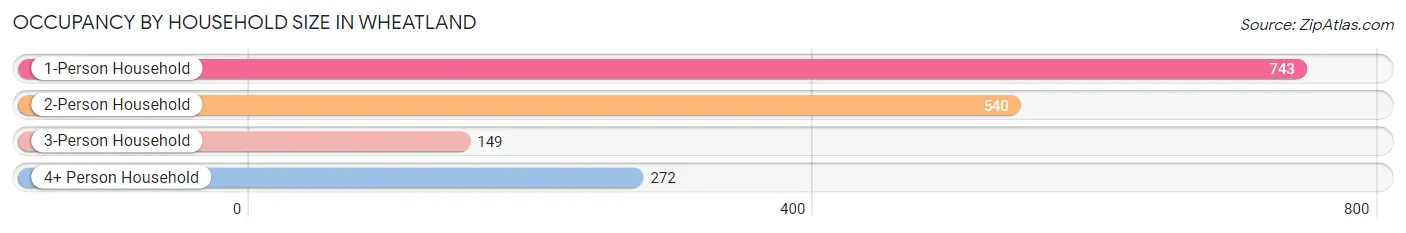
| Household Size | # Housing Units | % Housing Units |
| 1-Person Household | 743 | 43.6% |
| 2-Person Household | 540 | 31.7% |
| 3-Person Household | 149 | 8.7% |
| 4+ Person Household | 272 | 16.0% |
| Total Housing Units | 1,704 | 100.0% |
Occupancy by Ownership by Household Size in Wheatland
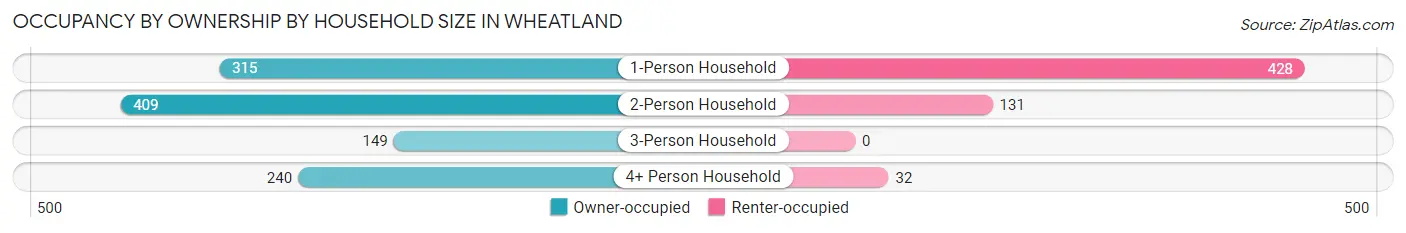
| Household Size | Owner-occupied | Renter-occupied |
| 1-Person Household | 315 (42.4%) | 428 (57.6%) |
| 2-Person Household | 409 (75.7%) | 131 (24.3%) |
| 3-Person Household | 149 (100.0%) | 0 (0.0%) |
| 4+ Person Household | 240 (88.2%) | 32 (11.8%) |
| Total Housing Units | 1,113 (65.3%) | 591 (34.7%) |
Occupancy by Educational Attainment in Wheatland
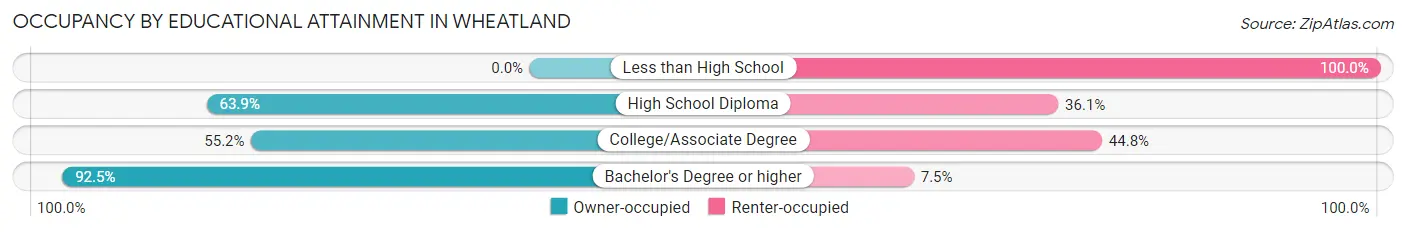
| Household Size | Owner-occupied | Renter-occupied |
| Less than High School | 0 (0.0%) | 22 (100.0%) |
| High School Diploma | 434 (63.9%) | 245 (36.1%) |
| College/Associate Degree | 369 (55.2%) | 299 (44.8%) |
| Bachelor's Degree or higher | 310 (92.5%) | 25 (7.5%) |
Occupancy by Age of Householder in Wheatland
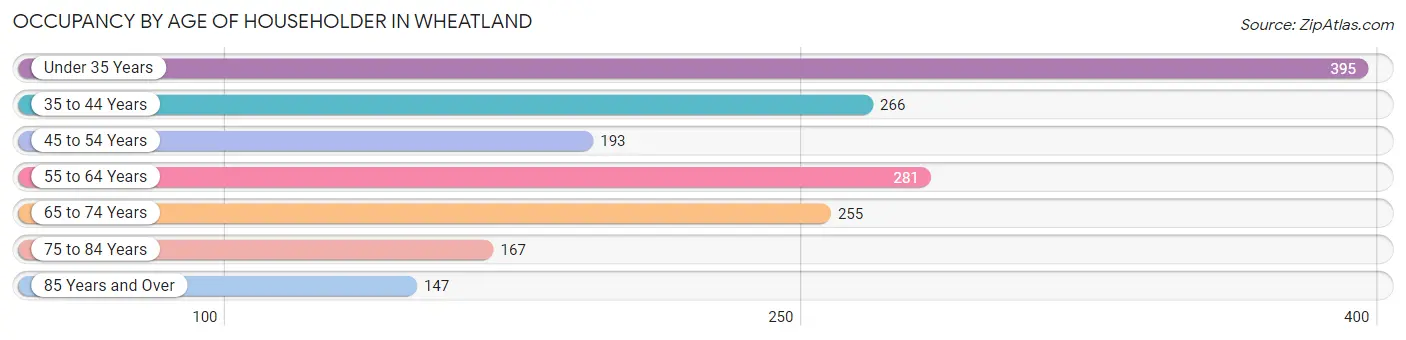
| Age Bracket | # Households | % Households |
| Under 35 Years | 395 | 23.2% |
| 35 to 44 Years | 266 | 15.6% |
| 45 to 54 Years | 193 | 11.3% |
| 55 to 64 Years | 281 | 16.5% |
| 65 to 74 Years | 255 | 15.0% |
| 75 to 84 Years | 167 | 9.8% |
| 85 Years and Over | 147 | 8.6% |
| Total | 1,704 | 100.0% |
Housing Finances in Wheatland
Median Income by Occupancy in Wheatland
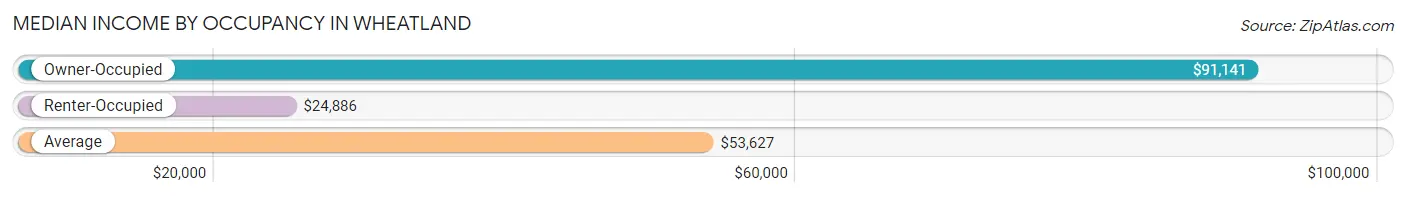
| Occupancy Type | # Households | Median Income |
| Owner-Occupied | 1,113 (65.3%) | $91,141 |
| Renter-Occupied | 591 (34.7%) | $24,886 |
| Average | 1,704 (100.0%) | $53,627 |
Occupancy by Householder Income Bracket in Wheatland
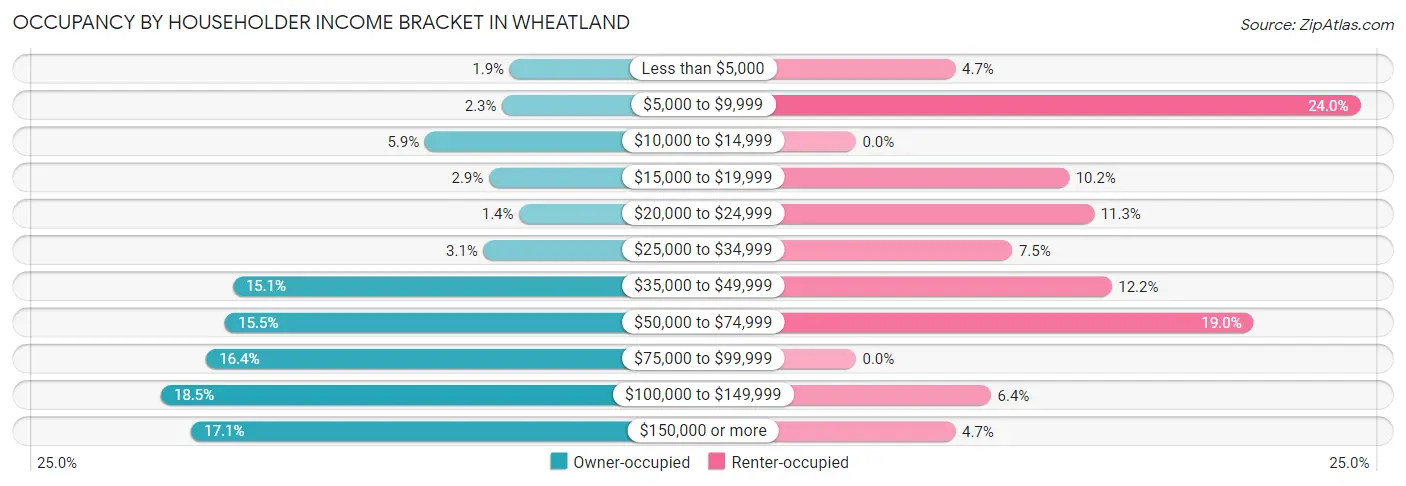
| Income Bracket | Owner-occupied | Renter-occupied |
| Less than $5,000 | 21 (1.9%) | 28 (4.7%) |
| $5,000 to $9,999 | 25 (2.2%) | 142 (24.0%) |
| $10,000 to $14,999 | 66 (5.9%) | 0 (0.0%) |
| $15,000 to $19,999 | 32 (2.9%) | 60 (10.2%) |
| $20,000 to $24,999 | 16 (1.4%) | 67 (11.3%) |
| $25,000 to $34,999 | 35 (3.1%) | 44 (7.4%) |
| $35,000 to $49,999 | 168 (15.1%) | 72 (12.2%) |
| $50,000 to $74,999 | 172 (15.4%) | 112 (19.0%) |
| $75,000 to $99,999 | 182 (16.4%) | 0 (0.0%) |
| $100,000 to $149,999 | 206 (18.5%) | 38 (6.4%) |
| $150,000 or more | 190 (17.1%) | 28 (4.7%) |
| Total | 1,113 (100.0%) | 591 (100.0%) |
Monthly Housing Cost Tiers in Wheatland
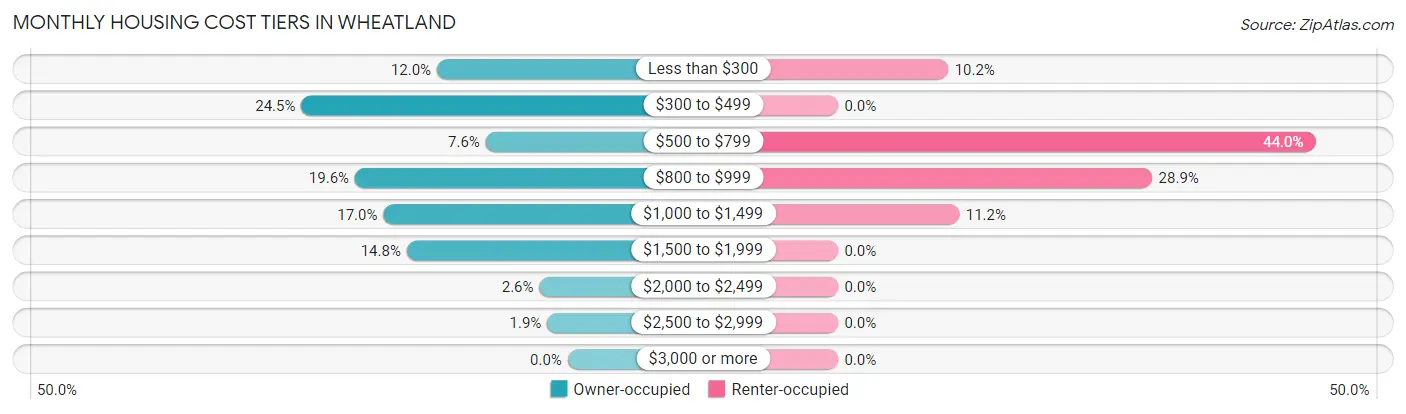
| Monthly Cost | Owner-occupied | Renter-occupied |
| Less than $300 | 134 (12.0%) | 60 (10.2%) |
| $300 to $499 | 273 (24.5%) | 0 (0.0%) |
| $500 to $799 | 84 (7.5%) | 260 (44.0%) |
| $800 to $999 | 218 (19.6%) | 171 (28.9%) |
| $1,000 to $1,499 | 189 (17.0%) | 66 (11.2%) |
| $1,500 to $1,999 | 165 (14.8%) | 0 (0.0%) |
| $2,000 to $2,499 | 29 (2.6%) | 0 (0.0%) |
| $2,500 to $2,999 | 21 (1.9%) | 0 (0.0%) |
| $3,000 or more | 0 (0.0%) | 0 (0.0%) |
| Total | 1,113 (100.0%) | 591 (100.0%) |
Physical Housing Characteristics in Wheatland
Housing Structures in Wheatland
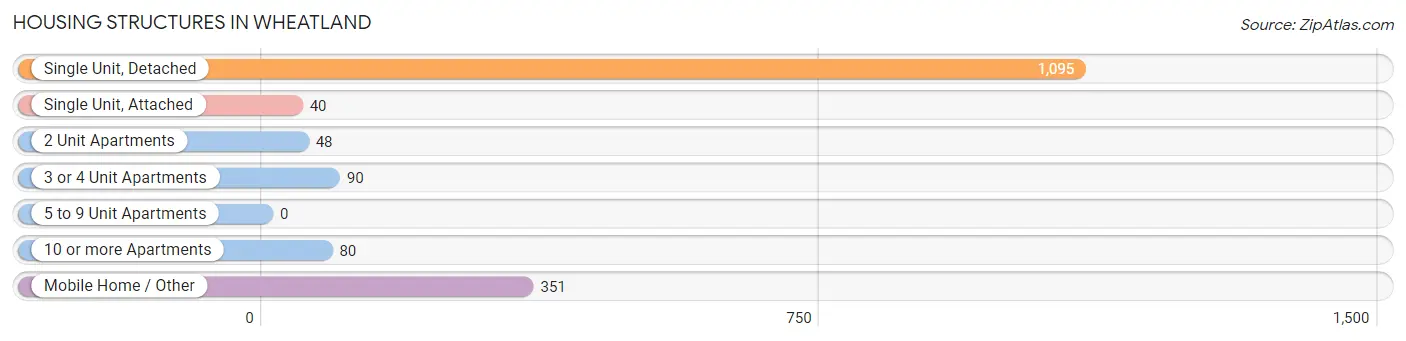
| Structure Type | # Housing Units | % Housing Units |
| Single Unit, Detached | 1,095 | 64.3% |
| Single Unit, Attached | 40 | 2.4% |
| 2 Unit Apartments | 48 | 2.8% |
| 3 or 4 Unit Apartments | 90 | 5.3% |
| 5 to 9 Unit Apartments | 0 | 0.0% |
| 10 or more Apartments | 80 | 4.7% |
| Mobile Home / Other | 351 | 20.6% |
| Total | 1,704 | 100.0% |
Housing Structures by Occupancy in Wheatland
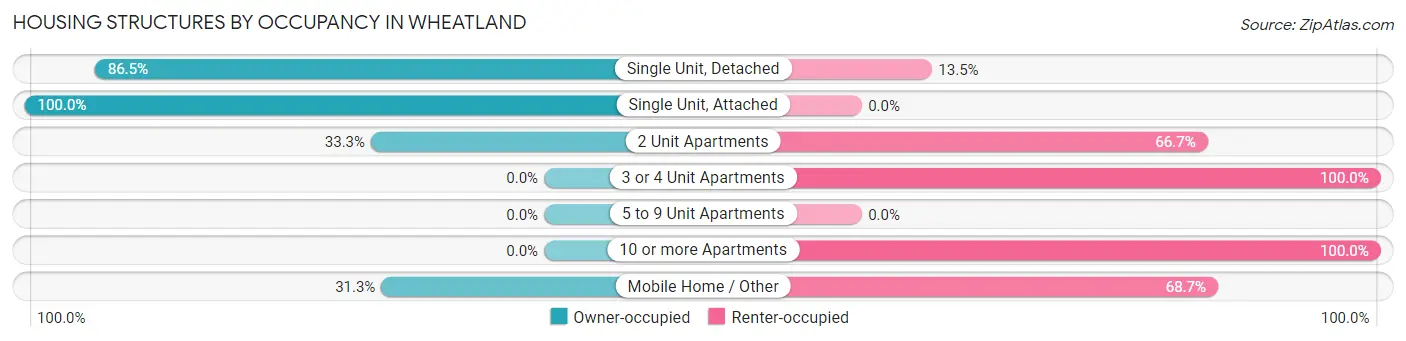
| Structure Type | Owner-occupied | Renter-occupied |
| Single Unit, Detached | 947 (86.5%) | 148 (13.5%) |
| Single Unit, Attached | 40 (100.0%) | 0 (0.0%) |
| 2 Unit Apartments | 16 (33.3%) | 32 (66.7%) |
| 3 or 4 Unit Apartments | 0 (0.0%) | 90 (100.0%) |
| 5 to 9 Unit Apartments | 0 (0.0%) | 0 (0.0%) |
| 10 or more Apartments | 0 (0.0%) | 80 (100.0%) |
| Mobile Home / Other | 110 (31.3%) | 241 (68.7%) |
| Total | 1,113 (65.3%) | 591 (34.7%) |
Housing Structures by Number of Rooms in Wheatland
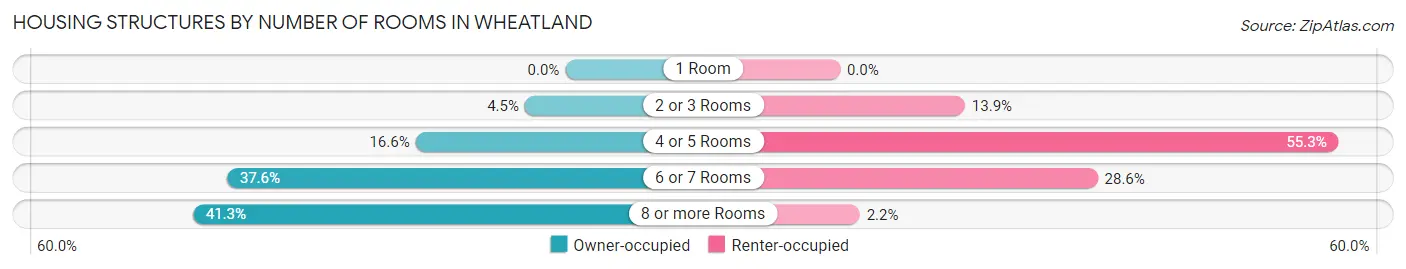
| Number of Rooms | Owner-occupied | Renter-occupied |
| 1 Room | 0 (0.0%) | 0 (0.0%) |
| 2 or 3 Rooms | 50 (4.5%) | 82 (13.9%) |
| 4 or 5 Rooms | 185 (16.6%) | 327 (55.3%) |
| 6 or 7 Rooms | 418 (37.6%) | 169 (28.6%) |
| 8 or more Rooms | 460 (41.3%) | 13 (2.2%) |
| Total | 1,113 (100.0%) | 591 (100.0%) |
Housing Structure by Heating Type in Wheatland
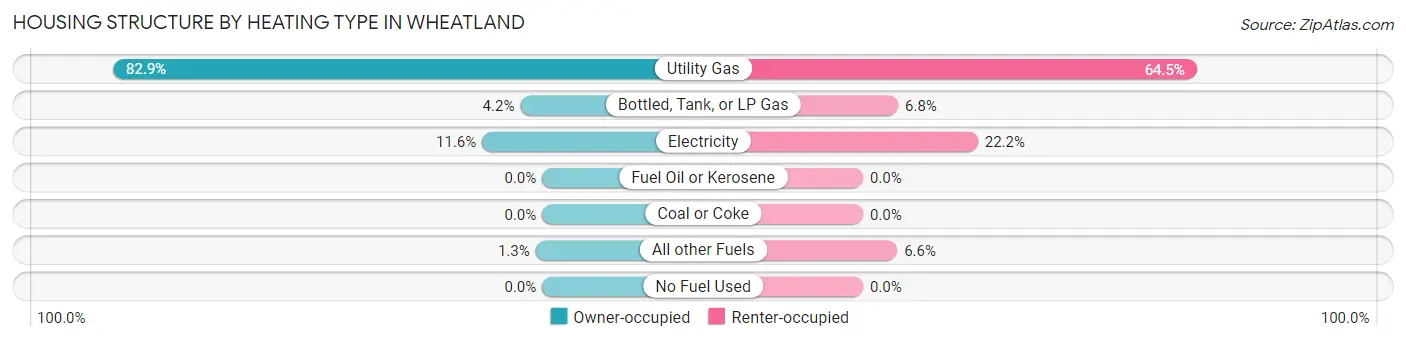
| Heating Type | Owner-occupied | Renter-occupied |
| Utility Gas | 923 (82.9%) | 381 (64.5%) |
| Bottled, Tank, or LP Gas | 47 (4.2%) | 40 (6.8%) |
| Electricity | 129 (11.6%) | 131 (22.2%) |
| Fuel Oil or Kerosene | 0 (0.0%) | 0 (0.0%) |
| Coal or Coke | 0 (0.0%) | 0 (0.0%) |
| All other Fuels | 14 (1.3%) | 39 (6.6%) |
| No Fuel Used | 0 (0.0%) | 0 (0.0%) |
| Total | 1,113 (100.0%) | 591 (100.0%) |
Household Vehicle Usage in Wheatland
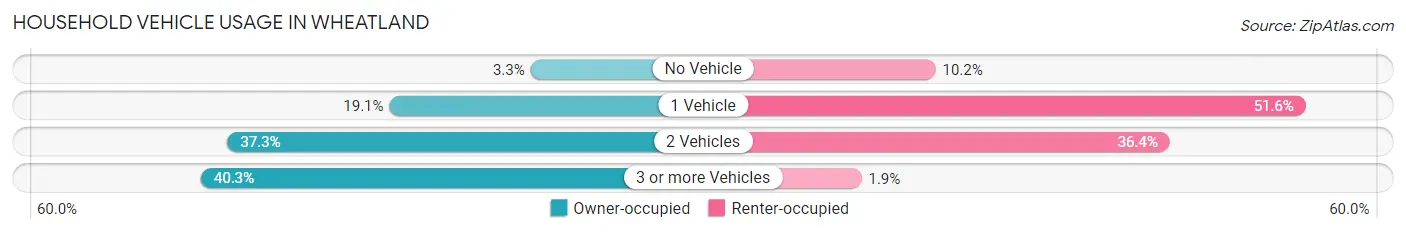
| Vehicles per Household | Owner-occupied | Renter-occupied |
| No Vehicle | 37 (3.3%) | 60 (10.2%) |
| 1 Vehicle | 213 (19.1%) | 305 (51.6%) |
| 2 Vehicles | 415 (37.3%) | 215 (36.4%) |
| 3 or more Vehicles | 448 (40.3%) | 11 (1.9%) |
| Total | 1,113 (100.0%) | 591 (100.0%) |
Real Estate & Mortgages in Wheatland
Real Estate and Mortgage Overview in Wheatland
| Characteristic | Without Mortgage | With Mortgage |
| Housing Units | 611 | 502 |
| Median Property Value | $217,800 | $227,500 |
| Median Household Income | $47,750 | $115 |
| Monthly Housing Costs | $452 | $0 |
| Real Estate Taxes | $1,385 | $0 |
Property Value by Mortgage Status in Wheatland
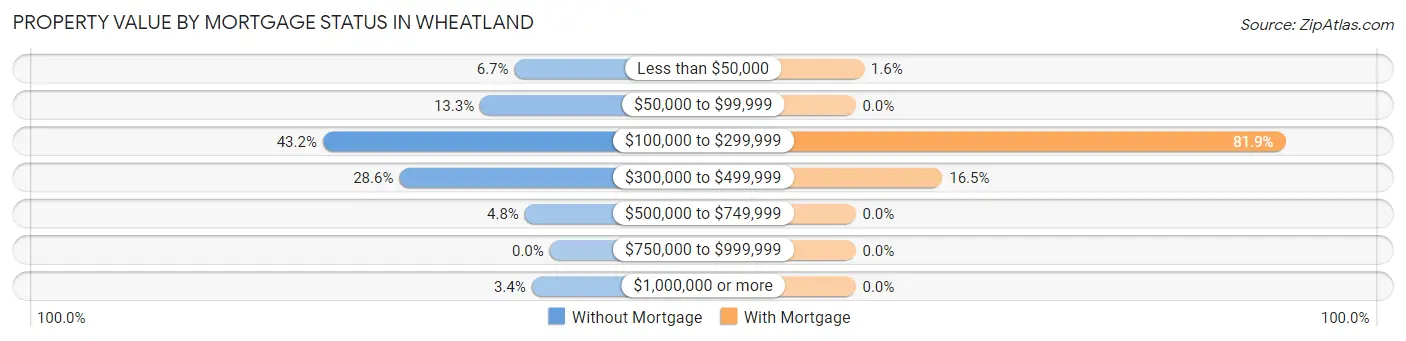
| Property Value | Without Mortgage | With Mortgage |
| Less than $50,000 | 41 (6.7%) | 8 (1.6%) |
| $50,000 to $99,999 | 81 (13.3%) | 0 (0.0%) |
| $100,000 to $299,999 | 264 (43.2%) | 411 (81.9%) |
| $300,000 to $499,999 | 175 (28.6%) | 83 (16.5%) |
| $500,000 to $749,999 | 29 (4.8%) | 0 (0.0%) |
| $750,000 to $999,999 | 0 (0.0%) | 0 (0.0%) |
| $1,000,000 or more | 21 (3.4%) | 0 (0.0%) |
| Total | 611 (100.0%) | 502 (100.0%) |
Household Income by Mortgage Status in Wheatland
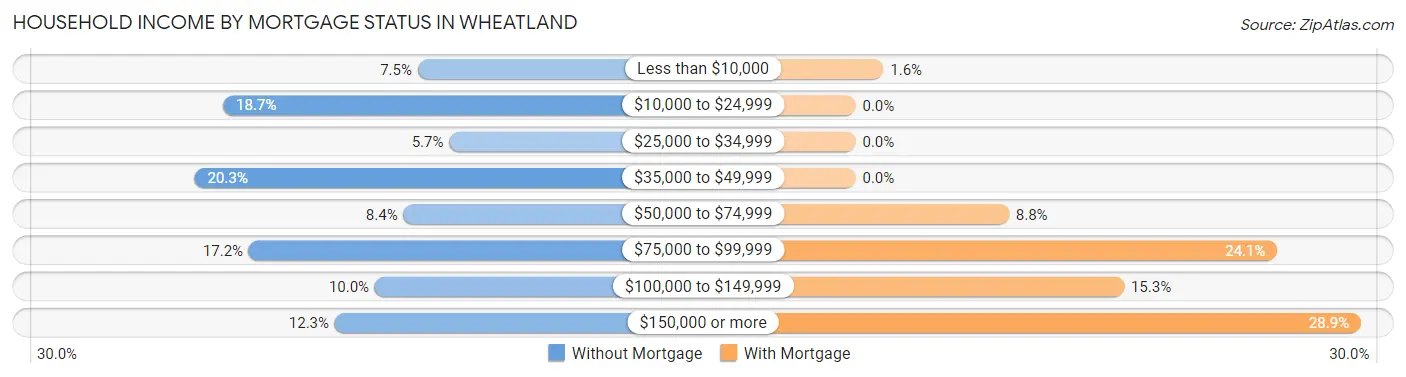
| Household Income | Without Mortgage | With Mortgage |
| Less than $10,000 | 46 (7.5%) | 8 (1.6%) |
| $10,000 to $24,999 | 114 (18.7%) | 0 (0.0%) |
| $25,000 to $34,999 | 35 (5.7%) | 0 (0.0%) |
| $35,000 to $49,999 | 124 (20.3%) | 0 (0.0%) |
| $50,000 to $74,999 | 51 (8.4%) | 44 (8.8%) |
| $75,000 to $99,999 | 105 (17.2%) | 121 (24.1%) |
| $100,000 to $149,999 | 61 (10.0%) | 77 (15.3%) |
| $150,000 or more | 75 (12.3%) | 145 (28.9%) |
| Total | 611 (100.0%) | 502 (100.0%) |
Property Value to Household Income Ratio in Wheatland
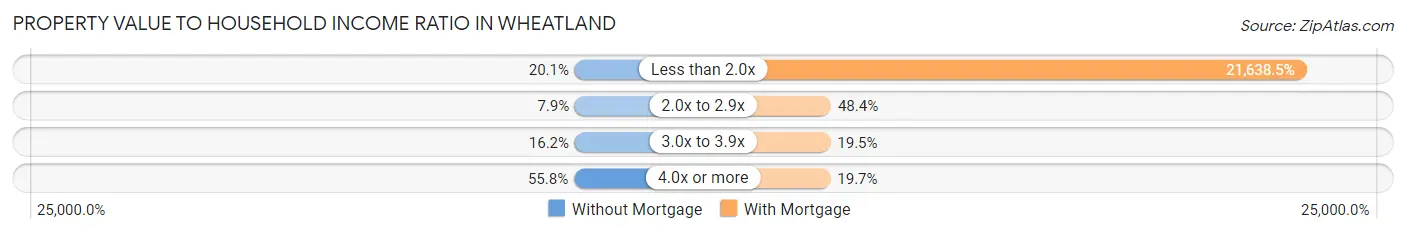
| Value-to-Income Ratio | Without Mortgage | With Mortgage |
| Less than 2.0x | 123 (20.1%) | 108,625 (21,638.5%) |
| 2.0x to 2.9x | 48 (7.9%) | 243 (48.4%) |
| 3.0x to 3.9x | 99 (16.2%) | 98 (19.5%) |
| 4.0x or more | 341 (55.8%) | 99 (19.7%) |
| Total | 611 (100.0%) | 502 (100.0%) |
Real Estate Taxes by Mortgage Status in Wheatland
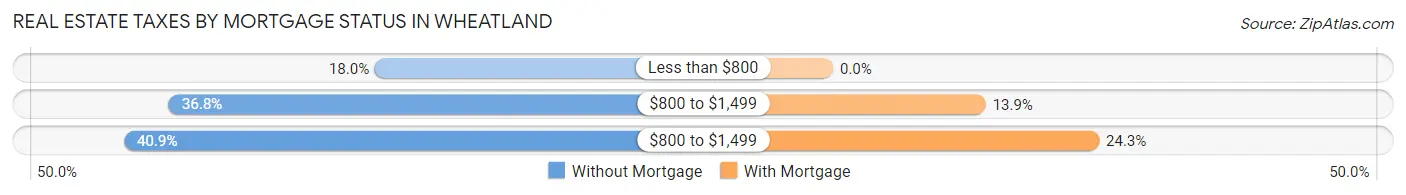
| Property Taxes | Without Mortgage | With Mortgage |
| Less than $800 | 110 (18.0%) | 0 (0.0%) |
| $800 to $1,499 | 225 (36.8%) | 70 (13.9%) |
| $800 to $1,499 | 250 (40.9%) | 122 (24.3%) |
| Total | 611 (100.0%) | 502 (100.0%) |
Health & Disability in Wheatland
Health Insurance Coverage by Age in Wheatland
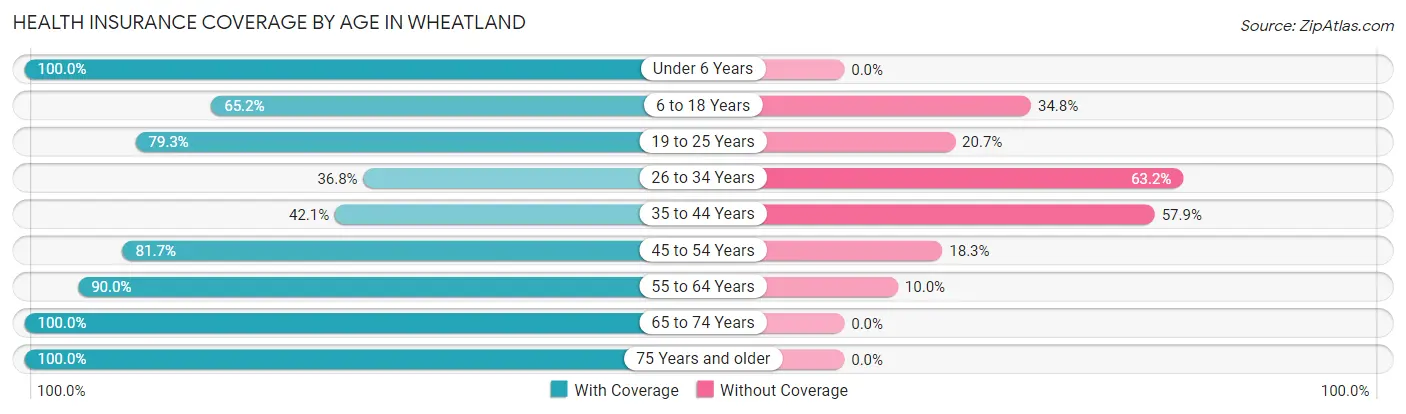
| Age Bracket | With Coverage | Without Coverage |
| Under 6 Years | 136 (100.0%) | 0 (0.0%) |
| 6 to 18 Years | 307 (65.2%) | 164 (34.8%) |
| 19 to 25 Years | 165 (79.3%) | 43 (20.7%) |
| 26 to 34 Years | 173 (36.8%) | 297 (63.2%) |
| 35 to 44 Years | 224 (42.1%) | 308 (57.9%) |
| 45 to 54 Years | 344 (81.7%) | 77 (18.3%) |
| 55 to 64 Years | 423 (90.0%) | 47 (10.0%) |
| 65 to 74 Years | 406 (100.0%) | 0 (0.0%) |
| 75 Years and older | 358 (100.0%) | 0 (0.0%) |
| Total | 2,536 (73.0%) | 936 (27.0%) |
Health Insurance Coverage by Citizenship Status in Wheatland
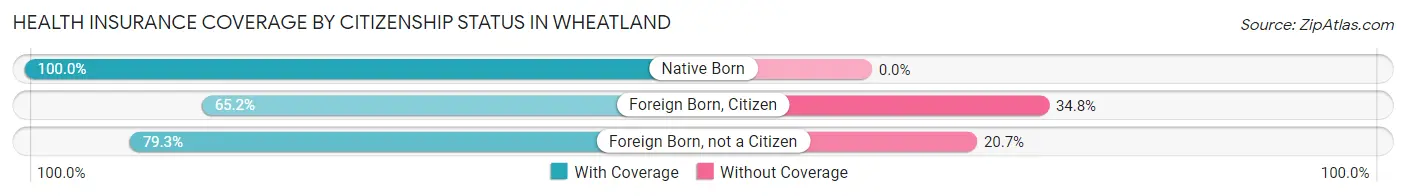
| Citizenship Status | With Coverage | Without Coverage |
| Native Born | 136 (100.0%) | 0 (0.0%) |
| Foreign Born, Citizen | 307 (65.2%) | 164 (34.8%) |
| Foreign Born, not a Citizen | 165 (79.3%) | 43 (20.7%) |
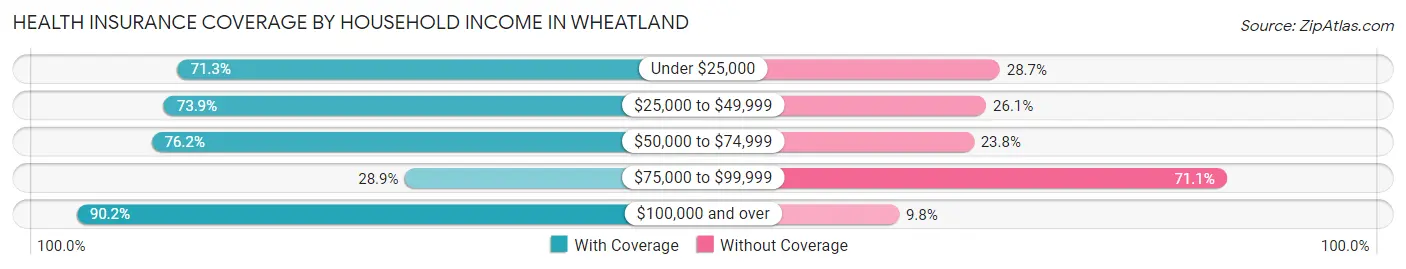
Health Insurance Coverage by Household Income in Wheatland
| Household Income | With Coverage | Without Coverage |
| Under $25,000 | 356 (71.3%) | 143 (28.7%) |
| $25,000 to $49,999 | 385 (73.9%) | 136 (26.1%) |
| $50,000 to $74,999 | 375 (76.2%) | 117 (23.8%) |
| $75,000 to $99,999 | 164 (28.9%) | 404 (71.1%) |
| $100,000 and over | 1,254 (90.2%) | 136 (9.8%) |
Public vs Private Health Insurance Coverage by Age in Wheatland
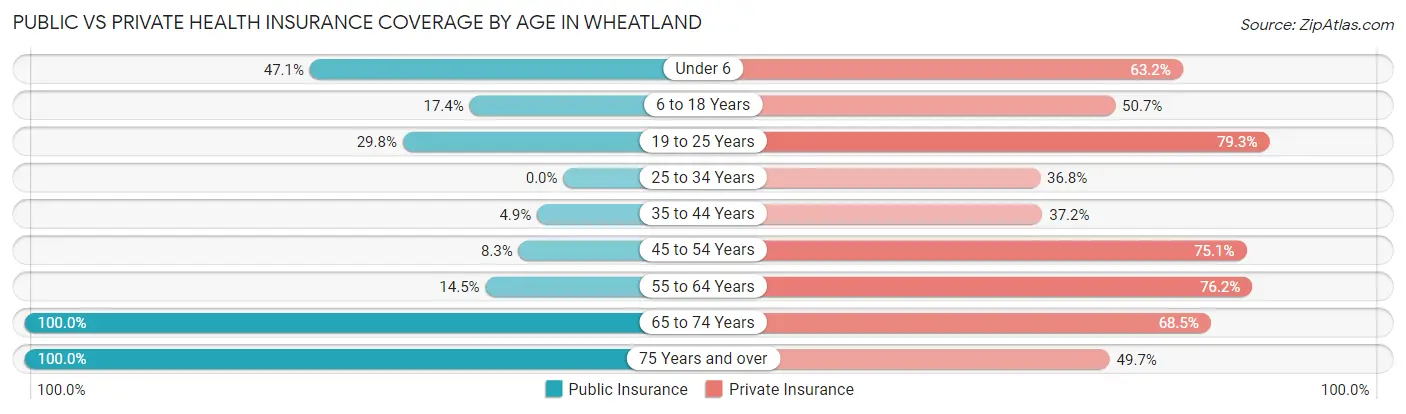
| Age Bracket | Public Insurance | Private Insurance |
| Under 6 | 64 (47.1%) | 86 (63.2%) |
| 6 to 18 Years | 82 (17.4%) | 239 (50.7%) |
| 19 to 25 Years | 62 (29.8%) | 165 (79.3%) |
| 25 to 34 Years | 0 (0.0%) | 173 (36.8%) |
| 35 to 44 Years | 26 (4.9%) | 198 (37.2%) |
| 45 to 54 Years | 35 (8.3%) | 316 (75.1%) |
| 55 to 64 Years | 68 (14.5%) | 358 (76.2%) |
| 65 to 74 Years | 406 (100.0%) | 278 (68.5%) |
| 75 Years and over | 358 (100.0%) | 178 (49.7%) |
| Total | 1,101 (31.7%) | 1,991 (57.3%) |
Disability Status by Sex by Age in Wheatland
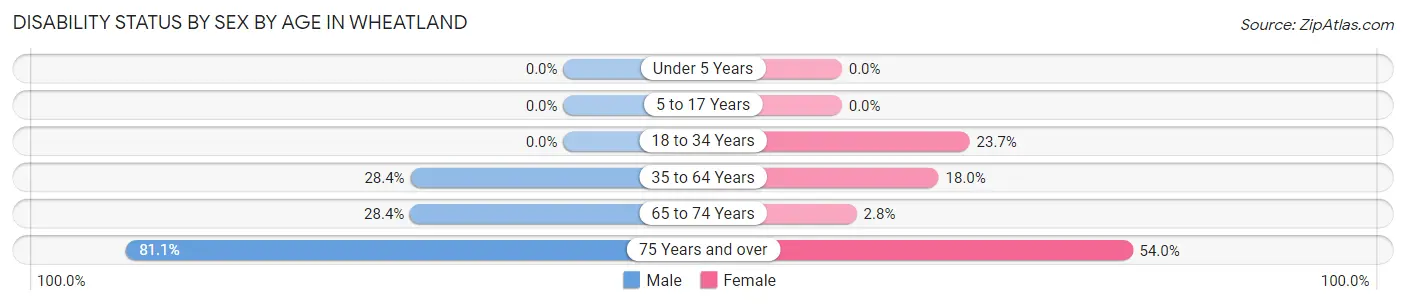
| Age Bracket | Male | Female |
| Under 5 Years | 0 (0.0%) | 0 (0.0%) |
| 5 to 17 Years | 0 (0.0%) | 0 (0.0%) |
| 18 to 34 Years | 0 (0.0%) | 75 (23.7%) |
| 35 to 64 Years | 189 (28.4%) | 136 (18.0%) |
| 65 to 74 Years | 64 (28.4%) | 5 (2.8%) |
| 75 Years and over | 86 (81.1%) | 136 (54.0%) |
Disability Class by Sex by Age in Wheatland
Disability Class: Hearing Difficulty
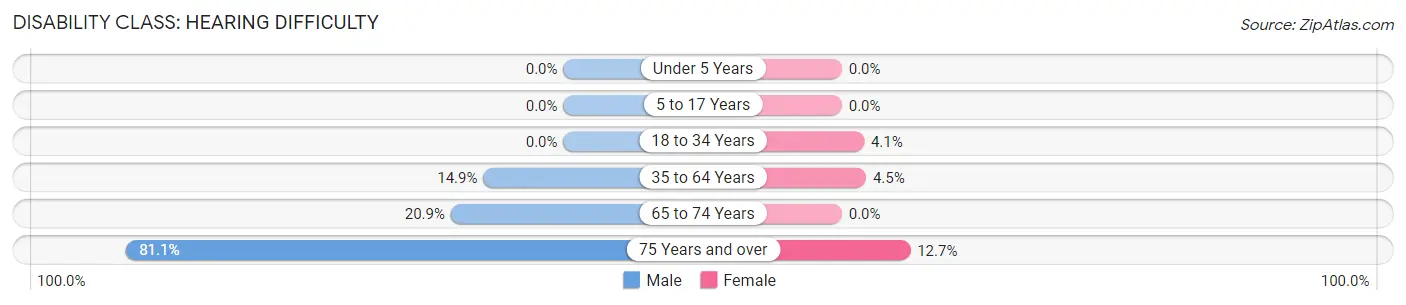
| Age Bracket | Male | Female |
| Under 5 Years | 0 (0.0%) | 0 (0.0%) |
| 5 to 17 Years | 0 (0.0%) | 0 (0.0%) |
| 18 to 34 Years | 0 (0.0%) | 13 (4.1%) |
| 35 to 64 Years | 99 (14.9%) | 34 (4.5%) |
| 65 to 74 Years | 47 (20.9%) | 0 (0.0%) |
| 75 Years and over | 86 (81.1%) | 32 (12.7%) |
Disability Class: Vision Difficulty
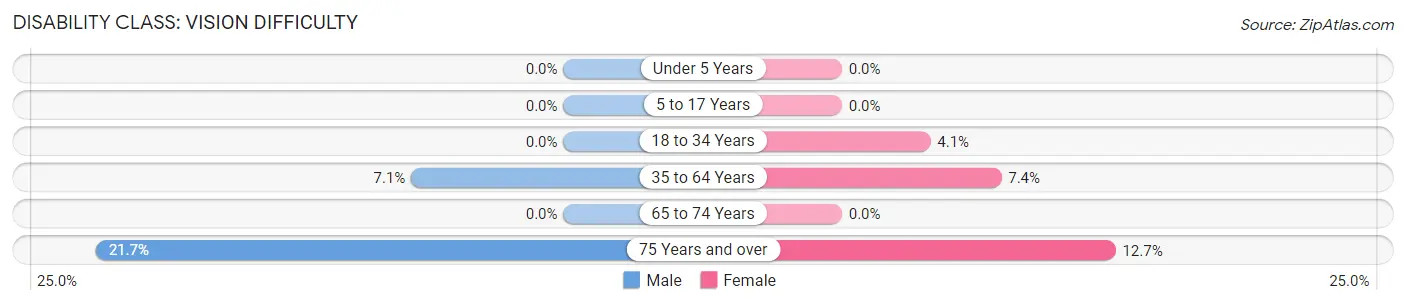
| Age Bracket | Male | Female |
| Under 5 Years | 0 (0.0%) | 0 (0.0%) |
| 5 to 17 Years | 0 (0.0%) | 0 (0.0%) |
| 18 to 34 Years | 0 (0.0%) | 13 (4.1%) |
| 35 to 64 Years | 47 (7.1%) | 56 (7.4%) |
| 65 to 74 Years | 0 (0.0%) | 0 (0.0%) |
| 75 Years and over | 23 (21.7%) | 32 (12.7%) |
Disability Class: Cognitive Difficulty
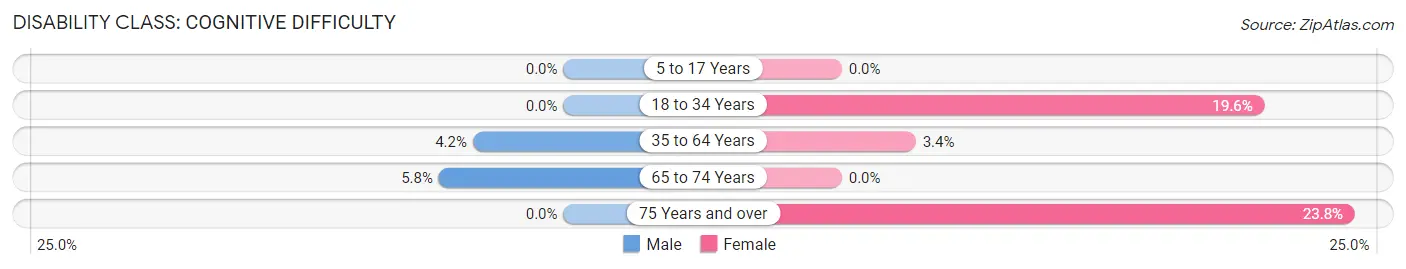
| Age Bracket | Male | Female |
| 5 to 17 Years | 0 (0.0%) | 0 (0.0%) |
| 18 to 34 Years | 0 (0.0%) | 62 (19.6%) |
| 35 to 64 Years | 28 (4.2%) | 26 (3.4%) |
| 65 to 74 Years | 13 (5.8%) | 0 (0.0%) |
| 75 Years and over | 0 (0.0%) | 60 (23.8%) |
Disability Class: Ambulatory Difficulty
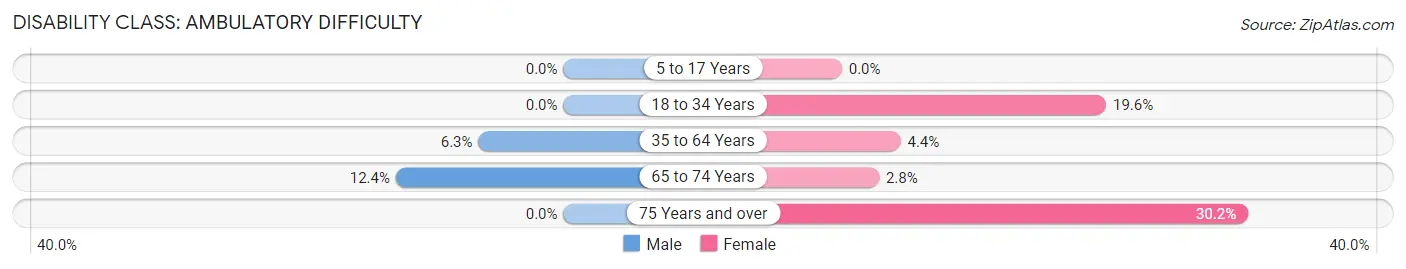
| Age Bracket | Male | Female |
| 5 to 17 Years | 0 (0.0%) | 0 (0.0%) |
| 18 to 34 Years | 0 (0.0%) | 62 (19.6%) |
| 35 to 64 Years | 42 (6.3%) | 33 (4.4%) |
| 65 to 74 Years | 28 (12.4%) | 5 (2.8%) |
| 75 Years and over | 0 (0.0%) | 76 (30.2%) |
Disability Class: Self-Care Difficulty
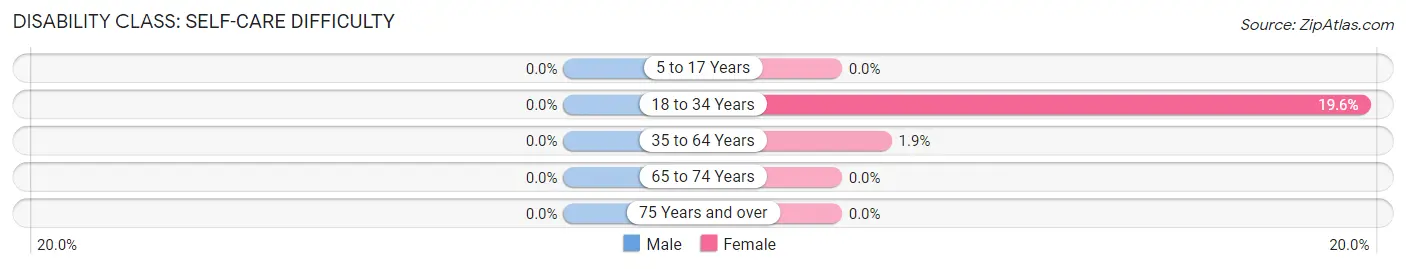
| Age Bracket | Male | Female |
| 5 to 17 Years | 0 (0.0%) | 0 (0.0%) |
| 18 to 34 Years | 0 (0.0%) | 62 (19.6%) |
| 35 to 64 Years | 0 (0.0%) | 14 (1.8%) |
| 65 to 74 Years | 0 (0.0%) | 0 (0.0%) |
| 75 Years and over | 0 (0.0%) | 0 (0.0%) |
Technology Access in Wheatland
Computing Device Access in Wheatland
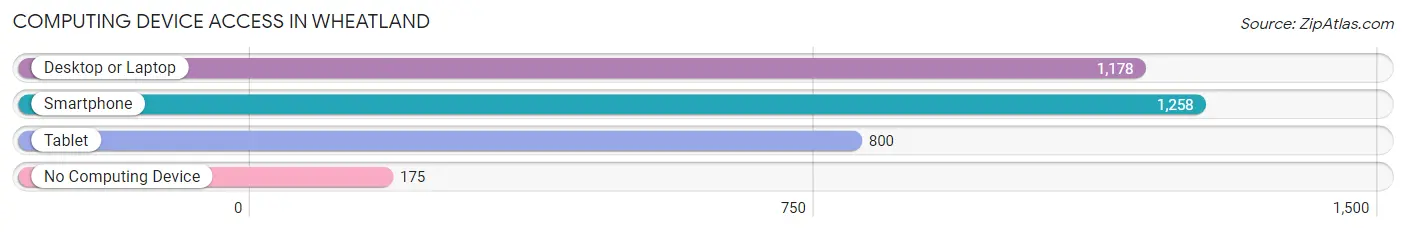
| Device Type | # Households | % Households |
| Desktop or Laptop | 1,178 | 69.1% |
| Smartphone | 1,258 | 73.8% |
| Tablet | 800 | 46.9% |
| No Computing Device | 175 | 10.3% |
| Total | 1,704 | 100.0% |
Internet Access in Wheatland
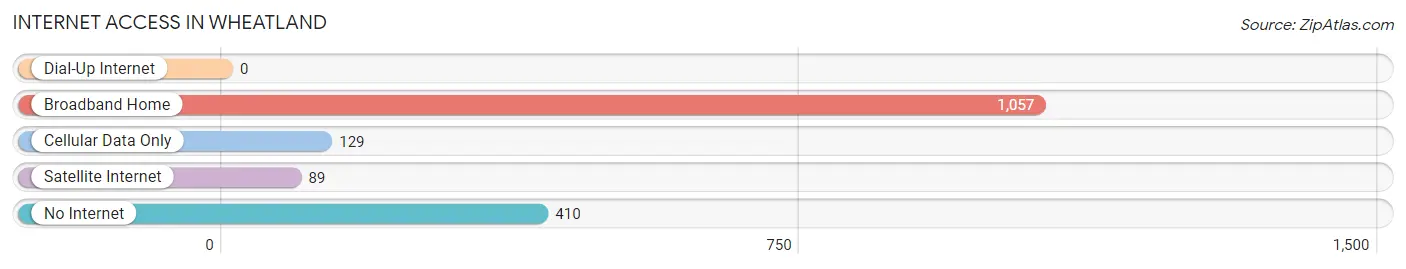
| Internet Type | # Households | % Households |
| Dial-Up Internet | 0 | 0.0% |
| Broadband Home | 1,057 | 62.0% |
| Cellular Data Only | 129 | 7.6% |
| Satellite Internet | 89 | 5.2% |
| No Internet | 410 | 24.1% |
| Total | 1,704 | 100.0% |
Wheatland Summary
Wheatland, Wyoming is a small town located in Platte County in the southeastern corner of the state. It is the county seat and the largest town in the county. The town was founded in 1868 and was named after the abundant wheat fields in the area. The population of Wheatland was 2,619 at the 2010 census.
Geography
Wheatland is located at the intersection of Interstate 25 and US Route 85. It is situated in the Laramie Plains, a region of rolling hills and grasslands. The town is located at an elevation of 4,890 feet (1,490 m). The Laramie River flows through the town and is a major source of irrigation for the surrounding area.
The climate in Wheatland is semi-arid, with hot summers and cold winters. The average annual precipitation is 13.5 inches (343 mm). The average high temperature in July is 87°F (31°C) and the average low temperature in January is 11°F (-12°C).
Economy
Wheatland’s economy is largely based on agriculture and ranching. The town is home to several large farms and ranches, as well as a number of smaller operations. The town is also home to several businesses, including a grocery store, a hardware store, a bank, and a few restaurants.
The town is also home to a number of government offices, including the Platte County Courthouse, the Platte County Sheriff’s Office, and the Platte County Health Department.
Demographics
As of the 2010 census, the population of Wheatland was 2,619. The racial makeup of the town was 95.2% White, 0.3% African American, 0.7% Native American, 0.3% Asian, 0.1% Pacific Islander, 1.2% from other races, and 2.3% from two or more races. Hispanic or Latino of any race were 4.2% of the population.
The median income for a household in Wheatland was $37,917, and the median income for a family was $45,938. The per capita income for the town was $18,945. About 11.2% of families and 14.2% of the population were below the poverty line, including 17.2% of those under age 18 and 8.2% of those age 65 or over.
History
Wheatland was founded in 1868 by a group of settlers from the Midwest. The town was named after the abundant wheat fields in the area. The town quickly grew and by 1872, it had become the county seat of Platte County.
In the late 19th century, the town was a major stop on the Union Pacific Railroad. The railroad brought in new settlers and businesses, and the town continued to grow.
In the early 20th century, the town was a major center for the cattle industry. The town was also home to several large ranches, including the famous Pitchfork Ranch.
In the late 20th century, the town began to diversify its economy. The town is now home to several businesses, including a grocery store, a hardware store, a bank, and a few restaurants. The town is also home to a number of government offices, including the Platte County Courthouse, the Platte County Sheriff’s Office, and the Platte County Health Department.
Common Questions
What is Per Capita Income in Wheatland?
Per Capita income in Wheatland is $36,033.
What is the Median Family Income in Wheatland?
Median Family Income in Wheatland is $95,332.
What is the Median Household income in Wheatland?
Median Household Income in Wheatland is $53,627.
What is Income or Wage Gap in Wheatland?
Income or Wage Gap in Wheatland is 19.7%.
Women in Wheatland earn 80.3 cents for every dollar earned by a man.
What is Inequality or Gini Index in Wheatland?
Inequality or Gini Index in Wheatland is 0.47.
What is the Total Population of Wheatland?
Total Population of Wheatland is 3,575.
What is the Total Male Population of Wheatland?
Total Male Population of Wheatland is 1,818.
What is the Total Female Population of Wheatland?
Total Female Population of Wheatland is 1,757.
What is the Ratio of Males per 100 Females in Wheatland?
There are 103.47 Males per 100 Females in Wheatland.
What is the Ratio of Females per 100 Males in Wheatland?
There are 96.64 Females per 100 Males in Wheatland.
What is the Median Population Age in Wheatland?
Median Population Age in Wheatland is 44.6 Years.
What is the Average Family Size in Wheatland
Average Family Size in Wheatland is 2.9 People.
What is the Average Household Size in Wheatland
Average Household Size in Wheatland is 2.0 People.
How Large is the Labor Force in Wheatland?
There are 1,593 People in the Labor Forcein in Wheatland.
What is the Percentage of People in the Labor Force in Wheatland?
51.1% of People are in the Labor Force in Wheatland.
What is the Unemployment Rate in Wheatland?
Unemployment Rate in Wheatland is 1.8%.