Jackson, WY Map & Demographics
Jackson Map
Jackson Overview
$56,496
PER CAPITA INCOME
$111,941
AVG FAMILY INCOME
$101,477
AVG HOUSEHOLD INCOME
14.8%
WAGE / INCOME GAP [ % ]
85.2¢/ $1
WAGE / INCOME GAP [ $ ]
0.46
INEQUALITY / GINI INDEX
10,748
TOTAL POPULATION
5,653
MALE POPULATION
5,095
FEMALE POPULATION
110.95
MALES / 100 FEMALES
90.13
FEMALES / 100 MALES
34.5
MEDIAN AGE
2.9
AVG FAMILY SIZE
2.5
AVG HOUSEHOLD SIZE
7,833
LABOR FORCE [ PEOPLE ]
88.8%
PERCENT IN LABOR FORCE
0.8%
UNEMPLOYMENT RATE
Jackson Zip Codes
Jackson Area Codes
Income in Jackson
Income Overview in Jackson
Per Capita Income in Jackson is $56,496, while median incomes of families and households are $111,941 and $101,477 respectively.
| Characteristic | Number | Measure |
| Per Capita Income | 10,748 | $56,496 |
| Median Family Income | 2,391 | $111,941 |
| Mean Family Income | 2,391 | $159,267 |
| Median Household Income | 4,352 | $101,477 |
| Mean Household Income | 4,352 | $138,869 |
| Income Deficit | 2,391 | $0 |
| Wage / Income Gap (%) | 10,748 | 14.77% |
| Wage / Income Gap ($) | 10,748 | 85.23¢ per $1 |
| Gini / Inequality Index | 10,748 | 0.46 |
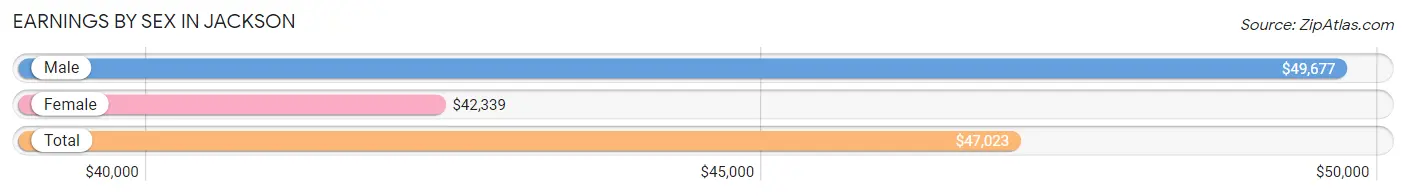
Earnings by Sex in Jackson
Average Earnings in Jackson are $47,023, $49,677 for men and $42,339 for women, a difference of 14.8%.
| Sex | Number | Average Earnings |
| Male | 4,325 (53.9%) | $49,677 |
| Female | 3,702 (46.1%) | $42,339 |
| Total | 8,027 (100.0%) | $47,023 |
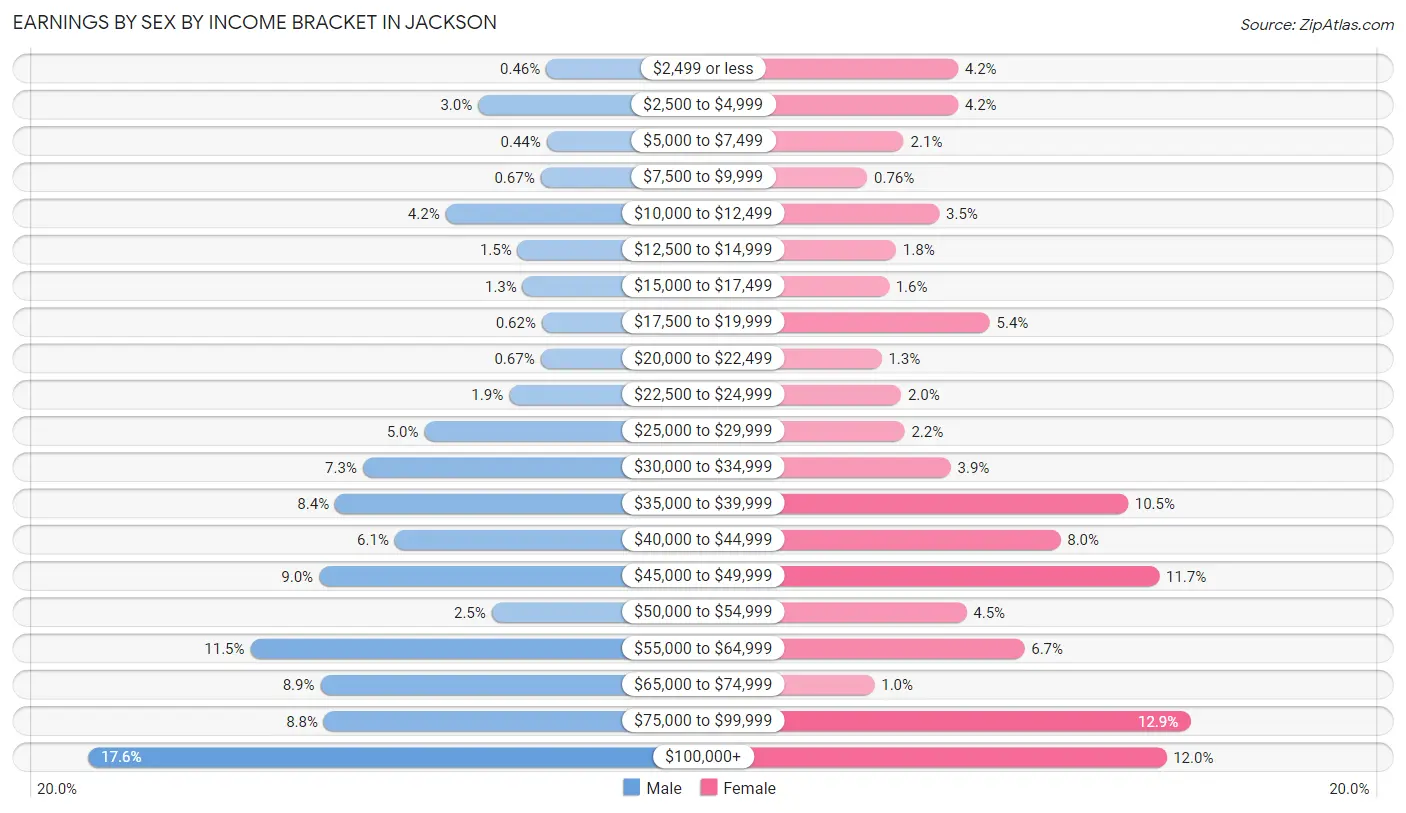
Earnings by Sex by Income Bracket in Jackson
The most common earnings brackets in Jackson are $100,000+ for men (762 | 17.6%) and $75,000 to $99,999 for women (476 | 12.9%).
| Income | Male | Female |
| $2,499 or less | 20 (0.5%) | 154 (4.2%) |
| $2,500 to $4,999 | 130 (3.0%) | 154 (4.2%) |
| $5,000 to $7,499 | 19 (0.4%) | 79 (2.1%) |
| $7,500 to $9,999 | 29 (0.7%) | 28 (0.8%) |
| $10,000 to $12,499 | 183 (4.2%) | 128 (3.5%) |
| $12,500 to $14,999 | 66 (1.5%) | 68 (1.8%) |
| $15,000 to $17,499 | 58 (1.3%) | 58 (1.6%) |
| $17,500 to $19,999 | 27 (0.6%) | 198 (5.3%) |
| $20,000 to $22,499 | 29 (0.7%) | 48 (1.3%) |
| $22,500 to $24,999 | 80 (1.8%) | 75 (2.0%) |
| $25,000 to $29,999 | 217 (5.0%) | 80 (2.2%) |
| $30,000 to $34,999 | 317 (7.3%) | 144 (3.9%) |
| $35,000 to $39,999 | 362 (8.4%) | 390 (10.5%) |
| $40,000 to $44,999 | 265 (6.1%) | 296 (8.0%) |
| $45,000 to $49,999 | 388 (9.0%) | 433 (11.7%) |
| $50,000 to $54,999 | 108 (2.5%) | 166 (4.5%) |
| $55,000 to $64,999 | 499 (11.5%) | 246 (6.7%) |
| $65,000 to $74,999 | 386 (8.9%) | 38 (1.0%) |
| $75,000 to $99,999 | 380 (8.8%) | 476 (12.9%) |
| $100,000+ | 762 (17.6%) | 443 (12.0%) |
| Total | 4,325 (100.0%) | 3,702 (100.0%) |
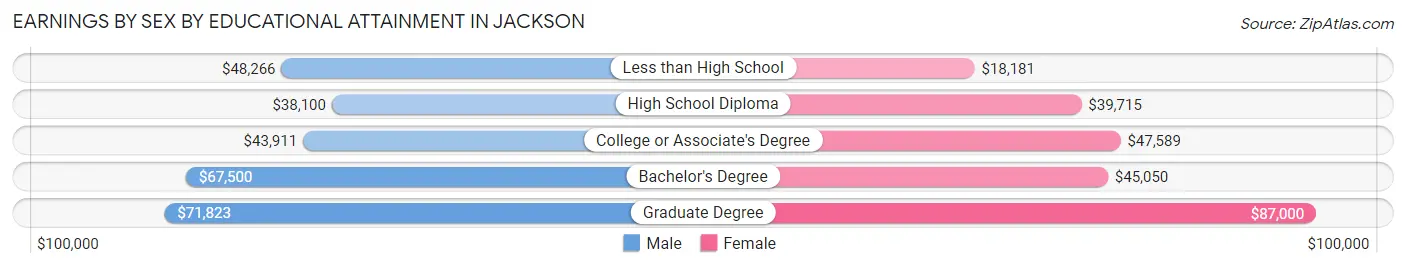
Earnings by Sex by Educational Attainment in Jackson
Average earnings in Jackson are $52,127 for men and $46,363 for women, a difference of 11.1%. Men with an educational attainment of graduate degree enjoy the highest average annual earnings of $71,823, while those with high school diploma education earn the least with $38,100. Women with an educational attainment of graduate degree earn the most with the average annual earnings of $87,000, while those with less than high school education have the smallest earnings of $18,181.
| Educational Attainment | Male Income | Female Income |
| Less than High School | $48,266 | $18,181 |
| High School Diploma | $38,100 | $39,715 |
| College or Associate's Degree | $43,911 | $47,589 |
| Bachelor's Degree | $67,500 | $45,050 |
| Graduate Degree | $71,823 | $87,000 |
| Total | $52,127 | $46,363 |
Family Income in Jackson
Family Income Brackets in Jackson
According to the Jackson family income data, there are 703 families falling into the $100,000 to $149,999 income range, which is the most common income bracket and makes up 29.4% of all families.
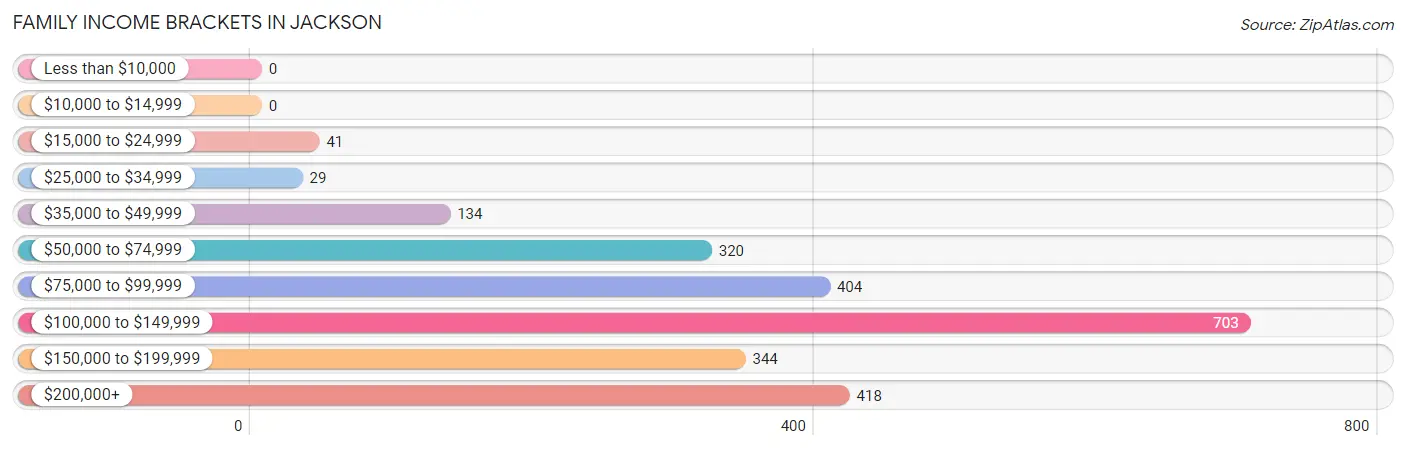
| Income Bracket | # Families | % Families |
| Less than $10,000 | 0 | 0.0% |
| $10,000 to $14,999 | 0 | 0.0% |
| $15,000 to $24,999 | 41 | 1.7% |
| $25,000 to $34,999 | 29 | 1.2% |
| $35,000 to $49,999 | 134 | 5.6% |
| $50,000 to $74,999 | 320 | 13.4% |
| $75,000 to $99,999 | 404 | 16.9% |
| $100,000 to $149,999 | 703 | 29.4% |
| $150,000 to $199,999 | 344 | 14.4% |
| $200,000+ | 418 | 17.5% |
Family Income by Famaliy Size in Jackson
4-person families (397 | 16.6%) account for the highest median family income in Jackson with $169,620 per family, while 2-person families (930 | 38.9%) have the highest median income of $47,536 per family member.
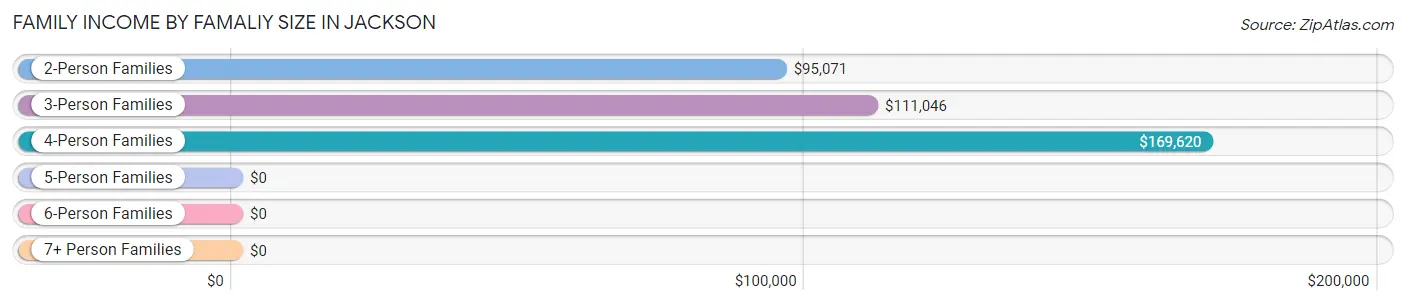
| Income Bracket | # Families | Median Income |
| 2-Person Families | 930 (38.9%) | $95,071 |
| 3-Person Families | 775 (32.4%) | $111,046 |
| 4-Person Families | 397 (16.6%) | $169,620 |
| 5-Person Families | 168 (7.0%) | $0 |
| 6-Person Families | 80 (3.4%) | $0 |
| 7+ Person Families | 41 (1.7%) | $0 |
| Total | 2,391 (100.0%) | $111,941 |
Family Income by Number of Earners in Jackson
The median family income in Jackson is $111,941, with families comprising 3+ earners (298) having the highest median family income of $155,244, while families with no earners (202) have the lowest median family income of $73,276, accounting for 12.5% and 8.5% of families, respectively.
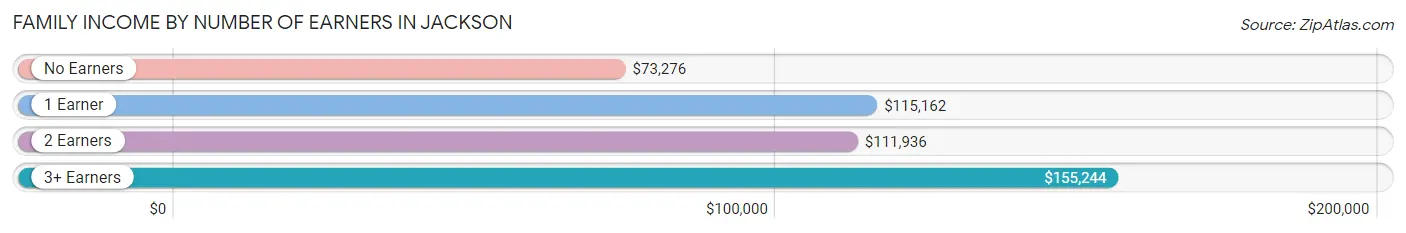
| Number of Earners | # Families | Median Income |
| No Earners | 202 (8.5%) | $73,276 |
| 1 Earner | 345 (14.4%) | $115,162 |
| 2 Earners | 1,546 (64.7%) | $111,936 |
| 3+ Earners | 298 (12.5%) | $155,244 |
| Total | 2,391 (100.0%) | $111,941 |
Household Income in Jackson
Household Income Brackets in Jackson
With 988 households falling in the category, the $100,000 to $149,999 income range is the most frequent in Jackson, accounting for 22.7% of all households. In contrast, only 30 households (0.7%) fall into the less than $10,000 income bracket, making it the least populous group.
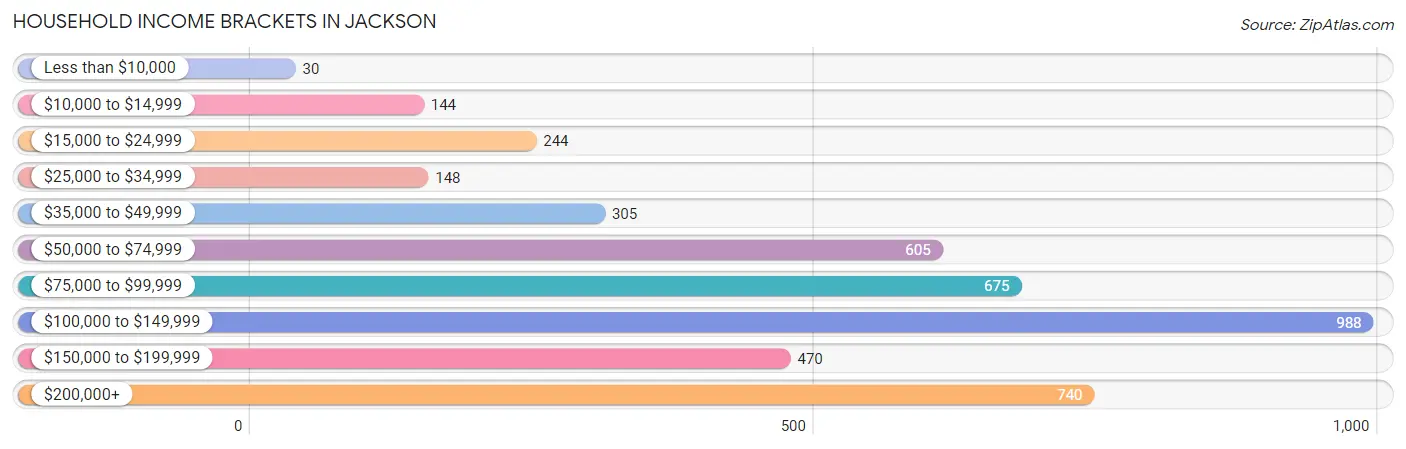
| Income Bracket | # Households | % Households |
| Less than $10,000 | 30 | 0.7% |
| $10,000 to $14,999 | 144 | 3.3% |
| $15,000 to $24,999 | 244 | 5.6% |
| $25,000 to $34,999 | 148 | 3.4% |
| $35,000 to $49,999 | 305 | 7.0% |
| $50,000 to $74,999 | 605 | 13.9% |
| $75,000 to $99,999 | 675 | 15.5% |
| $100,000 to $149,999 | 988 | 22.7% |
| $150,000 to $199,999 | 470 | 10.8% |
| $200,000+ | 740 | 17.0% |
Household Income by Householder Age in Jackson
The median household income in Jackson is $101,477, with the highest median household income of $110,468 found in the 25 to 44 years age bracket for the primary householder. A total of 2,487 households (57.2%) fall into this category. Meanwhile, the 15 to 24 years age bracket for the primary householder has the lowest median household income of $0, with 69 households (1.6%) in this group.
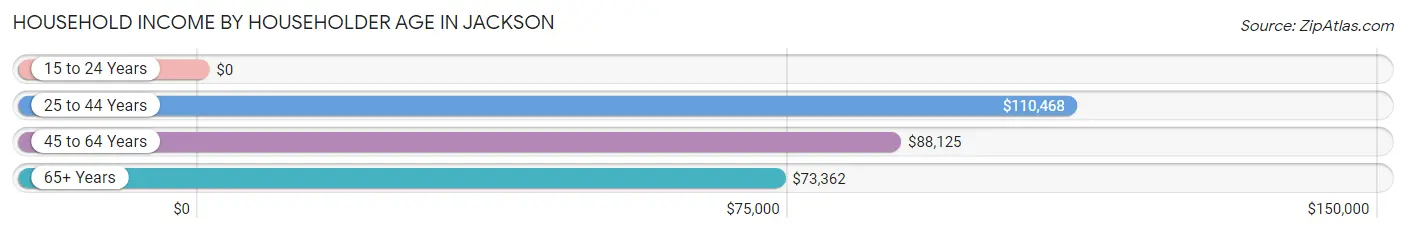
| Income Bracket | # Households | Median Income |
| 15 to 24 Years | 69 (1.6%) | $0 |
| 25 to 44 Years | 2,487 (57.2%) | $110,468 |
| 45 to 64 Years | 1,278 (29.4%) | $88,125 |
| 65+ Years | 518 (11.9%) | $73,362 |
| Total | 4,352 (100.0%) | $101,477 |
Poverty in Jackson
Income Below Poverty by Sex and Age in Jackson
With 4.4% poverty level for males and 6.4% for females among the residents of Jackson, 6 to 11 year old males and 18 to 24 year old females are the most vulnerable to poverty, with 37 males (9.8%) and 108 females (48.0%) in their respective age groups living below the poverty level.
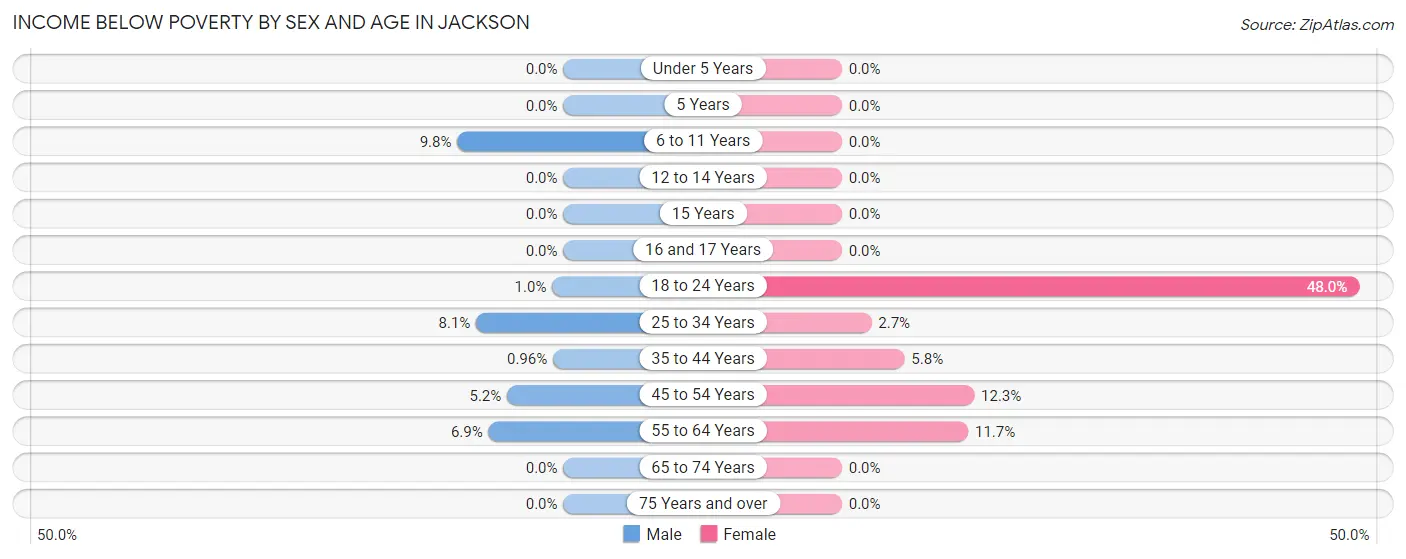
| Age Bracket | Male | Female |
| Under 5 Years | 0 (0.0%) | 0 (0.0%) |
| 5 Years | 0 (0.0%) | 0 (0.0%) |
| 6 to 11 Years | 37 (9.8%) | 0 (0.0%) |
| 12 to 14 Years | 0 (0.0%) | 0 (0.0%) |
| 15 Years | 0 (0.0%) | 0 (0.0%) |
| 16 and 17 Years | 0 (0.0%) | 0 (0.0%) |
| 18 to 24 Years | 1 (1.0%) | 108 (48.0%) |
| 25 to 34 Years | 130 (8.1%) | 37 (2.7%) |
| 35 to 44 Years | 13 (1.0%) | 65 (5.8%) |
| 45 to 54 Years | 35 (5.2%) | 84 (12.3%) |
| 55 to 64 Years | 31 (6.9%) | 28 (11.7%) |
| 65 to 74 Years | 0 (0.0%) | 0 (0.0%) |
| 75 Years and over | 0 (0.0%) | 0 (0.0%) |
| Total | 247 (4.4%) | 322 (6.4%) |
Income Above Poverty by Sex and Age in Jackson
According to the poverty statistics in Jackson, males aged under 5 years and females aged under 5 years are the age groups that are most secure financially, with 100.0% of males and 100.0% of females in these age groups living above the poverty line.
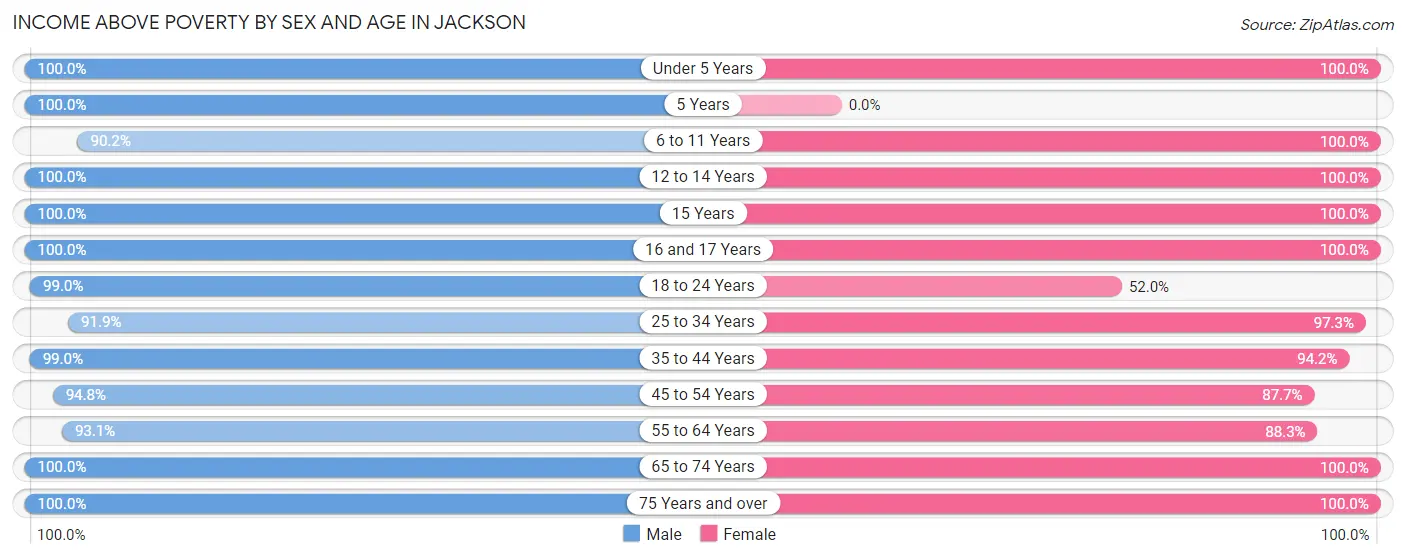
| Age Bracket | Male | Female |
| Under 5 Years | 366 (100.0%) | 342 (100.0%) |
| 5 Years | 27 (100.0%) | 0 (0.0%) |
| 6 to 11 Years | 339 (90.2%) | 370 (100.0%) |
| 12 to 14 Years | 211 (100.0%) | 116 (100.0%) |
| 15 Years | 43 (100.0%) | 72 (100.0%) |
| 16 and 17 Years | 130 (100.0%) | 130 (100.0%) |
| 18 to 24 Years | 96 (99.0%) | 117 (52.0%) |
| 25 to 34 Years | 1,477 (91.9%) | 1,315 (97.3%) |
| 35 to 44 Years | 1,340 (99.0%) | 1,054 (94.2%) |
| 45 to 54 Years | 636 (94.8%) | 600 (87.7%) |
| 55 to 64 Years | 416 (93.1%) | 211 (88.3%) |
| 65 to 74 Years | 176 (100.0%) | 268 (100.0%) |
| 75 Years and over | 130 (100.0%) | 136 (100.0%) |
| Total | 5,387 (95.6%) | 4,731 (93.6%) |
Income Below Poverty Among Married-Couple Families in Jackson
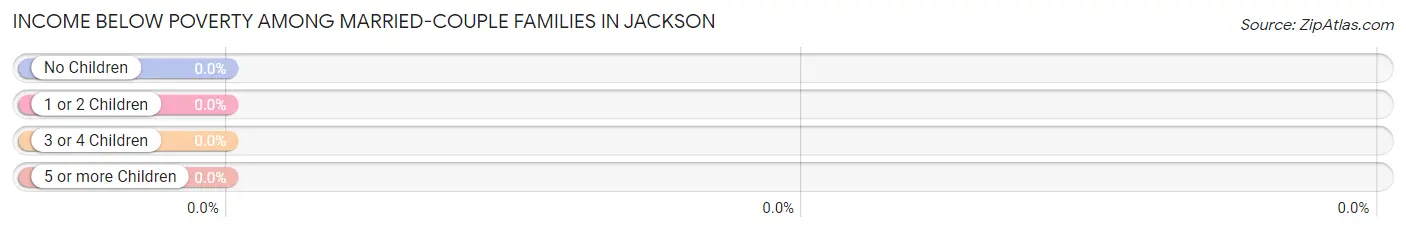
| Children | Above Poverty | Below Poverty |
| No Children | 768 (100.0%) | 0 (0.0%) |
| 1 or 2 Children | 934 (100.0%) | 0 (0.0%) |
| 3 or 4 Children | 198 (100.0%) | 0 (0.0%) |
| 5 or more Children | 41 (100.0%) | 0 (0.0%) |
| Total | 1,941 (100.0%) | 0 (0.0%) |
Income Below Poverty Among Single-Parent Households in Jackson
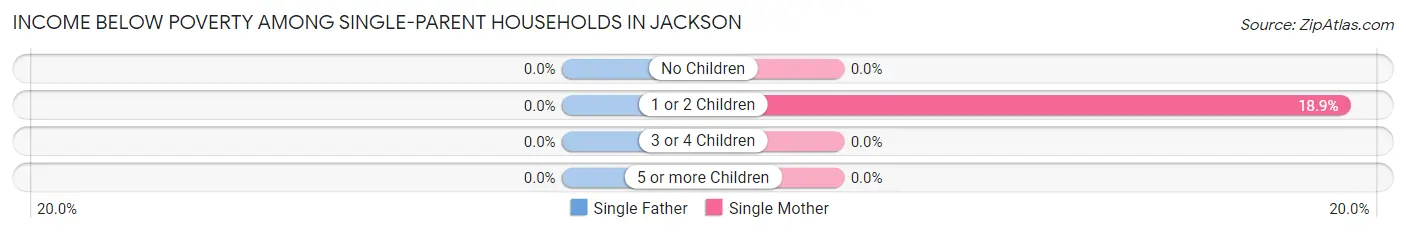
| Children | Single Father | Single Mother |
| No Children | 0 (0.0%) | 0 (0.0%) |
| 1 or 2 Children | 0 (0.0%) | 40 (18.9%) |
| 3 or 4 Children | 0 (0.0%) | 0 (0.0%) |
| 5 or more Children | 0 (0.0%) | 0 (0.0%) |
| Total | 0 (0.0%) | 40 (15.1%) |
Income Below Poverty Among Married-Couple vs Single-Parent Households in Jackson
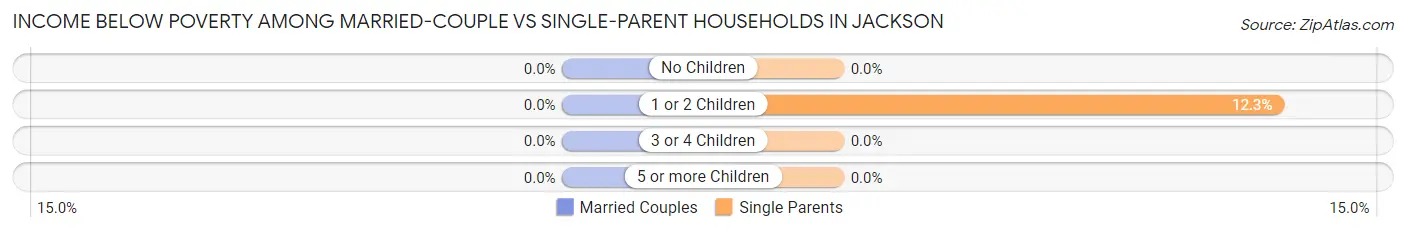
| Children | Married-Couple Families | Single-Parent Households |
| No Children | 0 (0.0%) | 0 (0.0%) |
| 1 or 2 Children | 0 (0.0%) | 40 (12.3%) |
| 3 or 4 Children | 0 (0.0%) | 0 (0.0%) |
| 5 or more Children | 0 (0.0%) | 0 (0.0%) |
| Total | 0 (0.0%) | 40 (8.9%) |
Race in Jackson
The most populous races in Jackson are White / Caucasian (8,038 | 74.8%), Hispanic or Latino (2,451 | 22.8%), and Some other Race (1,613 | 15.0%).
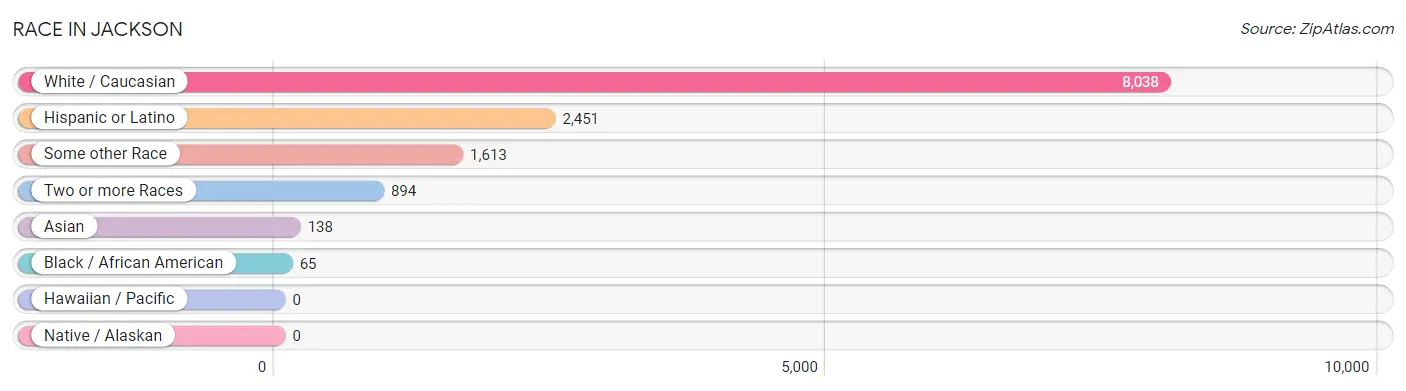
| Race | # Population | % Population |
| Asian | 138 | 1.3% |
| Black / African American | 65 | 0.6% |
| Hawaiian / Pacific | 0 | 0.0% |
| Hispanic or Latino | 2,451 | 22.8% |
| Native / Alaskan | 0 | 0.0% |
| White / Caucasian | 8,038 | 74.8% |
| Two or more Races | 894 | 8.3% |
| Some other Race | 1,613 | 15.0% |
| Total | 10,748 | 100.0% |
Ancestry in Jackson
The most populous ancestries reported in Jackson are Mexican (2,002 | 18.6%), English (1,572 | 14.6%), German (1,401 | 13.0%), Irish (1,357 | 12.6%), and Italian (649 | 6.0%), together accounting for 65.0% of all Jackson residents.
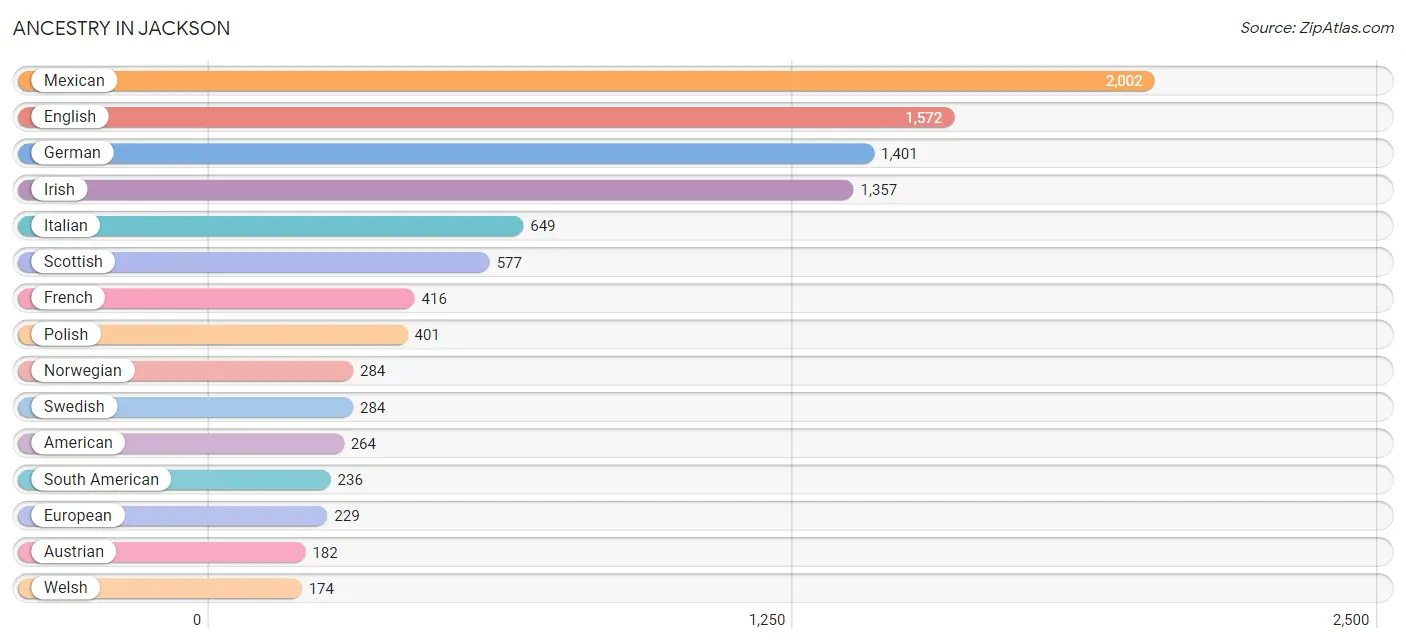
| Ancestry | # Population | % Population |
| Albanian | 46 | 0.4% |
| American | 264 | 2.5% |
| Apache | 29 | 0.3% |
| Australian | 24 | 0.2% |
| Austrian | 182 | 1.7% |
| Belgian | 31 | 0.3% |
| Bhutanese | 19 | 0.2% |
| British | 121 | 1.1% |
| Canadian | 39 | 0.4% |
| Central American | 1 | 0.0% |
| Colombian | 69 | 0.6% |
| Danish | 31 | 0.3% |
| Dominican | 1 | 0.0% |
| Dutch | 145 | 1.3% |
| Ecuadorian | 27 | 0.3% |
| English | 1,572 | 14.6% |
| European | 229 | 2.1% |
| Finnish | 80 | 0.7% |
| French | 416 | 3.9% |
| German | 1,401 | 13.0% |
| Hungarian | 69 | 0.6% |
| Indian (Asian) | 34 | 0.3% |
| Irish | 1,357 | 12.6% |
| Italian | 649 | 6.0% |
| Jamaican | 1 | 0.0% |
| Korean | 35 | 0.3% |
| Lithuanian | 16 | 0.2% |
| Mexican | 2,002 | 18.6% |
| Navajo | 93 | 0.9% |
| Nigerian | 35 | 0.3% |
| Northern European | 87 | 0.8% |
| Norwegian | 284 | 2.6% |
| Pakistani | 64 | 0.6% |
| Pennsylvania German | 32 | 0.3% |
| Peruvian | 140 | 1.3% |
| Polish | 401 | 3.7% |
| Puerto Rican | 95 | 0.9% |
| Romanian | 29 | 0.3% |
| Russian | 16 | 0.2% |
| Salvadoran | 1 | 0.0% |
| Scandinavian | 1 | 0.0% |
| Scotch-Irish | 71 | 0.7% |
| Scottish | 577 | 5.4% |
| Slavic | 152 | 1.4% |
| South African | 39 | 0.4% |
| South American | 236 | 2.2% |
| Subsaharan African | 74 | 0.7% |
| Swedish | 284 | 2.6% |
| Swiss | 28 | 0.3% |
| Thai | 66 | 0.6% |
| Tongan | 52 | 0.5% |
| Turkish | 29 | 0.3% |
| Ukrainian | 70 | 0.6% |
| Welsh | 174 | 1.6% | View All 54 Rows |
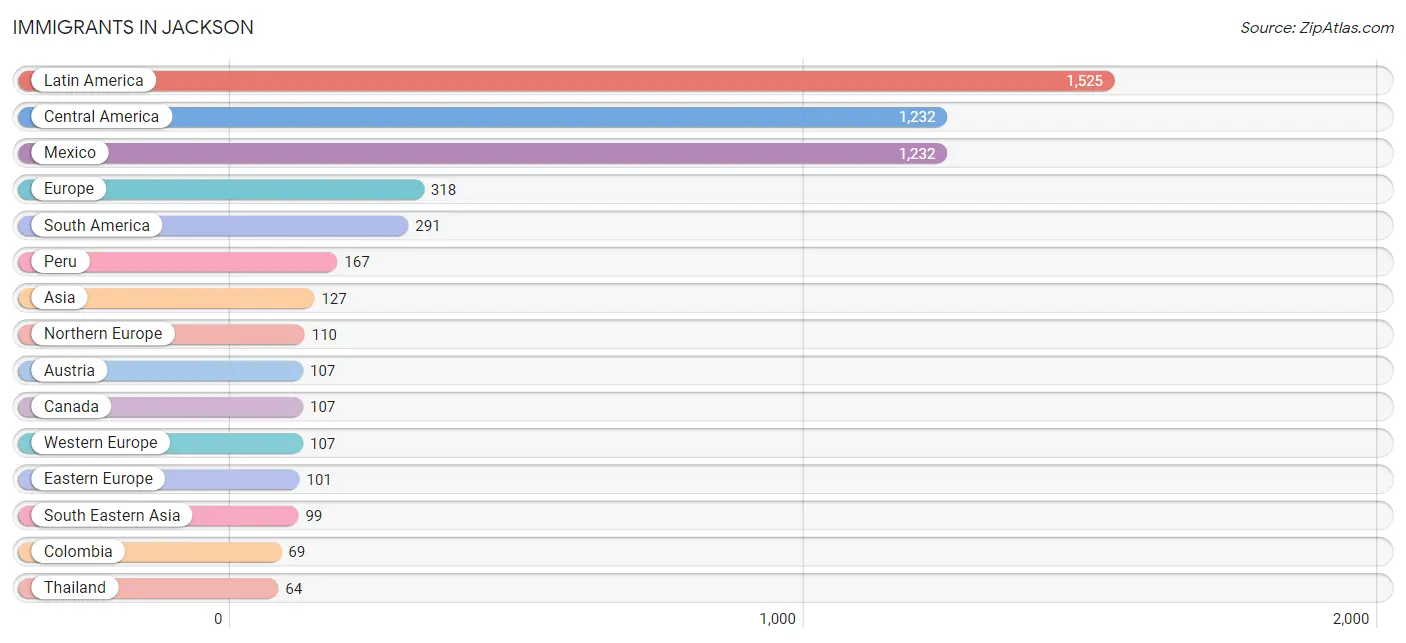
Immigrants in Jackson
The most numerous immigrant groups reported in Jackson came from Latin America (1,525 | 14.2%), Central America (1,232 | 11.5%), Mexico (1,232 | 11.5%), Europe (318 | 3.0%), and South America (291 | 2.7%), together accounting for 42.8% of all Jackson residents.
| Immigration Origin | # Population | % Population |
| Africa | 35 | 0.3% |
| Albania | 46 | 0.4% |
| Asia | 127 | 1.2% |
| Austria | 107 | 1.0% |
| Canada | 107 | 1.0% |
| Caribbean | 2 | 0.0% |
| Central America | 1,232 | 11.5% |
| Chile | 28 | 0.3% |
| China | 27 | 0.3% |
| Colombia | 69 | 0.6% |
| Dominican Republic | 1 | 0.0% |
| Eastern Asia | 27 | 0.3% |
| Eastern Europe | 101 | 0.9% |
| Ecuador | 27 | 0.3% |
| England | 39 | 0.4% |
| Europe | 318 | 3.0% |
| Hong Kong | 27 | 0.3% |
| Jamaica | 1 | 0.0% |
| Latin America | 1,525 | 14.2% |
| Mexico | 1,232 | 11.5% |
| Moldova | 2 | 0.0% |
| Nigeria | 35 | 0.3% |
| Northern Europe | 110 | 1.0% |
| Norway | 4 | 0.0% |
| Peru | 167 | 1.5% |
| Philippines | 35 | 0.3% |
| Romania | 27 | 0.3% |
| Russia | 1 | 0.0% |
| South America | 291 | 2.7% |
| South Eastern Asia | 99 | 0.9% |
| Thailand | 64 | 0.6% |
| Turkey | 1 | 0.0% |
| Ukraine | 25 | 0.2% |
| Western Africa | 35 | 0.3% |
| Western Asia | 1 | 0.0% |
| Western Europe | 107 | 1.0% | View All 36 Rows |
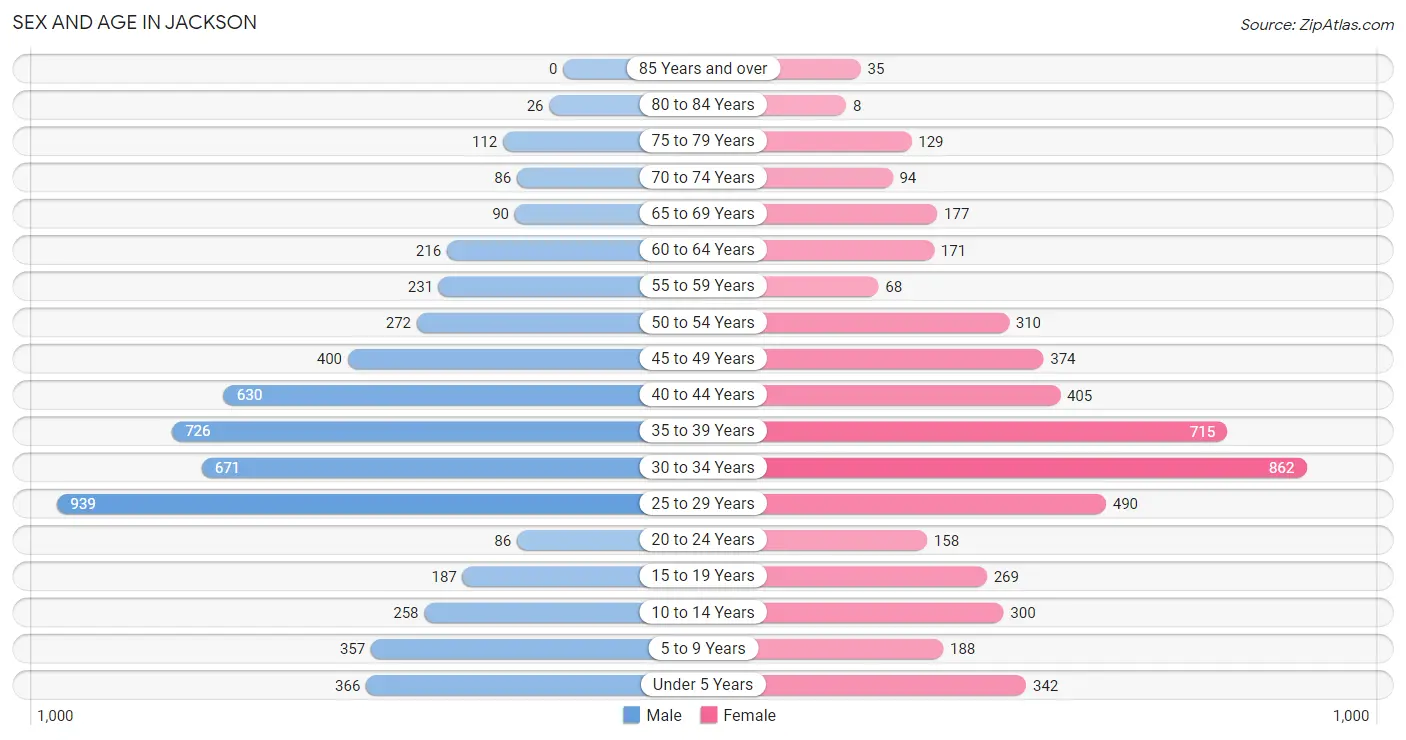
Sex and Age in Jackson
Sex and Age in Jackson
The most populous age groups in Jackson are 25 to 29 Years (939 | 16.6%) for men and 30 to 34 Years (862 | 16.9%) for women.
| Age Bracket | Male | Female |
| Under 5 Years | 366 (6.5%) | 342 (6.7%) |
| 5 to 9 Years | 357 (6.3%) | 188 (3.7%) |
| 10 to 14 Years | 258 (4.6%) | 300 (5.9%) |
| 15 to 19 Years | 187 (3.3%) | 269 (5.3%) |
| 20 to 24 Years | 86 (1.5%) | 158 (3.1%) |
| 25 to 29 Years | 939 (16.6%) | 490 (9.6%) |
| 30 to 34 Years | 671 (11.9%) | 862 (16.9%) |
| 35 to 39 Years | 726 (12.8%) | 715 (14.0%) |
| 40 to 44 Years | 630 (11.1%) | 405 (8.0%) |
| 45 to 49 Years | 400 (7.1%) | 374 (7.3%) |
| 50 to 54 Years | 272 (4.8%) | 310 (6.1%) |
| 55 to 59 Years | 231 (4.1%) | 68 (1.3%) |
| 60 to 64 Years | 216 (3.8%) | 171 (3.4%) |
| 65 to 69 Years | 90 (1.6%) | 177 (3.5%) |
| 70 to 74 Years | 86 (1.5%) | 94 (1.8%) |
| 75 to 79 Years | 112 (2.0%) | 129 (2.5%) |
| 80 to 84 Years | 26 (0.5%) | 8 (0.2%) |
| 85 Years and over | 0 (0.0%) | 35 (0.7%) |
| Total | 5,653 (100.0%) | 5,095 (100.0%) |
Families and Households in Jackson
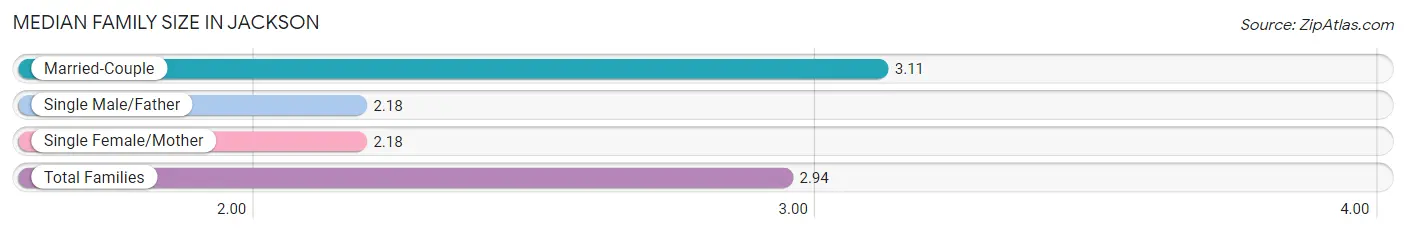
Median Family Size in Jackson
The median family size in Jackson is 2.94 persons per family, with married-couple families (1,941 | 81.2%) accounting for the largest median family size of 3.11 persons per family. On the other hand, single male/father families (185 | 7.7%) represent the smallest median family size with 2.18 persons per family.
| Family Type | # Families | Family Size |
| Married-Couple | 1,941 (81.2%) | 3.11 |
| Single Male/Father | 185 (7.7%) | 2.18 |
| Single Female/Mother | 265 (11.1%) | 2.18 |
| Total Families | 2,391 (100.0%) | 2.94 |
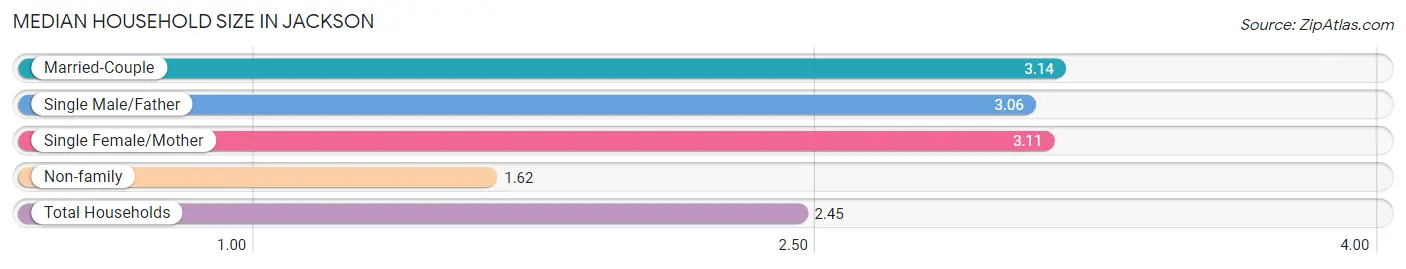
Median Household Size in Jackson
The median household size in Jackson is 2.45 persons per household, with married-couple households (1,941 | 44.6%) accounting for the largest median household size of 3.14 persons per household. non-family households (1,961 | 45.1%) represent the smallest median household size with 1.62 persons per household.
| Household Type | # Households | Household Size |
| Married-Couple | 1,941 (44.6%) | 3.14 |
| Single Male/Father | 185 (4.3%) | 3.06 |
| Single Female/Mother | 265 (6.1%) | 3.11 |
| Non-family | 1,961 (45.1%) | 1.62 |
| Total Households | 4,352 (100.0%) | 2.45 |
Household Size by Marriage Status in Jackson
Out of a total of 4,352 households in Jackson, 2,391 (54.9%) are family households, while 1,961 (45.1%) are nonfamily households. The most numerous type of family households are 2-person households, comprising 811, and the most common type of nonfamily households are 1-person households, comprising 1,103.
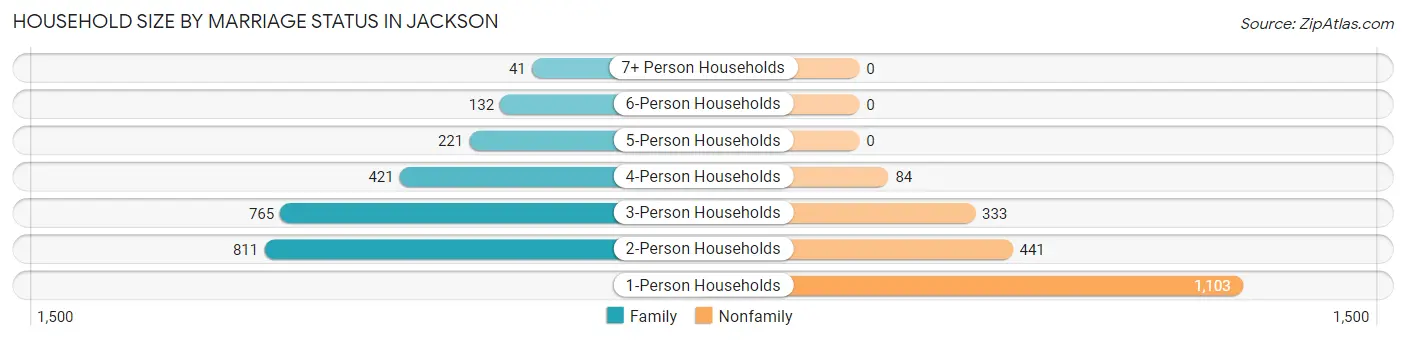
| Household Size | Family Households | Nonfamily Households |
| 1-Person Households | - | 1,103 (25.3%) |
| 2-Person Households | 811 (18.6%) | 441 (10.1%) |
| 3-Person Households | 765 (17.6%) | 333 (7.6%) |
| 4-Person Households | 421 (9.7%) | 84 (1.9%) |
| 5-Person Households | 221 (5.1%) | 0 (0.0%) |
| 6-Person Households | 132 (3.0%) | 0 (0.0%) |
| 7+ Person Households | 41 (0.9%) | 0 (0.0%) |
| Total | 2,391 (54.9%) | 1,961 (45.1%) |
Female Fertility in Jackson
Fertility by Age in Jackson
Average fertility rate in Jackson is 71.0 births per 1,000 women. Women in the age bracket of 20 to 34 years have the highest fertility rate with 123.0 births per 1,000 women. Women in the age bracket of 20 to 34 years acount for 75.6% of all women with births.
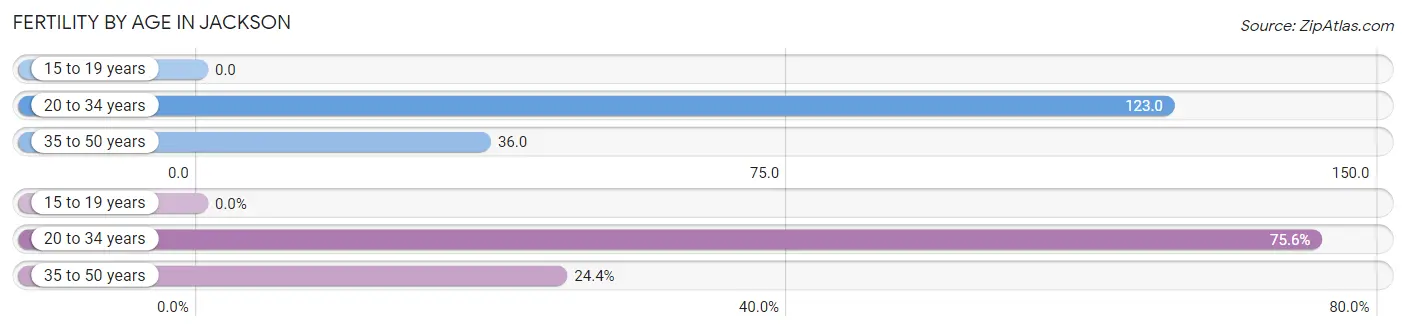
| Age Bracket | Women with Births | Births / 1,000 Women |
| 15 to 19 years | 0 (0.0%) | 0.0 |
| 20 to 34 years | 186 (75.6%) | 123.0 |
| 35 to 50 years | 60 (24.4%) | 36.0 |
| Total | 246 (100.0%) | 71.0 |
Fertility by Age by Marriage Status in Jackson
91.5% of women with births (246) in Jackson are married. The highest percentage of unmarried women with births falls into 35 to 50 years age bracket with 35.0% of them unmarried at the time of birth, while the lowest percentage of unmarried women with births belong to 20 to 34 years age bracket with 0.0% of them unmarried.
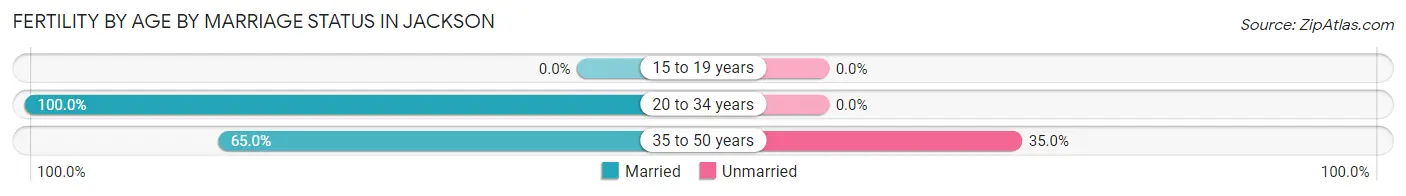
| Age Bracket | Married | Unmarried |
| 15 to 19 years | 0 (0.0%) | 0 (0.0%) |
| 20 to 34 years | 186 (100.0%) | 0 (0.0%) |
| 35 to 50 years | 39 (65.0%) | 21 (35.0%) |
| Total | 225 (91.5%) | 21 (8.5%) |
Fertility by Education in Jackson
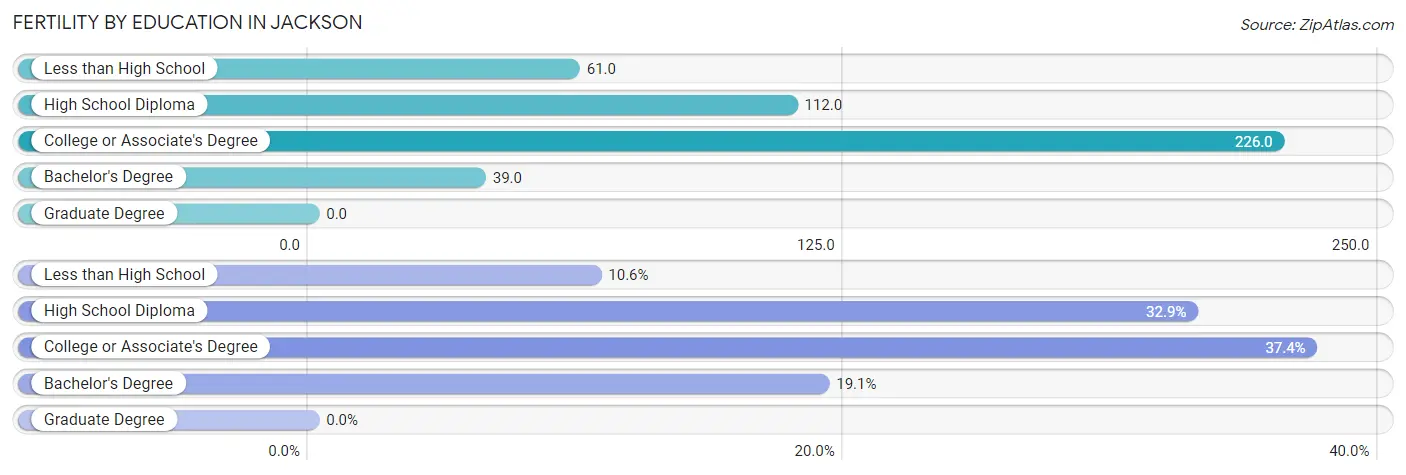
| Educational Attainment | Women with Births | Births / 1,000 Women |
| Less than High School | 26 (10.6%) | 61.0 |
| High School Diploma | 81 (32.9%) | 112.0 |
| College or Associate's Degree | 92 (37.4%) | 226.0 |
| Bachelor's Degree | 47 (19.1%) | 39.0 |
| Graduate Degree | 0 (0.0%) | 0.0 |
| Total | 246 (100.0%) | 71.0 |
Fertility by Education by Marriage Status in Jackson
8.5% of women with births in Jackson are unmarried. Women with the educational attainment of less than high school are most likely to be married with 100.0% of them married at childbirth, while women with the educational attainment of high school diploma are least likely to be married with 25.9% of them unmarried at childbirth.
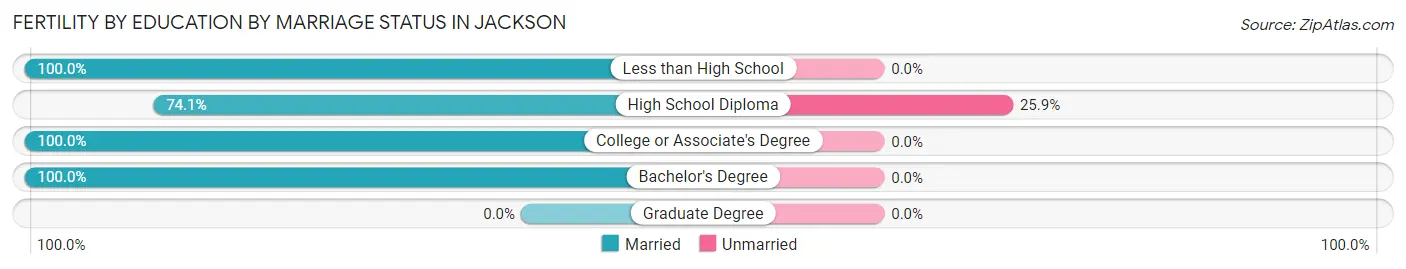
| Educational Attainment | Married | Unmarried |
| Less than High School | 26 (100.0%) | 0 (0.0%) |
| High School Diploma | 60 (74.1%) | 21 (25.9%) |
| College or Associate's Degree | 92 (100.0%) | 0 (0.0%) |
| Bachelor's Degree | 47 (100.0%) | 0 (0.0%) |
| Graduate Degree | 0 (0.0%) | 0 (0.0%) |
| Total | 225 (91.5%) | 21 (8.5%) |
Employment Characteristics in Jackson
Employment by Class of Employer in Jackson
Among the 7,399 employed individuals in Jackson, private company employees (4,976 | 67.2%), self-employed (not incorporated) (666 | 9.0%), and self-employed (incorporated) (664 | 9.0%) make up the most common classes of employment.
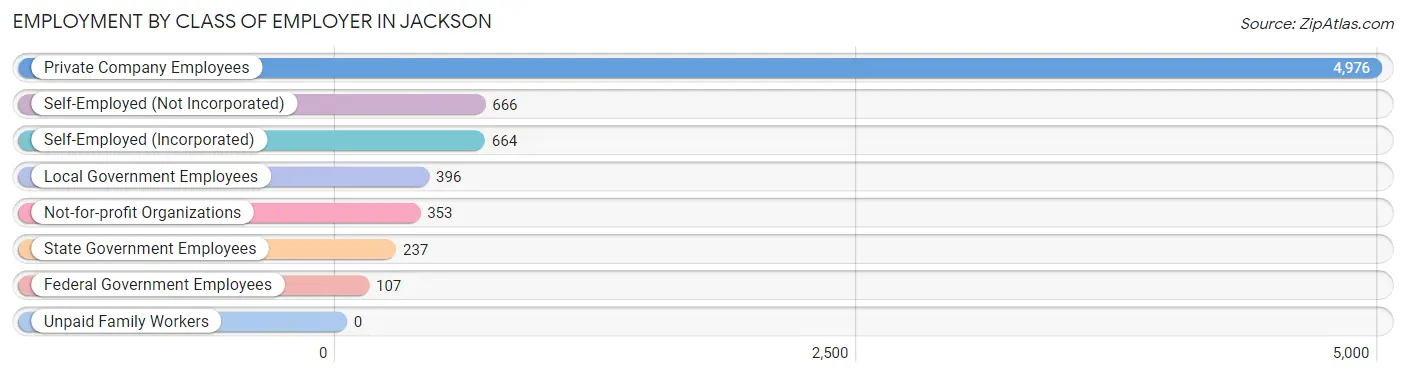
| Employer Class | # Employees | % Employees |
| Private Company Employees | 4,976 | 67.2% |
| Self-Employed (Incorporated) | 664 | 9.0% |
| Self-Employed (Not Incorporated) | 666 | 9.0% |
| Not-for-profit Organizations | 353 | 4.8% |
| Local Government Employees | 396 | 5.3% |
| State Government Employees | 237 | 3.2% |
| Federal Government Employees | 107 | 1.5% |
| Unpaid Family Workers | 0 | 0.0% |
| Total | 7,399 | 100.0% |
Employment Status by Age in Jackson
According to the labor force statistics for Jackson, out of the total population over 16 years of age (8,821), 88.8% or 7,833 individuals are in the labor force, with 0.8% or 63 of them unemployed. The age group with the highest labor force participation rate is 55 to 59 years, with 100.0% or 299 individuals in the labor force. Within the labor force, the 30 to 34 years age range has the highest percentage of unemployed individuals, with 2.0% or 29 of them being unemployed.
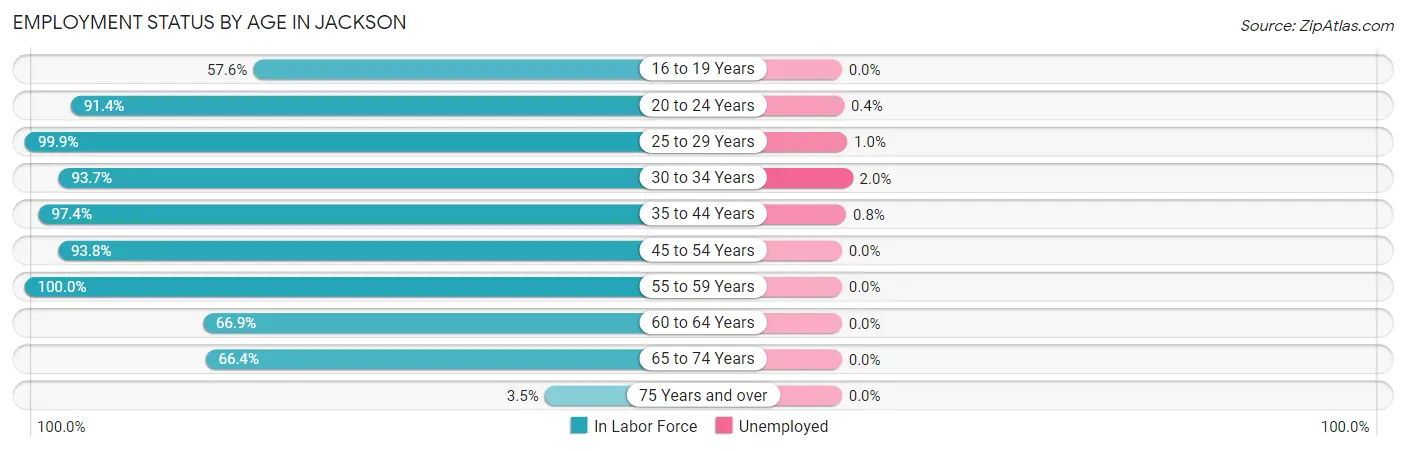
| Age Bracket | In Labor Force | Unemployed |
| 16 to 19 Years | 196 (57.6%) | 0 (0.0%) |
| 20 to 24 Years | 223 (91.4%) | 1 (0.4%) |
| 25 to 29 Years | 1,428 (99.9%) | 14 (1.0%) |
| 30 to 34 Years | 1,436 (93.7%) | 29 (2.0%) |
| 35 to 44 Years | 2,412 (97.4%) | 19 (0.8%) |
| 45 to 54 Years | 1,272 (93.8%) | 0 (0.0%) |
| 55 to 59 Years | 299 (100.0%) | 0 (0.0%) |
| 60 to 64 Years | 259 (66.9%) | 0 (0.0%) |
| 65 to 74 Years | 297 (66.4%) | 0 (0.0%) |
| 75 Years and over | 11 (3.5%) | 0 (0.0%) |
| Total | 7,833 (88.8%) | 63 (0.8%) |
Employment Status by Educational Attainment in Jackson
According to labor force statistics for Jackson, 95.0% of individuals (7,106) out of the total population between 25 and 64 years of age (7,480) are in the labor force, with 0.9% or 64 of them being unemployed. The group with the highest labor force participation rate are those with the educational attainment of less than high school, with 100.0% or 430 individuals in the labor force. Within the labor force, individuals with college / associate degree education have the highest percentage of unemployment, with 2.4% or 29 of them being unemployed.
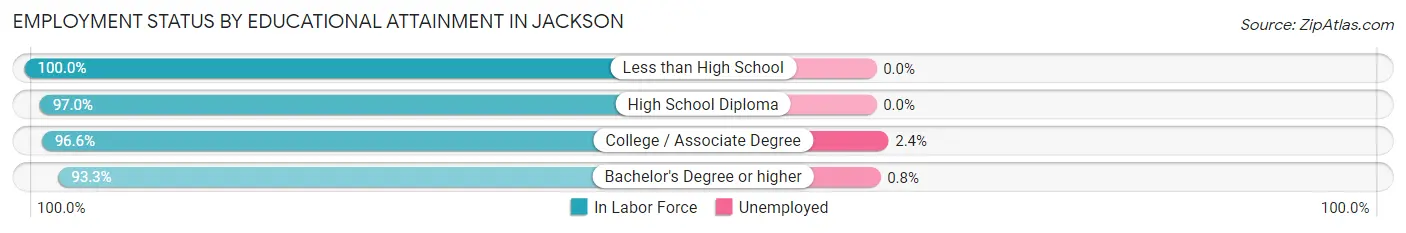
| Educational Attainment | In Labor Force | Unemployed |
| Less than High School | 430 (100.0%) | 0 (0.0%) |
| High School Diploma | 1,427 (97.0%) | 0 (0.0%) |
| College / Associate Degree | 1,226 (96.6%) | 30 (2.4%) |
| Bachelor's Degree or higher | 4,021 (93.3%) | 34 (0.8%) |
| Total | 7,106 (95.0%) | 67 (0.9%) |
Employment Occupations by Sex in Jackson
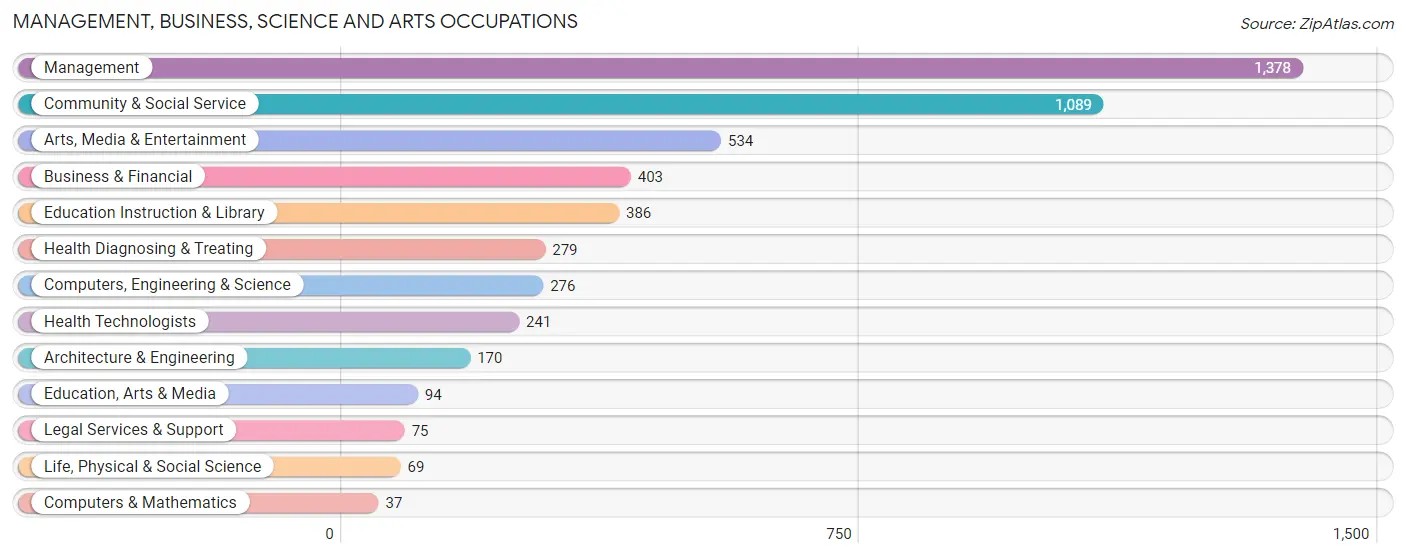
Management, Business, Science and Arts Occupations
The most common Management, Business, Science and Arts occupations in Jackson are Management (1,378 | 17.7%), Community & Social Service (1,089 | 14.0%), Arts, Media & Entertainment (534 | 6.9%), Business & Financial (403 | 5.2%), and Education Instruction & Library (386 | 5.0%).
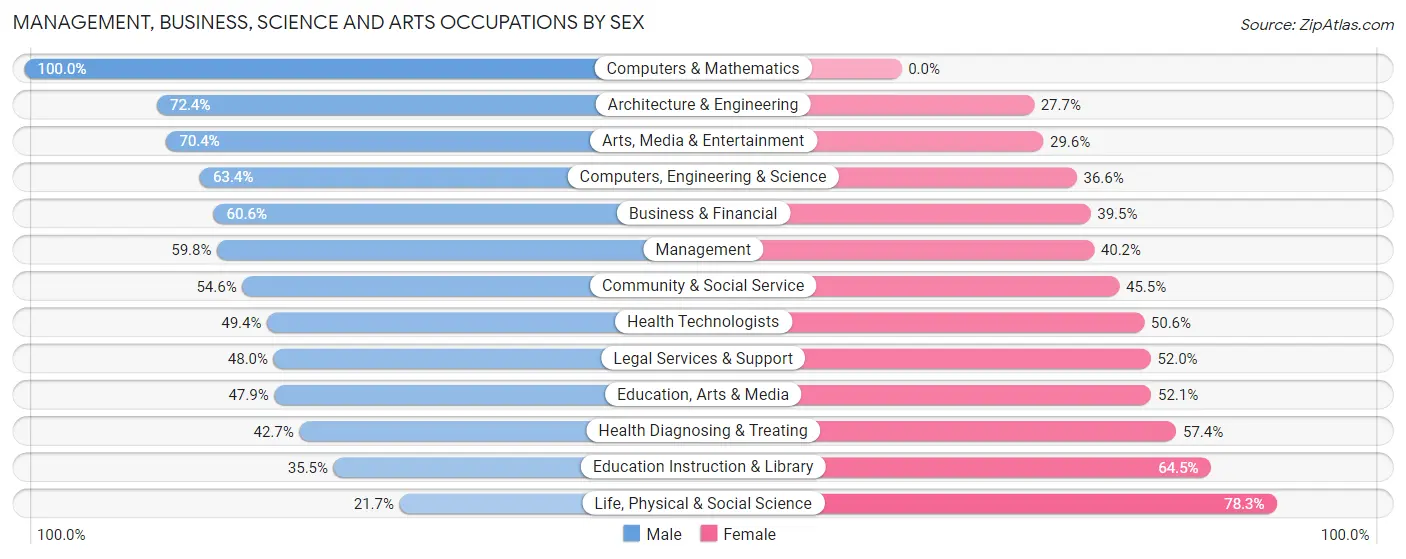
Management, Business, Science and Arts Occupations by Sex
Within the Management, Business, Science and Arts occupations in Jackson, the most male-oriented occupations are Computers & Mathematics (100.0%), Architecture & Engineering (72.4%), and Arts, Media & Entertainment (70.4%), while the most female-oriented occupations are Life, Physical & Social Science (78.3%), Education Instruction & Library (64.5%), and Health Diagnosing & Treating (57.4%).
| Occupation | Male | Female |
| Management | 824 (59.8%) | 554 (40.2%) |
| Business & Financial | 244 (60.6%) | 159 (39.5%) |
| Computers, Engineering & Science | 175 (63.4%) | 101 (36.6%) |
| Computers & Mathematics | 37 (100.0%) | 0 (0.0%) |
| Architecture & Engineering | 123 (72.4%) | 47 (27.7%) |
| Life, Physical & Social Science | 15 (21.7%) | 54 (78.3%) |
| Community & Social Service | 594 (54.5%) | 495 (45.5%) |
| Education, Arts & Media | 45 (47.9%) | 49 (52.1%) |
| Legal Services & Support | 36 (48.0%) | 39 (52.0%) |
| Education Instruction & Library | 137 (35.5%) | 249 (64.5%) |
| Arts, Media & Entertainment | 376 (70.4%) | 158 (29.6%) |
| Health Diagnosing & Treating | 119 (42.6%) | 160 (57.4%) |
| Health Technologists | 119 (49.4%) | 122 (50.6%) |
| Total (Category) | 1,956 (57.1%) | 1,469 (42.9%) |
| Total (Overall) | 4,255 (54.8%) | 3,514 (45.2%) |
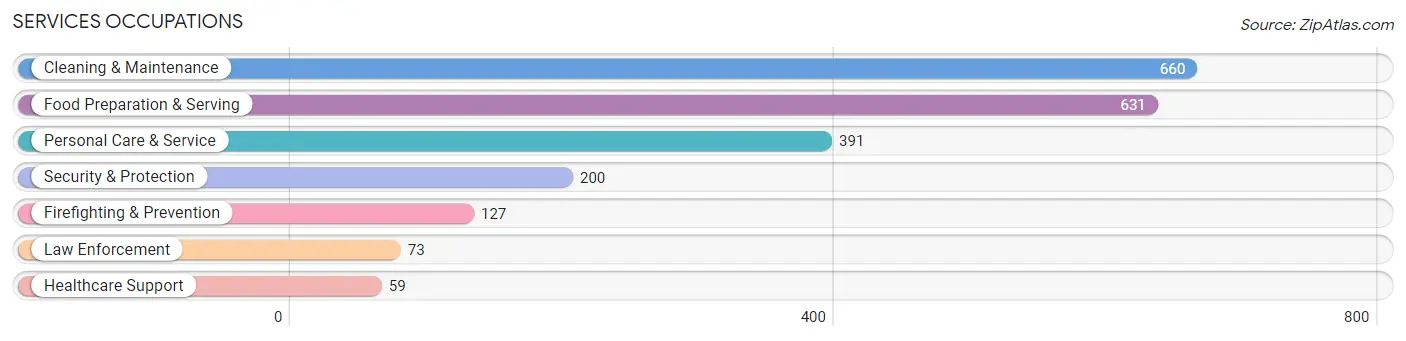
Services Occupations
The most common Services occupations in Jackson are Cleaning & Maintenance (660 | 8.5%), Food Preparation & Serving (631 | 8.1%), Personal Care & Service (391 | 5.0%), Security & Protection (200 | 2.6%), and Firefighting & Prevention (127 | 1.6%).
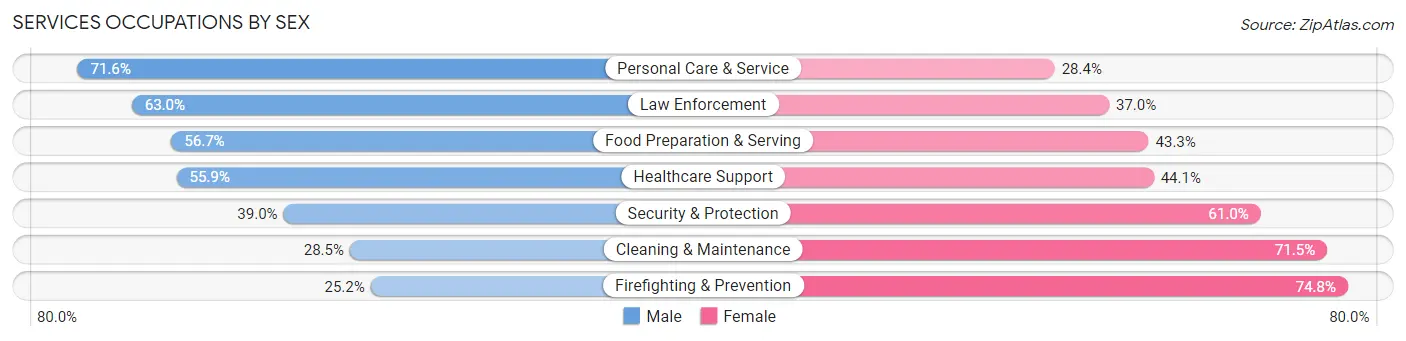
Services Occupations by Sex
Within the Services occupations in Jackson, the most male-oriented occupations are Personal Care & Service (71.6%), Law Enforcement (63.0%), and Food Preparation & Serving (56.7%), while the most female-oriented occupations are Firefighting & Prevention (74.8%), Cleaning & Maintenance (71.5%), and Security & Protection (61.0%).
| Occupation | Male | Female |
| Healthcare Support | 33 (55.9%) | 26 (44.1%) |
| Security & Protection | 78 (39.0%) | 122 (61.0%) |
| Firefighting & Prevention | 32 (25.2%) | 95 (74.8%) |
| Law Enforcement | 46 (63.0%) | 27 (37.0%) |
| Food Preparation & Serving | 358 (56.7%) | 273 (43.3%) |
| Cleaning & Maintenance | 188 (28.5%) | 472 (71.5%) |
| Personal Care & Service | 280 (71.6%) | 111 (28.4%) |
| Total (Category) | 937 (48.3%) | 1,004 (51.7%) |
| Total (Overall) | 4,255 (54.8%) | 3,514 (45.2%) |
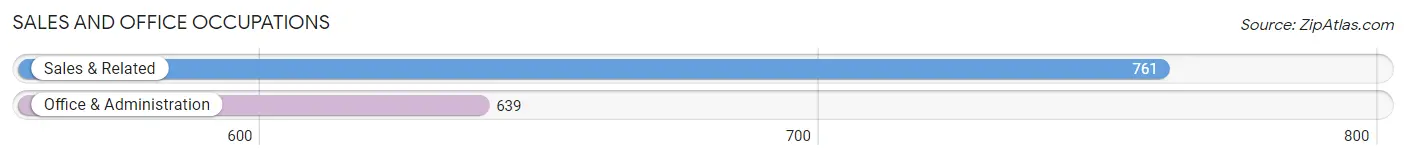
Sales and Office Occupations
The most common Sales and Office occupations in Jackson are Sales & Related (761 | 9.8%), and Office & Administration (639 | 8.2%).
Sales and Office Occupations by Sex
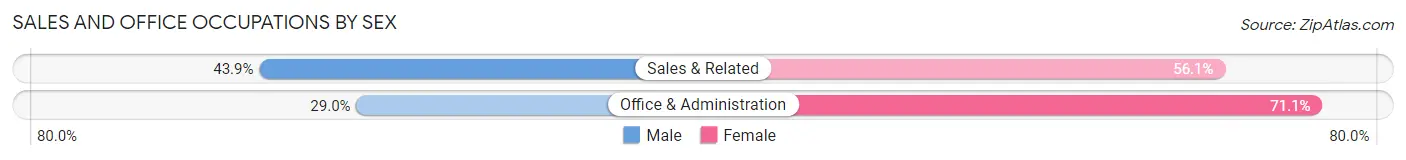
| Occupation | Male | Female |
| Sales & Related | 334 (43.9%) | 427 (56.1%) |
| Office & Administration | 185 (28.9%) | 454 (71.1%) |
| Total (Category) | 519 (37.1%) | 881 (62.9%) |
| Total (Overall) | 4,255 (54.8%) | 3,514 (45.2%) |
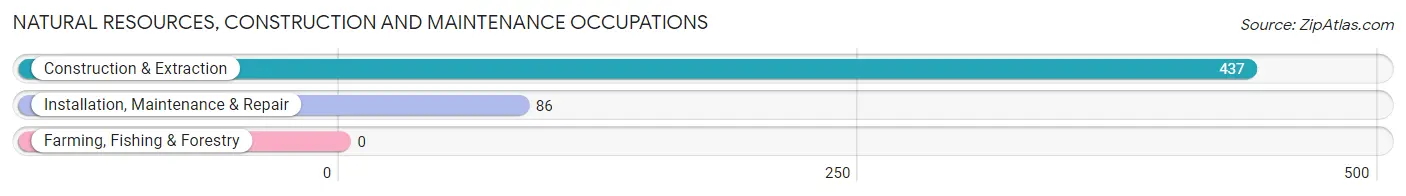
Natural Resources, Construction and Maintenance Occupations
The most common Natural Resources, Construction and Maintenance occupations in Jackson are Construction & Extraction (437 | 5.6%), and Installation, Maintenance & Repair (86 | 1.1%).
Natural Resources, Construction and Maintenance Occupations by Sex
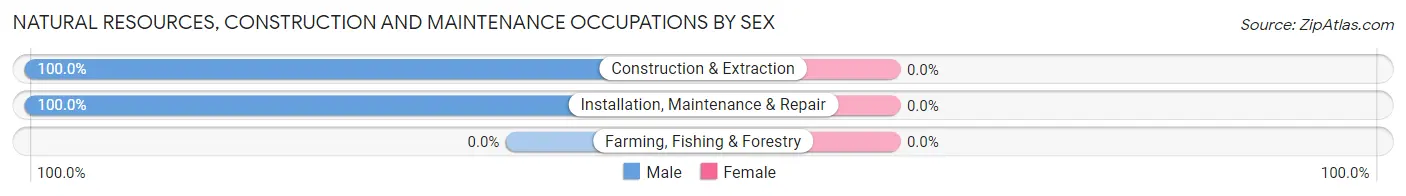
| Occupation | Male | Female |
| Farming, Fishing & Forestry | 0 (0.0%) | 0 (0.0%) |
| Construction & Extraction | 437 (100.0%) | 0 (0.0%) |
| Installation, Maintenance & Repair | 86 (100.0%) | 0 (0.0%) |
| Total (Category) | 523 (100.0%) | 0 (0.0%) |
| Total (Overall) | 4,255 (54.8%) | 3,514 (45.2%) |
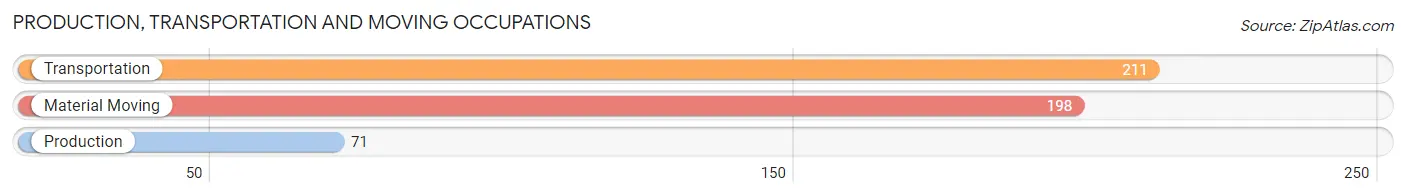
Production, Transportation and Moving Occupations
The most common Production, Transportation and Moving occupations in Jackson are Transportation (211 | 2.7%), Material Moving (198 | 2.5%), and Production (71 | 0.9%).
Production, Transportation and Moving Occupations by Sex
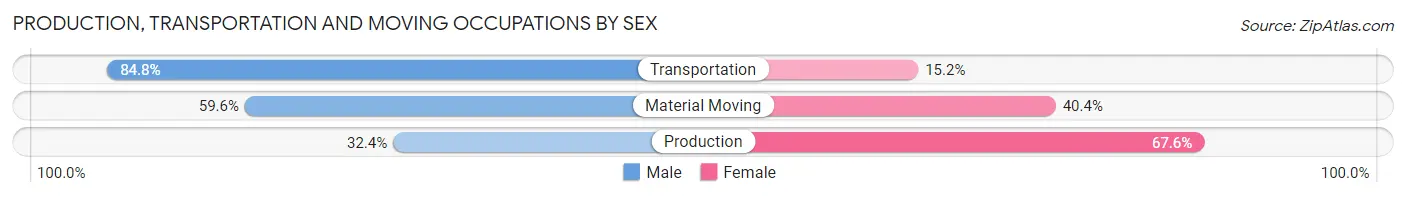
| Occupation | Male | Female |
| Production | 23 (32.4%) | 48 (67.6%) |
| Transportation | 179 (84.8%) | 32 (15.2%) |
| Material Moving | 118 (59.6%) | 80 (40.4%) |
| Total (Category) | 320 (66.7%) | 160 (33.3%) |
| Total (Overall) | 4,255 (54.8%) | 3,514 (45.2%) |
Employment Industries by Sex in Jackson
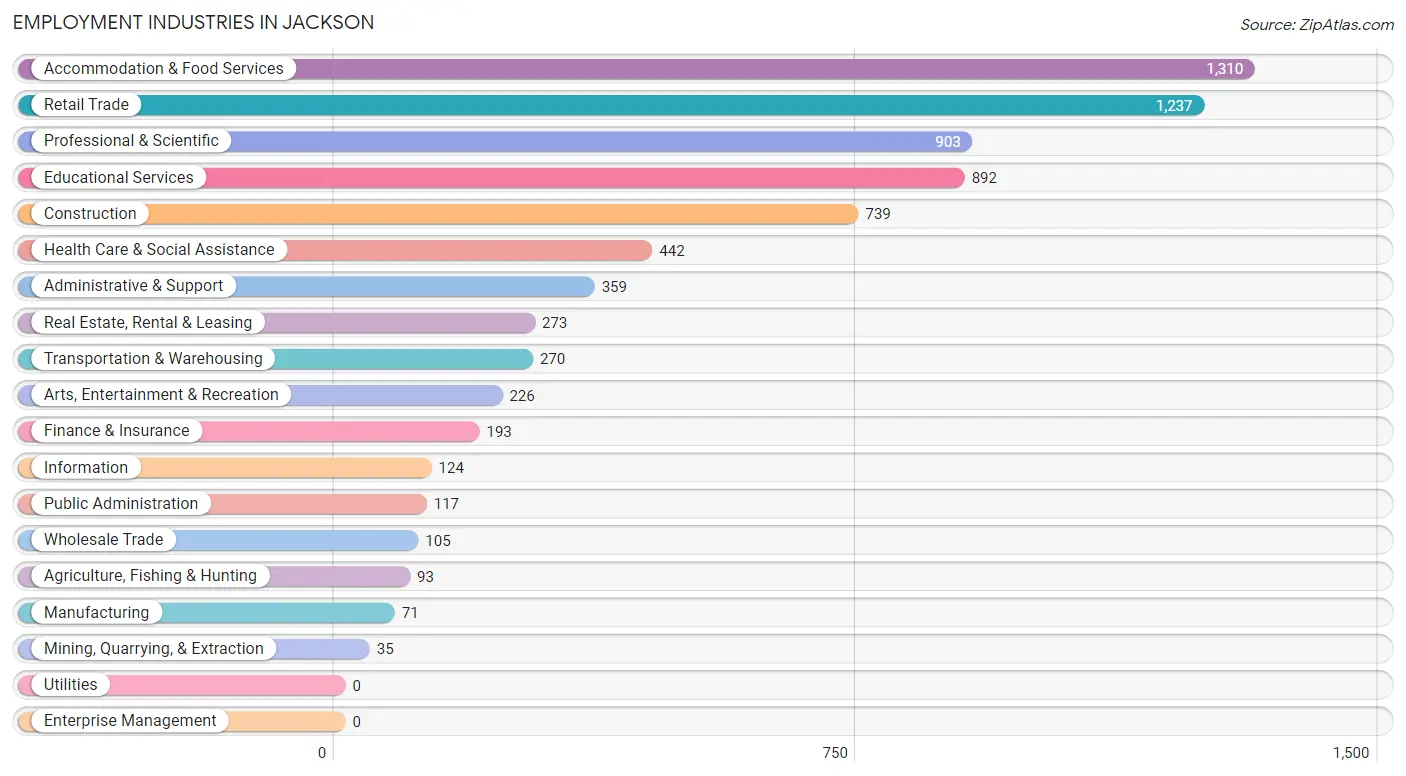
Employment Industries in Jackson
The major employment industries in Jackson include Accommodation & Food Services (1,310 | 16.9%), Retail Trade (1,237 | 15.9%), Professional & Scientific (903 | 11.6%), Educational Services (892 | 11.5%), and Construction (739 | 9.5%).
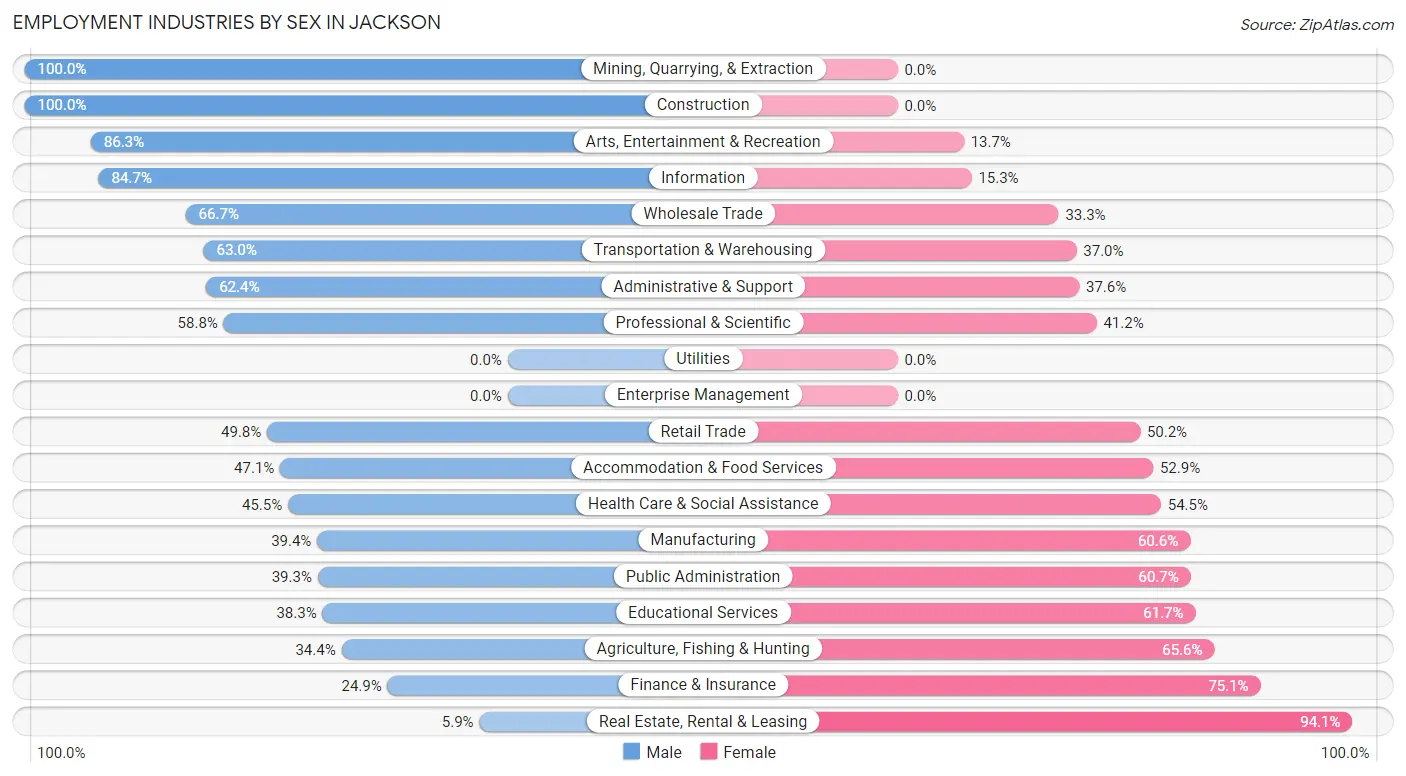
Employment Industries by Sex in Jackson
The Jackson industries that see more men than women are Mining, Quarrying, & Extraction (100.0%), Construction (100.0%), and Arts, Entertainment & Recreation (86.3%), whereas the industries that tend to have a higher number of women are Real Estate, Rental & Leasing (94.1%), Finance & Insurance (75.1%), and Agriculture, Fishing & Hunting (65.6%).
| Industry | Male | Female |
| Agriculture, Fishing & Hunting | 32 (34.4%) | 61 (65.6%) |
| Mining, Quarrying, & Extraction | 35 (100.0%) | 0 (0.0%) |
| Construction | 739 (100.0%) | 0 (0.0%) |
| Manufacturing | 28 (39.4%) | 43 (60.6%) |
| Wholesale Trade | 70 (66.7%) | 35 (33.3%) |
| Retail Trade | 616 (49.8%) | 621 (50.2%) |
| Transportation & Warehousing | 170 (63.0%) | 100 (37.0%) |
| Utilities | 0 (0.0%) | 0 (0.0%) |
| Information | 105 (84.7%) | 19 (15.3%) |
| Finance & Insurance | 48 (24.9%) | 145 (75.1%) |
| Real Estate, Rental & Leasing | 16 (5.9%) | 257 (94.1%) |
| Professional & Scientific | 531 (58.8%) | 372 (41.2%) |
| Enterprise Management | 0 (0.0%) | 0 (0.0%) |
| Administrative & Support | 224 (62.4%) | 135 (37.6%) |
| Educational Services | 342 (38.3%) | 550 (61.7%) |
| Health Care & Social Assistance | 201 (45.5%) | 241 (54.5%) |
| Arts, Entertainment & Recreation | 195 (86.3%) | 31 (13.7%) |
| Accommodation & Food Services | 617 (47.1%) | 693 (52.9%) |
| Public Administration | 46 (39.3%) | 71 (60.7%) |
| Total | 4,255 (54.8%) | 3,514 (45.2%) |
Education in Jackson
School Enrollment in Jackson
The most common levels of schooling among the 2,051 students in Jackson are elementary school (560 | 27.3%), high school (444 | 21.6%), and middle school (415 | 20.2%).
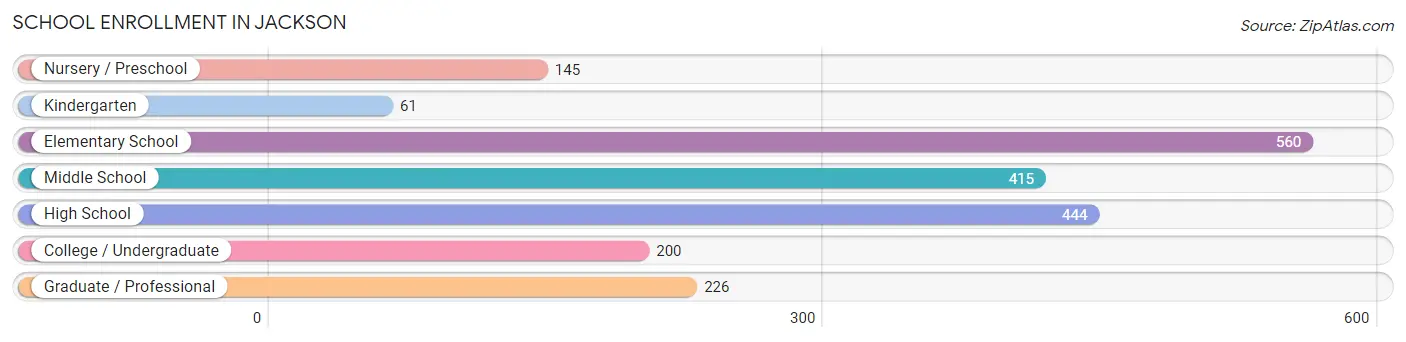
| School Level | # Students | % Students |
| Nursery / Preschool | 145 | 7.1% |
| Kindergarten | 61 | 3.0% |
| Elementary School | 560 | 27.3% |
| Middle School | 415 | 20.2% |
| High School | 444 | 21.6% |
| College / Undergraduate | 200 | 9.8% |
| Graduate / Professional | 226 | 11.0% |
| Total | 2,051 | 100.0% |
School Enrollment by Age by Funding Source in Jackson
Out of a total of 2,051 students who are enrolled in schools in Jackson, 55 (2.7%) attend a private institution, while the remaining 1,996 (97.3%) are enrolled in public schools. The age group of 20 to 24 year olds has the highest likelihood of being enrolled in private schools, with 19 (73.1% in the age bracket) enrolled. Conversely, the age group of 5 to 9 year old has the lowest likelihood of being enrolled in a private school, with 534 (100.0% in the age bracket) attending a public institution.
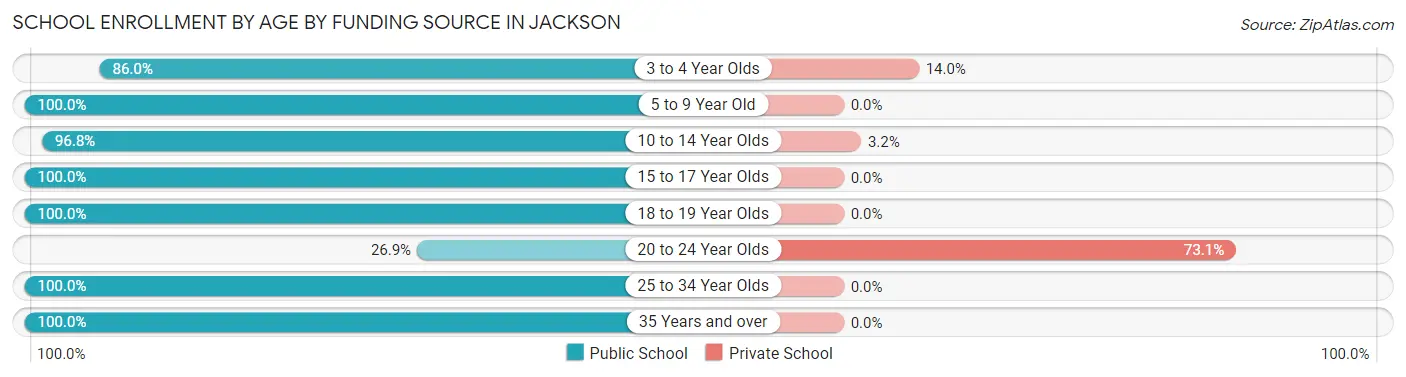
| Age Bracket | Public School | Private School |
| 3 to 4 Year Olds | 117 (86.0%) | 19 (14.0%) |
| 5 to 9 Year Old | 534 (100.0%) | 0 (0.0%) |
| 10 to 14 Year Olds | 540 (96.8%) | 18 (3.2%) |
| 15 to 17 Year Olds | 299 (100.0%) | 0 (0.0%) |
| 18 to 19 Year Olds | 72 (100.0%) | 0 (0.0%) |
| 20 to 24 Year Olds | 7 (26.9%) | 19 (73.1%) |
| 25 to 34 Year Olds | 198 (100.0%) | 0 (0.0%) |
| 35 Years and over | 228 (100.0%) | 0 (0.0%) |
| Total | 1,996 (97.3%) | 55 (2.7%) |
Educational Attainment by Field of Study in Jackson
Business (876 | 18.1%), science & technology (494 | 10.2%), visual & performing arts (486 | 10.0%), bio, nature & agricultural (445 | 9.2%), and communications (379 | 7.8%) are the most common fields of study among 4,847 individuals in Jackson who have obtained a bachelor's degree or higher.
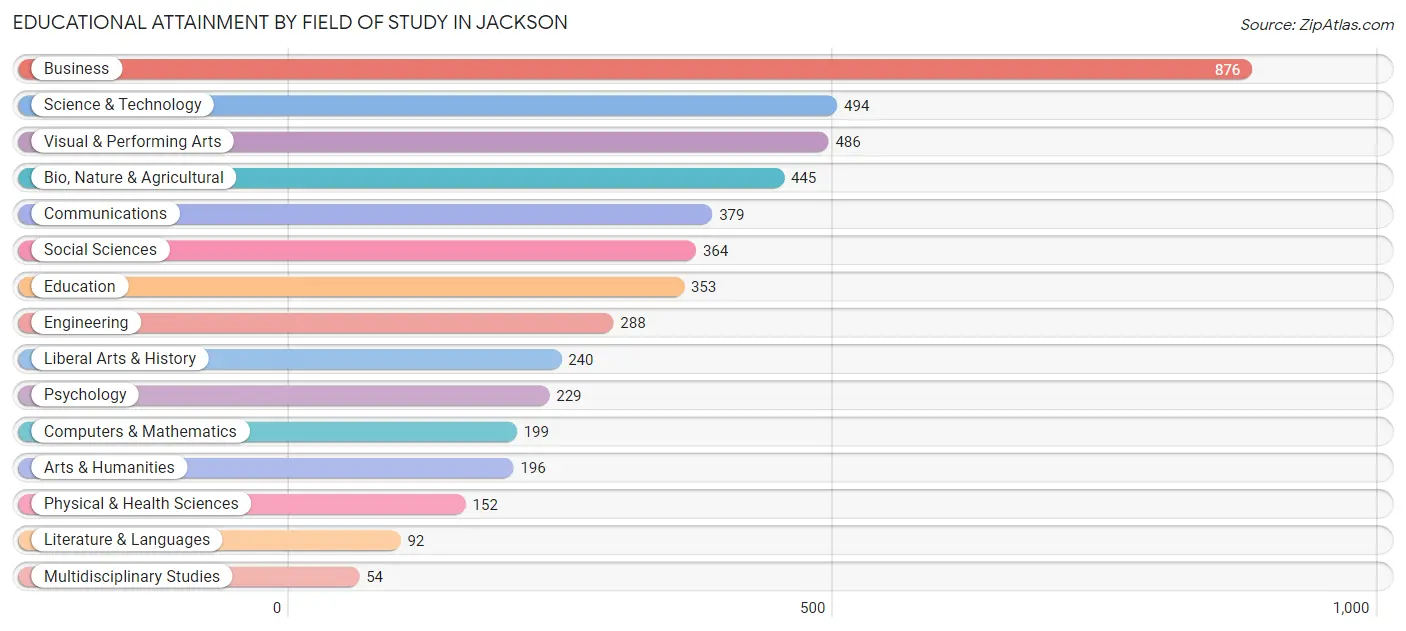
| Field of Study | # Graduates | % Graduates |
| Computers & Mathematics | 199 | 4.1% |
| Bio, Nature & Agricultural | 445 | 9.2% |
| Physical & Health Sciences | 152 | 3.1% |
| Psychology | 229 | 4.7% |
| Social Sciences | 364 | 7.5% |
| Engineering | 288 | 5.9% |
| Multidisciplinary Studies | 54 | 1.1% |
| Science & Technology | 494 | 10.2% |
| Business | 876 | 18.1% |
| Education | 353 | 7.3% |
| Literature & Languages | 92 | 1.9% |
| Liberal Arts & History | 240 | 5.0% |
| Visual & Performing Arts | 486 | 10.0% |
| Communications | 379 | 7.8% |
| Arts & Humanities | 196 | 4.0% |
| Total | 4,847 | 100.0% |
Transportation & Commute in Jackson
Vehicle Availability by Sex in Jackson
The most prevalent vehicle ownership categories in Jackson are males with 2 vehicles (1,890, accounting for 48.2%) and females with 2 vehicles (1,697, making up 54.8%).
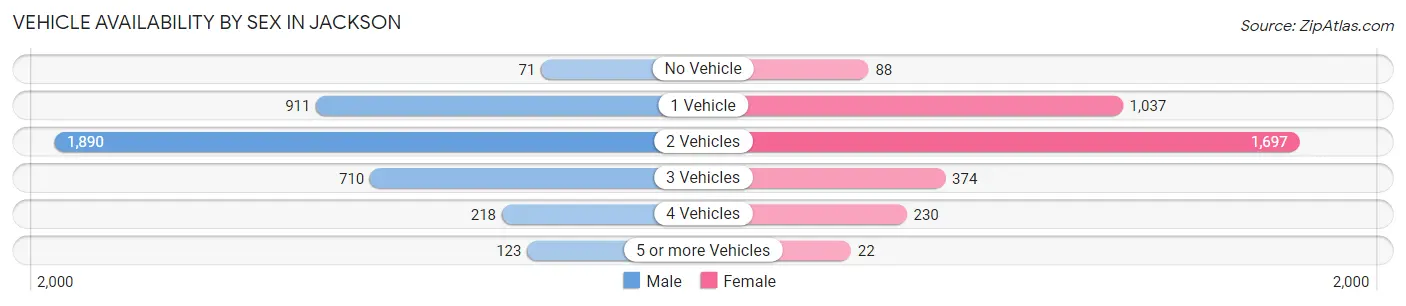
| Vehicles Available | Male | Female |
| No Vehicle | 71 (1.8%) | 88 (2.5%) |
| 1 Vehicle | 911 (23.2%) | 1,037 (30.1%) |
| 2 Vehicles | 1,890 (48.2%) | 1,697 (49.2%) |
| 3 Vehicles | 710 (18.1%) | 374 (10.8%) |
| 4 Vehicles | 218 (5.6%) | 230 (6.7%) |
| 5 or more Vehicles | 123 (3.1%) | 22 (0.6%) |
| Total | 3,923 (100.0%) | 3,448 (100.0%) |
Commute Time in Jackson
The most frequently occuring commute durations in Jackson are 5 to 9 minutes (1,791 commuters, 26.5%), 10 to 14 minutes (1,470 commuters, 21.8%), and 15 to 19 minutes (1,113 commuters, 16.5%).
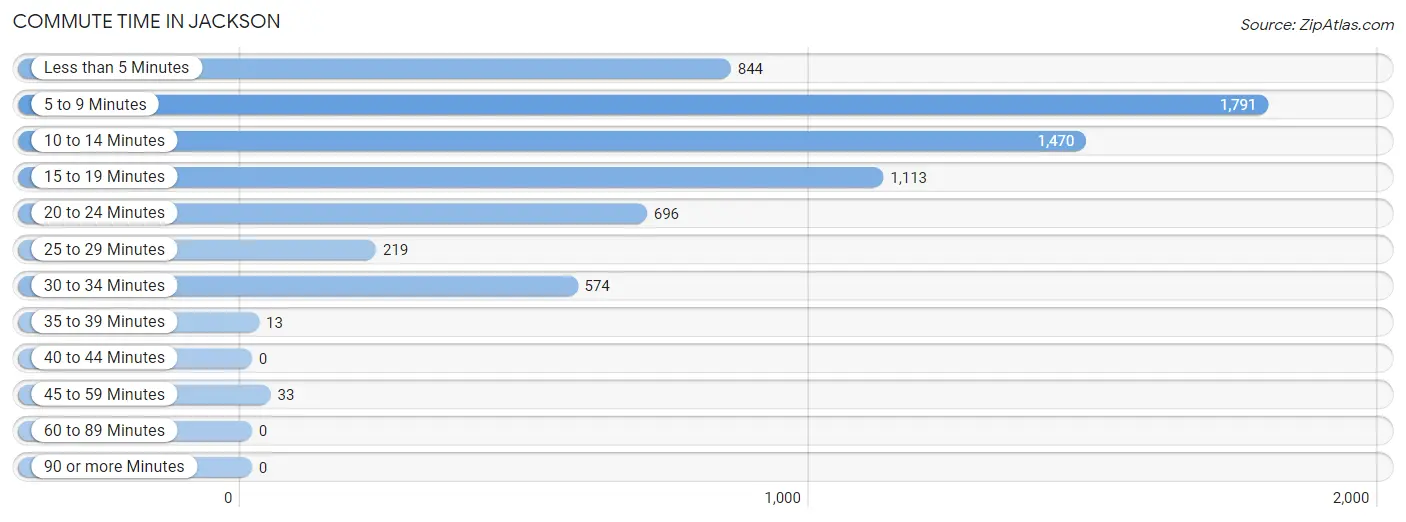
| Commute Time | # Commuters | % Commuters |
| Less than 5 Minutes | 844 | 12.5% |
| 5 to 9 Minutes | 1,791 | 26.5% |
| 10 to 14 Minutes | 1,470 | 21.8% |
| 15 to 19 Minutes | 1,113 | 16.5% |
| 20 to 24 Minutes | 696 | 10.3% |
| 25 to 29 Minutes | 219 | 3.2% |
| 30 to 34 Minutes | 574 | 8.5% |
| 35 to 39 Minutes | 13 | 0.2% |
| 40 to 44 Minutes | 0 | 0.0% |
| 45 to 59 Minutes | 33 | 0.5% |
| 60 to 89 Minutes | 0 | 0.0% |
| 90 or more Minutes | 0 | 0.0% |
Commute Time by Sex in Jackson
The most common commute times in Jackson are 5 to 9 minutes (934 commuters, 26.3%) for males and 5 to 9 minutes (857 commuters, 26.8%) for females.
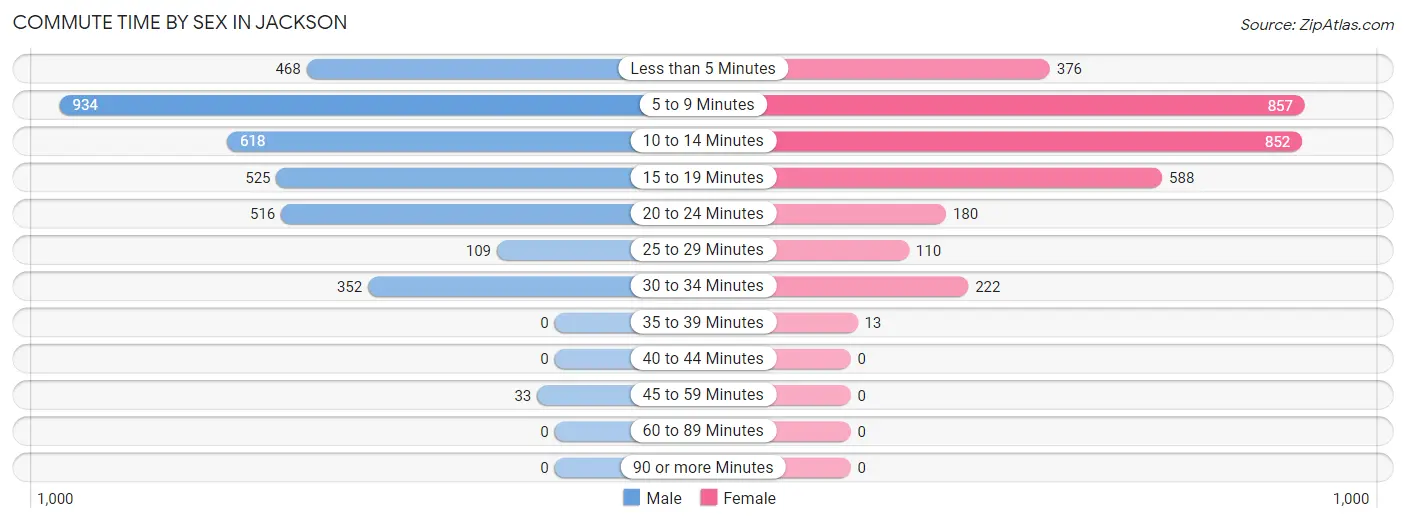
| Commute Time | Male | Female |
| Less than 5 Minutes | 468 (13.2%) | 376 (11.8%) |
| 5 to 9 Minutes | 934 (26.3%) | 857 (26.8%) |
| 10 to 14 Minutes | 618 (17.4%) | 852 (26.6%) |
| 15 to 19 Minutes | 525 (14.8%) | 588 (18.4%) |
| 20 to 24 Minutes | 516 (14.5%) | 180 (5.6%) |
| 25 to 29 Minutes | 109 (3.1%) | 110 (3.4%) |
| 30 to 34 Minutes | 352 (9.9%) | 222 (6.9%) |
| 35 to 39 Minutes | 0 (0.0%) | 13 (0.4%) |
| 40 to 44 Minutes | 0 (0.0%) | 0 (0.0%) |
| 45 to 59 Minutes | 33 (0.9%) | 0 (0.0%) |
| 60 to 89 Minutes | 0 (0.0%) | 0 (0.0%) |
| 90 or more Minutes | 0 (0.0%) | 0 (0.0%) |
Time of Departure to Work by Sex in Jackson
The most frequent times of departure to work in Jackson are 8:00 AM to 8:29 AM (871, 24.5%) for males and 9:00 AM to 9:59 AM (653, 20.4%) for females.
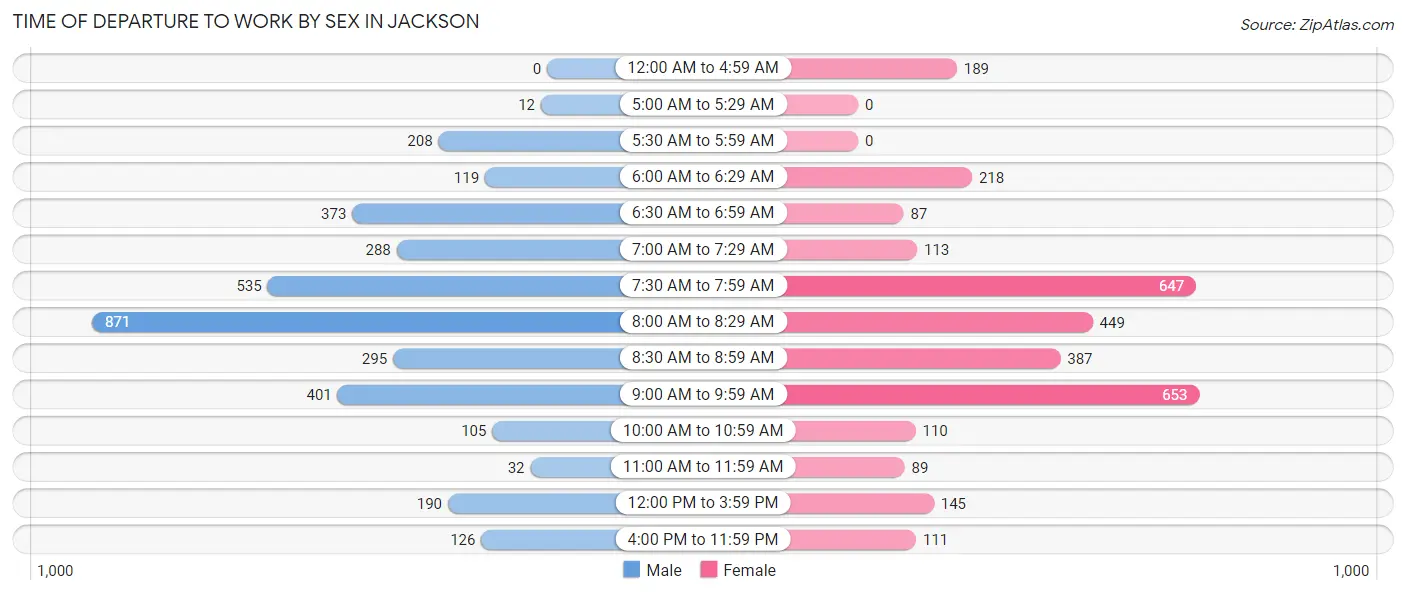
| Time of Departure | Male | Female |
| 12:00 AM to 4:59 AM | 0 (0.0%) | 189 (5.9%) |
| 5:00 AM to 5:29 AM | 12 (0.3%) | 0 (0.0%) |
| 5:30 AM to 5:59 AM | 208 (5.9%) | 0 (0.0%) |
| 6:00 AM to 6:29 AM | 119 (3.4%) | 218 (6.8%) |
| 6:30 AM to 6:59 AM | 373 (10.5%) | 87 (2.7%) |
| 7:00 AM to 7:29 AM | 288 (8.1%) | 113 (3.5%) |
| 7:30 AM to 7:59 AM | 535 (15.0%) | 647 (20.2%) |
| 8:00 AM to 8:29 AM | 871 (24.5%) | 449 (14.0%) |
| 8:30 AM to 8:59 AM | 295 (8.3%) | 387 (12.1%) |
| 9:00 AM to 9:59 AM | 401 (11.3%) | 653 (20.4%) |
| 10:00 AM to 10:59 AM | 105 (2.9%) | 110 (3.4%) |
| 11:00 AM to 11:59 AM | 32 (0.9%) | 89 (2.8%) |
| 12:00 PM to 3:59 PM | 190 (5.3%) | 145 (4.5%) |
| 4:00 PM to 11:59 PM | 126 (3.5%) | 111 (3.5%) |
| Total | 3,555 (100.0%) | 3,198 (100.0%) |
Housing Occupancy in Jackson
Occupancy by Ownership in Jackson
Of the total 4,352 dwellings in Jackson, owner-occupied units account for 2,040 (46.9%), while renter-occupied units make up 2,312 (53.1%).
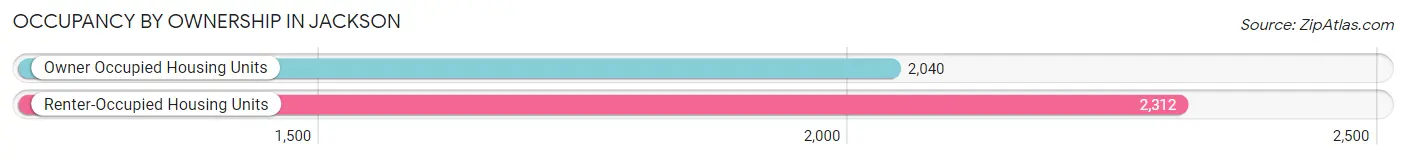
| Occupancy | # Housing Units | % Housing Units |
| Owner Occupied Housing Units | 2,040 | 46.9% |
| Renter-Occupied Housing Units | 2,312 | 53.1% |
| Total Occupied Housing Units | 4,352 | 100.0% |
Occupancy by Household Size in Jackson
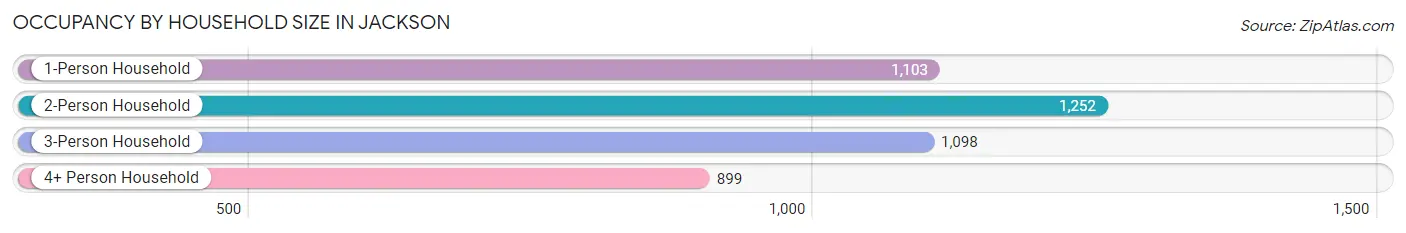
| Household Size | # Housing Units | % Housing Units |
| 1-Person Household | 1,103 | 25.3% |
| 2-Person Household | 1,252 | 28.8% |
| 3-Person Household | 1,098 | 25.2% |
| 4+ Person Household | 899 | 20.7% |
| Total Housing Units | 4,352 | 100.0% |
Occupancy by Ownership by Household Size in Jackson
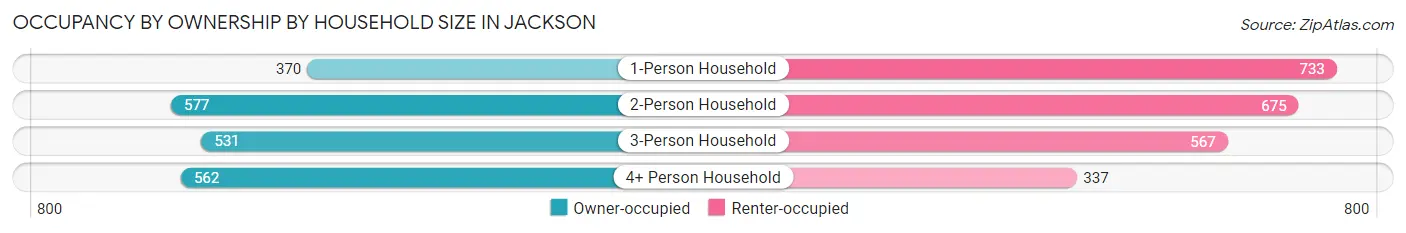
| Household Size | Owner-occupied | Renter-occupied |
| 1-Person Household | 370 (33.5%) | 733 (66.5%) |
| 2-Person Household | 577 (46.1%) | 675 (53.9%) |
| 3-Person Household | 531 (48.4%) | 567 (51.6%) |
| 4+ Person Household | 562 (62.5%) | 337 (37.5%) |
| Total Housing Units | 2,040 (46.9%) | 2,312 (53.1%) |
Occupancy by Educational Attainment in Jackson
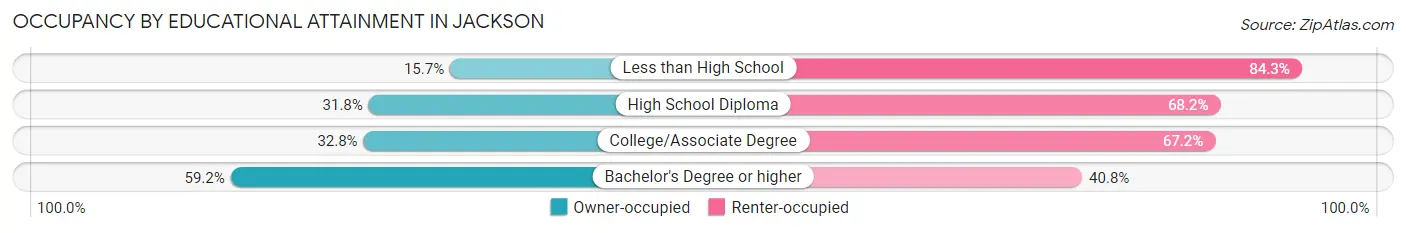
| Household Size | Owner-occupied | Renter-occupied |
| Less than High School | 31 (15.7%) | 167 (84.3%) |
| High School Diploma | 261 (31.8%) | 560 (68.2%) |
| College/Associate Degree | 279 (32.8%) | 571 (67.2%) |
| Bachelor's Degree or higher | 1,469 (59.2%) | 1,014 (40.8%) |
Occupancy by Age of Householder in Jackson
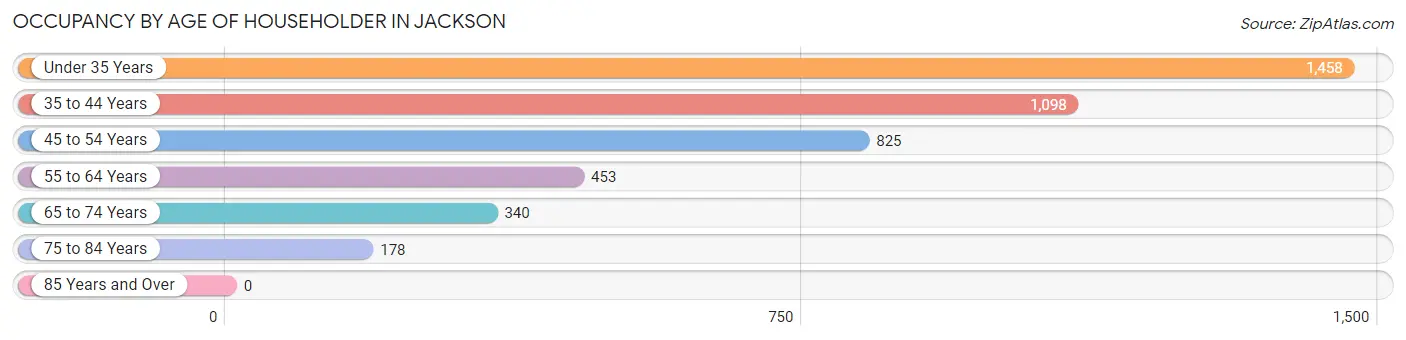
| Age Bracket | # Households | % Households |
| Under 35 Years | 1,458 | 33.5% |
| 35 to 44 Years | 1,098 | 25.2% |
| 45 to 54 Years | 825 | 19.0% |
| 55 to 64 Years | 453 | 10.4% |
| 65 to 74 Years | 340 | 7.8% |
| 75 to 84 Years | 178 | 4.1% |
| 85 Years and Over | 0 | 0.0% |
| Total | 4,352 | 100.0% |
Housing Finances in Jackson
Median Income by Occupancy in Jackson
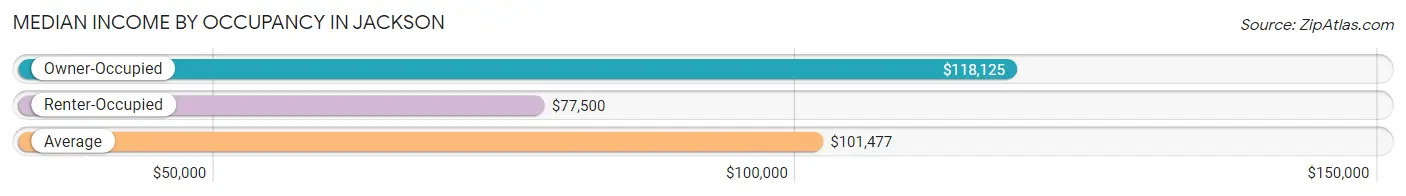
| Occupancy Type | # Households | Median Income |
| Owner-Occupied | 2,040 (46.9%) | $118,125 |
| Renter-Occupied | 2,312 (53.1%) | $77,500 |
| Average | 4,352 (100.0%) | $101,477 |
Occupancy by Householder Income Bracket in Jackson
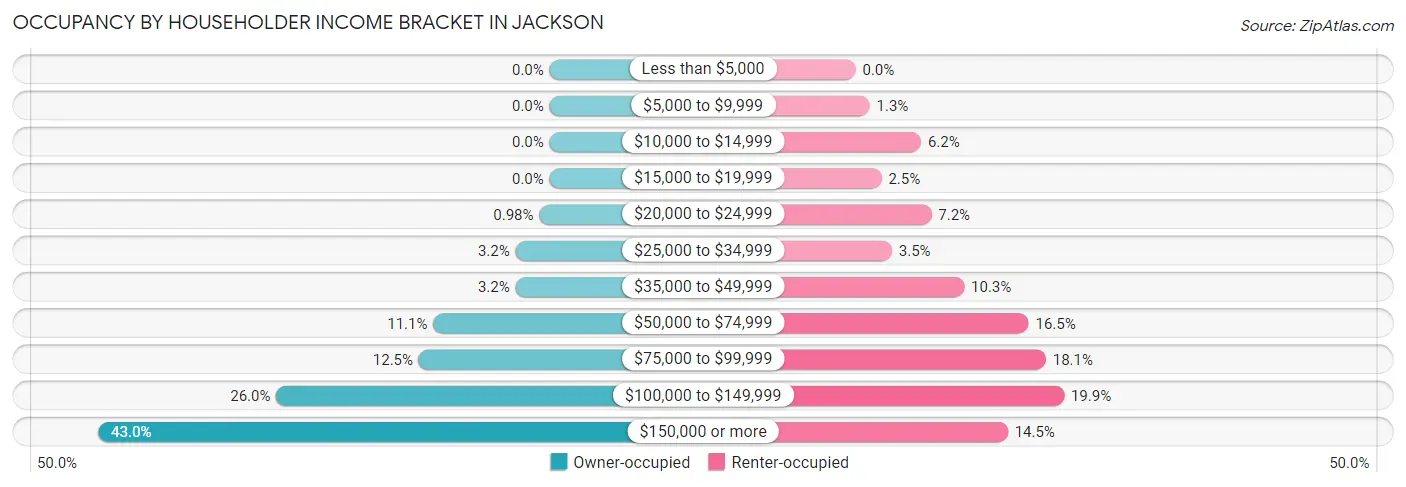
| Income Bracket | Owner-occupied | Renter-occupied |
| Less than $5,000 | 0 (0.0%) | 0 (0.0%) |
| $5,000 to $9,999 | 0 (0.0%) | 31 (1.3%) |
| $10,000 to $14,999 | 0 (0.0%) | 144 (6.2%) |
| $15,000 to $19,999 | 0 (0.0%) | 57 (2.5%) |
| $20,000 to $24,999 | 20 (1.0%) | 167 (7.2%) |
| $25,000 to $34,999 | 66 (3.2%) | 80 (3.5%) |
| $35,000 to $49,999 | 66 (3.2%) | 239 (10.3%) |
| $50,000 to $74,999 | 226 (11.1%) | 381 (16.5%) |
| $75,000 to $99,999 | 254 (12.4%) | 419 (18.1%) |
| $100,000 to $149,999 | 531 (26.0%) | 459 (19.9%) |
| $150,000 or more | 877 (43.0%) | 335 (14.5%) |
| Total | 2,040 (100.0%) | 2,312 (100.0%) |
Monthly Housing Cost Tiers in Jackson
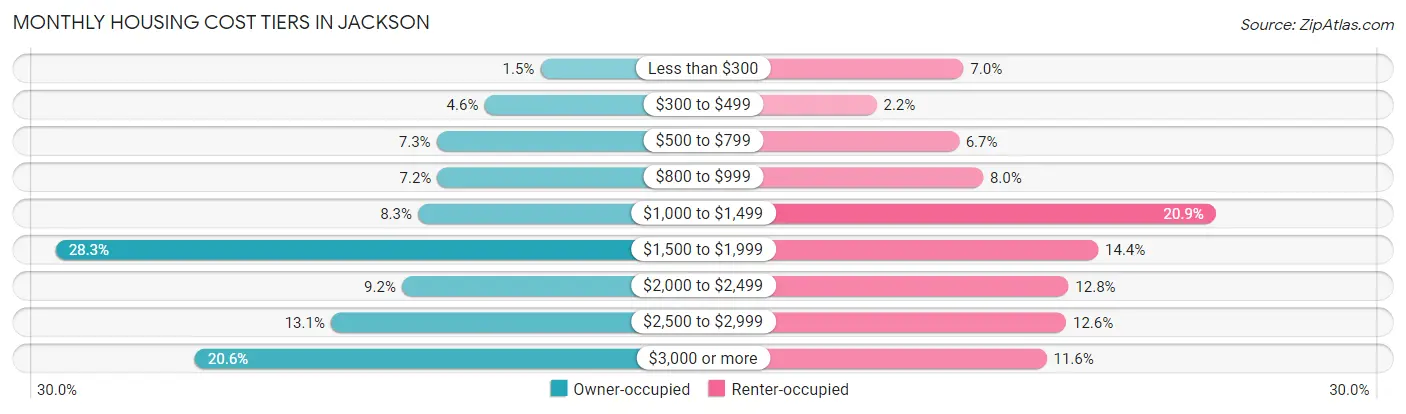
| Monthly Cost | Owner-occupied | Renter-occupied |
| Less than $300 | 31 (1.5%) | 161 (7.0%) |
| $300 to $499 | 94 (4.6%) | 50 (2.2%) |
| $500 to $799 | 148 (7.2%) | 155 (6.7%) |
| $800 to $999 | 147 (7.2%) | 186 (8.0%) |
| $1,000 to $1,499 | 169 (8.3%) | 483 (20.9%) |
| $1,500 to $1,999 | 577 (28.3%) | 333 (14.4%) |
| $2,000 to $2,499 | 187 (9.2%) | 295 (12.8%) |
| $2,500 to $2,999 | 267 (13.1%) | 292 (12.6%) |
| $3,000 or more | 420 (20.6%) | 267 (11.6%) |
| Total | 2,040 (100.0%) | 2,312 (100.0%) |
Physical Housing Characteristics in Jackson
Housing Structures in Jackson
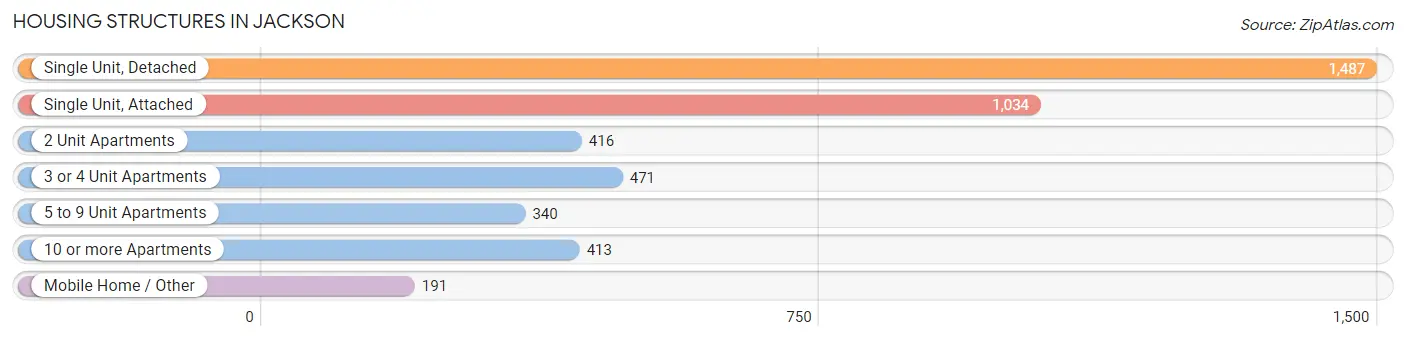
| Structure Type | # Housing Units | % Housing Units |
| Single Unit, Detached | 1,487 | 34.2% |
| Single Unit, Attached | 1,034 | 23.8% |
| 2 Unit Apartments | 416 | 9.6% |
| 3 or 4 Unit Apartments | 471 | 10.8% |
| 5 to 9 Unit Apartments | 340 | 7.8% |
| 10 or more Apartments | 413 | 9.5% |
| Mobile Home / Other | 191 | 4.4% |
| Total | 4,352 | 100.0% |
Housing Structures by Occupancy in Jackson
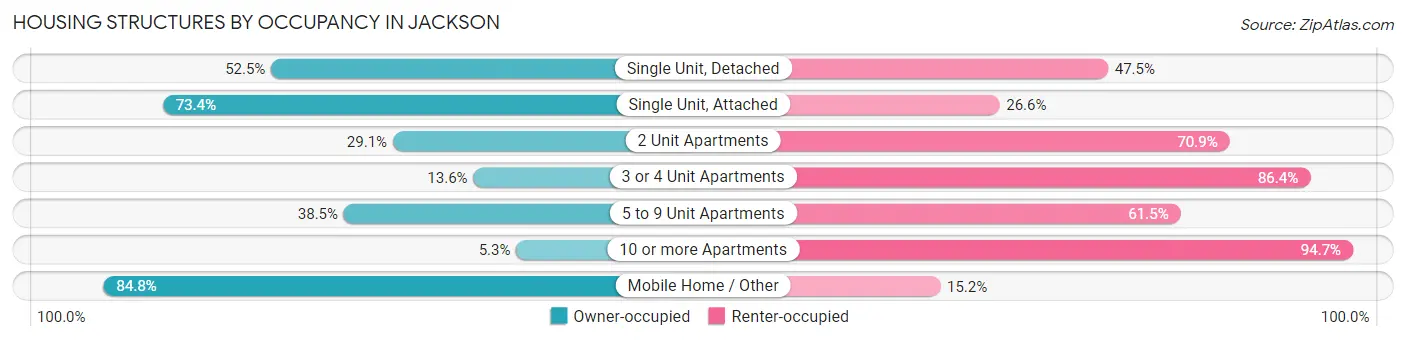
| Structure Type | Owner-occupied | Renter-occupied |
| Single Unit, Detached | 781 (52.5%) | 706 (47.5%) |
| Single Unit, Attached | 759 (73.4%) | 275 (26.6%) |
| 2 Unit Apartments | 121 (29.1%) | 295 (70.9%) |
| 3 or 4 Unit Apartments | 64 (13.6%) | 407 (86.4%) |
| 5 to 9 Unit Apartments | 131 (38.5%) | 209 (61.5%) |
| 10 or more Apartments | 22 (5.3%) | 391 (94.7%) |
| Mobile Home / Other | 162 (84.8%) | 29 (15.2%) |
| Total | 2,040 (46.9%) | 2,312 (53.1%) |
Housing Structures by Number of Rooms in Jackson
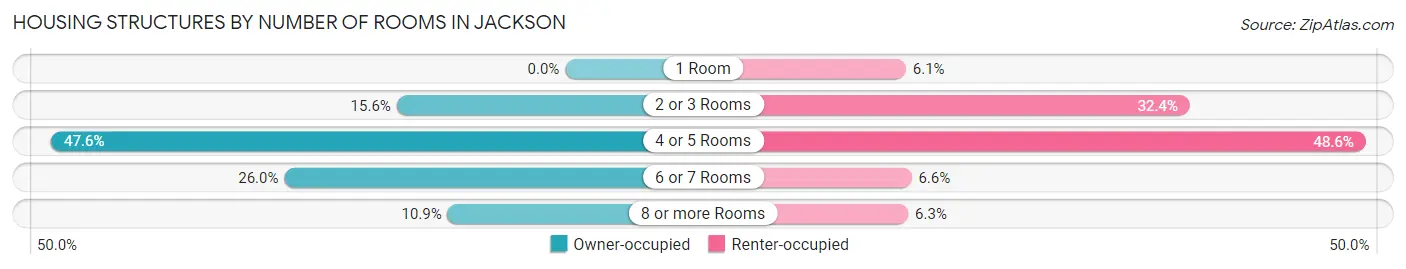
| Number of Rooms | Owner-occupied | Renter-occupied |
| 1 Room | 0 (0.0%) | 141 (6.1%) |
| 2 or 3 Rooms | 318 (15.6%) | 748 (32.4%) |
| 4 or 5 Rooms | 970 (47.5%) | 1,124 (48.6%) |
| 6 or 7 Rooms | 530 (26.0%) | 153 (6.6%) |
| 8 or more Rooms | 222 (10.9%) | 146 (6.3%) |
| Total | 2,040 (100.0%) | 2,312 (100.0%) |
Housing Structure by Heating Type in Jackson
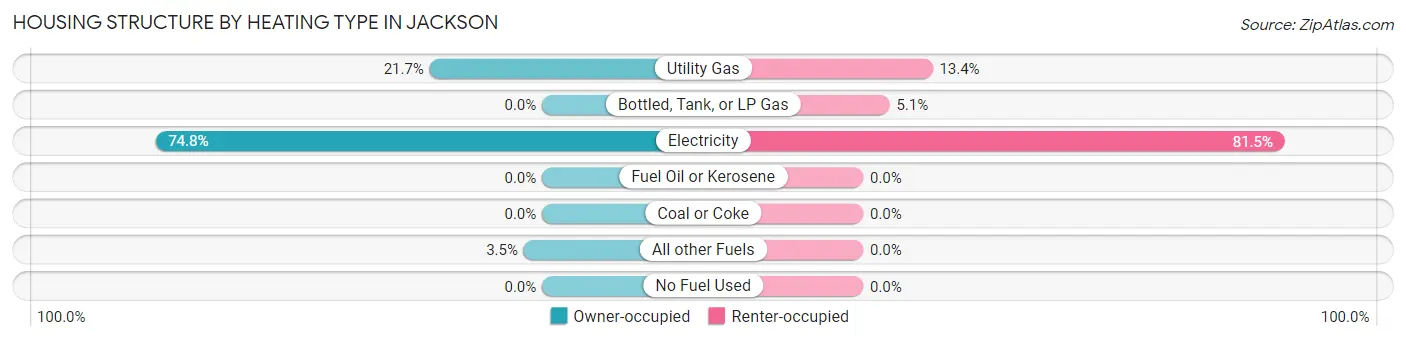
| Heating Type | Owner-occupied | Renter-occupied |
| Utility Gas | 443 (21.7%) | 310 (13.4%) |
| Bottled, Tank, or LP Gas | 0 (0.0%) | 118 (5.1%) |
| Electricity | 1,525 (74.8%) | 1,884 (81.5%) |
| Fuel Oil or Kerosene | 0 (0.0%) | 0 (0.0%) |
| Coal or Coke | 0 (0.0%) | 0 (0.0%) |
| All other Fuels | 72 (3.5%) | 0 (0.0%) |
| No Fuel Used | 0 (0.0%) | 0 (0.0%) |
| Total | 2,040 (100.0%) | 2,312 (100.0%) |
Household Vehicle Usage in Jackson
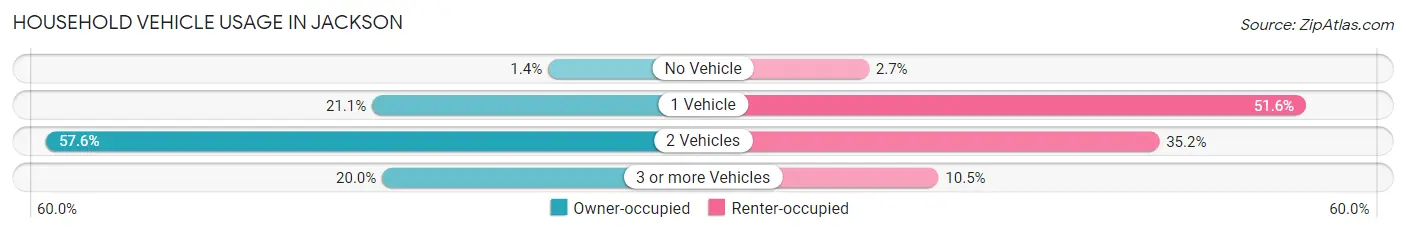
| Vehicles per Household | Owner-occupied | Renter-occupied |
| No Vehicle | 28 (1.4%) | 62 (2.7%) |
| 1 Vehicle | 430 (21.1%) | 1,194 (51.6%) |
| 2 Vehicles | 1,175 (57.6%) | 814 (35.2%) |
| 3 or more Vehicles | 407 (20.0%) | 242 (10.5%) |
| Total | 2,040 (100.0%) | 2,312 (100.0%) |
Real Estate & Mortgages in Jackson
Real Estate and Mortgage Overview in Jackson
| Characteristic | Without Mortgage | With Mortgage |
| Housing Units | 541 | 1,499 |
| Median Property Value | $919,900 | $921,200 |
| Median Household Income | $80,133 | $734 |
| Monthly Housing Costs | $793 | $420 |
| Real Estate Taxes | $4,449 | $67 |
Property Value by Mortgage Status in Jackson
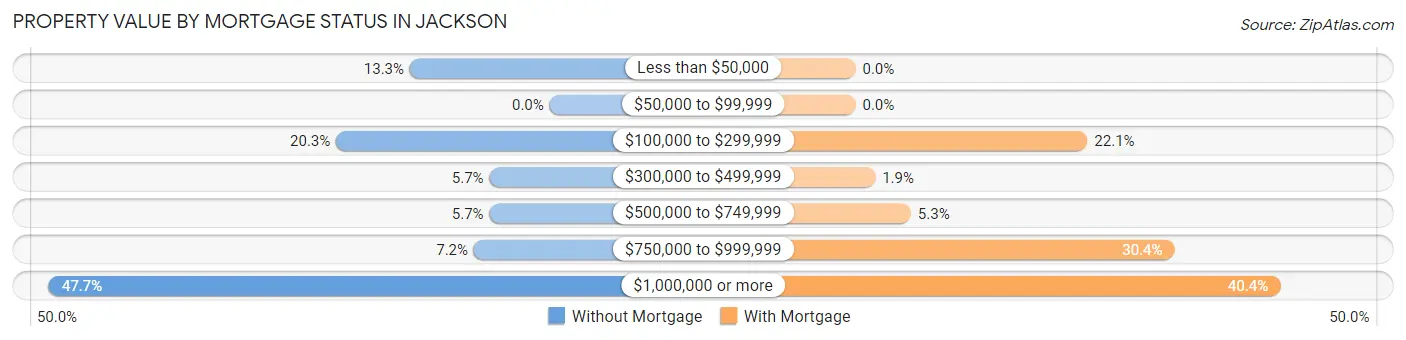
| Property Value | Without Mortgage | With Mortgage |
| Less than $50,000 | 72 (13.3%) | 0 (0.0%) |
| $50,000 to $99,999 | 0 (0.0%) | 0 (0.0%) |
| $100,000 to $299,999 | 110 (20.3%) | 331 (22.1%) |
| $300,000 to $499,999 | 31 (5.7%) | 28 (1.9%) |
| $500,000 to $749,999 | 31 (5.7%) | 79 (5.3%) |
| $750,000 to $999,999 | 39 (7.2%) | 455 (30.3%) |
| $1,000,000 or more | 258 (47.7%) | 606 (40.4%) |
| Total | 541 (100.0%) | 1,499 (100.0%) |
Household Income by Mortgage Status in Jackson
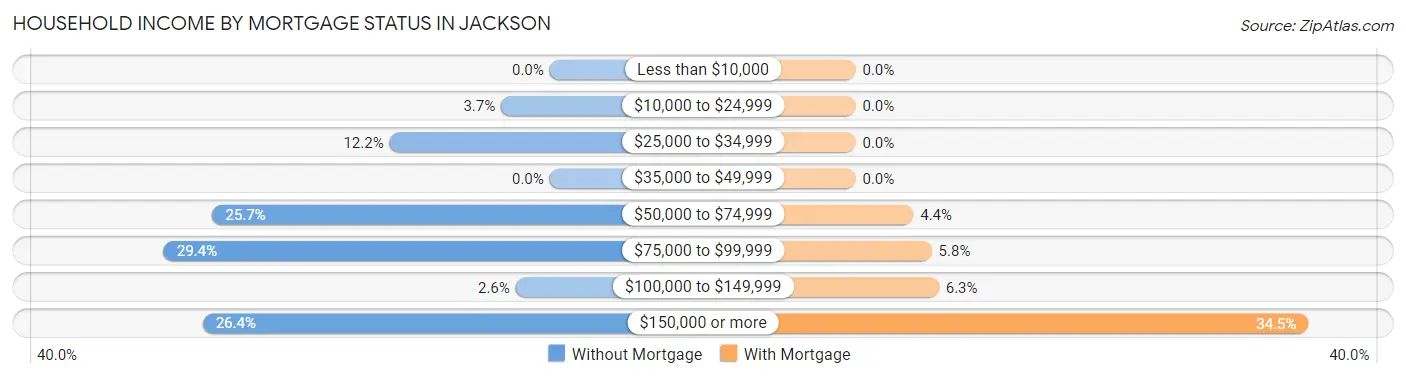
| Household Income | Without Mortgage | With Mortgage |
| Less than $10,000 | 0 (0.0%) | 0 (0.0%) |
| $10,000 to $24,999 | 20 (3.7%) | 0 (0.0%) |
| $25,000 to $34,999 | 66 (12.2%) | 0 (0.0%) |
| $35,000 to $49,999 | 0 (0.0%) | 0 (0.0%) |
| $50,000 to $74,999 | 139 (25.7%) | 66 (4.4%) |
| $75,000 to $99,999 | 159 (29.4%) | 87 (5.8%) |
| $100,000 to $149,999 | 14 (2.6%) | 95 (6.3%) |
| $150,000 or more | 143 (26.4%) | 517 (34.5%) |
| Total | 541 (100.0%) | 1,499 (100.0%) |
Property Value to Household Income Ratio in Jackson
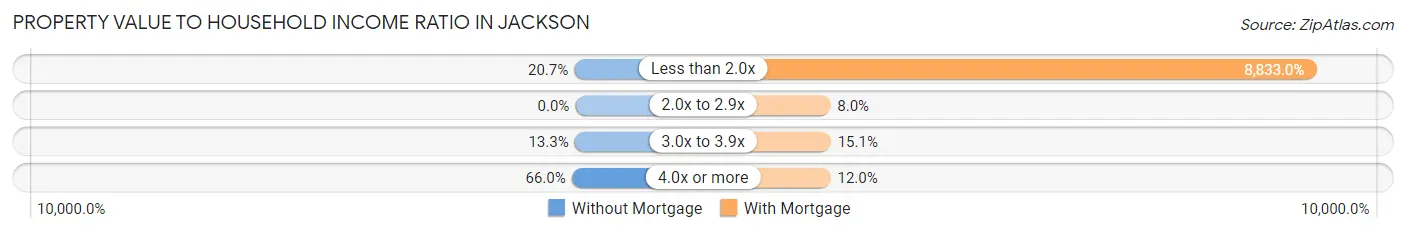
| Value-to-Income Ratio | Without Mortgage | With Mortgage |
| Less than 2.0x | 112 (20.7%) | 132,407 (8,833.0%) |
| 2.0x to 2.9x | 0 (0.0%) | 120 (8.0%) |
| 3.0x to 3.9x | 72 (13.3%) | 227 (15.1%) |
| 4.0x or more | 357 (66.0%) | 180 (12.0%) |
| Total | 541 (100.0%) | 1,499 (100.0%) |
Real Estate Taxes by Mortgage Status in Jackson
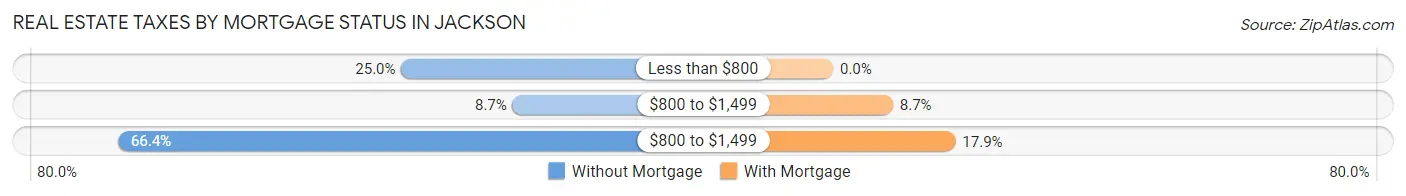
| Property Taxes | Without Mortgage | With Mortgage |
| Less than $800 | 135 (24.9%) | 0 (0.0%) |
| $800 to $1,499 | 47 (8.7%) | 131 (8.7%) |
| $800 to $1,499 | 359 (66.4%) | 268 (17.9%) |
| Total | 541 (100.0%) | 1,499 (100.0%) |
Health & Disability in Jackson
Health Insurance Coverage by Age in Jackson
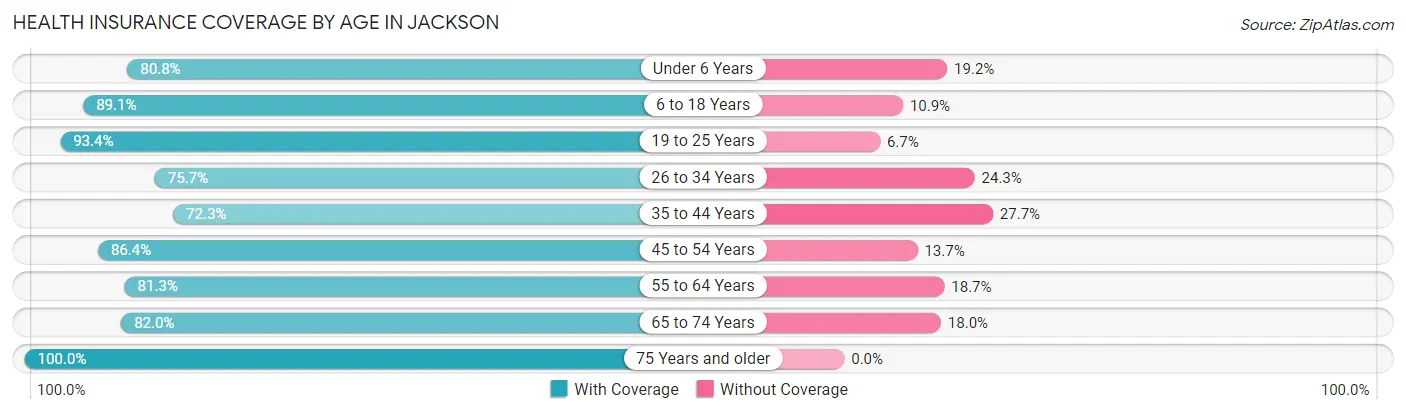
| Age Bracket | With Coverage | Without Coverage |
| Under 6 Years | 594 (80.8%) | 141 (19.2%) |
| 6 to 18 Years | 1,360 (89.1%) | 167 (10.9%) |
| 19 to 25 Years | 407 (93.3%) | 29 (6.7%) |
| 26 to 34 Years | 2,094 (75.7%) | 672 (24.3%) |
| 35 to 44 Years | 1,787 (72.3%) | 685 (27.7%) |
| 45 to 54 Years | 1,170 (86.4%) | 185 (13.7%) |
| 55 to 64 Years | 558 (81.3%) | 128 (18.7%) |
| 65 to 74 Years | 364 (82.0%) | 80 (18.0%) |
| 75 Years and older | 266 (100.0%) | 0 (0.0%) |
| Total | 8,600 (80.5%) | 2,087 (19.5%) |
Health Insurance Coverage by Citizenship Status in Jackson
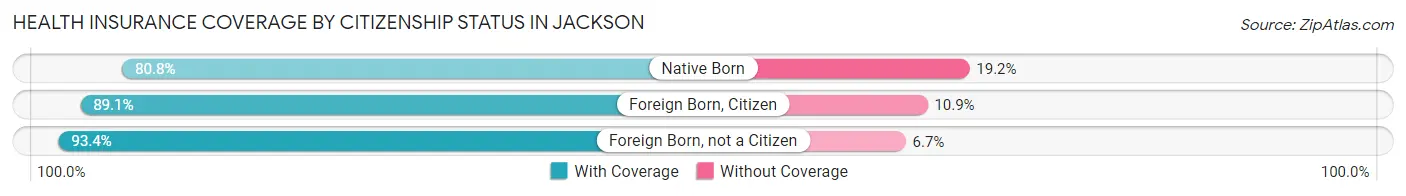
| Citizenship Status | With Coverage | Without Coverage |
| Native Born | 594 (80.8%) | 141 (19.2%) |
| Foreign Born, Citizen | 1,360 (89.1%) | 167 (10.9%) |
| Foreign Born, not a Citizen | 407 (93.3%) | 29 (6.7%) |
Health Insurance Coverage by Household Income in Jackson
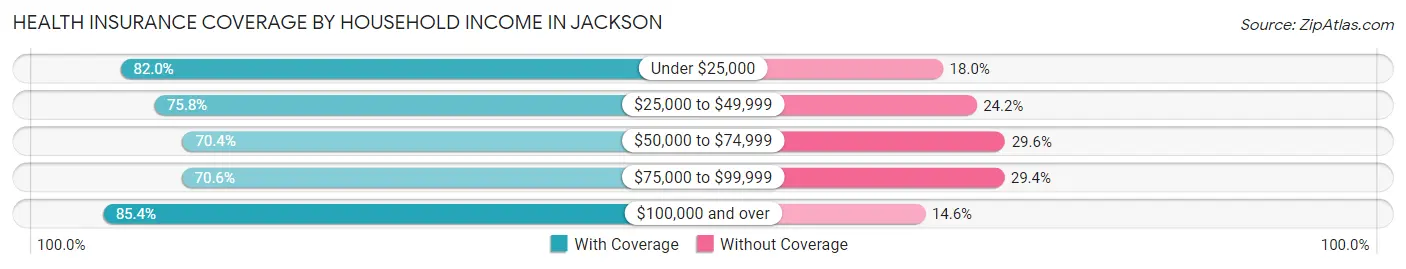
| Household Income | With Coverage | Without Coverage |
| Under $25,000 | 434 (82.0%) | 95 (18.0%) |
| $25,000 to $49,999 | 600 (75.8%) | 192 (24.2%) |
| $50,000 to $74,999 | 702 (70.4%) | 295 (29.6%) |
| $75,000 to $99,999 | 1,322 (70.6%) | 551 (29.4%) |
| $100,000 and over | 5,520 (85.4%) | 947 (14.6%) |
Public vs Private Health Insurance Coverage by Age in Jackson
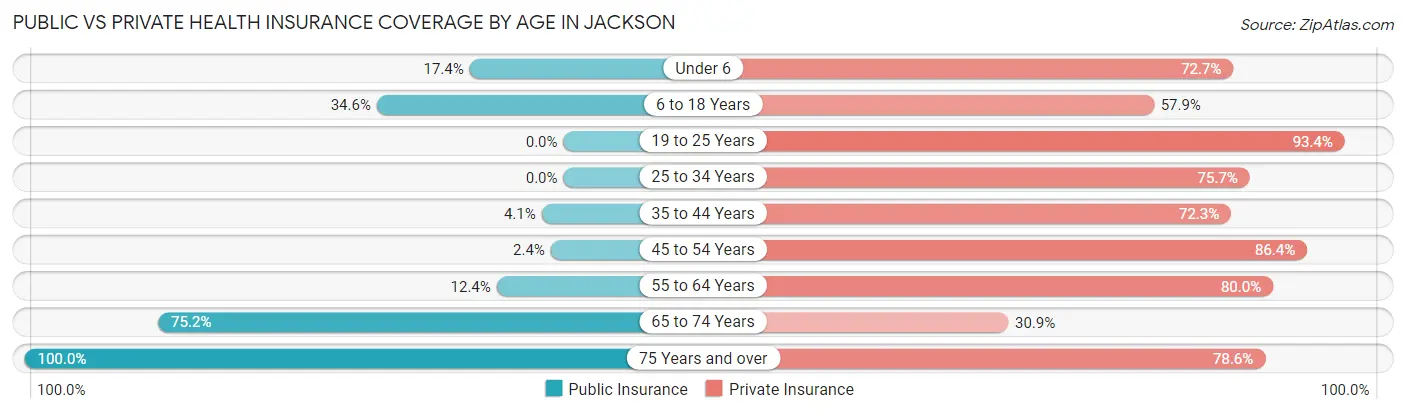
| Age Bracket | Public Insurance | Private Insurance |
| Under 6 | 128 (17.4%) | 534 (72.7%) |
| 6 to 18 Years | 529 (34.6%) | 884 (57.9%) |
| 19 to 25 Years | 0 (0.0%) | 407 (93.3%) |
| 25 to 34 Years | 0 (0.0%) | 2,094 (75.7%) |
| 35 to 44 Years | 100 (4.1%) | 1,786 (72.3%) |
| 45 to 54 Years | 32 (2.4%) | 1,170 (86.4%) |
| 55 to 64 Years | 85 (12.4%) | 549 (80.0%) |
| 65 to 74 Years | 334 (75.2%) | 137 (30.9%) |
| 75 Years and over | 266 (100.0%) | 209 (78.6%) |
| Total | 1,474 (13.8%) | 7,770 (72.7%) |
Disability Status by Sex by Age in Jackson
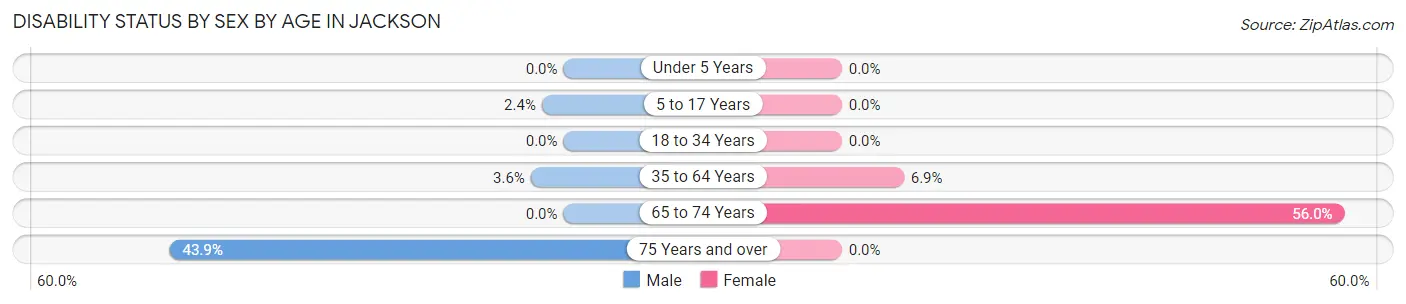
| Age Bracket | Male | Female |
| Under 5 Years | 0 (0.0%) | 0 (0.0%) |
| 5 to 17 Years | 19 (2.4%) | 0 (0.0%) |
| 18 to 34 Years | 0 (0.0%) | 0 (0.0%) |
| 35 to 64 Years | 90 (3.6%) | 141 (6.9%) |
| 65 to 74 Years | 0 (0.0%) | 150 (56.0%) |
| 75 Years and over | 57 (43.9%) | 0 (0.0%) |
Disability Class by Sex by Age in Jackson
Disability Class: Hearing Difficulty
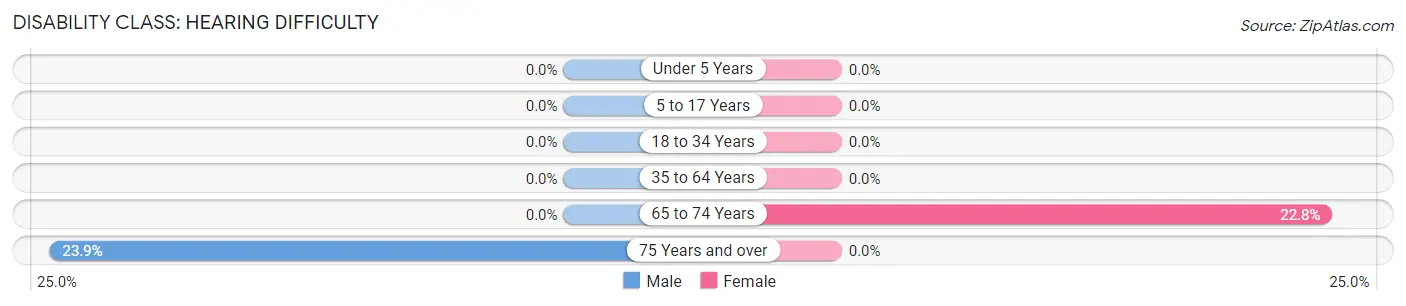
| Age Bracket | Male | Female |
| Under 5 Years | 0 (0.0%) | 0 (0.0%) |
| 5 to 17 Years | 0 (0.0%) | 0 (0.0%) |
| 18 to 34 Years | 0 (0.0%) | 0 (0.0%) |
| 35 to 64 Years | 0 (0.0%) | 0 (0.0%) |
| 65 to 74 Years | 0 (0.0%) | 61 (22.8%) |
| 75 Years and over | 31 (23.8%) | 0 (0.0%) |
Disability Class: Vision Difficulty
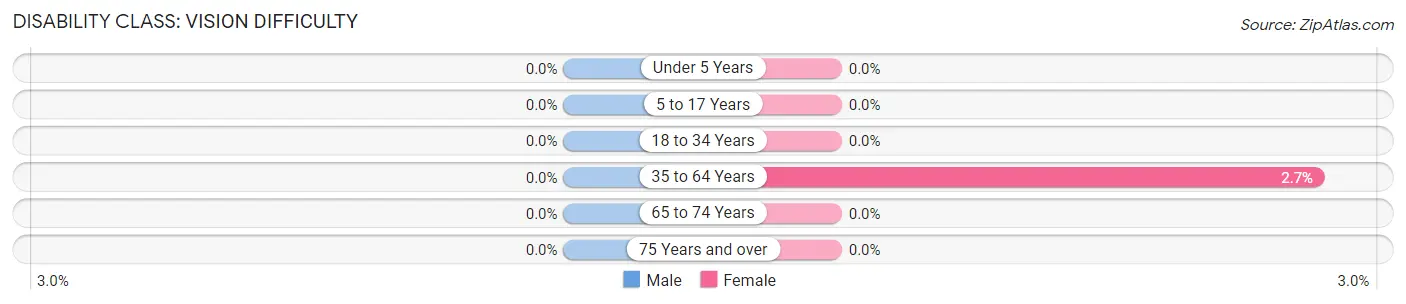
| Age Bracket | Male | Female |
| Under 5 Years | 0 (0.0%) | 0 (0.0%) |
| 5 to 17 Years | 0 (0.0%) | 0 (0.0%) |
| 18 to 34 Years | 0 (0.0%) | 0 (0.0%) |
| 35 to 64 Years | 0 (0.0%) | 55 (2.7%) |
| 65 to 74 Years | 0 (0.0%) | 0 (0.0%) |
| 75 Years and over | 0 (0.0%) | 0 (0.0%) |
Disability Class: Cognitive Difficulty
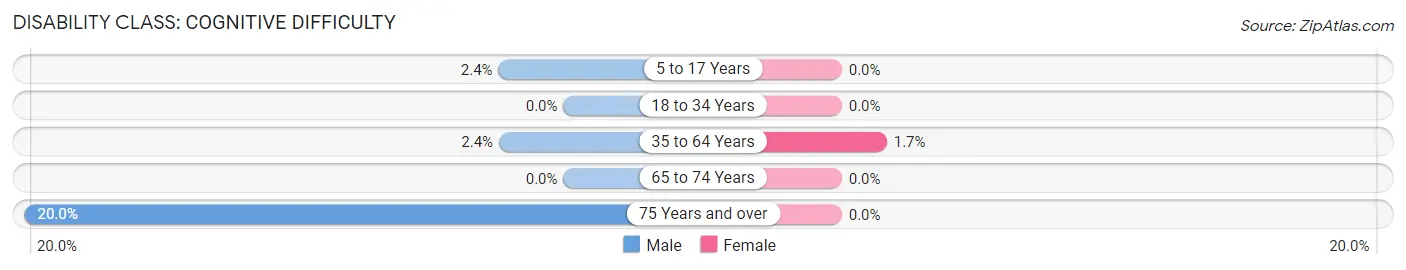
| Age Bracket | Male | Female |
| 5 to 17 Years | 19 (2.4%) | 0 (0.0%) |
| 18 to 34 Years | 0 (0.0%) | 0 (0.0%) |
| 35 to 64 Years | 59 (2.4%) | 34 (1.7%) |
| 65 to 74 Years | 0 (0.0%) | 0 (0.0%) |
| 75 Years and over | 26 (20.0%) | 0 (0.0%) |
Disability Class: Ambulatory Difficulty
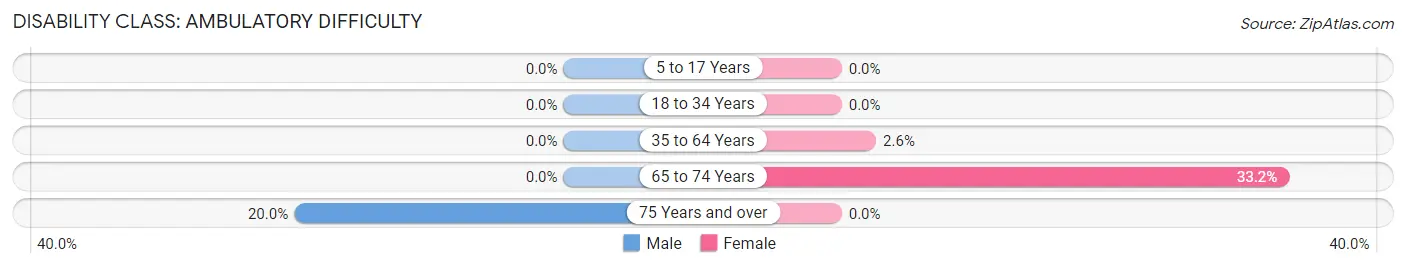
| Age Bracket | Male | Female |
| 5 to 17 Years | 0 (0.0%) | 0 (0.0%) |
| 18 to 34 Years | 0 (0.0%) | 0 (0.0%) |
| 35 to 64 Years | 0 (0.0%) | 52 (2.5%) |
| 65 to 74 Years | 0 (0.0%) | 89 (33.2%) |
| 75 Years and over | 26 (20.0%) | 0 (0.0%) |
Disability Class: Self-Care Difficulty
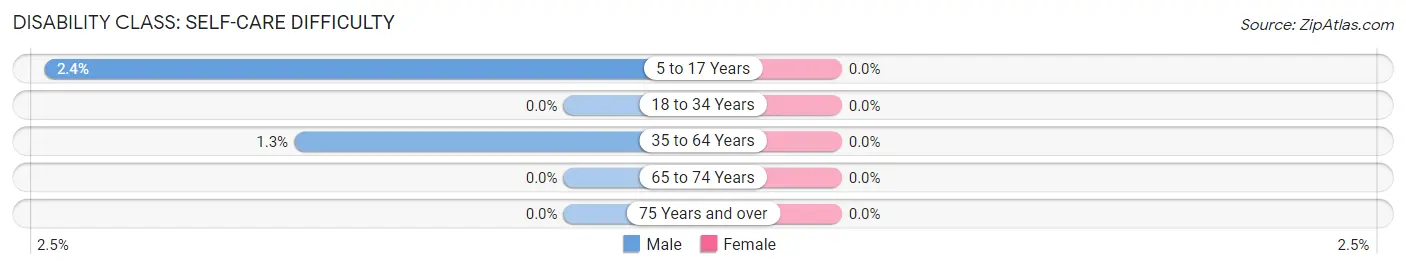
| Age Bracket | Male | Female |
| 5 to 17 Years | 19 (2.4%) | 0 (0.0%) |
| 18 to 34 Years | 0 (0.0%) | 0 (0.0%) |
| 35 to 64 Years | 31 (1.3%) | 0 (0.0%) |
| 65 to 74 Years | 0 (0.0%) | 0 (0.0%) |
| 75 Years and over | 0 (0.0%) | 0 (0.0%) |
Technology Access in Jackson
Computing Device Access in Jackson
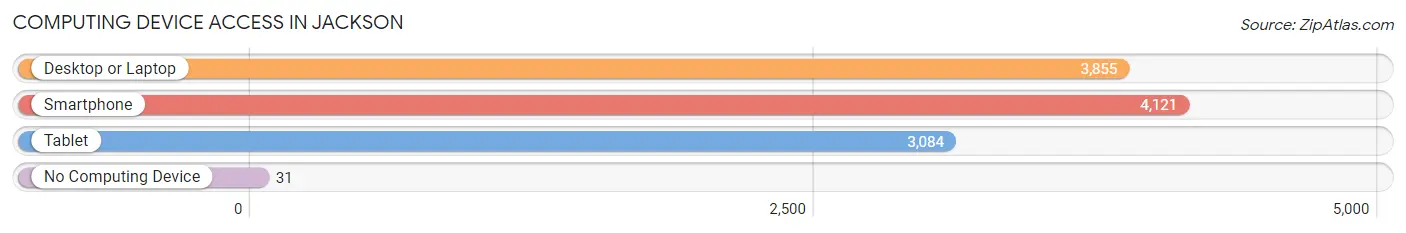
| Device Type | # Households | % Households |
| Desktop or Laptop | 3,855 | 88.6% |
| Smartphone | 4,121 | 94.7% |
| Tablet | 3,084 | 70.9% |
| No Computing Device | 31 | 0.7% |
| Total | 4,352 | 100.0% |
Internet Access in Jackson
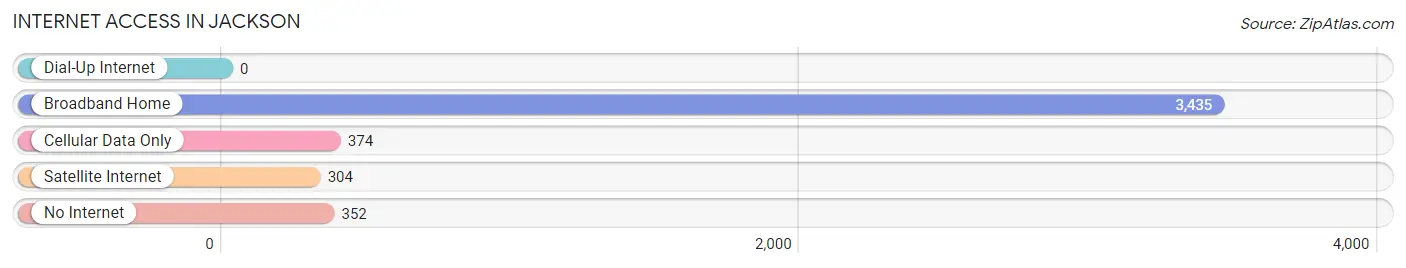
| Internet Type | # Households | % Households |
| Dial-Up Internet | 0 | 0.0% |
| Broadband Home | 3,435 | 78.9% |
| Cellular Data Only | 374 | 8.6% |
| Satellite Internet | 304 | 7.0% |
| No Internet | 352 | 8.1% |
| Total | 4,352 | 100.0% |
Jackson Summary
Jackson, Wyoming is a small town located in the western part of the United States, in the state of Wyoming. It is situated in the Jackson Hole valley, which is surrounded by the Teton Range of the Rocky Mountains. The town is the county seat of Teton County and is home to a population of approximately 10,000 people.
History
The area that is now Jackson was first inhabited by the Shoshone and Bannock Native American tribes. The first Europeans to explore the area were fur trappers and traders, who arrived in the early 1800s. The town of Jackson was founded in 1894 by a group of settlers led by David Jackson, who named the town after himself. The town quickly grew and became an important trading post for the surrounding area.
In the early 1900s, the town began to attract tourists, who were drawn to the area by its stunning scenery and abundant wildlife. The town was incorporated in 1914 and the first mayor was elected in 1915.
In the 1950s, the town began to experience a period of rapid growth, as more and more people moved to the area to take advantage of the area’s natural beauty and recreational opportunities. This growth continued into the 1970s and 1980s, and the town’s population has continued to grow since then.
Geography
Jackson is located in the Jackson Hole valley, which is surrounded by the Teton Range of the Rocky Mountains. The town is situated at an elevation of 6,237 feet (1,901 m) above sea level. The town is located approximately 50 miles (80 km) south of Yellowstone National Park and is close to Grand Teton National Park.
The town is located in a high mountain valley, which is characterized by its flat terrain and wide open spaces. The valley is surrounded by mountains on all sides, with the highest peak in the area being the Grand Teton, which stands at 13,770 feet (4,197 m).
The climate in Jackson is generally mild, with cold winters and warm summers. The average annual temperature is around 40°F (4°C). The area receives an average of around 20 inches (51 cm) of precipitation per year, with most of it falling in the form of snow.
Economy
The economy of Jackson is largely based on tourism, as the town is a popular destination for visitors from all over the world. The town is home to a number of resorts, hotels, restaurants, and other tourist-related businesses. The town is also home to a number of art galleries, museums, and other cultural attractions.
The town is also home to a number of businesses that provide goods and services to the local population. These include retail stores, restaurants, banks, and other businesses.
Demographics
As of the 2010 census, the population of Jackson was 8,647. The racial makeup of the town was 94.3% White, 0.7% African American, 0.3% Native American, 0.7% Asian, 0.1% Pacific Islander, 1.2% from other races, and 2.7% from two or more races. Hispanic or Latino of any race were 4.2% of the population.
The median household income in Jackson was $63,944, and the median family income was $77,813. The per capita income for the town was $37,845. About 8.2% of families and 11.3% of the population were below the poverty line, including 15.2% of those under age 18 and 4.2% of those age 65 or over.
Jackson is a small town with a unique history, geography, economy, and demographics. The town is a popular tourist destination, and its economy is largely based on tourism. The town is also home to a diverse population, with a variety of racial and ethnic backgrounds. The town is a great place to live and visit, and its unique characteristics make it a great place to call home.
Common Questions
What is Per Capita Income in Jackson?
Per Capita income in Jackson is $56,496.
What is the Median Family Income in Jackson?
Median Family Income in Jackson is $111,941.
What is the Median Household income in Jackson?
Median Household Income in Jackson is $101,477.
What is Income or Wage Gap in Jackson?
Income or Wage Gap in Jackson is 14.8%.
Women in Jackson earn 85.2 cents for every dollar earned by a man.
What is Inequality or Gini Index in Jackson?
Inequality or Gini Index in Jackson is 0.46.
What is the Total Population of Jackson?
Total Population of Jackson is 10,748.
What is the Total Male Population of Jackson?
Total Male Population of Jackson is 5,653.
What is the Total Female Population of Jackson?
Total Female Population of Jackson is 5,095.
What is the Ratio of Males per 100 Females in Jackson?
There are 110.95 Males per 100 Females in Jackson.
What is the Ratio of Females per 100 Males in Jackson?
There are 90.13 Females per 100 Males in Jackson.
What is the Median Population Age in Jackson?
Median Population Age in Jackson is 34.5 Years.
What is the Average Family Size in Jackson
Average Family Size in Jackson is 2.9 People.
What is the Average Household Size in Jackson
Average Household Size in Jackson is 2.5 People.
How Large is the Labor Force in Jackson?
There are 7,833 People in the Labor Forcein in Jackson.
What is the Percentage of People in the Labor Force in Jackson?
88.8% of People are in the Labor Force in Jackson.
What is the Unemployment Rate in Jackson?
Unemployment Rate in Jackson is 0.8%.