Thermopolis, WY Map & Demographics
Thermopolis Map
Thermopolis Overview
$34,307
PER CAPITA INCOME
$85,063
AVG FAMILY INCOME
$66,591
AVG HOUSEHOLD INCOME
16.9%
WAGE / INCOME GAP [ % ]
83.1¢/ $1
WAGE / INCOME GAP [ $ ]
0.37
INEQUALITY / GINI INDEX
2,722
TOTAL POPULATION
1,355
MALE POPULATION
1,367
FEMALE POPULATION
99.12
MALES / 100 FEMALES
100.89
FEMALES / 100 MALES
46.0
MEDIAN AGE
2.5
AVG FAMILY SIZE
2.0
AVG HOUSEHOLD SIZE
1,272
LABOR FORCE [ PEOPLE ]
57.0%
PERCENT IN LABOR FORCE
0.9%
UNEMPLOYMENT RATE
Thermopolis Zip Codes
Thermopolis Area Codes
Income in Thermopolis
Income Overview in Thermopolis
Per Capita Income in Thermopolis is $34,307, while median incomes of families and households are $85,063 and $66,591 respectively.
| Characteristic | Number | Measure |
| Per Capita Income | 2,722 | $34,307 |
| Median Family Income | 800 | $85,063 |
| Mean Family Income | 800 | $84,908 |
| Median Household Income | 1,286 | $66,591 |
| Mean Household Income | 1,286 | $73,035 |
| Income Deficit | 800 | $0 |
| Wage / Income Gap (%) | 2,722 | 16.85% |
| Wage / Income Gap ($) | 2,722 | 83.15¢ per $1 |
| Gini / Inequality Index | 2,722 | 0.37 |
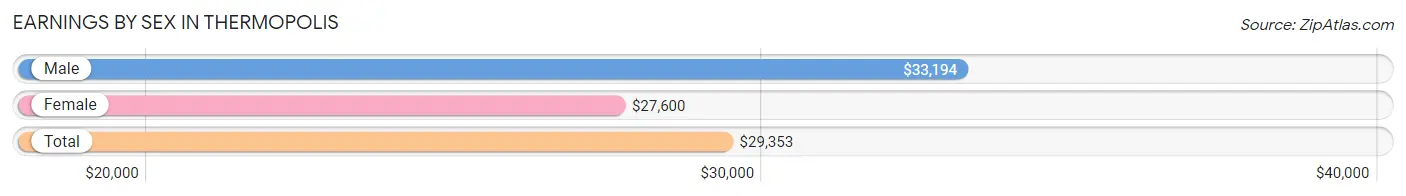
Earnings by Sex in Thermopolis
Average Earnings in Thermopolis are $29,353, $33,194 for men and $27,600 for women, a difference of 16.9%.
| Sex | Number | Average Earnings |
| Male | 753 (54.0%) | $33,194 |
| Female | 642 (46.0%) | $27,600 |
| Total | 1,395 (100.0%) | $29,353 |
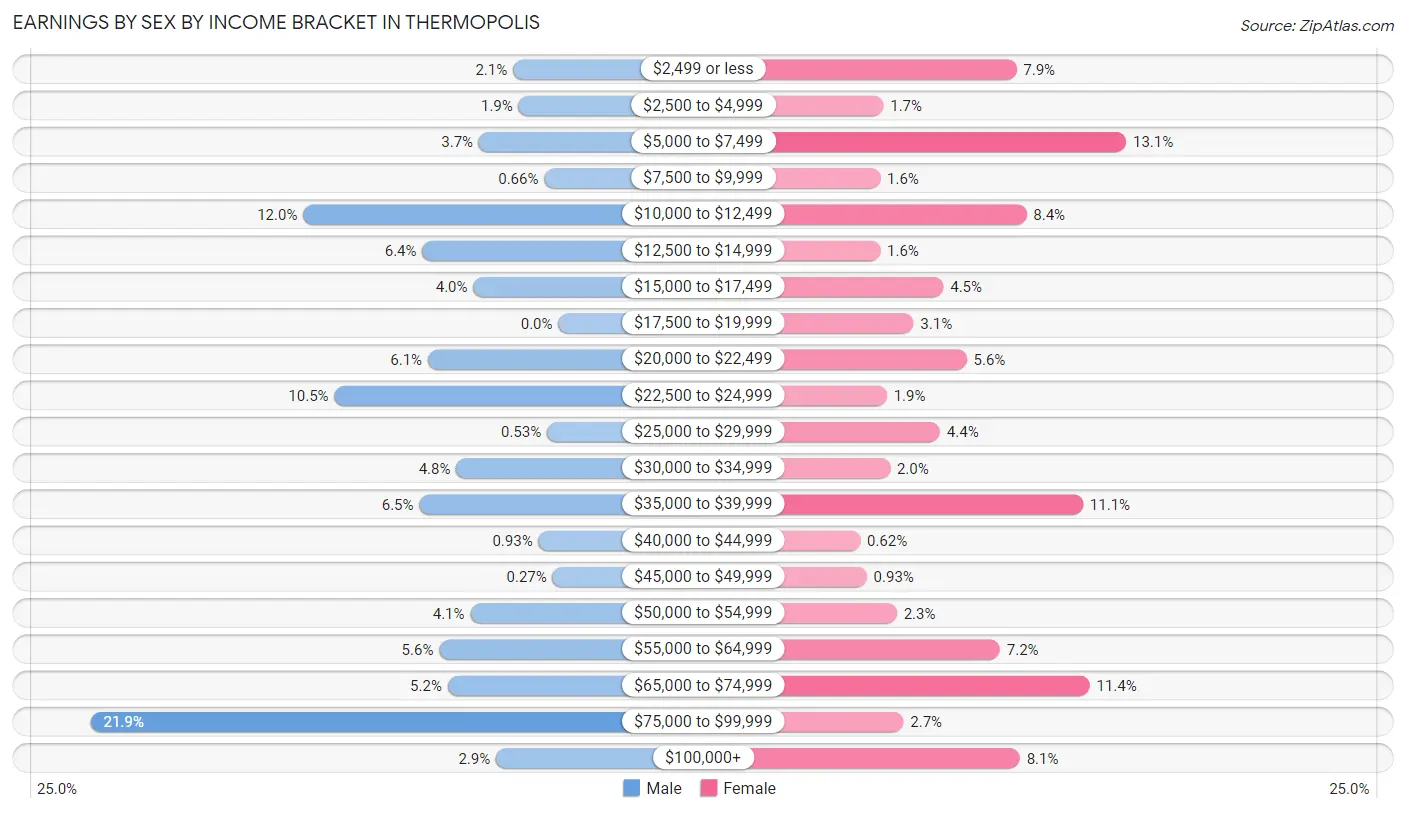
Earnings by Sex by Income Bracket in Thermopolis
The most common earnings brackets in Thermopolis are $75,000 to $99,999 for men (165 | 21.9%) and $5,000 to $7,499 for women (84 | 13.1%).
| Income | Male | Female |
| $2,499 or less | 16 (2.1%) | 51 (7.9%) |
| $2,500 to $4,999 | 14 (1.9%) | 11 (1.7%) |
| $5,000 to $7,499 | 28 (3.7%) | 84 (13.1%) |
| $7,500 to $9,999 | 5 (0.7%) | 10 (1.6%) |
| $10,000 to $12,499 | 90 (11.9%) | 54 (8.4%) |
| $12,500 to $14,999 | 48 (6.4%) | 10 (1.6%) |
| $15,000 to $17,499 | 30 (4.0%) | 29 (4.5%) |
| $17,500 to $19,999 | 0 (0.0%) | 20 (3.1%) |
| $20,000 to $22,499 | 46 (6.1%) | 36 (5.6%) |
| $22,500 to $24,999 | 79 (10.5%) | 12 (1.9%) |
| $25,000 to $29,999 | 4 (0.5%) | 28 (4.4%) |
| $30,000 to $34,999 | 36 (4.8%) | 13 (2.0%) |
| $35,000 to $39,999 | 49 (6.5%) | 71 (11.1%) |
| $40,000 to $44,999 | 7 (0.9%) | 4 (0.6%) |
| $45,000 to $49,999 | 2 (0.3%) | 6 (0.9%) |
| $50,000 to $54,999 | 31 (4.1%) | 15 (2.3%) |
| $55,000 to $64,999 | 42 (5.6%) | 46 (7.2%) |
| $65,000 to $74,999 | 39 (5.2%) | 73 (11.4%) |
| $75,000 to $99,999 | 165 (21.9%) | 17 (2.6%) |
| $100,000+ | 22 (2.9%) | 52 (8.1%) |
| Total | 753 (100.0%) | 642 (100.0%) |
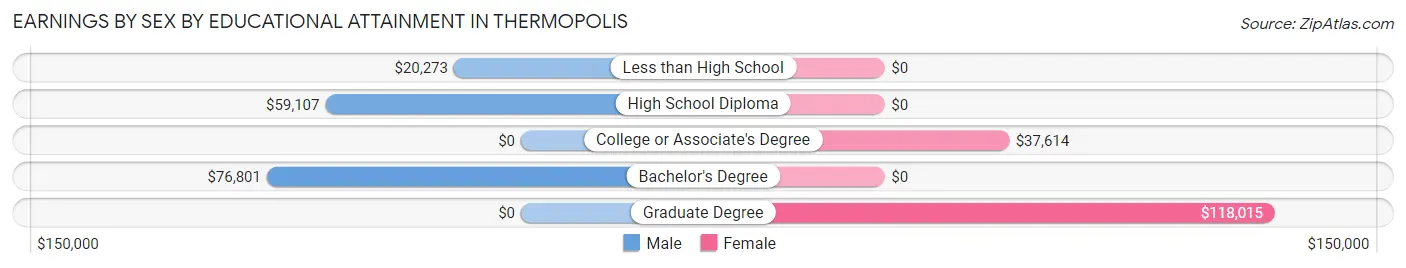
Earnings by Sex by Educational Attainment in Thermopolis
Average earnings in Thermopolis are $38,495 for men and $31,771 for women, a difference of 17.5%. Men with an educational attainment of bachelor's degree enjoy the highest average annual earnings of $76,801, while those with less than high school education earn the least with $20,273. Women with an educational attainment of graduate degree earn the most with the average annual earnings of $118,015, while those with college or associate's degree education have the smallest earnings of $37,614.
| Educational Attainment | Male Income | Female Income |
| Less than High School | $20,273 | $0 |
| High School Diploma | $59,107 | $0 |
| College or Associate's Degree | - | - |
| Bachelor's Degree | $76,801 | $0 |
| Graduate Degree | - | - |
| Total | $38,495 | $31,771 |
Family Income in Thermopolis
Family Income Brackets in Thermopolis
According to the Thermopolis family income data, there are 178 families falling into the $75,000 to $99,999 income range, which is the most common income bracket and makes up 22.3% of all families.
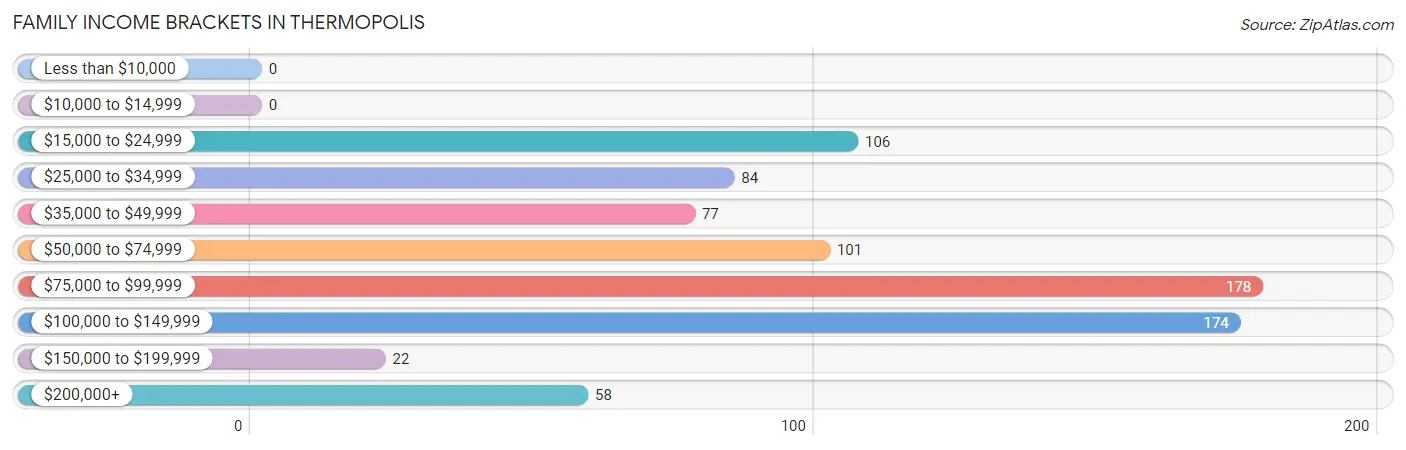
| Income Bracket | # Families | % Families |
| Less than $10,000 | 0 | 0.0% |
| $10,000 to $14,999 | 0 | 0.0% |
| $15,000 to $24,999 | 106 | 13.3% |
| $25,000 to $34,999 | 84 | 10.5% |
| $35,000 to $49,999 | 77 | 9.6% |
| $50,000 to $74,999 | 101 | 12.6% |
| $75,000 to $99,999 | 178 | 22.3% |
| $100,000 to $149,999 | 174 | 21.8% |
| $150,000 to $199,999 | 22 | 2.8% |
| $200,000+ | 58 | 7.3% |
Family Income by Famaliy Size in Thermopolis
2-person families (586 | 73.3%) account for the highest median family income in Thermopolis with $85,875 per family, while 2-person families (586 | 73.3%) have the highest median income of $42,938 per family member.
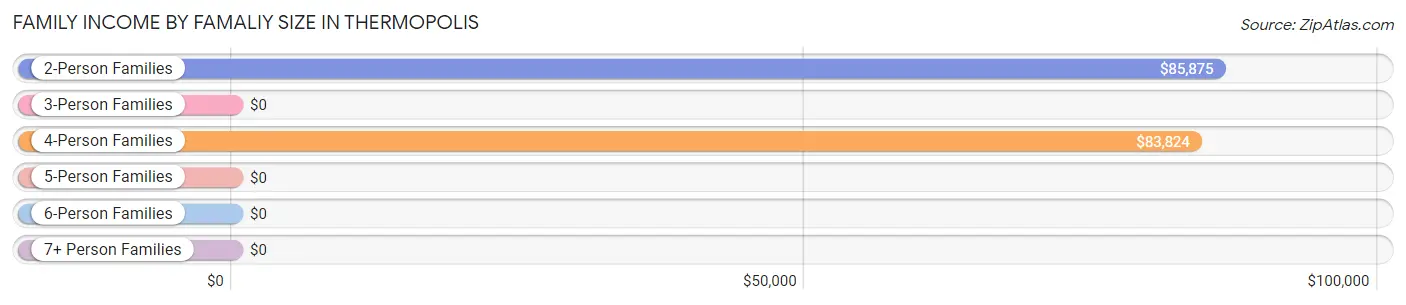
| Income Bracket | # Families | Median Income |
| 2-Person Families | 586 (73.3%) | $85,875 |
| 3-Person Families | 15 (1.9%) | $0 |
| 4-Person Families | 82 (10.2%) | $83,824 |
| 5-Person Families | 117 (14.6%) | $0 |
| 6-Person Families | 0 (0.0%) | $0 |
| 7+ Person Families | 0 (0.0%) | $0 |
| Total | 800 (100.0%) | $85,063 |
Family Income by Number of Earners in Thermopolis
The median family income in Thermopolis is $85,063, with families comprising 3+ earners (58) having the highest median family income of $114,107, while families with no earners (116) have the lowest median family income of $55,962, accounting for 7.2% and 14.5% of families, respectively.
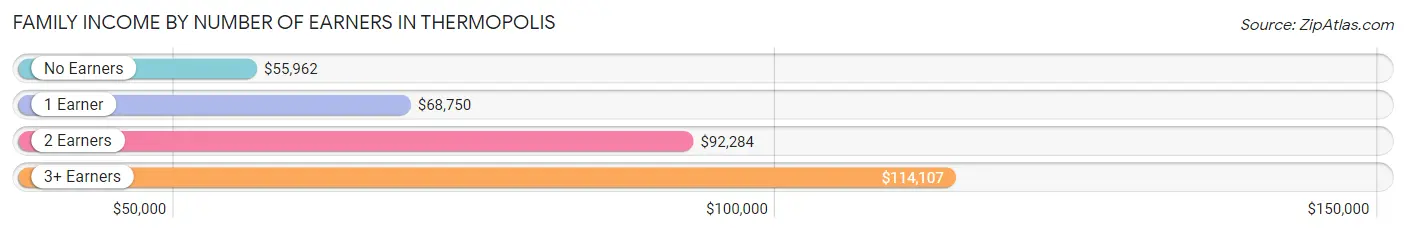
| Number of Earners | # Families | Median Income |
| No Earners | 116 (14.5%) | $55,962 |
| 1 Earner | 411 (51.4%) | $68,750 |
| 2 Earners | 215 (26.9%) | $92,284 |
| 3+ Earners | 58 (7.2%) | $114,107 |
| Total | 800 (100.0%) | $85,063 |
Household Income in Thermopolis
Household Income Brackets in Thermopolis
With 322 households falling in the category, the $75,000 to $99,999 income range is the most frequent in Thermopolis, accounting for 25.0% of all households. In contrast, only 27 households (2.1%) fall into the less than $10,000 income bracket, making it the least populous group.
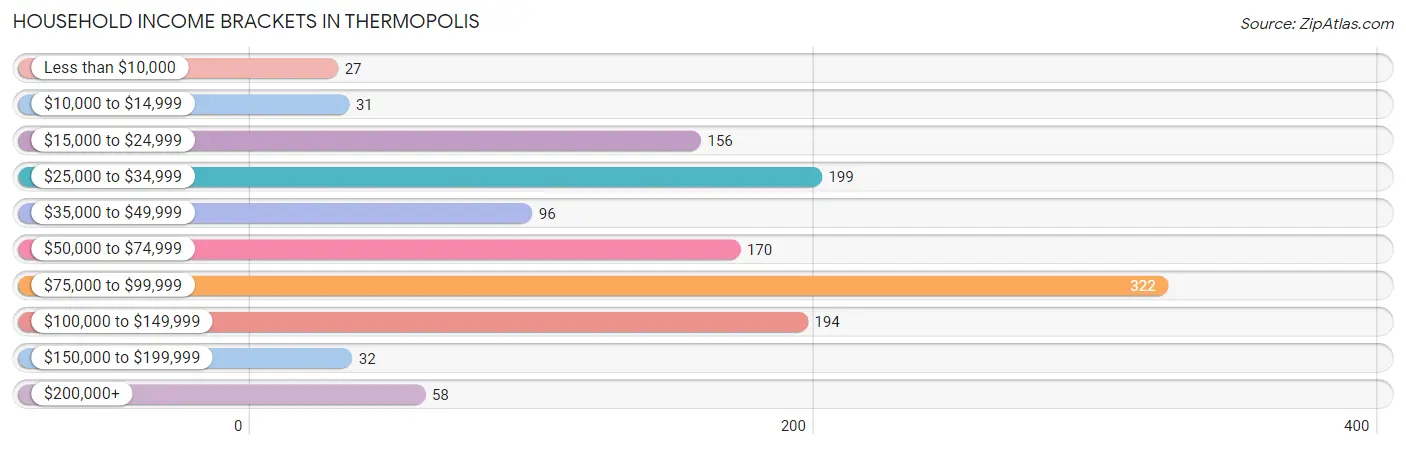
| Income Bracket | # Households | % Households |
| Less than $10,000 | 27 | 2.1% |
| $10,000 to $14,999 | 31 | 2.4% |
| $15,000 to $24,999 | 156 | 12.1% |
| $25,000 to $34,999 | 199 | 15.5% |
| $35,000 to $49,999 | 96 | 7.5% |
| $50,000 to $74,999 | 170 | 13.2% |
| $75,000 to $99,999 | 322 | 25.0% |
| $100,000 to $149,999 | 194 | 15.1% |
| $150,000 to $199,999 | 32 | 2.5% |
| $200,000+ | 58 | 4.5% |
Household Income by Householder Age in Thermopolis
The median household income in Thermopolis is $66,591, with the highest median household income of $80,762 found in the 45 to 64 years age bracket for the primary householder. A total of 424 households (33.0%) fall into this category. Meanwhile, the 15 to 24 years age bracket for the primary householder has the lowest median household income of $0, with 112 households (8.7%) in this group.
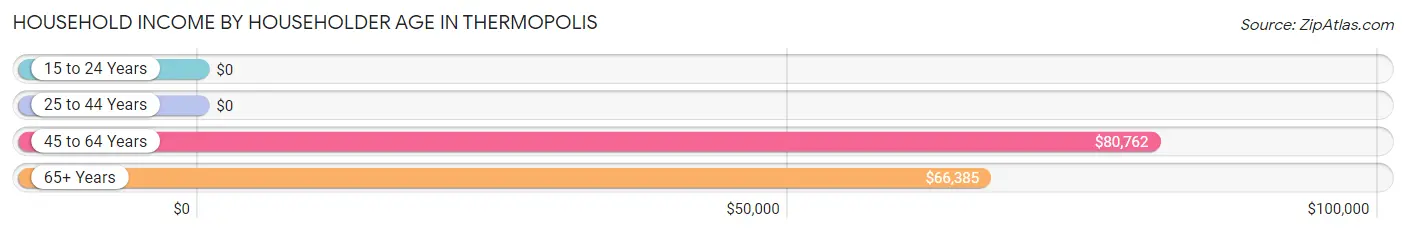
| Income Bracket | # Households | Median Income |
| 15 to 24 Years | 112 (8.7%) | $0 |
| 25 to 44 Years | 257 (20.0%) | $0 |
| 45 to 64 Years | 424 (33.0%) | $80,762 |
| 65+ Years | 493 (38.3%) | $66,385 |
| Total | 1,286 (100.0%) | $66,591 |
Poverty in Thermopolis
Income Below Poverty by Sex and Age in Thermopolis
With 10.3% poverty level for males and 24.7% for females among the residents of Thermopolis, 25 to 34 year old males and 18 to 24 year old females are the most vulnerable to poverty, with 68 males (59.1%) and 93 females (70.5%) in their respective age groups living below the poverty level.
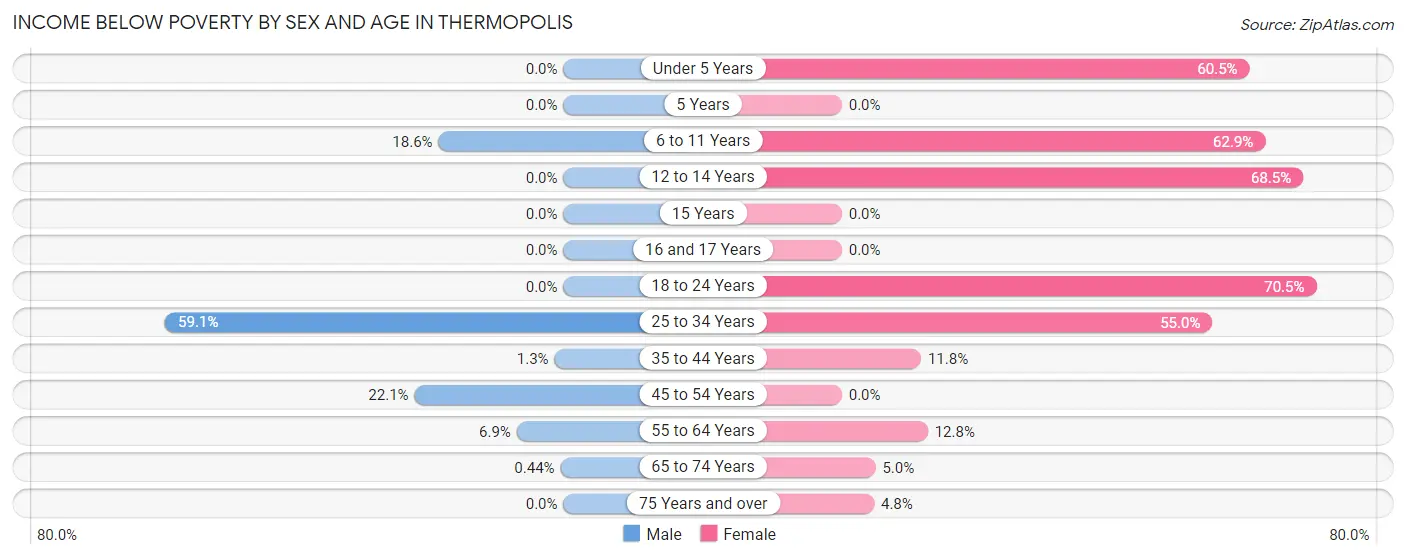
| Age Bracket | Male | Female |
| Under 5 Years | 0 (0.0%) | 23 (60.5%) |
| 5 Years | 0 (0.0%) | 0 (0.0%) |
| 6 to 11 Years | 23 (18.5%) | 66 (62.9%) |
| 12 to 14 Years | 0 (0.0%) | 50 (68.5%) |
| 15 Years | 0 (0.0%) | 0 (0.0%) |
| 16 and 17 Years | 0 (0.0%) | 0 (0.0%) |
| 18 to 24 Years | 0 (0.0%) | 93 (70.5%) |
| 25 to 34 Years | 68 (59.1%) | 33 (55.0%) |
| 35 to 44 Years | 2 (1.3%) | 24 (11.8%) |
| 45 to 54 Years | 23 (22.1%) | 0 (0.0%) |
| 55 to 64 Years | 14 (6.9%) | 25 (12.8%) |
| 65 to 74 Years | 1 (0.4%) | 11 (5.0%) |
| 75 Years and over | 0 (0.0%) | 7 (4.8%) |
| Total | 131 (10.3%) | 332 (24.7%) |
Income Above Poverty by Sex and Age in Thermopolis
According to the poverty statistics in Thermopolis, males aged under 5 years and females aged 15 years are the age groups that are most secure financially, with 100.0% of males and 100.0% of females in these age groups living above the poverty line.
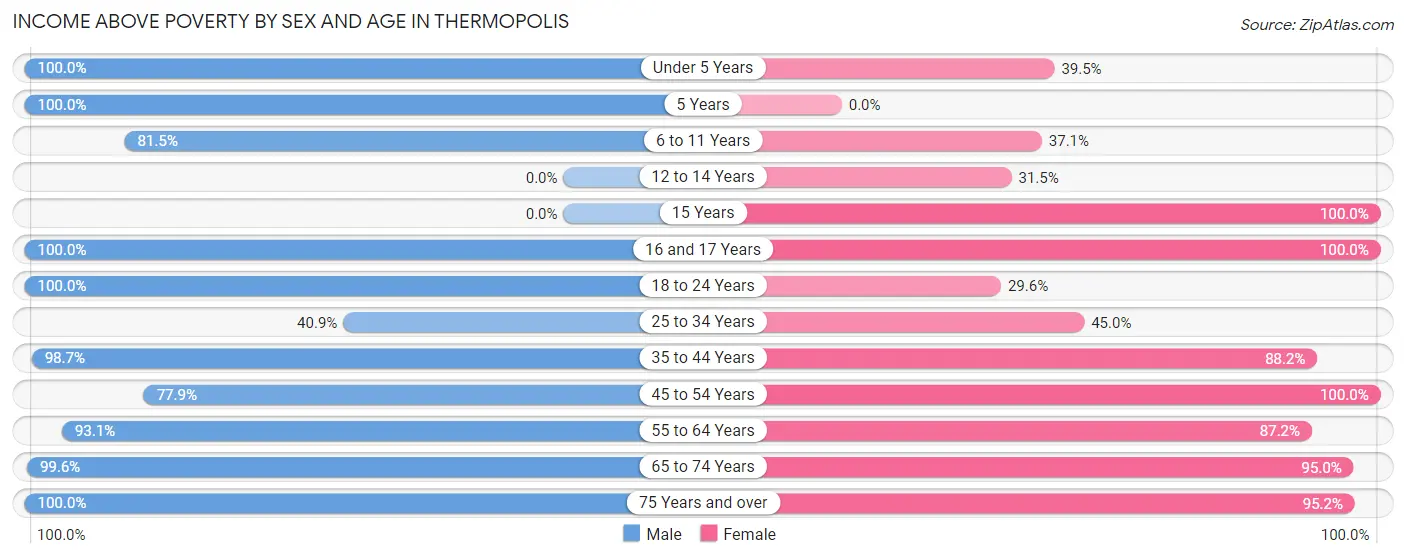
| Age Bracket | Male | Female |
| Under 5 Years | 64 (100.0%) | 15 (39.5%) |
| 5 Years | 25 (100.0%) | 0 (0.0%) |
| 6 to 11 Years | 101 (81.5%) | 39 (37.1%) |
| 12 to 14 Years | 0 (0.0%) | 23 (31.5%) |
| 15 Years | 0 (0.0%) | 34 (100.0%) |
| 16 and 17 Years | 14 (100.0%) | 29 (100.0%) |
| 18 to 24 Years | 131 (100.0%) | 39 (29.5%) |
| 25 to 34 Years | 47 (40.9%) | 27 (45.0%) |
| 35 to 44 Years | 149 (98.7%) | 180 (88.2%) |
| 45 to 54 Years | 81 (77.9%) | 109 (100.0%) |
| 55 to 64 Years | 188 (93.1%) | 171 (87.2%) |
| 65 to 74 Years | 228 (99.6%) | 209 (95.0%) |
| 75 Years and over | 115 (100.0%) | 139 (95.2%) |
| Total | 1,143 (89.7%) | 1,014 (75.3%) |
Income Below Poverty Among Married-Couple Families in Thermopolis
The poverty statistics for married-couple families in Thermopolis show that 6.5% or 35 of the total 543 families live below the poverty line. Families with 3 or 4 children have the highest poverty rate of 36.4%, comprising of 24 families. On the other hand, families with 1 or 2 children have the lowest poverty rate of 0.0%, which includes 0 families.
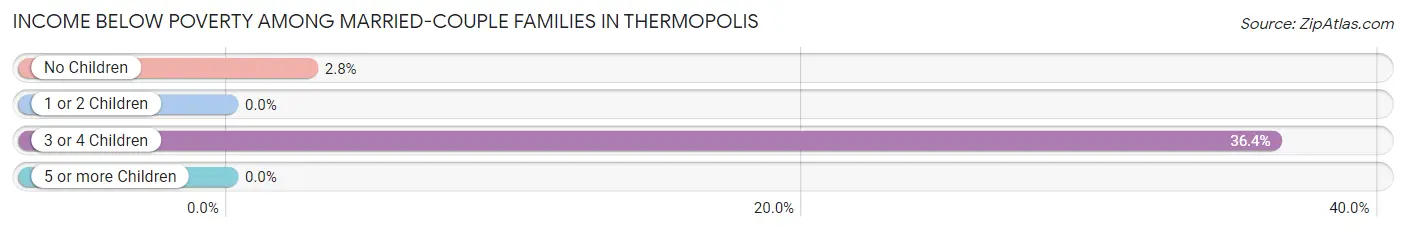
| Children | Above Poverty | Below Poverty |
| No Children | 385 (97.2%) | 11 (2.8%) |
| 1 or 2 Children | 81 (100.0%) | 0 (0.0%) |
| 3 or 4 Children | 42 (63.6%) | 24 (36.4%) |
| 5 or more Children | 0 (0.0%) | 0 (0.0%) |
| Total | 508 (93.5%) | 35 (6.5%) |
Income Below Poverty Among Single-Parent Households in Thermopolis
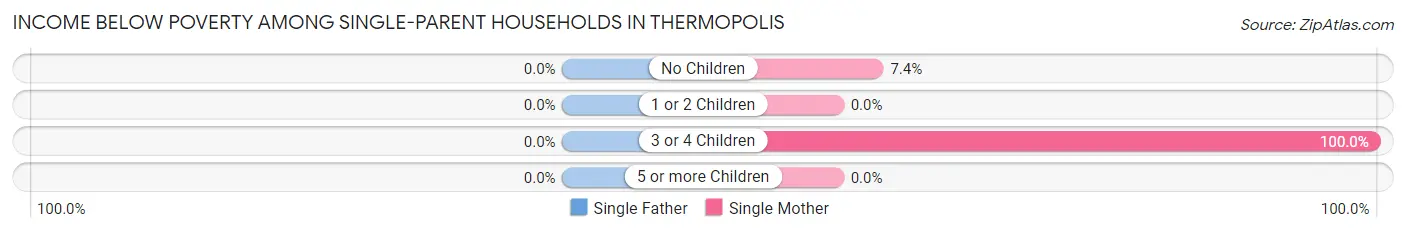
| Children | Single Father | Single Mother |
| No Children | 0 (0.0%) | 6 (7.4%) |
| 1 or 2 Children | 0 (0.0%) | 0 (0.0%) |
| 3 or 4 Children | 0 (0.0%) | 24 (100.0%) |
| 5 or more Children | 0 (0.0%) | 0 (0.0%) |
| Total | 0 (0.0%) | 30 (26.1%) |
Income Below Poverty Among Married-Couple vs Single-Parent Households in Thermopolis
The poverty data for Thermopolis shows that 35 of the married-couple family households (6.5%) and 30 of the single-parent households (11.7%) are living below the poverty level. Within the married-couple family households, those with 3 or 4 children have the highest poverty rate, with 24 households (36.4%) falling below the poverty line. Among the single-parent households, those with 3 or 4 children have the highest poverty rate, with 24 household (100.0%) living below poverty.
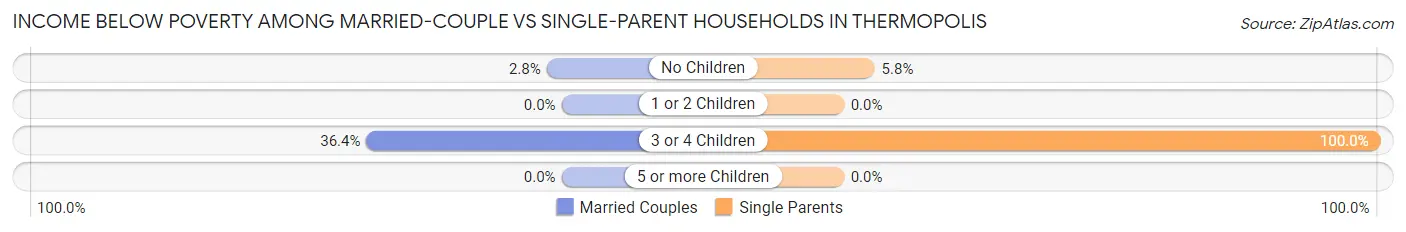
| Children | Married-Couple Families | Single-Parent Households |
| No Children | 11 (2.8%) | 6 (5.8%) |
| 1 or 2 Children | 0 (0.0%) | 0 (0.0%) |
| 3 or 4 Children | 24 (36.4%) | 24 (100.0%) |
| 5 or more Children | 0 (0.0%) | 0 (0.0%) |
| Total | 35 (6.5%) | 30 (11.7%) |
Race in Thermopolis
The most populous races in Thermopolis are White / Caucasian (2,576 | 94.6%), Hispanic or Latino (136 | 5.0%), and Two or more Races (74 | 2.7%).
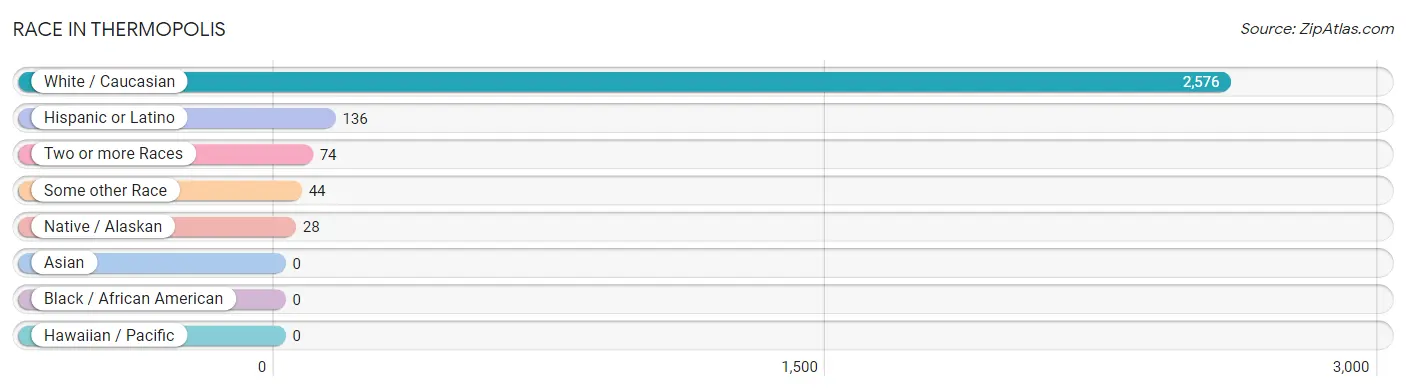
| Race | # Population | % Population |
| Asian | 0 | 0.0% |
| Black / African American | 0 | 0.0% |
| Hawaiian / Pacific | 0 | 0.0% |
| Hispanic or Latino | 136 | 5.0% |
| Native / Alaskan | 28 | 1.0% |
| White / Caucasian | 2,576 | 94.6% |
| Two or more Races | 74 | 2.7% |
| Some other Race | 44 | 1.6% |
| Total | 2,722 | 100.0% |
Ancestry in Thermopolis
The most populous ancestries reported in Thermopolis are German (601 | 22.1%), Irish (502 | 18.4%), English (478 | 17.6%), Norwegian (225 | 8.3%), and Scotch-Irish (161 | 5.9%), together accounting for 72.3% of all Thermopolis residents.
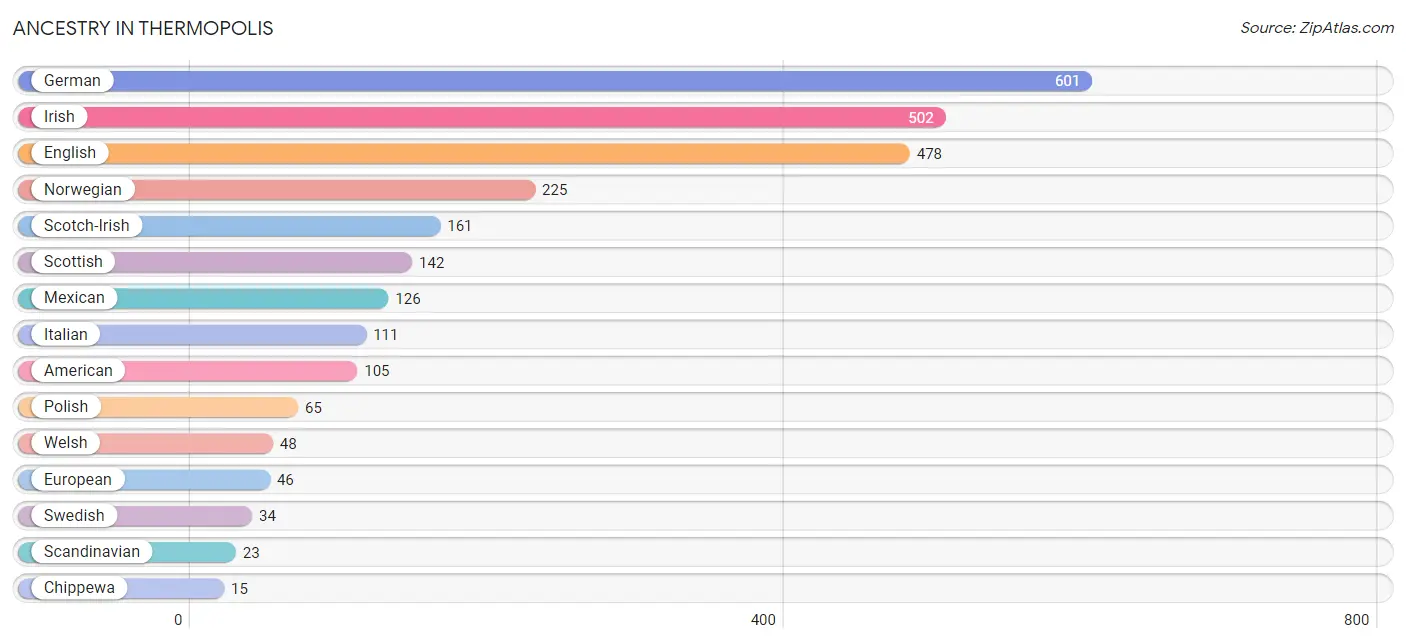
| Ancestry | # Population | % Population |
| American | 105 | 3.9% |
| Arapaho | 4 | 0.2% |
| British | 4 | 0.2% |
| Canadian | 4 | 0.2% |
| Chippewa | 15 | 0.5% |
| Dutch | 15 | 0.5% |
| English | 478 | 17.6% |
| European | 46 | 1.7% |
| French | 4 | 0.2% |
| German | 601 | 22.1% |
| Hungarian | 1 | 0.0% |
| Irish | 502 | 18.4% |
| Italian | 111 | 4.1% |
| Mexican | 126 | 4.6% |
| Northern European | 9 | 0.3% |
| Norwegian | 225 | 8.3% |
| Polish | 65 | 2.4% |
| Puerto Rican | 7 | 0.3% |
| Scandinavian | 23 | 0.8% |
| Scotch-Irish | 161 | 5.9% |
| Scottish | 142 | 5.2% |
| Shoshone | 9 | 0.3% |
| Swedish | 34 | 1.3% |
| Swiss | 5 | 0.2% |
| Welsh | 48 | 1.8% | View All 25 Rows |
Immigrants in Thermopolis
The most numerous immigrant groups reported in Thermopolis came from Central America (13 | 0.5%), Latin America (13 | 0.5%), Mexico (13 | 0.5%), Europe (9 | 0.3%), and Germany (9 | 0.3%), together accounting for 2.1% of all Thermopolis residents.
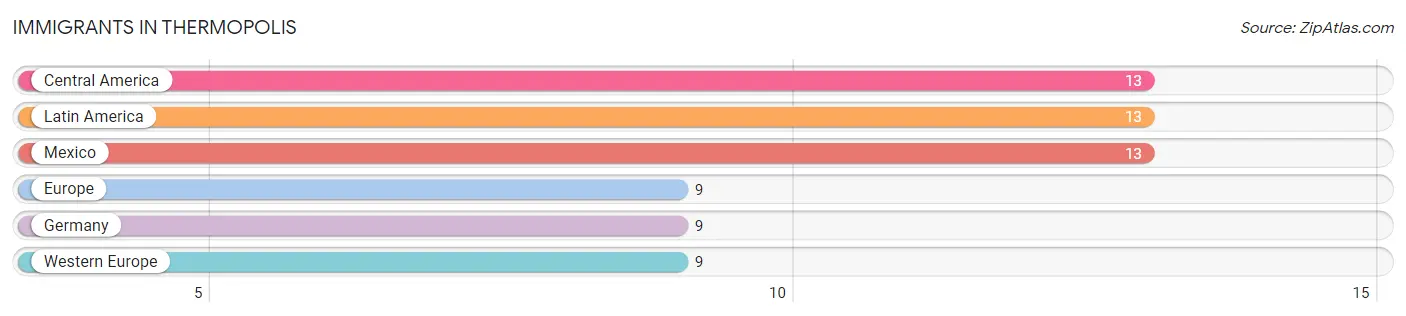
| Immigration Origin | # Population | % Population |
| Central America | 13 | 0.5% |
| Europe | 9 | 0.3% |
| Germany | 9 | 0.3% |
| Latin America | 13 | 0.5% |
| Mexico | 13 | 0.5% |
| Western Europe | 9 | 0.3% | View All 6 Rows |
Sex and Age in Thermopolis
Sex and Age in Thermopolis
The most populous age groups in Thermopolis are 70 to 74 Years (137 | 10.1%) for men and 35 to 39 Years (132 | 9.7%) for women.
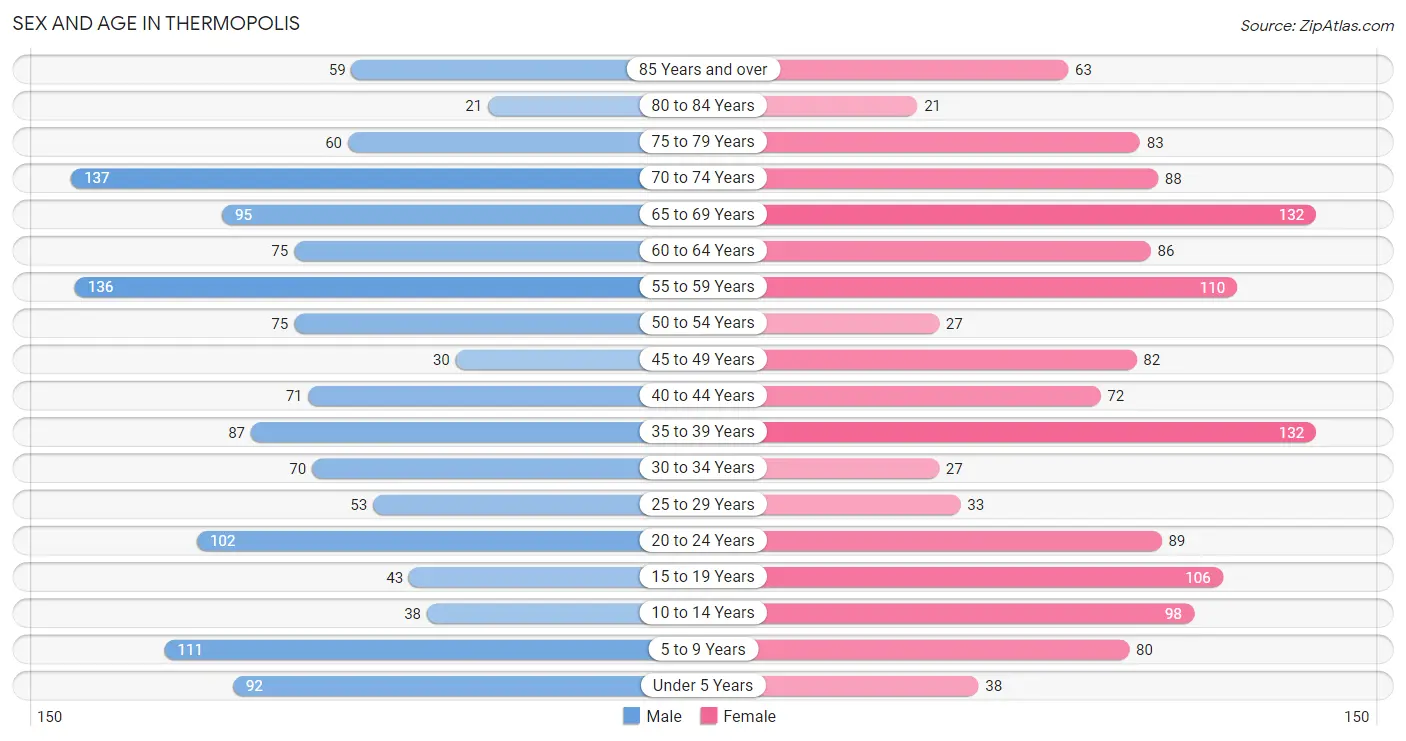
| Age Bracket | Male | Female |
| Under 5 Years | 92 (6.8%) | 38 (2.8%) |
| 5 to 9 Years | 111 (8.2%) | 80 (5.9%) |
| 10 to 14 Years | 38 (2.8%) | 98 (7.2%) |
| 15 to 19 Years | 43 (3.2%) | 106 (7.7%) |
| 20 to 24 Years | 102 (7.5%) | 89 (6.5%) |
| 25 to 29 Years | 53 (3.9%) | 33 (2.4%) |
| 30 to 34 Years | 70 (5.2%) | 27 (2.0%) |
| 35 to 39 Years | 87 (6.4%) | 132 (9.7%) |
| 40 to 44 Years | 71 (5.2%) | 72 (5.3%) |
| 45 to 49 Years | 30 (2.2%) | 82 (6.0%) |
| 50 to 54 Years | 75 (5.5%) | 27 (2.0%) |
| 55 to 59 Years | 136 (10.0%) | 110 (8.1%) |
| 60 to 64 Years | 75 (5.5%) | 86 (6.3%) |
| 65 to 69 Years | 95 (7.0%) | 132 (9.7%) |
| 70 to 74 Years | 137 (10.1%) | 88 (6.4%) |
| 75 to 79 Years | 60 (4.4%) | 83 (6.1%) |
| 80 to 84 Years | 21 (1.5%) | 21 (1.5%) |
| 85 Years and over | 59 (4.3%) | 63 (4.6%) |
| Total | 1,355 (100.0%) | 1,367 (100.0%) |
Families and Households in Thermopolis
Median Family Size in Thermopolis
The median family size in Thermopolis is 2.46 persons per family, with married-couple families (543 | 67.9%) accounting for the largest median family size of 2.6 persons per family. On the other hand, single male/father families (142 | 17.7%) represent the smallest median family size with 1.84 persons per family.
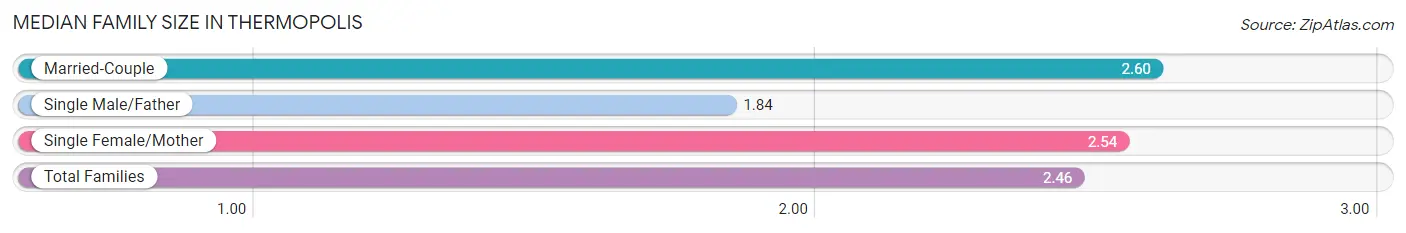
| Family Type | # Families | Family Size |
| Married-Couple | 543 (67.9%) | 2.60 |
| Single Male/Father | 142 (17.7%) | 1.84 |
| Single Female/Mother | 115 (14.4%) | 2.54 |
| Total Families | 800 (100.0%) | 2.46 |
Median Household Size in Thermopolis
The median household size in Thermopolis is 2.05 persons per household, with married-couple households (543 | 42.2%) accounting for the largest median household size of 2.66 persons per household. non-family households (486 | 37.8%) represent the smallest median household size with 1.17 persons per household.
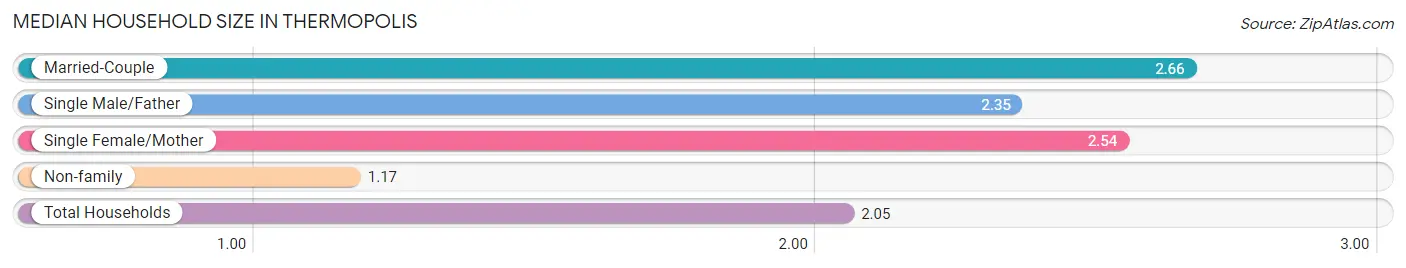
| Household Type | # Households | Household Size |
| Married-Couple | 543 (42.2%) | 2.66 |
| Single Male/Father | 142 (11.0%) | 2.35 |
| Single Female/Mother | 115 (8.9%) | 2.54 |
| Non-family | 486 (37.8%) | 1.17 |
| Total Households | 1,286 (100.0%) | 2.05 |
Household Size by Marriage Status in Thermopolis
Out of a total of 1,286 households in Thermopolis, 800 (62.2%) are family households, while 486 (37.8%) are nonfamily households. The most numerous type of family households are 2-person households, comprising 493, and the most common type of nonfamily households are 1-person households, comprising 450.
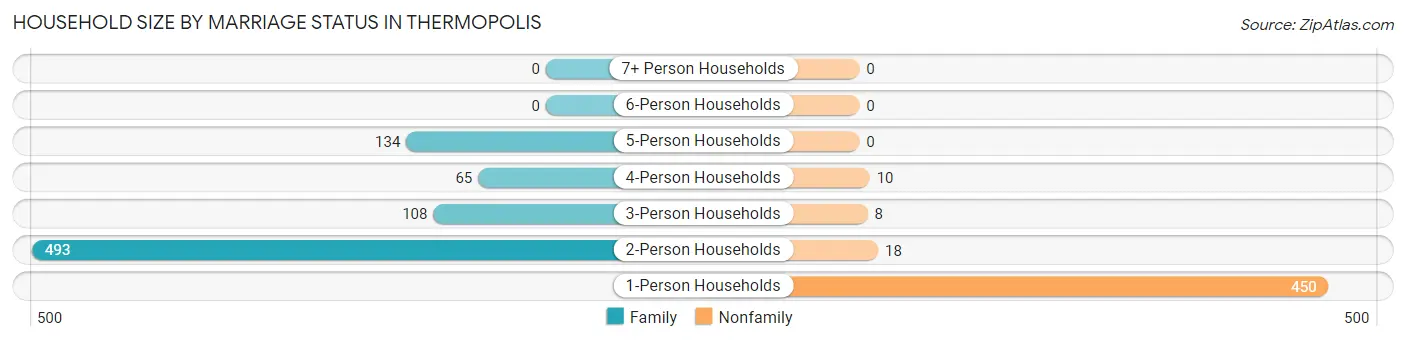
| Household Size | Family Households | Nonfamily Households |
| 1-Person Households | - | 450 (35.0%) |
| 2-Person Households | 493 (38.3%) | 18 (1.4%) |
| 3-Person Households | 108 (8.4%) | 8 (0.6%) |
| 4-Person Households | 65 (5.1%) | 10 (0.8%) |
| 5-Person Households | 134 (10.4%) | 0 (0.0%) |
| 6-Person Households | 0 (0.0%) | 0 (0.0%) |
| 7+ Person Households | 0 (0.0%) | 0 (0.0%) |
| Total | 800 (62.2%) | 486 (37.8%) |
Female Fertility in Thermopolis
Fertility by Age in Thermopolis
Average fertility rate in Thermopolis is 179.0 births per 1,000 women. Women in the age bracket of 20 to 34 years have the highest fertility rate with 550.0 births per 1,000 women. Women in the age bracket of 20 to 34 years acount for 84.5% of all women with births.
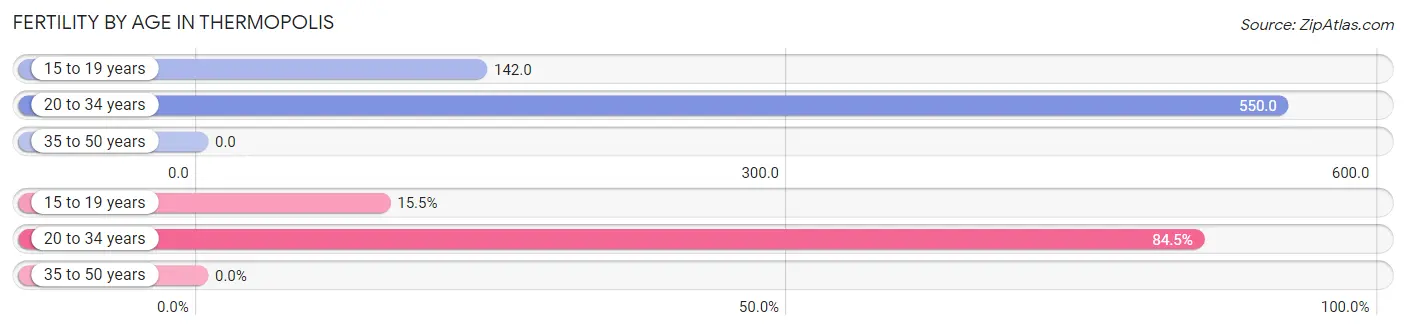
| Age Bracket | Women with Births | Births / 1,000 Women |
| 15 to 19 years | 15 (15.5%) | 142.0 |
| 20 to 34 years | 82 (84.5%) | 550.0 |
| 35 to 50 years | 0 (0.0%) | 0.0 |
| Total | 97 (100.0%) | 179.0 |
Fertility by Age by Marriage Status in Thermopolis
24.7% of women with births (97) in Thermopolis are married. The highest percentage of unmarried women with births falls into 15 to 19 years age bracket with 100.0% of them unmarried at the time of birth, while the lowest percentage of unmarried women with births belong to 20 to 34 years age bracket with 70.7% of them unmarried.
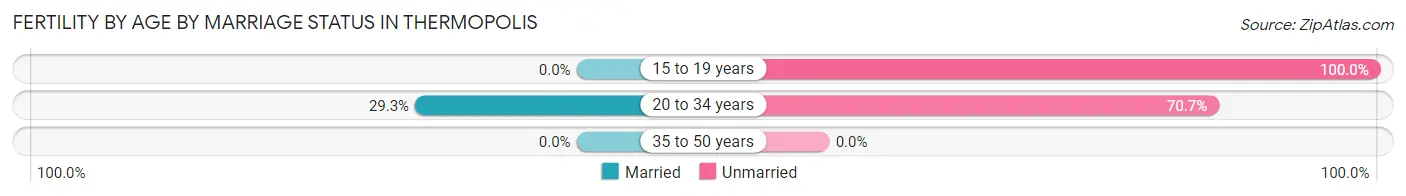
| Age Bracket | Married | Unmarried |
| 15 to 19 years | 0 (0.0%) | 15 (100.0%) |
| 20 to 34 years | 24 (29.3%) | 58 (70.7%) |
| 35 to 50 years | 0 (0.0%) | 0 (0.0%) |
| Total | 24 (24.7%) | 73 (75.3%) |
Fertility by Education in Thermopolis
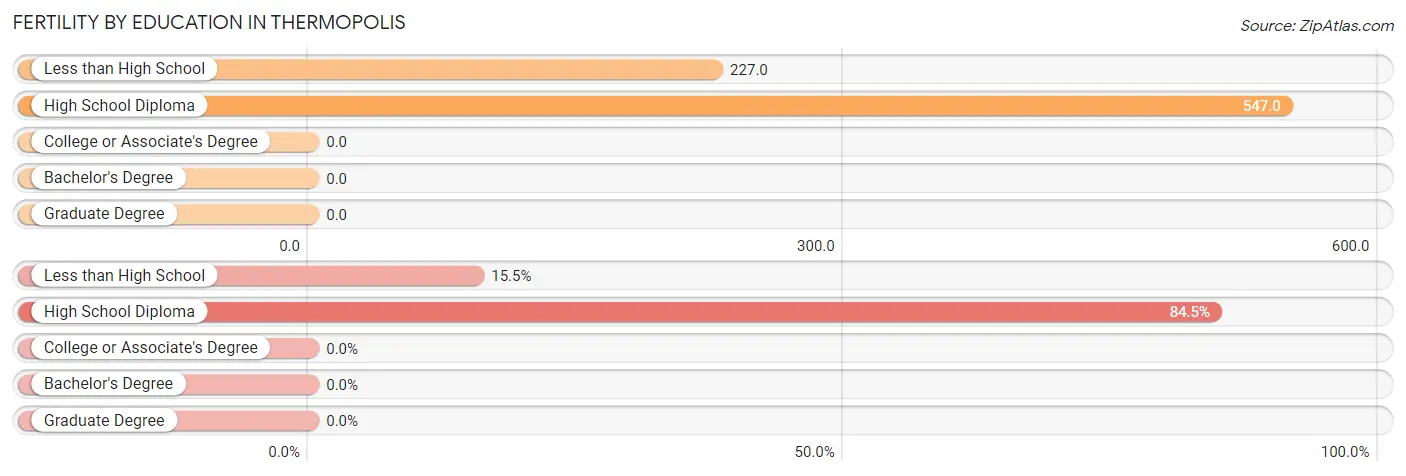
| Educational Attainment | Women with Births | Births / 1,000 Women |
| Less than High School | 15 (15.5%) | 227.0 |
| High School Diploma | 82 (84.5%) | 547.0 |
| College or Associate's Degree | 0 (0.0%) | 0.0 |
| Bachelor's Degree | 0 (0.0%) | 0.0 |
| Graduate Degree | 0 (0.0%) | 0.0 |
| Total | 97 (100.0%) | 179.0 |
Fertility by Education by Marriage Status in Thermopolis
75.3% of women with births in Thermopolis are unmarried. Women with the educational attainment of high school diploma are most likely to be married with 29.3% of them married at childbirth, while women with the educational attainment of less than high school are least likely to be married with 100.0% of them unmarried at childbirth.
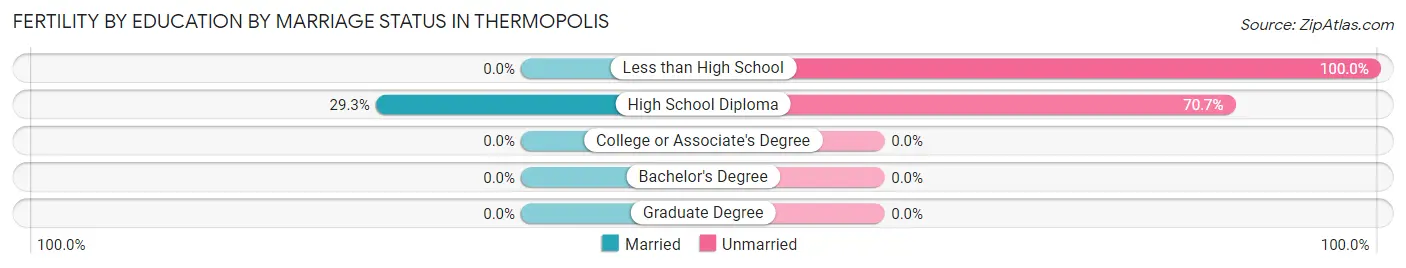
| Educational Attainment | Married | Unmarried |
| Less than High School | 0 (0.0%) | 15 (100.0%) |
| High School Diploma | 24 (29.3%) | 58 (70.7%) |
| College or Associate's Degree | 0 (0.0%) | 0 (0.0%) |
| Bachelor's Degree | 0 (0.0%) | 0 (0.0%) |
| Graduate Degree | 0 (0.0%) | 0 (0.0%) |
| Total | 24 (24.7%) | 73 (75.3%) |
Employment Characteristics in Thermopolis
Employment by Class of Employer in Thermopolis
Among the 1,233 employed individuals in Thermopolis, private company employees (603 | 48.9%), local government employees (201 | 16.3%), and state government employees (135 | 11.0%) make up the most common classes of employment.
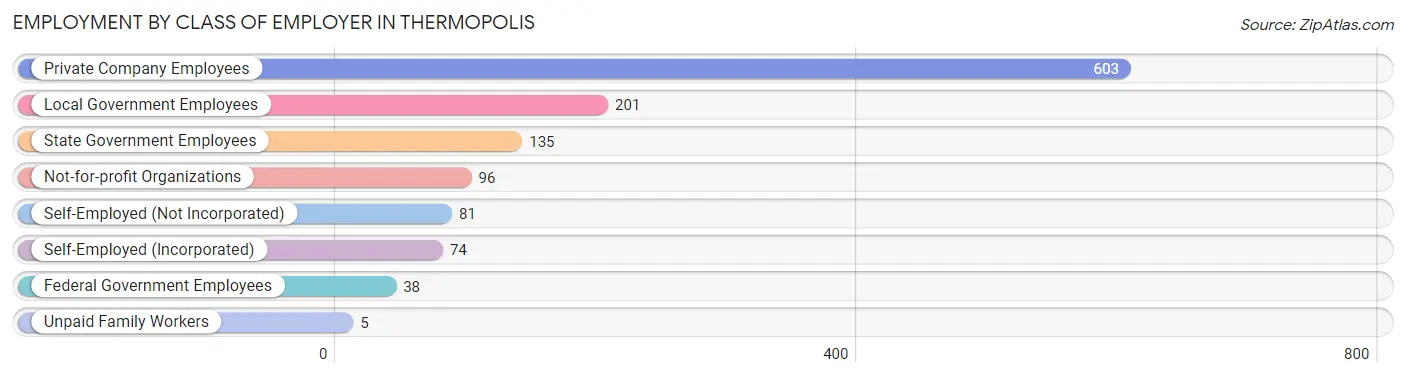
| Employer Class | # Employees | % Employees |
| Private Company Employees | 603 | 48.9% |
| Self-Employed (Incorporated) | 74 | 6.0% |
| Self-Employed (Not Incorporated) | 81 | 6.6% |
| Not-for-profit Organizations | 96 | 7.8% |
| Local Government Employees | 201 | 16.3% |
| State Government Employees | 135 | 11.0% |
| Federal Government Employees | 38 | 3.1% |
| Unpaid Family Workers | 5 | 0.4% |
| Total | 1,233 | 100.0% |
Employment Status by Age in Thermopolis
According to the labor force statistics for Thermopolis, out of the total population over 16 years of age (2,231), 57.0% or 1,272 individuals are in the labor force, with 0.9% or 11 of them unemployed. The age group with the highest labor force participation rate is 25 to 29 years, with 93.0% or 80 individuals in the labor force. Within the labor force, the 35 to 44 years age range has the highest percentage of unemployed individuals, with 4.6% or 12 of them being unemployed.
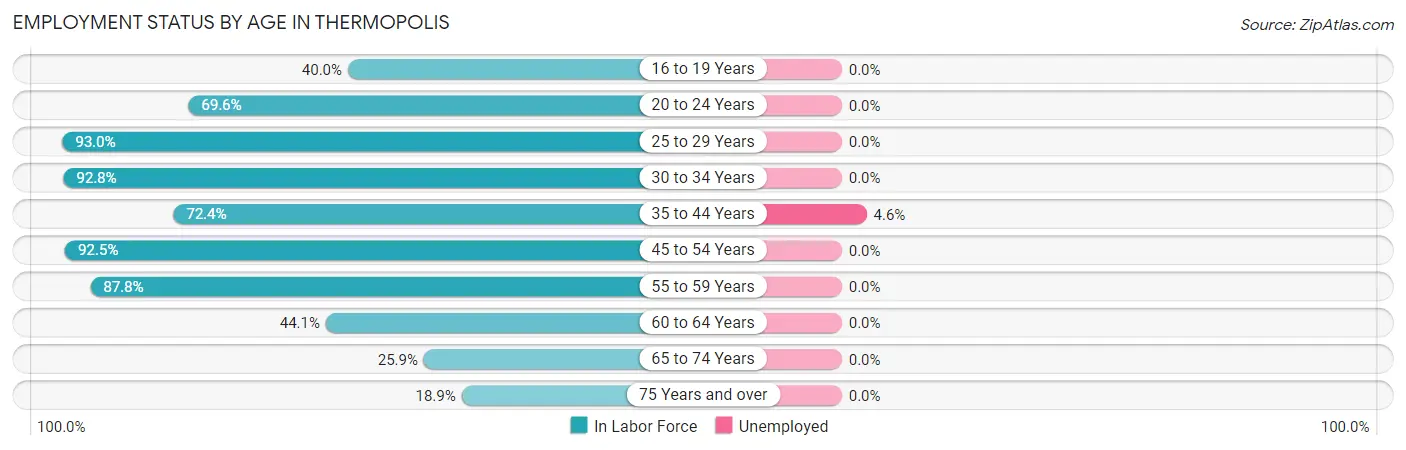
| Age Bracket | In Labor Force | Unemployed |
| 16 to 19 Years | 46 (40.0%) | 0 (0.0%) |
| 20 to 24 Years | 133 (69.6%) | 0 (0.0%) |
| 25 to 29 Years | 80 (93.0%) | 0 (0.0%) |
| 30 to 34 Years | 90 (92.8%) | 0 (0.0%) |
| 35 to 44 Years | 262 (72.4%) | 12 (4.6%) |
| 45 to 54 Years | 198 (92.5%) | 0 (0.0%) |
| 55 to 59 Years | 216 (87.8%) | 0 (0.0%) |
| 60 to 64 Years | 71 (44.1%) | 0 (0.0%) |
| 65 to 74 Years | 117 (25.9%) | 0 (0.0%) |
| 75 Years and over | 58 (18.9%) | 0 (0.0%) |
| Total | 1,272 (57.0%) | 11 (0.9%) |
Employment Status by Educational Attainment in Thermopolis
According to labor force statistics for Thermopolis, 78.6% of individuals (916) out of the total population between 25 and 64 years of age (1,166) are in the labor force, with 1.3% or 12 of them being unemployed. The group with the highest labor force participation rate are those with the educational attainment of less than high school, with 88.0% or 81 individuals in the labor force. Within the labor force, individuals with college / associate degree education have the highest percentage of unemployment, with 3.4% or 12 of them being unemployed.
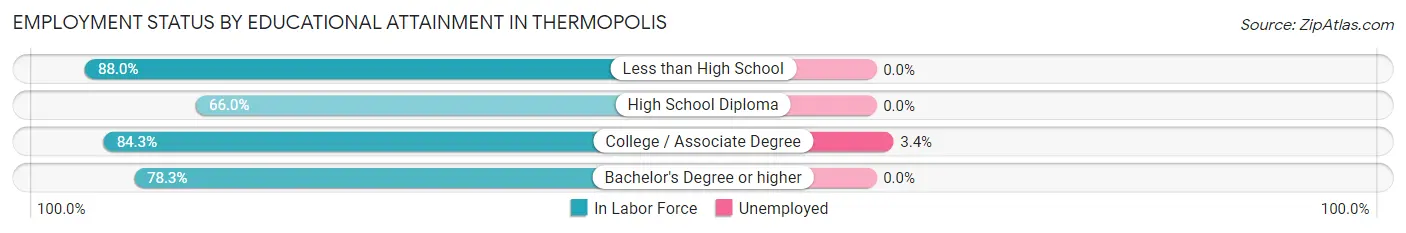
| Educational Attainment | In Labor Force | Unemployed |
| Less than High School | 81 (88.0%) | 0 (0.0%) |
| High School Diploma | 157 (66.0%) | 0 (0.0%) |
| College / Associate Degree | 348 (84.3%) | 14 (3.4%) |
| Bachelor's Degree or higher | 331 (78.3%) | 0 (0.0%) |
| Total | 916 (78.6%) | 15 (1.3%) |
Employment Occupations by Sex in Thermopolis
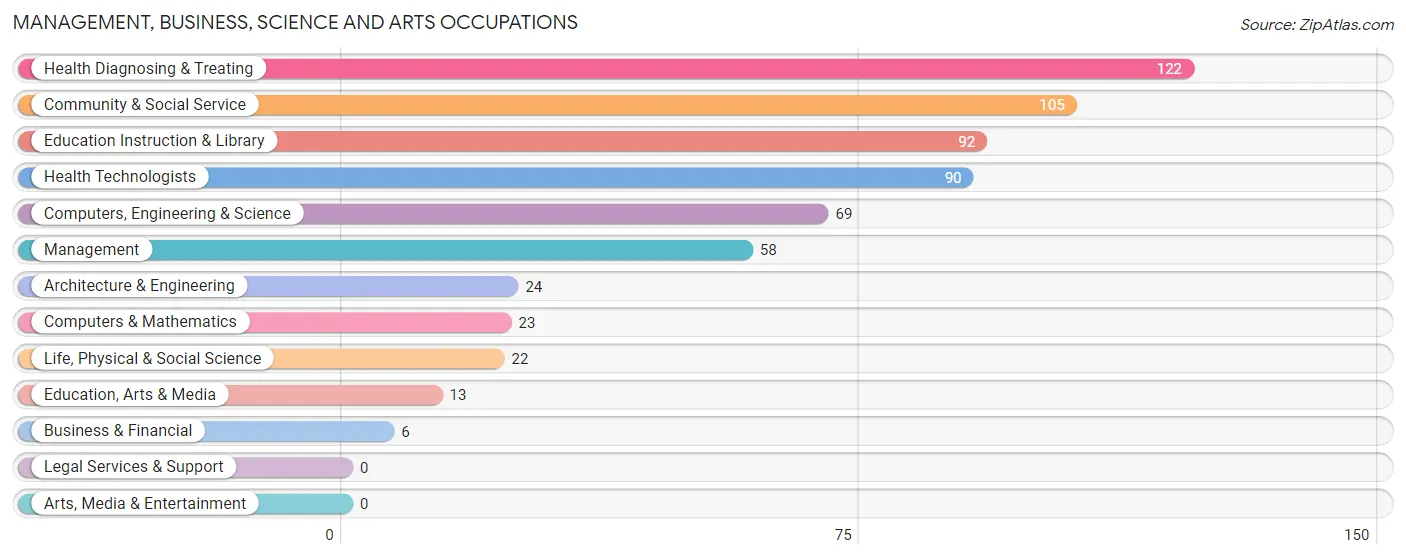
Management, Business, Science and Arts Occupations
The most common Management, Business, Science and Arts occupations in Thermopolis are Health Diagnosing & Treating (122 | 9.7%), Community & Social Service (105 | 8.3%), Education Instruction & Library (92 | 7.3%), Health Technologists (90 | 7.1%), and Computers, Engineering & Science (69 | 5.5%).
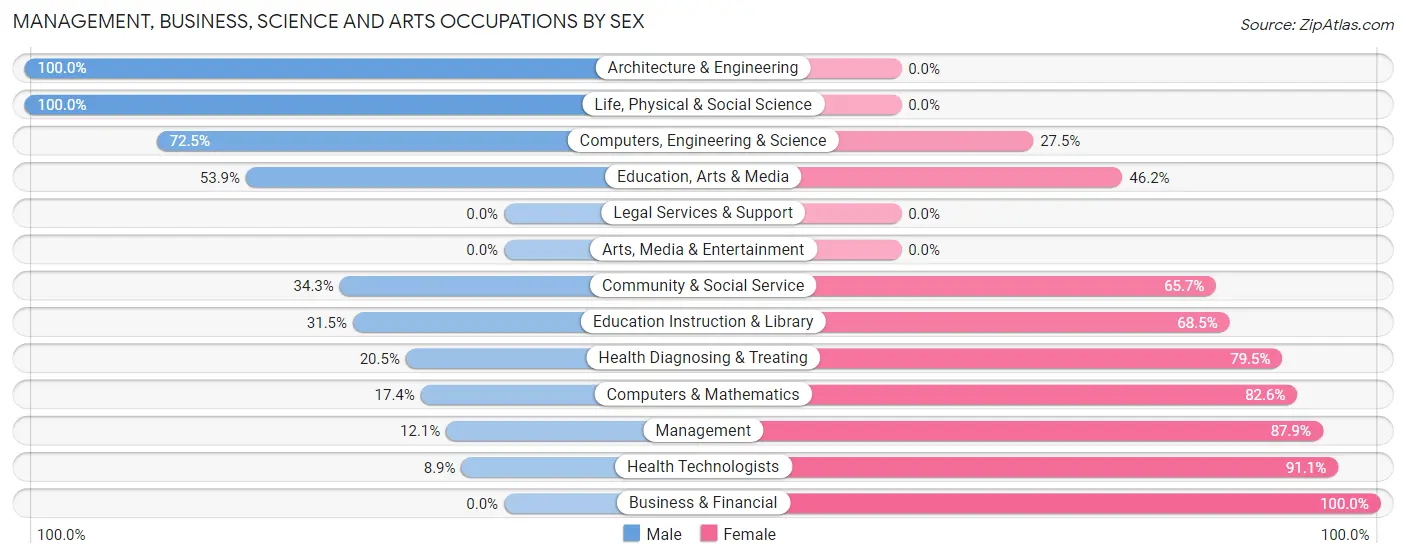
Management, Business, Science and Arts Occupations by Sex
Within the Management, Business, Science and Arts occupations in Thermopolis, the most male-oriented occupations are Architecture & Engineering (100.0%), Life, Physical & Social Science (100.0%), and Computers, Engineering & Science (72.5%), while the most female-oriented occupations are Business & Financial (100.0%), Health Technologists (91.1%), and Management (87.9%).
| Occupation | Male | Female |
| Management | 7 (12.1%) | 51 (87.9%) |
| Business & Financial | 0 (0.0%) | 6 (100.0%) |
| Computers, Engineering & Science | 50 (72.5%) | 19 (27.5%) |
| Computers & Mathematics | 4 (17.4%) | 19 (82.6%) |
| Architecture & Engineering | 24 (100.0%) | 0 (0.0%) |
| Life, Physical & Social Science | 22 (100.0%) | 0 (0.0%) |
| Community & Social Service | 36 (34.3%) | 69 (65.7%) |
| Education, Arts & Media | 7 (53.8%) | 6 (46.2%) |
| Legal Services & Support | 0 (0.0%) | 0 (0.0%) |
| Education Instruction & Library | 29 (31.5%) | 63 (68.5%) |
| Arts, Media & Entertainment | 0 (0.0%) | 0 (0.0%) |
| Health Diagnosing & Treating | 25 (20.5%) | 97 (79.5%) |
| Health Technologists | 8 (8.9%) | 82 (91.1%) |
| Total (Category) | 118 (32.8%) | 242 (67.2%) |
| Total (Overall) | 701 (55.7%) | 558 (44.3%) |
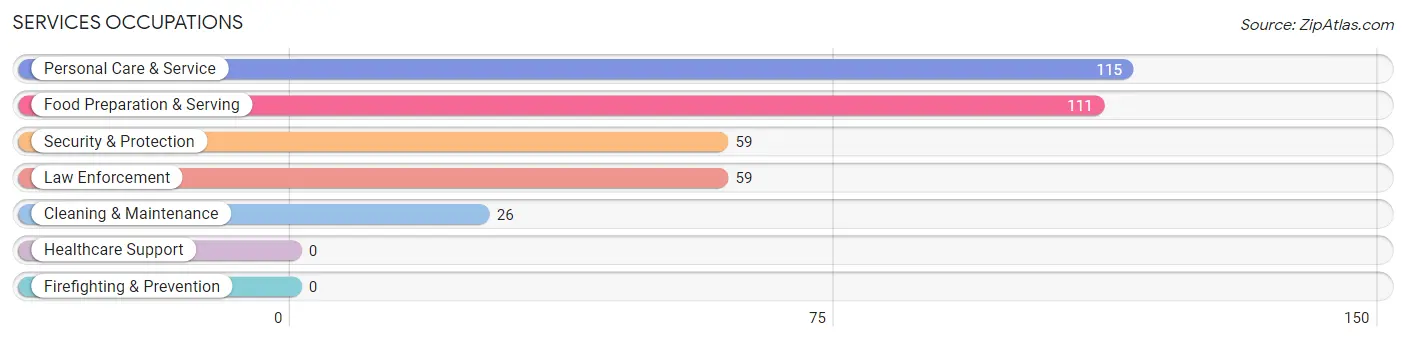
Services Occupations
The most common Services occupations in Thermopolis are Personal Care & Service (115 | 9.1%), Food Preparation & Serving (111 | 8.8%), Security & Protection (59 | 4.7%), Law Enforcement (59 | 4.7%), and Cleaning & Maintenance (26 | 2.1%).
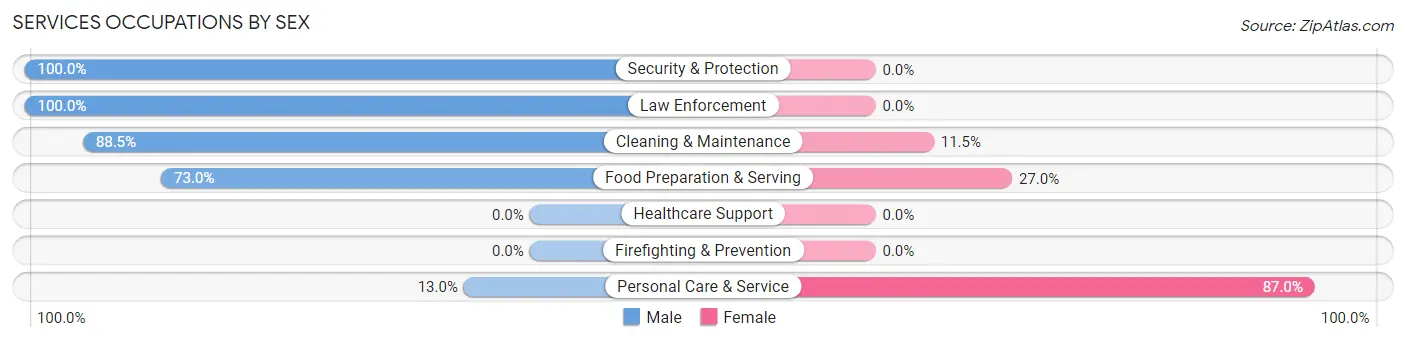
Services Occupations by Sex
Within the Services occupations in Thermopolis, the most male-oriented occupations are Security & Protection (100.0%), Law Enforcement (100.0%), and Cleaning & Maintenance (88.5%), while the most female-oriented occupations are Personal Care & Service (87.0%), Food Preparation & Serving (27.0%), and Cleaning & Maintenance (11.5%).
| Occupation | Male | Female |
| Healthcare Support | 0 (0.0%) | 0 (0.0%) |
| Security & Protection | 59 (100.0%) | 0 (0.0%) |
| Firefighting & Prevention | 0 (0.0%) | 0 (0.0%) |
| Law Enforcement | 59 (100.0%) | 0 (0.0%) |
| Food Preparation & Serving | 81 (73.0%) | 30 (27.0%) |
| Cleaning & Maintenance | 23 (88.5%) | 3 (11.5%) |
| Personal Care & Service | 15 (13.0%) | 100 (87.0%) |
| Total (Category) | 178 (57.2%) | 133 (42.8%) |
| Total (Overall) | 701 (55.7%) | 558 (44.3%) |
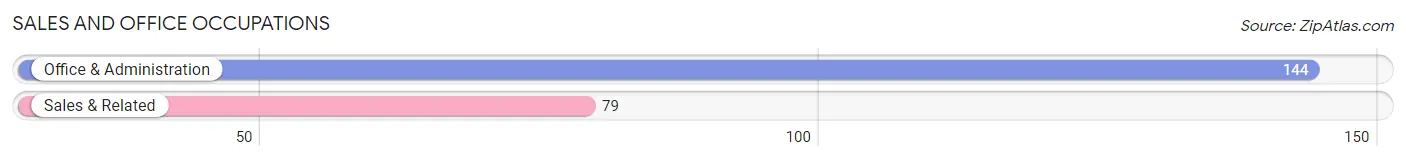
Sales and Office Occupations
The most common Sales and Office occupations in Thermopolis are Office & Administration (144 | 11.4%), and Sales & Related (79 | 6.3%).
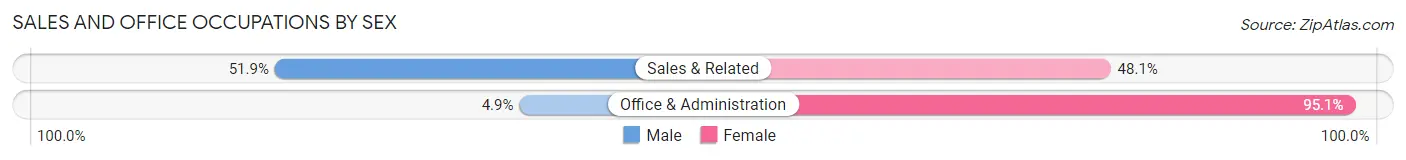
Sales and Office Occupations by Sex
| Occupation | Male | Female |
| Sales & Related | 41 (51.9%) | 38 (48.1%) |
| Office & Administration | 7 (4.9%) | 137 (95.1%) |
| Total (Category) | 48 (21.5%) | 175 (78.5%) |
| Total (Overall) | 701 (55.7%) | 558 (44.3%) |
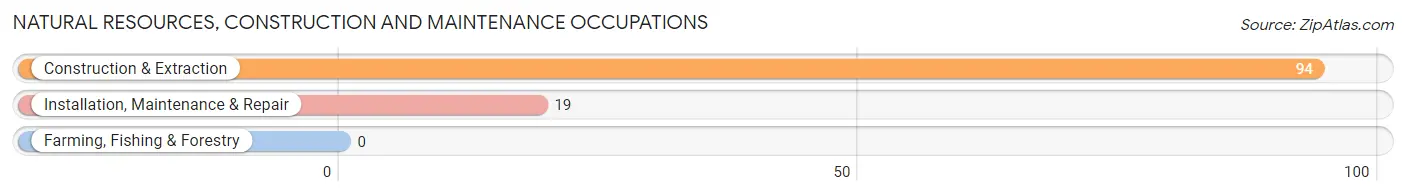
Natural Resources, Construction and Maintenance Occupations
The most common Natural Resources, Construction and Maintenance occupations in Thermopolis are Construction & Extraction (94 | 7.5%), and Installation, Maintenance & Repair (19 | 1.5%).
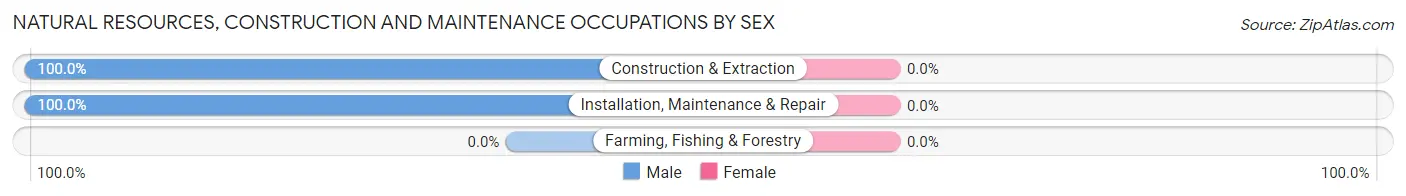
Natural Resources, Construction and Maintenance Occupations by Sex
| Occupation | Male | Female |
| Farming, Fishing & Forestry | 0 (0.0%) | 0 (0.0%) |
| Construction & Extraction | 94 (100.0%) | 0 (0.0%) |
| Installation, Maintenance & Repair | 19 (100.0%) | 0 (0.0%) |
| Total (Category) | 113 (100.0%) | 0 (0.0%) |
| Total (Overall) | 701 (55.7%) | 558 (44.3%) |
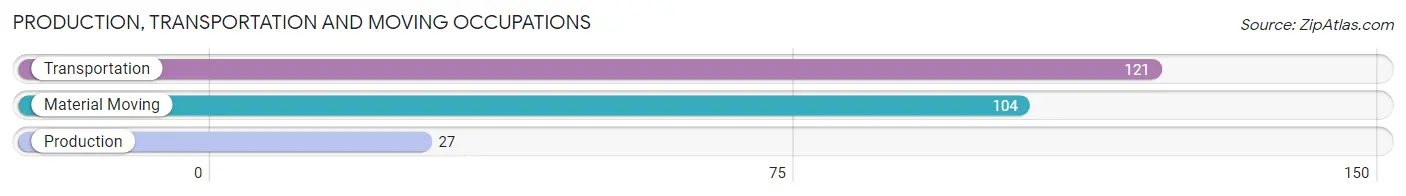
Production, Transportation and Moving Occupations
The most common Production, Transportation and Moving occupations in Thermopolis are Transportation (121 | 9.6%), Material Moving (104 | 8.3%), and Production (27 | 2.1%).
Production, Transportation and Moving Occupations by Sex
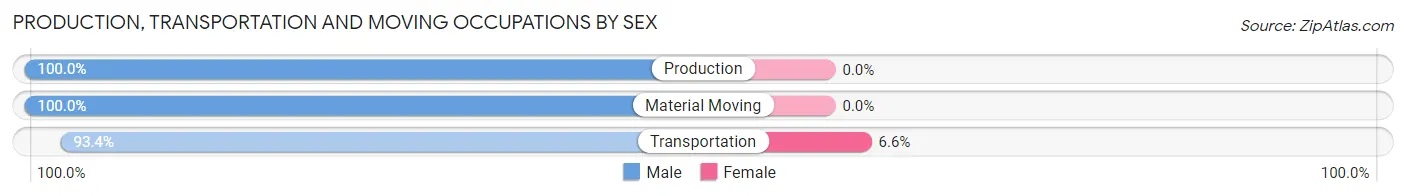
| Occupation | Male | Female |
| Production | 27 (100.0%) | 0 (0.0%) |
| Transportation | 113 (93.4%) | 8 (6.6%) |
| Material Moving | 104 (100.0%) | 0 (0.0%) |
| Total (Category) | 244 (96.8%) | 8 (3.2%) |
| Total (Overall) | 701 (55.7%) | 558 (44.3%) |
Employment Industries by Sex in Thermopolis
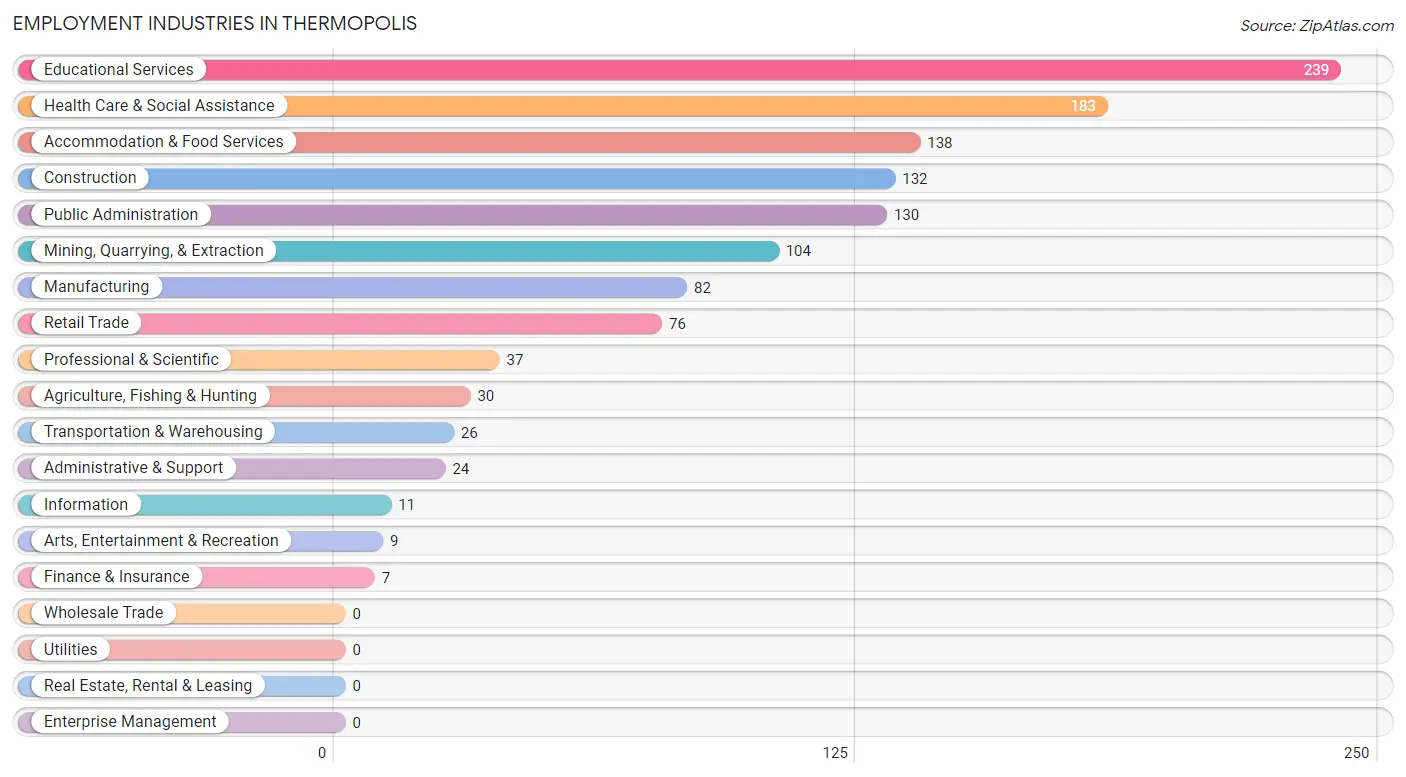
Employment Industries in Thermopolis
The major employment industries in Thermopolis include Educational Services (239 | 19.0%), Health Care & Social Assistance (183 | 14.5%), Accommodation & Food Services (138 | 11.0%), Construction (132 | 10.5%), and Public Administration (130 | 10.3%).
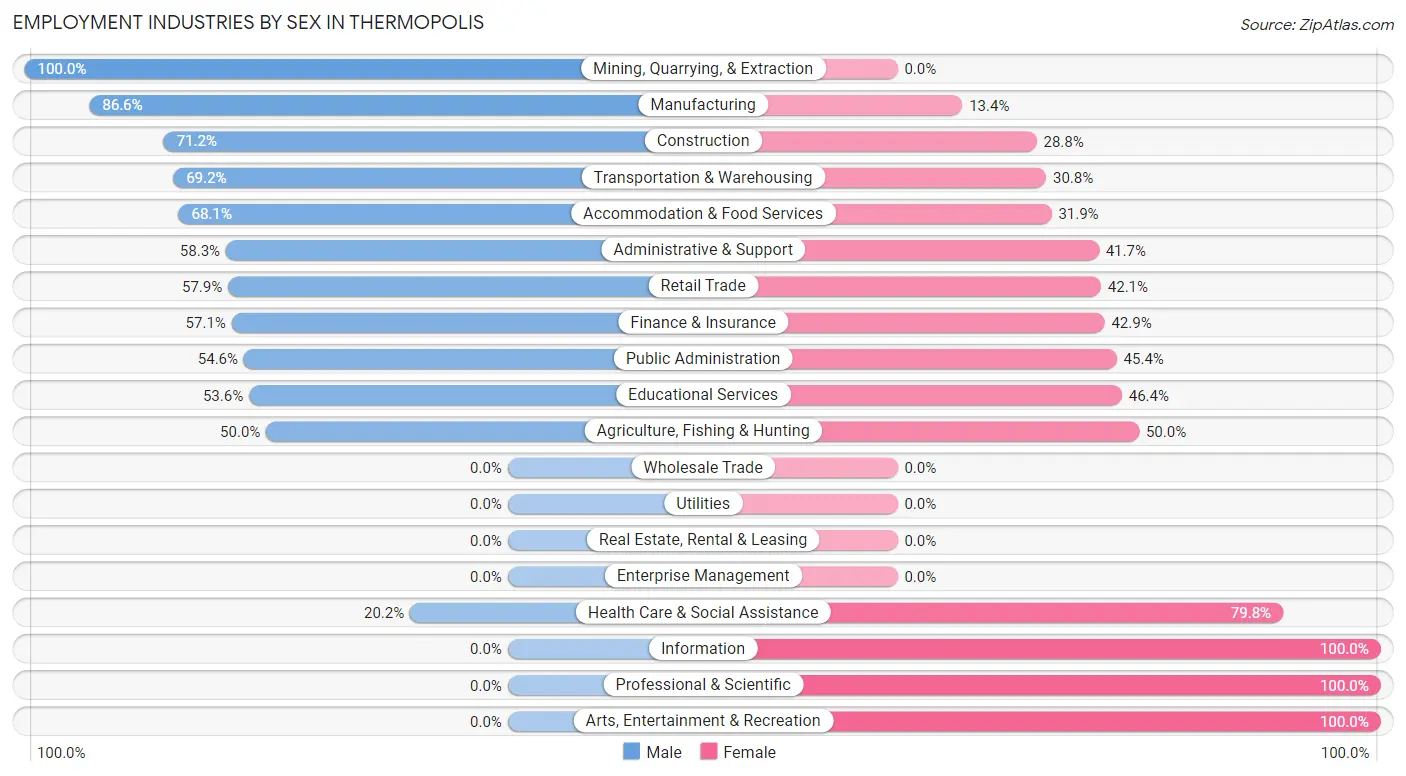
Employment Industries by Sex in Thermopolis
The Thermopolis industries that see more men than women are Mining, Quarrying, & Extraction (100.0%), Manufacturing (86.6%), and Construction (71.2%), whereas the industries that tend to have a higher number of women are Information (100.0%), Professional & Scientific (100.0%), and Arts, Entertainment & Recreation (100.0%).
| Industry | Male | Female |
| Agriculture, Fishing & Hunting | 15 (50.0%) | 15 (50.0%) |
| Mining, Quarrying, & Extraction | 104 (100.0%) | 0 (0.0%) |
| Construction | 94 (71.2%) | 38 (28.8%) |
| Manufacturing | 71 (86.6%) | 11 (13.4%) |
| Wholesale Trade | 0 (0.0%) | 0 (0.0%) |
| Retail Trade | 44 (57.9%) | 32 (42.1%) |
| Transportation & Warehousing | 18 (69.2%) | 8 (30.8%) |
| Utilities | 0 (0.0%) | 0 (0.0%) |
| Information | 0 (0.0%) | 11 (100.0%) |
| Finance & Insurance | 4 (57.1%) | 3 (42.9%) |
| Real Estate, Rental & Leasing | 0 (0.0%) | 0 (0.0%) |
| Professional & Scientific | 0 (0.0%) | 37 (100.0%) |
| Enterprise Management | 0 (0.0%) | 0 (0.0%) |
| Administrative & Support | 14 (58.3%) | 10 (41.7%) |
| Educational Services | 128 (53.6%) | 111 (46.4%) |
| Health Care & Social Assistance | 37 (20.2%) | 146 (79.8%) |
| Arts, Entertainment & Recreation | 0 (0.0%) | 9 (100.0%) |
| Accommodation & Food Services | 94 (68.1%) | 44 (31.9%) |
| Public Administration | 71 (54.6%) | 59 (45.4%) |
| Total | 701 (55.7%) | 558 (44.3%) |
Education in Thermopolis
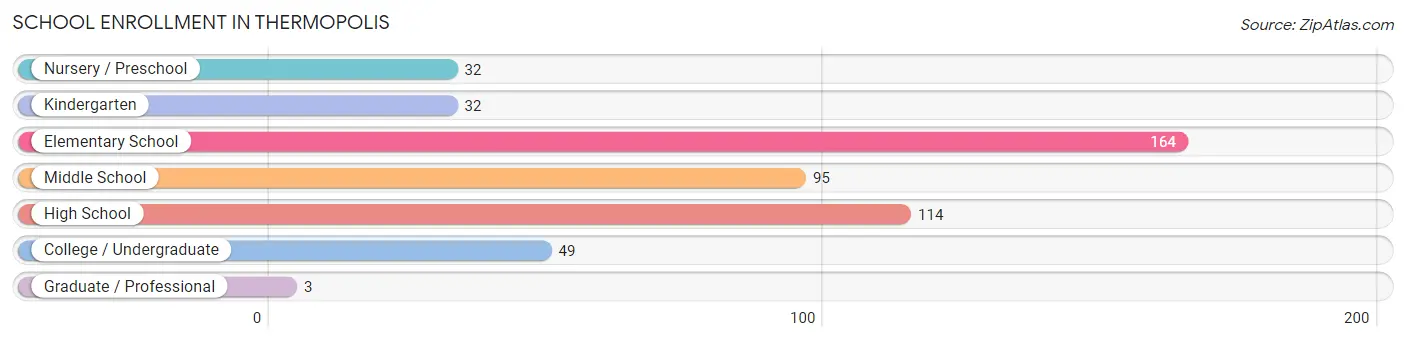
School Enrollment in Thermopolis
The most common levels of schooling among the 489 students in Thermopolis are elementary school (164 | 33.5%), high school (114 | 23.3%), and middle school (95 | 19.4%).
| School Level | # Students | % Students |
| Nursery / Preschool | 32 | 6.5% |
| Kindergarten | 32 | 6.5% |
| Elementary School | 164 | 33.5% |
| Middle School | 95 | 19.4% |
| High School | 114 | 23.3% |
| College / Undergraduate | 49 | 10.0% |
| Graduate / Professional | 3 | 0.6% |
| Total | 489 | 100.0% |
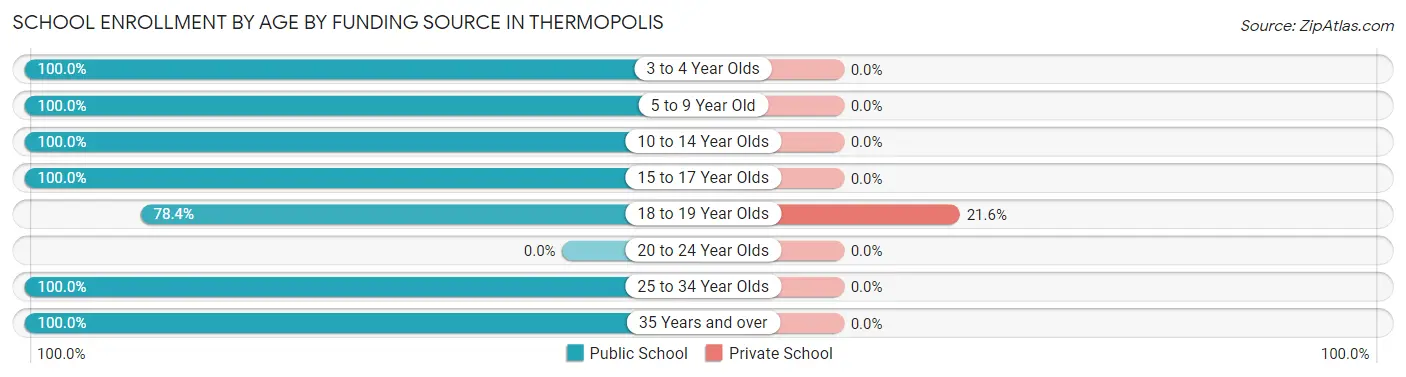
School Enrollment by Age by Funding Source in Thermopolis
Out of a total of 489 students who are enrolled in schools in Thermopolis, 8 (1.6%) attend a private institution, while the remaining 481 (98.4%) are enrolled in public schools. The age group of 18 to 19 year olds has the highest likelihood of being enrolled in private schools, with 8 (21.6% in the age bracket) enrolled. Conversely, the age group of 3 to 4 year olds has the lowest likelihood of being enrolled in a private school, with 4 (100.0% in the age bracket) attending a public institution.
| Age Bracket | Public School | Private School |
| 3 to 4 Year Olds | 4 (100.0%) | 0 (0.0%) |
| 5 to 9 Year Old | 191 (100.0%) | 0 (0.0%) |
| 10 to 14 Year Olds | 136 (100.0%) | 0 (0.0%) |
| 15 to 17 Year Olds | 77 (100.0%) | 0 (0.0%) |
| 18 to 19 Year Olds | 29 (78.4%) | 8 (21.6%) |
| 20 to 24 Year Olds | 0 (0.0%) | 0 (0.0%) |
| 25 to 34 Year Olds | 3 (100.0%) | 0 (0.0%) |
| 35 Years and over | 41 (100.0%) | 0 (0.0%) |
| Total | 481 (98.4%) | 8 (1.6%) |
Educational Attainment by Field of Study in Thermopolis
Education (140 | 23.3%), science & technology (104 | 17.3%), business (91 | 15.2%), bio, nature & agricultural (67 | 11.2%), and engineering (50 | 8.3%) are the most common fields of study among 600 individuals in Thermopolis who have obtained a bachelor's degree or higher.
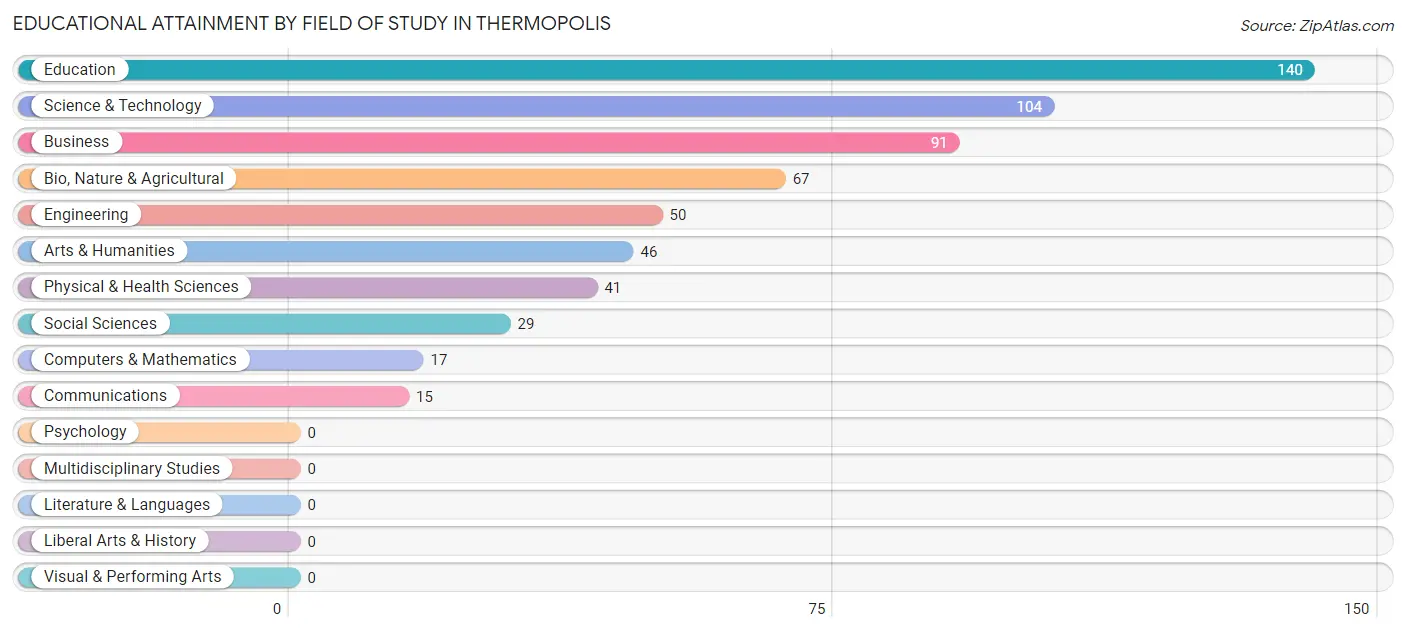
| Field of Study | # Graduates | % Graduates |
| Computers & Mathematics | 17 | 2.8% |
| Bio, Nature & Agricultural | 67 | 11.2% |
| Physical & Health Sciences | 41 | 6.8% |
| Psychology | 0 | 0.0% |
| Social Sciences | 29 | 4.8% |
| Engineering | 50 | 8.3% |
| Multidisciplinary Studies | 0 | 0.0% |
| Science & Technology | 104 | 17.3% |
| Business | 91 | 15.2% |
| Education | 140 | 23.3% |
| Literature & Languages | 0 | 0.0% |
| Liberal Arts & History | 0 | 0.0% |
| Visual & Performing Arts | 0 | 0.0% |
| Communications | 15 | 2.5% |
| Arts & Humanities | 46 | 7.7% |
| Total | 600 | 100.0% |
Transportation & Commute in Thermopolis
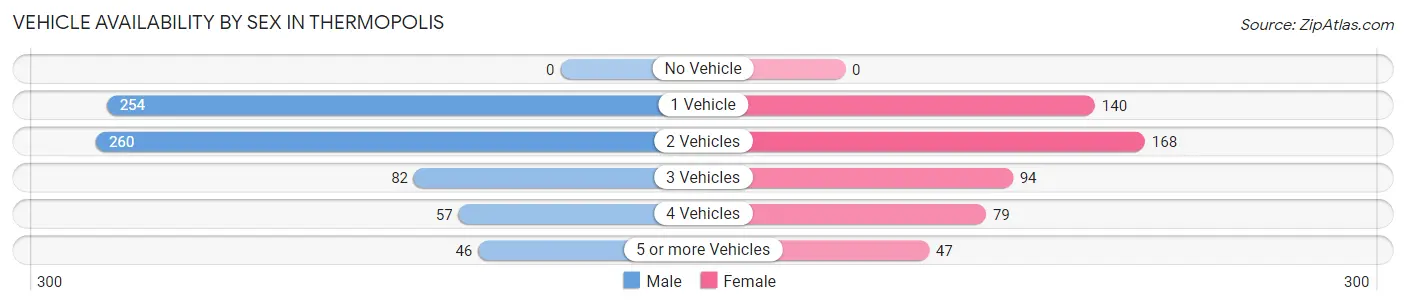
Vehicle Availability by Sex in Thermopolis
The most prevalent vehicle ownership categories in Thermopolis are males with 2 vehicles (260, accounting for 37.2%) and females with 2 vehicles (168, making up 49.2%).
| Vehicles Available | Male | Female |
| No Vehicle | 0 (0.0%) | 0 (0.0%) |
| 1 Vehicle | 254 (36.3%) | 140 (26.5%) |
| 2 Vehicles | 260 (37.2%) | 168 (31.8%) |
| 3 Vehicles | 82 (11.7%) | 94 (17.8%) |
| 4 Vehicles | 57 (8.2%) | 79 (15.0%) |
| 5 or more Vehicles | 46 (6.6%) | 47 (8.9%) |
| Total | 699 (100.0%) | 528 (100.0%) |
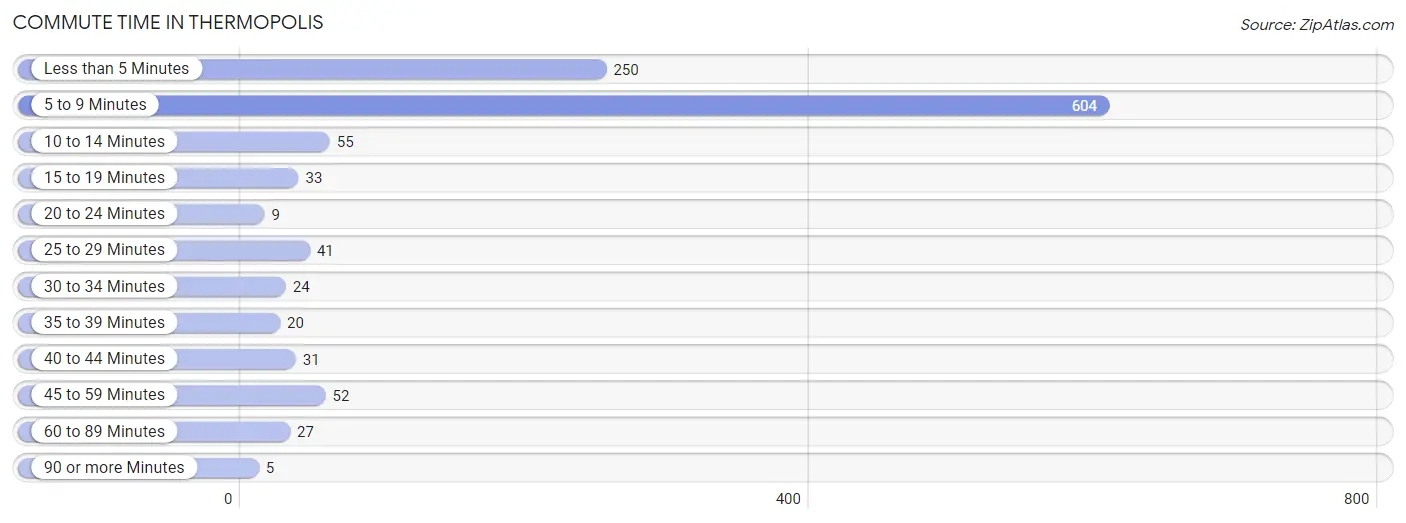
Commute Time in Thermopolis
The most frequently occuring commute durations in Thermopolis are 5 to 9 minutes (604 commuters, 52.5%), less than 5 minutes (250 commuters, 21.7%), and 10 to 14 minutes (55 commuters, 4.8%).
| Commute Time | # Commuters | % Commuters |
| Less than 5 Minutes | 250 | 21.7% |
| 5 to 9 Minutes | 604 | 52.5% |
| 10 to 14 Minutes | 55 | 4.8% |
| 15 to 19 Minutes | 33 | 2.9% |
| 20 to 24 Minutes | 9 | 0.8% |
| 25 to 29 Minutes | 41 | 3.6% |
| 30 to 34 Minutes | 24 | 2.1% |
| 35 to 39 Minutes | 20 | 1.7% |
| 40 to 44 Minutes | 31 | 2.7% |
| 45 to 59 Minutes | 52 | 4.5% |
| 60 to 89 Minutes | 27 | 2.4% |
| 90 or more Minutes | 5 | 0.4% |
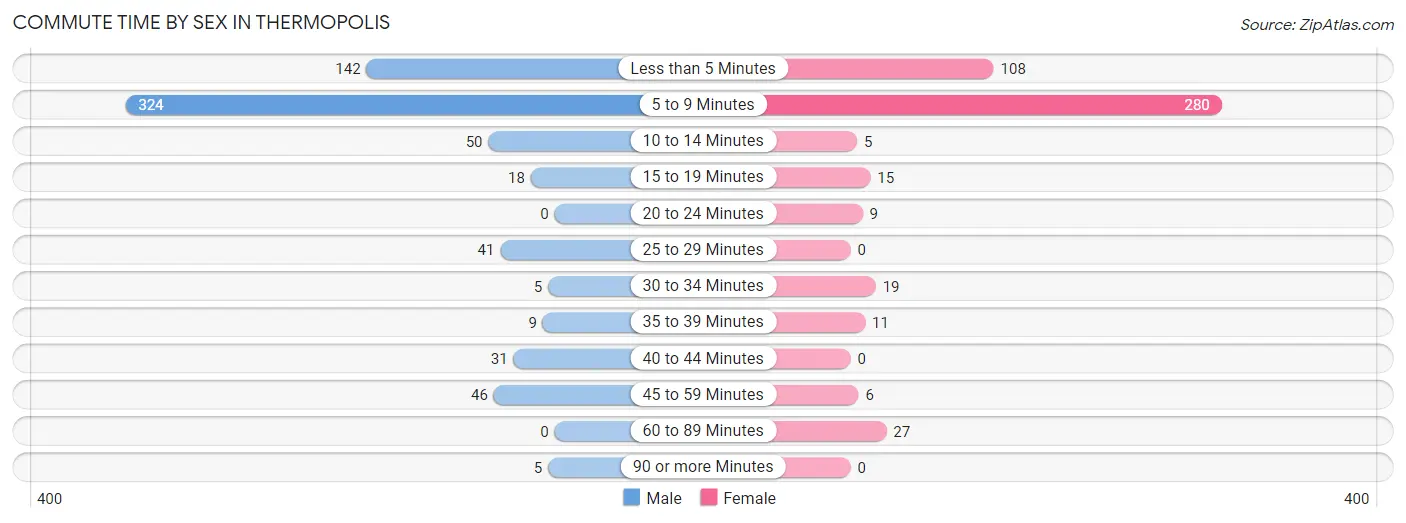
Commute Time by Sex in Thermopolis
The most common commute times in Thermopolis are 5 to 9 minutes (324 commuters, 48.3%) for males and 5 to 9 minutes (280 commuters, 58.3%) for females.
| Commute Time | Male | Female |
| Less than 5 Minutes | 142 (21.2%) | 108 (22.5%) |
| 5 to 9 Minutes | 324 (48.3%) | 280 (58.3%) |
| 10 to 14 Minutes | 50 (7.4%) | 5 (1.0%) |
| 15 to 19 Minutes | 18 (2.7%) | 15 (3.1%) |
| 20 to 24 Minutes | 0 (0.0%) | 9 (1.9%) |
| 25 to 29 Minutes | 41 (6.1%) | 0 (0.0%) |
| 30 to 34 Minutes | 5 (0.7%) | 19 (4.0%) |
| 35 to 39 Minutes | 9 (1.3%) | 11 (2.3%) |
| 40 to 44 Minutes | 31 (4.6%) | 0 (0.0%) |
| 45 to 59 Minutes | 46 (6.9%) | 6 (1.3%) |
| 60 to 89 Minutes | 0 (0.0%) | 27 (5.6%) |
| 90 or more Minutes | 5 (0.7%) | 0 (0.0%) |
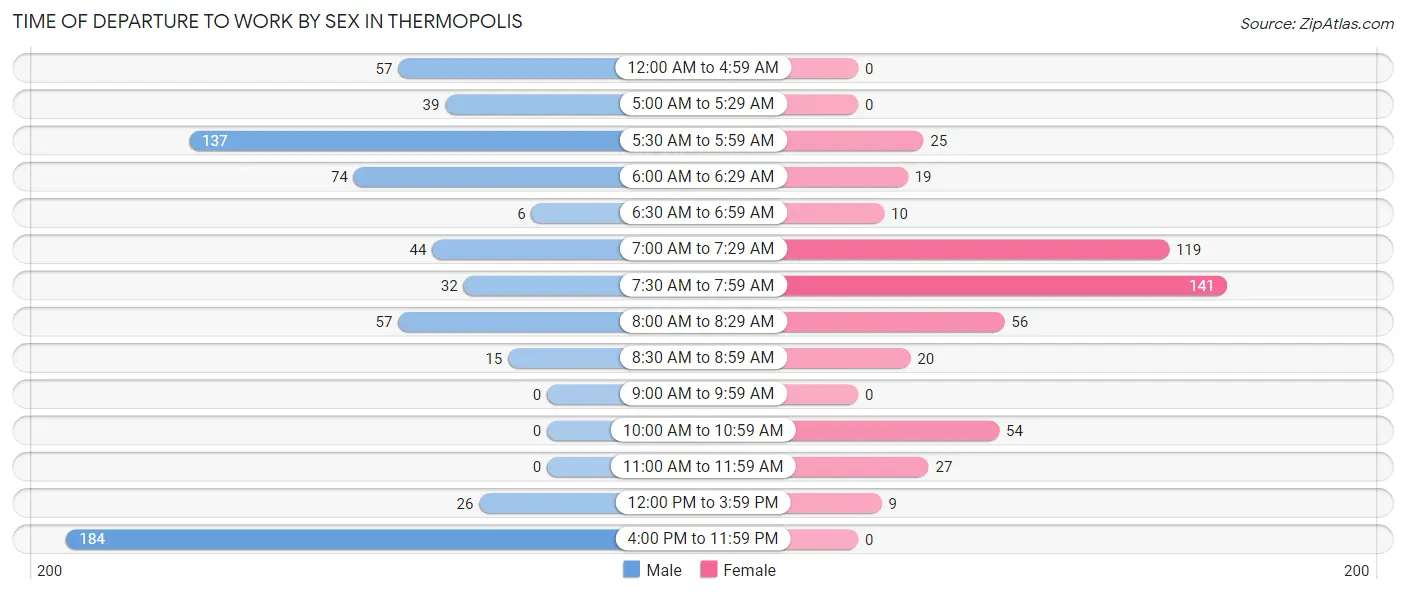
Time of Departure to Work by Sex in Thermopolis
The most frequent times of departure to work in Thermopolis are 4:00 PM to 11:59 PM (184, 27.4%) for males and 7:30 AM to 7:59 AM (141, 29.4%) for females.
| Time of Departure | Male | Female |
| 12:00 AM to 4:59 AM | 57 (8.5%) | 0 (0.0%) |
| 5:00 AM to 5:29 AM | 39 (5.8%) | 0 (0.0%) |
| 5:30 AM to 5:59 AM | 137 (20.4%) | 25 (5.2%) |
| 6:00 AM to 6:29 AM | 74 (11.0%) | 19 (4.0%) |
| 6:30 AM to 6:59 AM | 6 (0.9%) | 10 (2.1%) |
| 7:00 AM to 7:29 AM | 44 (6.6%) | 119 (24.8%) |
| 7:30 AM to 7:59 AM | 32 (4.8%) | 141 (29.4%) |
| 8:00 AM to 8:29 AM | 57 (8.5%) | 56 (11.7%) |
| 8:30 AM to 8:59 AM | 15 (2.2%) | 20 (4.2%) |
| 9:00 AM to 9:59 AM | 0 (0.0%) | 0 (0.0%) |
| 10:00 AM to 10:59 AM | 0 (0.0%) | 54 (11.3%) |
| 11:00 AM to 11:59 AM | 0 (0.0%) | 27 (5.6%) |
| 12:00 PM to 3:59 PM | 26 (3.9%) | 9 (1.9%) |
| 4:00 PM to 11:59 PM | 184 (27.4%) | 0 (0.0%) |
| Total | 671 (100.0%) | 480 (100.0%) |
Housing Occupancy in Thermopolis
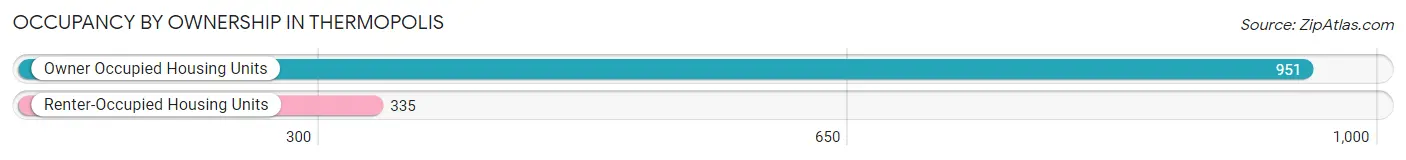
Occupancy by Ownership in Thermopolis
Of the total 1,286 dwellings in Thermopolis, owner-occupied units account for 951 (74.0%), while renter-occupied units make up 335 (26.1%).
| Occupancy | # Housing Units | % Housing Units |
| Owner Occupied Housing Units | 951 | 74.0% |
| Renter-Occupied Housing Units | 335 | 26.1% |
| Total Occupied Housing Units | 1,286 | 100.0% |
Occupancy by Household Size in Thermopolis
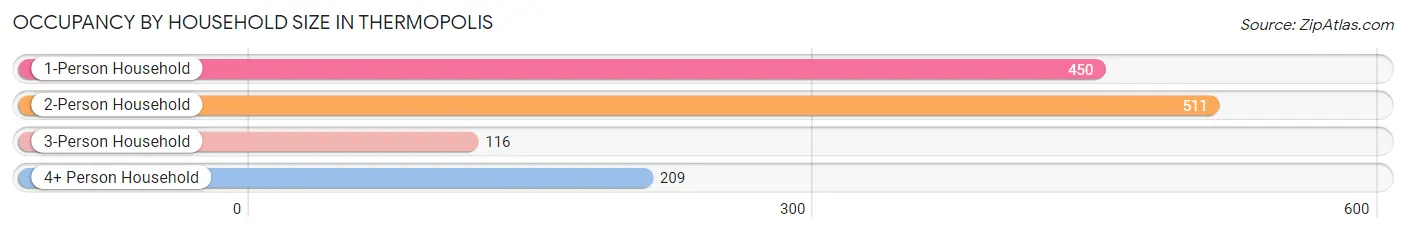
| Household Size | # Housing Units | % Housing Units |
| 1-Person Household | 450 | 35.0% |
| 2-Person Household | 511 | 39.7% |
| 3-Person Household | 116 | 9.0% |
| 4+ Person Household | 209 | 16.3% |
| Total Housing Units | 1,286 | 100.0% |
Occupancy by Ownership by Household Size in Thermopolis
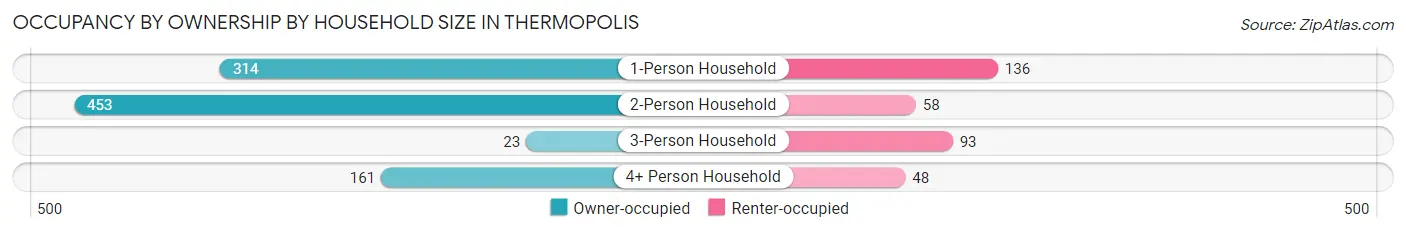
| Household Size | Owner-occupied | Renter-occupied |
| 1-Person Household | 314 (69.8%) | 136 (30.2%) |
| 2-Person Household | 453 (88.6%) | 58 (11.4%) |
| 3-Person Household | 23 (19.8%) | 93 (80.2%) |
| 4+ Person Household | 161 (77.0%) | 48 (23.0%) |
| Total Housing Units | 951 (74.0%) | 335 (26.1%) |
Occupancy by Educational Attainment in Thermopolis
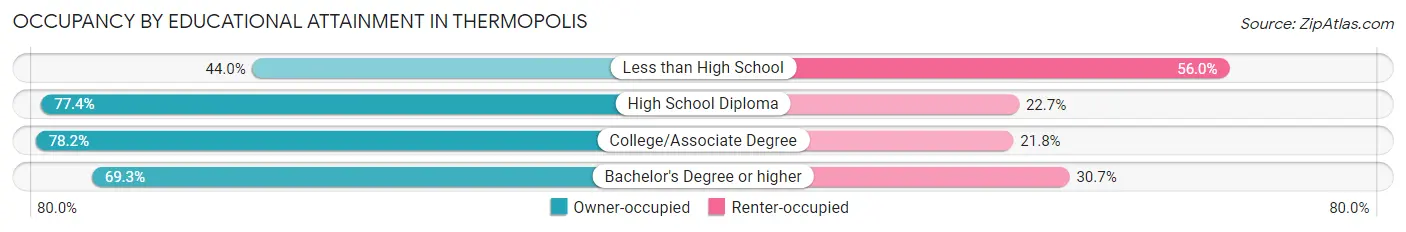
| Household Size | Owner-occupied | Renter-occupied |
| Less than High School | 33 (44.0%) | 42 (56.0%) |
| High School Diploma | 338 (77.3%) | 99 (22.7%) |
| College/Associate Degree | 381 (78.2%) | 106 (21.8%) |
| Bachelor's Degree or higher | 199 (69.3%) | 88 (30.7%) |
Occupancy by Age of Householder in Thermopolis
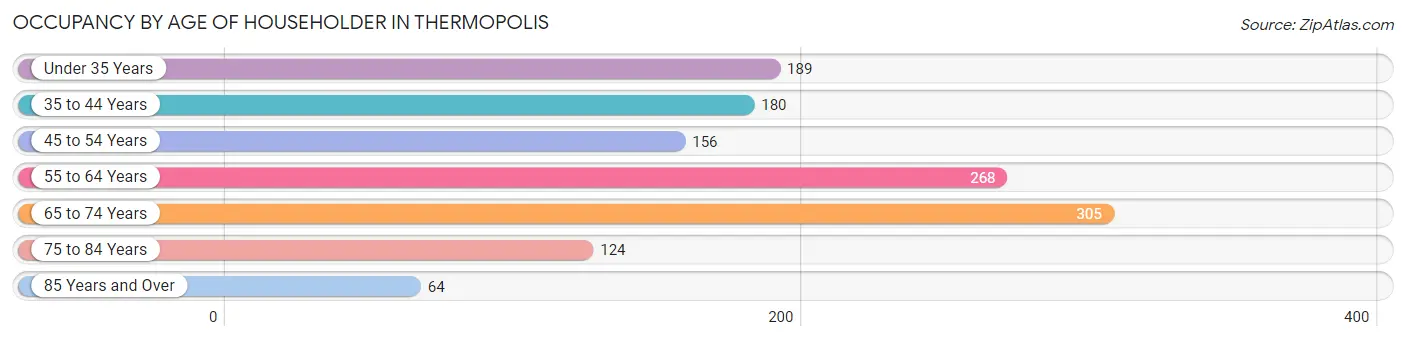
| Age Bracket | # Households | % Households |
| Under 35 Years | 189 | 14.7% |
| 35 to 44 Years | 180 | 14.0% |
| 45 to 54 Years | 156 | 12.1% |
| 55 to 64 Years | 268 | 20.8% |
| 65 to 74 Years | 305 | 23.7% |
| 75 to 84 Years | 124 | 9.6% |
| 85 Years and Over | 64 | 5.0% |
| Total | 1,286 | 100.0% |
Housing Finances in Thermopolis
Median Income by Occupancy in Thermopolis
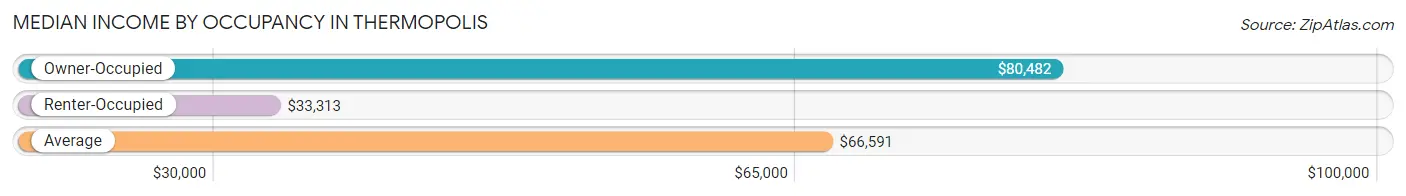
| Occupancy Type | # Households | Median Income |
| Owner-Occupied | 951 (74.0%) | $80,482 |
| Renter-Occupied | 335 (26.1%) | $33,313 |
| Average | 1,286 (100.0%) | $66,591 |
Occupancy by Householder Income Bracket in Thermopolis
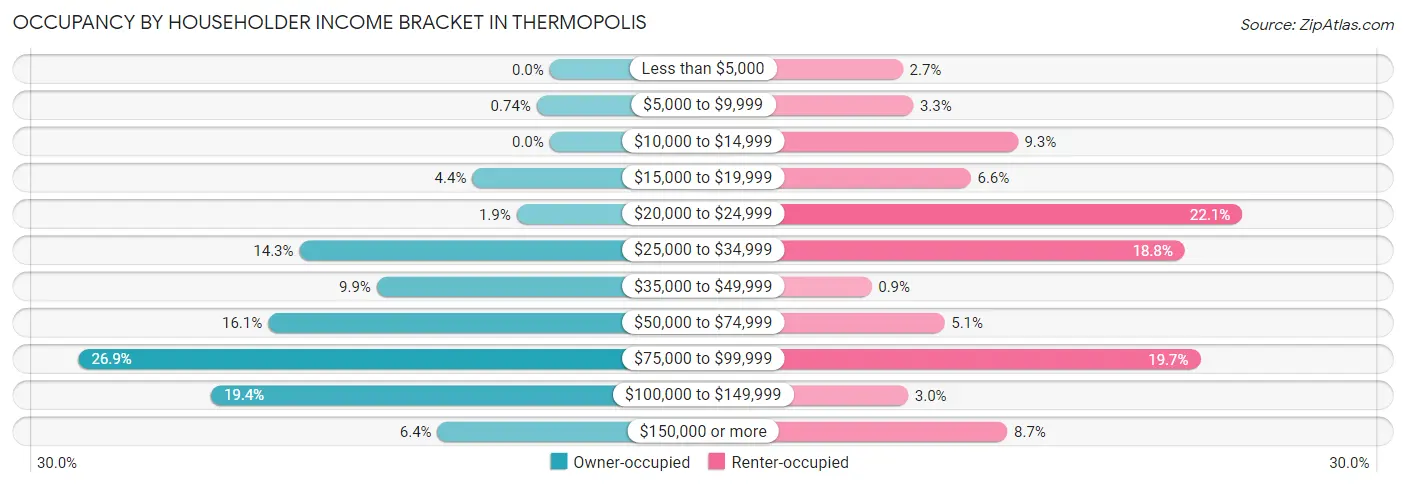
| Income Bracket | Owner-occupied | Renter-occupied |
| Less than $5,000 | 0 (0.0%) | 9 (2.7%) |
| $5,000 to $9,999 | 7 (0.7%) | 11 (3.3%) |
| $10,000 to $14,999 | 0 (0.0%) | 31 (9.2%) |
| $15,000 to $19,999 | 42 (4.4%) | 22 (6.6%) |
| $20,000 to $24,999 | 18 (1.9%) | 74 (22.1%) |
| $25,000 to $34,999 | 136 (14.3%) | 63 (18.8%) |
| $35,000 to $49,999 | 94 (9.9%) | 3 (0.9%) |
| $50,000 to $74,999 | 153 (16.1%) | 17 (5.1%) |
| $75,000 to $99,999 | 256 (26.9%) | 66 (19.7%) |
| $100,000 to $149,999 | 184 (19.4%) | 10 (3.0%) |
| $150,000 or more | 61 (6.4%) | 29 (8.7%) |
| Total | 951 (100.0%) | 335 (100.0%) |
Monthly Housing Cost Tiers in Thermopolis
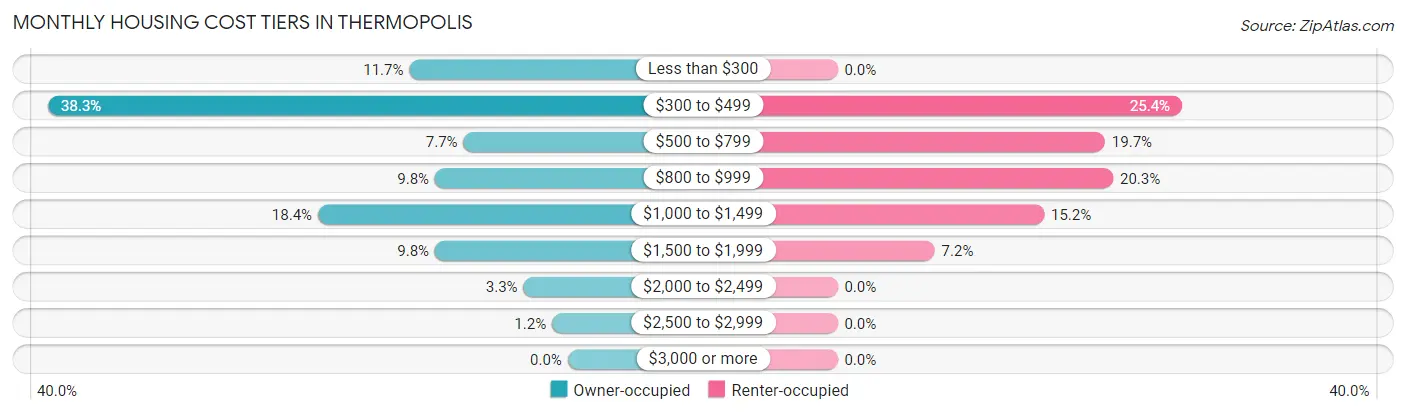
| Monthly Cost | Owner-occupied | Renter-occupied |
| Less than $300 | 111 (11.7%) | 0 (0.0%) |
| $300 to $499 | 364 (38.3%) | 85 (25.4%) |
| $500 to $799 | 73 (7.7%) | 66 (19.7%) |
| $800 to $999 | 93 (9.8%) | 68 (20.3%) |
| $1,000 to $1,499 | 175 (18.4%) | 51 (15.2%) |
| $1,500 to $1,999 | 93 (9.8%) | 24 (7.2%) |
| $2,000 to $2,499 | 31 (3.3%) | 0 (0.0%) |
| $2,500 to $2,999 | 11 (1.2%) | 0 (0.0%) |
| $3,000 or more | 0 (0.0%) | 0 (0.0%) |
| Total | 951 (100.0%) | 335 (100.0%) |
Physical Housing Characteristics in Thermopolis
Housing Structures in Thermopolis
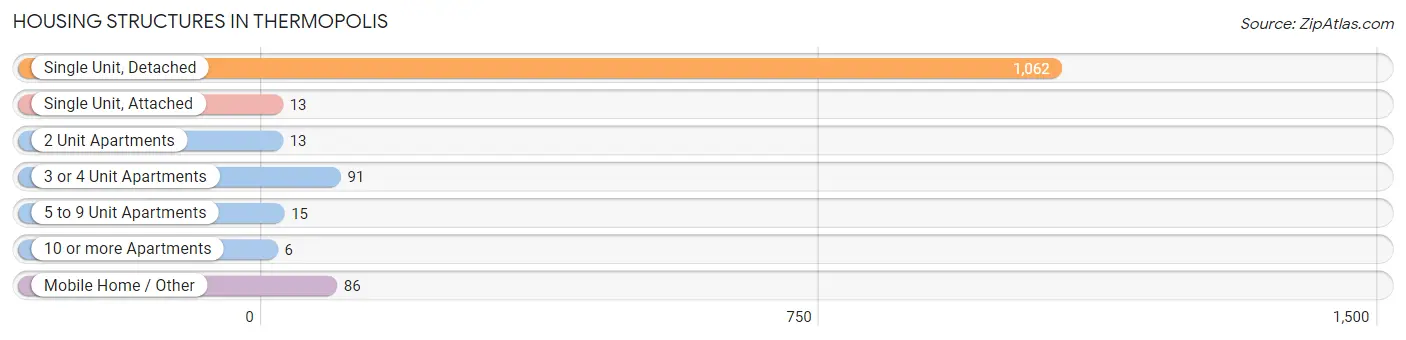
| Structure Type | # Housing Units | % Housing Units |
| Single Unit, Detached | 1,062 | 82.6% |
| Single Unit, Attached | 13 | 1.0% |
| 2 Unit Apartments | 13 | 1.0% |
| 3 or 4 Unit Apartments | 91 | 7.1% |
| 5 to 9 Unit Apartments | 15 | 1.2% |
| 10 or more Apartments | 6 | 0.5% |
| Mobile Home / Other | 86 | 6.7% |
| Total | 1,286 | 100.0% |
Housing Structures by Occupancy in Thermopolis
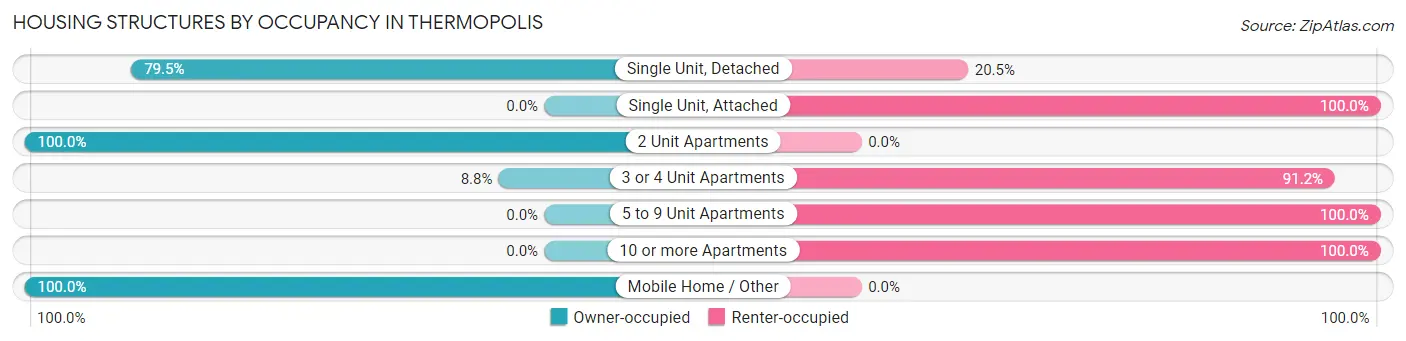
| Structure Type | Owner-occupied | Renter-occupied |
| Single Unit, Detached | 844 (79.5%) | 218 (20.5%) |
| Single Unit, Attached | 0 (0.0%) | 13 (100.0%) |
| 2 Unit Apartments | 13 (100.0%) | 0 (0.0%) |
| 3 or 4 Unit Apartments | 8 (8.8%) | 83 (91.2%) |
| 5 to 9 Unit Apartments | 0 (0.0%) | 15 (100.0%) |
| 10 or more Apartments | 0 (0.0%) | 6 (100.0%) |
| Mobile Home / Other | 86 (100.0%) | 0 (0.0%) |
| Total | 951 (74.0%) | 335 (26.1%) |
Housing Structures by Number of Rooms in Thermopolis
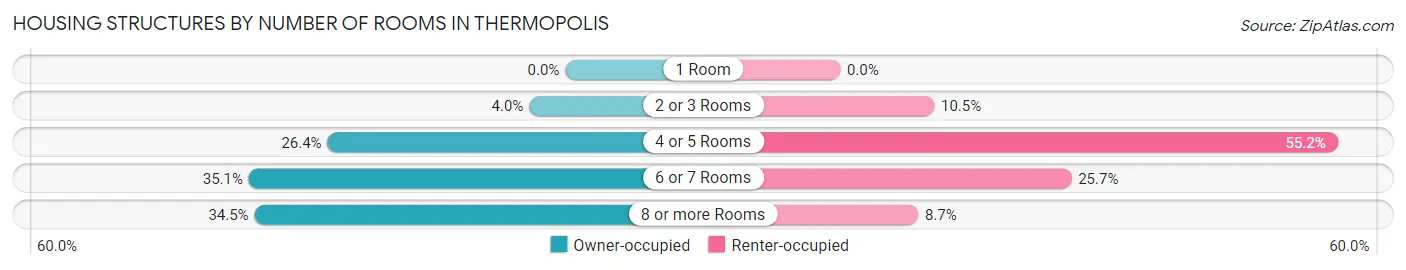
| Number of Rooms | Owner-occupied | Renter-occupied |
| 1 Room | 0 (0.0%) | 0 (0.0%) |
| 2 or 3 Rooms | 38 (4.0%) | 35 (10.4%) |
| 4 or 5 Rooms | 251 (26.4%) | 185 (55.2%) |
| 6 or 7 Rooms | 334 (35.1%) | 86 (25.7%) |
| 8 or more Rooms | 328 (34.5%) | 29 (8.7%) |
| Total | 951 (100.0%) | 335 (100.0%) |
Housing Structure by Heating Type in Thermopolis
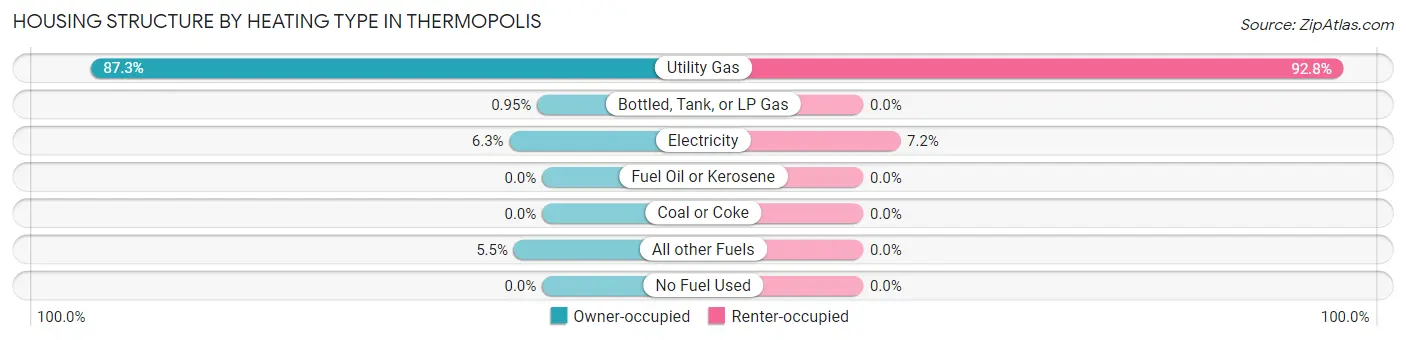
| Heating Type | Owner-occupied | Renter-occupied |
| Utility Gas | 830 (87.3%) | 311 (92.8%) |
| Bottled, Tank, or LP Gas | 9 (0.9%) | 0 (0.0%) |
| Electricity | 60 (6.3%) | 24 (7.2%) |
| Fuel Oil or Kerosene | 0 (0.0%) | 0 (0.0%) |
| Coal or Coke | 0 (0.0%) | 0 (0.0%) |
| All other Fuels | 52 (5.5%) | 0 (0.0%) |
| No Fuel Used | 0 (0.0%) | 0 (0.0%) |
| Total | 951 (100.0%) | 335 (100.0%) |
Household Vehicle Usage in Thermopolis
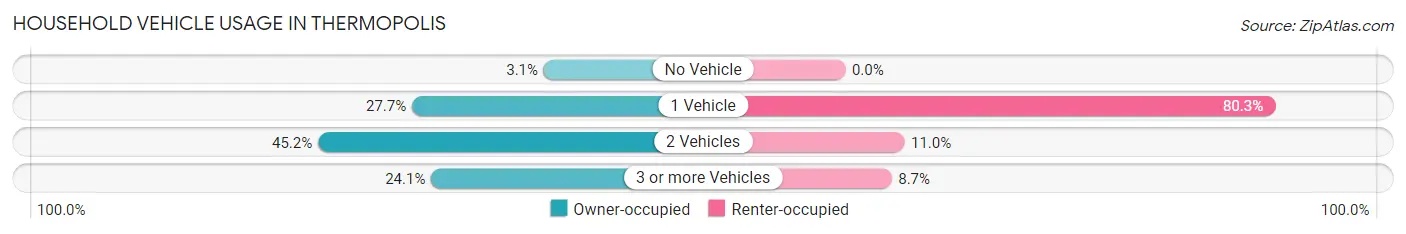
| Vehicles per Household | Owner-occupied | Renter-occupied |
| No Vehicle | 29 (3.0%) | 0 (0.0%) |
| 1 Vehicle | 263 (27.7%) | 269 (80.3%) |
| 2 Vehicles | 430 (45.2%) | 37 (11.0%) |
| 3 or more Vehicles | 229 (24.1%) | 29 (8.7%) |
| Total | 951 (100.0%) | 335 (100.0%) |
Real Estate & Mortgages in Thermopolis
Real Estate and Mortgage Overview in Thermopolis
| Characteristic | Without Mortgage | With Mortgage |
| Housing Units | 528 | 423 |
| Median Property Value | $155,700 | $211,300 |
| Median Household Income | $59,700 | $56 |
| Monthly Housing Costs | $390 | $0 |
| Real Estate Taxes | $960 | $4 |
Property Value by Mortgage Status in Thermopolis
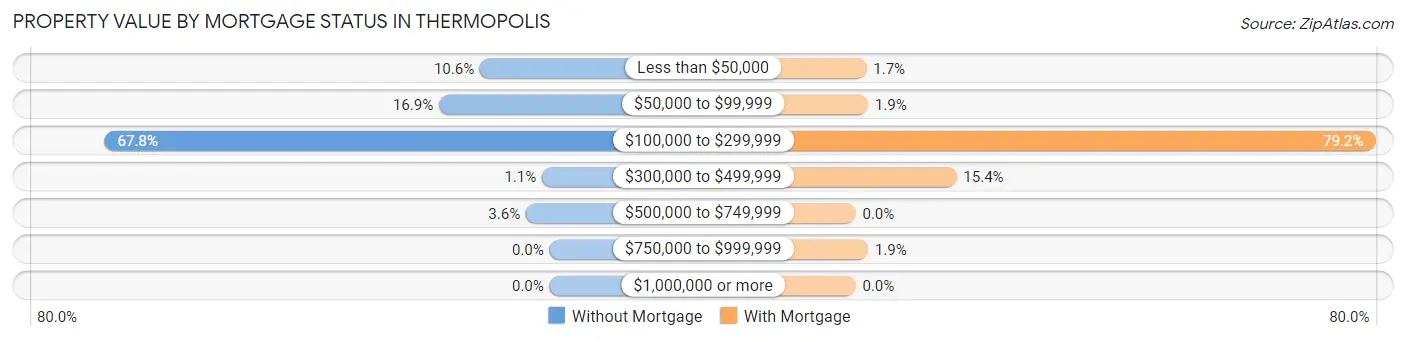
| Property Value | Without Mortgage | With Mortgage |
| Less than $50,000 | 56 (10.6%) | 7 (1.7%) |
| $50,000 to $99,999 | 89 (16.9%) | 8 (1.9%) |
| $100,000 to $299,999 | 358 (67.8%) | 335 (79.2%) |
| $300,000 to $499,999 | 6 (1.1%) | 65 (15.4%) |
| $500,000 to $749,999 | 19 (3.6%) | 0 (0.0%) |
| $750,000 to $999,999 | 0 (0.0%) | 8 (1.9%) |
| $1,000,000 or more | 0 (0.0%) | 0 (0.0%) |
| Total | 528 (100.0%) | 423 (100.0%) |
Household Income by Mortgage Status in Thermopolis
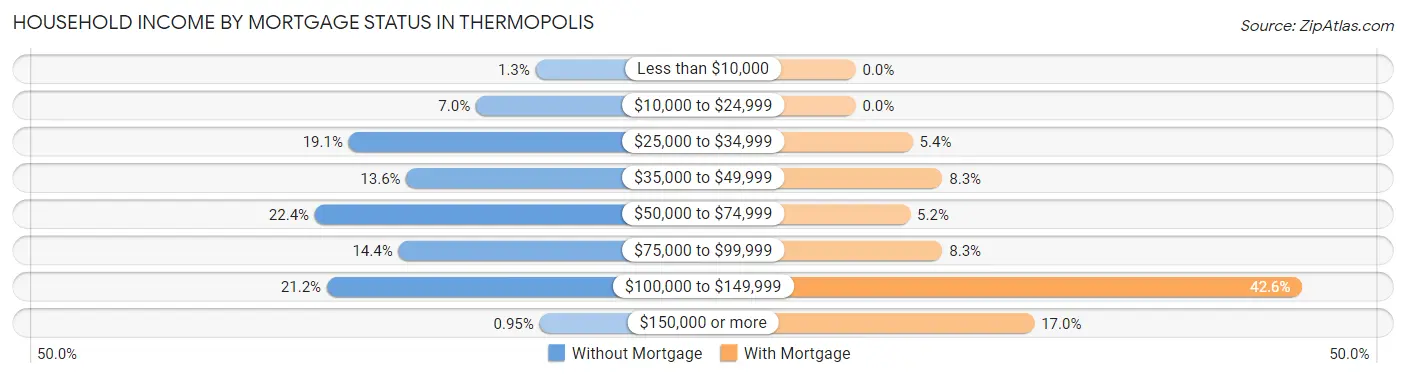
| Household Income | Without Mortgage | With Mortgage |
| Less than $10,000 | 7 (1.3%) | 0 (0.0%) |
| $10,000 to $24,999 | 37 (7.0%) | 0 (0.0%) |
| $25,000 to $34,999 | 101 (19.1%) | 23 (5.4%) |
| $35,000 to $49,999 | 72 (13.6%) | 35 (8.3%) |
| $50,000 to $74,999 | 118 (22.4%) | 22 (5.2%) |
| $75,000 to $99,999 | 76 (14.4%) | 35 (8.3%) |
| $100,000 to $149,999 | 112 (21.2%) | 180 (42.5%) |
| $150,000 or more | 5 (0.9%) | 72 (17.0%) |
| Total | 528 (100.0%) | 423 (100.0%) |
Property Value to Household Income Ratio in Thermopolis
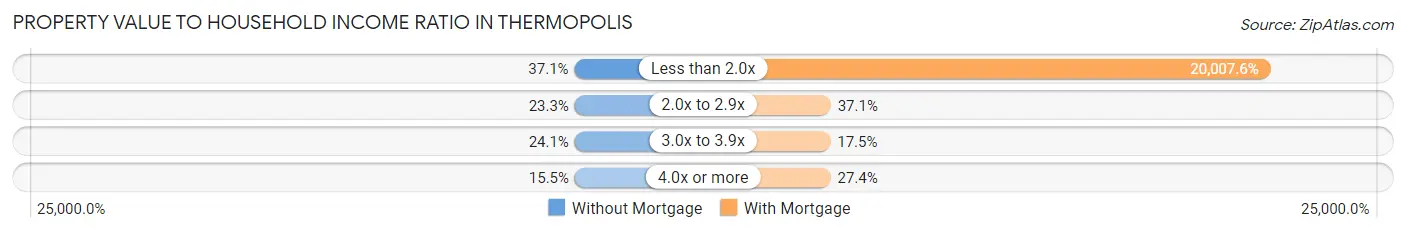
| Value-to-Income Ratio | Without Mortgage | With Mortgage |
| Less than 2.0x | 196 (37.1%) | 84,632 (20,007.6%) |
| 2.0x to 2.9x | 123 (23.3%) | 157 (37.1%) |
| 3.0x to 3.9x | 127 (24.0%) | 74 (17.5%) |
| 4.0x or more | 82 (15.5%) | 116 (27.4%) |
| Total | 528 (100.0%) | 423 (100.0%) |
Real Estate Taxes by Mortgage Status in Thermopolis
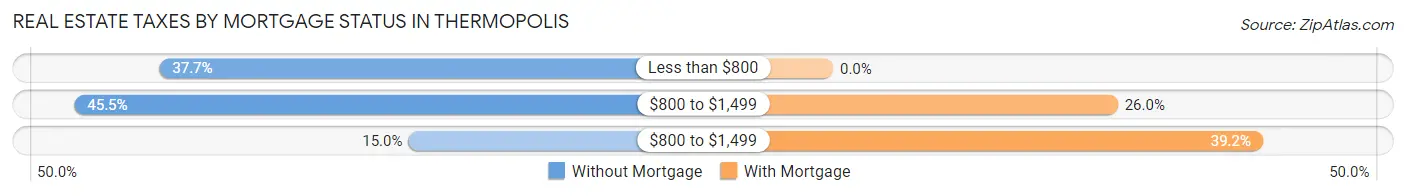
| Property Taxes | Without Mortgage | With Mortgage |
| Less than $800 | 199 (37.7%) | 0 (0.0%) |
| $800 to $1,499 | 240 (45.5%) | 110 (26.0%) |
| $800 to $1,499 | 79 (15.0%) | 166 (39.2%) |
| Total | 528 (100.0%) | 423 (100.0%) |
Health & Disability in Thermopolis
Health Insurance Coverage by Age in Thermopolis
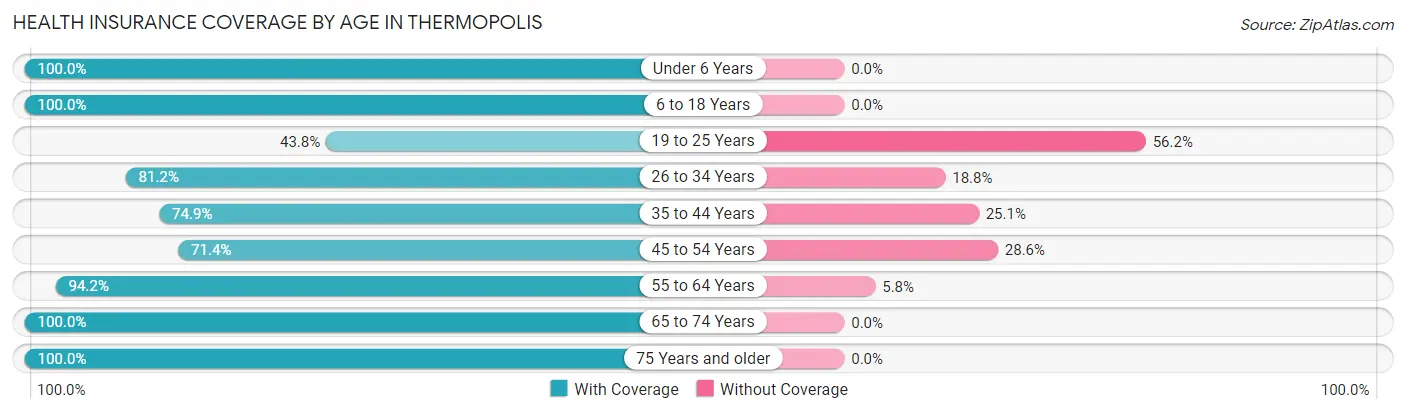
| Age Bracket | With Coverage | Without Coverage |
| Under 6 Years | 155 (100.0%) | 0 (0.0%) |
| 6 to 18 Years | 389 (100.0%) | 0 (0.0%) |
| 19 to 25 Years | 127 (43.8%) | 163 (56.2%) |
| 26 to 34 Years | 112 (81.2%) | 26 (18.8%) |
| 35 to 44 Years | 266 (74.9%) | 89 (25.1%) |
| 45 to 54 Years | 152 (71.4%) | 61 (28.6%) |
| 55 to 64 Years | 375 (94.2%) | 23 (5.8%) |
| 65 to 74 Years | 449 (100.0%) | 0 (0.0%) |
| 75 Years and older | 261 (100.0%) | 0 (0.0%) |
| Total | 2,286 (86.3%) | 362 (13.7%) |
Health Insurance Coverage by Citizenship Status in Thermopolis
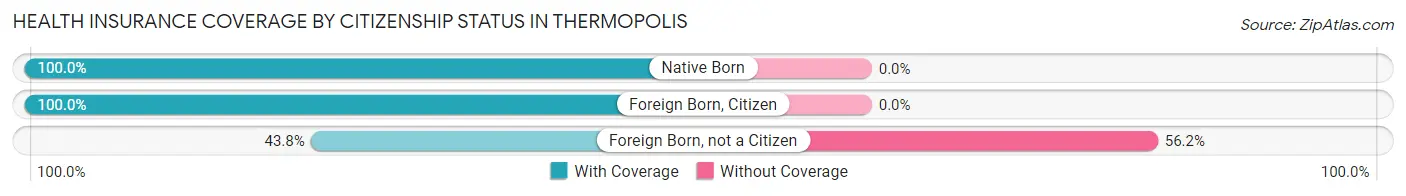
| Citizenship Status | With Coverage | Without Coverage |
| Native Born | 155 (100.0%) | 0 (0.0%) |
| Foreign Born, Citizen | 389 (100.0%) | 0 (0.0%) |
| Foreign Born, not a Citizen | 127 (43.8%) | 163 (56.2%) |
Health Insurance Coverage by Household Income in Thermopolis
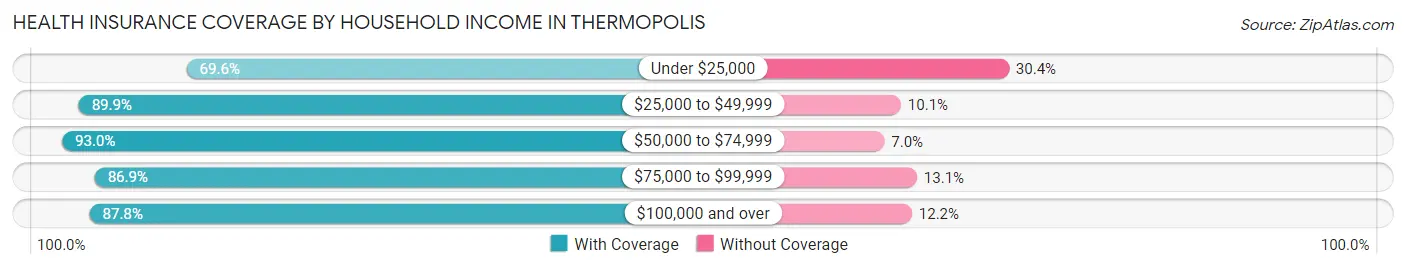
| Household Income | With Coverage | Without Coverage |
| Under $25,000 | 243 (69.6%) | 106 (30.4%) |
| $25,000 to $49,999 | 594 (89.9%) | 67 (10.1%) |
| $50,000 to $74,999 | 291 (93.0%) | 22 (7.0%) |
| $75,000 to $99,999 | 542 (86.9%) | 82 (13.1%) |
| $100,000 and over | 605 (87.8%) | 84 (12.2%) |
Public vs Private Health Insurance Coverage by Age in Thermopolis
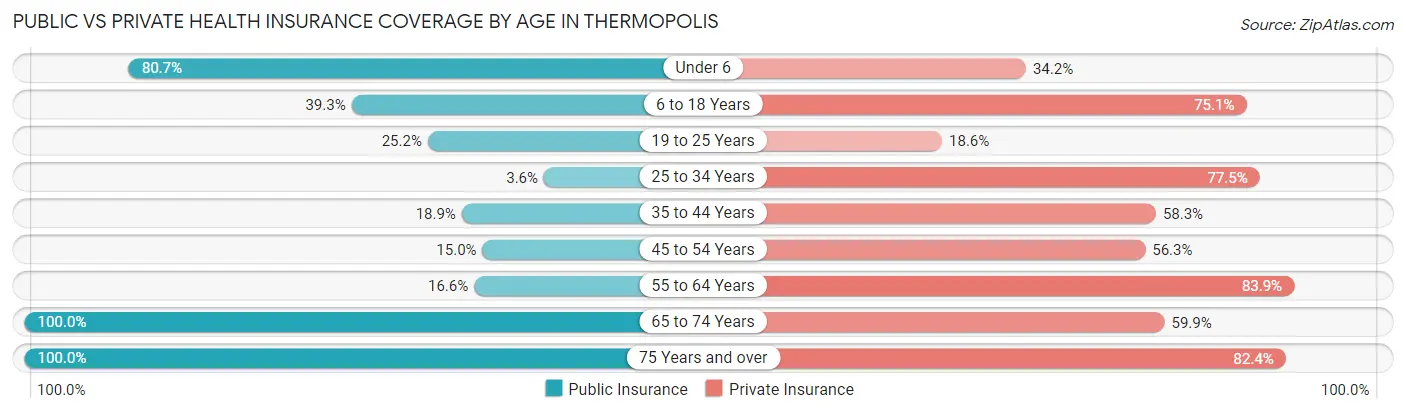
| Age Bracket | Public Insurance | Private Insurance |
| Under 6 | 125 (80.6%) | 53 (34.2%) |
| 6 to 18 Years | 153 (39.3%) | 292 (75.1%) |
| 19 to 25 Years | 73 (25.2%) | 54 (18.6%) |
| 25 to 34 Years | 5 (3.6%) | 107 (77.5%) |
| 35 to 44 Years | 67 (18.9%) | 207 (58.3%) |
| 45 to 54 Years | 32 (15.0%) | 120 (56.3%) |
| 55 to 64 Years | 66 (16.6%) | 334 (83.9%) |
| 65 to 74 Years | 449 (100.0%) | 269 (59.9%) |
| 75 Years and over | 261 (100.0%) | 215 (82.4%) |
| Total | 1,231 (46.5%) | 1,651 (62.4%) |
Disability Status by Sex by Age in Thermopolis
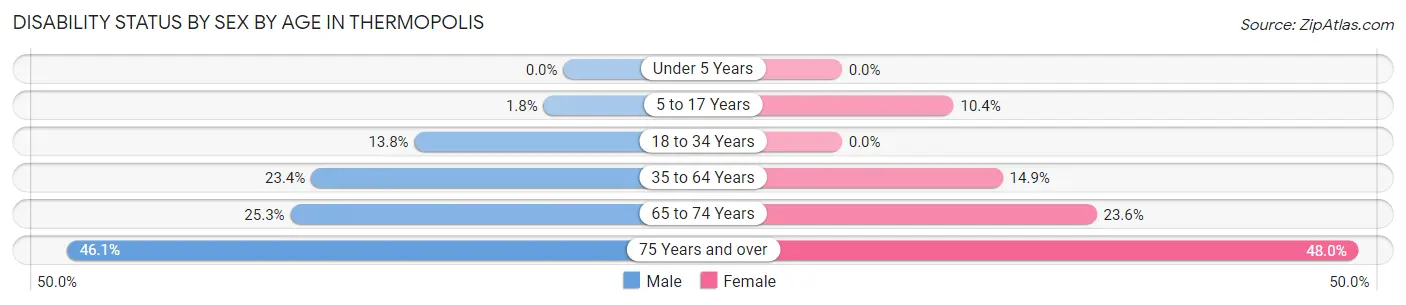
| Age Bracket | Male | Female |
| Under 5 Years | 0 (0.0%) | 0 (0.0%) |
| 5 to 17 Years | 3 (1.8%) | 25 (10.4%) |
| 18 to 34 Years | 34 (13.8%) | 0 (0.0%) |
| 35 to 64 Years | 107 (23.4%) | 76 (14.9%) |
| 65 to 74 Years | 58 (25.3%) | 52 (23.6%) |
| 75 Years and over | 53 (46.1%) | 70 (47.9%) |
Disability Class by Sex by Age in Thermopolis
Disability Class: Hearing Difficulty
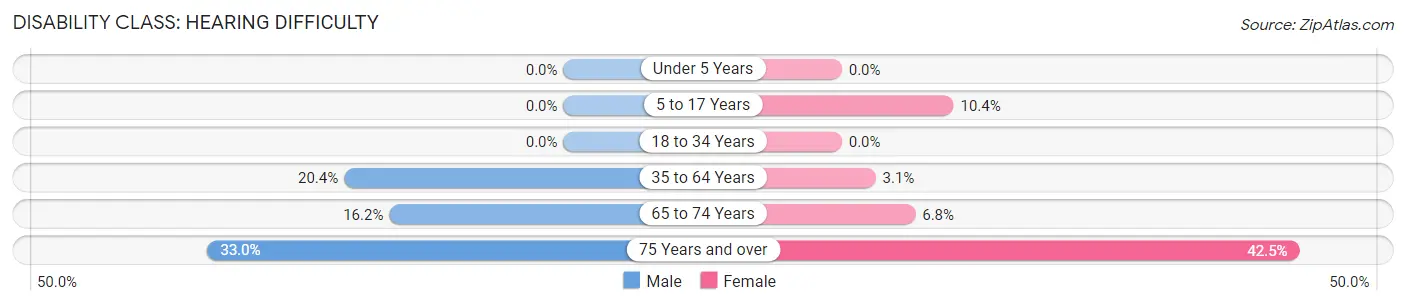
| Age Bracket | Male | Female |
| Under 5 Years | 0 (0.0%) | 0 (0.0%) |
| 5 to 17 Years | 0 (0.0%) | 25 (10.4%) |
| 18 to 34 Years | 0 (0.0%) | 0 (0.0%) |
| 35 to 64 Years | 93 (20.3%) | 16 (3.1%) |
| 65 to 74 Years | 37 (16.2%) | 15 (6.8%) |
| 75 Years and over | 38 (33.0%) | 62 (42.5%) |
Disability Class: Vision Difficulty
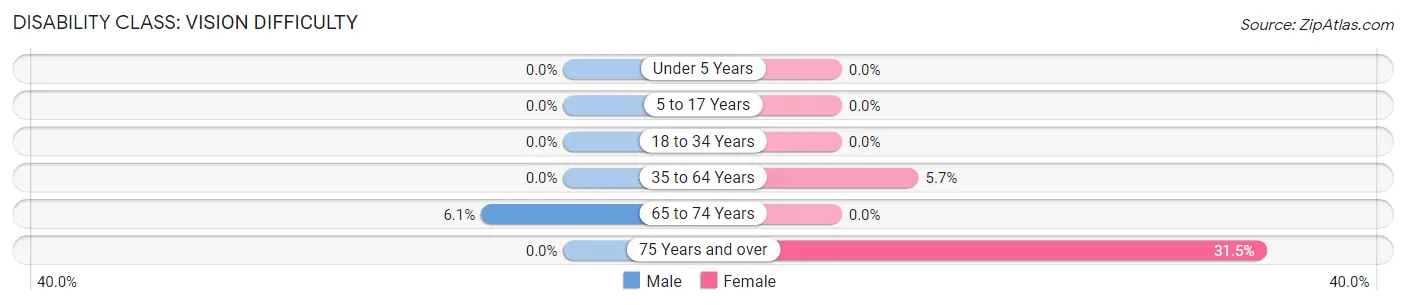
| Age Bracket | Male | Female |
| Under 5 Years | 0 (0.0%) | 0 (0.0%) |
| 5 to 17 Years | 0 (0.0%) | 0 (0.0%) |
| 18 to 34 Years | 0 (0.0%) | 0 (0.0%) |
| 35 to 64 Years | 0 (0.0%) | 29 (5.7%) |
| 65 to 74 Years | 14 (6.1%) | 0 (0.0%) |
| 75 Years and over | 0 (0.0%) | 46 (31.5%) |
Disability Class: Cognitive Difficulty
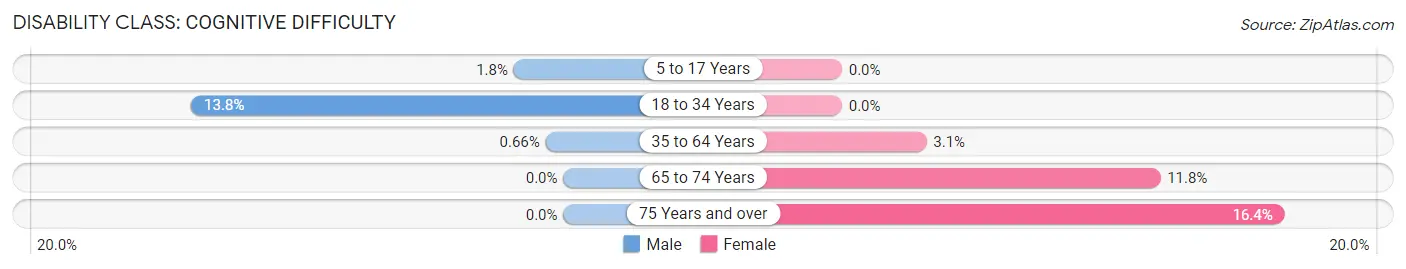
| Age Bracket | Male | Female |
| 5 to 17 Years | 3 (1.8%) | 0 (0.0%) |
| 18 to 34 Years | 34 (13.8%) | 0 (0.0%) |
| 35 to 64 Years | 3 (0.7%) | 16 (3.1%) |
| 65 to 74 Years | 0 (0.0%) | 26 (11.8%) |
| 75 Years and over | 0 (0.0%) | 24 (16.4%) |
Disability Class: Ambulatory Difficulty
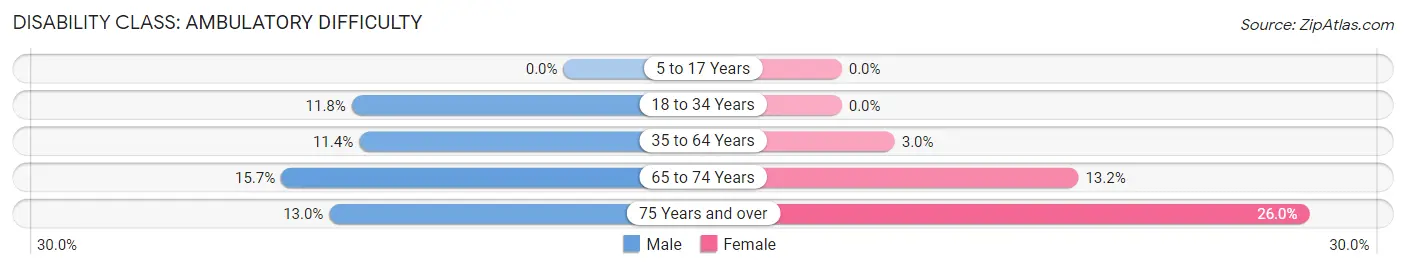
| Age Bracket | Male | Female |
| 5 to 17 Years | 0 (0.0%) | 0 (0.0%) |
| 18 to 34 Years | 29 (11.8%) | 0 (0.0%) |
| 35 to 64 Years | 52 (11.4%) | 15 (2.9%) |
| 65 to 74 Years | 36 (15.7%) | 29 (13.2%) |
| 75 Years and over | 15 (13.0%) | 38 (26.0%) |
Disability Class: Self-Care Difficulty
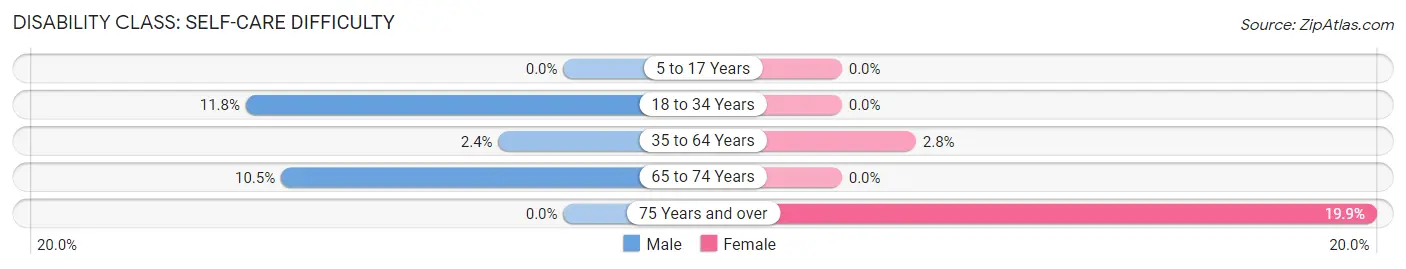
| Age Bracket | Male | Female |
| 5 to 17 Years | 0 (0.0%) | 0 (0.0%) |
| 18 to 34 Years | 29 (11.8%) | 0 (0.0%) |
| 35 to 64 Years | 11 (2.4%) | 14 (2.8%) |
| 65 to 74 Years | 24 (10.5%) | 0 (0.0%) |
| 75 Years and over | 0 (0.0%) | 29 (19.9%) |
Technology Access in Thermopolis
Computing Device Access in Thermopolis
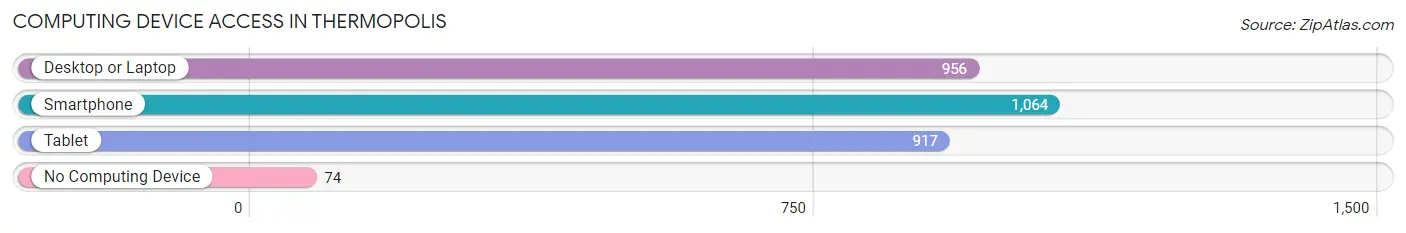
| Device Type | # Households | % Households |
| Desktop or Laptop | 956 | 74.3% |
| Smartphone | 1,064 | 82.7% |
| Tablet | 917 | 71.3% |
| No Computing Device | 74 | 5.8% |
| Total | 1,286 | 100.0% |
Internet Access in Thermopolis
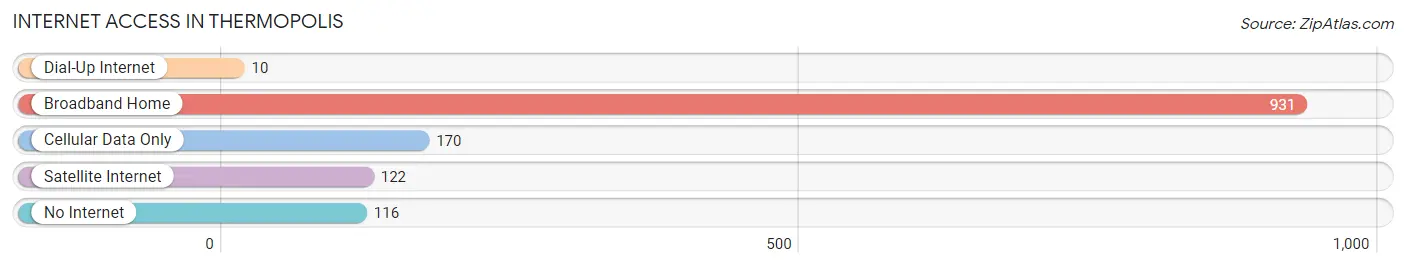
| Internet Type | # Households | % Households |
| Dial-Up Internet | 10 | 0.8% |
| Broadband Home | 931 | 72.4% |
| Cellular Data Only | 170 | 13.2% |
| Satellite Internet | 122 | 9.5% |
| No Internet | 116 | 9.0% |
| Total | 1,286 | 100.0% |
Thermopolis Summary
Thermopolis, Wyoming is a small town located in Hot Springs County in the northwest corner of the state. It is the county seat and the largest town in the county. The town is situated on the banks of the Big Horn River and is surrounded by the Big Horn Mountains. The town is known for its hot springs, which are the largest in the world and attract visitors from all over the world.
History
The area around Thermopolis has been inhabited for thousands of years by Native American tribes, including the Shoshone, Arapaho, and Crow. The first Europeans to visit the area were fur trappers in the early 1800s. The town was founded in 1883 by the Wyoming Stock Growers Association, who built a stockyard and a hotel. The town was named after the hot springs, which were discovered by a group of prospectors in 1883.
The town grew rapidly in the late 1800s and early 1900s, and by 1910 it had a population of over 1,000. The town was incorporated in 1911 and the first mayor was elected in 1912. The town continued to grow and by 1920 the population had reached 2,000.
In the 1920s, the town became a popular tourist destination due to its hot springs. The town was also home to a number of businesses, including a hotel, a bank, a newspaper, and a movie theater. The town also had a number of churches, including the First Baptist Church, which was founded in 1921.
The town continued to grow in the 1930s and 1940s, and by 1950 the population had reached 3,000. The town was also home to a number of businesses, including a hospital, a library, and a number of stores. The town also had a number of churches, including the First Baptist Church, which was founded in 1921.
The town continued to grow in the 1950s and 1960s, and by 1970 the population had reached 4,000. The town was also home to a number of businesses, including a hospital, a library, and a number of stores. The town also had a number of churches, including the First Baptist Church, which was founded in 1921.
The town continued to grow in the 1970s and 1980s, and by 1990 the population had reached 5,000. The town was also home to a number of businesses, including a hospital, a library, and a number of stores. The town also had a number of churches, including the First Baptist Church, which was founded in 1921.
Geography
Thermopolis is located in the northwest corner of Wyoming, in Hot Springs County. The town is situated on the banks of the Big Horn River and is surrounded by the Big Horn Mountains. The town is located at an elevation of 4,400 feet above sea level. The town has a total area of 4.2 square miles, of which 4.1 square miles is land and 0.1 square miles is water.
The climate in Thermopolis is semi-arid, with hot summers and cold winters. The average temperature in the summer is around 80 degrees Fahrenheit, and the average temperature in the winter is around 20 degrees Fahrenheit. The town receives an average of 16 inches of precipitation per year.
Economy
The economy of Thermopolis is largely based on tourism, due to its hot springs. The town is home to a number of hotels, restaurants, and other businesses that cater to tourists. The town is also home to a number of manufacturing businesses, including a furniture factory and a plastics factory.
The town is also home to a number of government offices, including the Hot Springs County Courthouse and the Hot Springs County Sheriff's Office. The town is also home to a number of schools, including Hot Springs County High School and Thermopolis Middle School.
Demographics
As of the 2010 census, the population of Thermopolis was 5,255. The racial makeup of the town was 94.3% White, 0.7% African American, 0.7% Native American, 0.3% Asian, 0.1% Pacific Islander, 1.3% from other races, and 2.6% from two or more races. Hispanic or Latino of any race were 4.2% of the population.
The median income for a household in the town was $37,917, and the median income for a family was $45,938. The per capita income for the town was $19,945. About 11.3% of families and 14.2% of the population were below the poverty line, including 19.2% of those under age 18 and 8.2% of those age 65 or over.
Common Questions
What is Per Capita Income in Thermopolis?
Per Capita income in Thermopolis is $34,307.
What is the Median Family Income in Thermopolis?
Median Family Income in Thermopolis is $85,063.
What is the Median Household income in Thermopolis?
Median Household Income in Thermopolis is $66,591.
What is Income or Wage Gap in Thermopolis?
Income or Wage Gap in Thermopolis is 16.9%.
Women in Thermopolis earn 83.1 cents for every dollar earned by a man.
What is Inequality or Gini Index in Thermopolis?
Inequality or Gini Index in Thermopolis is 0.37.
What is the Total Population of Thermopolis?
Total Population of Thermopolis is 2,722.
What is the Total Male Population of Thermopolis?
Total Male Population of Thermopolis is 1,355.
What is the Total Female Population of Thermopolis?
Total Female Population of Thermopolis is 1,367.
What is the Ratio of Males per 100 Females in Thermopolis?
There are 99.12 Males per 100 Females in Thermopolis.
What is the Ratio of Females per 100 Males in Thermopolis?
There are 100.89 Females per 100 Males in Thermopolis.
What is the Median Population Age in Thermopolis?
Median Population Age in Thermopolis is 46.0 Years.
What is the Average Family Size in Thermopolis
Average Family Size in Thermopolis is 2.5 People.
What is the Average Household Size in Thermopolis
Average Household Size in Thermopolis is 2.0 People.
How Large is the Labor Force in Thermopolis?
There are 1,272 People in the Labor Forcein in Thermopolis.
What is the Percentage of People in the Labor Force in Thermopolis?
57.0% of People are in the Labor Force in Thermopolis.
What is the Unemployment Rate in Thermopolis?
Unemployment Rate in Thermopolis is 0.9%.