Rock Springs, WY Map & Demographics
Rock Springs Map
Rock Springs Overview
$40,921
PER CAPITA INCOME
$95,983
AVG FAMILY INCOME
$75,863
AVG HOUSEHOLD INCOME
45.2%
WAGE / INCOME GAP [ % ]
54.8¢/ $1
WAGE / INCOME GAP [ $ ]
$9,921
FAMILY INCOME DEFICIT
0.47
INEQUALITY / GINI INDEX
23,361
TOTAL POPULATION
12,188
MALE POPULATION
11,173
FEMALE POPULATION
109.08
MALES / 100 FEMALES
91.67
FEMALES / 100 MALES
35.2
MEDIAN AGE
3.2
AVG FAMILY SIZE
2.5
AVG HOUSEHOLD SIZE
12,754
LABOR FORCE [ PEOPLE ]
71.1%
PERCENT IN LABOR FORCE
5.4%
UNEMPLOYMENT RATE
Rock Springs Zip Codes
Rock Springs Area Codes
Income in Rock Springs
Income Overview in Rock Springs
Per Capita Income in Rock Springs is $40,921, while median incomes of families and households are $95,983 and $75,863 respectively.
| Characteristic | Number | Measure |
| Per Capita Income | 23,361 | $40,921 |
| Median Family Income | 5,690 | $95,983 |
| Mean Family Income | 5,690 | $126,682 |
| Median Household Income | 9,017 | $75,863 |
| Mean Household Income | 9,017 | $102,150 |
| Income Deficit | 5,690 | $9,921 |
| Wage / Income Gap (%) | 23,361 | 45.25% |
| Wage / Income Gap ($) | 23,361 | 54.75¢ per $1 |
| Gini / Inequality Index | 23,361 | 0.47 |
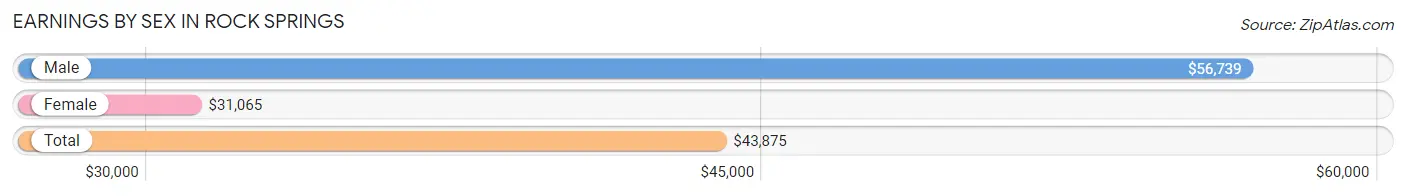
Earnings by Sex in Rock Springs
Average Earnings in Rock Springs are $43,875, $56,739 for men and $31,065 for women, a difference of 45.3%.
| Sex | Number | Average Earnings |
| Male | 7,363 (55.5%) | $56,739 |
| Female | 5,906 (44.5%) | $31,065 |
| Total | 13,269 (100.0%) | $43,875 |
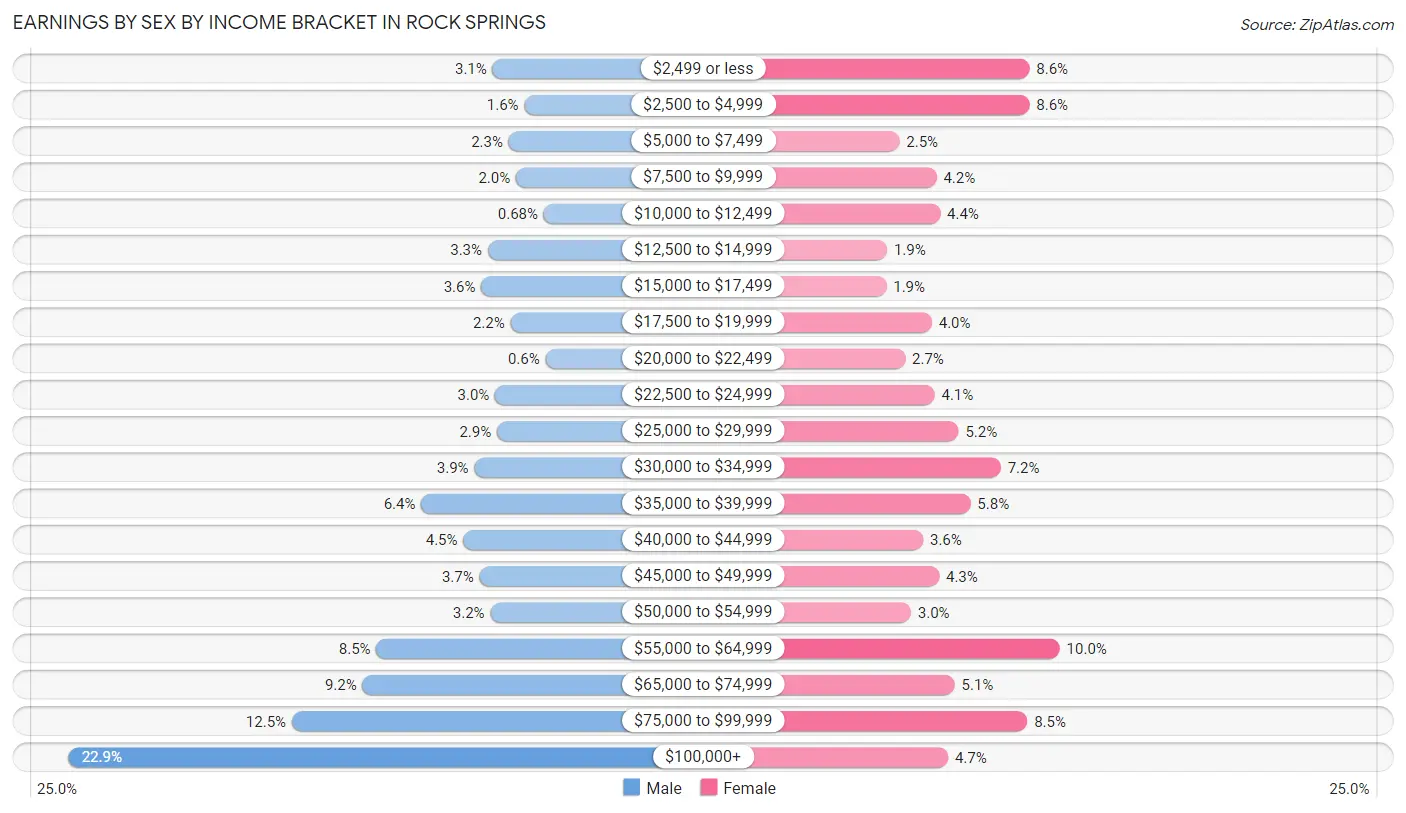
Earnings by Sex by Income Bracket in Rock Springs
The most common earnings brackets in Rock Springs are $100,000+ for men (1,688 | 22.9%) and $55,000 to $64,999 for women (589 | 10.0%).
| Income | Male | Female |
| $2,499 or less | 227 (3.1%) | 505 (8.6%) |
| $2,500 to $4,999 | 117 (1.6%) | 505 (8.6%) |
| $5,000 to $7,499 | 171 (2.3%) | 145 (2.5%) |
| $7,500 to $9,999 | 146 (2.0%) | 248 (4.2%) |
| $10,000 to $12,499 | 50 (0.7%) | 258 (4.4%) |
| $12,500 to $14,999 | 243 (3.3%) | 111 (1.9%) |
| $15,000 to $17,499 | 266 (3.6%) | 109 (1.8%) |
| $17,500 to $19,999 | 165 (2.2%) | 235 (4.0%) |
| $20,000 to $22,499 | 44 (0.6%) | 161 (2.7%) |
| $22,500 to $24,999 | 218 (3.0%) | 243 (4.1%) |
| $25,000 to $29,999 | 211 (2.9%) | 309 (5.2%) |
| $30,000 to $34,999 | 289 (3.9%) | 426 (7.2%) |
| $35,000 to $39,999 | 473 (6.4%) | 342 (5.8%) |
| $40,000 to $44,999 | 328 (4.4%) | 211 (3.6%) |
| $45,000 to $49,999 | 272 (3.7%) | 255 (4.3%) |
| $50,000 to $54,999 | 234 (3.2%) | 177 (3.0%) |
| $55,000 to $64,999 | 627 (8.5%) | 589 (10.0%) |
| $65,000 to $74,999 | 675 (9.2%) | 298 (5.1%) |
| $75,000 to $99,999 | 919 (12.5%) | 499 (8.5%) |
| $100,000+ | 1,688 (22.9%) | 280 (4.7%) |
| Total | 7,363 (100.0%) | 5,906 (100.0%) |
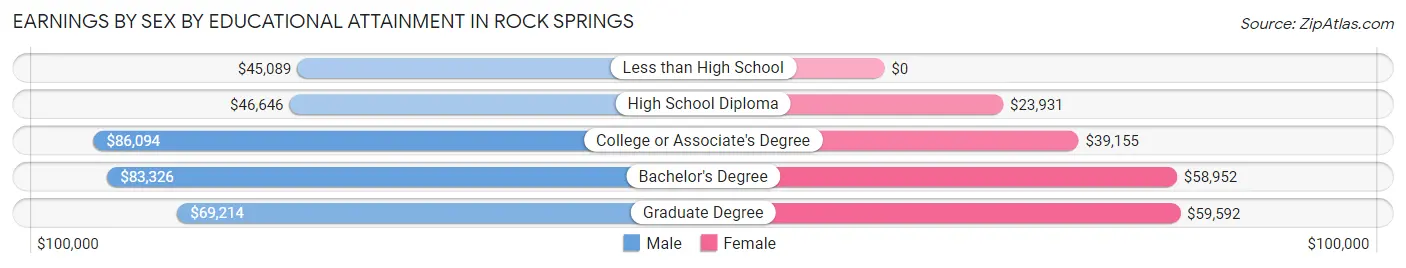
Earnings by Sex by Educational Attainment in Rock Springs
Average earnings in Rock Springs are $61,742 for men and $39,109 for women, a difference of 36.7%. Men with an educational attainment of college or associate's degree enjoy the highest average annual earnings of $86,094, while those with less than high school education earn the least with $45,089. Women with an educational attainment of graduate degree earn the most with the average annual earnings of $59,592, while those with high school diploma education have the smallest earnings of $23,931.
| Educational Attainment | Male Income | Female Income |
| Less than High School | $45,089 | $0 |
| High School Diploma | $46,646 | $23,931 |
| College or Associate's Degree | $86,094 | $39,155 |
| Bachelor's Degree | $83,326 | $58,952 |
| Graduate Degree | $69,214 | $59,592 |
| Total | $61,742 | $39,109 |
Family Income in Rock Springs
Family Income Brackets in Rock Springs
According to the Rock Springs family income data, there are 1,371 families falling into the $100,000 to $149,999 income range, which is the most common income bracket and makes up 24.1% of all families. Conversely, the $10,000 to $14,999 income bracket is the least frequent group with only 119 families (2.1%) belonging to this category.
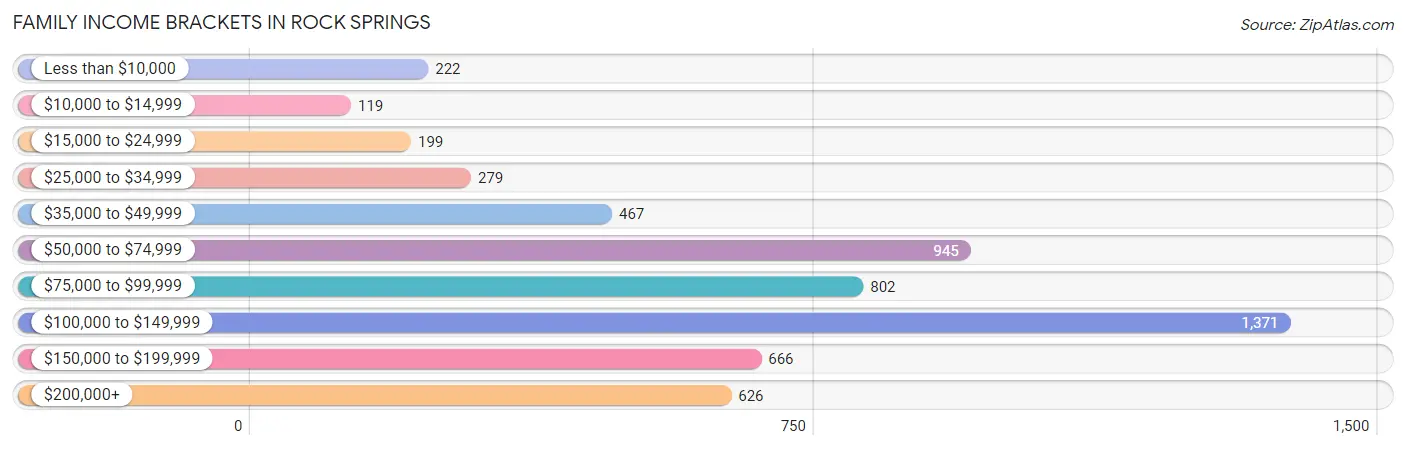
| Income Bracket | # Families | % Families |
| Less than $10,000 | 222 | 3.9% |
| $10,000 to $14,999 | 119 | 2.1% |
| $15,000 to $24,999 | 199 | 3.5% |
| $25,000 to $34,999 | 279 | 4.9% |
| $35,000 to $49,999 | 467 | 8.2% |
| $50,000 to $74,999 | 945 | 16.6% |
| $75,000 to $99,999 | 802 | 14.1% |
| $100,000 to $149,999 | 1,371 | 24.1% |
| $150,000 to $199,999 | 666 | 11.7% |
| $200,000+ | 626 | 11.0% |
Family Income by Famaliy Size in Rock Springs
6-person families (275 | 4.8%) account for the highest median family income in Rock Springs with $134,205 per family, while 2-person families (2,512 | 44.2%) have the highest median income of $43,786 per family member.
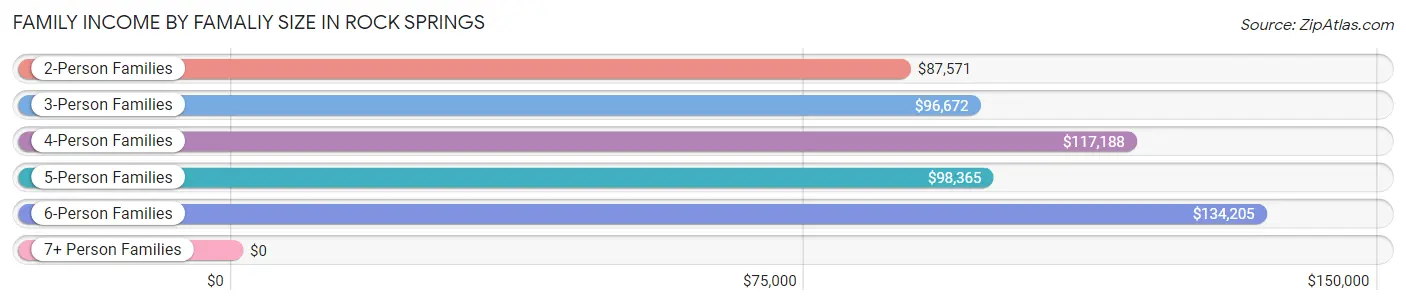
| Income Bracket | # Families | Median Income |
| 2-Person Families | 2,512 (44.2%) | $87,571 |
| 3-Person Families | 1,287 (22.6%) | $96,672 |
| 4-Person Families | 788 (13.9%) | $117,188 |
| 5-Person Families | 756 (13.3%) | $98,365 |
| 6-Person Families | 275 (4.8%) | $134,205 |
| 7+ Person Families | 72 (1.3%) | $0 |
| Total | 5,690 (100.0%) | $95,983 |
Family Income by Number of Earners in Rock Springs
The median family income in Rock Springs is $95,983, with families comprising 3+ earners (808) having the highest median family income of $170,406, while families with no earners (609) have the lowest median family income of $61,042, accounting for 14.2% and 10.7% of families, respectively.
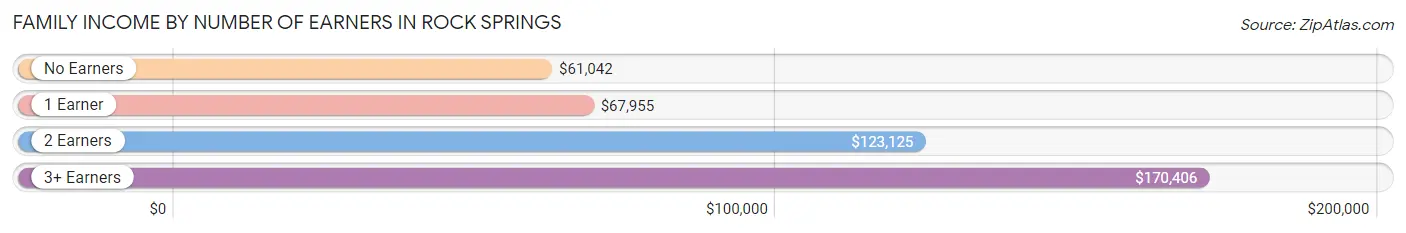
| Number of Earners | # Families | Median Income |
| No Earners | 609 (10.7%) | $61,042 |
| 1 Earner | 1,822 (32.0%) | $67,955 |
| 2 Earners | 2,451 (43.1%) | $123,125 |
| 3+ Earners | 808 (14.2%) | $170,406 |
| Total | 5,690 (100.0%) | $95,983 |
Household Income in Rock Springs
Household Income Brackets in Rock Springs
With 1,993 households falling in the category, the $100,000 to $149,999 income range is the most frequent in Rock Springs, accounting for 22.1% of all households. In contrast, only 307 households (3.4%) fall into the $10,000 to $14,999 income bracket, making it the least populous group.
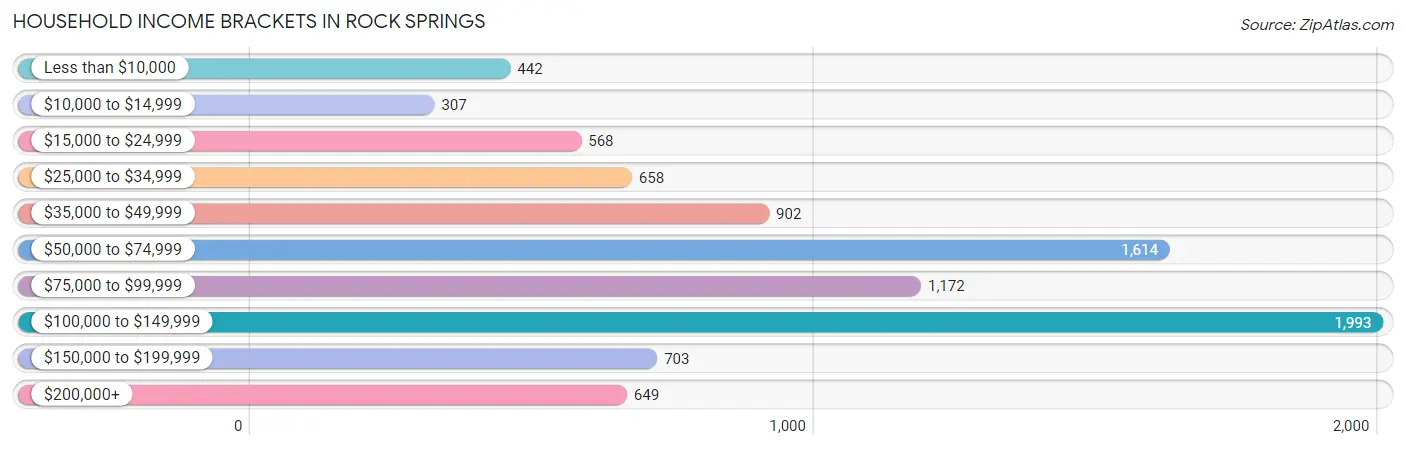
| Income Bracket | # Households | % Households |
| Less than $10,000 | 442 | 4.9% |
| $10,000 to $14,999 | 307 | 3.4% |
| $15,000 to $24,999 | 568 | 6.3% |
| $25,000 to $34,999 | 658 | 7.3% |
| $35,000 to $49,999 | 902 | 10.0% |
| $50,000 to $74,999 | 1,614 | 17.9% |
| $75,000 to $99,999 | 1,172 | 13.0% |
| $100,000 to $149,999 | 1,993 | 22.1% |
| $150,000 to $199,999 | 703 | 7.8% |
| $200,000+ | 649 | 7.2% |
Household Income by Householder Age in Rock Springs
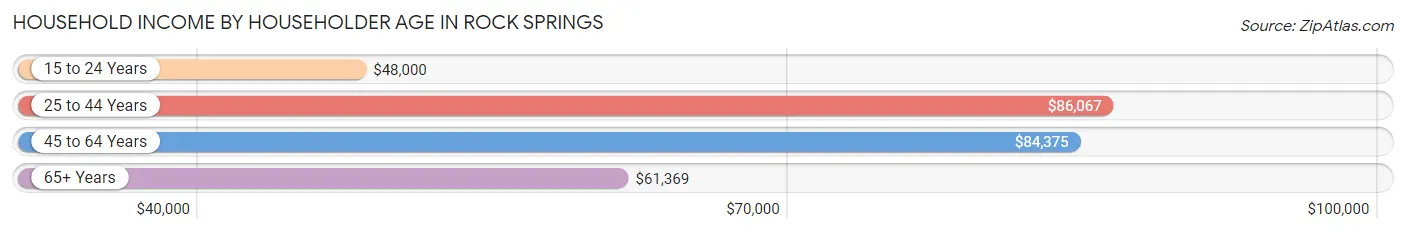
The median household income in Rock Springs is $75,863, with the highest median household income of $86,067 found in the 25 to 44 years age bracket for the primary householder. A total of 3,418 households (37.9%) fall into this category. Meanwhile, the 15 to 24 years age bracket for the primary householder has the lowest median household income of $48,000, with 482 households (5.3%) in this group.
| Income Bracket | # Households | Median Income |
| 15 to 24 Years | 482 (5.3%) | $48,000 |
| 25 to 44 Years | 3,418 (37.9%) | $86,067 |
| 45 to 64 Years | 3,258 (36.1%) | $84,375 |
| 65+ Years | 1,859 (20.6%) | $61,369 |
| Total | 9,017 (100.0%) | $75,863 |
Poverty in Rock Springs
Income Below Poverty by Sex and Age in Rock Springs
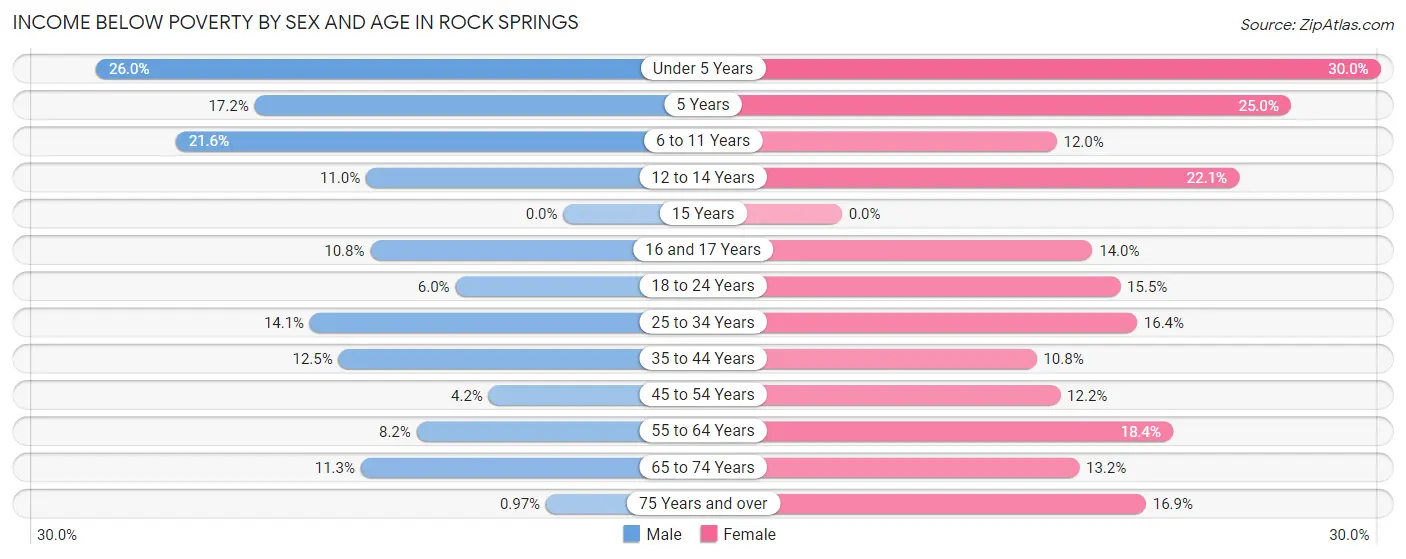
With 11.5% poverty level for males and 15.6% for females among the residents of Rock Springs, under 5 year old males and under 5 year old females are the most vulnerable to poverty, with 178 males (26.0%) and 206 females (30.0%) in their respective age groups living below the poverty level.
| Age Bracket | Male | Female |
| Under 5 Years | 178 (26.0%) | 206 (30.0%) |
| 5 Years | 32 (17.2%) | 41 (25.0%) |
| 6 to 11 Years | 213 (21.6%) | 105 (12.0%) |
| 12 to 14 Years | 69 (11.0%) | 159 (22.1%) |
| 15 Years | 0 (0.0%) | 0 (0.0%) |
| 16 and 17 Years | 33 (10.7%) | 47 (14.0%) |
| 18 to 24 Years | 73 (6.0%) | 168 (15.5%) |
| 25 to 34 Years | 243 (14.1%) | 209 (16.4%) |
| 35 to 44 Years | 254 (12.5%) | 185 (10.8%) |
| 45 to 54 Years | 57 (4.2%) | 148 (12.2%) |
| 55 to 64 Years | 105 (8.2%) | 251 (18.4%) |
| 65 to 74 Years | 111 (11.3%) | 116 (13.2%) |
| 75 Years and over | 4 (1.0%) | 74 (16.9%) |
| Total | 1,372 (11.5%) | 1,709 (15.6%) |
Income Above Poverty by Sex and Age in Rock Springs
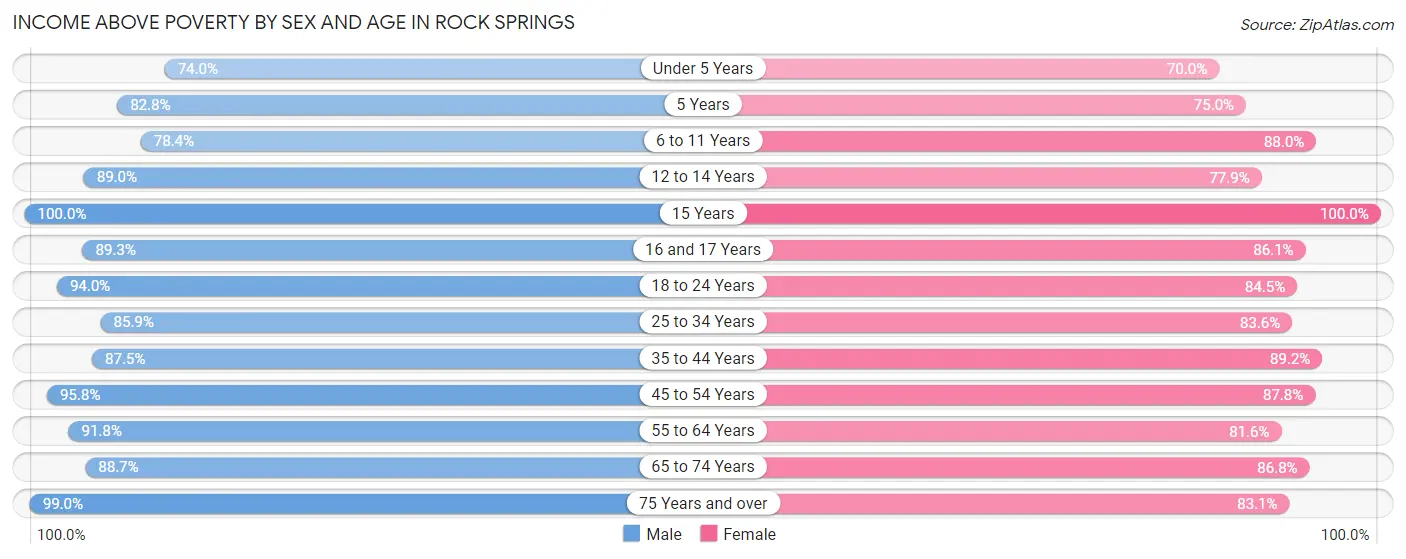
According to the poverty statistics in Rock Springs, males aged 15 years and females aged 15 years are the age groups that are most secure financially, with 100.0% of males and 100.0% of females in these age groups living above the poverty line.
| Age Bracket | Male | Female |
| Under 5 Years | 506 (74.0%) | 481 (70.0%) |
| 5 Years | 154 (82.8%) | 123 (75.0%) |
| 6 to 11 Years | 774 (78.4%) | 773 (88.0%) |
| 12 to 14 Years | 559 (89.0%) | 560 (77.9%) |
| 15 Years | 166 (100.0%) | 209 (100.0%) |
| 16 and 17 Years | 274 (89.2%) | 290 (86.1%) |
| 18 to 24 Years | 1,141 (94.0%) | 916 (84.5%) |
| 25 to 34 Years | 1,479 (85.9%) | 1,063 (83.6%) |
| 35 to 44 Years | 1,775 (87.5%) | 1,521 (89.2%) |
| 45 to 54 Years | 1,313 (95.8%) | 1,069 (87.8%) |
| 55 to 64 Years | 1,180 (91.8%) | 1,111 (81.6%) |
| 65 to 74 Years | 873 (88.7%) | 762 (86.8%) |
| 75 Years and over | 407 (99.0%) | 363 (83.1%) |
| Total | 10,601 (88.5%) | 9,241 (84.4%) |
Income Below Poverty Among Married-Couple Families in Rock Springs
The poverty statistics for married-couple families in Rock Springs show that 9.2% or 391 of the total 4,233 families live below the poverty line. Families with 5 or more children have the highest poverty rate of 100.0%, comprising of 47 families. On the other hand, families with 1 or 2 children have the lowest poverty rate of 3.5%, which includes 45 families.
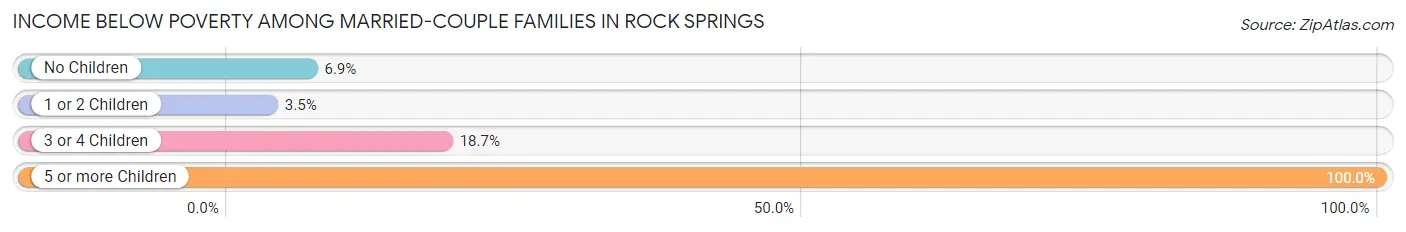
| Children | Above Poverty | Below Poverty |
| No Children | 1,909 (93.1%) | 142 (6.9%) |
| 1 or 2 Children | 1,250 (96.5%) | 45 (3.5%) |
| 3 or 4 Children | 683 (81.3%) | 157 (18.7%) |
| 5 or more Children | 0 (0.0%) | 47 (100.0%) |
| Total | 3,842 (90.8%) | 391 (9.2%) |
Income Below Poverty Among Single-Parent Households in Rock Springs
According to the poverty data in Rock Springs, 13.4% or 96 single-father households and 25.6% or 189 single-mother households are living below the poverty line. Among single-father households, those with 1 or 2 children have the highest poverty rate, with 85 households (23.2%) experiencing poverty. Likewise, among single-mother households, those with 1 or 2 children have the highest poverty rate, with 175 households (35.3%) falling below the poverty line.
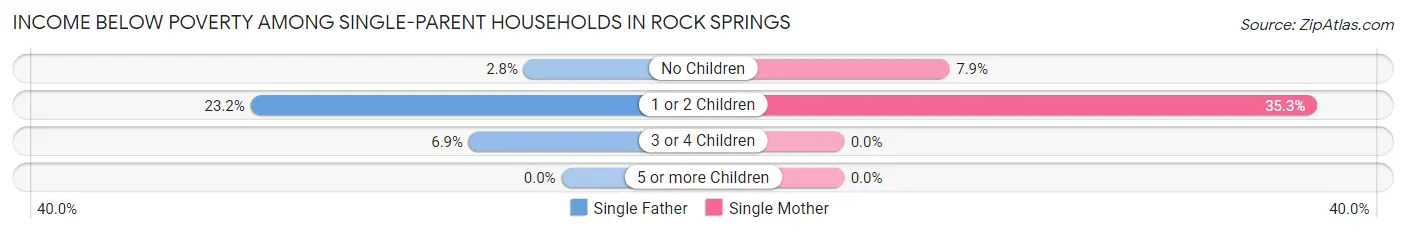
| Children | Single Father | Single Mother |
| No Children | 9 (2.8%) | 14 (7.9%) |
| 1 or 2 Children | 85 (23.2%) | 175 (35.3%) |
| 3 or 4 Children | 2 (6.9%) | 0 (0.0%) |
| 5 or more Children | 0 (0.0%) | 0 (0.0%) |
| Total | 96 (13.4%) | 189 (25.6%) |
Income Below Poverty Among Married-Couple vs Single-Parent Households in Rock Springs
The poverty data for Rock Springs shows that 391 of the married-couple family households (9.2%) and 285 of the single-parent households (19.6%) are living below the poverty level. Within the married-couple family households, those with 5 or more children have the highest poverty rate, with 47 households (100.0%) falling below the poverty line. Among the single-parent households, those with 1 or 2 children have the highest poverty rate, with 260 household (30.1%) living below poverty.
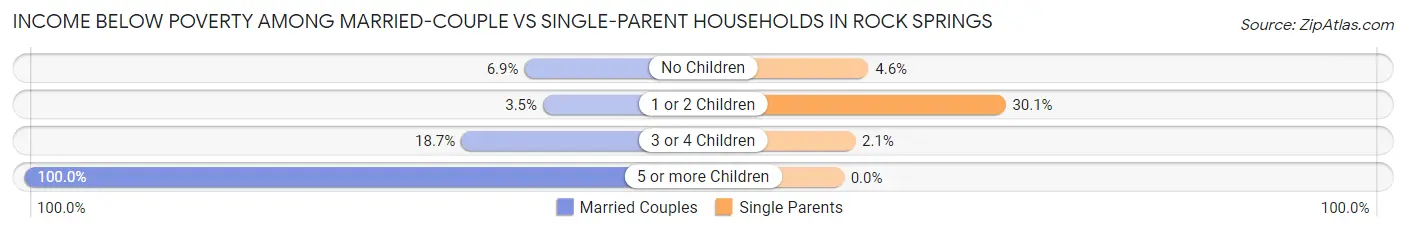
| Children | Married-Couple Families | Single-Parent Households |
| No Children | 142 (6.9%) | 23 (4.6%) |
| 1 or 2 Children | 45 (3.5%) | 260 (30.1%) |
| 3 or 4 Children | 157 (18.7%) | 2 (2.1%) |
| 5 or more Children | 47 (100.0%) | 0 (0.0%) |
| Total | 391 (9.2%) | 285 (19.6%) |
Race in Rock Springs
The most populous races in Rock Springs are White / Caucasian (19,279 | 82.5%), Hispanic or Latino (3,712 | 15.9%), and Two or more Races (1,980 | 8.5%).
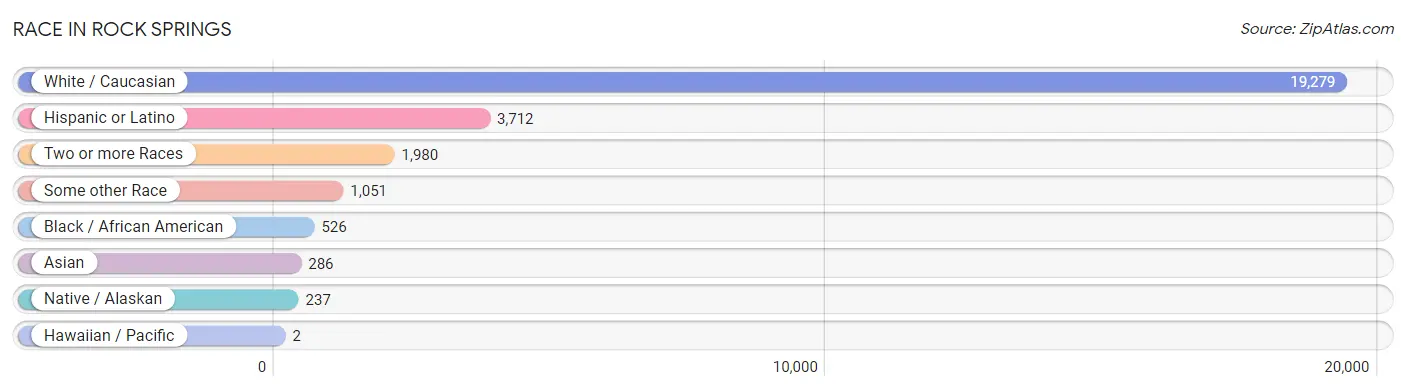
| Race | # Population | % Population |
| Asian | 286 | 1.2% |
| Black / African American | 526 | 2.2% |
| Hawaiian / Pacific | 2 | 0.0% |
| Hispanic or Latino | 3,712 | 15.9% |
| Native / Alaskan | 237 | 1.0% |
| White / Caucasian | 19,279 | 82.5% |
| Two or more Races | 1,980 | 8.5% |
| Some other Race | 1,051 | 4.5% |
| Total | 23,361 | 100.0% |
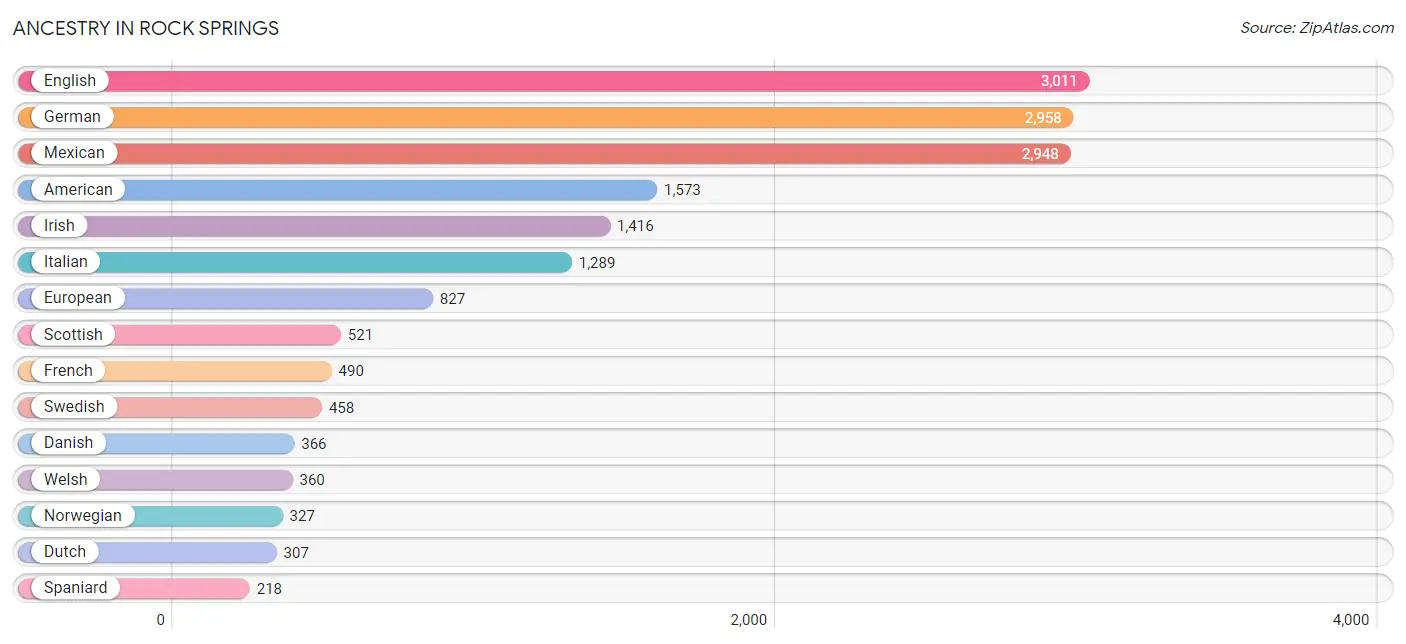
Ancestry in Rock Springs
The most populous ancestries reported in Rock Springs are English (3,011 | 12.9%), German (2,958 | 12.7%), Mexican (2,948 | 12.6%), American (1,573 | 6.7%), and Irish (1,416 | 6.1%), together accounting for 51.0% of all Rock Springs residents.
| Ancestry | # Population | % Population |
| African | 24 | 0.1% |
| American | 1,573 | 6.7% |
| Apache | 173 | 0.7% |
| Arab | 8 | 0.0% |
| Arapaho | 9 | 0.0% |
| Argentinean | 30 | 0.1% |
| Austrian | 43 | 0.2% |
| Basque | 89 | 0.4% |
| Belgian | 25 | 0.1% |
| Bhutanese | 43 | 0.2% |
| British | 123 | 0.5% |
| Burmese | 56 | 0.2% |
| Canadian | 97 | 0.4% |
| Central American | 169 | 0.7% |
| Central American Indian | 15 | 0.1% |
| Cherokee | 172 | 0.7% |
| Chippewa | 86 | 0.4% |
| Colombian | 61 | 0.3% |
| Cree | 38 | 0.2% |
| Creek | 4 | 0.0% |
| Croatian | 93 | 0.4% |
| Czech | 30 | 0.1% |
| Czechoslovakian | 39 | 0.2% |
| Danish | 366 | 1.6% |
| Dutch | 307 | 1.3% |
| Eastern European | 17 | 0.1% |
| Ecuadorian | 2 | 0.0% |
| English | 3,011 | 12.9% |
| Ethiopian | 1 | 0.0% |
| European | 827 | 3.5% |
| Finnish | 104 | 0.4% |
| French | 490 | 2.1% |
| French Canadian | 74 | 0.3% |
| German | 2,958 | 12.7% |
| Ghanaian | 5 | 0.0% |
| Greek | 93 | 0.4% |
| Guatemalan | 154 | 0.7% |
| Honduran | 15 | 0.1% |
| Hungarian | 37 | 0.2% |
| Indian (Asian) | 11 | 0.1% |
| Irish | 1,416 | 6.1% |
| Italian | 1,289 | 5.5% |
| Korean | 172 | 0.7% |
| Lithuanian | 111 | 0.5% |
| Mexican | 2,948 | 12.6% |
| Navajo | 28 | 0.1% |
| Nigerian | 3 | 0.0% |
| Northern European | 101 | 0.4% |
| Norwegian | 327 | 1.4% |
| Peruvian | 7 | 0.0% |
| Polish | 160 | 0.7% |
| Portuguese | 28 | 0.1% |
| Puerto Rican | 26 | 0.1% |
| Romanian | 23 | 0.1% |
| Russian | 60 | 0.3% |
| Scandinavian | 116 | 0.5% |
| Scotch-Irish | 203 | 0.9% |
| Scottish | 521 | 2.2% |
| Senegalese | 56 | 0.2% |
| Shoshone | 3 | 0.0% |
| Sioux | 25 | 0.1% |
| Slavic | 176 | 0.7% |
| Slovak | 1 | 0.0% |
| Slovene | 99 | 0.4% |
| South American | 152 | 0.6% |
| South American Indian | 6 | 0.0% |
| Spaniard | 218 | 0.9% |
| Spanish | 64 | 0.3% |
| Sri Lankan | 176 | 0.7% |
| Subsaharan African | 91 | 0.4% |
| Swedish | 458 | 2.0% |
| Swiss | 126 | 0.5% |
| Tongan | 2 | 0.0% |
| Ukrainian | 29 | 0.1% |
| Venezuelan | 52 | 0.2% |
| Welsh | 360 | 1.5% |
| Yugoslavian | 23 | 0.1% | View All 77 Rows |
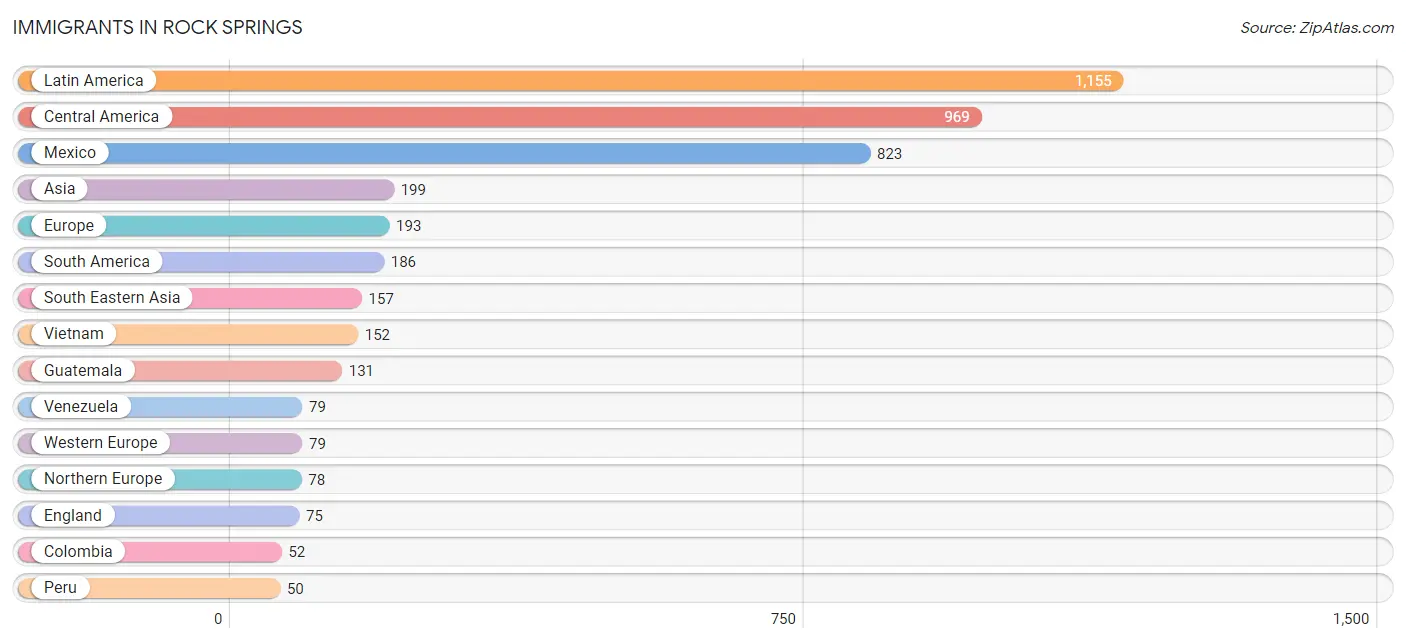
Immigrants in Rock Springs
The most numerous immigrant groups reported in Rock Springs came from Latin America (1,155 | 4.9%), Central America (969 | 4.2%), Mexico (823 | 3.5%), Asia (199 | 0.9%), and Europe (193 | 0.8%), together accounting for 14.3% of all Rock Springs residents.
| Immigration Origin | # Population | % Population |
| Africa | 33 | 0.1% |
| Argentina | 5 | 0.0% |
| Asia | 199 | 0.9% |
| Belgium | 15 | 0.1% |
| Canada | 27 | 0.1% |
| Central America | 969 | 4.2% |
| China | 2 | 0.0% |
| Colombia | 52 | 0.2% |
| Eastern Africa | 1 | 0.0% |
| Eastern Asia | 42 | 0.2% |
| Eastern Europe | 34 | 0.2% |
| England | 75 | 0.3% |
| Ethiopia | 1 | 0.0% |
| Europe | 193 | 0.8% |
| Germany | 30 | 0.1% |
| Ghana | 5 | 0.0% |
| Guatemala | 131 | 0.6% |
| Honduras | 15 | 0.1% |
| Italy | 2 | 0.0% |
| Japan | 9 | 0.0% |
| Korea | 31 | 0.1% |
| Latin America | 1,155 | 4.9% |
| Mexico | 823 | 3.5% |
| Netherlands | 34 | 0.2% |
| Nigeria | 3 | 0.0% |
| Northern Europe | 78 | 0.3% |
| Peru | 50 | 0.2% |
| Philippines | 5 | 0.0% |
| Russia | 10 | 0.0% |
| Senegal | 21 | 0.1% |
| South America | 186 | 0.8% |
| South Eastern Asia | 157 | 0.7% |
| Southern Europe | 2 | 0.0% |
| Sweden | 3 | 0.0% |
| Venezuela | 79 | 0.3% |
| Vietnam | 152 | 0.6% |
| Western Africa | 31 | 0.1% |
| Western Europe | 79 | 0.3% | View All 38 Rows |
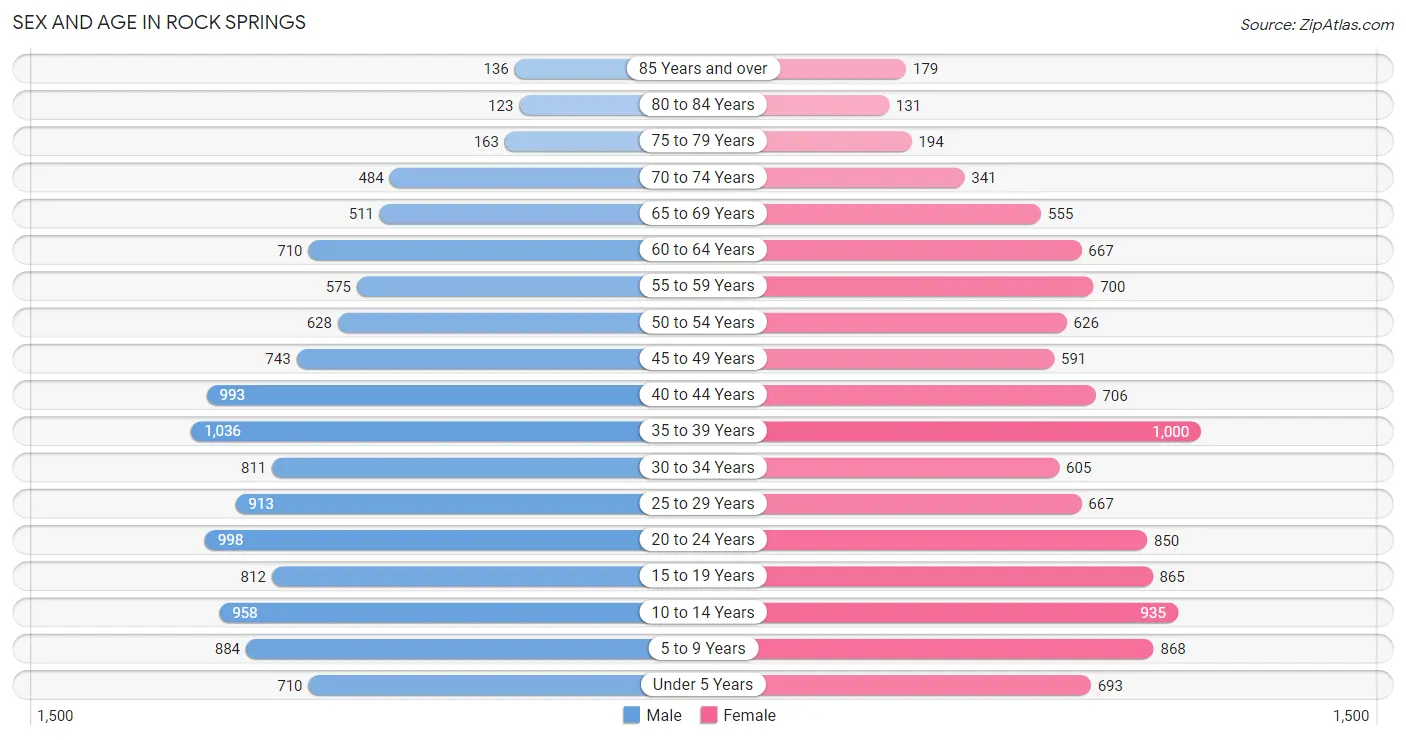
Sex and Age in Rock Springs
Sex and Age in Rock Springs
The most populous age groups in Rock Springs are 35 to 39 Years (1,036 | 8.5%) for men and 35 to 39 Years (1,000 | 8.9%) for women.
| Age Bracket | Male | Female |
| Under 5 Years | 710 (5.8%) | 693 (6.2%) |
| 5 to 9 Years | 884 (7.2%) | 868 (7.8%) |
| 10 to 14 Years | 958 (7.9%) | 935 (8.4%) |
| 15 to 19 Years | 812 (6.7%) | 865 (7.7%) |
| 20 to 24 Years | 998 (8.2%) | 850 (7.6%) |
| 25 to 29 Years | 913 (7.5%) | 667 (6.0%) |
| 30 to 34 Years | 811 (6.7%) | 605 (5.4%) |
| 35 to 39 Years | 1,036 (8.5%) | 1,000 (8.9%) |
| 40 to 44 Years | 993 (8.2%) | 706 (6.3%) |
| 45 to 49 Years | 743 (6.1%) | 591 (5.3%) |
| 50 to 54 Years | 628 (5.1%) | 626 (5.6%) |
| 55 to 59 Years | 575 (4.7%) | 700 (6.3%) |
| 60 to 64 Years | 710 (5.8%) | 667 (6.0%) |
| 65 to 69 Years | 511 (4.2%) | 555 (5.0%) |
| 70 to 74 Years | 484 (4.0%) | 341 (3.0%) |
| 75 to 79 Years | 163 (1.3%) | 194 (1.7%) |
| 80 to 84 Years | 123 (1.0%) | 131 (1.2%) |
| 85 Years and over | 136 (1.1%) | 179 (1.6%) |
| Total | 12,188 (100.0%) | 11,173 (100.0%) |
Families and Households in Rock Springs
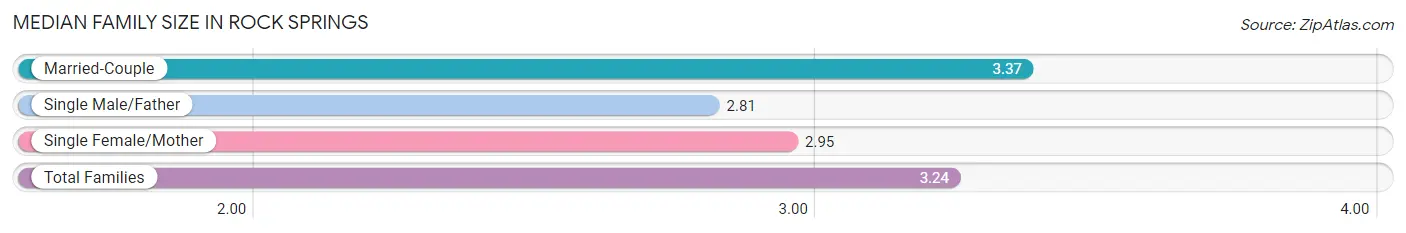
Median Family Size in Rock Springs
The median family size in Rock Springs is 3.24 persons per family, with married-couple families (4,233 | 74.4%) accounting for the largest median family size of 3.37 persons per family. On the other hand, single male/father families (718 | 12.6%) represent the smallest median family size with 2.81 persons per family.
| Family Type | # Families | Family Size |
| Married-Couple | 4,233 (74.4%) | 3.37 |
| Single Male/Father | 718 (12.6%) | 2.81 |
| Single Female/Mother | 739 (13.0%) | 2.95 |
| Total Families | 5,690 (100.0%) | 3.24 |
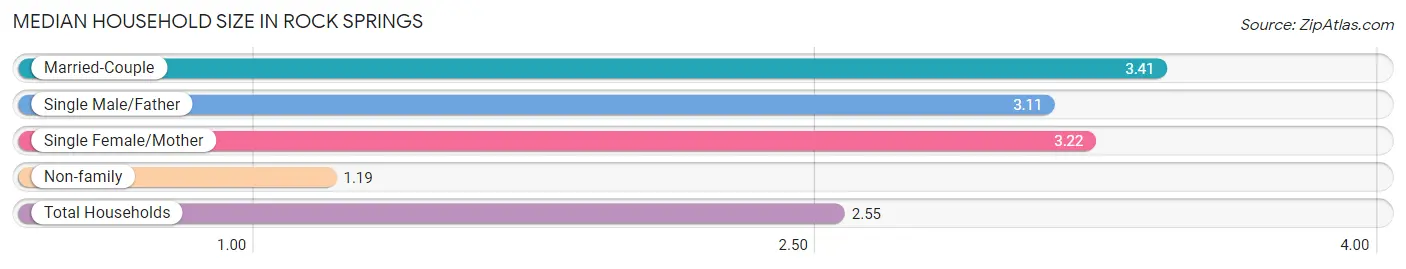
Median Household Size in Rock Springs
The median household size in Rock Springs is 2.55 persons per household, with married-couple households (4,233 | 46.9%) accounting for the largest median household size of 3.41 persons per household. non-family households (3,327 | 36.9%) represent the smallest median household size with 1.19 persons per household.
| Household Type | # Households | Household Size |
| Married-Couple | 4,233 (46.9%) | 3.41 |
| Single Male/Father | 718 (8.0%) | 3.11 |
| Single Female/Mother | 739 (8.2%) | 3.22 |
| Non-family | 3,327 (36.9%) | 1.19 |
| Total Households | 9,017 (100.0%) | 2.55 |
Household Size by Marriage Status in Rock Springs
Out of a total of 9,017 households in Rock Springs, 5,690 (63.1%) are family households, while 3,327 (36.9%) are nonfamily households. The most numerous type of family households are 2-person households, comprising 2,305, and the most common type of nonfamily households are 1-person households, comprising 2,967.
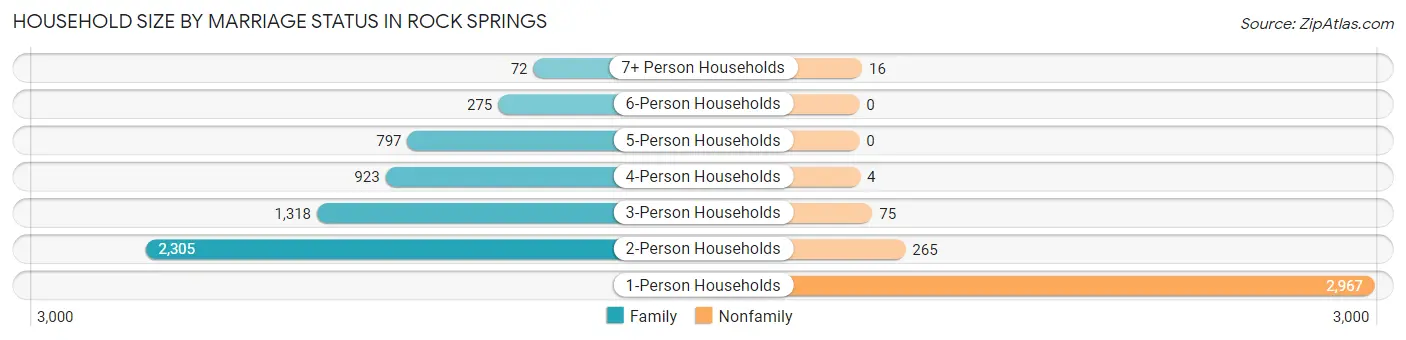
| Household Size | Family Households | Nonfamily Households |
| 1-Person Households | - | 2,967 (32.9%) |
| 2-Person Households | 2,305 (25.6%) | 265 (2.9%) |
| 3-Person Households | 1,318 (14.6%) | 75 (0.8%) |
| 4-Person Households | 923 (10.2%) | 4 (0.0%) |
| 5-Person Households | 797 (8.8%) | 0 (0.0%) |
| 6-Person Households | 275 (3.0%) | 0 (0.0%) |
| 7+ Person Households | 72 (0.8%) | 16 (0.2%) |
| Total | 5,690 (63.1%) | 3,327 (36.9%) |
Female Fertility in Rock Springs
Fertility by Age in Rock Springs
Average fertility rate in Rock Springs is 49.0 births per 1,000 women. Women in the age bracket of 20 to 34 years have the highest fertility rate with 106.0 births per 1,000 women. Women in the age bracket of 20 to 34 years acount for 83.3% of all women with births.
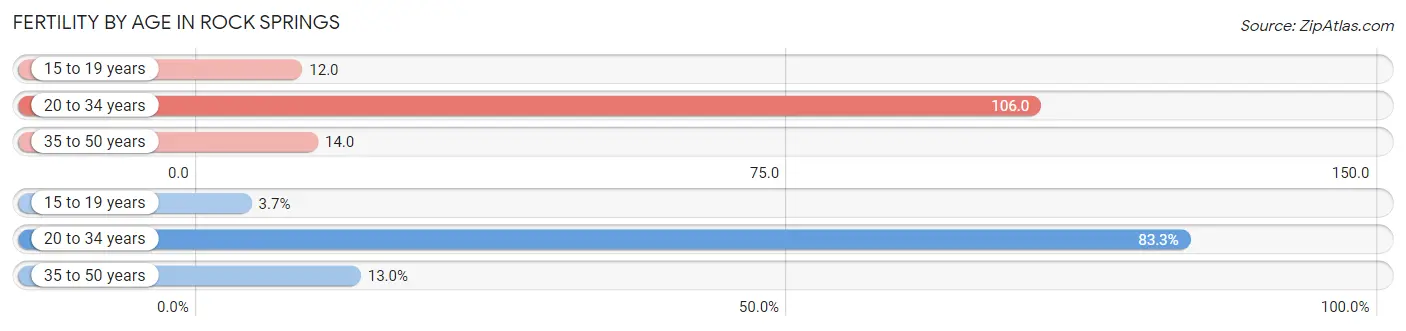
| Age Bracket | Women with Births | Births / 1,000 Women |
| 15 to 19 years | 10 (3.7%) | 12.0 |
| 20 to 34 years | 225 (83.3%) | 106.0 |
| 35 to 50 years | 35 (13.0%) | 14.0 |
| Total | 270 (100.0%) | 49.0 |
Fertility by Age by Marriage Status in Rock Springs
79.6% of women with births (270) in Rock Springs are married. The highest percentage of unmarried women with births falls into 15 to 19 years age bracket with 100.0% of them unmarried at the time of birth, while the lowest percentage of unmarried women with births belong to 20 to 34 years age bracket with 14.7% of them unmarried.
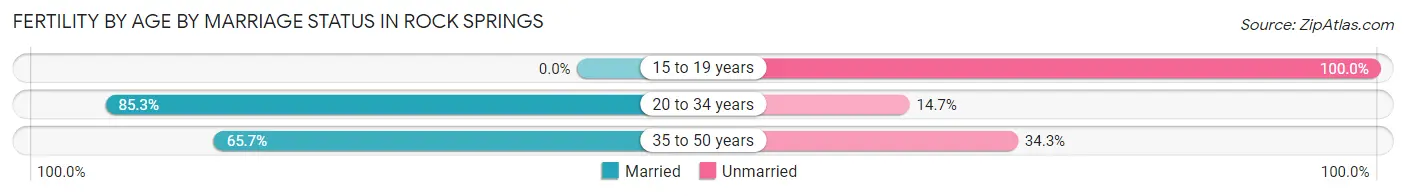
| Age Bracket | Married | Unmarried |
| 15 to 19 years | 0 (0.0%) | 10 (100.0%) |
| 20 to 34 years | 192 (85.3%) | 33 (14.7%) |
| 35 to 50 years | 23 (65.7%) | 12 (34.3%) |
| Total | 215 (79.6%) | 55 (20.4%) |
Fertility by Education in Rock Springs
Average fertility rate in Rock Springs is 49.0 births per 1,000 women. Women with the education attainment of high school diploma have the highest fertility rate of 74.0 births per 1,000 women, while women with the education attainment of less than high school have the lowest fertility at 16.0 births per 1,000 women. Women with the education attainment of high school diploma represent 35.9% of all women with births.
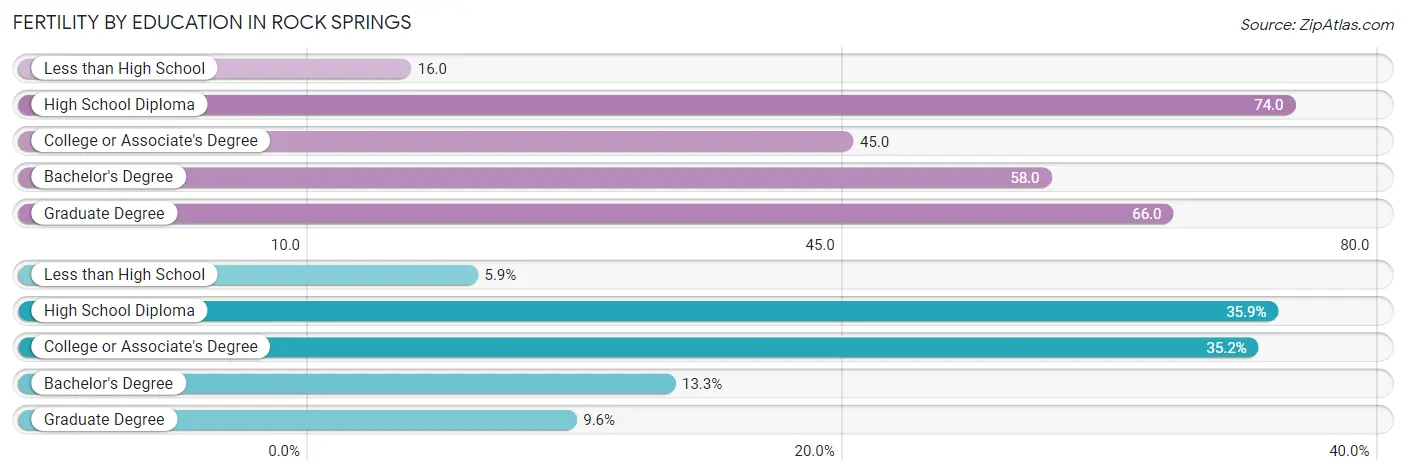
| Educational Attainment | Women with Births | Births / 1,000 Women |
| Less than High School | 16 (5.9%) | 16.0 |
| High School Diploma | 97 (35.9%) | 74.0 |
| College or Associate's Degree | 95 (35.2%) | 45.0 |
| Bachelor's Degree | 36 (13.3%) | 58.0 |
| Graduate Degree | 26 (9.6%) | 66.0 |
| Total | 270 (100.0%) | 49.0 |
Fertility by Education by Marriage Status in Rock Springs
20.4% of women with births in Rock Springs are unmarried. Women with the educational attainment of less than high school are most likely to be married with 100.0% of them married at childbirth, while women with the educational attainment of high school diploma are least likely to be married with 44.3% of them unmarried at childbirth.
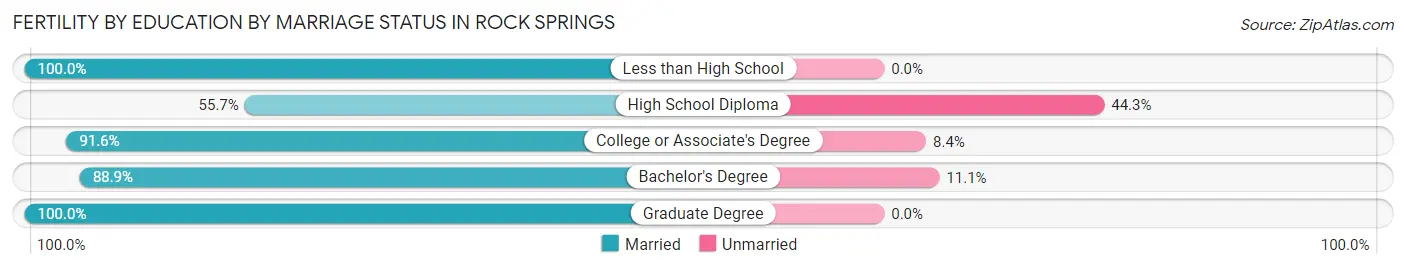
| Educational Attainment | Married | Unmarried |
| Less than High School | 16 (100.0%) | 0 (0.0%) |
| High School Diploma | 54 (55.7%) | 43 (44.3%) |
| College or Associate's Degree | 87 (91.6%) | 8 (8.4%) |
| Bachelor's Degree | 32 (88.9%) | 4 (11.1%) |
| Graduate Degree | 26 (100.0%) | 0 (0.0%) |
| Total | 215 (79.6%) | 55 (20.4%) |
Employment Characteristics in Rock Springs
Employment by Class of Employer in Rock Springs
Among the 11,850 employed individuals in Rock Springs, private company employees (7,866 | 66.4%), local government employees (1,570 | 13.3%), and not-for-profit organizations (770 | 6.5%) make up the most common classes of employment.
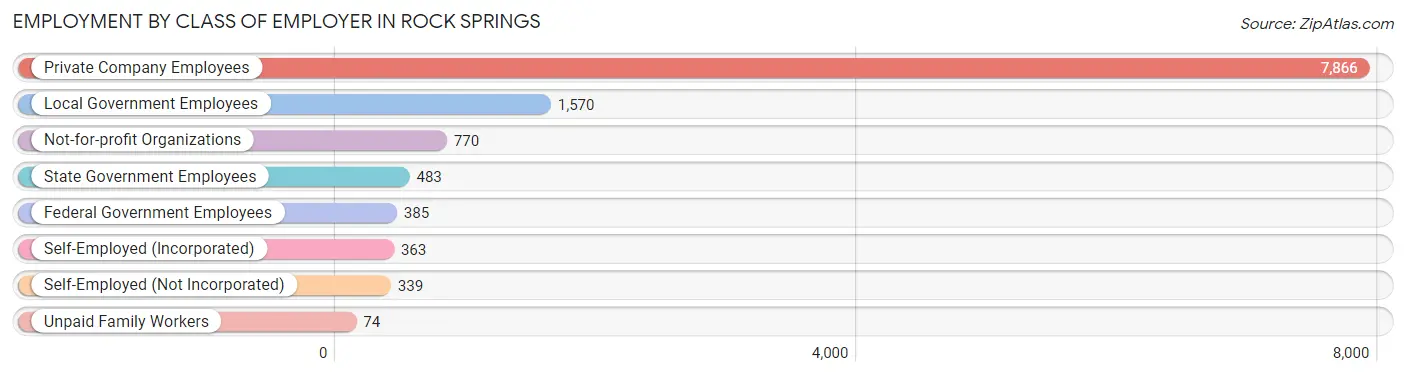
| Employer Class | # Employees | % Employees |
| Private Company Employees | 7,866 | 66.4% |
| Self-Employed (Incorporated) | 363 | 3.1% |
| Self-Employed (Not Incorporated) | 339 | 2.9% |
| Not-for-profit Organizations | 770 | 6.5% |
| Local Government Employees | 1,570 | 13.3% |
| State Government Employees | 483 | 4.1% |
| Federal Government Employees | 385 | 3.3% |
| Unpaid Family Workers | 74 | 0.6% |
| Total | 11,850 | 100.0% |
Employment Status by Age in Rock Springs
According to the labor force statistics for Rock Springs, out of the total population over 16 years of age (17,938), 71.1% or 12,754 individuals are in the labor force, with 5.4% or 689 of them unemployed. The age group with the highest labor force participation rate is 20 to 24 years, with 94.9% or 1,754 individuals in the labor force. Within the labor force, the 16 to 19 years age range has the highest percentage of unemployed individuals, with 14.9% or 93 of them being unemployed.
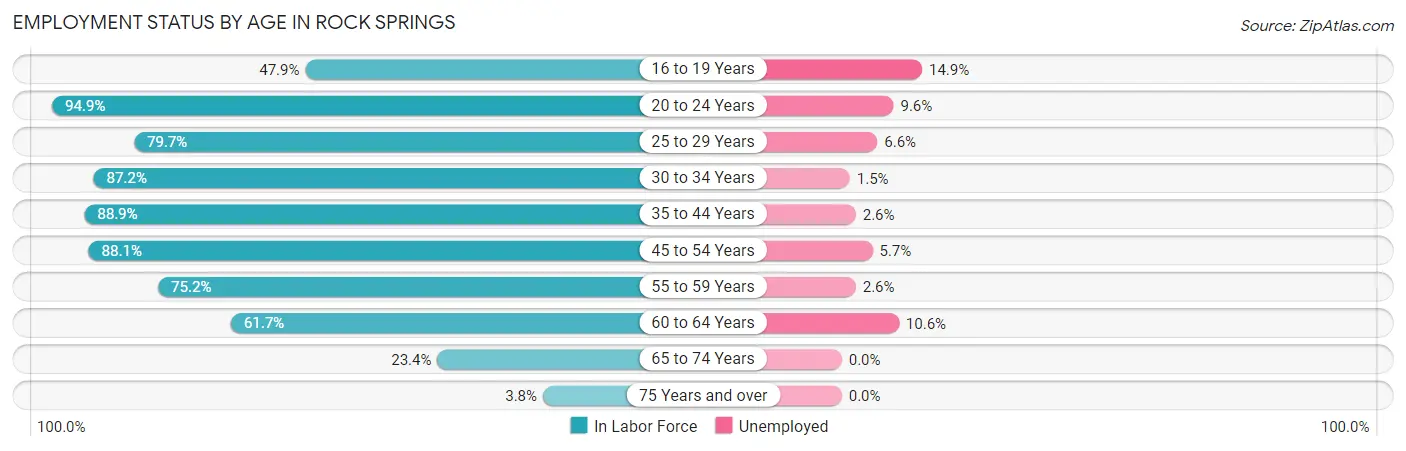
| Age Bracket | In Labor Force | Unemployed |
| 16 to 19 Years | 624 (47.9%) | 93 (14.9%) |
| 20 to 24 Years | 1,754 (94.9%) | 168 (9.6%) |
| 25 to 29 Years | 1,259 (79.7%) | 83 (6.6%) |
| 30 to 34 Years | 1,235 (87.2%) | 19 (1.5%) |
| 35 to 44 Years | 3,320 (88.9%) | 86 (2.6%) |
| 45 to 54 Years | 2,280 (88.1%) | 130 (5.7%) |
| 55 to 59 Years | 959 (75.2%) | 25 (2.6%) |
| 60 to 64 Years | 850 (61.7%) | 90 (10.6%) |
| 65 to 74 Years | 442 (23.4%) | 0 (0.0%) |
| 75 Years and over | 35 (3.8%) | 0 (0.0%) |
| Total | 12,754 (71.1%) | 689 (5.4%) |
Employment Status by Educational Attainment in Rock Springs
According to labor force statistics for Rock Springs, 82.7% of individuals (9,900) out of the total population between 25 and 64 years of age (11,971) are in the labor force, with 4.4% or 436 of them being unemployed. The group with the highest labor force participation rate are those with the educational attainment of bachelor's degree or higher, with 91.8% or 2,428 individuals in the labor force. Within the labor force, individuals with high school diploma education have the highest percentage of unemployment, with 7.1% or 222 of them being unemployed.
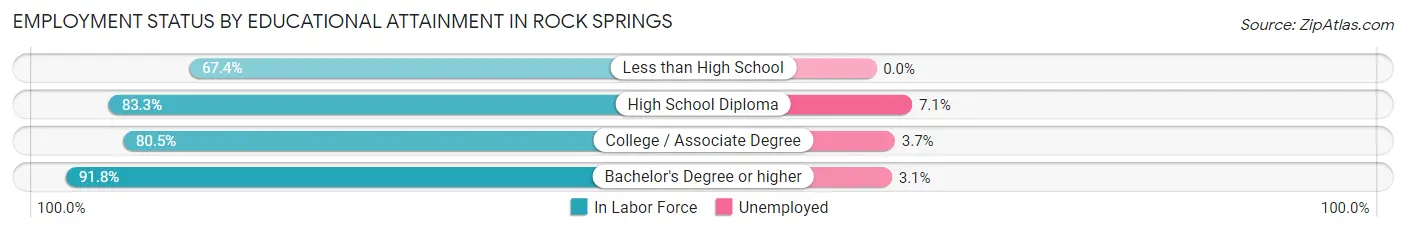
| Educational Attainment | In Labor Force | Unemployed |
| Less than High School | 690 (67.4%) | 0 (0.0%) |
| High School Diploma | 3,120 (83.3%) | 266 (7.1%) |
| College / Associate Degree | 3,669 (80.5%) | 169 (3.7%) |
| Bachelor's Degree or higher | 2,428 (91.8%) | 82 (3.1%) |
| Total | 9,900 (82.7%) | 527 (4.4%) |
Employment Occupations by Sex in Rock Springs
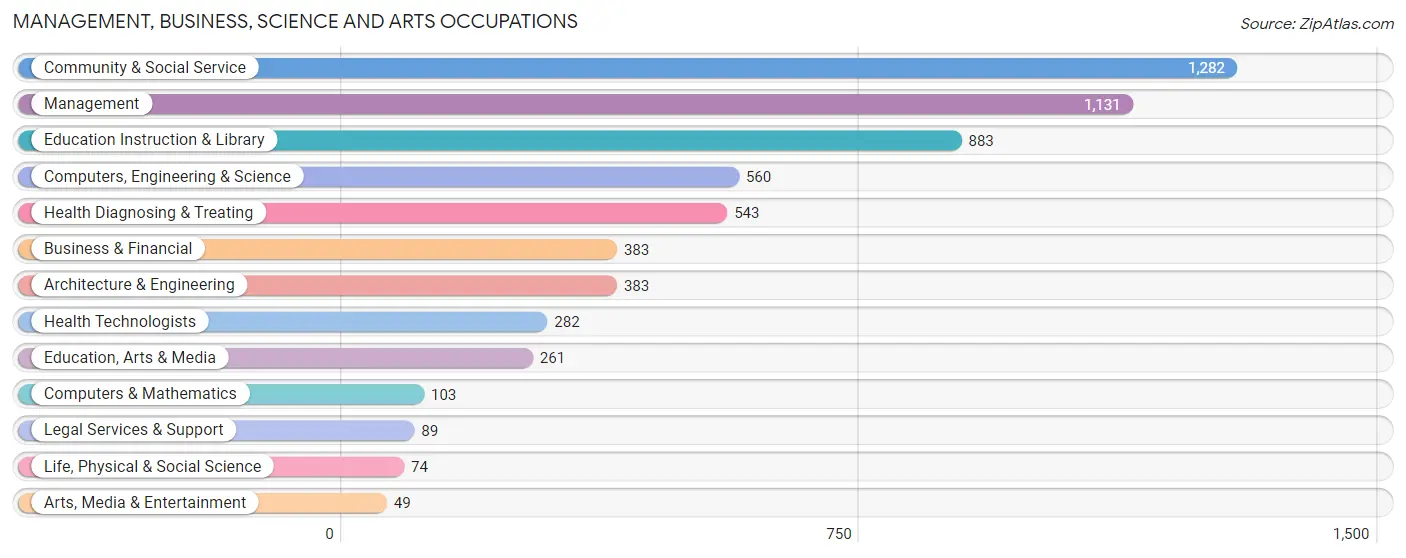
Management, Business, Science and Arts Occupations
The most common Management, Business, Science and Arts occupations in Rock Springs are Community & Social Service (1,282 | 10.7%), Management (1,131 | 9.4%), Education Instruction & Library (883 | 7.3%), Computers, Engineering & Science (560 | 4.7%), and Health Diagnosing & Treating (543 | 4.5%).
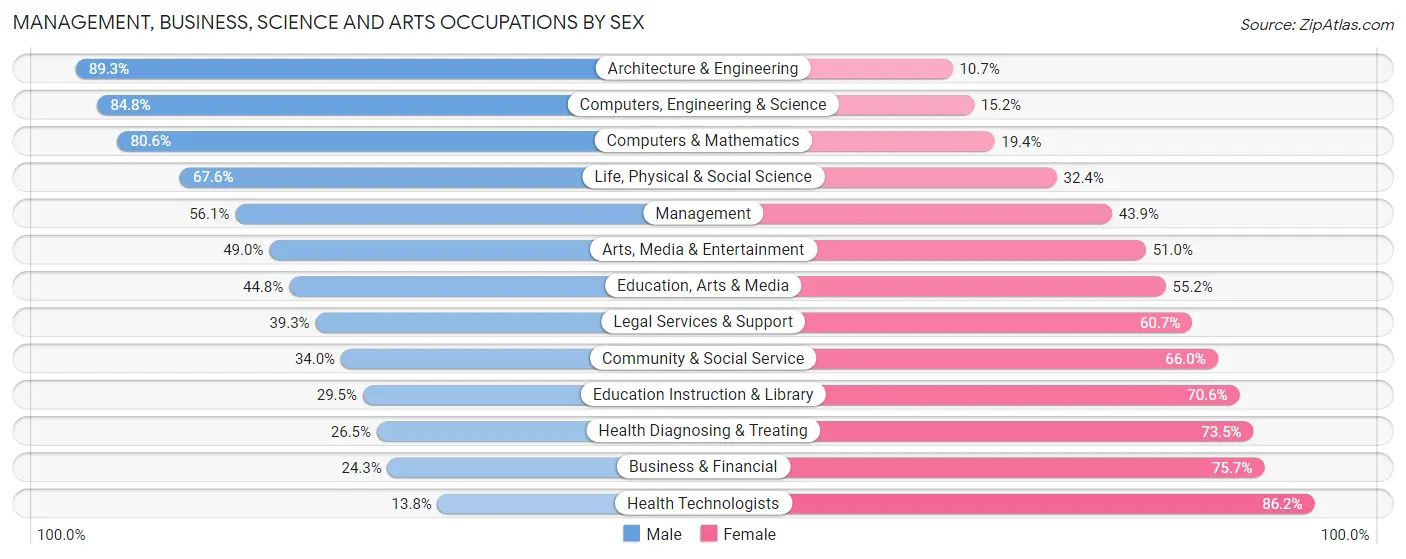
Management, Business, Science and Arts Occupations by Sex
Within the Management, Business, Science and Arts occupations in Rock Springs, the most male-oriented occupations are Architecture & Engineering (89.3%), Computers, Engineering & Science (84.8%), and Computers & Mathematics (80.6%), while the most female-oriented occupations are Health Technologists (86.2%), Business & Financial (75.7%), and Health Diagnosing & Treating (73.5%).
| Occupation | Male | Female |
| Management | 634 (56.1%) | 497 (43.9%) |
| Business & Financial | 93 (24.3%) | 290 (75.7%) |
| Computers, Engineering & Science | 475 (84.8%) | 85 (15.2%) |
| Computers & Mathematics | 83 (80.6%) | 20 (19.4%) |
| Architecture & Engineering | 342 (89.3%) | 41 (10.7%) |
| Life, Physical & Social Science | 50 (67.6%) | 24 (32.4%) |
| Community & Social Service | 436 (34.0%) | 846 (66.0%) |
| Education, Arts & Media | 117 (44.8%) | 144 (55.2%) |
| Legal Services & Support | 35 (39.3%) | 54 (60.7%) |
| Education Instruction & Library | 260 (29.4%) | 623 (70.6%) |
| Arts, Media & Entertainment | 24 (49.0%) | 25 (51.0%) |
| Health Diagnosing & Treating | 144 (26.5%) | 399 (73.5%) |
| Health Technologists | 39 (13.8%) | 243 (86.2%) |
| Total (Category) | 1,782 (45.7%) | 2,117 (54.3%) |
| Total (Overall) | 6,837 (56.9%) | 5,187 (43.1%) |
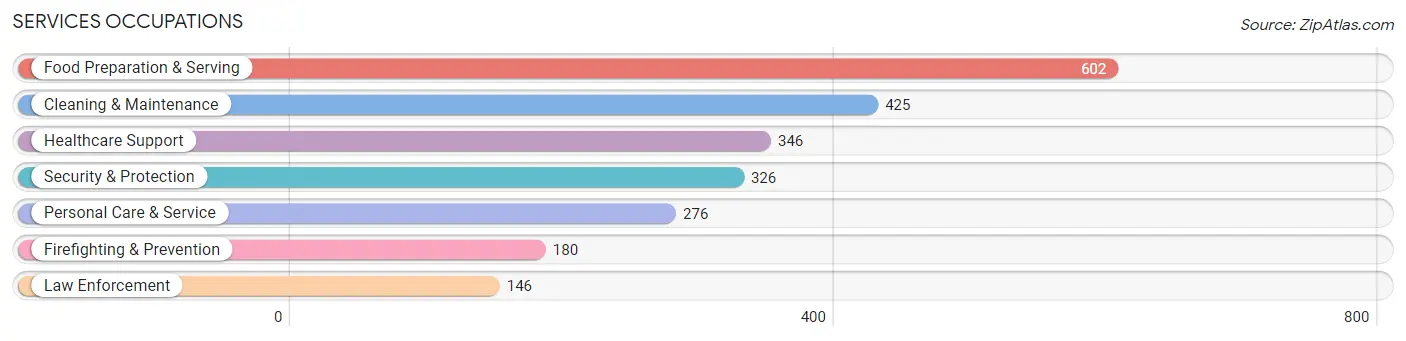
Services Occupations
The most common Services occupations in Rock Springs are Food Preparation & Serving (602 | 5.0%), Cleaning & Maintenance (425 | 3.5%), Healthcare Support (346 | 2.9%), Security & Protection (326 | 2.7%), and Personal Care & Service (276 | 2.3%).
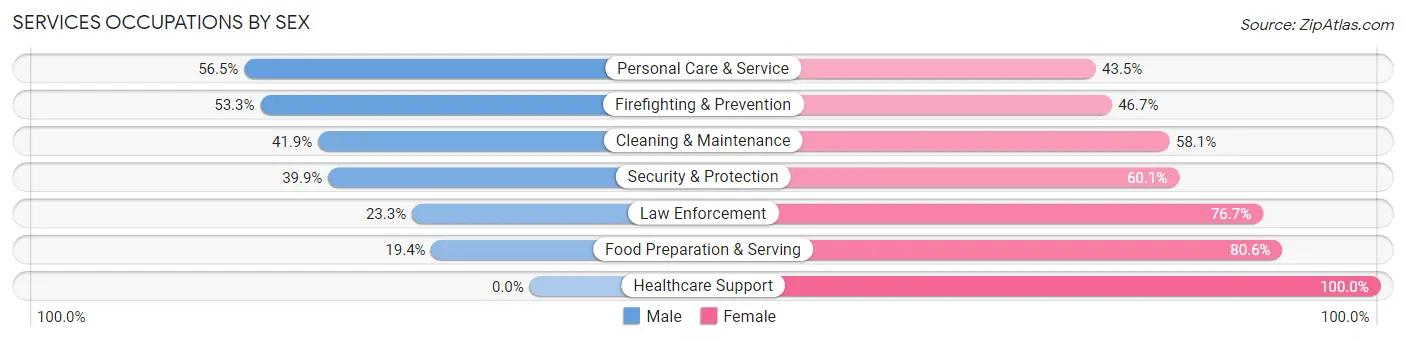
Services Occupations by Sex
Within the Services occupations in Rock Springs, the most male-oriented occupations are Personal Care & Service (56.5%), Firefighting & Prevention (53.3%), and Cleaning & Maintenance (41.9%), while the most female-oriented occupations are Healthcare Support (100.0%), Food Preparation & Serving (80.6%), and Law Enforcement (76.7%).
| Occupation | Male | Female |
| Healthcare Support | 0 (0.0%) | 346 (100.0%) |
| Security & Protection | 130 (39.9%) | 196 (60.1%) |
| Firefighting & Prevention | 96 (53.3%) | 84 (46.7%) |
| Law Enforcement | 34 (23.3%) | 112 (76.7%) |
| Food Preparation & Serving | 117 (19.4%) | 485 (80.6%) |
| Cleaning & Maintenance | 178 (41.9%) | 247 (58.1%) |
| Personal Care & Service | 156 (56.5%) | 120 (43.5%) |
| Total (Category) | 581 (29.4%) | 1,394 (70.6%) |
| Total (Overall) | 6,837 (56.9%) | 5,187 (43.1%) |
Sales and Office Occupations
The most common Sales and Office occupations in Rock Springs are Sales & Related (1,207 | 10.0%), and Office & Administration (1,091 | 9.1%).

Sales and Office Occupations by Sex
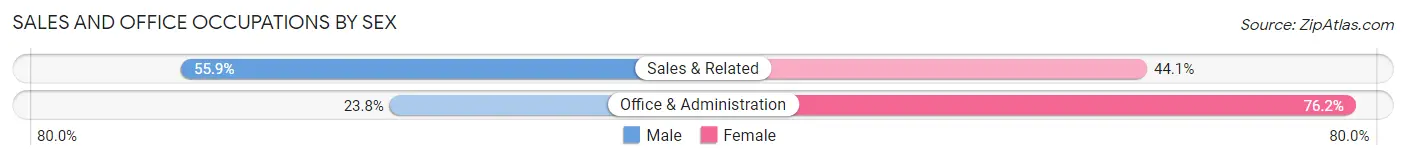
| Occupation | Male | Female |
| Sales & Related | 675 (55.9%) | 532 (44.1%) |
| Office & Administration | 260 (23.8%) | 831 (76.2%) |
| Total (Category) | 935 (40.7%) | 1,363 (59.3%) |
| Total (Overall) | 6,837 (56.9%) | 5,187 (43.1%) |
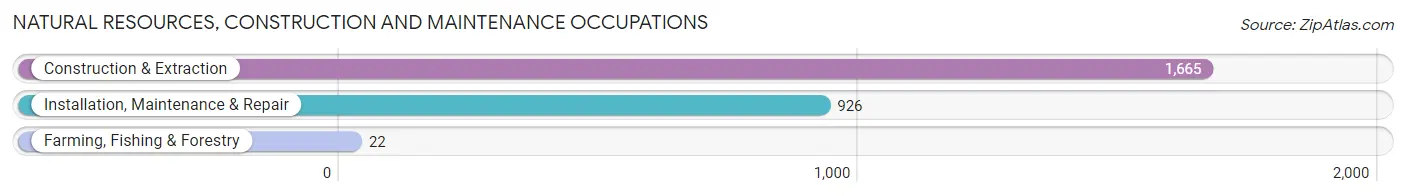
Natural Resources, Construction and Maintenance Occupations
The most common Natural Resources, Construction and Maintenance occupations in Rock Springs are Construction & Extraction (1,665 | 13.9%), Installation, Maintenance & Repair (926 | 7.7%), and Farming, Fishing & Forestry (22 | 0.2%).
Natural Resources, Construction and Maintenance Occupations by Sex
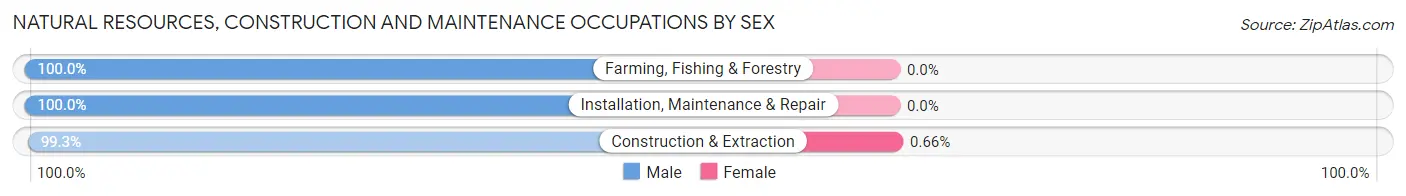
| Occupation | Male | Female |
| Farming, Fishing & Forestry | 22 (100.0%) | 0 (0.0%) |
| Construction & Extraction | 1,654 (99.3%) | 11 (0.7%) |
| Installation, Maintenance & Repair | 926 (100.0%) | 0 (0.0%) |
| Total (Category) | 2,602 (99.6%) | 11 (0.4%) |
| Total (Overall) | 6,837 (56.9%) | 5,187 (43.1%) |
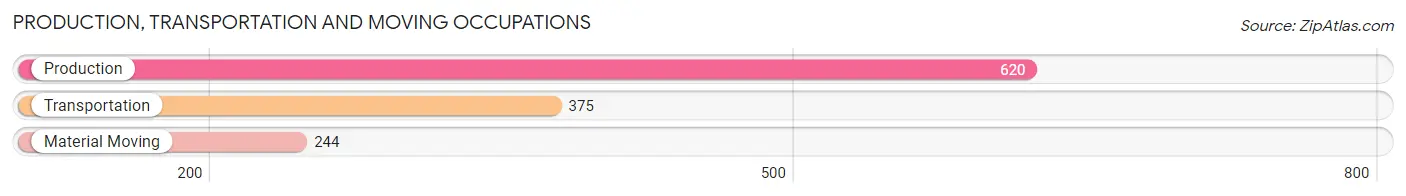
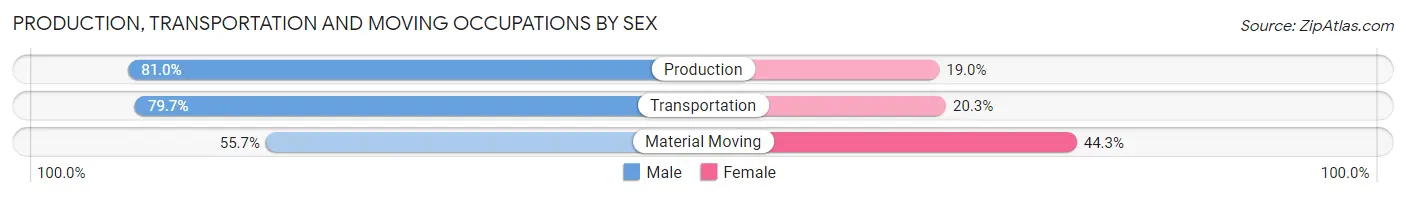
Production, Transportation and Moving Occupations
The most common Production, Transportation and Moving occupations in Rock Springs are Production (620 | 5.2%), Transportation (375 | 3.1%), and Material Moving (244 | 2.0%).
Production, Transportation and Moving Occupations by Sex
| Occupation | Male | Female |
| Production | 502 (81.0%) | 118 (19.0%) |
| Transportation | 299 (79.7%) | 76 (20.3%) |
| Material Moving | 136 (55.7%) | 108 (44.3%) |
| Total (Category) | 937 (75.6%) | 302 (24.4%) |
| Total (Overall) | 6,837 (56.9%) | 5,187 (43.1%) |
Employment Industries by Sex in Rock Springs
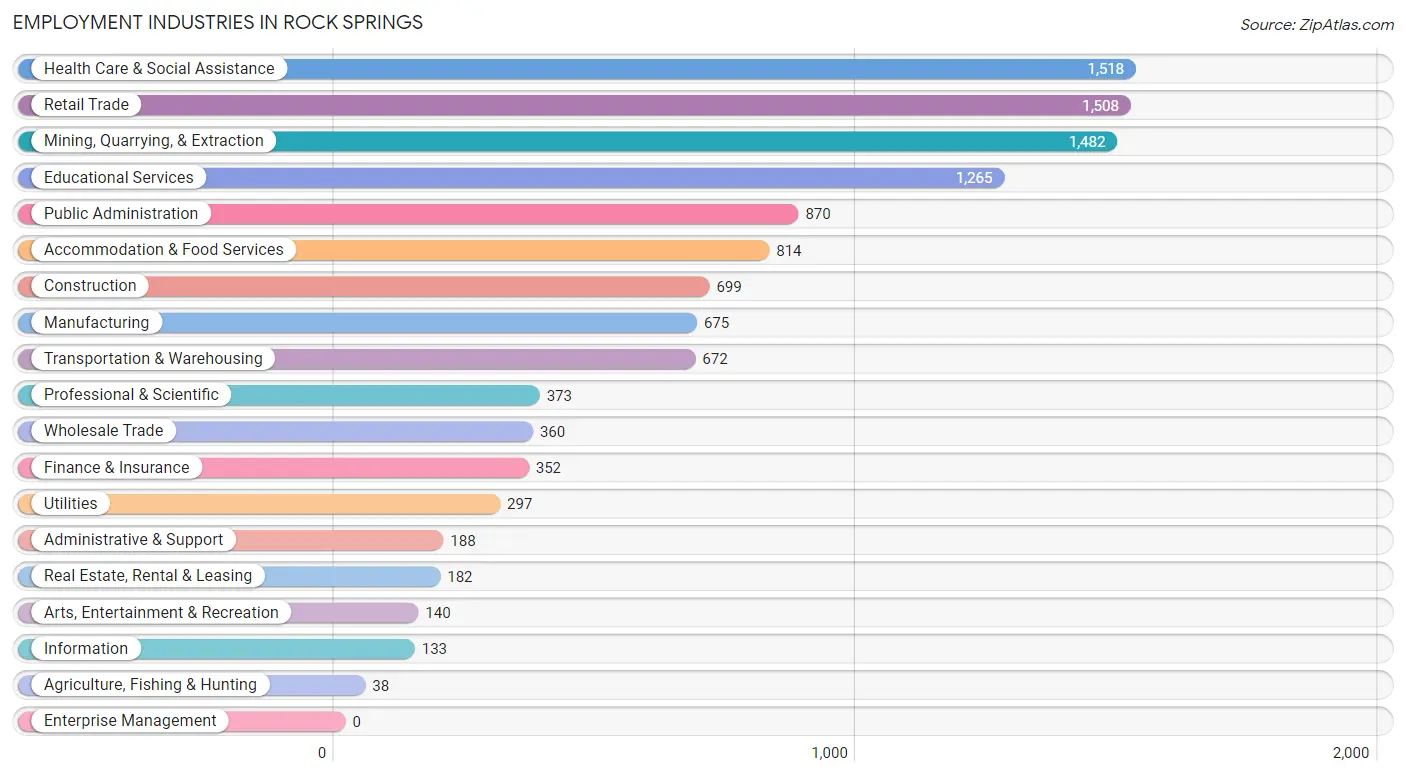
Employment Industries in Rock Springs
The major employment industries in Rock Springs include Health Care & Social Assistance (1,518 | 12.6%), Retail Trade (1,508 | 12.5%), Mining, Quarrying, & Extraction (1,482 | 12.3%), Educational Services (1,265 | 10.5%), and Public Administration (870 | 7.2%).
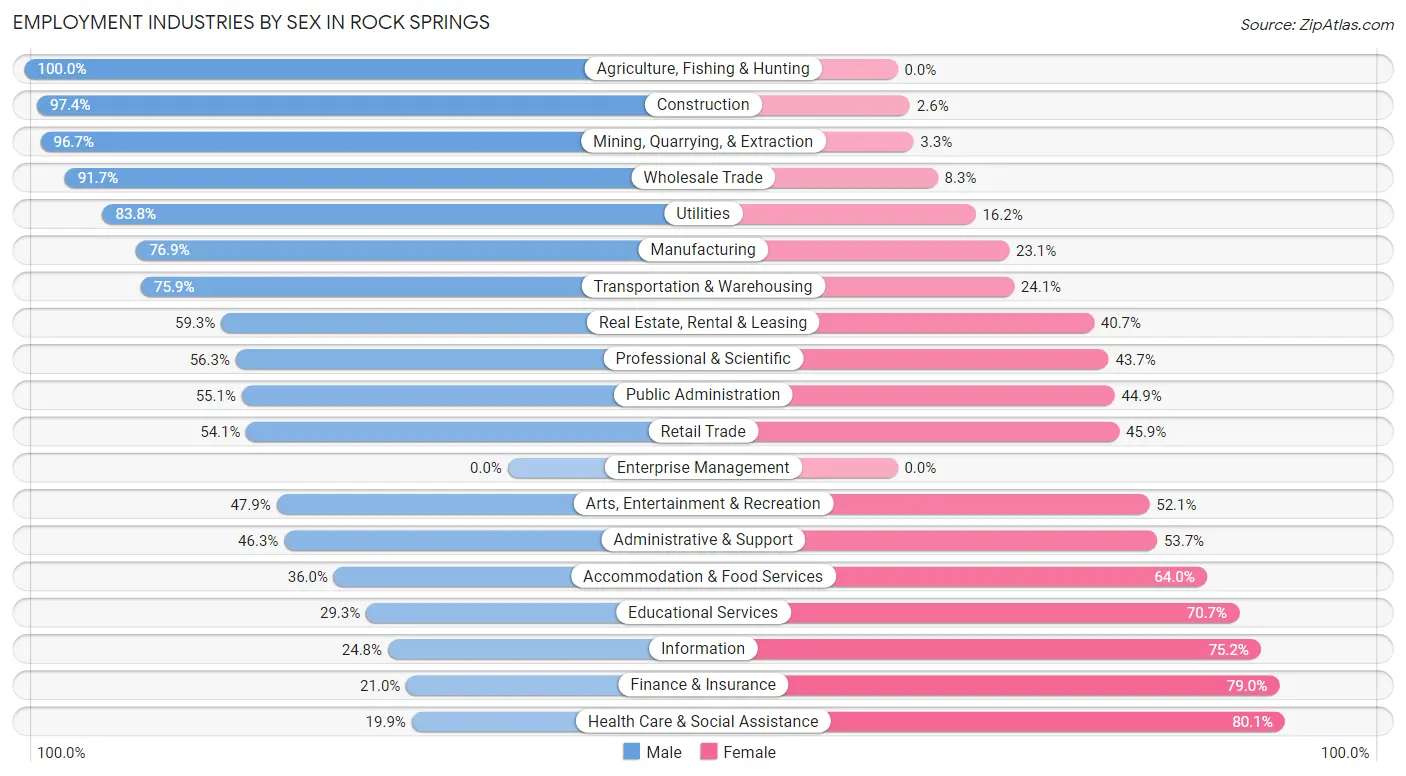
Employment Industries by Sex in Rock Springs
The Rock Springs industries that see more men than women are Agriculture, Fishing & Hunting (100.0%), Construction (97.4%), and Mining, Quarrying, & Extraction (96.7%), whereas the industries that tend to have a higher number of women are Health Care & Social Assistance (80.1%), Finance & Insurance (79.0%), and Information (75.2%).
| Industry | Male | Female |
| Agriculture, Fishing & Hunting | 38 (100.0%) | 0 (0.0%) |
| Mining, Quarrying, & Extraction | 1,433 (96.7%) | 49 (3.3%) |
| Construction | 681 (97.4%) | 18 (2.6%) |
| Manufacturing | 519 (76.9%) | 156 (23.1%) |
| Wholesale Trade | 330 (91.7%) | 30 (8.3%) |
| Retail Trade | 816 (54.1%) | 692 (45.9%) |
| Transportation & Warehousing | 510 (75.9%) | 162 (24.1%) |
| Utilities | 249 (83.8%) | 48 (16.2%) |
| Information | 33 (24.8%) | 100 (75.2%) |
| Finance & Insurance | 74 (21.0%) | 278 (79.0%) |
| Real Estate, Rental & Leasing | 108 (59.3%) | 74 (40.7%) |
| Professional & Scientific | 210 (56.3%) | 163 (43.7%) |
| Enterprise Management | 0 (0.0%) | 0 (0.0%) |
| Administrative & Support | 87 (46.3%) | 101 (53.7%) |
| Educational Services | 371 (29.3%) | 894 (70.7%) |
| Health Care & Social Assistance | 302 (19.9%) | 1,216 (80.1%) |
| Arts, Entertainment & Recreation | 67 (47.9%) | 73 (52.1%) |
| Accommodation & Food Services | 293 (36.0%) | 521 (64.0%) |
| Public Administration | 479 (55.1%) | 391 (44.9%) |
| Total | 6,837 (56.9%) | 5,187 (43.1%) |
Education in Rock Springs
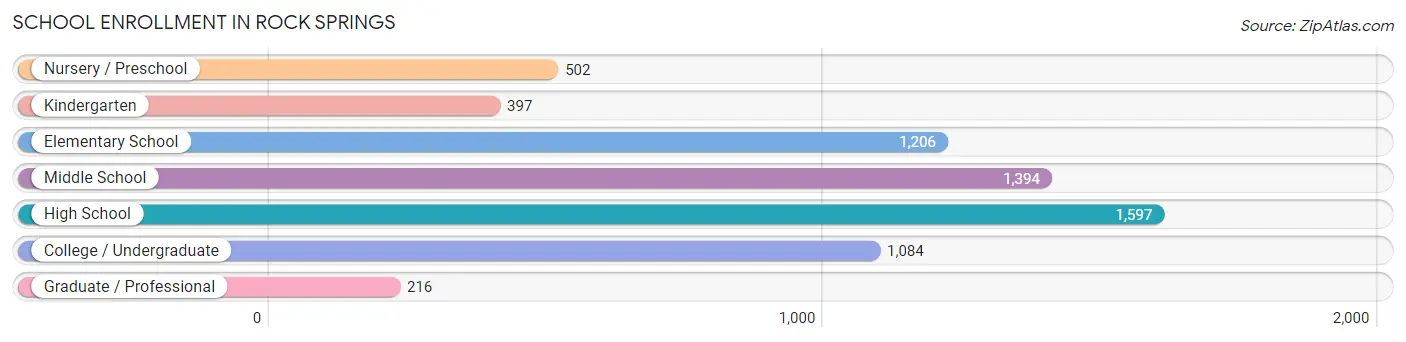
School Enrollment in Rock Springs
The most common levels of schooling among the 6,396 students in Rock Springs are high school (1,597 | 25.0%), middle school (1,394 | 21.8%), and elementary school (1,206 | 18.9%).
| School Level | # Students | % Students |
| Nursery / Preschool | 502 | 7.9% |
| Kindergarten | 397 | 6.2% |
| Elementary School | 1,206 | 18.9% |
| Middle School | 1,394 | 21.8% |
| High School | 1,597 | 25.0% |
| College / Undergraduate | 1,084 | 17.0% |
| Graduate / Professional | 216 | 3.4% |
| Total | 6,396 | 100.0% |
School Enrollment by Age by Funding Source in Rock Springs
Out of a total of 6,396 students who are enrolled in schools in Rock Springs, 512 (8.0%) attend a private institution, while the remaining 5,884 (92.0%) are enrolled in public schools. The age group of 3 to 4 year olds has the highest likelihood of being enrolled in private schools, with 140 (26.9% in the age bracket) enrolled. Conversely, the age group of 15 to 17 year olds has the lowest likelihood of being enrolled in a private school, with 1,017 (100.0% in the age bracket) attending a public institution.
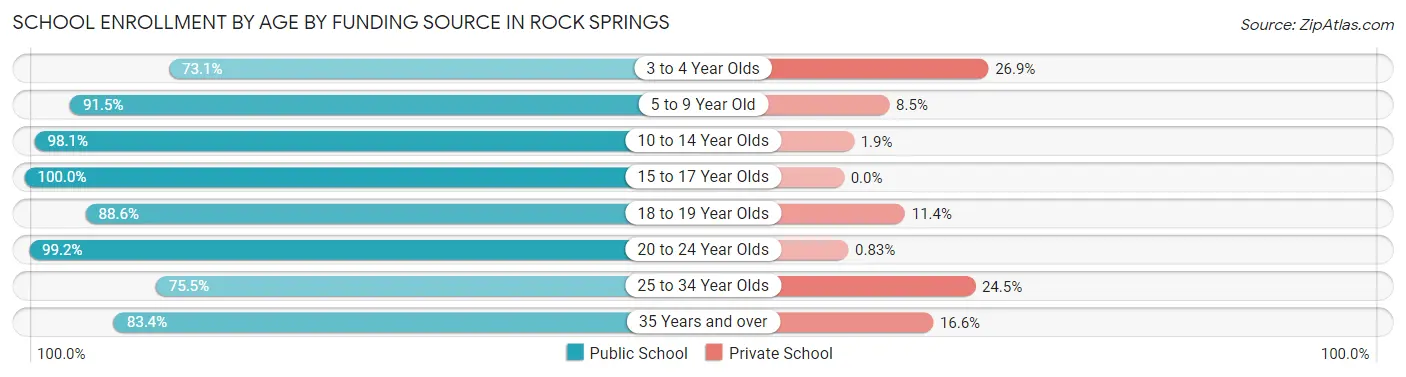
| Age Bracket | Public School | Private School |
| 3 to 4 Year Olds | 380 (73.1%) | 140 (26.9%) |
| 5 to 9 Year Old | 1,383 (91.5%) | 128 (8.5%) |
| 10 to 14 Year Olds | 1,835 (98.1%) | 35 (1.9%) |
| 15 to 17 Year Olds | 1,017 (100.0%) | 0 (0.0%) |
| 18 to 19 Year Olds | 397 (88.6%) | 51 (11.4%) |
| 20 to 24 Year Olds | 239 (99.2%) | 2 (0.8%) |
| 25 to 34 Year Olds | 210 (75.5%) | 68 (24.5%) |
| 35 Years and over | 426 (83.4%) | 85 (16.6%) |
| Total | 5,884 (92.0%) | 512 (8.0%) |
Educational Attainment by Field of Study in Rock Springs
Education (731 | 20.9%), business (496 | 14.2%), science & technology (356 | 10.2%), engineering (349 | 10.0%), and bio, nature & agricultural (237 | 6.8%) are the most common fields of study among 3,499 individuals in Rock Springs who have obtained a bachelor's degree or higher.
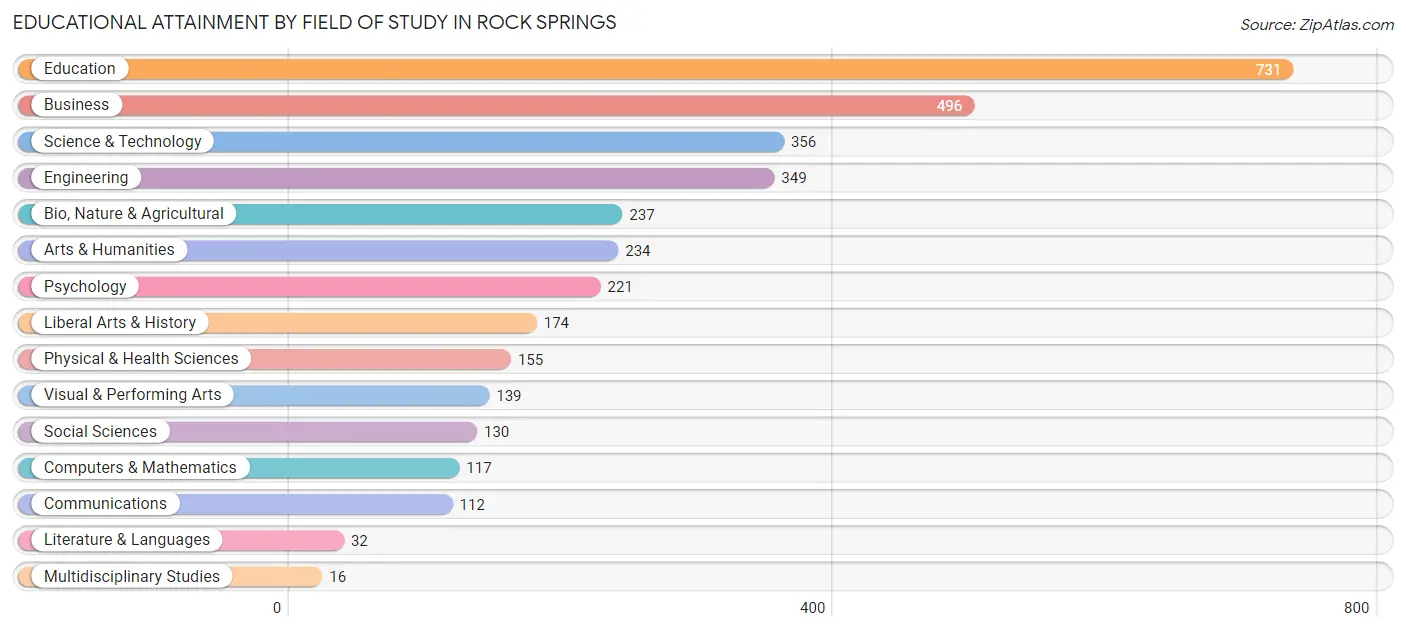
| Field of Study | # Graduates | % Graduates |
| Computers & Mathematics | 117 | 3.3% |
| Bio, Nature & Agricultural | 237 | 6.8% |
| Physical & Health Sciences | 155 | 4.4% |
| Psychology | 221 | 6.3% |
| Social Sciences | 130 | 3.7% |
| Engineering | 349 | 10.0% |
| Multidisciplinary Studies | 16 | 0.5% |
| Science & Technology | 356 | 10.2% |
| Business | 496 | 14.2% |
| Education | 731 | 20.9% |
| Literature & Languages | 32 | 0.9% |
| Liberal Arts & History | 174 | 5.0% |
| Visual & Performing Arts | 139 | 4.0% |
| Communications | 112 | 3.2% |
| Arts & Humanities | 234 | 6.7% |
| Total | 3,499 | 100.0% |
Transportation & Commute in Rock Springs
Vehicle Availability by Sex in Rock Springs
The most prevalent vehicle ownership categories in Rock Springs are males with 2 vehicles (2,523, accounting for 37.7%) and females with 2 vehicles (1,797, making up 49.7%).
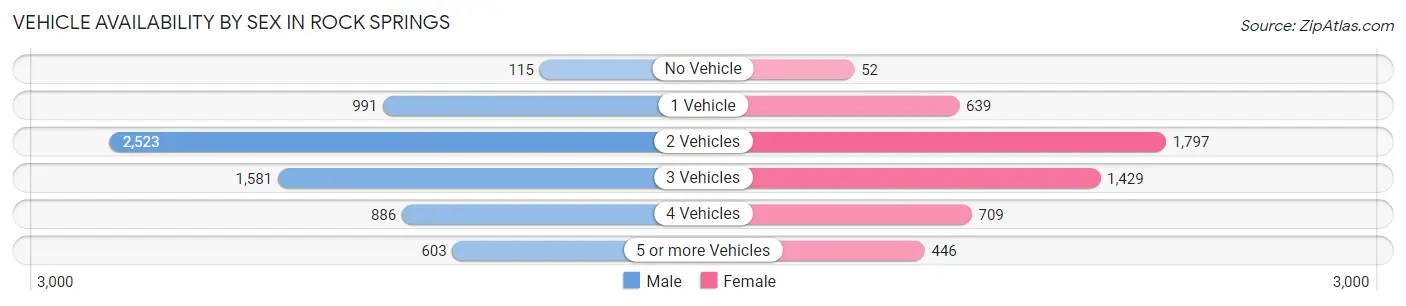
| Vehicles Available | Male | Female |
| No Vehicle | 115 (1.7%) | 52 (1.0%) |
| 1 Vehicle | 991 (14.8%) | 639 (12.6%) |
| 2 Vehicles | 2,523 (37.7%) | 1,797 (35.4%) |
| 3 Vehicles | 1,581 (23.6%) | 1,429 (28.2%) |
| 4 Vehicles | 886 (13.2%) | 709 (14.0%) |
| 5 or more Vehicles | 603 (9.0%) | 446 (8.8%) |
| Total | 6,699 (100.0%) | 5,072 (100.0%) |
Commute Time in Rock Springs
The most frequently occuring commute durations in Rock Springs are 10 to 14 minutes (3,214 commuters, 27.7%), 5 to 9 minutes (2,716 commuters, 23.4%), and 15 to 19 minutes (1,447 commuters, 12.4%).
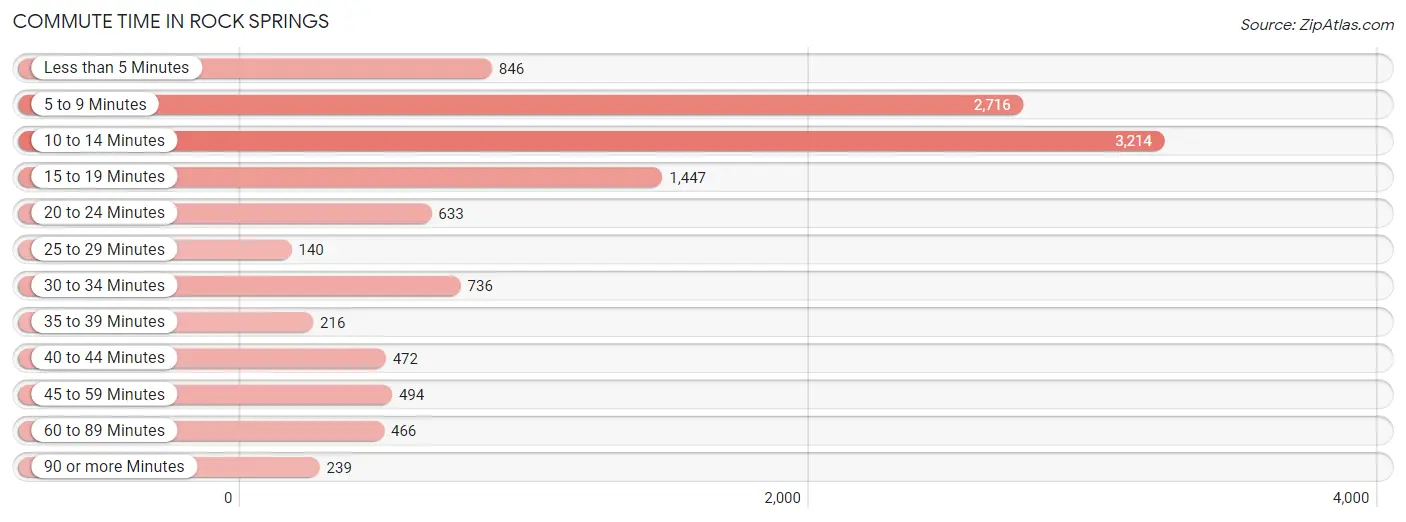
| Commute Time | # Commuters | % Commuters |
| Less than 5 Minutes | 846 | 7.3% |
| 5 to 9 Minutes | 2,716 | 23.4% |
| 10 to 14 Minutes | 3,214 | 27.7% |
| 15 to 19 Minutes | 1,447 | 12.4% |
| 20 to 24 Minutes | 633 | 5.4% |
| 25 to 29 Minutes | 140 | 1.2% |
| 30 to 34 Minutes | 736 | 6.3% |
| 35 to 39 Minutes | 216 | 1.9% |
| 40 to 44 Minutes | 472 | 4.1% |
| 45 to 59 Minutes | 494 | 4.3% |
| 60 to 89 Minutes | 466 | 4.0% |
| 90 or more Minutes | 239 | 2.1% |
Commute Time by Sex in Rock Springs
The most common commute times in Rock Springs are 10 to 14 minutes (1,826 commuters, 27.4%) for males and 5 to 9 minutes (1,612 commuters, 32.5%) for females.
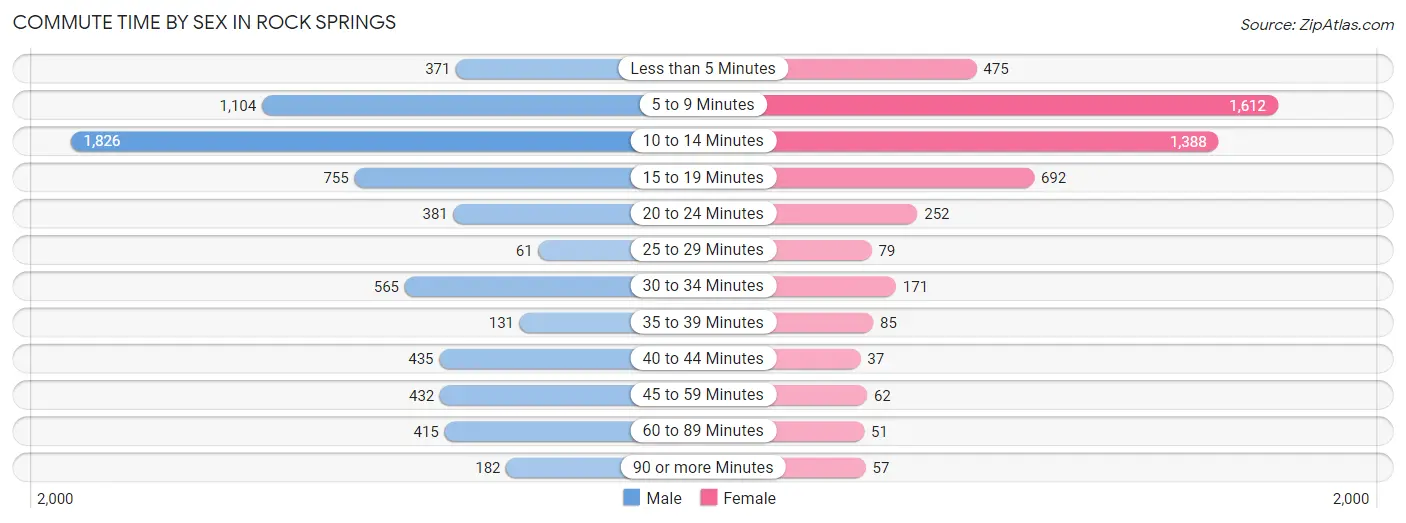
| Commute Time | Male | Female |
| Less than 5 Minutes | 371 (5.6%) | 475 (9.6%) |
| 5 to 9 Minutes | 1,104 (16.6%) | 1,612 (32.5%) |
| 10 to 14 Minutes | 1,826 (27.4%) | 1,388 (28.0%) |
| 15 to 19 Minutes | 755 (11.3%) | 692 (14.0%) |
| 20 to 24 Minutes | 381 (5.7%) | 252 (5.1%) |
| 25 to 29 Minutes | 61 (0.9%) | 79 (1.6%) |
| 30 to 34 Minutes | 565 (8.5%) | 171 (3.5%) |
| 35 to 39 Minutes | 131 (2.0%) | 85 (1.7%) |
| 40 to 44 Minutes | 435 (6.5%) | 37 (0.7%) |
| 45 to 59 Minutes | 432 (6.5%) | 62 (1.3%) |
| 60 to 89 Minutes | 415 (6.2%) | 51 (1.0%) |
| 90 or more Minutes | 182 (2.7%) | 57 (1.1%) |
Time of Departure to Work by Sex in Rock Springs
The most frequent times of departure to work in Rock Springs are 6:00 AM to 6:29 AM (1,051, 15.8%) for males and 7:00 AM to 7:29 AM (677, 13.7%) for females.
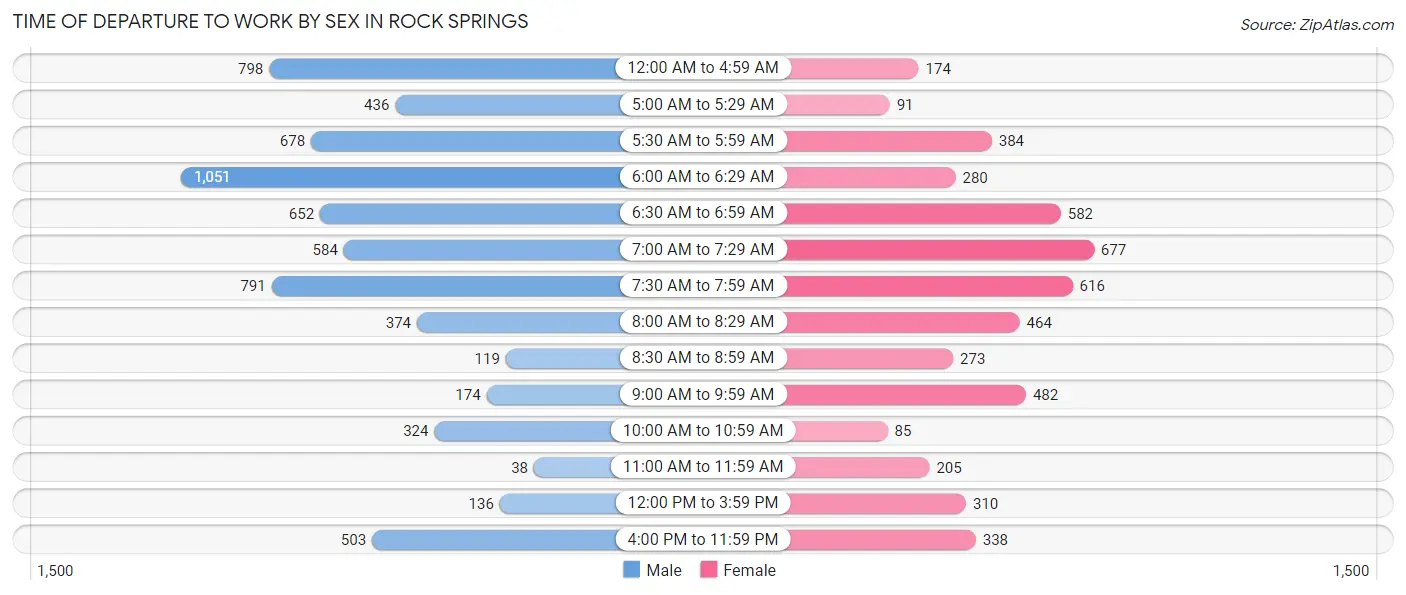
| Time of Departure | Male | Female |
| 12:00 AM to 4:59 AM | 798 (12.0%) | 174 (3.5%) |
| 5:00 AM to 5:29 AM | 436 (6.6%) | 91 (1.8%) |
| 5:30 AM to 5:59 AM | 678 (10.2%) | 384 (7.7%) |
| 6:00 AM to 6:29 AM | 1,051 (15.8%) | 280 (5.6%) |
| 6:30 AM to 6:59 AM | 652 (9.8%) | 582 (11.7%) |
| 7:00 AM to 7:29 AM | 584 (8.8%) | 677 (13.7%) |
| 7:30 AM to 7:59 AM | 791 (11.9%) | 616 (12.4%) |
| 8:00 AM to 8:29 AM | 374 (5.6%) | 464 (9.3%) |
| 8:30 AM to 8:59 AM | 119 (1.8%) | 273 (5.5%) |
| 9:00 AM to 9:59 AM | 174 (2.6%) | 482 (9.7%) |
| 10:00 AM to 10:59 AM | 324 (4.9%) | 85 (1.7%) |
| 11:00 AM to 11:59 AM | 38 (0.6%) | 205 (4.1%) |
| 12:00 PM to 3:59 PM | 136 (2.0%) | 310 (6.2%) |
| 4:00 PM to 11:59 PM | 503 (7.5%) | 338 (6.8%) |
| Total | 6,658 (100.0%) | 4,961 (100.0%) |
Housing Occupancy in Rock Springs
Occupancy by Ownership in Rock Springs
Of the total 9,017 dwellings in Rock Springs, owner-occupied units account for 6,412 (71.1%), while renter-occupied units make up 2,605 (28.9%).
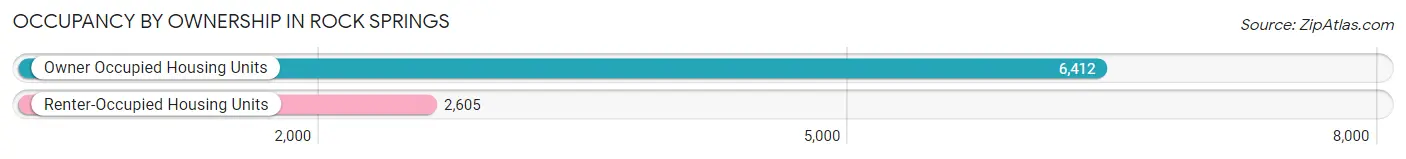
| Occupancy | # Housing Units | % Housing Units |
| Owner Occupied Housing Units | 6,412 | 71.1% |
| Renter-Occupied Housing Units | 2,605 | 28.9% |
| Total Occupied Housing Units | 9,017 | 100.0% |
Occupancy by Household Size in Rock Springs
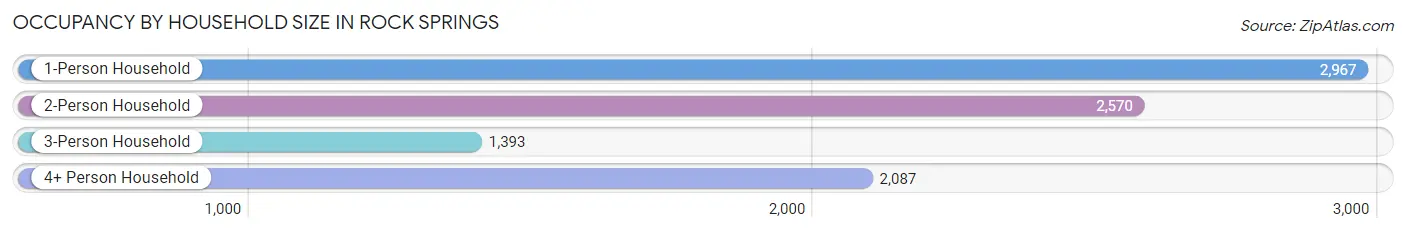
| Household Size | # Housing Units | % Housing Units |
| 1-Person Household | 2,967 | 32.9% |
| 2-Person Household | 2,570 | 28.5% |
| 3-Person Household | 1,393 | 15.4% |
| 4+ Person Household | 2,087 | 23.2% |
| Total Housing Units | 9,017 | 100.0% |
Occupancy by Ownership by Household Size in Rock Springs
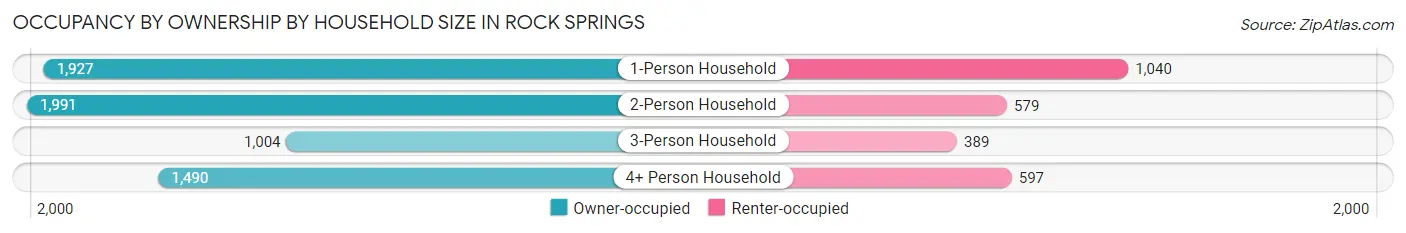
| Household Size | Owner-occupied | Renter-occupied |
| 1-Person Household | 1,927 (64.9%) | 1,040 (35.0%) |
| 2-Person Household | 1,991 (77.5%) | 579 (22.5%) |
| 3-Person Household | 1,004 (72.1%) | 389 (27.9%) |
| 4+ Person Household | 1,490 (71.4%) | 597 (28.6%) |
| Total Housing Units | 6,412 (71.1%) | 2,605 (28.9%) |
Occupancy by Educational Attainment in Rock Springs
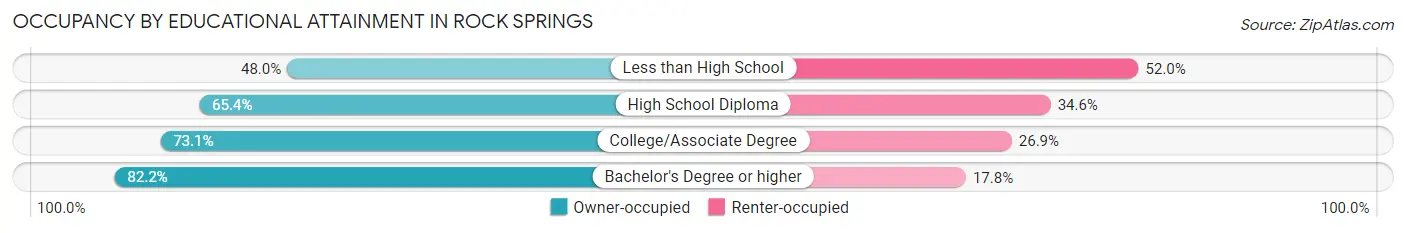
| Household Size | Owner-occupied | Renter-occupied |
| Less than High School | 295 (48.0%) | 320 (52.0%) |
| High School Diploma | 1,754 (65.4%) | 928 (34.6%) |
| College/Associate Degree | 2,720 (73.1%) | 1,001 (26.9%) |
| Bachelor's Degree or higher | 1,643 (82.2%) | 356 (17.8%) |
Occupancy by Age of Householder in Rock Springs
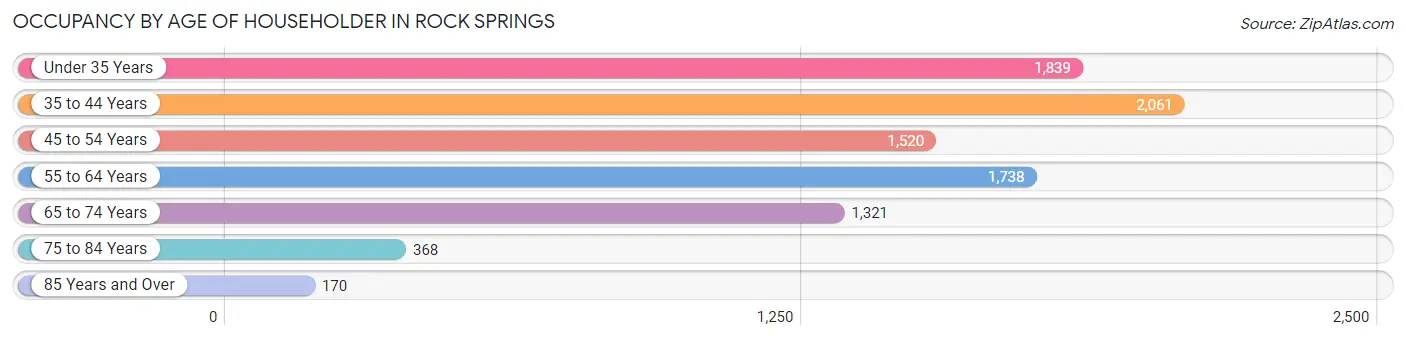
| Age Bracket | # Households | % Households |
| Under 35 Years | 1,839 | 20.4% |
| 35 to 44 Years | 2,061 | 22.9% |
| 45 to 54 Years | 1,520 | 16.9% |
| 55 to 64 Years | 1,738 | 19.3% |
| 65 to 74 Years | 1,321 | 14.6% |
| 75 to 84 Years | 368 | 4.1% |
| 85 Years and Over | 170 | 1.9% |
| Total | 9,017 | 100.0% |
Housing Finances in Rock Springs
Median Income by Occupancy in Rock Springs
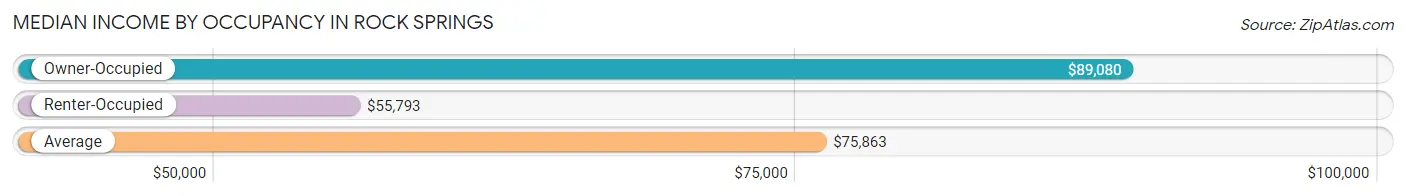
| Occupancy Type | # Households | Median Income |
| Owner-Occupied | 6,412 (71.1%) | $89,080 |
| Renter-Occupied | 2,605 (28.9%) | $55,793 |
| Average | 9,017 (100.0%) | $75,863 |
Occupancy by Householder Income Bracket in Rock Springs
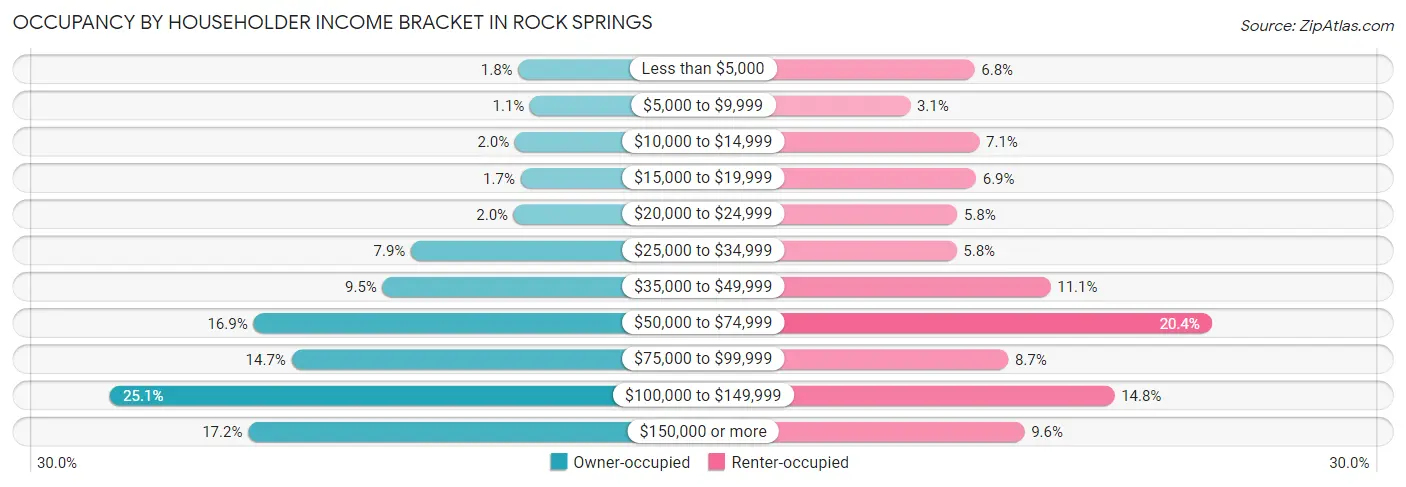
| Income Bracket | Owner-occupied | Renter-occupied |
| Less than $5,000 | 114 (1.8%) | 177 (6.8%) |
| $5,000 to $9,999 | 71 (1.1%) | 81 (3.1%) |
| $10,000 to $14,999 | 126 (2.0%) | 184 (7.1%) |
| $15,000 to $19,999 | 106 (1.7%) | 179 (6.9%) |
| $20,000 to $24,999 | 131 (2.0%) | 151 (5.8%) |
| $25,000 to $34,999 | 507 (7.9%) | 150 (5.8%) |
| $35,000 to $49,999 | 612 (9.5%) | 290 (11.1%) |
| $50,000 to $74,999 | 1,085 (16.9%) | 530 (20.3%) |
| $75,000 to $99,999 | 945 (14.7%) | 227 (8.7%) |
| $100,000 to $149,999 | 1,611 (25.1%) | 385 (14.8%) |
| $150,000 or more | 1,104 (17.2%) | 251 (9.6%) |
| Total | 6,412 (100.0%) | 2,605 (100.0%) |
Monthly Housing Cost Tiers in Rock Springs
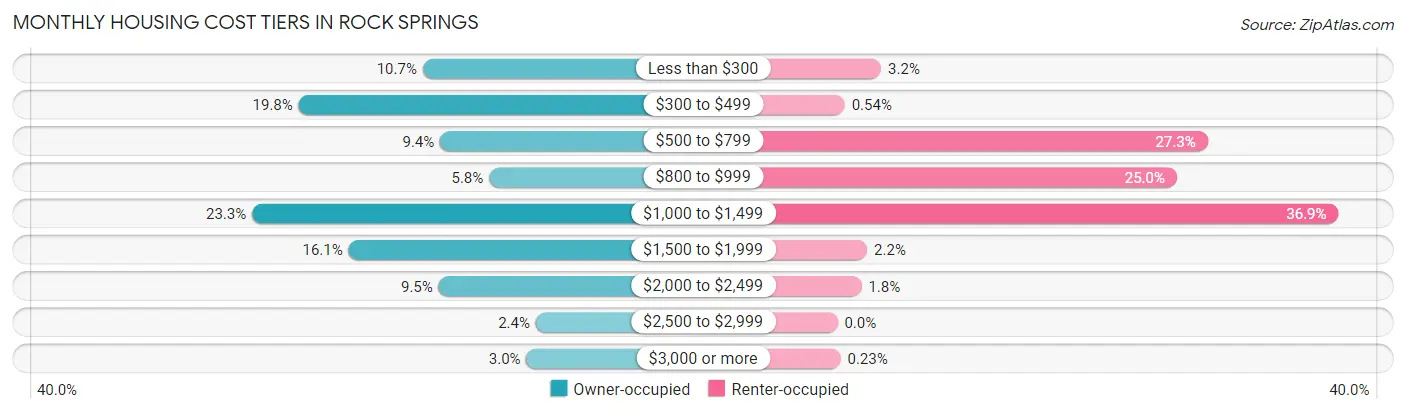
| Monthly Cost | Owner-occupied | Renter-occupied |
| Less than $300 | 685 (10.7%) | 84 (3.2%) |
| $300 to $499 | 1,271 (19.8%) | 14 (0.5%) |
| $500 to $799 | 603 (9.4%) | 710 (27.3%) |
| $800 to $999 | 371 (5.8%) | 651 (25.0%) |
| $1,000 to $1,499 | 1,491 (23.3%) | 961 (36.9%) |
| $1,500 to $1,999 | 1,035 (16.1%) | 57 (2.2%) |
| $2,000 to $2,499 | 610 (9.5%) | 46 (1.8%) |
| $2,500 to $2,999 | 151 (2.4%) | 0 (0.0%) |
| $3,000 or more | 195 (3.0%) | 6 (0.2%) |
| Total | 6,412 (100.0%) | 2,605 (100.0%) |
Physical Housing Characteristics in Rock Springs
Housing Structures in Rock Springs
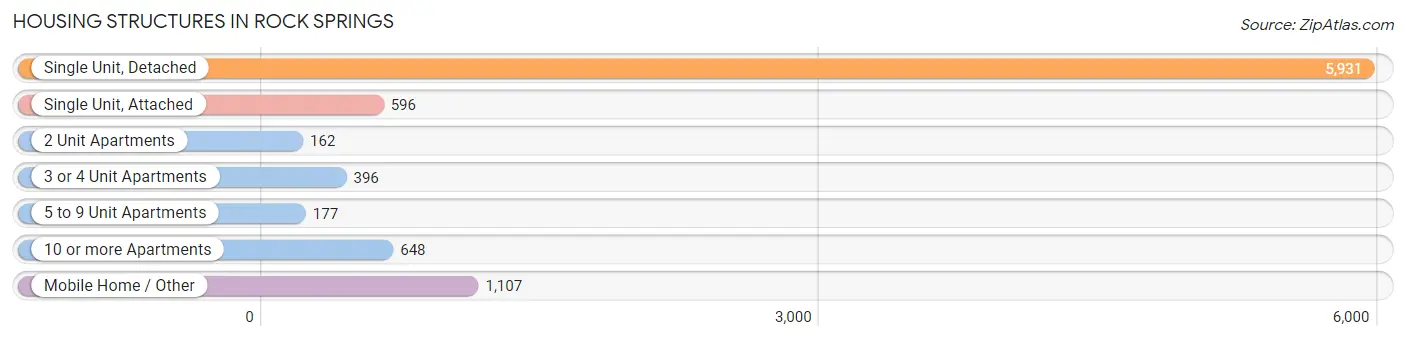
| Structure Type | # Housing Units | % Housing Units |
| Single Unit, Detached | 5,931 | 65.8% |
| Single Unit, Attached | 596 | 6.6% |
| 2 Unit Apartments | 162 | 1.8% |
| 3 or 4 Unit Apartments | 396 | 4.4% |
| 5 to 9 Unit Apartments | 177 | 2.0% |
| 10 or more Apartments | 648 | 7.2% |
| Mobile Home / Other | 1,107 | 12.3% |
| Total | 9,017 | 100.0% |
Housing Structures by Occupancy in Rock Springs
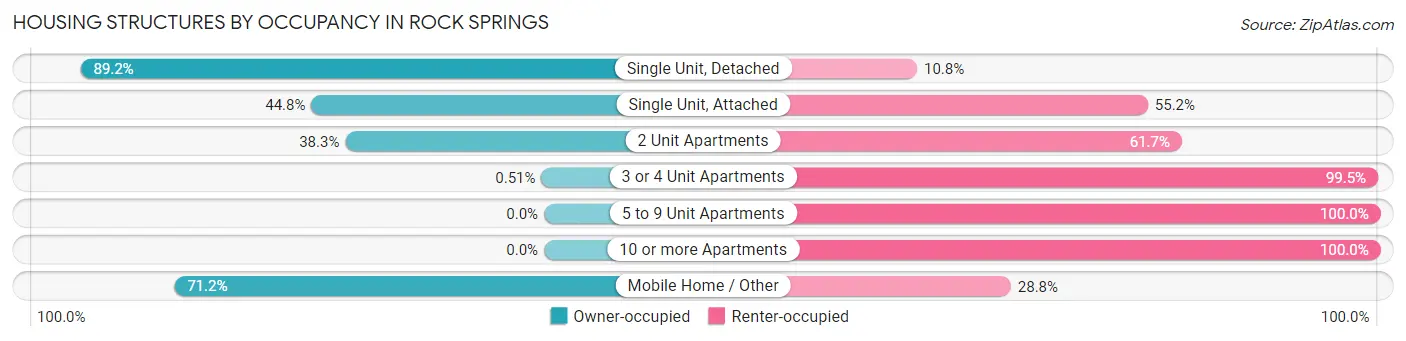
| Structure Type | Owner-occupied | Renter-occupied |
| Single Unit, Detached | 5,293 (89.2%) | 638 (10.8%) |
| Single Unit, Attached | 267 (44.8%) | 329 (55.2%) |
| 2 Unit Apartments | 62 (38.3%) | 100 (61.7%) |
| 3 or 4 Unit Apartments | 2 (0.5%) | 394 (99.5%) |
| 5 to 9 Unit Apartments | 0 (0.0%) | 177 (100.0%) |
| 10 or more Apartments | 0 (0.0%) | 648 (100.0%) |
| Mobile Home / Other | 788 (71.2%) | 319 (28.8%) |
| Total | 6,412 (71.1%) | 2,605 (28.9%) |
Housing Structures by Number of Rooms in Rock Springs
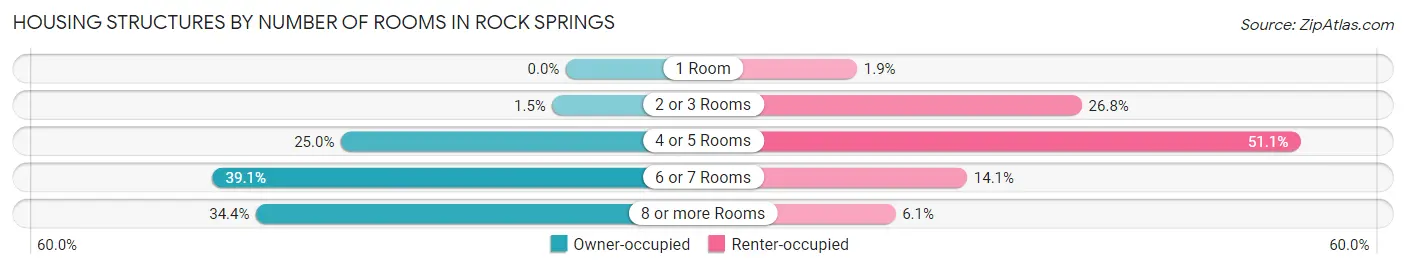
| Number of Rooms | Owner-occupied | Renter-occupied |
| 1 Room | 0 (0.0%) | 49 (1.9%) |
| 2 or 3 Rooms | 96 (1.5%) | 699 (26.8%) |
| 4 or 5 Rooms | 1,601 (25.0%) | 1,330 (51.1%) |
| 6 or 7 Rooms | 2,509 (39.1%) | 367 (14.1%) |
| 8 or more Rooms | 2,206 (34.4%) | 160 (6.1%) |
| Total | 6,412 (100.0%) | 2,605 (100.0%) |
Housing Structure by Heating Type in Rock Springs
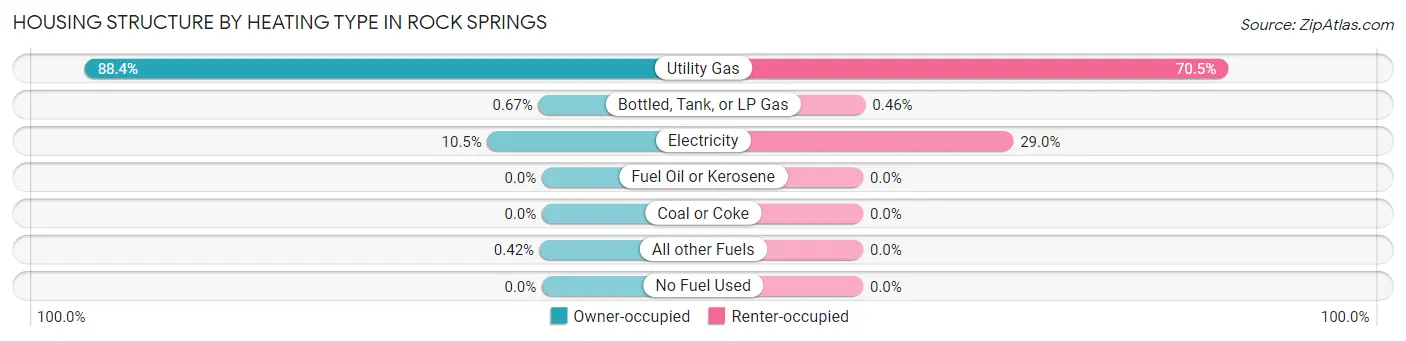
| Heating Type | Owner-occupied | Renter-occupied |
| Utility Gas | 5,667 (88.4%) | 1,837 (70.5%) |
| Bottled, Tank, or LP Gas | 43 (0.7%) | 12 (0.5%) |
| Electricity | 675 (10.5%) | 756 (29.0%) |
| Fuel Oil or Kerosene | 0 (0.0%) | 0 (0.0%) |
| Coal or Coke | 0 (0.0%) | 0 (0.0%) |
| All other Fuels | 27 (0.4%) | 0 (0.0%) |
| No Fuel Used | 0 (0.0%) | 0 (0.0%) |
| Total | 6,412 (100.0%) | 2,605 (100.0%) |
Household Vehicle Usage in Rock Springs
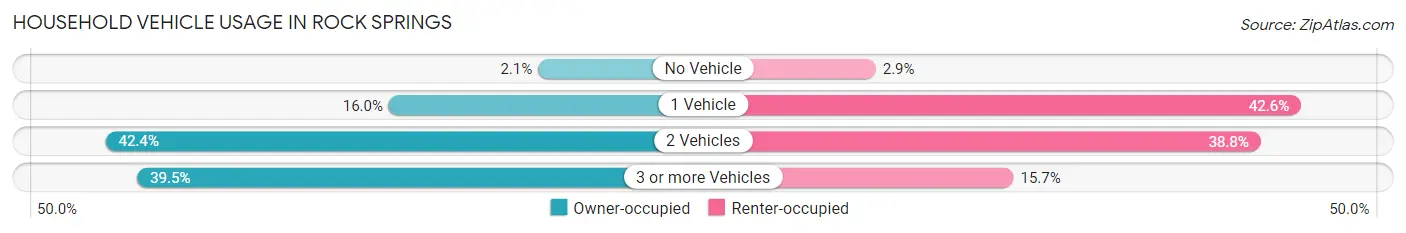
| Vehicles per Household | Owner-occupied | Renter-occupied |
| No Vehicle | 133 (2.1%) | 75 (2.9%) |
| 1 Vehicle | 1,026 (16.0%) | 1,109 (42.6%) |
| 2 Vehicles | 2,721 (42.4%) | 1,011 (38.8%) |
| 3 or more Vehicles | 2,532 (39.5%) | 410 (15.7%) |
| Total | 6,412 (100.0%) | 2,605 (100.0%) |
Real Estate & Mortgages in Rock Springs
Real Estate and Mortgage Overview in Rock Springs
| Characteristic | Without Mortgage | With Mortgage |
| Housing Units | 2,649 | 3,763 |
| Median Property Value | $219,400 | $259,700 |
| Median Household Income | $60,046 | $763 |
| Monthly Housing Costs | $410 | $113 |
| Real Estate Taxes | $1,324 | $44 |
Property Value by Mortgage Status in Rock Springs
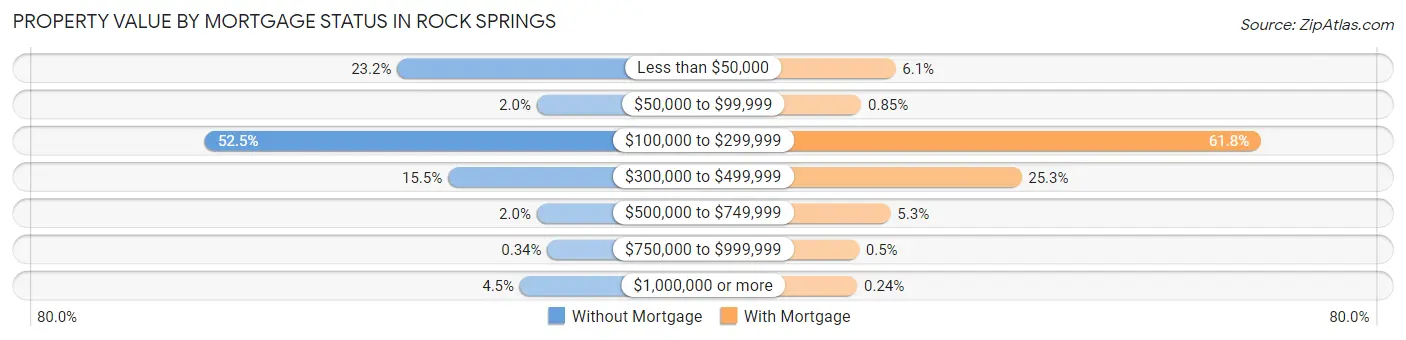
| Property Value | Without Mortgage | With Mortgage |
| Less than $50,000 | 615 (23.2%) | 228 (6.1%) |
| $50,000 to $99,999 | 52 (2.0%) | 32 (0.9%) |
| $100,000 to $299,999 | 1,391 (52.5%) | 2,325 (61.8%) |
| $300,000 to $499,999 | 410 (15.5%) | 950 (25.3%) |
| $500,000 to $749,999 | 52 (2.0%) | 200 (5.3%) |
| $750,000 to $999,999 | 9 (0.3%) | 19 (0.5%) |
| $1,000,000 or more | 120 (4.5%) | 9 (0.2%) |
| Total | 2,649 (100.0%) | 3,763 (100.0%) |
Household Income by Mortgage Status in Rock Springs
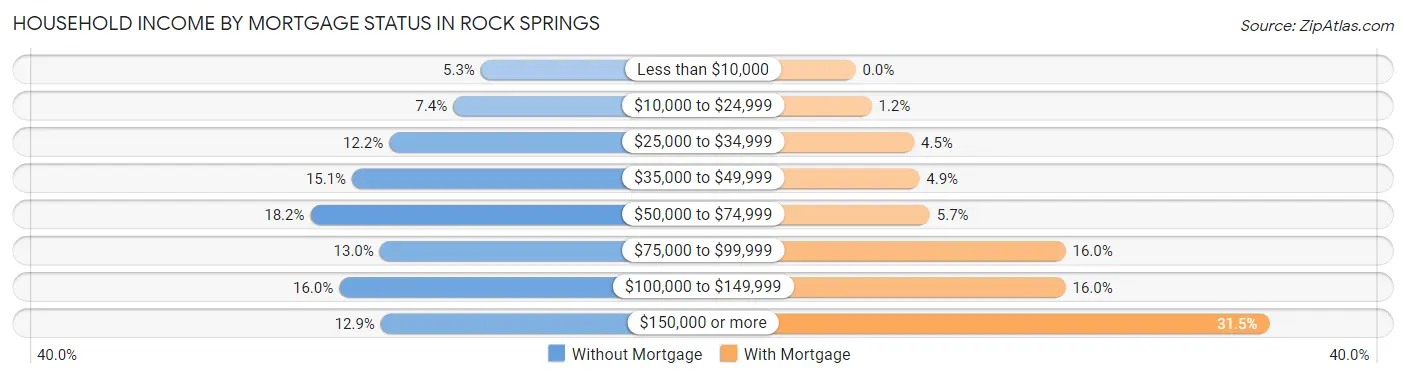
| Household Income | Without Mortgage | With Mortgage |
| Less than $10,000 | 139 (5.2%) | 0 (0.0%) |
| $10,000 to $24,999 | 195 (7.4%) | 46 (1.2%) |
| $25,000 to $34,999 | 324 (12.2%) | 168 (4.5%) |
| $35,000 to $49,999 | 399 (15.1%) | 183 (4.9%) |
| $50,000 to $74,999 | 483 (18.2%) | 213 (5.7%) |
| $75,000 to $99,999 | 343 (13.0%) | 602 (16.0%) |
| $100,000 to $149,999 | 425 (16.0%) | 602 (16.0%) |
| $150,000 or more | 341 (12.9%) | 1,186 (31.5%) |
| Total | 2,649 (100.0%) | 3,763 (100.0%) |
Property Value to Household Income Ratio in Rock Springs
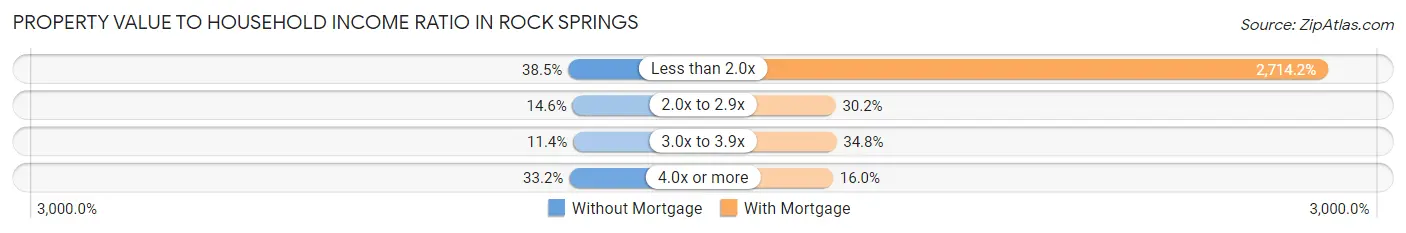
| Value-to-Income Ratio | Without Mortgage | With Mortgage |
| Less than 2.0x | 1,021 (38.5%) | 102,136 (2,714.2%) |
| 2.0x to 2.9x | 387 (14.6%) | 1,137 (30.2%) |
| 3.0x to 3.9x | 302 (11.4%) | 1,308 (34.8%) |
| 4.0x or more | 879 (33.2%) | 602 (16.0%) |
| Total | 2,649 (100.0%) | 3,763 (100.0%) |
Real Estate Taxes by Mortgage Status in Rock Springs
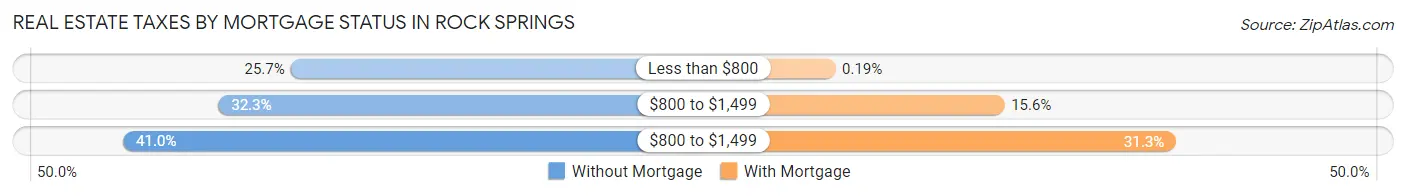
| Property Taxes | Without Mortgage | With Mortgage |
| Less than $800 | 681 (25.7%) | 7 (0.2%) |
| $800 to $1,499 | 856 (32.3%) | 588 (15.6%) |
| $800 to $1,499 | 1,086 (41.0%) | 1,179 (31.3%) |
| Total | 2,649 (100.0%) | 3,763 (100.0%) |
Health & Disability in Rock Springs
Health Insurance Coverage by Age in Rock Springs
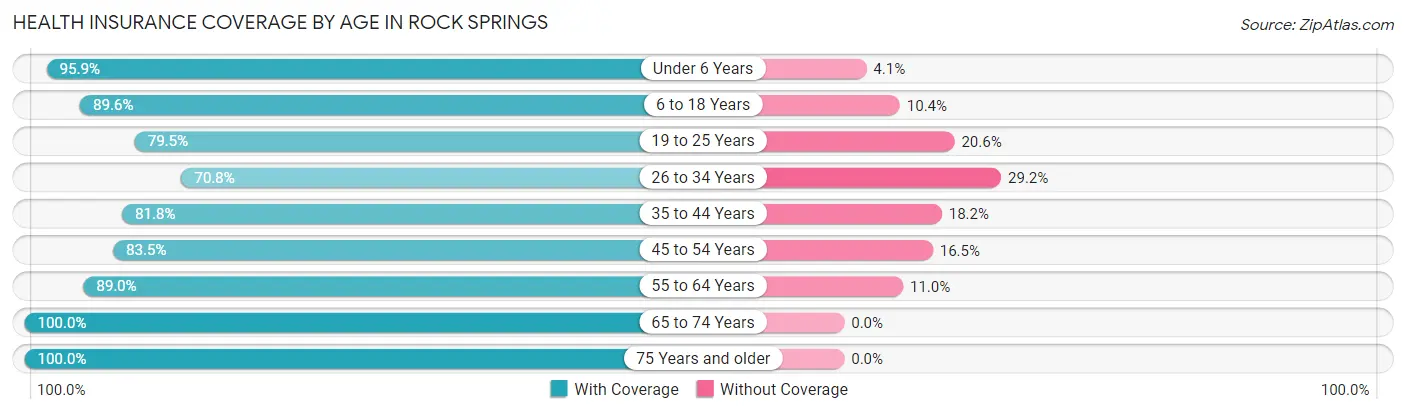
| Age Bracket | With Coverage | Without Coverage |
| Under 6 Years | 1,700 (95.9%) | 73 (4.1%) |
| 6 to 18 Years | 4,238 (89.6%) | 490 (10.4%) |
| 19 to 25 Years | 1,879 (79.4%) | 486 (20.5%) |
| 26 to 34 Years | 1,888 (70.8%) | 780 (29.2%) |
| 35 to 44 Years | 3,046 (81.8%) | 677 (18.2%) |
| 45 to 54 Years | 2,160 (83.5%) | 427 (16.5%) |
| 55 to 64 Years | 2,357 (89.0%) | 290 (11.0%) |
| 65 to 74 Years | 1,862 (100.0%) | 0 (0.0%) |
| 75 Years and older | 848 (100.0%) | 0 (0.0%) |
| Total | 19,978 (86.1%) | 3,223 (13.9%) |
Health Insurance Coverage by Citizenship Status in Rock Springs
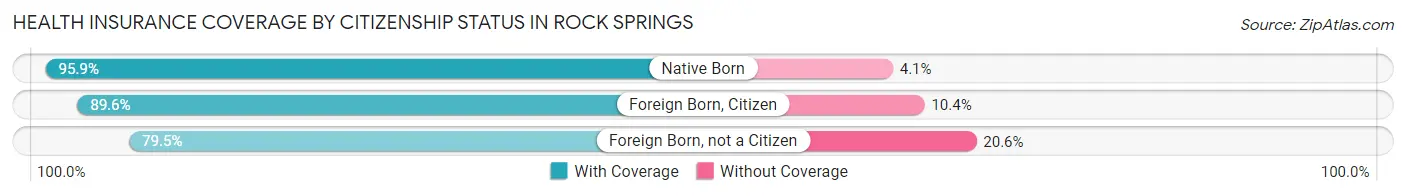
| Citizenship Status | With Coverage | Without Coverage |
| Native Born | 1,700 (95.9%) | 73 (4.1%) |
| Foreign Born, Citizen | 4,238 (89.6%) | 490 (10.4%) |
| Foreign Born, not a Citizen | 1,879 (79.4%) | 486 (20.5%) |
Health Insurance Coverage by Household Income in Rock Springs
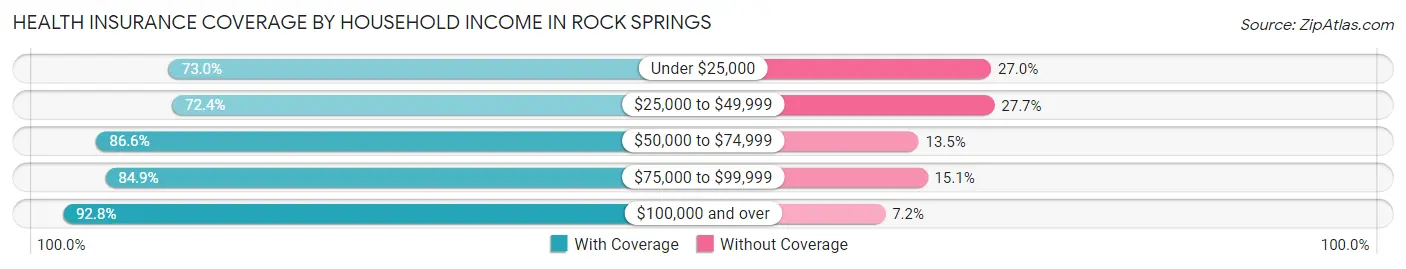
| Household Income | With Coverage | Without Coverage |
| Under $25,000 | 1,715 (73.0%) | 635 (27.0%) |
| $25,000 to $49,999 | 2,185 (72.4%) | 835 (27.7%) |
| $50,000 to $74,999 | 2,863 (86.6%) | 445 (13.5%) |
| $75,000 to $99,999 | 2,796 (84.9%) | 498 (15.1%) |
| $100,000 and over | 10,213 (92.8%) | 792 (7.2%) |
Public vs Private Health Insurance Coverage by Age in Rock Springs
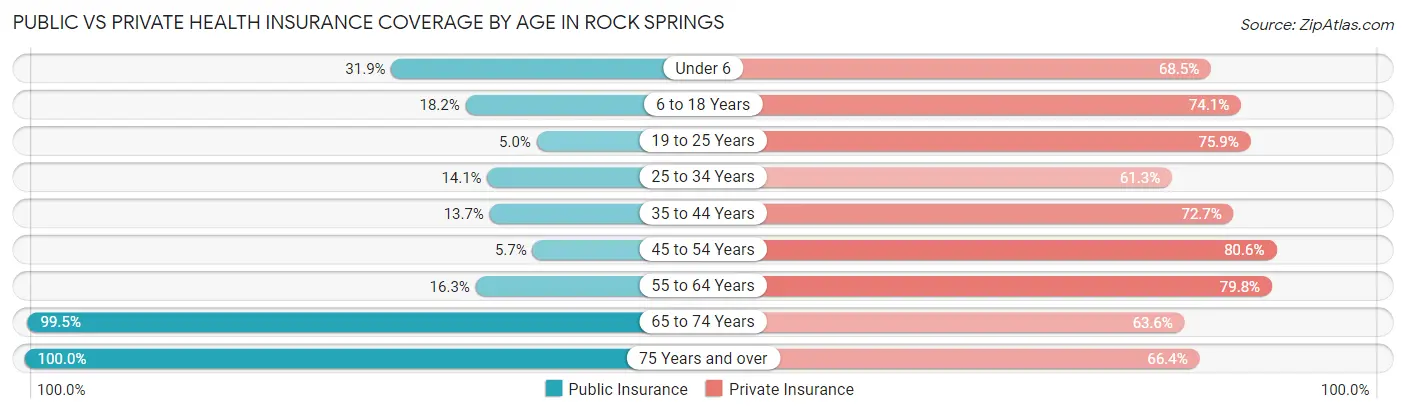
| Age Bracket | Public Insurance | Private Insurance |
| Under 6 | 566 (31.9%) | 1,215 (68.5%) |
| 6 to 18 Years | 858 (18.1%) | 3,504 (74.1%) |
| 19 to 25 Years | 117 (5.0%) | 1,794 (75.9%) |
| 25 to 34 Years | 376 (14.1%) | 1,635 (61.3%) |
| 35 to 44 Years | 509 (13.7%) | 2,707 (72.7%) |
| 45 to 54 Years | 148 (5.7%) | 2,086 (80.6%) |
| 55 to 64 Years | 431 (16.3%) | 2,113 (79.8%) |
| 65 to 74 Years | 1,852 (99.5%) | 1,185 (63.6%) |
| 75 Years and over | 848 (100.0%) | 563 (66.4%) |
| Total | 5,705 (24.6%) | 16,802 (72.4%) |
Disability Status by Sex by Age in Rock Springs
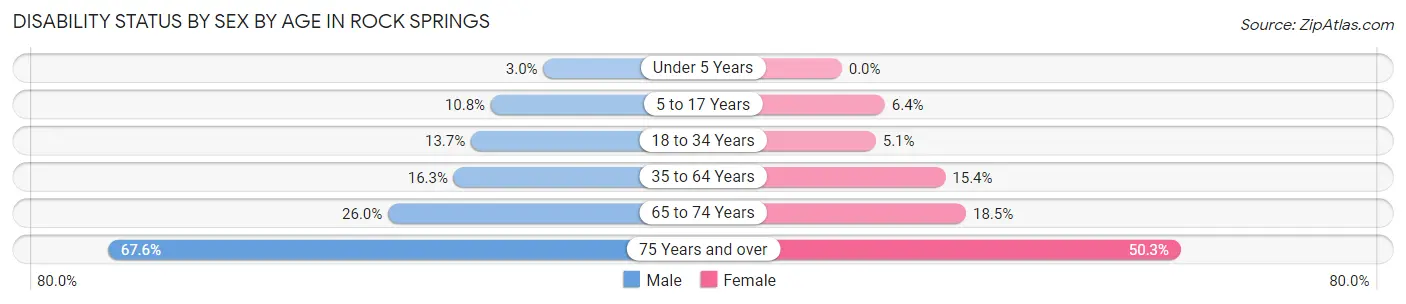
| Age Bracket | Male | Female |
| Under 5 Years | 21 (3.0%) | 0 (0.0%) |
| 5 to 17 Years | 249 (10.7%) | 150 (6.4%) |
| 18 to 34 Years | 415 (13.7%) | 123 (5.1%) |
| 35 to 64 Years | 760 (16.3%) | 659 (15.4%) |
| 65 to 74 Years | 256 (26.0%) | 162 (18.4%) |
| 75 Years and over | 278 (67.6%) | 220 (50.3%) |
Disability Class by Sex by Age in Rock Springs
Disability Class: Hearing Difficulty
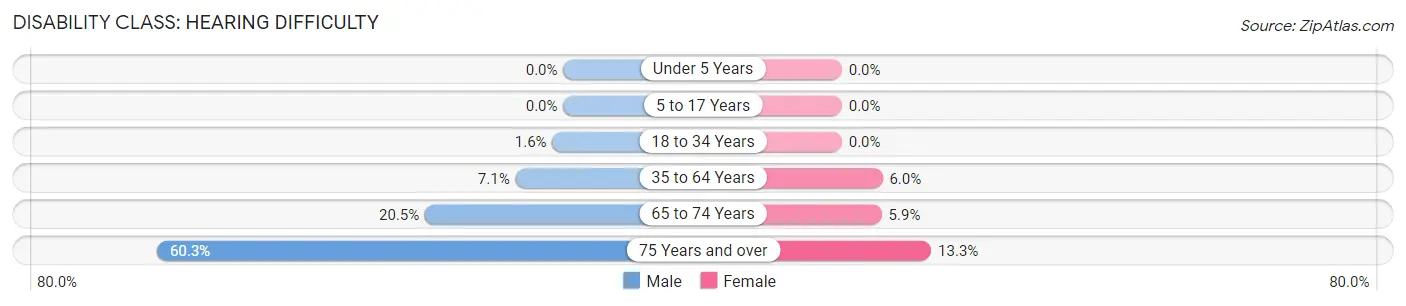
| Age Bracket | Male | Female |
| Under 5 Years | 0 (0.0%) | 0 (0.0%) |
| 5 to 17 Years | 0 (0.0%) | 0 (0.0%) |
| 18 to 34 Years | 49 (1.6%) | 0 (0.0%) |
| 35 to 64 Years | 332 (7.1%) | 259 (6.0%) |
| 65 to 74 Years | 202 (20.5%) | 52 (5.9%) |
| 75 Years and over | 248 (60.3%) | 58 (13.3%) |
Disability Class: Vision Difficulty
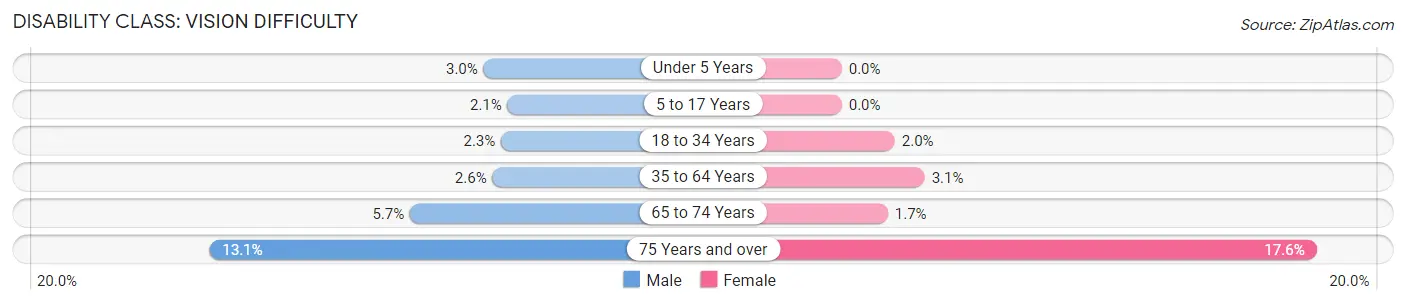
| Age Bracket | Male | Female |
| Under 5 Years | 21 (3.0%) | 0 (0.0%) |
| 5 to 17 Years | 48 (2.1%) | 0 (0.0%) |
| 18 to 34 Years | 70 (2.3%) | 48 (2.0%) |
| 35 to 64 Years | 123 (2.6%) | 132 (3.1%) |
| 65 to 74 Years | 56 (5.7%) | 15 (1.7%) |
| 75 Years and over | 54 (13.1%) | 77 (17.6%) |
Disability Class: Cognitive Difficulty
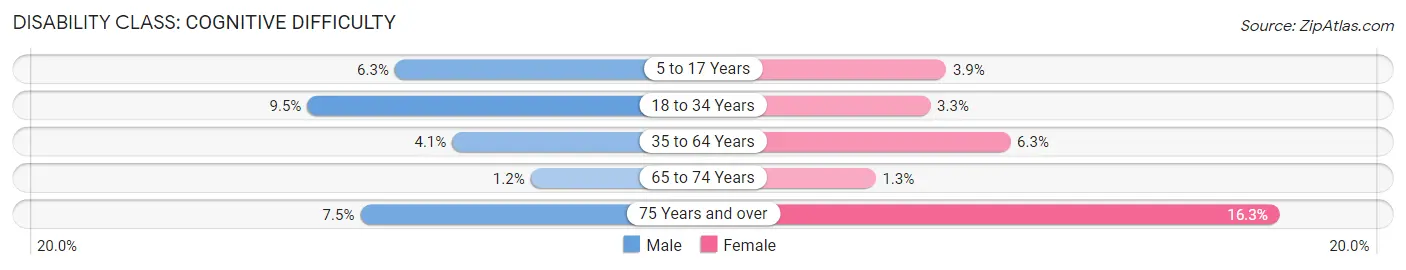
| Age Bracket | Male | Female |
| 5 to 17 Years | 145 (6.3%) | 91 (3.9%) |
| 18 to 34 Years | 288 (9.5%) | 80 (3.3%) |
| 35 to 64 Years | 193 (4.1%) | 268 (6.2%) |
| 65 to 74 Years | 12 (1.2%) | 11 (1.3%) |
| 75 Years and over | 31 (7.5%) | 71 (16.3%) |
Disability Class: Ambulatory Difficulty
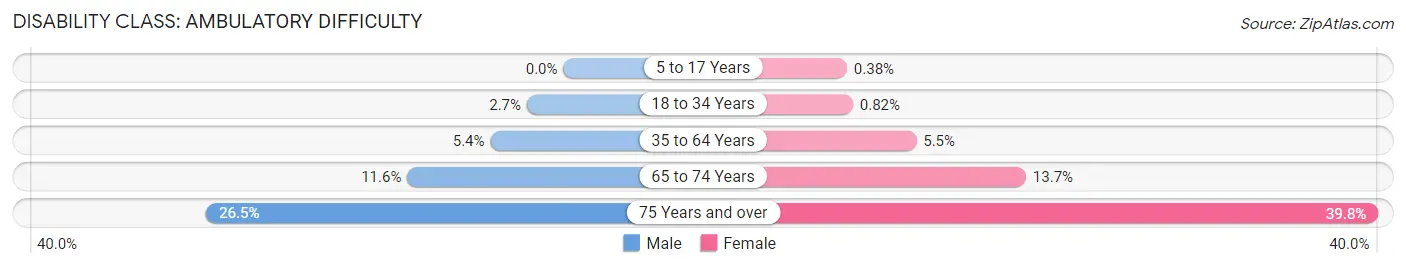
| Age Bracket | Male | Female |
| 5 to 17 Years | 0 (0.0%) | 9 (0.4%) |
| 18 to 34 Years | 82 (2.7%) | 20 (0.8%) |
| 35 to 64 Years | 253 (5.4%) | 237 (5.5%) |
| 65 to 74 Years | 114 (11.6%) | 120 (13.7%) |
| 75 Years and over | 109 (26.5%) | 174 (39.8%) |
Disability Class: Self-Care Difficulty
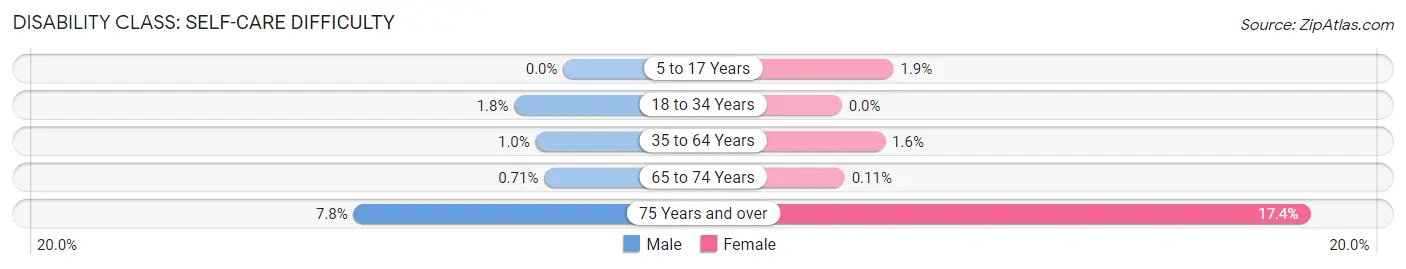
| Age Bracket | Male | Female |
| 5 to 17 Years | 0 (0.0%) | 45 (1.9%) |
| 18 to 34 Years | 55 (1.8%) | 0 (0.0%) |
| 35 to 64 Years | 48 (1.0%) | 69 (1.6%) |
| 65 to 74 Years | 7 (0.7%) | 1 (0.1%) |
| 75 Years and over | 32 (7.8%) | 76 (17.4%) |
Technology Access in Rock Springs
Computing Device Access in Rock Springs
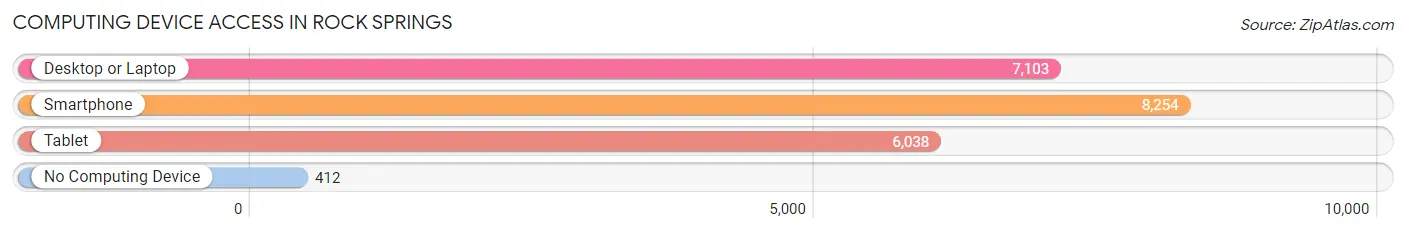
| Device Type | # Households | % Households |
| Desktop or Laptop | 7,103 | 78.8% |
| Smartphone | 8,254 | 91.5% |
| Tablet | 6,038 | 67.0% |
| No Computing Device | 412 | 4.6% |
| Total | 9,017 | 100.0% |
Internet Access in Rock Springs
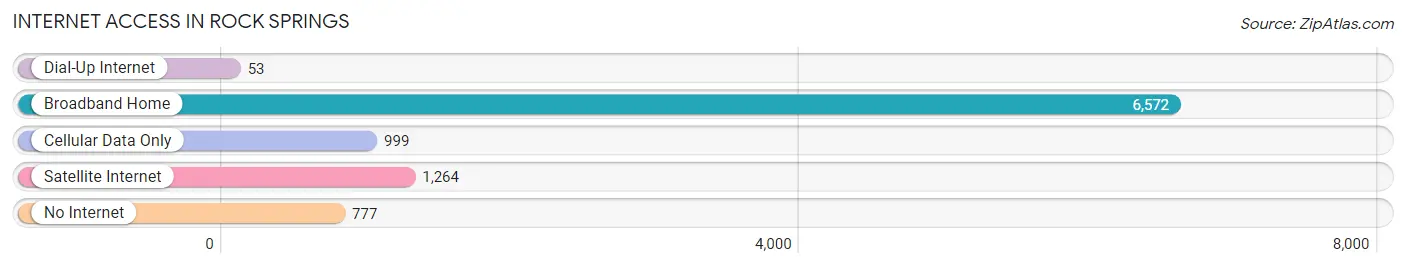
| Internet Type | # Households | % Households |
| Dial-Up Internet | 53 | 0.6% |
| Broadband Home | 6,572 | 72.9% |
| Cellular Data Only | 999 | 11.1% |
| Satellite Internet | 1,264 | 14.0% |
| No Internet | 777 | 8.6% |
| Total | 9,017 | 100.0% |
Rock Springs Summary
History
Rock Springs, Wyoming is a city located in Sweetwater County in the southwestern part of the state. It is the county seat and the largest city in the county. The city was founded in 1868 as a railroad town and was named after the nearby springs that were used by Native Americans for centuries. The city was originally a coal mining town and was the site of the infamous Rock Springs Massacre in 1885, when a mob of white miners attacked Chinese miners, killing 28 and injuring many more.
The city has a long and rich history, and has been home to many different cultures and ethnicities. The city was home to the Shoshone and Ute tribes for centuries before the arrival of white settlers. The city was also home to a large number of Chinese immigrants who came to work in the coal mines in the late 19th century. The city was also home to a large number of Italian immigrants who came to work in the coal mines in the early 20th century.
Geography
Rock Springs is located in the southwestern part of Wyoming, in Sweetwater County. The city is situated at the base of the Rocky Mountains, and is surrounded by the Red Desert to the south and the Great Divide Basin to the north. The city is located at an elevation of 6,200 feet above sea level. The city is located at the intersection of Interstate 80 and US Route 191, and is about 100 miles west of Cheyenne, Wyoming.
The city has a total area of 16.2 square miles, of which 16.1 square miles is land and 0.1 square miles is water. The city is located in a semi-arid climate, with hot summers and cold winters. The average annual precipitation is about 11 inches, and the average annual snowfall is about 30 inches.
Economy
Rock Springs is the economic hub of Sweetwater County, and is home to a variety of industries. The city is home to several large coal mines, and is also home to a number of oil and gas companies. The city is also home to a number of manufacturing companies, including a large aluminum smelter. The city is also home to a number of retail stores, restaurants, and other businesses.
The city is also home to a number of educational institutions, including Western Wyoming Community College and the University of Wyoming at Rock Springs. The city is also home to a number of medical facilities, including Memorial Hospital of Sweetwater County.
Demographics
As of the 2010 census, the population of Rock Springs was 23,036. The racial makeup of the city was 87.3% White, 0.7% African American, 0.7% Native American, 0.7% Asian, 0.2% Pacific Islander, 8.2% from other races, and 2.2% from two or more races. Hispanic or Latino of any race were 20.2% of the population.
The median income for a household in the city was $41,945, and the median income for a family was $50,945. The per capita income for the city was $20,945. About 14.2% of families and 17.7% of the population were below the poverty line, including 25.2% of those under age 18 and 8.2% of those age 65 or over.
Rock Springs is a diverse city, with a variety of cultures and ethnicities. The city is home to a large number of Native Americans, as well as a large number of immigrants from Mexico, Central America, and Asia. The city is also home to a large number of Italian Americans, as well as a large number of Chinese Americans.
Common Questions
What is Per Capita Income in Rock Springs?
Per Capita income in Rock Springs is $40,921.
What is the Median Family Income in Rock Springs?
Median Family Income in Rock Springs is $95,983.
What is the Median Household income in Rock Springs?
Median Household Income in Rock Springs is $75,863.
What is Income or Wage Gap in Rock Springs?
Income or Wage Gap in Rock Springs is 45.2%.
Women in Rock Springs earn 54.8 cents for every dollar earned by a man.
What is Family Income Deficit in Rock Springs?
Family Income Deficit in Rock Springs is $9,921.
Families that are below poverty line in Rock Springs earn $9,921 less on average than the poverty threshold level.
What is Inequality or Gini Index in Rock Springs?
Inequality or Gini Index in Rock Springs is 0.47.
What is the Total Population of Rock Springs?
Total Population of Rock Springs is 23,361.
What is the Total Male Population of Rock Springs?
Total Male Population of Rock Springs is 12,188.
What is the Total Female Population of Rock Springs?
Total Female Population of Rock Springs is 11,173.
What is the Ratio of Males per 100 Females in Rock Springs?
There are 109.08 Males per 100 Females in Rock Springs.
What is the Ratio of Females per 100 Males in Rock Springs?
There are 91.67 Females per 100 Males in Rock Springs.
What is the Median Population Age in Rock Springs?
Median Population Age in Rock Springs is 35.2 Years.
What is the Average Family Size in Rock Springs
Average Family Size in Rock Springs is 3.2 People.
What is the Average Household Size in Rock Springs
Average Household Size in Rock Springs is 2.5 People.
How Large is the Labor Force in Rock Springs?
There are 12,754 People in the Labor Forcein in Rock Springs.
What is the Percentage of People in the Labor Force in Rock Springs?
71.1% of People are in the Labor Force in Rock Springs.
What is the Unemployment Rate in Rock Springs?
Unemployment Rate in Rock Springs is 5.4%.