Lander, WY Map & Demographics
Lander Map
Lander Overview
$34,038
PER CAPITA INCOME
$90,915
AVG FAMILY INCOME
$62,958
AVG HOUSEHOLD INCOME
46.3%
WAGE / INCOME GAP [ % ]
53.7¢/ $1
WAGE / INCOME GAP [ $ ]
0.43
INEQUALITY / GINI INDEX
7,561
TOTAL POPULATION
3,663
MALE POPULATION
3,898
FEMALE POPULATION
93.97
MALES / 100 FEMALES
106.42
FEMALES / 100 MALES
37.1
MEDIAN AGE
3.3
AVG FAMILY SIZE
2.5
AVG HOUSEHOLD SIZE
3,627
LABOR FORCE [ PEOPLE ]
62.7%
PERCENT IN LABOR FORCE
4.3%
UNEMPLOYMENT RATE
Lander Zip Codes
Lander Area Codes
Income in Lander
Income Overview in Lander
Per Capita Income in Lander is $34,038, while median incomes of families and households are $90,915 and $62,958 respectively.
| Characteristic | Number | Measure |
| Per Capita Income | 7,561 | $34,038 |
| Median Family Income | 1,688 | $90,915 |
| Mean Family Income | 1,688 | $100,806 |
| Median Household Income | 2,969 | $62,958 |
| Mean Household Income | 2,969 | $82,844 |
| Income Deficit | 1,688 | $0 |
| Wage / Income Gap (%) | 7,561 | 46.28% |
| Wage / Income Gap ($) | 7,561 | 53.72¢ per $1 |
| Gini / Inequality Index | 7,561 | 0.43 |
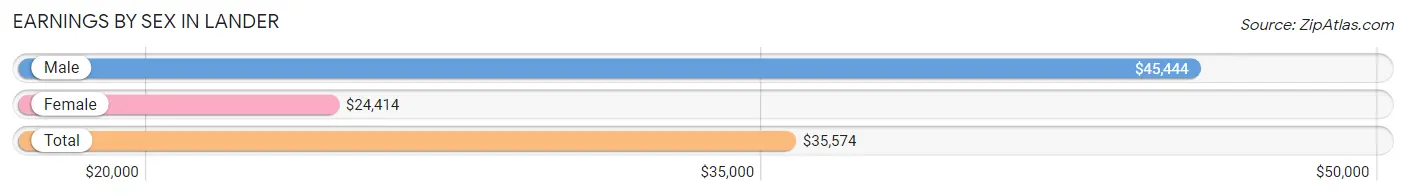
Earnings by Sex in Lander
Average Earnings in Lander are $35,574, $45,444 for men and $24,414 for women, a difference of 46.3%.
| Sex | Number | Average Earnings |
| Male | 2,051 (51.9%) | $45,444 |
| Female | 1,898 (48.1%) | $24,414 |
| Total | 3,949 (100.0%) | $35,574 |
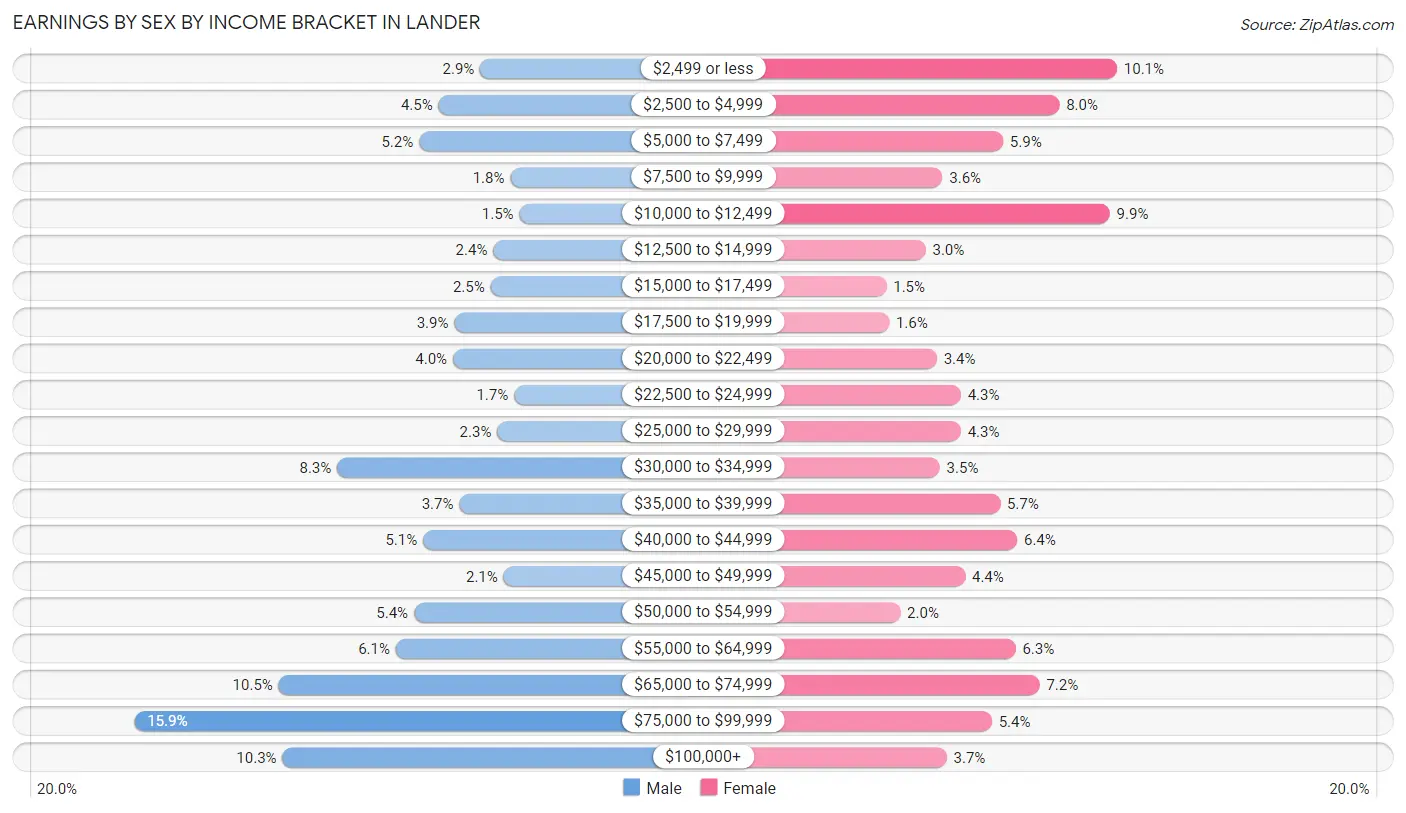
Earnings by Sex by Income Bracket in Lander
The most common earnings brackets in Lander are $75,000 to $99,999 for men (326 | 15.9%) and $2,499 or less for women (192 | 10.1%).
| Income | Male | Female |
| $2,499 or less | 60 (2.9%) | 192 (10.1%) |
| $2,500 to $4,999 | 92 (4.5%) | 151 (8.0%) |
| $5,000 to $7,499 | 107 (5.2%) | 111 (5.9%) |
| $7,500 to $9,999 | 37 (1.8%) | 68 (3.6%) |
| $10,000 to $12,499 | 30 (1.5%) | 187 (9.9%) |
| $12,500 to $14,999 | 50 (2.4%) | 56 (2.9%) |
| $15,000 to $17,499 | 52 (2.5%) | 28 (1.5%) |
| $17,500 to $19,999 | 80 (3.9%) | 30 (1.6%) |
| $20,000 to $22,499 | 81 (4.0%) | 64 (3.4%) |
| $22,500 to $24,999 | 34 (1.7%) | 81 (4.3%) |
| $25,000 to $29,999 | 47 (2.3%) | 81 (4.3%) |
| $30,000 to $34,999 | 170 (8.3%) | 66 (3.5%) |
| $35,000 to $39,999 | 76 (3.7%) | 109 (5.7%) |
| $40,000 to $44,999 | 104 (5.1%) | 121 (6.4%) |
| $45,000 to $49,999 | 42 (2.1%) | 84 (4.4%) |
| $50,000 to $54,999 | 111 (5.4%) | 38 (2.0%) |
| $55,000 to $64,999 | 125 (6.1%) | 120 (6.3%) |
| $65,000 to $74,999 | 215 (10.5%) | 137 (7.2%) |
| $75,000 to $99,999 | 326 (15.9%) | 103 (5.4%) |
| $100,000+ | 212 (10.3%) | 71 (3.7%) |
| Total | 2,051 (100.0%) | 1,898 (100.0%) |
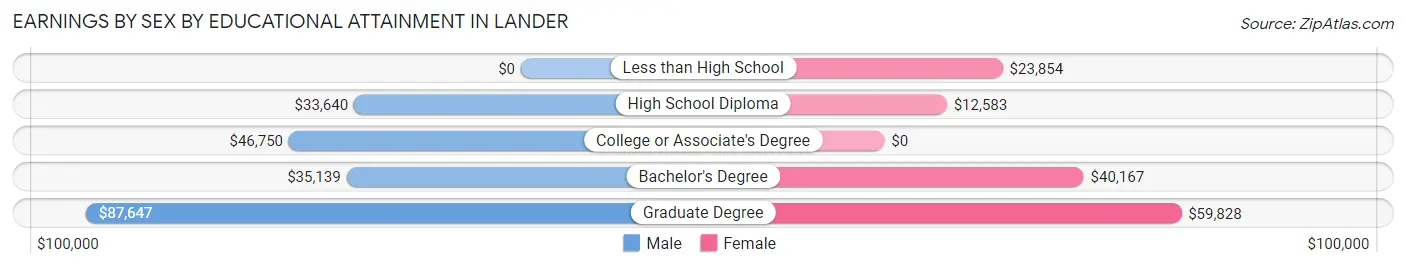
Earnings by Sex by Educational Attainment in Lander
Average earnings in Lander are $51,458 for men and $30,417 for women, a difference of 40.9%. Men with an educational attainment of graduate degree enjoy the highest average annual earnings of $87,647, while those with high school diploma education earn the least with $33,640. Women with an educational attainment of graduate degree earn the most with the average annual earnings of $59,828, while those with high school diploma education have the smallest earnings of $12,583.
| Educational Attainment | Male Income | Female Income |
| Less than High School | - | - |
| High School Diploma | $33,640 | $12,583 |
| College or Associate's Degree | $46,750 | $0 |
| Bachelor's Degree | $35,139 | $40,167 |
| Graduate Degree | $87,647 | $59,828 |
| Total | $51,458 | $30,417 |
Family Income in Lander
Family Income Brackets in Lander
According to the Lander family income data, there are 500 families falling into the $100,000 to $149,999 income range, which is the most common income bracket and makes up 29.6% of all families. Conversely, the less than $10,000 income bracket is the least frequent group with only 37 families (2.2%) belonging to this category.
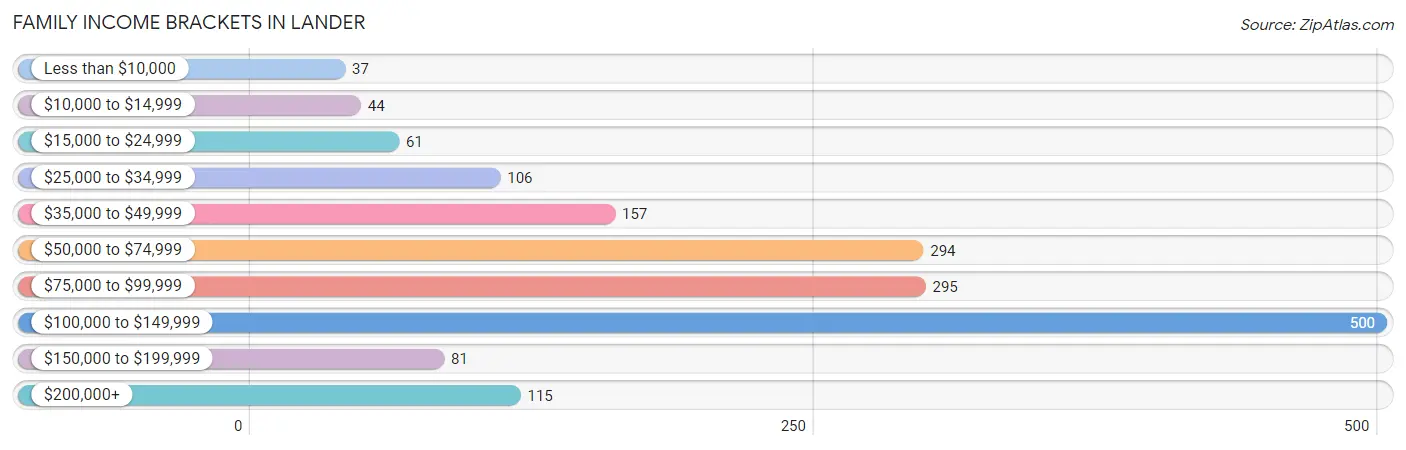
| Income Bracket | # Families | % Families |
| Less than $10,000 | 37 | 2.2% |
| $10,000 to $14,999 | 44 | 2.6% |
| $15,000 to $24,999 | 61 | 3.6% |
| $25,000 to $34,999 | 106 | 6.3% |
| $35,000 to $49,999 | 157 | 9.3% |
| $50,000 to $74,999 | 294 | 17.4% |
| $75,000 to $99,999 | 295 | 17.5% |
| $100,000 to $149,999 | 500 | 29.6% |
| $150,000 to $199,999 | 81 | 4.8% |
| $200,000+ | 115 | 6.8% |
Family Income by Famaliy Size in Lander
3-person families (363 | 21.5%) account for the highest median family income in Lander with $93,625 per family, while 2-person families (847 | 50.2%) have the highest median income of $46,363 per family member.
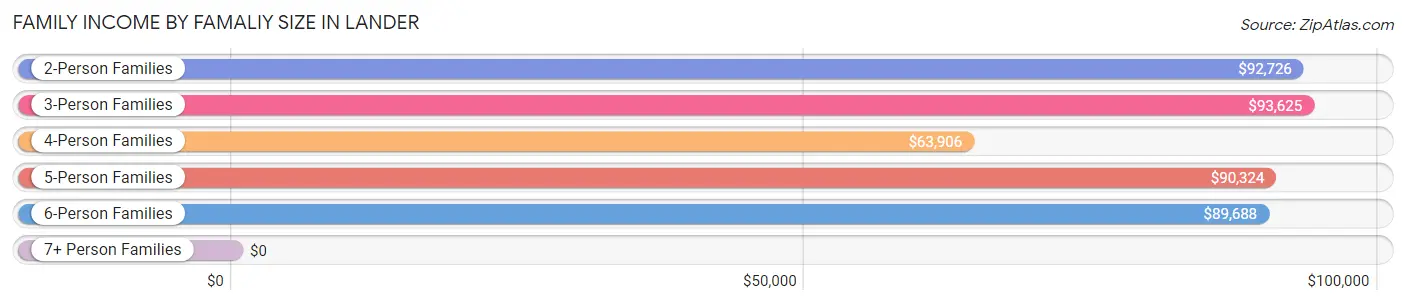
| Income Bracket | # Families | Median Income |
| 2-Person Families | 847 (50.2%) | $92,726 |
| 3-Person Families | 363 (21.5%) | $93,625 |
| 4-Person Families | 207 (12.3%) | $63,906 |
| 5-Person Families | 157 (9.3%) | $90,324 |
| 6-Person Families | 89 (5.3%) | $89,688 |
| 7+ Person Families | 25 (1.5%) | $0 |
| Total | 1,688 (100.0%) | $90,915 |
Family Income by Number of Earners in Lander
The median family income in Lander is $90,915, with families comprising 3+ earners (120) having the highest median family income of $108,017, while families with 1 earner (411) have the lowest median family income of $49,028, accounting for 7.1% and 24.3% of families, respectively.
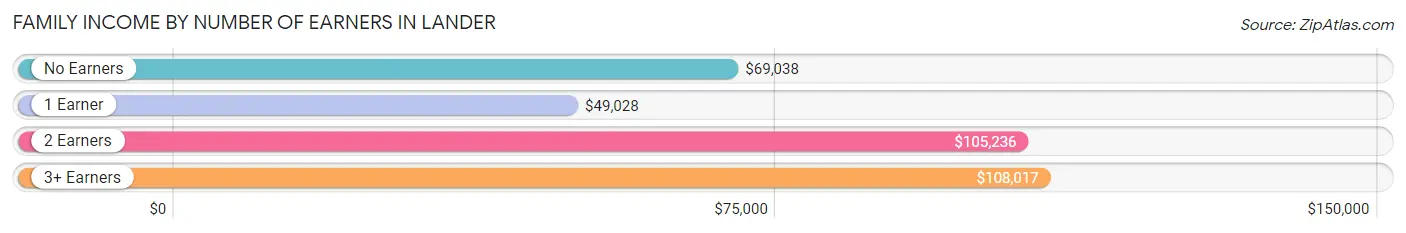
| Number of Earners | # Families | Median Income |
| No Earners | 258 (15.3%) | $69,038 |
| 1 Earner | 411 (24.3%) | $49,028 |
| 2 Earners | 899 (53.3%) | $105,236 |
| 3+ Earners | 120 (7.1%) | $108,017 |
| Total | 1,688 (100.0%) | $90,915 |
Household Income in Lander
Household Income Brackets in Lander
With 597 households falling in the category, the $100,000 to $149,999 income range is the most frequent in Lander, accounting for 20.1% of all households. In contrast, only 89 households (3.0%) fall into the $10,000 to $14,999 income bracket, making it the least populous group.
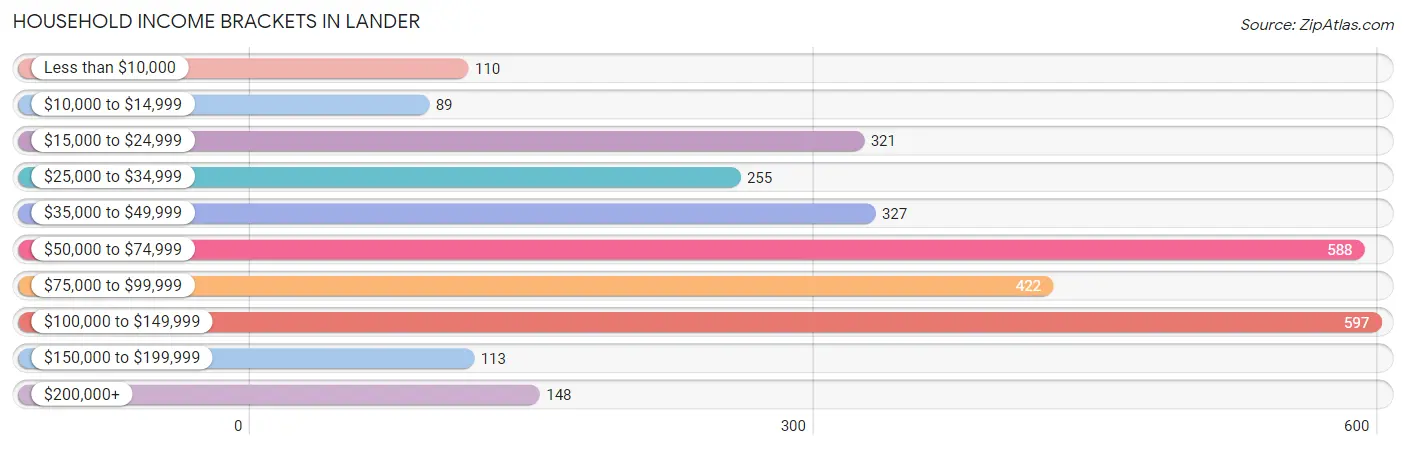
| Income Bracket | # Households | % Households |
| Less than $10,000 | 110 | 3.7% |
| $10,000 to $14,999 | 89 | 3.0% |
| $15,000 to $24,999 | 321 | 10.8% |
| $25,000 to $34,999 | 255 | 8.6% |
| $35,000 to $49,999 | 327 | 11.0% |
| $50,000 to $74,999 | 588 | 19.8% |
| $75,000 to $99,999 | 422 | 14.2% |
| $100,000 to $149,999 | 597 | 20.1% |
| $150,000 to $199,999 | 113 | 3.8% |
| $200,000+ | 148 | 5.0% |
Household Income by Householder Age in Lander
The median household income in Lander is $62,958, with the highest median household income of $93,244 found in the 45 to 64 years age bracket for the primary householder. A total of 986 households (33.2%) fall into this category. Meanwhile, the 15 to 24 years age bracket for the primary householder has the lowest median household income of $0, with 100 households (3.4%) in this group.
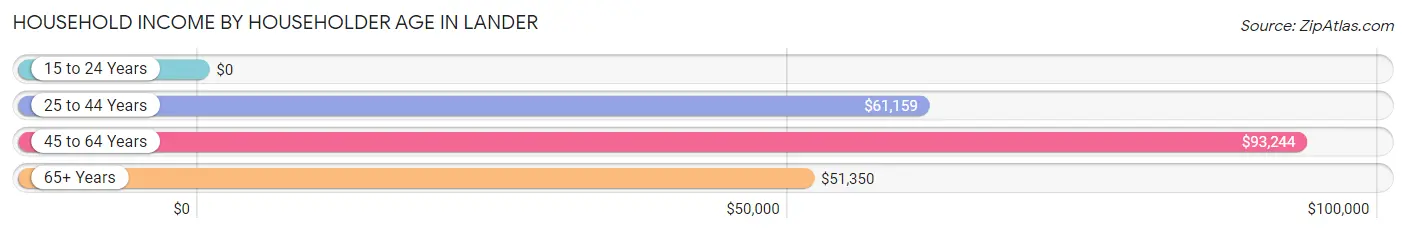
| Income Bracket | # Households | Median Income |
| 15 to 24 Years | 100 (3.4%) | $0 |
| 25 to 44 Years | 1,054 (35.5%) | $61,159 |
| 45 to 64 Years | 986 (33.2%) | $93,244 |
| 65+ Years | 829 (27.9%) | $51,350 |
| Total | 2,969 (100.0%) | $62,958 |
Poverty in Lander
Income Below Poverty by Sex and Age in Lander
With 11.2% poverty level for males and 10.9% for females among the residents of Lander, 16 and 17 year old males and 12 to 14 year old females are the most vulnerable to poverty, with 69 males (64.5%) and 41 females (29.9%) in their respective age groups living below the poverty level.
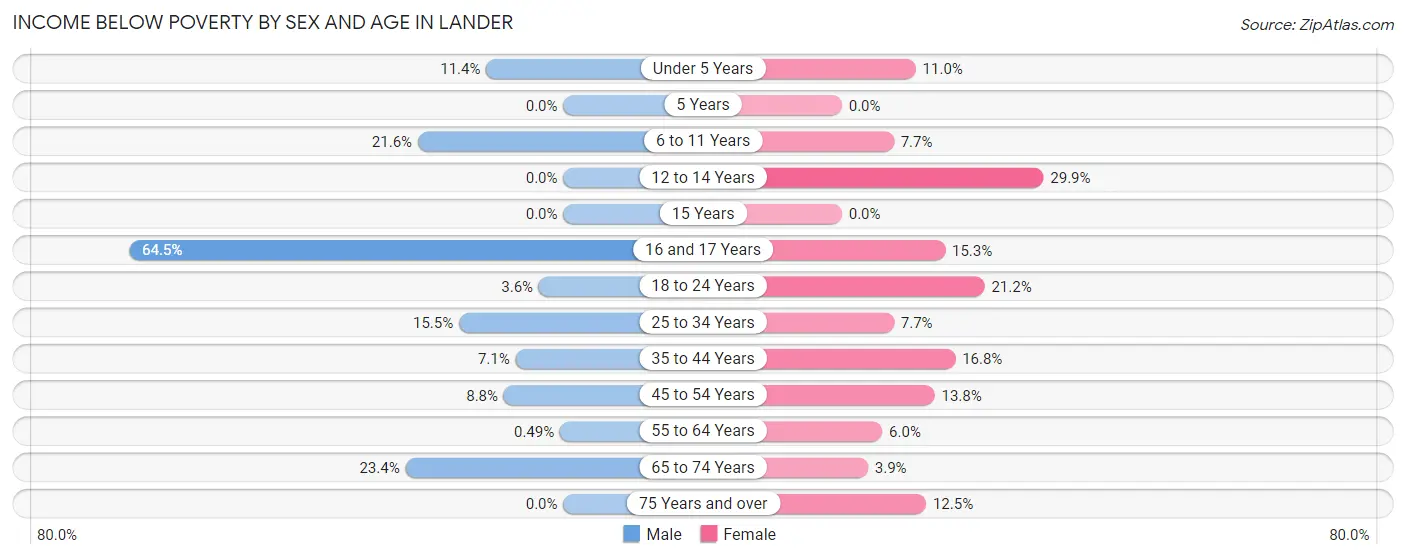
| Age Bracket | Male | Female |
| Under 5 Years | 23 (11.4%) | 26 (11.0%) |
| 5 Years | 0 (0.0%) | 0 (0.0%) |
| 6 to 11 Years | 73 (21.6%) | 34 (7.7%) |
| 12 to 14 Years | 0 (0.0%) | 41 (29.9%) |
| 15 Years | 0 (0.0%) | 0 (0.0%) |
| 16 and 17 Years | 69 (64.5%) | 23 (15.3%) |
| 18 to 24 Years | 9 (3.6%) | 32 (21.2%) |
| 25 to 34 Years | 66 (15.5%) | 31 (7.7%) |
| 35 to 44 Years | 40 (7.1%) | 95 (16.8%) |
| 45 to 54 Years | 40 (8.8%) | 42 (13.8%) |
| 55 to 64 Years | 2 (0.5%) | 27 (6.0%) |
| 65 to 74 Years | 75 (23.4%) | 17 (3.9%) |
| 75 Years and over | 0 (0.0%) | 36 (12.5%) |
| Total | 397 (11.2%) | 404 (10.9%) |
Income Above Poverty by Sex and Age in Lander
According to the poverty statistics in Lander, males aged 5 years and females aged 5 years are the age groups that are most secure financially, with 100.0% of males and 100.0% of females in these age groups living above the poverty line.
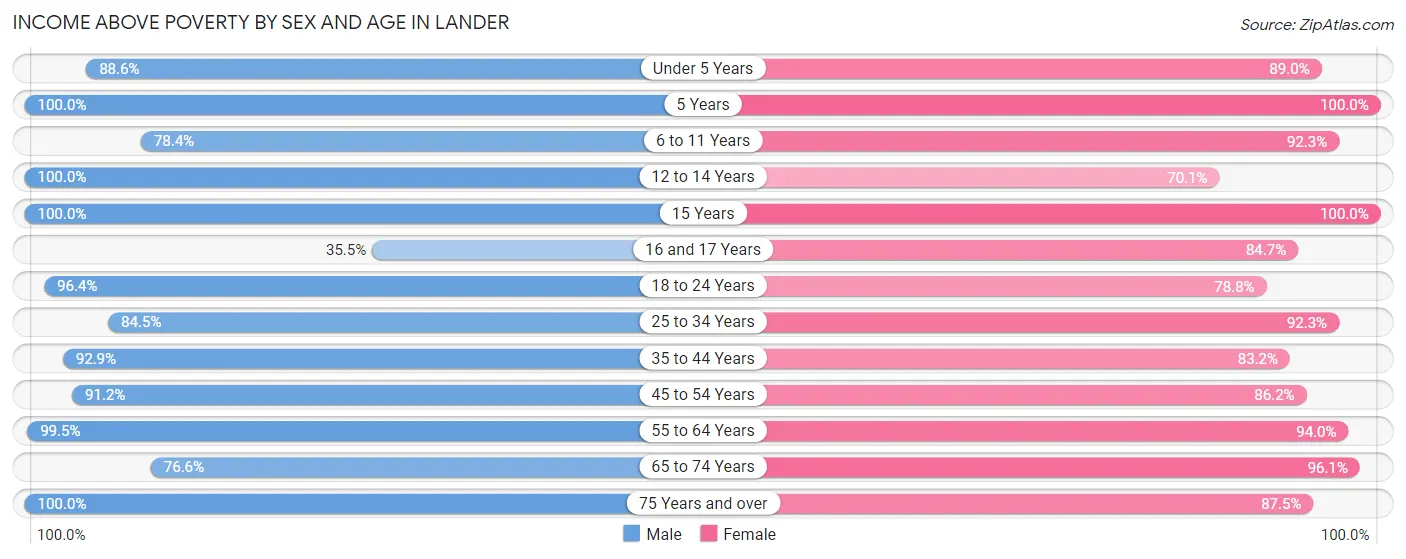
| Age Bracket | Male | Female |
| Under 5 Years | 178 (88.6%) | 211 (89.0%) |
| 5 Years | 18 (100.0%) | 38 (100.0%) |
| 6 to 11 Years | 265 (78.4%) | 407 (92.3%) |
| 12 to 14 Years | 176 (100.0%) | 96 (70.1%) |
| 15 Years | 34 (100.0%) | 90 (100.0%) |
| 16 and 17 Years | 38 (35.5%) | 127 (84.7%) |
| 18 to 24 Years | 239 (96.4%) | 119 (78.8%) |
| 25 to 34 Years | 360 (84.5%) | 370 (92.3%) |
| 35 to 44 Years | 523 (92.9%) | 469 (83.2%) |
| 45 to 54 Years | 413 (91.2%) | 263 (86.2%) |
| 55 to 64 Years | 405 (99.5%) | 424 (94.0%) |
| 65 to 74 Years | 245 (76.6%) | 422 (96.1%) |
| 75 Years and over | 257 (100.0%) | 252 (87.5%) |
| Total | 3,151 (88.8%) | 3,288 (89.1%) |
Income Below Poverty Among Married-Couple Families in Lander
The poverty statistics for married-couple families in Lander show that 1.4% or 18 of the total 1,313 families live below the poverty line. Families with 1 or 2 children have the highest poverty rate of 4.8%, comprising of 18 families. On the other hand, families with no children have the lowest poverty rate of 0.0%, which includes 0 families.
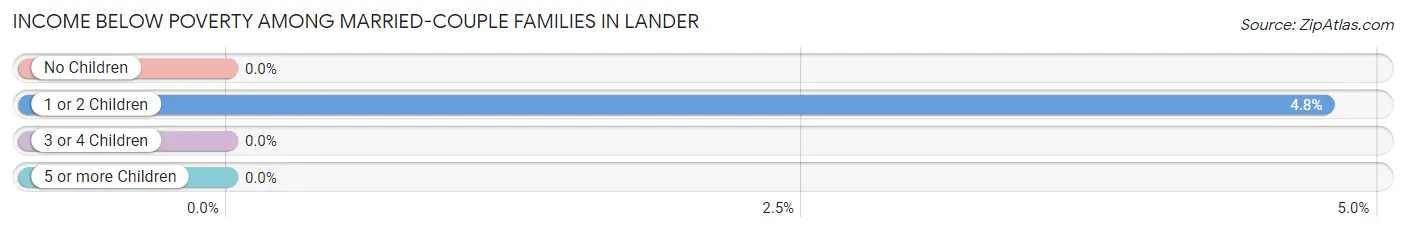
| Children | Above Poverty | Below Poverty |
| No Children | 697 (100.0%) | 0 (0.0%) |
| 1 or 2 Children | 359 (95.2%) | 18 (4.8%) |
| 3 or 4 Children | 214 (100.0%) | 0 (0.0%) |
| 5 or more Children | 25 (100.0%) | 0 (0.0%) |
| Total | 1,295 (98.6%) | 18 (1.4%) |
Income Below Poverty Among Single-Parent Households in Lander
According to the poverty data in Lander, 46.5% or 46 single-father households and 27.9% or 77 single-mother households are living below the poverty line. Among single-father households, those with 1 or 2 children have the highest poverty rate, with 46 households (73.0%) experiencing poverty. Likewise, among single-mother households, those with 3 or 4 children have the highest poverty rate, with 27 households (100.0%) falling below the poverty line.
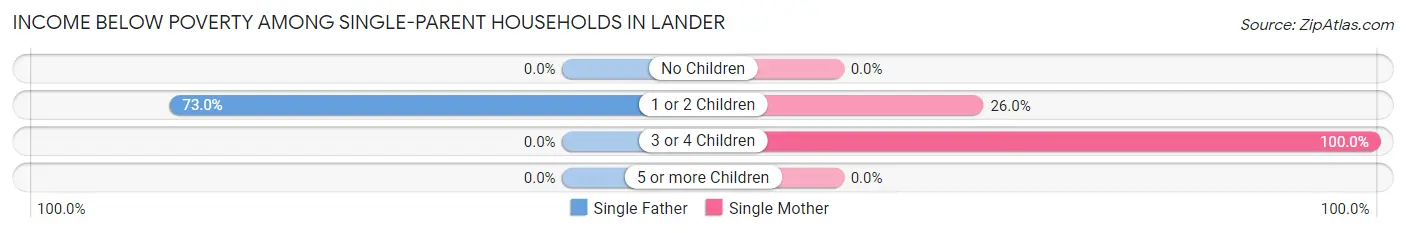
| Children | Single Father | Single Mother |
| No Children | 0 (0.0%) | 0 (0.0%) |
| 1 or 2 Children | 46 (73.0%) | 50 (26.0%) |
| 3 or 4 Children | 0 (0.0%) | 27 (100.0%) |
| 5 or more Children | 0 (0.0%) | 0 (0.0%) |
| Total | 46 (46.5%) | 77 (27.9%) |
Income Below Poverty Among Married-Couple vs Single-Parent Households in Lander
The poverty data for Lander shows that 18 of the married-couple family households (1.4%) and 123 of the single-parent households (32.8%) are living below the poverty level. Within the married-couple family households, those with 1 or 2 children have the highest poverty rate, with 18 households (4.8%) falling below the poverty line. Among the single-parent households, those with 3 or 4 children have the highest poverty rate, with 27 household (100.0%) living below poverty.
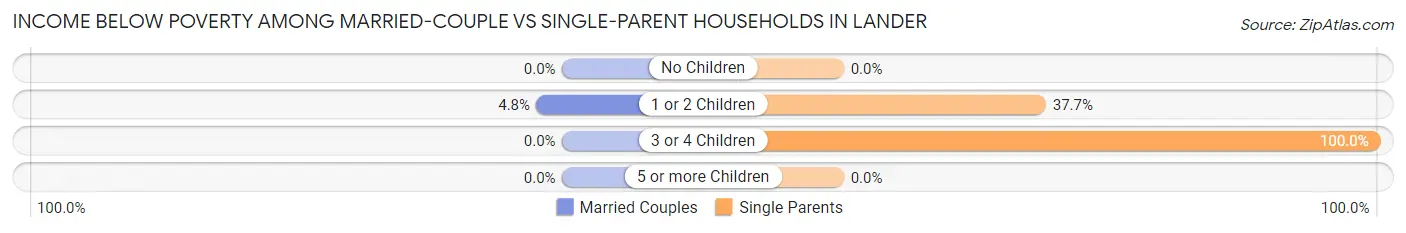
| Children | Married-Couple Families | Single-Parent Households |
| No Children | 0 (0.0%) | 0 (0.0%) |
| 1 or 2 Children | 18 (4.8%) | 96 (37.7%) |
| 3 or 4 Children | 0 (0.0%) | 27 (100.0%) |
| 5 or more Children | 0 (0.0%) | 0 (0.0%) |
| Total | 18 (1.4%) | 123 (32.8%) |
Race in Lander
The most populous races in Lander are White / Caucasian (6,391 | 84.5%), Native / Alaskan (572 | 7.6%), and Hispanic or Latino (503 | 6.7%).
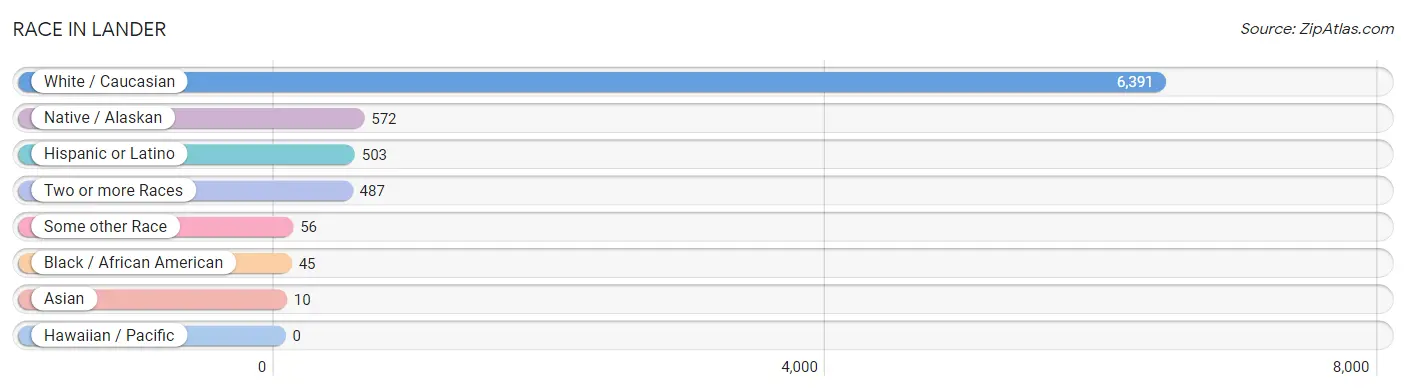
| Race | # Population | % Population |
| Asian | 10 | 0.1% |
| Black / African American | 45 | 0.6% |
| Hawaiian / Pacific | 0 | 0.0% |
| Hispanic or Latino | 503 | 6.7% |
| Native / Alaskan | 572 | 7.6% |
| White / Caucasian | 6,391 | 84.5% |
| Two or more Races | 487 | 6.4% |
| Some other Race | 56 | 0.7% |
| Total | 7,561 | 100.0% |
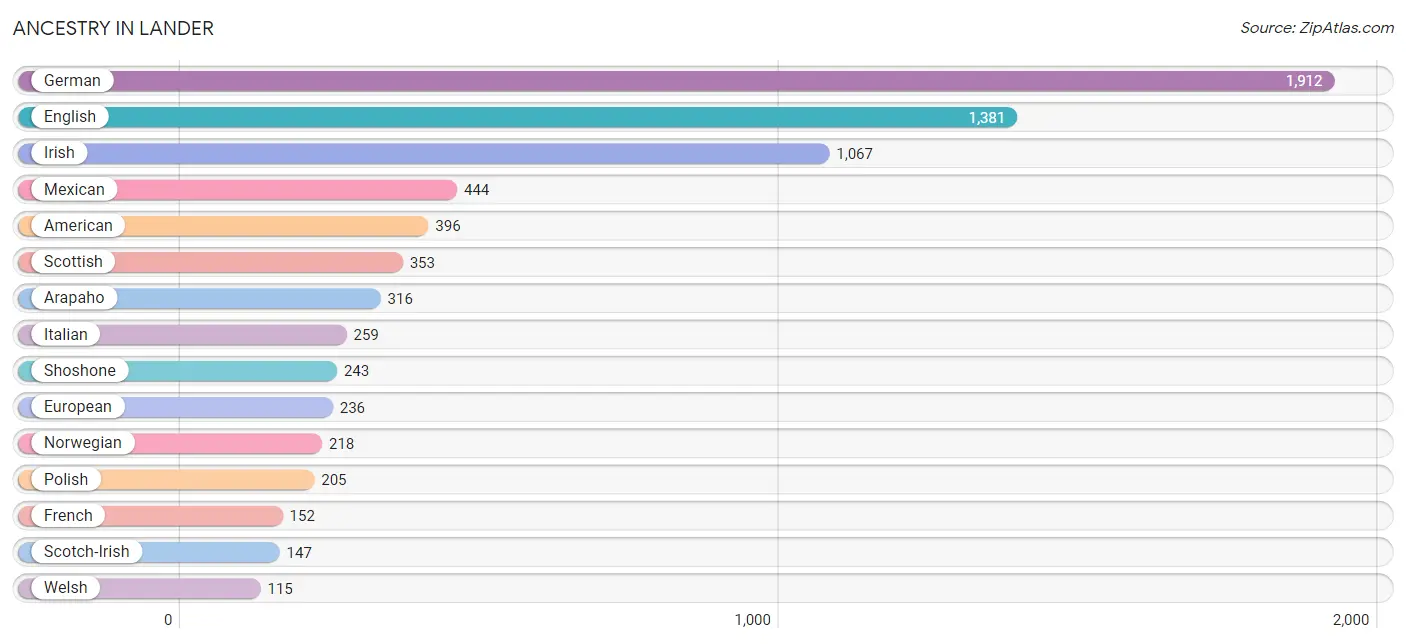
Ancestry in Lander
The most populous ancestries reported in Lander are German (1,912 | 25.3%), English (1,381 | 18.3%), Irish (1,067 | 14.1%), Mexican (444 | 5.9%), and American (396 | 5.2%), together accounting for 68.8% of all Lander residents.
| Ancestry | # Population | % Population |
| American | 396 | 5.2% |
| Arab | 35 | 0.5% |
| Arapaho | 316 | 4.2% |
| Austrian | 27 | 0.4% |
| Belgian | 54 | 0.7% |
| Bhutanese | 3 | 0.0% |
| Blackfeet | 14 | 0.2% |
| British | 5 | 0.1% |
| Burmese | 3 | 0.0% |
| Canadian | 23 | 0.3% |
| Cherokee | 5 | 0.1% |
| Choctaw | 11 | 0.2% |
| Croatian | 13 | 0.2% |
| Crow | 13 | 0.2% |
| Czech | 16 | 0.2% |
| Danish | 112 | 1.5% |
| Dominican | 1 | 0.0% |
| Dutch | 65 | 0.9% |
| Ecuadorian | 10 | 0.1% |
| English | 1,381 | 18.3% |
| Ethiopian | 22 | 0.3% |
| European | 236 | 3.1% |
| Filipino | 20 | 0.3% |
| Finnish | 40 | 0.5% |
| French | 152 | 2.0% |
| French Canadian | 36 | 0.5% |
| German | 1,912 | 25.3% |
| Greek | 17 | 0.2% |
| Hungarian | 47 | 0.6% |
| Indian (Asian) | 18 | 0.2% |
| Irish | 1,067 | 14.1% |
| Italian | 259 | 3.4% |
| Korean | 18 | 0.2% |
| Lebanese | 8 | 0.1% |
| Mexican | 444 | 5.9% |
| Moroccan | 27 | 0.4% |
| Native Hawaiian | 1 | 0.0% |
| Northern European | 32 | 0.4% |
| Norwegian | 218 | 2.9% |
| Pennsylvania German | 8 | 0.1% |
| Polish | 205 | 2.7% |
| Portuguese | 22 | 0.3% |
| Puerto Rican | 31 | 0.4% |
| Russian | 17 | 0.2% |
| Samoan | 14 | 0.2% |
| Scandinavian | 63 | 0.8% |
| Scotch-Irish | 147 | 1.9% |
| Scottish | 353 | 4.7% |
| Shoshone | 243 | 3.2% |
| Sioux | 88 | 1.2% |
| Slovak | 8 | 0.1% |
| Slovene | 10 | 0.1% |
| South American | 10 | 0.1% |
| Spaniard | 9 | 0.1% |
| Spanish | 8 | 0.1% |
| Subsaharan African | 22 | 0.3% |
| Swedish | 86 | 1.1% |
| Swiss | 68 | 0.9% |
| Turkish | 8 | 0.1% |
| Ukrainian | 16 | 0.2% |
| Welsh | 115 | 1.5% |
| Yugoslavian | 10 | 0.1% | View All 62 Rows |
Immigrants in Lander
The most numerous immigrant groups reported in Lander came from Europe (43 | 0.6%), Northern Europe (27 | 0.4%), Central America (26 | 0.3%), Latin America (26 | 0.3%), and Mexico (26 | 0.3%), together accounting for 1.9% of all Lander residents.
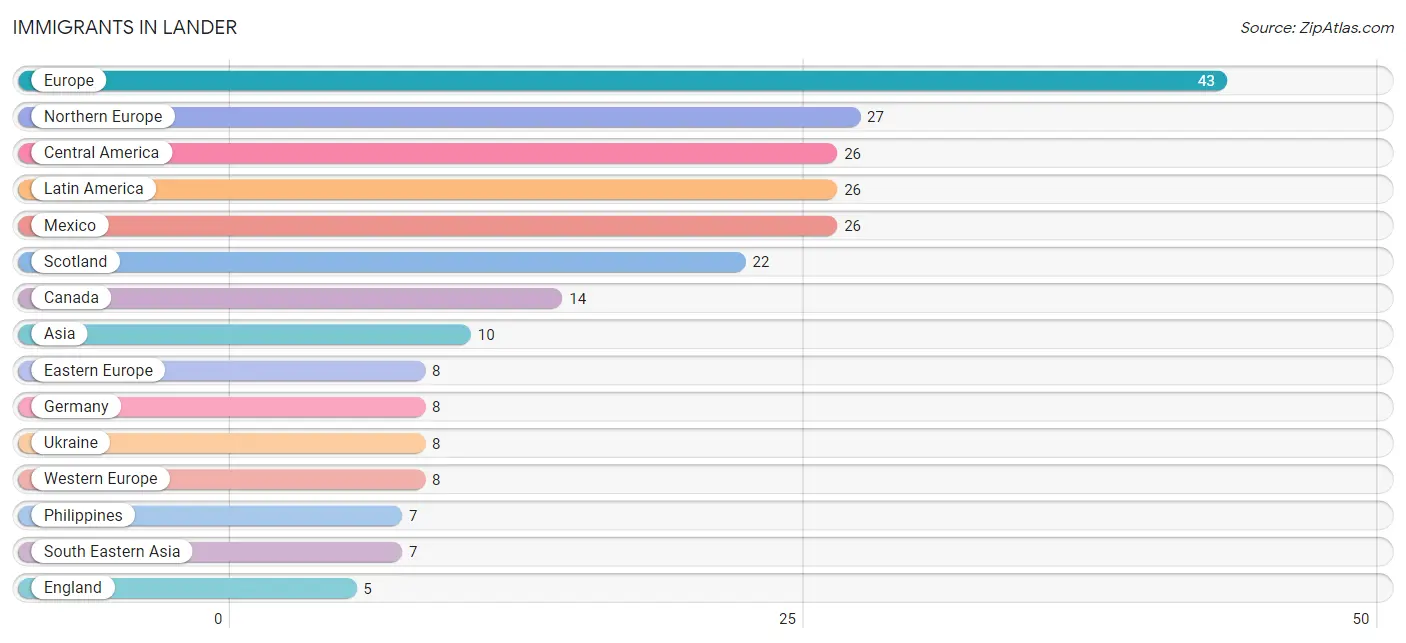
| Immigration Origin | # Population | % Population |
| Asia | 10 | 0.1% |
| Canada | 14 | 0.2% |
| Central America | 26 | 0.3% |
| Eastern Asia | 3 | 0.0% |
| Eastern Europe | 8 | 0.1% |
| England | 5 | 0.1% |
| Europe | 43 | 0.6% |
| Germany | 8 | 0.1% |
| Korea | 3 | 0.0% |
| Latin America | 26 | 0.3% |
| Mexico | 26 | 0.3% |
| Northern Europe | 27 | 0.4% |
| Philippines | 7 | 0.1% |
| Scotland | 22 | 0.3% |
| South Eastern Asia | 7 | 0.1% |
| Ukraine | 8 | 0.1% |
| Western Europe | 8 | 0.1% | View All 17 Rows |
Sex and Age in Lander
Sex and Age in Lander
The most populous age groups in Lander are 35 to 39 Years (364 | 9.9%) for men and 5 to 9 Years (371 | 9.5%) for women.
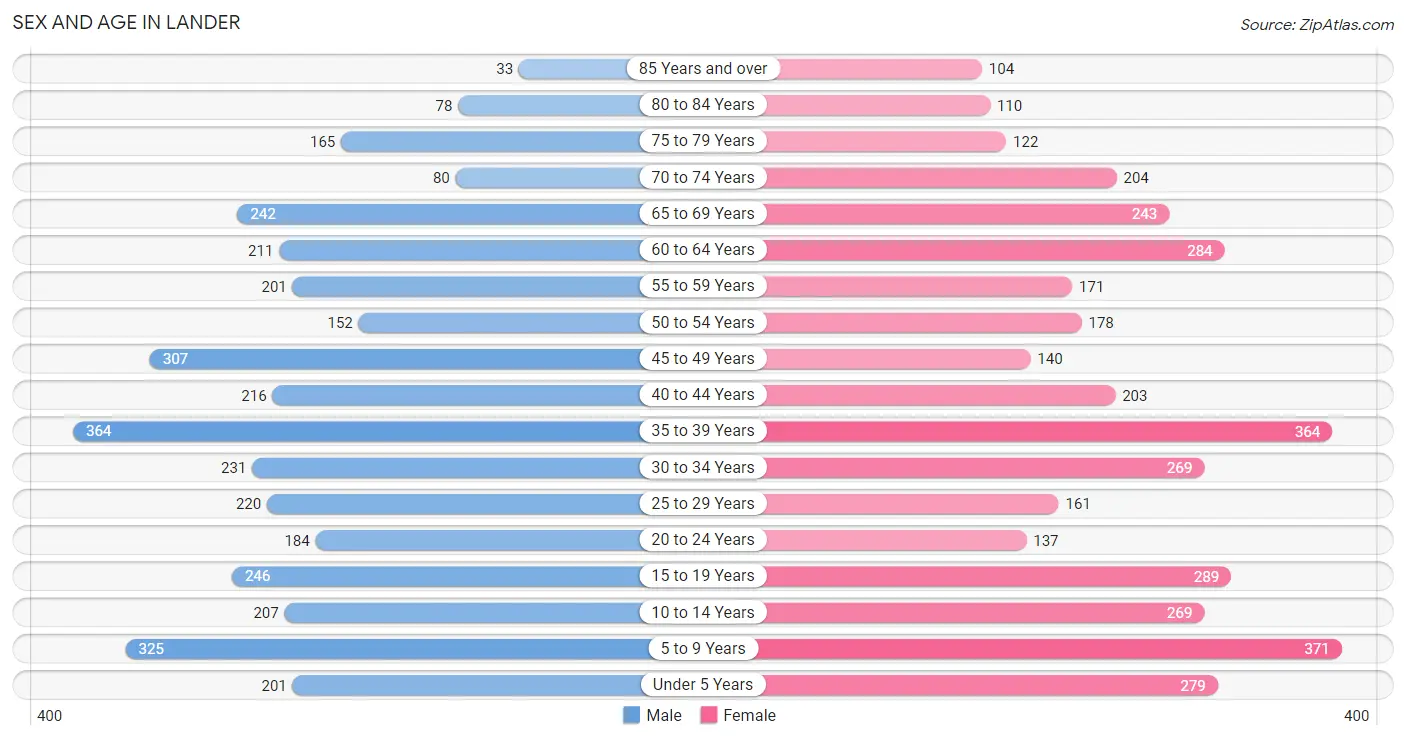
| Age Bracket | Male | Female |
| Under 5 Years | 201 (5.5%) | 279 (7.2%) |
| 5 to 9 Years | 325 (8.9%) | 371 (9.5%) |
| 10 to 14 Years | 207 (5.7%) | 269 (6.9%) |
| 15 to 19 Years | 246 (6.7%) | 289 (7.4%) |
| 20 to 24 Years | 184 (5.0%) | 137 (3.5%) |
| 25 to 29 Years | 220 (6.0%) | 161 (4.1%) |
| 30 to 34 Years | 231 (6.3%) | 269 (6.9%) |
| 35 to 39 Years | 364 (9.9%) | 364 (9.3%) |
| 40 to 44 Years | 216 (5.9%) | 203 (5.2%) |
| 45 to 49 Years | 307 (8.4%) | 140 (3.6%) |
| 50 to 54 Years | 152 (4.2%) | 178 (4.6%) |
| 55 to 59 Years | 201 (5.5%) | 171 (4.4%) |
| 60 to 64 Years | 211 (5.8%) | 284 (7.3%) |
| 65 to 69 Years | 242 (6.6%) | 243 (6.2%) |
| 70 to 74 Years | 80 (2.2%) | 204 (5.2%) |
| 75 to 79 Years | 165 (4.5%) | 122 (3.1%) |
| 80 to 84 Years | 78 (2.1%) | 110 (2.8%) |
| 85 Years and over | 33 (0.9%) | 104 (2.7%) |
| Total | 3,663 (100.0%) | 3,898 (100.0%) |
Families and Households in Lander
Median Family Size in Lander
The median family size in Lander is 3.26 persons per family, with married-couple families (1,313 | 77.8%) accounting for the largest median family size of 3.34 persons per family. On the other hand, single male/father families (99 | 5.9%) represent the smallest median family size with 2.69 persons per family.
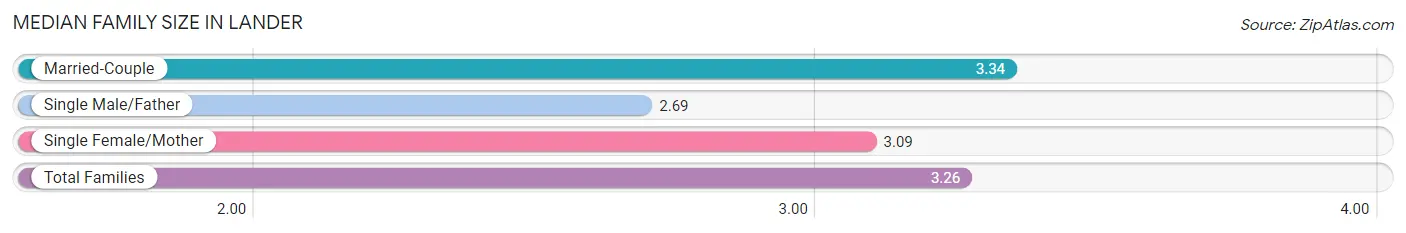
| Family Type | # Families | Family Size |
| Married-Couple | 1,313 (77.8%) | 3.34 |
| Single Male/Father | 99 (5.9%) | 2.69 |
| Single Female/Mother | 276 (16.4%) | 3.09 |
| Total Families | 1,688 (100.0%) | 3.26 |
Median Household Size in Lander
The median household size in Lander is 2.46 persons per household, with married-couple households (1,313 | 44.2%) accounting for the largest median household size of 3.37 persons per household. non-family households (1,281 | 43.1%) represent the smallest median household size with 1.33 persons per household.
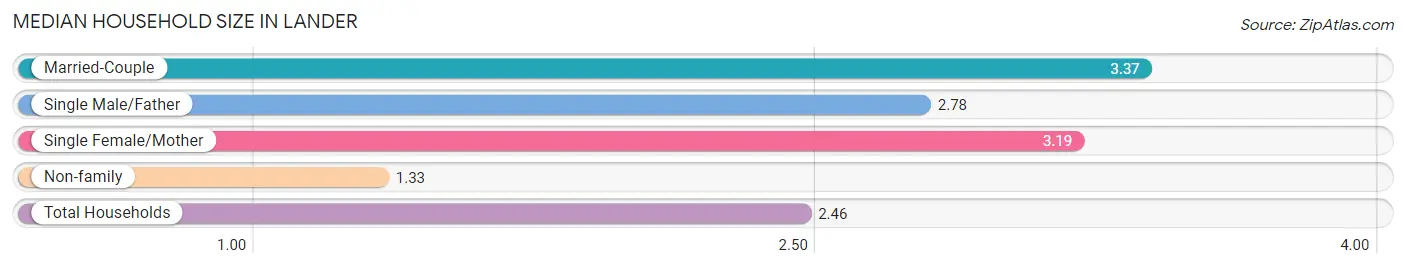
| Household Type | # Households | Household Size |
| Married-Couple | 1,313 (44.2%) | 3.37 |
| Single Male/Father | 99 (3.3%) | 2.78 |
| Single Female/Mother | 276 (9.3%) | 3.19 |
| Non-family | 1,281 (43.1%) | 1.33 |
| Total Households | 2,969 (100.0%) | 2.46 |
Household Size by Marriage Status in Lander
Out of a total of 2,969 households in Lander, 1,688 (56.9%) are family households, while 1,281 (43.1%) are nonfamily households. The most numerous type of family households are 2-person households, comprising 810, and the most common type of nonfamily households are 1-person households, comprising 1,022.
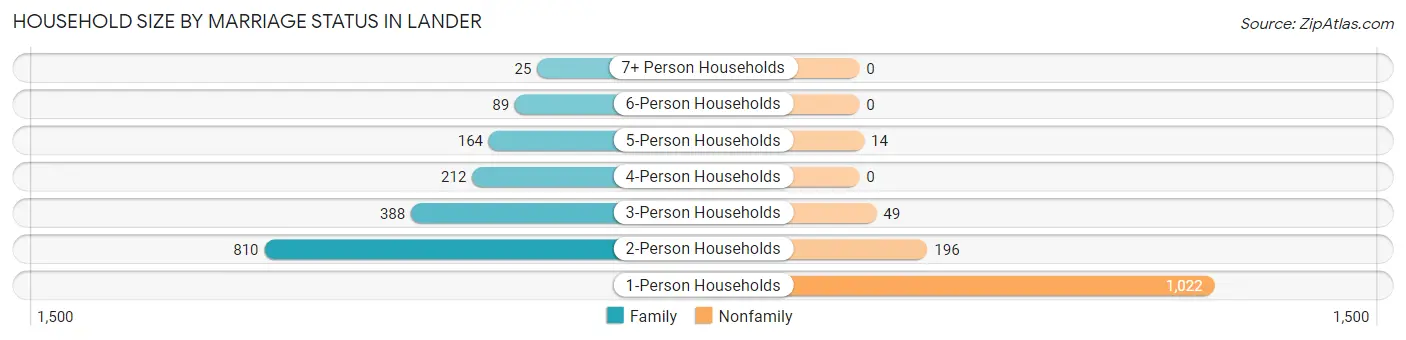
| Household Size | Family Households | Nonfamily Households |
| 1-Person Households | - | 1,022 (34.4%) |
| 2-Person Households | 810 (27.3%) | 196 (6.6%) |
| 3-Person Households | 388 (13.1%) | 49 (1.7%) |
| 4-Person Households | 212 (7.1%) | 0 (0.0%) |
| 5-Person Households | 164 (5.5%) | 14 (0.5%) |
| 6-Person Households | 89 (3.0%) | 0 (0.0%) |
| 7+ Person Households | 25 (0.8%) | 0 (0.0%) |
| Total | 1,688 (56.9%) | 1,281 (43.1%) |
Female Fertility in Lander
Fertility by Age in Lander
Average fertility rate in Lander is 69.0 births per 1,000 women. Women in the age bracket of 20 to 34 years have the highest fertility rate with 169.0 births per 1,000 women. Women in the age bracket of 20 to 34 years acount for 88.1% of all women with births.
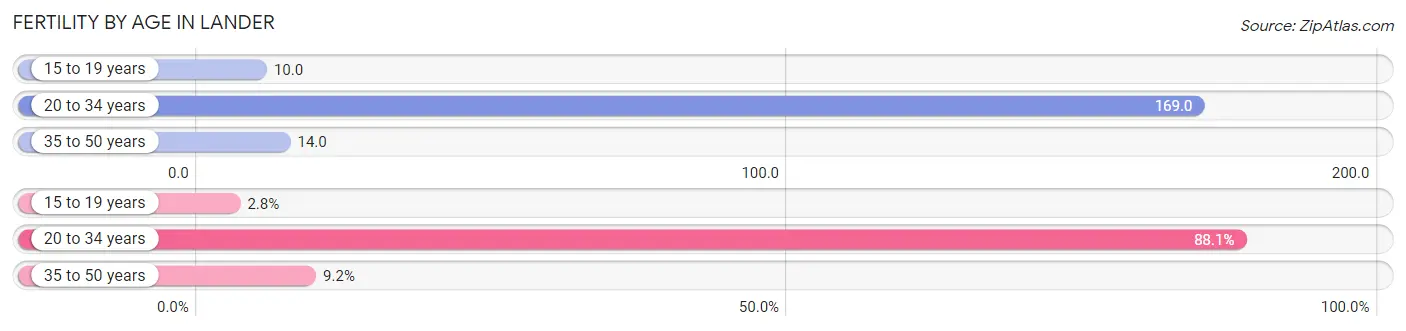
| Age Bracket | Women with Births | Births / 1,000 Women |
| 15 to 19 years | 3 (2.8%) | 10.0 |
| 20 to 34 years | 96 (88.1%) | 169.0 |
| 35 to 50 years | 10 (9.2%) | 14.0 |
| Total | 109 (100.0%) | 69.0 |
Fertility by Age by Marriage Status in Lander
91.7% of women with births (109) in Lander are married. The highest percentage of unmarried women with births falls into 15 to 19 years age bracket with 100.0% of them unmarried at the time of birth, while the lowest percentage of unmarried women with births belong to 35 to 50 years age bracket with 0.0% of them unmarried.
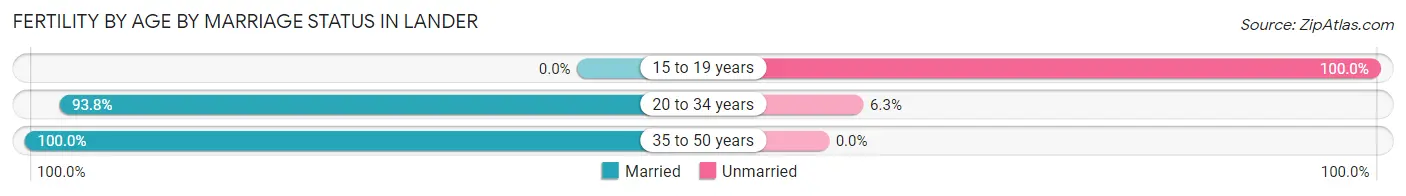
| Age Bracket | Married | Unmarried |
| 15 to 19 years | 0 (0.0%) | 3 (100.0%) |
| 20 to 34 years | 90 (93.8%) | 6 (6.2%) |
| 35 to 50 years | 10 (100.0%) | 0 (0.0%) |
| Total | 100 (91.7%) | 9 (8.3%) |
Fertility by Education in Lander
Average fertility rate in Lander is 69.0 births per 1,000 women. Women with the education attainment of high school diploma have the highest fertility rate of 118.0 births per 1,000 women, while women with the education attainment of college or associate's degree have the lowest fertility at 17.0 births per 1,000 women. Women with the education attainment of bachelor's degree represent 36.7% of all women with births.
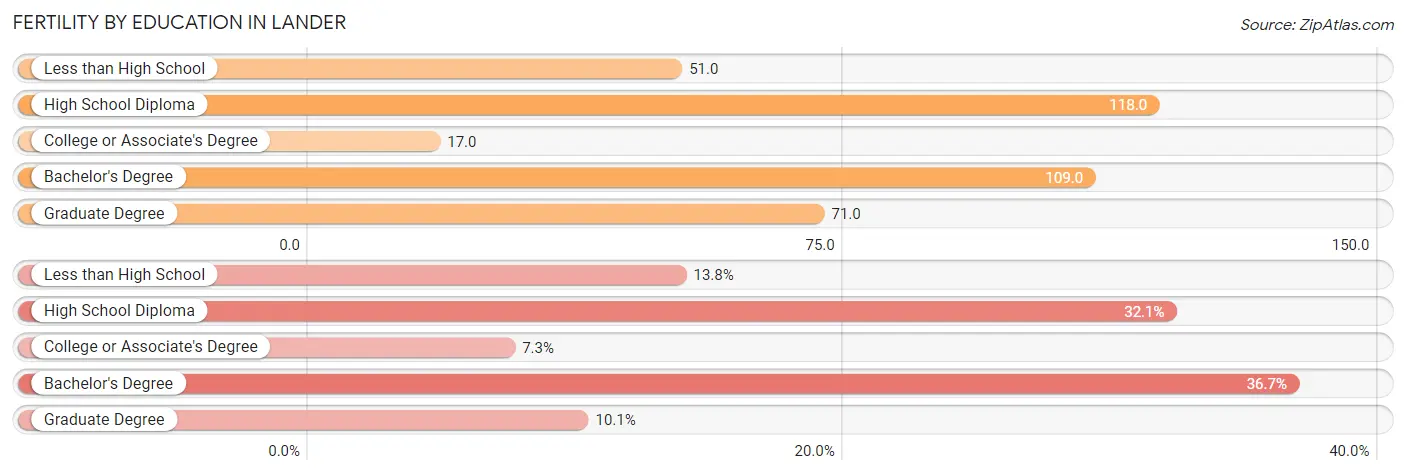
| Educational Attainment | Women with Births | Births / 1,000 Women |
| Less than High School | 15 (13.8%) | 51.0 |
| High School Diploma | 35 (32.1%) | 118.0 |
| College or Associate's Degree | 8 (7.3%) | 17.0 |
| Bachelor's Degree | 40 (36.7%) | 109.0 |
| Graduate Degree | 11 (10.1%) | 71.0 |
| Total | 109 (100.0%) | 69.0 |
Fertility by Education by Marriage Status in Lander
8.3% of women with births in Lander are unmarried. Women with the educational attainment of bachelor's degree are most likely to be married with 100.0% of them married at childbirth, while women with the educational attainment of college or associate's degree are least likely to be married with 37.5% of them unmarried at childbirth.
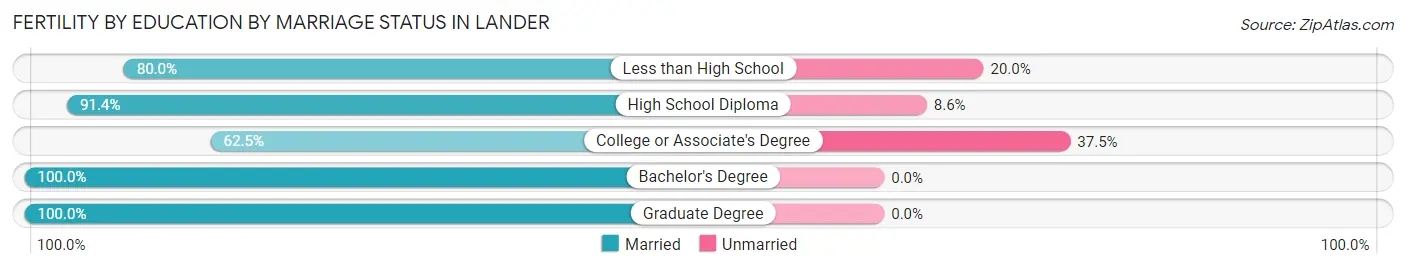
| Educational Attainment | Married | Unmarried |
| Less than High School | 12 (80.0%) | 3 (20.0%) |
| High School Diploma | 32 (91.4%) | 3 (8.6%) |
| College or Associate's Degree | 5 (62.5%) | 3 (37.5%) |
| Bachelor's Degree | 40 (100.0%) | 0 (0.0%) |
| Graduate Degree | 11 (100.0%) | 0 (0.0%) |
| Total | 100 (91.7%) | 9 (8.3%) |
Employment Characteristics in Lander
Employment by Class of Employer in Lander
Among the 3,256 employed individuals in Lander, private company employees (1,413 | 43.4%), local government employees (586 | 18.0%), and state government employees (346 | 10.6%) make up the most common classes of employment.
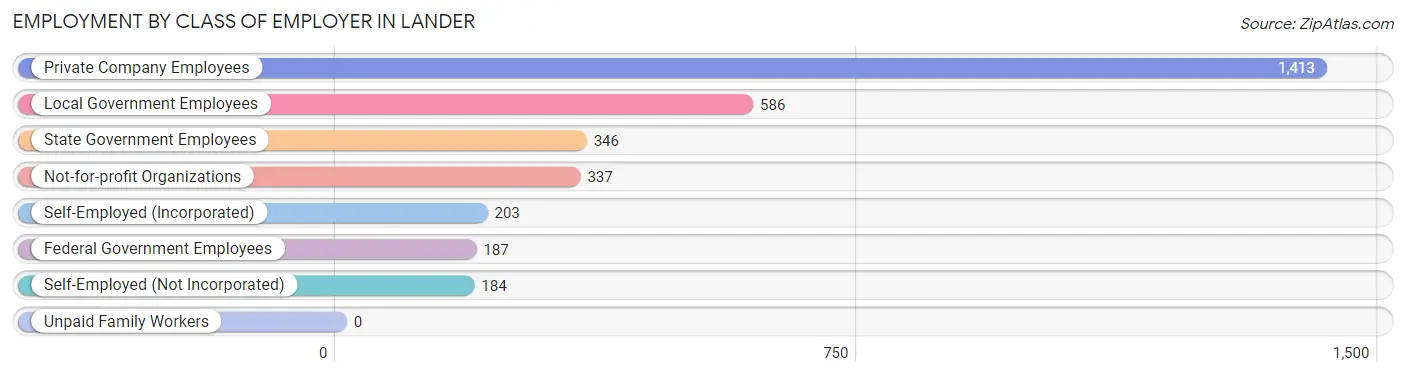
| Employer Class | # Employees | % Employees |
| Private Company Employees | 1,413 | 43.4% |
| Self-Employed (Incorporated) | 203 | 6.2% |
| Self-Employed (Not Incorporated) | 184 | 5.7% |
| Not-for-profit Organizations | 337 | 10.3% |
| Local Government Employees | 586 | 18.0% |
| State Government Employees | 346 | 10.6% |
| Federal Government Employees | 187 | 5.7% |
| Unpaid Family Workers | 0 | 0.0% |
| Total | 3,256 | 100.0% |
Employment Status by Age in Lander
According to the labor force statistics for Lander, out of the total population over 16 years of age (5,785), 62.7% or 3,627 individuals are in the labor force, with 4.3% or 156 of them unemployed. The age group with the highest labor force participation rate is 45 to 54 years, with 86.2% or 670 individuals in the labor force. Within the labor force, the 30 to 34 years age range has the highest percentage of unemployed individuals, with 11.1% or 46 of them being unemployed.
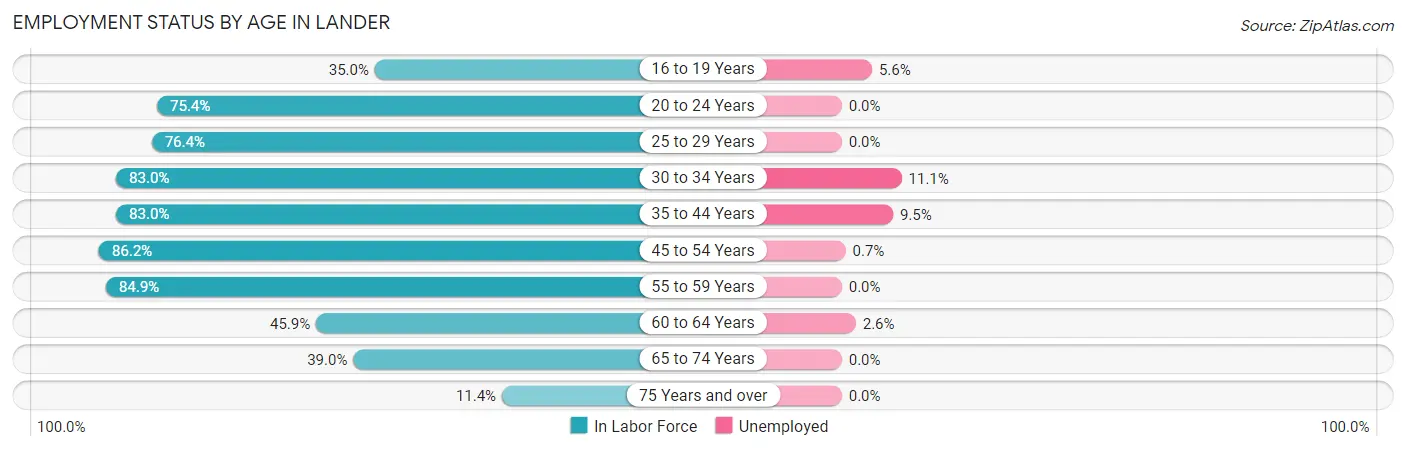
| Age Bracket | In Labor Force | Unemployed |
| 16 to 19 Years | 144 (35.0%) | 8 (5.6%) |
| 20 to 24 Years | 242 (75.4%) | 0 (0.0%) |
| 25 to 29 Years | 291 (76.4%) | 0 (0.0%) |
| 30 to 34 Years | 415 (83.0%) | 46 (11.1%) |
| 35 to 44 Years | 952 (83.0%) | 90 (9.5%) |
| 45 to 54 Years | 670 (86.2%) | 5 (0.7%) |
| 55 to 59 Years | 316 (84.9%) | 0 (0.0%) |
| 60 to 64 Years | 227 (45.9%) | 6 (2.6%) |
| 65 to 74 Years | 300 (39.0%) | 0 (0.0%) |
| 75 Years and over | 70 (11.4%) | 0 (0.0%) |
| Total | 3,627 (62.7%) | 156 (4.3%) |
Employment Status by Educational Attainment in Lander
According to labor force statistics for Lander, 78.2% of individuals (2,872) out of the total population between 25 and 64 years of age (3,672) are in the labor force, with 5.1% or 146 of them being unemployed. The group with the highest labor force participation rate are those with the educational attainment of bachelor's degree or higher, with 90.0% or 1,505 individuals in the labor force. Within the labor force, individuals with high school diploma education have the highest percentage of unemployment, with 16.8% or 99 of them being unemployed.
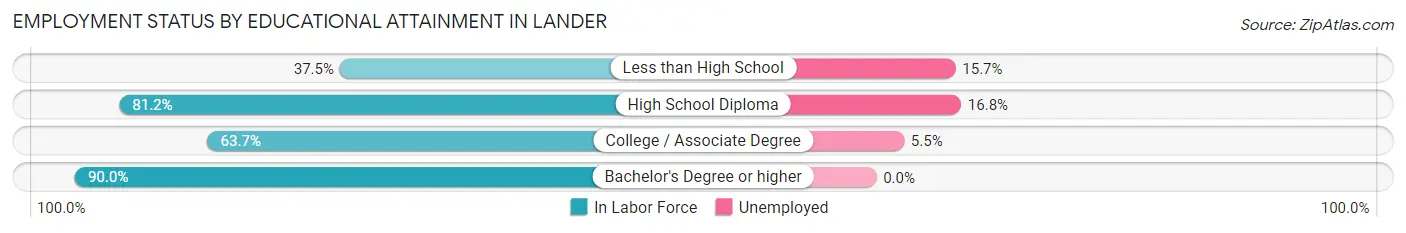
| Educational Attainment | In Labor Force | Unemployed |
| Less than High School | 51 (37.5%) | 21 (15.7%) |
| High School Diploma | 591 (81.2%) | 122 (16.8%) |
| College / Associate Degree | 724 (63.7%) | 62 (5.5%) |
| Bachelor's Degree or higher | 1,505 (90.0%) | 0 (0.0%) |
| Total | 2,872 (78.2%) | 187 (5.1%) |
Employment Occupations by Sex in Lander
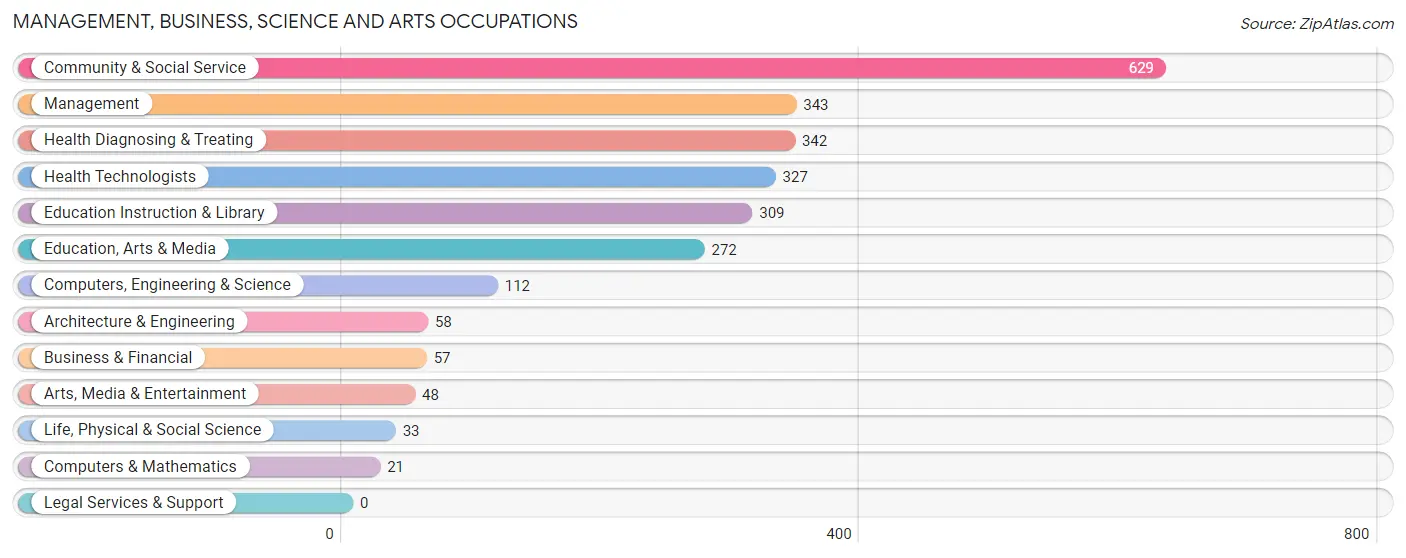
Management, Business, Science and Arts Occupations
The most common Management, Business, Science and Arts occupations in Lander are Community & Social Service (629 | 18.1%), Management (343 | 9.9%), Health Diagnosing & Treating (342 | 9.9%), Health Technologists (327 | 9.4%), and Education Instruction & Library (309 | 8.9%).
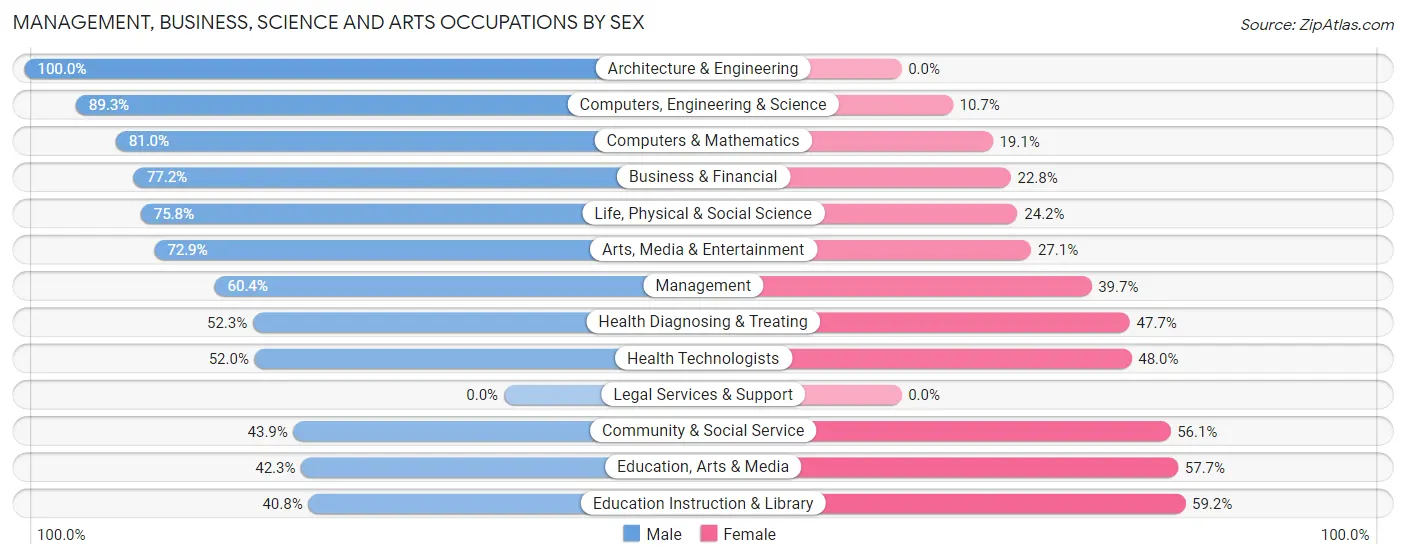
Management, Business, Science and Arts Occupations by Sex
Within the Management, Business, Science and Arts occupations in Lander, the most male-oriented occupations are Architecture & Engineering (100.0%), Computers, Engineering & Science (89.3%), and Computers & Mathematics (80.9%), while the most female-oriented occupations are Education Instruction & Library (59.2%), Education, Arts & Media (57.7%), and Community & Social Service (56.1%).
| Occupation | Male | Female |
| Management | 207 (60.4%) | 136 (39.7%) |
| Business & Financial | 44 (77.2%) | 13 (22.8%) |
| Computers, Engineering & Science | 100 (89.3%) | 12 (10.7%) |
| Computers & Mathematics | 17 (80.9%) | 4 (19.1%) |
| Architecture & Engineering | 58 (100.0%) | 0 (0.0%) |
| Life, Physical & Social Science | 25 (75.8%) | 8 (24.2%) |
| Community & Social Service | 276 (43.9%) | 353 (56.1%) |
| Education, Arts & Media | 115 (42.3%) | 157 (57.7%) |
| Legal Services & Support | 0 (0.0%) | 0 (0.0%) |
| Education Instruction & Library | 126 (40.8%) | 183 (59.2%) |
| Arts, Media & Entertainment | 35 (72.9%) | 13 (27.1%) |
| Health Diagnosing & Treating | 179 (52.3%) | 163 (47.7%) |
| Health Technologists | 170 (52.0%) | 157 (48.0%) |
| Total (Category) | 806 (54.3%) | 677 (45.7%) |
| Total (Overall) | 1,859 (53.5%) | 1,613 (46.5%) |
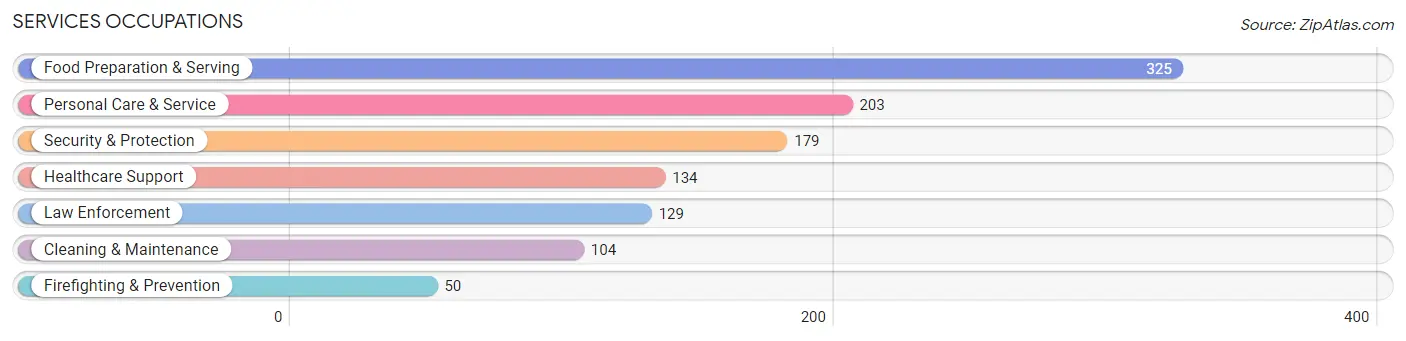
Services Occupations
The most common Services occupations in Lander are Food Preparation & Serving (325 | 9.4%), Personal Care & Service (203 | 5.9%), Security & Protection (179 | 5.2%), Healthcare Support (134 | 3.9%), and Law Enforcement (129 | 3.7%).
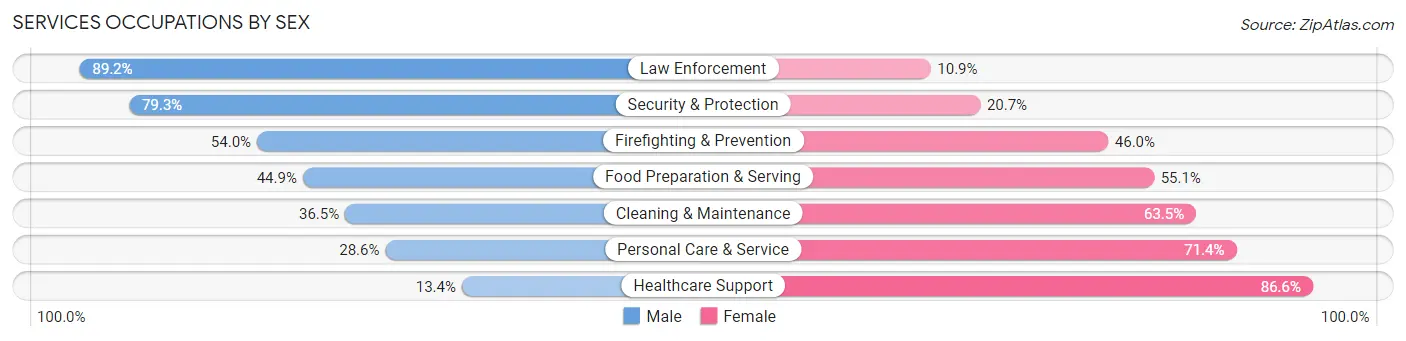
Services Occupations by Sex
Within the Services occupations in Lander, the most male-oriented occupations are Law Enforcement (89.1%), Security & Protection (79.3%), and Firefighting & Prevention (54.0%), while the most female-oriented occupations are Healthcare Support (86.6%), Personal Care & Service (71.4%), and Cleaning & Maintenance (63.5%).
| Occupation | Male | Female |
| Healthcare Support | 18 (13.4%) | 116 (86.6%) |
| Security & Protection | 142 (79.3%) | 37 (20.7%) |
| Firefighting & Prevention | 27 (54.0%) | 23 (46.0%) |
| Law Enforcement | 115 (89.1%) | 14 (10.8%) |
| Food Preparation & Serving | 146 (44.9%) | 179 (55.1%) |
| Cleaning & Maintenance | 38 (36.5%) | 66 (63.5%) |
| Personal Care & Service | 58 (28.6%) | 145 (71.4%) |
| Total (Category) | 402 (42.5%) | 543 (57.5%) |
| Total (Overall) | 1,859 (53.5%) | 1,613 (46.5%) |
Sales and Office Occupations
The most common Sales and Office occupations in Lander are Sales & Related (309 | 8.9%), and Office & Administration (171 | 4.9%).
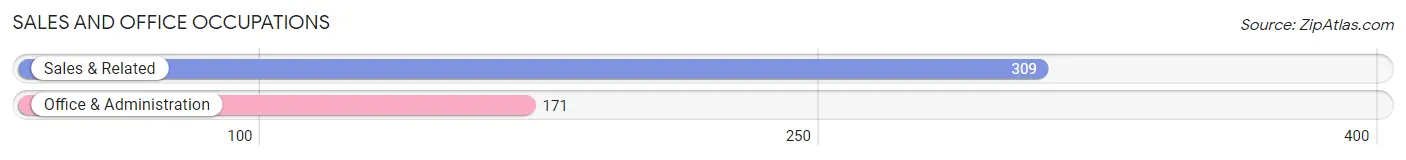
Sales and Office Occupations by Sex
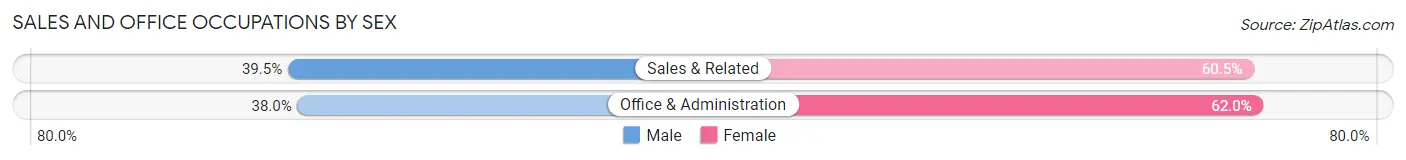
| Occupation | Male | Female |
| Sales & Related | 122 (39.5%) | 187 (60.5%) |
| Office & Administration | 65 (38.0%) | 106 (62.0%) |
| Total (Category) | 187 (39.0%) | 293 (61.0%) |
| Total (Overall) | 1,859 (53.5%) | 1,613 (46.5%) |
Natural Resources, Construction and Maintenance Occupations
The most common Natural Resources, Construction and Maintenance occupations in Lander are Construction & Extraction (207 | 6.0%), Installation, Maintenance & Repair (119 | 3.4%), and Farming, Fishing & Forestry (42 | 1.2%).
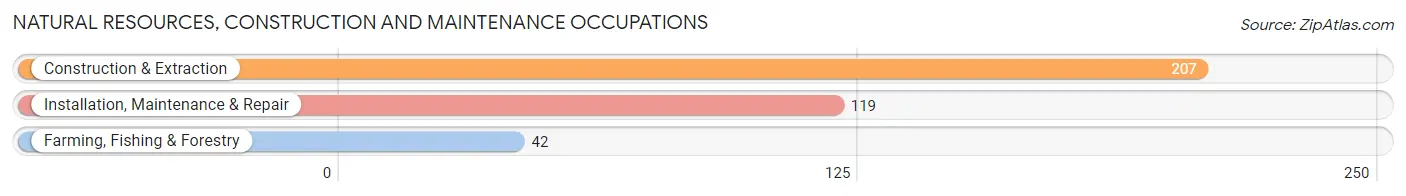
Natural Resources, Construction and Maintenance Occupations by Sex
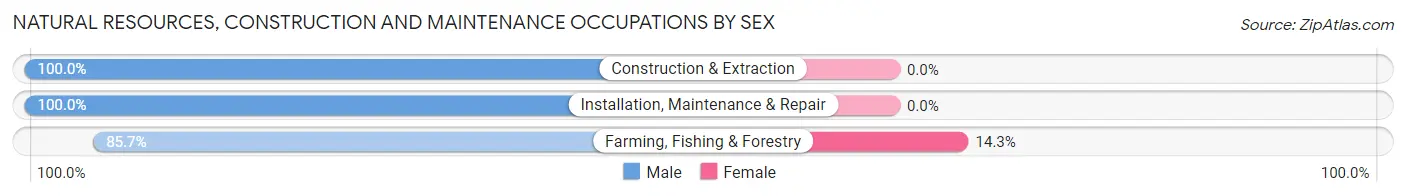
| Occupation | Male | Female |
| Farming, Fishing & Forestry | 36 (85.7%) | 6 (14.3%) |
| Construction & Extraction | 207 (100.0%) | 0 (0.0%) |
| Installation, Maintenance & Repair | 119 (100.0%) | 0 (0.0%) |
| Total (Category) | 362 (98.4%) | 6 (1.6%) |
| Total (Overall) | 1,859 (53.5%) | 1,613 (46.5%) |
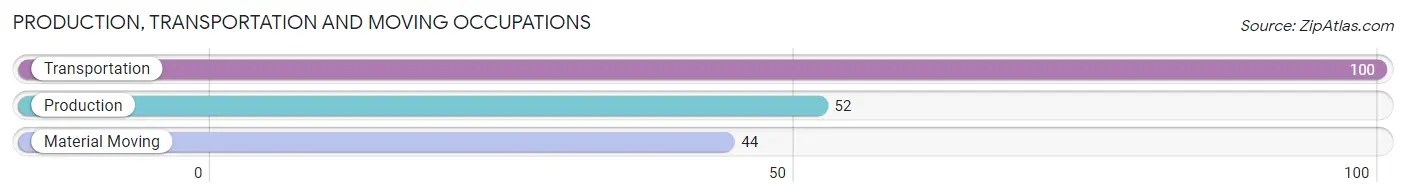
Production, Transportation and Moving Occupations
The most common Production, Transportation and Moving occupations in Lander are Transportation (100 | 2.9%), Production (52 | 1.5%), and Material Moving (44 | 1.3%).
Production, Transportation and Moving Occupations by Sex
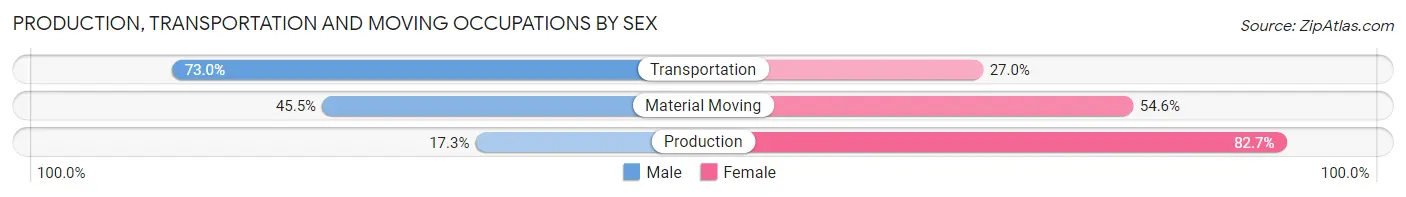
| Occupation | Male | Female |
| Production | 9 (17.3%) | 43 (82.7%) |
| Transportation | 73 (73.0%) | 27 (27.0%) |
| Material Moving | 20 (45.5%) | 24 (54.5%) |
| Total (Category) | 102 (52.0%) | 94 (48.0%) |
| Total (Overall) | 1,859 (53.5%) | 1,613 (46.5%) |
Employment Industries by Sex in Lander
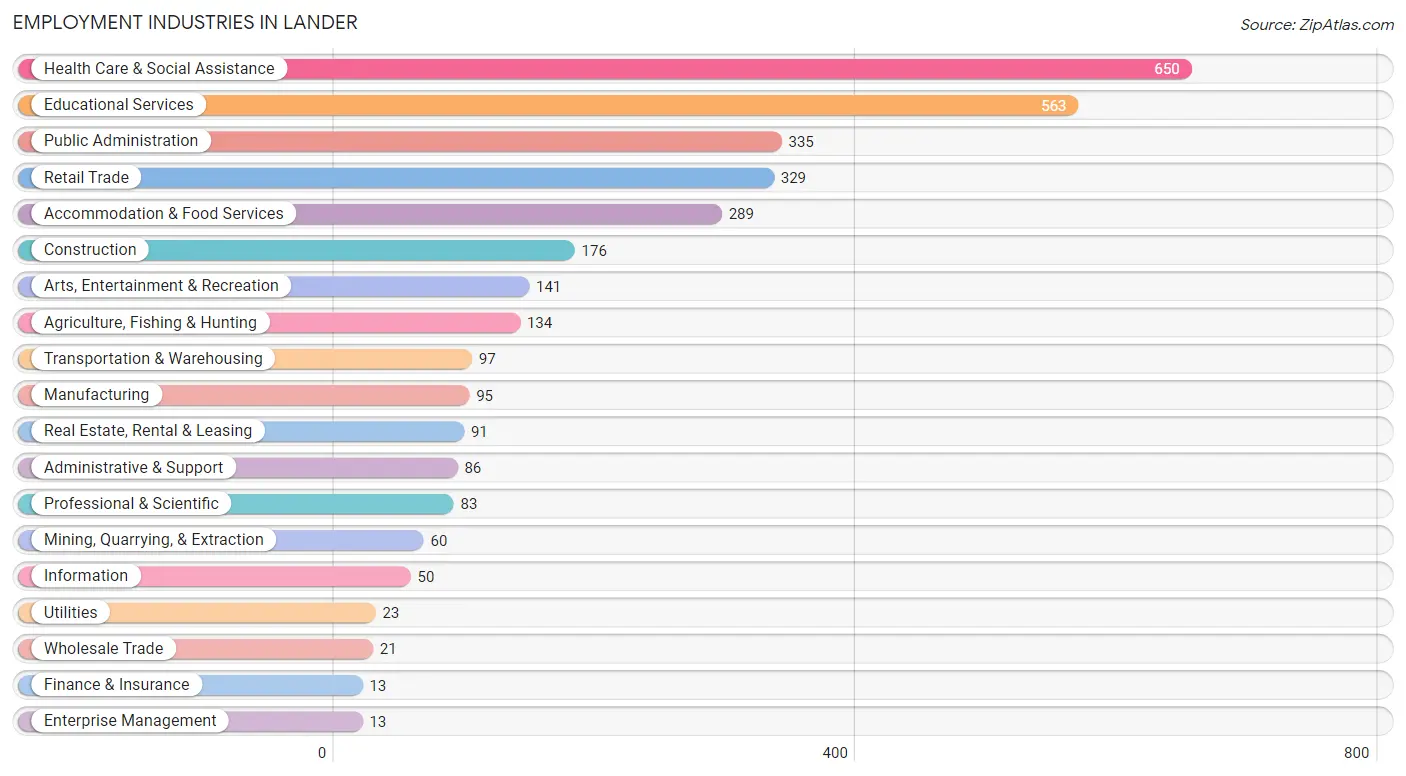
Employment Industries in Lander
The major employment industries in Lander include Health Care & Social Assistance (650 | 18.7%), Educational Services (563 | 16.2%), Public Administration (335 | 9.7%), Retail Trade (329 | 9.5%), and Accommodation & Food Services (289 | 8.3%).
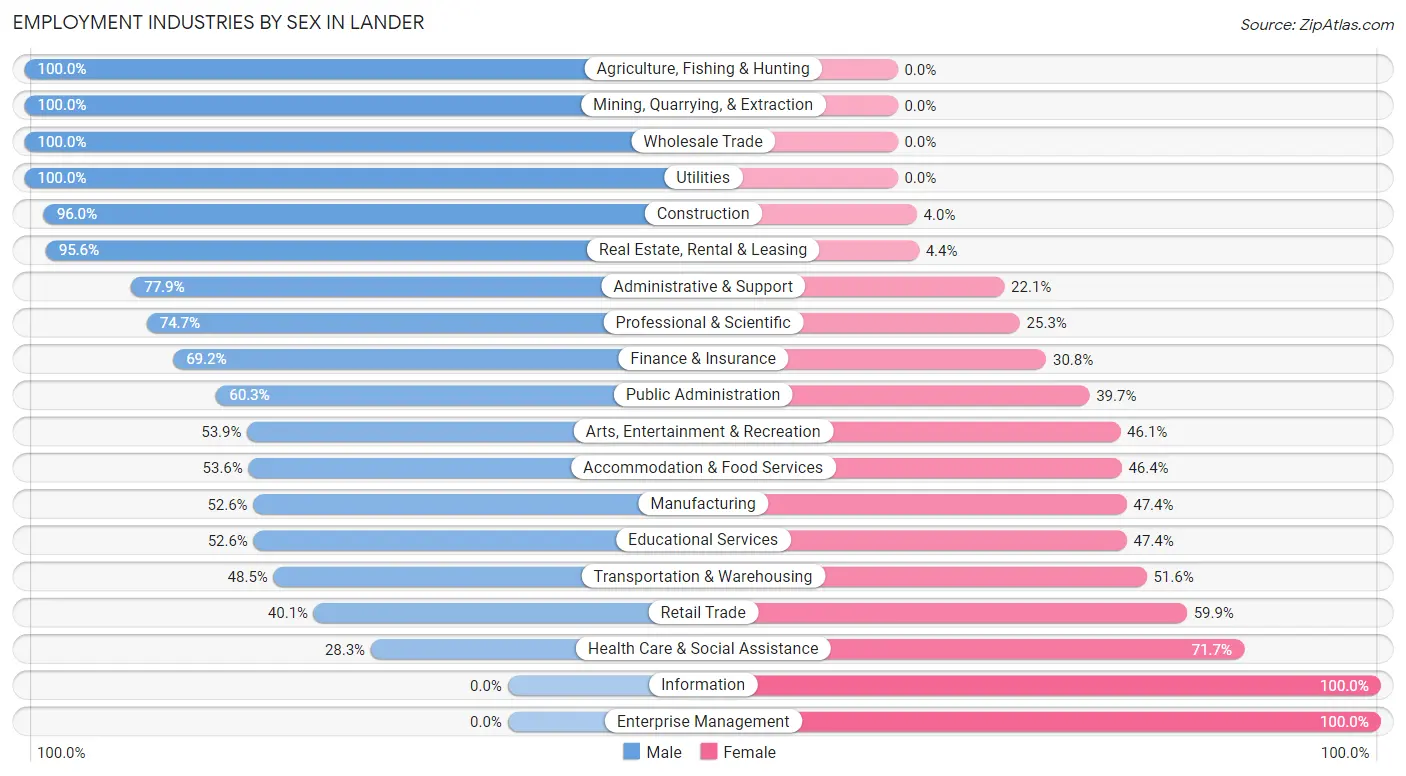
Employment Industries by Sex in Lander
The Lander industries that see more men than women are Agriculture, Fishing & Hunting (100.0%), Mining, Quarrying, & Extraction (100.0%), and Wholesale Trade (100.0%), whereas the industries that tend to have a higher number of women are Information (100.0%), Enterprise Management (100.0%), and Health Care & Social Assistance (71.7%).
| Industry | Male | Female |
| Agriculture, Fishing & Hunting | 134 (100.0%) | 0 (0.0%) |
| Mining, Quarrying, & Extraction | 60 (100.0%) | 0 (0.0%) |
| Construction | 169 (96.0%) | 7 (4.0%) |
| Manufacturing | 50 (52.6%) | 45 (47.4%) |
| Wholesale Trade | 21 (100.0%) | 0 (0.0%) |
| Retail Trade | 132 (40.1%) | 197 (59.9%) |
| Transportation & Warehousing | 47 (48.4%) | 50 (51.5%) |
| Utilities | 23 (100.0%) | 0 (0.0%) |
| Information | 0 (0.0%) | 50 (100.0%) |
| Finance & Insurance | 9 (69.2%) | 4 (30.8%) |
| Real Estate, Rental & Leasing | 87 (95.6%) | 4 (4.4%) |
| Professional & Scientific | 62 (74.7%) | 21 (25.3%) |
| Enterprise Management | 0 (0.0%) | 13 (100.0%) |
| Administrative & Support | 67 (77.9%) | 19 (22.1%) |
| Educational Services | 296 (52.6%) | 267 (47.4%) |
| Health Care & Social Assistance | 184 (28.3%) | 466 (71.7%) |
| Arts, Entertainment & Recreation | 76 (53.9%) | 65 (46.1%) |
| Accommodation & Food Services | 155 (53.6%) | 134 (46.4%) |
| Public Administration | 202 (60.3%) | 133 (39.7%) |
| Total | 1,859 (53.5%) | 1,613 (46.5%) |
Education in Lander
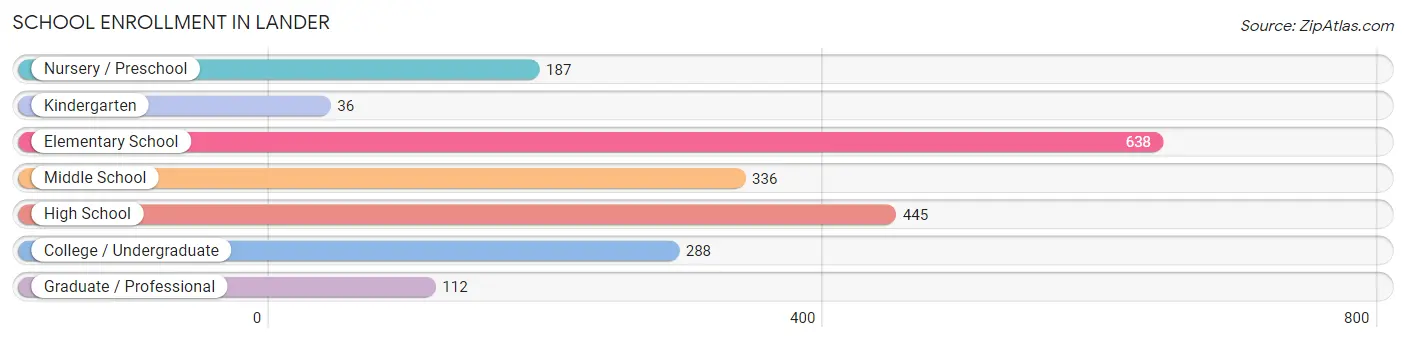
School Enrollment in Lander
The most common levels of schooling among the 2,042 students in Lander are elementary school (638 | 31.2%), high school (445 | 21.8%), and middle school (336 | 16.5%).
| School Level | # Students | % Students |
| Nursery / Preschool | 187 | 9.2% |
| Kindergarten | 36 | 1.8% |
| Elementary School | 638 | 31.2% |
| Middle School | 336 | 16.5% |
| High School | 445 | 21.8% |
| College / Undergraduate | 288 | 14.1% |
| Graduate / Professional | 112 | 5.5% |
| Total | 2,042 | 100.0% |
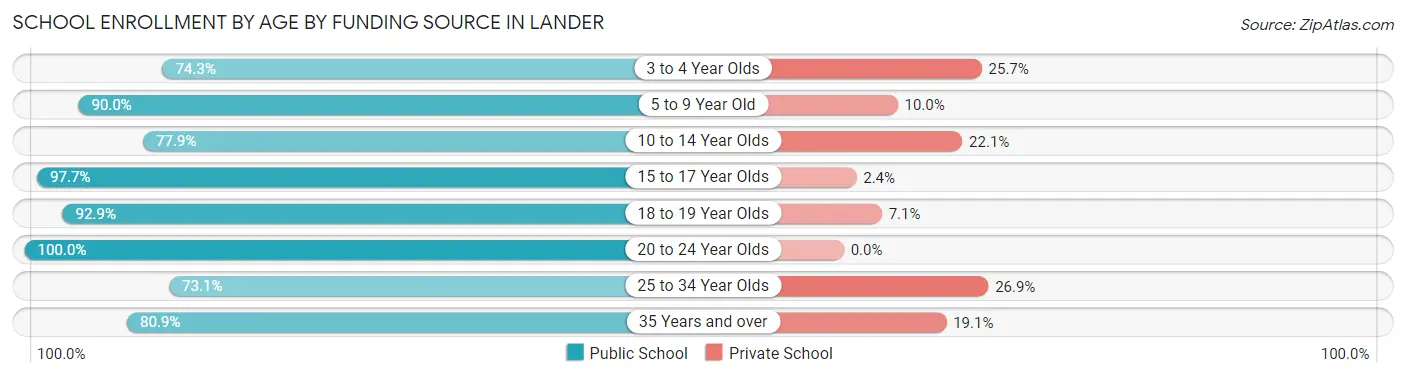
School Enrollment by Age by Funding Source in Lander
Out of a total of 2,042 students who are enrolled in schools in Lander, 270 (13.2%) attend a private institution, while the remaining 1,772 (86.8%) are enrolled in public schools. The age group of 25 to 34 year olds has the highest likelihood of being enrolled in private schools, with 14 (26.9% in the age bracket) enrolled. Conversely, the age group of 20 to 24 year olds has the lowest likelihood of being enrolled in a private school, with 83 (100.0% in the age bracket) attending a public institution.
| Age Bracket | Public School | Private School |
| 3 to 4 Year Olds | 107 (74.3%) | 37 (25.7%) |
| 5 to 9 Year Old | 600 (90.0%) | 67 (10.0%) |
| 10 to 14 Year Olds | 346 (77.9%) | 98 (22.1%) |
| 15 to 17 Year Olds | 332 (97.7%) | 8 (2.4%) |
| 18 to 19 Year Olds | 105 (92.9%) | 8 (7.1%) |
| 20 to 24 Year Olds | 83 (100.0%) | 0 (0.0%) |
| 25 to 34 Year Olds | 38 (73.1%) | 14 (26.9%) |
| 35 Years and over | 161 (80.9%) | 38 (19.1%) |
| Total | 1,772 (86.8%) | 270 (13.2%) |
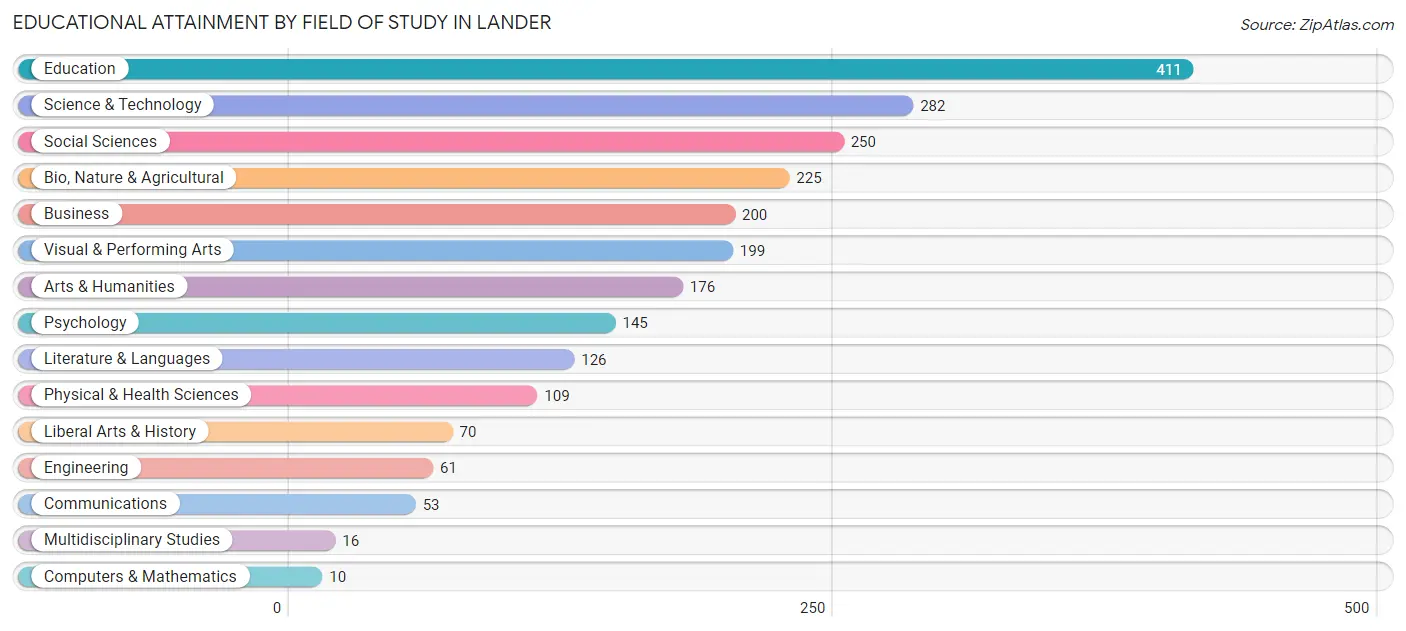
Educational Attainment by Field of Study in Lander
Education (411 | 17.6%), science & technology (282 | 12.1%), social sciences (250 | 10.7%), bio, nature & agricultural (225 | 9.6%), and business (200 | 8.6%) are the most common fields of study among 2,333 individuals in Lander who have obtained a bachelor's degree or higher.
| Field of Study | # Graduates | % Graduates |
| Computers & Mathematics | 10 | 0.4% |
| Bio, Nature & Agricultural | 225 | 9.6% |
| Physical & Health Sciences | 109 | 4.7% |
| Psychology | 145 | 6.2% |
| Social Sciences | 250 | 10.7% |
| Engineering | 61 | 2.6% |
| Multidisciplinary Studies | 16 | 0.7% |
| Science & Technology | 282 | 12.1% |
| Business | 200 | 8.6% |
| Education | 411 | 17.6% |
| Literature & Languages | 126 | 5.4% |
| Liberal Arts & History | 70 | 3.0% |
| Visual & Performing Arts | 199 | 8.5% |
| Communications | 53 | 2.3% |
| Arts & Humanities | 176 | 7.5% |
| Total | 2,333 | 100.0% |
Transportation & Commute in Lander
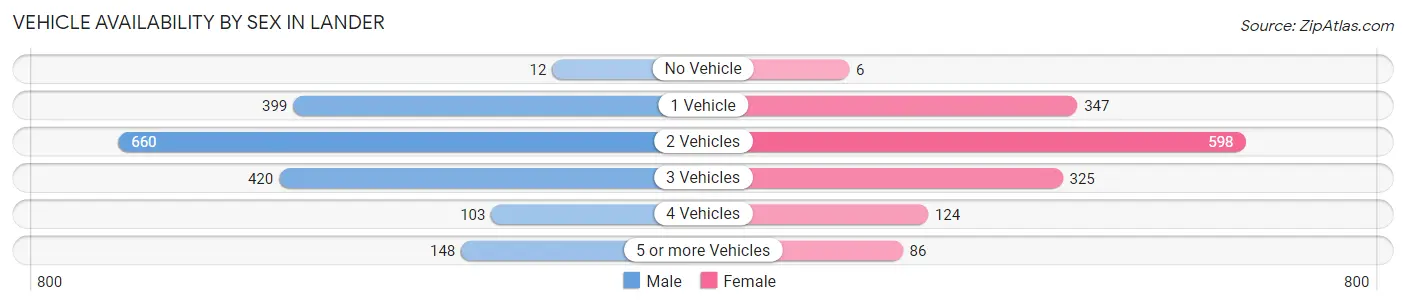
Vehicle Availability by Sex in Lander
The most prevalent vehicle ownership categories in Lander are males with 2 vehicles (660, accounting for 37.9%) and females with 2 vehicles (598, making up 44.4%).
| Vehicles Available | Male | Female |
| No Vehicle | 12 (0.7%) | 6 (0.4%) |
| 1 Vehicle | 399 (22.9%) | 347 (23.4%) |
| 2 Vehicles | 660 (37.9%) | 598 (40.2%) |
| 3 Vehicles | 420 (24.1%) | 325 (21.9%) |
| 4 Vehicles | 103 (5.9%) | 124 (8.3%) |
| 5 or more Vehicles | 148 (8.5%) | 86 (5.8%) |
| Total | 1,742 (100.0%) | 1,486 (100.0%) |
Commute Time in Lander
The most frequently occuring commute durations in Lander are 5 to 9 minutes (1,147 commuters, 37.4%), 10 to 14 minutes (534 commuters, 17.4%), and less than 5 minutes (353 commuters, 11.5%).
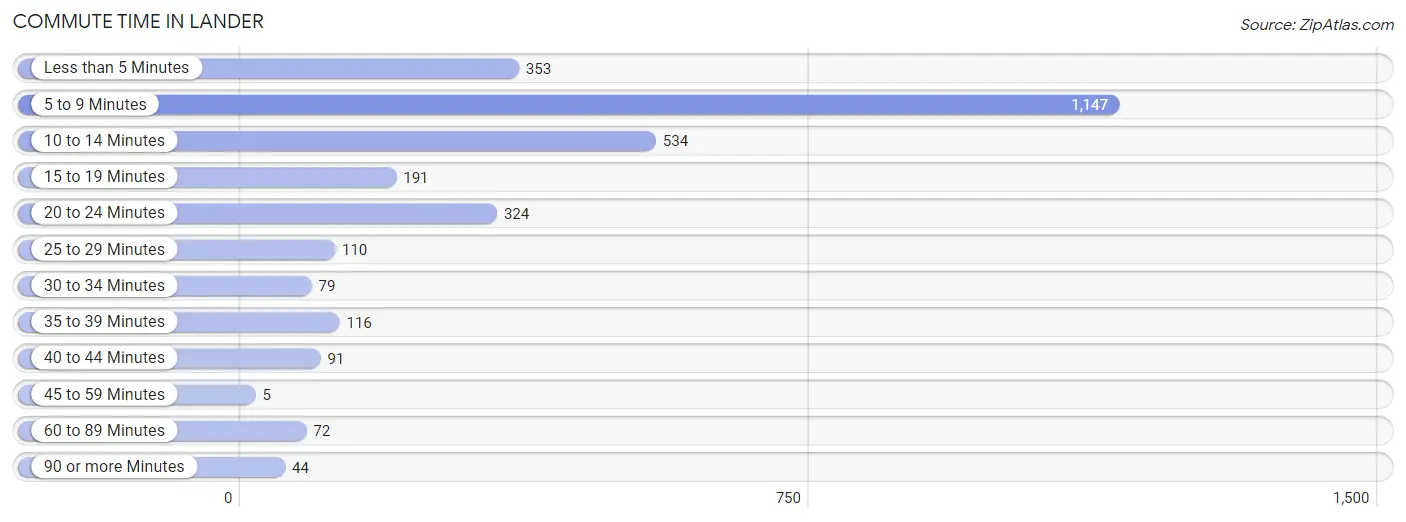
| Commute Time | # Commuters | % Commuters |
| Less than 5 Minutes | 353 | 11.5% |
| 5 to 9 Minutes | 1,147 | 37.4% |
| 10 to 14 Minutes | 534 | 17.4% |
| 15 to 19 Minutes | 191 | 6.2% |
| 20 to 24 Minutes | 324 | 10.6% |
| 25 to 29 Minutes | 110 | 3.6% |
| 30 to 34 Minutes | 79 | 2.6% |
| 35 to 39 Minutes | 116 | 3.8% |
| 40 to 44 Minutes | 91 | 3.0% |
| 45 to 59 Minutes | 5 | 0.2% |
| 60 to 89 Minutes | 72 | 2.4% |
| 90 or more Minutes | 44 | 1.4% |
Commute Time by Sex in Lander
The most common commute times in Lander are 5 to 9 minutes (643 commuters, 37.7%) for males and 5 to 9 minutes (504 commuters, 37.0%) for females.
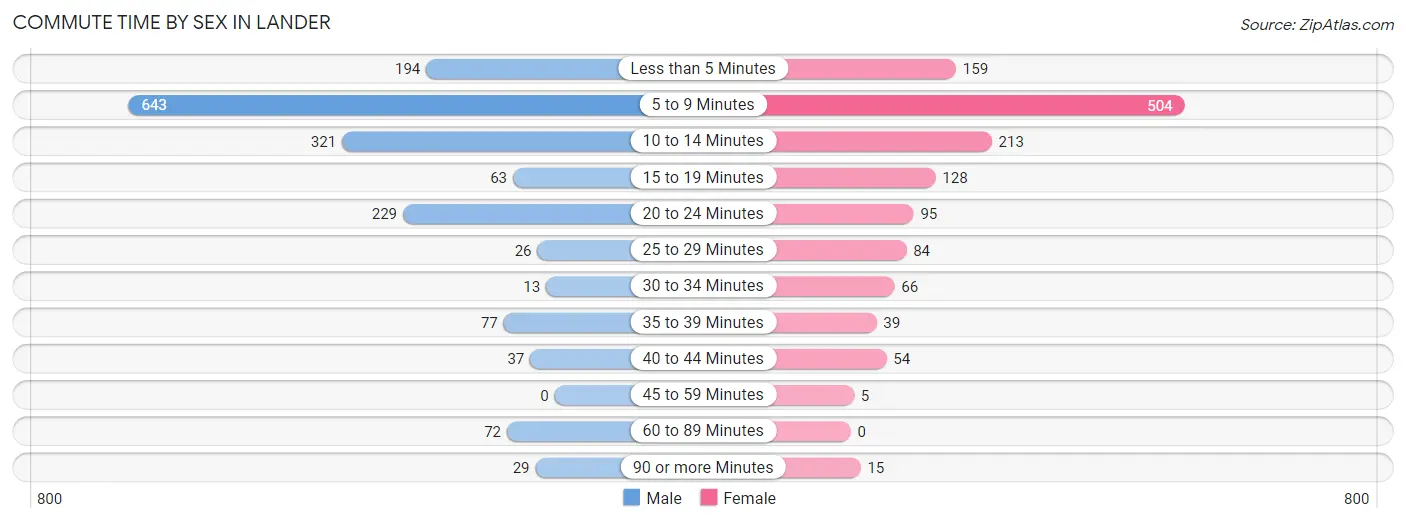
| Commute Time | Male | Female |
| Less than 5 Minutes | 194 (11.4%) | 159 (11.7%) |
| 5 to 9 Minutes | 643 (37.7%) | 504 (37.0%) |
| 10 to 14 Minutes | 321 (18.8%) | 213 (15.6%) |
| 15 to 19 Minutes | 63 (3.7%) | 128 (9.4%) |
| 20 to 24 Minutes | 229 (13.4%) | 95 (7.0%) |
| 25 to 29 Minutes | 26 (1.5%) | 84 (6.2%) |
| 30 to 34 Minutes | 13 (0.8%) | 66 (4.9%) |
| 35 to 39 Minutes | 77 (4.5%) | 39 (2.9%) |
| 40 to 44 Minutes | 37 (2.2%) | 54 (4.0%) |
| 45 to 59 Minutes | 0 (0.0%) | 5 (0.4%) |
| 60 to 89 Minutes | 72 (4.2%) | 0 (0.0%) |
| 90 or more Minutes | 29 (1.7%) | 15 (1.1%) |
Time of Departure to Work by Sex in Lander
The most frequent times of departure to work in Lander are 7:30 AM to 7:59 AM (360, 21.1%) for males and 7:30 AM to 7:59 AM (373, 27.4%) for females.
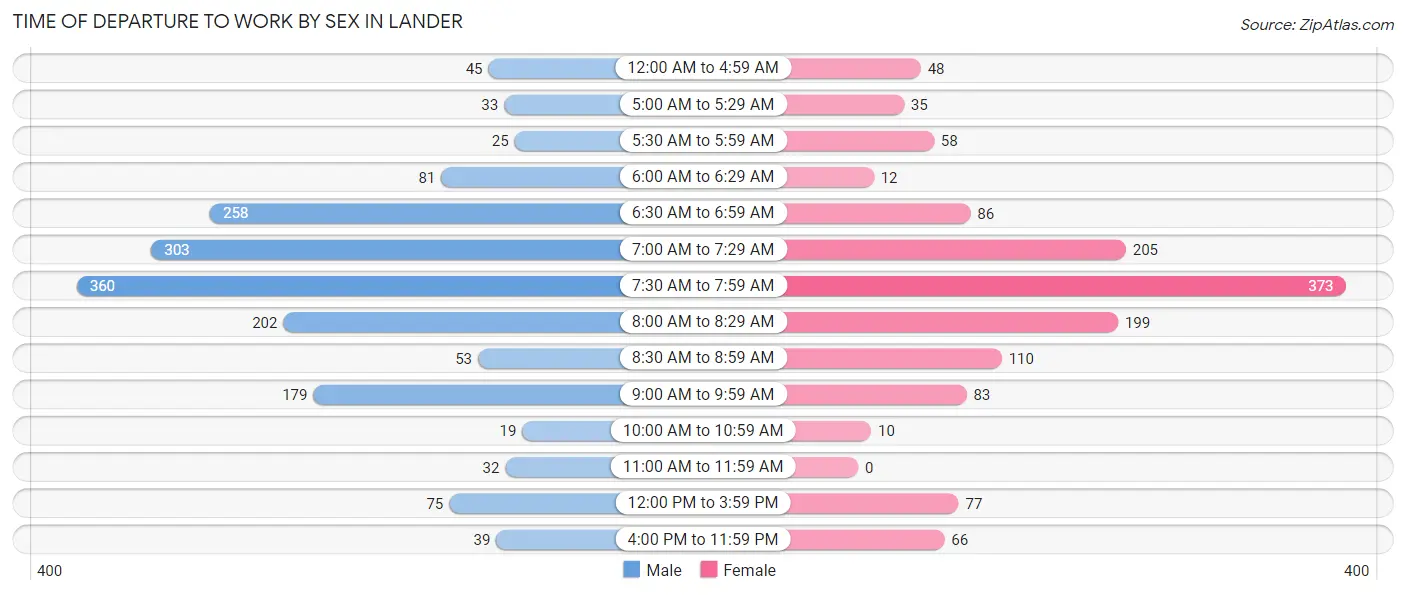
| Time of Departure | Male | Female |
| 12:00 AM to 4:59 AM | 45 (2.6%) | 48 (3.5%) |
| 5:00 AM to 5:29 AM | 33 (1.9%) | 35 (2.6%) |
| 5:30 AM to 5:59 AM | 25 (1.5%) | 58 (4.3%) |
| 6:00 AM to 6:29 AM | 81 (4.8%) | 12 (0.9%) |
| 6:30 AM to 6:59 AM | 258 (15.1%) | 86 (6.3%) |
| 7:00 AM to 7:29 AM | 303 (17.8%) | 205 (15.0%) |
| 7:30 AM to 7:59 AM | 360 (21.1%) | 373 (27.4%) |
| 8:00 AM to 8:29 AM | 202 (11.8%) | 199 (14.6%) |
| 8:30 AM to 8:59 AM | 53 (3.1%) | 110 (8.1%) |
| 9:00 AM to 9:59 AM | 179 (10.5%) | 83 (6.1%) |
| 10:00 AM to 10:59 AM | 19 (1.1%) | 10 (0.7%) |
| 11:00 AM to 11:59 AM | 32 (1.9%) | 0 (0.0%) |
| 12:00 PM to 3:59 PM | 75 (4.4%) | 77 (5.7%) |
| 4:00 PM to 11:59 PM | 39 (2.3%) | 66 (4.9%) |
| Total | 1,704 (100.0%) | 1,362 (100.0%) |
Housing Occupancy in Lander
Occupancy by Ownership in Lander
Of the total 2,969 dwellings in Lander, owner-occupied units account for 1,967 (66.2%), while renter-occupied units make up 1,002 (33.8%).
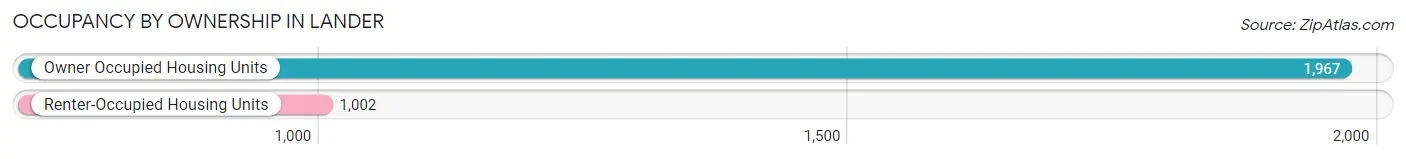
| Occupancy | # Housing Units | % Housing Units |
| Owner Occupied Housing Units | 1,967 | 66.2% |
| Renter-Occupied Housing Units | 1,002 | 33.8% |
| Total Occupied Housing Units | 2,969 | 100.0% |
Occupancy by Household Size in Lander
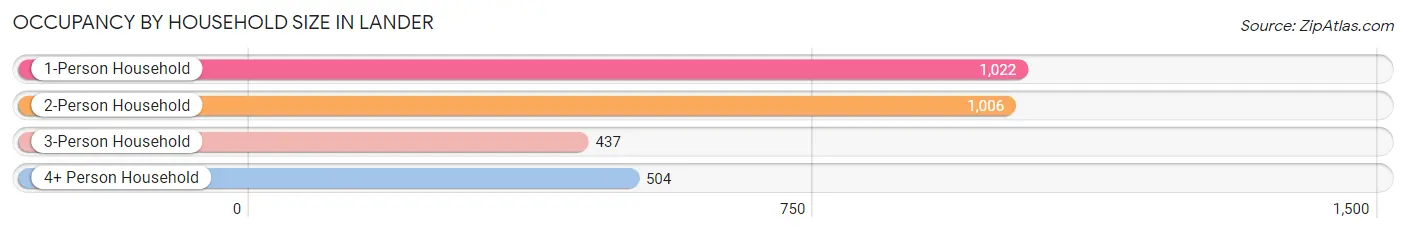
| Household Size | # Housing Units | % Housing Units |
| 1-Person Household | 1,022 | 34.4% |
| 2-Person Household | 1,006 | 33.9% |
| 3-Person Household | 437 | 14.7% |
| 4+ Person Household | 504 | 17.0% |
| Total Housing Units | 2,969 | 100.0% |
Occupancy by Ownership by Household Size in Lander
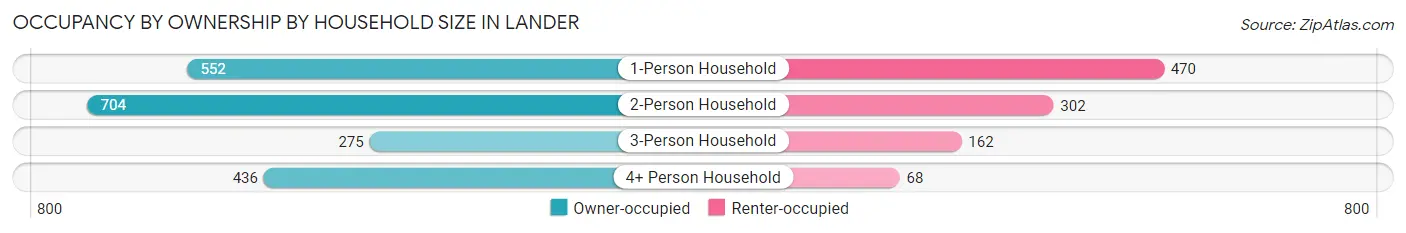
| Household Size | Owner-occupied | Renter-occupied |
| 1-Person Household | 552 (54.0%) | 470 (46.0%) |
| 2-Person Household | 704 (70.0%) | 302 (30.0%) |
| 3-Person Household | 275 (62.9%) | 162 (37.1%) |
| 4+ Person Household | 436 (86.5%) | 68 (13.5%) |
| Total Housing Units | 1,967 (66.2%) | 1,002 (33.8%) |
Occupancy by Educational Attainment in Lander
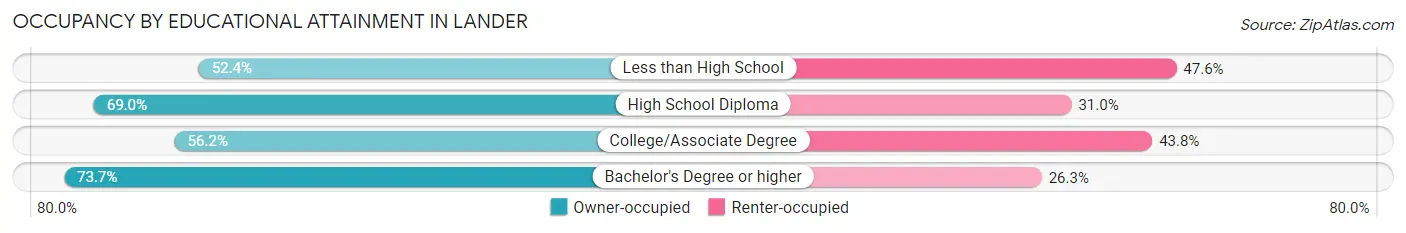
| Household Size | Owner-occupied | Renter-occupied |
| Less than High School | 44 (52.4%) | 40 (47.6%) |
| High School Diploma | 332 (69.0%) | 149 (31.0%) |
| College/Associate Degree | 583 (56.2%) | 454 (43.8%) |
| Bachelor's Degree or higher | 1,008 (73.7%) | 359 (26.3%) |
Occupancy by Age of Householder in Lander
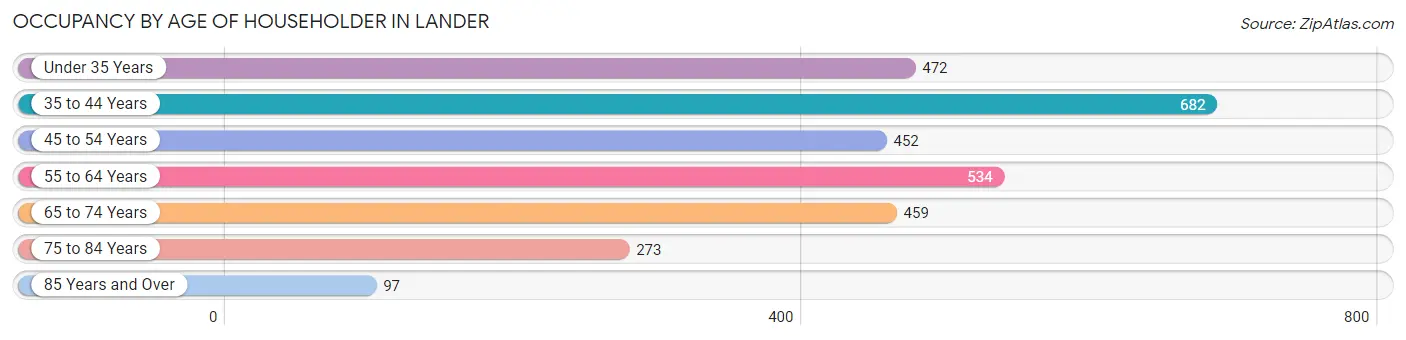
| Age Bracket | # Households | % Households |
| Under 35 Years | 472 | 15.9% |
| 35 to 44 Years | 682 | 23.0% |
| 45 to 54 Years | 452 | 15.2% |
| 55 to 64 Years | 534 | 18.0% |
| 65 to 74 Years | 459 | 15.5% |
| 75 to 84 Years | 273 | 9.2% |
| 85 Years and Over | 97 | 3.3% |
| Total | 2,969 | 100.0% |
Housing Finances in Lander
Median Income by Occupancy in Lander
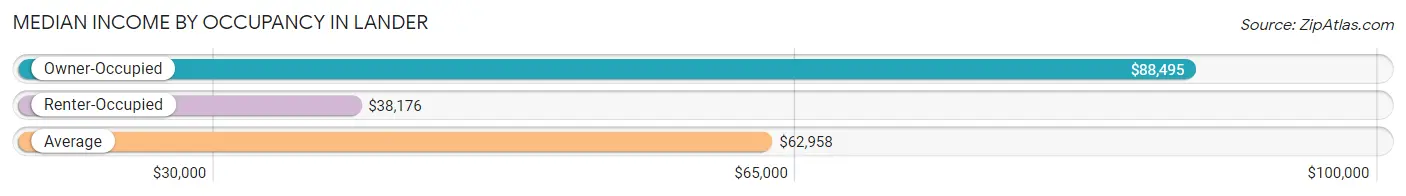
| Occupancy Type | # Households | Median Income |
| Owner-Occupied | 1,967 (66.2%) | $88,495 |
| Renter-Occupied | 1,002 (33.8%) | $38,176 |
| Average | 2,969 (100.0%) | $62,958 |
Occupancy by Householder Income Bracket in Lander
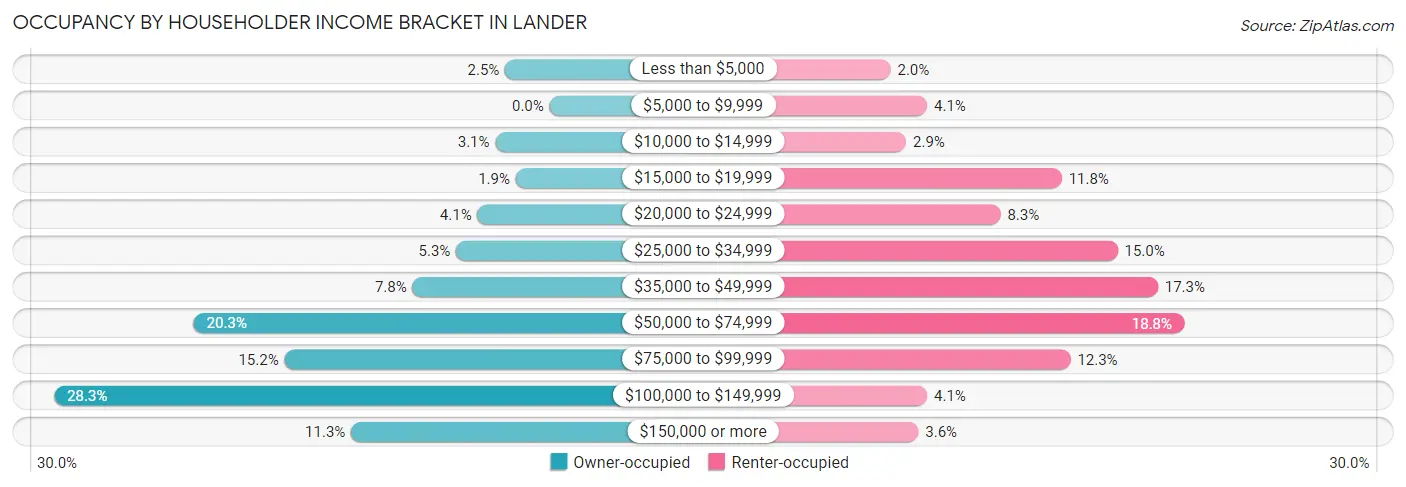
| Income Bracket | Owner-occupied | Renter-occupied |
| Less than $5,000 | 50 (2.5%) | 20 (2.0%) |
| $5,000 to $9,999 | 0 (0.0%) | 41 (4.1%) |
| $10,000 to $14,999 | 61 (3.1%) | 29 (2.9%) |
| $15,000 to $19,999 | 38 (1.9%) | 118 (11.8%) |
| $20,000 to $24,999 | 81 (4.1%) | 83 (8.3%) |
| $25,000 to $34,999 | 105 (5.3%) | 150 (15.0%) |
| $35,000 to $49,999 | 154 (7.8%) | 173 (17.3%) |
| $50,000 to $74,999 | 400 (20.3%) | 188 (18.8%) |
| $75,000 to $99,999 | 298 (15.1%) | 123 (12.3%) |
| $100,000 to $149,999 | 557 (28.3%) | 41 (4.1%) |
| $150,000 or more | 223 (11.3%) | 36 (3.6%) |
| Total | 1,967 (100.0%) | 1,002 (100.0%) |
Monthly Housing Cost Tiers in Lander
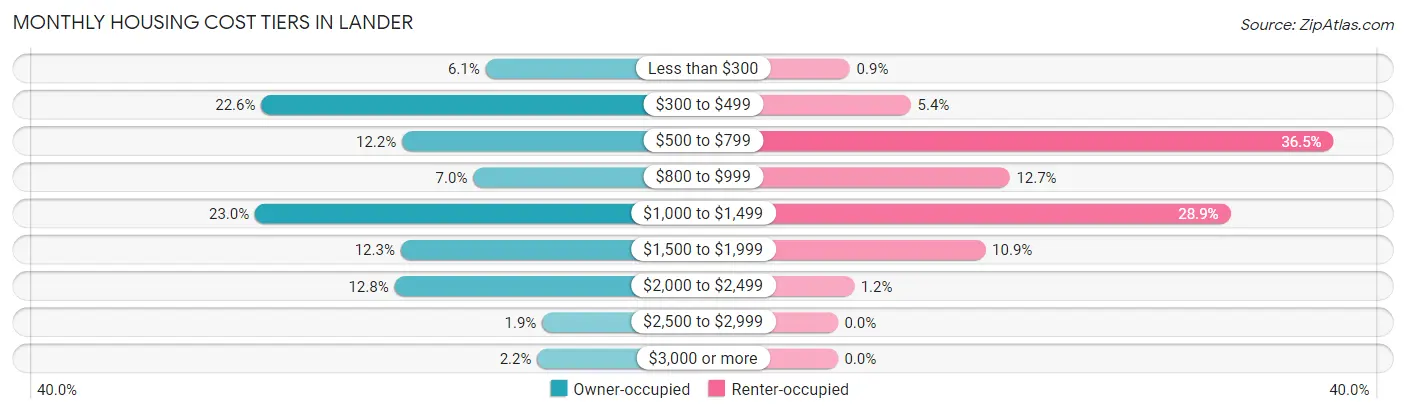
| Monthly Cost | Owner-occupied | Renter-occupied |
| Less than $300 | 119 (6.0%) | 9 (0.9%) |
| $300 to $499 | 444 (22.6%) | 54 (5.4%) |
| $500 to $799 | 240 (12.2%) | 366 (36.5%) |
| $800 to $999 | 137 (7.0%) | 127 (12.7%) |
| $1,000 to $1,499 | 453 (23.0%) | 290 (28.9%) |
| $1,500 to $1,999 | 242 (12.3%) | 109 (10.9%) |
| $2,000 to $2,499 | 251 (12.8%) | 12 (1.2%) |
| $2,500 to $2,999 | 37 (1.9%) | 0 (0.0%) |
| $3,000 or more | 44 (2.2%) | 0 (0.0%) |
| Total | 1,967 (100.0%) | 1,002 (100.0%) |
Physical Housing Characteristics in Lander
Housing Structures in Lander
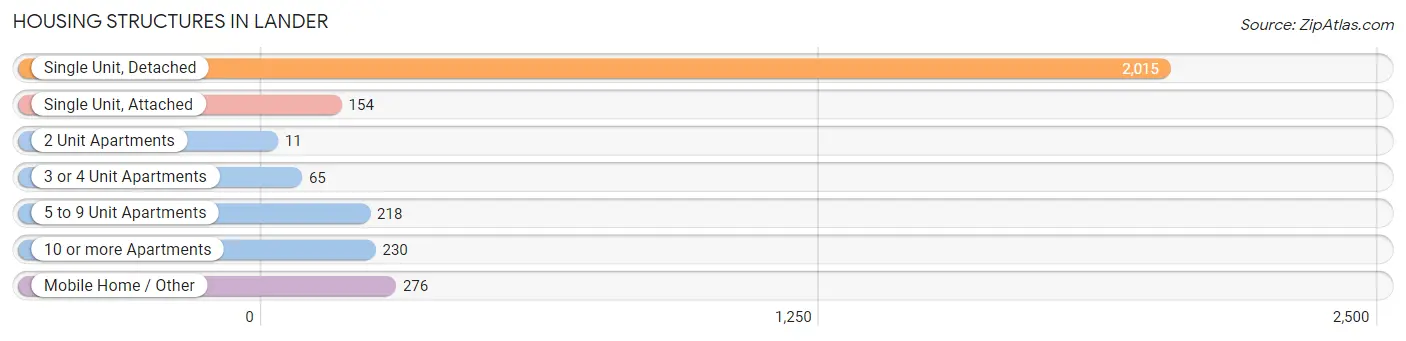
| Structure Type | # Housing Units | % Housing Units |
| Single Unit, Detached | 2,015 | 67.9% |
| Single Unit, Attached | 154 | 5.2% |
| 2 Unit Apartments | 11 | 0.4% |
| 3 or 4 Unit Apartments | 65 | 2.2% |
| 5 to 9 Unit Apartments | 218 | 7.3% |
| 10 or more Apartments | 230 | 7.7% |
| Mobile Home / Other | 276 | 9.3% |
| Total | 2,969 | 100.0% |
Housing Structures by Occupancy in Lander
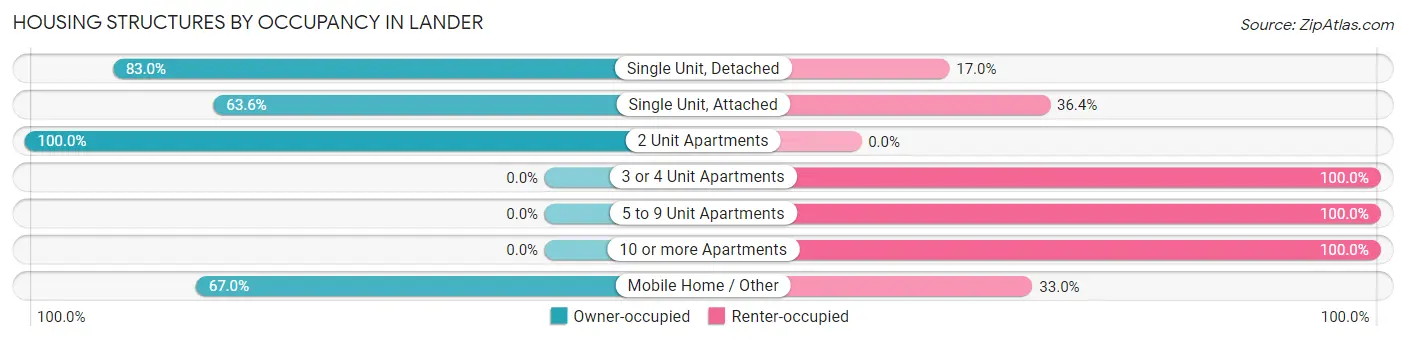
| Structure Type | Owner-occupied | Renter-occupied |
| Single Unit, Detached | 1,673 (83.0%) | 342 (17.0%) |
| Single Unit, Attached | 98 (63.6%) | 56 (36.4%) |
| 2 Unit Apartments | 11 (100.0%) | 0 (0.0%) |
| 3 or 4 Unit Apartments | 0 (0.0%) | 65 (100.0%) |
| 5 to 9 Unit Apartments | 0 (0.0%) | 218 (100.0%) |
| 10 or more Apartments | 0 (0.0%) | 230 (100.0%) |
| Mobile Home / Other | 185 (67.0%) | 91 (33.0%) |
| Total | 1,967 (66.2%) | 1,002 (33.8%) |
Housing Structures by Number of Rooms in Lander
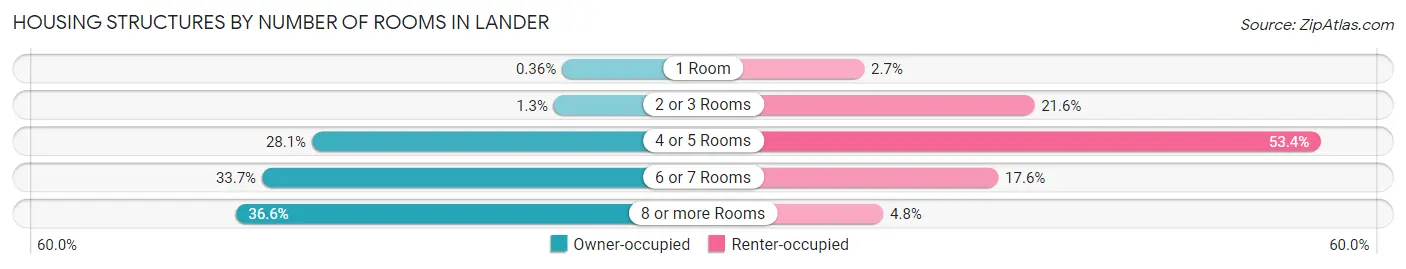
| Number of Rooms | Owner-occupied | Renter-occupied |
| 1 Room | 7 (0.4%) | 27 (2.7%) |
| 2 or 3 Rooms | 25 (1.3%) | 216 (21.6%) |
| 4 or 5 Rooms | 553 (28.1%) | 535 (53.4%) |
| 6 or 7 Rooms | 662 (33.7%) | 176 (17.6%) |
| 8 or more Rooms | 720 (36.6%) | 48 (4.8%) |
| Total | 1,967 (100.0%) | 1,002 (100.0%) |
Housing Structure by Heating Type in Lander
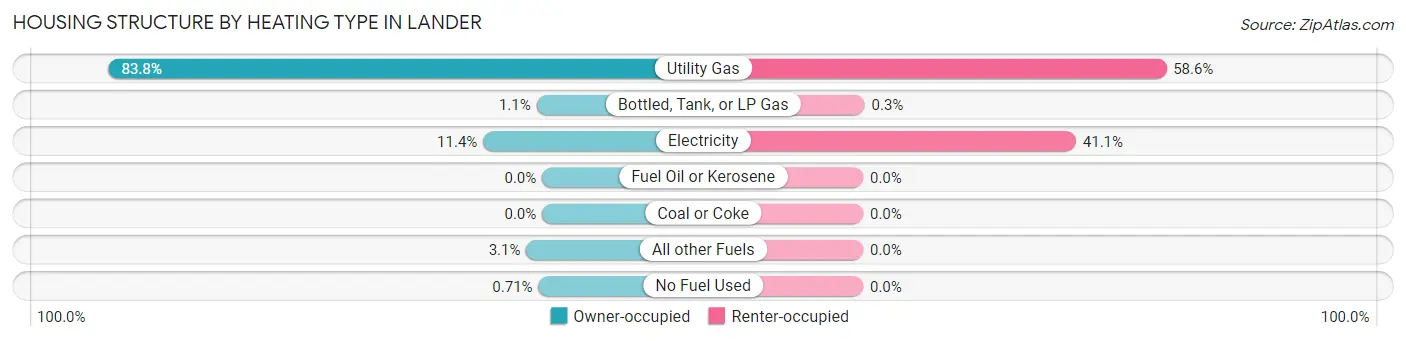
| Heating Type | Owner-occupied | Renter-occupied |
| Utility Gas | 1,648 (83.8%) | 587 (58.6%) |
| Bottled, Tank, or LP Gas | 21 (1.1%) | 3 (0.3%) |
| Electricity | 224 (11.4%) | 412 (41.1%) |
| Fuel Oil or Kerosene | 0 (0.0%) | 0 (0.0%) |
| Coal or Coke | 0 (0.0%) | 0 (0.0%) |
| All other Fuels | 60 (3.0%) | 0 (0.0%) |
| No Fuel Used | 14 (0.7%) | 0 (0.0%) |
| Total | 1,967 (100.0%) | 1,002 (100.0%) |
Household Vehicle Usage in Lander
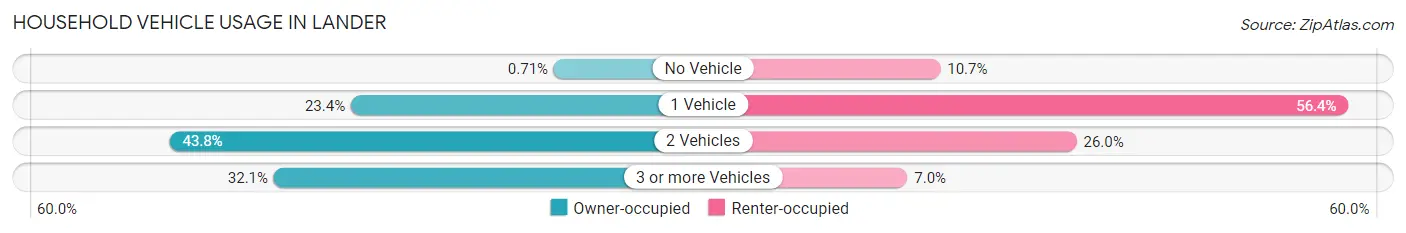
| Vehicles per Household | Owner-occupied | Renter-occupied |
| No Vehicle | 14 (0.7%) | 107 (10.7%) |
| 1 Vehicle | 461 (23.4%) | 565 (56.4%) |
| 2 Vehicles | 861 (43.8%) | 260 (26.0%) |
| 3 or more Vehicles | 631 (32.1%) | 70 (7.0%) |
| Total | 1,967 (100.0%) | 1,002 (100.0%) |
Real Estate & Mortgages in Lander
Real Estate and Mortgage Overview in Lander
| Characteristic | Without Mortgage | With Mortgage |
| Housing Units | 799 | 1,168 |
| Median Property Value | $259,800 | $309,500 |
| Median Household Income | $51,051 | $160 |
| Monthly Housing Costs | $436 | $44 |
| Real Estate Taxes | $1,485 | $46 |
Property Value by Mortgage Status in Lander
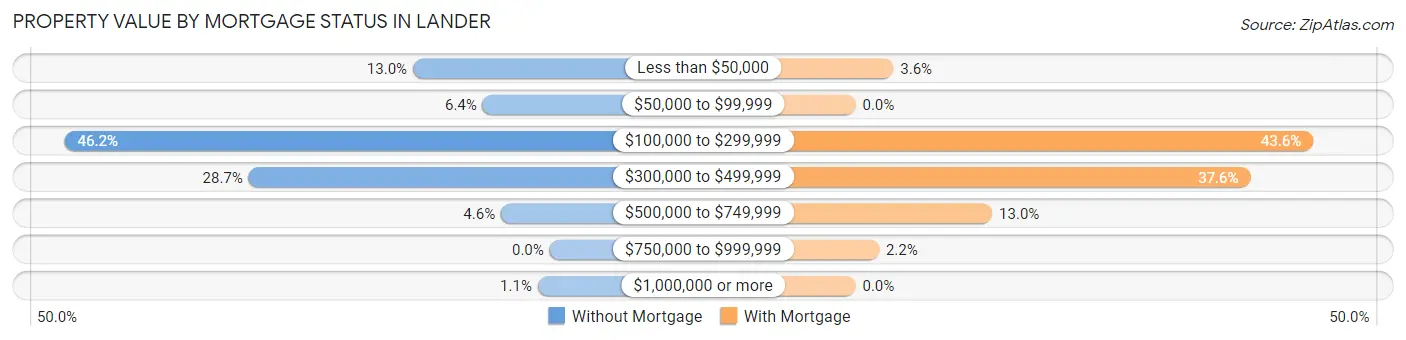
| Property Value | Without Mortgage | With Mortgage |
| Less than $50,000 | 104 (13.0%) | 42 (3.6%) |
| $50,000 to $99,999 | 51 (6.4%) | 0 (0.0%) |
| $100,000 to $299,999 | 369 (46.2%) | 509 (43.6%) |
| $300,000 to $499,999 | 229 (28.7%) | 439 (37.6%) |
| $500,000 to $749,999 | 37 (4.6%) | 152 (13.0%) |
| $750,000 to $999,999 | 0 (0.0%) | 26 (2.2%) |
| $1,000,000 or more | 9 (1.1%) | 0 (0.0%) |
| Total | 799 (100.0%) | 1,168 (100.0%) |
Household Income by Mortgage Status in Lander
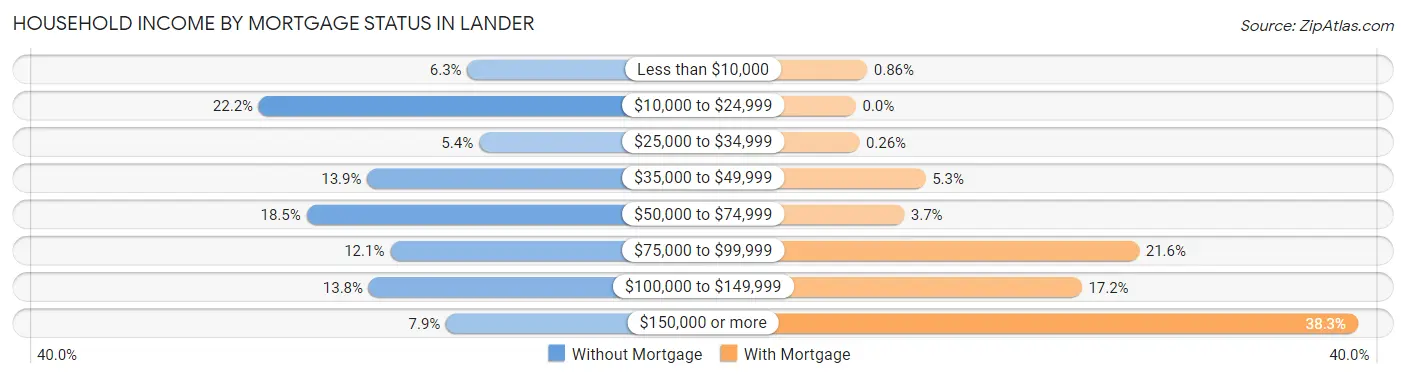
| Household Income | Without Mortgage | With Mortgage |
| Less than $10,000 | 50 (6.3%) | 10 (0.9%) |
| $10,000 to $24,999 | 177 (22.2%) | 0 (0.0%) |
| $25,000 to $34,999 | 43 (5.4%) | 3 (0.3%) |
| $35,000 to $49,999 | 111 (13.9%) | 62 (5.3%) |
| $50,000 to $74,999 | 148 (18.5%) | 43 (3.7%) |
| $75,000 to $99,999 | 97 (12.1%) | 252 (21.6%) |
| $100,000 to $149,999 | 110 (13.8%) | 201 (17.2%) |
| $150,000 or more | 63 (7.9%) | 447 (38.3%) |
| Total | 799 (100.0%) | 1,168 (100.0%) |
Property Value to Household Income Ratio in Lander
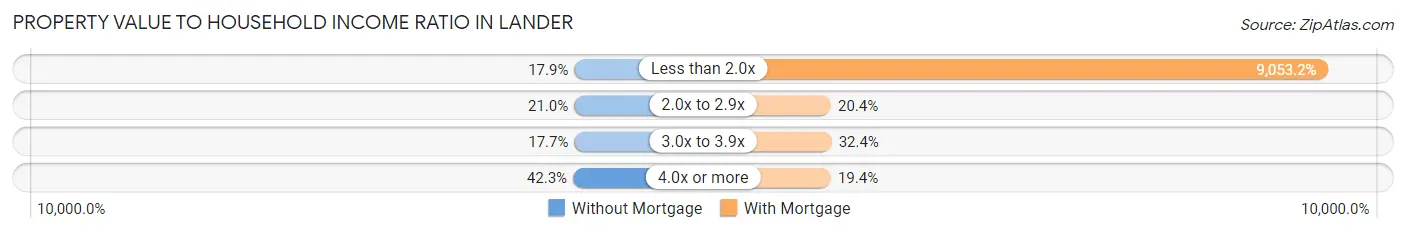
| Value-to-Income Ratio | Without Mortgage | With Mortgage |
| Less than 2.0x | 143 (17.9%) | 105,741 (9,053.2%) |
| 2.0x to 2.9x | 168 (21.0%) | 238 (20.4%) |
| 3.0x to 3.9x | 141 (17.6%) | 378 (32.4%) |
| 4.0x or more | 338 (42.3%) | 227 (19.4%) |
| Total | 799 (100.0%) | 1,168 (100.0%) |
Real Estate Taxes by Mortgage Status in Lander
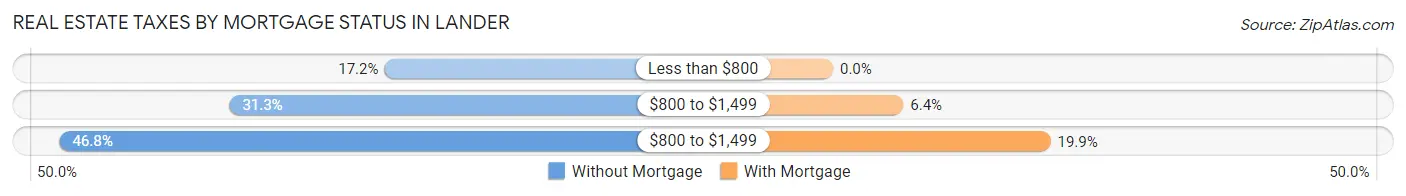
| Property Taxes | Without Mortgage | With Mortgage |
| Less than $800 | 137 (17.2%) | 0 (0.0%) |
| $800 to $1,499 | 250 (31.3%) | 75 (6.4%) |
| $800 to $1,499 | 374 (46.8%) | 232 (19.9%) |
| Total | 799 (100.0%) | 1,168 (100.0%) |
Health & Disability in Lander
Health Insurance Coverage by Age in Lander
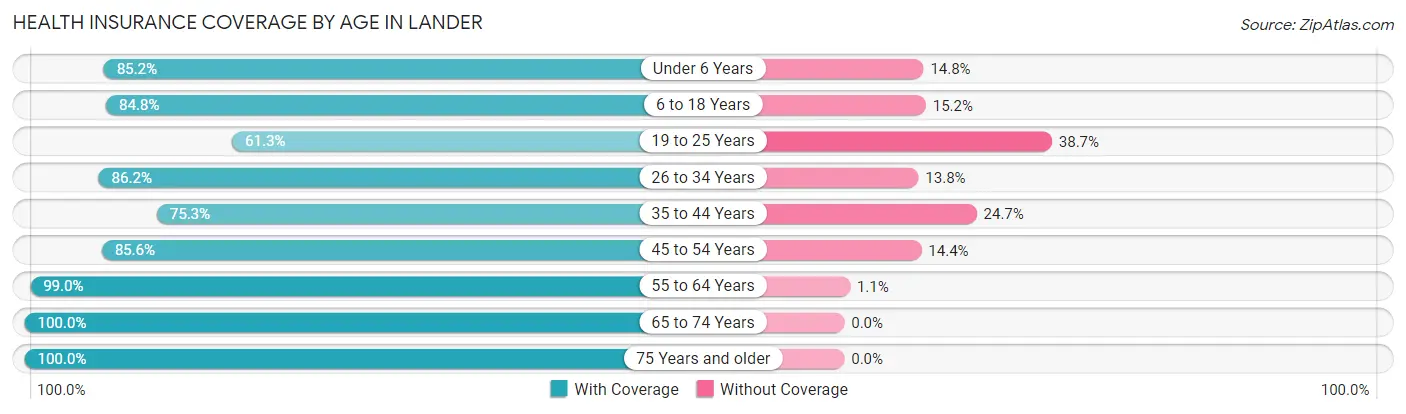
| Age Bracket | With Coverage | Without Coverage |
| Under 6 Years | 462 (85.2%) | 80 (14.8%) |
| 6 to 18 Years | 1,328 (84.8%) | 238 (15.2%) |
| 19 to 25 Years | 266 (61.3%) | 168 (38.7%) |
| 26 to 34 Years | 667 (86.2%) | 107 (13.8%) |
| 35 to 44 Years | 849 (75.3%) | 278 (24.7%) |
| 45 to 54 Years | 649 (85.6%) | 109 (14.4%) |
| 55 to 64 Years | 849 (99.0%) | 9 (1.1%) |
| 65 to 74 Years | 759 (100.0%) | 0 (0.0%) |
| 75 Years and older | 545 (100.0%) | 0 (0.0%) |
| Total | 6,374 (86.6%) | 989 (13.4%) |
Health Insurance Coverage by Citizenship Status in Lander
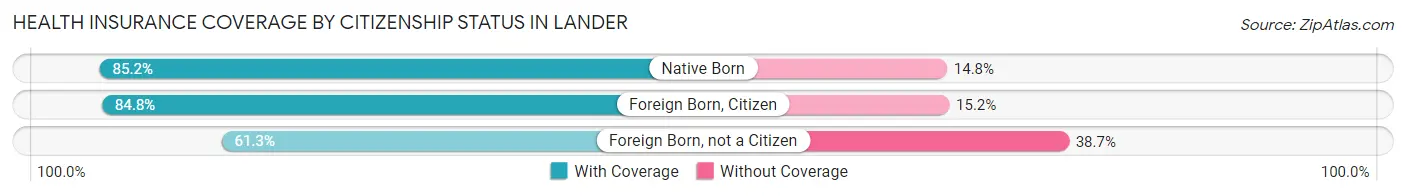
| Citizenship Status | With Coverage | Without Coverage |
| Native Born | 462 (85.2%) | 80 (14.8%) |
| Foreign Born, Citizen | 1,328 (84.8%) | 238 (15.2%) |
| Foreign Born, not a Citizen | 266 (61.3%) | 168 (38.7%) |
Health Insurance Coverage by Household Income in Lander
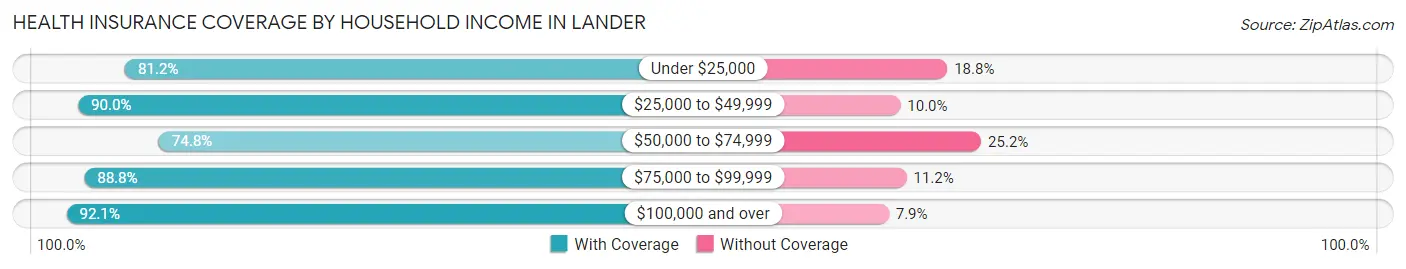
| Household Income | With Coverage | Without Coverage |
| Under $25,000 | 772 (81.2%) | 179 (18.8%) |
| $25,000 to $49,999 | 959 (90.0%) | 107 (10.0%) |
| $50,000 to $74,999 | 1,109 (74.8%) | 373 (25.2%) |
| $75,000 to $99,999 | 841 (88.8%) | 106 (11.2%) |
| $100,000 and over | 2,621 (92.1%) | 224 (7.9%) |
Public vs Private Health Insurance Coverage by Age in Lander
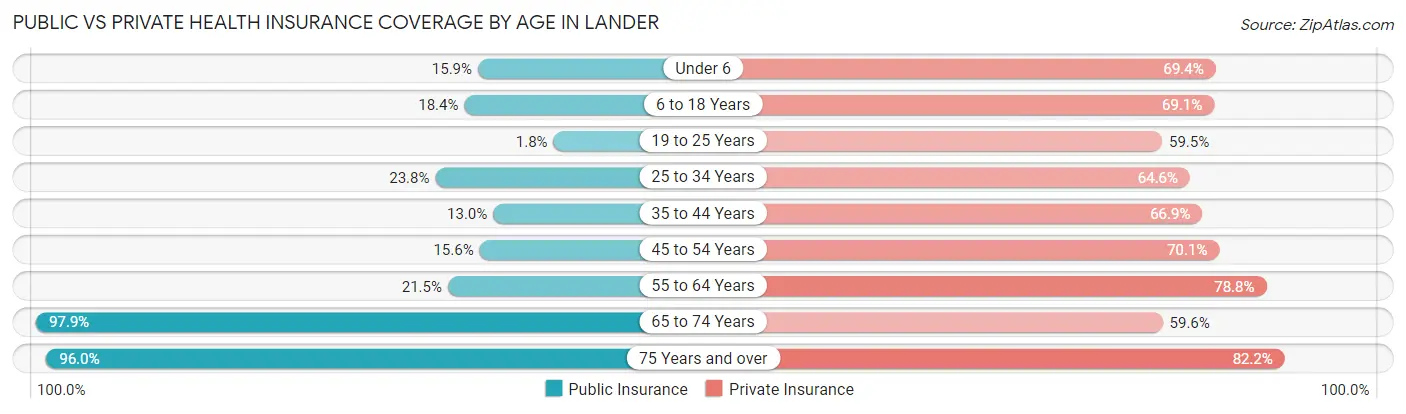
| Age Bracket | Public Insurance | Private Insurance |
| Under 6 | 86 (15.9%) | 376 (69.4%) |
| 6 to 18 Years | 288 (18.4%) | 1,082 (69.1%) |
| 19 to 25 Years | 8 (1.8%) | 258 (59.5%) |
| 25 to 34 Years | 184 (23.8%) | 500 (64.6%) |
| 35 to 44 Years | 147 (13.0%) | 754 (66.9%) |
| 45 to 54 Years | 118 (15.6%) | 531 (70.1%) |
| 55 to 64 Years | 184 (21.4%) | 676 (78.8%) |
| 65 to 74 Years | 743 (97.9%) | 452 (59.6%) |
| 75 Years and over | 523 (96.0%) | 448 (82.2%) |
| Total | 2,281 (31.0%) | 5,077 (69.0%) |
Disability Status by Sex by Age in Lander
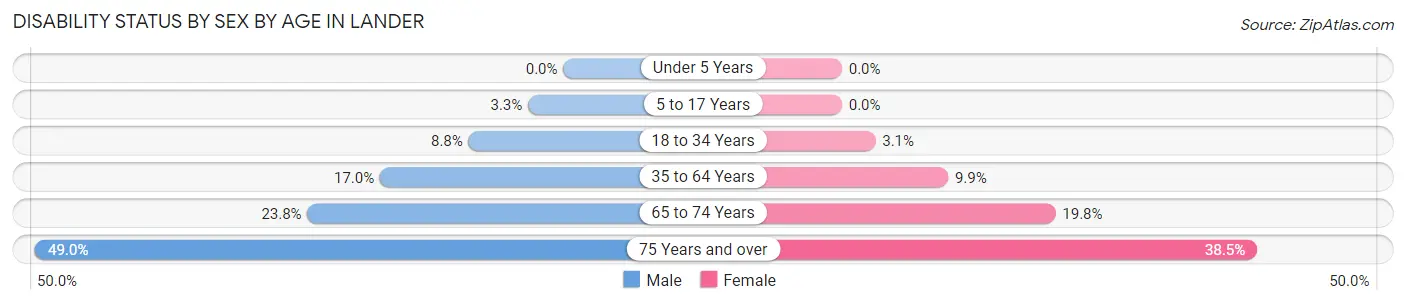
| Age Bracket | Male | Female |
| Under 5 Years | 0 (0.0%) | 0 (0.0%) |
| 5 to 17 Years | 22 (3.3%) | 0 (0.0%) |
| 18 to 34 Years | 62 (8.8%) | 18 (3.1%) |
| 35 to 64 Years | 242 (17.0%) | 130 (9.9%) |
| 65 to 74 Years | 76 (23.7%) | 87 (19.8%) |
| 75 Years and over | 126 (49.0%) | 111 (38.5%) |
Disability Class by Sex by Age in Lander
Disability Class: Hearing Difficulty
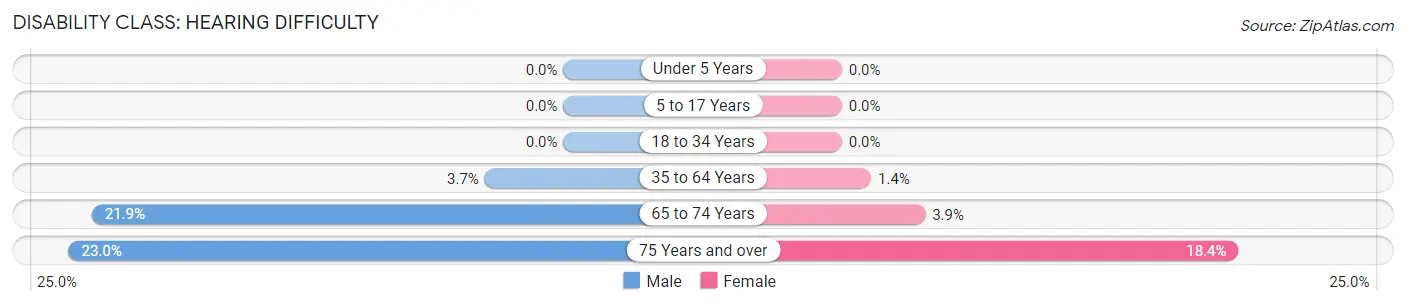
| Age Bracket | Male | Female |
| Under 5 Years | 0 (0.0%) | 0 (0.0%) |
| 5 to 17 Years | 0 (0.0%) | 0 (0.0%) |
| 18 to 34 Years | 0 (0.0%) | 0 (0.0%) |
| 35 to 64 Years | 52 (3.6%) | 18 (1.4%) |
| 65 to 74 Years | 70 (21.9%) | 17 (3.9%) |
| 75 Years and over | 59 (23.0%) | 53 (18.4%) |
Disability Class: Vision Difficulty
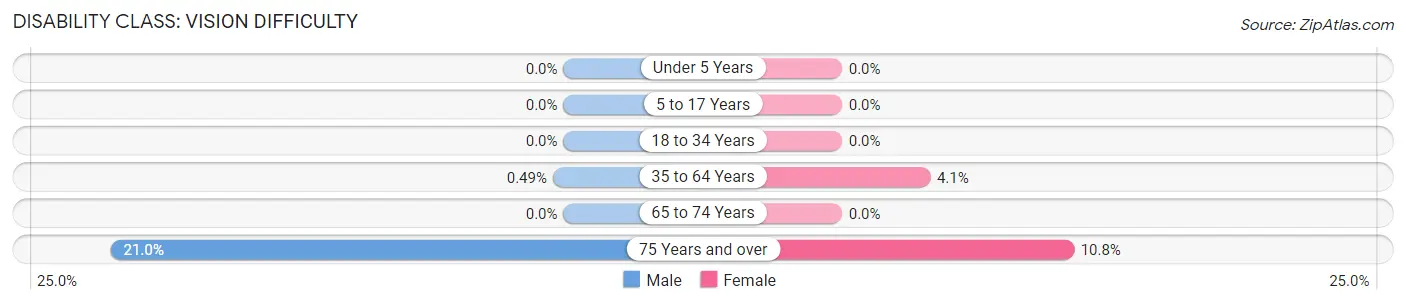
| Age Bracket | Male | Female |
| Under 5 Years | 0 (0.0%) | 0 (0.0%) |
| 5 to 17 Years | 0 (0.0%) | 0 (0.0%) |
| 18 to 34 Years | 0 (0.0%) | 0 (0.0%) |
| 35 to 64 Years | 7 (0.5%) | 54 (4.1%) |
| 65 to 74 Years | 0 (0.0%) | 0 (0.0%) |
| 75 Years and over | 54 (21.0%) | 31 (10.8%) |
Disability Class: Cognitive Difficulty
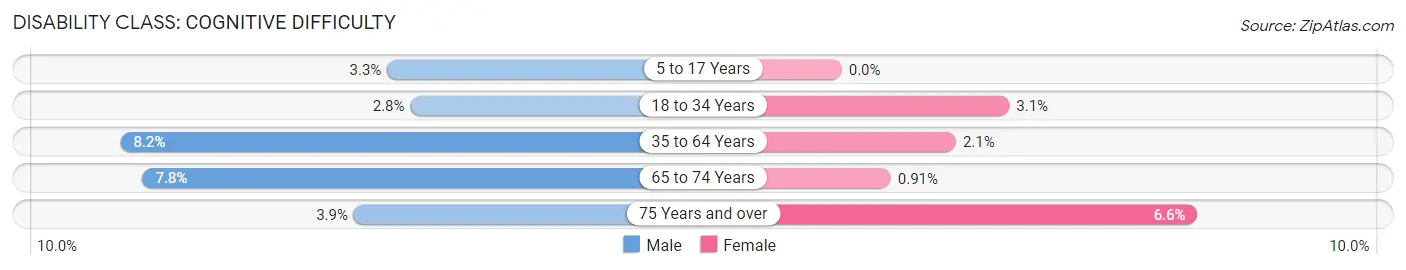
| Age Bracket | Male | Female |
| 5 to 17 Years | 22 (3.3%) | 0 (0.0%) |
| 18 to 34 Years | 20 (2.8%) | 18 (3.1%) |
| 35 to 64 Years | 117 (8.2%) | 28 (2.1%) |
| 65 to 74 Years | 25 (7.8%) | 4 (0.9%) |
| 75 Years and over | 10 (3.9%) | 19 (6.6%) |
Disability Class: Ambulatory Difficulty
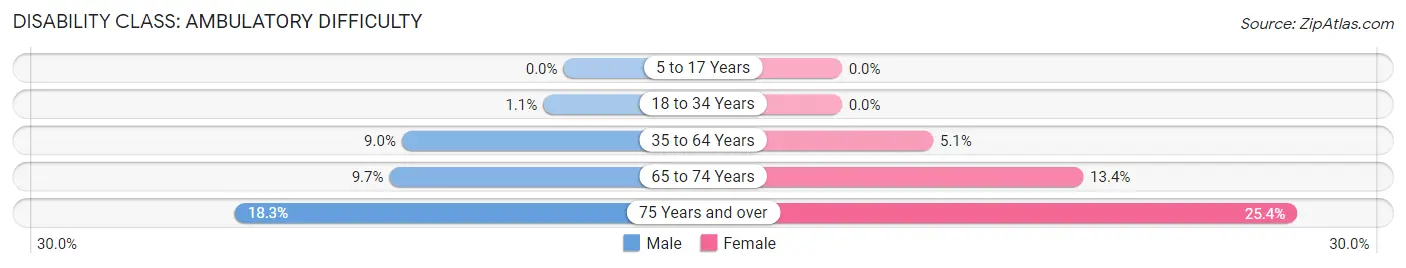
| Age Bracket | Male | Female |
| 5 to 17 Years | 0 (0.0%) | 0 (0.0%) |
| 18 to 34 Years | 8 (1.1%) | 0 (0.0%) |
| 35 to 64 Years | 128 (9.0%) | 67 (5.1%) |
| 65 to 74 Years | 31 (9.7%) | 59 (13.4%) |
| 75 Years and over | 47 (18.3%) | 73 (25.4%) |
Disability Class: Self-Care Difficulty
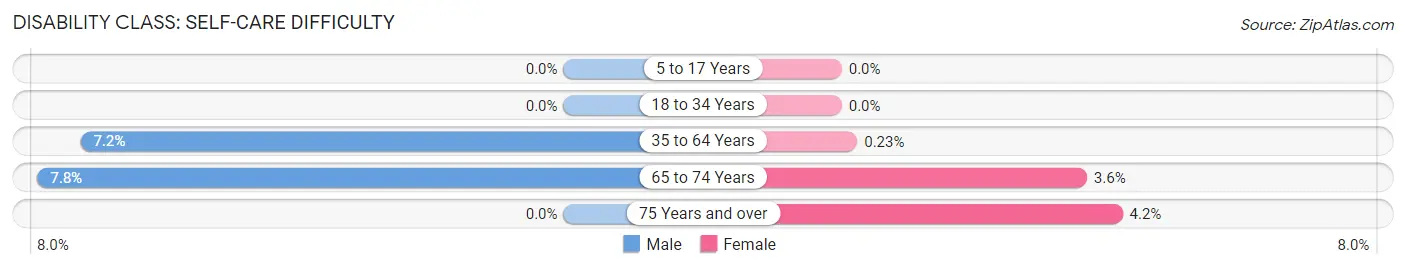
| Age Bracket | Male | Female |
| 5 to 17 Years | 0 (0.0%) | 0 (0.0%) |
| 18 to 34 Years | 0 (0.0%) | 0 (0.0%) |
| 35 to 64 Years | 102 (7.2%) | 3 (0.2%) |
| 65 to 74 Years | 25 (7.8%) | 16 (3.6%) |
| 75 Years and over | 0 (0.0%) | 12 (4.2%) |
Technology Access in Lander
Computing Device Access in Lander
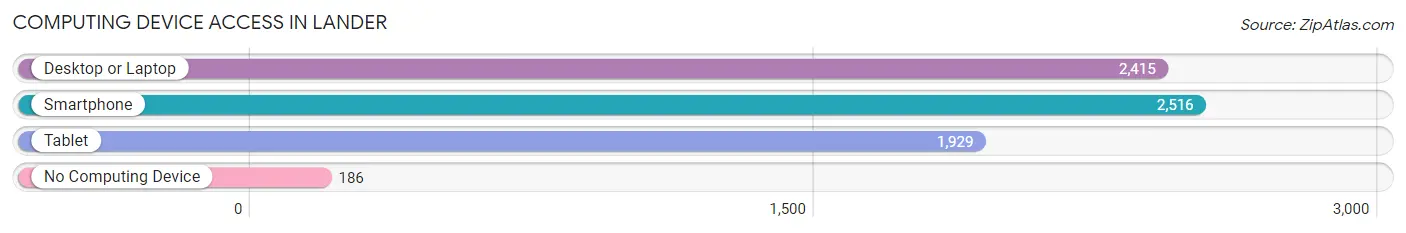
| Device Type | # Households | % Households |
| Desktop or Laptop | 2,415 | 81.3% |
| Smartphone | 2,516 | 84.7% |
| Tablet | 1,929 | 65.0% |
| No Computing Device | 186 | 6.3% |
| Total | 2,969 | 100.0% |
Internet Access in Lander
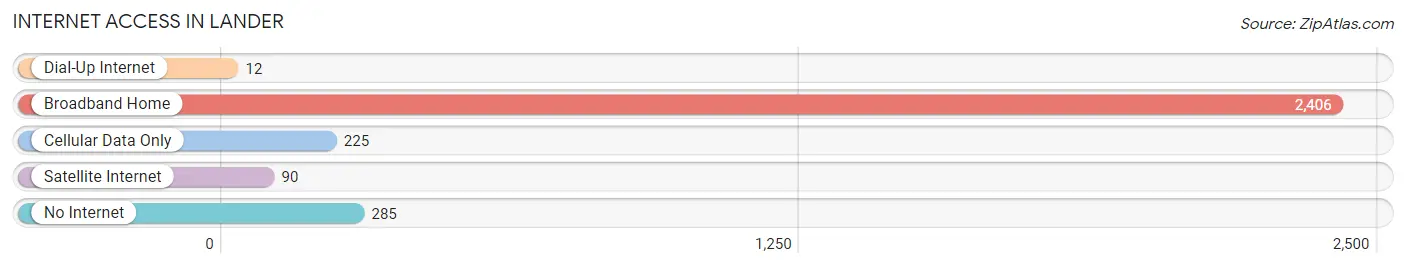
| Internet Type | # Households | % Households |
| Dial-Up Internet | 12 | 0.4% |
| Broadband Home | 2,406 | 81.0% |
| Cellular Data Only | 225 | 7.6% |
| Satellite Internet | 90 | 3.0% |
| No Internet | 285 | 9.6% |
| Total | 2,969 | 100.0% |
Lander Summary
Lander, Wyoming is a small city located in Fremont County in the central part of the state. It is the county seat and the largest city in the county. The city was founded in 1875 and named after transcontinental explorer Frederick W. Lander. The city is located at the confluence of the Popo Agie and Wind Rivers, and is surrounded by the Wind River Indian Reservation.
History
The area around Lander was first inhabited by the Shoshone and Arapaho tribes. The first white settlers arrived in the area in the late 1860s, and the town was officially founded in 1875. The town was named after Frederick W. Lander, a transcontinental explorer who had surveyed the area in the 1850s.
In the late 19th century, Lander was a bustling center of commerce and transportation. The town was a major stop on the Union Pacific Railroad, and the first transcontinental telephone line was completed in Lander in 1881. The town also served as a supply center for miners and ranchers in the area.
In the early 20th century, Lander experienced a period of growth and prosperity. The town was home to several businesses, including a bank, a newspaper, a hotel, and a movie theater. The town also had a thriving agricultural industry, with several farms and ranches in the area.
Geography
Lander is located in central Wyoming, in Fremont County. The city is situated at the confluence of the Popo Agie and Wind Rivers, and is surrounded by the Wind River Indian Reservation. The city is located at an elevation of 5,845 feet above sea level.
The city has a total area of 4.2 square miles, of which 4.1 square miles is land and 0.1 square miles is water. The city is located in a semi-arid climate, with hot summers and cold winters. The average annual precipitation is 11.5 inches.
Economy
Lander’s economy is largely based on tourism, agriculture, and government services. The city is home to several tourist attractions, including the Wind River Indian Reservation, Sinks Canyon State Park, and the Lander Valley Historic District.
Agriculture is also an important part of the local economy. The area is home to several farms and ranches, and the city is a major producer of hay, wheat, and other crops.
The city is also home to several government services, including the Bureau of Indian Affairs, the U.S. Forest Service, and the U.S. Fish and Wildlife Service.
Demographics
As of the 2010 census, the population of Lander was 7,487. The racial makeup of the city was 87.3% White, 0.7% African American, 8.2% Native American, 0.3% Asian, 0.1% Pacific Islander, 0.7% from other races, and 2.7% from two or more races. Hispanic or Latino of any race were 3.3% of the population.
The median household income in Lander was $41,944, and the median family income was $50,944. The per capita income for the city was $20,944. About 11.3% of families and 14.2% of the population were below the poverty line, including 17.3% of those under age 18 and 8.2% of those age 65 or over.
Common Questions
What is Per Capita Income in Lander?
Per Capita income in Lander is $34,038.
What is the Median Family Income in Lander?
Median Family Income in Lander is $90,915.
What is the Median Household income in Lander?
Median Household Income in Lander is $62,958.
What is Income or Wage Gap in Lander?
Income or Wage Gap in Lander is 46.3%.
Women in Lander earn 53.7 cents for every dollar earned by a man.
What is Inequality or Gini Index in Lander?
Inequality or Gini Index in Lander is 0.43.
What is the Total Population of Lander?
Total Population of Lander is 7,561.
What is the Total Male Population of Lander?
Total Male Population of Lander is 3,663.
What is the Total Female Population of Lander?
Total Female Population of Lander is 3,898.
What is the Ratio of Males per 100 Females in Lander?
There are 93.97 Males per 100 Females in Lander.
What is the Ratio of Females per 100 Males in Lander?
There are 106.42 Females per 100 Males in Lander.
What is the Median Population Age in Lander?
Median Population Age in Lander is 37.1 Years.
What is the Average Family Size in Lander
Average Family Size in Lander is 3.3 People.
What is the Average Household Size in Lander
Average Household Size in Lander is 2.5 People.
How Large is the Labor Force in Lander?
There are 3,627 People in the Labor Forcein in Lander.
What is the Percentage of People in the Labor Force in Lander?
62.7% of People are in the Labor Force in Lander.
What is the Unemployment Rate in Lander?
Unemployment Rate in Lander is 4.3%.