Torrington, WY Map & Demographics
Torrington Map
Torrington Overview
$30,777
PER CAPITA INCOME
$72,901
AVG FAMILY INCOME
$55,434
AVG HOUSEHOLD INCOME
35.2%
WAGE / INCOME GAP [ % ]
64.8¢/ $1
WAGE / INCOME GAP [ $ ]
0.46
INEQUALITY / GINI INDEX
6,161
TOTAL POPULATION
3,146
MALE POPULATION
3,015
FEMALE POPULATION
104.34
MALES / 100 FEMALES
95.84
FEMALES / 100 MALES
44.0
MEDIAN AGE
3.0
AVG FAMILY SIZE
2.2
AVG HOUSEHOLD SIZE
2,718
LABOR FORCE [ PEOPLE ]
52.6%
PERCENT IN LABOR FORCE
4.9%
UNEMPLOYMENT RATE
Torrington Zip Codes
Torrington Area Codes
Income in Torrington
Income Overview in Torrington
Per Capita Income in Torrington is $30,777, while median incomes of families and households are $72,901 and $55,434 respectively.
| Characteristic | Number | Measure |
| Per Capita Income | 6,161 | $30,777 |
| Median Family Income | 1,344 | $72,901 |
| Mean Family Income | 1,344 | $88,039 |
| Median Household Income | 2,373 | $55,434 |
| Mean Household Income | 2,373 | $72,068 |
| Income Deficit | 1,344 | $0 |
| Wage / Income Gap (%) | 6,161 | 35.23% |
| Wage / Income Gap ($) | 6,161 | 64.77¢ per $1 |
| Gini / Inequality Index | 6,161 | 0.46 |
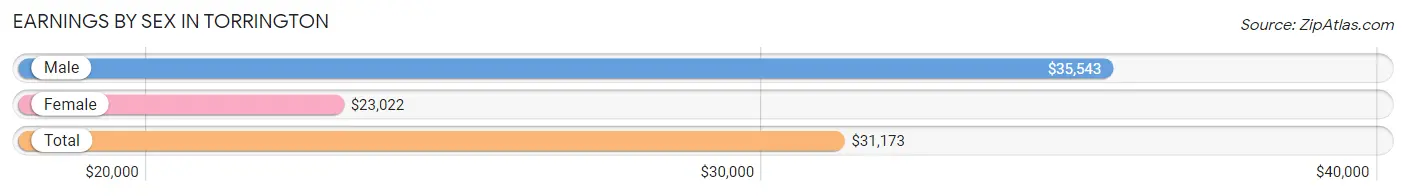
Earnings by Sex in Torrington
Average Earnings in Torrington are $31,173, $35,543 for men and $23,022 for women, a difference of 35.2%.
| Sex | Number | Average Earnings |
| Male | 1,920 (57.5%) | $35,543 |
| Female | 1,420 (42.5%) | $23,022 |
| Total | 3,340 (100.0%) | $31,173 |
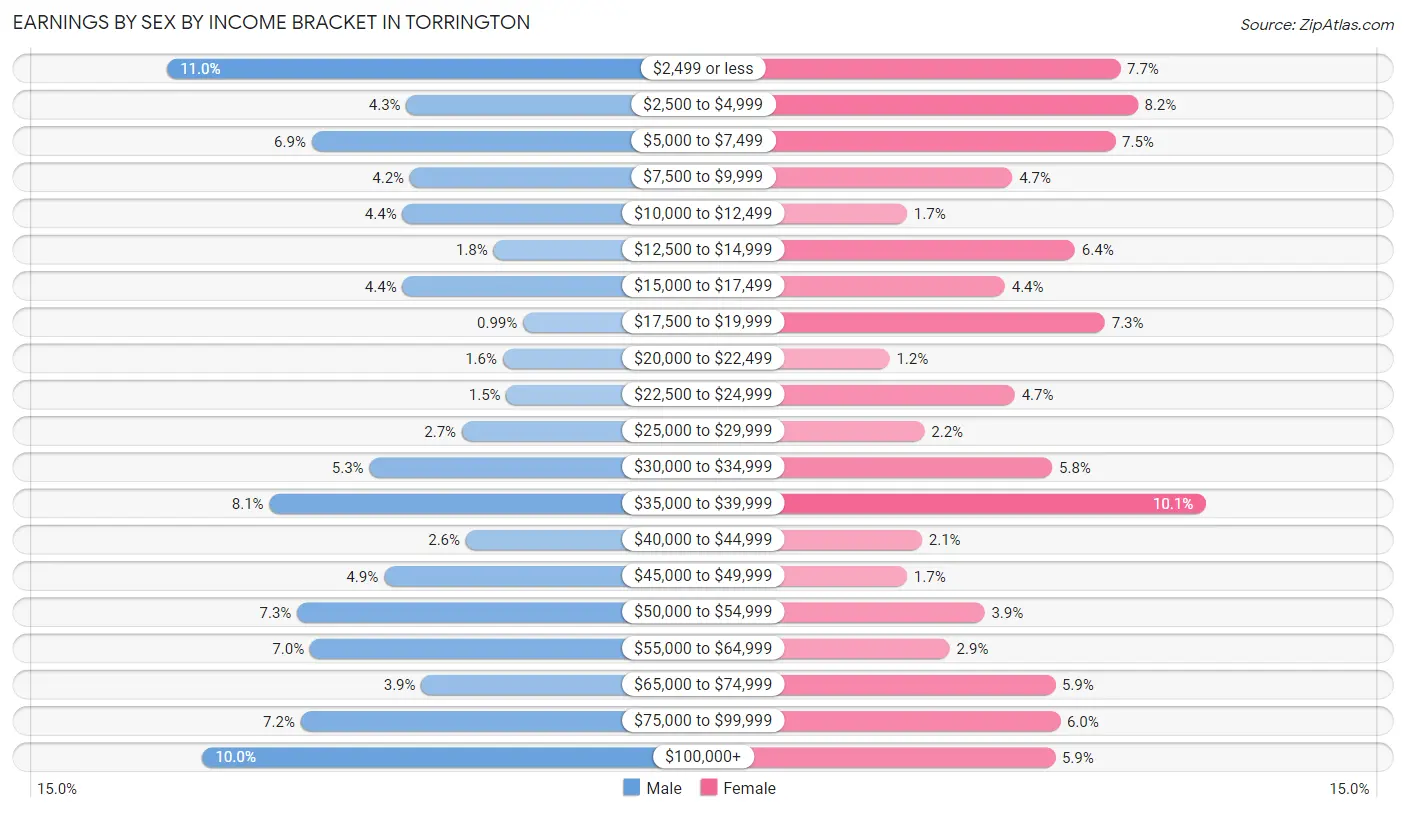
Earnings by Sex by Income Bracket in Torrington
The most common earnings brackets in Torrington are $2,499 or less for men (211 | 11.0%) and $35,000 to $39,999 for women (143 | 10.1%).
| Income | Male | Female |
| $2,499 or less | 211 (11.0%) | 109 (7.7%) |
| $2,500 to $4,999 | 82 (4.3%) | 116 (8.2%) |
| $5,000 to $7,499 | 133 (6.9%) | 107 (7.5%) |
| $7,500 to $9,999 | 80 (4.2%) | 66 (4.6%) |
| $10,000 to $12,499 | 84 (4.4%) | 24 (1.7%) |
| $12,500 to $14,999 | 35 (1.8%) | 91 (6.4%) |
| $15,000 to $17,499 | 84 (4.4%) | 63 (4.4%) |
| $17,500 to $19,999 | 19 (1.0%) | 103 (7.2%) |
| $20,000 to $22,499 | 30 (1.6%) | 17 (1.2%) |
| $22,500 to $24,999 | 28 (1.5%) | 67 (4.7%) |
| $25,000 to $29,999 | 52 (2.7%) | 31 (2.2%) |
| $30,000 to $34,999 | 102 (5.3%) | 82 (5.8%) |
| $35,000 to $39,999 | 156 (8.1%) | 143 (10.1%) |
| $40,000 to $44,999 | 50 (2.6%) | 30 (2.1%) |
| $45,000 to $49,999 | 94 (4.9%) | 24 (1.7%) |
| $50,000 to $54,999 | 141 (7.3%) | 55 (3.9%) |
| $55,000 to $64,999 | 134 (7.0%) | 41 (2.9%) |
| $65,000 to $74,999 | 74 (3.8%) | 83 (5.9%) |
| $75,000 to $99,999 | 139 (7.2%) | 85 (6.0%) |
| $100,000+ | 192 (10.0%) | 83 (5.9%) |
| Total | 1,920 (100.0%) | 1,420 (100.0%) |
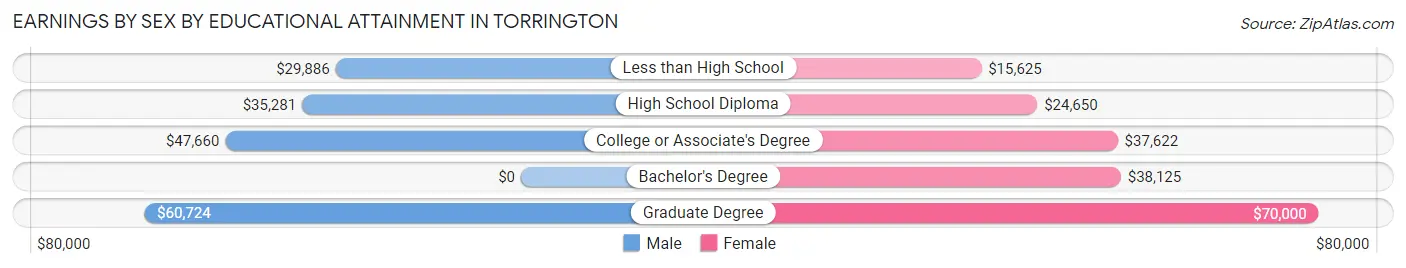
Earnings by Sex by Educational Attainment in Torrington
Average earnings in Torrington are $37,930 for men and $35,956 for women, a difference of 5.2%. Men with an educational attainment of graduate degree enjoy the highest average annual earnings of $60,724, while those with less than high school education earn the least with $29,886. Women with an educational attainment of graduate degree earn the most with the average annual earnings of $70,000, while those with less than high school education have the smallest earnings of $15,625.
| Educational Attainment | Male Income | Female Income |
| Less than High School | $29,886 | $15,625 |
| High School Diploma | $35,281 | $24,650 |
| College or Associate's Degree | $47,660 | $37,622 |
| Bachelor's Degree | - | - |
| Graduate Degree | $60,724 | $70,000 |
| Total | $37,930 | $35,956 |
Family Income in Torrington
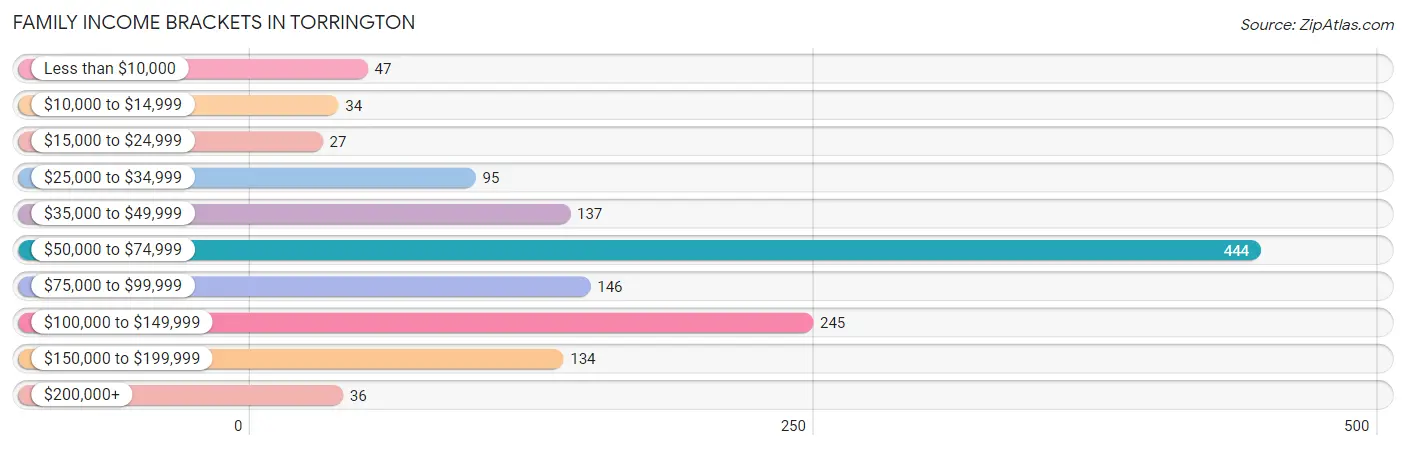
Family Income Brackets in Torrington
According to the Torrington family income data, there are 444 families falling into the $50,000 to $74,999 income range, which is the most common income bracket and makes up 33.0% of all families. Conversely, the $15,000 to $24,999 income bracket is the least frequent group with only 27 families (2.0%) belonging to this category.
| Income Bracket | # Families | % Families |
| Less than $10,000 | 47 | 3.5% |
| $10,000 to $14,999 | 34 | 2.5% |
| $15,000 to $24,999 | 27 | 2.0% |
| $25,000 to $34,999 | 95 | 7.1% |
| $35,000 to $49,999 | 137 | 10.2% |
| $50,000 to $74,999 | 444 | 33.0% |
| $75,000 to $99,999 | 146 | 10.9% |
| $100,000 to $149,999 | 245 | 18.2% |
| $150,000 to $199,999 | 134 | 10.0% |
| $200,000+ | 36 | 2.7% |
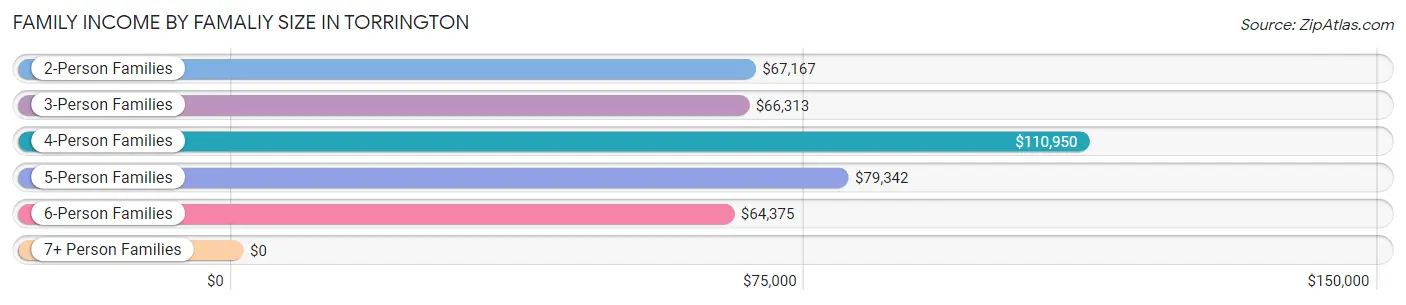
Family Income by Famaliy Size in Torrington
4-person families (174 | 13.0%) account for the highest median family income in Torrington with $110,950 per family, while 2-person families (694 | 51.6%) have the highest median income of $33,584 per family member.
| Income Bracket | # Families | Median Income |
| 2-Person Families | 694 (51.6%) | $67,167 |
| 3-Person Families | 333 (24.8%) | $66,313 |
| 4-Person Families | 174 (13.0%) | $110,950 |
| 5-Person Families | 80 (5.9%) | $79,342 |
| 6-Person Families | 63 (4.7%) | $64,375 |
| 7+ Person Families | 0 (0.0%) | $0 |
| Total | 1,344 (100.0%) | $72,901 |
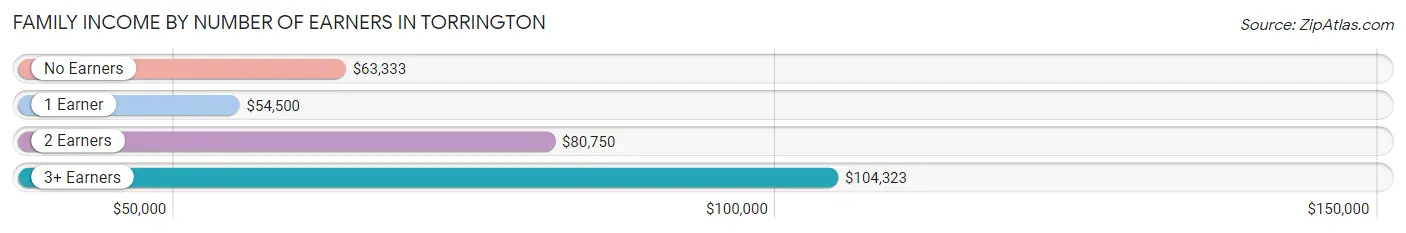
Family Income by Number of Earners in Torrington
The median family income in Torrington is $72,901, with families comprising 3+ earners (149) having the highest median family income of $104,323, while families with 1 earner (470) have the lowest median family income of $54,500, accounting for 11.1% and 35.0% of families, respectively.
| Number of Earners | # Families | Median Income |
| No Earners | 168 (12.5%) | $63,333 |
| 1 Earner | 470 (35.0%) | $54,500 |
| 2 Earners | 557 (41.4%) | $80,750 |
| 3+ Earners | 149 (11.1%) | $104,323 |
| Total | 1,344 (100.0%) | $72,901 |
Household Income in Torrington
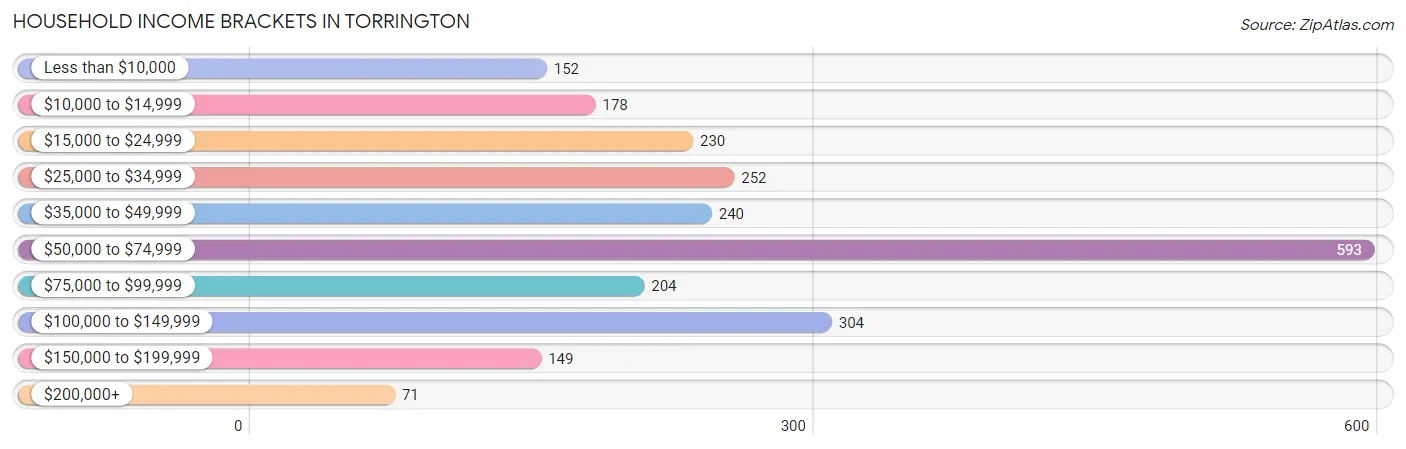
Household Income Brackets in Torrington
With 593 households falling in the category, the $50,000 to $74,999 income range is the most frequent in Torrington, accounting for 25.0% of all households. In contrast, only 71 households (3.0%) fall into the $200,000+ income bracket, making it the least populous group.
| Income Bracket | # Households | % Households |
| Less than $10,000 | 152 | 6.4% |
| $10,000 to $14,999 | 178 | 7.5% |
| $15,000 to $24,999 | 230 | 9.7% |
| $25,000 to $34,999 | 252 | 10.6% |
| $35,000 to $49,999 | 240 | 10.1% |
| $50,000 to $74,999 | 593 | 25.0% |
| $75,000 to $99,999 | 204 | 8.6% |
| $100,000 to $149,999 | 304 | 12.8% |
| $150,000 to $199,999 | 149 | 6.3% |
| $200,000+ | 71 | 3.0% |
Household Income by Householder Age in Torrington
The median household income in Torrington is $55,434, with the highest median household income of $74,103 found in the 25 to 44 years age bracket for the primary householder. A total of 516 households (21.7%) fall into this category. Meanwhile, the 15 to 24 years age bracket for the primary householder has the lowest median household income of $0, with 100 households (4.2%) in this group.
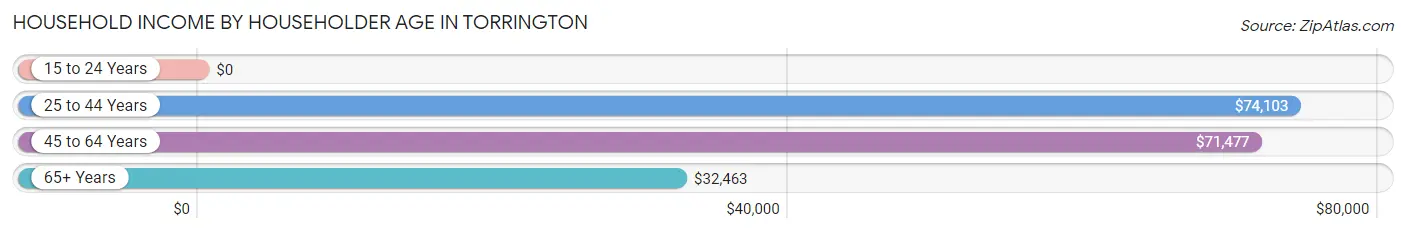
| Income Bracket | # Households | Median Income |
| 15 to 24 Years | 100 (4.2%) | $0 |
| 25 to 44 Years | 516 (21.7%) | $74,103 |
| 45 to 64 Years | 831 (35.0%) | $71,477 |
| 65+ Years | 926 (39.0%) | $32,463 |
| Total | 2,373 (100.0%) | $55,434 |
Poverty in Torrington
Income Below Poverty by Sex and Age in Torrington
With 9.3% poverty level for males and 13.8% for females among the residents of Torrington, 12 to 14 year old males and 18 to 24 year old females are the most vulnerable to poverty, with 41 males (34.2%) and 82 females (31.8%) in their respective age groups living below the poverty level.
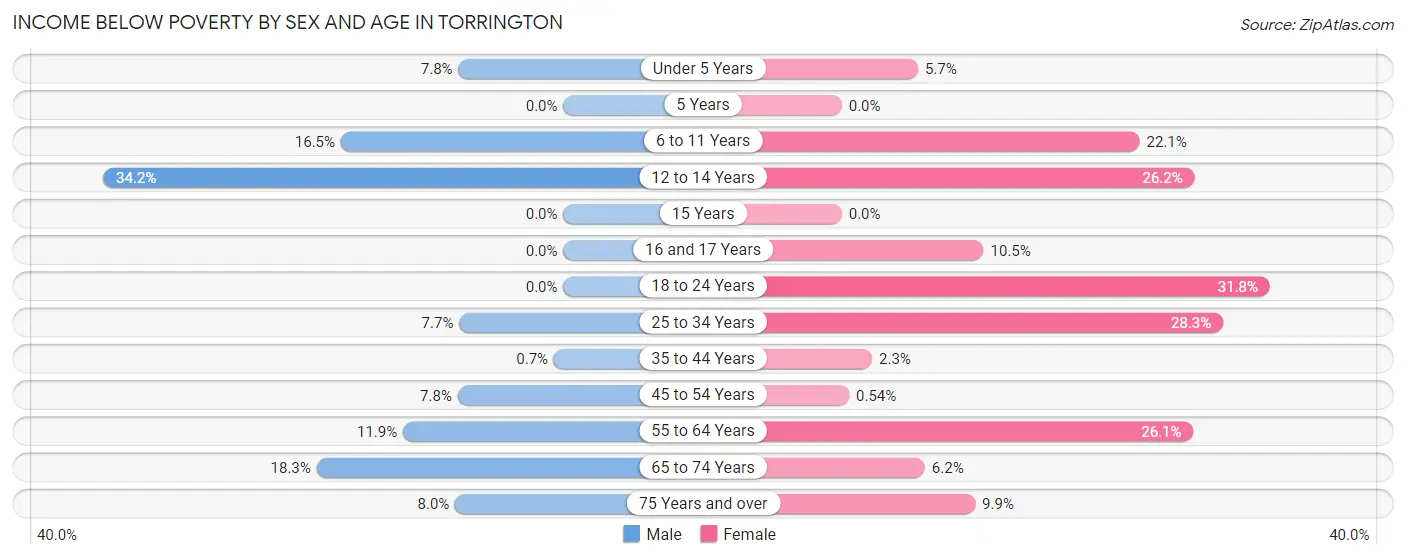
| Age Bracket | Male | Female |
| Under 5 Years | 19 (7.8%) | 6 (5.7%) |
| 5 Years | 0 (0.0%) | 0 (0.0%) |
| 6 to 11 Years | 19 (16.5%) | 21 (22.1%) |
| 12 to 14 Years | 41 (34.2%) | 22 (26.2%) |
| 15 Years | 0 (0.0%) | 0 (0.0%) |
| 16 and 17 Years | 0 (0.0%) | 12 (10.5%) |
| 18 to 24 Years | 0 (0.0%) | 82 (31.8%) |
| 25 to 34 Years | 18 (7.7%) | 77 (28.3%) |
| 35 to 44 Years | 2 (0.7%) | 6 (2.2%) |
| 45 to 54 Years | 33 (7.8%) | 2 (0.5%) |
| 55 to 64 Years | 35 (11.9%) | 107 (26.1%) |
| 65 to 74 Years | 48 (18.3%) | 20 (6.2%) |
| 75 Years and over | 20 (8.0%) | 39 (9.9%) |
| Total | 235 (9.3%) | 394 (13.8%) |
Income Above Poverty by Sex and Age in Torrington
According to the poverty statistics in Torrington, males aged 15 years and females aged 5 years are the age groups that are most secure financially, with 100.0% of males and 100.0% of females in these age groups living above the poverty line.
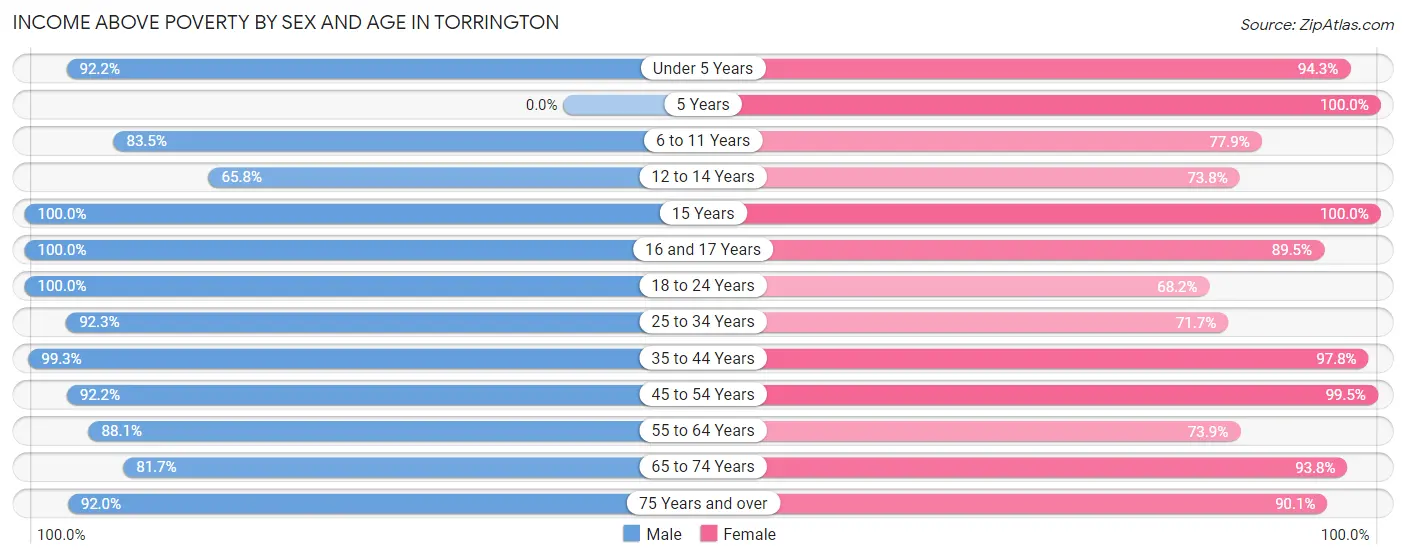
| Age Bracket | Male | Female |
| Under 5 Years | 225 (92.2%) | 100 (94.3%) |
| 5 Years | 0 (0.0%) | 148 (100.0%) |
| 6 to 11 Years | 96 (83.5%) | 74 (77.9%) |
| 12 to 14 Years | 79 (65.8%) | 62 (73.8%) |
| 15 Years | 8 (100.0%) | 25 (100.0%) |
| 16 and 17 Years | 85 (100.0%) | 102 (89.5%) |
| 18 to 24 Years | 206 (100.0%) | 176 (68.2%) |
| 25 to 34 Years | 215 (92.3%) | 195 (71.7%) |
| 35 to 44 Years | 282 (99.3%) | 261 (97.8%) |
| 45 to 54 Years | 388 (92.2%) | 365 (99.5%) |
| 55 to 64 Years | 259 (88.1%) | 303 (73.9%) |
| 65 to 74 Years | 214 (81.7%) | 304 (93.8%) |
| 75 Years and over | 229 (92.0%) | 355 (90.1%) |
| Total | 2,286 (90.7%) | 2,470 (86.2%) |
Income Below Poverty Among Married-Couple Families in Torrington
The poverty statistics for married-couple families in Torrington show that 2.5% or 25 of the total 1,006 families live below the poverty line. Families with 3 or 4 children have the highest poverty rate of 10.0%, comprising of 8 families. On the other hand, families with 1 or 2 children have the lowest poverty rate of 0.0%, which includes 0 families.
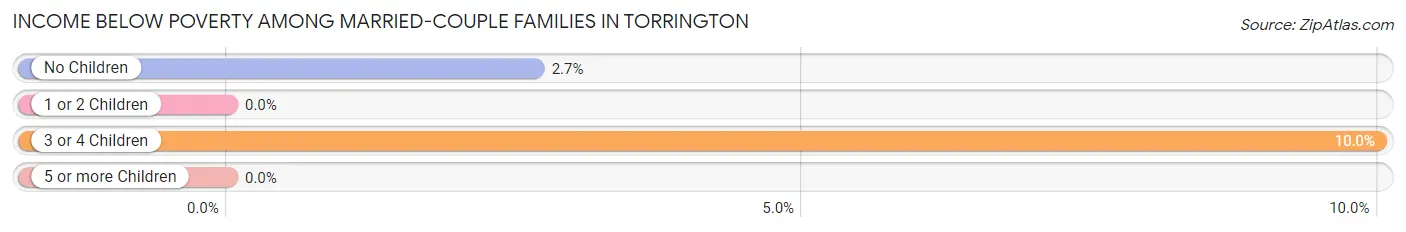
| Children | Above Poverty | Below Poverty |
| No Children | 619 (97.3%) | 17 (2.7%) |
| 1 or 2 Children | 290 (100.0%) | 0 (0.0%) |
| 3 or 4 Children | 72 (90.0%) | 8 (10.0%) |
| 5 or more Children | 0 (0.0%) | 0 (0.0%) |
| Total | 981 (97.5%) | 25 (2.5%) |
Income Below Poverty Among Single-Parent Households in Torrington
According to the poverty data in Torrington, 16.2% or 21 single-father households and 25.0% or 52 single-mother households are living below the poverty line. Among single-father households, those with 1 or 2 children have the highest poverty rate, with 21 households (36.2%) experiencing poverty. Likewise, among single-mother households, those with 1 or 2 children have the highest poverty rate, with 52 households (57.1%) falling below the poverty line.
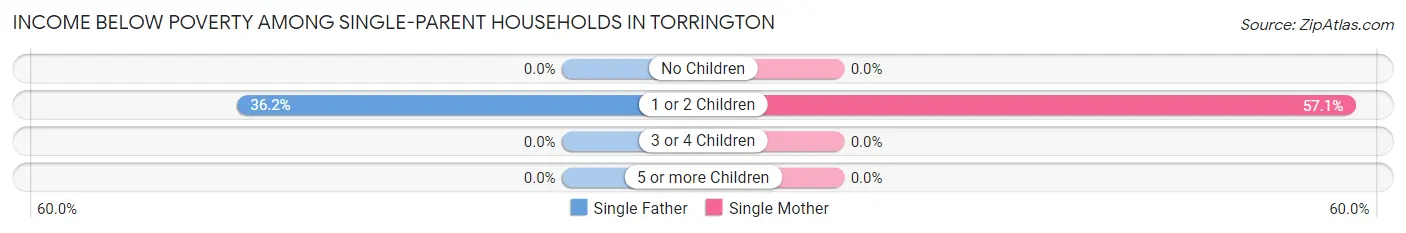
| Children | Single Father | Single Mother |
| No Children | 0 (0.0%) | 0 (0.0%) |
| 1 or 2 Children | 21 (36.2%) | 52 (57.1%) |
| 3 or 4 Children | 0 (0.0%) | 0 (0.0%) |
| 5 or more Children | 0 (0.0%) | 0 (0.0%) |
| Total | 21 (16.2%) | 52 (25.0%) |
Income Below Poverty Among Married-Couple vs Single-Parent Households in Torrington
The poverty data for Torrington shows that 25 of the married-couple family households (2.5%) and 73 of the single-parent households (21.6%) are living below the poverty level. Within the married-couple family households, those with 3 or 4 children have the highest poverty rate, with 8 households (10.0%) falling below the poverty line. Among the single-parent households, those with 1 or 2 children have the highest poverty rate, with 73 household (49.0%) living below poverty.
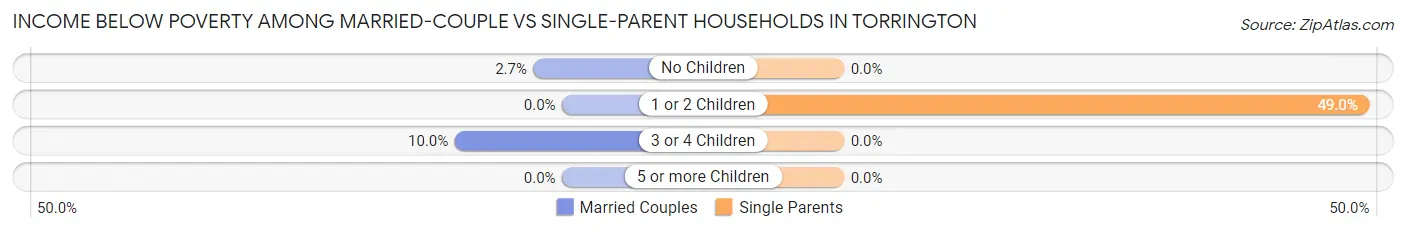
| Children | Married-Couple Families | Single-Parent Households |
| No Children | 17 (2.7%) | 0 (0.0%) |
| 1 or 2 Children | 0 (0.0%) | 73 (49.0%) |
| 3 or 4 Children | 8 (10.0%) | 0 (0.0%) |
| 5 or more Children | 0 (0.0%) | 0 (0.0%) |
| Total | 25 (2.5%) | 73 (21.6%) |
Race in Torrington
The most populous races in Torrington are White / Caucasian (5,301 | 86.0%), Hispanic or Latino (1,021 | 16.6%), and Two or more Races (514 | 8.3%).
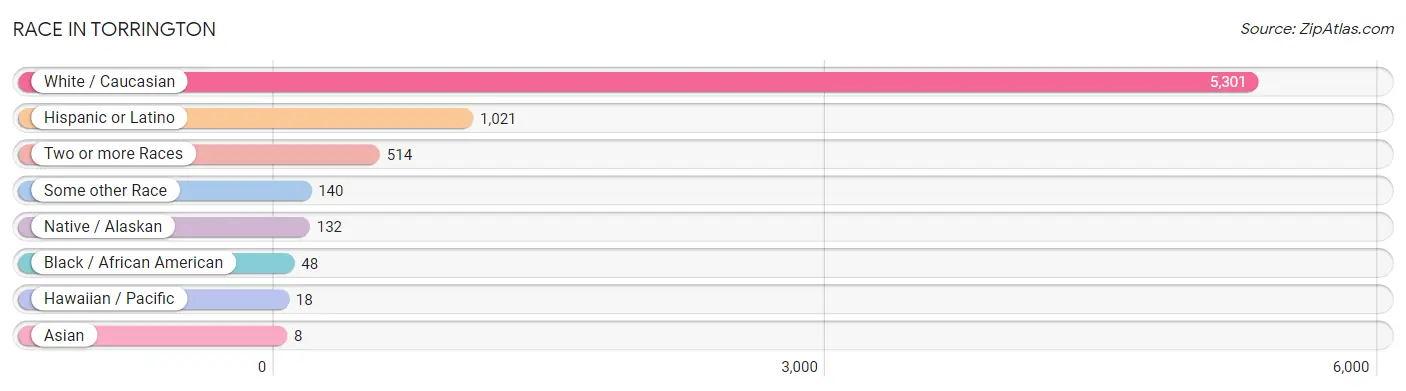
| Race | # Population | % Population |
| Asian | 8 | 0.1% |
| Black / African American | 48 | 0.8% |
| Hawaiian / Pacific | 18 | 0.3% |
| Hispanic or Latino | 1,021 | 16.6% |
| Native / Alaskan | 132 | 2.1% |
| White / Caucasian | 5,301 | 86.0% |
| Two or more Races | 514 | 8.3% |
| Some other Race | 140 | 2.3% |
| Total | 6,161 | 100.0% |
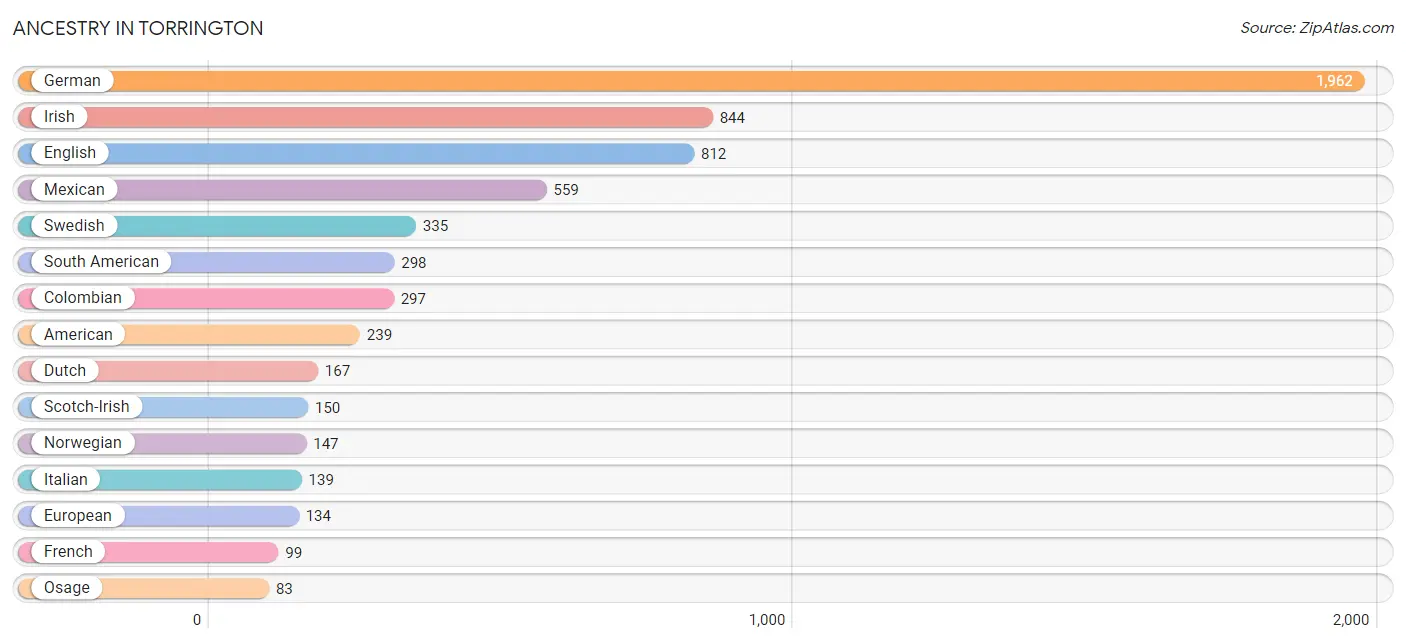
Ancestry in Torrington
The most populous ancestries reported in Torrington are German (1,962 | 31.9%), Irish (844 | 13.7%), English (812 | 13.2%), Mexican (559 | 9.1%), and Swedish (335 | 5.4%), together accounting for 73.2% of all Torrington residents.
| Ancestry | # Population | % Population |
| Alaska Native | 2 | 0.0% |
| American | 239 | 3.9% |
| Apache | 12 | 0.2% |
| Arab | 3 | 0.1% |
| Arapaho | 11 | 0.2% |
| Austrian | 17 | 0.3% |
| Basque | 1 | 0.0% |
| Bhutanese | 8 | 0.1% |
| Blackfeet | 6 | 0.1% |
| Brazilian | 3 | 0.1% |
| British | 5 | 0.1% |
| Bulgarian | 2 | 0.0% |
| Canadian | 13 | 0.2% |
| Central American Indian | 4 | 0.1% |
| Cherokee | 22 | 0.4% |
| Colombian | 297 | 4.8% |
| Czech | 15 | 0.2% |
| Czechoslovakian | 22 | 0.4% |
| Danish | 31 | 0.5% |
| Dutch | 167 | 2.7% |
| Eastern European | 4 | 0.1% |
| Ecuadorian | 1 | 0.0% |
| English | 812 | 13.2% |
| European | 134 | 2.2% |
| French | 99 | 1.6% |
| French Canadian | 9 | 0.2% |
| German | 1,962 | 31.9% |
| Greek | 10 | 0.2% |
| Hungarian | 20 | 0.3% |
| Irish | 844 | 13.7% |
| Italian | 139 | 2.3% |
| Korean | 22 | 0.4% |
| Mexican | 559 | 9.1% |
| Mexican American Indian | 4 | 0.1% |
| Native Hawaiian | 13 | 0.2% |
| Northern European | 11 | 0.2% |
| Norwegian | 147 | 2.4% |
| Osage | 83 | 1.3% |
| Polish | 35 | 0.6% |
| Potawatomi | 24 | 0.4% |
| Puerto Rican | 75 | 1.2% |
| Romanian | 5 | 0.1% |
| Russian | 21 | 0.3% |
| Scandinavian | 6 | 0.1% |
| Scotch-Irish | 150 | 2.4% |
| Scottish | 77 | 1.3% |
| Shoshone | 1 | 0.0% |
| Sioux | 6 | 0.1% |
| Slovak | 13 | 0.2% |
| South American | 298 | 4.8% |
| Spaniard | 33 | 0.5% |
| Spanish | 7 | 0.1% |
| Subsaharan African | 19 | 0.3% |
| Swedish | 335 | 5.4% |
| Swiss | 35 | 0.6% |
| Ugandan | 19 | 0.3% |
| Welsh | 6 | 0.1% | View All 57 Rows |
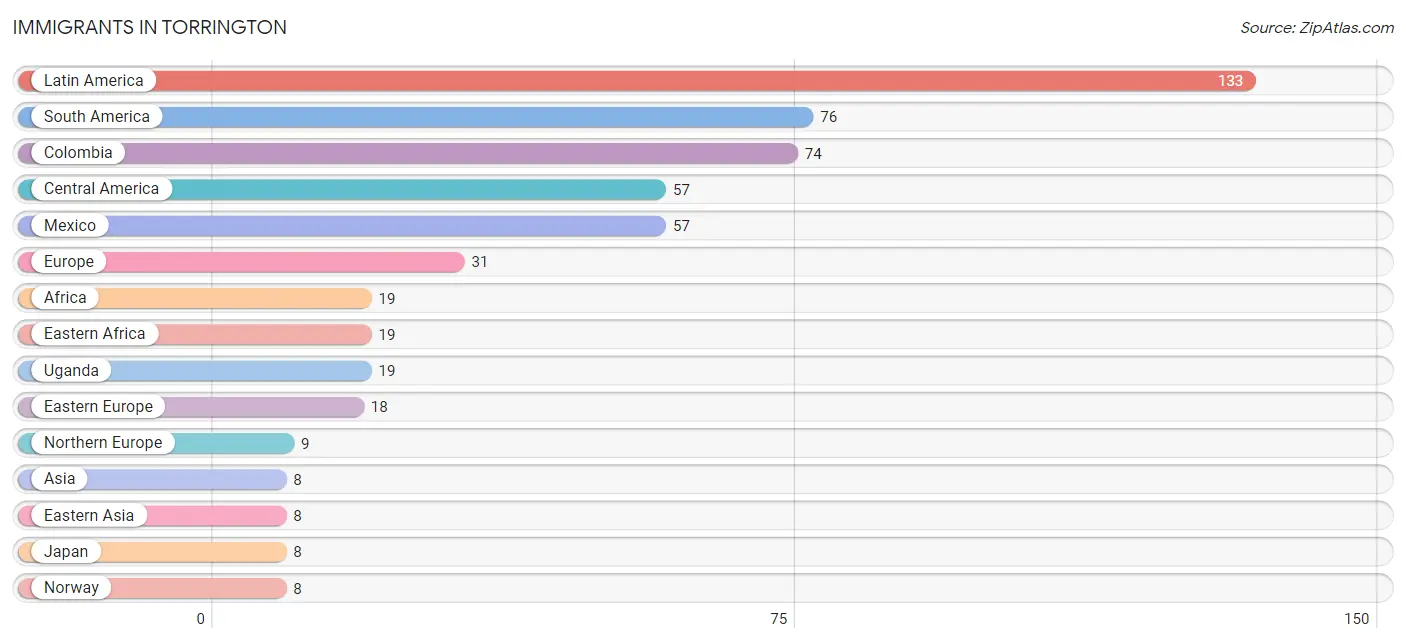
Immigrants in Torrington
The most numerous immigrant groups reported in Torrington came from Latin America (133 | 2.2%), South America (76 | 1.2%), Colombia (74 | 1.2%), Central America (57 | 0.9%), and Mexico (57 | 0.9%), together accounting for 6.5% of all Torrington residents.
| Immigration Origin | # Population | % Population |
| Africa | 19 | 0.3% |
| Asia | 8 | 0.1% |
| Bosnia and Herzegovina | 2 | 0.0% |
| Brazil | 2 | 0.0% |
| Bulgaria | 2 | 0.0% |
| Central America | 57 | 0.9% |
| Colombia | 74 | 1.2% |
| Eastern Africa | 19 | 0.3% |
| Eastern Asia | 8 | 0.1% |
| Eastern Europe | 18 | 0.3% |
| Europe | 31 | 0.5% |
| Japan | 8 | 0.1% |
| Latin America | 133 | 2.2% |
| Mexico | 57 | 0.9% |
| Northern Europe | 9 | 0.2% |
| Norway | 8 | 0.1% |
| Russia | 2 | 0.0% |
| South America | 76 | 1.2% |
| Southern Europe | 4 | 0.1% |
| Spain | 4 | 0.1% |
| Sweden | 1 | 0.0% |
| Uganda | 19 | 0.3% | View All 22 Rows |
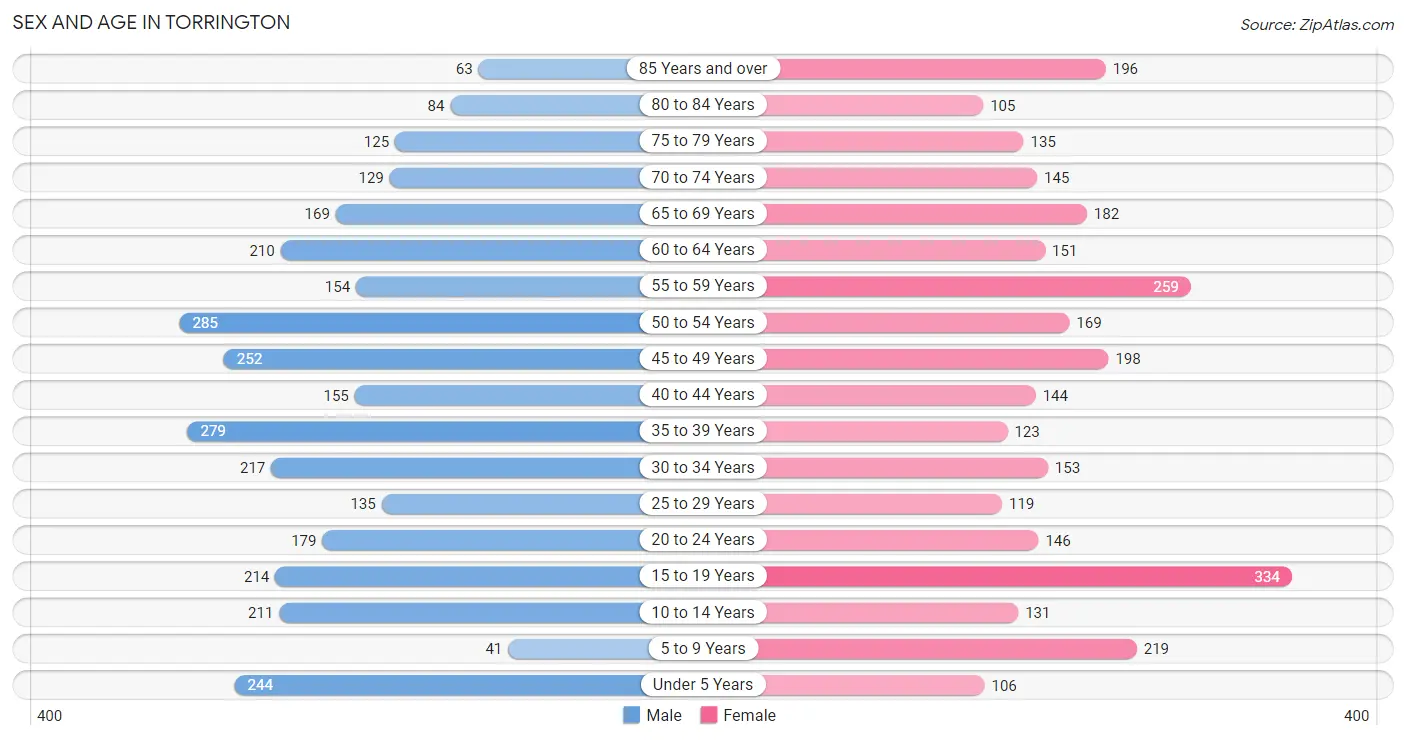
Sex and Age in Torrington
Sex and Age in Torrington
The most populous age groups in Torrington are 50 to 54 Years (285 | 9.1%) for men and 15 to 19 Years (334 | 11.1%) for women.
| Age Bracket | Male | Female |
| Under 5 Years | 244 (7.8%) | 106 (3.5%) |
| 5 to 9 Years | 41 (1.3%) | 219 (7.3%) |
| 10 to 14 Years | 211 (6.7%) | 131 (4.3%) |
| 15 to 19 Years | 214 (6.8%) | 334 (11.1%) |
| 20 to 24 Years | 179 (5.7%) | 146 (4.8%) |
| 25 to 29 Years | 135 (4.3%) | 119 (4.0%) |
| 30 to 34 Years | 217 (6.9%) | 153 (5.1%) |
| 35 to 39 Years | 279 (8.9%) | 123 (4.1%) |
| 40 to 44 Years | 155 (4.9%) | 144 (4.8%) |
| 45 to 49 Years | 252 (8.0%) | 198 (6.6%) |
| 50 to 54 Years | 285 (9.1%) | 169 (5.6%) |
| 55 to 59 Years | 154 (4.9%) | 259 (8.6%) |
| 60 to 64 Years | 210 (6.7%) | 151 (5.0%) |
| 65 to 69 Years | 169 (5.4%) | 182 (6.0%) |
| 70 to 74 Years | 129 (4.1%) | 145 (4.8%) |
| 75 to 79 Years | 125 (4.0%) | 135 (4.5%) |
| 80 to 84 Years | 84 (2.7%) | 105 (3.5%) |
| 85 Years and over | 63 (2.0%) | 196 (6.5%) |
| Total | 3,146 (100.0%) | 3,015 (100.0%) |
Families and Households in Torrington
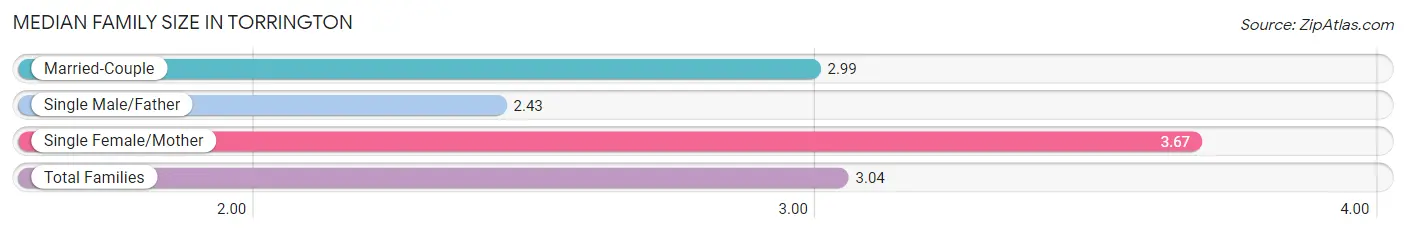
Median Family Size in Torrington
The median family size in Torrington is 3.04 persons per family, with single female/mother families (208 | 15.5%) accounting for the largest median family size of 3.67 persons per family. On the other hand, single male/father families (130 | 9.7%) represent the smallest median family size with 2.43 persons per family.
| Family Type | # Families | Family Size |
| Married-Couple | 1,006 (74.9%) | 2.99 |
| Single Male/Father | 130 (9.7%) | 2.43 |
| Single Female/Mother | 208 (15.5%) | 3.67 |
| Total Families | 1,344 (100.0%) | 3.04 |
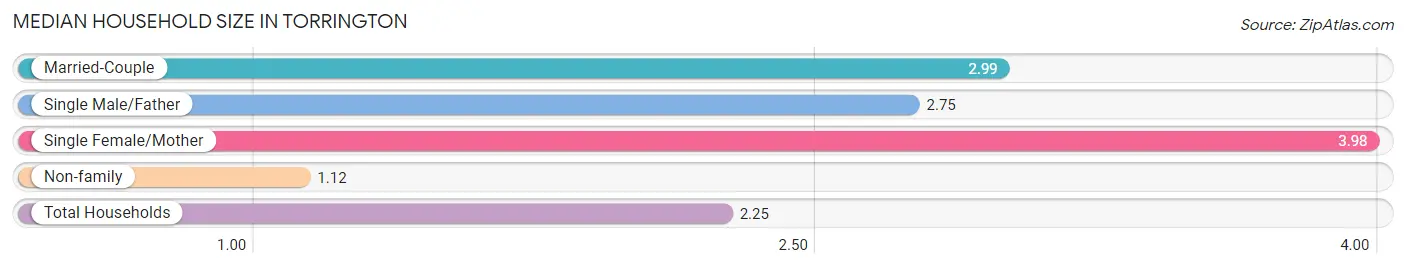
Median Household Size in Torrington
The median household size in Torrington is 2.25 persons per household, with single female/mother households (208 | 8.8%) accounting for the largest median household size of 3.98 persons per household. non-family households (1,029 | 43.4%) represent the smallest median household size with 1.12 persons per household.
| Household Type | # Households | Household Size |
| Married-Couple | 1,006 (42.4%) | 2.99 |
| Single Male/Father | 130 (5.5%) | 2.75 |
| Single Female/Mother | 208 (8.8%) | 3.98 |
| Non-family | 1,029 (43.4%) | 1.12 |
| Total Households | 2,373 (100.0%) | 2.25 |
Household Size by Marriage Status in Torrington
Out of a total of 2,373 households in Torrington, 1,344 (56.6%) are family households, while 1,029 (43.4%) are nonfamily households. The most numerous type of family households are 2-person households, comprising 636, and the most common type of nonfamily households are 1-person households, comprising 928.
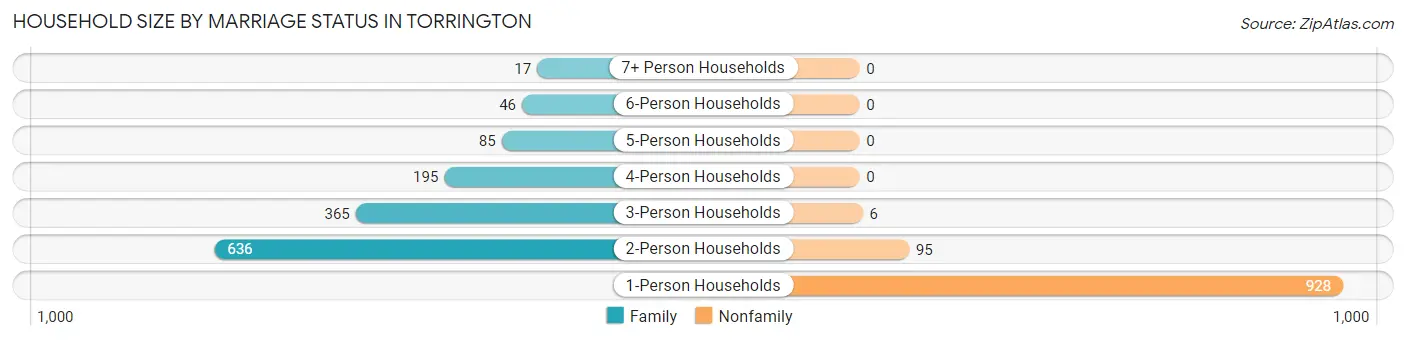
| Household Size | Family Households | Nonfamily Households |
| 1-Person Households | - | 928 (39.1%) |
| 2-Person Households | 636 (26.8%) | 95 (4.0%) |
| 3-Person Households | 365 (15.4%) | 6 (0.3%) |
| 4-Person Households | 195 (8.2%) | 0 (0.0%) |
| 5-Person Households | 85 (3.6%) | 0 (0.0%) |
| 6-Person Households | 46 (1.9%) | 0 (0.0%) |
| 7+ Person Households | 17 (0.7%) | 0 (0.0%) |
| Total | 1,344 (56.6%) | 1,029 (43.4%) |
Female Fertility in Torrington
Fertility by Age in Torrington
Average fertility rate in Torrington is 51.0 births per 1,000 women. Women in the age bracket of 20 to 34 years have the highest fertility rate with 100.0 births per 1,000 women. Women in the age bracket of 20 to 34 years acount for 64.6% of all women with births.
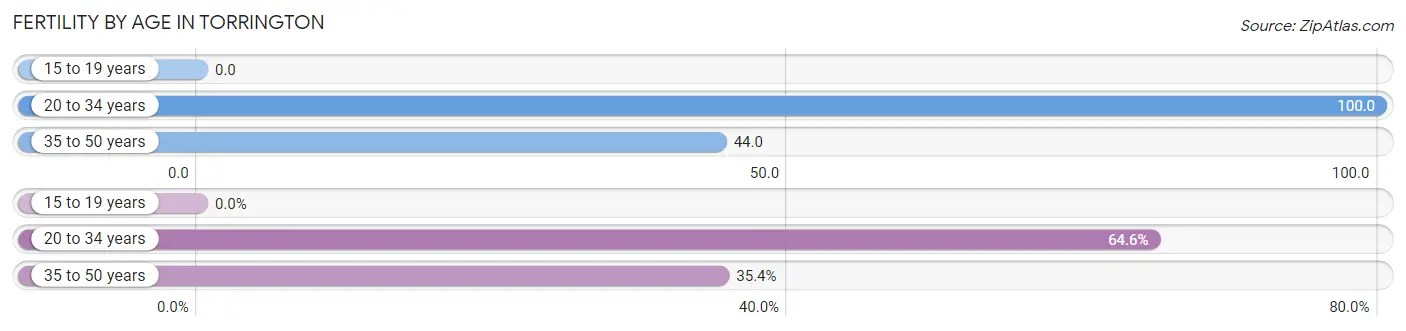
| Age Bracket | Women with Births | Births / 1,000 Women |
| 15 to 19 years | 0 (0.0%) | 0.0 |
| 20 to 34 years | 42 (64.6%) | 100.0 |
| 35 to 50 years | 23 (35.4%) | 44.0 |
| Total | 65 (100.0%) | 51.0 |
Fertility by Age by Marriage Status in Torrington
53.8% of women with births (65) in Torrington are married. The highest percentage of unmarried women with births falls into 35 to 50 years age bracket with 100.0% of them unmarried at the time of birth, while the lowest percentage of unmarried women with births belong to 20 to 34 years age bracket with 16.7% of them unmarried.
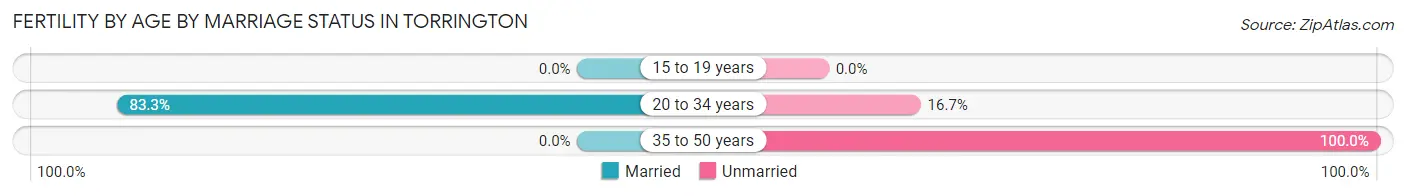
| Age Bracket | Married | Unmarried |
| 15 to 19 years | 0 (0.0%) | 0 (0.0%) |
| 20 to 34 years | 35 (83.3%) | 7 (16.7%) |
| 35 to 50 years | 0 (0.0%) | 23 (100.0%) |
| Total | 35 (53.8%) | 30 (46.2%) |
Fertility by Education in Torrington
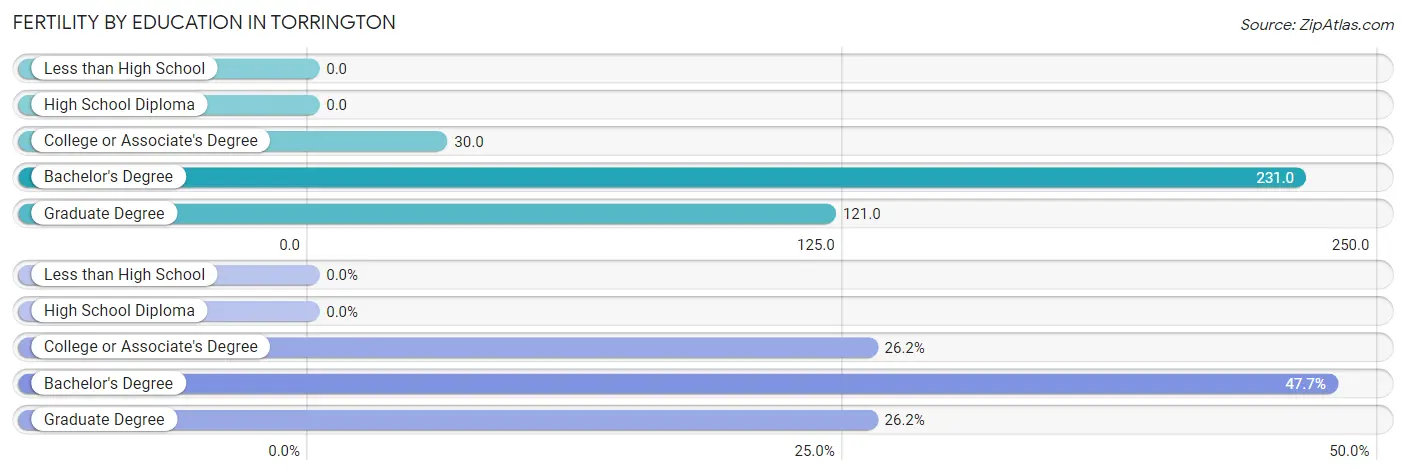
| Educational Attainment | Women with Births | Births / 1,000 Women |
| Less than High School | 0 (0.0%) | 0.0 |
| High School Diploma | 0 (0.0%) | 0.0 |
| College or Associate's Degree | 17 (26.2%) | 30.0 |
| Bachelor's Degree | 31 (47.7%) | 231.0 |
| Graduate Degree | 17 (26.2%) | 121.0 |
| Total | 65 (100.0%) | 51.0 |
Fertility by Education by Marriage Status in Torrington
46.2% of women with births in Torrington are unmarried. Women with the educational attainment of bachelor's degree are most likely to be married with 80.6% of them married at childbirth, while women with the educational attainment of graduate degree are least likely to be married with 100.0% of them unmarried at childbirth.
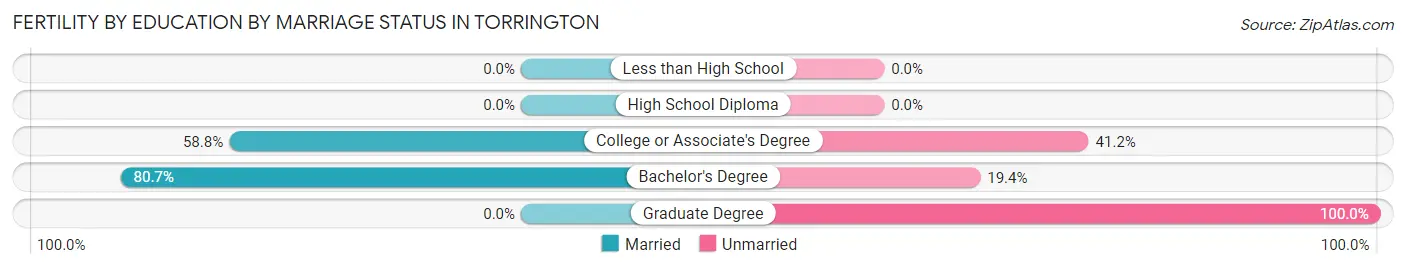
| Educational Attainment | Married | Unmarried |
| Less than High School | 0 (0.0%) | 0 (0.0%) |
| High School Diploma | 0 (0.0%) | 0 (0.0%) |
| College or Associate's Degree | 10 (58.8%) | 7 (41.2%) |
| Bachelor's Degree | 25 (80.6%) | 6 (19.4%) |
| Graduate Degree | 0 (0.0%) | 17 (100.0%) |
| Total | 35 (53.8%) | 30 (46.2%) |
Employment Characteristics in Torrington
Employment by Class of Employer in Torrington
Among the 2,549 employed individuals in Torrington, private company employees (1,200 | 47.1%), state government employees (397 | 15.6%), and not-for-profit organizations (334 | 13.1%) make up the most common classes of employment.
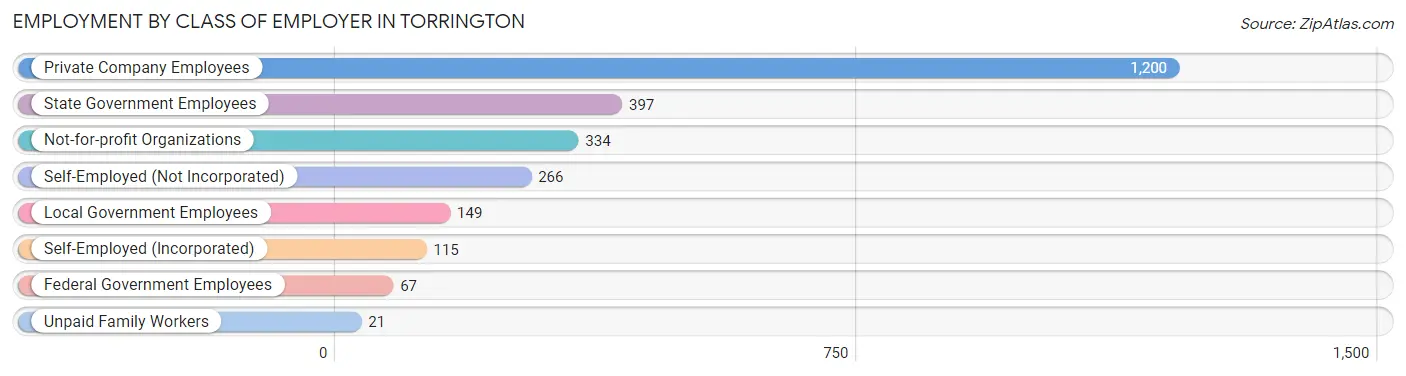
| Employer Class | # Employees | % Employees |
| Private Company Employees | 1,200 | 47.1% |
| Self-Employed (Incorporated) | 115 | 4.5% |
| Self-Employed (Not Incorporated) | 266 | 10.4% |
| Not-for-profit Organizations | 334 | 13.1% |
| Local Government Employees | 149 | 5.9% |
| State Government Employees | 397 | 15.6% |
| Federal Government Employees | 67 | 2.6% |
| Unpaid Family Workers | 21 | 0.8% |
| Total | 2,549 | 100.0% |
Employment Status by Age in Torrington
According to the labor force statistics for Torrington, out of the total population over 16 years of age (5,168), 52.6% or 2,718 individuals are in the labor force, with 4.9% or 133 of them unemployed. The age group with the highest labor force participation rate is 20 to 24 years, with 71.7% or 233 individuals in the labor force. Within the labor force, the 75 years and over age range has the highest percentage of unemployed individuals, with 19.0% or 11 of them being unemployed.
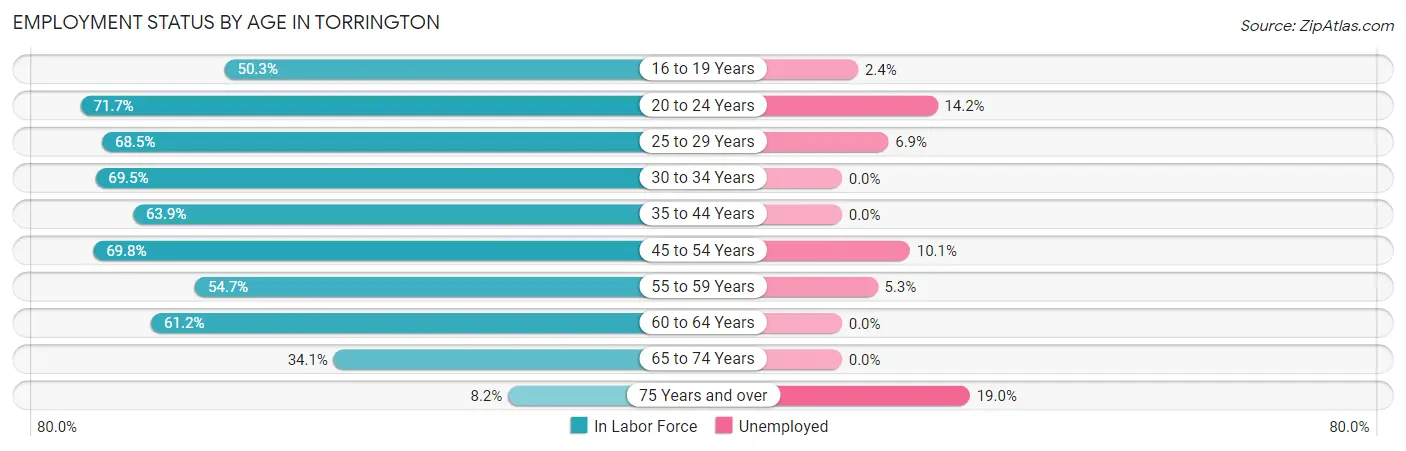
| Age Bracket | In Labor Force | Unemployed |
| 16 to 19 Years | 255 (50.3%) | 6 (2.4%) |
| 20 to 24 Years | 233 (71.7%) | 33 (14.2%) |
| 25 to 29 Years | 174 (68.5%) | 12 (6.9%) |
| 30 to 34 Years | 257 (69.5%) | 0 (0.0%) |
| 35 to 44 Years | 448 (63.9%) | 0 (0.0%) |
| 45 to 54 Years | 631 (69.8%) | 64 (10.1%) |
| 55 to 59 Years | 226 (54.7%) | 12 (5.3%) |
| 60 to 64 Years | 221 (61.2%) | 0 (0.0%) |
| 65 to 74 Years | 213 (34.1%) | 0 (0.0%) |
| 75 Years and over | 58 (8.2%) | 11 (19.0%) |
| Total | 2,718 (52.6%) | 133 (4.9%) |
Employment Status by Educational Attainment in Torrington
According to labor force statistics for Torrington, 65.2% of individuals (1,958) out of the total population between 25 and 64 years of age (3,003) are in the labor force, with 4.5% or 88 of them being unemployed. The group with the highest labor force participation rate are those with the educational attainment of bachelor's degree or higher, with 85.5% or 435 individuals in the labor force. Within the labor force, individuals with high school diploma education have the highest percentage of unemployment, with 14.6% or 61 of them being unemployed.
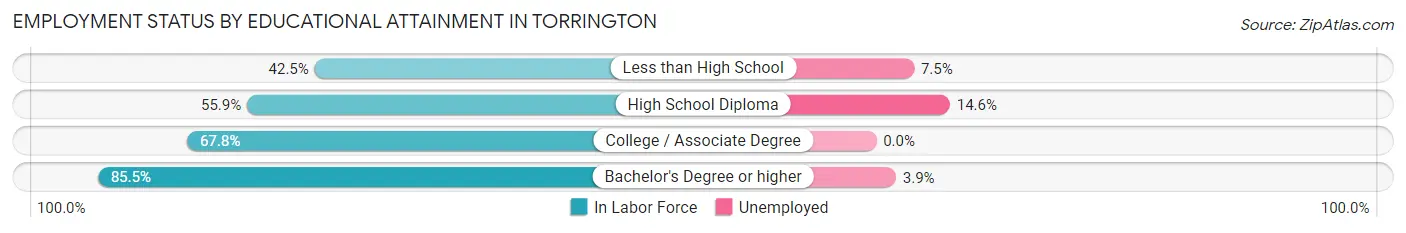
| Educational Attainment | In Labor Force | Unemployed |
| Less than High School | 133 (42.5%) | 23 (7.5%) |
| High School Diploma | 419 (55.9%) | 110 (14.6%) |
| College / Associate Degree | 970 (67.8%) | 0 (0.0%) |
| Bachelor's Degree or higher | 435 (85.5%) | 20 (3.9%) |
| Total | 1,958 (65.2%) | 135 (4.5%) |
Employment Occupations by Sex in Torrington
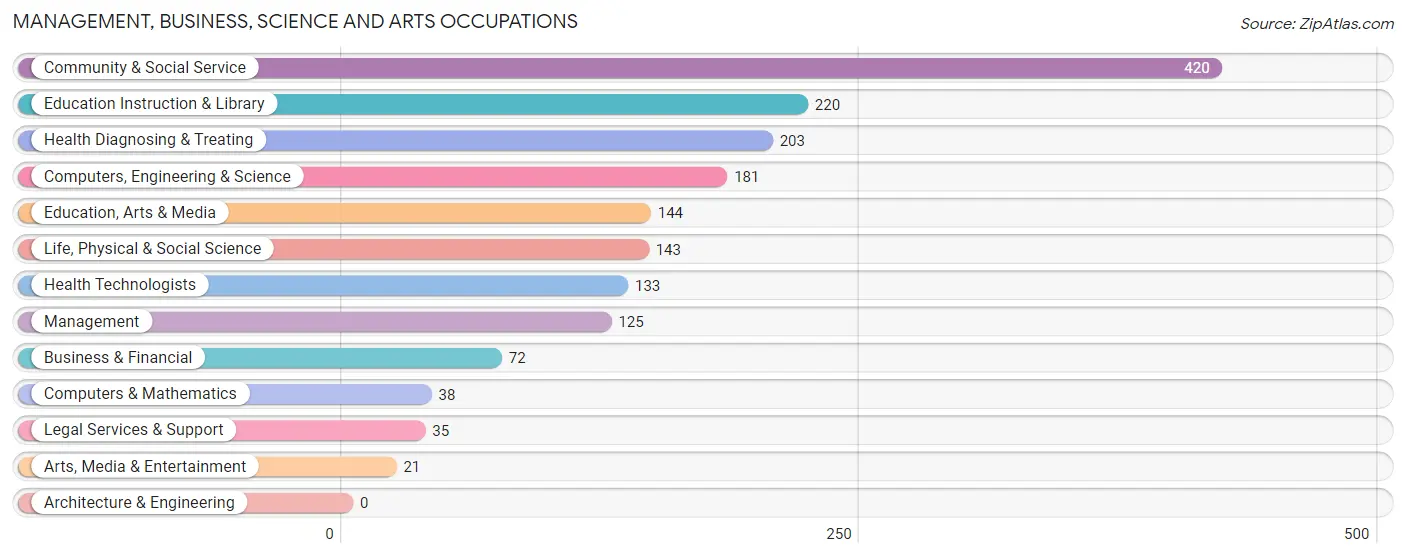
Management, Business, Science and Arts Occupations
The most common Management, Business, Science and Arts occupations in Torrington are Community & Social Service (420 | 16.6%), Education Instruction & Library (220 | 8.7%), Health Diagnosing & Treating (203 | 8.0%), Computers, Engineering & Science (181 | 7.1%), and Education, Arts & Media (144 | 5.7%).
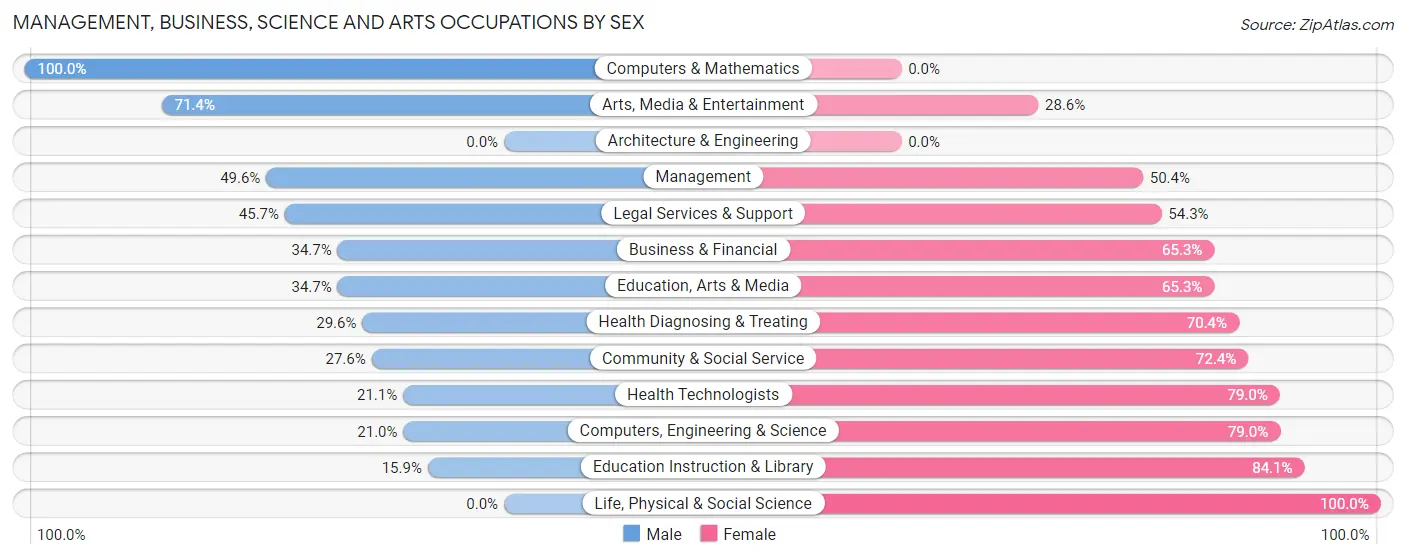
Management, Business, Science and Arts Occupations by Sex
Within the Management, Business, Science and Arts occupations in Torrington, the most male-oriented occupations are Computers & Mathematics (100.0%), Arts, Media & Entertainment (71.4%), and Management (49.6%), while the most female-oriented occupations are Life, Physical & Social Science (100.0%), Education Instruction & Library (84.1%), and Computers, Engineering & Science (79.0%).
| Occupation | Male | Female |
| Management | 62 (49.6%) | 63 (50.4%) |
| Business & Financial | 25 (34.7%) | 47 (65.3%) |
| Computers, Engineering & Science | 38 (21.0%) | 143 (79.0%) |
| Computers & Mathematics | 38 (100.0%) | 0 (0.0%) |
| Architecture & Engineering | 0 (0.0%) | 0 (0.0%) |
| Life, Physical & Social Science | 0 (0.0%) | 143 (100.0%) |
| Community & Social Service | 116 (27.6%) | 304 (72.4%) |
| Education, Arts & Media | 50 (34.7%) | 94 (65.3%) |
| Legal Services & Support | 16 (45.7%) | 19 (54.3%) |
| Education Instruction & Library | 35 (15.9%) | 185 (84.1%) |
| Arts, Media & Entertainment | 15 (71.4%) | 6 (28.6%) |
| Health Diagnosing & Treating | 60 (29.6%) | 143 (70.4%) |
| Health Technologists | 28 (21.0%) | 105 (78.9%) |
| Total (Category) | 301 (30.1%) | 700 (69.9%) |
| Total (Overall) | 1,248 (49.2%) | 1,288 (50.8%) |
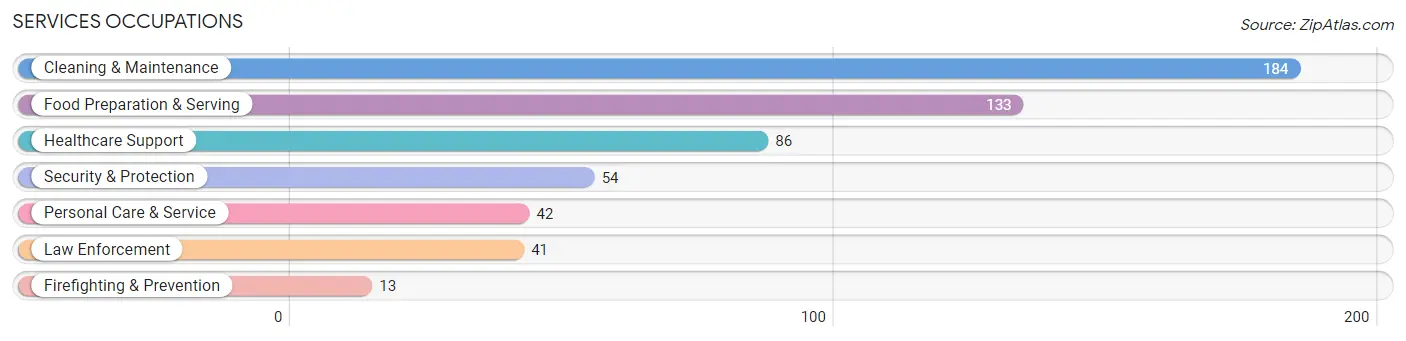
Services Occupations
The most common Services occupations in Torrington are Cleaning & Maintenance (184 | 7.3%), Food Preparation & Serving (133 | 5.2%), Healthcare Support (86 | 3.4%), Security & Protection (54 | 2.1%), and Personal Care & Service (42 | 1.7%).
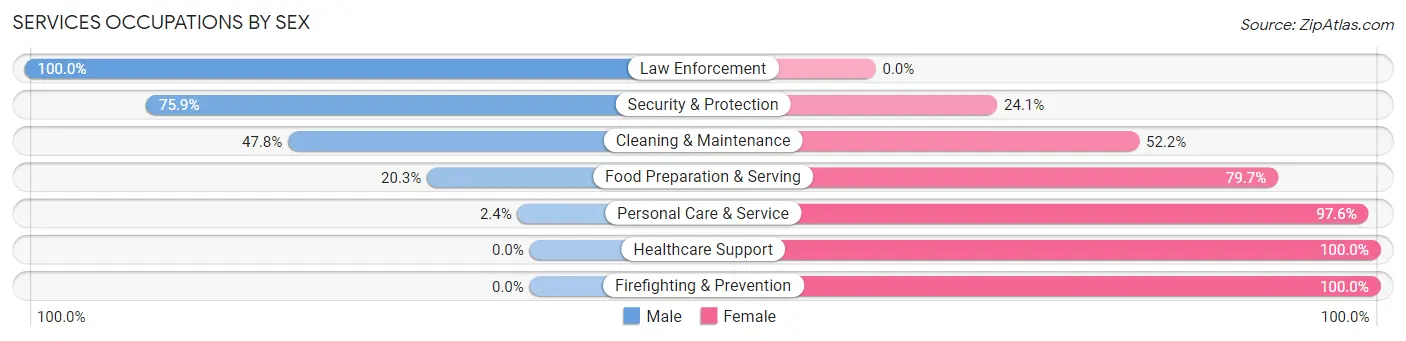
Services Occupations by Sex
Within the Services occupations in Torrington, the most male-oriented occupations are Law Enforcement (100.0%), Security & Protection (75.9%), and Cleaning & Maintenance (47.8%), while the most female-oriented occupations are Healthcare Support (100.0%), Firefighting & Prevention (100.0%), and Personal Care & Service (97.6%).
| Occupation | Male | Female |
| Healthcare Support | 0 (0.0%) | 86 (100.0%) |
| Security & Protection | 41 (75.9%) | 13 (24.1%) |
| Firefighting & Prevention | 0 (0.0%) | 13 (100.0%) |
| Law Enforcement | 41 (100.0%) | 0 (0.0%) |
| Food Preparation & Serving | 27 (20.3%) | 106 (79.7%) |
| Cleaning & Maintenance | 88 (47.8%) | 96 (52.2%) |
| Personal Care & Service | 1 (2.4%) | 41 (97.6%) |
| Total (Category) | 157 (31.5%) | 342 (68.5%) |
| Total (Overall) | 1,248 (49.2%) | 1,288 (50.8%) |
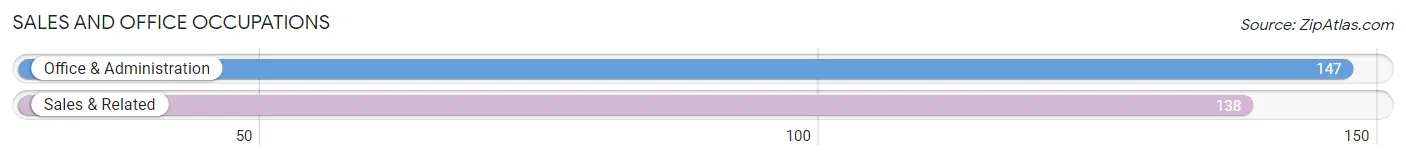
Sales and Office Occupations
The most common Sales and Office occupations in Torrington are Office & Administration (147 | 5.8%), and Sales & Related (138 | 5.4%).
Sales and Office Occupations by Sex
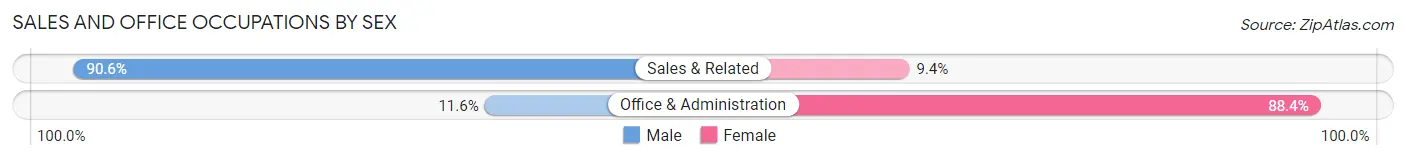
| Occupation | Male | Female |
| Sales & Related | 125 (90.6%) | 13 (9.4%) |
| Office & Administration | 17 (11.6%) | 130 (88.4%) |
| Total (Category) | 142 (49.8%) | 143 (50.2%) |
| Total (Overall) | 1,248 (49.2%) | 1,288 (50.8%) |
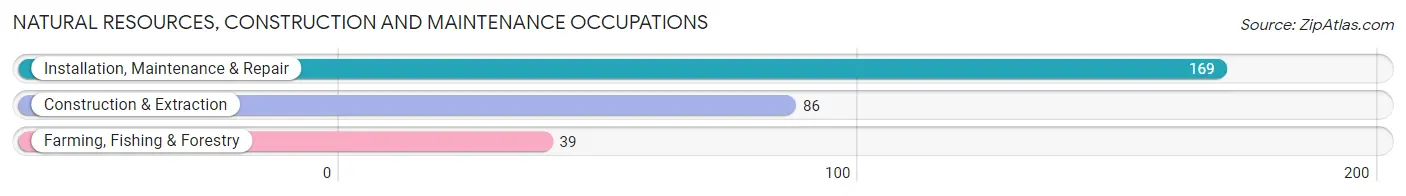
Natural Resources, Construction and Maintenance Occupations
The most common Natural Resources, Construction and Maintenance occupations in Torrington are Installation, Maintenance & Repair (169 | 6.7%), Construction & Extraction (86 | 3.4%), and Farming, Fishing & Forestry (39 | 1.5%).
Natural Resources, Construction and Maintenance Occupations by Sex
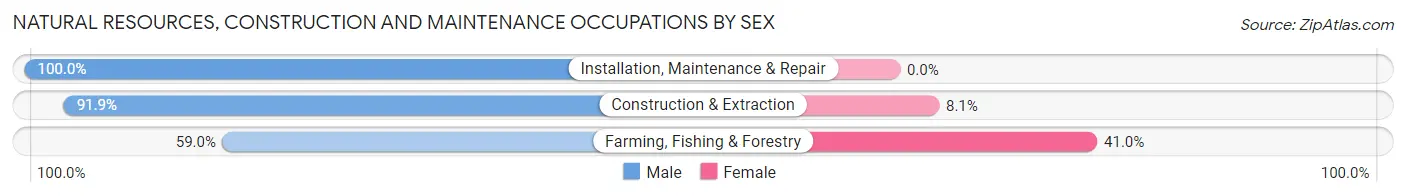
| Occupation | Male | Female |
| Farming, Fishing & Forestry | 23 (59.0%) | 16 (41.0%) |
| Construction & Extraction | 79 (91.9%) | 7 (8.1%) |
| Installation, Maintenance & Repair | 169 (100.0%) | 0 (0.0%) |
| Total (Category) | 271 (92.2%) | 23 (7.8%) |
| Total (Overall) | 1,248 (49.2%) | 1,288 (50.8%) |
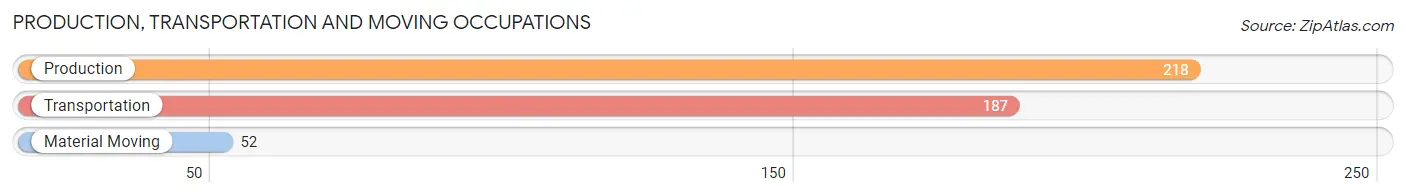
Production, Transportation and Moving Occupations
The most common Production, Transportation and Moving occupations in Torrington are Production (218 | 8.6%), Transportation (187 | 7.4%), and Material Moving (52 | 2.1%).
Production, Transportation and Moving Occupations by Sex
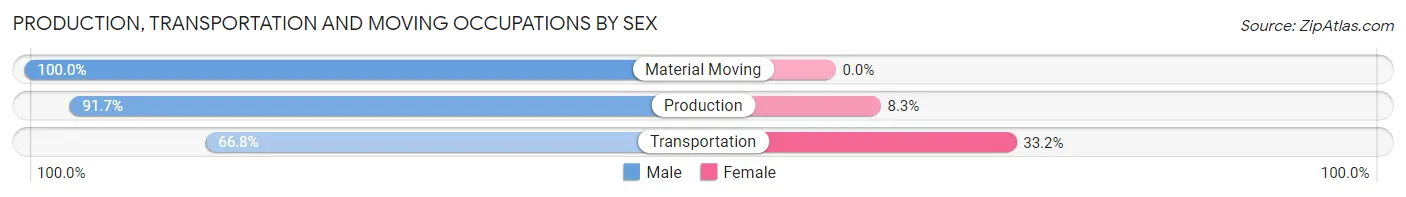
| Occupation | Male | Female |
| Production | 200 (91.7%) | 18 (8.3%) |
| Transportation | 125 (66.8%) | 62 (33.2%) |
| Material Moving | 52 (100.0%) | 0 (0.0%) |
| Total (Category) | 377 (82.5%) | 80 (17.5%) |
| Total (Overall) | 1,248 (49.2%) | 1,288 (50.8%) |
Employment Industries by Sex in Torrington
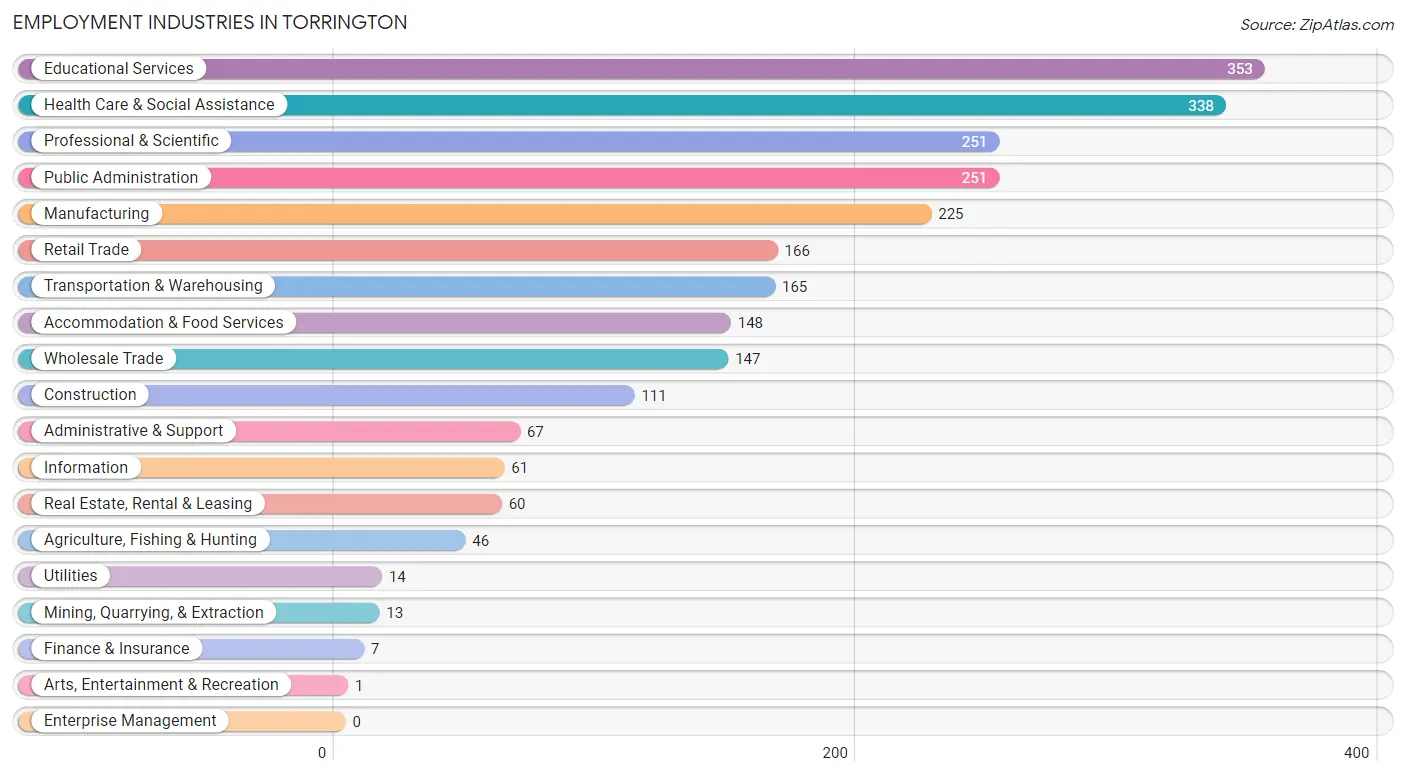
Employment Industries in Torrington
The major employment industries in Torrington include Educational Services (353 | 13.9%), Health Care & Social Assistance (338 | 13.3%), Professional & Scientific (251 | 9.9%), Public Administration (251 | 9.9%), and Manufacturing (225 | 8.9%).
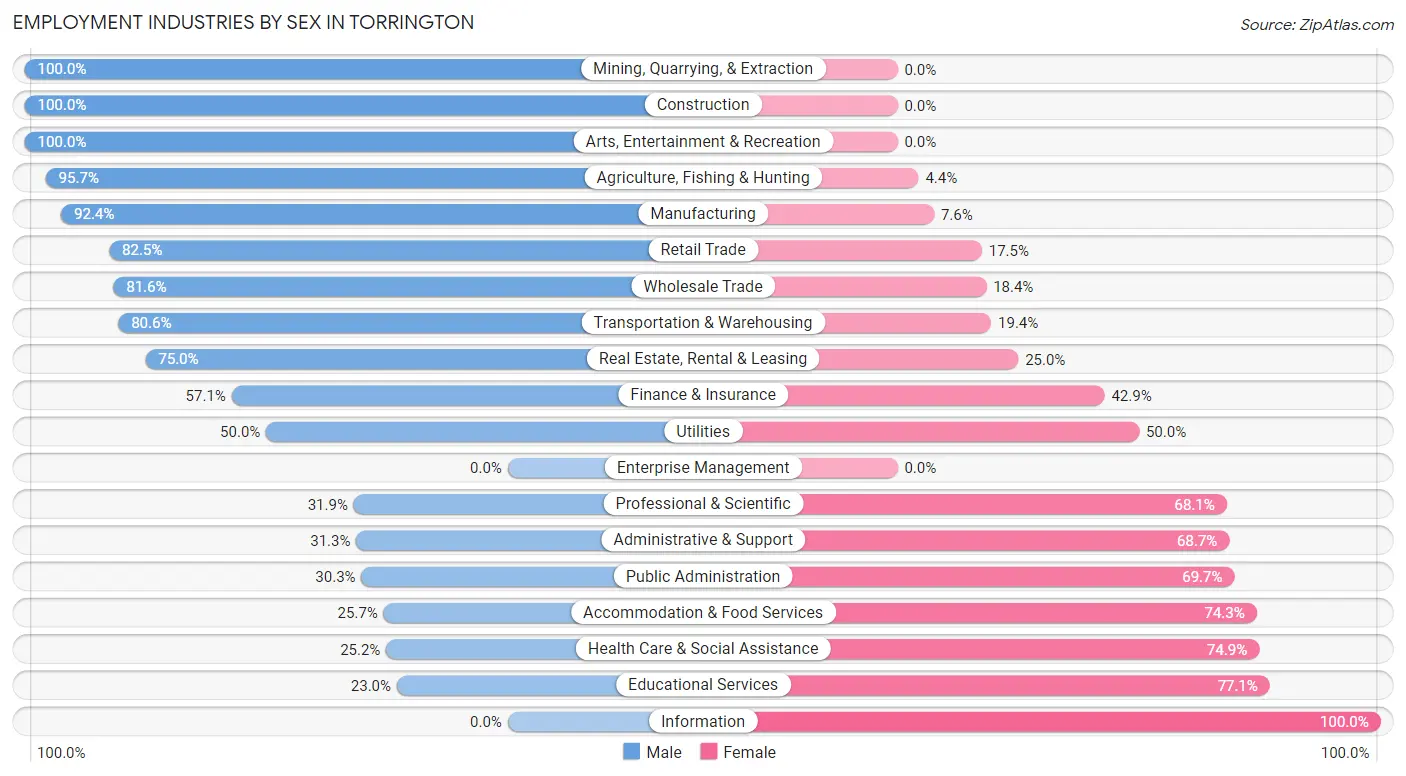
Employment Industries by Sex in Torrington
The Torrington industries that see more men than women are Mining, Quarrying, & Extraction (100.0%), Construction (100.0%), and Arts, Entertainment & Recreation (100.0%), whereas the industries that tend to have a higher number of women are Information (100.0%), Educational Services (77.0%), and Health Care & Social Assistance (74.9%).
| Industry | Male | Female |
| Agriculture, Fishing & Hunting | 44 (95.7%) | 2 (4.3%) |
| Mining, Quarrying, & Extraction | 13 (100.0%) | 0 (0.0%) |
| Construction | 111 (100.0%) | 0 (0.0%) |
| Manufacturing | 208 (92.4%) | 17 (7.6%) |
| Wholesale Trade | 120 (81.6%) | 27 (18.4%) |
| Retail Trade | 137 (82.5%) | 29 (17.5%) |
| Transportation & Warehousing | 133 (80.6%) | 32 (19.4%) |
| Utilities | 7 (50.0%) | 7 (50.0%) |
| Information | 0 (0.0%) | 61 (100.0%) |
| Finance & Insurance | 4 (57.1%) | 3 (42.9%) |
| Real Estate, Rental & Leasing | 45 (75.0%) | 15 (25.0%) |
| Professional & Scientific | 80 (31.9%) | 171 (68.1%) |
| Enterprise Management | 0 (0.0%) | 0 (0.0%) |
| Administrative & Support | 21 (31.3%) | 46 (68.7%) |
| Educational Services | 81 (23.0%) | 272 (77.0%) |
| Health Care & Social Assistance | 85 (25.2%) | 253 (74.9%) |
| Arts, Entertainment & Recreation | 1 (100.0%) | 0 (0.0%) |
| Accommodation & Food Services | 38 (25.7%) | 110 (74.3%) |
| Public Administration | 76 (30.3%) | 175 (69.7%) |
| Total | 1,248 (49.2%) | 1,288 (50.8%) |
Education in Torrington
School Enrollment in Torrington
The most common levels of schooling among the 1,295 students in Torrington are college / undergraduate (383 | 29.6%), high school (362 | 28.0%), and middle school (290 | 22.4%).
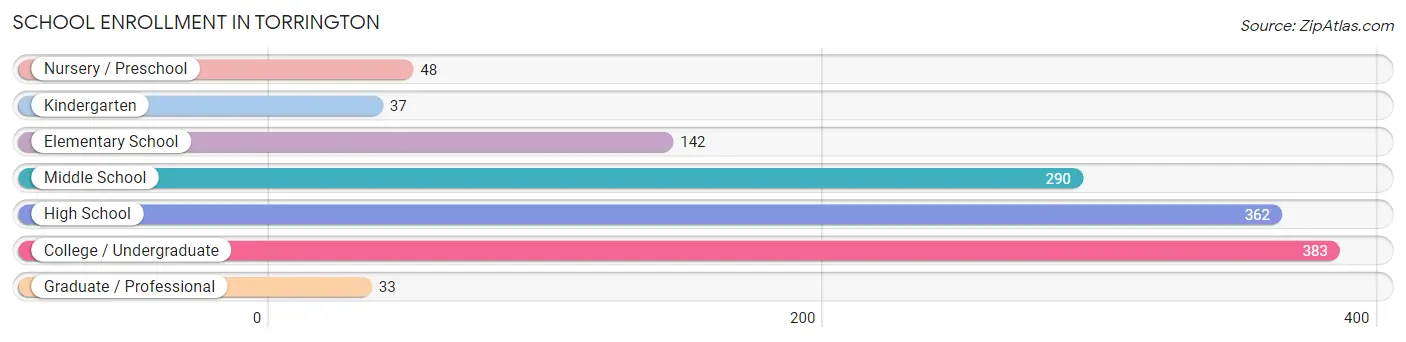
| School Level | # Students | % Students |
| Nursery / Preschool | 48 | 3.7% |
| Kindergarten | 37 | 2.9% |
| Elementary School | 142 | 11.0% |
| Middle School | 290 | 22.4% |
| High School | 362 | 28.0% |
| College / Undergraduate | 383 | 29.6% |
| Graduate / Professional | 33 | 2.5% |
| Total | 1,295 | 100.0% |
School Enrollment by Age by Funding Source in Torrington
Out of a total of 1,295 students who are enrolled in schools in Torrington, 109 (8.4%) attend a private institution, while the remaining 1,186 (91.6%) are enrolled in public schools. The age group of 3 to 4 year olds has the highest likelihood of being enrolled in private schools, with 26 (100.0% in the age bracket) enrolled. Conversely, the age group of 18 to 19 year olds has the lowest likelihood of being enrolled in a private school, with 271 (97.8% in the age bracket) attending a public institution.
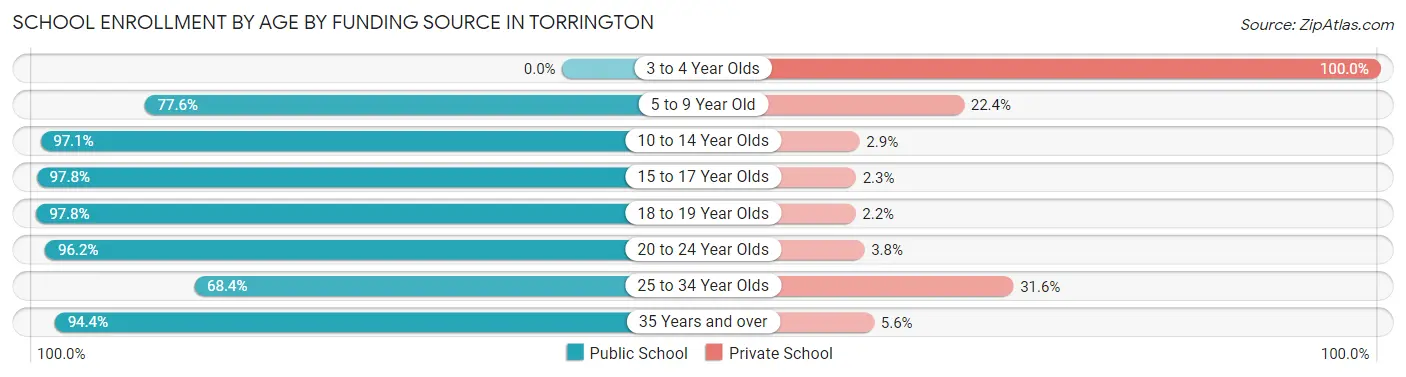
| Age Bracket | Public School | Private School |
| 3 to 4 Year Olds | 0 (0.0%) | 26 (100.0%) |
| 5 to 9 Year Old | 118 (77.6%) | 34 (22.4%) |
| 10 to 14 Year Olds | 331 (97.1%) | 10 (2.9%) |
| 15 to 17 Year Olds | 217 (97.8%) | 5 (2.2%) |
| 18 to 19 Year Olds | 271 (97.8%) | 6 (2.2%) |
| 20 to 24 Year Olds | 126 (96.2%) | 5 (3.8%) |
| 25 to 34 Year Olds | 39 (68.4%) | 18 (31.6%) |
| 35 Years and over | 84 (94.4%) | 5 (5.6%) |
| Total | 1,186 (91.6%) | 109 (8.4%) |
Educational Attainment by Field of Study in Torrington
Education (162 | 17.5%), psychology (113 | 12.2%), business (94 | 10.2%), arts & humanities (88 | 9.5%), and bio, nature & agricultural (86 | 9.3%) are the most common fields of study among 926 individuals in Torrington who have obtained a bachelor's degree or higher.
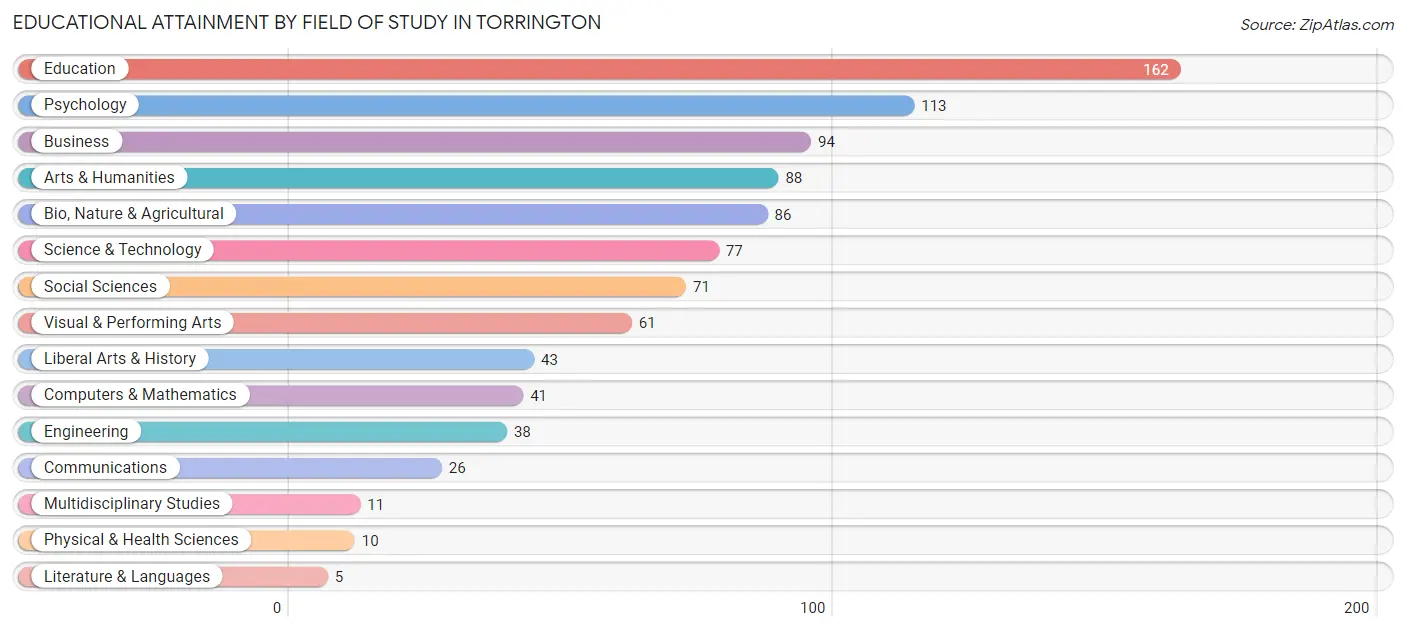
| Field of Study | # Graduates | % Graduates |
| Computers & Mathematics | 41 | 4.4% |
| Bio, Nature & Agricultural | 86 | 9.3% |
| Physical & Health Sciences | 10 | 1.1% |
| Psychology | 113 | 12.2% |
| Social Sciences | 71 | 7.7% |
| Engineering | 38 | 4.1% |
| Multidisciplinary Studies | 11 | 1.2% |
| Science & Technology | 77 | 8.3% |
| Business | 94 | 10.2% |
| Education | 162 | 17.5% |
| Literature & Languages | 5 | 0.5% |
| Liberal Arts & History | 43 | 4.6% |
| Visual & Performing Arts | 61 | 6.6% |
| Communications | 26 | 2.8% |
| Arts & Humanities | 88 | 9.5% |
| Total | 926 | 100.0% |
Transportation & Commute in Torrington
Vehicle Availability by Sex in Torrington
The most prevalent vehicle ownership categories in Torrington are males with 2 vehicles (519, accounting for 41.0%) and females with 2 vehicles (449, making up 42.6%).
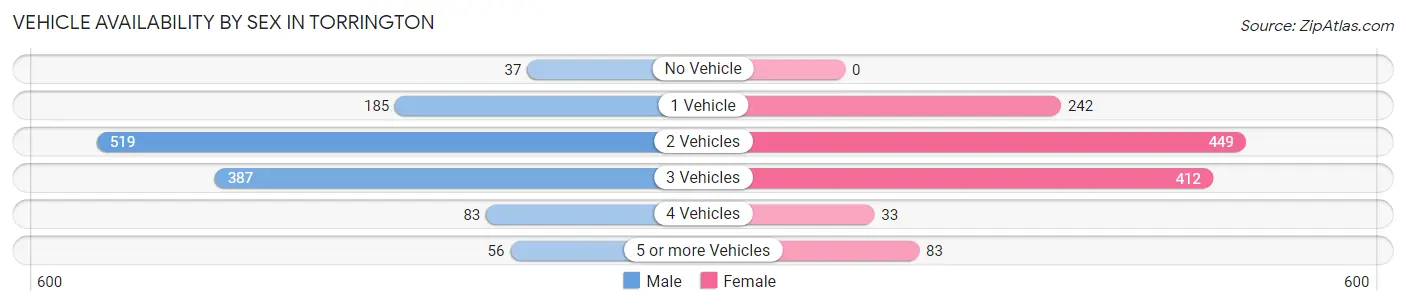
| Vehicles Available | Male | Female |
| No Vehicle | 37 (2.9%) | 0 (0.0%) |
| 1 Vehicle | 185 (14.6%) | 242 (19.9%) |
| 2 Vehicles | 519 (41.0%) | 449 (36.8%) |
| 3 Vehicles | 387 (30.5%) | 412 (33.8%) |
| 4 Vehicles | 83 (6.6%) | 33 (2.7%) |
| 5 or more Vehicles | 56 (4.4%) | 83 (6.8%) |
| Total | 1,267 (100.0%) | 1,219 (100.0%) |
Commute Time in Torrington
The most frequently occuring commute durations in Torrington are 5 to 9 minutes (929 commuters, 39.0%), 10 to 14 minutes (451 commuters, 18.9%), and less than 5 minutes (336 commuters, 14.1%).
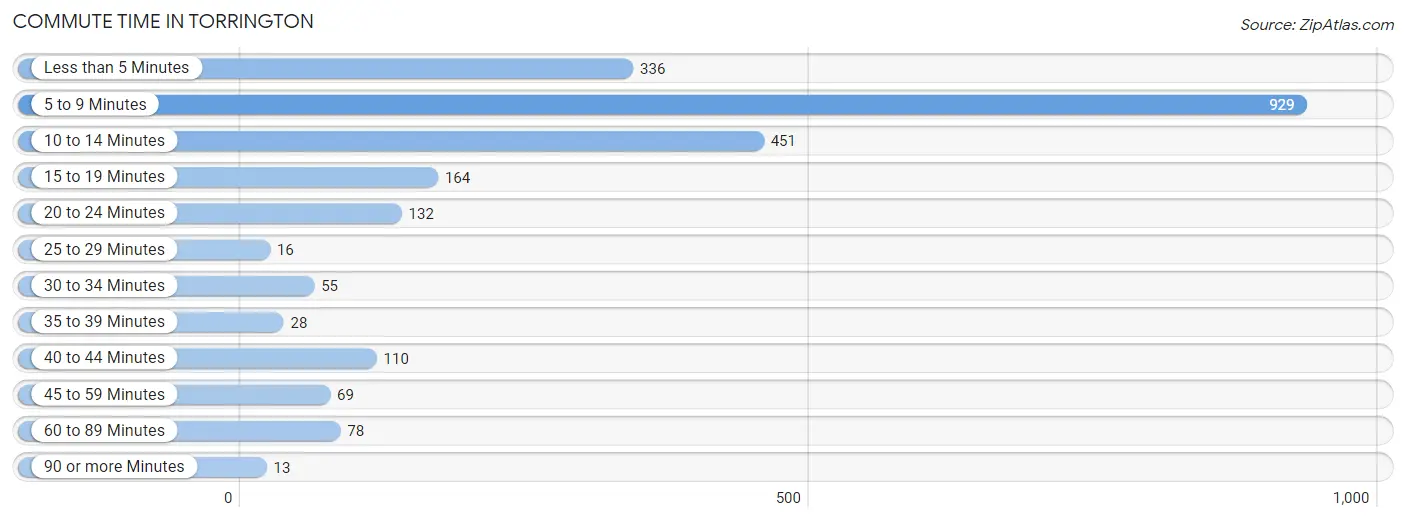
| Commute Time | # Commuters | % Commuters |
| Less than 5 Minutes | 336 | 14.1% |
| 5 to 9 Minutes | 929 | 39.0% |
| 10 to 14 Minutes | 451 | 18.9% |
| 15 to 19 Minutes | 164 | 6.9% |
| 20 to 24 Minutes | 132 | 5.5% |
| 25 to 29 Minutes | 16 | 0.7% |
| 30 to 34 Minutes | 55 | 2.3% |
| 35 to 39 Minutes | 28 | 1.2% |
| 40 to 44 Minutes | 110 | 4.6% |
| 45 to 59 Minutes | 69 | 2.9% |
| 60 to 89 Minutes | 78 | 3.3% |
| 90 or more Minutes | 13 | 0.5% |
Commute Time by Sex in Torrington
The most common commute times in Torrington are 5 to 9 minutes (460 commuters, 37.6%) for males and 5 to 9 minutes (469 commuters, 40.5%) for females.
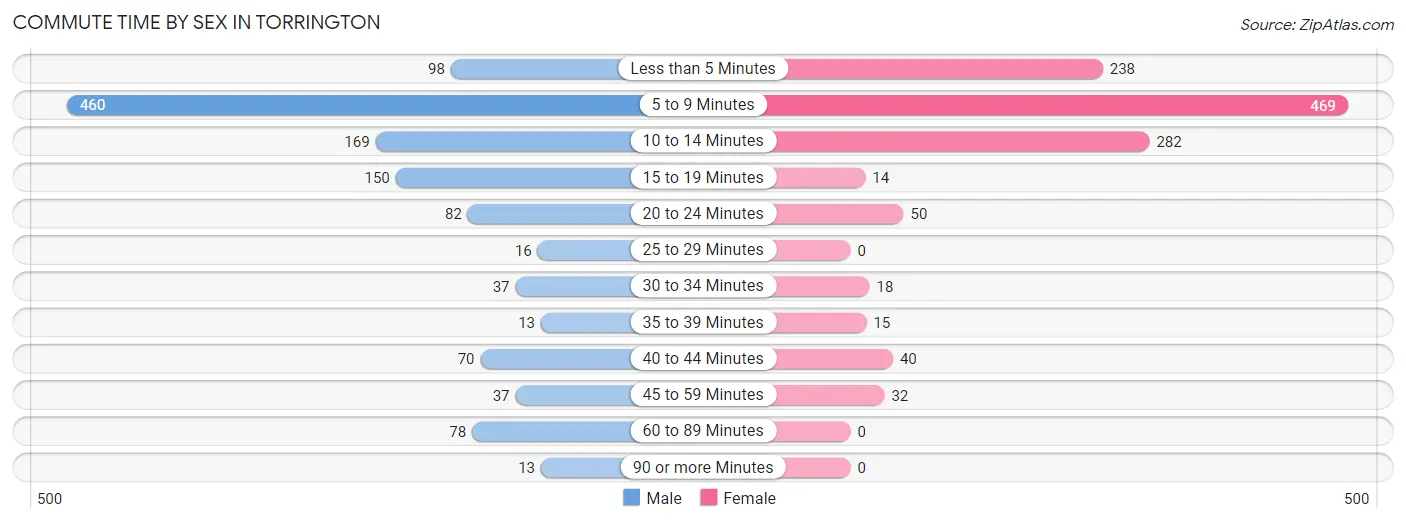
| Commute Time | Male | Female |
| Less than 5 Minutes | 98 (8.0%) | 238 (20.5%) |
| 5 to 9 Minutes | 460 (37.6%) | 469 (40.5%) |
| 10 to 14 Minutes | 169 (13.8%) | 282 (24.3%) |
| 15 to 19 Minutes | 150 (12.3%) | 14 (1.2%) |
| 20 to 24 Minutes | 82 (6.7%) | 50 (4.3%) |
| 25 to 29 Minutes | 16 (1.3%) | 0 (0.0%) |
| 30 to 34 Minutes | 37 (3.0%) | 18 (1.5%) |
| 35 to 39 Minutes | 13 (1.1%) | 15 (1.3%) |
| 40 to 44 Minutes | 70 (5.7%) | 40 (3.5%) |
| 45 to 59 Minutes | 37 (3.0%) | 32 (2.8%) |
| 60 to 89 Minutes | 78 (6.4%) | 0 (0.0%) |
| 90 or more Minutes | 13 (1.1%) | 0 (0.0%) |
Time of Departure to Work by Sex in Torrington
The most frequent times of departure to work in Torrington are 8:00 AM to 8:29 AM (240, 19.6%) for males and 7:00 AM to 7:29 AM (269, 23.2%) for females.
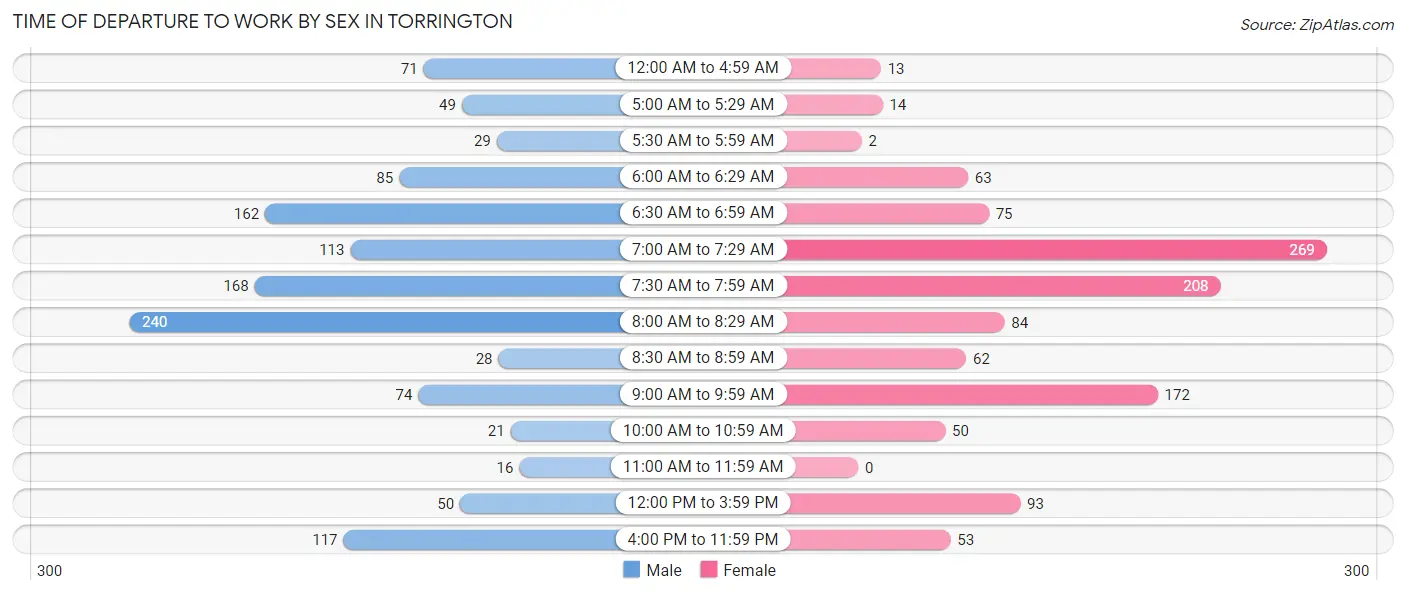
| Time of Departure | Male | Female |
| 12:00 AM to 4:59 AM | 71 (5.8%) | 13 (1.1%) |
| 5:00 AM to 5:29 AM | 49 (4.0%) | 14 (1.2%) |
| 5:30 AM to 5:59 AM | 29 (2.4%) | 2 (0.2%) |
| 6:00 AM to 6:29 AM | 85 (7.0%) | 63 (5.4%) |
| 6:30 AM to 6:59 AM | 162 (13.3%) | 75 (6.5%) |
| 7:00 AM to 7:29 AM | 113 (9.2%) | 269 (23.2%) |
| 7:30 AM to 7:59 AM | 168 (13.7%) | 208 (18.0%) |
| 8:00 AM to 8:29 AM | 240 (19.6%) | 84 (7.2%) |
| 8:30 AM to 8:59 AM | 28 (2.3%) | 62 (5.3%) |
| 9:00 AM to 9:59 AM | 74 (6.0%) | 172 (14.8%) |
| 10:00 AM to 10:59 AM | 21 (1.7%) | 50 (4.3%) |
| 11:00 AM to 11:59 AM | 16 (1.3%) | 0 (0.0%) |
| 12:00 PM to 3:59 PM | 50 (4.1%) | 93 (8.0%) |
| 4:00 PM to 11:59 PM | 117 (9.6%) | 53 (4.6%) |
| Total | 1,223 (100.0%) | 1,158 (100.0%) |
Housing Occupancy in Torrington
Occupancy by Ownership in Torrington
Of the total 2,373 dwellings in Torrington, owner-occupied units account for 1,545 (65.1%), while renter-occupied units make up 828 (34.9%).
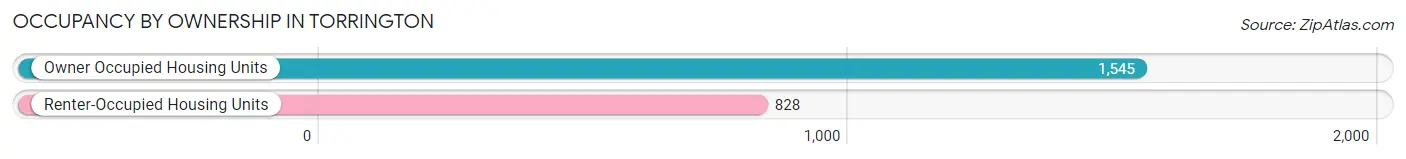
| Occupancy | # Housing Units | % Housing Units |
| Owner Occupied Housing Units | 1,545 | 65.1% |
| Renter-Occupied Housing Units | 828 | 34.9% |
| Total Occupied Housing Units | 2,373 | 100.0% |
Occupancy by Household Size in Torrington
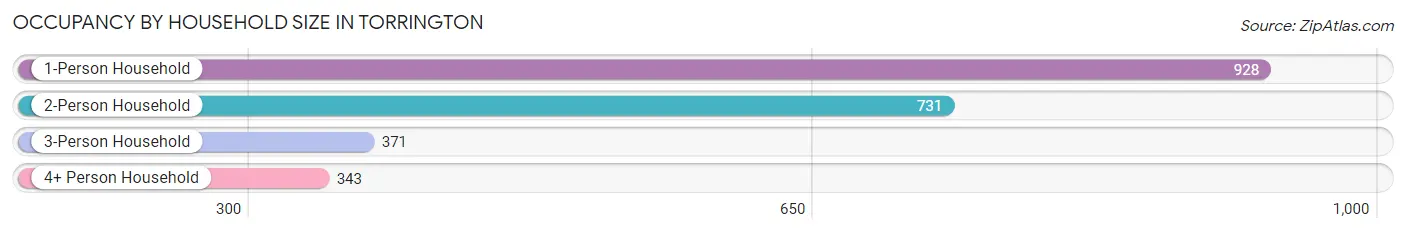
| Household Size | # Housing Units | % Housing Units |
| 1-Person Household | 928 | 39.1% |
| 2-Person Household | 731 | 30.8% |
| 3-Person Household | 371 | 15.6% |
| 4+ Person Household | 343 | 14.4% |
| Total Housing Units | 2,373 | 100.0% |
Occupancy by Ownership by Household Size in Torrington
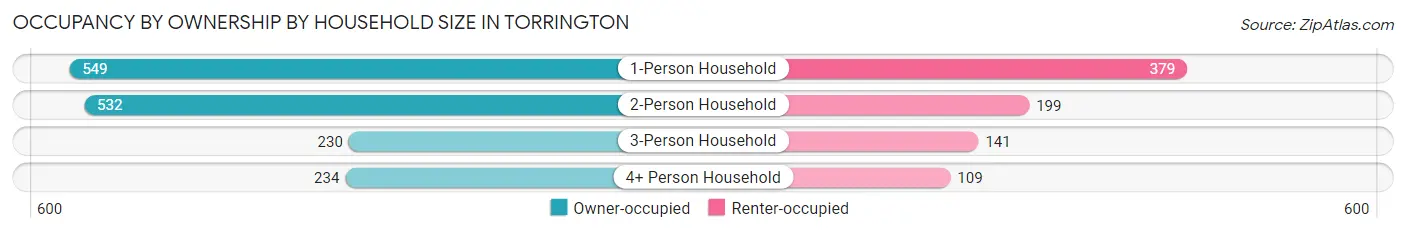
| Household Size | Owner-occupied | Renter-occupied |
| 1-Person Household | 549 (59.2%) | 379 (40.8%) |
| 2-Person Household | 532 (72.8%) | 199 (27.2%) |
| 3-Person Household | 230 (62.0%) | 141 (38.0%) |
| 4+ Person Household | 234 (68.2%) | 109 (31.8%) |
| Total Housing Units | 1,545 (65.1%) | 828 (34.9%) |
Occupancy by Educational Attainment in Torrington
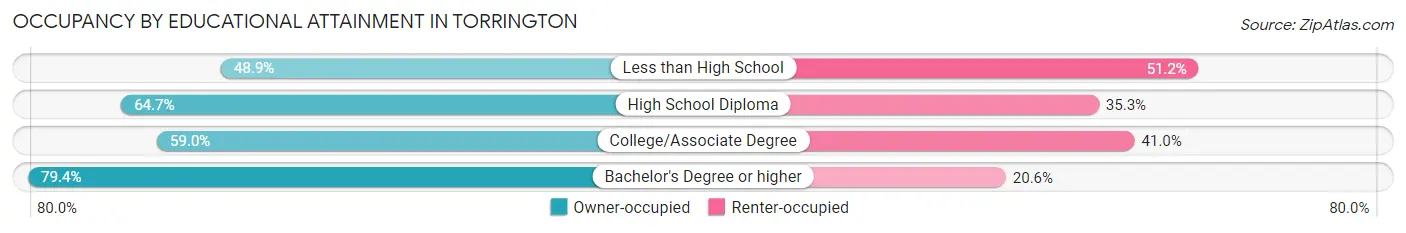
| Household Size | Owner-occupied | Renter-occupied |
| Less than High School | 64 (48.8%) | 67 (51.1%) |
| High School Diploma | 410 (64.7%) | 224 (35.3%) |
| College/Associate Degree | 596 (59.0%) | 414 (41.0%) |
| Bachelor's Degree or higher | 475 (79.4%) | 123 (20.6%) |
Occupancy by Age of Householder in Torrington
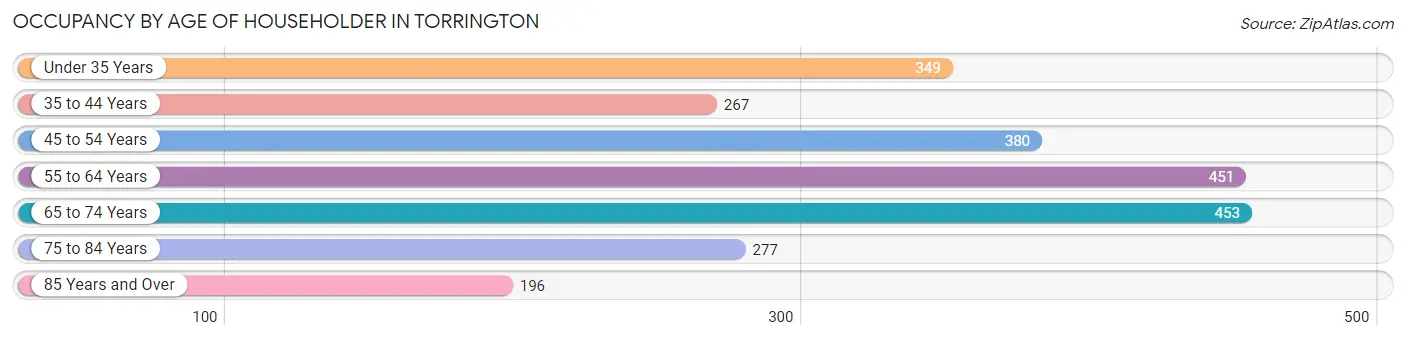
| Age Bracket | # Households | % Households |
| Under 35 Years | 349 | 14.7% |
| 35 to 44 Years | 267 | 11.3% |
| 45 to 54 Years | 380 | 16.0% |
| 55 to 64 Years | 451 | 19.0% |
| 65 to 74 Years | 453 | 19.1% |
| 75 to 84 Years | 277 | 11.7% |
| 85 Years and Over | 196 | 8.3% |
| Total | 2,373 | 100.0% |
Housing Finances in Torrington
Median Income by Occupancy in Torrington
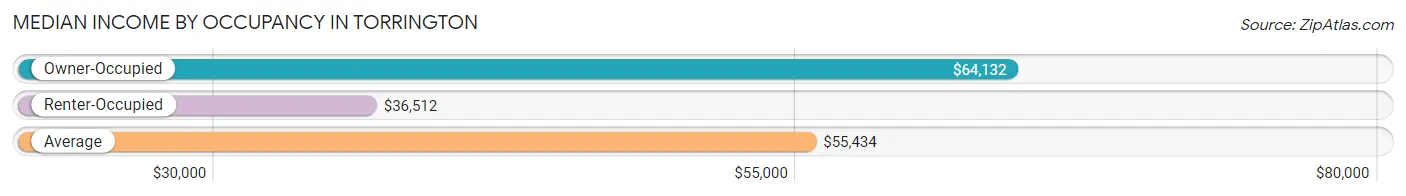
| Occupancy Type | # Households | Median Income |
| Owner-Occupied | 1,545 (65.1%) | $64,132 |
| Renter-Occupied | 828 (34.9%) | $36,512 |
| Average | 2,373 (100.0%) | $55,434 |
Occupancy by Householder Income Bracket in Torrington
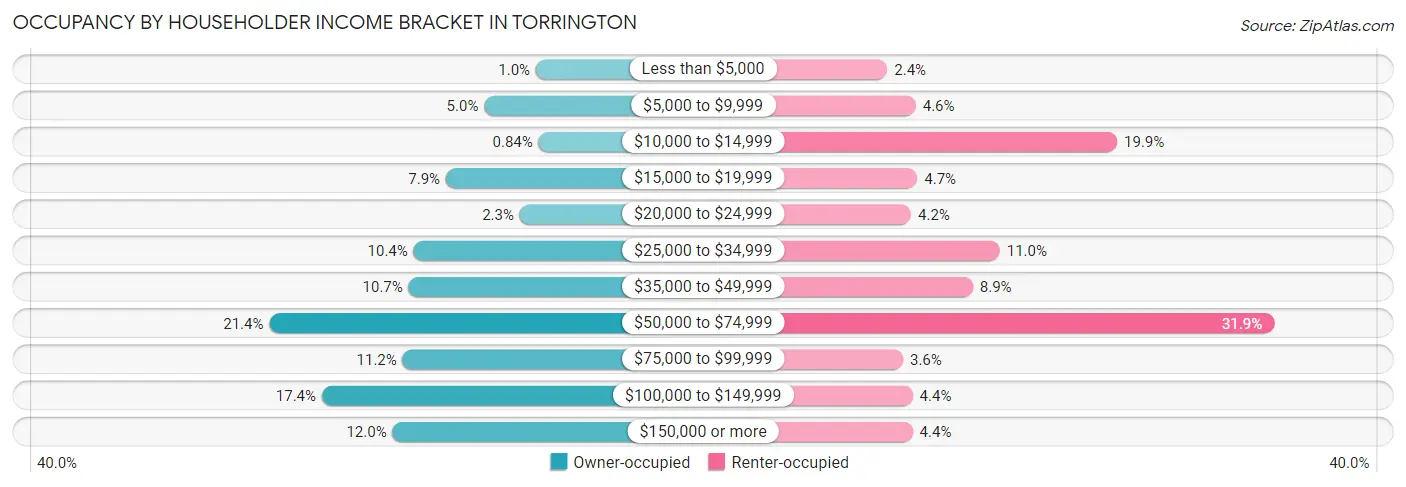
| Income Bracket | Owner-occupied | Renter-occupied |
| Less than $5,000 | 16 (1.0%) | 20 (2.4%) |
| $5,000 to $9,999 | 77 (5.0%) | 38 (4.6%) |
| $10,000 to $14,999 | 13 (0.8%) | 165 (19.9%) |
| $15,000 to $19,999 | 122 (7.9%) | 39 (4.7%) |
| $20,000 to $24,999 | 35 (2.3%) | 35 (4.2%) |
| $25,000 to $34,999 | 160 (10.4%) | 91 (11.0%) |
| $35,000 to $49,999 | 166 (10.7%) | 74 (8.9%) |
| $50,000 to $74,999 | 330 (21.4%) | 264 (31.9%) |
| $75,000 to $99,999 | 173 (11.2%) | 30 (3.6%) |
| $100,000 to $149,999 | 268 (17.3%) | 36 (4.3%) |
| $150,000 or more | 185 (12.0%) | 36 (4.3%) |
| Total | 1,545 (100.0%) | 828 (100.0%) |
Monthly Housing Cost Tiers in Torrington
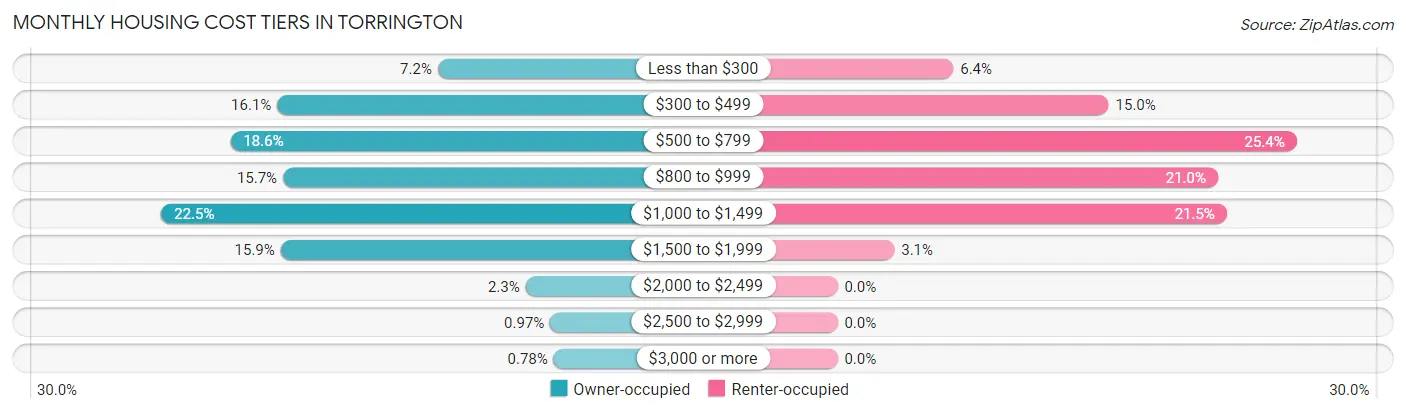
| Monthly Cost | Owner-occupied | Renter-occupied |
| Less than $300 | 111 (7.2%) | 53 (6.4%) |
| $300 to $499 | 248 (16.1%) | 124 (15.0%) |
| $500 to $799 | 288 (18.6%) | 210 (25.4%) |
| $800 to $999 | 243 (15.7%) | 174 (21.0%) |
| $1,000 to $1,499 | 347 (22.5%) | 178 (21.5%) |
| $1,500 to $1,999 | 245 (15.9%) | 26 (3.1%) |
| $2,000 to $2,499 | 36 (2.3%) | 0 (0.0%) |
| $2,500 to $2,999 | 15 (1.0%) | 0 (0.0%) |
| $3,000 or more | 12 (0.8%) | 0 (0.0%) |
| Total | 1,545 (100.0%) | 828 (100.0%) |
Physical Housing Characteristics in Torrington
Housing Structures in Torrington
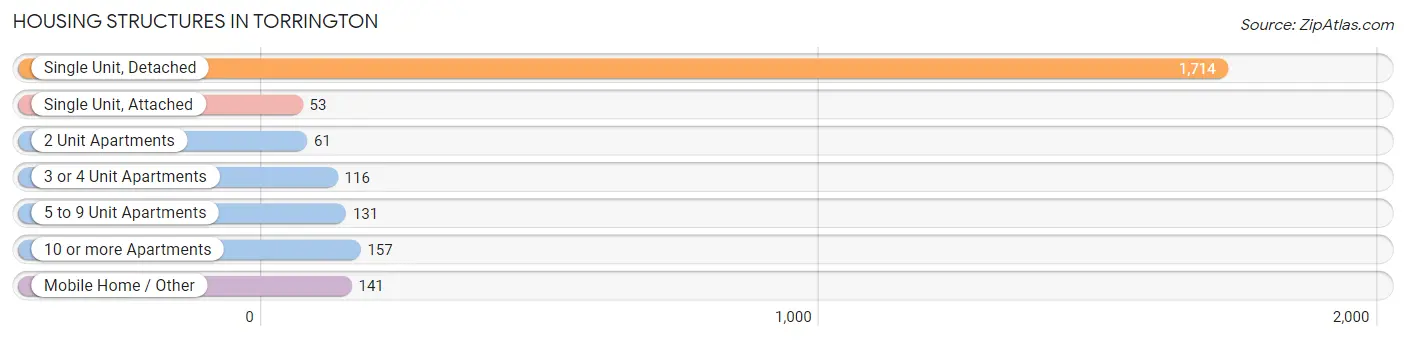
| Structure Type | # Housing Units | % Housing Units |
| Single Unit, Detached | 1,714 | 72.2% |
| Single Unit, Attached | 53 | 2.2% |
| 2 Unit Apartments | 61 | 2.6% |
| 3 or 4 Unit Apartments | 116 | 4.9% |
| 5 to 9 Unit Apartments | 131 | 5.5% |
| 10 or more Apartments | 157 | 6.6% |
| Mobile Home / Other | 141 | 5.9% |
| Total | 2,373 | 100.0% |
Housing Structures by Occupancy in Torrington
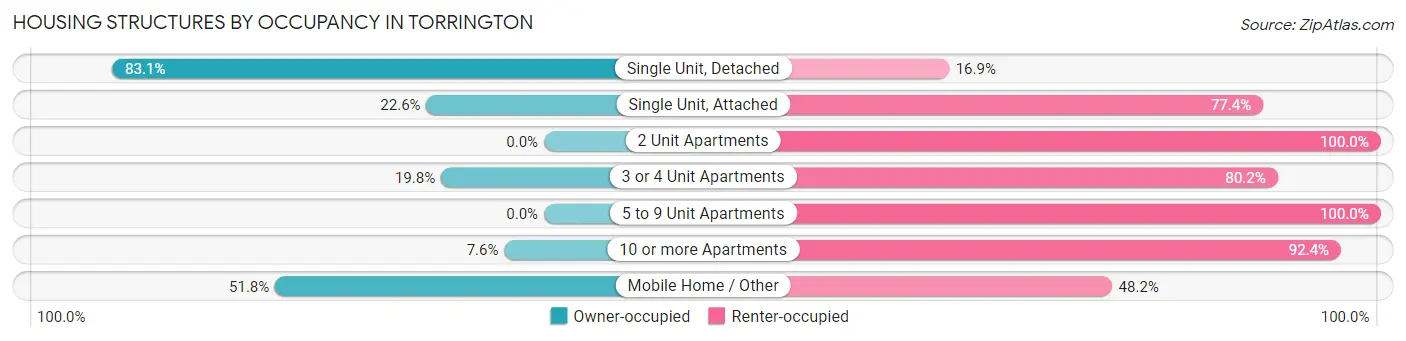
| Structure Type | Owner-occupied | Renter-occupied |
| Single Unit, Detached | 1,425 (83.1%) | 289 (16.9%) |
| Single Unit, Attached | 12 (22.6%) | 41 (77.4%) |
| 2 Unit Apartments | 0 (0.0%) | 61 (100.0%) |
| 3 or 4 Unit Apartments | 23 (19.8%) | 93 (80.2%) |
| 5 to 9 Unit Apartments | 0 (0.0%) | 131 (100.0%) |
| 10 or more Apartments | 12 (7.6%) | 145 (92.4%) |
| Mobile Home / Other | 73 (51.8%) | 68 (48.2%) |
| Total | 1,545 (65.1%) | 828 (34.9%) |
Housing Structures by Number of Rooms in Torrington
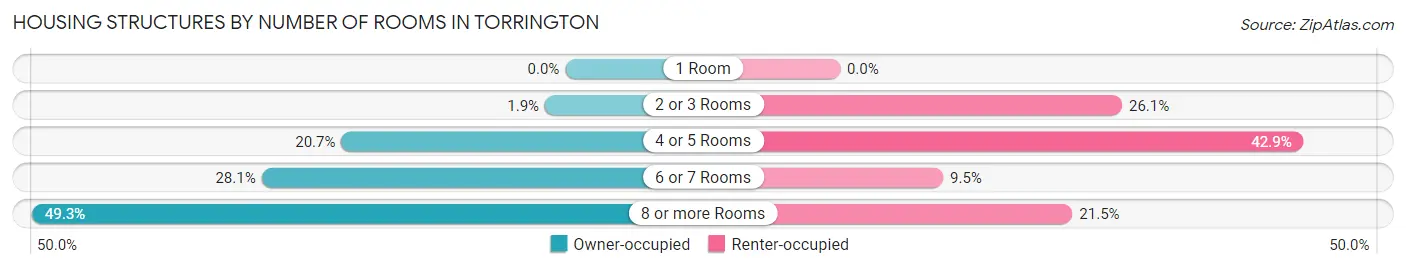
| Number of Rooms | Owner-occupied | Renter-occupied |
| 1 Room | 0 (0.0%) | 0 (0.0%) |
| 2 or 3 Rooms | 29 (1.9%) | 216 (26.1%) |
| 4 or 5 Rooms | 320 (20.7%) | 355 (42.9%) |
| 6 or 7 Rooms | 434 (28.1%) | 79 (9.5%) |
| 8 or more Rooms | 762 (49.3%) | 178 (21.5%) |
| Total | 1,545 (100.0%) | 828 (100.0%) |
Housing Structure by Heating Type in Torrington
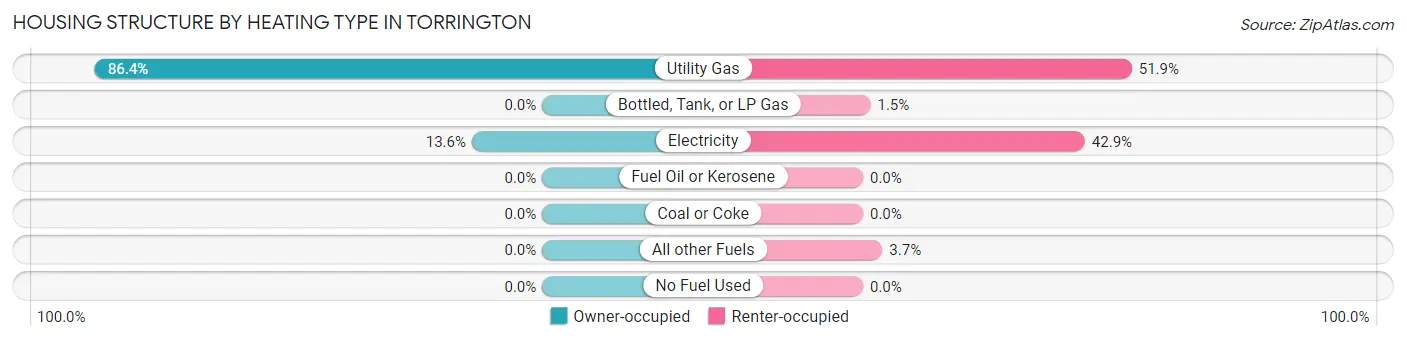
| Heating Type | Owner-occupied | Renter-occupied |
| Utility Gas | 1,335 (86.4%) | 430 (51.9%) |
| Bottled, Tank, or LP Gas | 0 (0.0%) | 12 (1.5%) |
| Electricity | 210 (13.6%) | 355 (42.9%) |
| Fuel Oil or Kerosene | 0 (0.0%) | 0 (0.0%) |
| Coal or Coke | 0 (0.0%) | 0 (0.0%) |
| All other Fuels | 0 (0.0%) | 31 (3.7%) |
| No Fuel Used | 0 (0.0%) | 0 (0.0%) |
| Total | 1,545 (100.0%) | 828 (100.0%) |
Household Vehicle Usage in Torrington
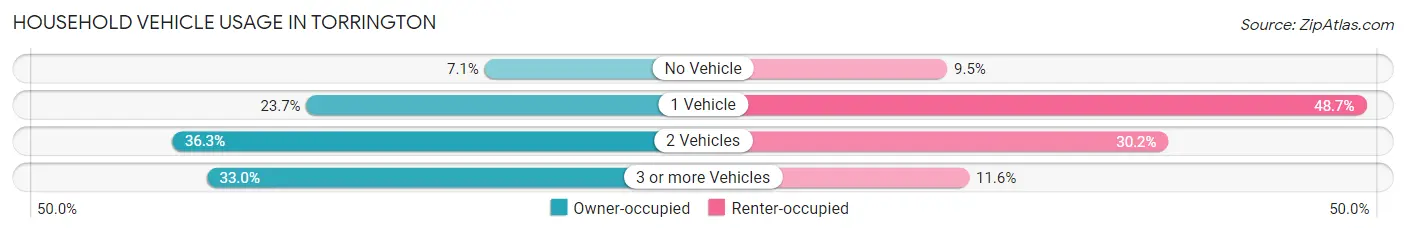
| Vehicles per Household | Owner-occupied | Renter-occupied |
| No Vehicle | 109 (7.1%) | 79 (9.5%) |
| 1 Vehicle | 366 (23.7%) | 403 (48.7%) |
| 2 Vehicles | 560 (36.2%) | 250 (30.2%) |
| 3 or more Vehicles | 510 (33.0%) | 96 (11.6%) |
| Total | 1,545 (100.0%) | 828 (100.0%) |
Real Estate & Mortgages in Torrington
Real Estate and Mortgage Overview in Torrington
| Characteristic | Without Mortgage | With Mortgage |
| Housing Units | 563 | 982 |
| Median Property Value | $172,500 | $184,800 |
| Median Household Income | $37,750 | $133 |
| Monthly Housing Costs | $461 | $12 |
| Real Estate Taxes | $1,255 | $65 |
Property Value by Mortgage Status in Torrington
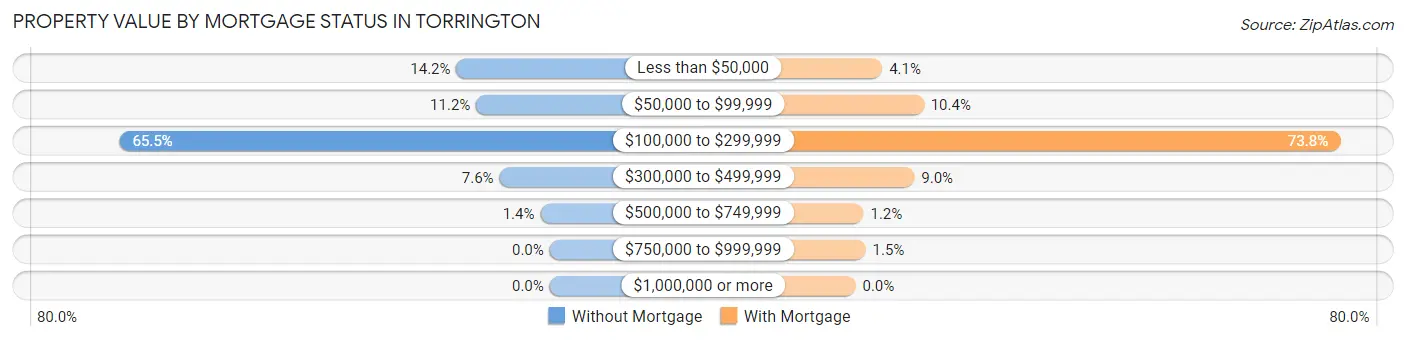
| Property Value | Without Mortgage | With Mortgage |
| Less than $50,000 | 80 (14.2%) | 40 (4.1%) |
| $50,000 to $99,999 | 63 (11.2%) | 102 (10.4%) |
| $100,000 to $299,999 | 369 (65.5%) | 725 (73.8%) |
| $300,000 to $499,999 | 43 (7.6%) | 88 (9.0%) |
| $500,000 to $749,999 | 8 (1.4%) | 12 (1.2%) |
| $750,000 to $999,999 | 0 (0.0%) | 15 (1.5%) |
| $1,000,000 or more | 0 (0.0%) | 0 (0.0%) |
| Total | 563 (100.0%) | 982 (100.0%) |
Household Income by Mortgage Status in Torrington
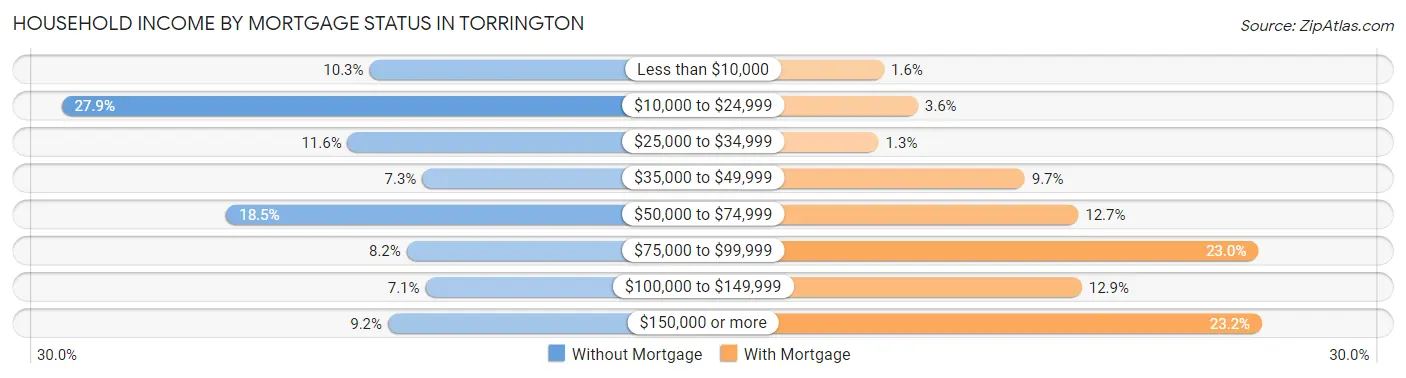
| Household Income | Without Mortgage | With Mortgage |
| Less than $10,000 | 58 (10.3%) | 16 (1.6%) |
| $10,000 to $24,999 | 157 (27.9%) | 35 (3.6%) |
| $25,000 to $34,999 | 65 (11.6%) | 13 (1.3%) |
| $35,000 to $49,999 | 41 (7.3%) | 95 (9.7%) |
| $50,000 to $74,999 | 104 (18.5%) | 125 (12.7%) |
| $75,000 to $99,999 | 46 (8.2%) | 226 (23.0%) |
| $100,000 to $149,999 | 40 (7.1%) | 127 (12.9%) |
| $150,000 or more | 52 (9.2%) | 228 (23.2%) |
| Total | 563 (100.0%) | 982 (100.0%) |
Property Value to Household Income Ratio in Torrington
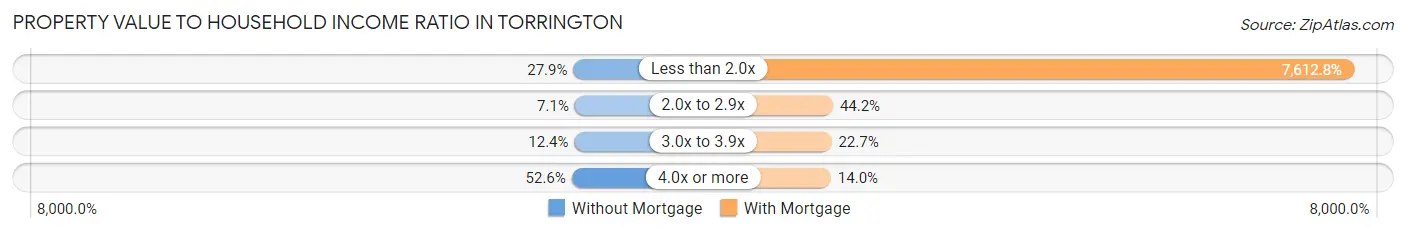
| Value-to-Income Ratio | Without Mortgage | With Mortgage |
| Less than 2.0x | 157 (27.9%) | 74,758 (7,612.8%) |
| 2.0x to 2.9x | 40 (7.1%) | 434 (44.2%) |
| 3.0x to 3.9x | 70 (12.4%) | 223 (22.7%) |
| 4.0x or more | 296 (52.6%) | 137 (14.0%) |
| Total | 563 (100.0%) | 982 (100.0%) |
Real Estate Taxes by Mortgage Status in Torrington
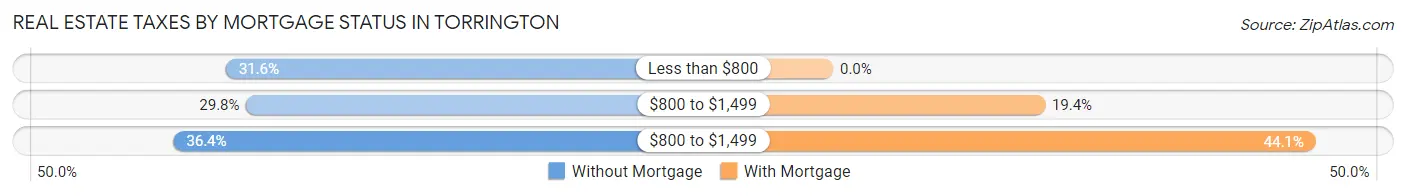
| Property Taxes | Without Mortgage | With Mortgage |
| Less than $800 | 178 (31.6%) | 0 (0.0%) |
| $800 to $1,499 | 168 (29.8%) | 190 (19.4%) |
| $800 to $1,499 | 205 (36.4%) | 433 (44.1%) |
| Total | 563 (100.0%) | 982 (100.0%) |
Health & Disability in Torrington
Health Insurance Coverage by Age in Torrington
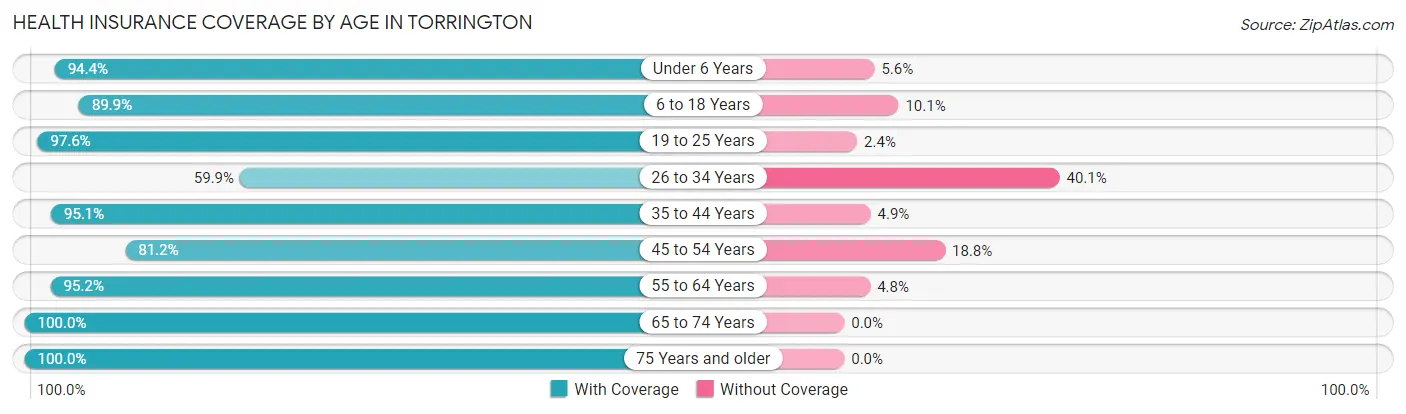
| Age Bracket | With Coverage | Without Coverage |
| Under 6 Years | 470 (94.4%) | 28 (5.6%) |
| 6 to 18 Years | 711 (89.9%) | 80 (10.1%) |
| 19 to 25 Years | 447 (97.6%) | 11 (2.4%) |
| 26 to 34 Years | 264 (59.9%) | 177 (40.1%) |
| 35 to 44 Years | 524 (95.1%) | 27 (4.9%) |
| 45 to 54 Years | 640 (81.2%) | 148 (18.8%) |
| 55 to 64 Years | 670 (95.2%) | 34 (4.8%) |
| 65 to 74 Years | 586 (100.0%) | 0 (0.0%) |
| 75 Years and older | 643 (100.0%) | 0 (0.0%) |
| Total | 4,955 (90.7%) | 505 (9.2%) |
Health Insurance Coverage by Citizenship Status in Torrington
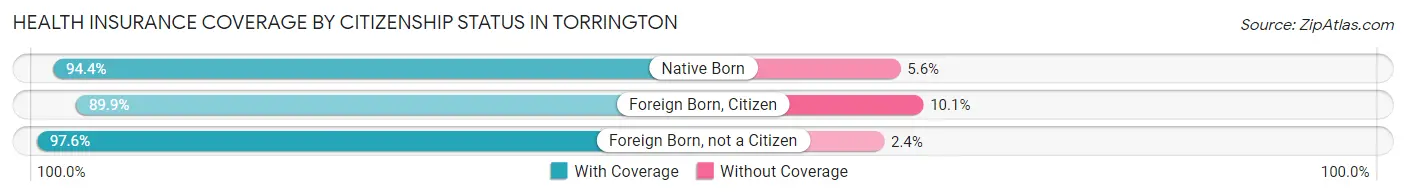
| Citizenship Status | With Coverage | Without Coverage |
| Native Born | 470 (94.4%) | 28 (5.6%) |
| Foreign Born, Citizen | 711 (89.9%) | 80 (10.1%) |
| Foreign Born, not a Citizen | 447 (97.6%) | 11 (2.4%) |
Health Insurance Coverage by Household Income in Torrington
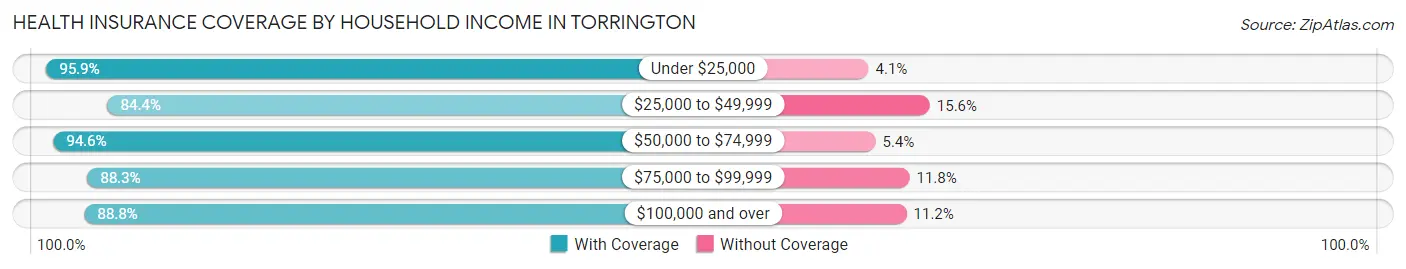
| Household Income | With Coverage | Without Coverage |
| Under $25,000 | 728 (95.9%) | 31 (4.1%) |
| $25,000 to $49,999 | 711 (84.4%) | 131 (15.6%) |
| $50,000 to $74,999 | 1,302 (94.6%) | 74 (5.4%) |
| $75,000 to $99,999 | 428 (88.2%) | 57 (11.7%) |
| $100,000 and over | 1,624 (88.8%) | 205 (11.2%) |
Public vs Private Health Insurance Coverage by Age in Torrington
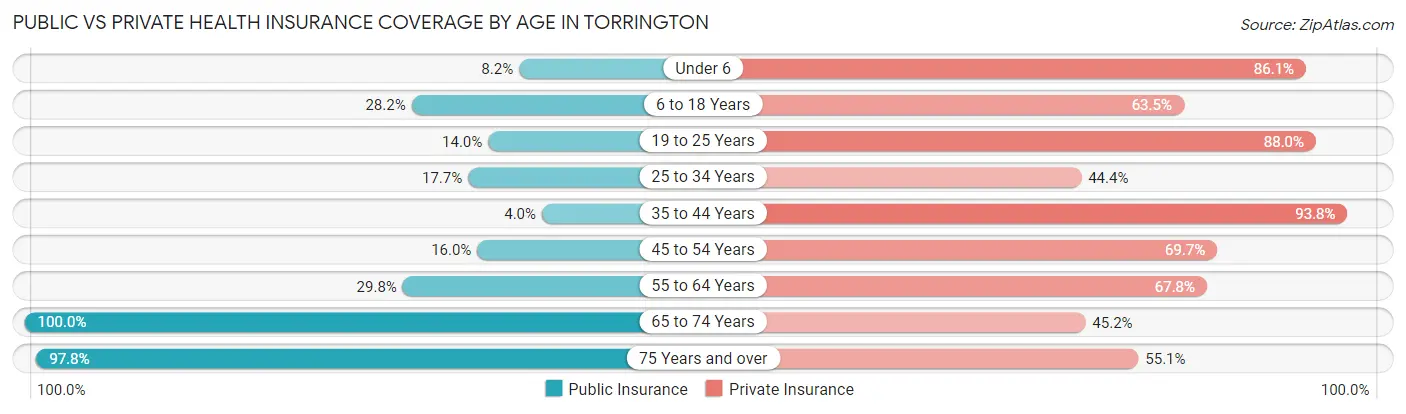
| Age Bracket | Public Insurance | Private Insurance |
| Under 6 | 41 (8.2%) | 429 (86.1%) |
| 6 to 18 Years | 223 (28.2%) | 502 (63.5%) |
| 19 to 25 Years | 64 (14.0%) | 403 (88.0%) |
| 25 to 34 Years | 78 (17.7%) | 196 (44.4%) |
| 35 to 44 Years | 22 (4.0%) | 517 (93.8%) |
| 45 to 54 Years | 126 (16.0%) | 549 (69.7%) |
| 55 to 64 Years | 210 (29.8%) | 477 (67.8%) |
| 65 to 74 Years | 586 (100.0%) | 265 (45.2%) |
| 75 Years and over | 629 (97.8%) | 354 (55.0%) |
| Total | 1,979 (36.2%) | 3,692 (67.6%) |
Disability Status by Sex by Age in Torrington
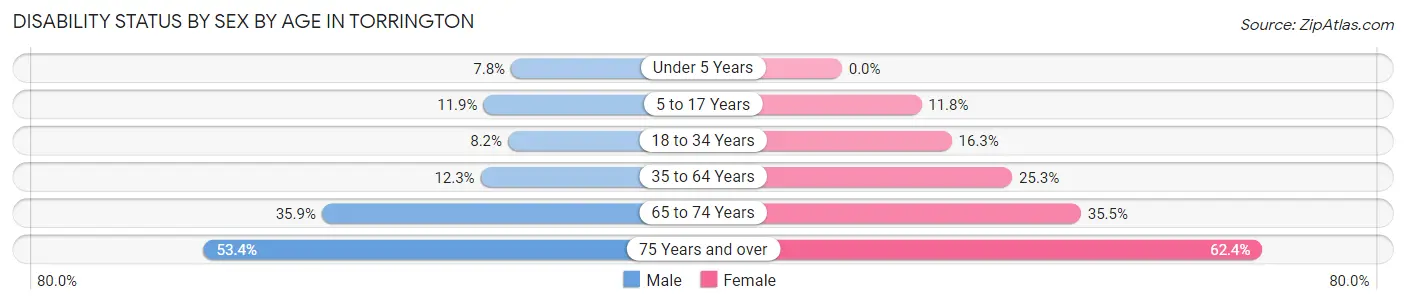
| Age Bracket | Male | Female |
| Under 5 Years | 19 (7.8%) | 0 (0.0%) |
| 5 to 17 Years | 39 (11.9%) | 55 (11.8%) |
| 18 to 34 Years | 36 (8.2%) | 99 (16.3%) |
| 35 to 64 Years | 123 (12.3%) | 264 (25.3%) |
| 65 to 74 Years | 94 (35.9%) | 115 (35.5%) |
| 75 Years and over | 133 (53.4%) | 246 (62.4%) |
Disability Class by Sex by Age in Torrington
Disability Class: Hearing Difficulty
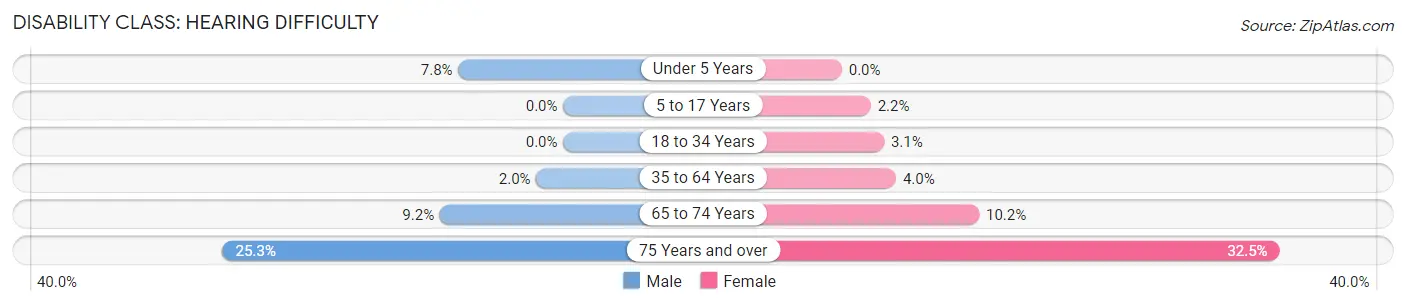
| Age Bracket | Male | Female |
| Under 5 Years | 19 (7.8%) | 0 (0.0%) |
| 5 to 17 Years | 0 (0.0%) | 10 (2.1%) |
| 18 to 34 Years | 0 (0.0%) | 19 (3.1%) |
| 35 to 64 Years | 20 (2.0%) | 42 (4.0%) |
| 65 to 74 Years | 24 (9.2%) | 33 (10.2%) |
| 75 Years and over | 63 (25.3%) | 128 (32.5%) |
Disability Class: Vision Difficulty
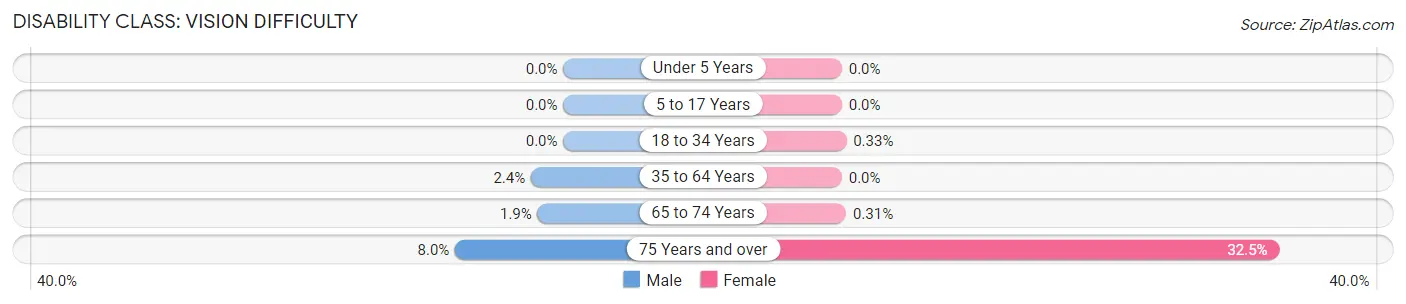
| Age Bracket | Male | Female |
| Under 5 Years | 0 (0.0%) | 0 (0.0%) |
| 5 to 17 Years | 0 (0.0%) | 0 (0.0%) |
| 18 to 34 Years | 0 (0.0%) | 2 (0.3%) |
| 35 to 64 Years | 24 (2.4%) | 0 (0.0%) |
| 65 to 74 Years | 5 (1.9%) | 1 (0.3%) |
| 75 Years and over | 20 (8.0%) | 128 (32.5%) |
Disability Class: Cognitive Difficulty
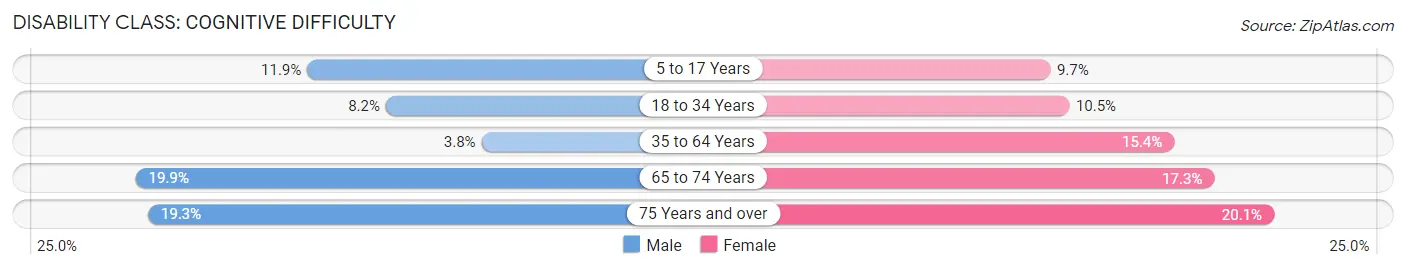
| Age Bracket | Male | Female |
| 5 to 17 Years | 39 (11.9%) | 45 (9.7%) |
| 18 to 34 Years | 36 (8.2%) | 64 (10.5%) |
| 35 to 64 Years | 38 (3.8%) | 161 (15.4%) |
| 65 to 74 Years | 52 (19.9%) | 56 (17.3%) |
| 75 Years and over | 48 (19.3%) | 79 (20.1%) |
Disability Class: Ambulatory Difficulty
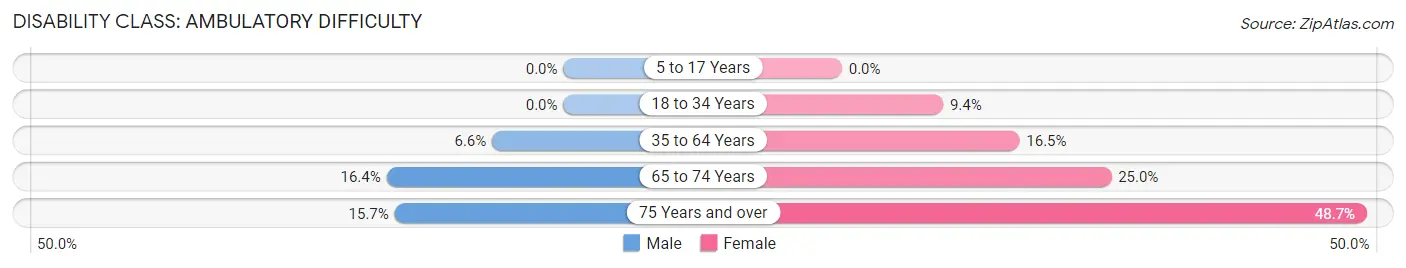
| Age Bracket | Male | Female |
| 5 to 17 Years | 0 (0.0%) | 0 (0.0%) |
| 18 to 34 Years | 0 (0.0%) | 57 (9.4%) |
| 35 to 64 Years | 66 (6.6%) | 172 (16.5%) |
| 65 to 74 Years | 43 (16.4%) | 81 (25.0%) |
| 75 Years and over | 39 (15.7%) | 192 (48.7%) |
Disability Class: Self-Care Difficulty
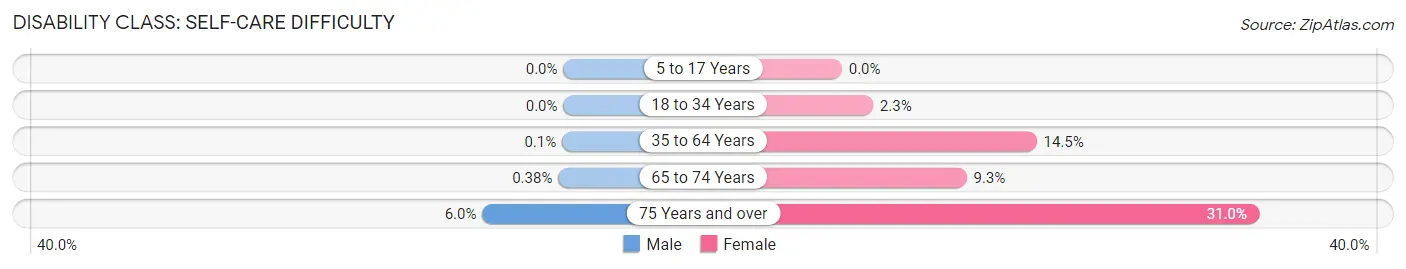
| Age Bracket | Male | Female |
| 5 to 17 Years | 0 (0.0%) | 0 (0.0%) |
| 18 to 34 Years | 0 (0.0%) | 14 (2.3%) |
| 35 to 64 Years | 1 (0.1%) | 151 (14.5%) |
| 65 to 74 Years | 1 (0.4%) | 30 (9.3%) |
| 75 Years and over | 15 (6.0%) | 122 (31.0%) |
Technology Access in Torrington
Computing Device Access in Torrington
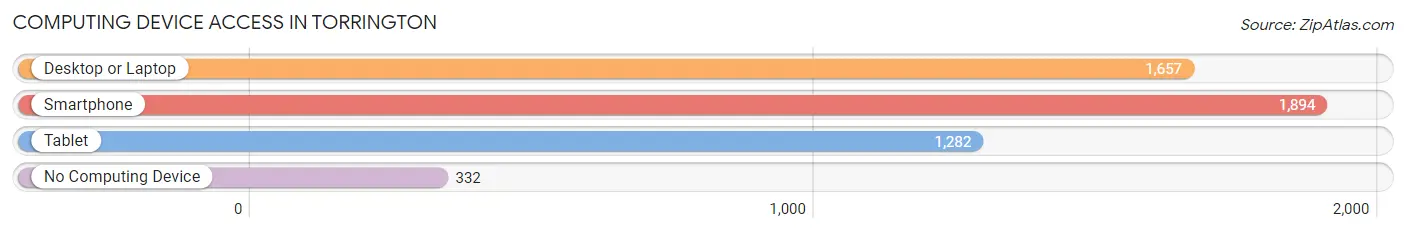
| Device Type | # Households | % Households |
| Desktop or Laptop | 1,657 | 69.8% |
| Smartphone | 1,894 | 79.8% |
| Tablet | 1,282 | 54.0% |
| No Computing Device | 332 | 14.0% |
| Total | 2,373 | 100.0% |
Internet Access in Torrington
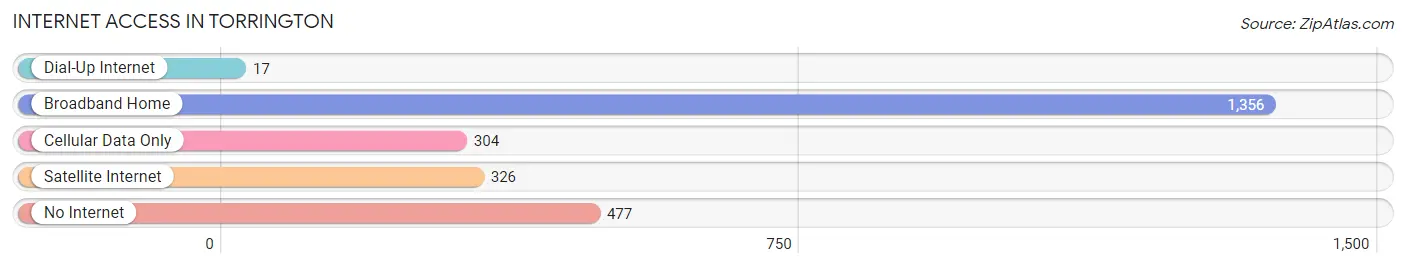
| Internet Type | # Households | % Households |
| Dial-Up Internet | 17 | 0.7% |
| Broadband Home | 1,356 | 57.1% |
| Cellular Data Only | 304 | 12.8% |
| Satellite Internet | 326 | 13.7% |
| No Internet | 477 | 20.1% |
| Total | 2,373 | 100.0% |
Torrington Summary
Torrington, Wyoming is a small city located in the eastern part of the state, near the Nebraska border. It is the county seat of Goshen County and has a population of approximately 5,000 people. The city is located in the High Plains region of Wyoming, and is surrounded by rolling hills and prairies.
History
The area around Torrington was first settled in the late 1800s by homesteaders. The town was officially founded in 1887 and was named after Torrington, Connecticut. The city was incorporated in 1890 and quickly became a center of commerce and industry for the region. The Union Pacific Railroad arrived in Torrington in 1891, and the city soon became a major shipping hub for the region.
In the early 1900s, Torrington experienced a period of rapid growth. The city was home to several businesses, including a flour mill, a creamery, a brickyard, and a lumberyard. The city also had a number of churches, schools, and other civic organizations.
Geography
Torrington is located in the eastern part of Wyoming, near the Nebraska border. The city is situated in the High Plains region of the state, and is surrounded by rolling hills and prairies. The city is located at the intersection of US Highway 26 and Wyoming Highway 156.
The city is located at an elevation of 4,400 feet above sea level. The climate in Torrington is semi-arid, with hot summers and cold winters. The average annual precipitation is approximately 16 inches.
Economy
The economy of Torrington is largely based on agriculture and ranching. The city is home to several large farms and ranches, which produce a variety of crops and livestock. The city is also home to several manufacturing companies, including a plastics factory and a metal fabrication plant.
The city is also home to several retail stores, restaurants, and other businesses. The city is served by the Union Pacific Railroad, which provides freight and passenger service to the region.
Demographics
As of the 2010 census, the population of Torrington was 5,037. The racial makeup of the city was 94.3% White, 0.7% African American, 0.7% Native American, 0.3% Asian, 0.1% Pacific Islander, 1.7% from other races, and 2.0% from two or more races. Hispanic or Latino of any race were 4.3% of the population.
The median household income in Torrington was $41,944, and the median family income was $50,944. The per capita income for the city was $20,845. About 11.3% of families and 14.2% of the population were below the poverty line, including 19.2% of those under age 18 and 8.2% of those age 65 or over.
Torrington is served by the Goshen County School District, which includes two elementary schools, one middle school, and one high school. The city is also home to Eastern Wyoming College, a two-year community college.
Common Questions
What is Per Capita Income in Torrington?
Per Capita income in Torrington is $30,777.
What is the Median Family Income in Torrington?
Median Family Income in Torrington is $72,901.
What is the Median Household income in Torrington?
Median Household Income in Torrington is $55,434.
What is Income or Wage Gap in Torrington?
Income or Wage Gap in Torrington is 35.2%.
Women in Torrington earn 64.8 cents for every dollar earned by a man.
What is Inequality or Gini Index in Torrington?
Inequality or Gini Index in Torrington is 0.46.
What is the Total Population of Torrington?
Total Population of Torrington is 6,161.
What is the Total Male Population of Torrington?
Total Male Population of Torrington is 3,146.
What is the Total Female Population of Torrington?
Total Female Population of Torrington is 3,015.
What is the Ratio of Males per 100 Females in Torrington?
There are 104.34 Males per 100 Females in Torrington.
What is the Ratio of Females per 100 Males in Torrington?
There are 95.84 Females per 100 Males in Torrington.
What is the Median Population Age in Torrington?
Median Population Age in Torrington is 44.0 Years.
What is the Average Family Size in Torrington
Average Family Size in Torrington is 3.0 People.
What is the Average Household Size in Torrington
Average Household Size in Torrington is 2.2 People.
How Large is the Labor Force in Torrington?
There are 2,718 People in the Labor Forcein in Torrington.
What is the Percentage of People in the Labor Force in Torrington?
52.6% of People are in the Labor Force in Torrington.
What is the Unemployment Rate in Torrington?
Unemployment Rate in Torrington is 4.9%.