Evanston, WY
Evanston Map
Evanston Overview
11,801
TOTAL POPULATION
5,868
MALE POPULATION
5,933
FEMALE POPULATION
98.90
MALES / 100 FEMALES
101.11
FEMALES / 100 MALES
35.7
MEDIAN AGE
3.3
AVG FAMILY SIZE
2.5
AVG HOUSEHOLD SIZE
$30,393
PER CAPITA INCOME
$78,813
AVG FAMILY INCOME
$70,825
AVG HOUSEHOLD INCOME
54.6%
WAGE / INCOME GAP [ % ]
45.4¢/ $1
WAGE / INCOME GAP [ $ ]
0.35
INEQUALITY / GINI INDEX
6,081
LABOR FORCE [ PEOPLE ]
68.1%
PERCENT IN LABOR FORCE
4.2%
UNEMPLOYMENT RATE
Evanston Zip Codes
Evanston Area Codes
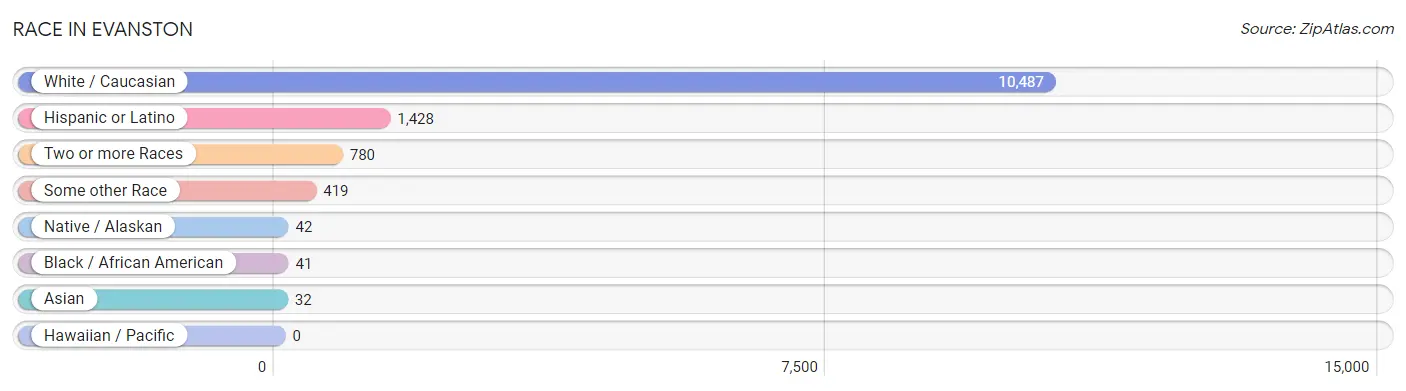
Race in Evanston
The most populous races in Evanston are White / Caucasian (10,487 | 88.9%), Hispanic or Latino (1,428 | 12.1%), and Two or more Races (780 | 6.6%).
| Race | # Population | % Population |
| Asian | 32 | 0.3% |
| Black / African American | 41 | 0.4% |
| Hawaiian / Pacific | 0 | 0.0% |
| Hispanic or Latino | 1,428 | 12.1% |
| Native / Alaskan | 42 | 0.4% |
| White / Caucasian | 10,487 | 88.9% |
| Two or more Races | 780 | 6.6% |
| Some other Race | 419 | 3.5% |
| Total | 11,801 | 100.0% |
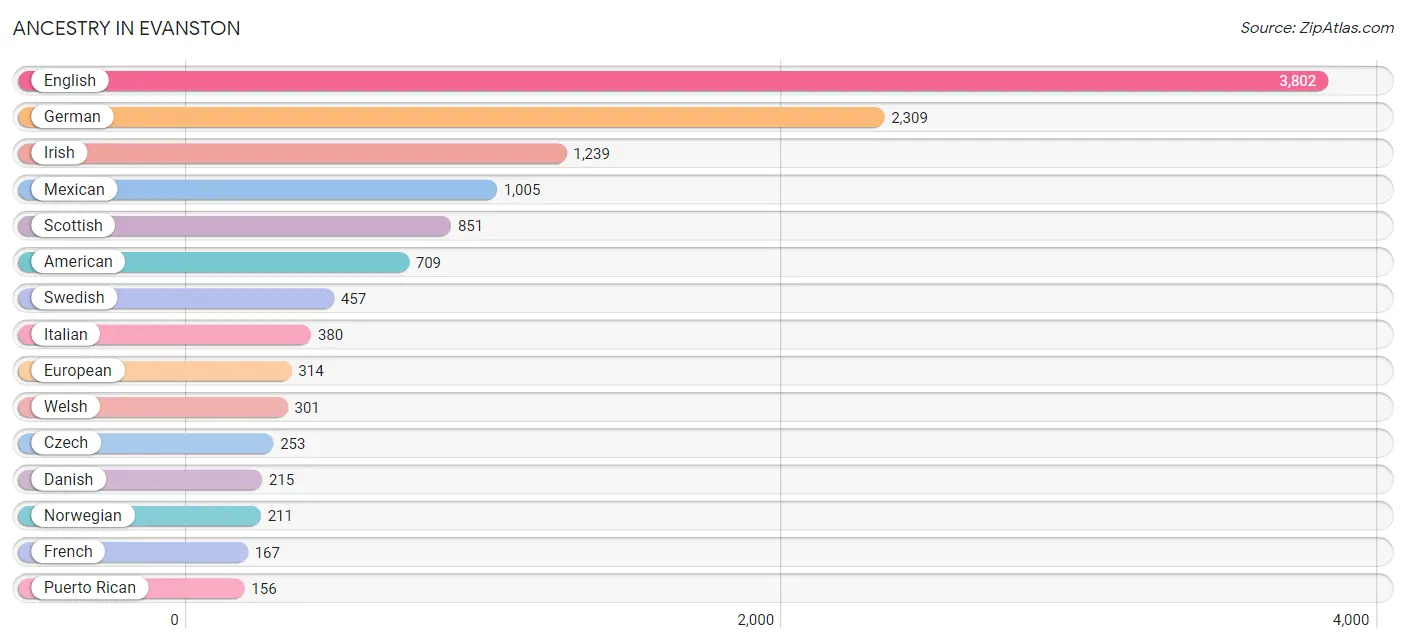
Ancestry in Evanston
The most populous ancestries reported in Evanston are English (3,802 | 32.2%), German (2,309 | 19.6%), Irish (1,239 | 10.5%), Mexican (1,005 | 8.5%), and Scottish (851 | 7.2%), together accounting for 78.0% of all Evanston residents.
| Ancestry | # Population | % Population |
| American | 709 | 6.0% |
| Apache | 45 | 0.4% |
| Austrian | 30 | 0.3% |
| Basque | 51 | 0.4% |
| Bhutanese | 82 | 0.7% |
| British | 102 | 0.9% |
| Cajun | 3 | 0.0% |
| Central American | 112 | 0.9% |
| Central American Indian | 100 | 0.9% |
| Cherokee | 105 | 0.9% |
| Cheyenne | 30 | 0.3% |
| Choctaw | 57 | 0.5% |
| Czech | 253 | 2.1% |
| Danish | 215 | 1.8% |
| Dutch | 125 | 1.1% |
| English | 3,802 | 32.2% |
| European | 314 | 2.7% |
| Finnish | 8 | 0.1% |
| French | 167 | 1.4% |
| French Canadian | 102 | 0.9% |
| German | 2,309 | 19.6% |
| Greek | 8 | 0.1% |
| Guatemalan | 112 | 0.9% |
| Hungarian | 20 | 0.2% |
| Irish | 1,239 | 10.5% |
| Italian | 380 | 3.2% |
| Korean | 74 | 0.6% |
| Lithuanian | 15 | 0.1% |
| Mexican | 1,005 | 8.5% |
| Native Hawaiian | 7 | 0.1% |
| Navajo | 64 | 0.5% |
| Nigerian | 24 | 0.2% |
| Northern European | 22 | 0.2% |
| Norwegian | 211 | 1.8% |
| Osage | 29 | 0.3% |
| Paiute | 10 | 0.1% |
| Polish | 106 | 0.9% |
| Portuguese | 21 | 0.2% |
| Puerto Rican | 156 | 1.3% |
| Russian | 41 | 0.4% |
| Scandinavian | 116 | 1.0% |
| Scotch-Irish | 149 | 1.3% |
| Scottish | 851 | 7.2% |
| Slovak | 19 | 0.2% |
| Spaniard | 7 | 0.1% |
| Spanish | 21 | 0.2% |
| Spanish American | 12 | 0.1% |
| Subsaharan African | 24 | 0.2% |
| Swedish | 457 | 3.9% |
| Swiss | 33 | 0.3% |
| Ute | 45 | 0.4% |
| Welsh | 301 | 2.5% |
| Yugoslavian | 47 | 0.4% | View All 53 Rows |
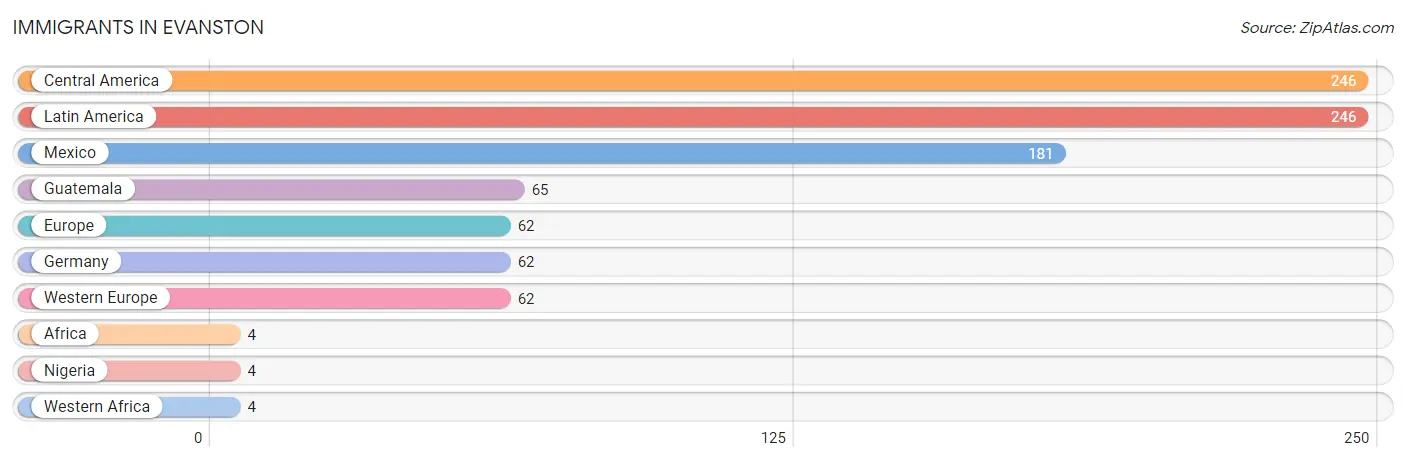
Immigrants in Evanston
The most numerous immigrant groups reported in Evanston came from Central America (246 | 2.1%), Latin America (246 | 2.1%), Mexico (181 | 1.5%), Guatemala (65 | 0.5%), and Europe (62 | 0.5%), together accounting for 6.8% of all Evanston residents.
| Immigration Origin | # Population | % Population |
| Africa | 4 | 0.0% |
| Central America | 246 | 2.1% |
| Europe | 62 | 0.5% |
| Germany | 62 | 0.5% |
| Guatemala | 65 | 0.5% |
| Latin America | 246 | 2.1% |
| Mexico | 181 | 1.5% |
| Nigeria | 4 | 0.0% |
| Western Africa | 4 | 0.0% |
| Western Europe | 62 | 0.5% | View All 10 Rows |
Sex and Age in Evanston
Sex and Age in Evanston
The most populous age groups in Evanston are 5 to 9 Years (567 | 9.7%) for men and 20 to 24 Years (517 | 8.7%) for women.
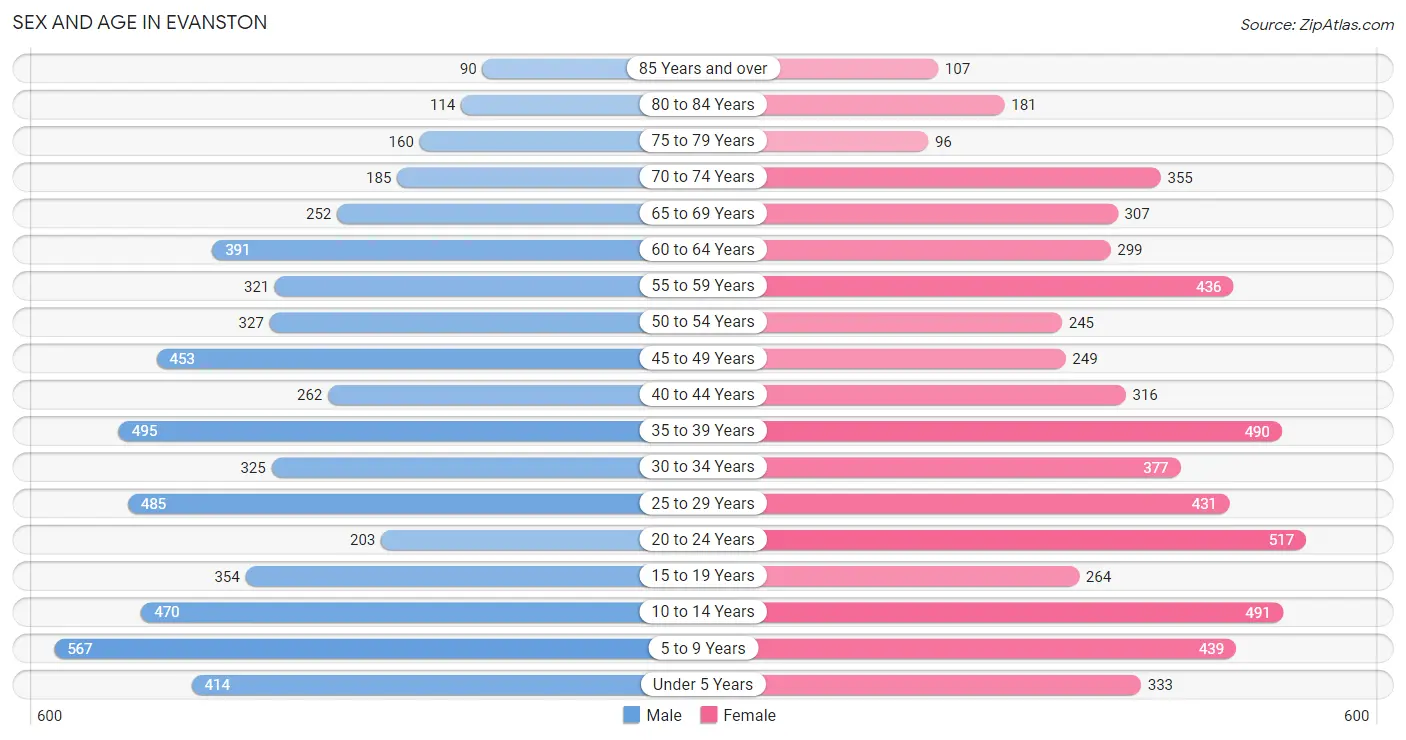
| Age Bracket | Male | Female |
| Under 5 Years | 414 (7.1%) | 333 (5.6%) |
| 5 to 9 Years | 567 (9.7%) | 439 (7.4%) |
| 10 to 14 Years | 470 (8.0%) | 491 (8.3%) |
| 15 to 19 Years | 354 (6.0%) | 264 (4.4%) |
| 20 to 24 Years | 203 (3.5%) | 517 (8.7%) |
| 25 to 29 Years | 485 (8.3%) | 431 (7.3%) |
| 30 to 34 Years | 325 (5.5%) | 377 (6.4%) |
| 35 to 39 Years | 495 (8.4%) | 490 (8.3%) |
| 40 to 44 Years | 262 (4.5%) | 316 (5.3%) |
| 45 to 49 Years | 453 (7.7%) | 249 (4.2%) |
| 50 to 54 Years | 327 (5.6%) | 245 (4.1%) |
| 55 to 59 Years | 321 (5.5%) | 436 (7.3%) |
| 60 to 64 Years | 391 (6.7%) | 299 (5.0%) |
| 65 to 69 Years | 252 (4.3%) | 307 (5.2%) |
| 70 to 74 Years | 185 (3.2%) | 355 (6.0%) |
| 75 to 79 Years | 160 (2.7%) | 96 (1.6%) |
| 80 to 84 Years | 114 (1.9%) | 181 (3.0%) |
| 85 Years and over | 90 (1.5%) | 107 (1.8%) |
| Total | 5,868 (100.0%) | 5,933 (100.0%) |
Families and Households in Evanston
Median Family Size in Evanston
The median family size in Evanston is 3.29 persons per family, with single male/father families (163 | 5.9%) accounting for the largest median family size of 3.52 persons per family. On the other hand, married-couple families (2,208 | 80.2%) represent the smallest median family size with 3.25 persons per family.
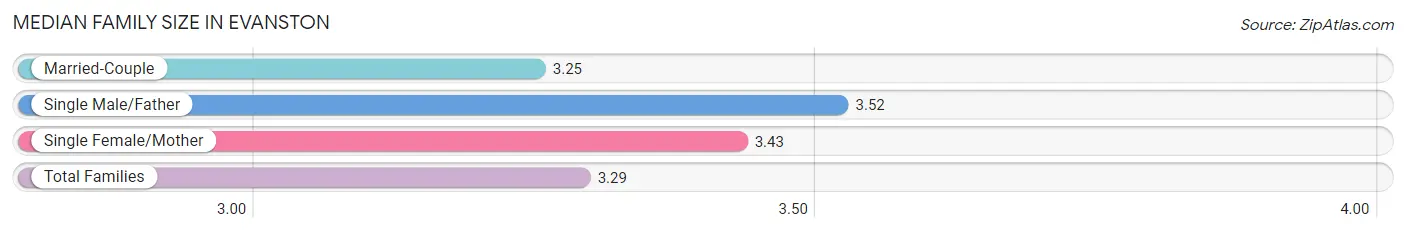
| Family Type | # Families | Family Size |
| Married-Couple | 2,208 (80.2%) | 3.25 |
| Single Male/Father | 163 (5.9%) | 3.52 |
| Single Female/Mother | 382 (13.9%) | 3.43 |
| Total Families | 2,753 (100.0%) | 3.29 |
Median Household Size in Evanston
The median household size in Evanston is 2.51 persons per household, with single female/mother households (382 | 8.3%) accounting for the largest median household size of 3.87 persons per household. non-family households (1,875 | 40.5%) represent the smallest median household size with 1.25 persons per household.
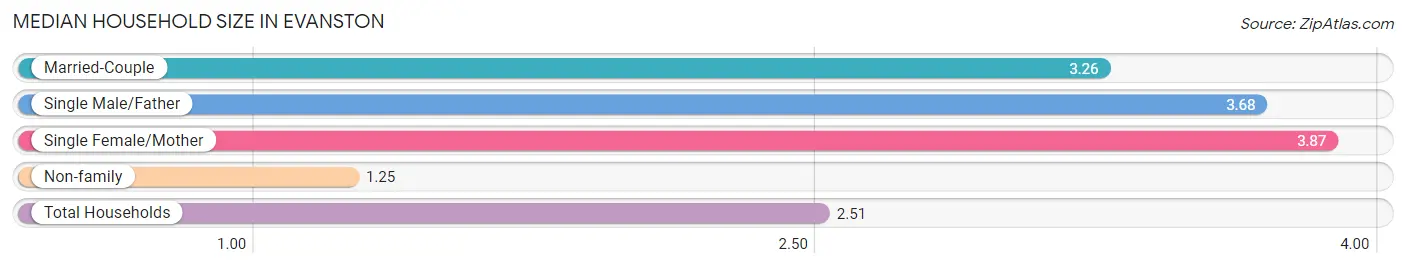
| Household Type | # Households | Household Size |
| Married-Couple | 2,208 (47.7%) | 3.26 |
| Single Male/Father | 163 (3.5%) | 3.68 |
| Single Female/Mother | 382 (8.3%) | 3.87 |
| Non-family | 1,875 (40.5%) | 1.25 |
| Total Households | 4,628 (100.0%) | 2.51 |
Household Size by Marriage Status in Evanston
Out of a total of 4,628 households in Evanston, 2,753 (59.5%) are family households, while 1,875 (40.5%) are nonfamily households. The most numerous type of family households are 2-person households, comprising 1,234, and the most common type of nonfamily households are 1-person households, comprising 1,629.
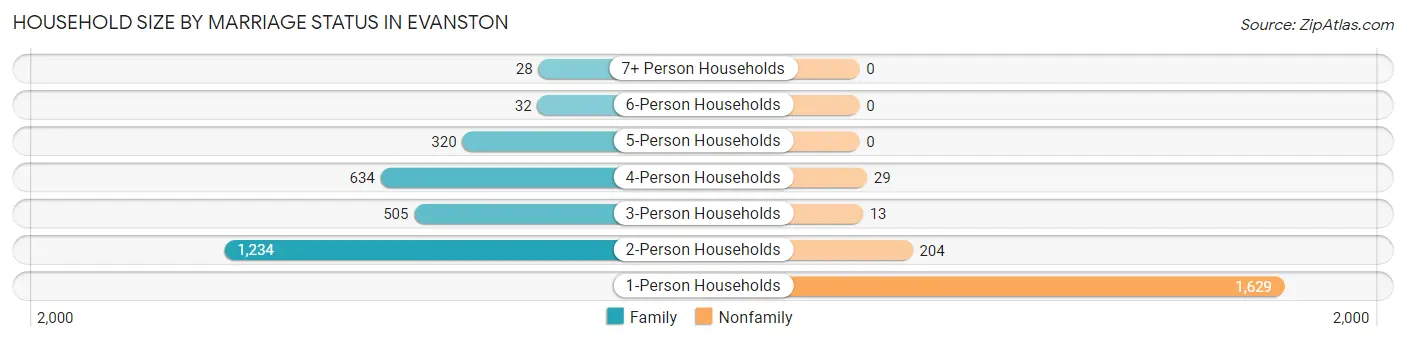
| Household Size | Family Households | Nonfamily Households |
| 1-Person Households | - | 1,629 (35.2%) |
| 2-Person Households | 1,234 (26.7%) | 204 (4.4%) |
| 3-Person Households | 505 (10.9%) | 13 (0.3%) |
| 4-Person Households | 634 (13.7%) | 29 (0.6%) |
| 5-Person Households | 320 (6.9%) | 0 (0.0%) |
| 6-Person Households | 32 (0.7%) | 0 (0.0%) |
| 7+ Person Households | 28 (0.6%) | 0 (0.0%) |
| Total | 2,753 (59.5%) | 1,875 (40.5%) |
Female Fertility in Evanston
Fertility by Age in Evanston
Average fertility rate in Evanston is 46.0 births per 1,000 women. Women in the age bracket of 20 to 34 years have the highest fertility rate with 90.0 births per 1,000 women. Women in the age bracket of 20 to 34 years acount for 95.2% of all women with births.
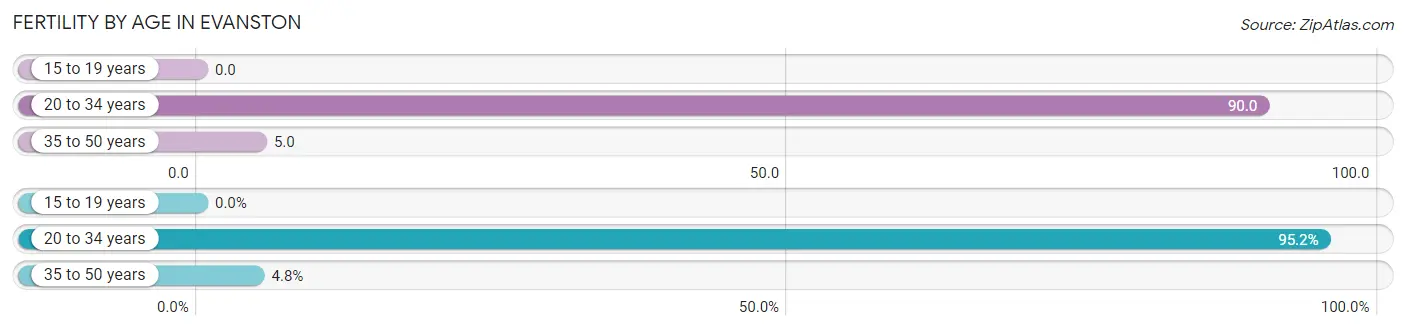
| Age Bracket | Women with Births | Births / 1,000 Women |
| 15 to 19 years | 0 (0.0%) | 0.0 |
| 20 to 34 years | 119 (95.2%) | 90.0 |
| 35 to 50 years | 6 (4.8%) | 5.0 |
| Total | 125 (100.0%) | 46.0 |
Fertility by Age by Marriage Status in Evanston
72.0% of women with births (125) in Evanston are married. The highest percentage of unmarried women with births falls into 20 to 34 years age bracket with 29.4% of them unmarried at the time of birth, while the lowest percentage of unmarried women with births belong to 35 to 50 years age bracket with 0.0% of them unmarried.
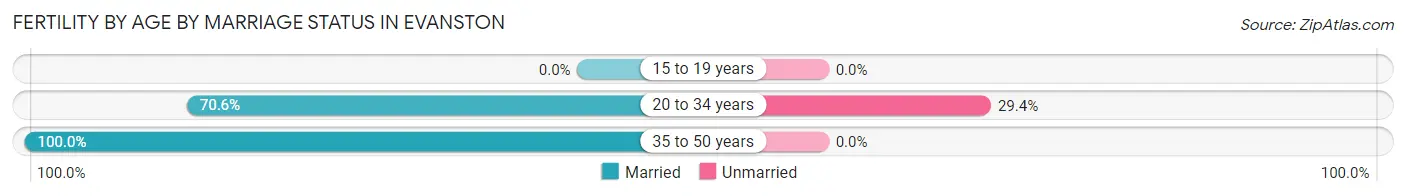
| Age Bracket | Married | Unmarried |
| 15 to 19 years | 0 (0.0%) | 0 (0.0%) |
| 20 to 34 years | 84 (70.6%) | 35 (29.4%) |
| 35 to 50 years | 6 (100.0%) | 0 (0.0%) |
| Total | 90 (72.0%) | 35 (28.0%) |
Fertility by Education in Evanston
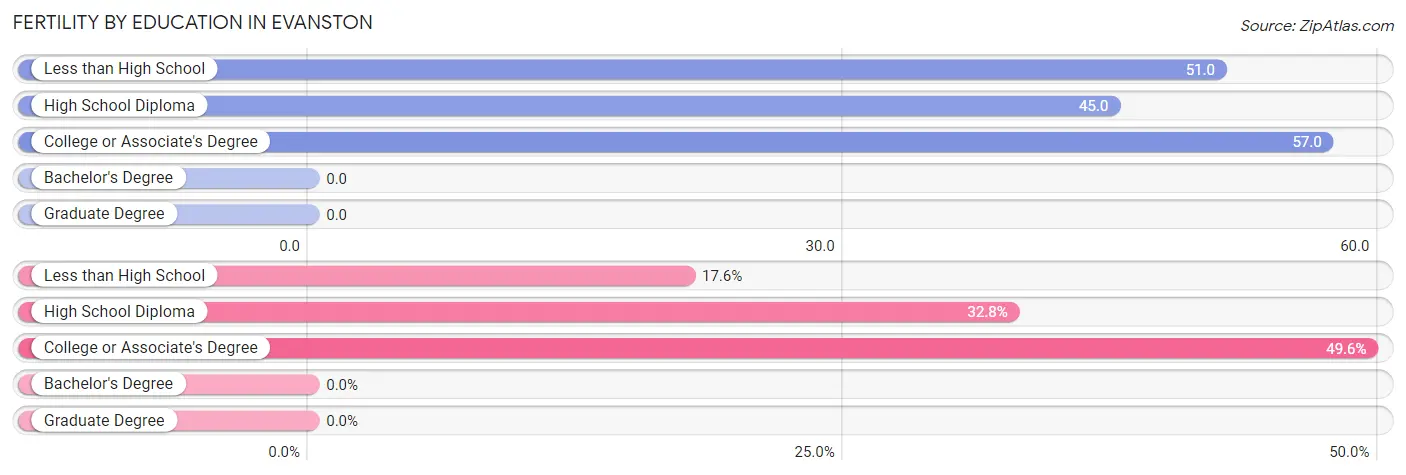
| Educational Attainment | Women with Births | Births / 1,000 Women |
| Less than High School | 22 (17.6%) | 51.0 |
| High School Diploma | 41 (32.8%) | 45.0 |
| College or Associate's Degree | 62 (49.6%) | 57.0 |
| Bachelor's Degree | 0 (0.0%) | 0.0 |
| Graduate Degree | 0 (0.0%) | 0.0 |
| Total | 125 (100.0%) | 46.0 |
Fertility by Education by Marriage Status in Evanston
28.0% of women with births in Evanston are unmarried. Women with the educational attainment of less than high school are most likely to be married with 100.0% of them married at childbirth, while women with the educational attainment of college or associate's degree are least likely to be married with 56.5% of them unmarried at childbirth.
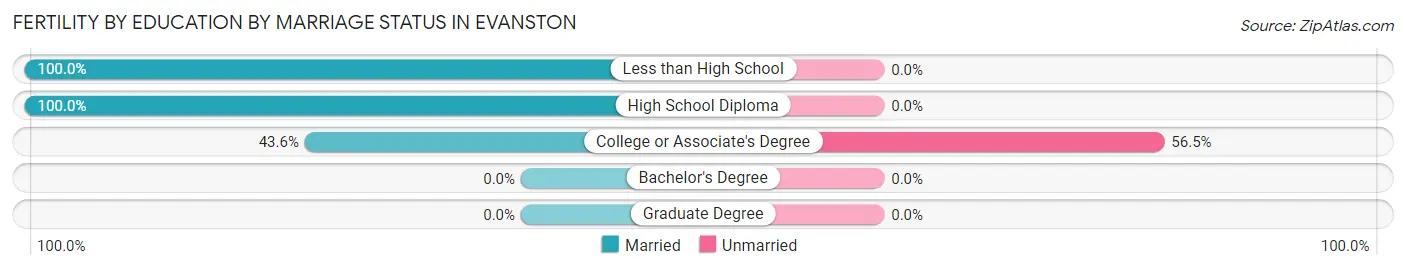
| Educational Attainment | Married | Unmarried |
| Less than High School | 22 (100.0%) | 0 (0.0%) |
| High School Diploma | 41 (100.0%) | 0 (0.0%) |
| College or Associate's Degree | 27 (43.5%) | 35 (56.5%) |
| Bachelor's Degree | 0 (0.0%) | 0 (0.0%) |
| Graduate Degree | 0 (0.0%) | 0 (0.0%) |
| Total | 90 (72.0%) | 35 (28.0%) |
Income in Evanston
Income Overview in Evanston
Per Capita Income in Evanston is $30,393, while median incomes of families and households are $78,813 and $70,825 respectively.
| Characteristic | Number | Measure |
| Per Capita Income | 11,801 | $30,393 |
| Median Family Income | 2,753 | $78,813 |
| Mean Family Income | 2,753 | $87,793 |
| Median Household Income | 4,628 | $70,825 |
| Mean Household Income | 4,628 | $74,143 |
| Income Deficit | 2,753 | $0 |
| Wage / Income Gap (%) | 11,801 | 54.61% |
| Wage / Income Gap ($) | 11,801 | 45.39¢ per $1 |
| Gini / Inequality Index | 11,801 | 0.35 |
Earnings by Sex in Evanston
Average Earnings in Evanston are $32,863, $55,830 for men and $25,342 for women, a difference of 54.6%.
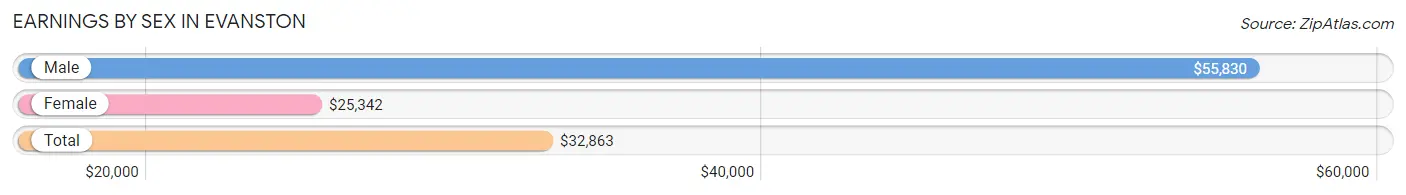
| Sex | Number | Average Earnings |
| Male | 3,087 (49.3%) | $55,830 |
| Female | 3,180 (50.7%) | $25,342 |
| Total | 6,267 (100.0%) | $32,863 |
Earnings by Sex by Income Bracket in Evanston
The most common earnings brackets in Evanston are $75,000 to $99,999 for men (502 | 16.3%) and $25,000 to $29,999 for women (636 | 20.0%).
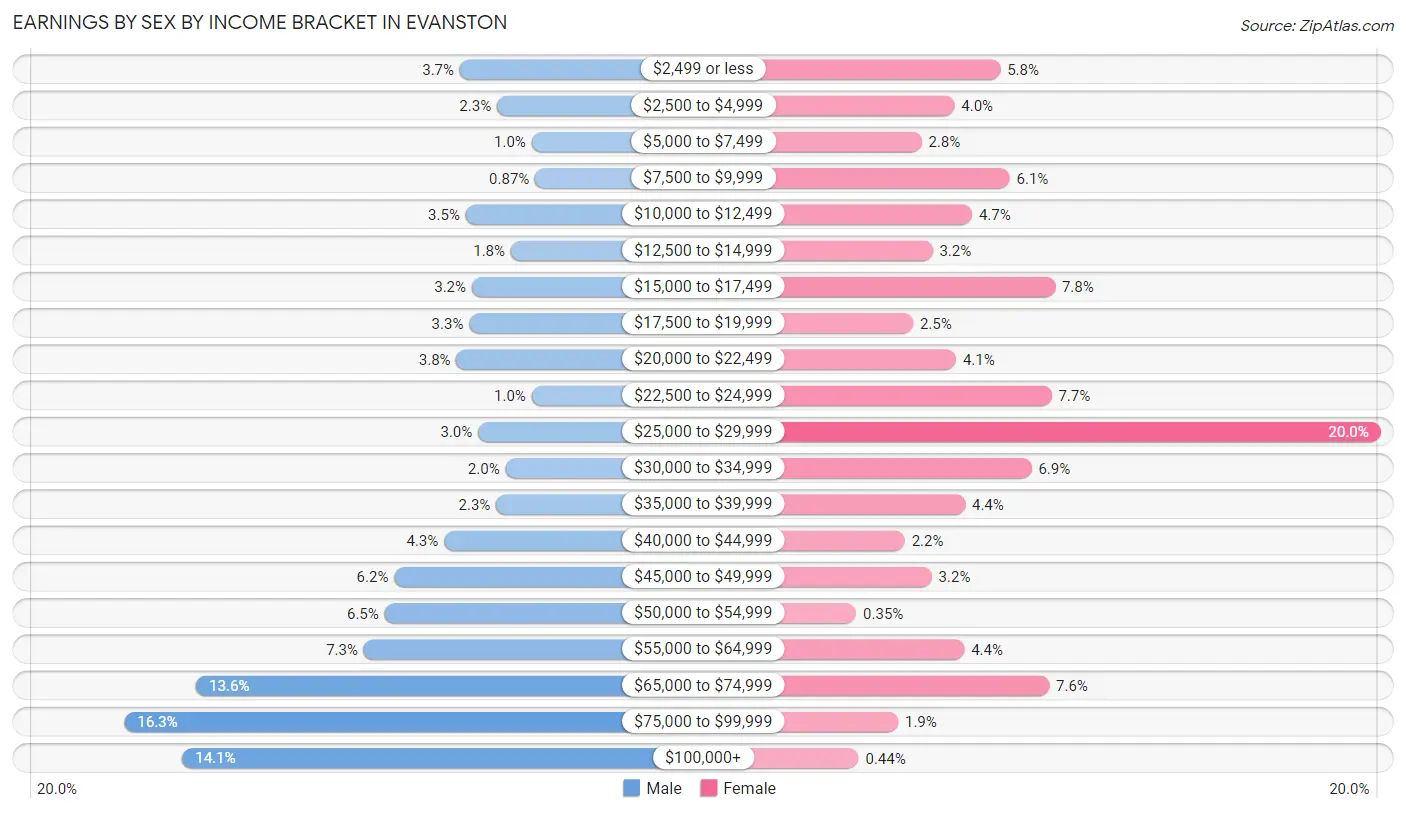
| Income | Male | Female |
| $2,499 or less | 114 (3.7%) | 183 (5.8%) |
| $2,500 to $4,999 | 71 (2.3%) | 128 (4.0%) |
| $5,000 to $7,499 | 31 (1.0%) | 89 (2.8%) |
| $7,500 to $9,999 | 27 (0.9%) | 194 (6.1%) |
| $10,000 to $12,499 | 107 (3.5%) | 149 (4.7%) |
| $12,500 to $14,999 | 55 (1.8%) | 102 (3.2%) |
| $15,000 to $17,499 | 100 (3.2%) | 248 (7.8%) |
| $17,500 to $19,999 | 103 (3.3%) | 79 (2.5%) |
| $20,000 to $22,499 | 118 (3.8%) | 130 (4.1%) |
| $22,500 to $24,999 | 31 (1.0%) | 244 (7.7%) |
| $25,000 to $29,999 | 93 (3.0%) | 636 (20.0%) |
| $30,000 to $34,999 | 61 (2.0%) | 220 (6.9%) |
| $35,000 to $39,999 | 72 (2.3%) | 141 (4.4%) |
| $40,000 to $44,999 | 132 (4.3%) | 69 (2.2%) |
| $45,000 to $49,999 | 190 (6.1%) | 101 (3.2%) |
| $50,000 to $54,999 | 201 (6.5%) | 11 (0.4%) |
| $55,000 to $64,999 | 225 (7.3%) | 140 (4.4%) |
| $65,000 to $74,999 | 419 (13.6%) | 241 (7.6%) |
| $75,000 to $99,999 | 502 (16.3%) | 61 (1.9%) |
| $100,000+ | 435 (14.1%) | 14 (0.4%) |
| Total | 3,087 (100.0%) | 3,180 (100.0%) |
Earnings by Sex by Educational Attainment in Evanston
Average earnings in Evanston are $64,050 for men and $26,064 for women, a difference of 59.3%. Men with an educational attainment of high school diploma enjoy the highest average annual earnings of $67,056, while those with bachelor's degree education earn the least with $63,100. Women with an educational attainment of graduate degree earn the most with the average annual earnings of $70,721, while those with college or associate's degree education have the smallest earnings of $24,286.
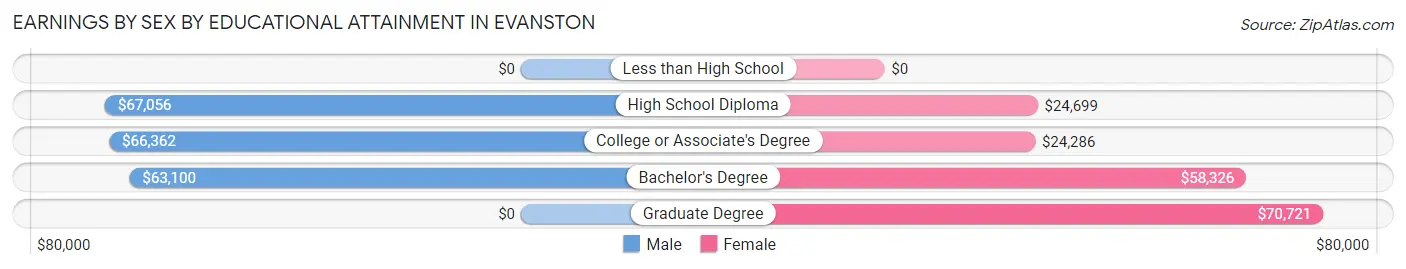
| Educational Attainment | Male Income | Female Income |
| Less than High School | - | - |
| High School Diploma | $67,056 | $24,699 |
| College or Associate's Degree | $66,362 | $24,286 |
| Bachelor's Degree | $63,100 | $58,326 |
| Graduate Degree | - | - |
| Total | $64,050 | $26,064 |
Family Income in Evanston
Family Income Brackets in Evanston
According to the Evanston family income data, there are 738 families falling into the $100,000 to $149,999 income range, which is the most common income bracket and makes up 26.8% of all families. Conversely, the $10,000 to $14,999 income bracket is the least frequent group with only 8 families (0.3%) belonging to this category.
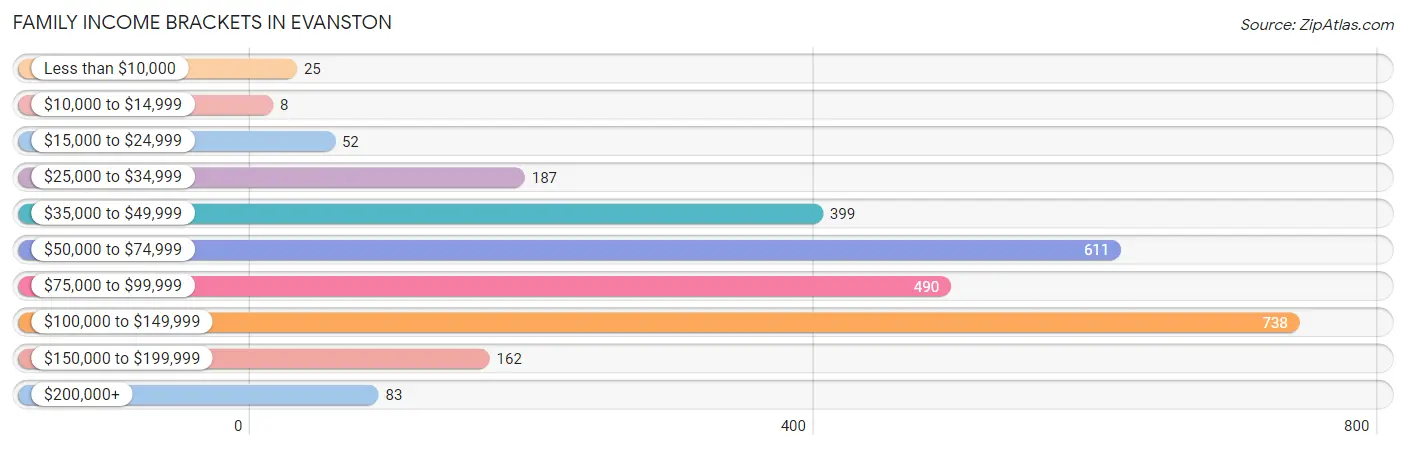
| Income Bracket | # Families | % Families |
| Less than $10,000 | 25 | 0.9% |
| $10,000 to $14,999 | 8 | 0.3% |
| $15,000 to $24,999 | 52 | 1.9% |
| $25,000 to $34,999 | 187 | 6.8% |
| $35,000 to $49,999 | 399 | 14.5% |
| $50,000 to $74,999 | 611 | 22.2% |
| $75,000 to $99,999 | 490 | 17.8% |
| $100,000 to $149,999 | 738 | 26.8% |
| $150,000 to $199,999 | 162 | 5.9% |
| $200,000+ | 83 | 3.0% |
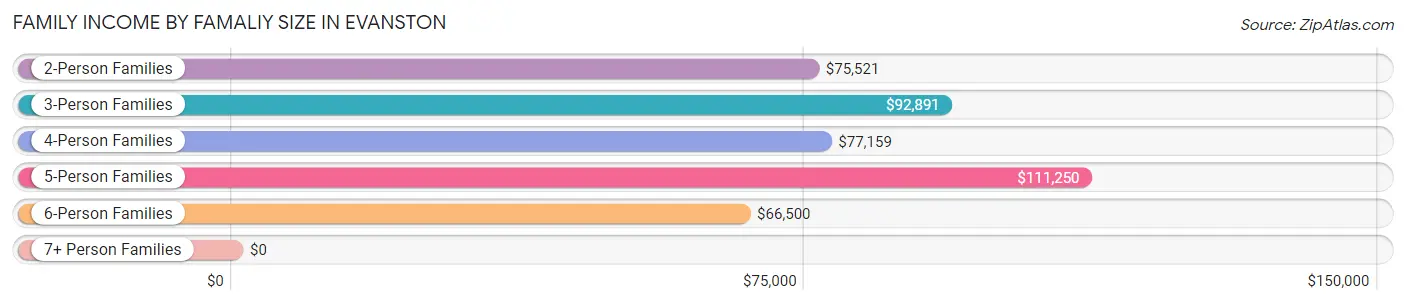
Family Income by Famaliy Size in Evanston
5-person families (216 | 7.9%) account for the highest median family income in Evanston with $111,250 per family, while 2-person families (1,272 | 46.2%) have the highest median income of $37,760 per family member.
| Income Bracket | # Families | Median Income |
| 2-Person Families | 1,272 (46.2%) | $75,521 |
| 3-Person Families | 495 (18.0%) | $92,891 |
| 4-Person Families | 710 (25.8%) | $77,159 |
| 5-Person Families | 216 (7.9%) | $111,250 |
| 6-Person Families | 32 (1.2%) | $66,500 |
| 7+ Person Families | 28 (1.0%) | $0 |
| Total | 2,753 (100.0%) | $78,813 |
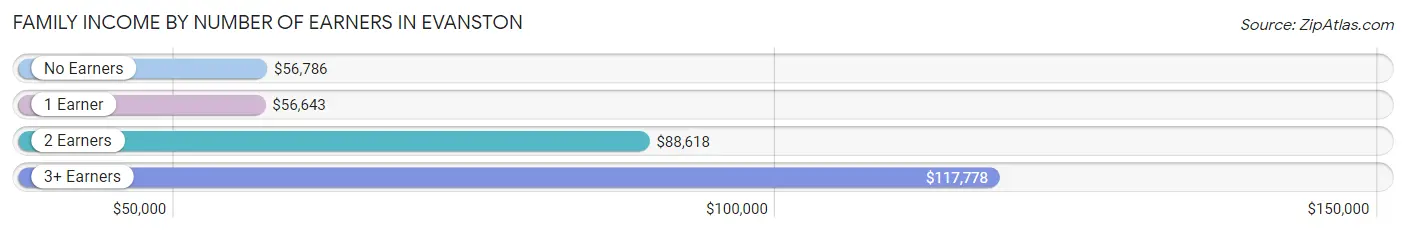
Family Income by Number of Earners in Evanston
The median family income in Evanston is $78,813, with families comprising 3+ earners (140) having the highest median family income of $117,778, while families with 1 earner (664) have the lowest median family income of $56,643, accounting for 5.1% and 24.1% of families, respectively.
| Number of Earners | # Families | Median Income |
| No Earners | 388 (14.1%) | $56,786 |
| 1 Earner | 664 (24.1%) | $56,643 |
| 2 Earners | 1,561 (56.7%) | $88,618 |
| 3+ Earners | 140 (5.1%) | $117,778 |
| Total | 2,753 (100.0%) | $78,813 |
Household Income in Evanston
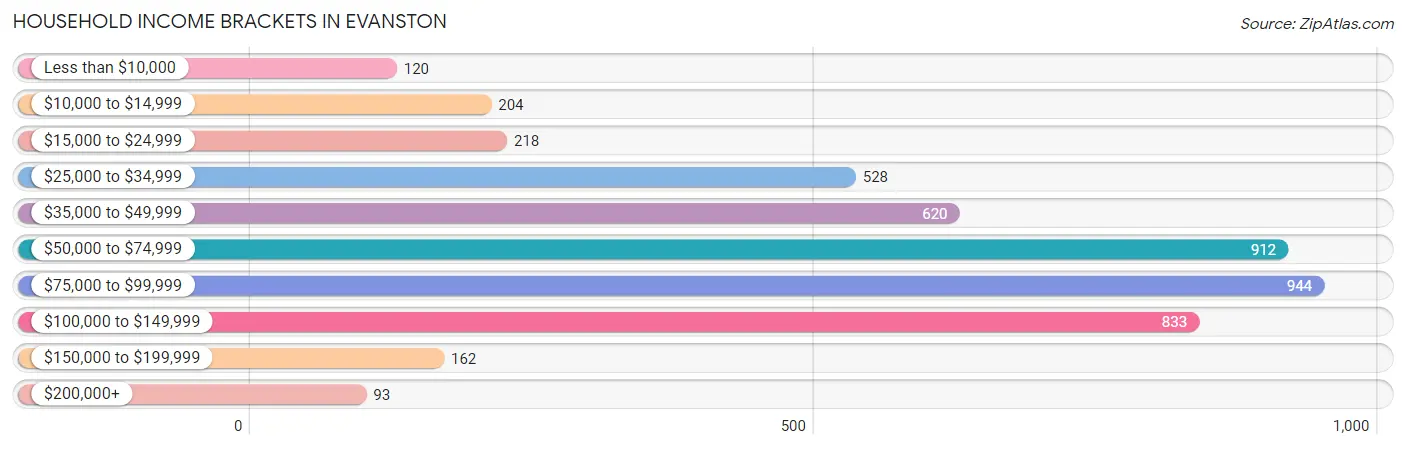
Household Income Brackets in Evanston
With 944 households falling in the category, the $75,000 to $99,999 income range is the most frequent in Evanston, accounting for 20.4% of all households. In contrast, only 93 households (2.0%) fall into the $200,000+ income bracket, making it the least populous group.
| Income Bracket | # Households | % Households |
| Less than $10,000 | 120 | 2.6% |
| $10,000 to $14,999 | 204 | 4.4% |
| $15,000 to $24,999 | 218 | 4.7% |
| $25,000 to $34,999 | 528 | 11.4% |
| $35,000 to $49,999 | 620 | 13.4% |
| $50,000 to $74,999 | 912 | 19.7% |
| $75,000 to $99,999 | 944 | 20.4% |
| $100,000 to $149,999 | 833 | 18.0% |
| $150,000 to $199,999 | 162 | 3.5% |
| $200,000+ | 93 | 2.0% |
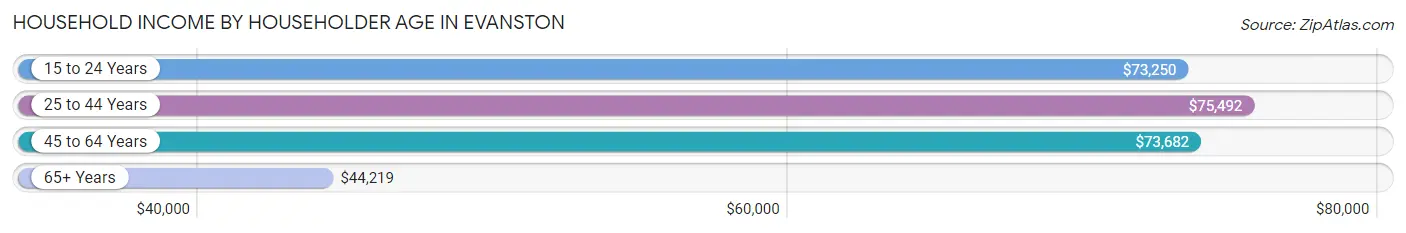
Household Income by Householder Age in Evanston
The median household income in Evanston is $70,825, with the highest median household income of $75,492 found in the 25 to 44 years age bracket for the primary householder. A total of 1,485 households (32.1%) fall into this category. Meanwhile, the 65+ years age bracket for the primary householder has the lowest median household income of $44,219, with 1,168 households (25.2%) in this group.
| Income Bracket | # Households | Median Income |
| 15 to 24 Years | 266 (5.8%) | $73,250 |
| 25 to 44 Years | 1,485 (32.1%) | $75,492 |
| 45 to 64 Years | 1,709 (36.9%) | $73,682 |
| 65+ Years | 1,168 (25.2%) | $44,219 |
| Total | 4,628 (100.0%) | $70,825 |
Poverty in Evanston
Income Below Poverty by Sex and Age in Evanston
With 6.4% poverty level for males and 6.4% for females among the residents of Evanston, 16 and 17 year old males and 75 year old and over females are the most vulnerable to poverty, with 30 males (17.1%) and 48 females (14.1%) in their respective age groups living below the poverty level.
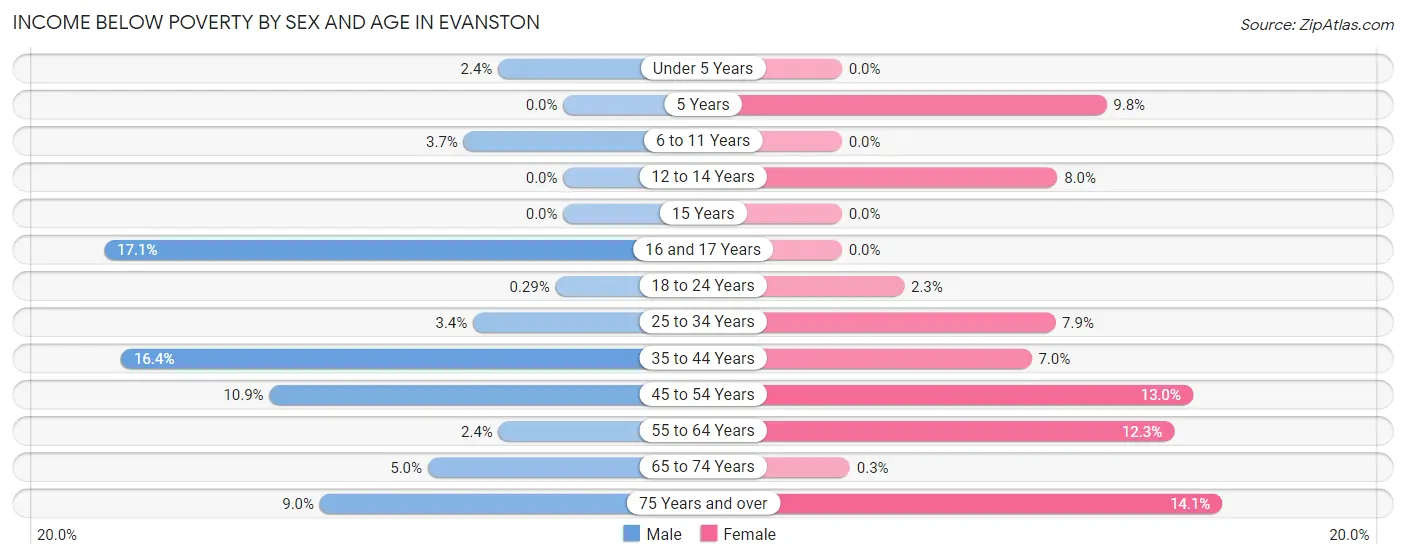
| Age Bracket | Male | Female |
| Under 5 Years | 10 (2.4%) | 0 (0.0%) |
| 5 Years | 0 (0.0%) | 16 (9.8%) |
| 6 to 11 Years | 22 (3.7%) | 0 (0.0%) |
| 12 to 14 Years | 0 (0.0%) | 22 (8.0%) |
| 15 Years | 0 (0.0%) | 0 (0.0%) |
| 16 and 17 Years | 30 (17.1%) | 0 (0.0%) |
| 18 to 24 Years | 1 (0.3%) | 12 (2.3%) |
| 25 to 34 Years | 27 (3.4%) | 64 (7.9%) |
| 35 to 44 Years | 124 (16.4%) | 56 (7.0%) |
| 45 to 54 Years | 85 (10.9%) | 64 (13.0%) |
| 55 to 64 Years | 17 (2.4%) | 89 (12.3%) |
| 65 to 74 Years | 22 (5.0%) | 2 (0.3%) |
| 75 Years and over | 32 (9.0%) | 48 (14.1%) |
| Total | 370 (6.4%) | 373 (6.4%) |
Income Above Poverty by Sex and Age in Evanston
According to the poverty statistics in Evanston, males aged 5 years and females aged under 5 years are the age groups that are most secure financially, with 100.0% of males and 100.0% of females in these age groups living above the poverty line.
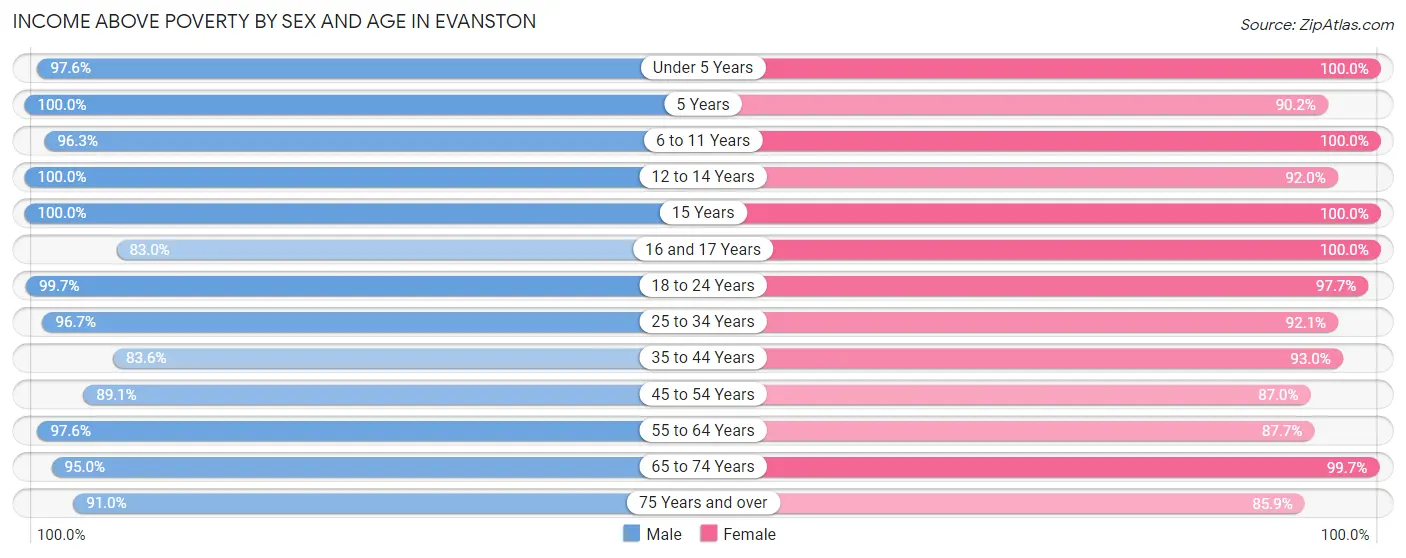
| Age Bracket | Male | Female |
| Under 5 Years | 404 (97.6%) | 324 (100.0%) |
| 5 Years | 79 (100.0%) | 147 (90.2%) |
| 6 to 11 Years | 573 (96.3%) | 492 (100.0%) |
| 12 to 14 Years | 311 (100.0%) | 253 (92.0%) |
| 15 Years | 23 (100.0%) | 135 (100.0%) |
| 16 and 17 Years | 146 (83.0%) | 97 (100.0%) |
| 18 to 24 Years | 346 (99.7%) | 507 (97.7%) |
| 25 to 34 Years | 778 (96.7%) | 744 (92.1%) |
| 35 to 44 Years | 631 (83.6%) | 739 (93.0%) |
| 45 to 54 Years | 694 (89.1%) | 427 (87.0%) |
| 55 to 64 Years | 692 (97.6%) | 633 (87.7%) |
| 65 to 74 Years | 415 (95.0%) | 656 (99.7%) |
| 75 Years and over | 322 (91.0%) | 292 (85.9%) |
| Total | 5,414 (93.6%) | 5,446 (93.6%) |
Income Below Poverty Among Married-Couple Families in Evanston
The poverty statistics for married-couple families in Evanston show that 1.1% or 25 of the total 2,208 families live below the poverty line. Families with no children have the highest poverty rate of 1.5%, comprising of 17 families. On the other hand, families with 3 or 4 children have the lowest poverty rate of 0.0%, which includes 0 families.
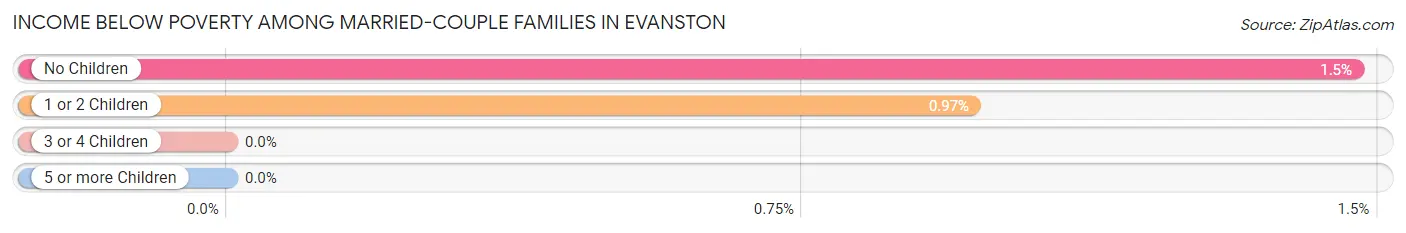
| Children | Above Poverty | Below Poverty |
| No Children | 1,137 (98.5%) | 17 (1.5%) |
| 1 or 2 Children | 818 (99.0%) | 8 (1.0%) |
| 3 or 4 Children | 213 (100.0%) | 0 (0.0%) |
| 5 or more Children | 15 (100.0%) | 0 (0.0%) |
| Total | 2,183 (98.9%) | 25 (1.1%) |
Income Below Poverty Among Single-Parent Households in Evanston
According to the poverty data in Evanston, 4.9% or 8 single-father households and 2.4% or 9 single-mother households are living below the poverty line. Among single-father households, those with 3 or 4 children have the highest poverty rate, with 8 households (100.0%) experiencing poverty. Likewise, among single-mother households, those with 1 or 2 children have the highest poverty rate, with 9 households (5.1%) falling below the poverty line.
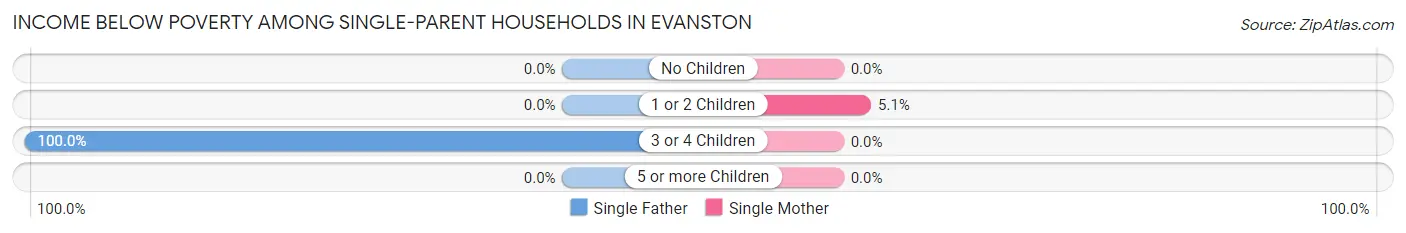
| Children | Single Father | Single Mother |
| No Children | 0 (0.0%) | 0 (0.0%) |
| 1 or 2 Children | 0 (0.0%) | 9 (5.1%) |
| 3 or 4 Children | 8 (100.0%) | 0 (0.0%) |
| 5 or more Children | 0 (0.0%) | 0 (0.0%) |
| Total | 8 (4.9%) | 9 (2.4%) |
Income Below Poverty Among Married-Couple vs Single-Parent Households in Evanston
The poverty data for Evanston shows that 25 of the married-couple family households (1.1%) and 17 of the single-parent households (3.1%) are living below the poverty level. Within the married-couple family households, those with no children have the highest poverty rate, with 17 households (1.5%) falling below the poverty line. Among the single-parent households, those with 3 or 4 children have the highest poverty rate, with 8 household (10.1%) living below poverty.
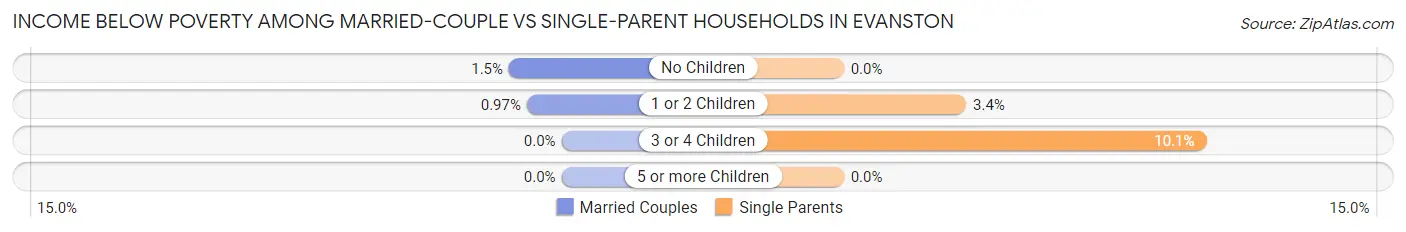
| Children | Married-Couple Families | Single-Parent Households |
| No Children | 17 (1.5%) | 0 (0.0%) |
| 1 or 2 Children | 8 (1.0%) | 9 (3.4%) |
| 3 or 4 Children | 0 (0.0%) | 8 (10.1%) |
| 5 or more Children | 0 (0.0%) | 0 (0.0%) |
| Total | 25 (1.1%) | 17 (3.1%) |
Employment Characteristics in Evanston
Employment by Class of Employer in Evanston
Among the 5,752 employed individuals in Evanston, private company employees (3,709 | 64.5%), local government employees (800 | 13.9%), and not-for-profit organizations (350 | 6.1%) make up the most common classes of employment.
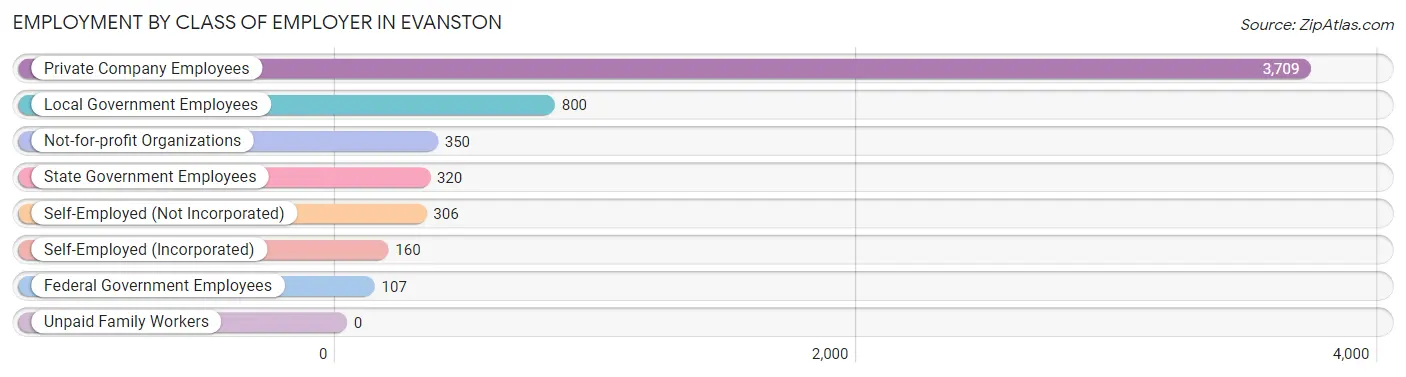
| Employer Class | # Employees | % Employees |
| Private Company Employees | 3,709 | 64.5% |
| Self-Employed (Incorporated) | 160 | 2.8% |
| Self-Employed (Not Incorporated) | 306 | 5.3% |
| Not-for-profit Organizations | 350 | 6.1% |
| Local Government Employees | 800 | 13.9% |
| State Government Employees | 320 | 5.6% |
| Federal Government Employees | 107 | 1.9% |
| Unpaid Family Workers | 0 | 0.0% |
| Total | 5,752 | 100.0% |
Employment Status by Age in Evanston
According to the labor force statistics for Evanston, out of the total population over 16 years of age (8,929), 68.1% or 6,081 individuals are in the labor force, with 4.2% or 255 of them unemployed. The age group with the highest labor force participation rate is 20 to 24 years, with 93.8% or 675 individuals in the labor force. Within the labor force, the 20 to 24 years age range has the highest percentage of unemployed individuals, with 15.9% or 107 of them being unemployed.
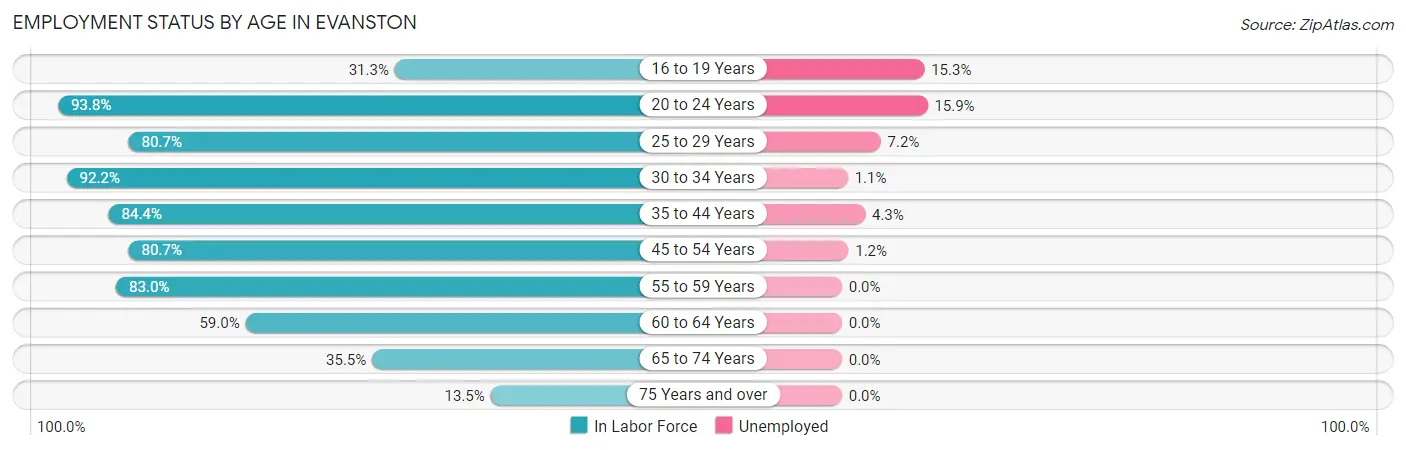
| Age Bracket | In Labor Force | Unemployed |
| 16 to 19 Years | 144 (31.3%) | 22 (15.3%) |
| 20 to 24 Years | 675 (93.8%) | 107 (15.9%) |
| 25 to 29 Years | 739 (80.7%) | 53 (7.2%) |
| 30 to 34 Years | 647 (92.2%) | 7 (1.1%) |
| 35 to 44 Years | 1,319 (84.4%) | 57 (4.3%) |
| 45 to 54 Years | 1,028 (80.7%) | 12 (1.2%) |
| 55 to 59 Years | 628 (83.0%) | 0 (0.0%) |
| 60 to 64 Years | 407 (59.0%) | 0 (0.0%) |
| 65 to 74 Years | 390 (35.5%) | 0 (0.0%) |
| 75 Years and over | 101 (13.5%) | 0 (0.0%) |
| Total | 6,081 (68.1%) | 255 (4.2%) |
Employment Status by Educational Attainment in Evanston
According to labor force statistics for Evanston, 80.8% of individuals (4,769) out of the total population between 25 and 64 years of age (5,902) are in the labor force, with 2.7% or 129 of them being unemployed. The group with the highest labor force participation rate are those with the educational attainment of college / associate degree, with 86.3% or 2,007 individuals in the labor force. Within the labor force, individuals with high school diploma education have the highest percentage of unemployment, with 3.7% or 67 of them being unemployed.
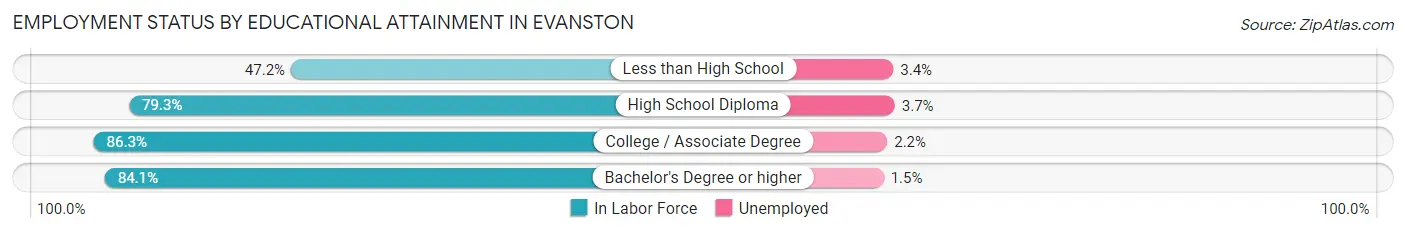
| Educational Attainment | In Labor Force | Unemployed |
| Less than High School | 174 (47.2%) | 13 (3.4%) |
| High School Diploma | 1,810 (79.3%) | 84 (3.7%) |
| College / Associate Degree | 2,007 (86.3%) | 51 (2.2%) |
| Bachelor's Degree or higher | 777 (84.1%) | 14 (1.5%) |
| Total | 4,769 (80.8%) | 159 (2.7%) |
Employment Occupations by Sex in Evanston
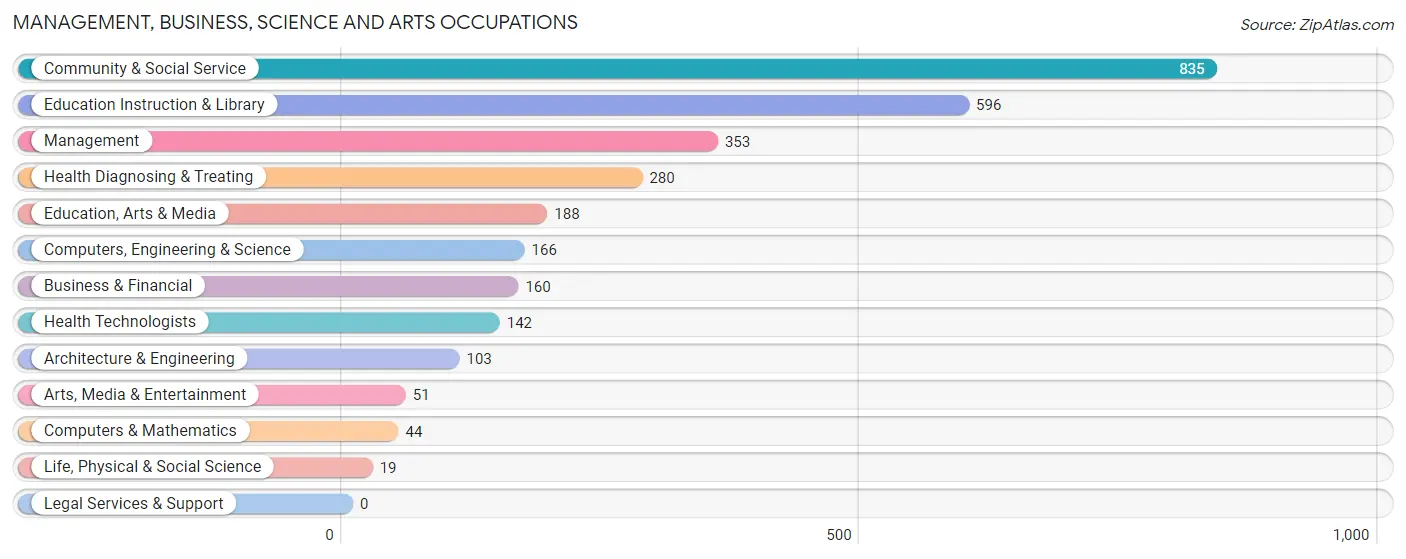
Management, Business, Science and Arts Occupations
The most common Management, Business, Science and Arts occupations in Evanston are Community & Social Service (835 | 14.4%), Education Instruction & Library (596 | 10.2%), Management (353 | 6.1%), Health Diagnosing & Treating (280 | 4.8%), and Education, Arts & Media (188 | 3.2%).
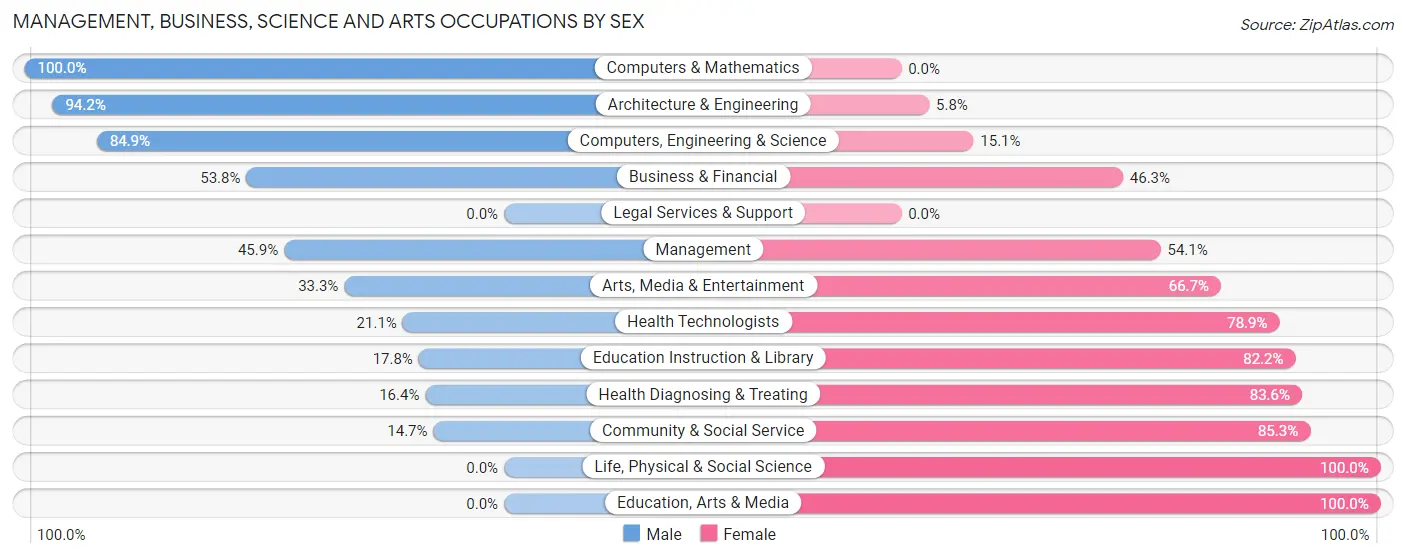
Management, Business, Science and Arts Occupations by Sex
Within the Management, Business, Science and Arts occupations in Evanston, the most male-oriented occupations are Computers & Mathematics (100.0%), Architecture & Engineering (94.2%), and Computers, Engineering & Science (84.9%), while the most female-oriented occupations are Life, Physical & Social Science (100.0%), Education, Arts & Media (100.0%), and Community & Social Service (85.3%).
| Occupation | Male | Female |
| Management | 162 (45.9%) | 191 (54.1%) |
| Business & Financial | 86 (53.7%) | 74 (46.3%) |
| Computers, Engineering & Science | 141 (84.9%) | 25 (15.1%) |
| Computers & Mathematics | 44 (100.0%) | 0 (0.0%) |
| Architecture & Engineering | 97 (94.2%) | 6 (5.8%) |
| Life, Physical & Social Science | 0 (0.0%) | 19 (100.0%) |
| Community & Social Service | 123 (14.7%) | 712 (85.3%) |
| Education, Arts & Media | 0 (0.0%) | 188 (100.0%) |
| Legal Services & Support | 0 (0.0%) | 0 (0.0%) |
| Education Instruction & Library | 106 (17.8%) | 490 (82.2%) |
| Arts, Media & Entertainment | 17 (33.3%) | 34 (66.7%) |
| Health Diagnosing & Treating | 46 (16.4%) | 234 (83.6%) |
| Health Technologists | 30 (21.1%) | 112 (78.9%) |
| Total (Category) | 558 (31.1%) | 1,236 (68.9%) |
| Total (Overall) | 2,861 (49.2%) | 2,951 (50.8%) |
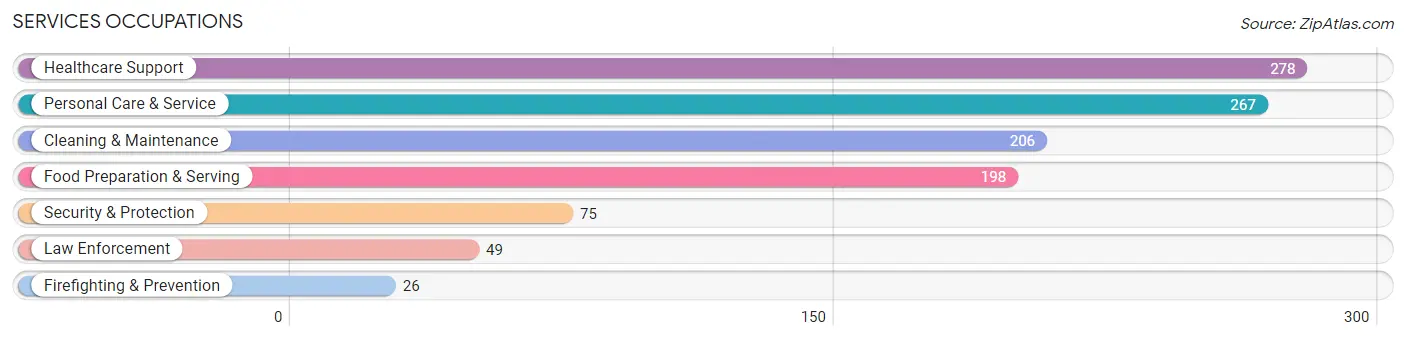
Services Occupations
The most common Services occupations in Evanston are Healthcare Support (278 | 4.8%), Personal Care & Service (267 | 4.6%), Cleaning & Maintenance (206 | 3.5%), Food Preparation & Serving (198 | 3.4%), and Security & Protection (75 | 1.3%).
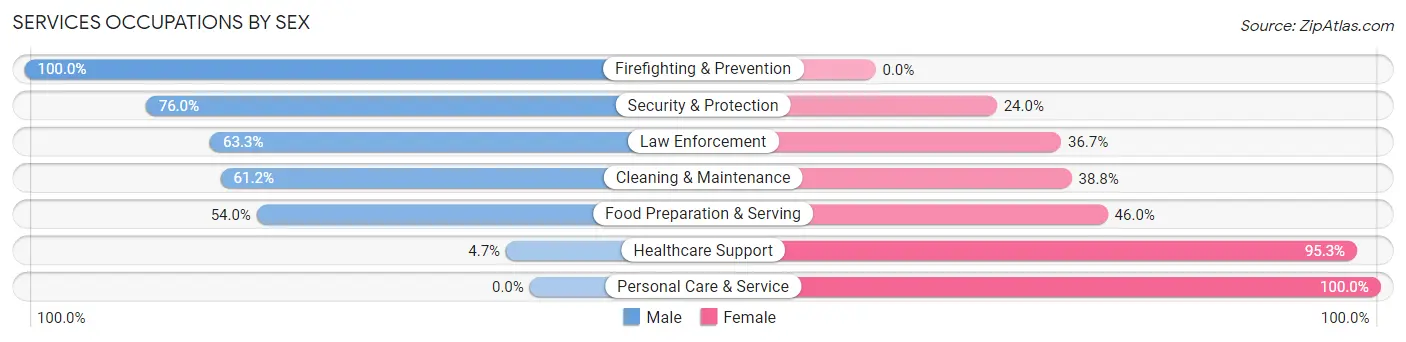
Services Occupations by Sex
Within the Services occupations in Evanston, the most male-oriented occupations are Firefighting & Prevention (100.0%), Security & Protection (76.0%), and Law Enforcement (63.3%), while the most female-oriented occupations are Personal Care & Service (100.0%), Healthcare Support (95.3%), and Food Preparation & Serving (46.0%).
| Occupation | Male | Female |
| Healthcare Support | 13 (4.7%) | 265 (95.3%) |
| Security & Protection | 57 (76.0%) | 18 (24.0%) |
| Firefighting & Prevention | 26 (100.0%) | 0 (0.0%) |
| Law Enforcement | 31 (63.3%) | 18 (36.7%) |
| Food Preparation & Serving | 107 (54.0%) | 91 (46.0%) |
| Cleaning & Maintenance | 126 (61.2%) | 80 (38.8%) |
| Personal Care & Service | 0 (0.0%) | 267 (100.0%) |
| Total (Category) | 303 (29.6%) | 721 (70.4%) |
| Total (Overall) | 2,861 (49.2%) | 2,951 (50.8%) |
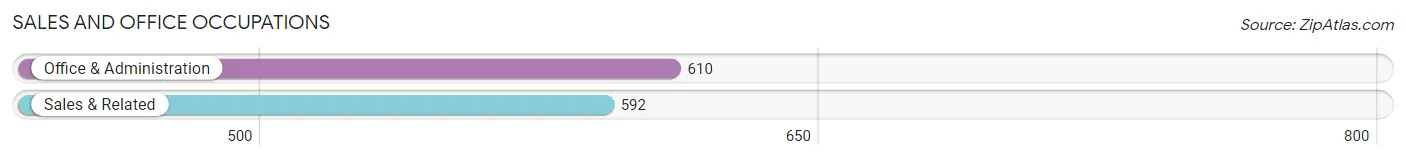
Sales and Office Occupations
The most common Sales and Office occupations in Evanston are Office & Administration (610 | 10.5%), and Sales & Related (592 | 10.2%).
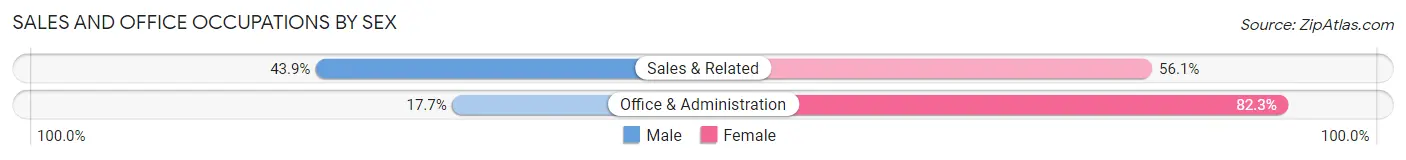
Sales and Office Occupations by Sex
| Occupation | Male | Female |
| Sales & Related | 260 (43.9%) | 332 (56.1%) |
| Office & Administration | 108 (17.7%) | 502 (82.3%) |
| Total (Category) | 368 (30.6%) | 834 (69.4%) |
| Total (Overall) | 2,861 (49.2%) | 2,951 (50.8%) |
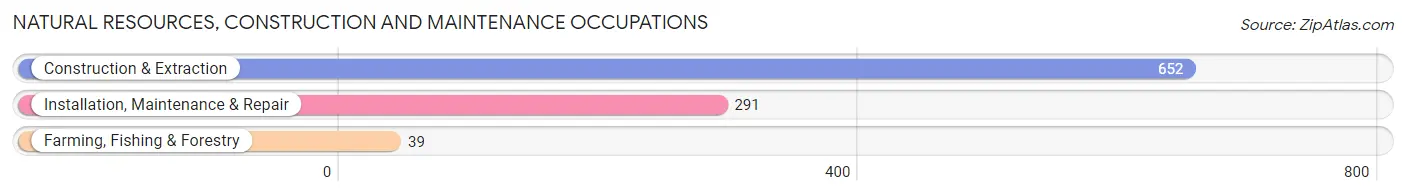
Natural Resources, Construction and Maintenance Occupations
The most common Natural Resources, Construction and Maintenance occupations in Evanston are Construction & Extraction (652 | 11.2%), Installation, Maintenance & Repair (291 | 5.0%), and Farming, Fishing & Forestry (39 | 0.7%).
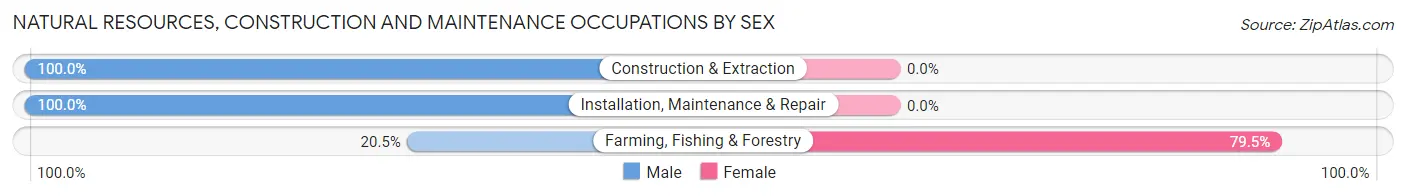
Natural Resources, Construction and Maintenance Occupations by Sex
| Occupation | Male | Female |
| Farming, Fishing & Forestry | 8 (20.5%) | 31 (79.5%) |
| Construction & Extraction | 652 (100.0%) | 0 (0.0%) |
| Installation, Maintenance & Repair | 291 (100.0%) | 0 (0.0%) |
| Total (Category) | 951 (96.8%) | 31 (3.2%) |
| Total (Overall) | 2,861 (49.2%) | 2,951 (50.8%) |
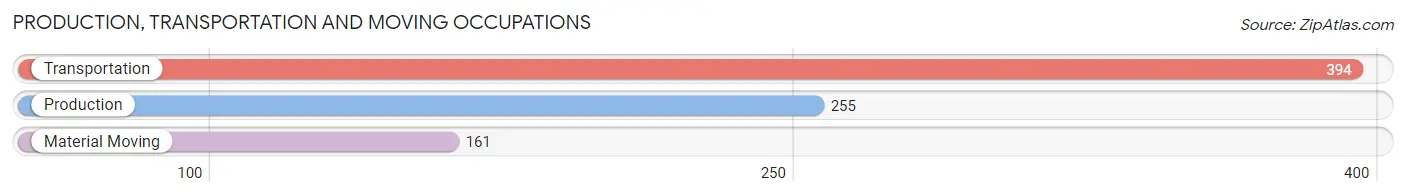
Production, Transportation and Moving Occupations
The most common Production, Transportation and Moving occupations in Evanston are Transportation (394 | 6.8%), Production (255 | 4.4%), and Material Moving (161 | 2.8%).
Production, Transportation and Moving Occupations by Sex
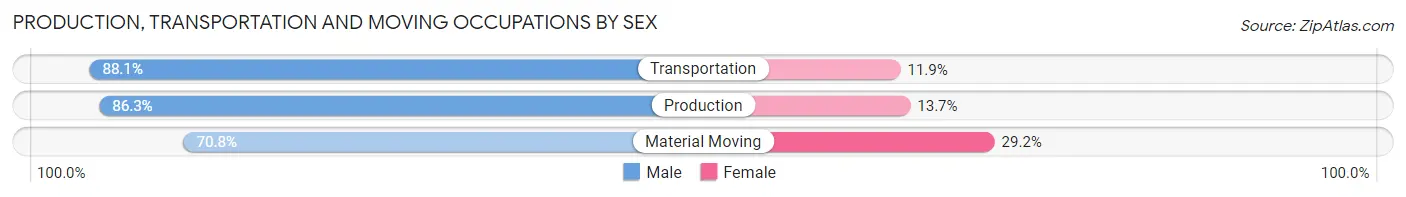
| Occupation | Male | Female |
| Production | 220 (86.3%) | 35 (13.7%) |
| Transportation | 347 (88.1%) | 47 (11.9%) |
| Material Moving | 114 (70.8%) | 47 (29.2%) |
| Total (Category) | 681 (84.1%) | 129 (15.9%) |
| Total (Overall) | 2,861 (49.2%) | 2,951 (50.8%) |
Employment Industries by Sex in Evanston
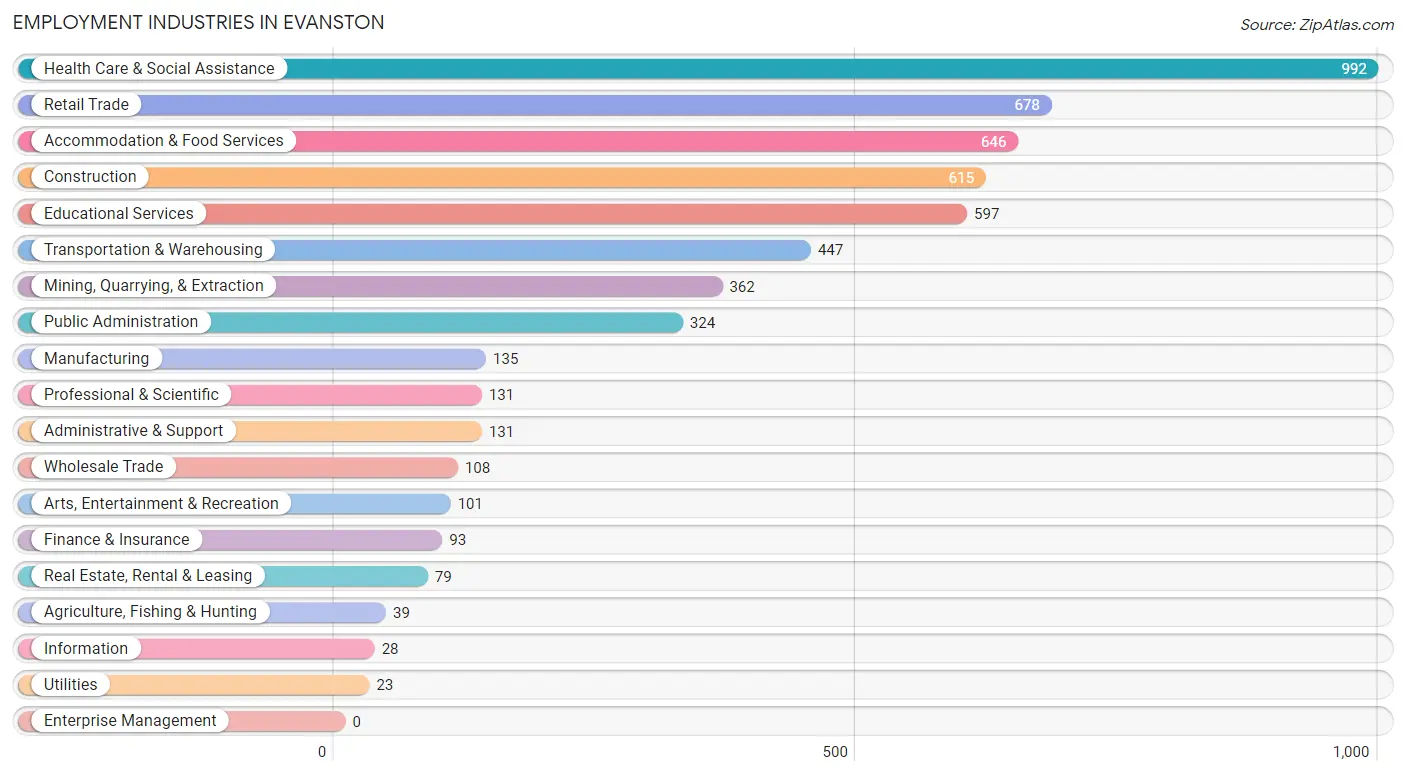
Employment Industries in Evanston
The major employment industries in Evanston include Health Care & Social Assistance (992 | 17.1%), Retail Trade (678 | 11.7%), Accommodation & Food Services (646 | 11.1%), Construction (615 | 10.6%), and Educational Services (597 | 10.3%).
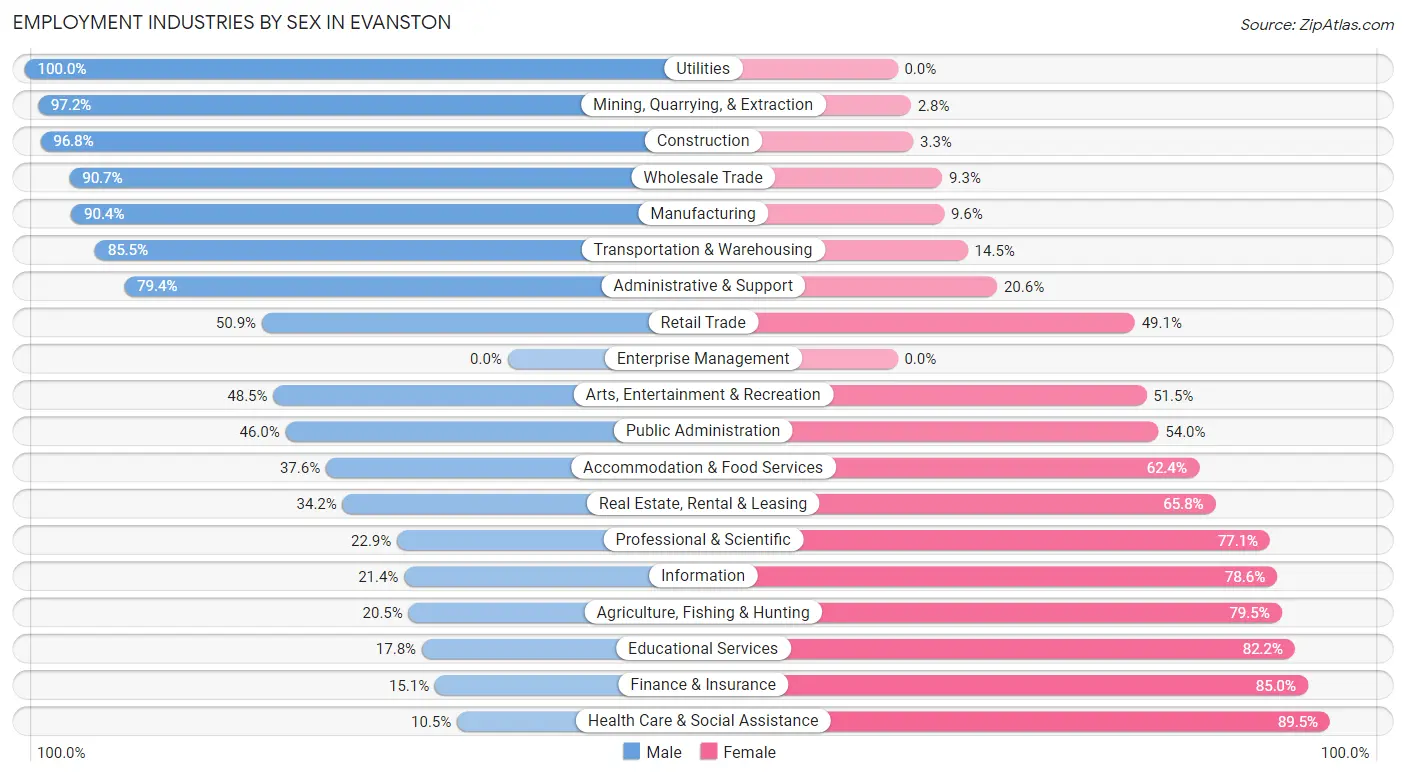
Employment Industries by Sex in Evanston
The Evanston industries that see more men than women are Utilities (100.0%), Mining, Quarrying, & Extraction (97.2%), and Construction (96.8%), whereas the industries that tend to have a higher number of women are Health Care & Social Assistance (89.5%), Finance & Insurance (85.0%), and Educational Services (82.2%).
| Industry | Male | Female |
| Agriculture, Fishing & Hunting | 8 (20.5%) | 31 (79.5%) |
| Mining, Quarrying, & Extraction | 352 (97.2%) | 10 (2.8%) |
| Construction | 595 (96.8%) | 20 (3.3%) |
| Manufacturing | 122 (90.4%) | 13 (9.6%) |
| Wholesale Trade | 98 (90.7%) | 10 (9.3%) |
| Retail Trade | 345 (50.9%) | 333 (49.1%) |
| Transportation & Warehousing | 382 (85.5%) | 65 (14.5%) |
| Utilities | 23 (100.0%) | 0 (0.0%) |
| Information | 6 (21.4%) | 22 (78.6%) |
| Finance & Insurance | 14 (15.0%) | 79 (85.0%) |
| Real Estate, Rental & Leasing | 27 (34.2%) | 52 (65.8%) |
| Professional & Scientific | 30 (22.9%) | 101 (77.1%) |
| Enterprise Management | 0 (0.0%) | 0 (0.0%) |
| Administrative & Support | 104 (79.4%) | 27 (20.6%) |
| Educational Services | 106 (17.8%) | 491 (82.2%) |
| Health Care & Social Assistance | 104 (10.5%) | 888 (89.5%) |
| Arts, Entertainment & Recreation | 49 (48.5%) | 52 (51.5%) |
| Accommodation & Food Services | 243 (37.6%) | 403 (62.4%) |
| Public Administration | 149 (46.0%) | 175 (54.0%) |
| Total | 2,861 (49.2%) | 2,951 (50.8%) |
Education in Evanston
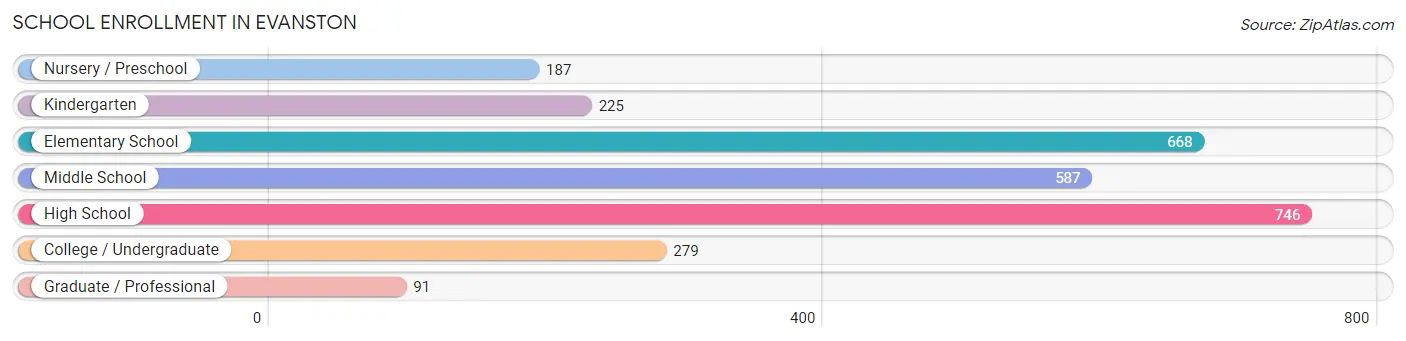
School Enrollment in Evanston
The most common levels of schooling among the 2,783 students in Evanston are high school (746 | 26.8%), elementary school (668 | 24.0%), and middle school (587 | 21.1%).
| School Level | # Students | % Students |
| Nursery / Preschool | 187 | 6.7% |
| Kindergarten | 225 | 8.1% |
| Elementary School | 668 | 24.0% |
| Middle School | 587 | 21.1% |
| High School | 746 | 26.8% |
| College / Undergraduate | 279 | 10.0% |
| Graduate / Professional | 91 | 3.3% |
| Total | 2,783 | 100.0% |
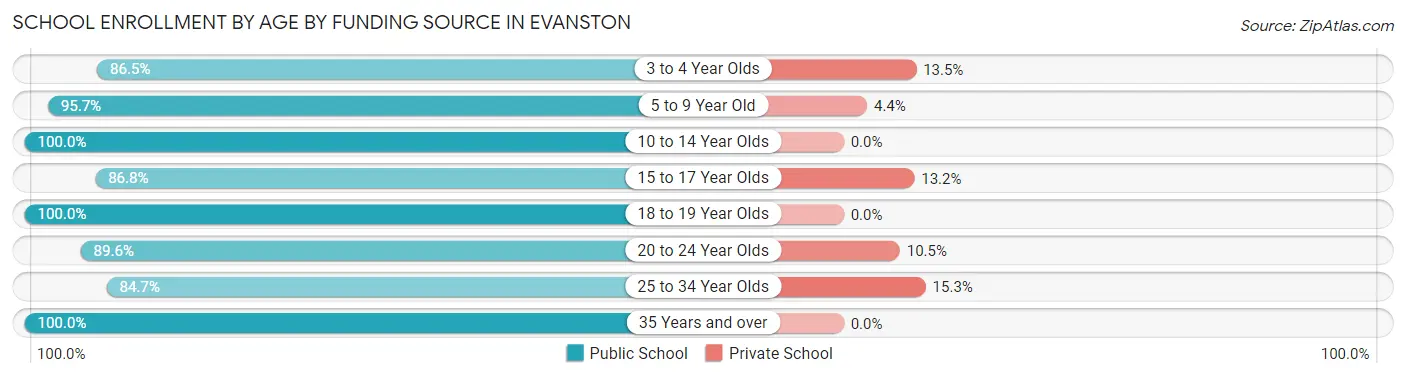
School Enrollment by Age by Funding Source in Evanston
Out of a total of 2,783 students who are enrolled in schools in Evanston, 139 (5.0%) attend a private institution, while the remaining 2,644 (95.0%) are enrolled in public schools. The age group of 25 to 34 year olds has the highest likelihood of being enrolled in private schools, with 20 (15.3% in the age bracket) enrolled. Conversely, the age group of 10 to 14 year olds has the lowest likelihood of being enrolled in a private school, with 938 (100.0% in the age bracket) attending a public institution.
| Age Bracket | Public School | Private School |
| 3 to 4 Year Olds | 64 (86.5%) | 10 (13.5%) |
| 5 to 9 Year Old | 880 (95.7%) | 40 (4.3%) |
| 10 to 14 Year Olds | 938 (100.0%) | 0 (0.0%) |
| 15 to 17 Year Olds | 409 (86.8%) | 62 (13.2%) |
| 18 to 19 Year Olds | 40 (100.0%) | 0 (0.0%) |
| 20 to 24 Year Olds | 60 (89.5%) | 7 (10.4%) |
| 25 to 34 Year Olds | 111 (84.7%) | 20 (15.3%) |
| 35 Years and over | 142 (100.0%) | 0 (0.0%) |
| Total | 2,644 (95.0%) | 139 (5.0%) |
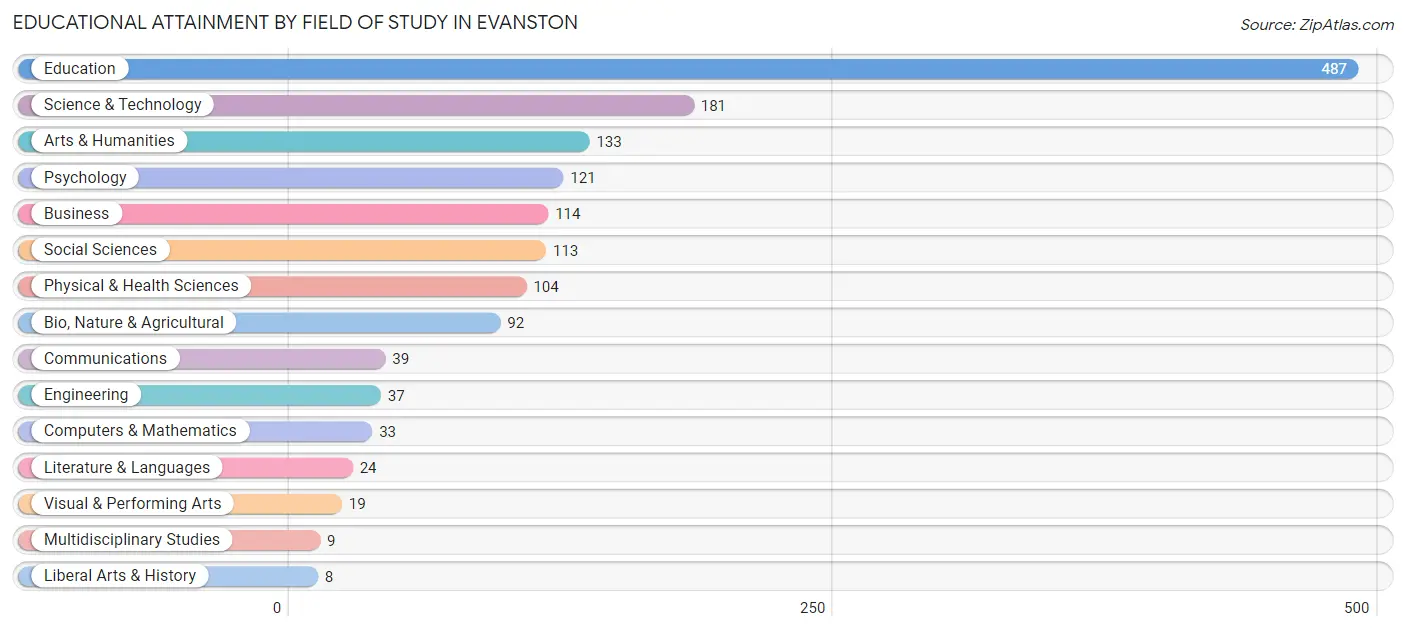
Educational Attainment by Field of Study in Evanston
Education (487 | 32.2%), science & technology (181 | 12.0%), arts & humanities (133 | 8.8%), psychology (121 | 8.0%), and business (114 | 7.5%) are the most common fields of study among 1,514 individuals in Evanston who have obtained a bachelor's degree or higher.
| Field of Study | # Graduates | % Graduates |
| Computers & Mathematics | 33 | 2.2% |
| Bio, Nature & Agricultural | 92 | 6.1% |
| Physical & Health Sciences | 104 | 6.9% |
| Psychology | 121 | 8.0% |
| Social Sciences | 113 | 7.5% |
| Engineering | 37 | 2.4% |
| Multidisciplinary Studies | 9 | 0.6% |
| Science & Technology | 181 | 12.0% |
| Business | 114 | 7.5% |
| Education | 487 | 32.2% |
| Literature & Languages | 24 | 1.6% |
| Liberal Arts & History | 8 | 0.5% |
| Visual & Performing Arts | 19 | 1.3% |
| Communications | 39 | 2.6% |
| Arts & Humanities | 133 | 8.8% |
| Total | 1,514 | 100.0% |
Transportation & Commute in Evanston
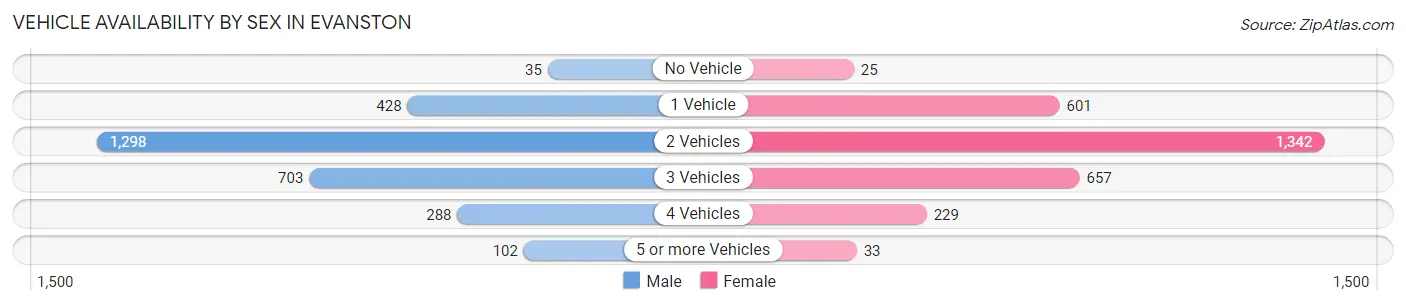
Vehicle Availability by Sex in Evanston
The most prevalent vehicle ownership categories in Evanston are males with 2 vehicles (1,298, accounting for 45.5%) and females with 2 vehicles (1,342, making up 45.0%).
| Vehicles Available | Male | Female |
| No Vehicle | 35 (1.2%) | 25 (0.9%) |
| 1 Vehicle | 428 (15.0%) | 601 (20.8%) |
| 2 Vehicles | 1,298 (45.5%) | 1,342 (46.5%) |
| 3 Vehicles | 703 (24.6%) | 657 (22.8%) |
| 4 Vehicles | 288 (10.1%) | 229 (7.9%) |
| 5 or more Vehicles | 102 (3.6%) | 33 (1.1%) |
| Total | 2,854 (100.0%) | 2,887 (100.0%) |
Commute Time in Evanston
The most frequently occuring commute durations in Evanston are 5 to 9 minutes (2,028 commuters, 36.6%), 10 to 14 minutes (1,732 commuters, 31.3%), and less than 5 minutes (666 commuters, 12.0%).
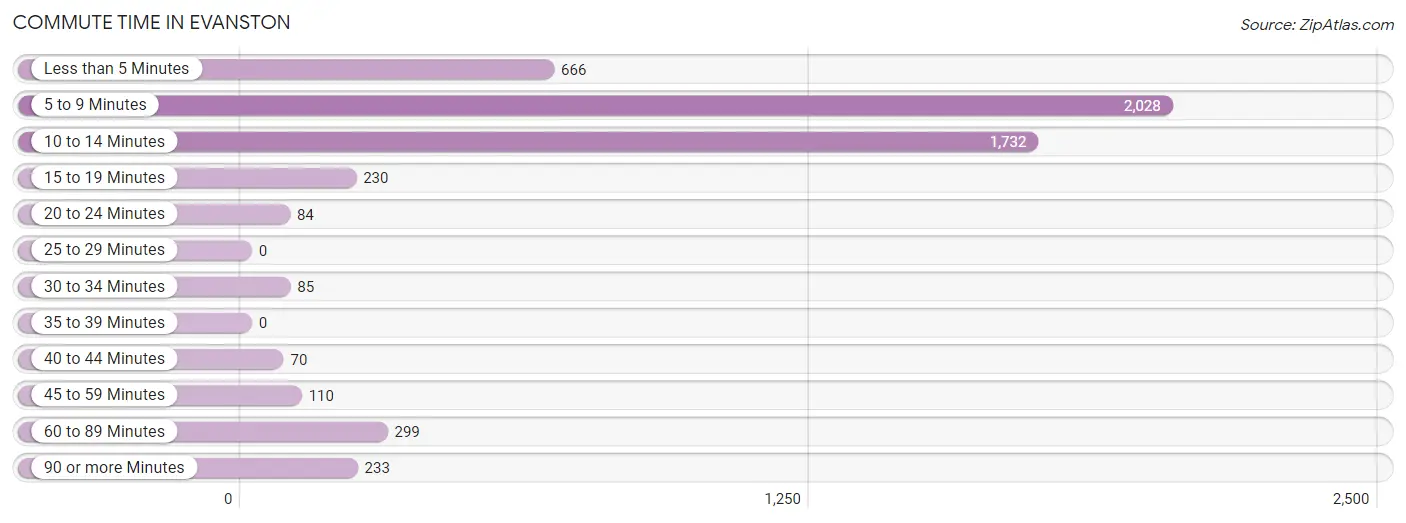
| Commute Time | # Commuters | % Commuters |
| Less than 5 Minutes | 666 | 12.0% |
| 5 to 9 Minutes | 2,028 | 36.6% |
| 10 to 14 Minutes | 1,732 | 31.3% |
| 15 to 19 Minutes | 230 | 4.2% |
| 20 to 24 Minutes | 84 | 1.5% |
| 25 to 29 Minutes | 0 | 0.0% |
| 30 to 34 Minutes | 85 | 1.5% |
| 35 to 39 Minutes | 0 | 0.0% |
| 40 to 44 Minutes | 70 | 1.3% |
| 45 to 59 Minutes | 110 | 2.0% |
| 60 to 89 Minutes | 299 | 5.4% |
| 90 or more Minutes | 233 | 4.2% |
Commute Time by Sex in Evanston
The most common commute times in Evanston are 5 to 9 minutes (974 commuters, 35.3%) for males and 5 to 9 minutes (1,054 commuters, 37.9%) for females.
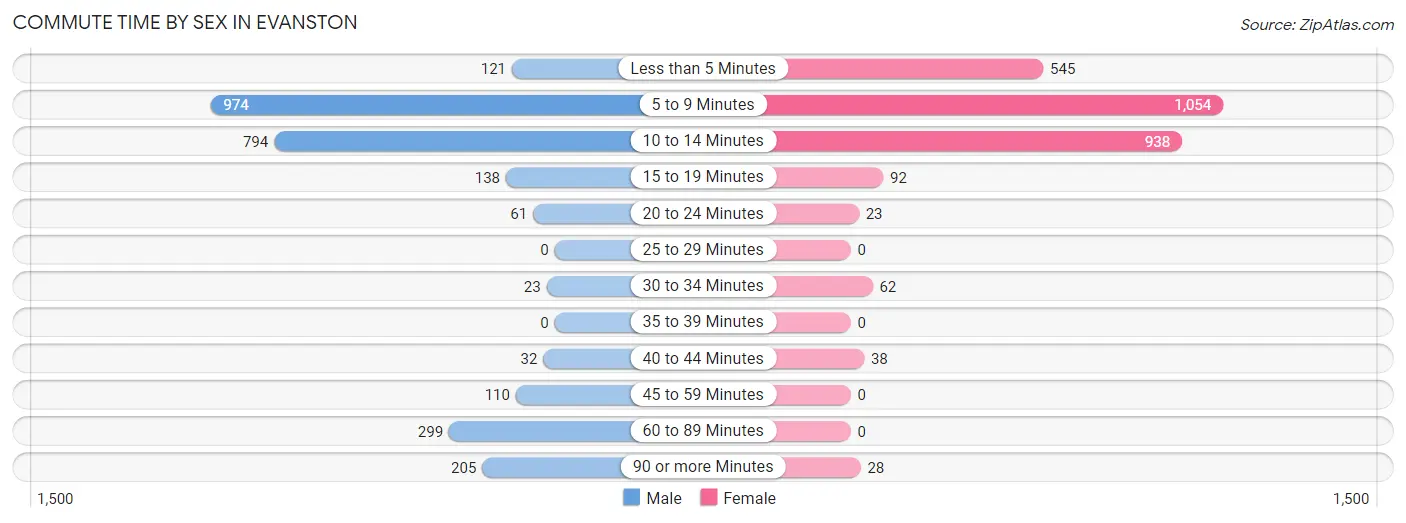
| Commute Time | Male | Female |
| Less than 5 Minutes | 121 (4.4%) | 545 (19.6%) |
| 5 to 9 Minutes | 974 (35.3%) | 1,054 (37.9%) |
| 10 to 14 Minutes | 794 (28.8%) | 938 (33.7%) |
| 15 to 19 Minutes | 138 (5.0%) | 92 (3.3%) |
| 20 to 24 Minutes | 61 (2.2%) | 23 (0.8%) |
| 25 to 29 Minutes | 0 (0.0%) | 0 (0.0%) |
| 30 to 34 Minutes | 23 (0.8%) | 62 (2.2%) |
| 35 to 39 Minutes | 0 (0.0%) | 0 (0.0%) |
| 40 to 44 Minutes | 32 (1.2%) | 38 (1.4%) |
| 45 to 59 Minutes | 110 (4.0%) | 0 (0.0%) |
| 60 to 89 Minutes | 299 (10.8%) | 0 (0.0%) |
| 90 or more Minutes | 205 (7.4%) | 28 (1.0%) |
Time of Departure to Work by Sex in Evanston
The most frequent times of departure to work in Evanston are 5:30 AM to 5:59 AM (462, 16.8%) for males and 7:00 AM to 7:29 AM (439, 15.8%) for females.
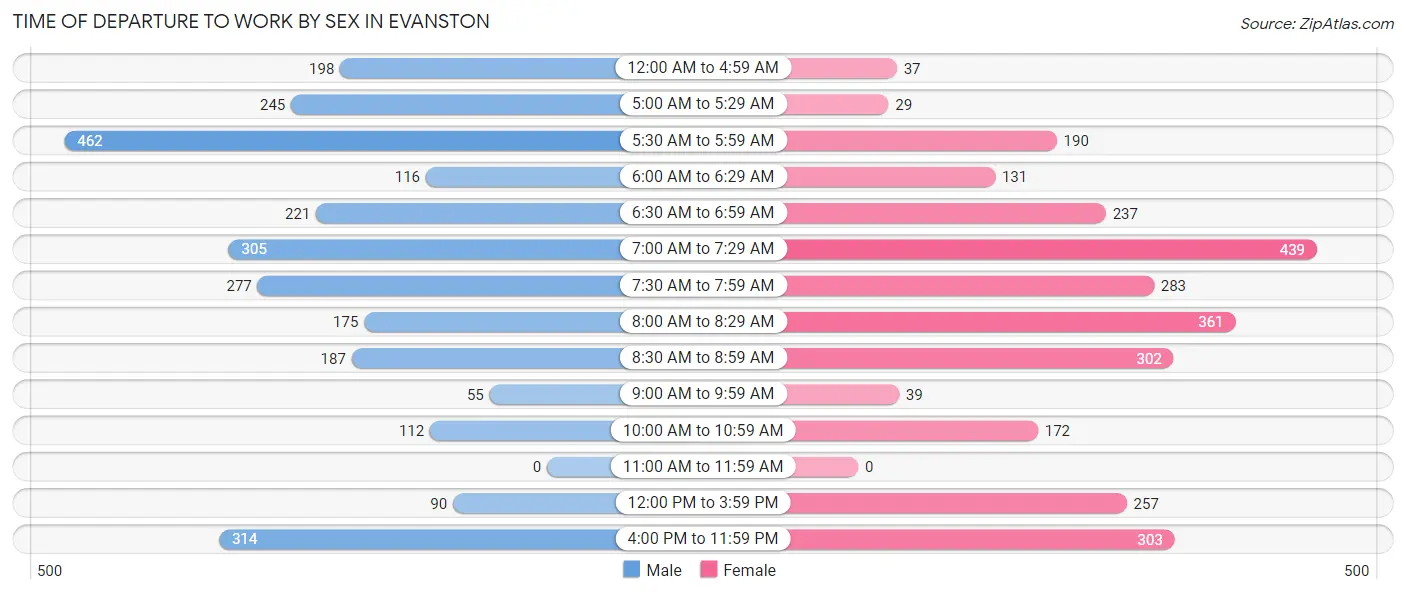
| Time of Departure | Male | Female |
| 12:00 AM to 4:59 AM | 198 (7.2%) | 37 (1.3%) |
| 5:00 AM to 5:29 AM | 245 (8.9%) | 29 (1.0%) |
| 5:30 AM to 5:59 AM | 462 (16.8%) | 190 (6.8%) |
| 6:00 AM to 6:29 AM | 116 (4.2%) | 131 (4.7%) |
| 6:30 AM to 6:59 AM | 221 (8.0%) | 237 (8.5%) |
| 7:00 AM to 7:29 AM | 305 (11.1%) | 439 (15.8%) |
| 7:30 AM to 7:59 AM | 277 (10.1%) | 283 (10.2%) |
| 8:00 AM to 8:29 AM | 175 (6.4%) | 361 (13.0%) |
| 8:30 AM to 8:59 AM | 187 (6.8%) | 302 (10.9%) |
| 9:00 AM to 9:59 AM | 55 (2.0%) | 39 (1.4%) |
| 10:00 AM to 10:59 AM | 112 (4.1%) | 172 (6.2%) |
| 11:00 AM to 11:59 AM | 0 (0.0%) | 0 (0.0%) |
| 12:00 PM to 3:59 PM | 90 (3.3%) | 257 (9.2%) |
| 4:00 PM to 11:59 PM | 314 (11.4%) | 303 (10.9%) |
| Total | 2,757 (100.0%) | 2,780 (100.0%) |
Housing Occupancy in Evanston
Occupancy by Ownership in Evanston
Of the total 4,628 dwellings in Evanston, owner-occupied units account for 3,346 (72.3%), while renter-occupied units make up 1,282 (27.7%).
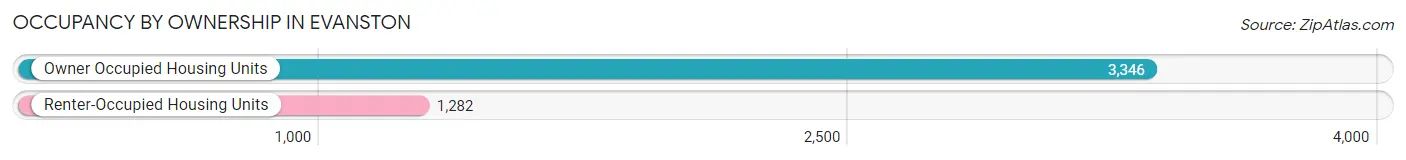
| Occupancy | # Housing Units | % Housing Units |
| Owner Occupied Housing Units | 3,346 | 72.3% |
| Renter-Occupied Housing Units | 1,282 | 27.7% |
| Total Occupied Housing Units | 4,628 | 100.0% |
Occupancy by Household Size in Evanston
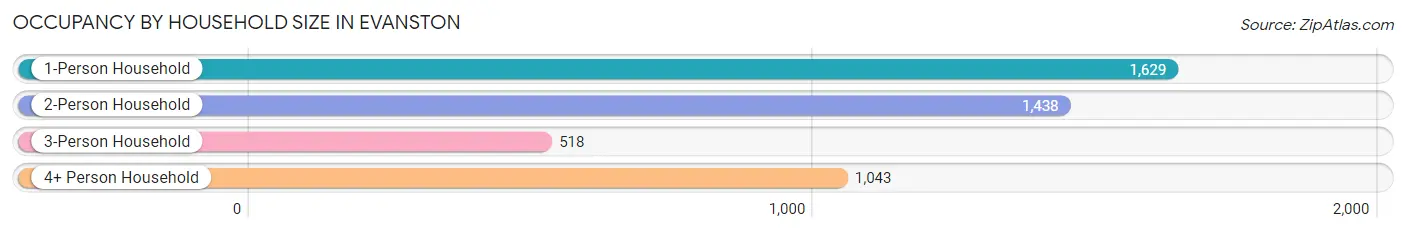
| Household Size | # Housing Units | % Housing Units |
| 1-Person Household | 1,629 | 35.2% |
| 2-Person Household | 1,438 | 31.1% |
| 3-Person Household | 518 | 11.2% |
| 4+ Person Household | 1,043 | 22.5% |
| Total Housing Units | 4,628 | 100.0% |
Occupancy by Ownership by Household Size in Evanston
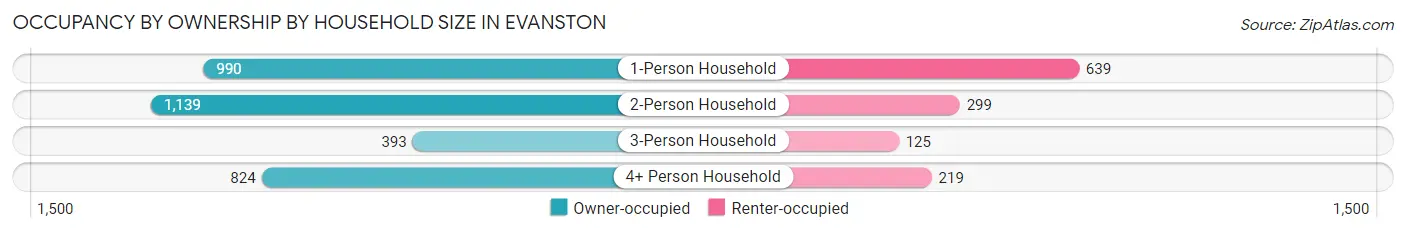
| Household Size | Owner-occupied | Renter-occupied |
| 1-Person Household | 990 (60.8%) | 639 (39.2%) |
| 2-Person Household | 1,139 (79.2%) | 299 (20.8%) |
| 3-Person Household | 393 (75.9%) | 125 (24.1%) |
| 4+ Person Household | 824 (79.0%) | 219 (21.0%) |
| Total Housing Units | 3,346 (72.3%) | 1,282 (27.7%) |
Occupancy by Educational Attainment in Evanston
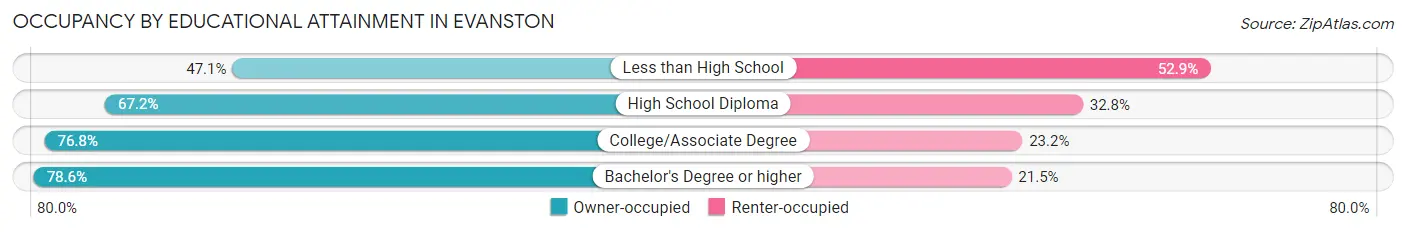
| Household Size | Owner-occupied | Renter-occupied |
| Less than High School | 112 (47.1%) | 126 (52.9%) |
| High School Diploma | 1,073 (67.2%) | 523 (32.8%) |
| College/Associate Degree | 1,509 (76.8%) | 455 (23.2%) |
| Bachelor's Degree or higher | 652 (78.5%) | 178 (21.4%) |
Occupancy by Age of Householder in Evanston
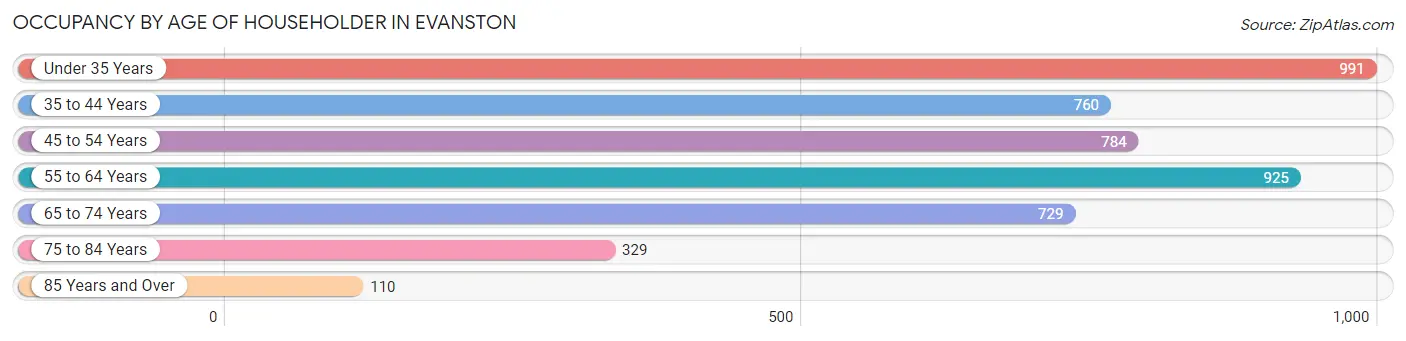
| Age Bracket | # Households | % Households |
| Under 35 Years | 991 | 21.4% |
| 35 to 44 Years | 760 | 16.4% |
| 45 to 54 Years | 784 | 16.9% |
| 55 to 64 Years | 925 | 20.0% |
| 65 to 74 Years | 729 | 15.8% |
| 75 to 84 Years | 329 | 7.1% |
| 85 Years and Over | 110 | 2.4% |
| Total | 4,628 | 100.0% |
Housing Finances in Evanston
Median Income by Occupancy in Evanston
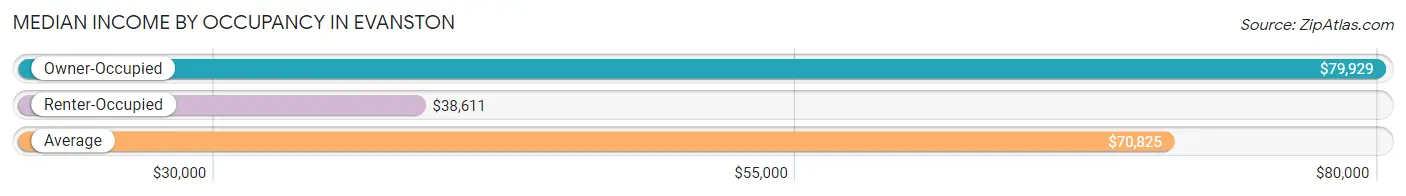
| Occupancy Type | # Households | Median Income |
| Owner-Occupied | 3,346 (72.3%) | $79,929 |
| Renter-Occupied | 1,282 (27.7%) | $38,611 |
| Average | 4,628 (100.0%) | $70,825 |
Occupancy by Householder Income Bracket in Evanston
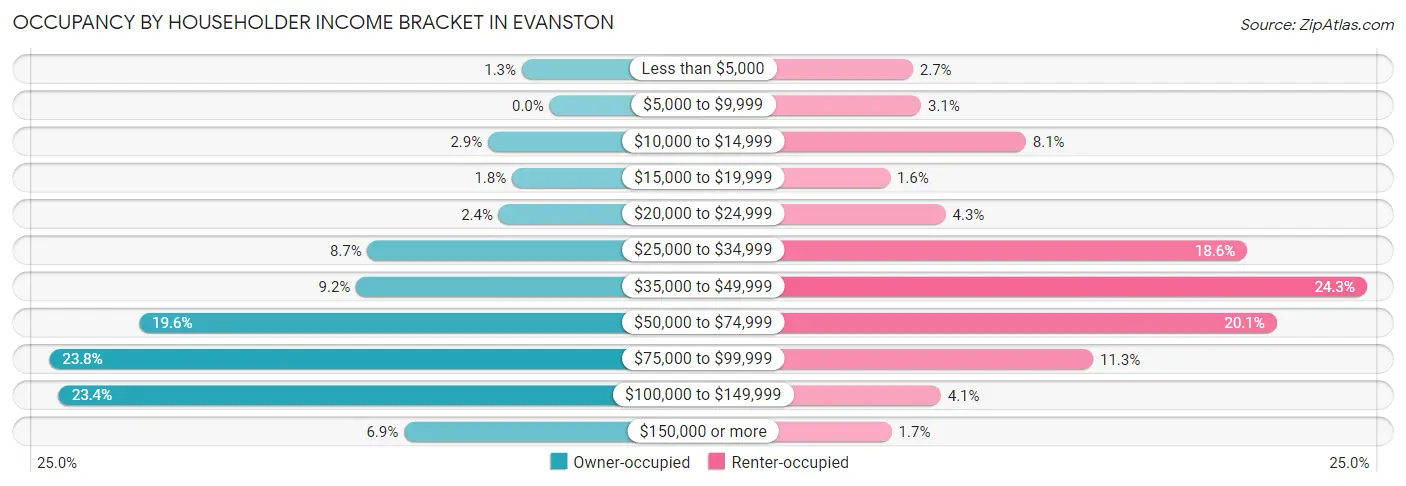
| Income Bracket | Owner-occupied | Renter-occupied |
| Less than $5,000 | 44 (1.3%) | 35 (2.7%) |
| $5,000 to $9,999 | 0 (0.0%) | 40 (3.1%) |
| $10,000 to $14,999 | 98 (2.9%) | 104 (8.1%) |
| $15,000 to $19,999 | 60 (1.8%) | 21 (1.6%) |
| $20,000 to $24,999 | 81 (2.4%) | 55 (4.3%) |
| $25,000 to $34,999 | 290 (8.7%) | 239 (18.6%) |
| $35,000 to $49,999 | 308 (9.2%) | 312 (24.3%) |
| $50,000 to $74,999 | 654 (19.6%) | 257 (20.1%) |
| $75,000 to $99,999 | 797 (23.8%) | 145 (11.3%) |
| $100,000 to $149,999 | 782 (23.4%) | 52 (4.1%) |
| $150,000 or more | 232 (6.9%) | 22 (1.7%) |
| Total | 3,346 (100.0%) | 1,282 (100.0%) |
Monthly Housing Cost Tiers in Evanston
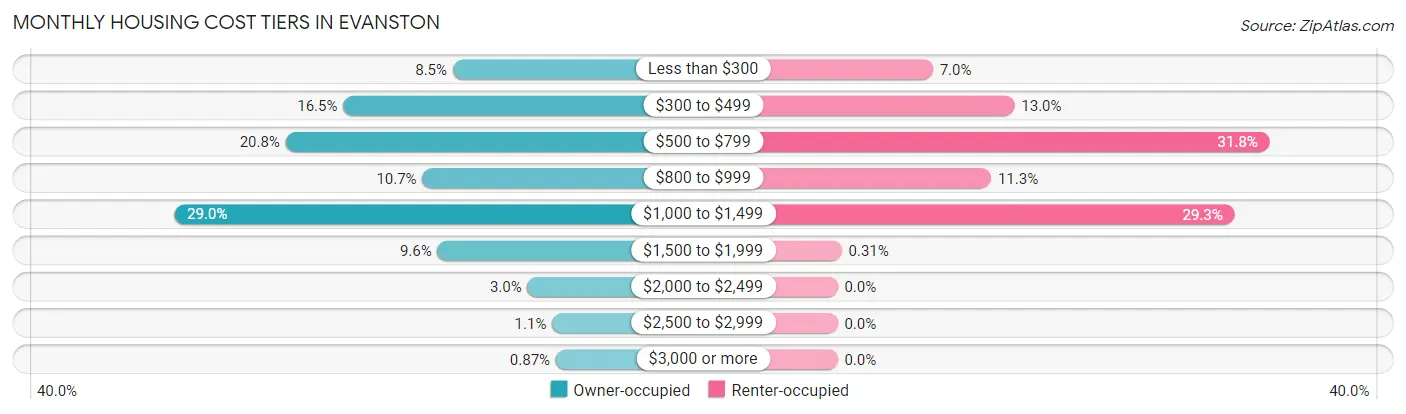
| Monthly Cost | Owner-occupied | Renter-occupied |
| Less than $300 | 283 (8.5%) | 90 (7.0%) |
| $300 to $499 | 553 (16.5%) | 167 (13.0%) |
| $500 to $799 | 695 (20.8%) | 408 (31.8%) |
| $800 to $999 | 358 (10.7%) | 145 (11.3%) |
| $1,000 to $1,499 | 970 (29.0%) | 375 (29.2%) |
| $1,500 to $1,999 | 321 (9.6%) | 4 (0.3%) |
| $2,000 to $2,499 | 99 (3.0%) | 0 (0.0%) |
| $2,500 to $2,999 | 38 (1.1%) | 0 (0.0%) |
| $3,000 or more | 29 (0.9%) | 0 (0.0%) |
| Total | 3,346 (100.0%) | 1,282 (100.0%) |
Physical Housing Characteristics in Evanston
Housing Structures in Evanston
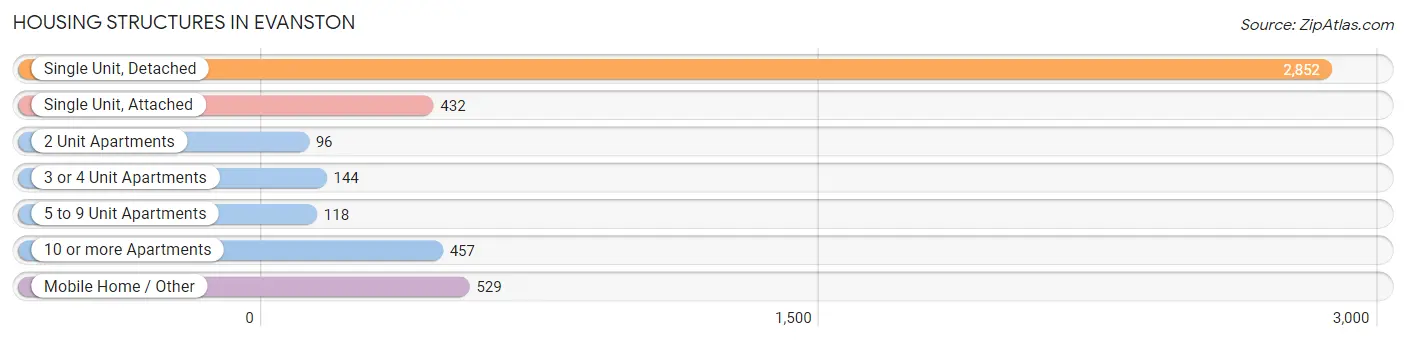
| Structure Type | # Housing Units | % Housing Units |
| Single Unit, Detached | 2,852 | 61.6% |
| Single Unit, Attached | 432 | 9.3% |
| 2 Unit Apartments | 96 | 2.1% |
| 3 or 4 Unit Apartments | 144 | 3.1% |
| 5 to 9 Unit Apartments | 118 | 2.5% |
| 10 or more Apartments | 457 | 9.9% |
| Mobile Home / Other | 529 | 11.4% |
| Total | 4,628 | 100.0% |
Housing Structures by Occupancy in Evanston
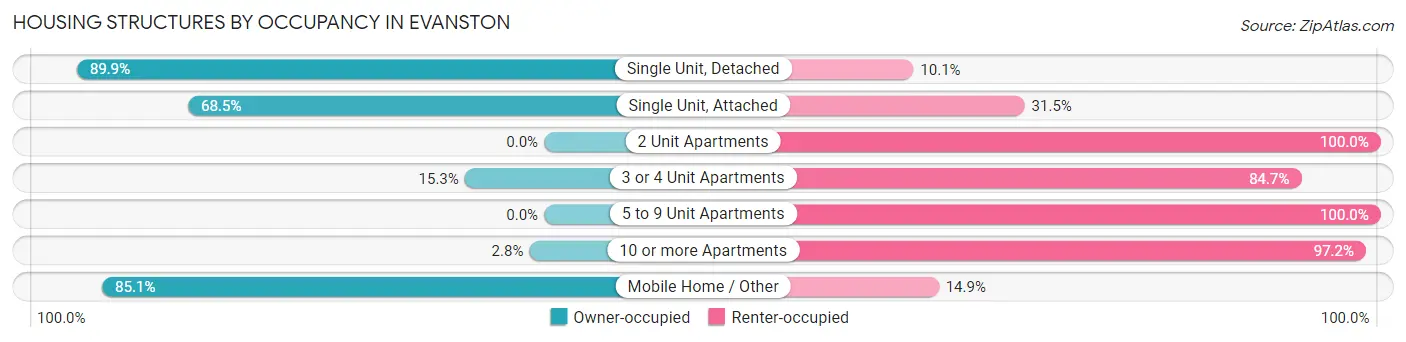
| Structure Type | Owner-occupied | Renter-occupied |
| Single Unit, Detached | 2,565 (89.9%) | 287 (10.1%) |
| Single Unit, Attached | 296 (68.5%) | 136 (31.5%) |
| 2 Unit Apartments | 0 (0.0%) | 96 (100.0%) |
| 3 or 4 Unit Apartments | 22 (15.3%) | 122 (84.7%) |
| 5 to 9 Unit Apartments | 0 (0.0%) | 118 (100.0%) |
| 10 or more Apartments | 13 (2.8%) | 444 (97.2%) |
| Mobile Home / Other | 450 (85.1%) | 79 (14.9%) |
| Total | 3,346 (72.3%) | 1,282 (27.7%) |
Housing Structures by Number of Rooms in Evanston
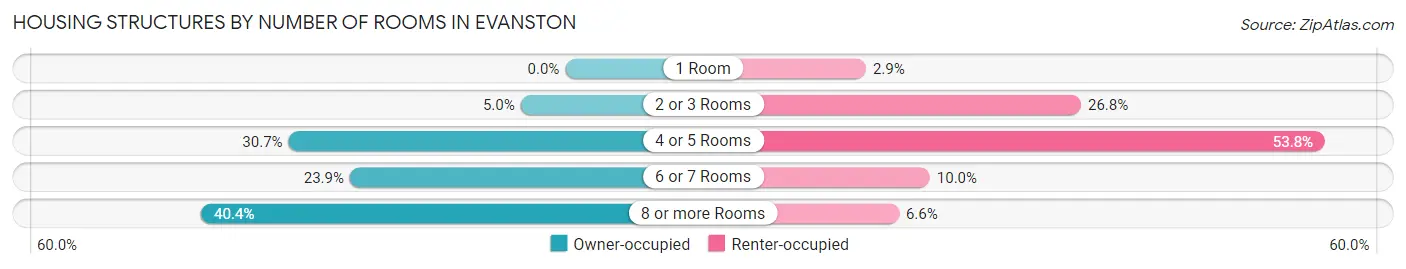
| Number of Rooms | Owner-occupied | Renter-occupied |
| 1 Room | 0 (0.0%) | 37 (2.9%) |
| 2 or 3 Rooms | 166 (5.0%) | 343 (26.8%) |
| 4 or 5 Rooms | 1,028 (30.7%) | 690 (53.8%) |
| 6 or 7 Rooms | 800 (23.9%) | 128 (10.0%) |
| 8 or more Rooms | 1,352 (40.4%) | 84 (6.6%) |
| Total | 3,346 (100.0%) | 1,282 (100.0%) |
Housing Structure by Heating Type in Evanston
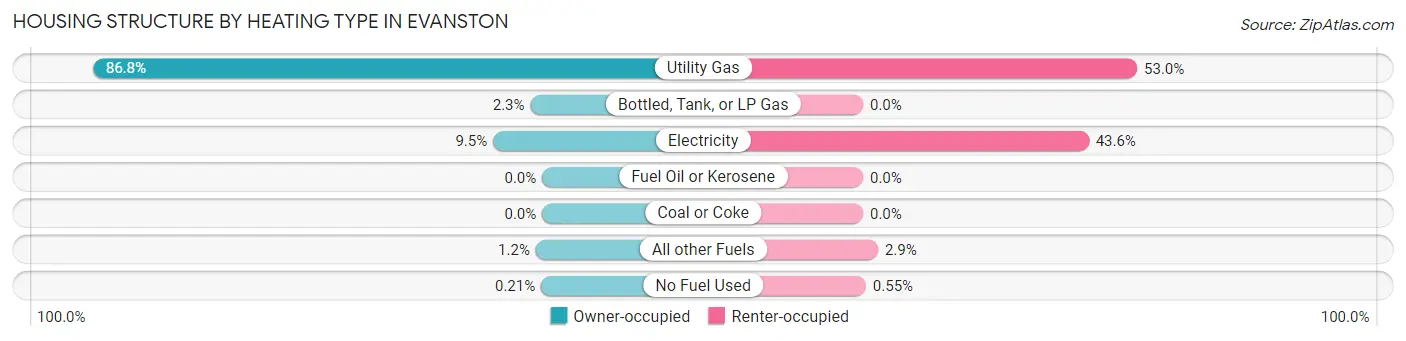
| Heating Type | Owner-occupied | Renter-occupied |
| Utility Gas | 2,905 (86.8%) | 679 (53.0%) |
| Bottled, Tank, or LP Gas | 76 (2.3%) | 0 (0.0%) |
| Electricity | 317 (9.5%) | 559 (43.6%) |
| Fuel Oil or Kerosene | 0 (0.0%) | 0 (0.0%) |
| Coal or Coke | 0 (0.0%) | 0 (0.0%) |
| All other Fuels | 41 (1.2%) | 37 (2.9%) |
| No Fuel Used | 7 (0.2%) | 7 (0.5%) |
| Total | 3,346 (100.0%) | 1,282 (100.0%) |
Household Vehicle Usage in Evanston
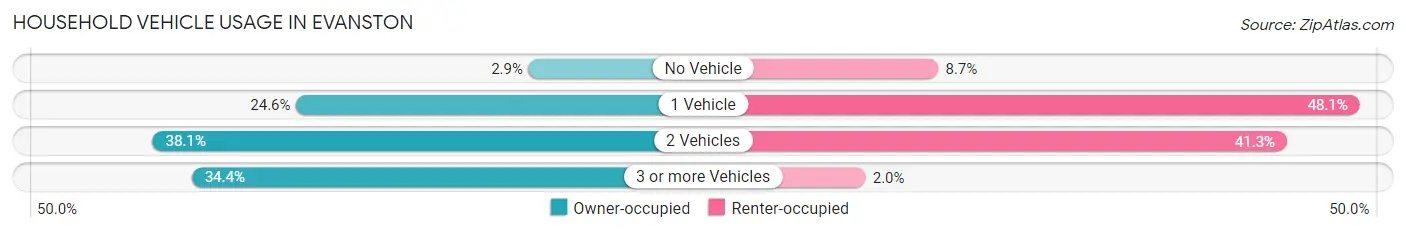
| Vehicles per Household | Owner-occupied | Renter-occupied |
| No Vehicle | 98 (2.9%) | 112 (8.7%) |
| 1 Vehicle | 824 (24.6%) | 616 (48.0%) |
| 2 Vehicles | 1,273 (38.1%) | 529 (41.3%) |
| 3 or more Vehicles | 1,151 (34.4%) | 25 (1.9%) |
| Total | 3,346 (100.0%) | 1,282 (100.0%) |
Real Estate & Mortgages in Evanston
Real Estate and Mortgage Overview in Evanston
| Characteristic | Without Mortgage | With Mortgage |
| Housing Units | 1,400 | 1,946 |
| Median Property Value | $195,200 | $198,300 |
| Median Household Income | $64,206 | $151 |
| Monthly Housing Costs | $466 | $7 |
| Real Estate Taxes | $1,306 | $24 |
Property Value by Mortgage Status in Evanston
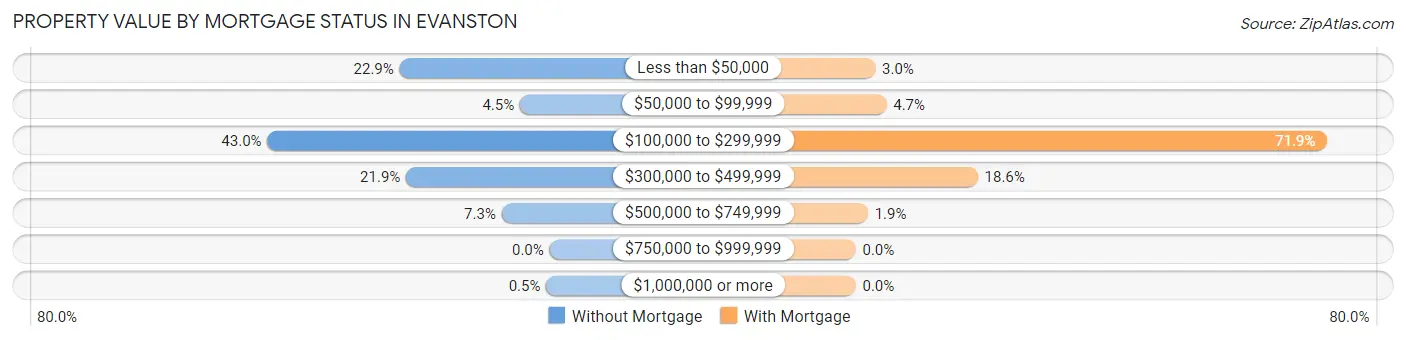
| Property Value | Without Mortgage | With Mortgage |
| Less than $50,000 | 320 (22.9%) | 58 (3.0%) |
| $50,000 to $99,999 | 63 (4.5%) | 91 (4.7%) |
| $100,000 to $299,999 | 602 (43.0%) | 1,399 (71.9%) |
| $300,000 to $499,999 | 306 (21.9%) | 362 (18.6%) |
| $500,000 to $749,999 | 102 (7.3%) | 36 (1.8%) |
| $750,000 to $999,999 | 0 (0.0%) | 0 (0.0%) |
| $1,000,000 or more | 7 (0.5%) | 0 (0.0%) |
| Total | 1,400 (100.0%) | 1,946 (100.0%) |
Household Income by Mortgage Status in Evanston
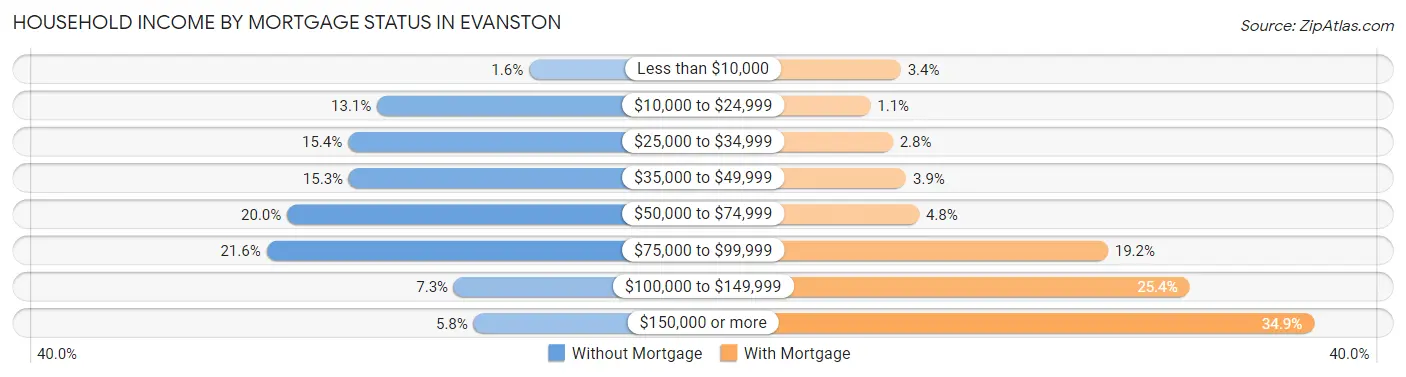
| Household Income | Without Mortgage | With Mortgage |
| Less than $10,000 | 22 (1.6%) | 67 (3.4%) |
| $10,000 to $24,999 | 184 (13.1%) | 22 (1.1%) |
| $25,000 to $34,999 | 215 (15.4%) | 55 (2.8%) |
| $35,000 to $49,999 | 214 (15.3%) | 75 (3.8%) |
| $50,000 to $74,999 | 280 (20.0%) | 94 (4.8%) |
| $75,000 to $99,999 | 302 (21.6%) | 374 (19.2%) |
| $100,000 to $149,999 | 102 (7.3%) | 495 (25.4%) |
| $150,000 or more | 81 (5.8%) | 680 (34.9%) |
| Total | 1,400 (100.0%) | 1,946 (100.0%) |
Property Value to Household Income Ratio in Evanston
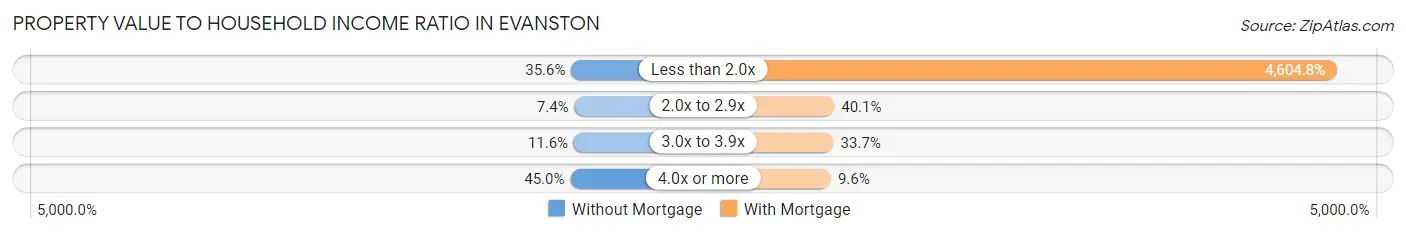
| Value-to-Income Ratio | Without Mortgage | With Mortgage |
| Less than 2.0x | 498 (35.6%) | 89,610 (4,604.8%) |
| 2.0x to 2.9x | 103 (7.4%) | 780 (40.1%) |
| 3.0x to 3.9x | 163 (11.6%) | 656 (33.7%) |
| 4.0x or more | 630 (45.0%) | 187 (9.6%) |
| Total | 1,400 (100.0%) | 1,946 (100.0%) |
Real Estate Taxes by Mortgage Status in Evanston
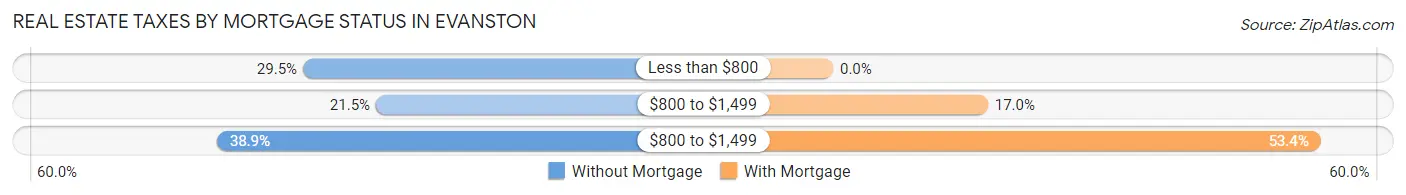
| Property Taxes | Without Mortgage | With Mortgage |
| Less than $800 | 413 (29.5%) | 0 (0.0%) |
| $800 to $1,499 | 301 (21.5%) | 330 (17.0%) |
| $800 to $1,499 | 545 (38.9%) | 1,040 (53.4%) |
| Total | 1,400 (100.0%) | 1,946 (100.0%) |
Health & Disability in Evanston
Health Insurance Coverage by Age in Evanston
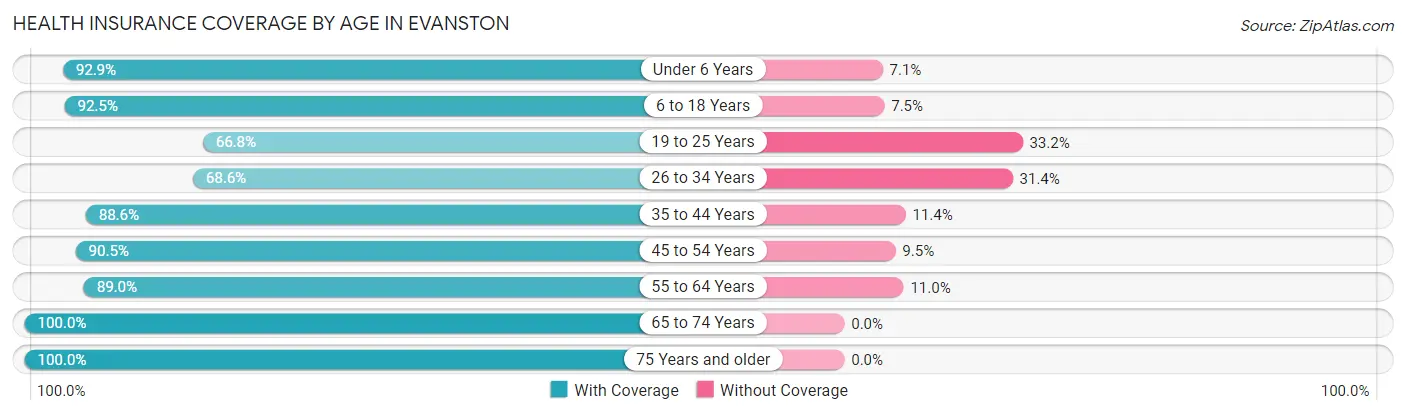
| Age Bracket | With Coverage | Without Coverage |
| Under 6 Years | 923 (92.9%) | 71 (7.1%) |
| 6 to 18 Years | 2,048 (92.5%) | 165 (7.5%) |
| 19 to 25 Years | 631 (66.8%) | 314 (33.2%) |
| 26 to 34 Years | 1,010 (68.6%) | 462 (31.4%) |
| 35 to 44 Years | 1,365 (88.6%) | 176 (11.4%) |
| 45 to 54 Years | 1,149 (90.5%) | 121 (9.5%) |
| 55 to 64 Years | 1,273 (89.0%) | 158 (11.0%) |
| 65 to 74 Years | 1,095 (100.0%) | 0 (0.0%) |
| 75 Years and older | 694 (100.0%) | 0 (0.0%) |
| Total | 10,188 (87.4%) | 1,467 (12.6%) |
Health Insurance Coverage by Citizenship Status in Evanston
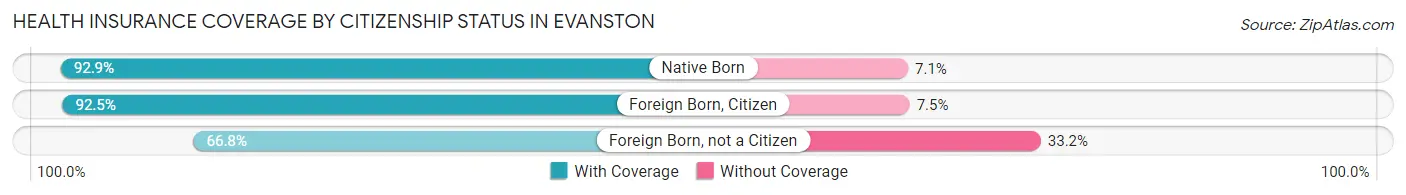
| Citizenship Status | With Coverage | Without Coverage |
| Native Born | 923 (92.9%) | 71 (7.1%) |
| Foreign Born, Citizen | 2,048 (92.5%) | 165 (7.5%) |
| Foreign Born, not a Citizen | 631 (66.8%) | 314 (33.2%) |
Health Insurance Coverage by Household Income in Evanston
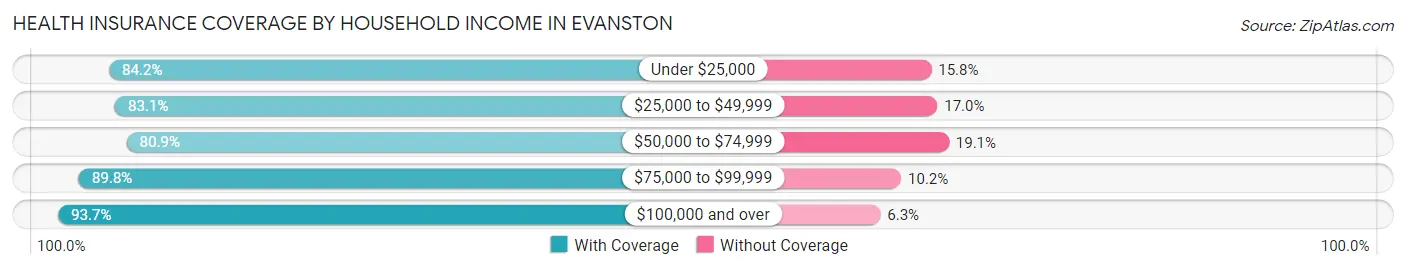
| Household Income | With Coverage | Without Coverage |
| Under $25,000 | 537 (84.2%) | 101 (15.8%) |
| $25,000 to $49,999 | 1,960 (83.1%) | 400 (17.0%) |
| $50,000 to $74,999 | 1,992 (80.9%) | 471 (19.1%) |
| $75,000 to $99,999 | 2,392 (89.8%) | 271 (10.2%) |
| $100,000 and over | 3,260 (93.7%) | 219 (6.3%) |
Public vs Private Health Insurance Coverage by Age in Evanston
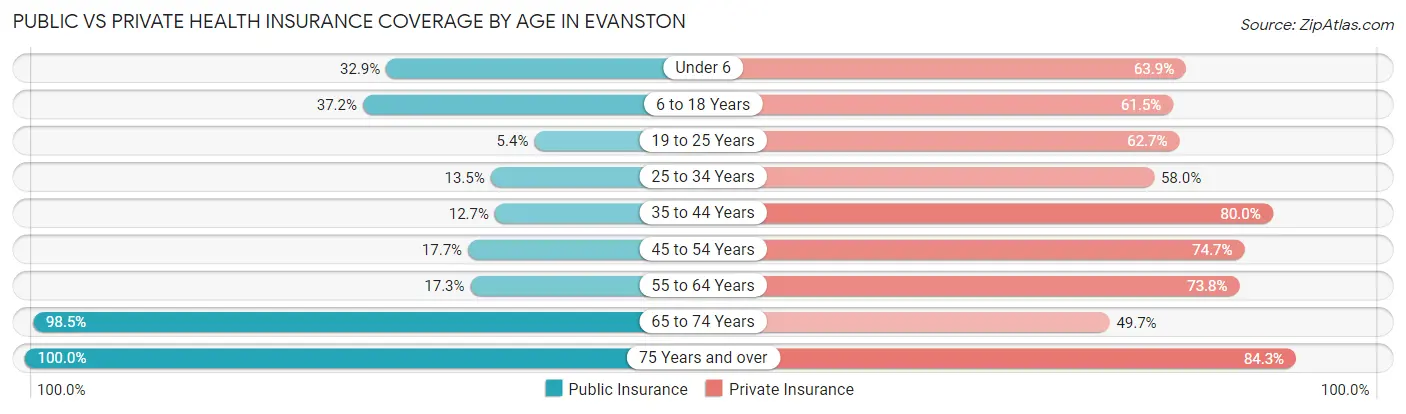
| Age Bracket | Public Insurance | Private Insurance |
| Under 6 | 327 (32.9%) | 635 (63.9%) |
| 6 to 18 Years | 824 (37.2%) | 1,361 (61.5%) |
| 19 to 25 Years | 51 (5.4%) | 592 (62.6%) |
| 25 to 34 Years | 199 (13.5%) | 853 (58.0%) |
| 35 to 44 Years | 196 (12.7%) | 1,232 (79.9%) |
| 45 to 54 Years | 225 (17.7%) | 949 (74.7%) |
| 55 to 64 Years | 247 (17.3%) | 1,056 (73.8%) |
| 65 to 74 Years | 1,078 (98.5%) | 544 (49.7%) |
| 75 Years and over | 694 (100.0%) | 585 (84.3%) |
| Total | 3,841 (33.0%) | 7,807 (67.0%) |
Disability Status by Sex by Age in Evanston
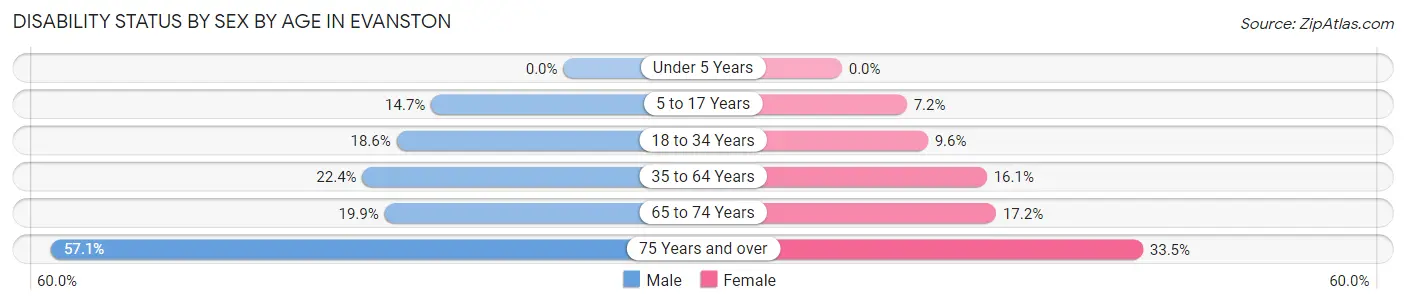
| Age Bracket | Male | Female |
| Under 5 Years | 0 (0.0%) | 0 (0.0%) |
| 5 to 17 Years | 182 (14.7%) | 84 (7.2%) |
| 18 to 34 Years | 214 (18.6%) | 127 (9.6%) |
| 35 to 64 Years | 500 (22.4%) | 324 (16.1%) |
| 65 to 74 Years | 87 (19.9%) | 113 (17.2%) |
| 75 Years and over | 202 (57.1%) | 114 (33.5%) |
Disability Class by Sex by Age in Evanston
Disability Class: Hearing Difficulty
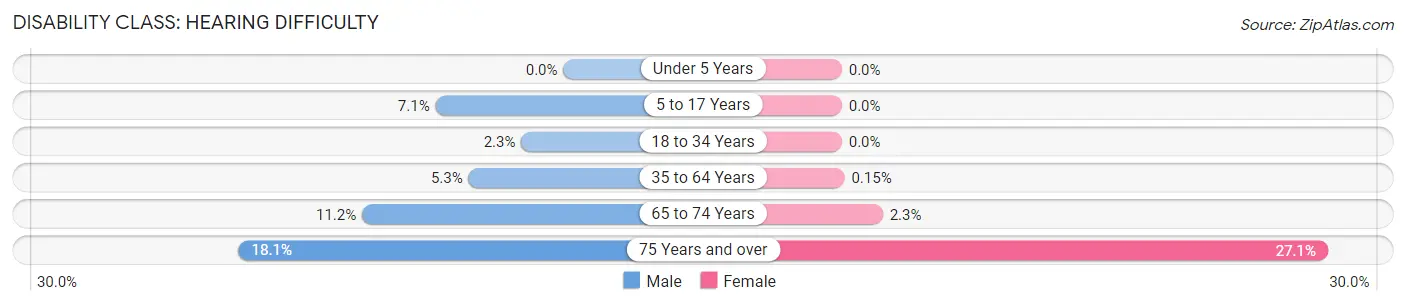
| Age Bracket | Male | Female |
| Under 5 Years | 0 (0.0%) | 0 (0.0%) |
| 5 to 17 Years | 88 (7.1%) | 0 (0.0%) |
| 18 to 34 Years | 27 (2.3%) | 0 (0.0%) |
| 35 to 64 Years | 118 (5.3%) | 3 (0.2%) |
| 65 to 74 Years | 49 (11.2%) | 15 (2.3%) |
| 75 Years and over | 64 (18.1%) | 92 (27.1%) |
Disability Class: Vision Difficulty
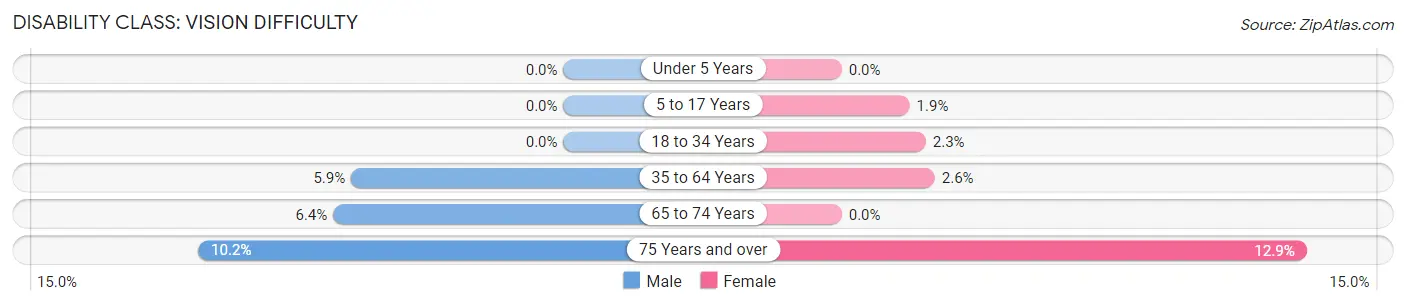
| Age Bracket | Male | Female |
| Under 5 Years | 0 (0.0%) | 0 (0.0%) |
| 5 to 17 Years | 0 (0.0%) | 22 (1.9%) |
| 18 to 34 Years | 0 (0.0%) | 31 (2.3%) |
| 35 to 64 Years | 132 (5.9%) | 52 (2.6%) |
| 65 to 74 Years | 28 (6.4%) | 0 (0.0%) |
| 75 Years and over | 36 (10.2%) | 44 (12.9%) |
Disability Class: Cognitive Difficulty
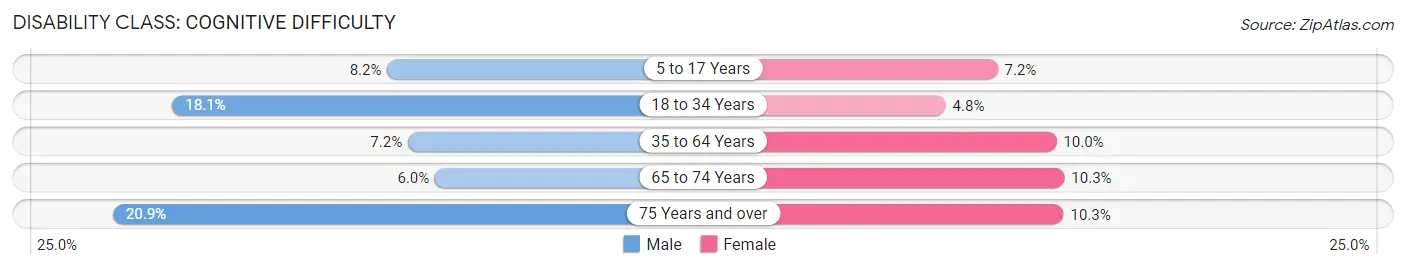
| Age Bracket | Male | Female |
| 5 to 17 Years | 101 (8.2%) | 84 (7.2%) |
| 18 to 34 Years | 209 (18.1%) | 64 (4.8%) |
| 35 to 64 Years | 161 (7.2%) | 200 (10.0%) |
| 65 to 74 Years | 26 (5.9%) | 68 (10.3%) |
| 75 Years and over | 74 (20.9%) | 35 (10.3%) |
Disability Class: Ambulatory Difficulty
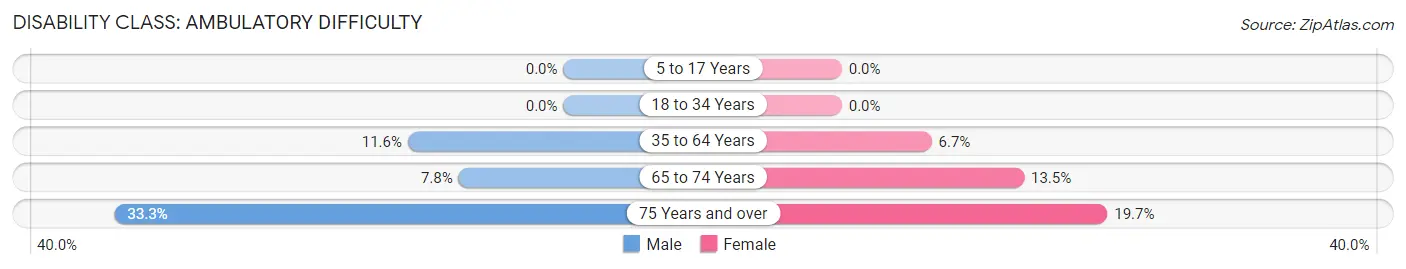
| Age Bracket | Male | Female |
| 5 to 17 Years | 0 (0.0%) | 0 (0.0%) |
| 18 to 34 Years | 0 (0.0%) | 0 (0.0%) |
| 35 to 64 Years | 258 (11.6%) | 134 (6.7%) |
| 65 to 74 Years | 34 (7.8%) | 89 (13.5%) |
| 75 Years and over | 118 (33.3%) | 67 (19.7%) |
Disability Class: Self-Care Difficulty
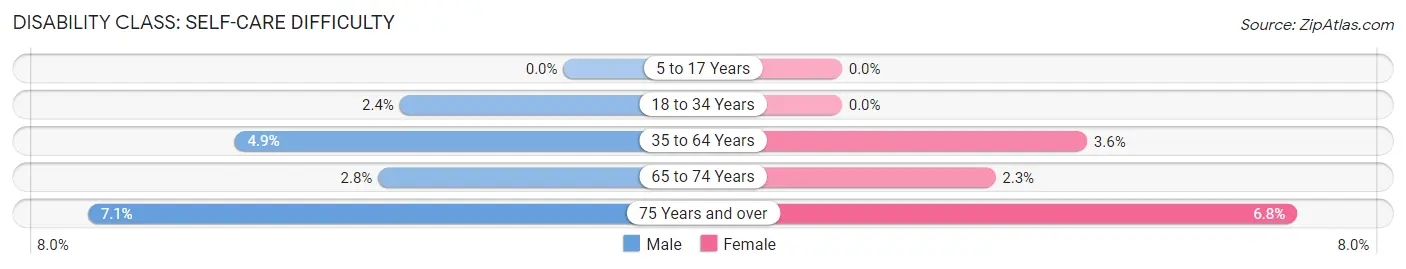
| Age Bracket | Male | Female |
| 5 to 17 Years | 0 (0.0%) | 0 (0.0%) |
| 18 to 34 Years | 28 (2.4%) | 0 (0.0%) |
| 35 to 64 Years | 109 (4.9%) | 73 (3.6%) |
| 65 to 74 Years | 12 (2.8%) | 15 (2.3%) |
| 75 Years and over | 25 (7.1%) | 23 (6.8%) |
Technology Access in Evanston
Computing Device Access in Evanston
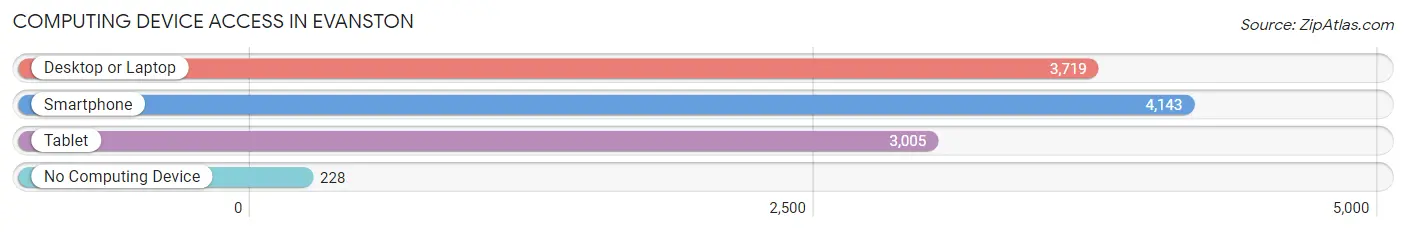
| Device Type | # Households | % Households |
| Desktop or Laptop | 3,719 | 80.4% |
| Smartphone | 4,143 | 89.5% |
| Tablet | 3,005 | 64.9% |
| No Computing Device | 228 | 4.9% |
| Total | 4,628 | 100.0% |
Internet Access in Evanston
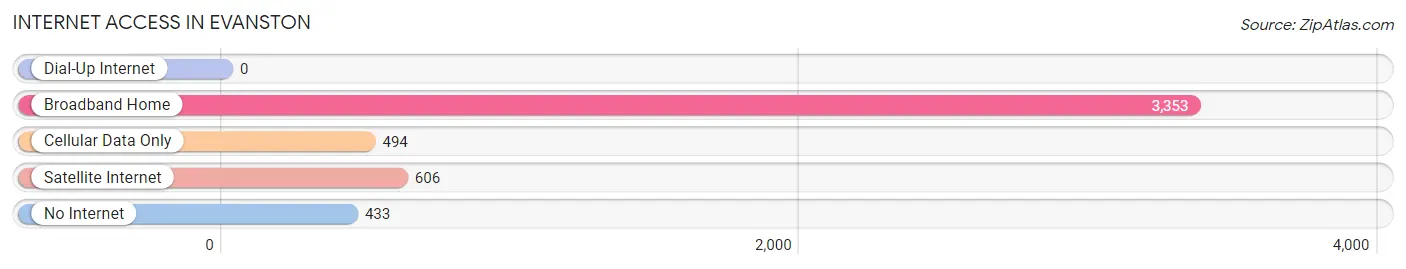
| Internet Type | # Households | % Households |
| Dial-Up Internet | 0 | 0.0% |
| Broadband Home | 3,353 | 72.5% |
| Cellular Data Only | 494 | 10.7% |
| Satellite Internet | 606 | 13.1% |
| No Internet | 433 | 9.4% |
| Total | 4,628 | 100.0% |
Evanston Summary
Evanston, Wyoming is a small city located in the southwestern corner of the state, near the Utah border. It is the county seat of Uinta County and is the largest city in the county. The city is located in the Bear River Valley, at an elevation of 6,715 feet. The city has a population of 12,359 as of the 2020 census, making it the tenth largest city in Wyoming.
History
Evanston was founded in 1868 as a railroad town, when the Union Pacific Railroad was built through the area. The city was named after James E. Evans, a surveyor for the railroad. The city was incorporated in 1884 and has since grown to become the largest city in Uinta County.
Geography
Evanston is located in the Bear River Valley, at an elevation of 6,715 feet. The city is situated on the western edge of the Uinta Mountains, which are part of the Rocky Mountains. The city is located near the Utah border, and is about 80 miles east of Salt Lake City. The city is located in a semi-arid climate, with hot summers and cold winters.
Economy
Evanston’s economy is largely based on the energy industry, with coal mining and oil and gas production being the main sources of employment. The city is also home to several manufacturing companies, including a large paper mill. The city is also home to several retail stores, restaurants, and other businesses.
Demographics
As of the 2020 census, Evanston had a population of 12,359. The racial makeup of the city was 91.2% White, 0.7% African American, 0.7% Native American, 0.7% Asian, 0.2% Pacific Islander, 4.2% from other races, and 2.2% from two or more races. Hispanic or Latino of any race were 8.2% of the population.
The median income for a household in Evanston was $45,945, and the median income for a family was $54,945. The per capita income for the city was $22,945. About 11.2% of families and 14.2% of the population were below the poverty line, including 17.2% of those under age 18 and 8.2% of those age 65 or over.
Evanston is a small city with a rich history and a diverse population. The city’s economy is largely based on the energy industry, and the city is home to several manufacturing companies and retail stores. The city has a population of 12,359 as of the 2020 census, and the median income for a household is $45,945.
Common Questions
What is the Total Population of Evanston?
Total Population of Evanston is 11,801.
What is the Total Male Population of Evanston?
Total Male Population of Evanston is 5,868.
What is the Total Female Population of Evanston?
Total Female Population of Evanston is 5,933.
What is the Ratio of Males per 100 Females in Evanston?
There are 98.90 Males per 100 Females in Evanston.
What is the Ratio of Females per 100 Males in Evanston?
There are 101.11 Females per 100 Males in Evanston.
What is the Median Population Age in Evanston?
Median Population Age in Evanston is 35.7 Years.
What is the Average Family Size in Evanston
Average Family Size in Evanston is 3.3 People.
What is the Average Household Size in Evanston
Average Household Size in Evanston is 2.5 People.
What is Per Capita Income in Evanston?
Per Capita income in Evanston is $30,393.
What is the Median Family Income in Evanston?
Median Family Income in Evanston is $78,813.
What is the Median Household income in Evanston?
Median Household Income in Evanston is $70,825.
What is Income or Wage Gap in Evanston?
Income or Wage Gap in Evanston is 54.6%.
Women in Evanston earn 45.4 cents for every dollar earned by a man.
What is Inequality or Gini Index in Evanston?
Inequality or Gini Index in Evanston is 0.35.
How Large is the Labor Force in Evanston?
There are 6,081 People in the Labor Forcein in Evanston.
What is the Percentage of People in the Labor Force in Evanston?
68.1% of People are in the Labor Force in Evanston.
What is the Unemployment Rate in Evanston?
Unemployment Rate in Evanston is 4.2%.