Gillette, WY Map & Demographics
Gillette Map
Gillette Overview
$38,670
PER CAPITA INCOME
$101,455
AVG FAMILY INCOME
$90,415
AVG HOUSEHOLD INCOME
44.6%
WAGE / INCOME GAP [ % ]
55.4¢/ $1
WAGE / INCOME GAP [ $ ]
0.39
INEQUALITY / GINI INDEX
33,158
TOTAL POPULATION
17,387
MALE POPULATION
15,771
FEMALE POPULATION
110.25
MALES / 100 FEMALES
90.71
FEMALES / 100 MALES
33.2
MEDIAN AGE
3.2
AVG FAMILY SIZE
2.6
AVG HOUSEHOLD SIZE
17,522
LABOR FORCE [ PEOPLE ]
71.8%
PERCENT IN LABOR FORCE
3.6%
UNEMPLOYMENT RATE
Gillette Area Codes
Income in Gillette
Income Overview in Gillette
Per Capita Income in Gillette is $38,670, while median incomes of families and households are $101,455 and $90,415 respectively.
| Characteristic | Number | Measure |
| Per Capita Income | 33,158 | $38,670 |
| Median Family Income | 8,521 | $101,455 |
| Mean Family Income | 8,521 | $111,370 |
| Median Household Income | 12,417 | $90,415 |
| Mean Household Income | 12,417 | $101,113 |
| Income Deficit | 8,521 | $0 |
| Wage / Income Gap (%) | 33,158 | 44.61% |
| Wage / Income Gap ($) | 33,158 | 55.39¢ per $1 |
| Gini / Inequality Index | 33,158 | 0.39 |
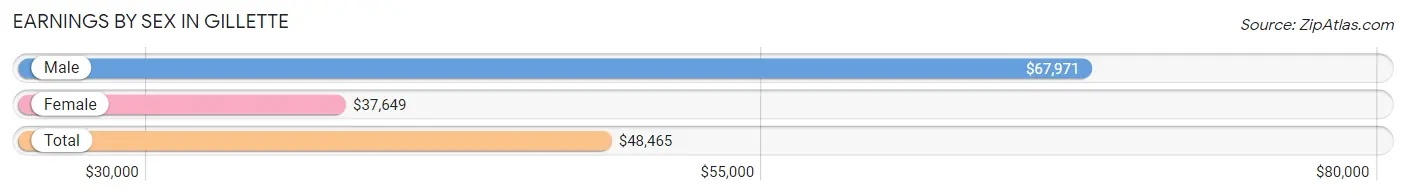
Earnings by Sex in Gillette
Average Earnings in Gillette are $48,465, $67,971 for men and $37,649 for women, a difference of 44.6%.
| Sex | Number | Average Earnings |
| Male | 10,421 (57.5%) | $67,971 |
| Female | 7,710 (42.5%) | $37,649 |
| Total | 18,131 (100.0%) | $48,465 |
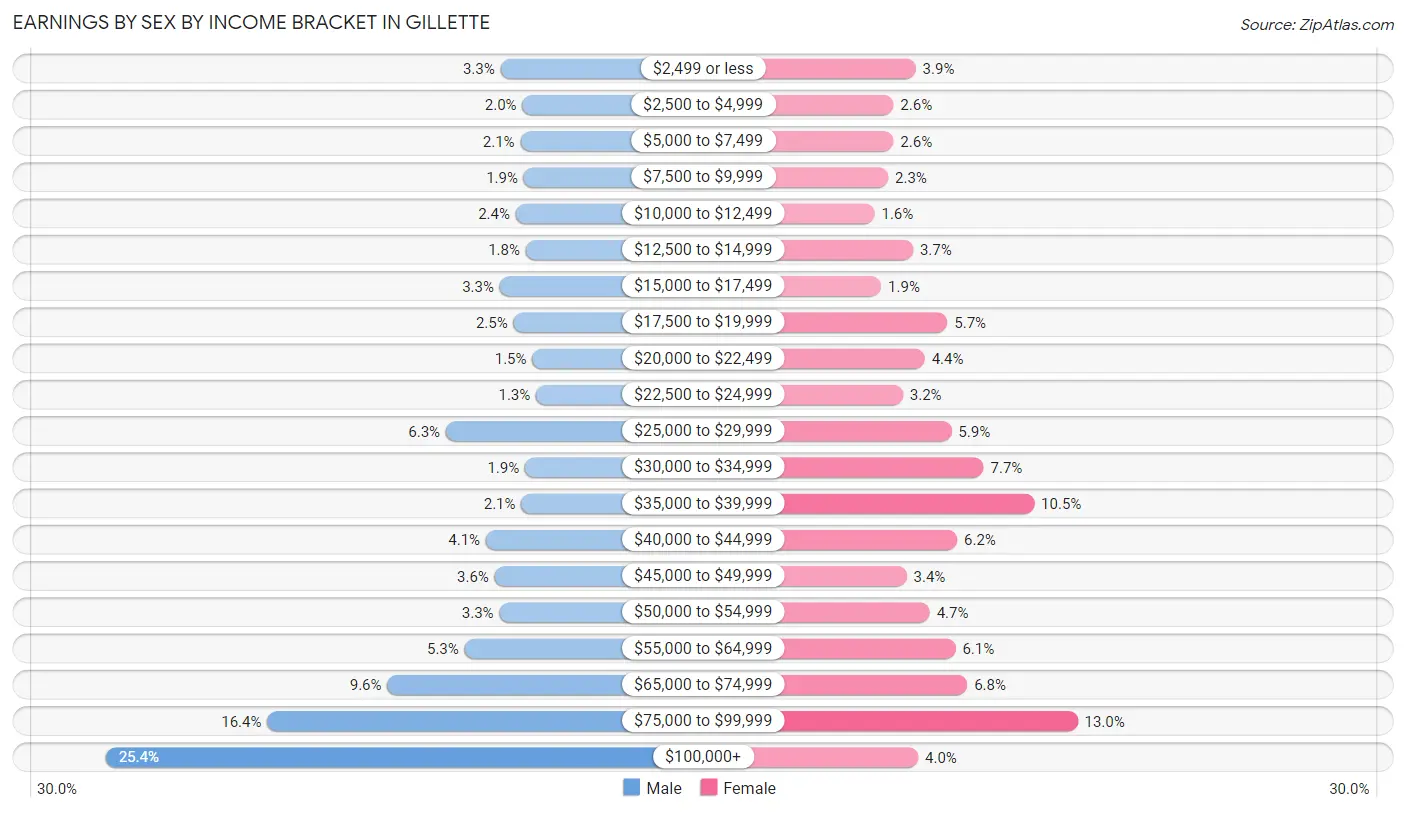
Earnings by Sex by Income Bracket in Gillette
The most common earnings brackets in Gillette are $100,000+ for men (2,651 | 25.4%) and $75,000 to $99,999 for women (1,000 | 13.0%).
| Income | Male | Female |
| $2,499 or less | 339 (3.3%) | 298 (3.9%) |
| $2,500 to $4,999 | 211 (2.0%) | 202 (2.6%) |
| $5,000 to $7,499 | 222 (2.1%) | 202 (2.6%) |
| $7,500 to $9,999 | 202 (1.9%) | 179 (2.3%) |
| $10,000 to $12,499 | 249 (2.4%) | 120 (1.6%) |
| $12,500 to $14,999 | 191 (1.8%) | 287 (3.7%) |
| $15,000 to $17,499 | 343 (3.3%) | 149 (1.9%) |
| $17,500 to $19,999 | 263 (2.5%) | 436 (5.7%) |
| $20,000 to $22,499 | 152 (1.5%) | 338 (4.4%) |
| $22,500 to $24,999 | 130 (1.3%) | 243 (3.2%) |
| $25,000 to $29,999 | 659 (6.3%) | 453 (5.9%) |
| $30,000 to $34,999 | 195 (1.9%) | 593 (7.7%) |
| $35,000 to $39,999 | 217 (2.1%) | 812 (10.5%) |
| $40,000 to $44,999 | 424 (4.1%) | 478 (6.2%) |
| $45,000 to $49,999 | 373 (3.6%) | 259 (3.4%) |
| $50,000 to $54,999 | 345 (3.3%) | 359 (4.7%) |
| $55,000 to $64,999 | 549 (5.3%) | 471 (6.1%) |
| $65,000 to $74,999 | 1,001 (9.6%) | 522 (6.8%) |
| $75,000 to $99,999 | 1,705 (16.4%) | 1,000 (13.0%) |
| $100,000+ | 2,651 (25.4%) | 309 (4.0%) |
| Total | 10,421 (100.0%) | 7,710 (100.0%) |
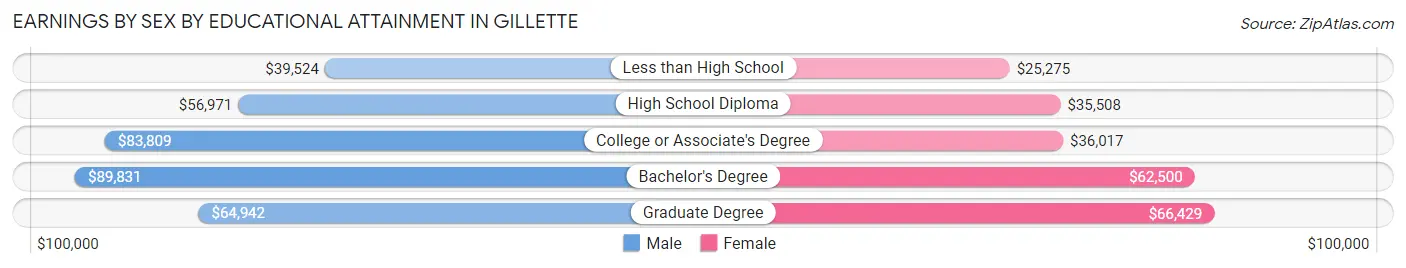
Earnings by Sex by Educational Attainment in Gillette
Average earnings in Gillette are $73,546 for men and $39,942 for women, a difference of 45.7%. Men with an educational attainment of bachelor's degree enjoy the highest average annual earnings of $89,831, while those with less than high school education earn the least with $39,524. Women with an educational attainment of graduate degree earn the most with the average annual earnings of $66,429, while those with less than high school education have the smallest earnings of $25,275.
| Educational Attainment | Male Income | Female Income |
| Less than High School | $39,524 | $25,275 |
| High School Diploma | $56,971 | $35,508 |
| College or Associate's Degree | $83,809 | $36,017 |
| Bachelor's Degree | $89,831 | $62,500 |
| Graduate Degree | $64,942 | $66,429 |
| Total | $73,546 | $39,942 |
Family Income in Gillette
Family Income Brackets in Gillette
According to the Gillette family income data, there are 2,301 families falling into the $100,000 to $149,999 income range, which is the most common income bracket and makes up 27.0% of all families. Conversely, the $10,000 to $14,999 income bracket is the least frequent group with only 51 families (0.6%) belonging to this category.

| Income Bracket | # Families | % Families |
| Less than $10,000 | 341 | 4.0% |
| $10,000 to $14,999 | 51 | 0.6% |
| $15,000 to $24,999 | 298 | 3.5% |
| $25,000 to $34,999 | 247 | 2.9% |
| $35,000 to $49,999 | 571 | 6.7% |
| $50,000 to $74,999 | 1,167 | 13.7% |
| $75,000 to $99,999 | 1,474 | 17.3% |
| $100,000 to $149,999 | 2,301 | 27.0% |
| $150,000 to $199,999 | 1,244 | 14.6% |
| $200,000+ | 827 | 9.7% |
Family Income by Famaliy Size in Gillette
5-person families (576 | 6.8%) account for the highest median family income in Gillette with $126,742 per family, while 2-person families (3,888 | 45.6%) have the highest median income of $49,049 per family member.
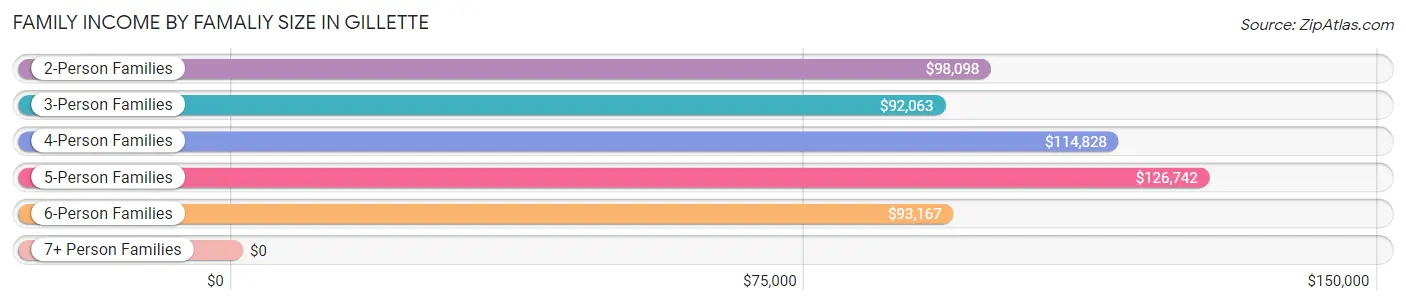
| Income Bracket | # Families | Median Income |
| 2-Person Families | 3,888 (45.6%) | $98,098 |
| 3-Person Families | 1,876 (22.0%) | $92,063 |
| 4-Person Families | 1,966 (23.1%) | $114,828 |
| 5-Person Families | 576 (6.8%) | $126,742 |
| 6-Person Families | 154 (1.8%) | $93,167 |
| 7+ Person Families | 61 (0.7%) | $0 |
| Total | 8,521 (100.0%) | $101,455 |
Family Income by Number of Earners in Gillette
The median family income in Gillette is $101,455, with families comprising 2 earners (4,075) having the highest median family income of $129,970, while families with no earners (945) have the lowest median family income of $50,417, accounting for 47.8% and 11.1% of families, respectively.
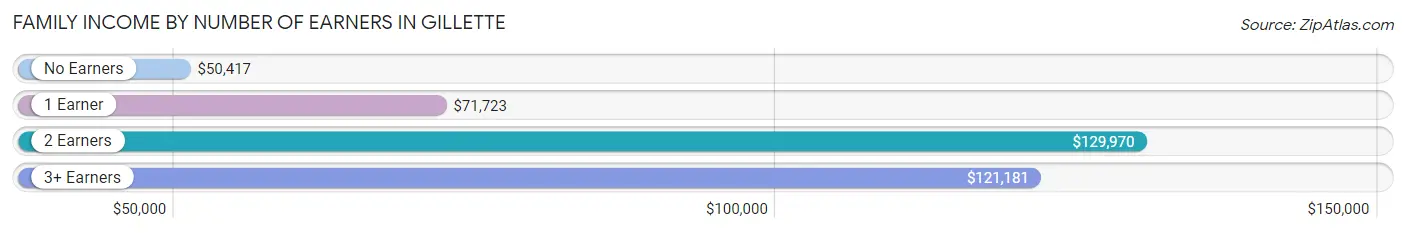
| Number of Earners | # Families | Median Income |
| No Earners | 945 (11.1%) | $50,417 |
| 1 Earner | 2,777 (32.6%) | $71,723 |
| 2 Earners | 4,075 (47.8%) | $129,970 |
| 3+ Earners | 724 (8.5%) | $121,181 |
| Total | 8,521 (100.0%) | $101,455 |
Household Income in Gillette
Household Income Brackets in Gillette
With 2,968 households falling in the category, the $100,000 to $149,999 income range is the most frequent in Gillette, accounting for 23.9% of all households. In contrast, only 261 households (2.1%) fall into the $10,000 to $14,999 income bracket, making it the least populous group.
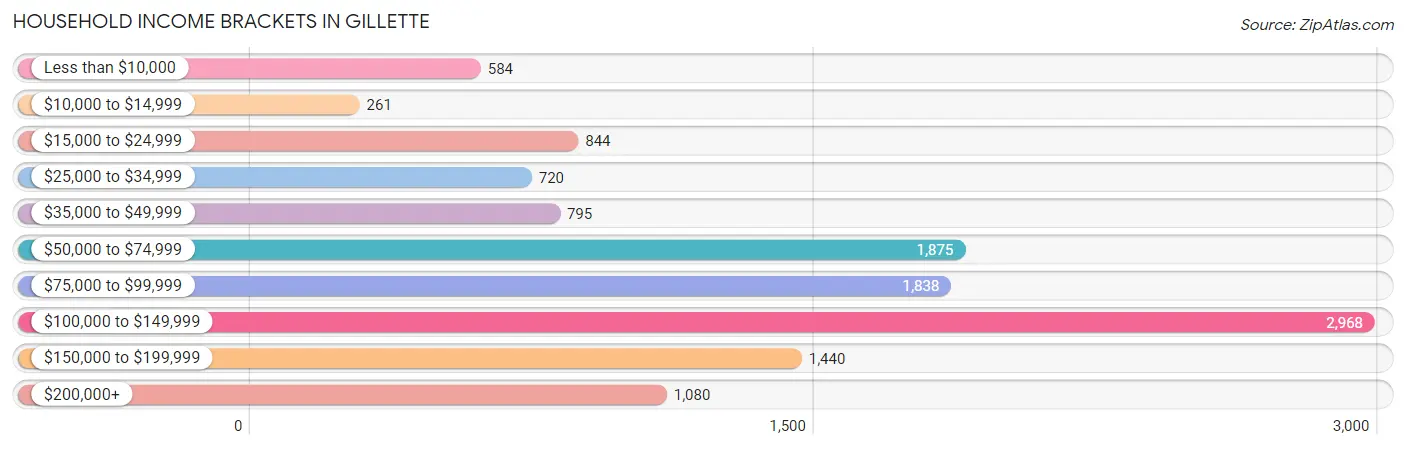
| Income Bracket | # Households | % Households |
| Less than $10,000 | 584 | 4.7% |
| $10,000 to $14,999 | 261 | 2.1% |
| $15,000 to $24,999 | 844 | 6.8% |
| $25,000 to $34,999 | 720 | 5.8% |
| $35,000 to $49,999 | 795 | 6.4% |
| $50,000 to $74,999 | 1,875 | 15.1% |
| $75,000 to $99,999 | 1,838 | 14.8% |
| $100,000 to $149,999 | 2,968 | 23.9% |
| $150,000 to $199,999 | 1,440 | 11.6% |
| $200,000+ | 1,080 | 8.7% |
Household Income by Householder Age in Gillette
The median household income in Gillette is $90,415, with the highest median household income of $111,535 found in the 45 to 64 years age bracket for the primary householder. A total of 3,942 households (31.8%) fall into this category. Meanwhile, the 15 to 24 years age bracket for the primary householder has the lowest median household income of $33,661, with 760 households (6.1%) in this group.
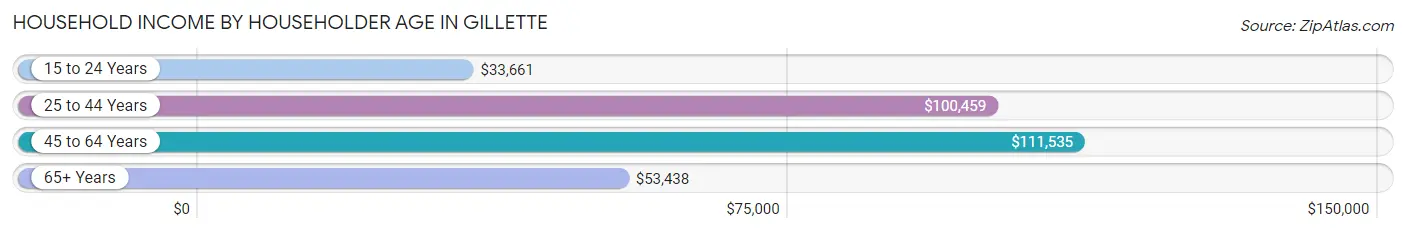
| Income Bracket | # Households | Median Income |
| 15 to 24 Years | 760 (6.1%) | $33,661 |
| 25 to 44 Years | 5,281 (42.5%) | $100,459 |
| 45 to 64 Years | 3,942 (31.8%) | $111,535 |
| 65+ Years | 2,434 (19.6%) | $53,438 |
| Total | 12,417 (100.0%) | $90,415 |
Poverty in Gillette
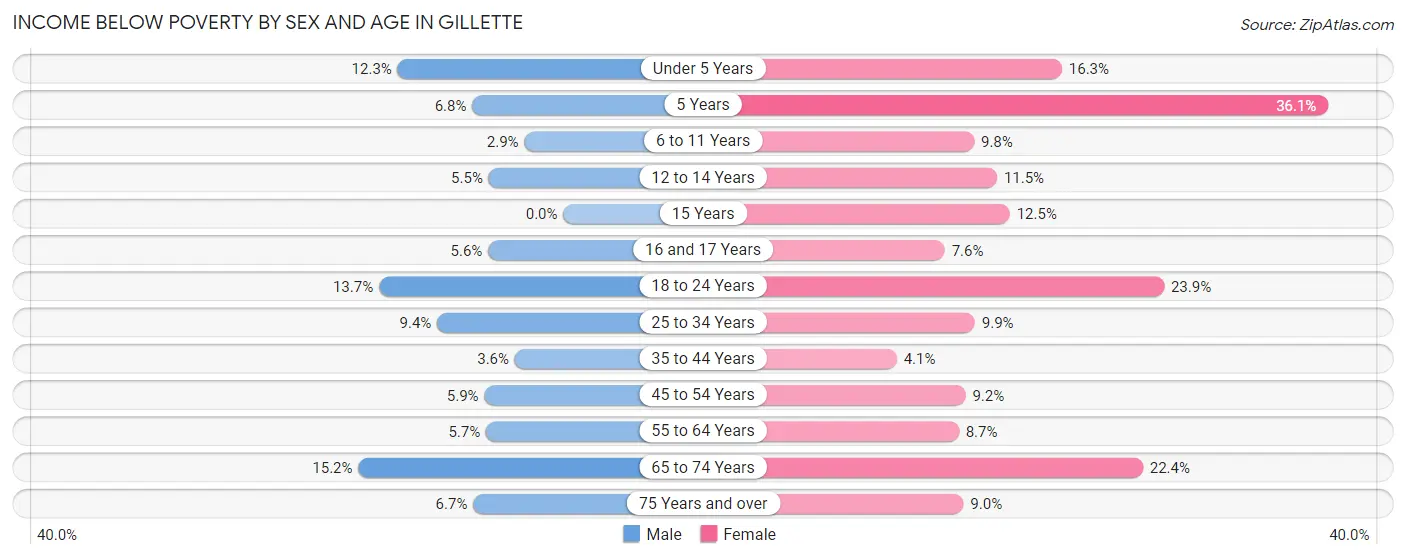
Income Below Poverty by Sex and Age in Gillette
With 7.6% poverty level for males and 11.9% for females among the residents of Gillette, 65 to 74 year old males and 5 year old females are the most vulnerable to poverty, with 195 males (15.2%) and 104 females (36.1%) in their respective age groups living below the poverty level.
| Age Bracket | Male | Female |
| Under 5 Years | 188 (12.3%) | 174 (16.3%) |
| 5 Years | 23 (6.8%) | 104 (36.1%) |
| 6 to 11 Years | 50 (2.9%) | 145 (9.8%) |
| 12 to 14 Years | 48 (5.5%) | 93 (11.5%) |
| 15 Years | 0 (0.0%) | 45 (12.5%) |
| 16 and 17 Years | 37 (5.6%) | 22 (7.6%) |
| 18 to 24 Years | 188 (13.7%) | 299 (23.9%) |
| 25 to 34 Years | 238 (9.4%) | 244 (9.9%) |
| 35 to 44 Years | 96 (3.6%) | 91 (4.1%) |
| 45 to 54 Years | 78 (5.9%) | 126 (9.2%) |
| 55 to 64 Years | 126 (5.7%) | 175 (8.7%) |
| 65 to 74 Years | 195 (15.2%) | 278 (22.4%) |
| 75 Years and over | 32 (6.7%) | 57 (9.0%) |
| Total | 1,299 (7.6%) | 1,853 (11.9%) |
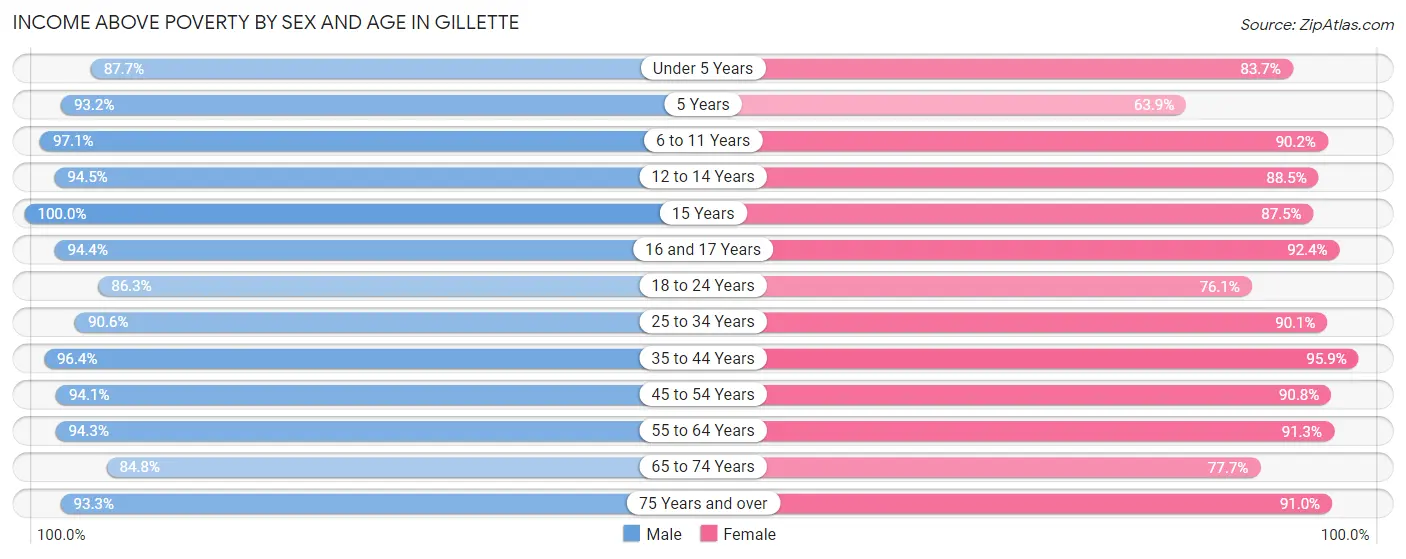
Income Above Poverty by Sex and Age in Gillette
According to the poverty statistics in Gillette, males aged 15 years and females aged 35 to 44 years are the age groups that are most secure financially, with 100.0% of males and 95.9% of females in these age groups living above the poverty line.
| Age Bracket | Male | Female |
| Under 5 Years | 1,340 (87.7%) | 891 (83.7%) |
| 5 Years | 317 (93.2%) | 184 (63.9%) |
| 6 to 11 Years | 1,680 (97.1%) | 1,331 (90.2%) |
| 12 to 14 Years | 819 (94.5%) | 714 (88.5%) |
| 15 Years | 132 (100.0%) | 316 (87.5%) |
| 16 and 17 Years | 626 (94.4%) | 266 (92.4%) |
| 18 to 24 Years | 1,185 (86.3%) | 951 (76.1%) |
| 25 to 34 Years | 2,302 (90.6%) | 2,225 (90.1%) |
| 35 to 44 Years | 2,567 (96.4%) | 2,142 (95.9%) |
| 45 to 54 Years | 1,253 (94.1%) | 1,247 (90.8%) |
| 55 to 64 Years | 2,069 (94.3%) | 1,841 (91.3%) |
| 65 to 74 Years | 1,086 (84.8%) | 966 (77.6%) |
| 75 Years and over | 446 (93.3%) | 574 (91.0%) |
| Total | 15,822 (92.4%) | 13,648 (88.0%) |
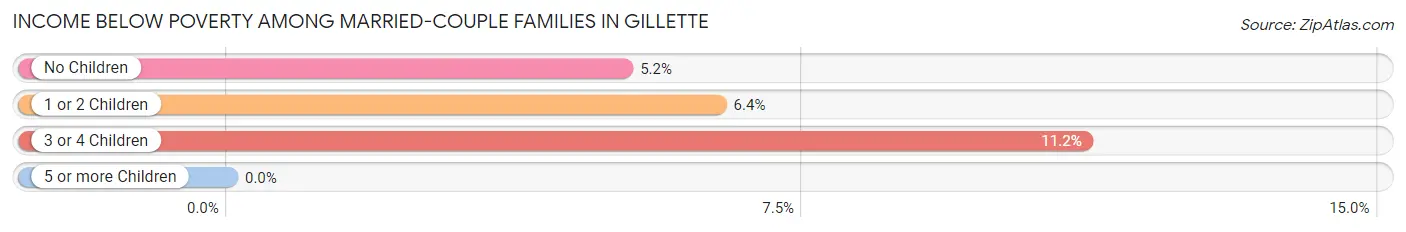
Income Below Poverty Among Married-Couple Families in Gillette
The poverty statistics for married-couple families in Gillette show that 6.1% or 408 of the total 6,629 families live below the poverty line. Families with 3 or 4 children have the highest poverty rate of 11.2%, comprising of 65 families. On the other hand, families with no children have the lowest poverty rate of 5.2%, which includes 181 families.
| Children | Above Poverty | Below Poverty |
| No Children | 3,325 (94.8%) | 181 (5.2%) |
| 1 or 2 Children | 2,379 (93.6%) | 162 (6.4%) |
| 3 or 4 Children | 517 (88.8%) | 65 (11.2%) |
| 5 or more Children | 0 (0.0%) | 0 (0.0%) |
| Total | 6,221 (93.9%) | 408 (6.1%) |
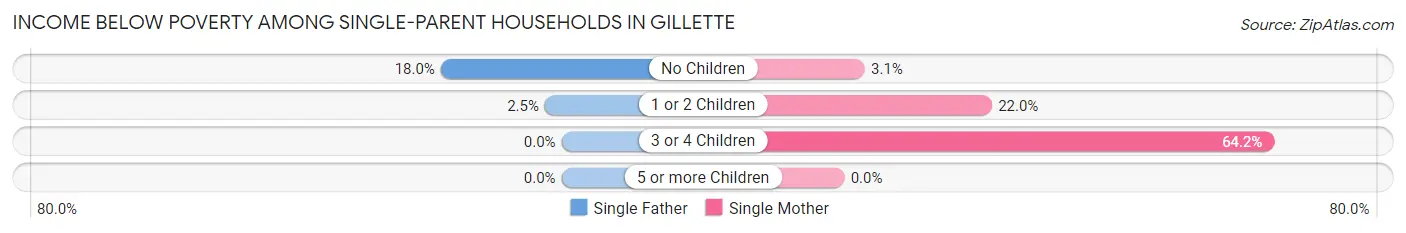
Income Below Poverty Among Single-Parent Households in Gillette
According to the poverty data in Gillette, 4.6% or 32 single-father households and 22.6% or 272 single-mother households are living below the poverty line. Among single-father households, those with no children have the highest poverty rate, with 18 households (18.0%) experiencing poverty. Likewise, among single-mother households, those with 3 or 4 children have the highest poverty rate, with 68 households (64.1%) falling below the poverty line.
| Children | Single Father | Single Mother |
| No Children | 18 (18.0%) | 6 (3.0%) |
| 1 or 2 Children | 14 (2.5%) | 198 (22.0%) |
| 3 or 4 Children | 0 (0.0%) | 68 (64.1%) |
| 5 or more Children | 0 (0.0%) | 0 (0.0%) |
| Total | 32 (4.6%) | 272 (22.6%) |
Income Below Poverty Among Married-Couple vs Single-Parent Households in Gillette
The poverty data for Gillette shows that 408 of the married-couple family households (6.1%) and 304 of the single-parent households (16.1%) are living below the poverty level. Within the married-couple family households, those with 3 or 4 children have the highest poverty rate, with 65 households (11.2%) falling below the poverty line. Among the single-parent households, those with 3 or 4 children have the highest poverty rate, with 68 household (51.5%) living below poverty.
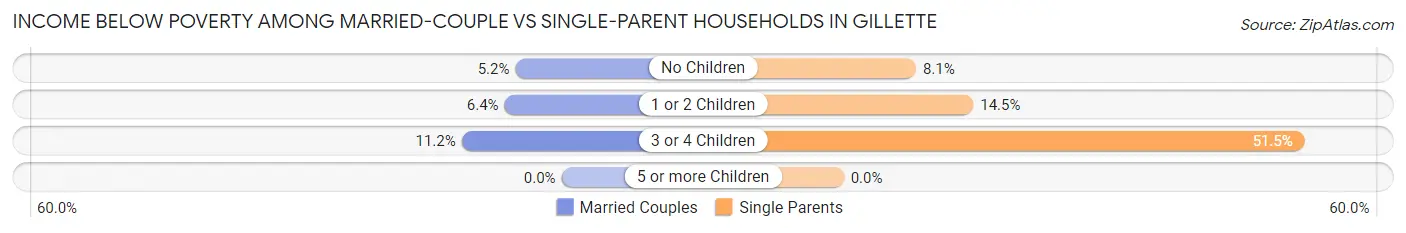
| Children | Married-Couple Families | Single-Parent Households |
| No Children | 181 (5.2%) | 24 (8.1%) |
| 1 or 2 Children | 162 (6.4%) | 212 (14.5%) |
| 3 or 4 Children | 65 (11.2%) | 68 (51.5%) |
| 5 or more Children | 0 (0.0%) | 0 (0.0%) |
| Total | 408 (6.1%) | 304 (16.1%) |
Race in Gillette
The most populous races in Gillette are White / Caucasian (29,227 | 88.1%), Hispanic or Latino (2,773 | 8.4%), and Two or more Races (1,988 | 6.0%).
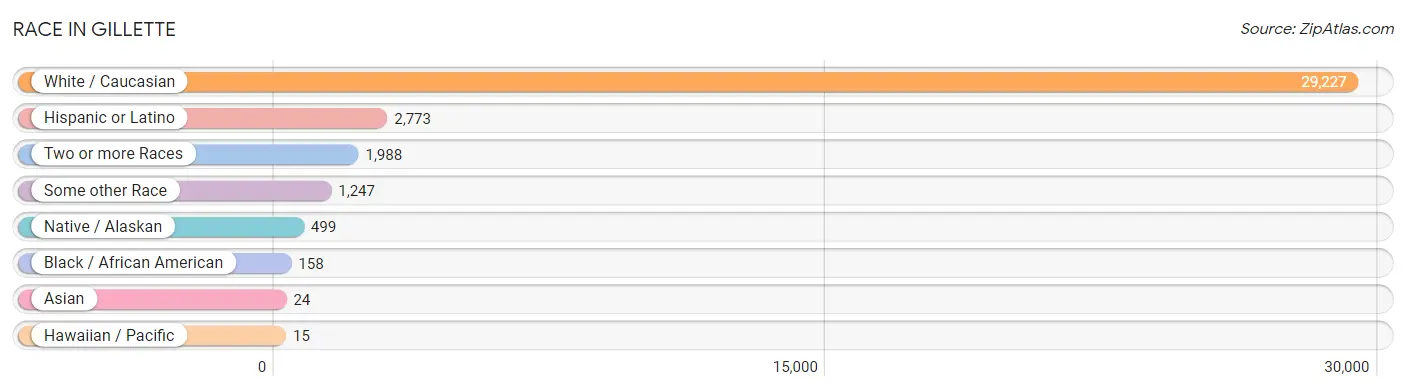
| Race | # Population | % Population |
| Asian | 24 | 0.1% |
| Black / African American | 158 | 0.5% |
| Hawaiian / Pacific | 15 | 0.1% |
| Hispanic or Latino | 2,773 | 8.4% |
| Native / Alaskan | 499 | 1.5% |
| White / Caucasian | 29,227 | 88.1% |
| Two or more Races | 1,988 | 6.0% |
| Some other Race | 1,247 | 3.8% |
| Total | 33,158 | 100.0% |
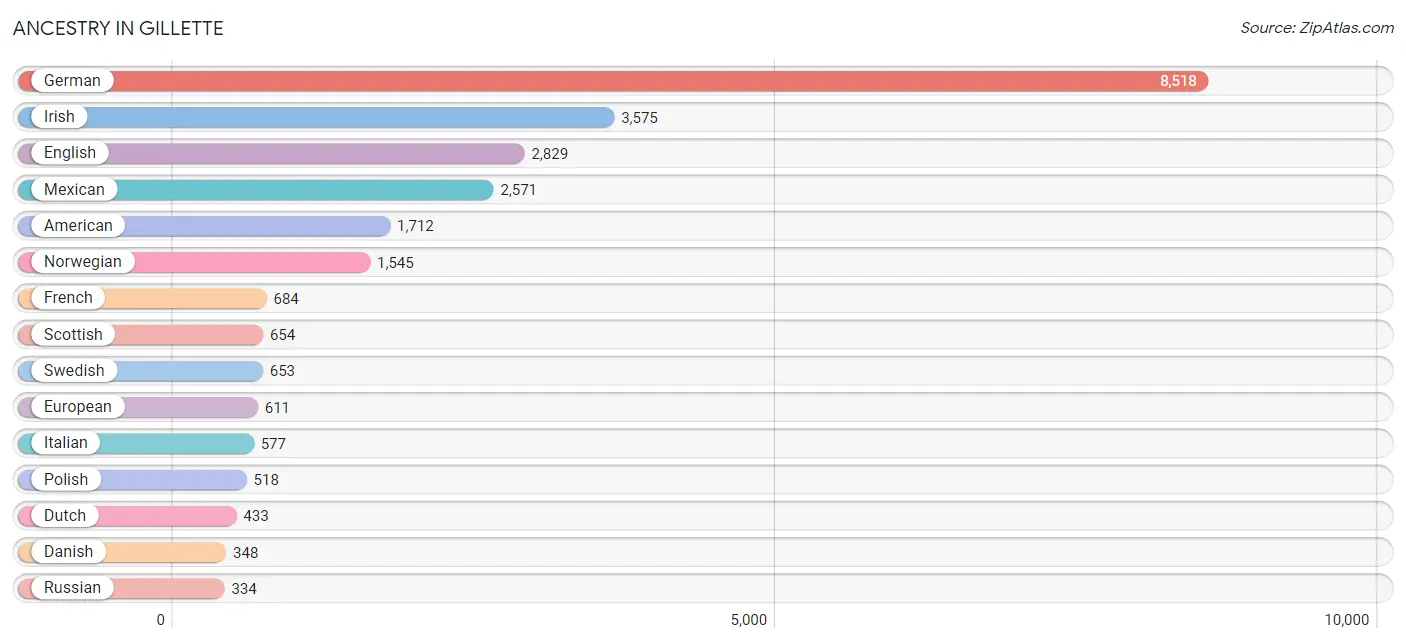
Ancestry in Gillette
The most populous ancestries reported in Gillette are German (8,518 | 25.7%), Irish (3,575 | 10.8%), English (2,829 | 8.5%), Mexican (2,571 | 7.7%), and American (1,712 | 5.2%), together accounting for 57.9% of all Gillette residents.
| Ancestry | # Population | % Population |
| African | 42 | 0.1% |
| American | 1,712 | 5.2% |
| Apache | 1 | 0.0% |
| Arapaho | 12 | 0.0% |
| Austrian | 21 | 0.1% |
| Basque | 83 | 0.3% |
| Bhutanese | 16 | 0.1% |
| Blackfeet | 4 | 0.0% |
| British | 304 | 0.9% |
| Burmese | 24 | 0.1% |
| Canadian | 154 | 0.5% |
| Celtic | 24 | 0.1% |
| Central American | 10 | 0.0% |
| Cherokee | 34 | 0.1% |
| Cheyenne | 133 | 0.4% |
| Chippewa | 27 | 0.1% |
| Choctaw | 21 | 0.1% |
| Colombian | 29 | 0.1% |
| Crow | 98 | 0.3% |
| Czech | 182 | 0.5% |
| Czechoslovakian | 10 | 0.0% |
| Danish | 348 | 1.1% |
| Dutch | 433 | 1.3% |
| English | 2,829 | 8.5% |
| European | 611 | 1.8% |
| Finnish | 90 | 0.3% |
| French | 684 | 2.1% |
| French Canadian | 21 | 0.1% |
| German | 8,518 | 25.7% |
| Greek | 19 | 0.1% |
| Guatemalan | 3 | 0.0% |
| Hungarian | 163 | 0.5% |
| Icelander | 22 | 0.1% |
| Irish | 3,575 | 10.8% |
| Iroquois | 53 | 0.2% |
| Italian | 577 | 1.7% |
| Kenyan | 109 | 0.3% |
| Korean | 99 | 0.3% |
| Lithuanian | 22 | 0.1% |
| Mexican | 2,571 | 7.7% |
| Mexican American Indian | 67 | 0.2% |
| Native Hawaiian | 31 | 0.1% |
| Navajo | 48 | 0.1% |
| Nigerian | 6 | 0.0% |
| Northern European | 25 | 0.1% |
| Norwegian | 1,545 | 4.7% |
| Peruvian | 37 | 0.1% |
| Polish | 518 | 1.6% |
| Portuguese | 45 | 0.1% |
| Romanian | 61 | 0.2% |
| Russian | 334 | 1.0% |
| Salvadoran | 7 | 0.0% |
| Scandinavian | 24 | 0.1% |
| Scotch-Irish | 140 | 0.4% |
| Scottish | 654 | 2.0% |
| Shoshone | 221 | 0.7% |
| Sioux | 104 | 0.3% |
| Slovak | 22 | 0.1% |
| South American | 66 | 0.2% |
| Spaniard | 70 | 0.2% |
| Spanish | 9 | 0.0% |
| Sri Lankan | 16 | 0.1% |
| Subsaharan African | 157 | 0.5% |
| Swedish | 653 | 2.0% |
| Swiss | 45 | 0.1% |
| Welsh | 194 | 0.6% |
| Yakama | 9 | 0.0% |
| Yugoslavian | 48 | 0.1% | View All 68 Rows |
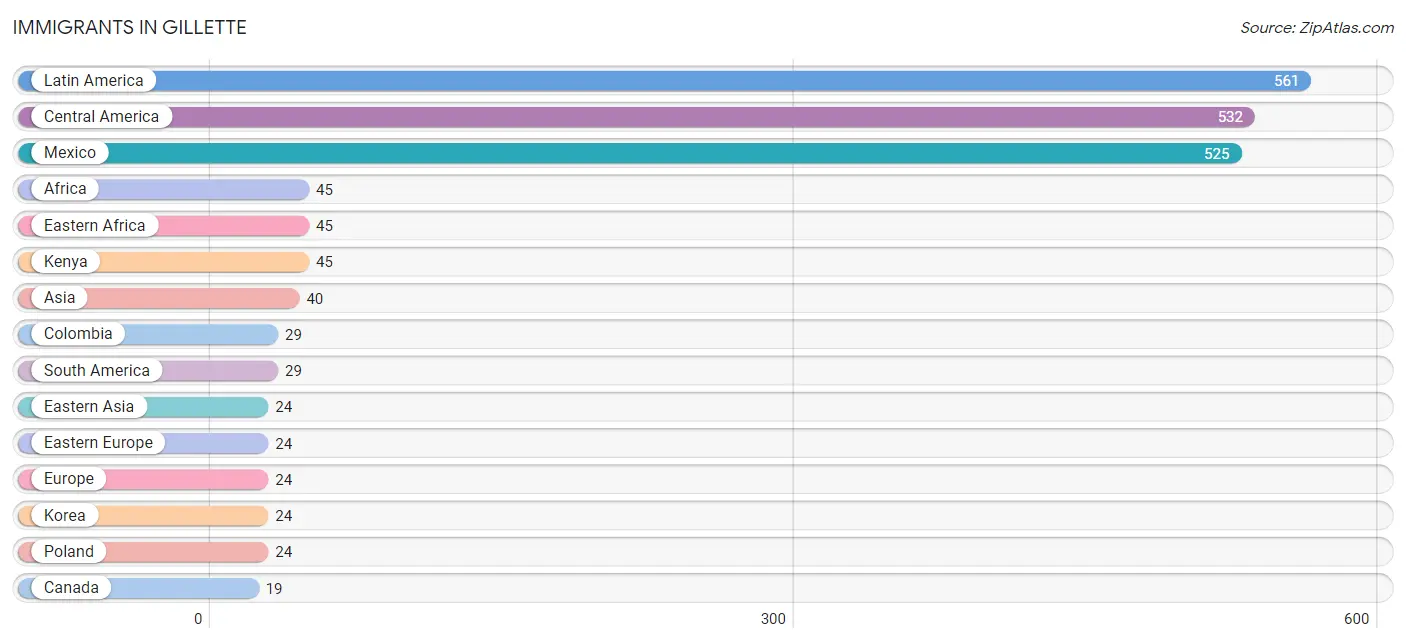
Immigrants in Gillette
The most numerous immigrant groups reported in Gillette came from Latin America (561 | 1.7%), Central America (532 | 1.6%), Mexico (525 | 1.6%), Africa (45 | 0.1%), and Eastern Africa (45 | 0.1%), together accounting for 5.1% of all Gillette residents.
| Immigration Origin | # Population | % Population |
| Africa | 45 | 0.1% |
| Asia | 40 | 0.1% |
| Canada | 19 | 0.1% |
| Central America | 532 | 1.6% |
| Colombia | 29 | 0.1% |
| Eastern Africa | 45 | 0.1% |
| Eastern Asia | 24 | 0.1% |
| Eastern Europe | 24 | 0.1% |
| El Salvador | 7 | 0.0% |
| Europe | 24 | 0.1% |
| Kenya | 45 | 0.1% |
| Korea | 24 | 0.1% |
| Latin America | 561 | 1.7% |
| Mexico | 525 | 1.6% |
| Philippines | 16 | 0.1% |
| Poland | 24 | 0.1% |
| South America | 29 | 0.1% |
| South Eastern Asia | 16 | 0.1% | View All 18 Rows |
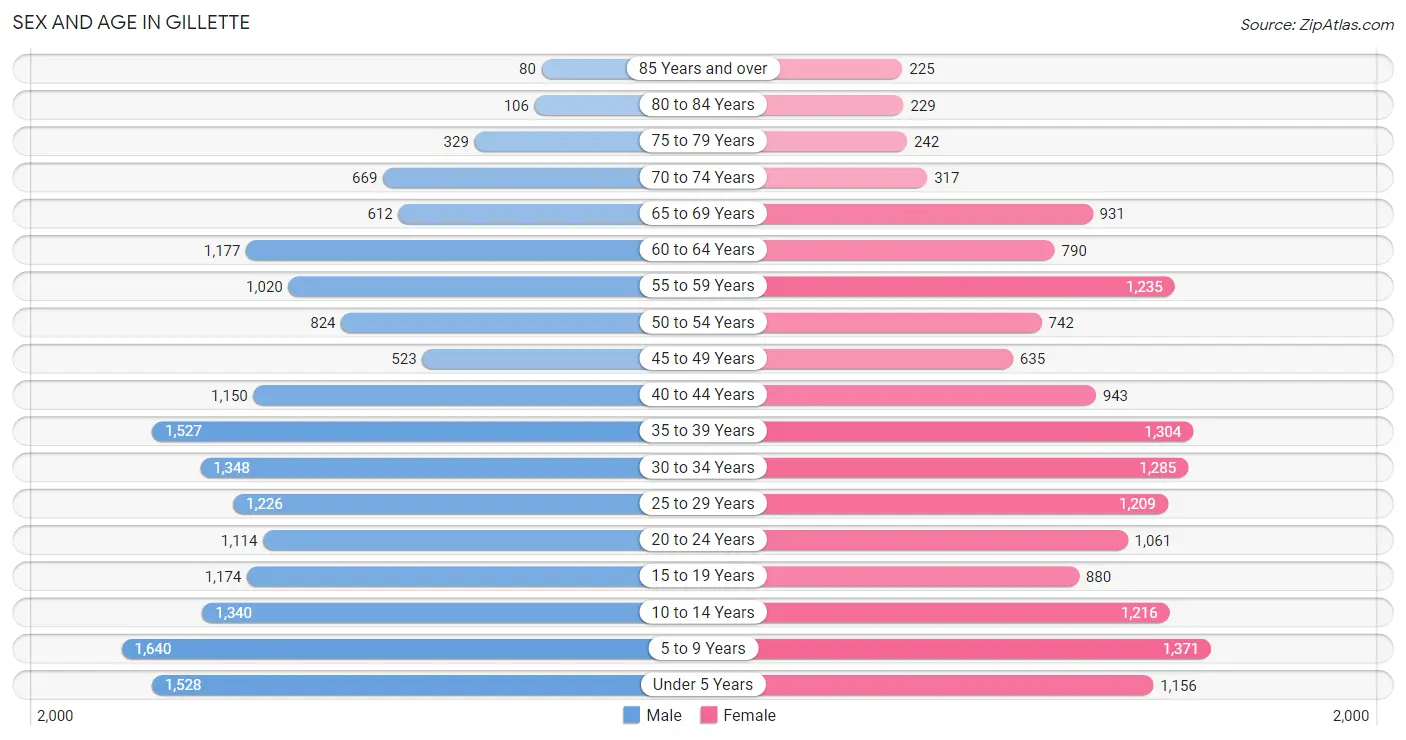
Sex and Age in Gillette
Sex and Age in Gillette
The most populous age groups in Gillette are 5 to 9 Years (1,640 | 9.4%) for men and 5 to 9 Years (1,371 | 8.7%) for women.
| Age Bracket | Male | Female |
| Under 5 Years | 1,528 (8.8%) | 1,156 (7.3%) |
| 5 to 9 Years | 1,640 (9.4%) | 1,371 (8.7%) |
| 10 to 14 Years | 1,340 (7.7%) | 1,216 (7.7%) |
| 15 to 19 Years | 1,174 (6.8%) | 880 (5.6%) |
| 20 to 24 Years | 1,114 (6.4%) | 1,061 (6.7%) |
| 25 to 29 Years | 1,226 (7.0%) | 1,209 (7.7%) |
| 30 to 34 Years | 1,348 (7.7%) | 1,285 (8.2%) |
| 35 to 39 Years | 1,527 (8.8%) | 1,304 (8.3%) |
| 40 to 44 Years | 1,150 (6.6%) | 943 (6.0%) |
| 45 to 49 Years | 523 (3.0%) | 635 (4.0%) |
| 50 to 54 Years | 824 (4.7%) | 742 (4.7%) |
| 55 to 59 Years | 1,020 (5.9%) | 1,235 (7.8%) |
| 60 to 64 Years | 1,177 (6.8%) | 790 (5.0%) |
| 65 to 69 Years | 612 (3.5%) | 931 (5.9%) |
| 70 to 74 Years | 669 (3.8%) | 317 (2.0%) |
| 75 to 79 Years | 329 (1.9%) | 242 (1.5%) |
| 80 to 84 Years | 106 (0.6%) | 229 (1.5%) |
| 85 Years and over | 80 (0.5%) | 225 (1.4%) |
| Total | 17,387 (100.0%) | 15,771 (100.0%) |
Families and Households in Gillette
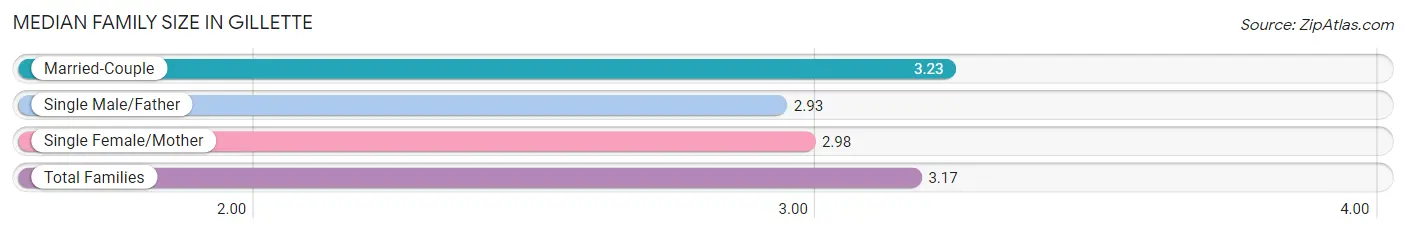
Median Family Size in Gillette
The median family size in Gillette is 3.17 persons per family, with married-couple families (6,629 | 77.8%) accounting for the largest median family size of 3.23 persons per family. On the other hand, single male/father families (688 | 8.1%) represent the smallest median family size with 2.93 persons per family.
| Family Type | # Families | Family Size |
| Married-Couple | 6,629 (77.8%) | 3.23 |
| Single Male/Father | 688 (8.1%) | 2.93 |
| Single Female/Mother | 1,204 (14.1%) | 2.98 |
| Total Families | 8,521 (100.0%) | 3.17 |
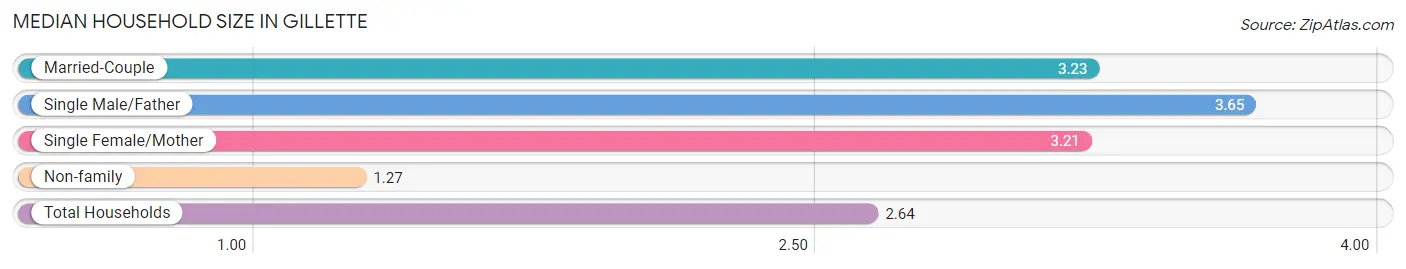
Median Household Size in Gillette
The median household size in Gillette is 2.64 persons per household, with single male/father households (688 | 5.5%) accounting for the largest median household size of 3.65 persons per household. non-family households (3,896 | 31.4%) represent the smallest median household size with 1.27 persons per household.
| Household Type | # Households | Household Size |
| Married-Couple | 6,629 (53.4%) | 3.23 |
| Single Male/Father | 688 (5.5%) | 3.65 |
| Single Female/Mother | 1,204 (9.7%) | 3.21 |
| Non-family | 3,896 (31.4%) | 1.27 |
| Total Households | 12,417 (100.0%) | 2.64 |
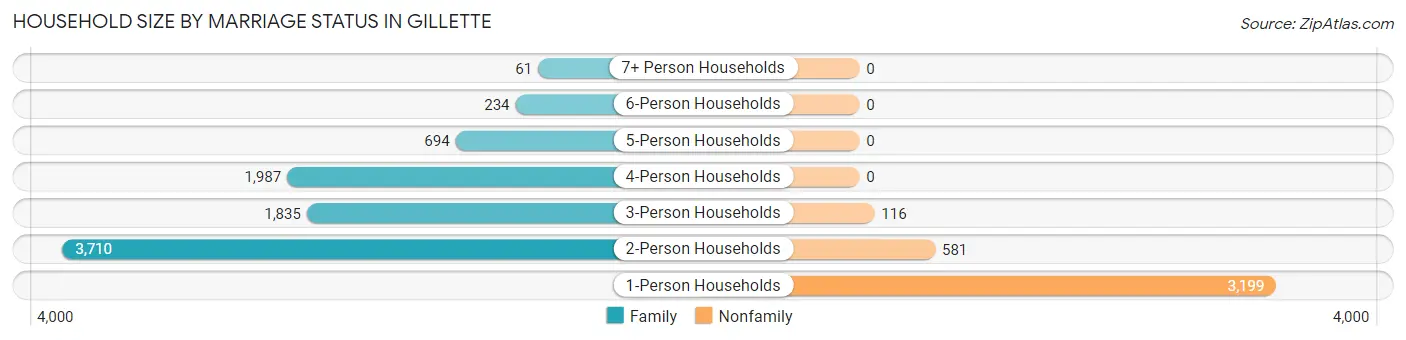
Household Size by Marriage Status in Gillette
Out of a total of 12,417 households in Gillette, 8,521 (68.6%) are family households, while 3,896 (31.4%) are nonfamily households. The most numerous type of family households are 2-person households, comprising 3,710, and the most common type of nonfamily households are 1-person households, comprising 3,199.
| Household Size | Family Households | Nonfamily Households |
| 1-Person Households | - | 3,199 (25.8%) |
| 2-Person Households | 3,710 (29.9%) | 581 (4.7%) |
| 3-Person Households | 1,835 (14.8%) | 116 (0.9%) |
| 4-Person Households | 1,987 (16.0%) | 0 (0.0%) |
| 5-Person Households | 694 (5.6%) | 0 (0.0%) |
| 6-Person Households | 234 (1.9%) | 0 (0.0%) |
| 7+ Person Households | 61 (0.5%) | 0 (0.0%) |
| Total | 8,521 (68.6%) | 3,896 (31.4%) |
Female Fertility in Gillette
Fertility by Age in Gillette
Average fertility rate in Gillette is 91.0 births per 1,000 women. Women in the age bracket of 20 to 34 years have the highest fertility rate with 130.0 births per 1,000 women. Women in the age bracket of 20 to 34 years acount for 68.1% of all women with births.
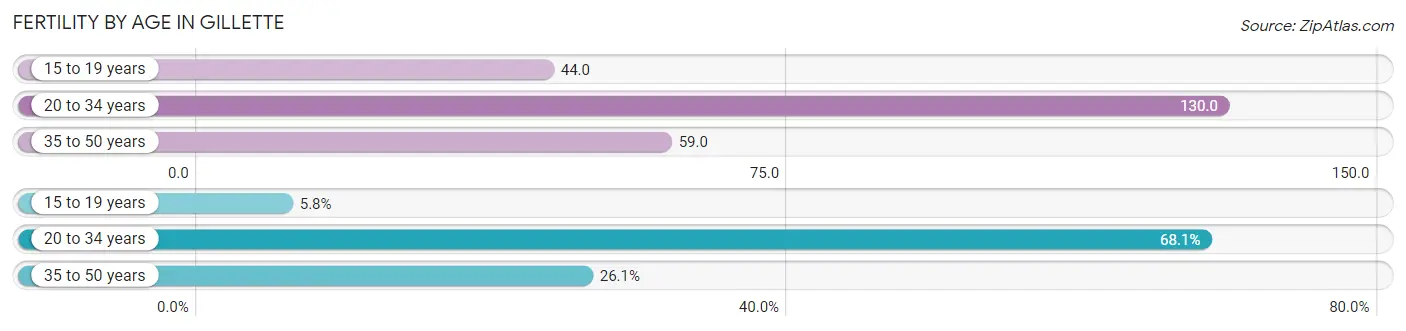
| Age Bracket | Women with Births | Births / 1,000 Women |
| 15 to 19 years | 39 (5.8%) | 44.0 |
| 20 to 34 years | 462 (68.1%) | 130.0 |
| 35 to 50 years | 177 (26.1%) | 59.0 |
| Total | 678 (100.0%) | 91.0 |
Fertility by Age by Marriage Status in Gillette
77.0% of women with births (678) in Gillette are married. The highest percentage of unmarried women with births falls into 15 to 19 years age bracket with 100.0% of them unmarried at the time of birth, while the lowest percentage of unmarried women with births belong to 35 to 50 years age bracket with 5.1% of them unmarried.
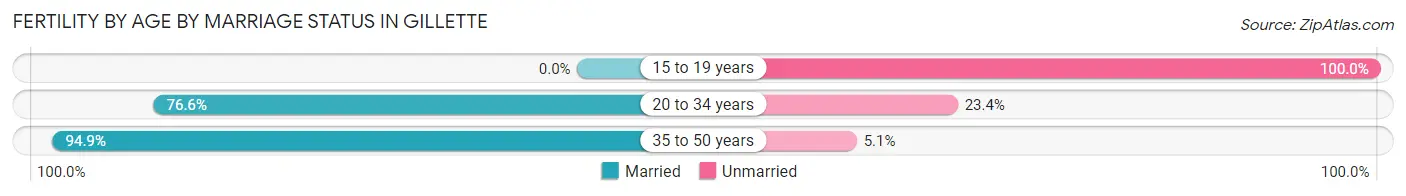
| Age Bracket | Married | Unmarried |
| 15 to 19 years | 0 (0.0%) | 39 (100.0%) |
| 20 to 34 years | 354 (76.6%) | 108 (23.4%) |
| 35 to 50 years | 168 (94.9%) | 9 (5.1%) |
| Total | 522 (77.0%) | 156 (23.0%) |
Fertility by Education in Gillette
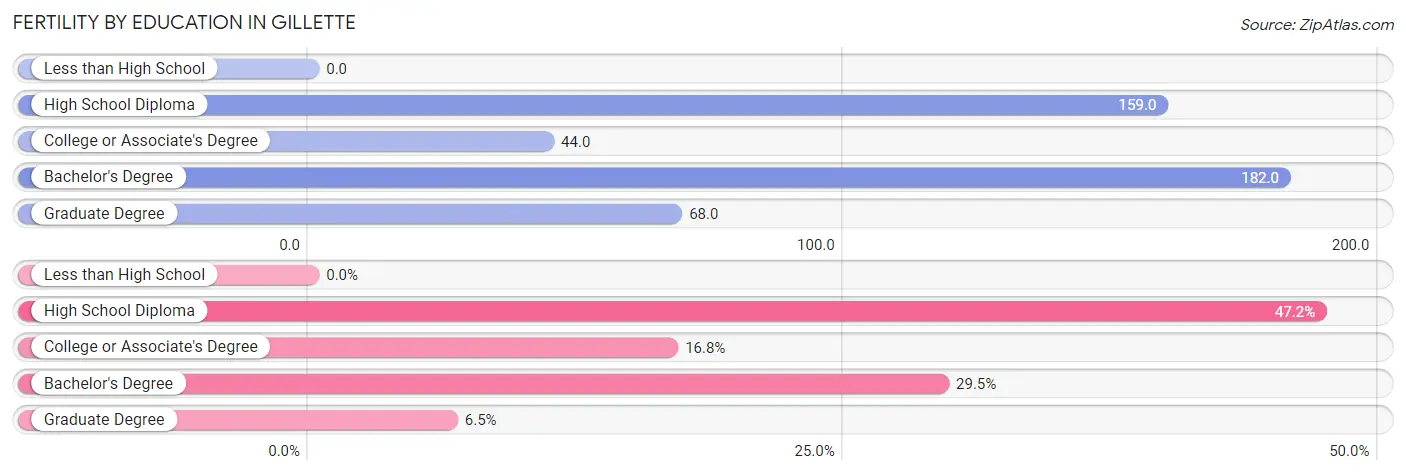
| Educational Attainment | Women with Births | Births / 1,000 Women |
| Less than High School | 0 (0.0%) | 0.0 |
| High School Diploma | 320 (47.2%) | 159.0 |
| College or Associate's Degree | 114 (16.8%) | 44.0 |
| Bachelor's Degree | 200 (29.5%) | 182.0 |
| Graduate Degree | 44 (6.5%) | 68.0 |
| Total | 678 (100.0%) | 91.0 |
Fertility by Education by Marriage Status in Gillette
23.0% of women with births in Gillette are unmarried. Women with the educational attainment of graduate degree are most likely to be married with 100.0% of them married at childbirth, while women with the educational attainment of high school diploma are least likely to be married with 39.4% of them unmarried at childbirth.
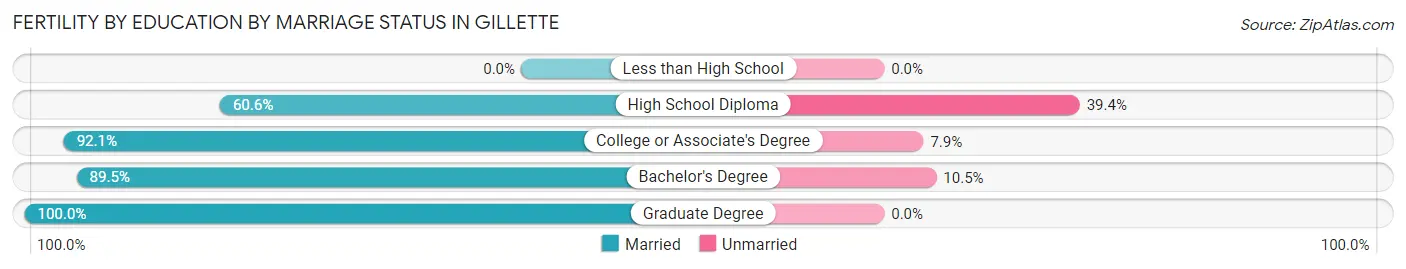
| Educational Attainment | Married | Unmarried |
| Less than High School | 0 (0.0%) | 0 (0.0%) |
| High School Diploma | 194 (60.6%) | 126 (39.4%) |
| College or Associate's Degree | 105 (92.1%) | 9 (7.9%) |
| Bachelor's Degree | 179 (89.5%) | 21 (10.5%) |
| Graduate Degree | 44 (100.0%) | 0 (0.0%) |
| Total | 522 (77.0%) | 156 (23.0%) |
Employment Characteristics in Gillette
Employment by Class of Employer in Gillette
Among the 16,519 employed individuals in Gillette, private company employees (11,580 | 70.1%), local government employees (2,512 | 15.2%), and not-for-profit organizations (717 | 4.3%) make up the most common classes of employment.
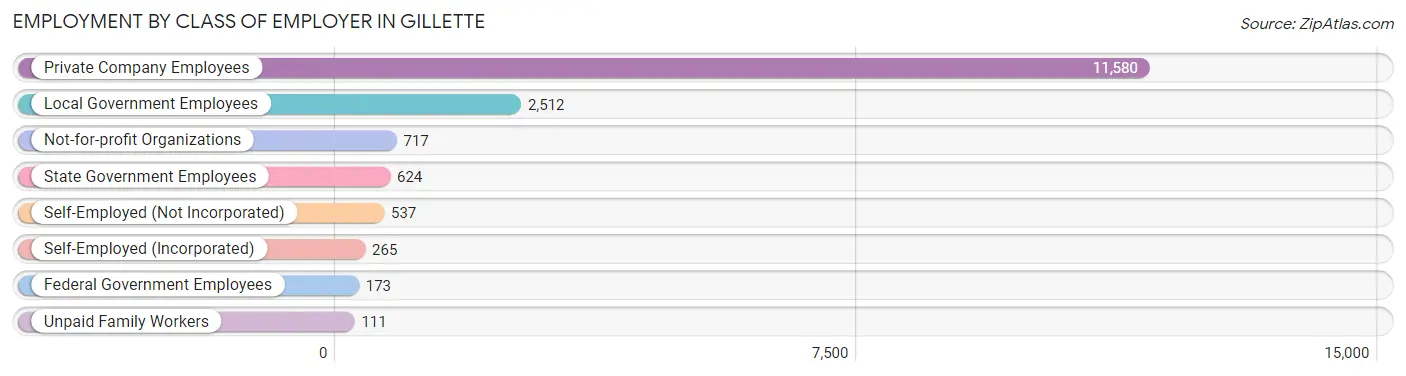
| Employer Class | # Employees | % Employees |
| Private Company Employees | 11,580 | 70.1% |
| Self-Employed (Incorporated) | 265 | 1.6% |
| Self-Employed (Not Incorporated) | 537 | 3.3% |
| Not-for-profit Organizations | 717 | 4.3% |
| Local Government Employees | 2,512 | 15.2% |
| State Government Employees | 624 | 3.8% |
| Federal Government Employees | 173 | 1.1% |
| Unpaid Family Workers | 111 | 0.7% |
| Total | 16,519 | 100.0% |
Employment Status by Age in Gillette
According to the labor force statistics for Gillette, out of the total population over 16 years of age (24,404), 71.8% or 17,522 individuals are in the labor force, with 3.6% or 631 of them unemployed. The age group with the highest labor force participation rate is 35 to 44 years, with 93.9% or 4,624 individuals in the labor force. Within the labor force, the 75 years and over age range has the highest percentage of unemployed individuals, with 30.5% or 18 of them being unemployed.
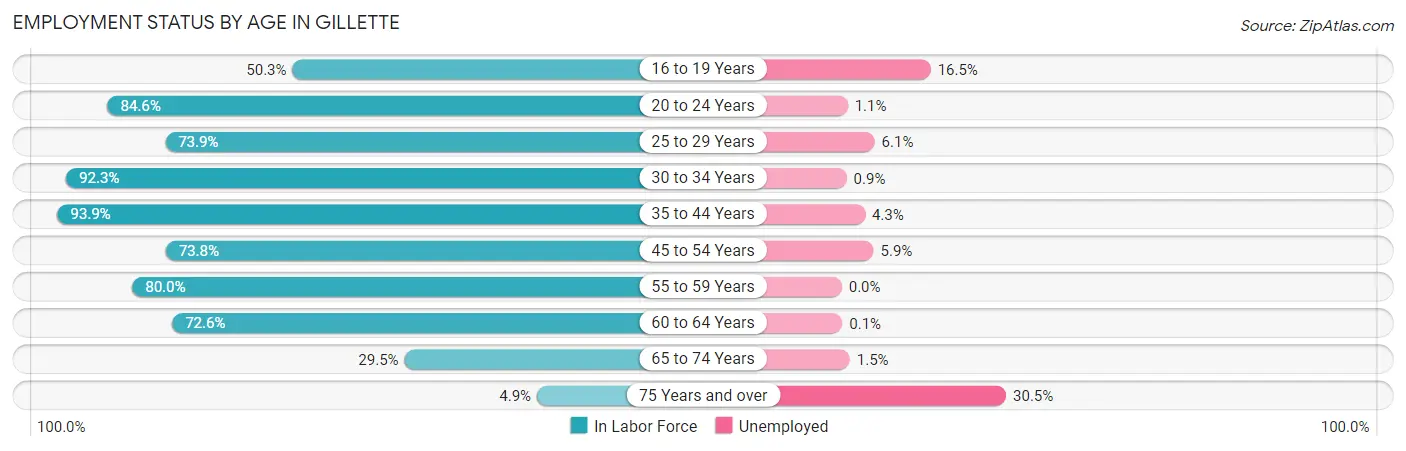
| Age Bracket | In Labor Force | Unemployed |
| 16 to 19 Years | 780 (50.3%) | 129 (16.5%) |
| 20 to 24 Years | 1,840 (84.6%) | 20 (1.1%) |
| 25 to 29 Years | 1,799 (73.9%) | 110 (6.1%) |
| 30 to 34 Years | 2,430 (92.3%) | 22 (0.9%) |
| 35 to 44 Years | 4,624 (93.9%) | 199 (4.3%) |
| 45 to 54 Years | 2,010 (73.8%) | 119 (5.9%) |
| 55 to 59 Years | 1,804 (80.0%) | 0 (0.0%) |
| 60 to 64 Years | 1,428 (72.6%) | 1 (0.1%) |
| 65 to 74 Years | 746 (29.5%) | 11 (1.5%) |
| 75 Years and over | 59 (4.9%) | 18 (30.5%) |
| Total | 17,522 (71.8%) | 631 (3.6%) |
Employment Status by Educational Attainment in Gillette
According to labor force statistics for Gillette, 83.2% of individuals (14,092) out of the total population between 25 and 64 years of age (16,938) are in the labor force, with 3.2% or 451 of them being unemployed. The group with the highest labor force participation rate are those with the educational attainment of college / associate degree, with 88.1% or 5,770 individuals in the labor force. Within the labor force, individuals with less than high school education have the highest percentage of unemployment, with 16.4% or 143 of them being unemployed.
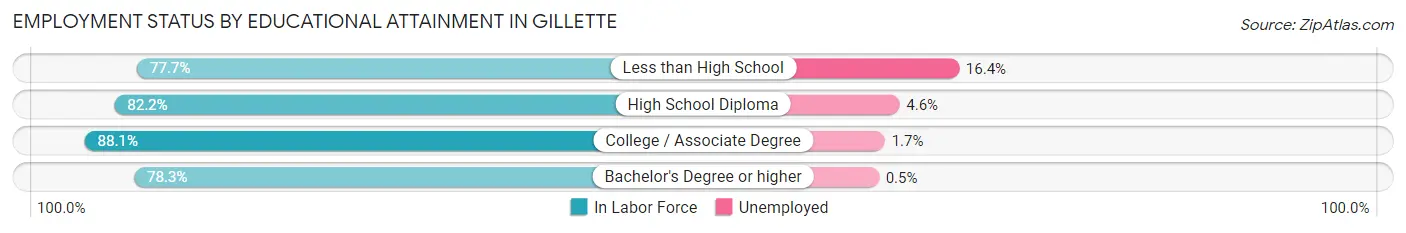
| Educational Attainment | In Labor Force | Unemployed |
| Less than High School | 874 (77.7%) | 184 (16.4%) |
| High School Diploma | 4,219 (82.2%) | 236 (4.6%) |
| College / Associate Degree | 5,770 (88.1%) | 111 (1.7%) |
| Bachelor's Degree or higher | 3,235 (78.3%) | 21 (0.5%) |
| Total | 14,092 (83.2%) | 542 (3.2%) |
Employment Occupations by Sex in Gillette
Management, Business, Science and Arts Occupations
The most common Management, Business, Science and Arts occupations in Gillette are Community & Social Service (2,040 | 12.1%), Education Instruction & Library (1,598 | 9.5%), Management (1,203 | 7.1%), Health Diagnosing & Treating (942 | 5.6%), and Computers, Engineering & Science (697 | 4.1%).
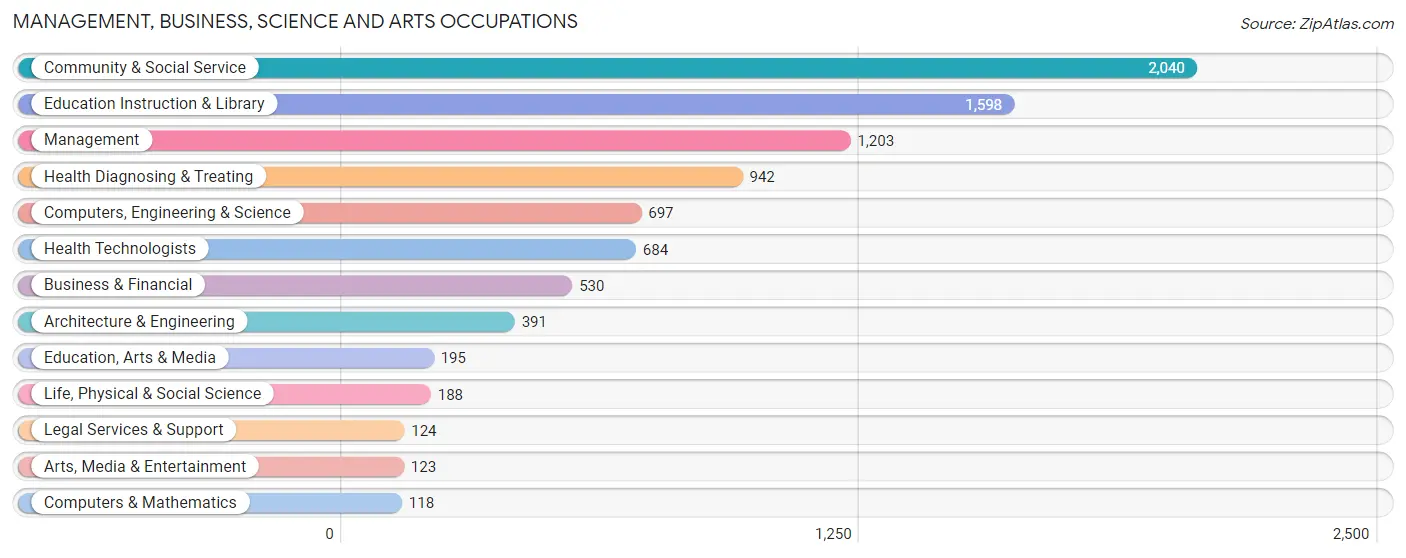
Management, Business, Science and Arts Occupations by Sex
Within the Management, Business, Science and Arts occupations in Gillette, the most male-oriented occupations are Architecture & Engineering (100.0%), Legal Services & Support (89.5%), and Computers, Engineering & Science (88.4%), while the most female-oriented occupations are Health Diagnosing & Treating (86.4%), Health Technologists (85.5%), and Education Instruction & Library (75.3%).
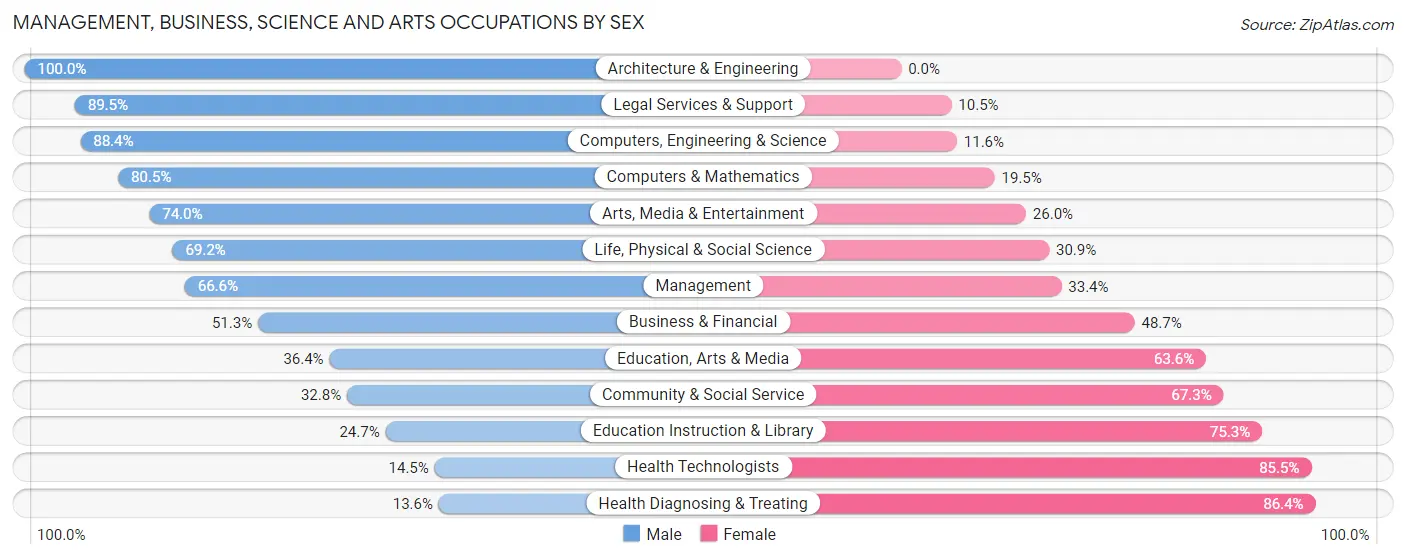
| Occupation | Male | Female |
| Management | 801 (66.6%) | 402 (33.4%) |
| Business & Financial | 272 (51.3%) | 258 (48.7%) |
| Computers, Engineering & Science | 616 (88.4%) | 81 (11.6%) |
| Computers & Mathematics | 95 (80.5%) | 23 (19.5%) |
| Architecture & Engineering | 391 (100.0%) | 0 (0.0%) |
| Life, Physical & Social Science | 130 (69.2%) | 58 (30.8%) |
| Community & Social Service | 668 (32.8%) | 1,372 (67.2%) |
| Education, Arts & Media | 71 (36.4%) | 124 (63.6%) |
| Legal Services & Support | 111 (89.5%) | 13 (10.5%) |
| Education Instruction & Library | 395 (24.7%) | 1,203 (75.3%) |
| Arts, Media & Entertainment | 91 (74.0%) | 32 (26.0%) |
| Health Diagnosing & Treating | 128 (13.6%) | 814 (86.4%) |
| Health Technologists | 99 (14.5%) | 585 (85.5%) |
| Total (Category) | 2,485 (45.9%) | 2,927 (54.1%) |
| Total (Overall) | 9,625 (57.1%) | 7,235 (42.9%) |
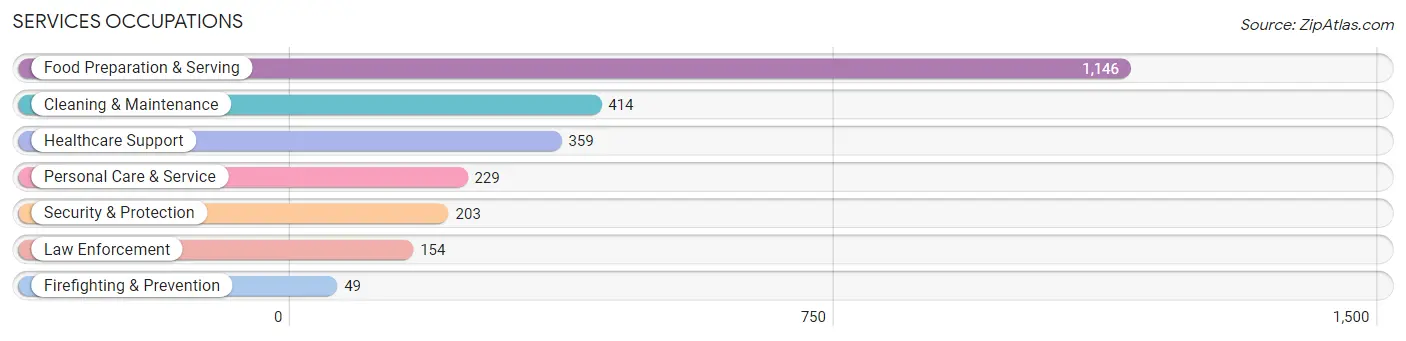
Services Occupations
The most common Services occupations in Gillette are Food Preparation & Serving (1,146 | 6.8%), Cleaning & Maintenance (414 | 2.5%), Healthcare Support (359 | 2.1%), Personal Care & Service (229 | 1.4%), and Security & Protection (203 | 1.2%).
Services Occupations by Sex
Within the Services occupations in Gillette, the most male-oriented occupations are Firefighting & Prevention (100.0%), Security & Protection (72.9%), and Law Enforcement (64.3%), while the most female-oriented occupations are Healthcare Support (83.6%), Personal Care & Service (78.2%), and Food Preparation & Serving (43.5%).
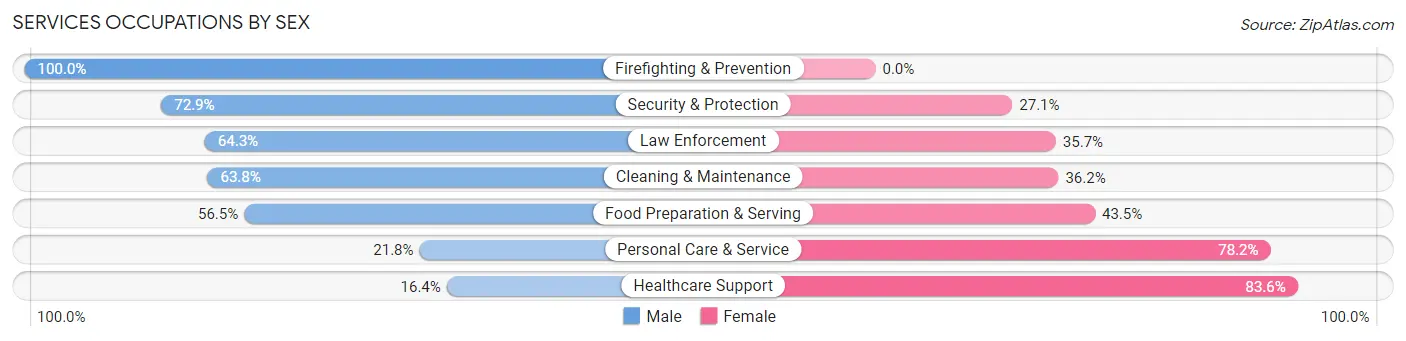
| Occupation | Male | Female |
| Healthcare Support | 59 (16.4%) | 300 (83.6%) |
| Security & Protection | 148 (72.9%) | 55 (27.1%) |
| Firefighting & Prevention | 49 (100.0%) | 0 (0.0%) |
| Law Enforcement | 99 (64.3%) | 55 (35.7%) |
| Food Preparation & Serving | 648 (56.5%) | 498 (43.5%) |
| Cleaning & Maintenance | 264 (63.8%) | 150 (36.2%) |
| Personal Care & Service | 50 (21.8%) | 179 (78.2%) |
| Total (Category) | 1,169 (49.7%) | 1,182 (50.3%) |
| Total (Overall) | 9,625 (57.1%) | 7,235 (42.9%) |
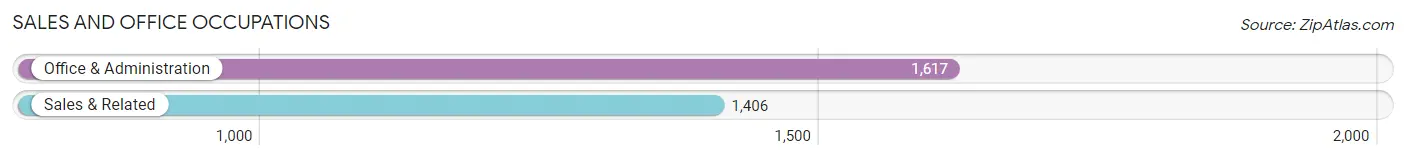
Sales and Office Occupations
The most common Sales and Office occupations in Gillette are Office & Administration (1,617 | 9.6%), and Sales & Related (1,406 | 8.3%).
Sales and Office Occupations by Sex
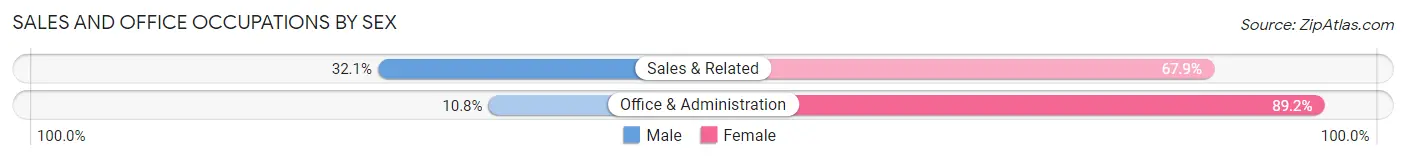
| Occupation | Male | Female |
| Sales & Related | 451 (32.1%) | 955 (67.9%) |
| Office & Administration | 175 (10.8%) | 1,442 (89.2%) |
| Total (Category) | 626 (20.7%) | 2,397 (79.3%) |
| Total (Overall) | 9,625 (57.1%) | 7,235 (42.9%) |
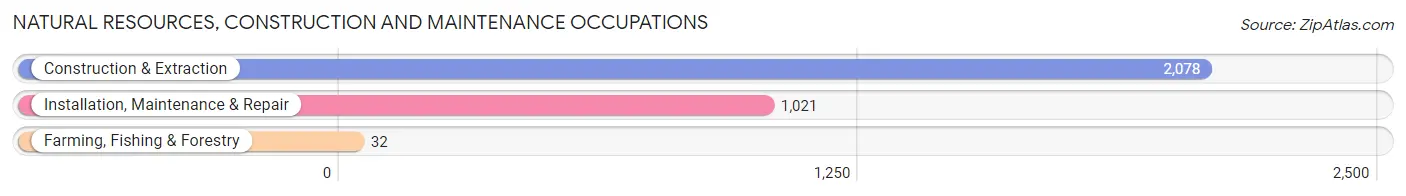
Natural Resources, Construction and Maintenance Occupations
The most common Natural Resources, Construction and Maintenance occupations in Gillette are Construction & Extraction (2,078 | 12.3%), Installation, Maintenance & Repair (1,021 | 6.1%), and Farming, Fishing & Forestry (32 | 0.2%).
Natural Resources, Construction and Maintenance Occupations by Sex
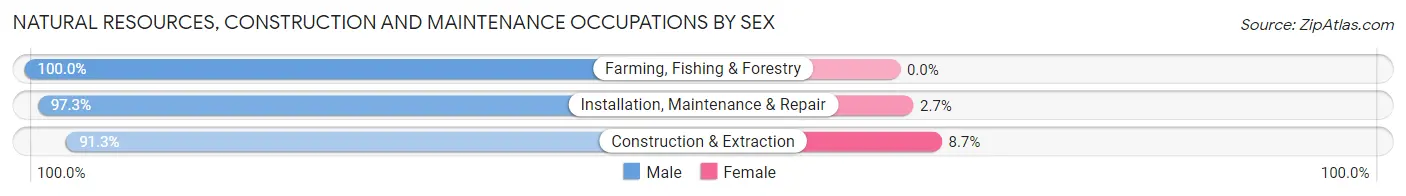
| Occupation | Male | Female |
| Farming, Fishing & Forestry | 32 (100.0%) | 0 (0.0%) |
| Construction & Extraction | 1,898 (91.3%) | 180 (8.7%) |
| Installation, Maintenance & Repair | 993 (97.3%) | 28 (2.7%) |
| Total (Category) | 2,923 (93.4%) | 208 (6.6%) |
| Total (Overall) | 9,625 (57.1%) | 7,235 (42.9%) |
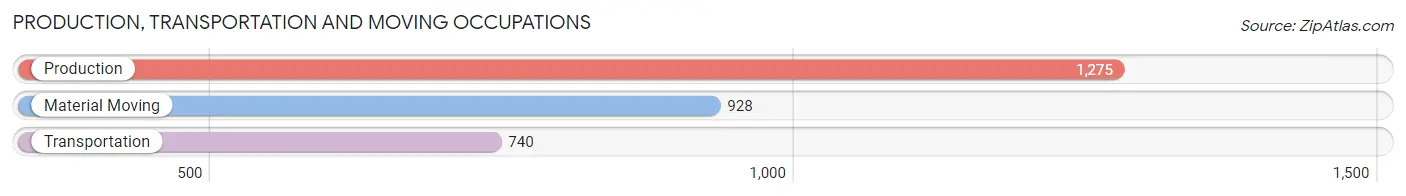
Production, Transportation and Moving Occupations
The most common Production, Transportation and Moving occupations in Gillette are Production (1,275 | 7.6%), Material Moving (928 | 5.5%), and Transportation (740 | 4.4%).
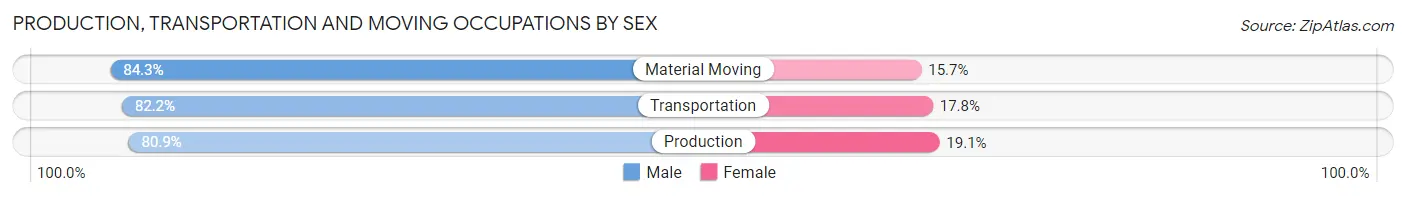
Production, Transportation and Moving Occupations by Sex
| Occupation | Male | Female |
| Production | 1,032 (80.9%) | 243 (19.1%) |
| Transportation | 608 (82.2%) | 132 (17.8%) |
| Material Moving | 782 (84.3%) | 146 (15.7%) |
| Total (Category) | 2,422 (82.3%) | 521 (17.7%) |
| Total (Overall) | 9,625 (57.1%) | 7,235 (42.9%) |
Employment Industries by Sex in Gillette
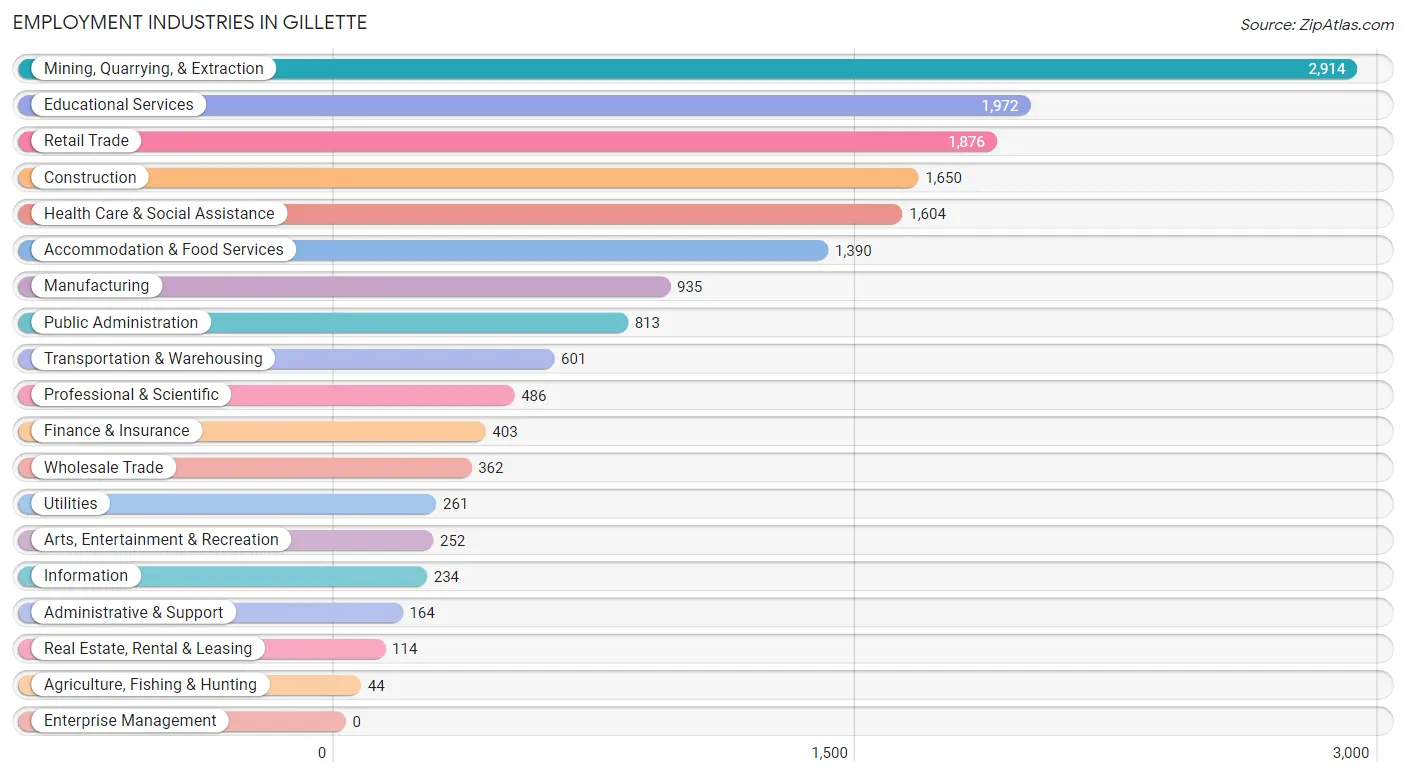
Employment Industries in Gillette
The major employment industries in Gillette include Mining, Quarrying, & Extraction (2,914 | 17.3%), Educational Services (1,972 | 11.7%), Retail Trade (1,876 | 11.1%), Construction (1,650 | 9.8%), and Health Care & Social Assistance (1,604 | 9.5%).
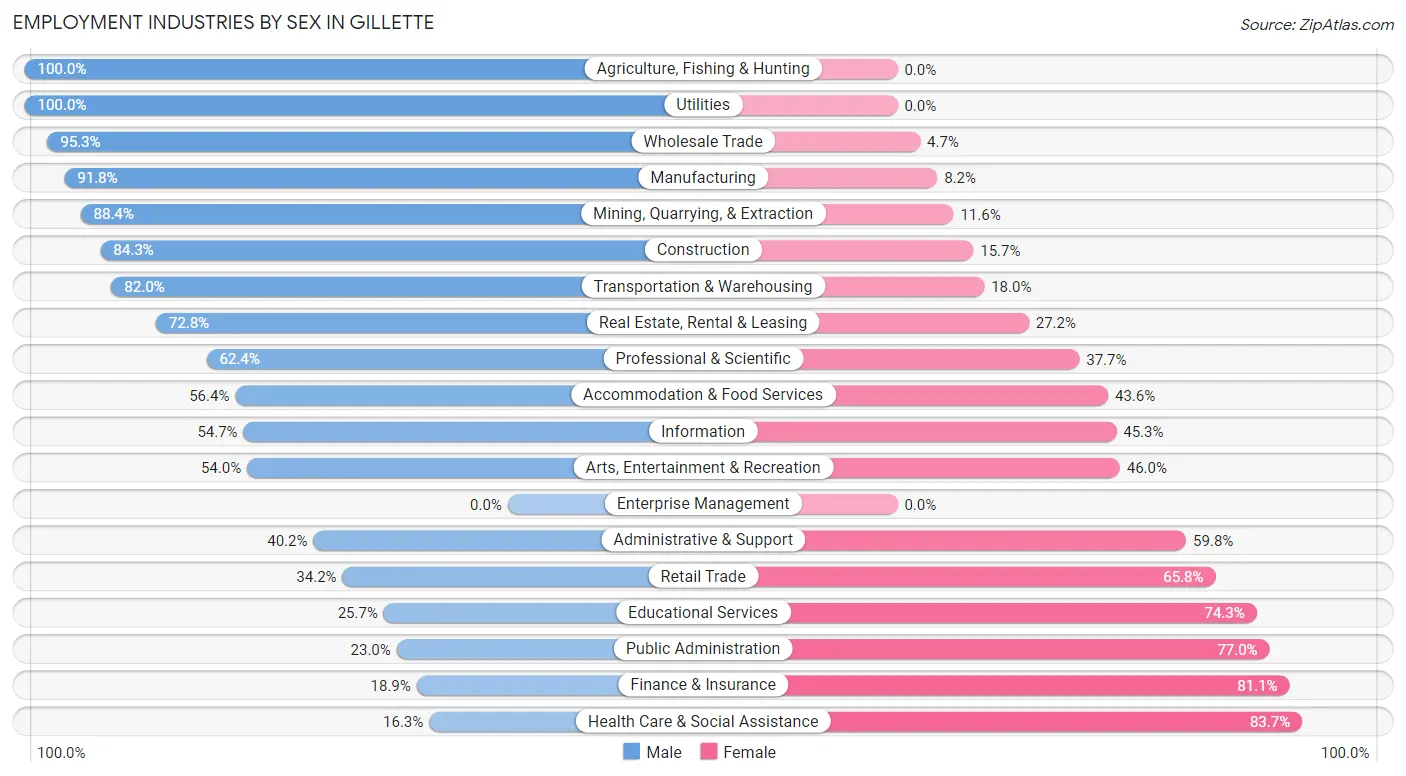
Employment Industries by Sex in Gillette
The Gillette industries that see more men than women are Agriculture, Fishing & Hunting (100.0%), Utilities (100.0%), and Wholesale Trade (95.3%), whereas the industries that tend to have a higher number of women are Health Care & Social Assistance (83.7%), Finance & Insurance (81.1%), and Public Administration (77.0%).
| Industry | Male | Female |
| Agriculture, Fishing & Hunting | 44 (100.0%) | 0 (0.0%) |
| Mining, Quarrying, & Extraction | 2,576 (88.4%) | 338 (11.6%) |
| Construction | 1,391 (84.3%) | 259 (15.7%) |
| Manufacturing | 858 (91.8%) | 77 (8.2%) |
| Wholesale Trade | 345 (95.3%) | 17 (4.7%) |
| Retail Trade | 642 (34.2%) | 1,234 (65.8%) |
| Transportation & Warehousing | 493 (82.0%) | 108 (18.0%) |
| Utilities | 261 (100.0%) | 0 (0.0%) |
| Information | 128 (54.7%) | 106 (45.3%) |
| Finance & Insurance | 76 (18.9%) | 327 (81.1%) |
| Real Estate, Rental & Leasing | 83 (72.8%) | 31 (27.2%) |
| Professional & Scientific | 303 (62.4%) | 183 (37.7%) |
| Enterprise Management | 0 (0.0%) | 0 (0.0%) |
| Administrative & Support | 66 (40.2%) | 98 (59.8%) |
| Educational Services | 506 (25.7%) | 1,466 (74.3%) |
| Health Care & Social Assistance | 261 (16.3%) | 1,343 (83.7%) |
| Arts, Entertainment & Recreation | 136 (54.0%) | 116 (46.0%) |
| Accommodation & Food Services | 784 (56.4%) | 606 (43.6%) |
| Public Administration | 187 (23.0%) | 626 (77.0%) |
| Total | 9,625 (57.1%) | 7,235 (42.9%) |
Education in Gillette
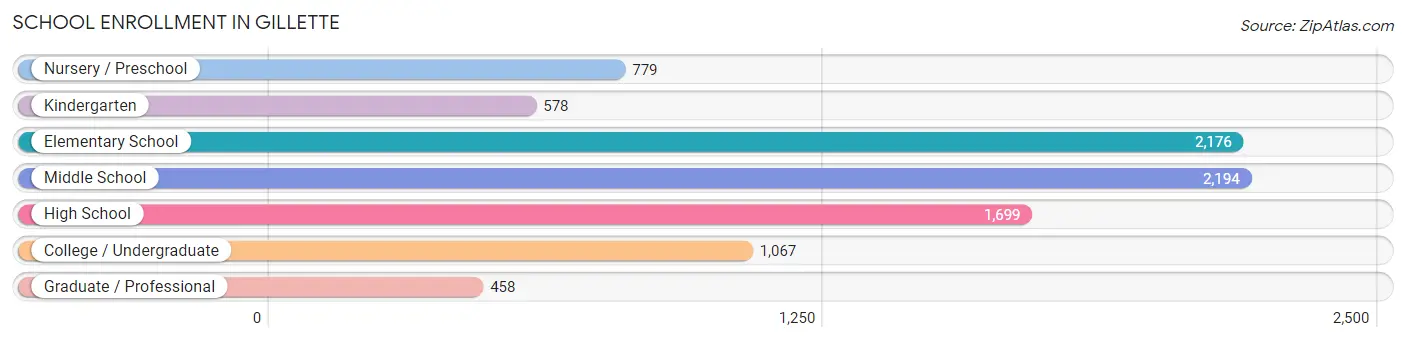
School Enrollment in Gillette
The most common levels of schooling among the 8,951 students in Gillette are middle school (2,194 | 24.5%), elementary school (2,176 | 24.3%), and high school (1,699 | 19.0%).
| School Level | # Students | % Students |
| Nursery / Preschool | 779 | 8.7% |
| Kindergarten | 578 | 6.5% |
| Elementary School | 2,176 | 24.3% |
| Middle School | 2,194 | 24.5% |
| High School | 1,699 | 19.0% |
| College / Undergraduate | 1,067 | 11.9% |
| Graduate / Professional | 458 | 5.1% |
| Total | 8,951 | 100.0% |
School Enrollment by Age by Funding Source in Gillette
Out of a total of 8,951 students who are enrolled in schools in Gillette, 537 (6.0%) attend a private institution, while the remaining 8,414 (94.0%) are enrolled in public schools. The age group of 25 to 34 year olds has the highest likelihood of being enrolled in private schools, with 90 (25.9% in the age bracket) enrolled. Conversely, the age group of 15 to 17 year olds has the lowest likelihood of being enrolled in a private school, with 1,413 (99.0% in the age bracket) attending a public institution.
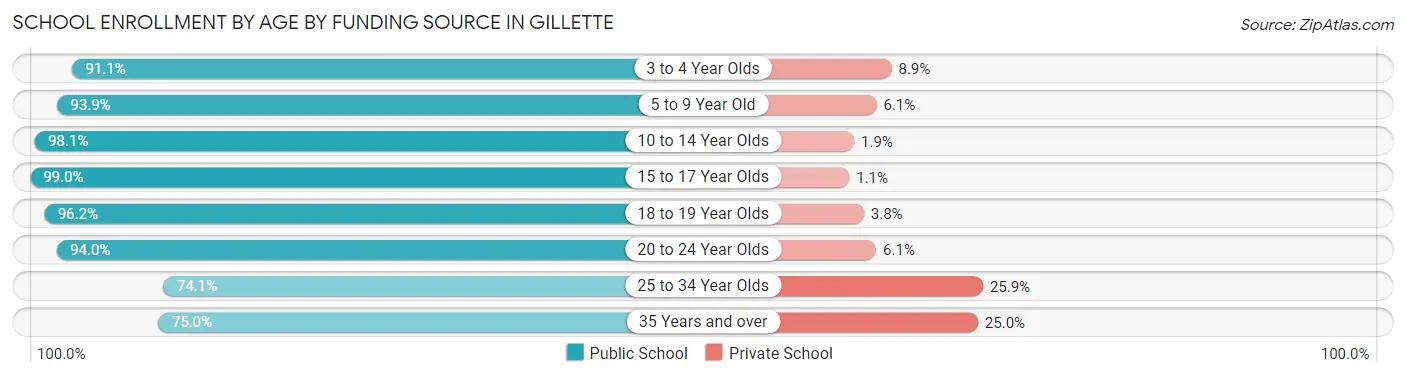
| Age Bracket | Public School | Private School |
| 3 to 4 Year Olds | 480 (91.1%) | 47 (8.9%) |
| 5 to 9 Year Old | 2,701 (93.9%) | 176 (6.1%) |
| 10 to 14 Year Olds | 2,478 (98.1%) | 49 (1.9%) |
| 15 to 17 Year Olds | 1,413 (99.0%) | 15 (1.1%) |
| 18 to 19 Year Olds | 179 (96.2%) | 7 (3.8%) |
| 20 to 24 Year Olds | 559 (94.0%) | 36 (6.0%) |
| 25 to 34 Year Olds | 257 (74.1%) | 90 (25.9%) |
| 35 Years and over | 348 (75.0%) | 116 (25.0%) |
| Total | 8,414 (94.0%) | 537 (6.0%) |
Educational Attainment by Field of Study in Gillette
Education (1,110 | 20.8%), business (683 | 12.8%), science & technology (675 | 12.7%), arts & humanities (576 | 10.8%), and social sciences (572 | 10.7%) are the most common fields of study among 5,332 individuals in Gillette who have obtained a bachelor's degree or higher.
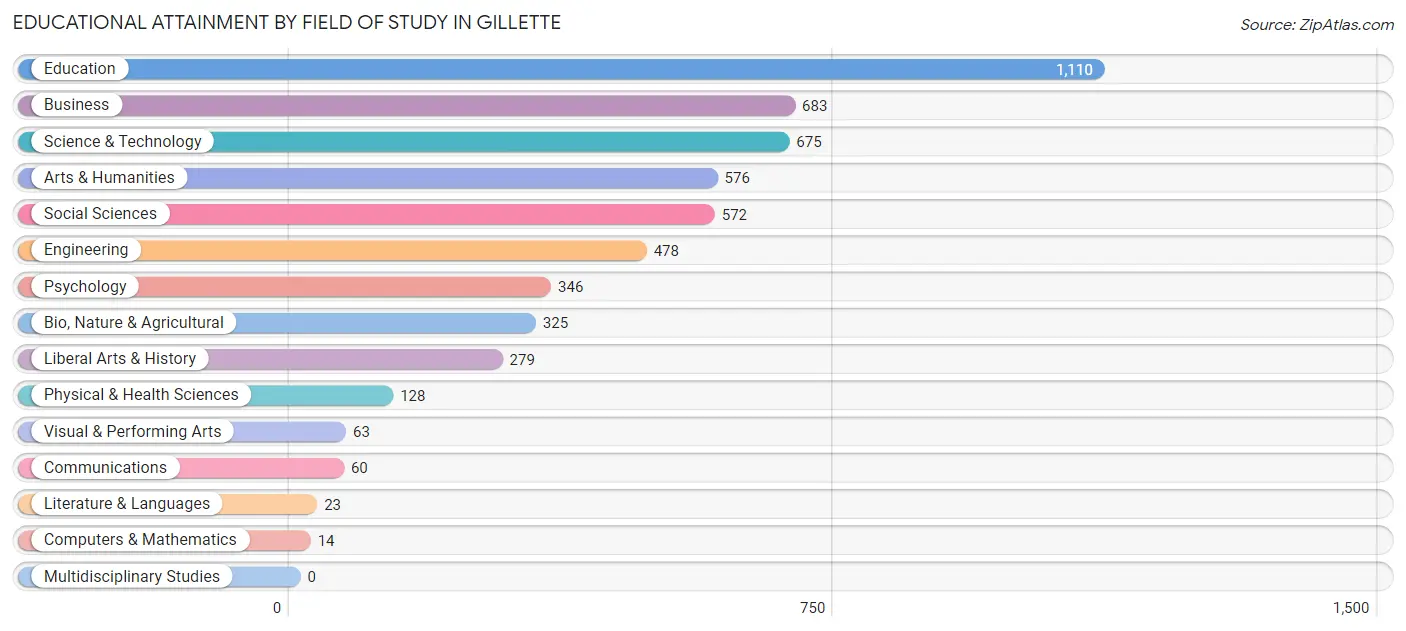
| Field of Study | # Graduates | % Graduates |
| Computers & Mathematics | 14 | 0.3% |
| Bio, Nature & Agricultural | 325 | 6.1% |
| Physical & Health Sciences | 128 | 2.4% |
| Psychology | 346 | 6.5% |
| Social Sciences | 572 | 10.7% |
| Engineering | 478 | 9.0% |
| Multidisciplinary Studies | 0 | 0.0% |
| Science & Technology | 675 | 12.7% |
| Business | 683 | 12.8% |
| Education | 1,110 | 20.8% |
| Literature & Languages | 23 | 0.4% |
| Liberal Arts & History | 279 | 5.2% |
| Visual & Performing Arts | 63 | 1.2% |
| Communications | 60 | 1.1% |
| Arts & Humanities | 576 | 10.8% |
| Total | 5,332 | 100.0% |
Transportation & Commute in Gillette
Vehicle Availability by Sex in Gillette
The most prevalent vehicle ownership categories in Gillette are males with 2 vehicles (3,718, accounting for 39.2%) and females with 2 vehicles (2,635, making up 53.1%).
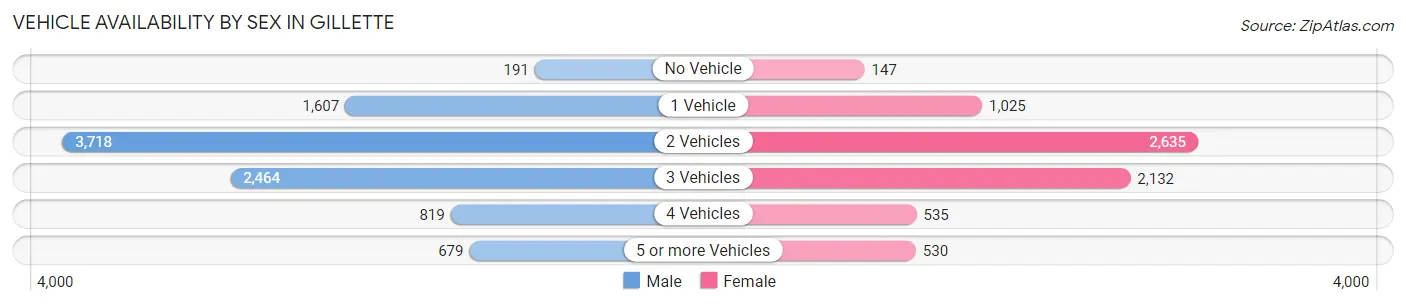
| Vehicles Available | Male | Female |
| No Vehicle | 191 (2.0%) | 147 (2.1%) |
| 1 Vehicle | 1,607 (17.0%) | 1,025 (14.6%) |
| 2 Vehicles | 3,718 (39.2%) | 2,635 (37.6%) |
| 3 Vehicles | 2,464 (26.0%) | 2,132 (30.4%) |
| 4 Vehicles | 819 (8.6%) | 535 (7.6%) |
| 5 or more Vehicles | 679 (7.2%) | 530 (7.6%) |
| Total | 9,478 (100.0%) | 7,004 (100.0%) |
Commute Time in Gillette
The most frequently occuring commute durations in Gillette are 5 to 9 minutes (4,138 commuters, 25.8%), 10 to 14 minutes (3,990 commuters, 24.9%), and 15 to 19 minutes (2,659 commuters, 16.6%).
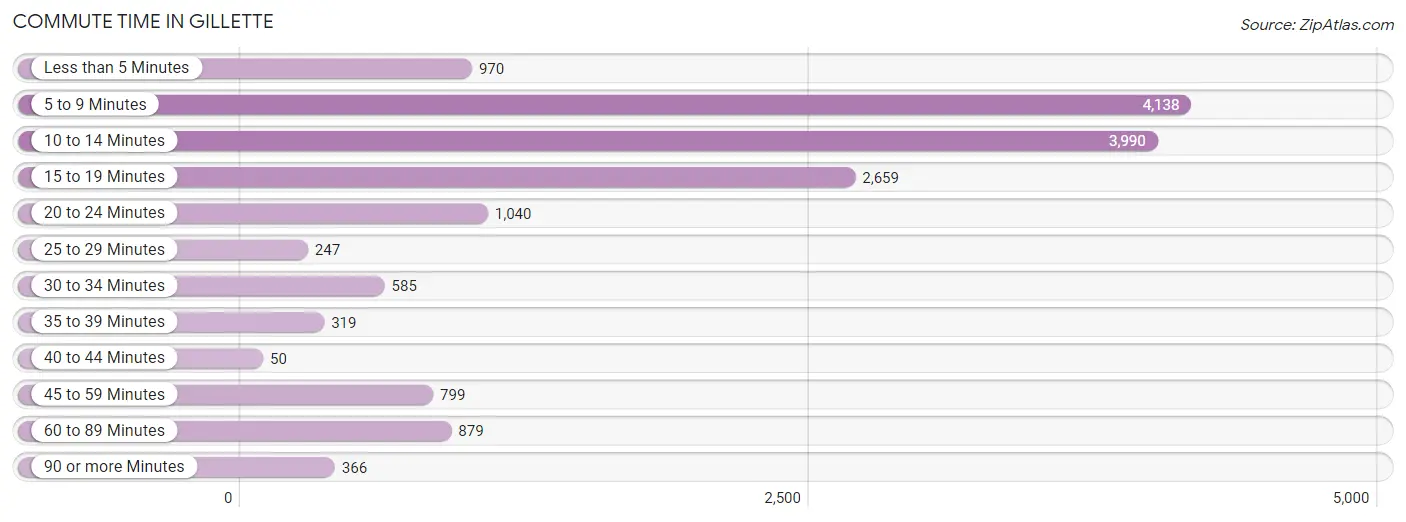
| Commute Time | # Commuters | % Commuters |
| Less than 5 Minutes | 970 | 6.0% |
| 5 to 9 Minutes | 4,138 | 25.8% |
| 10 to 14 Minutes | 3,990 | 24.9% |
| 15 to 19 Minutes | 2,659 | 16.6% |
| 20 to 24 Minutes | 1,040 | 6.5% |
| 25 to 29 Minutes | 247 | 1.5% |
| 30 to 34 Minutes | 585 | 3.6% |
| 35 to 39 Minutes | 319 | 2.0% |
| 40 to 44 Minutes | 50 | 0.3% |
| 45 to 59 Minutes | 799 | 5.0% |
| 60 to 89 Minutes | 879 | 5.5% |
| 90 or more Minutes | 366 | 2.3% |
Commute Time by Sex in Gillette
The most common commute times in Gillette are 10 to 14 minutes (2,034 commuters, 22.0%) for males and 5 to 9 minutes (2,210 commuters, 32.4%) for females.
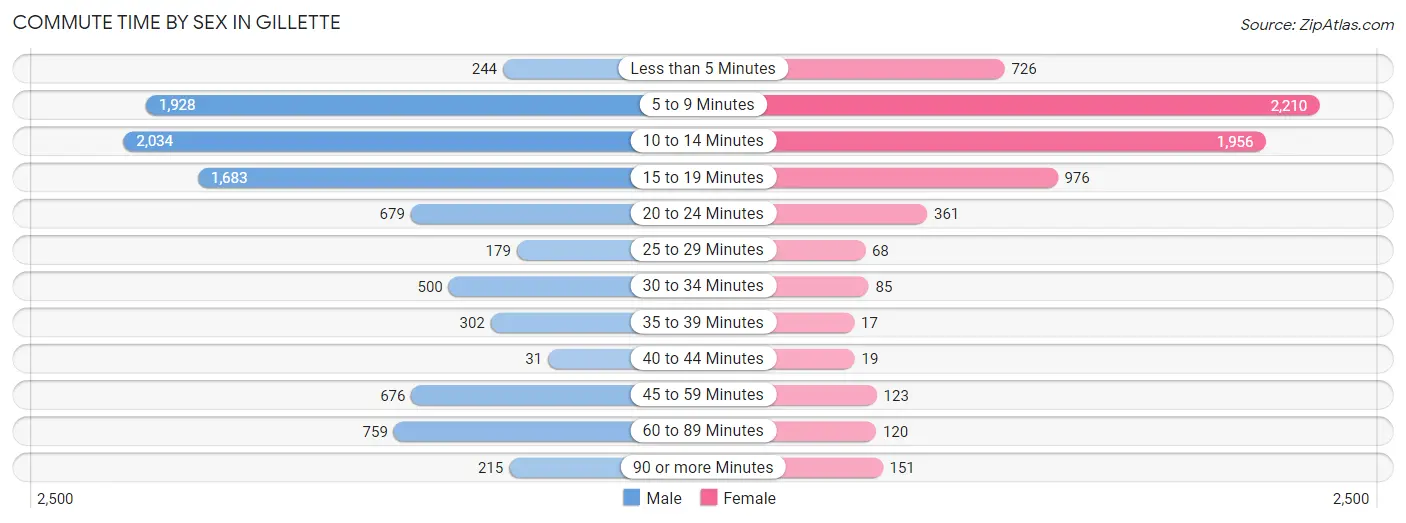
| Commute Time | Male | Female |
| Less than 5 Minutes | 244 (2.6%) | 726 (10.7%) |
| 5 to 9 Minutes | 1,928 (20.9%) | 2,210 (32.4%) |
| 10 to 14 Minutes | 2,034 (22.0%) | 1,956 (28.7%) |
| 15 to 19 Minutes | 1,683 (18.2%) | 976 (14.3%) |
| 20 to 24 Minutes | 679 (7.4%) | 361 (5.3%) |
| 25 to 29 Minutes | 179 (1.9%) | 68 (1.0%) |
| 30 to 34 Minutes | 500 (5.4%) | 85 (1.3%) |
| 35 to 39 Minutes | 302 (3.3%) | 17 (0.3%) |
| 40 to 44 Minutes | 31 (0.3%) | 19 (0.3%) |
| 45 to 59 Minutes | 676 (7.3%) | 123 (1.8%) |
| 60 to 89 Minutes | 759 (8.2%) | 120 (1.8%) |
| 90 or more Minutes | 215 (2.3%) | 151 (2.2%) |
Time of Departure to Work by Sex in Gillette
The most frequent times of departure to work in Gillette are 12:00 AM to 4:59 AM (1,707, 18.5%) for males and 7:30 AM to 7:59 AM (1,308, 19.2%) for females.
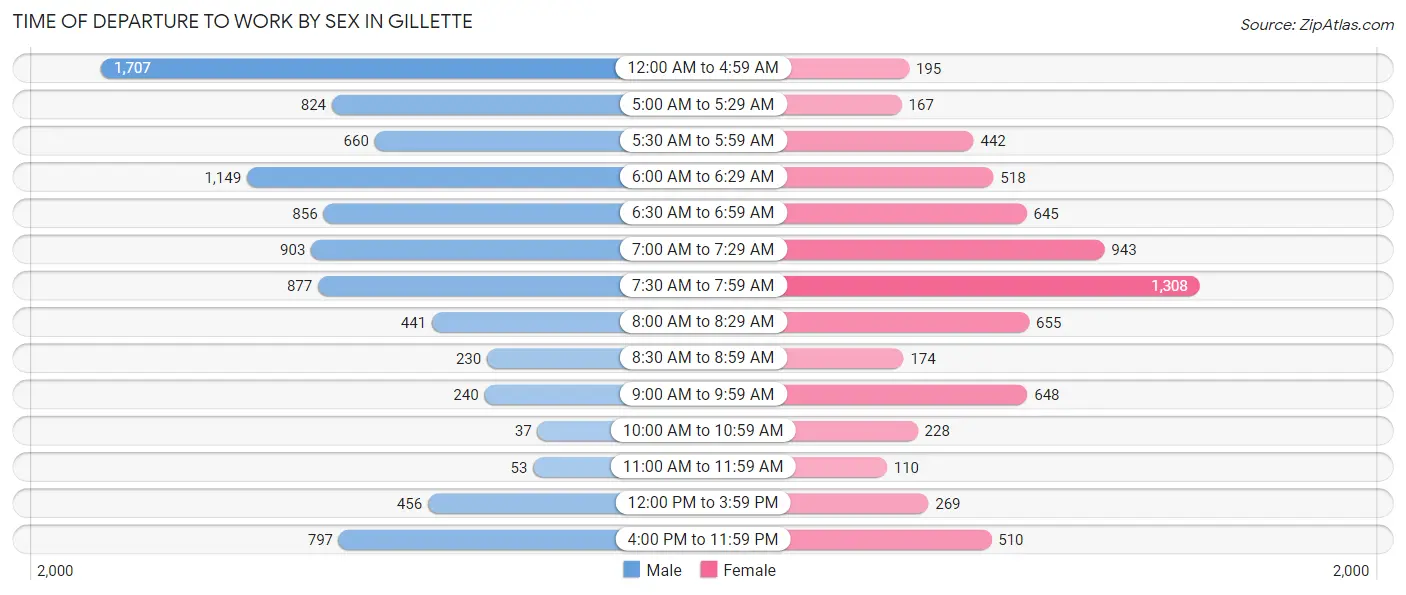
| Time of Departure | Male | Female |
| 12:00 AM to 4:59 AM | 1,707 (18.5%) | 195 (2.9%) |
| 5:00 AM to 5:29 AM | 824 (8.9%) | 167 (2.5%) |
| 5:30 AM to 5:59 AM | 660 (7.1%) | 442 (6.5%) |
| 6:00 AM to 6:29 AM | 1,149 (12.4%) | 518 (7.6%) |
| 6:30 AM to 6:59 AM | 856 (9.3%) | 645 (9.5%) |
| 7:00 AM to 7:29 AM | 903 (9.8%) | 943 (13.8%) |
| 7:30 AM to 7:59 AM | 877 (9.5%) | 1,308 (19.2%) |
| 8:00 AM to 8:29 AM | 441 (4.8%) | 655 (9.6%) |
| 8:30 AM to 8:59 AM | 230 (2.5%) | 174 (2.5%) |
| 9:00 AM to 9:59 AM | 240 (2.6%) | 648 (9.5%) |
| 10:00 AM to 10:59 AM | 37 (0.4%) | 228 (3.4%) |
| 11:00 AM to 11:59 AM | 53 (0.6%) | 110 (1.6%) |
| 12:00 PM to 3:59 PM | 456 (4.9%) | 269 (4.0%) |
| 4:00 PM to 11:59 PM | 797 (8.6%) | 510 (7.5%) |
| Total | 9,230 (100.0%) | 6,812 (100.0%) |
Housing Occupancy in Gillette
Occupancy by Ownership in Gillette
Of the total 12,417 dwellings in Gillette, owner-occupied units account for 9,307 (75.0%), while renter-occupied units make up 3,110 (25.1%).
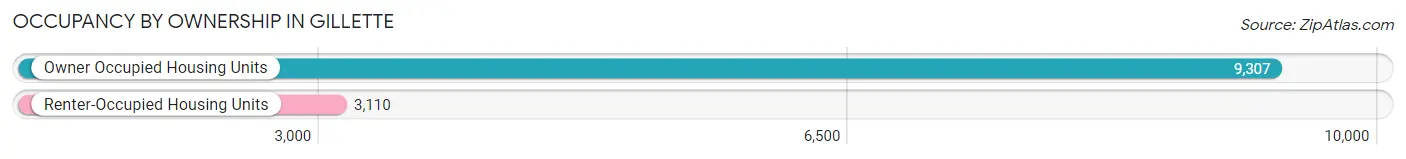
| Occupancy | # Housing Units | % Housing Units |
| Owner Occupied Housing Units | 9,307 | 75.0% |
| Renter-Occupied Housing Units | 3,110 | 25.1% |
| Total Occupied Housing Units | 12,417 | 100.0% |
Occupancy by Household Size in Gillette
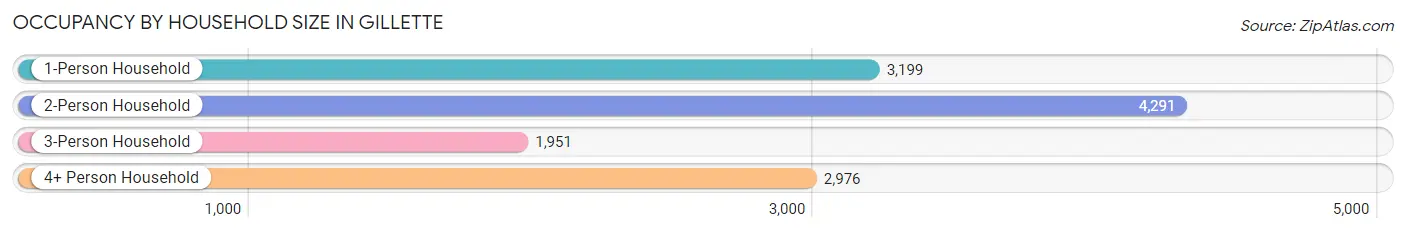
| Household Size | # Housing Units | % Housing Units |
| 1-Person Household | 3,199 | 25.8% |
| 2-Person Household | 4,291 | 34.6% |
| 3-Person Household | 1,951 | 15.7% |
| 4+ Person Household | 2,976 | 24.0% |
| Total Housing Units | 12,417 | 100.0% |
Occupancy by Ownership by Household Size in Gillette
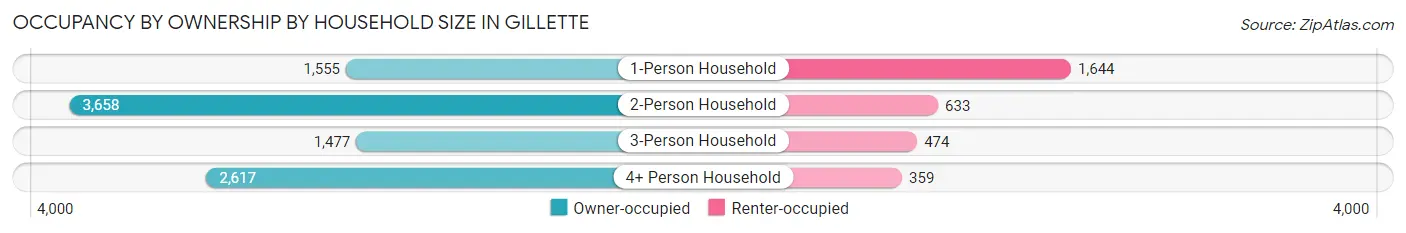
| Household Size | Owner-occupied | Renter-occupied |
| 1-Person Household | 1,555 (48.6%) | 1,644 (51.4%) |
| 2-Person Household | 3,658 (85.3%) | 633 (14.7%) |
| 3-Person Household | 1,477 (75.7%) | 474 (24.3%) |
| 4+ Person Household | 2,617 (87.9%) | 359 (12.1%) |
| Total Housing Units | 9,307 (75.0%) | 3,110 (25.1%) |
Occupancy by Educational Attainment in Gillette
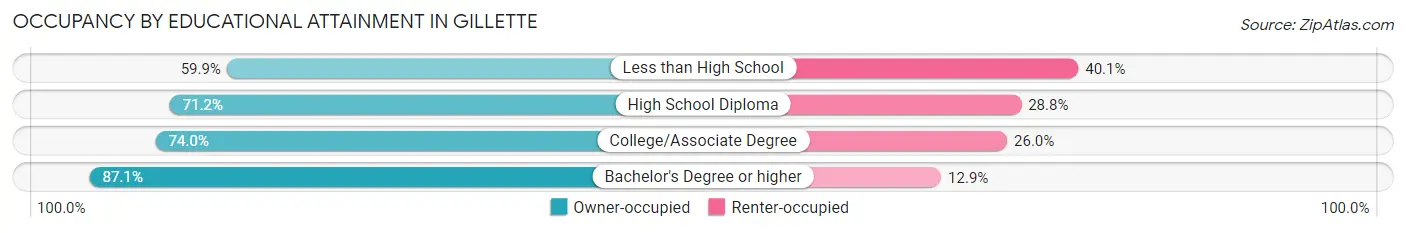
| Household Size | Owner-occupied | Renter-occupied |
| Less than High School | 504 (59.9%) | 337 (40.1%) |
| High School Diploma | 2,531 (71.2%) | 1,022 (28.8%) |
| College/Associate Degree | 4,061 (74.0%) | 1,424 (26.0%) |
| Bachelor's Degree or higher | 2,211 (87.1%) | 327 (12.9%) |
Occupancy by Age of Householder in Gillette
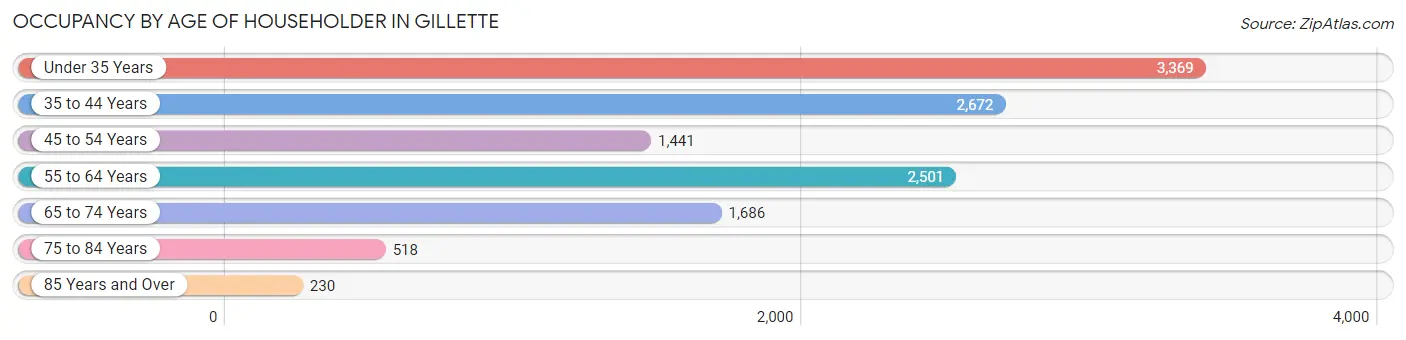
| Age Bracket | # Households | % Households |
| Under 35 Years | 3,369 | 27.1% |
| 35 to 44 Years | 2,672 | 21.5% |
| 45 to 54 Years | 1,441 | 11.6% |
| 55 to 64 Years | 2,501 | 20.1% |
| 65 to 74 Years | 1,686 | 13.6% |
| 75 to 84 Years | 518 | 4.2% |
| 85 Years and Over | 230 | 1.8% |
| Total | 12,417 | 100.0% |
Housing Finances in Gillette
Median Income by Occupancy in Gillette

| Occupancy Type | # Households | Median Income |
| Owner-Occupied | 9,307 (75.0%) | $106,096 |
| Renter-Occupied | 3,110 (25.1%) | $35,570 |
| Average | 12,417 (100.0%) | $90,415 |
Occupancy by Householder Income Bracket in Gillette
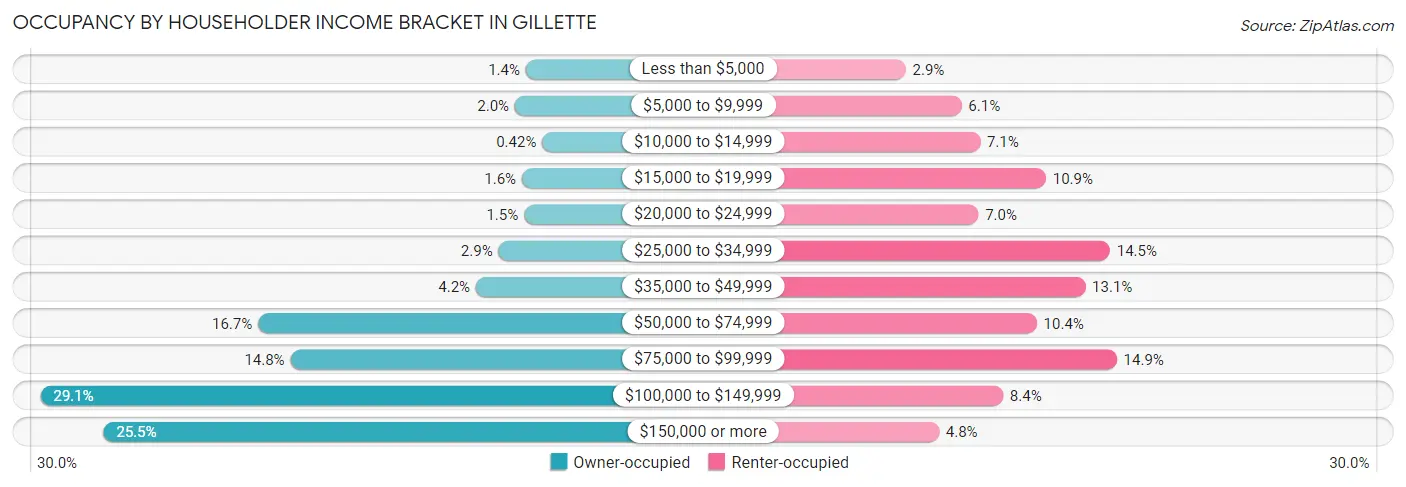
| Income Bracket | Owner-occupied | Renter-occupied |
| Less than $5,000 | 127 (1.4%) | 89 (2.9%) |
| $5,000 to $9,999 | 184 (2.0%) | 188 (6.0%) |
| $10,000 to $14,999 | 39 (0.4%) | 221 (7.1%) |
| $15,000 to $19,999 | 147 (1.6%) | 338 (10.9%) |
| $20,000 to $24,999 | 136 (1.5%) | 218 (7.0%) |
| $25,000 to $34,999 | 272 (2.9%) | 452 (14.5%) |
| $35,000 to $49,999 | 392 (4.2%) | 408 (13.1%) |
| $50,000 to $74,999 | 1,551 (16.7%) | 322 (10.3%) |
| $75,000 to $99,999 | 1,378 (14.8%) | 464 (14.9%) |
| $100,000 to $149,999 | 2,708 (29.1%) | 262 (8.4%) |
| $150,000 or more | 2,373 (25.5%) | 148 (4.8%) |
| Total | 9,307 (100.0%) | 3,110 (100.0%) |
Monthly Housing Cost Tiers in Gillette
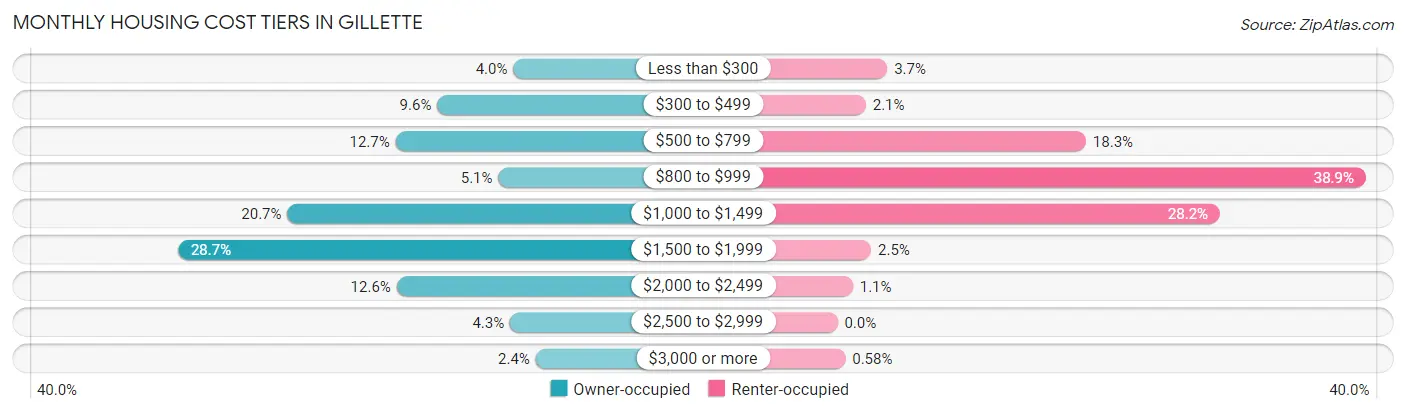
| Monthly Cost | Owner-occupied | Renter-occupied |
| Less than $300 | 373 (4.0%) | 114 (3.7%) |
| $300 to $499 | 894 (9.6%) | 65 (2.1%) |
| $500 to $799 | 1,180 (12.7%) | 569 (18.3%) |
| $800 to $999 | 476 (5.1%) | 1,210 (38.9%) |
| $1,000 to $1,499 | 1,922 (20.6%) | 876 (28.2%) |
| $1,500 to $1,999 | 2,673 (28.7%) | 77 (2.5%) |
| $2,000 to $2,499 | 1,173 (12.6%) | 35 (1.1%) |
| $2,500 to $2,999 | 396 (4.3%) | 0 (0.0%) |
| $3,000 or more | 220 (2.4%) | 18 (0.6%) |
| Total | 9,307 (100.0%) | 3,110 (100.0%) |
Physical Housing Characteristics in Gillette
Housing Structures in Gillette
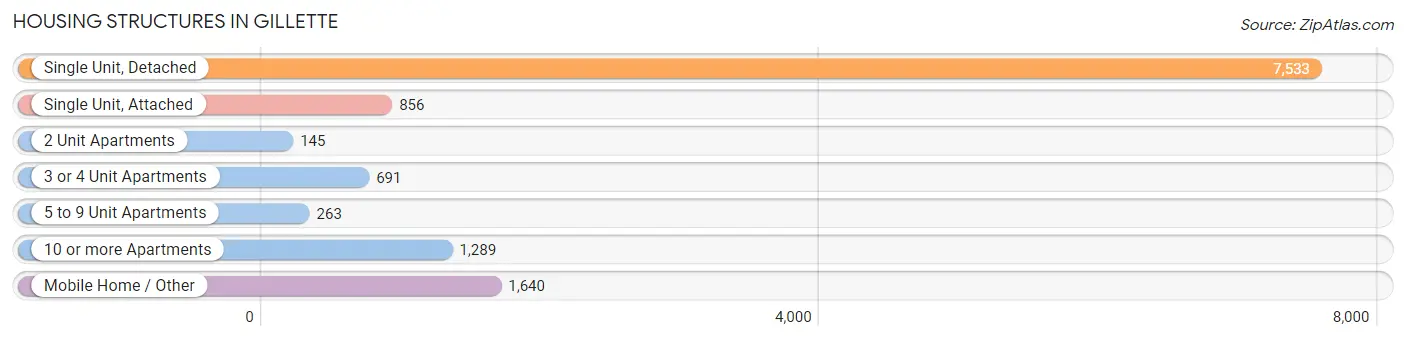
| Structure Type | # Housing Units | % Housing Units |
| Single Unit, Detached | 7,533 | 60.7% |
| Single Unit, Attached | 856 | 6.9% |
| 2 Unit Apartments | 145 | 1.2% |
| 3 or 4 Unit Apartments | 691 | 5.6% |
| 5 to 9 Unit Apartments | 263 | 2.1% |
| 10 or more Apartments | 1,289 | 10.4% |
| Mobile Home / Other | 1,640 | 13.2% |
| Total | 12,417 | 100.0% |
Housing Structures by Occupancy in Gillette
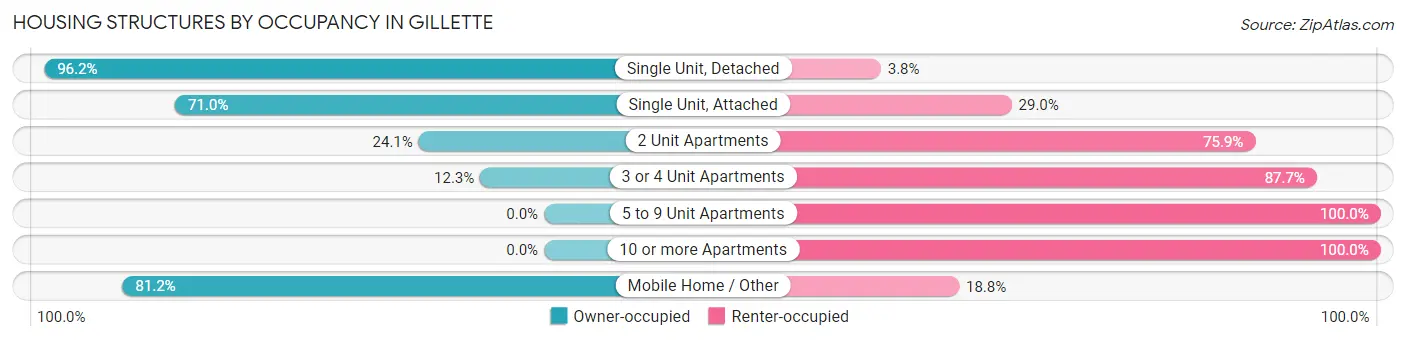
| Structure Type | Owner-occupied | Renter-occupied |
| Single Unit, Detached | 7,248 (96.2%) | 285 (3.8%) |
| Single Unit, Attached | 608 (71.0%) | 248 (29.0%) |
| 2 Unit Apartments | 35 (24.1%) | 110 (75.9%) |
| 3 or 4 Unit Apartments | 85 (12.3%) | 606 (87.7%) |
| 5 to 9 Unit Apartments | 0 (0.0%) | 263 (100.0%) |
| 10 or more Apartments | 0 (0.0%) | 1,289 (100.0%) |
| Mobile Home / Other | 1,331 (81.2%) | 309 (18.8%) |
| Total | 9,307 (75.0%) | 3,110 (25.1%) |
Housing Structures by Number of Rooms in Gillette
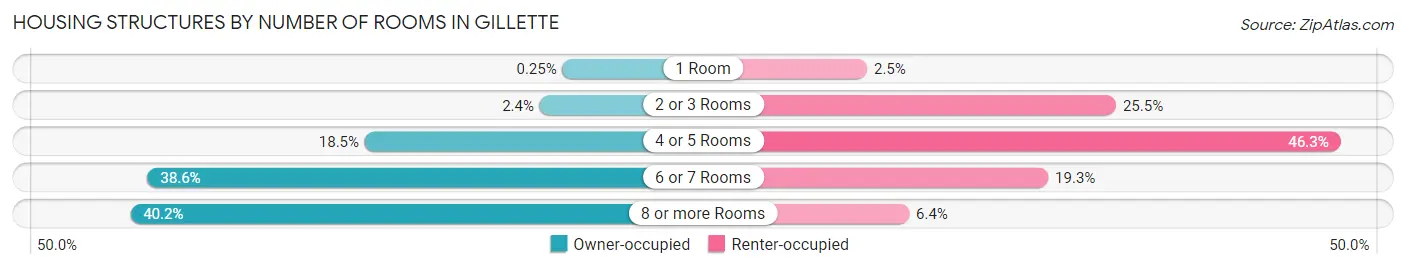
| Number of Rooms | Owner-occupied | Renter-occupied |
| 1 Room | 23 (0.3%) | 78 (2.5%) |
| 2 or 3 Rooms | 219 (2.4%) | 794 (25.5%) |
| 4 or 5 Rooms | 1,725 (18.5%) | 1,440 (46.3%) |
| 6 or 7 Rooms | 3,596 (38.6%) | 599 (19.3%) |
| 8 or more Rooms | 3,744 (40.2%) | 199 (6.4%) |
| Total | 9,307 (100.0%) | 3,110 (100.0%) |
Housing Structure by Heating Type in Gillette
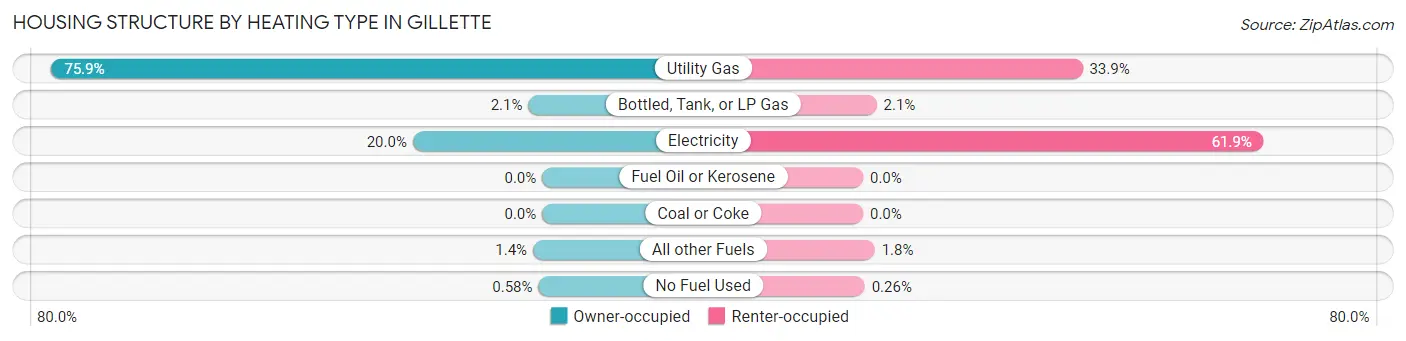
| Heating Type | Owner-occupied | Renter-occupied |
| Utility Gas | 7,061 (75.9%) | 1,055 (33.9%) |
| Bottled, Tank, or LP Gas | 199 (2.1%) | 65 (2.1%) |
| Electricity | 1,861 (20.0%) | 1,926 (61.9%) |
| Fuel Oil or Kerosene | 0 (0.0%) | 0 (0.0%) |
| Coal or Coke | 0 (0.0%) | 0 (0.0%) |
| All other Fuels | 132 (1.4%) | 56 (1.8%) |
| No Fuel Used | 54 (0.6%) | 8 (0.3%) |
| Total | 9,307 (100.0%) | 3,110 (100.0%) |
Household Vehicle Usage in Gillette
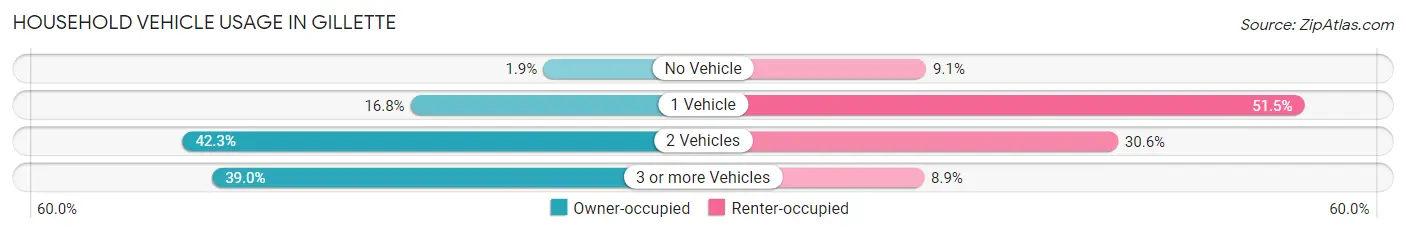
| Vehicles per Household | Owner-occupied | Renter-occupied |
| No Vehicle | 179 (1.9%) | 283 (9.1%) |
| 1 Vehicle | 1,562 (16.8%) | 1,600 (51.4%) |
| 2 Vehicles | 3,938 (42.3%) | 951 (30.6%) |
| 3 or more Vehicles | 3,628 (39.0%) | 276 (8.9%) |
| Total | 9,307 (100.0%) | 3,110 (100.0%) |
Real Estate & Mortgages in Gillette
Real Estate and Mortgage Overview in Gillette
| Characteristic | Without Mortgage | With Mortgage |
| Housing Units | 2,614 | 6,693 |
| Median Property Value | $231,400 | $246,300 |
| Median Household Income | $90,728 | $1,803 |
| Monthly Housing Costs | $510 | $220 |
| Real Estate Taxes | $1,315 | $147 |
Property Value by Mortgage Status in Gillette
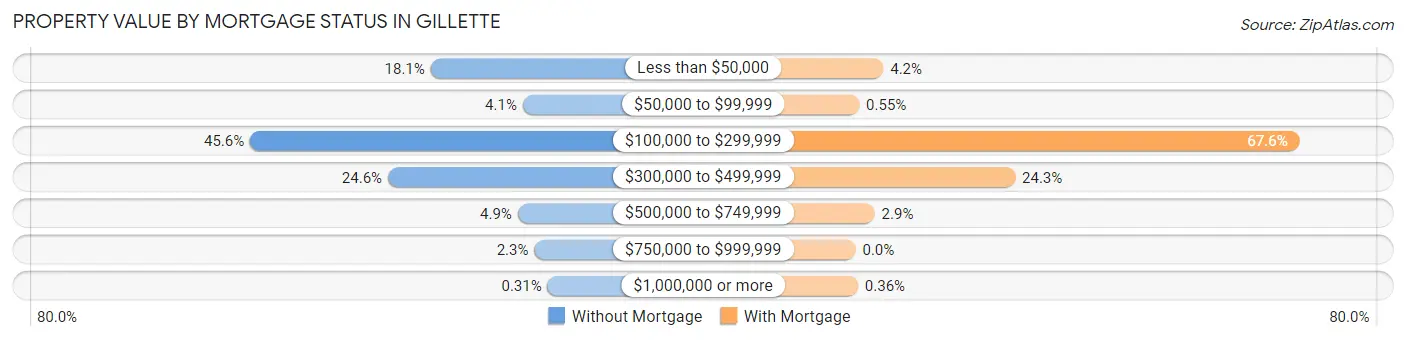
| Property Value | Without Mortgage | With Mortgage |
| Less than $50,000 | 474 (18.1%) | 283 (4.2%) |
| $50,000 to $99,999 | 107 (4.1%) | 37 (0.5%) |
| $100,000 to $299,999 | 1,193 (45.6%) | 4,527 (67.6%) |
| $300,000 to $499,999 | 644 (24.6%) | 1,627 (24.3%) |
| $500,000 to $749,999 | 127 (4.9%) | 195 (2.9%) |
| $750,000 to $999,999 | 61 (2.3%) | 0 (0.0%) |
| $1,000,000 or more | 8 (0.3%) | 24 (0.4%) |
| Total | 2,614 (100.0%) | 6,693 (100.0%) |
Household Income by Mortgage Status in Gillette
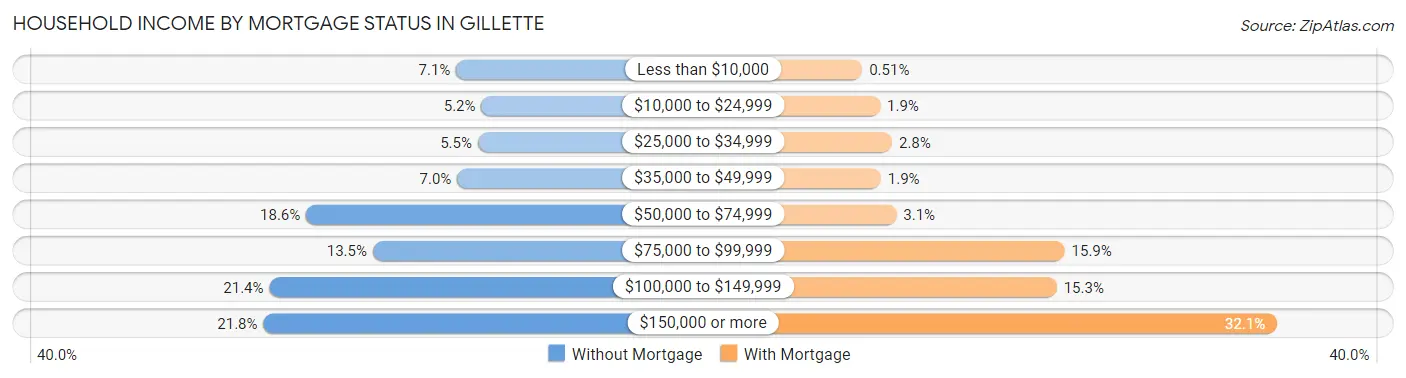
| Household Income | Without Mortgage | With Mortgage |
| Less than $10,000 | 186 (7.1%) | 34 (0.5%) |
| $10,000 to $24,999 | 136 (5.2%) | 125 (1.9%) |
| $25,000 to $34,999 | 143 (5.5%) | 186 (2.8%) |
| $35,000 to $49,999 | 184 (7.0%) | 129 (1.9%) |
| $50,000 to $74,999 | 485 (18.5%) | 208 (3.1%) |
| $75,000 to $99,999 | 352 (13.5%) | 1,066 (15.9%) |
| $100,000 to $149,999 | 558 (21.3%) | 1,026 (15.3%) |
| $150,000 or more | 570 (21.8%) | 2,150 (32.1%) |
| Total | 2,614 (100.0%) | 6,693 (100.0%) |
Property Value to Household Income Ratio in Gillette
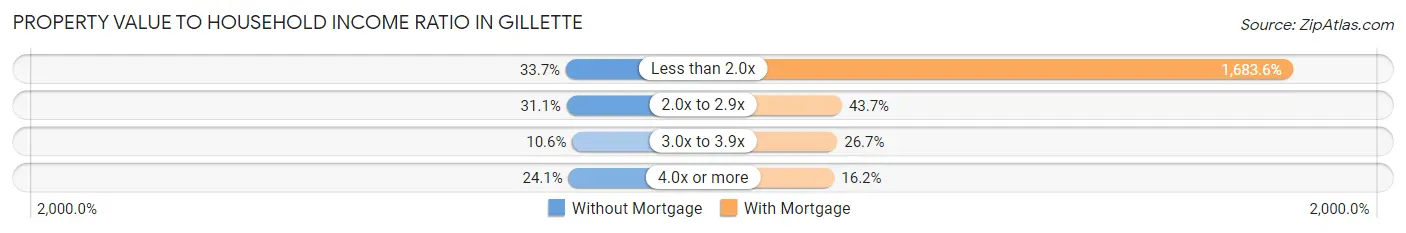
| Value-to-Income Ratio | Without Mortgage | With Mortgage |
| Less than 2.0x | 881 (33.7%) | 112,680 (1,683.5%) |
| 2.0x to 2.9x | 814 (31.1%) | 2,927 (43.7%) |
| 3.0x to 3.9x | 277 (10.6%) | 1,787 (26.7%) |
| 4.0x or more | 631 (24.1%) | 1,087 (16.2%) |
| Total | 2,614 (100.0%) | 6,693 (100.0%) |
Real Estate Taxes by Mortgage Status in Gillette
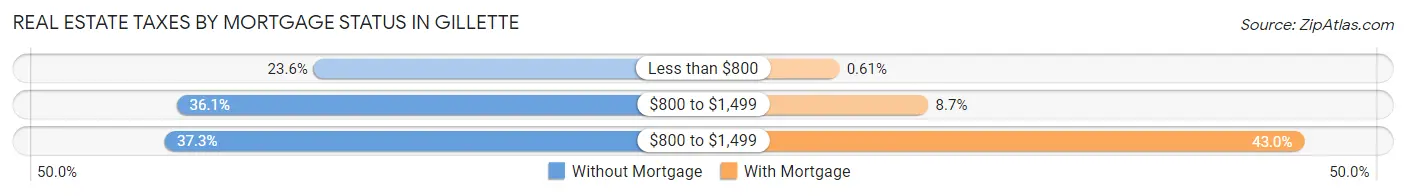
| Property Taxes | Without Mortgage | With Mortgage |
| Less than $800 | 617 (23.6%) | 41 (0.6%) |
| $800 to $1,499 | 944 (36.1%) | 584 (8.7%) |
| $800 to $1,499 | 974 (37.3%) | 2,880 (43.0%) |
| Total | 2,614 (100.0%) | 6,693 (100.0%) |
Health & Disability in Gillette
Health Insurance Coverage by Age in Gillette
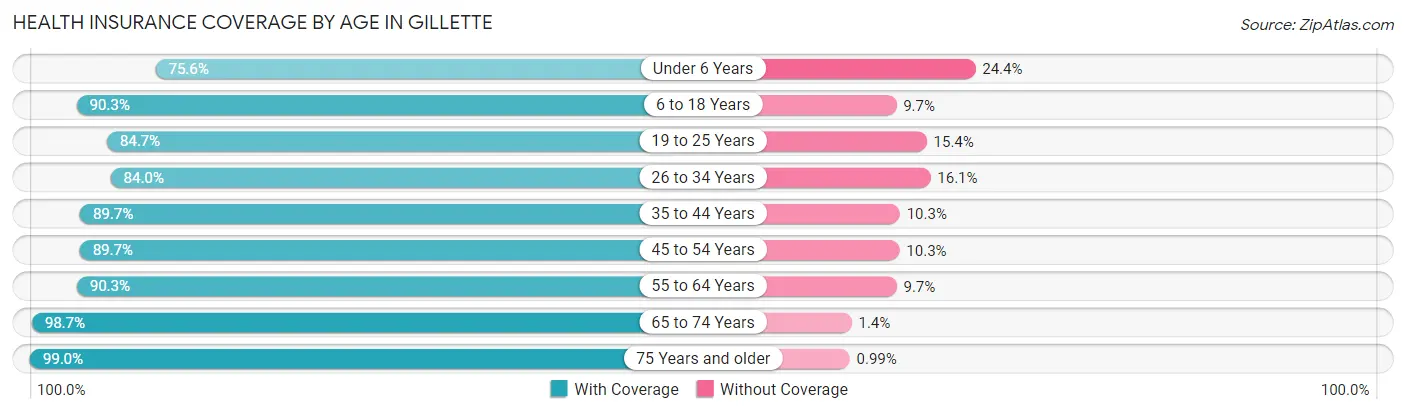
| Age Bracket | With Coverage | Without Coverage |
| Under 6 Years | 2,503 (75.6%) | 809 (24.4%) |
| 6 to 18 Years | 6,103 (90.3%) | 654 (9.7%) |
| 19 to 25 Years | 2,466 (84.7%) | 447 (15.3%) |
| 26 to 34 Years | 3,703 (84.0%) | 708 (16.1%) |
| 35 to 44 Years | 4,368 (89.7%) | 504 (10.3%) |
| 45 to 54 Years | 2,426 (89.7%) | 278 (10.3%) |
| 55 to 64 Years | 3,801 (90.3%) | 410 (9.7%) |
| 65 to 74 Years | 2,491 (98.7%) | 34 (1.3%) |
| 75 Years and older | 1,098 (99.0%) | 11 (1.0%) |
| Total | 28,959 (88.2%) | 3,855 (11.7%) |
Health Insurance Coverage by Citizenship Status in Gillette
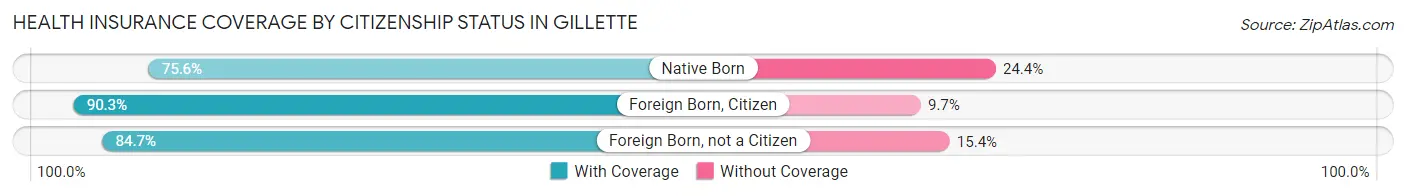
| Citizenship Status | With Coverage | Without Coverage |
| Native Born | 2,503 (75.6%) | 809 (24.4%) |
| Foreign Born, Citizen | 6,103 (90.3%) | 654 (9.7%) |
| Foreign Born, not a Citizen | 2,466 (84.7%) | 447 (15.3%) |
Health Insurance Coverage by Household Income in Gillette
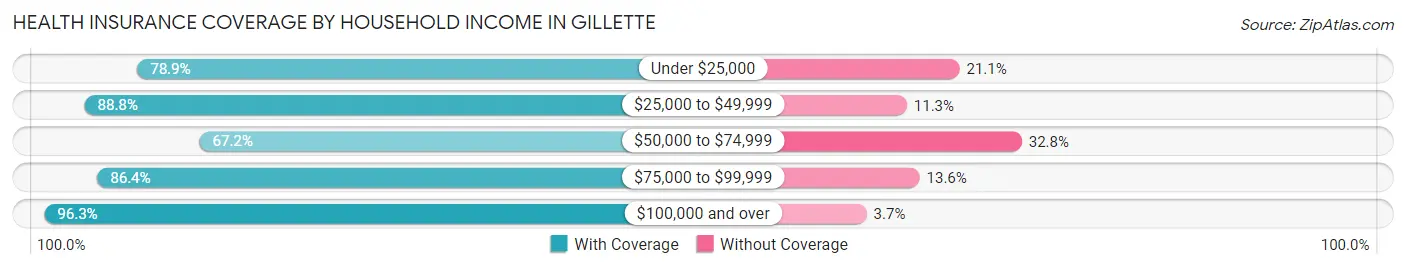
| Household Income | With Coverage | Without Coverage |
| Under $25,000 | 2,304 (78.9%) | 617 (21.1%) |
| $25,000 to $49,999 | 2,864 (88.7%) | 363 (11.3%) |
| $50,000 to $74,999 | 3,170 (67.2%) | 1,546 (32.8%) |
| $75,000 to $99,999 | 4,266 (86.4%) | 674 (13.6%) |
| $100,000 and over | 16,259 (96.3%) | 628 (3.7%) |
Public vs Private Health Insurance Coverage by Age in Gillette
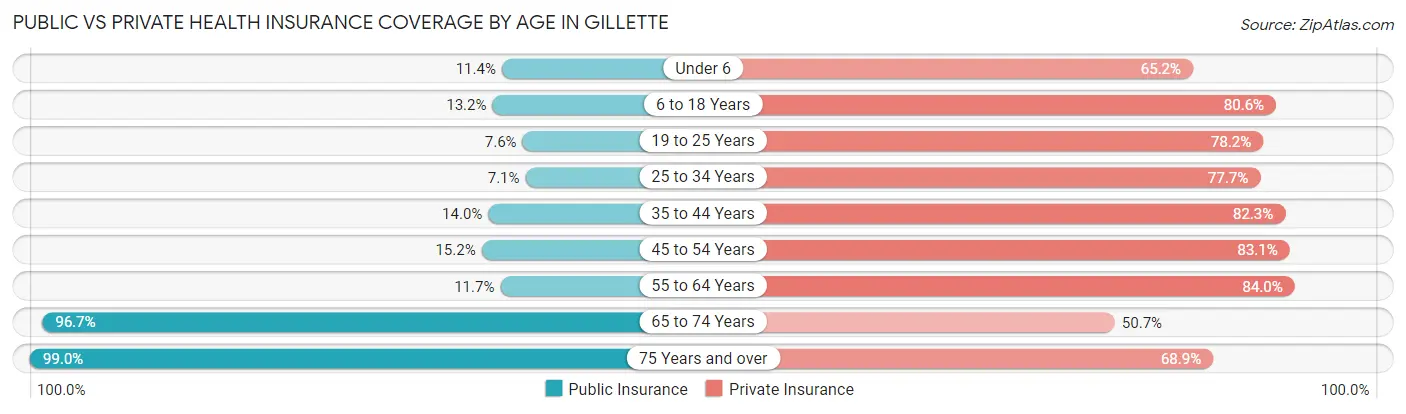
| Age Bracket | Public Insurance | Private Insurance |
| Under 6 | 379 (11.4%) | 2,158 (65.2%) |
| 6 to 18 Years | 891 (13.2%) | 5,444 (80.6%) |
| 19 to 25 Years | 221 (7.6%) | 2,278 (78.2%) |
| 25 to 34 Years | 311 (7.0%) | 3,425 (77.6%) |
| 35 to 44 Years | 680 (14.0%) | 4,008 (82.3%) |
| 45 to 54 Years | 411 (15.2%) | 2,247 (83.1%) |
| 55 to 64 Years | 493 (11.7%) | 3,539 (84.0%) |
| 65 to 74 Years | 2,442 (96.7%) | 1,280 (50.7%) |
| 75 Years and over | 1,098 (99.0%) | 764 (68.9%) |
| Total | 6,926 (21.1%) | 25,143 (76.6%) |
Disability Status by Sex by Age in Gillette
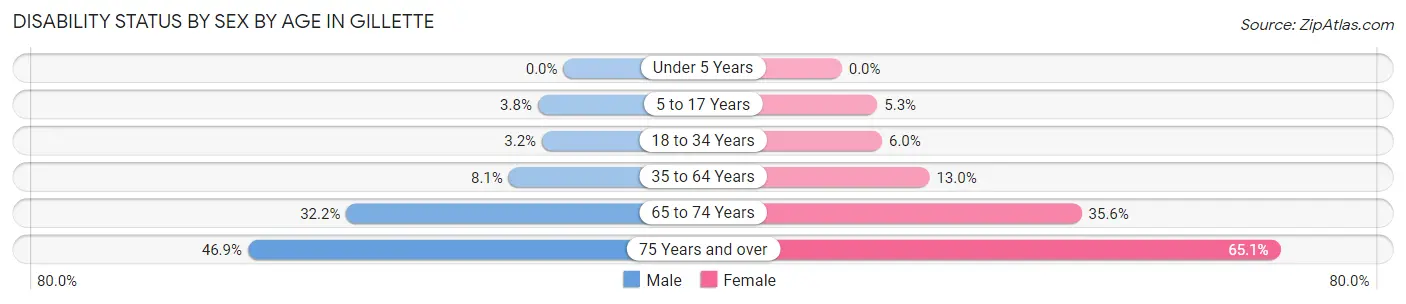
| Age Bracket | Male | Female |
| Under 5 Years | 0 (0.0%) | 0 (0.0%) |
| 5 to 17 Years | 143 (3.8%) | 170 (5.3%) |
| 18 to 34 Years | 127 (3.2%) | 223 (6.0%) |
| 35 to 64 Years | 501 (8.1%) | 732 (13.0%) |
| 65 to 74 Years | 413 (32.2%) | 443 (35.6%) |
| 75 Years and over | 224 (46.9%) | 411 (65.1%) |
Disability Class by Sex by Age in Gillette
Disability Class: Hearing Difficulty
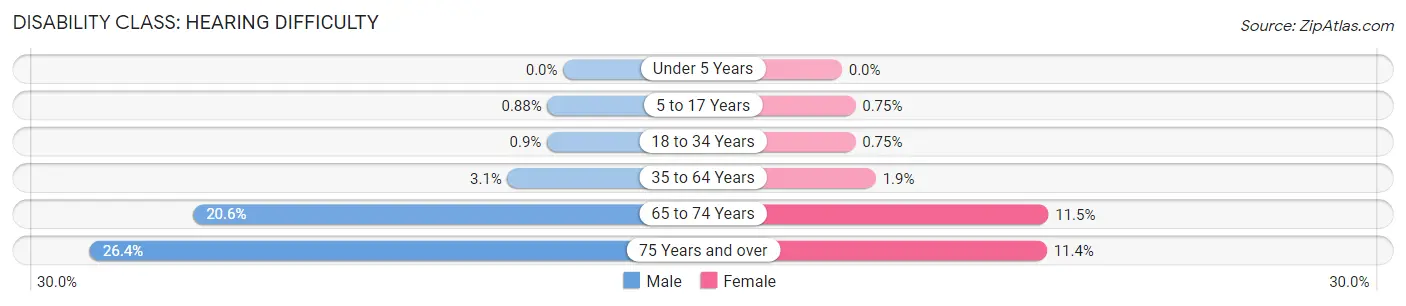
| Age Bracket | Male | Female |
| Under 5 Years | 0 (0.0%) | 0 (0.0%) |
| 5 to 17 Years | 33 (0.9%) | 24 (0.7%) |
| 18 to 34 Years | 36 (0.9%) | 28 (0.7%) |
| 35 to 64 Years | 191 (3.1%) | 106 (1.9%) |
| 65 to 74 Years | 264 (20.6%) | 143 (11.5%) |
| 75 Years and over | 126 (26.4%) | 72 (11.4%) |
Disability Class: Vision Difficulty
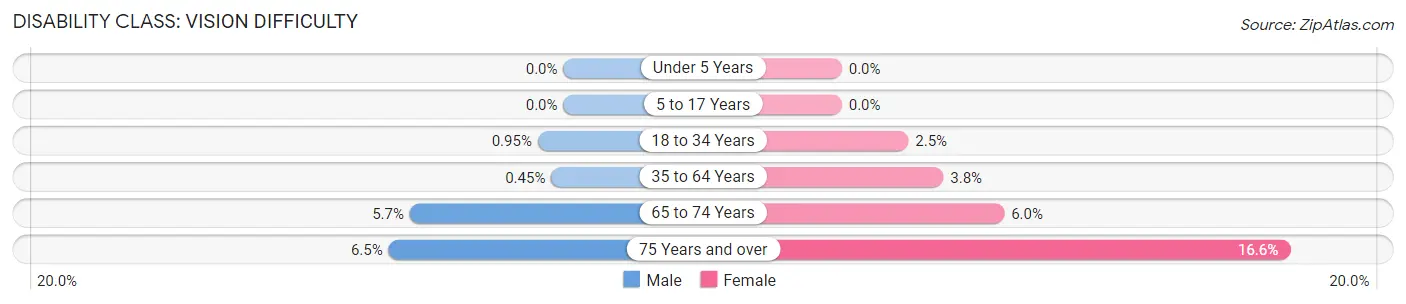
| Age Bracket | Male | Female |
| Under 5 Years | 0 (0.0%) | 0 (0.0%) |
| 5 to 17 Years | 0 (0.0%) | 0 (0.0%) |
| 18 to 34 Years | 38 (0.9%) | 92 (2.5%) |
| 35 to 64 Years | 28 (0.4%) | 212 (3.8%) |
| 65 to 74 Years | 73 (5.7%) | 75 (6.0%) |
| 75 Years and over | 31 (6.5%) | 105 (16.6%) |
Disability Class: Cognitive Difficulty
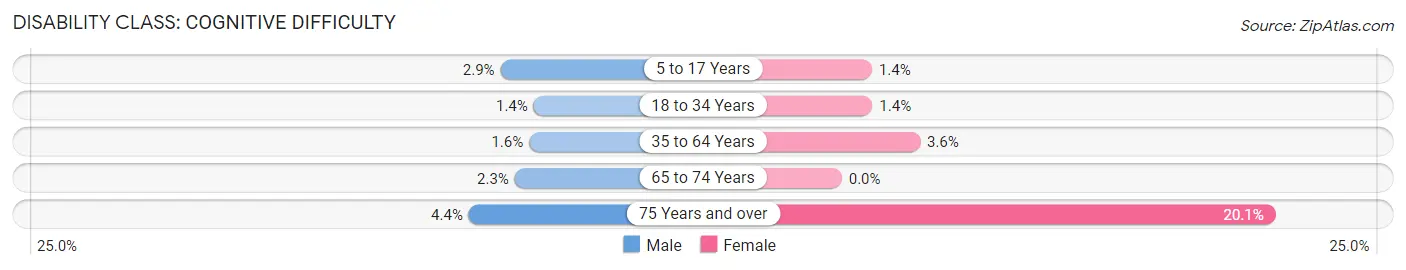
| Age Bracket | Male | Female |
| 5 to 17 Years | 110 (2.9%) | 45 (1.4%) |
| 18 to 34 Years | 55 (1.4%) | 53 (1.4%) |
| 35 to 64 Years | 98 (1.6%) | 204 (3.6%) |
| 65 to 74 Years | 29 (2.3%) | 0 (0.0%) |
| 75 Years and over | 21 (4.4%) | 127 (20.1%) |
Disability Class: Ambulatory Difficulty
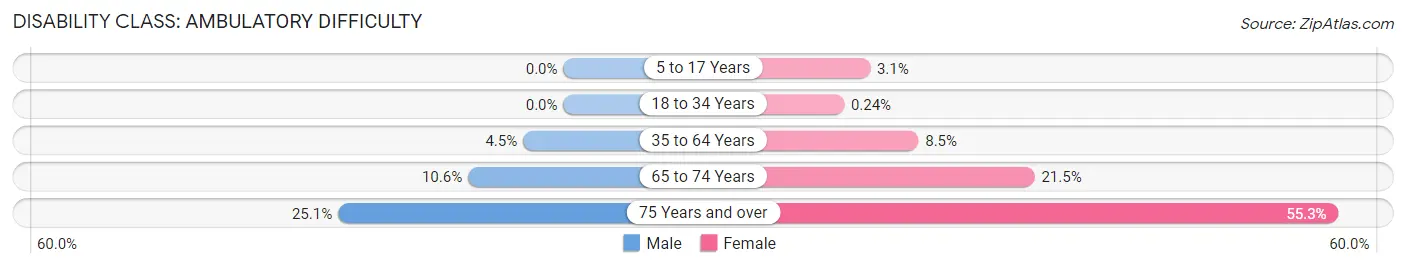
| Age Bracket | Male | Female |
| 5 to 17 Years | 0 (0.0%) | 101 (3.1%) |
| 18 to 34 Years | 0 (0.0%) | 9 (0.2%) |
| 35 to 64 Years | 277 (4.5%) | 479 (8.5%) |
| 65 to 74 Years | 136 (10.6%) | 267 (21.5%) |
| 75 Years and over | 120 (25.1%) | 349 (55.3%) |
Disability Class: Self-Care Difficulty
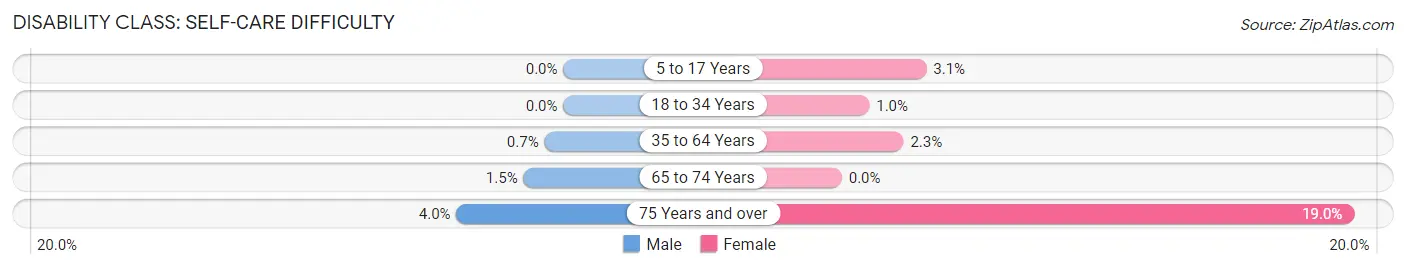
| Age Bracket | Male | Female |
| 5 to 17 Years | 0 (0.0%) | 101 (3.1%) |
| 18 to 34 Years | 0 (0.0%) | 38 (1.0%) |
| 35 to 64 Years | 43 (0.7%) | 129 (2.3%) |
| 65 to 74 Years | 19 (1.5%) | 0 (0.0%) |
| 75 Years and over | 19 (4.0%) | 120 (19.0%) |
Technology Access in Gillette
Computing Device Access in Gillette
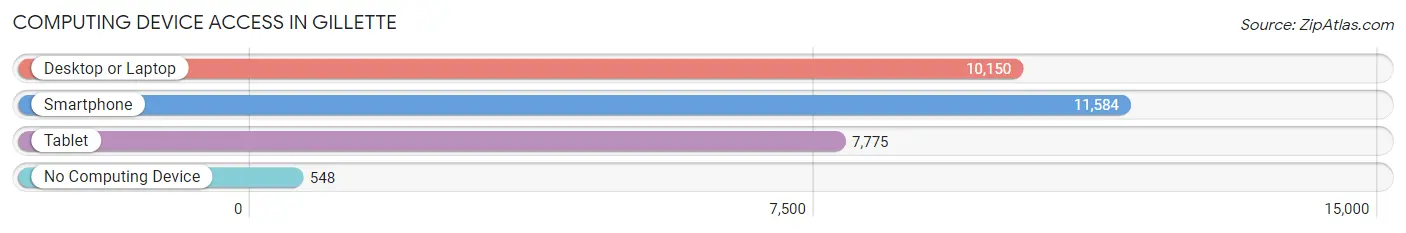
| Device Type | # Households | % Households |
| Desktop or Laptop | 10,150 | 81.7% |
| Smartphone | 11,584 | 93.3% |
| Tablet | 7,775 | 62.6% |
| No Computing Device | 548 | 4.4% |
| Total | 12,417 | 100.0% |
Internet Access in Gillette
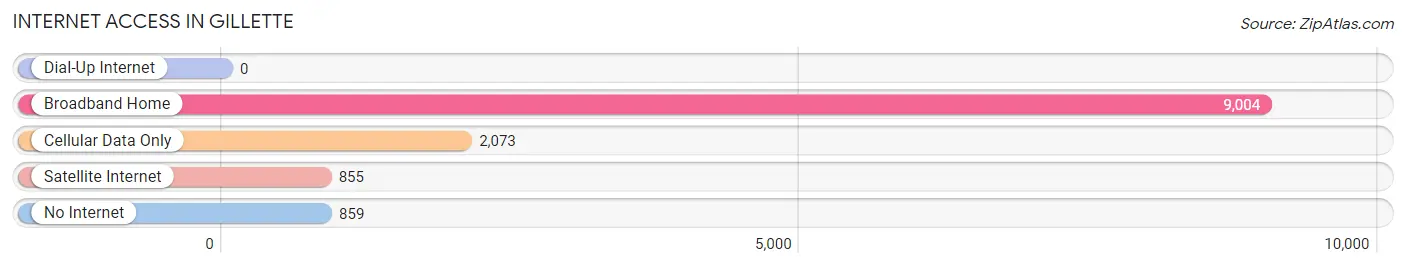
| Internet Type | # Households | % Households |
| Dial-Up Internet | 0 | 0.0% |
| Broadband Home | 9,004 | 72.5% |
| Cellular Data Only | 2,073 | 16.7% |
| Satellite Internet | 855 | 6.9% |
| No Internet | 859 | 6.9% |
| Total | 12,417 | 100.0% |
Gillette Summary
Gillette, Wyoming is a city located in the northeastern corner of the state. It is the county seat of Campbell County and is the largest city in the county. The city is located in the Powder River Basin, which is a major coal-producing region. The city is known for its coal mining, oil and gas production, and agricultural production.
History
The area that is now Gillette was first settled in the late 1800s by ranchers and homesteaders. The city was officially founded in 1891 and was named after Edward Gillette, a surveyor who worked in the area. The city was incorporated in 1910 and has since grown to become the largest city in Campbell County.
Geography
Gillette is located in the northeastern corner of Wyoming, in the Powder River Basin. The city is situated at an elevation of 4,890 feet above sea level. The city is located in the foothills of the Big Horn Mountains and is surrounded by rolling hills and prairies. The city is located near the Black Hills National Forest and is close to the Bighorn National Forest.
Economy
The economy of Gillette is largely based on the energy industry. The city is home to several coal mines, oil and gas production, and agricultural production. The city is also home to several manufacturing companies, including a large paper mill. The city is also home to several retail stores, restaurants, and other businesses.
Demographics
As of the 2010 census, the population of Gillette was estimated to be 30,890. The population is predominantly white, with a small percentage of African Americans, Native Americans, and Asians. The median household income in the city is $60,890, and the median home value is $179,000. The city has a high rate of homeownership, with over 70% of the population owning their own homes.
Conclusion
Gillette, Wyoming is a city located in the northeastern corner of the state. It is the county seat of Campbell County and is the largest city in the county. The city is known for its coal mining, oil and gas production, and agricultural production. The city has a population of 30,890 and a median household income of $60,890. The city is home to several energy companies, manufacturing companies, and retail stores.
Common Questions
What is Per Capita Income in Gillette?
Per Capita income in Gillette is $38,670.
What is the Median Family Income in Gillette?
Median Family Income in Gillette is $101,455.
What is the Median Household income in Gillette?
Median Household Income in Gillette is $90,415.
What is Income or Wage Gap in Gillette?
Income or Wage Gap in Gillette is 44.6%.
Women in Gillette earn 55.4 cents for every dollar earned by a man.
What is Inequality or Gini Index in Gillette?
Inequality or Gini Index in Gillette is 0.39.
What is the Total Population of Gillette?
Total Population of Gillette is 33,158.
What is the Total Male Population of Gillette?
Total Male Population of Gillette is 17,387.
What is the Total Female Population of Gillette?
Total Female Population of Gillette is 15,771.
What is the Ratio of Males per 100 Females in Gillette?
There are 110.25 Males per 100 Females in Gillette.
What is the Ratio of Females per 100 Males in Gillette?
There are 90.71 Females per 100 Males in Gillette.
What is the Median Population Age in Gillette?
Median Population Age in Gillette is 33.2 Years.
What is the Average Family Size in Gillette
Average Family Size in Gillette is 3.2 People.
What is the Average Household Size in Gillette
Average Household Size in Gillette is 2.6 People.
How Large is the Labor Force in Gillette?
There are 17,522 People in the Labor Forcein in Gillette.
What is the Percentage of People in the Labor Force in Gillette?
71.8% of People are in the Labor Force in Gillette.
What is the Unemployment Rate in Gillette?
Unemployment Rate in Gillette is 3.6%.