Riverton, WY Map & Demographics
Riverton Map
Riverton Overview
$25,653
PER CAPITA INCOME
$70,804
AVG FAMILY INCOME
$50,861
AVG HOUSEHOLD INCOME
3.5%
WAGE / INCOME GAP [ % ]
96.5¢/ $1
WAGE / INCOME GAP [ $ ]
0.38
INEQUALITY / GINI INDEX
10,733
TOTAL POPULATION
5,275
MALE POPULATION
5,458
FEMALE POPULATION
96.65
MALES / 100 FEMALES
103.47
FEMALES / 100 MALES
36.4
MEDIAN AGE
3.3
AVG FAMILY SIZE
2.5
AVG HOUSEHOLD SIZE
5,447
LABOR FORCE [ PEOPLE ]
65.0%
PERCENT IN LABOR FORCE
7.1%
UNEMPLOYMENT RATE
Riverton Zip Codes
Riverton Area Codes
Income in Riverton
Income Overview in Riverton
Per Capita Income in Riverton is $25,653, while median incomes of families and households are $70,804 and $50,861 respectively.
| Characteristic | Number | Measure |
| Per Capita Income | 10,733 | $25,653 |
| Median Family Income | 2,369 | $70,804 |
| Mean Family Income | 2,369 | $76,844 |
| Median Household Income | 4,124 | $50,861 |
| Mean Household Income | 4,124 | $61,867 |
| Income Deficit | 2,369 | $0 |
| Wage / Income Gap (%) | 10,733 | 3.53% |
| Wage / Income Gap ($) | 10,733 | 96.47¢ per $1 |
| Gini / Inequality Index | 10,733 | 0.38 |
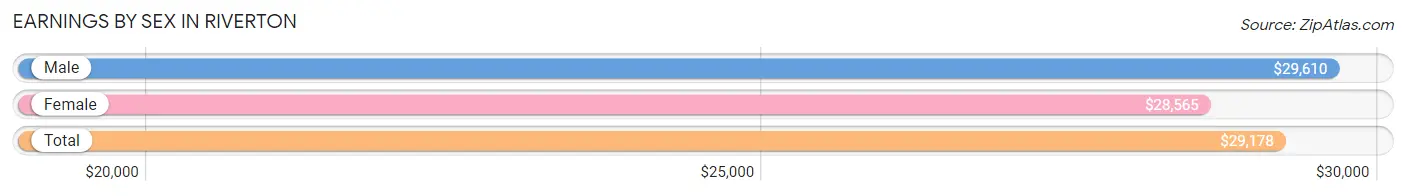
Earnings by Sex in Riverton
Average Earnings in Riverton are $29,178, $29,610 for men and $28,565 for women, a difference of 3.5%.
| Sex | Number | Average Earnings |
| Male | 3,231 (54.7%) | $29,610 |
| Female | 2,677 (45.3%) | $28,565 |
| Total | 5,908 (100.0%) | $29,178 |
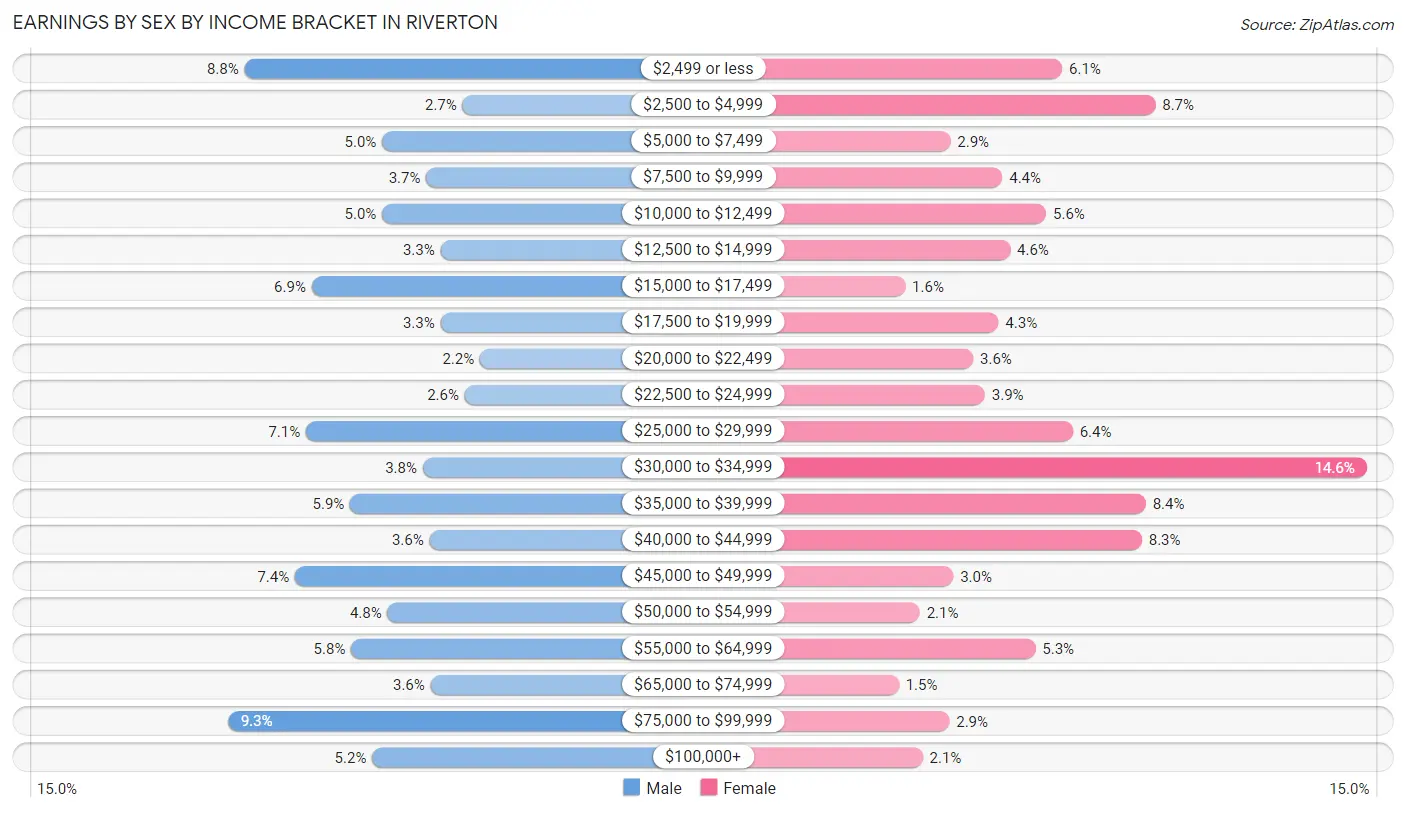
Earnings by Sex by Income Bracket in Riverton
The most common earnings brackets in Riverton are $75,000 to $99,999 for men (300 | 9.3%) and $30,000 to $34,999 for women (391 | 14.6%).
| Income | Male | Female |
| $2,499 or less | 285 (8.8%) | 162 (6.0%) |
| $2,500 to $4,999 | 87 (2.7%) | 232 (8.7%) |
| $5,000 to $7,499 | 160 (5.0%) | 78 (2.9%) |
| $7,500 to $9,999 | 120 (3.7%) | 117 (4.4%) |
| $10,000 to $12,499 | 160 (5.0%) | 150 (5.6%) |
| $12,500 to $14,999 | 107 (3.3%) | 123 (4.6%) |
| $15,000 to $17,499 | 224 (6.9%) | 44 (1.6%) |
| $17,500 to $19,999 | 107 (3.3%) | 114 (4.3%) |
| $20,000 to $22,499 | 71 (2.2%) | 95 (3.5%) |
| $22,500 to $24,999 | 85 (2.6%) | 104 (3.9%) |
| $25,000 to $29,999 | 229 (7.1%) | 170 (6.4%) |
| $30,000 to $34,999 | 123 (3.8%) | 391 (14.6%) |
| $35,000 to $39,999 | 189 (5.9%) | 225 (8.4%) |
| $40,000 to $44,999 | 117 (3.6%) | 222 (8.3%) |
| $45,000 to $49,999 | 239 (7.4%) | 80 (3.0%) |
| $50,000 to $54,999 | 155 (4.8%) | 55 (2.1%) |
| $55,000 to $64,999 | 188 (5.8%) | 142 (5.3%) |
| $65,000 to $74,999 | 116 (3.6%) | 39 (1.5%) |
| $75,000 to $99,999 | 300 (9.3%) | 77 (2.9%) |
| $100,000+ | 169 (5.2%) | 57 (2.1%) |
| Total | 3,231 (100.0%) | 2,677 (100.0%) |
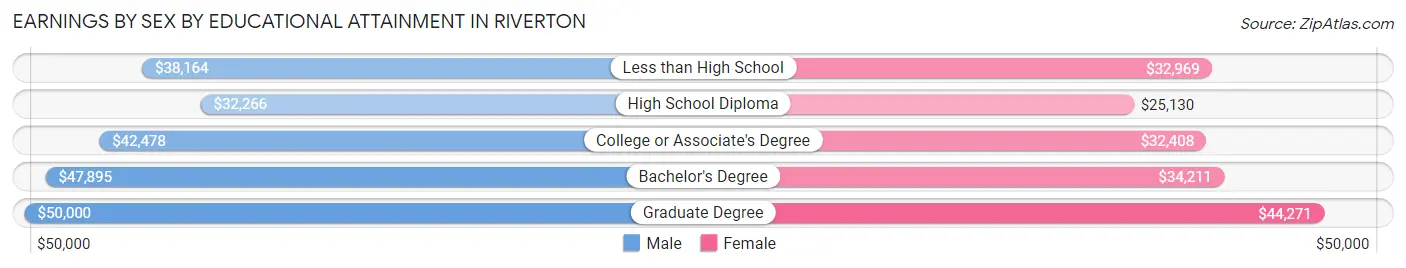
Earnings by Sex by Educational Attainment in Riverton
Average earnings in Riverton are $39,247 for men and $32,900 for women, a difference of 16.2%. Men with an educational attainment of graduate degree enjoy the highest average annual earnings of $50,000, while those with high school diploma education earn the least with $32,266. Women with an educational attainment of graduate degree earn the most with the average annual earnings of $44,271, while those with high school diploma education have the smallest earnings of $25,130.
| Educational Attainment | Male Income | Female Income |
| Less than High School | $38,164 | $32,969 |
| High School Diploma | $32,266 | $25,130 |
| College or Associate's Degree | $42,478 | $32,408 |
| Bachelor's Degree | $47,895 | $34,211 |
| Graduate Degree | $50,000 | $44,271 |
| Total | $39,247 | $32,900 |
Family Income in Riverton
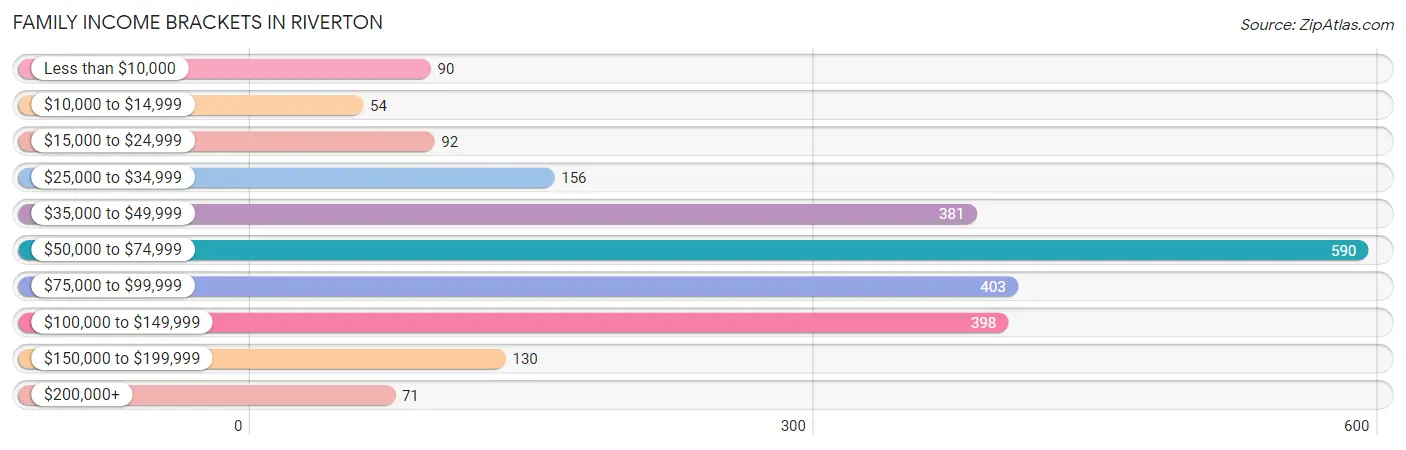
Family Income Brackets in Riverton
According to the Riverton family income data, there are 590 families falling into the $50,000 to $74,999 income range, which is the most common income bracket and makes up 24.9% of all families. Conversely, the $10,000 to $14,999 income bracket is the least frequent group with only 54 families (2.3%) belonging to this category.
| Income Bracket | # Families | % Families |
| Less than $10,000 | 90 | 3.8% |
| $10,000 to $14,999 | 54 | 2.3% |
| $15,000 to $24,999 | 92 | 3.9% |
| $25,000 to $34,999 | 156 | 6.6% |
| $35,000 to $49,999 | 381 | 16.1% |
| $50,000 to $74,999 | 590 | 24.9% |
| $75,000 to $99,999 | 403 | 17.0% |
| $100,000 to $149,999 | 398 | 16.8% |
| $150,000 to $199,999 | 130 | 5.5% |
| $200,000+ | 71 | 3.0% |
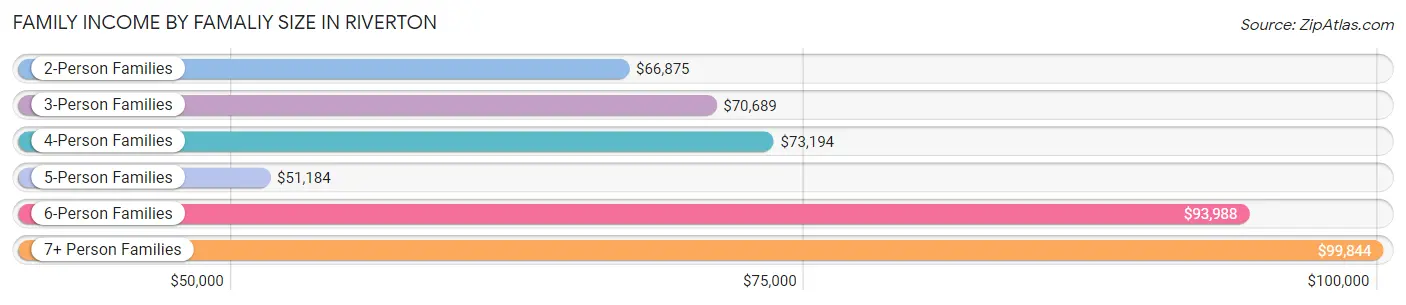
Family Income by Famaliy Size in Riverton
7+ person families (40 | 1.7%) account for the highest median family income in Riverton with $99,844 per family, while 2-person families (1,242 | 52.4%) have the highest median income of $33,438 per family member.
| Income Bracket | # Families | Median Income |
| 2-Person Families | 1,242 (52.4%) | $66,875 |
| 3-Person Families | 431 (18.2%) | $70,689 |
| 4-Person Families | 407 (17.2%) | $73,194 |
| 5-Person Families | 204 (8.6%) | $51,184 |
| 6-Person Families | 45 (1.9%) | $93,988 |
| 7+ Person Families | 40 (1.7%) | $99,844 |
| Total | 2,369 (100.0%) | $70,804 |
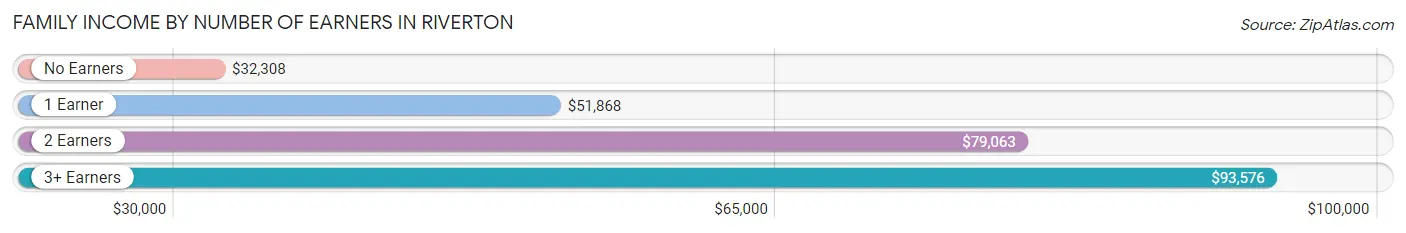
Family Income by Number of Earners in Riverton
The median family income in Riverton is $70,804, with families comprising 3+ earners (279) having the highest median family income of $93,576, while families with no earners (340) have the lowest median family income of $32,308, accounting for 11.8% and 14.3% of families, respectively.
| Number of Earners | # Families | Median Income |
| No Earners | 340 (14.3%) | $32,308 |
| 1 Earner | 803 (33.9%) | $51,868 |
| 2 Earners | 947 (40.0%) | $79,063 |
| 3+ Earners | 279 (11.8%) | $93,576 |
| Total | 2,369 (100.0%) | $70,804 |
Household Income in Riverton
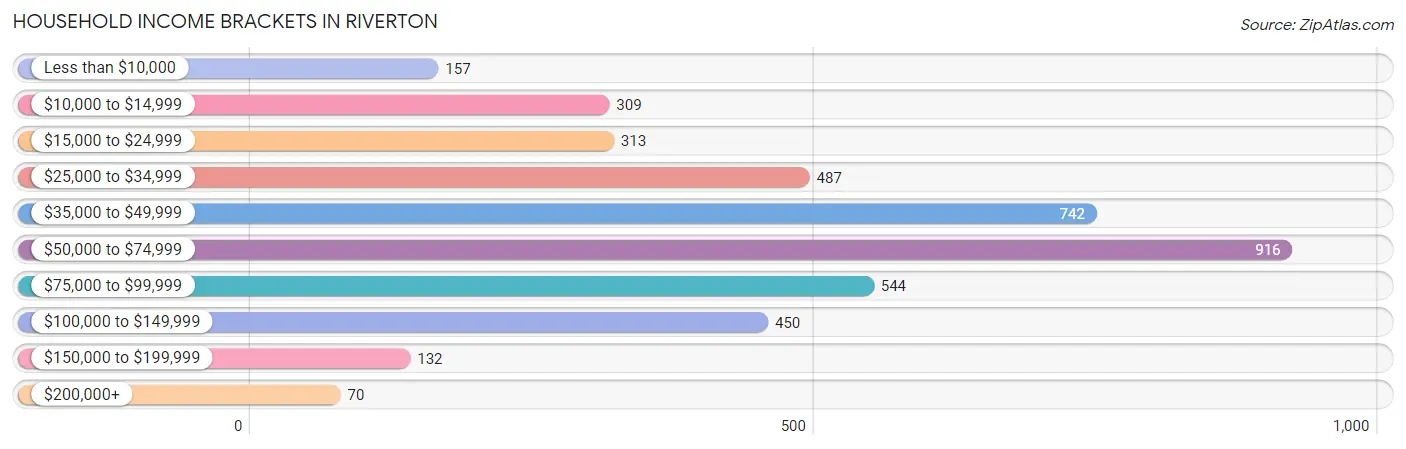
Household Income Brackets in Riverton
With 916 households falling in the category, the $50,000 to $74,999 income range is the most frequent in Riverton, accounting for 22.2% of all households. In contrast, only 70 households (1.7%) fall into the $200,000+ income bracket, making it the least populous group.
| Income Bracket | # Households | % Households |
| Less than $10,000 | 157 | 3.8% |
| $10,000 to $14,999 | 309 | 7.5% |
| $15,000 to $24,999 | 313 | 7.6% |
| $25,000 to $34,999 | 487 | 11.8% |
| $35,000 to $49,999 | 742 | 18.0% |
| $50,000 to $74,999 | 916 | 22.2% |
| $75,000 to $99,999 | 544 | 13.2% |
| $100,000 to $149,999 | 450 | 10.9% |
| $150,000 to $199,999 | 132 | 3.2% |
| $200,000+ | 70 | 1.7% |
Household Income by Householder Age in Riverton
The median household income in Riverton is $50,861, with the highest median household income of $59,817 found in the 25 to 44 years age bracket for the primary householder. A total of 1,300 households (31.5%) fall into this category. Meanwhile, the 15 to 24 years age bracket for the primary householder has the lowest median household income of $31,607, with 263 households (6.4%) in this group.
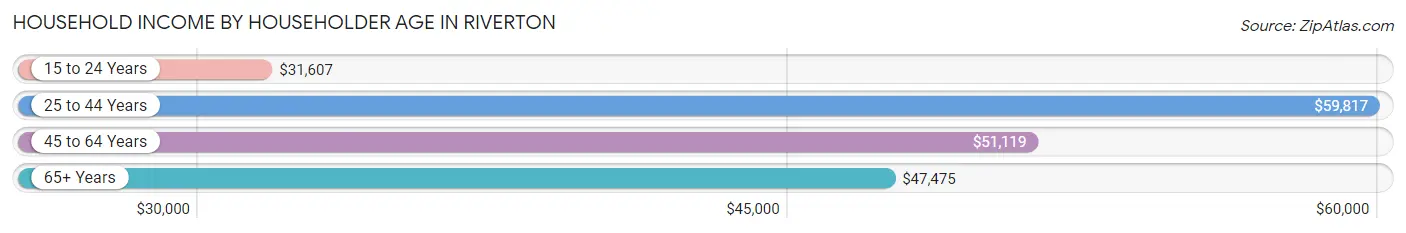
| Income Bracket | # Households | Median Income |
| 15 to 24 Years | 263 (6.4%) | $31,607 |
| 25 to 44 Years | 1,300 (31.5%) | $59,817 |
| 45 to 64 Years | 1,568 (38.0%) | $51,119 |
| 65+ Years | 993 (24.1%) | $47,475 |
| Total | 4,124 (100.0%) | $50,861 |
Poverty in Riverton
Income Below Poverty by Sex and Age in Riverton
With 12.2% poverty level for males and 16.5% for females among the residents of Riverton, 5 year old males and 5 year old females are the most vulnerable to poverty, with 32 males (64.0%) and 21 females (100.0%) in their respective age groups living below the poverty level.
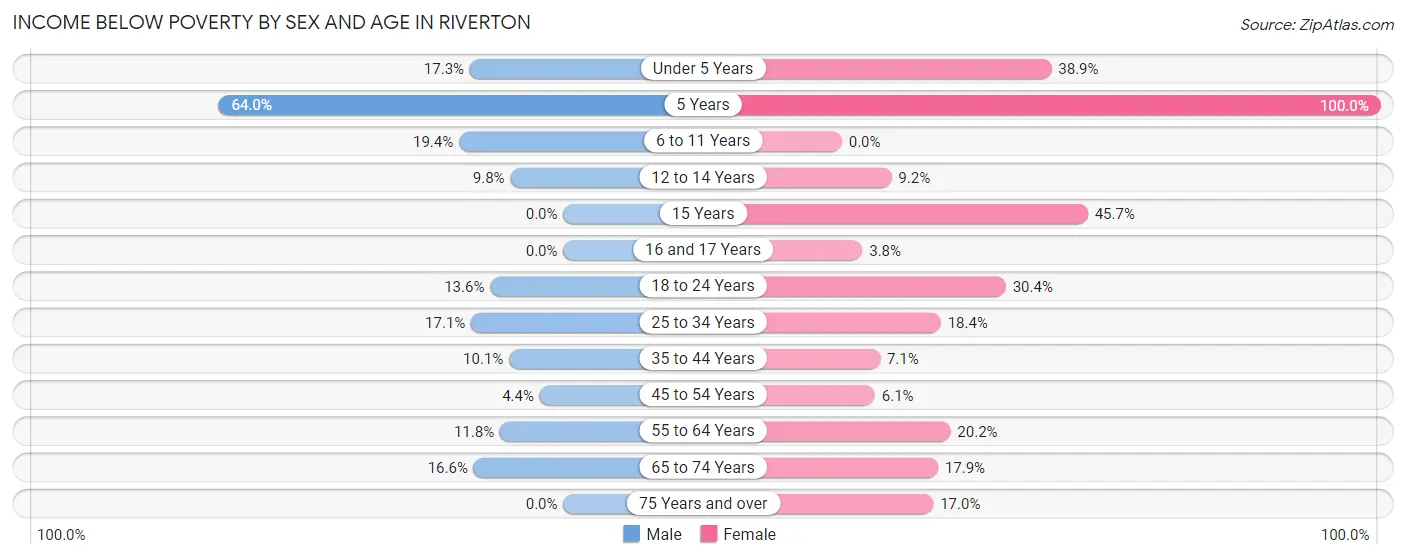
| Age Bracket | Male | Female |
| Under 5 Years | 47 (17.3%) | 149 (38.9%) |
| 5 Years | 32 (64.0%) | 21 (100.0%) |
| 6 to 11 Years | 97 (19.4%) | 0 (0.0%) |
| 12 to 14 Years | 16 (9.8%) | 34 (9.2%) |
| 15 Years | 0 (0.0%) | 42 (45.7%) |
| 16 and 17 Years | 0 (0.0%) | 3 (3.8%) |
| 18 to 24 Years | 81 (13.6%) | 150 (30.4%) |
| 25 to 34 Years | 90 (17.1%) | 125 (18.4%) |
| 35 to 44 Years | 64 (10.1%) | 46 (7.1%) |
| 45 to 54 Years | 28 (4.4%) | 40 (6.1%) |
| 55 to 64 Years | 68 (11.8%) | 126 (20.2%) |
| 65 to 74 Years | 74 (16.6%) | 73 (17.8%) |
| 75 Years and over | 0 (0.0%) | 74 (17.0%) |
| Total | 597 (12.2%) | 883 (16.5%) |
Income Above Poverty by Sex and Age in Riverton
According to the poverty statistics in Riverton, males aged 15 years and females aged 6 to 11 years are the age groups that are most secure financially, with 100.0% of males and 100.0% of females in these age groups living above the poverty line.
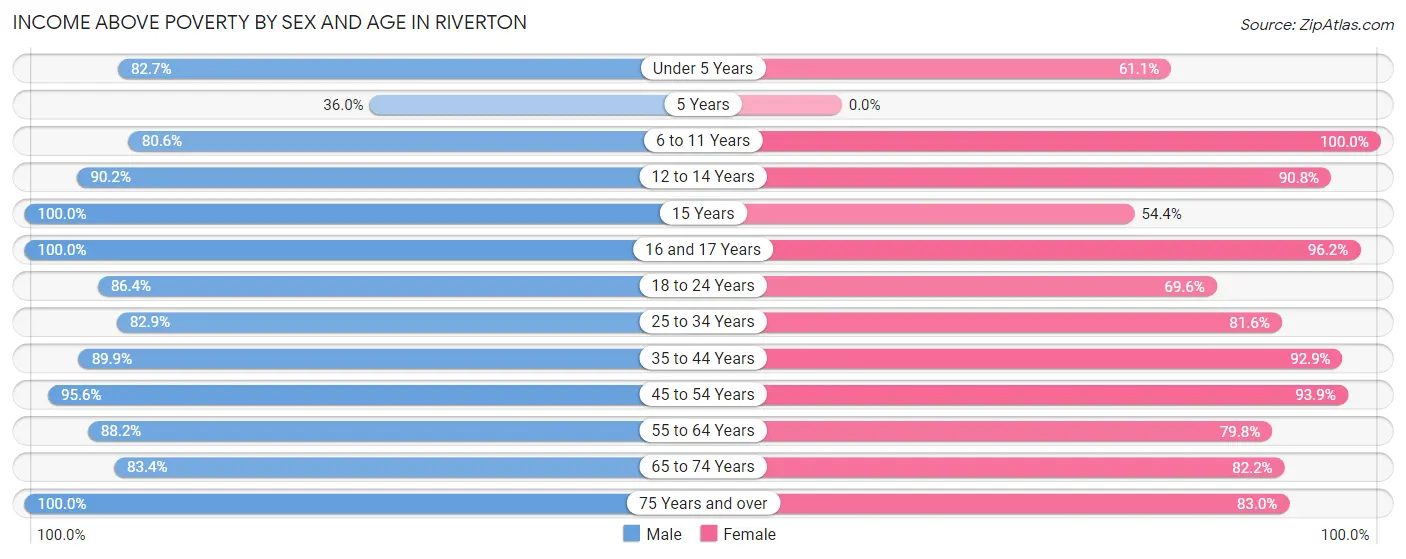
| Age Bracket | Male | Female |
| Under 5 Years | 224 (82.7%) | 234 (61.1%) |
| 5 Years | 18 (36.0%) | 0 (0.0%) |
| 6 to 11 Years | 404 (80.6%) | 448 (100.0%) |
| 12 to 14 Years | 147 (90.2%) | 335 (90.8%) |
| 15 Years | 12 (100.0%) | 50 (54.3%) |
| 16 and 17 Years | 202 (100.0%) | 76 (96.2%) |
| 18 to 24 Years | 516 (86.4%) | 343 (69.6%) |
| 25 to 34 Years | 436 (82.9%) | 556 (81.6%) |
| 35 to 44 Years | 572 (89.9%) | 604 (92.9%) |
| 45 to 54 Years | 613 (95.6%) | 611 (93.9%) |
| 55 to 64 Years | 510 (88.2%) | 499 (79.8%) |
| 65 to 74 Years | 371 (83.4%) | 336 (82.2%) |
| 75 Years and over | 265 (100.0%) | 362 (83.0%) |
| Total | 4,290 (87.8%) | 4,454 (83.5%) |
Income Below Poverty Among Married-Couple Families in Riverton
The poverty statistics for married-couple families in Riverton show that 1.4% or 23 of the total 1,638 families live below the poverty line. Families with 3 or 4 children have the highest poverty rate of 8.5%, comprising of 12 families. On the other hand, families with 1 or 2 children have the lowest poverty rate of 0.0%, which includes 0 families.
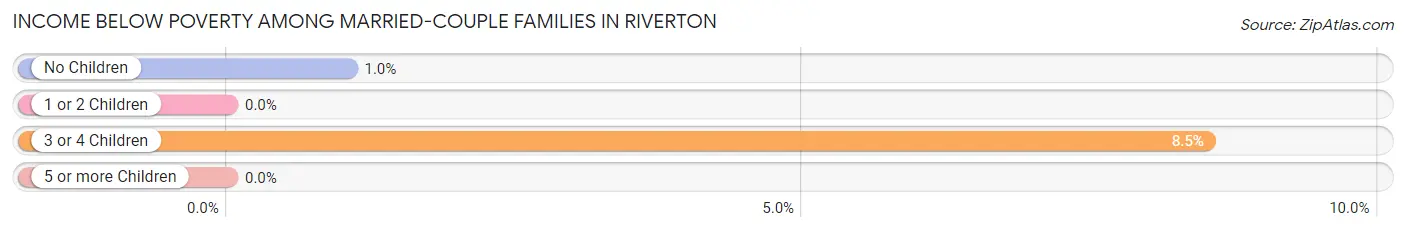
| Children | Above Poverty | Below Poverty |
| No Children | 1,051 (99.0%) | 11 (1.0%) |
| 1 or 2 Children | 411 (100.0%) | 0 (0.0%) |
| 3 or 4 Children | 129 (91.5%) | 12 (8.5%) |
| 5 or more Children | 24 (100.0%) | 0 (0.0%) |
| Total | 1,615 (98.6%) | 23 (1.4%) |
Income Below Poverty Among Single-Parent Households in Riverton
According to the poverty data in Riverton, 24.7% or 66 single-father households and 25.0% or 116 single-mother households are living below the poverty line. Among single-father households, those with 3 or 4 children have the highest poverty rate, with 25 households (100.0%) experiencing poverty. Likewise, among single-mother households, those with 5 or more children have the highest poverty rate, with 5 households (100.0%) falling below the poverty line.
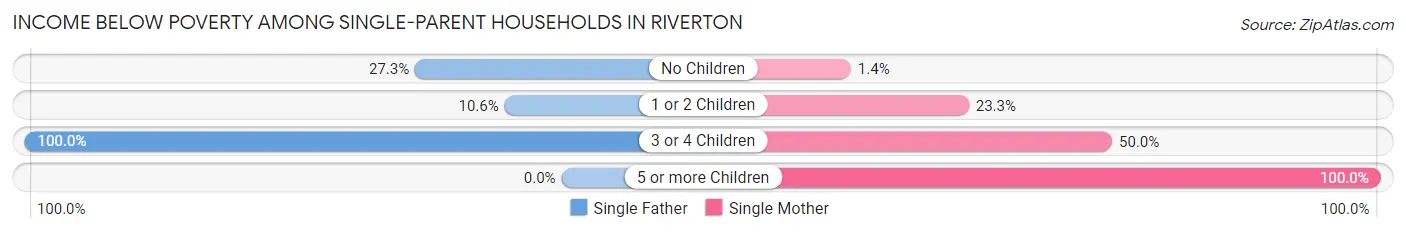
| Children | Single Father | Single Mother |
| No Children | 27 (27.3%) | 1 (1.3%) |
| 1 or 2 Children | 14 (10.6%) | 72 (23.3%) |
| 3 or 4 Children | 25 (100.0%) | 38 (50.0%) |
| 5 or more Children | 0 (0.0%) | 5 (100.0%) |
| Total | 66 (24.7%) | 116 (25.0%) |
Income Below Poverty Among Married-Couple vs Single-Parent Households in Riverton
The poverty data for Riverton shows that 23 of the married-couple family households (1.4%) and 182 of the single-parent households (24.9%) are living below the poverty level. Within the married-couple family households, those with 3 or 4 children have the highest poverty rate, with 12 households (8.5%) falling below the poverty line. Among the single-parent households, those with 3 or 4 children have the highest poverty rate, with 63 household (62.4%) living below poverty.
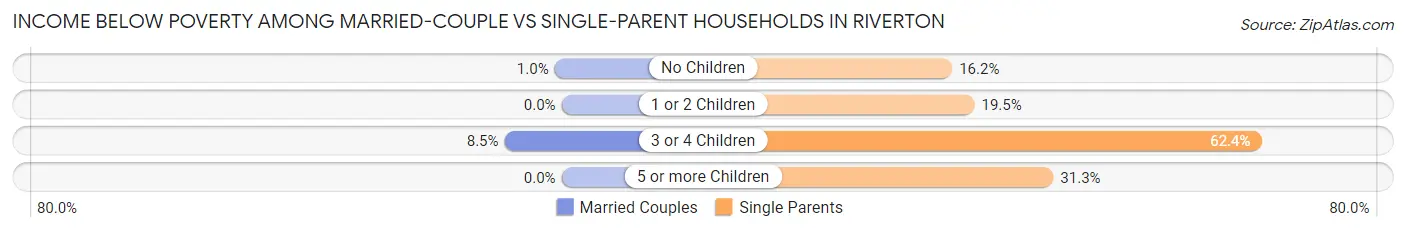
| Children | Married-Couple Families | Single-Parent Households |
| No Children | 11 (1.0%) | 28 (16.2%) |
| 1 or 2 Children | 0 (0.0%) | 86 (19.5%) |
| 3 or 4 Children | 12 (8.5%) | 63 (62.4%) |
| 5 or more Children | 0 (0.0%) | 5 (31.2%) |
| Total | 23 (1.4%) | 182 (24.9%) |
Race in Riverton
The most populous races in Riverton are White / Caucasian (8,269 | 77.0%), Hispanic or Latino (1,422 | 13.3%), and Native / Alaskan (1,066 | 9.9%).
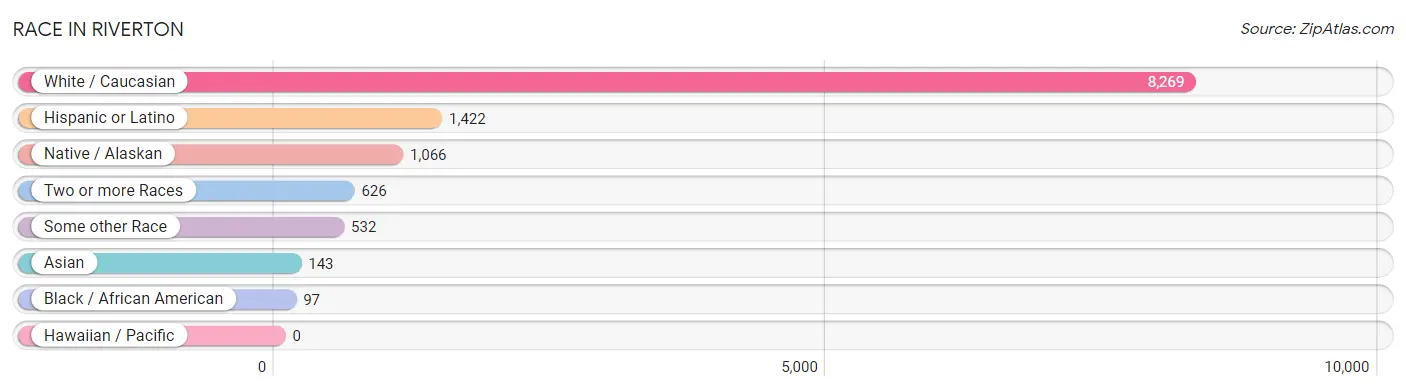
| Race | # Population | % Population |
| Asian | 143 | 1.3% |
| Black / African American | 97 | 0.9% |
| Hawaiian / Pacific | 0 | 0.0% |
| Hispanic or Latino | 1,422 | 13.3% |
| Native / Alaskan | 1,066 | 9.9% |
| White / Caucasian | 8,269 | 77.0% |
| Two or more Races | 626 | 5.8% |
| Some other Race | 532 | 5.0% |
| Total | 10,733 | 100.0% |
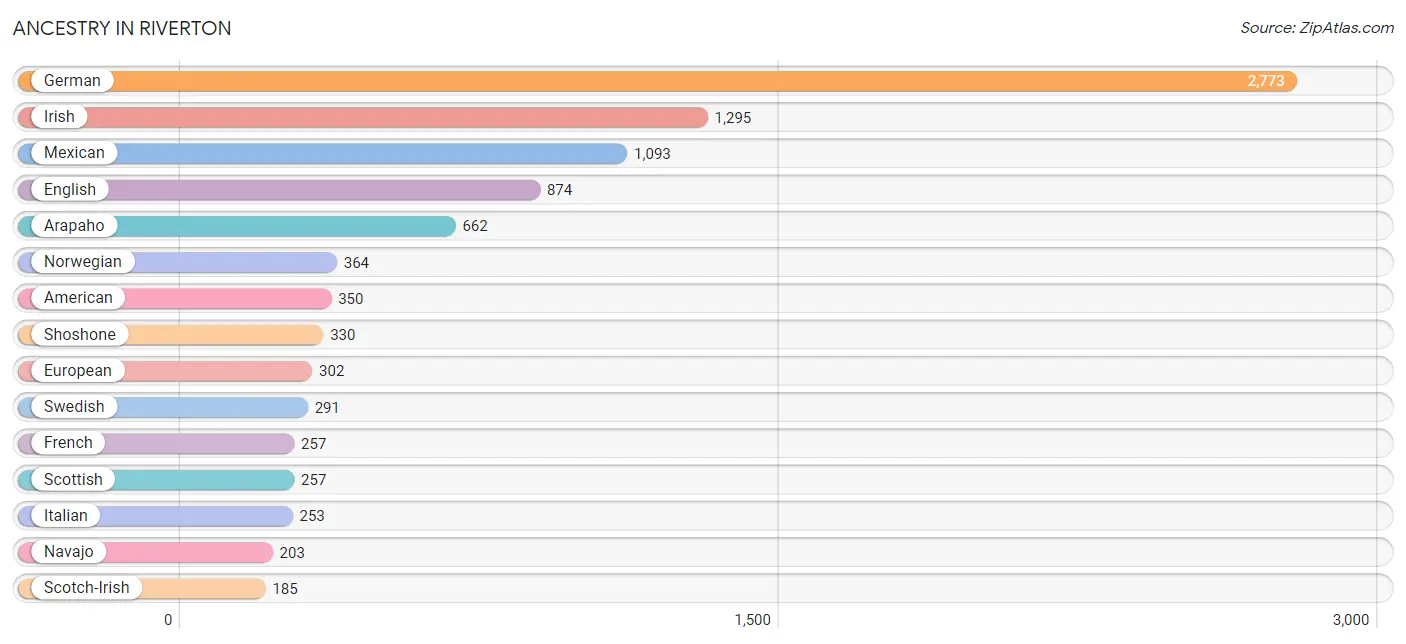
Ancestry in Riverton
The most populous ancestries reported in Riverton are German (2,773 | 25.8%), Irish (1,295 | 12.1%), Mexican (1,093 | 10.2%), English (874 | 8.1%), and Arapaho (662 | 6.2%), together accounting for 62.4% of all Riverton residents.
| Ancestry | # Population | % Population |
| American | 350 | 3.3% |
| Apache | 39 | 0.4% |
| Arapaho | 662 | 6.2% |
| Austrian | 8 | 0.1% |
| Bhutanese | 5 | 0.1% |
| British | 55 | 0.5% |
| Cajun | 9 | 0.1% |
| Central American | 24 | 0.2% |
| Cherokee | 57 | 0.5% |
| Cheyenne | 59 | 0.5% |
| Chippewa | 61 | 0.6% |
| Choctaw | 13 | 0.1% |
| Croatian | 10 | 0.1% |
| Crow | 1 | 0.0% |
| Cuban | 18 | 0.2% |
| Czech | 90 | 0.8% |
| Czechoslovakian | 20 | 0.2% |
| Danish | 66 | 0.6% |
| Dutch | 114 | 1.1% |
| Eastern European | 19 | 0.2% |
| English | 874 | 8.1% |
| European | 302 | 2.8% |
| Finnish | 11 | 0.1% |
| French | 257 | 2.4% |
| French American Indian | 15 | 0.1% |
| French Canadian | 54 | 0.5% |
| German | 2,773 | 25.8% |
| Greek | 15 | 0.1% |
| Irish | 1,295 | 12.1% |
| Italian | 253 | 2.4% |
| Jamaican | 10 | 0.1% |
| Korean | 162 | 1.5% |
| Mexican | 1,093 | 10.2% |
| Mexican American Indian | 15 | 0.1% |
| Native Hawaiian | 3 | 0.0% |
| Navajo | 203 | 1.9% |
| Norwegian | 364 | 3.4% |
| Osage | 1 | 0.0% |
| Pennsylvania German | 3 | 0.0% |
| Polish | 14 | 0.1% |
| Portuguese | 43 | 0.4% |
| Russian | 93 | 0.9% |
| Salvadoran | 24 | 0.2% |
| Samoan | 24 | 0.2% |
| Scandinavian | 29 | 0.3% |
| Scotch-Irish | 185 | 1.7% |
| Scottish | 257 | 2.4% |
| Shoshone | 330 | 3.1% |
| Sioux | 52 | 0.5% |
| Slavic | 22 | 0.2% |
| Slovak | 8 | 0.1% |
| South American | 11 | 0.1% |
| Spaniard | 31 | 0.3% |
| Spanish | 148 | 1.4% |
| Sri Lankan | 18 | 0.2% |
| Swedish | 291 | 2.7% |
| Swiss | 33 | 0.3% |
| Tohono O'Odham | 12 | 0.1% |
| Ukrainian | 5 | 0.1% |
| Venezuelan | 11 | 0.1% |
| Welsh | 30 | 0.3% |
| West Indian | 1 | 0.0% |
| Yuman | 15 | 0.1% | View All 63 Rows |
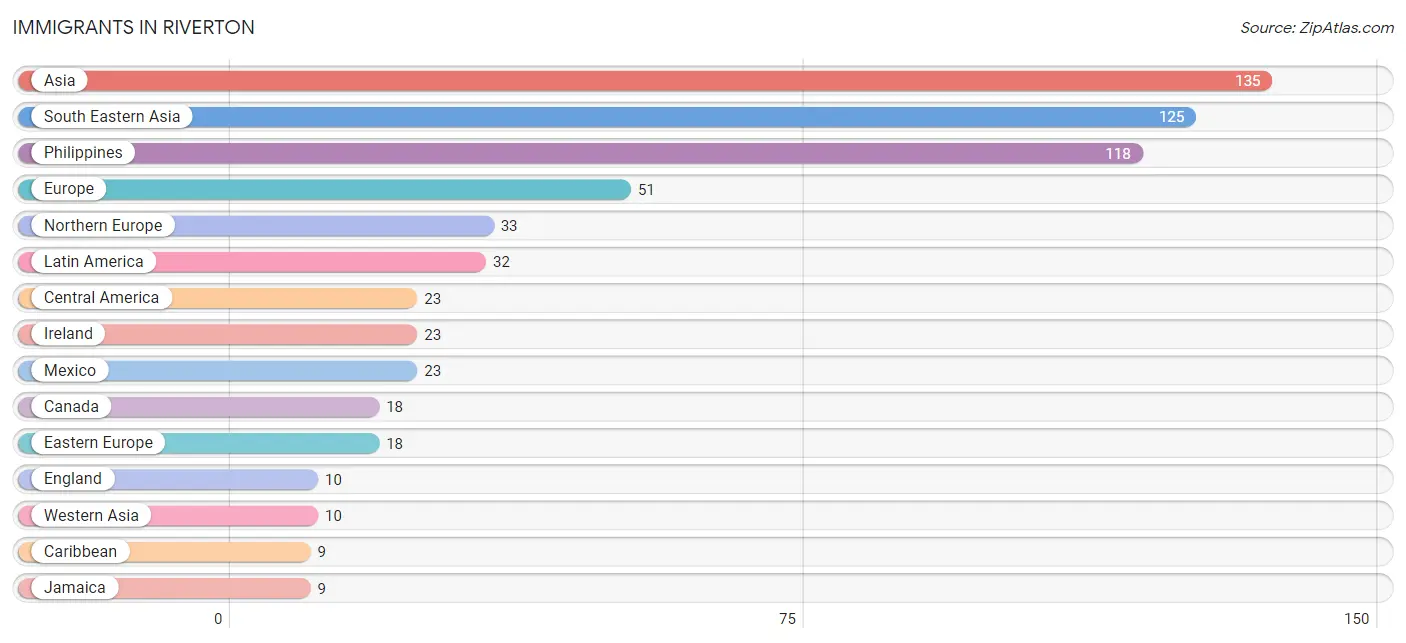
Immigrants in Riverton
The most numerous immigrant groups reported in Riverton came from Asia (135 | 1.3%), South Eastern Asia (125 | 1.2%), Philippines (118 | 1.1%), Europe (51 | 0.5%), and Northern Europe (33 | 0.3%), together accounting for 4.3% of all Riverton residents.
| Immigration Origin | # Population | % Population |
| Asia | 135 | 1.3% |
| Canada | 18 | 0.2% |
| Caribbean | 9 | 0.1% |
| Central America | 23 | 0.2% |
| Eastern Europe | 18 | 0.2% |
| England | 10 | 0.1% |
| Europe | 51 | 0.5% |
| Ireland | 23 | 0.2% |
| Jamaica | 9 | 0.1% |
| Latin America | 32 | 0.3% |
| Mexico | 23 | 0.2% |
| Northern Europe | 33 | 0.3% |
| Philippines | 118 | 1.1% |
| Russia | 1 | 0.0% |
| South Eastern Asia | 125 | 1.2% |
| Vietnam | 7 | 0.1% |
| Western Asia | 10 | 0.1% | View All 17 Rows |
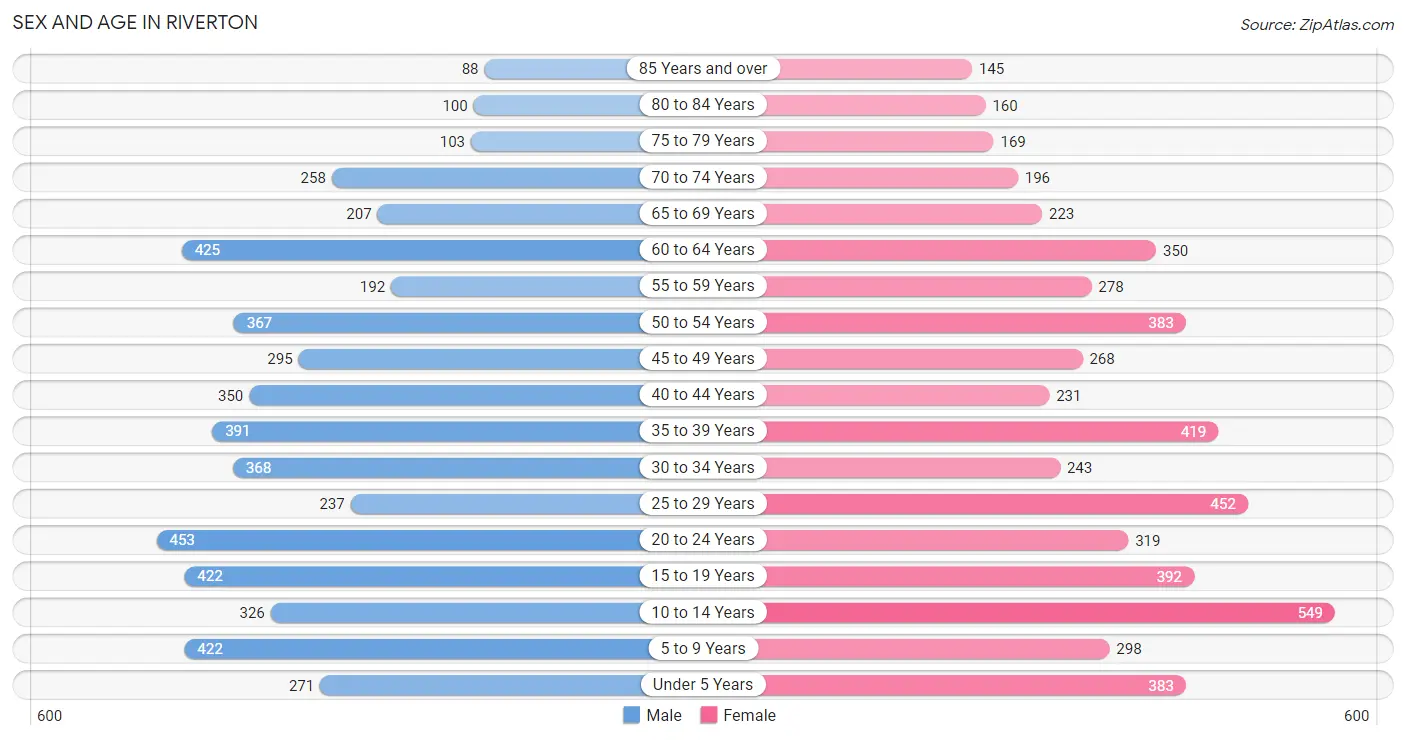
Sex and Age in Riverton
Sex and Age in Riverton
The most populous age groups in Riverton are 20 to 24 Years (453 | 8.6%) for men and 10 to 14 Years (549 | 10.1%) for women.
| Age Bracket | Male | Female |
| Under 5 Years | 271 (5.1%) | 383 (7.0%) |
| 5 to 9 Years | 422 (8.0%) | 298 (5.5%) |
| 10 to 14 Years | 326 (6.2%) | 549 (10.1%) |
| 15 to 19 Years | 422 (8.0%) | 392 (7.2%) |
| 20 to 24 Years | 453 (8.6%) | 319 (5.8%) |
| 25 to 29 Years | 237 (4.5%) | 452 (8.3%) |
| 30 to 34 Years | 368 (7.0%) | 243 (4.4%) |
| 35 to 39 Years | 391 (7.4%) | 419 (7.7%) |
| 40 to 44 Years | 350 (6.6%) | 231 (4.2%) |
| 45 to 49 Years | 295 (5.6%) | 268 (4.9%) |
| 50 to 54 Years | 367 (7.0%) | 383 (7.0%) |
| 55 to 59 Years | 192 (3.6%) | 278 (5.1%) |
| 60 to 64 Years | 425 (8.1%) | 350 (6.4%) |
| 65 to 69 Years | 207 (3.9%) | 223 (4.1%) |
| 70 to 74 Years | 258 (4.9%) | 196 (3.6%) |
| 75 to 79 Years | 103 (1.9%) | 169 (3.1%) |
| 80 to 84 Years | 100 (1.9%) | 160 (2.9%) |
| 85 Years and over | 88 (1.7%) | 145 (2.7%) |
| Total | 5,275 (100.0%) | 5,458 (100.0%) |
Families and Households in Riverton
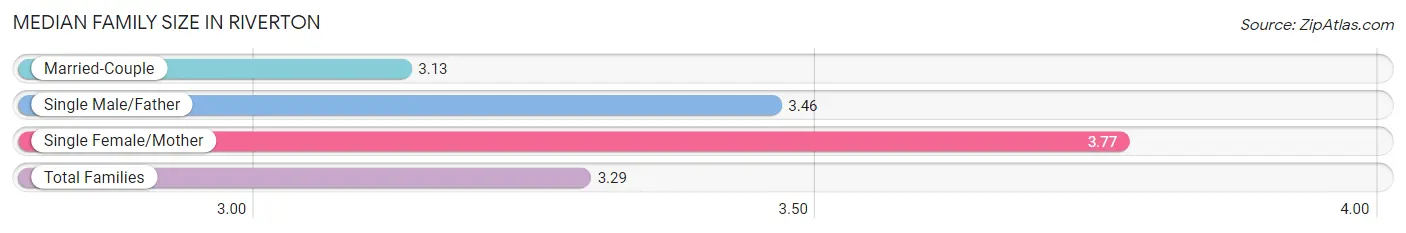
Median Family Size in Riverton
The median family size in Riverton is 3.29 persons per family, with single female/mother families (464 | 19.6%) accounting for the largest median family size of 3.77 persons per family. On the other hand, married-couple families (1,638 | 69.1%) represent the smallest median family size with 3.13 persons per family.
| Family Type | # Families | Family Size |
| Married-Couple | 1,638 (69.1%) | 3.13 |
| Single Male/Father | 267 (11.3%) | 3.46 |
| Single Female/Mother | 464 (19.6%) | 3.77 |
| Total Families | 2,369 (100.0%) | 3.29 |
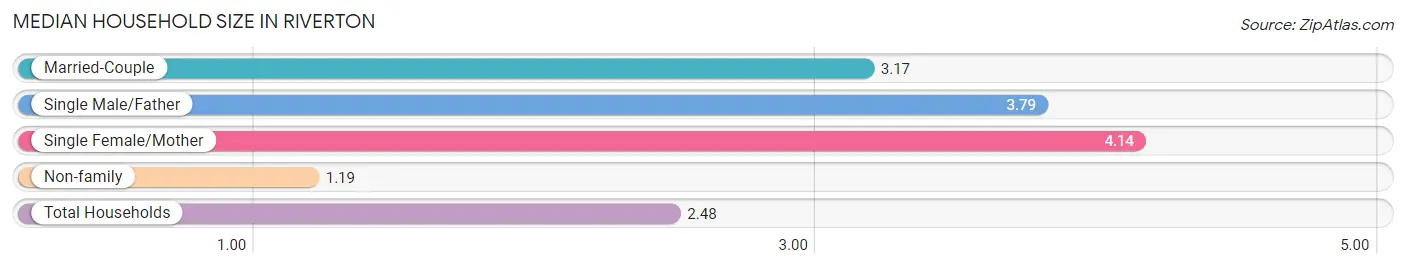
Median Household Size in Riverton
The median household size in Riverton is 2.48 persons per household, with single female/mother households (464 | 11.3%) accounting for the largest median household size of 4.14 persons per household. non-family households (1,755 | 42.6%) represent the smallest median household size with 1.19 persons per household.
| Household Type | # Households | Household Size |
| Married-Couple | 1,638 (39.7%) | 3.17 |
| Single Male/Father | 267 (6.5%) | 3.79 |
| Single Female/Mother | 464 (11.3%) | 4.14 |
| Non-family | 1,755 (42.6%) | 1.19 |
| Total Households | 4,124 (100.0%) | 2.48 |
Household Size by Marriage Status in Riverton
Out of a total of 4,124 households in Riverton, 2,369 (57.4%) are family households, while 1,755 (42.6%) are nonfamily households. The most numerous type of family households are 2-person households, comprising 1,140, and the most common type of nonfamily households are 1-person households, comprising 1,548.
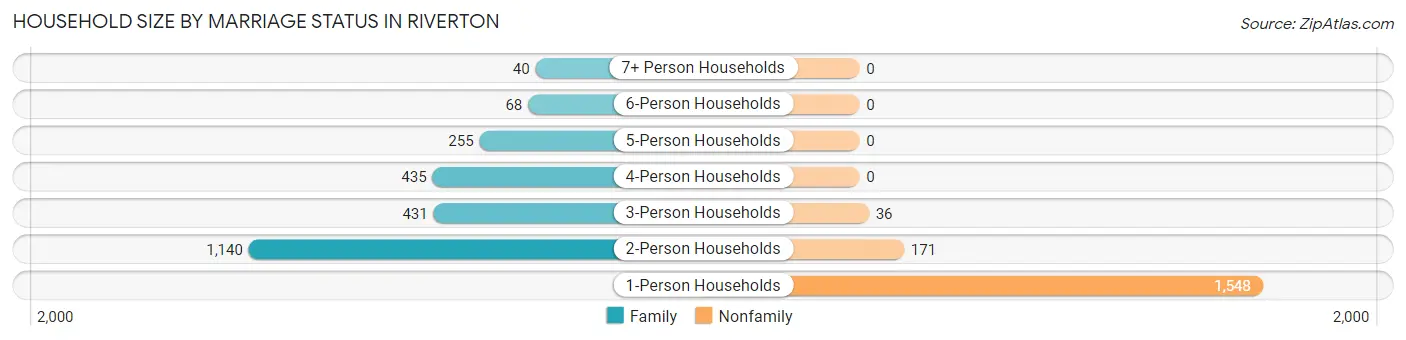
| Household Size | Family Households | Nonfamily Households |
| 1-Person Households | - | 1,548 (37.5%) |
| 2-Person Households | 1,140 (27.6%) | 171 (4.2%) |
| 3-Person Households | 431 (10.4%) | 36 (0.9%) |
| 4-Person Households | 435 (10.5%) | 0 (0.0%) |
| 5-Person Households | 255 (6.2%) | 0 (0.0%) |
| 6-Person Households | 68 (1.7%) | 0 (0.0%) |
| 7+ Person Households | 40 (1.0%) | 0 (0.0%) |
| Total | 2,369 (57.4%) | 1,755 (42.6%) |
Female Fertility in Riverton
Fertility by Age in Riverton
Average fertility rate in Riverton is 48.0 births per 1,000 women. Women in the age bracket of 20 to 34 years have the highest fertility rate with 106.0 births per 1,000 women. Women in the age bracket of 20 to 34 years acount for 92.2% of all women with births.
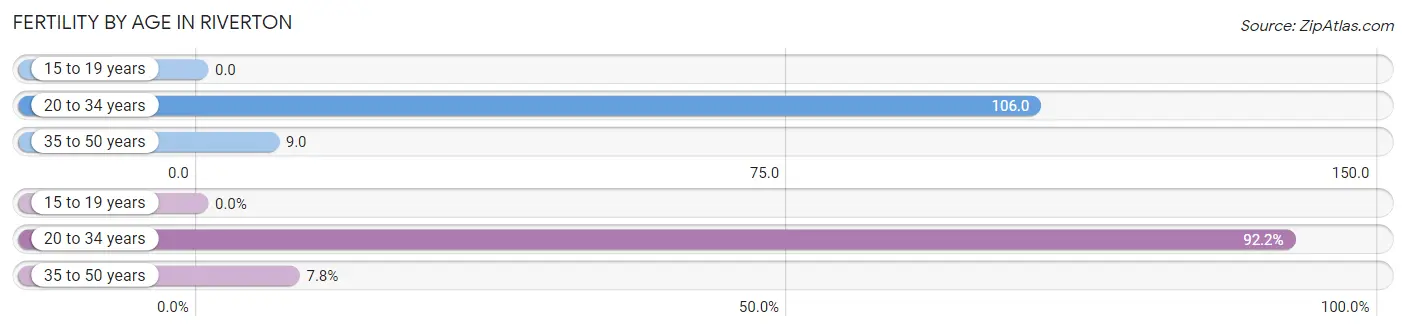
| Age Bracket | Women with Births | Births / 1,000 Women |
| 15 to 19 years | 0 (0.0%) | 0.0 |
| 20 to 34 years | 107 (92.2%) | 106.0 |
| 35 to 50 years | 9 (7.8%) | 9.0 |
| Total | 116 (100.0%) | 48.0 |
Fertility by Age by Marriage Status in Riverton
52.6% of women with births (116) in Riverton are married. The highest percentage of unmarried women with births falls into 20 to 34 years age bracket with 51.4% of them unmarried at the time of birth, while the lowest percentage of unmarried women with births belong to 35 to 50 years age bracket with 0.0% of them unmarried.
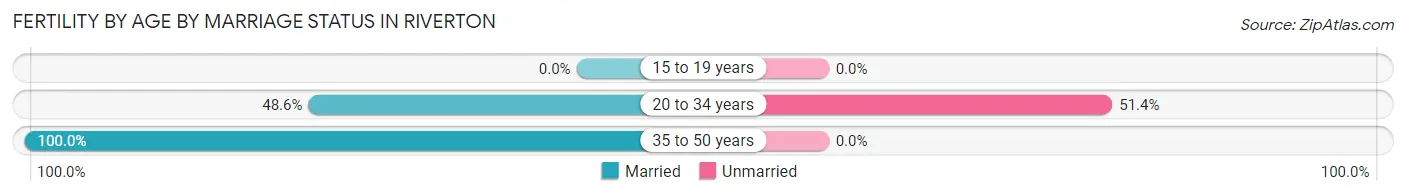
| Age Bracket | Married | Unmarried |
| 15 to 19 years | 0 (0.0%) | 0 (0.0%) |
| 20 to 34 years | 52 (48.6%) | 55 (51.4%) |
| 35 to 50 years | 9 (100.0%) | 0 (0.0%) |
| Total | 61 (52.6%) | 55 (47.4%) |
Fertility by Education in Riverton
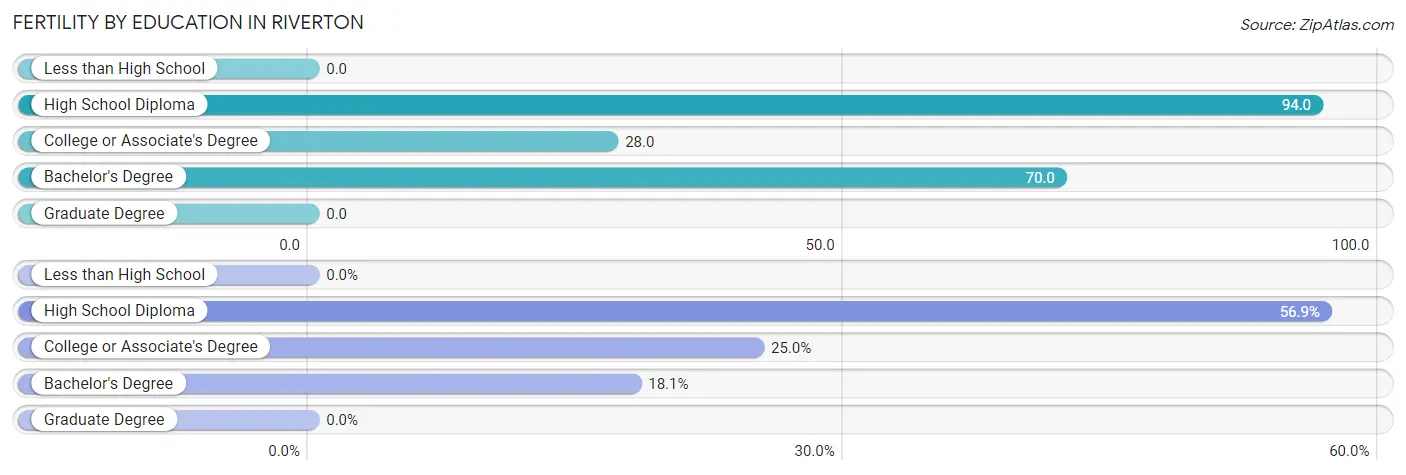
| Educational Attainment | Women with Births | Births / 1,000 Women |
| Less than High School | 0 (0.0%) | 0.0 |
| High School Diploma | 66 (56.9%) | 94.0 |
| College or Associate's Degree | 29 (25.0%) | 28.0 |
| Bachelor's Degree | 21 (18.1%) | 70.0 |
| Graduate Degree | 0 (0.0%) | 0.0 |
| Total | 116 (100.0%) | 48.0 |
Fertility by Education by Marriage Status in Riverton
47.4% of women with births in Riverton are unmarried. Women with the educational attainment of high school diploma are most likely to be married with 71.2% of them married at childbirth, while women with the educational attainment of bachelor's degree are least likely to be married with 100.0% of them unmarried at childbirth.
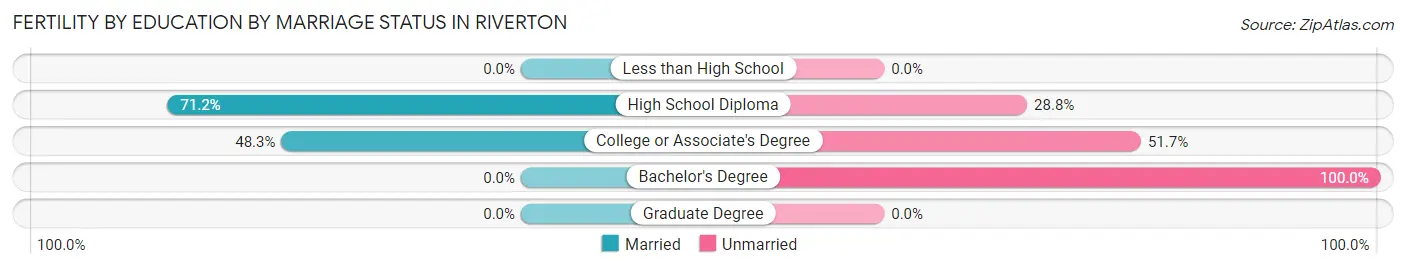
| Educational Attainment | Married | Unmarried |
| Less than High School | 0 (0.0%) | 0 (0.0%) |
| High School Diploma | 47 (71.2%) | 19 (28.8%) |
| College or Associate's Degree | 14 (48.3%) | 15 (51.7%) |
| Bachelor's Degree | 0 (0.0%) | 21 (100.0%) |
| Graduate Degree | 0 (0.0%) | 0 (0.0%) |
| Total | 61 (52.6%) | 55 (47.4%) |
Employment Characteristics in Riverton
Employment by Class of Employer in Riverton
Among the 4,871 employed individuals in Riverton, private company employees (2,804 | 57.6%), local government employees (513 | 10.5%), and self-employed (not incorporated) (446 | 9.2%) make up the most common classes of employment.
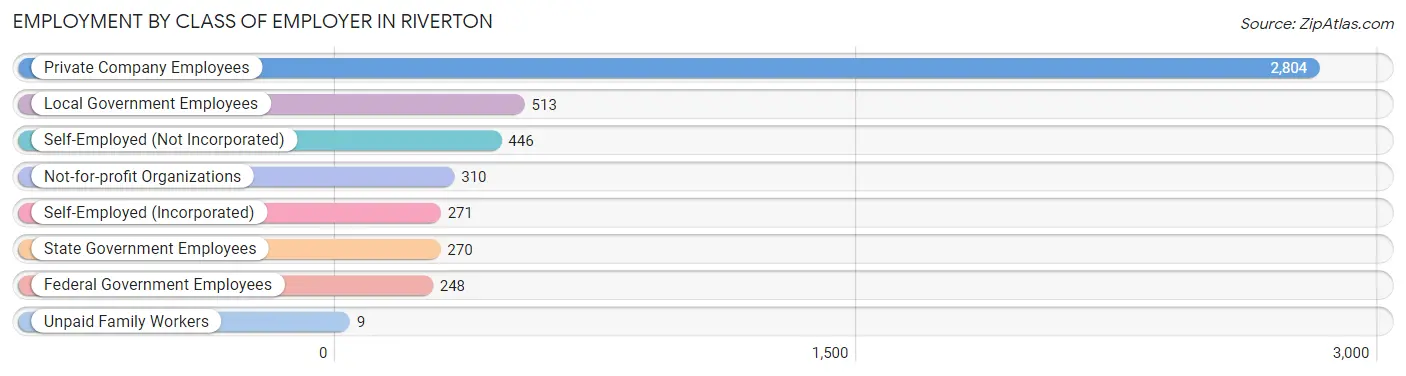
| Employer Class | # Employees | % Employees |
| Private Company Employees | 2,804 | 57.6% |
| Self-Employed (Incorporated) | 271 | 5.6% |
| Self-Employed (Not Incorporated) | 446 | 9.2% |
| Not-for-profit Organizations | 310 | 6.4% |
| Local Government Employees | 513 | 10.5% |
| State Government Employees | 270 | 5.5% |
| Federal Government Employees | 248 | 5.1% |
| Unpaid Family Workers | 9 | 0.2% |
| Total | 4,871 | 100.0% |
Employment Status by Age in Riverton
According to the labor force statistics for Riverton, out of the total population over 16 years of age (8,380), 65.0% or 5,447 individuals are in the labor force, with 7.1% or 387 of them unemployed. The age group with the highest labor force participation rate is 20 to 24 years, with 89.2% or 689 individuals in the labor force. Within the labor force, the 16 to 19 years age range has the highest percentage of unemployed individuals, with 23.5% or 110 of them being unemployed.
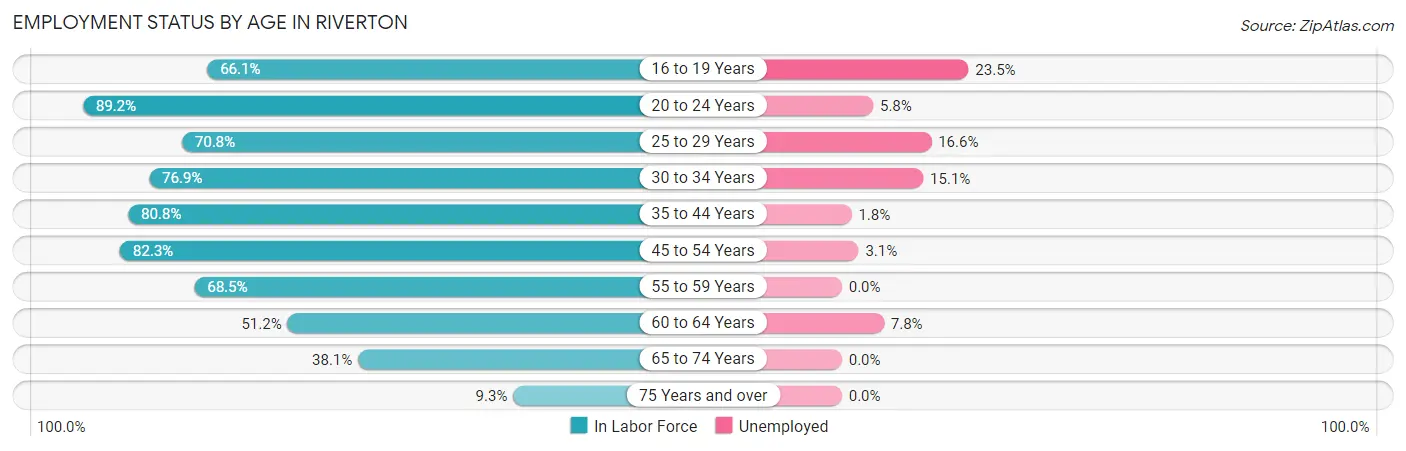
| Age Bracket | In Labor Force | Unemployed |
| 16 to 19 Years | 469 (66.1%) | 110 (23.5%) |
| 20 to 24 Years | 689 (89.2%) | 40 (5.8%) |
| 25 to 29 Years | 488 (70.8%) | 81 (16.6%) |
| 30 to 34 Years | 470 (76.9%) | 71 (15.1%) |
| 35 to 44 Years | 1,124 (80.8%) | 20 (1.8%) |
| 45 to 54 Years | 1,081 (82.3%) | 34 (3.1%) |
| 55 to 59 Years | 322 (68.5%) | 0 (0.0%) |
| 60 to 64 Years | 397 (51.2%) | 31 (7.8%) |
| 65 to 74 Years | 337 (38.1%) | 0 (0.0%) |
| 75 Years and over | 71 (9.3%) | 0 (0.0%) |
| Total | 5,447 (65.0%) | 387 (7.1%) |
Employment Status by Educational Attainment in Riverton
According to labor force statistics for Riverton, 74.0% of individuals (3,884) out of the total population between 25 and 64 years of age (5,249) are in the labor force, with 6.1% or 237 of them being unemployed. The group with the highest labor force participation rate are those with the educational attainment of college / associate degree, with 78.1% or 1,751 individuals in the labor force. Within the labor force, individuals with less than high school education have the highest percentage of unemployment, with 8.2% or 18 of them being unemployed.
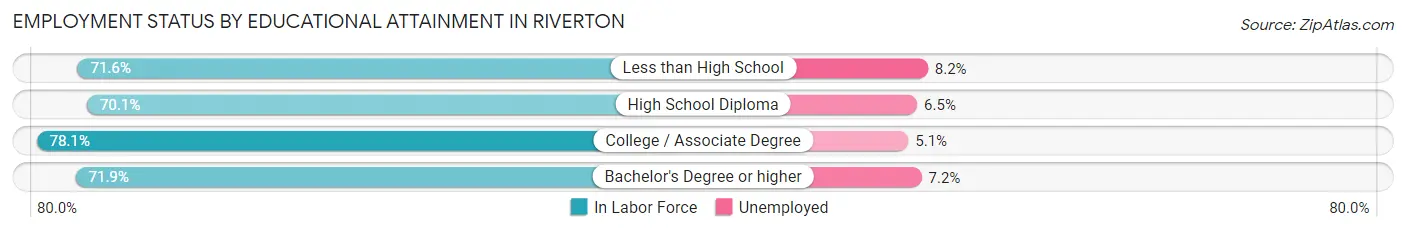
| Educational Attainment | In Labor Force | Unemployed |
| Less than High School | 219 (71.6%) | 25 (8.2%) |
| High School Diploma | 1,220 (70.1%) | 113 (6.5%) |
| College / Associate Degree | 1,751 (78.1%) | 114 (5.1%) |
| Bachelor's Degree or higher | 691 (71.9%) | 69 (7.2%) |
| Total | 3,884 (74.0%) | 320 (6.1%) |
Employment Occupations by Sex in Riverton
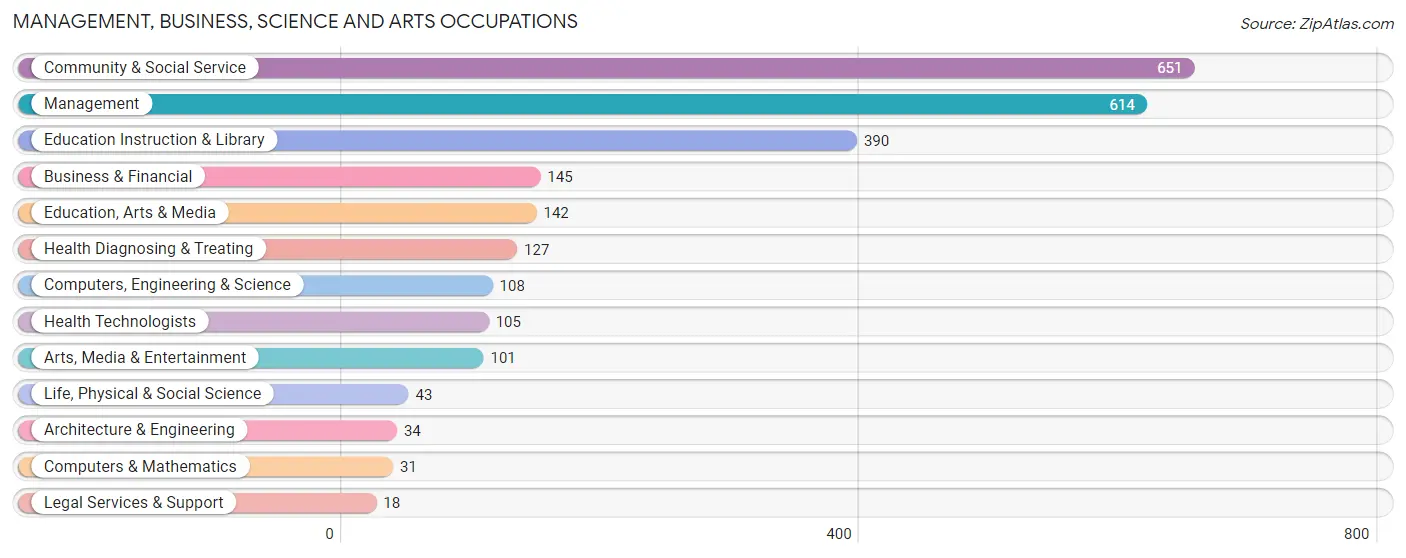
Management, Business, Science and Arts Occupations
The most common Management, Business, Science and Arts occupations in Riverton are Community & Social Service (651 | 12.9%), Management (614 | 12.1%), Education Instruction & Library (390 | 7.7%), Business & Financial (145 | 2.9%), and Education, Arts & Media (142 | 2.8%).
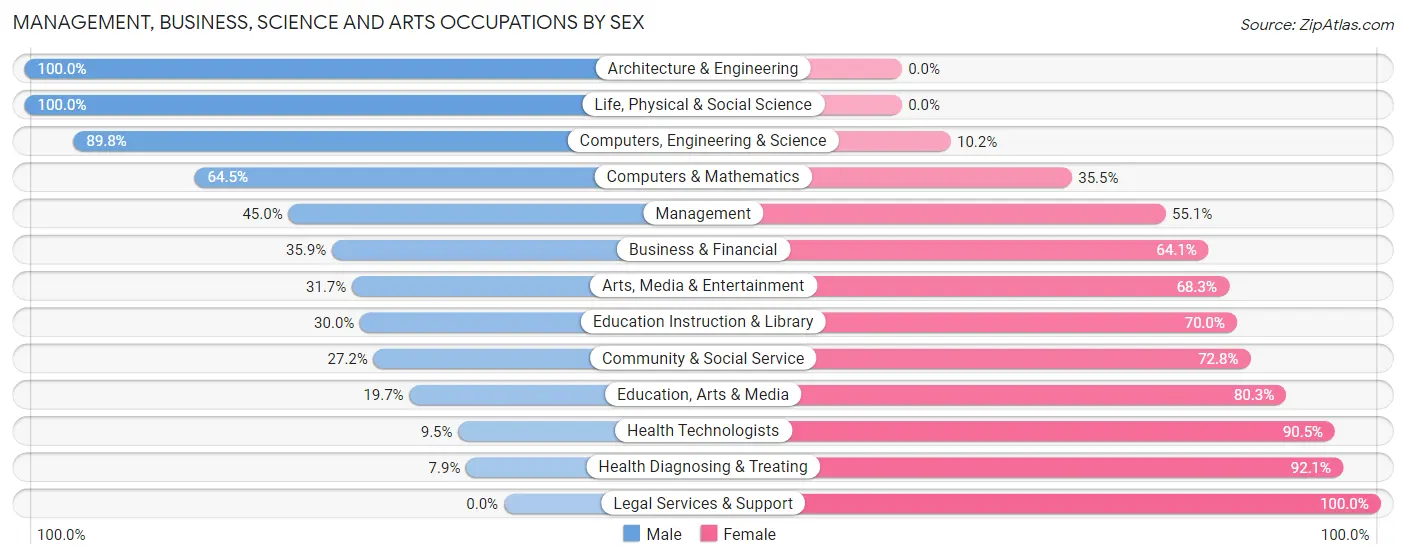
Management, Business, Science and Arts Occupations by Sex
Within the Management, Business, Science and Arts occupations in Riverton, the most male-oriented occupations are Architecture & Engineering (100.0%), Life, Physical & Social Science (100.0%), and Computers, Engineering & Science (89.8%), while the most female-oriented occupations are Legal Services & Support (100.0%), Health Diagnosing & Treating (92.1%), and Health Technologists (90.5%).
| Occupation | Male | Female |
| Management | 276 (45.0%) | 338 (55.0%) |
| Business & Financial | 52 (35.9%) | 93 (64.1%) |
| Computers, Engineering & Science | 97 (89.8%) | 11 (10.2%) |
| Computers & Mathematics | 20 (64.5%) | 11 (35.5%) |
| Architecture & Engineering | 34 (100.0%) | 0 (0.0%) |
| Life, Physical & Social Science | 43 (100.0%) | 0 (0.0%) |
| Community & Social Service | 177 (27.2%) | 474 (72.8%) |
| Education, Arts & Media | 28 (19.7%) | 114 (80.3%) |
| Legal Services & Support | 0 (0.0%) | 18 (100.0%) |
| Education Instruction & Library | 117 (30.0%) | 273 (70.0%) |
| Arts, Media & Entertainment | 32 (31.7%) | 69 (68.3%) |
| Health Diagnosing & Treating | 10 (7.9%) | 117 (92.1%) |
| Health Technologists | 10 (9.5%) | 95 (90.5%) |
| Total (Category) | 612 (37.2%) | 1,033 (62.8%) |
| Total (Overall) | 2,621 (51.8%) | 2,441 (48.2%) |
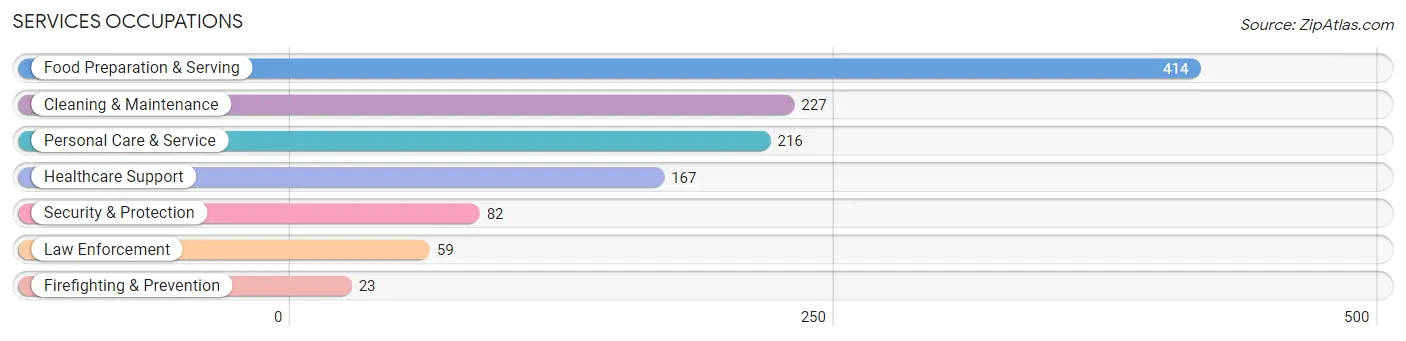
Services Occupations
The most common Services occupations in Riverton are Food Preparation & Serving (414 | 8.2%), Cleaning & Maintenance (227 | 4.5%), Personal Care & Service (216 | 4.3%), Healthcare Support (167 | 3.3%), and Security & Protection (82 | 1.6%).
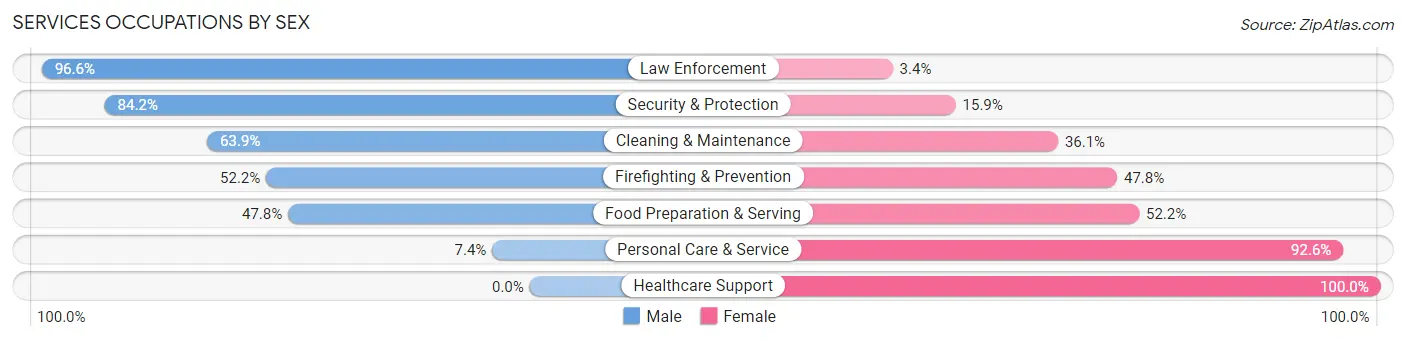
Services Occupations by Sex
Within the Services occupations in Riverton, the most male-oriented occupations are Law Enforcement (96.6%), Security & Protection (84.2%), and Cleaning & Maintenance (63.9%), while the most female-oriented occupations are Healthcare Support (100.0%), Personal Care & Service (92.6%), and Food Preparation & Serving (52.2%).
| Occupation | Male | Female |
| Healthcare Support | 0 (0.0%) | 167 (100.0%) |
| Security & Protection | 69 (84.2%) | 13 (15.9%) |
| Firefighting & Prevention | 12 (52.2%) | 11 (47.8%) |
| Law Enforcement | 57 (96.6%) | 2 (3.4%) |
| Food Preparation & Serving | 198 (47.8%) | 216 (52.2%) |
| Cleaning & Maintenance | 145 (63.9%) | 82 (36.1%) |
| Personal Care & Service | 16 (7.4%) | 200 (92.6%) |
| Total (Category) | 428 (38.7%) | 678 (61.3%) |
| Total (Overall) | 2,621 (51.8%) | 2,441 (48.2%) |
Sales and Office Occupations
The most common Sales and Office occupations in Riverton are Office & Administration (585 | 11.6%), and Sales & Related (434 | 8.6%).
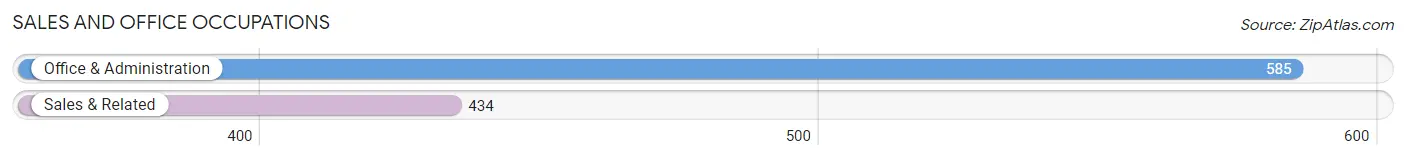
Sales and Office Occupations by Sex
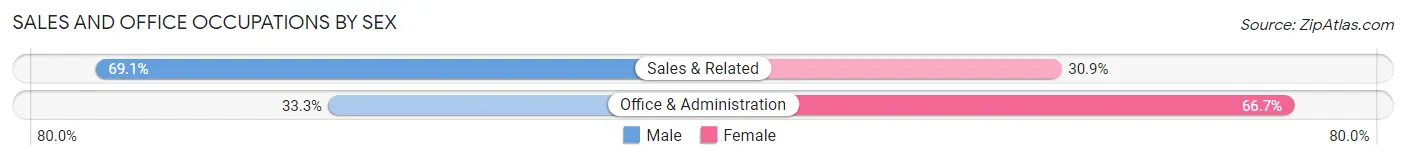
| Occupation | Male | Female |
| Sales & Related | 300 (69.1%) | 134 (30.9%) |
| Office & Administration | 195 (33.3%) | 390 (66.7%) |
| Total (Category) | 495 (48.6%) | 524 (51.4%) |
| Total (Overall) | 2,621 (51.8%) | 2,441 (48.2%) |
Natural Resources, Construction and Maintenance Occupations
The most common Natural Resources, Construction and Maintenance occupations in Riverton are Construction & Extraction (346 | 6.8%), Installation, Maintenance & Repair (192 | 3.8%), and Farming, Fishing & Forestry (10 | 0.2%).
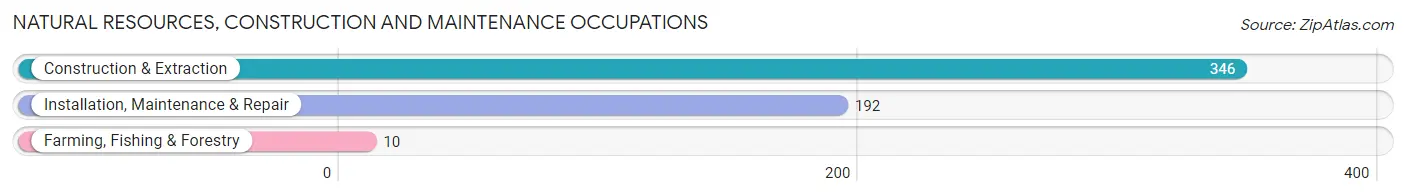
Natural Resources, Construction and Maintenance Occupations by Sex
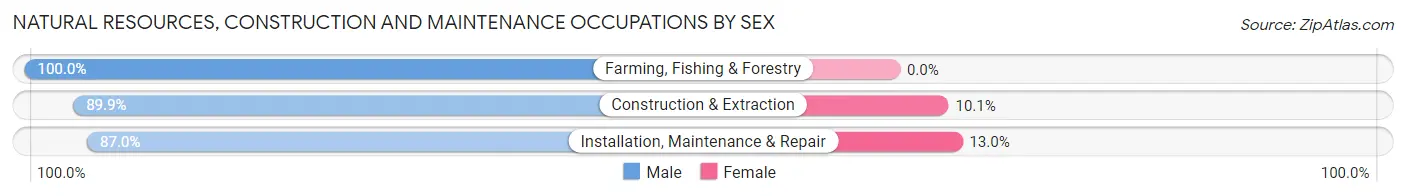
| Occupation | Male | Female |
| Farming, Fishing & Forestry | 10 (100.0%) | 0 (0.0%) |
| Construction & Extraction | 311 (89.9%) | 35 (10.1%) |
| Installation, Maintenance & Repair | 167 (87.0%) | 25 (13.0%) |
| Total (Category) | 488 (89.0%) | 60 (11.0%) |
| Total (Overall) | 2,621 (51.8%) | 2,441 (48.2%) |
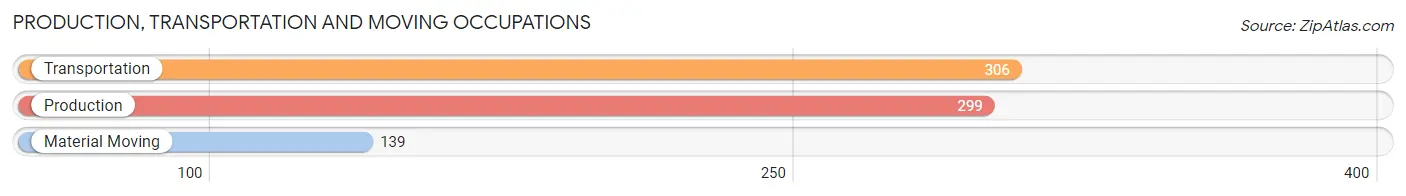
Production, Transportation and Moving Occupations
The most common Production, Transportation and Moving occupations in Riverton are Transportation (306 | 6.0%), Production (299 | 5.9%), and Material Moving (139 | 2.8%).
Production, Transportation and Moving Occupations by Sex
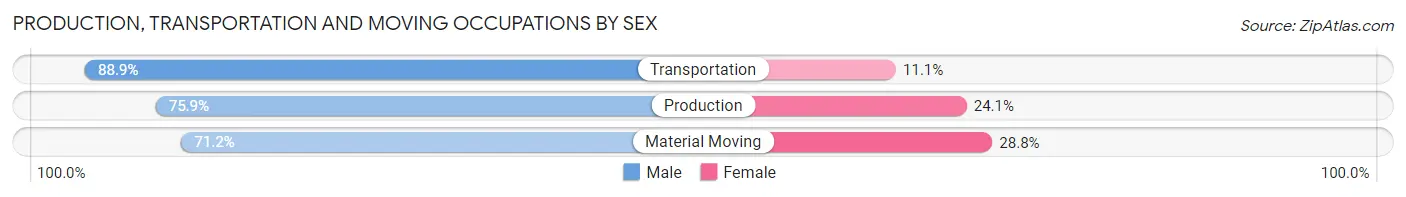
| Occupation | Male | Female |
| Production | 227 (75.9%) | 72 (24.1%) |
| Transportation | 272 (88.9%) | 34 (11.1%) |
| Material Moving | 99 (71.2%) | 40 (28.8%) |
| Total (Category) | 598 (80.4%) | 146 (19.6%) |
| Total (Overall) | 2,621 (51.8%) | 2,441 (48.2%) |
Employment Industries by Sex in Riverton
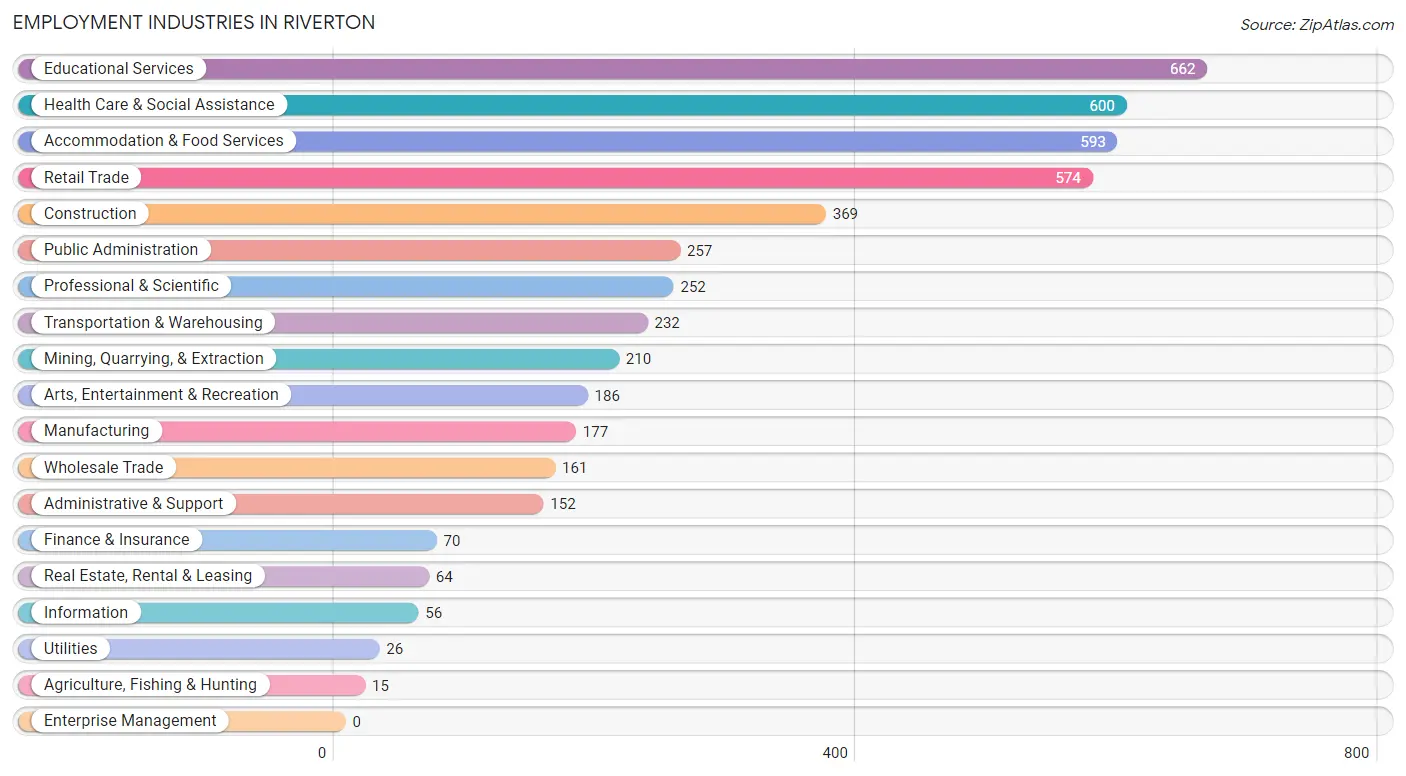
Employment Industries in Riverton
The major employment industries in Riverton include Educational Services (662 | 13.1%), Health Care & Social Assistance (600 | 11.8%), Accommodation & Food Services (593 | 11.7%), Retail Trade (574 | 11.3%), and Construction (369 | 7.3%).
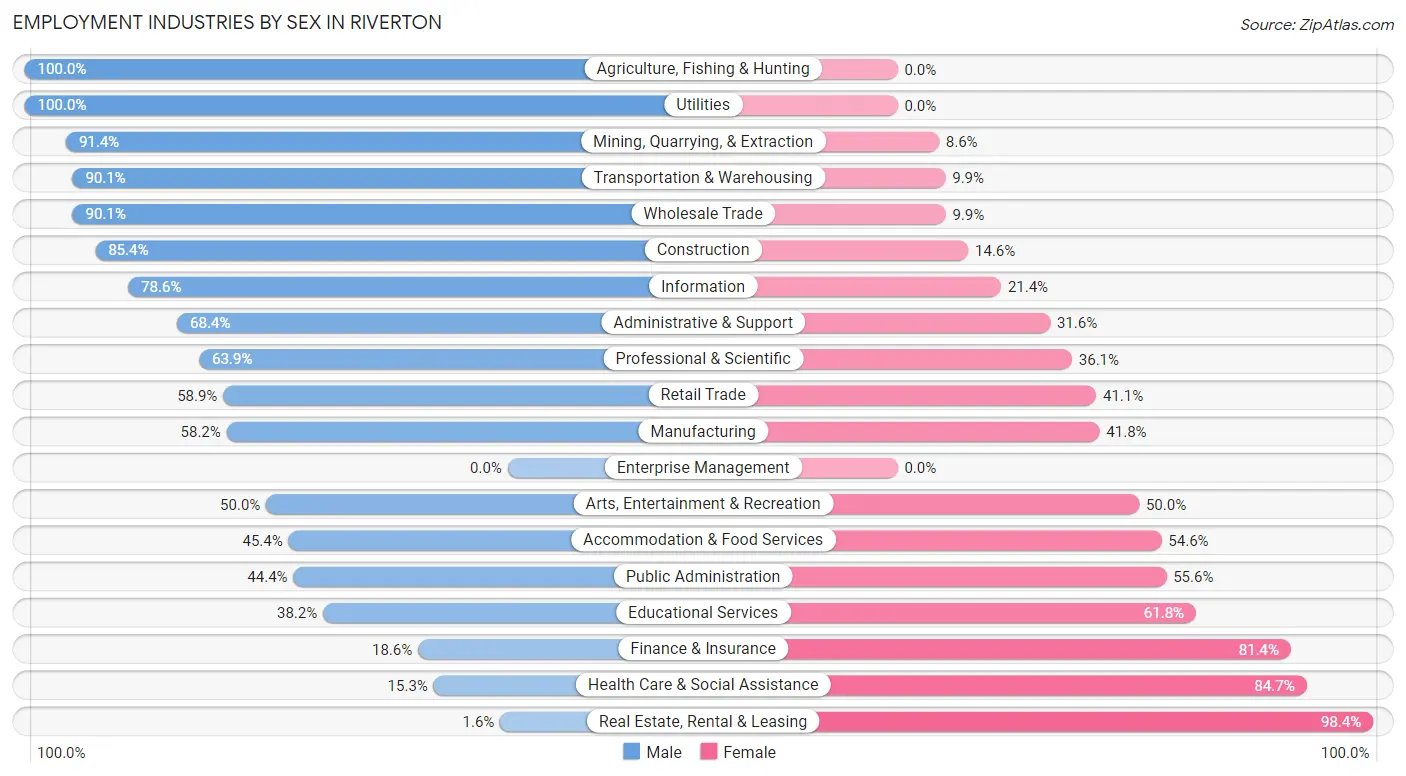
Employment Industries by Sex in Riverton
The Riverton industries that see more men than women are Agriculture, Fishing & Hunting (100.0%), Utilities (100.0%), and Mining, Quarrying, & Extraction (91.4%), whereas the industries that tend to have a higher number of women are Real Estate, Rental & Leasing (98.4%), Health Care & Social Assistance (84.7%), and Finance & Insurance (81.4%).
| Industry | Male | Female |
| Agriculture, Fishing & Hunting | 15 (100.0%) | 0 (0.0%) |
| Mining, Quarrying, & Extraction | 192 (91.4%) | 18 (8.6%) |
| Construction | 315 (85.4%) | 54 (14.6%) |
| Manufacturing | 103 (58.2%) | 74 (41.8%) |
| Wholesale Trade | 145 (90.1%) | 16 (9.9%) |
| Retail Trade | 338 (58.9%) | 236 (41.1%) |
| Transportation & Warehousing | 209 (90.1%) | 23 (9.9%) |
| Utilities | 26 (100.0%) | 0 (0.0%) |
| Information | 44 (78.6%) | 12 (21.4%) |
| Finance & Insurance | 13 (18.6%) | 57 (81.4%) |
| Real Estate, Rental & Leasing | 1 (1.6%) | 63 (98.4%) |
| Professional & Scientific | 161 (63.9%) | 91 (36.1%) |
| Enterprise Management | 0 (0.0%) | 0 (0.0%) |
| Administrative & Support | 104 (68.4%) | 48 (31.6%) |
| Educational Services | 253 (38.2%) | 409 (61.8%) |
| Health Care & Social Assistance | 92 (15.3%) | 508 (84.7%) |
| Arts, Entertainment & Recreation | 93 (50.0%) | 93 (50.0%) |
| Accommodation & Food Services | 269 (45.4%) | 324 (54.6%) |
| Public Administration | 114 (44.4%) | 143 (55.6%) |
| Total | 2,621 (51.8%) | 2,441 (48.2%) |
Education in Riverton
School Enrollment in Riverton
The most common levels of schooling among the 2,637 students in Riverton are middle school (734 | 27.8%), elementary school (622 | 23.6%), and high school (521 | 19.8%).
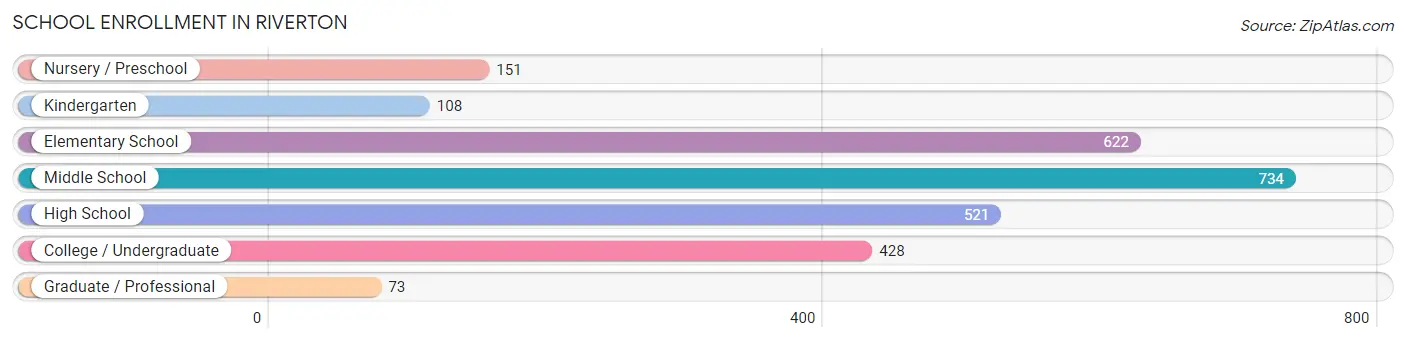
| School Level | # Students | % Students |
| Nursery / Preschool | 151 | 5.7% |
| Kindergarten | 108 | 4.1% |
| Elementary School | 622 | 23.6% |
| Middle School | 734 | 27.8% |
| High School | 521 | 19.8% |
| College / Undergraduate | 428 | 16.2% |
| Graduate / Professional | 73 | 2.8% |
| Total | 2,637 | 100.0% |
School Enrollment by Age by Funding Source in Riverton
Out of a total of 2,637 students who are enrolled in schools in Riverton, 208 (7.9%) attend a private institution, while the remaining 2,429 (92.1%) are enrolled in public schools. The age group of 25 to 34 year olds has the highest likelihood of being enrolled in private schools, with 35 (50.0% in the age bracket) enrolled. Conversely, the age group of 15 to 17 year olds has the lowest likelihood of being enrolled in a private school, with 287 (100.0% in the age bracket) attending a public institution.
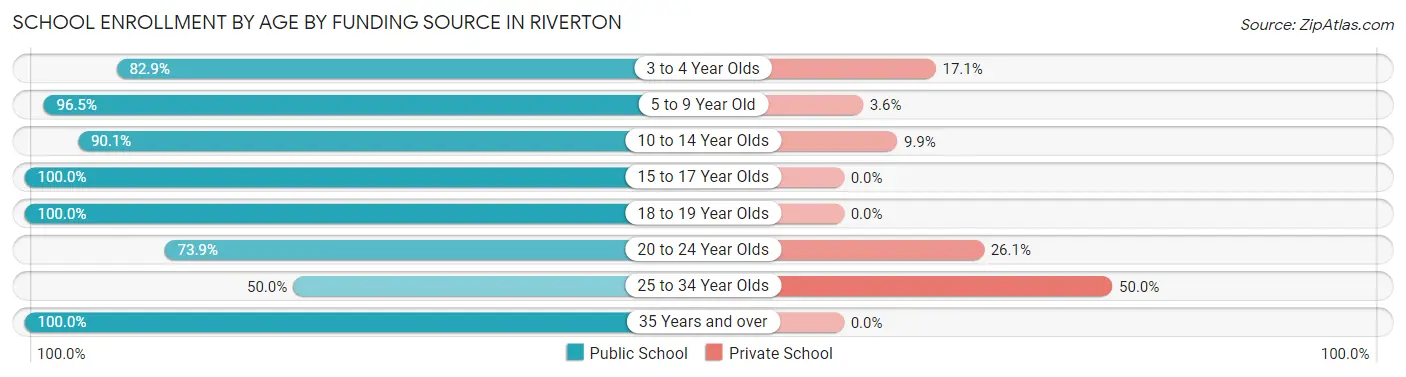
| Age Bracket | Public School | Private School |
| 3 to 4 Year Olds | 92 (82.9%) | 19 (17.1%) |
| 5 to 9 Year Old | 679 (96.5%) | 25 (3.5%) |
| 10 to 14 Year Olds | 788 (90.1%) | 87 (9.9%) |
| 15 to 17 Year Olds | 287 (100.0%) | 0 (0.0%) |
| 18 to 19 Year Olds | 286 (100.0%) | 0 (0.0%) |
| 20 to 24 Year Olds | 119 (73.9%) | 42 (26.1%) |
| 25 to 34 Year Olds | 35 (50.0%) | 35 (50.0%) |
| 35 Years and over | 143 (100.0%) | 0 (0.0%) |
| Total | 2,429 (92.1%) | 208 (7.9%) |
Educational Attainment by Field of Study in Riverton
Education (341 | 21.2%), science & technology (272 | 16.9%), arts & humanities (178 | 11.1%), bio, nature & agricultural (147 | 9.1%), and engineering (138 | 8.6%) are the most common fields of study among 1,608 individuals in Riverton who have obtained a bachelor's degree or higher.
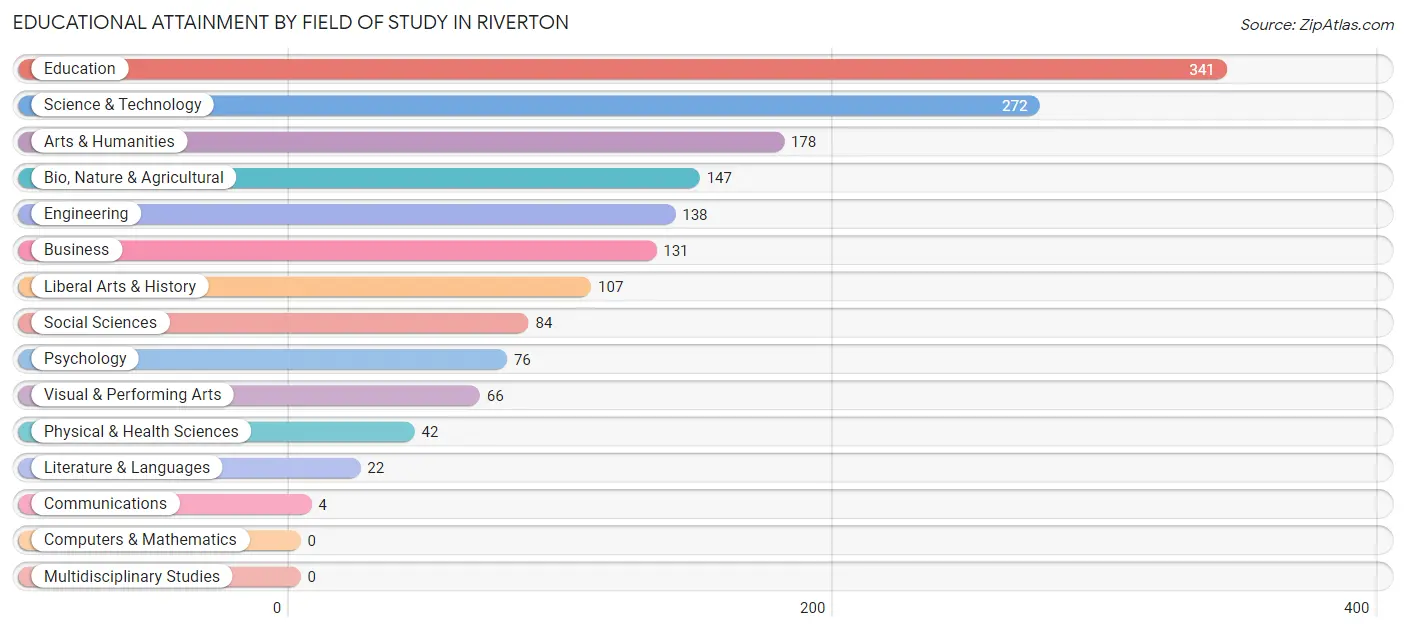
| Field of Study | # Graduates | % Graduates |
| Computers & Mathematics | 0 | 0.0% |
| Bio, Nature & Agricultural | 147 | 9.1% |
| Physical & Health Sciences | 42 | 2.6% |
| Psychology | 76 | 4.7% |
| Social Sciences | 84 | 5.2% |
| Engineering | 138 | 8.6% |
| Multidisciplinary Studies | 0 | 0.0% |
| Science & Technology | 272 | 16.9% |
| Business | 131 | 8.2% |
| Education | 341 | 21.2% |
| Literature & Languages | 22 | 1.4% |
| Liberal Arts & History | 107 | 6.7% |
| Visual & Performing Arts | 66 | 4.1% |
| Communications | 4 | 0.3% |
| Arts & Humanities | 178 | 11.1% |
| Total | 1,608 | 100.0% |
Transportation & Commute in Riverton
Vehicle Availability by Sex in Riverton
The most prevalent vehicle ownership categories in Riverton are males with 2 vehicles (1,023, accounting for 41.8%) and females with 2 vehicles (1,138, making up 43.2%).
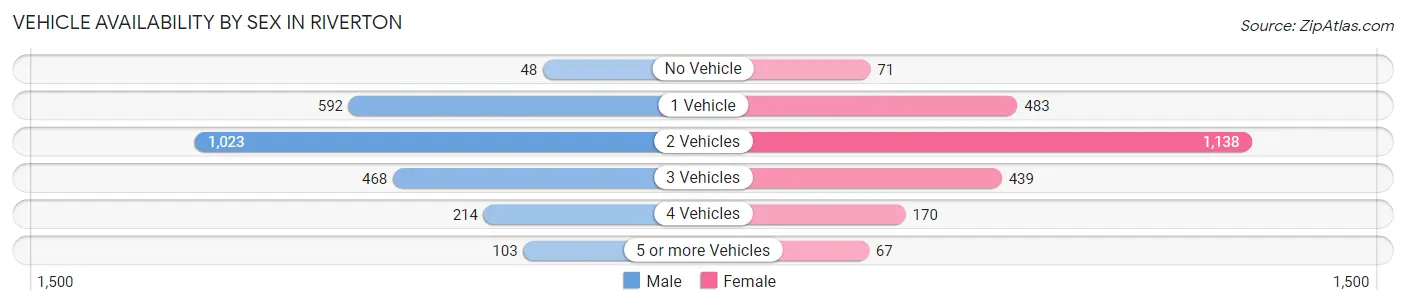
| Vehicles Available | Male | Female |
| No Vehicle | 48 (2.0%) | 71 (3.0%) |
| 1 Vehicle | 592 (24.2%) | 483 (20.4%) |
| 2 Vehicles | 1,023 (41.8%) | 1,138 (48.1%) |
| 3 Vehicles | 468 (19.1%) | 439 (18.5%) |
| 4 Vehicles | 214 (8.7%) | 170 (7.2%) |
| 5 or more Vehicles | 103 (4.2%) | 67 (2.8%) |
| Total | 2,448 (100.0%) | 2,368 (100.0%) |
Commute Time in Riverton
The most frequently occuring commute durations in Riverton are 5 to 9 minutes (1,782 commuters, 38.8%), 10 to 14 minutes (824 commuters, 17.9%), and less than 5 minutes (513 commuters, 11.2%).
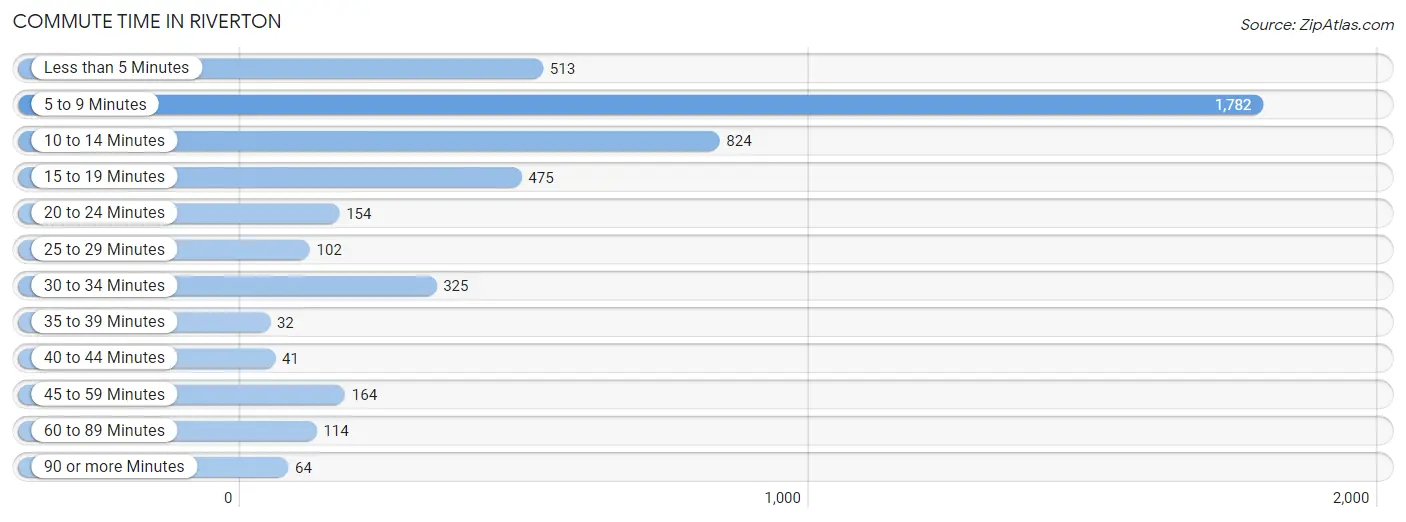
| Commute Time | # Commuters | % Commuters |
| Less than 5 Minutes | 513 | 11.2% |
| 5 to 9 Minutes | 1,782 | 38.8% |
| 10 to 14 Minutes | 824 | 17.9% |
| 15 to 19 Minutes | 475 | 10.3% |
| 20 to 24 Minutes | 154 | 3.4% |
| 25 to 29 Minutes | 102 | 2.2% |
| 30 to 34 Minutes | 325 | 7.1% |
| 35 to 39 Minutes | 32 | 0.7% |
| 40 to 44 Minutes | 41 | 0.9% |
| 45 to 59 Minutes | 164 | 3.6% |
| 60 to 89 Minutes | 114 | 2.5% |
| 90 or more Minutes | 64 | 1.4% |
Commute Time by Sex in Riverton
The most common commute times in Riverton are 5 to 9 minutes (782 commuters, 33.2%) for males and 5 to 9 minutes (1,000 commuters, 44.8%) for females.
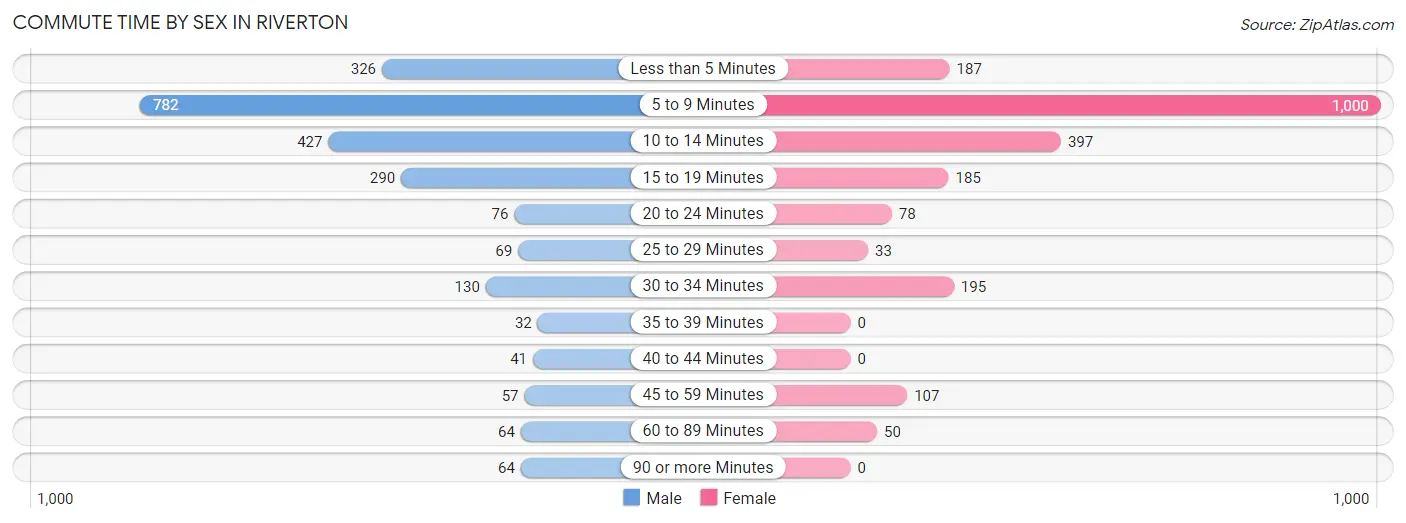
| Commute Time | Male | Female |
| Less than 5 Minutes | 326 (13.8%) | 187 (8.4%) |
| 5 to 9 Minutes | 782 (33.2%) | 1,000 (44.8%) |
| 10 to 14 Minutes | 427 (18.1%) | 397 (17.8%) |
| 15 to 19 Minutes | 290 (12.3%) | 185 (8.3%) |
| 20 to 24 Minutes | 76 (3.2%) | 78 (3.5%) |
| 25 to 29 Minutes | 69 (2.9%) | 33 (1.5%) |
| 30 to 34 Minutes | 130 (5.5%) | 195 (8.7%) |
| 35 to 39 Minutes | 32 (1.4%) | 0 (0.0%) |
| 40 to 44 Minutes | 41 (1.7%) | 0 (0.0%) |
| 45 to 59 Minutes | 57 (2.4%) | 107 (4.8%) |
| 60 to 89 Minutes | 64 (2.7%) | 50 (2.2%) |
| 90 or more Minutes | 64 (2.7%) | 0 (0.0%) |
Time of Departure to Work by Sex in Riverton
The most frequent times of departure to work in Riverton are 6:30 AM to 6:59 AM (431, 18.3%) for males and 7:00 AM to 7:29 AM (404, 18.1%) for females.
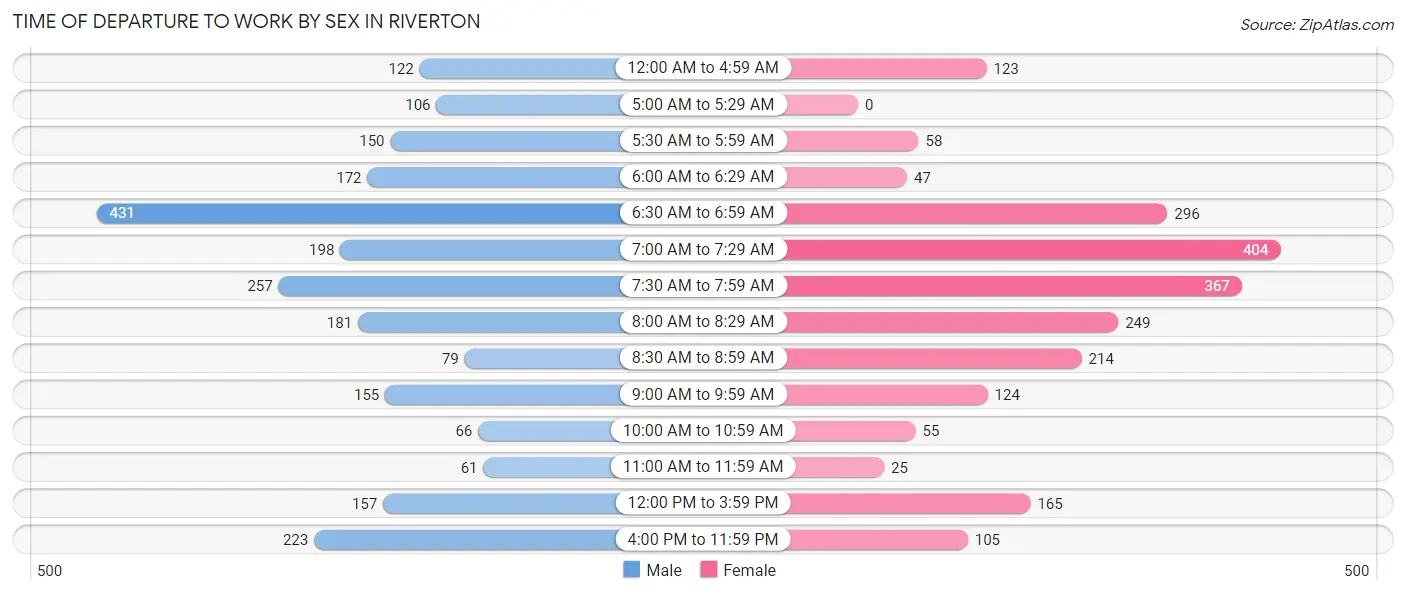
| Time of Departure | Male | Female |
| 12:00 AM to 4:59 AM | 122 (5.2%) | 123 (5.5%) |
| 5:00 AM to 5:29 AM | 106 (4.5%) | 0 (0.0%) |
| 5:30 AM to 5:59 AM | 150 (6.4%) | 58 (2.6%) |
| 6:00 AM to 6:29 AM | 172 (7.3%) | 47 (2.1%) |
| 6:30 AM to 6:59 AM | 431 (18.3%) | 296 (13.3%) |
| 7:00 AM to 7:29 AM | 198 (8.4%) | 404 (18.1%) |
| 7:30 AM to 7:59 AM | 257 (10.9%) | 367 (16.4%) |
| 8:00 AM to 8:29 AM | 181 (7.7%) | 249 (11.2%) |
| 8:30 AM to 8:59 AM | 79 (3.4%) | 214 (9.6%) |
| 9:00 AM to 9:59 AM | 155 (6.6%) | 124 (5.6%) |
| 10:00 AM to 10:59 AM | 66 (2.8%) | 55 (2.5%) |
| 11:00 AM to 11:59 AM | 61 (2.6%) | 25 (1.1%) |
| 12:00 PM to 3:59 PM | 157 (6.7%) | 165 (7.4%) |
| 4:00 PM to 11:59 PM | 223 (9.5%) | 105 (4.7%) |
| Total | 2,358 (100.0%) | 2,232 (100.0%) |
Housing Occupancy in Riverton
Occupancy by Ownership in Riverton
Of the total 4,124 dwellings in Riverton, owner-occupied units account for 2,432 (59.0%), while renter-occupied units make up 1,692 (41.0%).
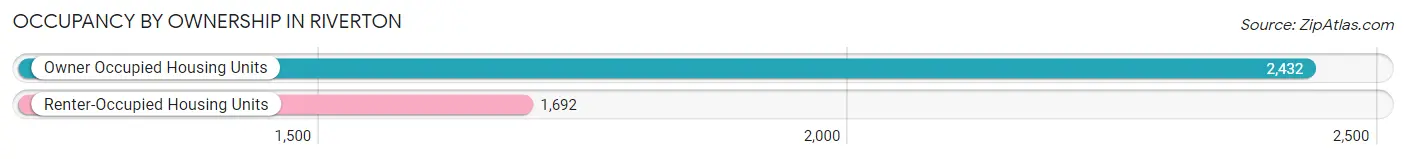
| Occupancy | # Housing Units | % Housing Units |
| Owner Occupied Housing Units | 2,432 | 59.0% |
| Renter-Occupied Housing Units | 1,692 | 41.0% |
| Total Occupied Housing Units | 4,124 | 100.0% |
Occupancy by Household Size in Riverton
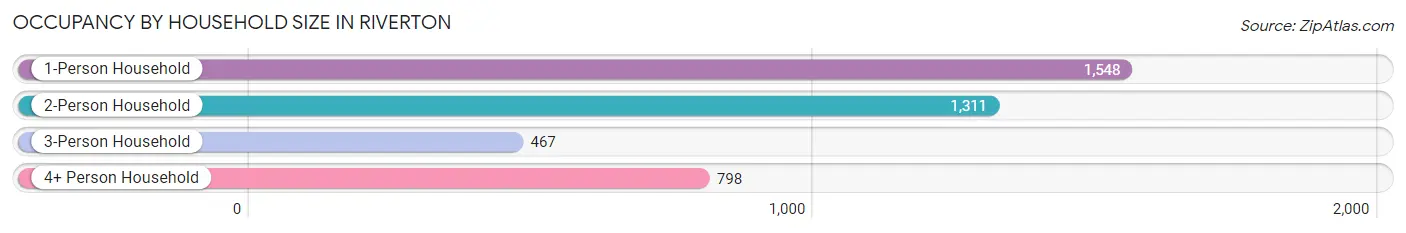
| Household Size | # Housing Units | % Housing Units |
| 1-Person Household | 1,548 | 37.5% |
| 2-Person Household | 1,311 | 31.8% |
| 3-Person Household | 467 | 11.3% |
| 4+ Person Household | 798 | 19.4% |
| Total Housing Units | 4,124 | 100.0% |
Occupancy by Ownership by Household Size in Riverton
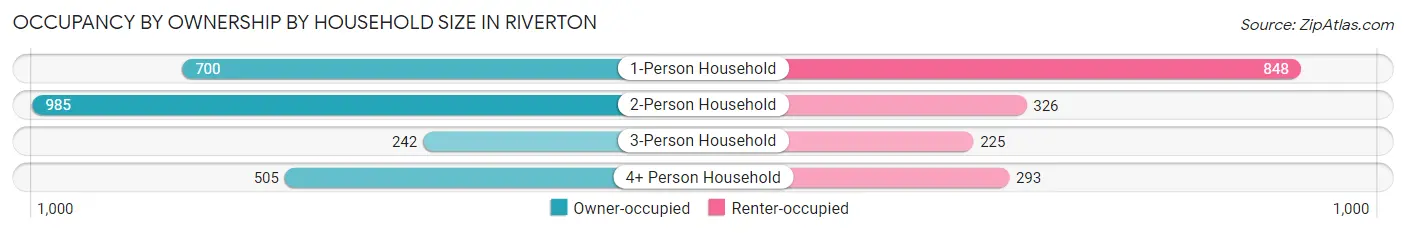
| Household Size | Owner-occupied | Renter-occupied |
| 1-Person Household | 700 (45.2%) | 848 (54.8%) |
| 2-Person Household | 985 (75.1%) | 326 (24.9%) |
| 3-Person Household | 242 (51.8%) | 225 (48.2%) |
| 4+ Person Household | 505 (63.3%) | 293 (36.7%) |
| Total Housing Units | 2,432 (59.0%) | 1,692 (41.0%) |
Occupancy by Educational Attainment in Riverton
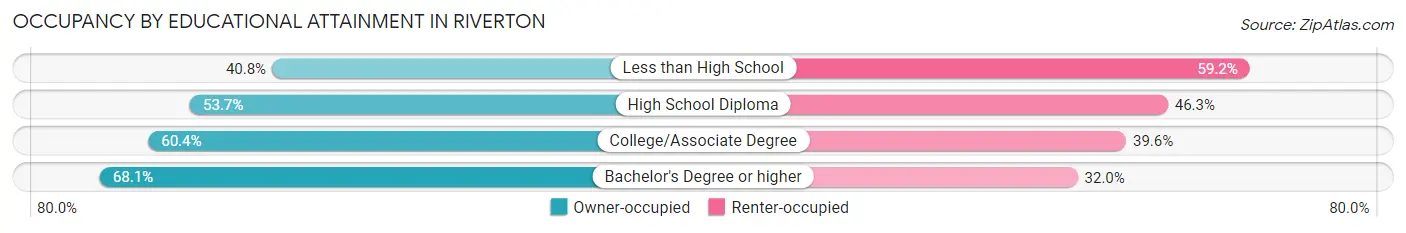
| Household Size | Owner-occupied | Renter-occupied |
| Less than High School | 106 (40.8%) | 154 (59.2%) |
| High School Diploma | 639 (53.7%) | 550 (46.3%) |
| College/Associate Degree | 1,048 (60.4%) | 688 (39.6%) |
| Bachelor's Degree or higher | 639 (68.0%) | 300 (32.0%) |
Occupancy by Age of Householder in Riverton
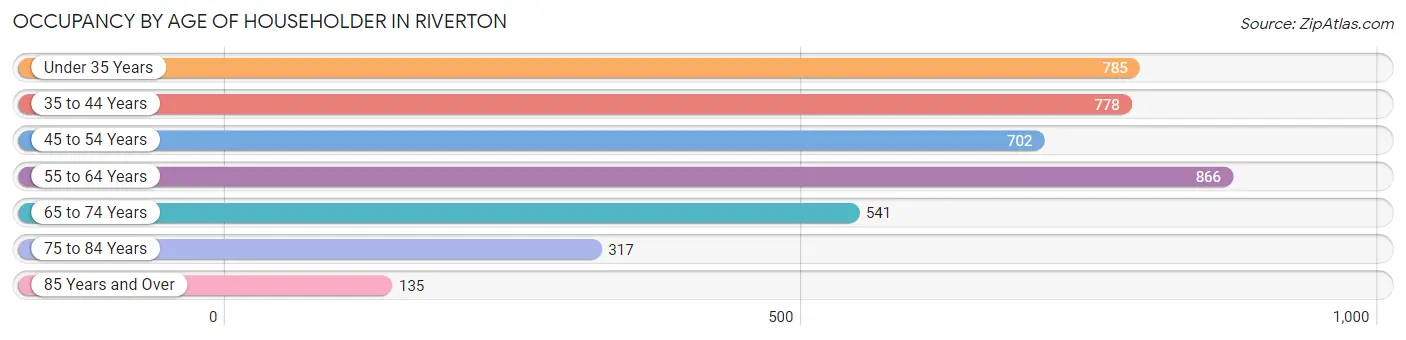
| Age Bracket | # Households | % Households |
| Under 35 Years | 785 | 19.0% |
| 35 to 44 Years | 778 | 18.9% |
| 45 to 54 Years | 702 | 17.0% |
| 55 to 64 Years | 866 | 21.0% |
| 65 to 74 Years | 541 | 13.1% |
| 75 to 84 Years | 317 | 7.7% |
| 85 Years and Over | 135 | 3.3% |
| Total | 4,124 | 100.0% |
Housing Finances in Riverton
Median Income by Occupancy in Riverton
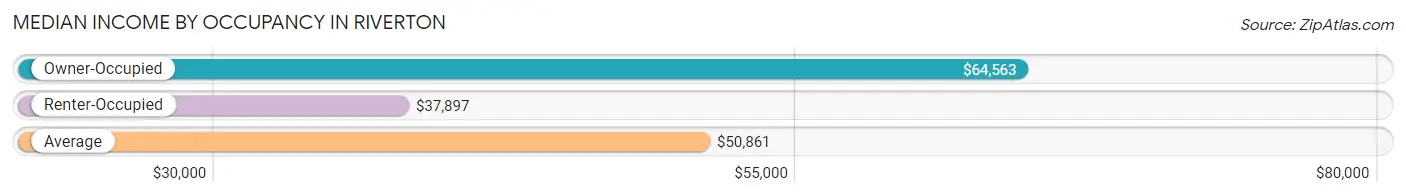
| Occupancy Type | # Households | Median Income |
| Owner-Occupied | 2,432 (59.0%) | $64,563 |
| Renter-Occupied | 1,692 (41.0%) | $37,897 |
| Average | 4,124 (100.0%) | $50,861 |
Occupancy by Householder Income Bracket in Riverton
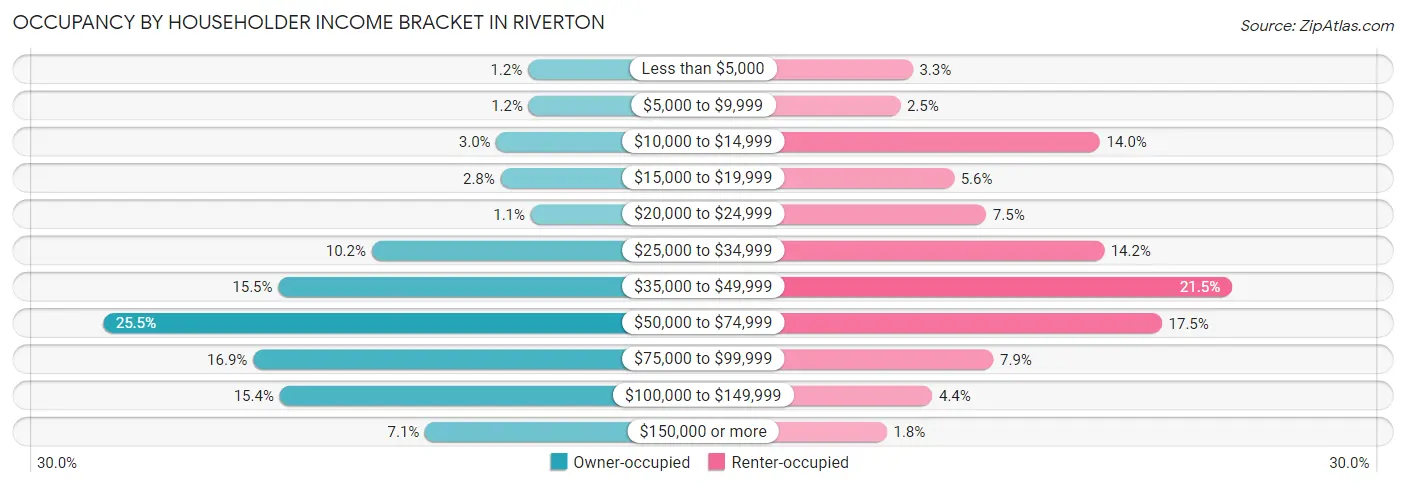
| Income Bracket | Owner-occupied | Renter-occupied |
| Less than $5,000 | 30 (1.2%) | 55 (3.3%) |
| $5,000 to $9,999 | 29 (1.2%) | 43 (2.5%) |
| $10,000 to $14,999 | 74 (3.0%) | 236 (14.0%) |
| $15,000 to $19,999 | 68 (2.8%) | 95 (5.6%) |
| $20,000 to $24,999 | 26 (1.1%) | 126 (7.4%) |
| $25,000 to $34,999 | 247 (10.2%) | 240 (14.2%) |
| $35,000 to $49,999 | 377 (15.5%) | 364 (21.5%) |
| $50,000 to $74,999 | 621 (25.5%) | 296 (17.5%) |
| $75,000 to $99,999 | 412 (16.9%) | 133 (7.9%) |
| $100,000 to $149,999 | 375 (15.4%) | 74 (4.4%) |
| $150,000 or more | 173 (7.1%) | 30 (1.8%) |
| Total | 2,432 (100.0%) | 1,692 (100.0%) |
Monthly Housing Cost Tiers in Riverton
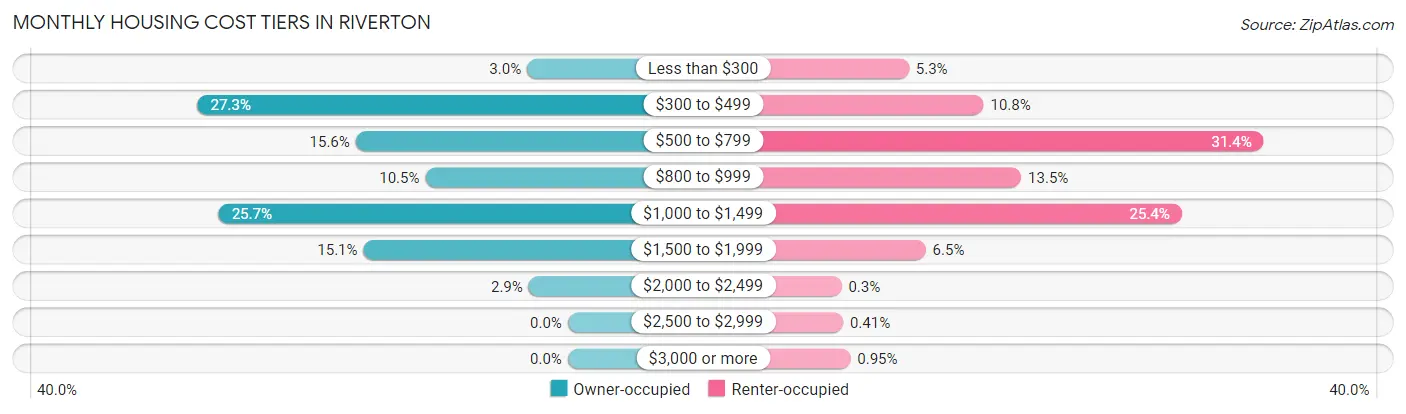
| Monthly Cost | Owner-occupied | Renter-occupied |
| Less than $300 | 73 (3.0%) | 89 (5.3%) |
| $300 to $499 | 663 (27.3%) | 182 (10.8%) |
| $500 to $799 | 380 (15.6%) | 531 (31.4%) |
| $800 to $999 | 255 (10.5%) | 229 (13.5%) |
| $1,000 to $1,499 | 625 (25.7%) | 429 (25.4%) |
| $1,500 to $1,999 | 366 (15.0%) | 110 (6.5%) |
| $2,000 to $2,499 | 70 (2.9%) | 5 (0.3%) |
| $2,500 to $2,999 | 0 (0.0%) | 7 (0.4%) |
| $3,000 or more | 0 (0.0%) | 16 (0.9%) |
| Total | 2,432 (100.0%) | 1,692 (100.0%) |
Physical Housing Characteristics in Riverton
Housing Structures in Riverton
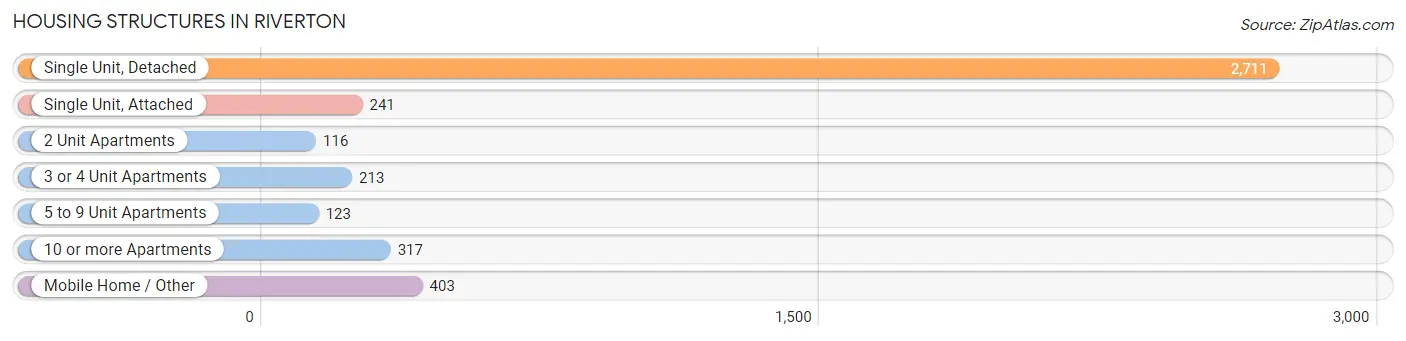
| Structure Type | # Housing Units | % Housing Units |
| Single Unit, Detached | 2,711 | 65.7% |
| Single Unit, Attached | 241 | 5.8% |
| 2 Unit Apartments | 116 | 2.8% |
| 3 or 4 Unit Apartments | 213 | 5.2% |
| 5 to 9 Unit Apartments | 123 | 3.0% |
| 10 or more Apartments | 317 | 7.7% |
| Mobile Home / Other | 403 | 9.8% |
| Total | 4,124 | 100.0% |
Housing Structures by Occupancy in Riverton
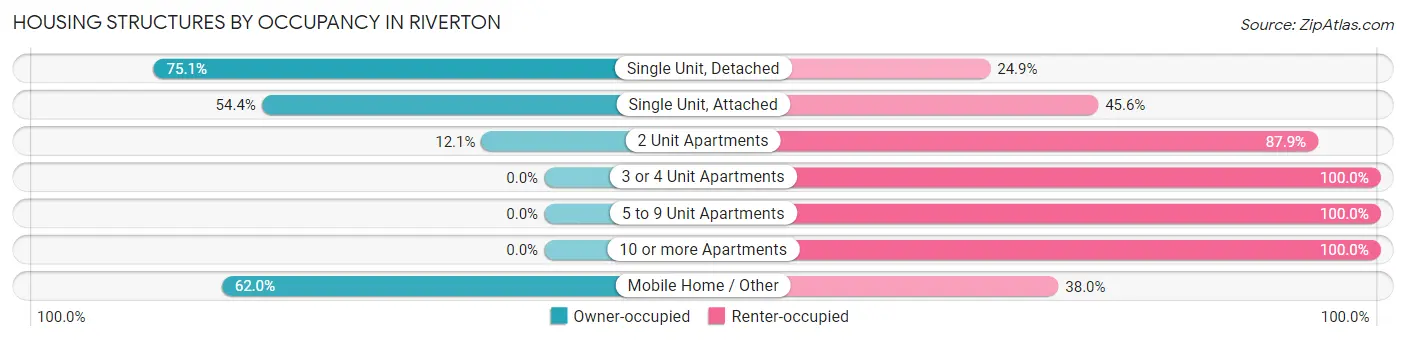
| Structure Type | Owner-occupied | Renter-occupied |
| Single Unit, Detached | 2,037 (75.1%) | 674 (24.9%) |
| Single Unit, Attached | 131 (54.4%) | 110 (45.6%) |
| 2 Unit Apartments | 14 (12.1%) | 102 (87.9%) |
| 3 or 4 Unit Apartments | 0 (0.0%) | 213 (100.0%) |
| 5 to 9 Unit Apartments | 0 (0.0%) | 123 (100.0%) |
| 10 or more Apartments | 0 (0.0%) | 317 (100.0%) |
| Mobile Home / Other | 250 (62.0%) | 153 (38.0%) |
| Total | 2,432 (59.0%) | 1,692 (41.0%) |
Housing Structures by Number of Rooms in Riverton
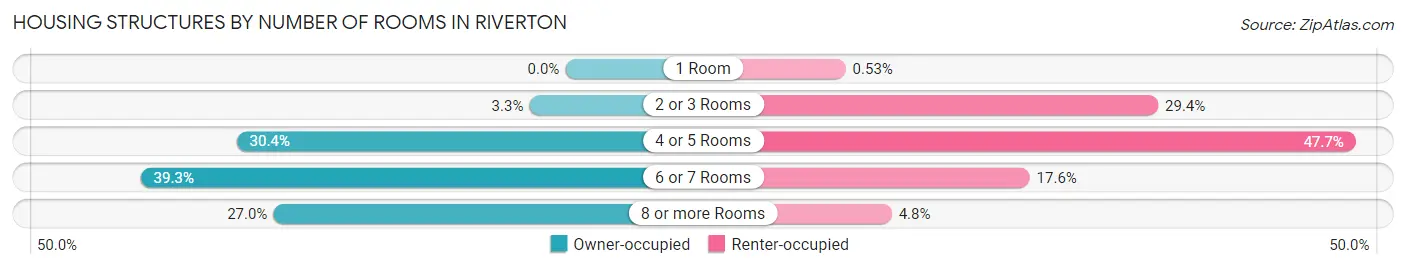
| Number of Rooms | Owner-occupied | Renter-occupied |
| 1 Room | 0 (0.0%) | 9 (0.5%) |
| 2 or 3 Rooms | 81 (3.3%) | 498 (29.4%) |
| 4 or 5 Rooms | 739 (30.4%) | 807 (47.7%) |
| 6 or 7 Rooms | 955 (39.3%) | 297 (17.5%) |
| 8 or more Rooms | 657 (27.0%) | 81 (4.8%) |
| Total | 2,432 (100.0%) | 1,692 (100.0%) |
Housing Structure by Heating Type in Riverton
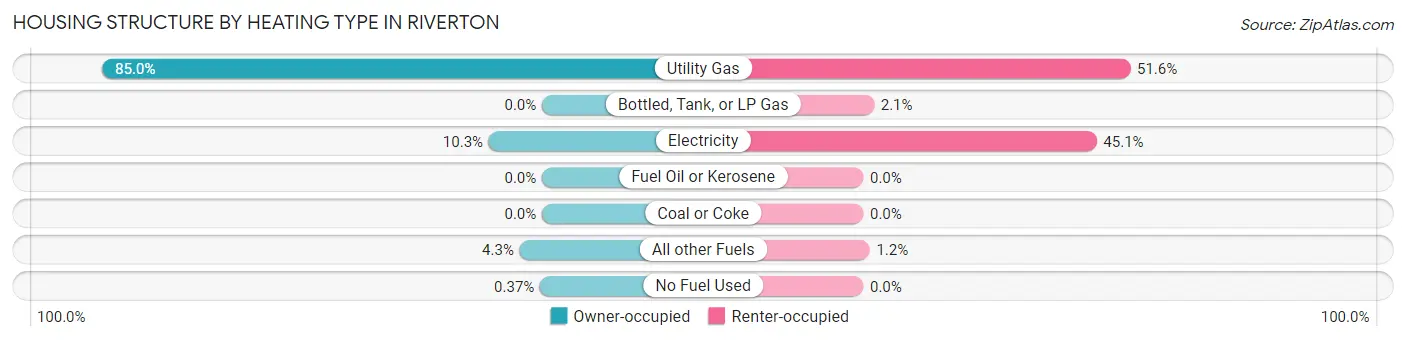
| Heating Type | Owner-occupied | Renter-occupied |
| Utility Gas | 2,068 (85.0%) | 873 (51.6%) |
| Bottled, Tank, or LP Gas | 0 (0.0%) | 35 (2.1%) |
| Electricity | 250 (10.3%) | 763 (45.1%) |
| Fuel Oil or Kerosene | 0 (0.0%) | 0 (0.0%) |
| Coal or Coke | 0 (0.0%) | 0 (0.0%) |
| All other Fuels | 105 (4.3%) | 21 (1.2%) |
| No Fuel Used | 9 (0.4%) | 0 (0.0%) |
| Total | 2,432 (100.0%) | 1,692 (100.0%) |
Household Vehicle Usage in Riverton
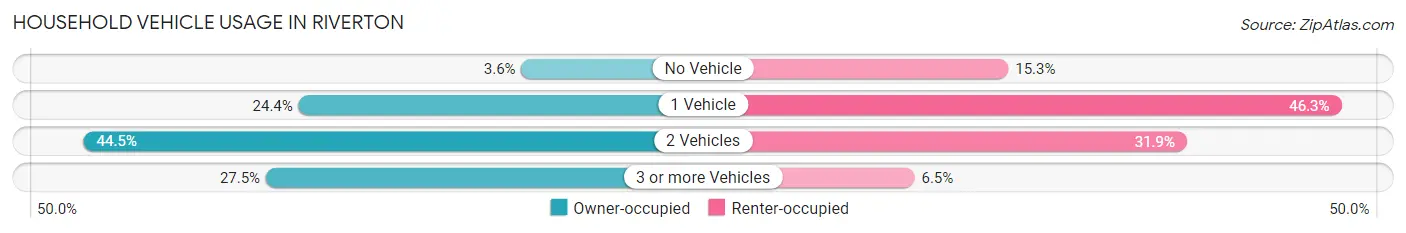
| Vehicles per Household | Owner-occupied | Renter-occupied |
| No Vehicle | 88 (3.6%) | 258 (15.2%) |
| 1 Vehicle | 594 (24.4%) | 784 (46.3%) |
| 2 Vehicles | 1,082 (44.5%) | 540 (31.9%) |
| 3 or more Vehicles | 668 (27.5%) | 110 (6.5%) |
| Total | 2,432 (100.0%) | 1,692 (100.0%) |
Real Estate & Mortgages in Riverton
Real Estate and Mortgage Overview in Riverton
| Characteristic | Without Mortgage | With Mortgage |
| Housing Units | 1,194 | 1,238 |
| Median Property Value | $191,300 | $198,100 |
| Median Household Income | $64,009 | $64 |
| Monthly Housing Costs | $461 | $0 |
| Real Estate Taxes | $1,384 | $21 |
Property Value by Mortgage Status in Riverton
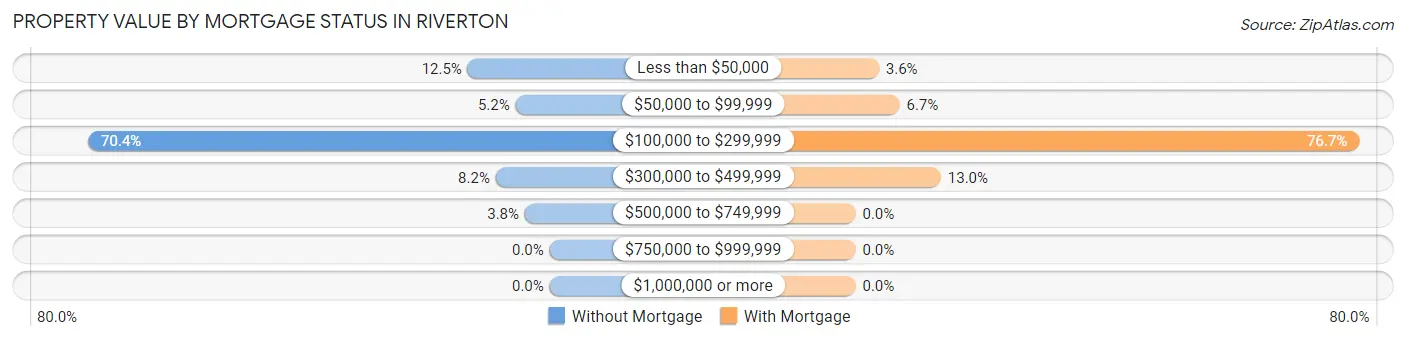
| Property Value | Without Mortgage | With Mortgage |
| Less than $50,000 | 149 (12.5%) | 44 (3.5%) |
| $50,000 to $99,999 | 62 (5.2%) | 83 (6.7%) |
| $100,000 to $299,999 | 840 (70.4%) | 950 (76.7%) |
| $300,000 to $499,999 | 98 (8.2%) | 161 (13.0%) |
| $500,000 to $749,999 | 45 (3.8%) | 0 (0.0%) |
| $750,000 to $999,999 | 0 (0.0%) | 0 (0.0%) |
| $1,000,000 or more | 0 (0.0%) | 0 (0.0%) |
| Total | 1,194 (100.0%) | 1,238 (100.0%) |
Household Income by Mortgage Status in Riverton
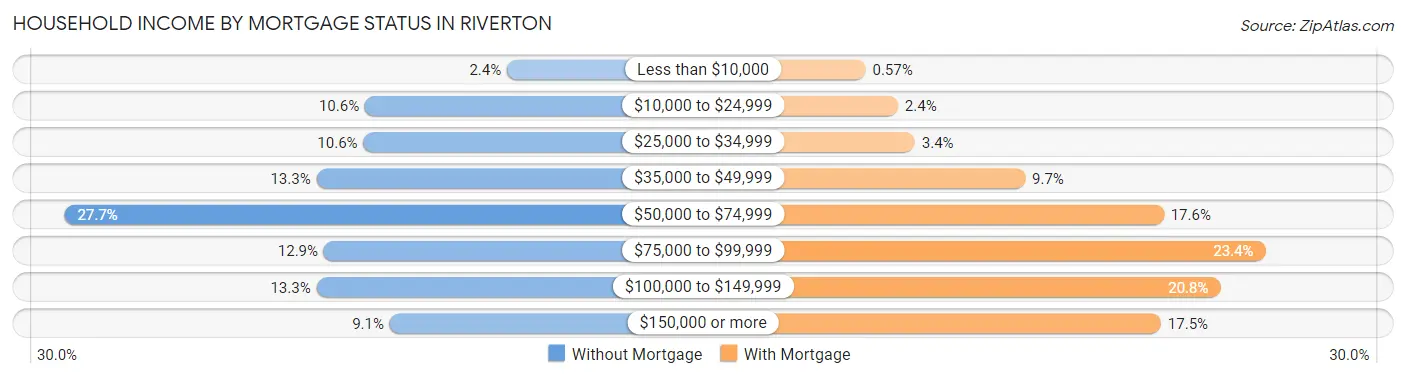
| Household Income | Without Mortgage | With Mortgage |
| Less than $10,000 | 29 (2.4%) | 7 (0.6%) |
| $10,000 to $24,999 | 126 (10.5%) | 30 (2.4%) |
| $25,000 to $34,999 | 127 (10.6%) | 42 (3.4%) |
| $35,000 to $49,999 | 159 (13.3%) | 120 (9.7%) |
| $50,000 to $74,999 | 331 (27.7%) | 218 (17.6%) |
| $75,000 to $99,999 | 154 (12.9%) | 290 (23.4%) |
| $100,000 to $149,999 | 159 (13.3%) | 258 (20.8%) |
| $150,000 or more | 109 (9.1%) | 216 (17.4%) |
| Total | 1,194 (100.0%) | 1,238 (100.0%) |
Property Value to Household Income Ratio in Riverton
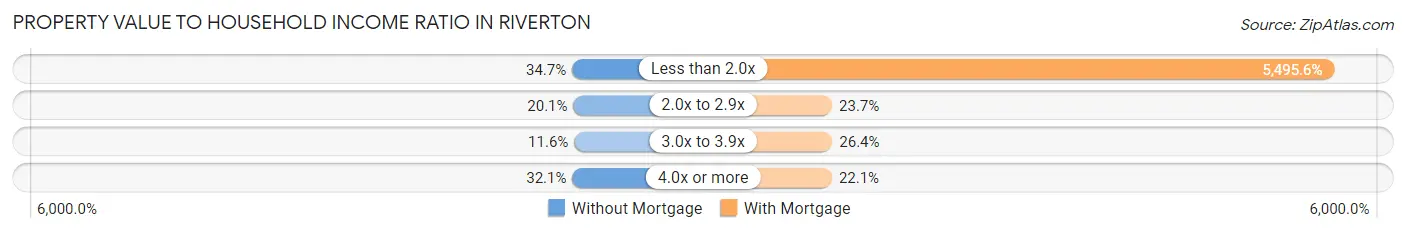
| Value-to-Income Ratio | Without Mortgage | With Mortgage |
| Less than 2.0x | 414 (34.7%) | 68,036 (5,495.6%) |
| 2.0x to 2.9x | 240 (20.1%) | 293 (23.7%) |
| 3.0x to 3.9x | 138 (11.6%) | 327 (26.4%) |
| 4.0x or more | 383 (32.1%) | 273 (22.1%) |
| Total | 1,194 (100.0%) | 1,238 (100.0%) |
Real Estate Taxes by Mortgage Status in Riverton
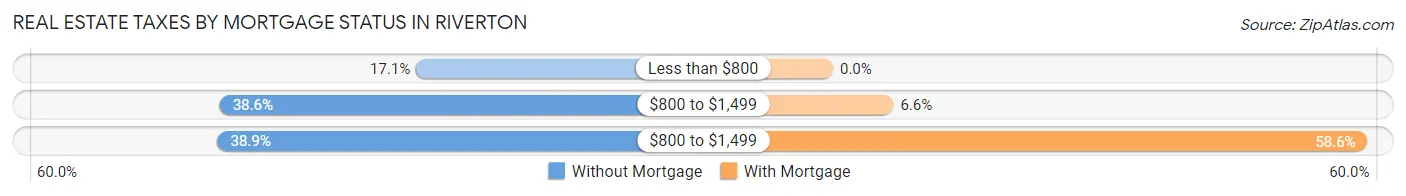
| Property Taxes | Without Mortgage | With Mortgage |
| Less than $800 | 204 (17.1%) | 0 (0.0%) |
| $800 to $1,499 | 461 (38.6%) | 82 (6.6%) |
| $800 to $1,499 | 464 (38.9%) | 725 (58.6%) |
| Total | 1,194 (100.0%) | 1,238 (100.0%) |
Health & Disability in Riverton
Health Insurance Coverage by Age in Riverton
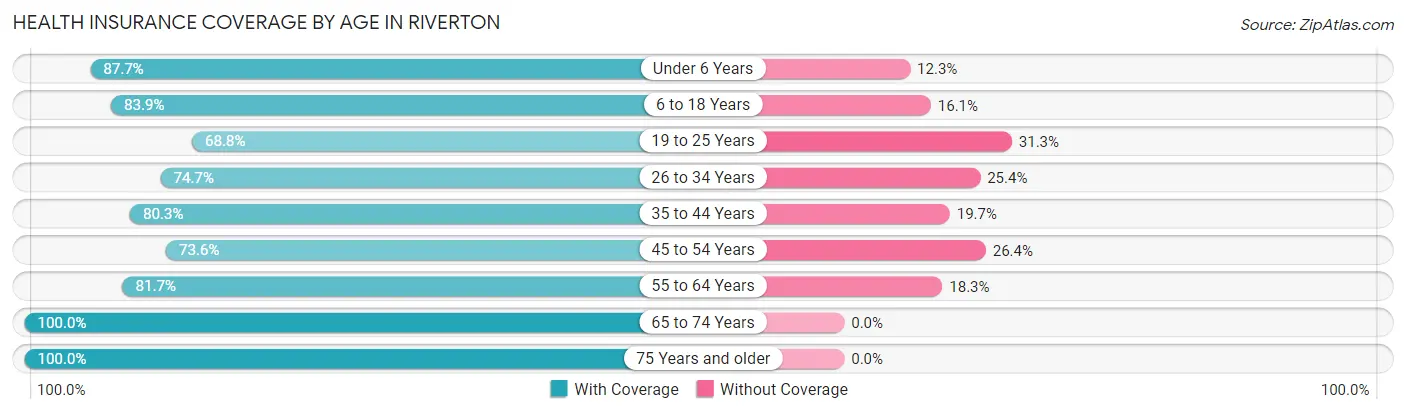
| Age Bracket | With Coverage | Without Coverage |
| Under 6 Years | 636 (87.7%) | 89 (12.3%) |
| 6 to 18 Years | 1,813 (83.9%) | 349 (16.1%) |
| 19 to 25 Years | 693 (68.8%) | 315 (31.2%) |
| 26 to 34 Years | 857 (74.7%) | 291 (25.4%) |
| 35 to 44 Years | 1,033 (80.3%) | 253 (19.7%) |
| 45 to 54 Years | 951 (73.6%) | 341 (26.4%) |
| 55 to 64 Years | 983 (81.7%) | 220 (18.3%) |
| 65 to 74 Years | 854 (100.0%) | 0 (0.0%) |
| 75 Years and older | 701 (100.0%) | 0 (0.0%) |
| Total | 8,521 (82.1%) | 1,858 (17.9%) |
Health Insurance Coverage by Citizenship Status in Riverton
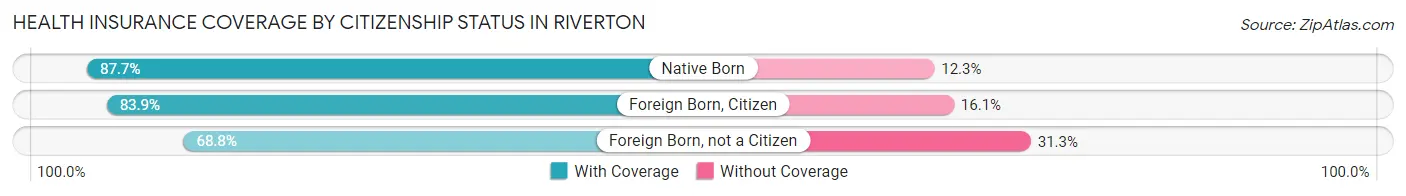
| Citizenship Status | With Coverage | Without Coverage |
| Native Born | 636 (87.7%) | 89 (12.3%) |
| Foreign Born, Citizen | 1,813 (83.9%) | 349 (16.1%) |
| Foreign Born, not a Citizen | 693 (68.8%) | 315 (31.2%) |
Health Insurance Coverage by Household Income in Riverton
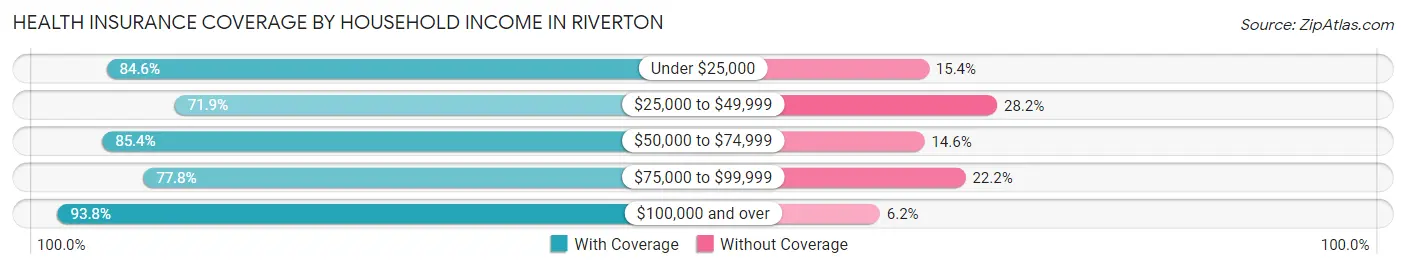
| Household Income | With Coverage | Without Coverage |
| Under $25,000 | 1,074 (84.6%) | 195 (15.4%) |
| $25,000 to $49,999 | 1,771 (71.9%) | 694 (28.1%) |
| $50,000 to $74,999 | 2,177 (85.4%) | 371 (14.6%) |
| $75,000 to $99,999 | 1,437 (77.8%) | 411 (22.2%) |
| $100,000 and over | 1,956 (93.8%) | 129 (6.2%) |
Public vs Private Health Insurance Coverage by Age in Riverton
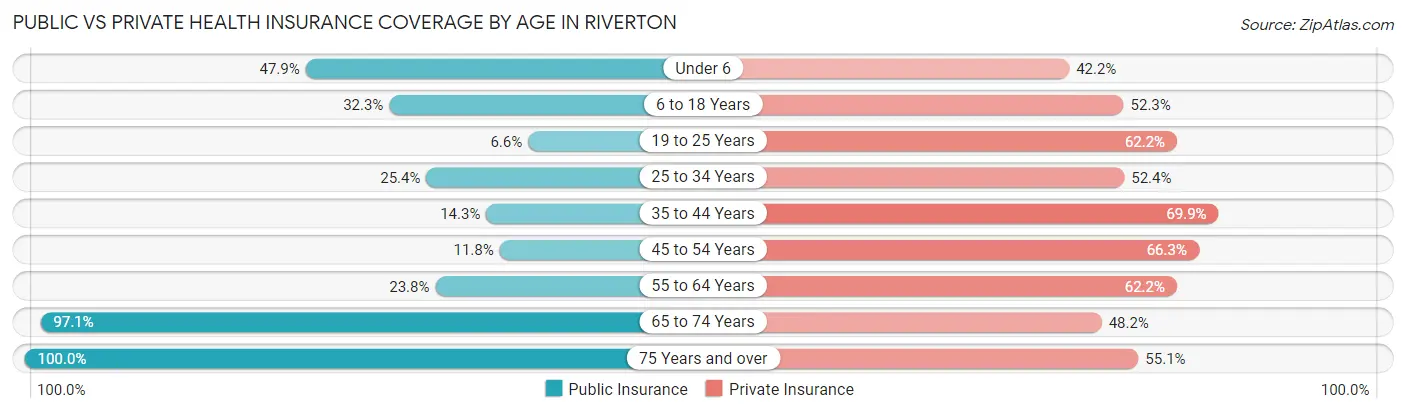
| Age Bracket | Public Insurance | Private Insurance |
| Under 6 | 347 (47.9%) | 306 (42.2%) |
| 6 to 18 Years | 699 (32.3%) | 1,131 (52.3%) |
| 19 to 25 Years | 66 (6.6%) | 627 (62.2%) |
| 25 to 34 Years | 292 (25.4%) | 602 (52.4%) |
| 35 to 44 Years | 184 (14.3%) | 899 (69.9%) |
| 45 to 54 Years | 153 (11.8%) | 856 (66.2%) |
| 55 to 64 Years | 286 (23.8%) | 748 (62.2%) |
| 65 to 74 Years | 829 (97.1%) | 412 (48.2%) |
| 75 Years and over | 701 (100.0%) | 386 (55.1%) |
| Total | 3,557 (34.3%) | 5,967 (57.5%) |
Disability Status by Sex by Age in Riverton
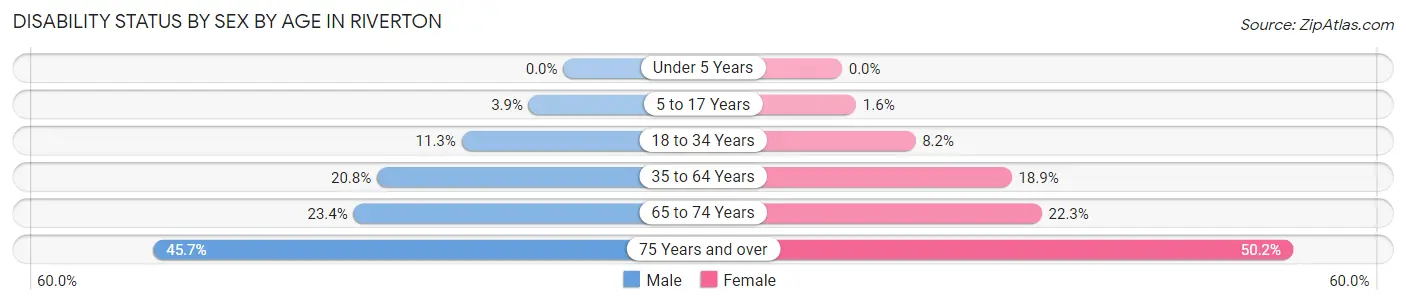
| Age Bracket | Male | Female |
| Under 5 Years | 0 (0.0%) | 0 (0.0%) |
| 5 to 17 Years | 37 (3.8%) | 16 (1.6%) |
| 18 to 34 Years | 133 (11.3%) | 101 (8.2%) |
| 35 to 64 Years | 385 (20.7%) | 364 (18.9%) |
| 65 to 74 Years | 104 (23.4%) | 91 (22.3%) |
| 75 Years and over | 121 (45.7%) | 219 (50.2%) |
Disability Class by Sex by Age in Riverton
Disability Class: Hearing Difficulty
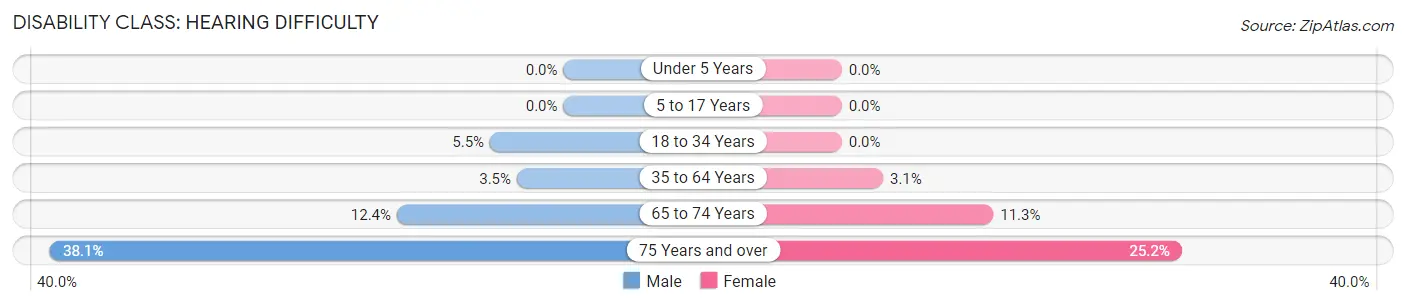
| Age Bracket | Male | Female |
| Under 5 Years | 0 (0.0%) | 0 (0.0%) |
| 5 to 17 Years | 0 (0.0%) | 0 (0.0%) |
| 18 to 34 Years | 64 (5.4%) | 0 (0.0%) |
| 35 to 64 Years | 64 (3.5%) | 59 (3.1%) |
| 65 to 74 Years | 55 (12.4%) | 46 (11.3%) |
| 75 Years and over | 101 (38.1%) | 110 (25.2%) |
Disability Class: Vision Difficulty
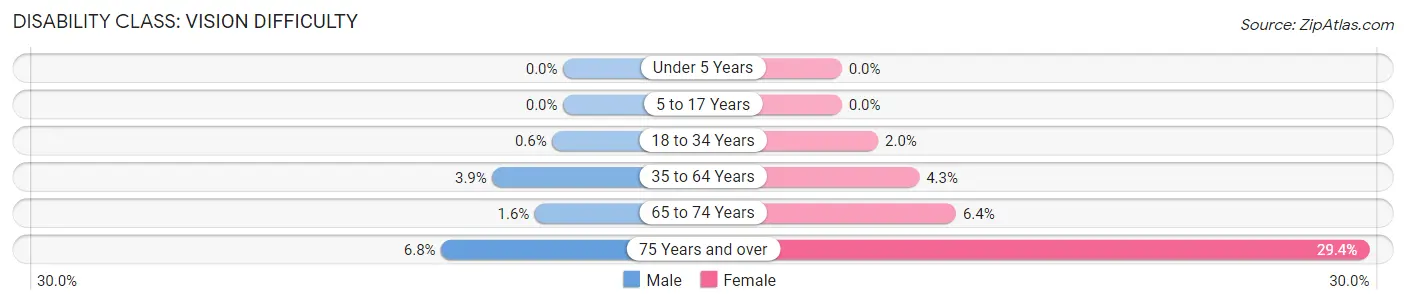
| Age Bracket | Male | Female |
| Under 5 Years | 0 (0.0%) | 0 (0.0%) |
| 5 to 17 Years | 0 (0.0%) | 0 (0.0%) |
| 18 to 34 Years | 7 (0.6%) | 25 (2.0%) |
| 35 to 64 Years | 73 (3.9%) | 83 (4.3%) |
| 65 to 74 Years | 7 (1.6%) | 26 (6.4%) |
| 75 Years and over | 18 (6.8%) | 128 (29.4%) |
Disability Class: Cognitive Difficulty
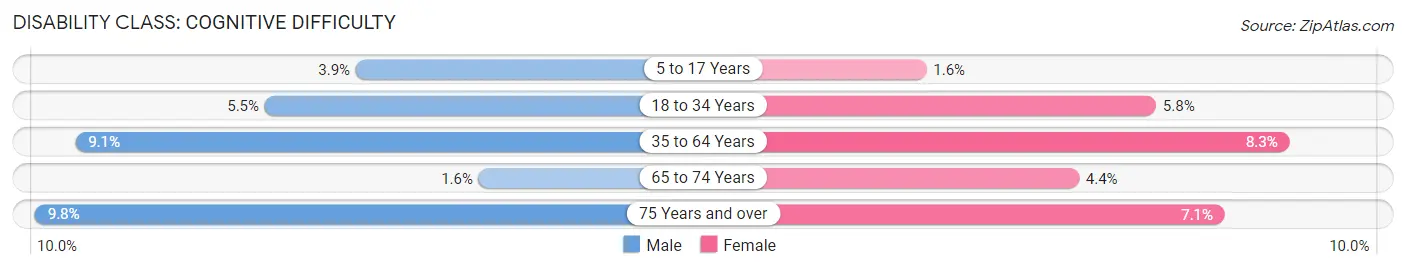
| Age Bracket | Male | Female |
| 5 to 17 Years | 37 (3.8%) | 16 (1.6%) |
| 18 to 34 Years | 65 (5.5%) | 72 (5.8%) |
| 35 to 64 Years | 168 (9.1%) | 160 (8.3%) |
| 65 to 74 Years | 7 (1.6%) | 18 (4.4%) |
| 75 Years and over | 26 (9.8%) | 31 (7.1%) |
Disability Class: Ambulatory Difficulty
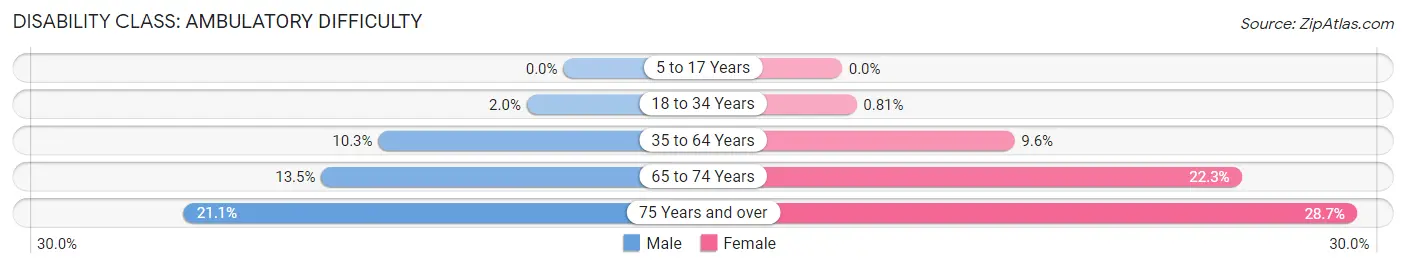
| Age Bracket | Male | Female |
| 5 to 17 Years | 0 (0.0%) | 0 (0.0%) |
| 18 to 34 Years | 24 (2.0%) | 10 (0.8%) |
| 35 to 64 Years | 191 (10.3%) | 185 (9.6%) |
| 65 to 74 Years | 60 (13.5%) | 91 (22.3%) |
| 75 Years and over | 56 (21.1%) | 125 (28.7%) |
Disability Class: Self-Care Difficulty
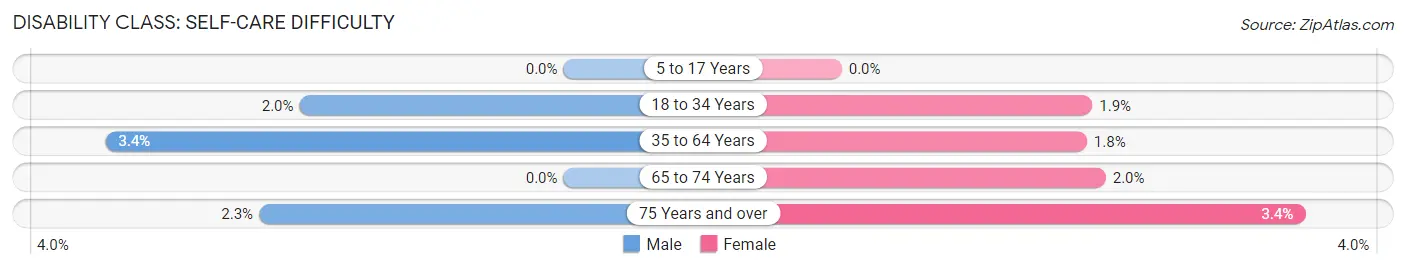
| Age Bracket | Male | Female |
| 5 to 17 Years | 0 (0.0%) | 0 (0.0%) |
| 18 to 34 Years | 23 (2.0%) | 23 (1.9%) |
| 35 to 64 Years | 63 (3.4%) | 35 (1.8%) |
| 65 to 74 Years | 0 (0.0%) | 8 (2.0%) |
| 75 Years and over | 6 (2.3%) | 15 (3.4%) |
Technology Access in Riverton
Computing Device Access in Riverton
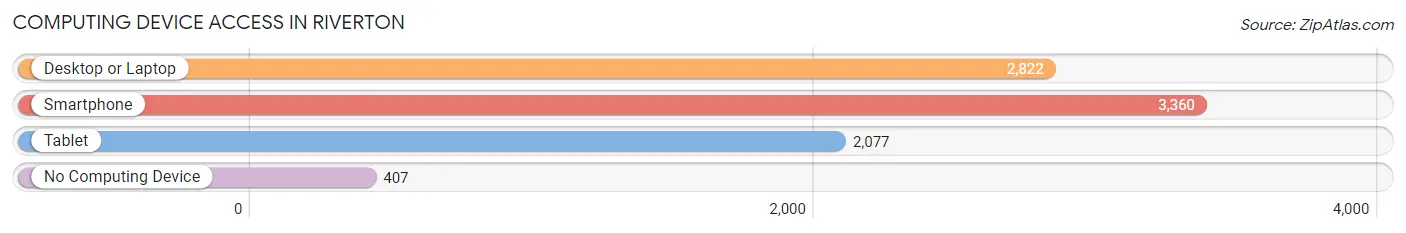
| Device Type | # Households | % Households |
| Desktop or Laptop | 2,822 | 68.4% |
| Smartphone | 3,360 | 81.5% |
| Tablet | 2,077 | 50.4% |
| No Computing Device | 407 | 9.9% |
| Total | 4,124 | 100.0% |
Internet Access in Riverton
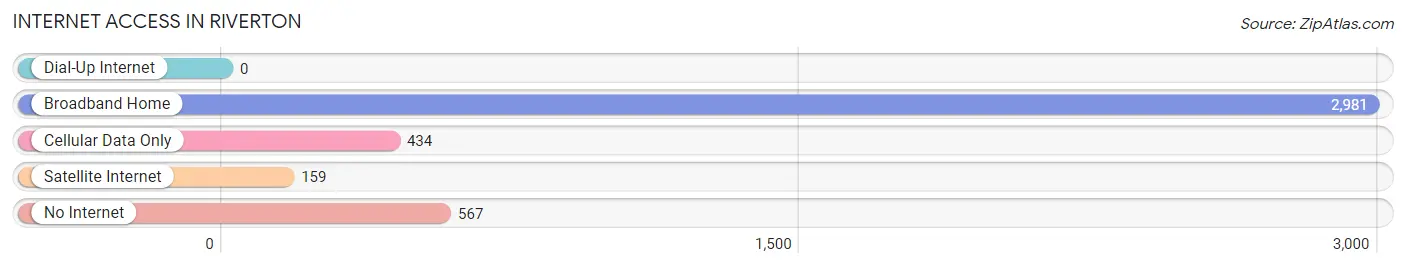
| Internet Type | # Households | % Households |
| Dial-Up Internet | 0 | 0.0% |
| Broadband Home | 2,981 | 72.3% |
| Cellular Data Only | 434 | 10.5% |
| Satellite Internet | 159 | 3.9% |
| No Internet | 567 | 13.8% |
| Total | 4,124 | 100.0% |
Riverton Summary
Riverton, Wyoming is a small city located in the Wind River Valley of Fremont County. It is the county seat and the largest city in the county. The city is situated on the banks of the Wind River, which is a tributary of the Green River. The city is located in the heart of the Rocky Mountains and is surrounded by the Wind River Indian Reservation.
History
The area that is now Riverton was first inhabited by the Shoshone and Arapaho tribes. The first white settlers arrived in the area in the late 1800s. The town was originally called “Riverside” and was established in 1906. The name was changed to Riverton in 1909.
The city was incorporated in 1910 and was the first city in Wyoming to be incorporated under the state’s new home rule law. The city was originally a farming and ranching community, but in the 1920s, oil and gas were discovered in the area. This led to an economic boom in the city and the population grew rapidly.
The city was also home to a large military base during World War II. The base was closed in the 1950s, but the city continued to grow and prosper.
Geography
Riverton is located in the Wind River Valley of Fremont County. The city is situated on the banks of the Wind River, which is a tributary of the Green River. The city is surrounded by the Wind River Indian Reservation.
The city has a total area of 8.2 square miles, of which 8.1 square miles is land and 0.1 square miles is water. The city is located at an elevation of 4,890 feet above sea level.
Economy
The economy of Riverton is largely based on agriculture, oil and gas, and tourism. The city is home to several large agricultural operations, including cattle ranches, wheat farms, and potato farms.
The oil and gas industry is also a major contributor to the local economy. The city is home to several oil and gas companies, including Anadarko Petroleum Corporation and Chevron Corporation.
Tourism is also an important part of the local economy. The city is home to several attractions, including the Wind River Indian Reservation, the Wind River Casino, and the Wind River Canyon.
Demographics
As of the 2010 census, the population of Riverton was 10,615. The racial makeup of the city was 87.3% White, 0.7% African American, 8.2% Native American, 0.3% Asian, 0.1% Pacific Islander, 0.7% from other races, and 2.7% from two or more races. Hispanic or Latino of any race were 3.3% of the population.
The median income for a household in the city was $41,944, and the median income for a family was $50,919. The per capita income for the city was $20,945. About 11.2% of families and 14.2% of the population were below the poverty line, including 19.2% of those under age 18 and 8.2% of those age 65 or over.
Common Questions
What is Per Capita Income in Riverton?
Per Capita income in Riverton is $25,653.
What is the Median Family Income in Riverton?
Median Family Income in Riverton is $70,804.
What is the Median Household income in Riverton?
Median Household Income in Riverton is $50,861.
What is Income or Wage Gap in Riverton?
Income or Wage Gap in Riverton is 3.5%.
Women in Riverton earn 96.5 cents for every dollar earned by a man.
What is Inequality or Gini Index in Riverton?
Inequality or Gini Index in Riverton is 0.38.
What is the Total Population of Riverton?
Total Population of Riverton is 10,733.
What is the Total Male Population of Riverton?
Total Male Population of Riverton is 5,275.
What is the Total Female Population of Riverton?
Total Female Population of Riverton is 5,458.
What is the Ratio of Males per 100 Females in Riverton?
There are 96.65 Males per 100 Females in Riverton.
What is the Ratio of Females per 100 Males in Riverton?
There are 103.47 Females per 100 Males in Riverton.
What is the Median Population Age in Riverton?
Median Population Age in Riverton is 36.4 Years.
What is the Average Family Size in Riverton
Average Family Size in Riverton is 3.3 People.
What is the Average Household Size in Riverton
Average Household Size in Riverton is 2.5 People.
How Large is the Labor Force in Riverton?
There are 5,447 People in the Labor Forcein in Riverton.
What is the Percentage of People in the Labor Force in Riverton?
65.0% of People are in the Labor Force in Riverton.
What is the Unemployment Rate in Riverton?
Unemployment Rate in Riverton is 7.1%.