Denison, IA Map & Demographics
Denison Map
Denison Overview
$25,944
PER CAPITA INCOME
$62,141
AVG FAMILY INCOME
$57,744
AVG HOUSEHOLD INCOME
19.4%
WAGE / INCOME GAP [ % ]
80.6¢/ $1
WAGE / INCOME GAP [ $ ]
0.44
INEQUALITY / GINI INDEX
8,316
TOTAL POPULATION
4,052
MALE POPULATION
4,264
FEMALE POPULATION
95.03
MALES / 100 FEMALES
105.23
FEMALES / 100 MALES
33.7
MEDIAN AGE
3.0
AVG FAMILY SIZE
2.6
AVG HOUSEHOLD SIZE
4,054
LABOR FORCE [ PEOPLE ]
63.1%
PERCENT IN LABOR FORCE
6.2%
UNEMPLOYMENT RATE
Denison Zip Codes
Denison Area Codes
Income in Denison
Income Overview in Denison
Per Capita Income in Denison is $25,944, while median incomes of families and households are $62,141 and $57,744 respectively.
| Characteristic | Number | Measure |
| Per Capita Income | 8,316 | $25,944 |
| Median Family Income | 2,258 | $62,141 |
| Mean Family Income | 2,258 | $80,229 |
| Median Household Income | 3,029 | $57,744 |
| Mean Household Income | 3,029 | $71,469 |
| Income Deficit | 2,258 | $0 |
| Wage / Income Gap (%) | 8,316 | 19.35% |
| Wage / Income Gap ($) | 8,316 | 80.65¢ per $1 |
| Gini / Inequality Index | 8,316 | 0.44 |
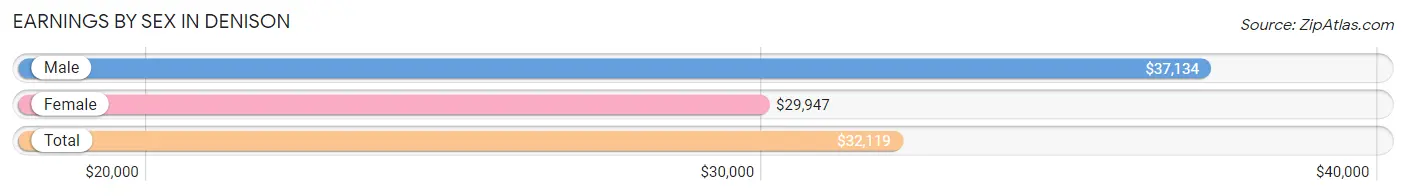
Earnings by Sex in Denison
Average Earnings in Denison are $32,119, $37,134 for men and $29,947 for women, a difference of 19.4%.
| Sex | Number | Average Earnings |
| Male | 2,333 (54.7%) | $37,134 |
| Female | 1,932 (45.3%) | $29,947 |
| Total | 4,265 (100.0%) | $32,119 |
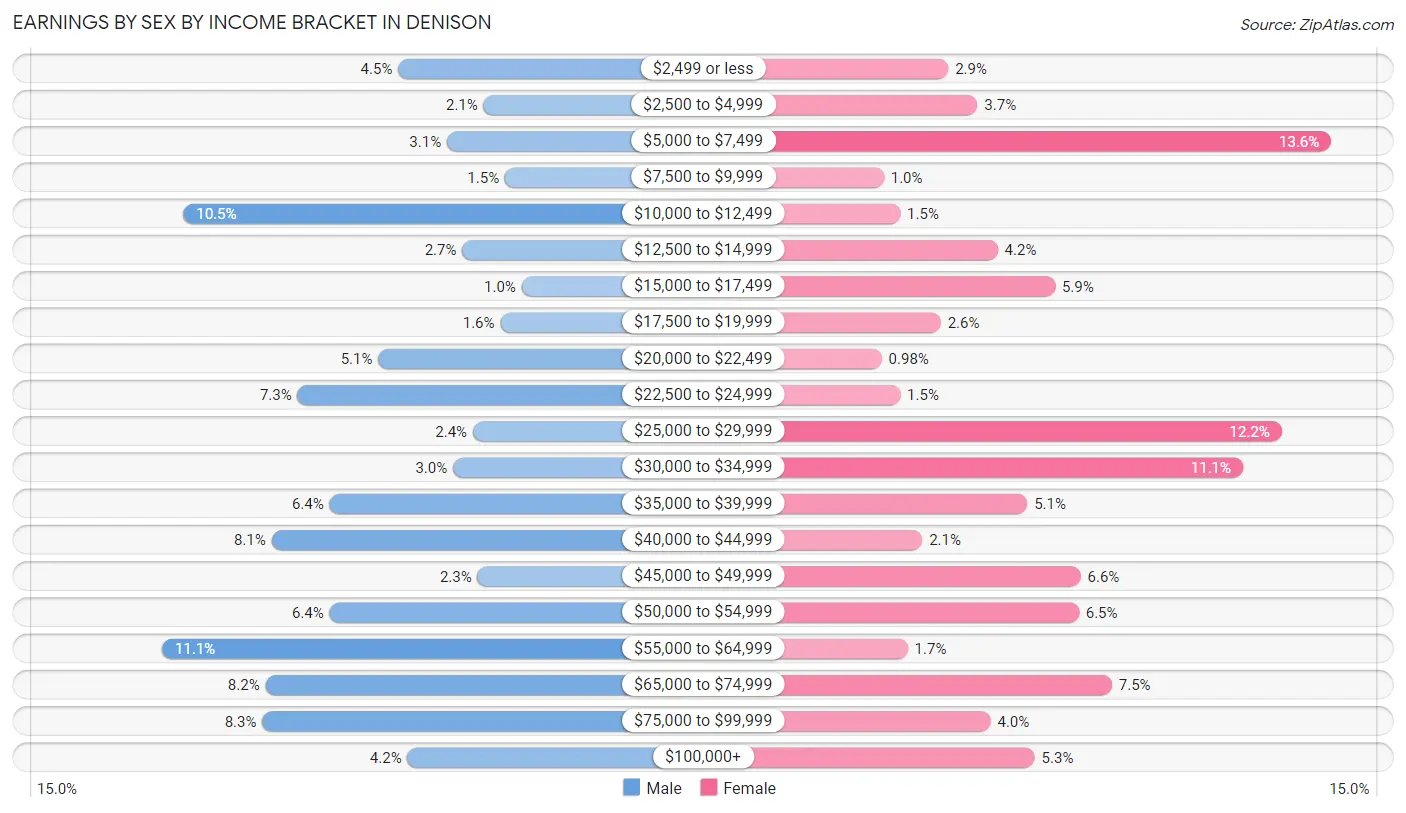
Earnings by Sex by Income Bracket in Denison
The most common earnings brackets in Denison are $55,000 to $64,999 for men (260 | 11.1%) and $5,000 to $7,499 for women (263 | 13.6%).
| Income | Male | Female |
| $2,499 or less | 105 (4.5%) | 55 (2.9%) |
| $2,500 to $4,999 | 49 (2.1%) | 71 (3.7%) |
| $5,000 to $7,499 | 73 (3.1%) | 263 (13.6%) |
| $7,500 to $9,999 | 35 (1.5%) | 20 (1.0%) |
| $10,000 to $12,499 | 246 (10.5%) | 29 (1.5%) |
| $12,500 to $14,999 | 63 (2.7%) | 82 (4.2%) |
| $15,000 to $17,499 | 24 (1.0%) | 113 (5.9%) |
| $17,500 to $19,999 | 38 (1.6%) | 51 (2.6%) |
| $20,000 to $22,499 | 118 (5.1%) | 19 (1.0%) |
| $22,500 to $24,999 | 171 (7.3%) | 29 (1.5%) |
| $25,000 to $29,999 | 56 (2.4%) | 236 (12.2%) |
| $30,000 to $34,999 | 69 (3.0%) | 215 (11.1%) |
| $35,000 to $39,999 | 150 (6.4%) | 98 (5.1%) |
| $40,000 to $44,999 | 188 (8.1%) | 41 (2.1%) |
| $45,000 to $49,999 | 53 (2.3%) | 127 (6.6%) |
| $50,000 to $54,999 | 150 (6.4%) | 126 (6.5%) |
| $55,000 to $64,999 | 260 (11.1%) | 33 (1.7%) |
| $65,000 to $74,999 | 192 (8.2%) | 144 (7.4%) |
| $75,000 to $99,999 | 194 (8.3%) | 78 (4.0%) |
| $100,000+ | 99 (4.2%) | 102 (5.3%) |
| Total | 2,333 (100.0%) | 1,932 (100.0%) |
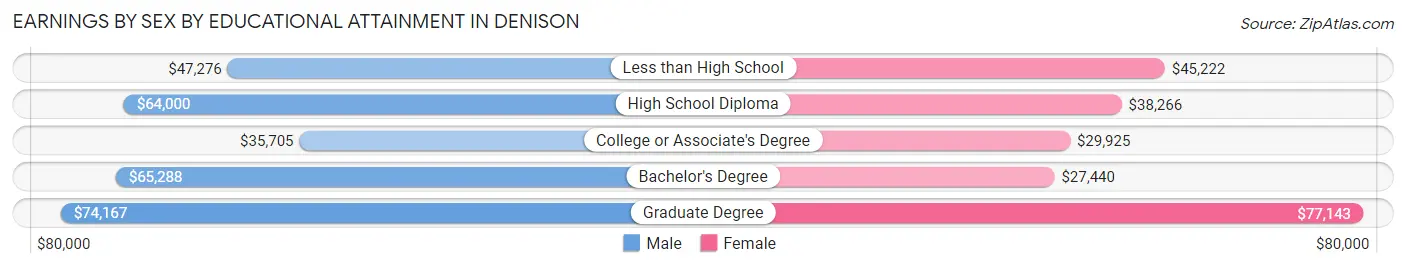
Earnings by Sex by Educational Attainment in Denison
Average earnings in Denison are $44,610 for men and $35,526 for women, a difference of 20.4%. Men with an educational attainment of graduate degree enjoy the highest average annual earnings of $74,167, while those with college or associate's degree education earn the least with $35,705. Women with an educational attainment of graduate degree earn the most with the average annual earnings of $77,143, while those with bachelor's degree education have the smallest earnings of $27,440.
| Educational Attainment | Male Income | Female Income |
| Less than High School | $47,276 | $45,222 |
| High School Diploma | $64,000 | $38,266 |
| College or Associate's Degree | $35,705 | $29,925 |
| Bachelor's Degree | $65,288 | $27,440 |
| Graduate Degree | $74,167 | $77,143 |
| Total | $44,610 | $35,526 |
Family Income in Denison
Family Income Brackets in Denison
According to the Denison family income data, there are 513 families falling into the $50,000 to $74,999 income range, which is the most common income bracket and makes up 22.7% of all families.

| Income Bracket | # Families | % Families |
| Less than $10,000 | 314 | 13.9% |
| $10,000 to $14,999 | 0 | 0.0% |
| $15,000 to $24,999 | 212 | 9.4% |
| $25,000 to $34,999 | 75 | 3.3% |
| $35,000 to $49,999 | 156 | 6.9% |
| $50,000 to $74,999 | 513 | 22.7% |
| $75,000 to $99,999 | 271 | 12.0% |
| $100,000 to $149,999 | 488 | 21.6% |
| $150,000 to $199,999 | 79 | 3.5% |
| $200,000+ | 151 | 6.7% |
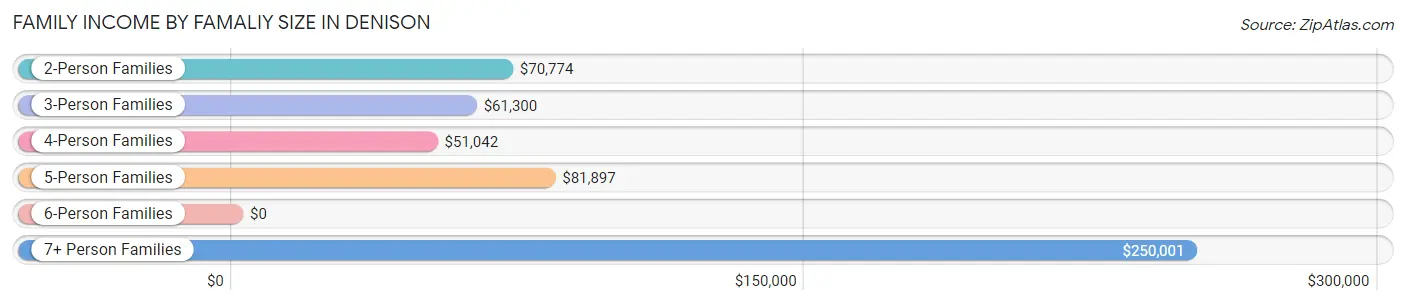
Family Income by Famaliy Size in Denison
7+ person families (169 | 7.5%) account for the highest median family income in Denison with $250,001 per family, while 7+ person families (169 | 7.5%) have the highest median income of $35,714 per family member.
| Income Bracket | # Families | Median Income |
| 2-Person Families | 873 (38.7%) | $70,774 |
| 3-Person Families | 342 (15.1%) | $61,300 |
| 4-Person Families | 617 (27.3%) | $51,042 |
| 5-Person Families | 234 (10.4%) | $81,897 |
| 6-Person Families | 23 (1.0%) | $0 |
| 7+ Person Families | 169 (7.5%) | $250,001 |
| Total | 2,258 (100.0%) | $62,141 |
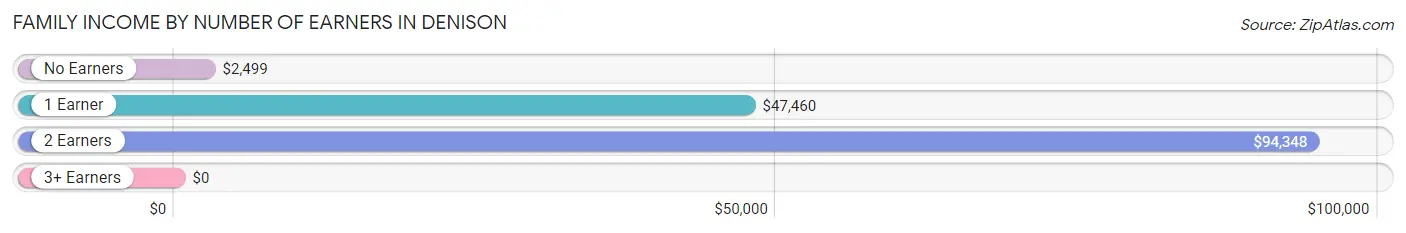
Family Income by Number of Earners in Denison
| Number of Earners | # Families | Median Income |
| No Earners | 440 (19.5%) | $2,499 |
| 1 Earner | 508 (22.5%) | $47,460 |
| 2 Earners | 1,062 (47.0%) | $94,348 |
| 3+ Earners | 248 (11.0%) | $0 |
| Total | 2,258 (100.0%) | $62,141 |
Household Income in Denison
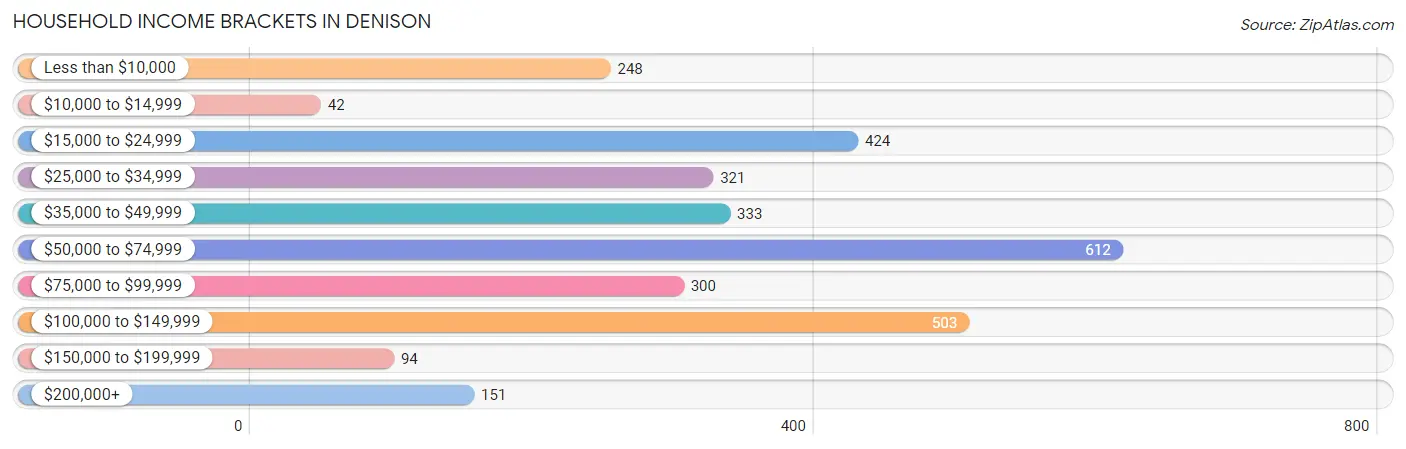
Household Income Brackets in Denison
With 612 households falling in the category, the $50,000 to $74,999 income range is the most frequent in Denison, accounting for 20.2% of all households. In contrast, only 42 households (1.4%) fall into the $10,000 to $14,999 income bracket, making it the least populous group.
| Income Bracket | # Households | % Households |
| Less than $10,000 | 248 | 8.2% |
| $10,000 to $14,999 | 42 | 1.4% |
| $15,000 to $24,999 | 424 | 14.0% |
| $25,000 to $34,999 | 321 | 10.6% |
| $35,000 to $49,999 | 333 | 11.0% |
| $50,000 to $74,999 | 612 | 20.2% |
| $75,000 to $99,999 | 300 | 9.9% |
| $100,000 to $149,999 | 503 | 16.6% |
| $150,000 to $199,999 | 94 | 3.1% |
| $200,000+ | 151 | 5.0% |
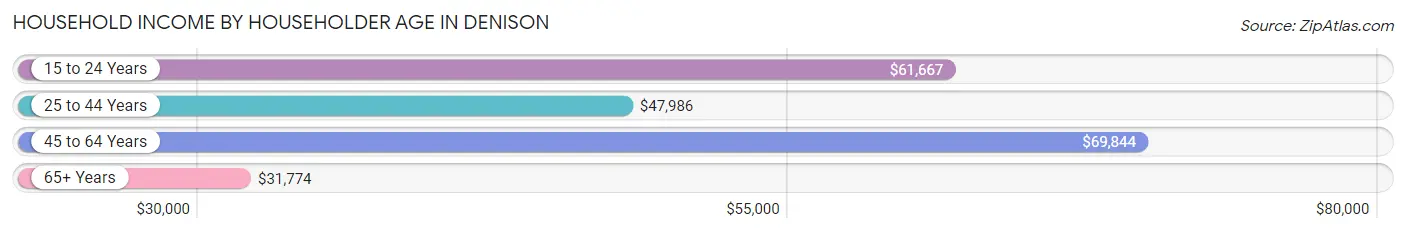
Household Income by Householder Age in Denison
The median household income in Denison is $57,744, with the highest median household income of $69,844 found in the 45 to 64 years age bracket for the primary householder. A total of 1,008 households (33.3%) fall into this category. Meanwhile, the 65+ years age bracket for the primary householder has the lowest median household income of $31,774, with 648 households (21.4%) in this group.
| Income Bracket | # Households | Median Income |
| 15 to 24 Years | 122 (4.0%) | $61,667 |
| 25 to 44 Years | 1,251 (41.3%) | $47,986 |
| 45 to 64 Years | 1,008 (33.3%) | $69,844 |
| 65+ Years | 648 (21.4%) | $31,774 |
| Total | 3,029 (100.0%) | $57,744 |
Poverty in Denison
Income Below Poverty by Sex and Age in Denison
With 16.8% poverty level for males and 24.7% for females among the residents of Denison, 5 year old males and 5 year old females are the most vulnerable to poverty, with 86 males (69.4%) and 34 females (100.0%) in their respective age groups living below the poverty level.
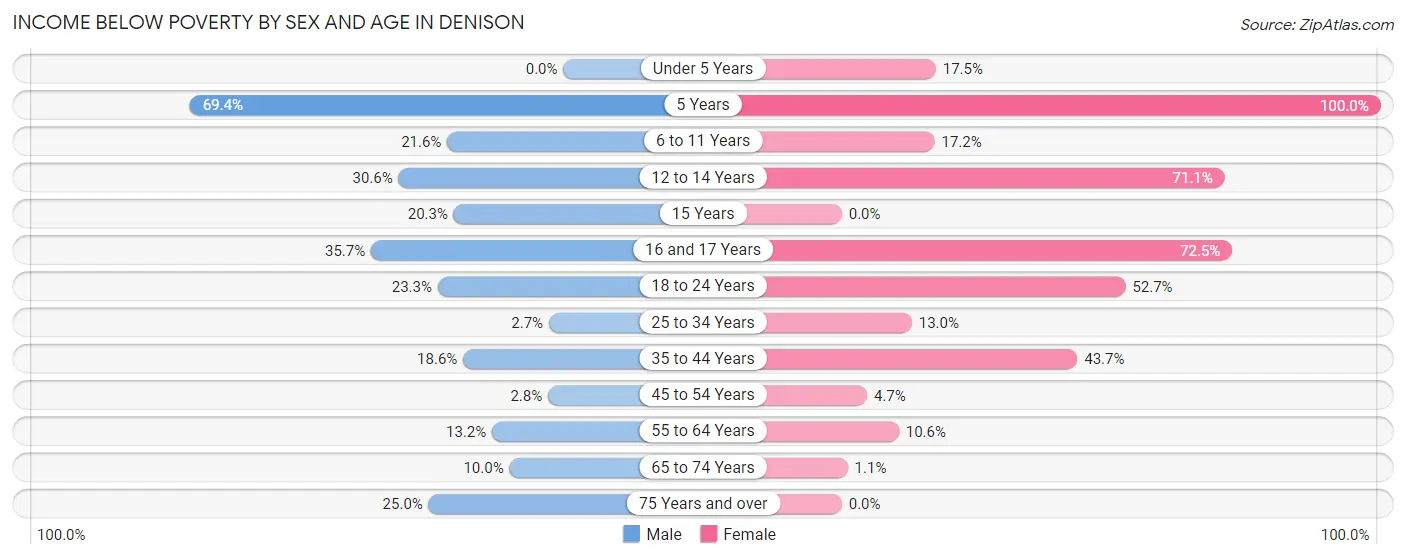
| Age Bracket | Male | Female |
| Under 5 Years | 0 (0.0%) | 52 (17.4%) |
| 5 Years | 86 (69.4%) | 34 (100.0%) |
| 6 to 11 Years | 47 (21.6%) | 89 (17.2%) |
| 12 to 14 Years | 93 (30.6%) | 81 (71.1%) |
| 15 Years | 24 (20.3%) | 0 (0.0%) |
| 16 and 17 Years | 91 (35.7%) | 50 (72.5%) |
| 18 to 24 Years | 107 (23.3%) | 268 (52.6%) |
| 25 to 34 Years | 19 (2.7%) | 60 (13.0%) |
| 35 to 44 Years | 64 (18.6%) | 320 (43.7%) |
| 45 to 54 Years | 12 (2.8%) | 16 (4.7%) |
| 55 to 64 Years | 48 (13.2%) | 58 (10.6%) |
| 65 to 74 Years | 31 (10.0%) | 3 (1.1%) |
| 75 Years and over | 49 (25.0%) | 0 (0.0%) |
| Total | 671 (16.8%) | 1,031 (24.7%) |
Income Above Poverty by Sex and Age in Denison
According to the poverty statistics in Denison, males aged under 5 years and females aged 75 years and over are the age groups that are most secure financially, with 100.0% of males and 100.0% of females in these age groups living above the poverty line.
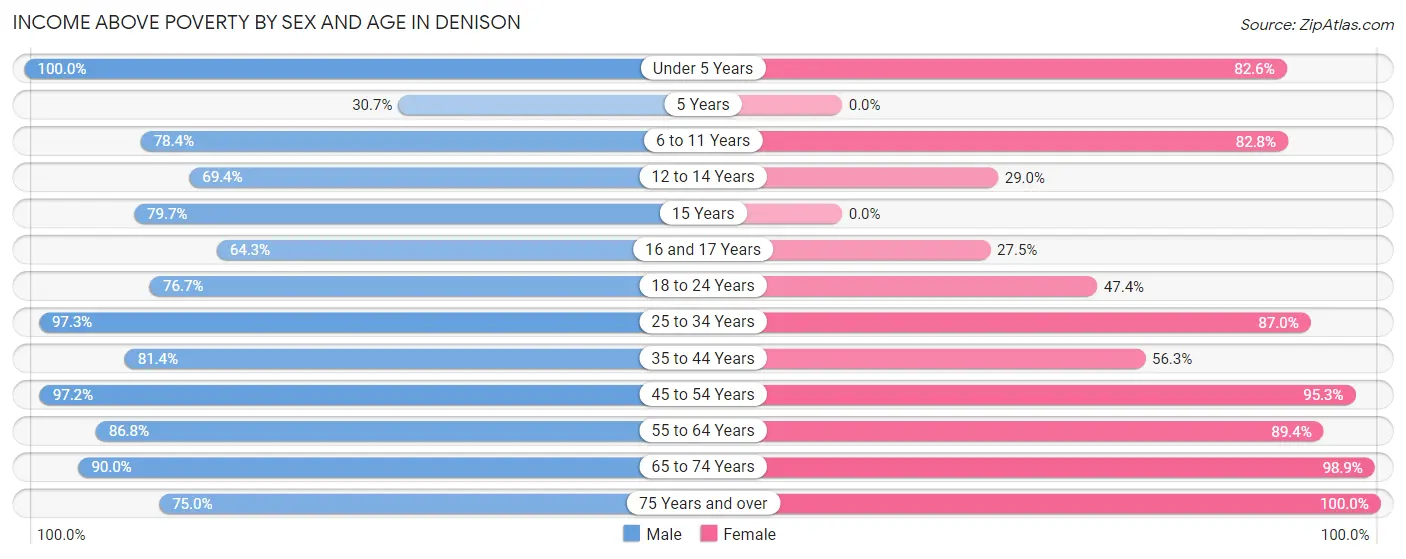
| Age Bracket | Male | Female |
| Under 5 Years | 165 (100.0%) | 246 (82.6%) |
| 5 Years | 38 (30.6%) | 0 (0.0%) |
| 6 to 11 Years | 171 (78.4%) | 428 (82.8%) |
| 12 to 14 Years | 211 (69.4%) | 33 (28.9%) |
| 15 Years | 94 (79.7%) | 0 (0.0%) |
| 16 and 17 Years | 164 (64.3%) | 19 (27.5%) |
| 18 to 24 Years | 352 (76.7%) | 241 (47.3%) |
| 25 to 34 Years | 693 (97.3%) | 402 (87.0%) |
| 35 to 44 Years | 280 (81.4%) | 412 (56.3%) |
| 45 to 54 Years | 410 (97.2%) | 326 (95.3%) |
| 55 to 64 Years | 315 (86.8%) | 490 (89.4%) |
| 65 to 74 Years | 279 (90.0%) | 273 (98.9%) |
| 75 Years and over | 147 (75.0%) | 272 (100.0%) |
| Total | 3,319 (83.2%) | 3,142 (75.3%) |
Income Below Poverty Among Married-Couple Families in Denison
The poverty statistics for married-couple families in Denison show that 3.9% or 55 of the total 1,421 families live below the poverty line. Families with no children have the highest poverty rate of 6.8%, comprising of 55 families. On the other hand, families with 1 or 2 children have the lowest poverty rate of 0.0%, which includes 0 families.
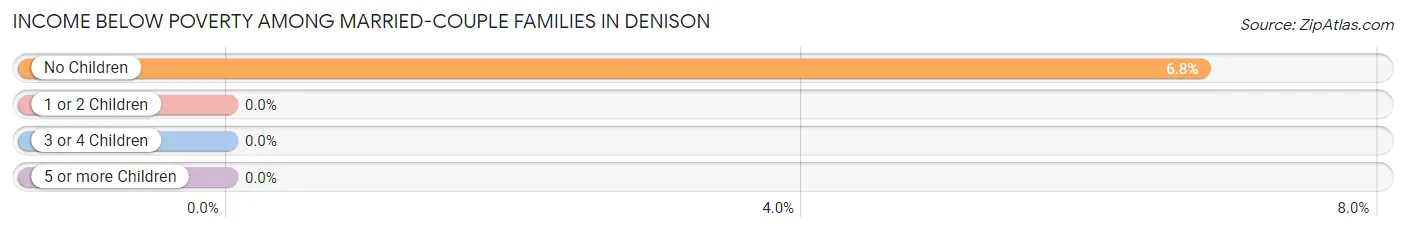
| Children | Above Poverty | Below Poverty |
| No Children | 758 (93.2%) | 55 (6.8%) |
| 1 or 2 Children | 280 (100.0%) | 0 (0.0%) |
| 3 or 4 Children | 296 (100.0%) | 0 (0.0%) |
| 5 or more Children | 32 (100.0%) | 0 (0.0%) |
| Total | 1,366 (96.1%) | 55 (3.9%) |
Income Below Poverty Among Single-Parent Households in Denison
According to the poverty data in Denison, 29.5% or 64 single-father households and 59.0% or 366 single-mother households are living below the poverty line. Among single-father households, those with 3 or 4 children have the highest poverty rate, with 64 households (90.1%) experiencing poverty. Likewise, among single-mother households, those with 1 or 2 children have the highest poverty rate, with 243 households (61.4%) falling below the poverty line.
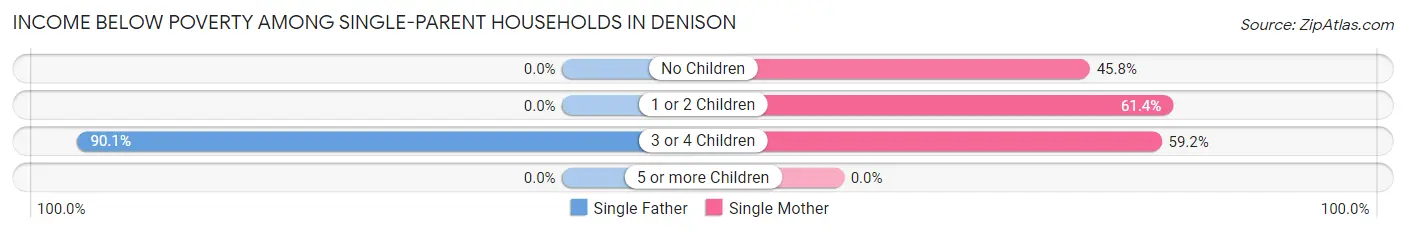
| Children | Single Father | Single Mother |
| No Children | 0 (0.0%) | 33 (45.8%) |
| 1 or 2 Children | 0 (0.0%) | 243 (61.4%) |
| 3 or 4 Children | 64 (90.1%) | 90 (59.2%) |
| 5 or more Children | 0 (0.0%) | 0 (0.0%) |
| Total | 64 (29.5%) | 366 (59.0%) |
Income Below Poverty Among Married-Couple vs Single-Parent Households in Denison
The poverty data for Denison shows that 55 of the married-couple family households (3.9%) and 430 of the single-parent households (51.4%) are living below the poverty level. Within the married-couple family households, those with no children have the highest poverty rate, with 55 households (6.8%) falling below the poverty line. Among the single-parent households, those with 3 or 4 children have the highest poverty rate, with 154 household (69.1%) living below poverty.
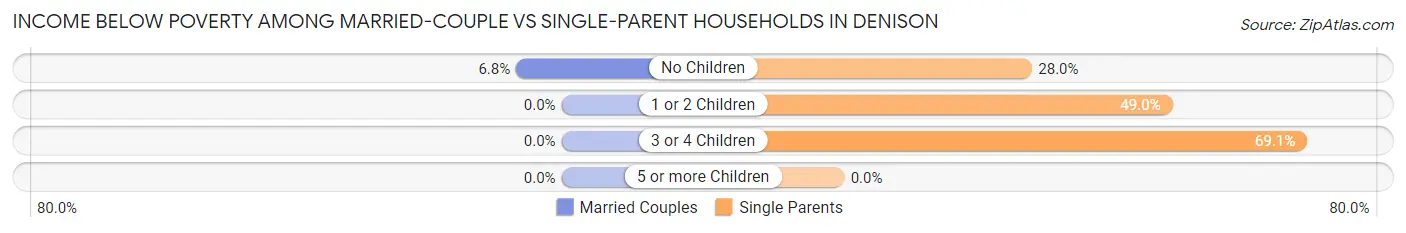
| Children | Married-Couple Families | Single-Parent Households |
| No Children | 55 (6.8%) | 33 (28.0%) |
| 1 or 2 Children | 0 (0.0%) | 243 (49.0%) |
| 3 or 4 Children | 0 (0.0%) | 154 (69.1%) |
| 5 or more Children | 0 (0.0%) | 0 (0.0%) |
| Total | 55 (3.9%) | 430 (51.4%) |
Race in Denison
The most populous races in Denison are White / Caucasian (5,399 | 64.9%), Hispanic or Latino (4,153 | 49.9%), and Two or more Races (1,238 | 14.9%).
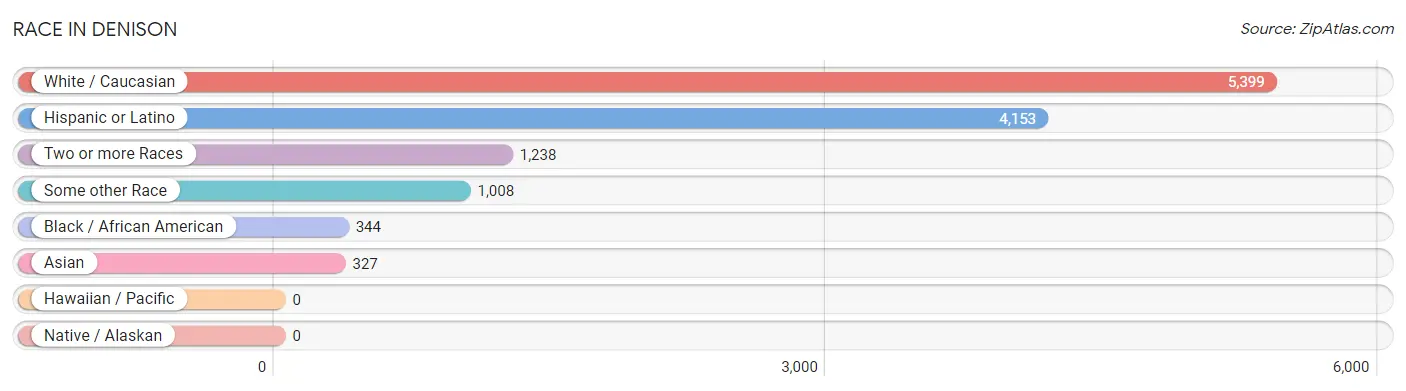
| Race | # Population | % Population |
| Asian | 327 | 3.9% |
| Black / African American | 344 | 4.1% |
| Hawaiian / Pacific | 0 | 0.0% |
| Hispanic or Latino | 4,153 | 49.9% |
| Native / Alaskan | 0 | 0.0% |
| White / Caucasian | 5,399 | 64.9% |
| Two or more Races | 1,238 | 14.9% |
| Some other Race | 1,008 | 12.1% |
| Total | 8,316 | 100.0% |
Ancestry in Denison
The most populous ancestries reported in Denison are Mexican (2,457 | 29.5%), German (1,698 | 20.4%), Central American (1,670 | 20.1%), Salvadoran (1,185 | 14.2%), and Guatemalan (485 | 5.8%), together accounting for 90.1% of all Denison residents.
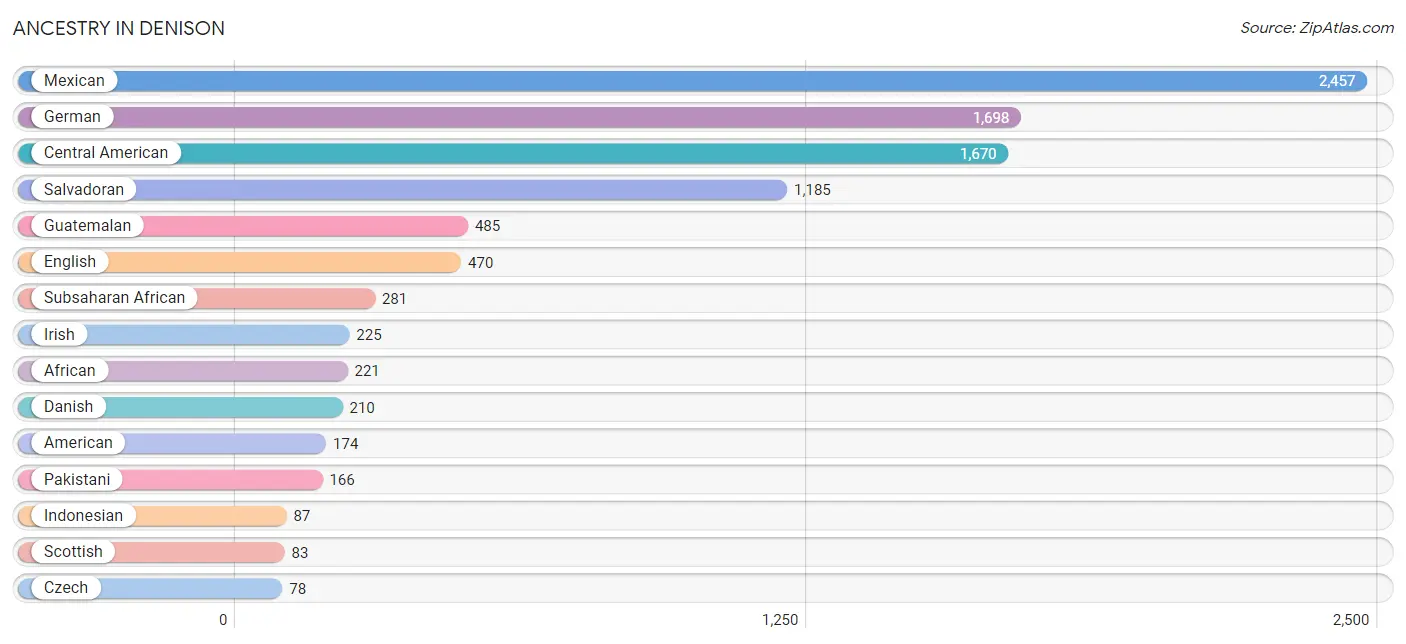
| Ancestry | # Population | % Population |
| African | 221 | 2.7% |
| American | 174 | 2.1% |
| British | 10 | 0.1% |
| Burmese | 53 | 0.6% |
| Central American | 1,670 | 20.1% |
| Czech | 78 | 0.9% |
| Czechoslovakian | 9 | 0.1% |
| Danish | 210 | 2.5% |
| Dutch | 51 | 0.6% |
| Eastern European | 9 | 0.1% |
| English | 470 | 5.7% |
| Ethiopian | 10 | 0.1% |
| European | 29 | 0.4% |
| Finnish | 9 | 0.1% |
| French | 38 | 0.5% |
| French Canadian | 17 | 0.2% |
| German | 1,698 | 20.4% |
| Greek | 7 | 0.1% |
| Guatemalan | 485 | 5.8% |
| Indian (Asian) | 31 | 0.4% |
| Indonesian | 87 | 1.1% |
| Irish | 225 | 2.7% |
| Lithuanian | 12 | 0.1% |
| Mexican | 2,457 | 29.5% |
| Mexican American Indian | 7 | 0.1% |
| Native Hawaiian | 28 | 0.3% |
| Norwegian | 29 | 0.4% |
| Pakistani | 166 | 2.0% |
| Polish | 27 | 0.3% |
| Salvadoran | 1,185 | 14.2% |
| Scandinavian | 14 | 0.2% |
| Scotch-Irish | 5 | 0.1% |
| Scottish | 83 | 1.0% |
| Subsaharan African | 281 | 3.4% |
| Sudanese | 50 | 0.6% |
| Swedish | 17 | 0.2% |
| Swiss | 15 | 0.2% |
| Welsh | 39 | 0.5% | View All 38 Rows |
Immigrants in Denison
The most numerous immigrant groups reported in Denison came from Central America (1,881 | 22.6%), Latin America (1,881 | 22.6%), Mexico (1,087 | 13.1%), El Salvador (403 | 4.9%), and Guatemala (391 | 4.7%), together accounting for 67.9% of all Denison residents.
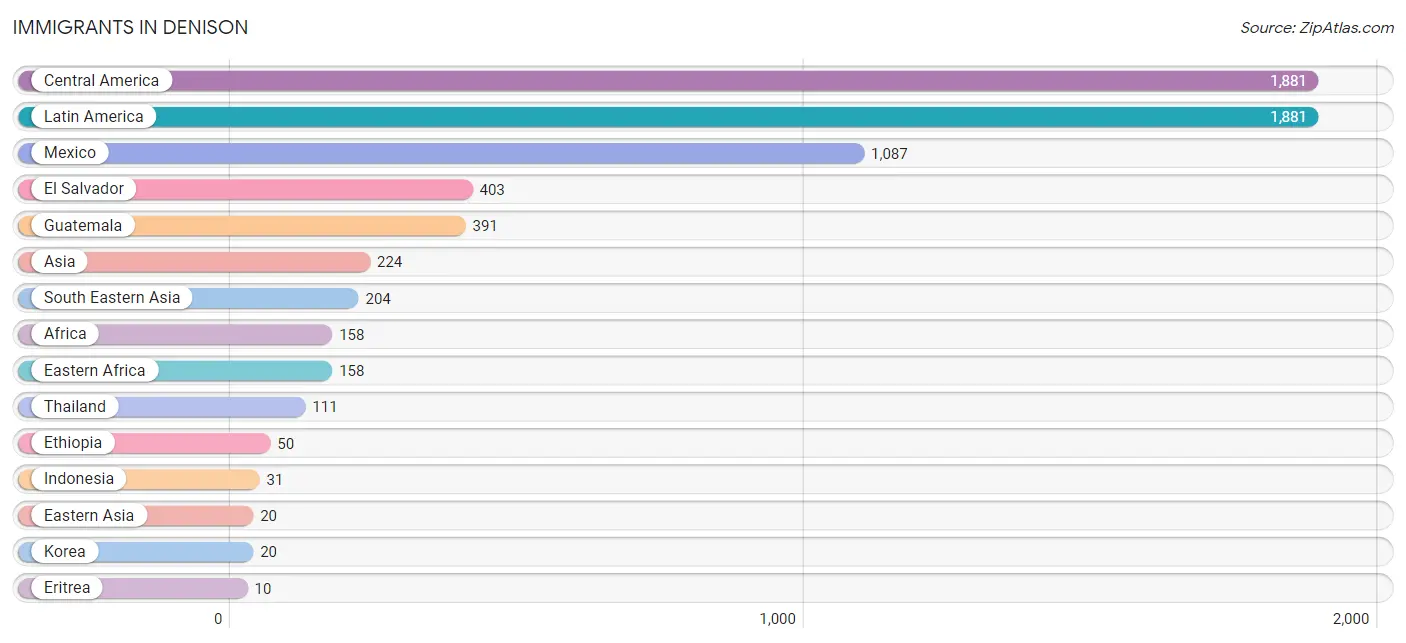
| Immigration Origin | # Population | % Population |
| Africa | 158 | 1.9% |
| Asia | 224 | 2.7% |
| Central America | 1,881 | 22.6% |
| Eastern Africa | 158 | 1.9% |
| Eastern Asia | 20 | 0.2% |
| El Salvador | 403 | 4.9% |
| Eritrea | 10 | 0.1% |
| Ethiopia | 50 | 0.6% |
| Europe | 9 | 0.1% |
| Germany | 9 | 0.1% |
| Guatemala | 391 | 4.7% |
| Indonesia | 31 | 0.4% |
| Korea | 20 | 0.2% |
| Latin America | 1,881 | 22.6% |
| Mexico | 1,087 | 13.1% |
| South Eastern Asia | 204 | 2.5% |
| Thailand | 111 | 1.3% |
| Western Europe | 9 | 0.1% | View All 18 Rows |
Sex and Age in Denison
Sex and Age in Denison
The most populous age groups in Denison are 15 to 19 Years (517 | 12.8%) for men and 35 to 39 Years (494 | 11.6%) for women.
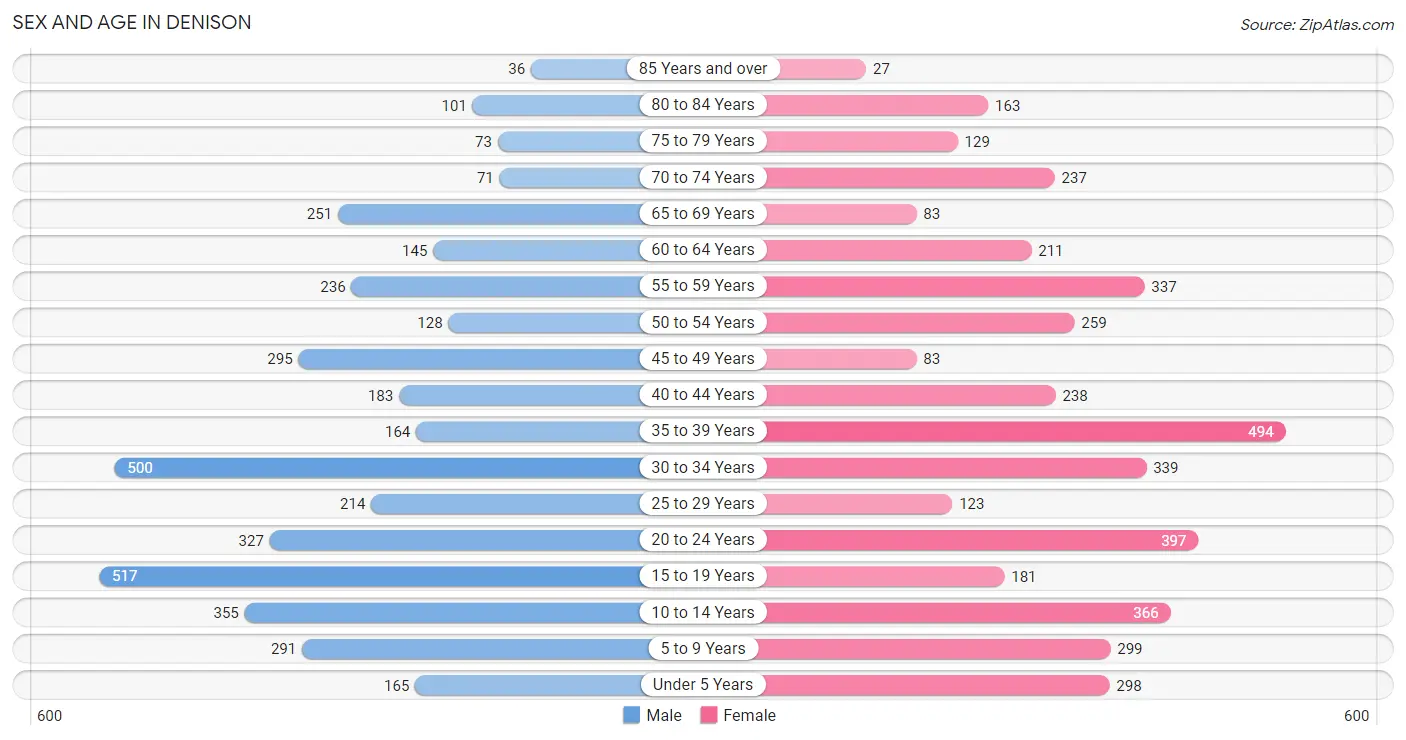
| Age Bracket | Male | Female |
| Under 5 Years | 165 (4.1%) | 298 (7.0%) |
| 5 to 9 Years | 291 (7.2%) | 299 (7.0%) |
| 10 to 14 Years | 355 (8.8%) | 366 (8.6%) |
| 15 to 19 Years | 517 (12.8%) | 181 (4.2%) |
| 20 to 24 Years | 327 (8.1%) | 397 (9.3%) |
| 25 to 29 Years | 214 (5.3%) | 123 (2.9%) |
| 30 to 34 Years | 500 (12.3%) | 339 (8.0%) |
| 35 to 39 Years | 164 (4.1%) | 494 (11.6%) |
| 40 to 44 Years | 183 (4.5%) | 238 (5.6%) |
| 45 to 49 Years | 295 (7.3%) | 83 (1.9%) |
| 50 to 54 Years | 128 (3.2%) | 259 (6.1%) |
| 55 to 59 Years | 236 (5.8%) | 337 (7.9%) |
| 60 to 64 Years | 145 (3.6%) | 211 (5.0%) |
| 65 to 69 Years | 251 (6.2%) | 83 (1.9%) |
| 70 to 74 Years | 71 (1.8%) | 237 (5.6%) |
| 75 to 79 Years | 73 (1.8%) | 129 (3.0%) |
| 80 to 84 Years | 101 (2.5%) | 163 (3.8%) |
| 85 Years and over | 36 (0.9%) | 27 (0.6%) |
| Total | 4,052 (100.0%) | 4,264 (100.0%) |
Families and Households in Denison
Median Family Size in Denison
The median family size in Denison is 3.01 persons per family, with single female/mother families (620 | 27.5%) accounting for the largest median family size of 3.17 persons per family. On the other hand, single male/father families (217 | 9.6%) represent the smallest median family size with 2.71 persons per family.
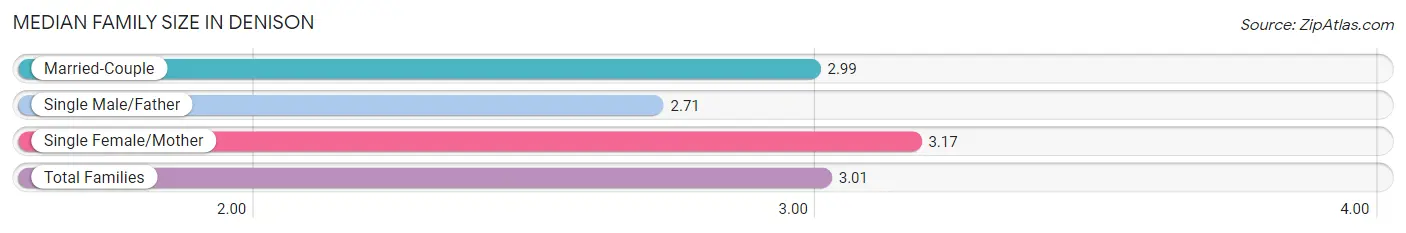
| Family Type | # Families | Family Size |
| Married-Couple | 1,421 (62.9%) | 2.99 |
| Single Male/Father | 217 (9.6%) | 2.71 |
| Single Female/Mother | 620 (27.5%) | 3.17 |
| Total Families | 2,258 (100.0%) | 3.01 |
Median Household Size in Denison
The median household size in Denison is 2.59 persons per household, with single female/mother households (620 | 20.5%) accounting for the largest median household size of 3.35 persons per household. non-family households (771 | 25.5%) represent the smallest median household size with 1.14 persons per household.
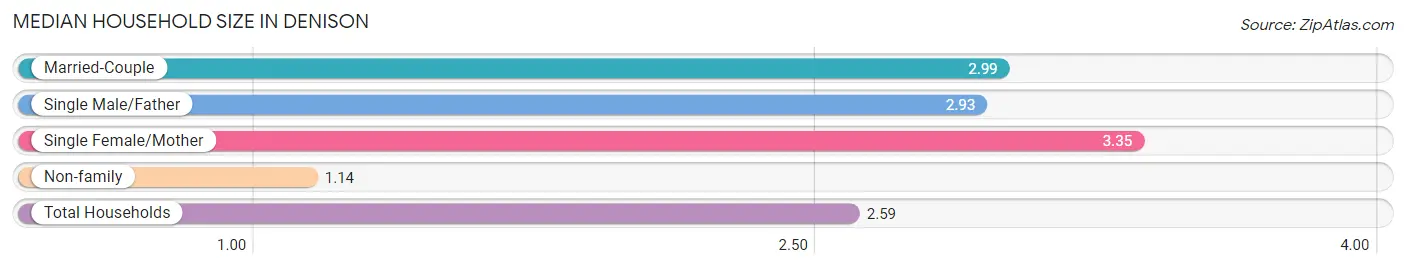
| Household Type | # Households | Household Size |
| Married-Couple | 1,421 (46.9%) | 2.99 |
| Single Male/Father | 217 (7.2%) | 2.93 |
| Single Female/Mother | 620 (20.5%) | 3.35 |
| Non-family | 771 (25.5%) | 1.14 |
| Total Households | 3,029 (100.0%) | 2.59 |
Household Size by Marriage Status in Denison
Out of a total of 3,029 households in Denison, 2,258 (74.6%) are family households, while 771 (25.5%) are nonfamily households. The most numerous type of family households are 2-person households, comprising 734, and the most common type of nonfamily households are 1-person households, comprising 617.
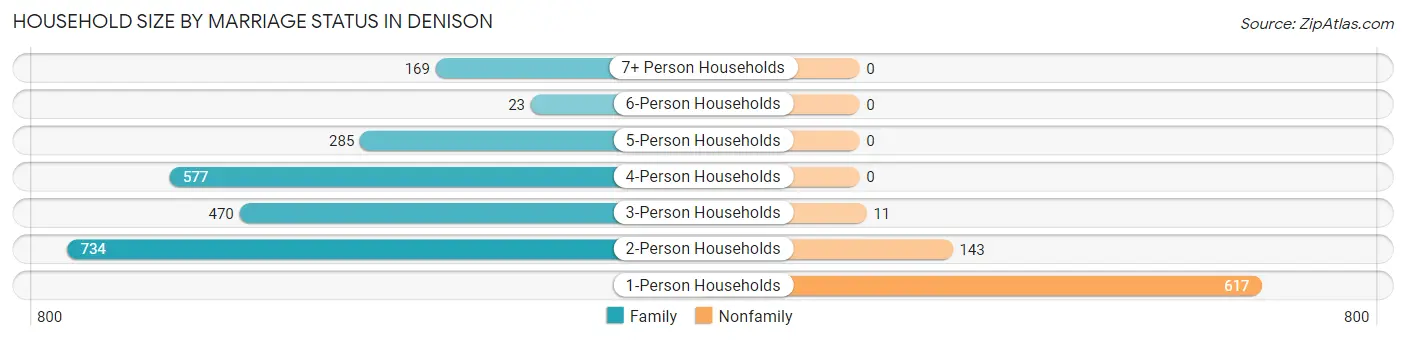
| Household Size | Family Households | Nonfamily Households |
| 1-Person Households | - | 617 (20.4%) |
| 2-Person Households | 734 (24.2%) | 143 (4.7%) |
| 3-Person Households | 470 (15.5%) | 11 (0.4%) |
| 4-Person Households | 577 (19.1%) | 0 (0.0%) |
| 5-Person Households | 285 (9.4%) | 0 (0.0%) |
| 6-Person Households | 23 (0.8%) | 0 (0.0%) |
| 7+ Person Households | 169 (5.6%) | 0 (0.0%) |
| Total | 2,258 (74.6%) | 771 (25.5%) |
Female Fertility in Denison
Fertility by Age in Denison
Average fertility rate in Denison is 63.0 births per 1,000 women. Women in the age bracket of 20 to 34 years have the highest fertility rate with 79.0 births per 1,000 women. Women in the age bracket of 20 to 34 years acount for 55.7% of all women with births.
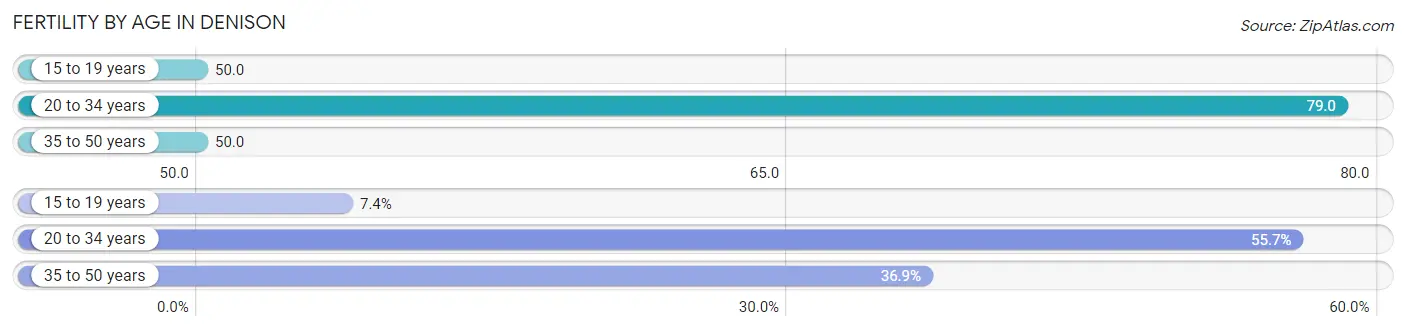
| Age Bracket | Women with Births | Births / 1,000 Women |
| 15 to 19 years | 9 (7.4%) | 50.0 |
| 20 to 34 years | 68 (55.7%) | 79.0 |
| 35 to 50 years | 45 (36.9%) | 50.0 |
| Total | 122 (100.0%) | 63.0 |
Fertility by Age by Marriage Status in Denison
92.6% of women with births (122) in Denison are married. The highest percentage of unmarried women with births falls into 15 to 19 years age bracket with 100.0% of them unmarried at the time of birth, while the lowest percentage of unmarried women with births belong to 20 to 34 years age bracket with 0.0% of them unmarried.
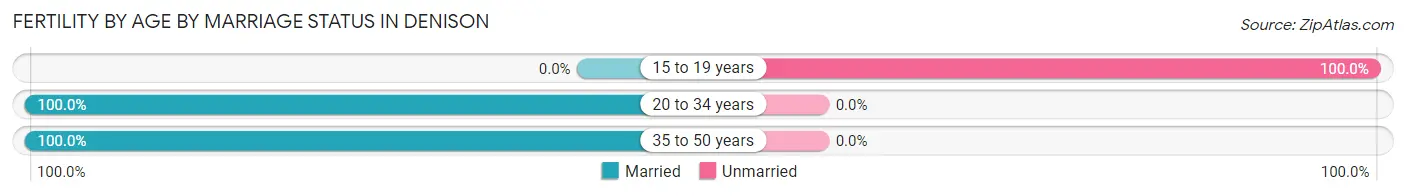
| Age Bracket | Married | Unmarried |
| 15 to 19 years | 0 (0.0%) | 9 (100.0%) |
| 20 to 34 years | 68 (100.0%) | 0 (0.0%) |
| 35 to 50 years | 45 (100.0%) | 0 (0.0%) |
| Total | 113 (92.6%) | 9 (7.4%) |
Fertility by Education in Denison
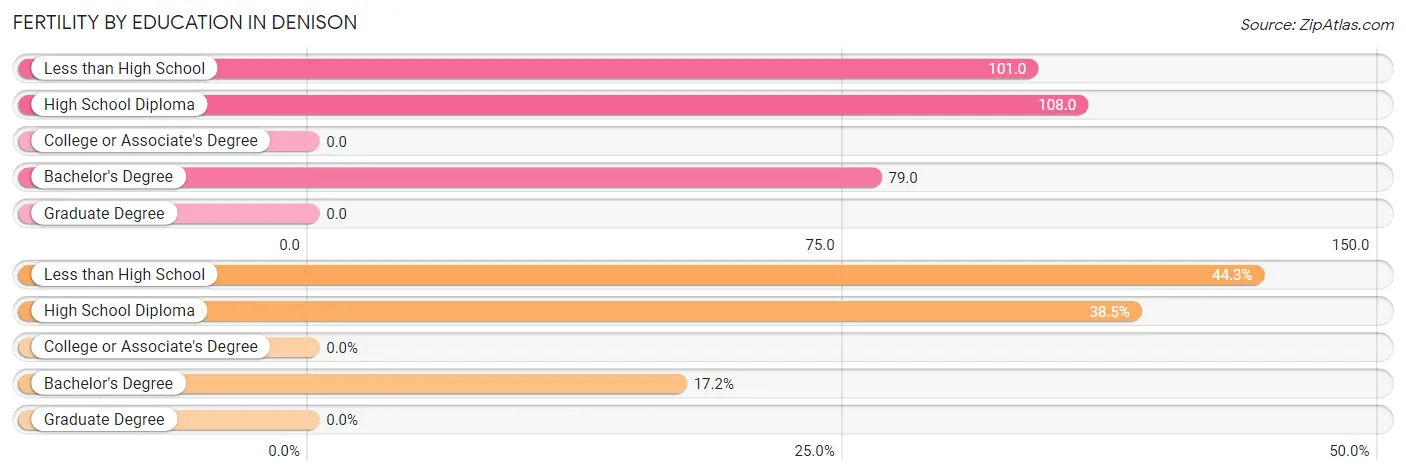
| Educational Attainment | Women with Births | Births / 1,000 Women |
| Less than High School | 54 (44.3%) | 101.0 |
| High School Diploma | 47 (38.5%) | 108.0 |
| College or Associate's Degree | 0 (0.0%) | 0.0 |
| Bachelor's Degree | 21 (17.2%) | 79.0 |
| Graduate Degree | 0 (0.0%) | 0.0 |
| Total | 122 (100.0%) | 63.0 |
Fertility by Education by Marriage Status in Denison
7.4% of women with births in Denison are unmarried. Women with the educational attainment of high school diploma are most likely to be married with 100.0% of them married at childbirth, while women with the educational attainment of less than high school are least likely to be married with 16.7% of them unmarried at childbirth.
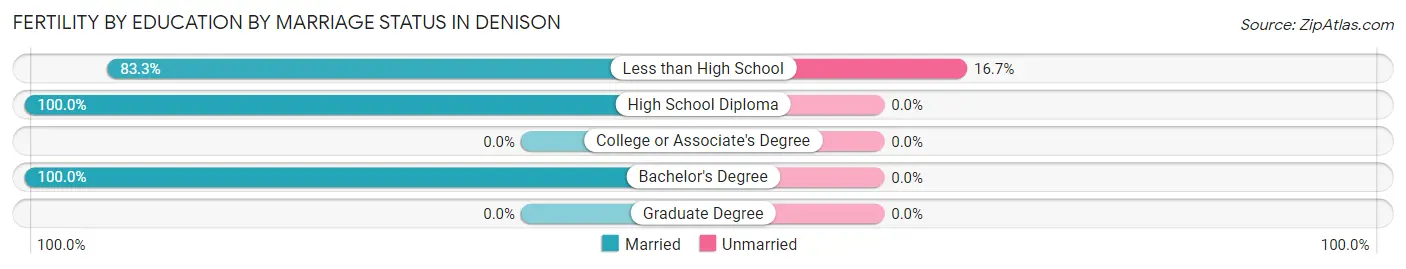
| Educational Attainment | Married | Unmarried |
| Less than High School | 45 (83.3%) | 9 (16.7%) |
| High School Diploma | 47 (100.0%) | 0 (0.0%) |
| College or Associate's Degree | 0 (0.0%) | 0 (0.0%) |
| Bachelor's Degree | 21 (100.0%) | 0 (0.0%) |
| Graduate Degree | 0 (0.0%) | 0 (0.0%) |
| Total | 113 (92.6%) | 9 (7.4%) |
Employment Characteristics in Denison
Employment by Class of Employer in Denison
Among the 3,704 employed individuals in Denison, private company employees (2,437 | 65.8%), self-employed (not incorporated) (569 | 15.4%), and not-for-profit organizations (264 | 7.1%) make up the most common classes of employment.
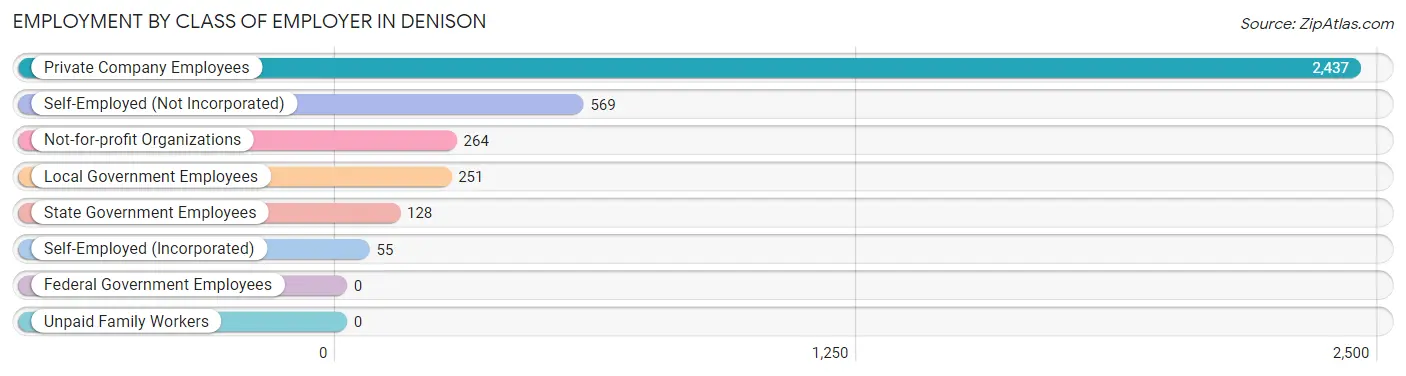
| Employer Class | # Employees | % Employees |
| Private Company Employees | 2,437 | 65.8% |
| Self-Employed (Incorporated) | 55 | 1.5% |
| Self-Employed (Not Incorporated) | 569 | 15.4% |
| Not-for-profit Organizations | 264 | 7.1% |
| Local Government Employees | 251 | 6.8% |
| State Government Employees | 128 | 3.5% |
| Federal Government Employees | 0 | 0.0% |
| Unpaid Family Workers | 0 | 0.0% |
| Total | 3,704 | 100.0% |
Employment Status by Age in Denison
According to the labor force statistics for Denison, out of the total population over 16 years of age (6,424), 63.1% or 4,054 individuals are in the labor force, with 6.2% or 251 of them unemployed. The age group with the highest labor force participation rate is 25 to 29 years, with 96.1% or 324 individuals in the labor force. Within the labor force, the 16 to 19 years age range has the highest percentage of unemployed individuals, with 32.5% or 90 of them being unemployed.
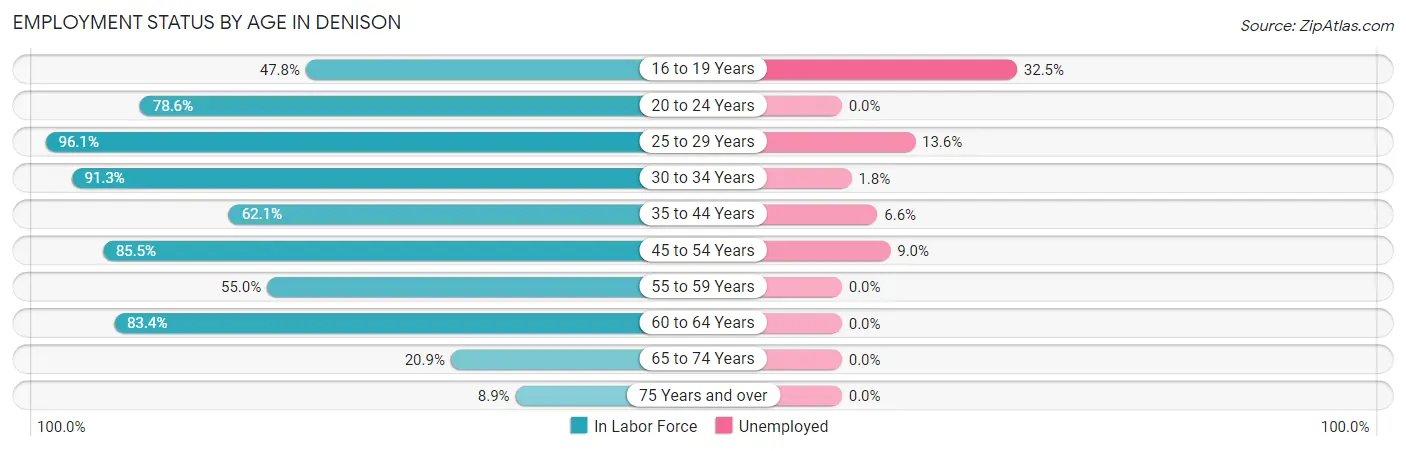
| Age Bracket | In Labor Force | Unemployed |
| 16 to 19 Years | 277 (47.8%) | 90 (32.5%) |
| 20 to 24 Years | 569 (78.6%) | 0 (0.0%) |
| 25 to 29 Years | 324 (96.1%) | 44 (13.6%) |
| 30 to 34 Years | 766 (91.3%) | 14 (1.8%) |
| 35 to 44 Years | 670 (62.1%) | 44 (6.6%) |
| 45 to 54 Years | 654 (85.5%) | 59 (9.0%) |
| 55 to 59 Years | 315 (55.0%) | 0 (0.0%) |
| 60 to 64 Years | 297 (83.4%) | 0 (0.0%) |
| 65 to 74 Years | 134 (20.9%) | 0 (0.0%) |
| 75 Years and over | 47 (8.9%) | 0 (0.0%) |
| Total | 4,054 (63.1%) | 251 (6.2%) |
Employment Status by Educational Attainment in Denison
According to labor force statistics for Denison, 76.6% of individuals (3,025) out of the total population between 25 and 64 years of age (3,949) are in the labor force, with 5.3% or 160 of them being unemployed. The group with the highest labor force participation rate are those with the educational attainment of bachelor's degree or higher, with 98.6% or 477 individuals in the labor force. Within the labor force, individuals with bachelor's degree or higher education have the highest percentage of unemployment, with 10.7% or 51 of them being unemployed.
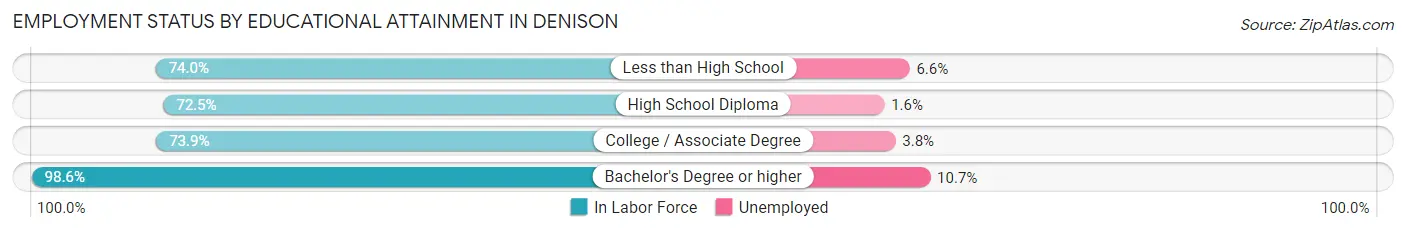
| Educational Attainment | In Labor Force | Unemployed |
| Less than High School | 993 (74.0%) | 89 (6.6%) |
| High School Diploma | 691 (72.5%) | 15 (1.6%) |
| College / Associate Degree | 865 (73.9%) | 44 (3.8%) |
| Bachelor's Degree or higher | 477 (98.6%) | 52 (10.7%) |
| Total | 3,025 (76.6%) | 209 (5.3%) |
Employment Occupations by Sex in Denison
Management, Business, Science and Arts Occupations
The most common Management, Business, Science and Arts occupations in Denison are Community & Social Service (249 | 6.6%), Education Instruction & Library (172 | 4.5%), Management (158 | 4.2%), Business & Financial (57 | 1.5%), and Education, Arts & Media (52 | 1.4%).
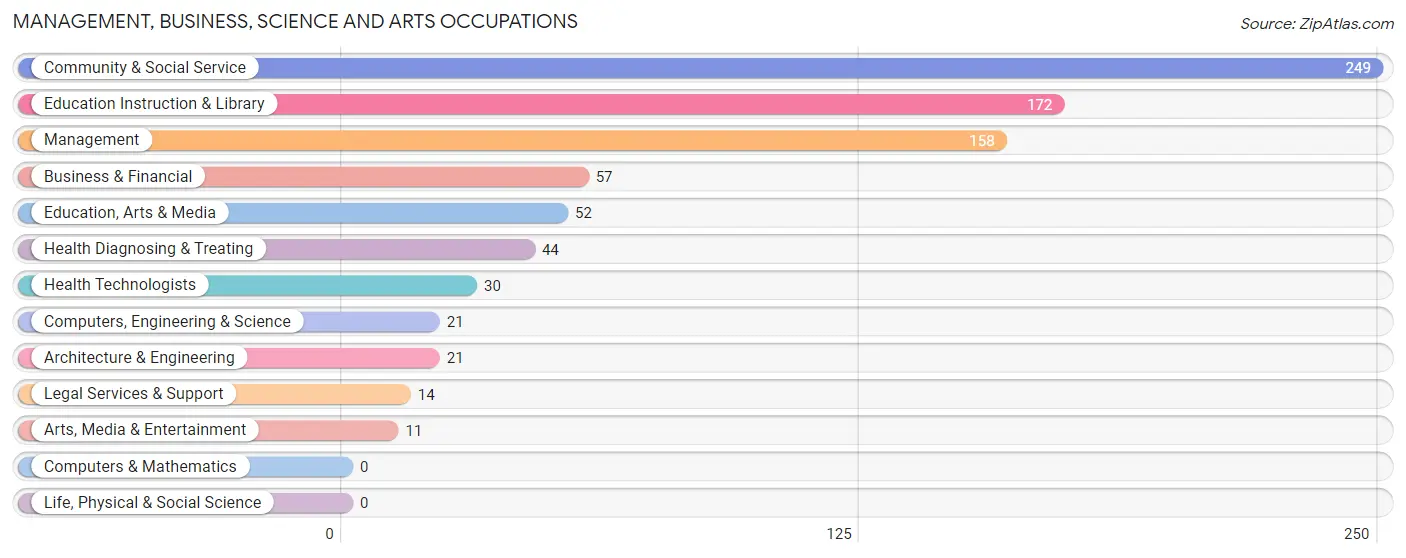
Management, Business, Science and Arts Occupations by Sex
Within the Management, Business, Science and Arts occupations in Denison, the most male-oriented occupations are Computers, Engineering & Science (100.0%), Architecture & Engineering (100.0%), and Legal Services & Support (100.0%), while the most female-oriented occupations are Arts, Media & Entertainment (100.0%), Education Instruction & Library (84.9%), and Community & Social Service (76.7%).
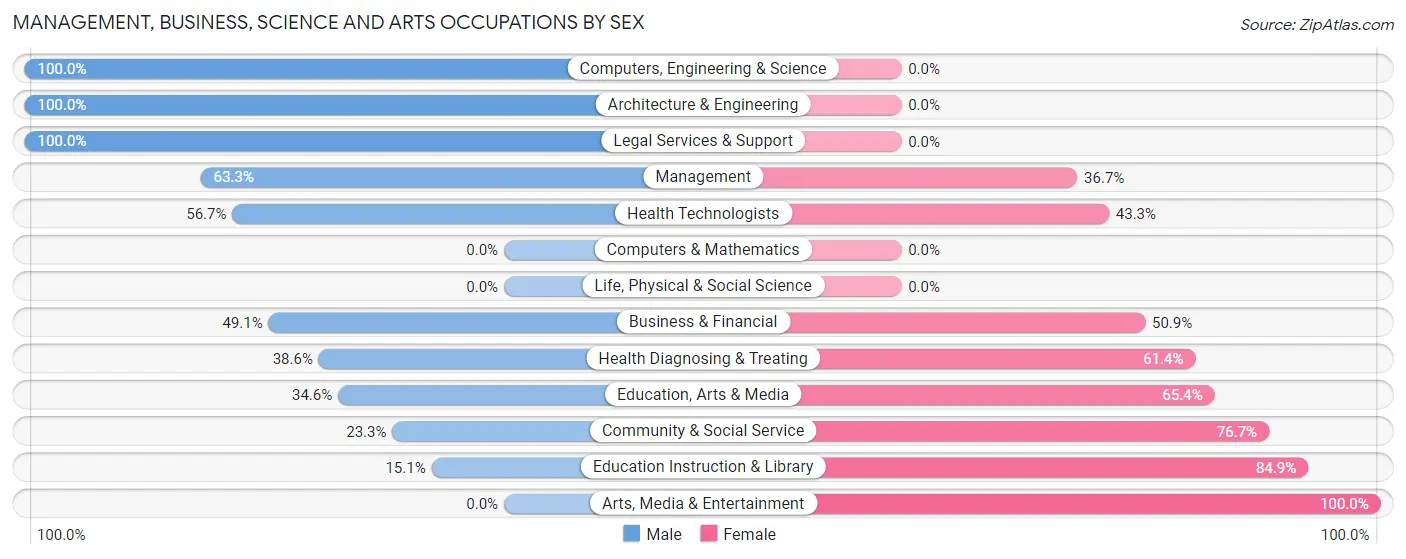
| Occupation | Male | Female |
| Management | 100 (63.3%) | 58 (36.7%) |
| Business & Financial | 28 (49.1%) | 29 (50.9%) |
| Computers, Engineering & Science | 21 (100.0%) | 0 (0.0%) |
| Computers & Mathematics | 0 (0.0%) | 0 (0.0%) |
| Architecture & Engineering | 21 (100.0%) | 0 (0.0%) |
| Life, Physical & Social Science | 0 (0.0%) | 0 (0.0%) |
| Community & Social Service | 58 (23.3%) | 191 (76.7%) |
| Education, Arts & Media | 18 (34.6%) | 34 (65.4%) |
| Legal Services & Support | 14 (100.0%) | 0 (0.0%) |
| Education Instruction & Library | 26 (15.1%) | 146 (84.9%) |
| Arts, Media & Entertainment | 0 (0.0%) | 11 (100.0%) |
| Health Diagnosing & Treating | 17 (38.6%) | 27 (61.4%) |
| Health Technologists | 17 (56.7%) | 13 (43.3%) |
| Total (Category) | 224 (42.3%) | 305 (57.7%) |
| Total (Overall) | 2,132 (56.1%) | 1,670 (43.9%) |
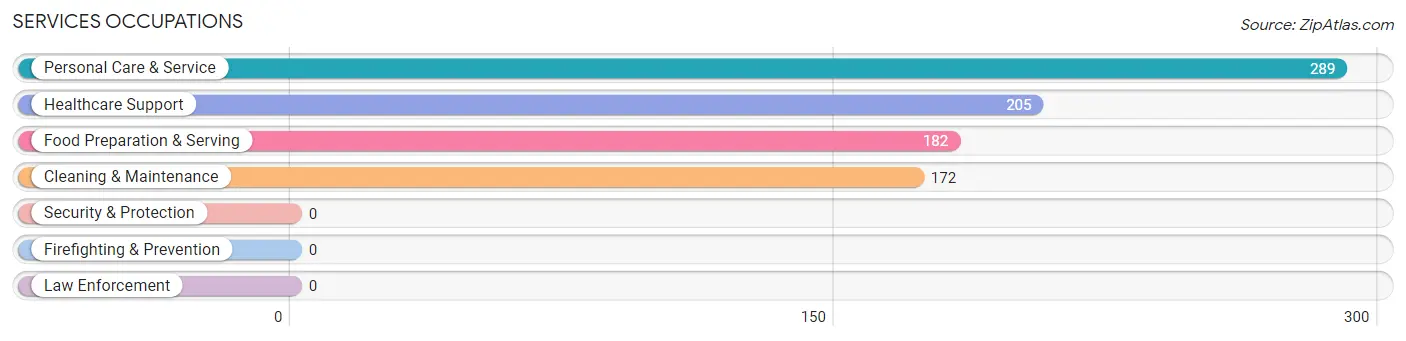
Services Occupations
The most common Services occupations in Denison are Personal Care & Service (289 | 7.6%), Healthcare Support (205 | 5.4%), Food Preparation & Serving (182 | 4.8%), and Cleaning & Maintenance (172 | 4.5%).
Services Occupations by Sex
Within the Services occupations in Denison, the most male-oriented occupations are Food Preparation & Serving (82.4%), Healthcare Support (81.0%), and Cleaning & Maintenance (74.4%), while the most female-oriented occupations are Personal Care & Service (86.5%), Cleaning & Maintenance (25.6%), and Healthcare Support (19.0%).
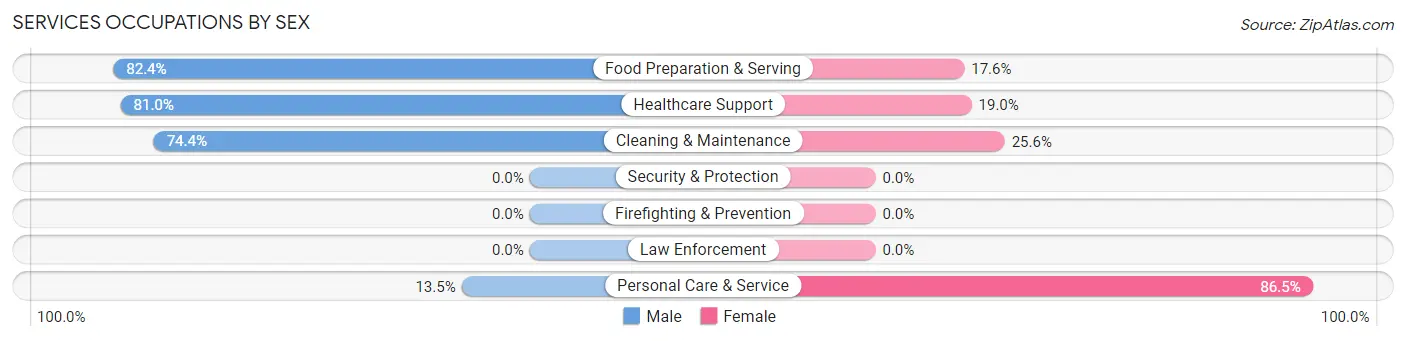
| Occupation | Male | Female |
| Healthcare Support | 166 (81.0%) | 39 (19.0%) |
| Security & Protection | 0 (0.0%) | 0 (0.0%) |
| Firefighting & Prevention | 0 (0.0%) | 0 (0.0%) |
| Law Enforcement | 0 (0.0%) | 0 (0.0%) |
| Food Preparation & Serving | 150 (82.4%) | 32 (17.6%) |
| Cleaning & Maintenance | 128 (74.4%) | 44 (25.6%) |
| Personal Care & Service | 39 (13.5%) | 250 (86.5%) |
| Total (Category) | 483 (57.0%) | 365 (43.0%) |
| Total (Overall) | 2,132 (56.1%) | 1,670 (43.9%) |
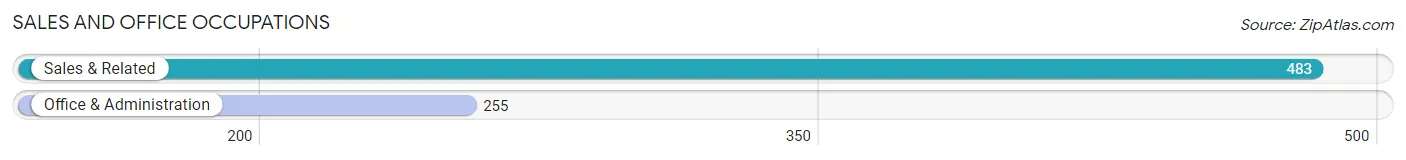
Sales and Office Occupations
The most common Sales and Office occupations in Denison are Sales & Related (483 | 12.7%), and Office & Administration (255 | 6.7%).
Sales and Office Occupations by Sex

| Occupation | Male | Female |
| Sales & Related | 180 (37.3%) | 303 (62.7%) |
| Office & Administration | 13 (5.1%) | 242 (94.9%) |
| Total (Category) | 193 (26.2%) | 545 (73.9%) |
| Total (Overall) | 2,132 (56.1%) | 1,670 (43.9%) |
Natural Resources, Construction and Maintenance Occupations
The most common Natural Resources, Construction and Maintenance occupations in Denison are Construction & Extraction (241 | 6.3%), Farming, Fishing & Forestry (81 | 2.1%), and Installation, Maintenance & Repair (55 | 1.5%).
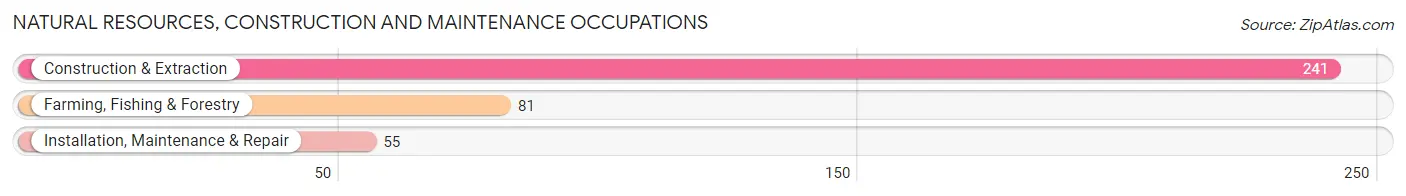
Natural Resources, Construction and Maintenance Occupations by Sex
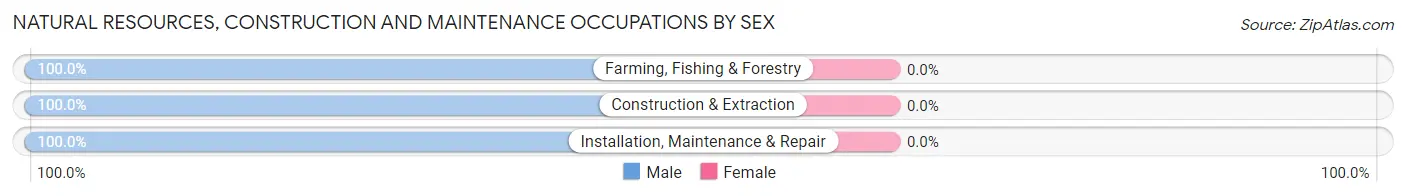
| Occupation | Male | Female |
| Farming, Fishing & Forestry | 81 (100.0%) | 0 (0.0%) |
| Construction & Extraction | 241 (100.0%) | 0 (0.0%) |
| Installation, Maintenance & Repair | 55 (100.0%) | 0 (0.0%) |
| Total (Category) | 377 (100.0%) | 0 (0.0%) |
| Total (Overall) | 2,132 (56.1%) | 1,670 (43.9%) |
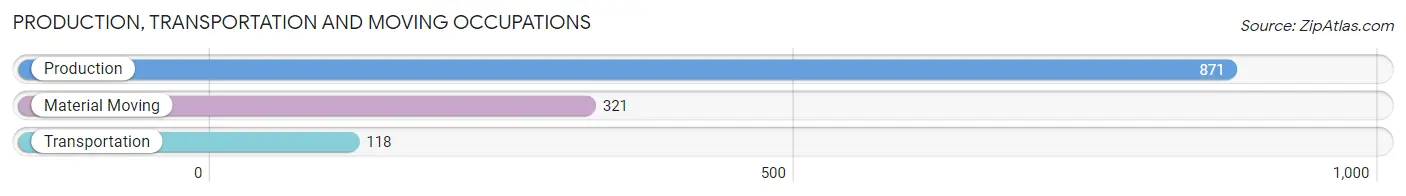
Production, Transportation and Moving Occupations
The most common Production, Transportation and Moving occupations in Denison are Production (871 | 22.9%), Material Moving (321 | 8.4%), and Transportation (118 | 3.1%).
Production, Transportation and Moving Occupations by Sex
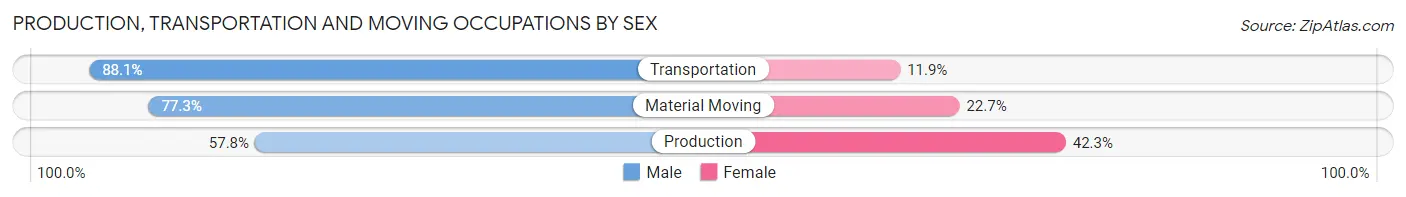
| Occupation | Male | Female |
| Production | 503 (57.8%) | 368 (42.2%) |
| Transportation | 104 (88.1%) | 14 (11.9%) |
| Material Moving | 248 (77.3%) | 73 (22.7%) |
| Total (Category) | 855 (65.3%) | 455 (34.7%) |
| Total (Overall) | 2,132 (56.1%) | 1,670 (43.9%) |
Employment Industries by Sex in Denison
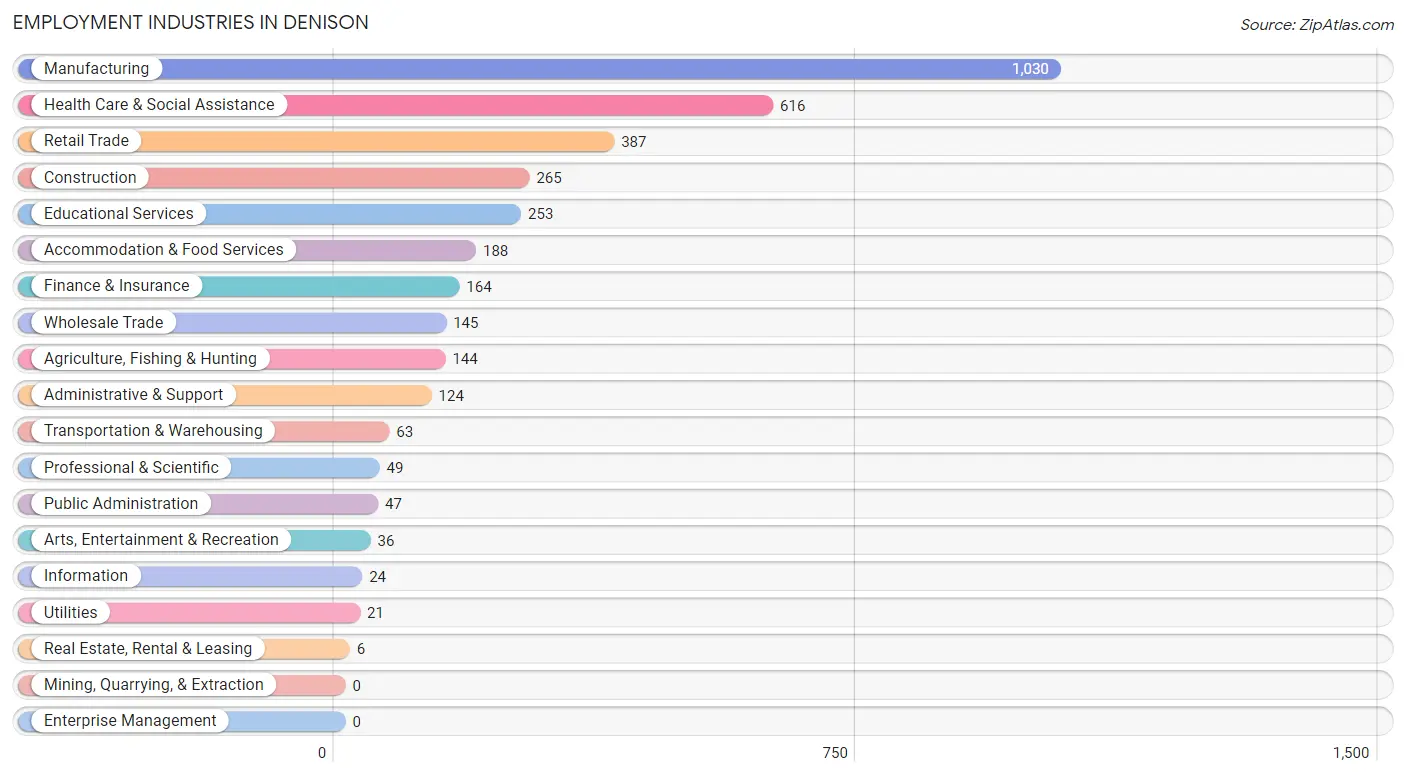
Employment Industries in Denison
The major employment industries in Denison include Manufacturing (1,030 | 27.1%), Health Care & Social Assistance (616 | 16.2%), Retail Trade (387 | 10.2%), Construction (265 | 7.0%), and Educational Services (253 | 6.7%).
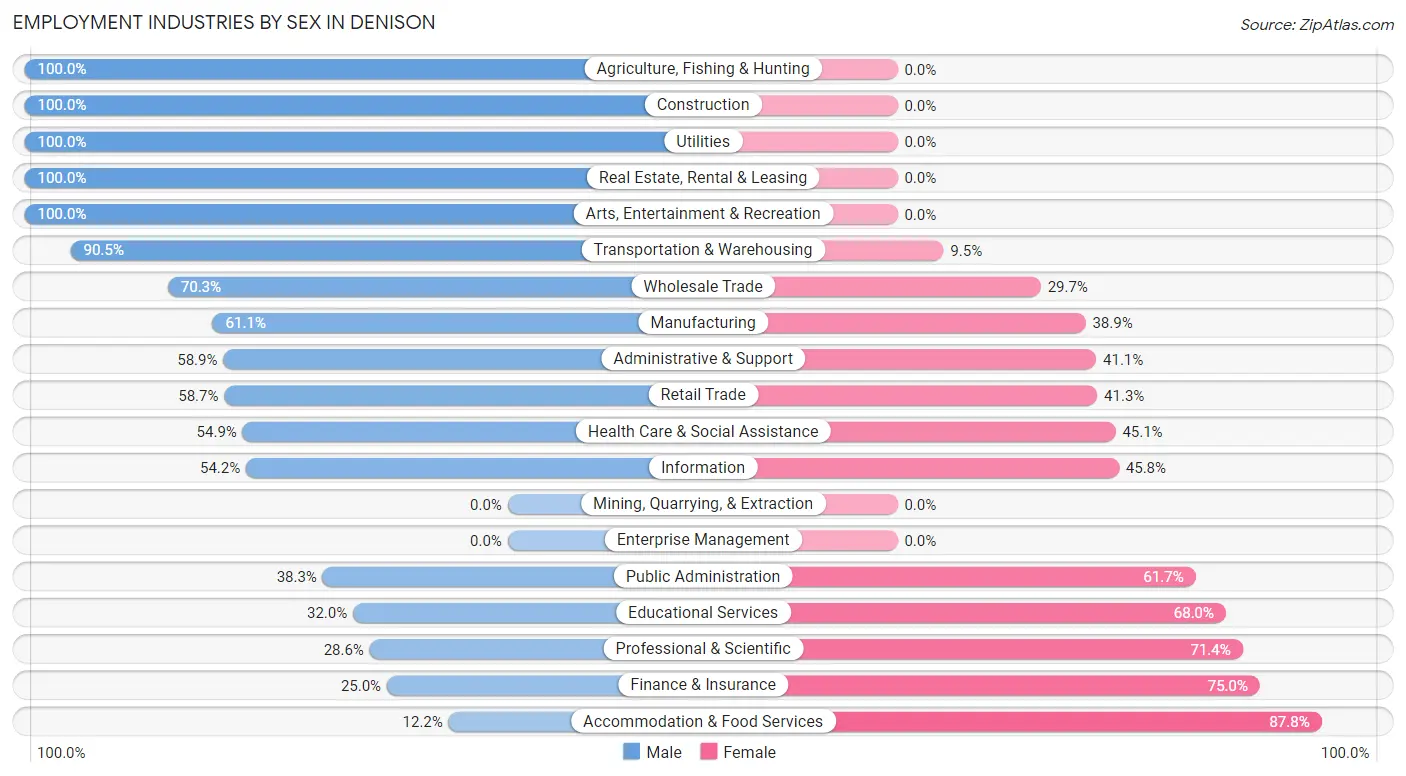
Employment Industries by Sex in Denison
The Denison industries that see more men than women are Agriculture, Fishing & Hunting (100.0%), Construction (100.0%), and Utilities (100.0%), whereas the industries that tend to have a higher number of women are Accommodation & Food Services (87.8%), Finance & Insurance (75.0%), and Professional & Scientific (71.4%).
| Industry | Male | Female |
| Agriculture, Fishing & Hunting | 144 (100.0%) | 0 (0.0%) |
| Mining, Quarrying, & Extraction | 0 (0.0%) | 0 (0.0%) |
| Construction | 265 (100.0%) | 0 (0.0%) |
| Manufacturing | 629 (61.1%) | 401 (38.9%) |
| Wholesale Trade | 102 (70.3%) | 43 (29.7%) |
| Retail Trade | 227 (58.7%) | 160 (41.3%) |
| Transportation & Warehousing | 57 (90.5%) | 6 (9.5%) |
| Utilities | 21 (100.0%) | 0 (0.0%) |
| Information | 13 (54.2%) | 11 (45.8%) |
| Finance & Insurance | 41 (25.0%) | 123 (75.0%) |
| Real Estate, Rental & Leasing | 6 (100.0%) | 0 (0.0%) |
| Professional & Scientific | 14 (28.6%) | 35 (71.4%) |
| Enterprise Management | 0 (0.0%) | 0 (0.0%) |
| Administrative & Support | 73 (58.9%) | 51 (41.1%) |
| Educational Services | 81 (32.0%) | 172 (68.0%) |
| Health Care & Social Assistance | 338 (54.9%) | 278 (45.1%) |
| Arts, Entertainment & Recreation | 36 (100.0%) | 0 (0.0%) |
| Accommodation & Food Services | 23 (12.2%) | 165 (87.8%) |
| Public Administration | 18 (38.3%) | 29 (61.7%) |
| Total | 2,132 (56.1%) | 1,670 (43.9%) |
Education in Denison
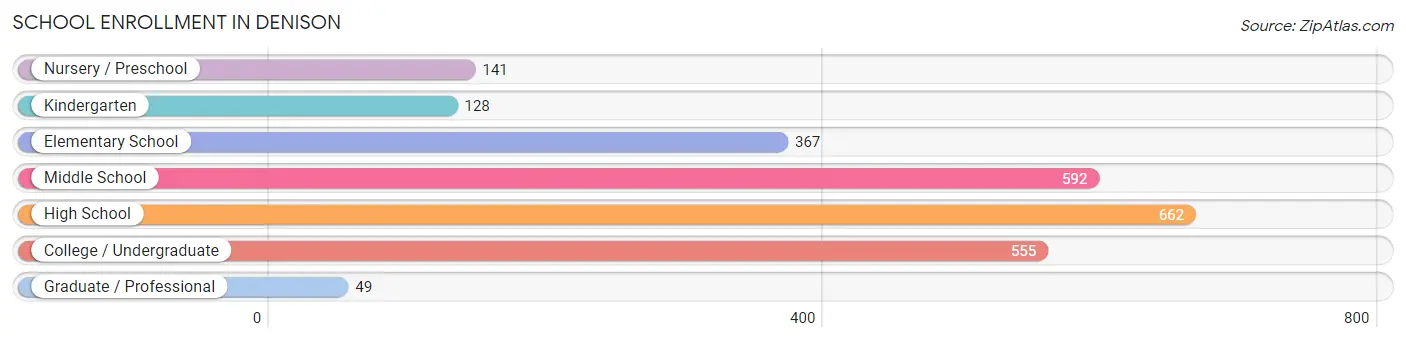
School Enrollment in Denison
The most common levels of schooling among the 2,494 students in Denison are high school (662 | 26.5%), middle school (592 | 23.7%), and college / undergraduate (555 | 22.3%).
| School Level | # Students | % Students |
| Nursery / Preschool | 141 | 5.7% |
| Kindergarten | 128 | 5.1% |
| Elementary School | 367 | 14.7% |
| Middle School | 592 | 23.7% |
| High School | 662 | 26.5% |
| College / Undergraduate | 555 | 22.3% |
| Graduate / Professional | 49 | 2.0% |
| Total | 2,494 | 100.0% |
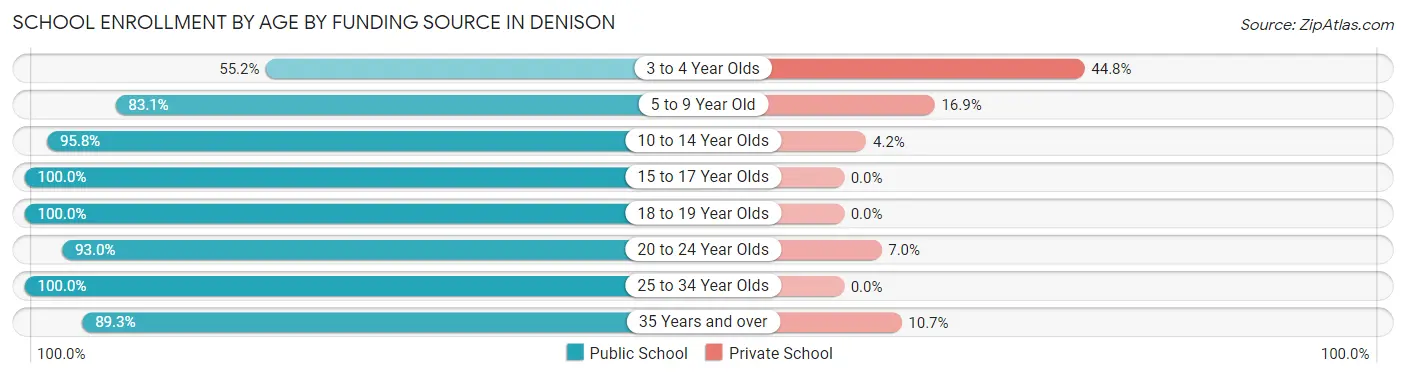
School Enrollment by Age by Funding Source in Denison
Out of a total of 2,494 students who are enrolled in schools in Denison, 212 (8.5%) attend a private institution, while the remaining 2,282 (91.5%) are enrolled in public schools. The age group of 3 to 4 year olds has the highest likelihood of being enrolled in private schools, with 52 (44.8% in the age bracket) enrolled. Conversely, the age group of 15 to 17 year olds has the lowest likelihood of being enrolled in a private school, with 421 (100.0% in the age bracket) attending a public institution.
| Age Bracket | Public School | Private School |
| 3 to 4 Year Olds | 64 (55.2%) | 52 (44.8%) |
| 5 to 9 Year Old | 432 (83.1%) | 88 (16.9%) |
| 10 to 14 Year Olds | 620 (95.8%) | 27 (4.2%) |
| 15 to 17 Year Olds | 421 (100.0%) | 0 (0.0%) |
| 18 to 19 Year Olds | 177 (100.0%) | 0 (0.0%) |
| 20 to 24 Year Olds | 412 (93.0%) | 31 (7.0%) |
| 25 to 34 Year Olds | 49 (100.0%) | 0 (0.0%) |
| 35 Years and over | 108 (89.3%) | 13 (10.7%) |
| Total | 2,282 (91.5%) | 212 (8.5%) |
Educational Attainment by Field of Study in Denison
Education (185 | 23.9%), business (180 | 23.3%), arts & humanities (129 | 16.7%), science & technology (113 | 14.6%), and engineering (45 | 5.8%) are the most common fields of study among 774 individuals in Denison who have obtained a bachelor's degree or higher.
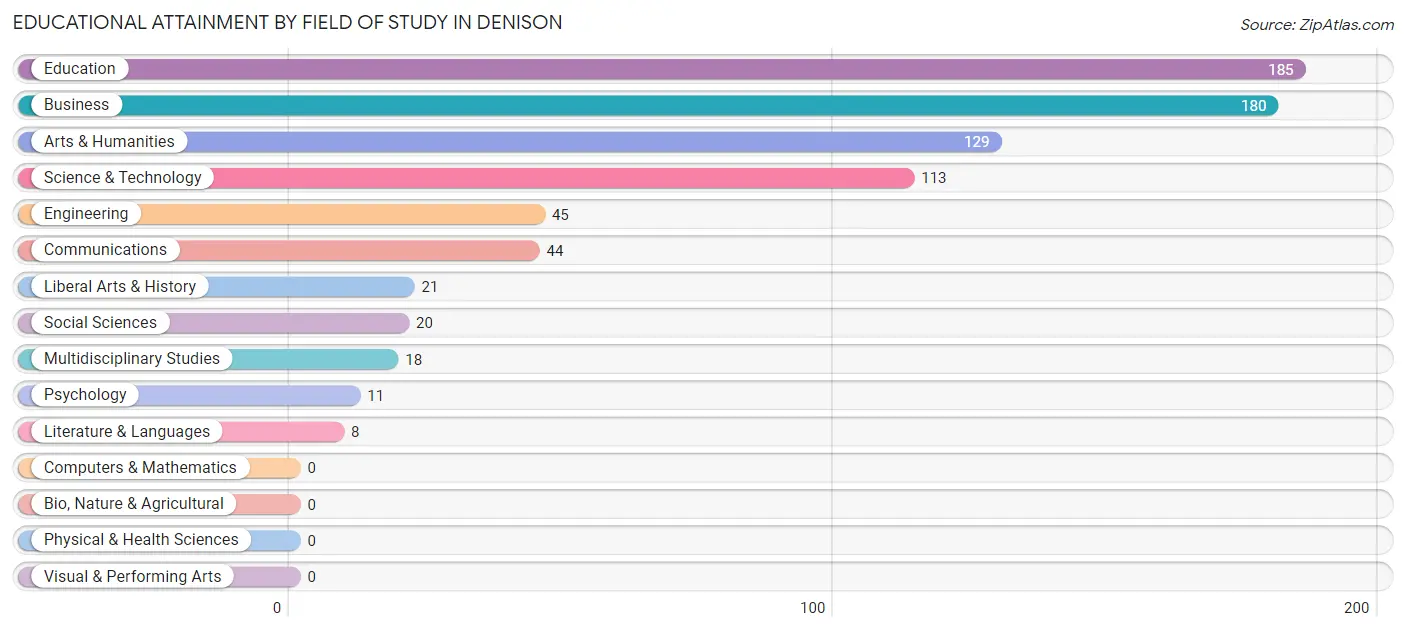
| Field of Study | # Graduates | % Graduates |
| Computers & Mathematics | 0 | 0.0% |
| Bio, Nature & Agricultural | 0 | 0.0% |
| Physical & Health Sciences | 0 | 0.0% |
| Psychology | 11 | 1.4% |
| Social Sciences | 20 | 2.6% |
| Engineering | 45 | 5.8% |
| Multidisciplinary Studies | 18 | 2.3% |
| Science & Technology | 113 | 14.6% |
| Business | 180 | 23.3% |
| Education | 185 | 23.9% |
| Literature & Languages | 8 | 1.0% |
| Liberal Arts & History | 21 | 2.7% |
| Visual & Performing Arts | 0 | 0.0% |
| Communications | 44 | 5.7% |
| Arts & Humanities | 129 | 16.7% |
| Total | 774 | 100.0% |
Transportation & Commute in Denison
Vehicle Availability by Sex in Denison
The most prevalent vehicle ownership categories in Denison are males with 2 vehicles (1,192, accounting for 58.3%) and females with 2 vehicles (805, making up 75.9%).
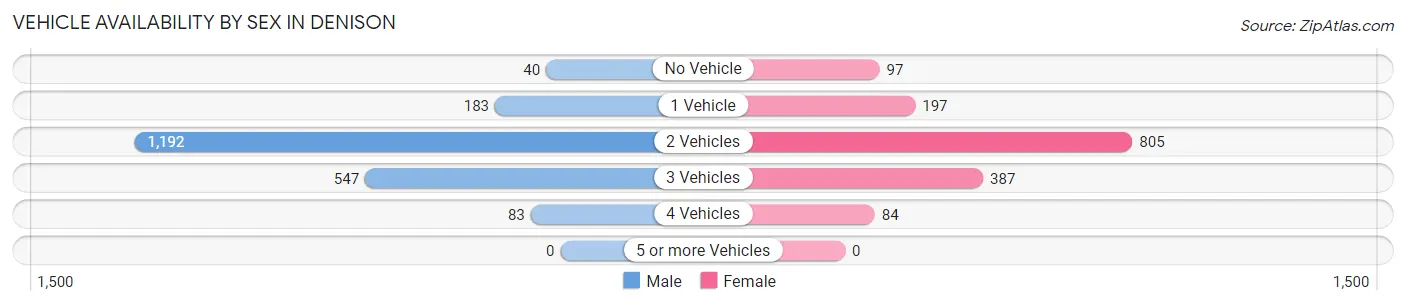
| Vehicles Available | Male | Female |
| No Vehicle | 40 (2.0%) | 97 (6.2%) |
| 1 Vehicle | 183 (8.9%) | 197 (12.6%) |
| 2 Vehicles | 1,192 (58.3%) | 805 (51.3%) |
| 3 Vehicles | 547 (26.8%) | 387 (24.6%) |
| 4 Vehicles | 83 (4.1%) | 84 (5.3%) |
| 5 or more Vehicles | 0 (0.0%) | 0 (0.0%) |
| Total | 2,045 (100.0%) | 1,570 (100.0%) |
Commute Time in Denison
The most frequently occuring commute durations in Denison are 5 to 9 minutes (1,653 commuters, 46.4%), 10 to 14 minutes (717 commuters, 20.1%), and less than 5 minutes (343 commuters, 9.6%).
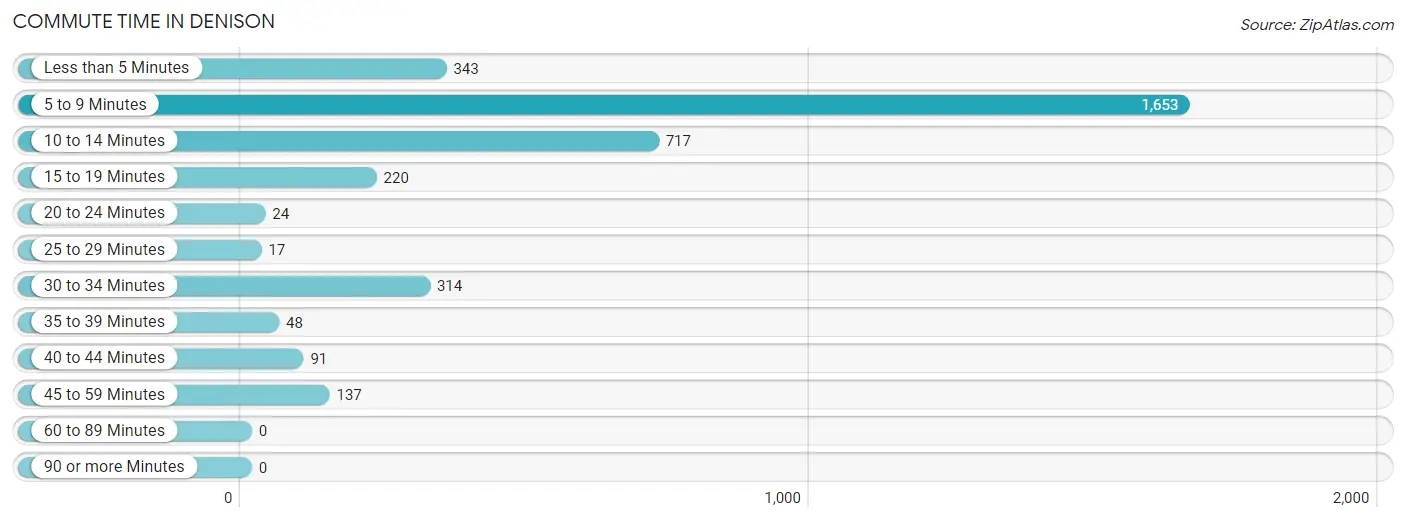
| Commute Time | # Commuters | % Commuters |
| Less than 5 Minutes | 343 | 9.6% |
| 5 to 9 Minutes | 1,653 | 46.4% |
| 10 to 14 Minutes | 717 | 20.1% |
| 15 to 19 Minutes | 220 | 6.2% |
| 20 to 24 Minutes | 24 | 0.7% |
| 25 to 29 Minutes | 17 | 0.5% |
| 30 to 34 Minutes | 314 | 8.8% |
| 35 to 39 Minutes | 48 | 1.3% |
| 40 to 44 Minutes | 91 | 2.5% |
| 45 to 59 Minutes | 137 | 3.8% |
| 60 to 89 Minutes | 0 | 0.0% |
| 90 or more Minutes | 0 | 0.0% |
Commute Time by Sex in Denison
The most common commute times in Denison are 5 to 9 minutes (1,018 commuters, 50.1%) for males and 5 to 9 minutes (635 commuters, 41.4%) for females.
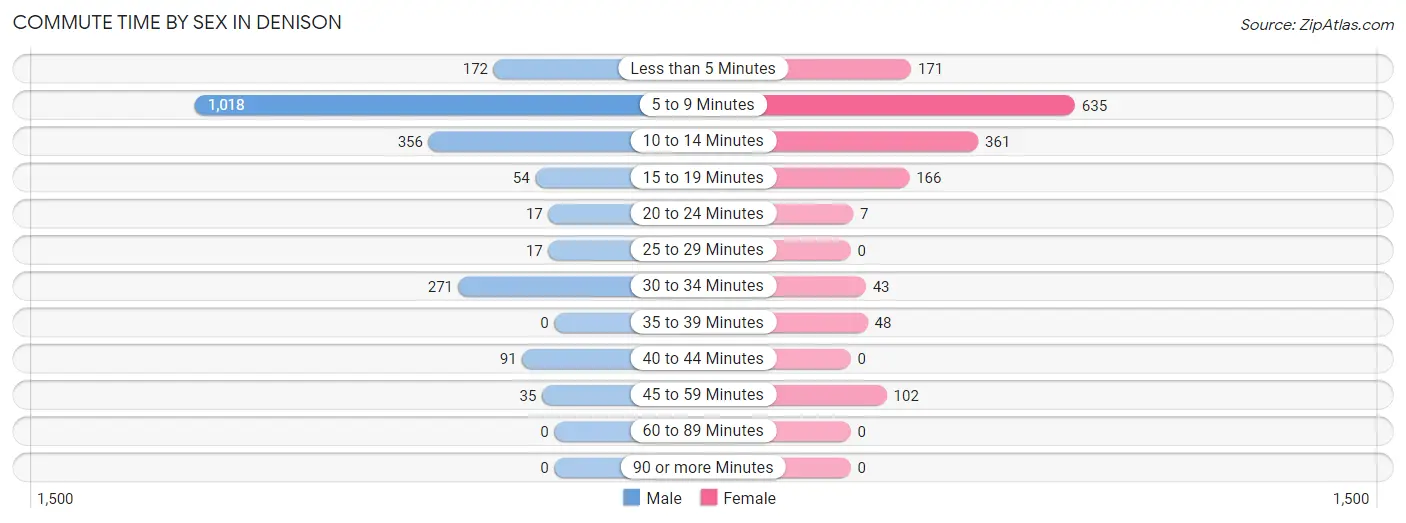
| Commute Time | Male | Female |
| Less than 5 Minutes | 172 (8.5%) | 171 (11.2%) |
| 5 to 9 Minutes | 1,018 (50.1%) | 635 (41.4%) |
| 10 to 14 Minutes | 356 (17.5%) | 361 (23.5%) |
| 15 to 19 Minutes | 54 (2.7%) | 166 (10.8%) |
| 20 to 24 Minutes | 17 (0.8%) | 7 (0.5%) |
| 25 to 29 Minutes | 17 (0.8%) | 0 (0.0%) |
| 30 to 34 Minutes | 271 (13.3%) | 43 (2.8%) |
| 35 to 39 Minutes | 0 (0.0%) | 48 (3.1%) |
| 40 to 44 Minutes | 91 (4.5%) | 0 (0.0%) |
| 45 to 59 Minutes | 35 (1.7%) | 102 (6.7%) |
| 60 to 89 Minutes | 0 (0.0%) | 0 (0.0%) |
| 90 or more Minutes | 0 (0.0%) | 0 (0.0%) |
Time of Departure to Work by Sex in Denison
The most frequent times of departure to work in Denison are 12:00 PM to 3:59 PM (326, 16.1%) for males and 7:30 AM to 7:59 AM (266, 17.3%) for females.
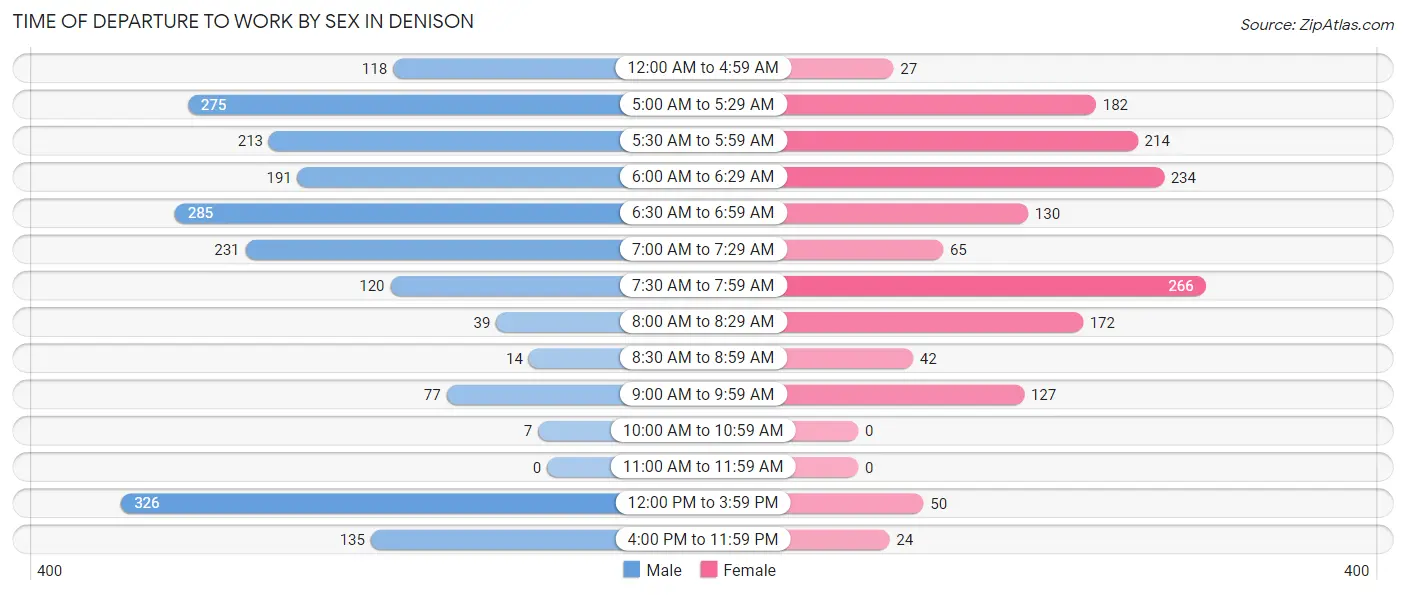
| Time of Departure | Male | Female |
| 12:00 AM to 4:59 AM | 118 (5.8%) | 27 (1.8%) |
| 5:00 AM to 5:29 AM | 275 (13.5%) | 182 (11.9%) |
| 5:30 AM to 5:59 AM | 213 (10.5%) | 214 (14.0%) |
| 6:00 AM to 6:29 AM | 191 (9.4%) | 234 (15.3%) |
| 6:30 AM to 6:59 AM | 285 (14.0%) | 130 (8.5%) |
| 7:00 AM to 7:29 AM | 231 (11.4%) | 65 (4.2%) |
| 7:30 AM to 7:59 AM | 120 (5.9%) | 266 (17.3%) |
| 8:00 AM to 8:29 AM | 39 (1.9%) | 172 (11.2%) |
| 8:30 AM to 8:59 AM | 14 (0.7%) | 42 (2.7%) |
| 9:00 AM to 9:59 AM | 77 (3.8%) | 127 (8.3%) |
| 10:00 AM to 10:59 AM | 7 (0.3%) | 0 (0.0%) |
| 11:00 AM to 11:59 AM | 0 (0.0%) | 0 (0.0%) |
| 12:00 PM to 3:59 PM | 326 (16.1%) | 50 (3.3%) |
| 4:00 PM to 11:59 PM | 135 (6.7%) | 24 (1.6%) |
| Total | 2,031 (100.0%) | 1,533 (100.0%) |
Housing Occupancy in Denison
Occupancy by Ownership in Denison
Of the total 3,029 dwellings in Denison, owner-occupied units account for 2,005 (66.2%), while renter-occupied units make up 1,024 (33.8%).
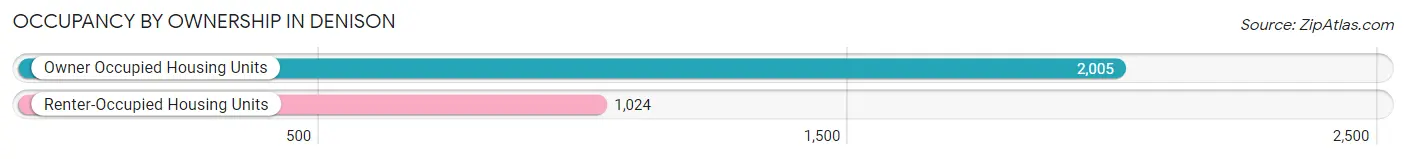
| Occupancy | # Housing Units | % Housing Units |
| Owner Occupied Housing Units | 2,005 | 66.2% |
| Renter-Occupied Housing Units | 1,024 | 33.8% |
| Total Occupied Housing Units | 3,029 | 100.0% |
Occupancy by Household Size in Denison
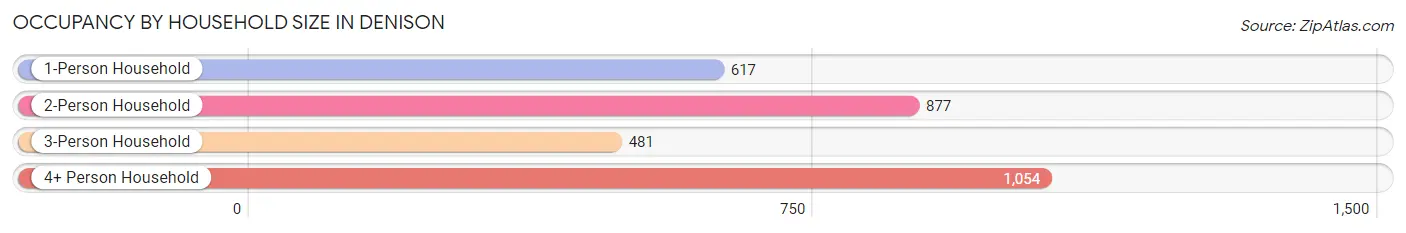
| Household Size | # Housing Units | % Housing Units |
| 1-Person Household | 617 | 20.4% |
| 2-Person Household | 877 | 28.9% |
| 3-Person Household | 481 | 15.9% |
| 4+ Person Household | 1,054 | 34.8% |
| Total Housing Units | 3,029 | 100.0% |
Occupancy by Ownership by Household Size in Denison
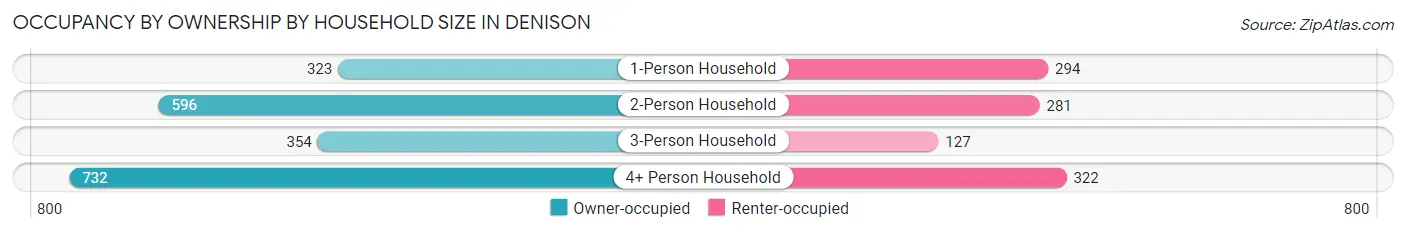
| Household Size | Owner-occupied | Renter-occupied |
| 1-Person Household | 323 (52.3%) | 294 (47.6%) |
| 2-Person Household | 596 (68.0%) | 281 (32.0%) |
| 3-Person Household | 354 (73.6%) | 127 (26.4%) |
| 4+ Person Household | 732 (69.5%) | 322 (30.5%) |
| Total Housing Units | 2,005 (66.2%) | 1,024 (33.8%) |
Occupancy by Educational Attainment in Denison
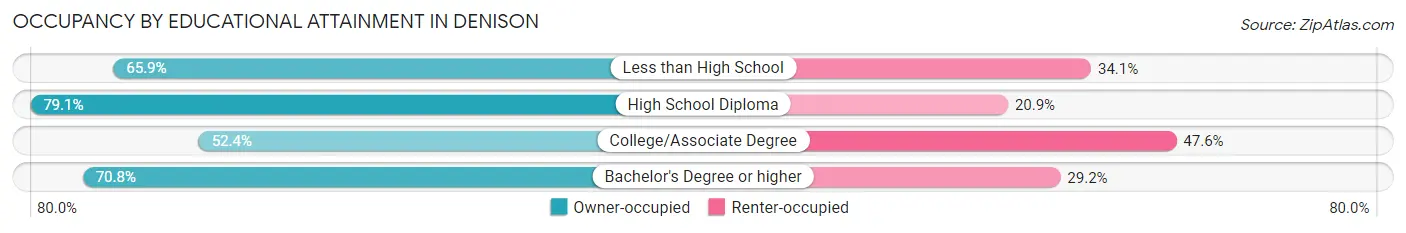
| Household Size | Owner-occupied | Renter-occupied |
| Less than High School | 472 (65.9%) | 244 (34.1%) |
| High School Diploma | 700 (79.1%) | 185 (20.9%) |
| College/Associate Degree | 506 (52.4%) | 460 (47.6%) |
| Bachelor's Degree or higher | 327 (70.8%) | 135 (29.2%) |
Occupancy by Age of Householder in Denison
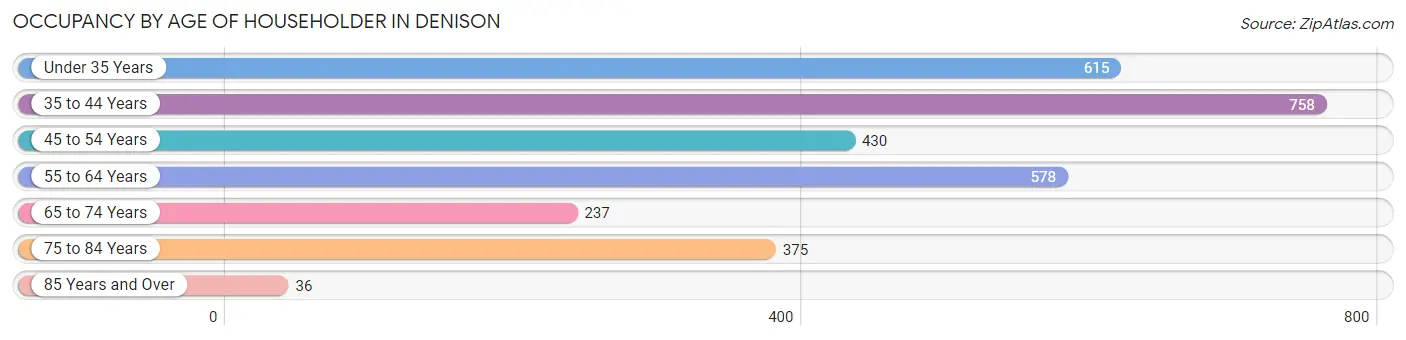
| Age Bracket | # Households | % Households |
| Under 35 Years | 615 | 20.3% |
| 35 to 44 Years | 758 | 25.0% |
| 45 to 54 Years | 430 | 14.2% |
| 55 to 64 Years | 578 | 19.1% |
| 65 to 74 Years | 237 | 7.8% |
| 75 to 84 Years | 375 | 12.4% |
| 85 Years and Over | 36 | 1.2% |
| Total | 3,029 | 100.0% |
Housing Finances in Denison
Median Income by Occupancy in Denison
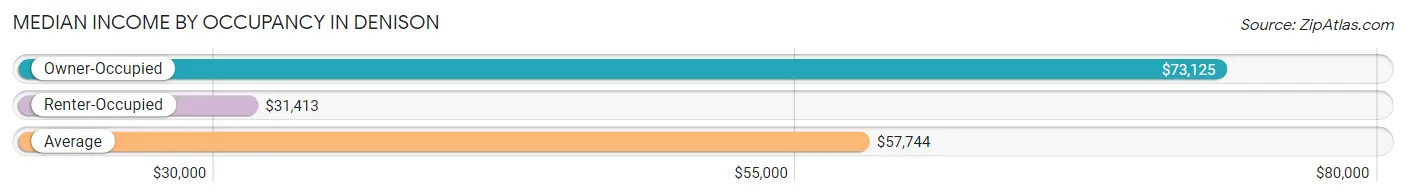
| Occupancy Type | # Households | Median Income |
| Owner-Occupied | 2,005 (66.2%) | $73,125 |
| Renter-Occupied | 1,024 (33.8%) | $31,413 |
| Average | 3,029 (100.0%) | $57,744 |
Occupancy by Householder Income Bracket in Denison
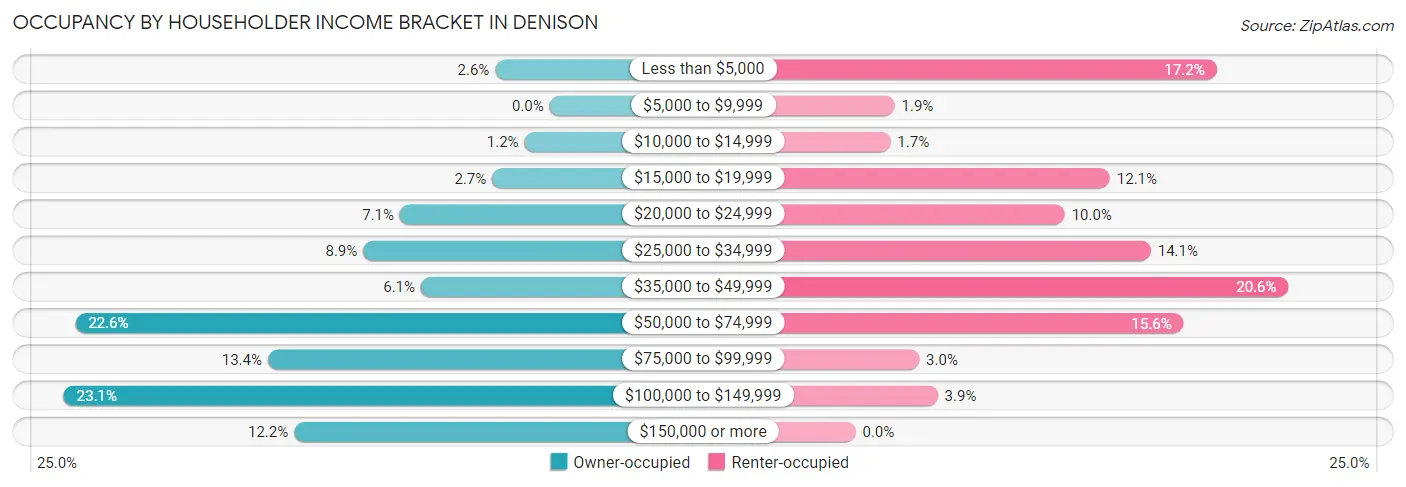
| Income Bracket | Owner-occupied | Renter-occupied |
| Less than $5,000 | 52 (2.6%) | 176 (17.2%) |
| $5,000 to $9,999 | 0 (0.0%) | 19 (1.9%) |
| $10,000 to $14,999 | 24 (1.2%) | 17 (1.7%) |
| $15,000 to $19,999 | 55 (2.7%) | 124 (12.1%) |
| $20,000 to $24,999 | 143 (7.1%) | 102 (10.0%) |
| $25,000 to $34,999 | 178 (8.9%) | 144 (14.1%) |
| $35,000 to $49,999 | 123 (6.1%) | 211 (20.6%) |
| $50,000 to $74,999 | 453 (22.6%) | 160 (15.6%) |
| $75,000 to $99,999 | 269 (13.4%) | 31 (3.0%) |
| $100,000 to $149,999 | 464 (23.1%) | 40 (3.9%) |
| $150,000 or more | 244 (12.2%) | 0 (0.0%) |
| Total | 2,005 (100.0%) | 1,024 (100.0%) |
Monthly Housing Cost Tiers in Denison
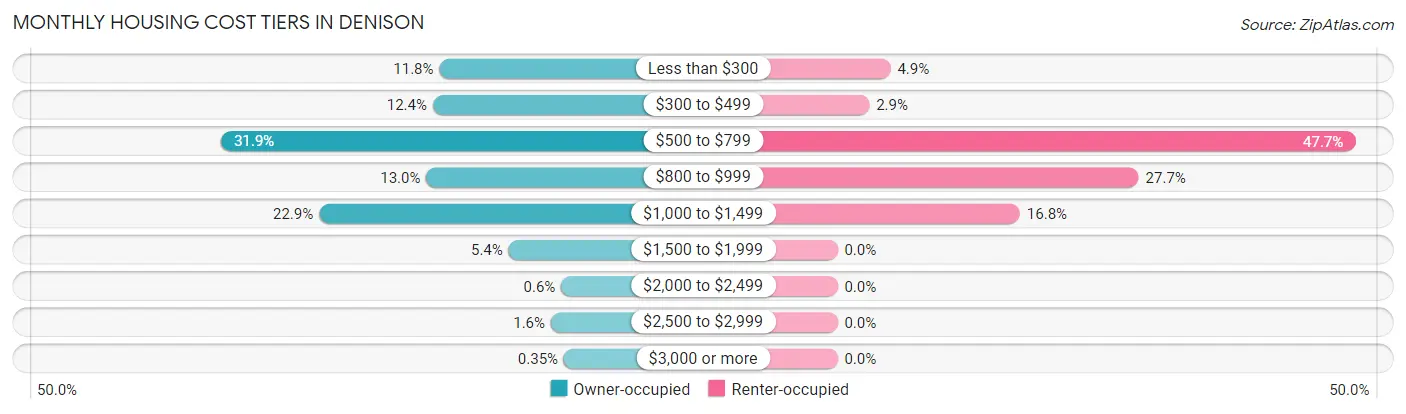
| Monthly Cost | Owner-occupied | Renter-occupied |
| Less than $300 | 237 (11.8%) | 50 (4.9%) |
| $300 to $499 | 249 (12.4%) | 30 (2.9%) |
| $500 to $799 | 640 (31.9%) | 488 (47.7%) |
| $800 to $999 | 261 (13.0%) | 284 (27.7%) |
| $1,000 to $1,499 | 459 (22.9%) | 172 (16.8%) |
| $1,500 to $1,999 | 109 (5.4%) | 0 (0.0%) |
| $2,000 to $2,499 | 12 (0.6%) | 0 (0.0%) |
| $2,500 to $2,999 | 31 (1.5%) | 0 (0.0%) |
| $3,000 or more | 7 (0.4%) | 0 (0.0%) |
| Total | 2,005 (100.0%) | 1,024 (100.0%) |
Physical Housing Characteristics in Denison
Housing Structures in Denison
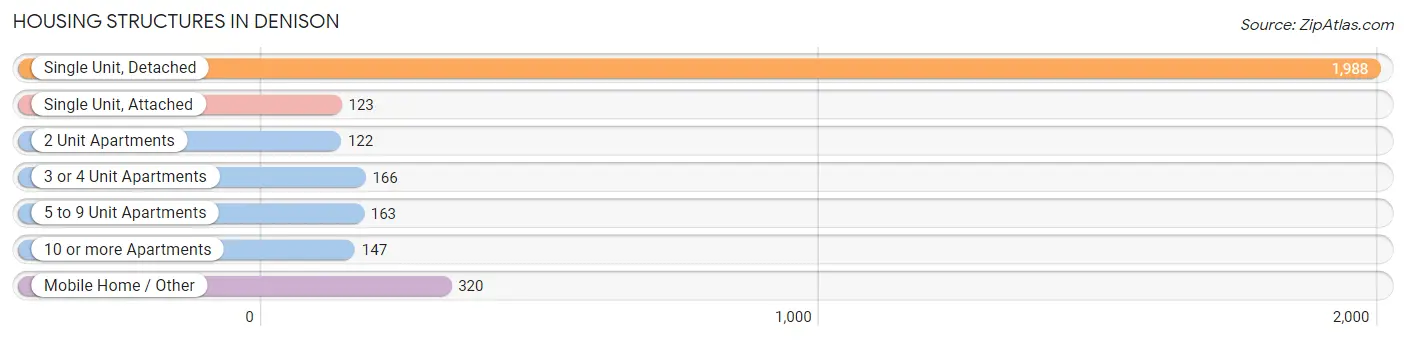
| Structure Type | # Housing Units | % Housing Units |
| Single Unit, Detached | 1,988 | 65.6% |
| Single Unit, Attached | 123 | 4.1% |
| 2 Unit Apartments | 122 | 4.0% |
| 3 or 4 Unit Apartments | 166 | 5.5% |
| 5 to 9 Unit Apartments | 163 | 5.4% |
| 10 or more Apartments | 147 | 4.9% |
| Mobile Home / Other | 320 | 10.6% |
| Total | 3,029 | 100.0% |
Housing Structures by Occupancy in Denison
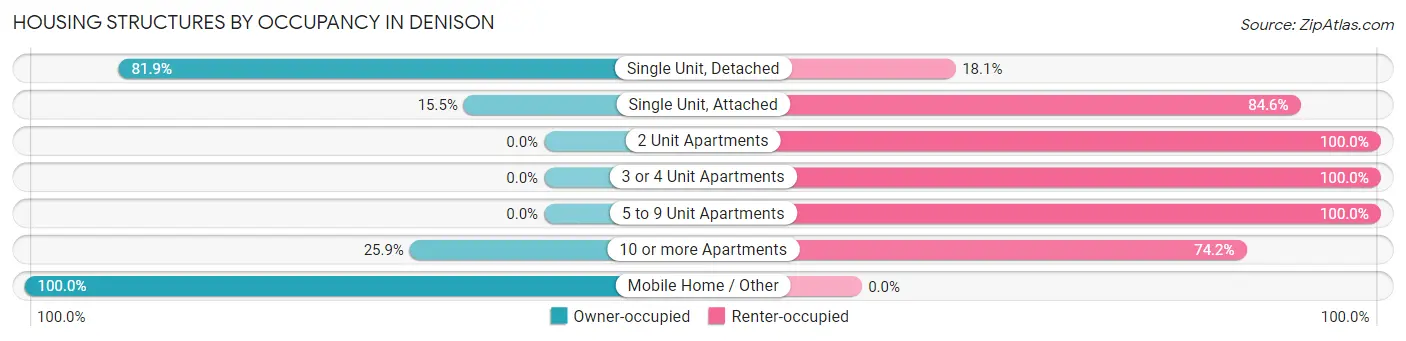
| Structure Type | Owner-occupied | Renter-occupied |
| Single Unit, Detached | 1,628 (81.9%) | 360 (18.1%) |
| Single Unit, Attached | 19 (15.4%) | 104 (84.6%) |
| 2 Unit Apartments | 0 (0.0%) | 122 (100.0%) |
| 3 or 4 Unit Apartments | 0 (0.0%) | 166 (100.0%) |
| 5 to 9 Unit Apartments | 0 (0.0%) | 163 (100.0%) |
| 10 or more Apartments | 38 (25.9%) | 109 (74.2%) |
| Mobile Home / Other | 320 (100.0%) | 0 (0.0%) |
| Total | 2,005 (66.2%) | 1,024 (33.8%) |
Housing Structures by Number of Rooms in Denison
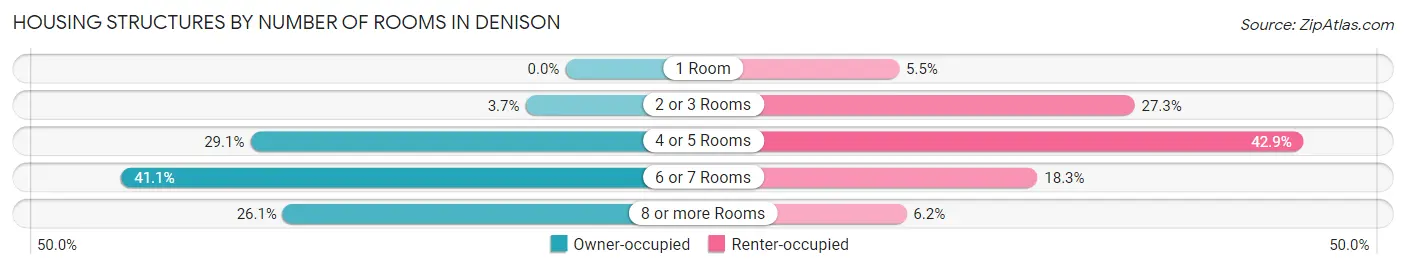
| Number of Rooms | Owner-occupied | Renter-occupied |
| 1 Room | 0 (0.0%) | 56 (5.5%) |
| 2 or 3 Rooms | 74 (3.7%) | 279 (27.3%) |
| 4 or 5 Rooms | 584 (29.1%) | 439 (42.9%) |
| 6 or 7 Rooms | 823 (41.0%) | 187 (18.3%) |
| 8 or more Rooms | 524 (26.1%) | 63 (6.1%) |
| Total | 2,005 (100.0%) | 1,024 (100.0%) |
Housing Structure by Heating Type in Denison
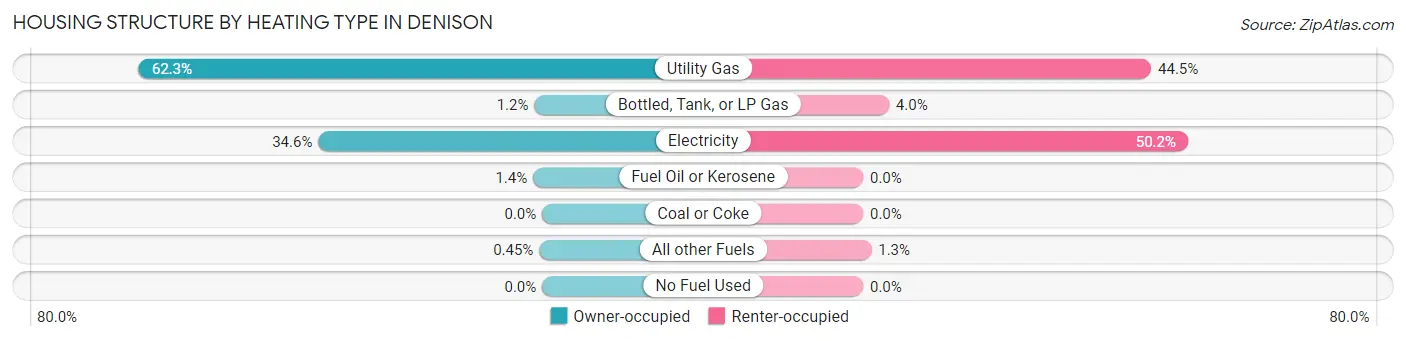
| Heating Type | Owner-occupied | Renter-occupied |
| Utility Gas | 1,250 (62.3%) | 456 (44.5%) |
| Bottled, Tank, or LP Gas | 24 (1.2%) | 41 (4.0%) |
| Electricity | 694 (34.6%) | 514 (50.2%) |
| Fuel Oil or Kerosene | 28 (1.4%) | 0 (0.0%) |
| Coal or Coke | 0 (0.0%) | 0 (0.0%) |
| All other Fuels | 9 (0.4%) | 13 (1.3%) |
| No Fuel Used | 0 (0.0%) | 0 (0.0%) |
| Total | 2,005 (100.0%) | 1,024 (100.0%) |
Household Vehicle Usage in Denison
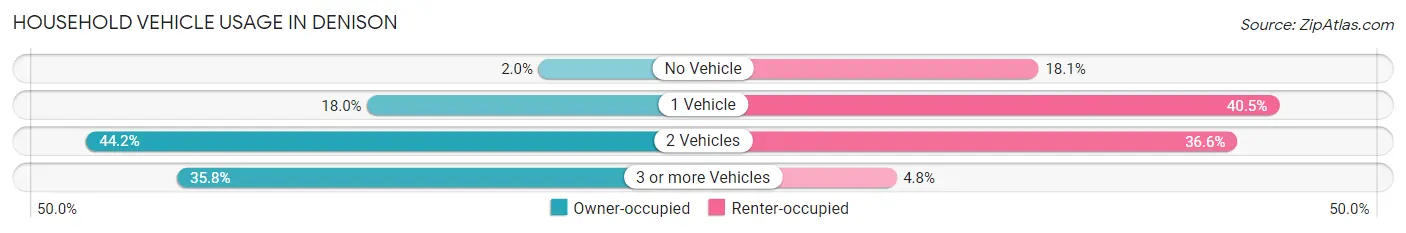
| Vehicles per Household | Owner-occupied | Renter-occupied |
| No Vehicle | 40 (2.0%) | 185 (18.1%) |
| 1 Vehicle | 361 (18.0%) | 415 (40.5%) |
| 2 Vehicles | 887 (44.2%) | 375 (36.6%) |
| 3 or more Vehicles | 717 (35.8%) | 49 (4.8%) |
| Total | 2,005 (100.0%) | 1,024 (100.0%) |
Real Estate & Mortgages in Denison
Real Estate and Mortgage Overview in Denison
| Characteristic | Without Mortgage | With Mortgage |
| Housing Units | 1,120 | 885 |
| Median Property Value | $94,300 | $147,000 |
| Median Household Income | $60,533 | $189 |
| Monthly Housing Costs | $526 | $7 |
| Real Estate Taxes | $1,457 | $69 |
Property Value by Mortgage Status in Denison
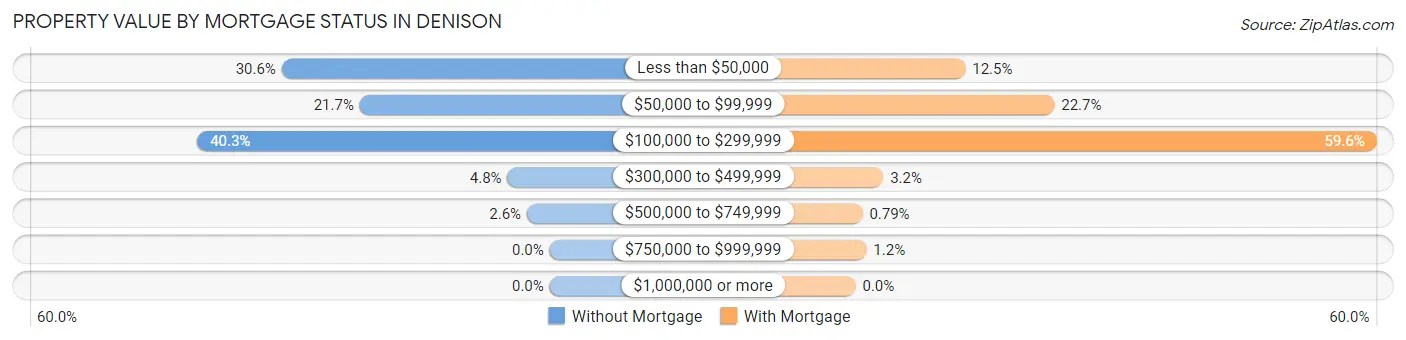
| Property Value | Without Mortgage | With Mortgage |
| Less than $50,000 | 343 (30.6%) | 111 (12.5%) |
| $50,000 to $99,999 | 243 (21.7%) | 201 (22.7%) |
| $100,000 to $299,999 | 451 (40.3%) | 527 (59.6%) |
| $300,000 to $499,999 | 54 (4.8%) | 28 (3.2%) |
| $500,000 to $749,999 | 29 (2.6%) | 7 (0.8%) |
| $750,000 to $999,999 | 0 (0.0%) | 11 (1.2%) |
| $1,000,000 or more | 0 (0.0%) | 0 (0.0%) |
| Total | 1,120 (100.0%) | 885 (100.0%) |
Household Income by Mortgage Status in Denison
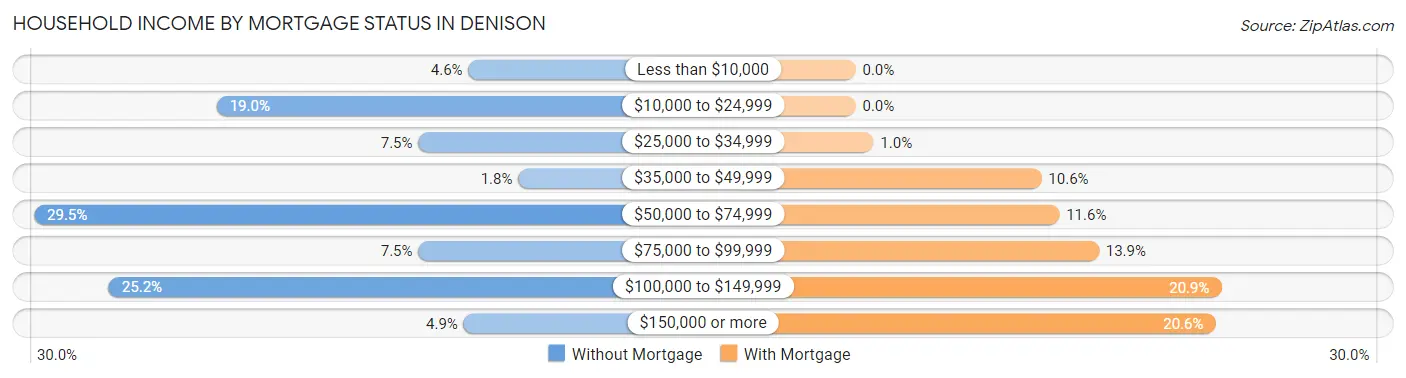
| Household Income | Without Mortgage | With Mortgage |
| Less than $10,000 | 52 (4.6%) | 0 (0.0%) |
| $10,000 to $24,999 | 213 (19.0%) | 0 (0.0%) |
| $25,000 to $34,999 | 84 (7.5%) | 9 (1.0%) |
| $35,000 to $49,999 | 20 (1.8%) | 94 (10.6%) |
| $50,000 to $74,999 | 330 (29.5%) | 103 (11.6%) |
| $75,000 to $99,999 | 84 (7.5%) | 123 (13.9%) |
| $100,000 to $149,999 | 282 (25.2%) | 185 (20.9%) |
| $150,000 or more | 55 (4.9%) | 182 (20.6%) |
| Total | 1,120 (100.0%) | 885 (100.0%) |
Property Value to Household Income Ratio in Denison
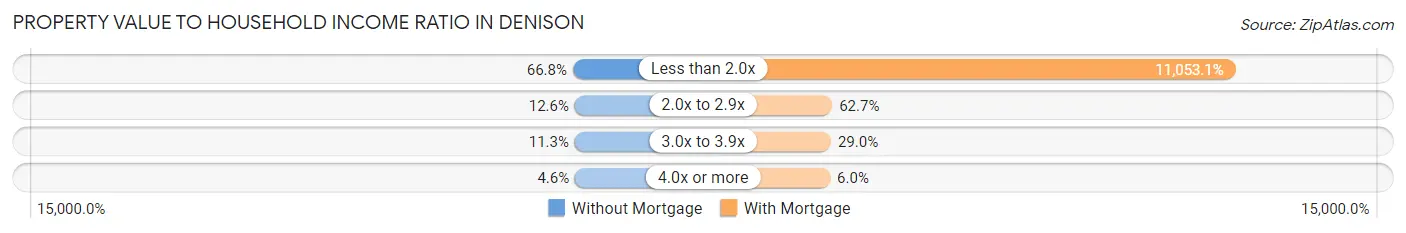
| Value-to-Income Ratio | Without Mortgage | With Mortgage |
| Less than 2.0x | 748 (66.8%) | 97,820 (11,053.1%) |
| 2.0x to 2.9x | 141 (12.6%) | 555 (62.7%) |
| 3.0x to 3.9x | 127 (11.3%) | 257 (29.0%) |
| 4.0x or more | 52 (4.6%) | 53 (6.0%) |
| Total | 1,120 (100.0%) | 885 (100.0%) |
Real Estate Taxes by Mortgage Status in Denison
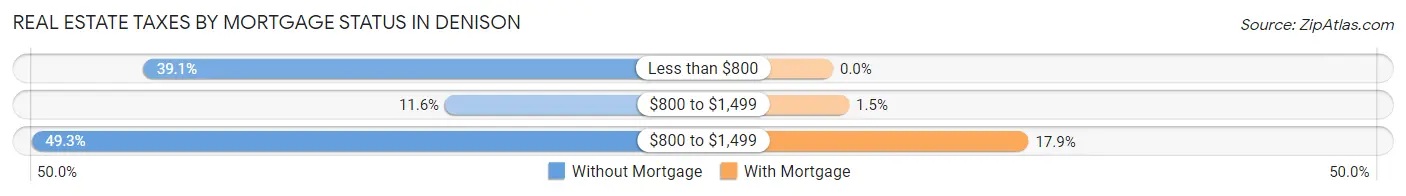
| Property Taxes | Without Mortgage | With Mortgage |
| Less than $800 | 438 (39.1%) | 0 (0.0%) |
| $800 to $1,499 | 130 (11.6%) | 13 (1.5%) |
| $800 to $1,499 | 552 (49.3%) | 158 (17.8%) |
| Total | 1,120 (100.0%) | 885 (100.0%) |
Health & Disability in Denison
Health Insurance Coverage by Age in Denison
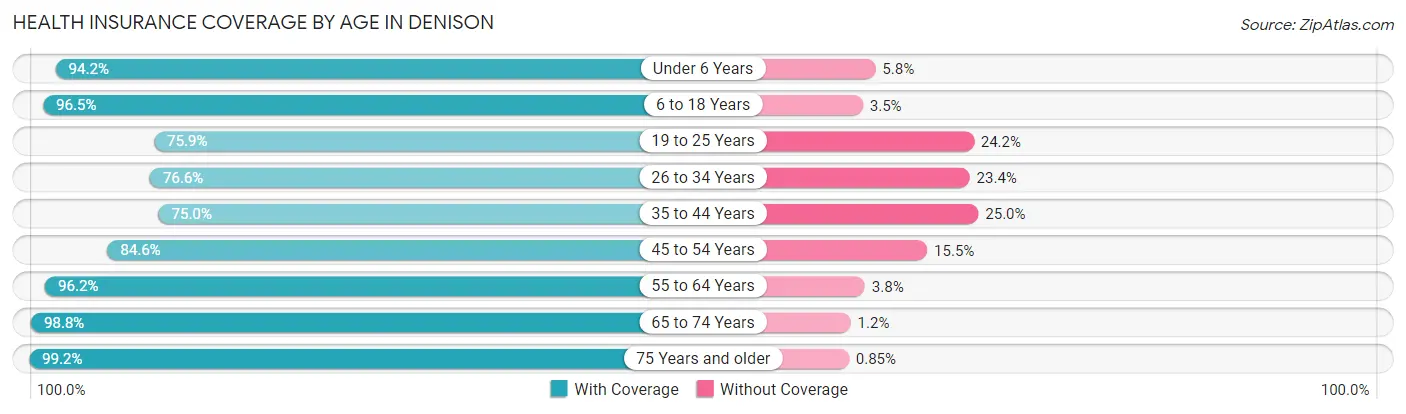
| Age Bracket | With Coverage | Without Coverage |
| Under 6 Years | 585 (94.2%) | 36 (5.8%) |
| 6 to 18 Years | 1,702 (96.5%) | 61 (3.5%) |
| 19 to 25 Years | 738 (75.8%) | 235 (24.1%) |
| 26 to 34 Years | 767 (76.6%) | 234 (23.4%) |
| 35 to 44 Years | 807 (75.0%) | 269 (25.0%) |
| 45 to 54 Years | 646 (84.6%) | 118 (15.4%) |
| 55 to 64 Years | 876 (96.2%) | 35 (3.8%) |
| 65 to 74 Years | 579 (98.8%) | 7 (1.2%) |
| 75 Years and older | 464 (99.2%) | 4 (0.9%) |
| Total | 7,164 (87.8%) | 999 (12.2%) |
Health Insurance Coverage by Citizenship Status in Denison
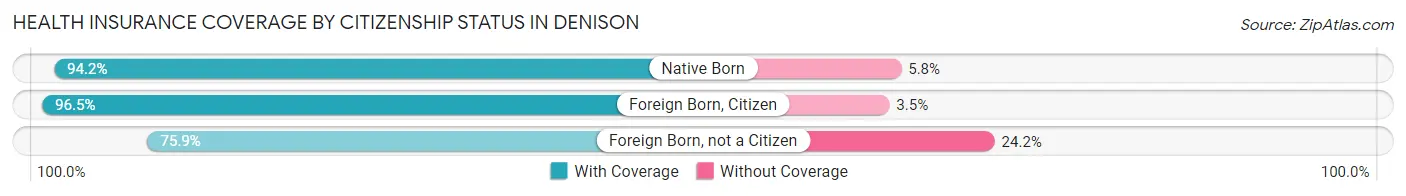
| Citizenship Status | With Coverage | Without Coverage |
| Native Born | 585 (94.2%) | 36 (5.8%) |
| Foreign Born, Citizen | 1,702 (96.5%) | 61 (3.5%) |
| Foreign Born, not a Citizen | 738 (75.8%) | 235 (24.1%) |
Health Insurance Coverage by Household Income in Denison
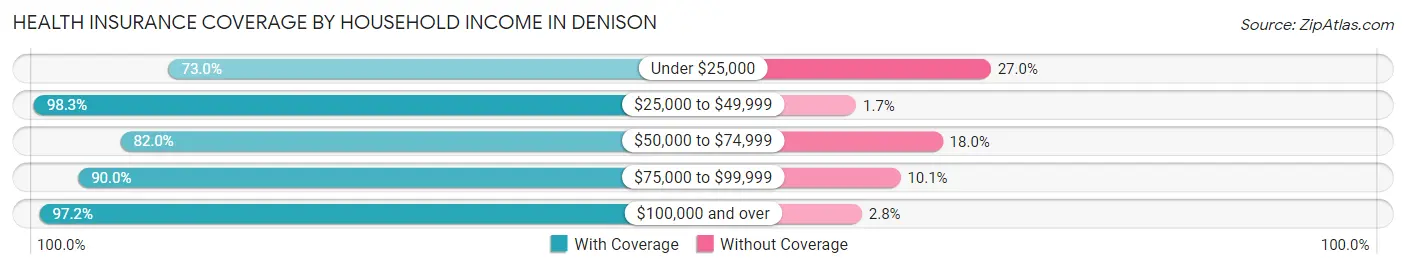
| Household Income | With Coverage | Without Coverage |
| Under $25,000 | 1,175 (73.0%) | 434 (27.0%) |
| $25,000 to $49,999 | 1,129 (98.3%) | 20 (1.7%) |
| $50,000 to $74,999 | 1,613 (82.0%) | 353 (18.0%) |
| $75,000 to $99,999 | 725 (89.9%) | 81 (10.1%) |
| $100,000 and over | 2,239 (97.2%) | 65 (2.8%) |
Public vs Private Health Insurance Coverage by Age in Denison
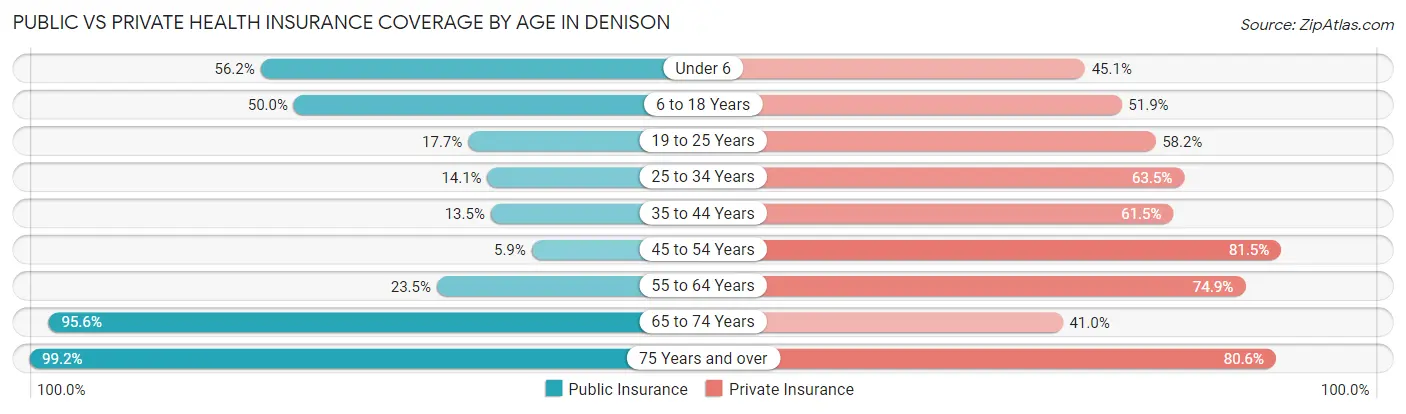
| Age Bracket | Public Insurance | Private Insurance |
| Under 6 | 349 (56.2%) | 280 (45.1%) |
| 6 to 18 Years | 882 (50.0%) | 915 (51.9%) |
| 19 to 25 Years | 172 (17.7%) | 566 (58.2%) |
| 25 to 34 Years | 141 (14.1%) | 636 (63.5%) |
| 35 to 44 Years | 145 (13.5%) | 662 (61.5%) |
| 45 to 54 Years | 45 (5.9%) | 623 (81.5%) |
| 55 to 64 Years | 214 (23.5%) | 682 (74.9%) |
| 65 to 74 Years | 560 (95.6%) | 240 (41.0%) |
| 75 Years and over | 464 (99.2%) | 377 (80.6%) |
| Total | 2,972 (36.4%) | 4,981 (61.0%) |
Disability Status by Sex by Age in Denison
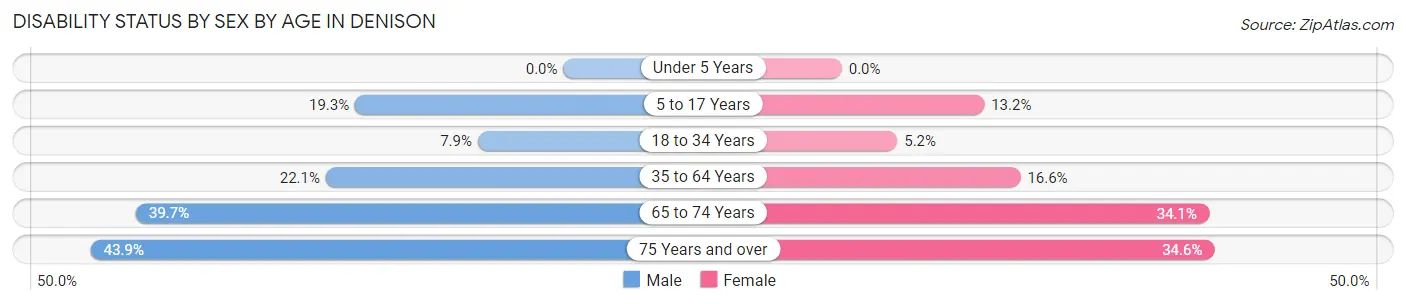
| Age Bracket | Male | Female |
| Under 5 Years | 0 (0.0%) | 0 (0.0%) |
| 5 to 17 Years | 197 (19.3%) | 97 (13.2%) |
| 18 to 34 Years | 93 (7.9%) | 50 (5.1%) |
| 35 to 64 Years | 249 (22.1%) | 269 (16.6%) |
| 65 to 74 Years | 123 (39.7%) | 94 (34.1%) |
| 75 Years and over | 86 (43.9%) | 94 (34.6%) |
Disability Class by Sex by Age in Denison
Disability Class: Hearing Difficulty
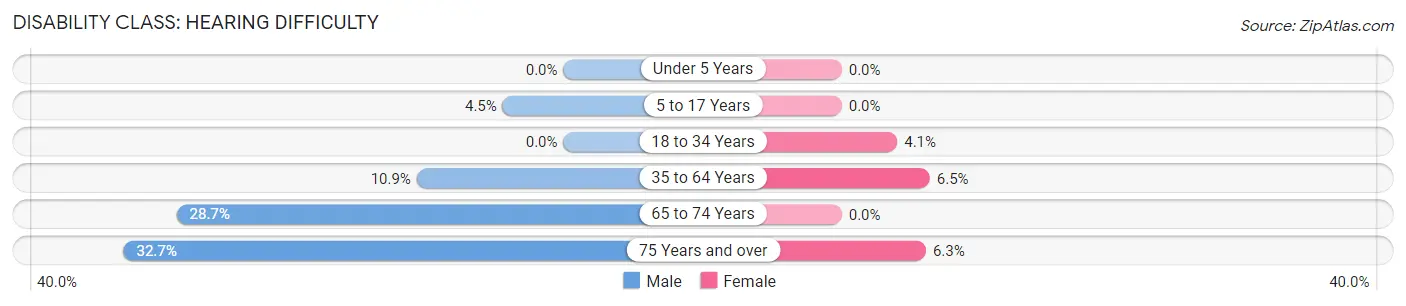
| Age Bracket | Male | Female |
| Under 5 Years | 0 (0.0%) | 0 (0.0%) |
| 5 to 17 Years | 46 (4.5%) | 0 (0.0%) |
| 18 to 34 Years | 0 (0.0%) | 40 (4.1%) |
| 35 to 64 Years | 123 (10.9%) | 106 (6.5%) |
| 65 to 74 Years | 89 (28.7%) | 0 (0.0%) |
| 75 Years and over | 64 (32.7%) | 17 (6.2%) |
Disability Class: Vision Difficulty
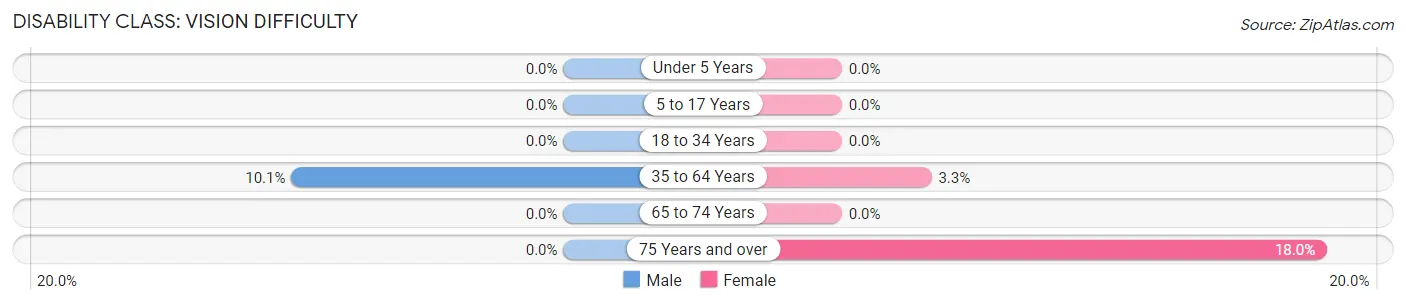
| Age Bracket | Male | Female |
| Under 5 Years | 0 (0.0%) | 0 (0.0%) |
| 5 to 17 Years | 0 (0.0%) | 0 (0.0%) |
| 18 to 34 Years | 0 (0.0%) | 0 (0.0%) |
| 35 to 64 Years | 114 (10.1%) | 54 (3.3%) |
| 65 to 74 Years | 0 (0.0%) | 0 (0.0%) |
| 75 Years and over | 0 (0.0%) | 49 (18.0%) |
Disability Class: Cognitive Difficulty
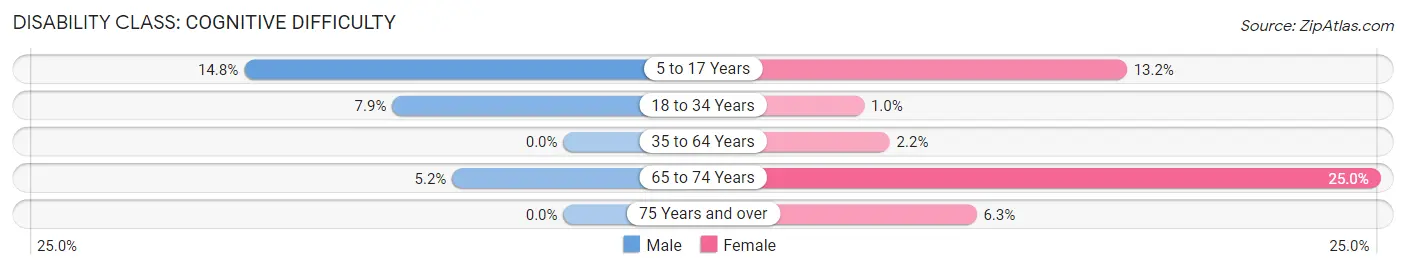
| Age Bracket | Male | Female |
| 5 to 17 Years | 151 (14.8%) | 97 (13.2%) |
| 18 to 34 Years | 93 (7.9%) | 10 (1.0%) |
| 35 to 64 Years | 0 (0.0%) | 36 (2.2%) |
| 65 to 74 Years | 16 (5.2%) | 69 (25.0%) |
| 75 Years and over | 0 (0.0%) | 17 (6.2%) |
Disability Class: Ambulatory Difficulty
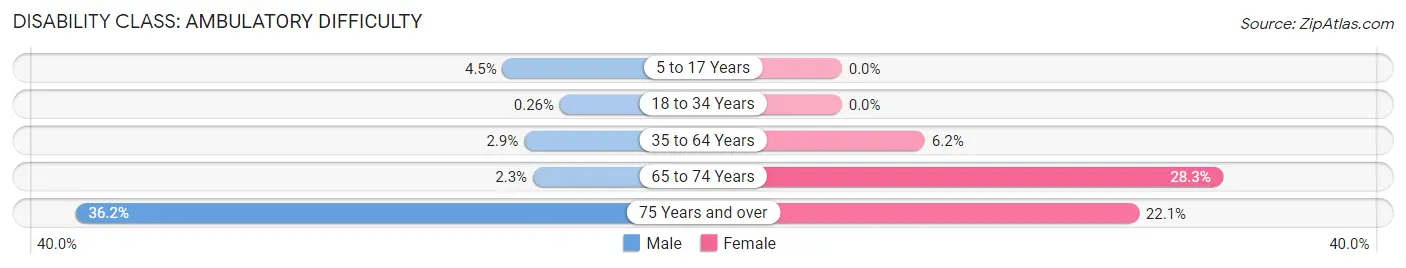
| Age Bracket | Male | Female |
| 5 to 17 Years | 46 (4.5%) | 0 (0.0%) |
| 18 to 34 Years | 3 (0.3%) | 0 (0.0%) |
| 35 to 64 Years | 33 (2.9%) | 100 (6.2%) |
| 65 to 74 Years | 7 (2.3%) | 78 (28.3%) |
| 75 Years and over | 71 (36.2%) | 60 (22.1%) |
Disability Class: Self-Care Difficulty
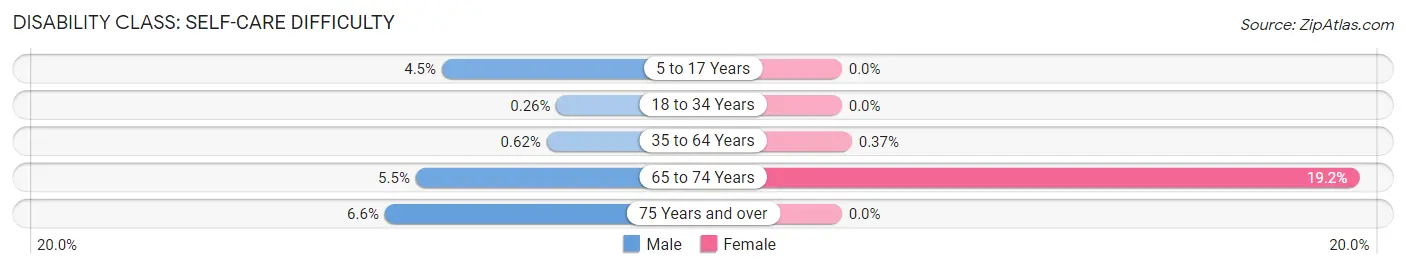
| Age Bracket | Male | Female |
| 5 to 17 Years | 46 (4.5%) | 0 (0.0%) |
| 18 to 34 Years | 3 (0.3%) | 0 (0.0%) |
| 35 to 64 Years | 7 (0.6%) | 6 (0.4%) |
| 65 to 74 Years | 17 (5.5%) | 53 (19.2%) |
| 75 Years and over | 13 (6.6%) | 0 (0.0%) |
Technology Access in Denison
Computing Device Access in Denison
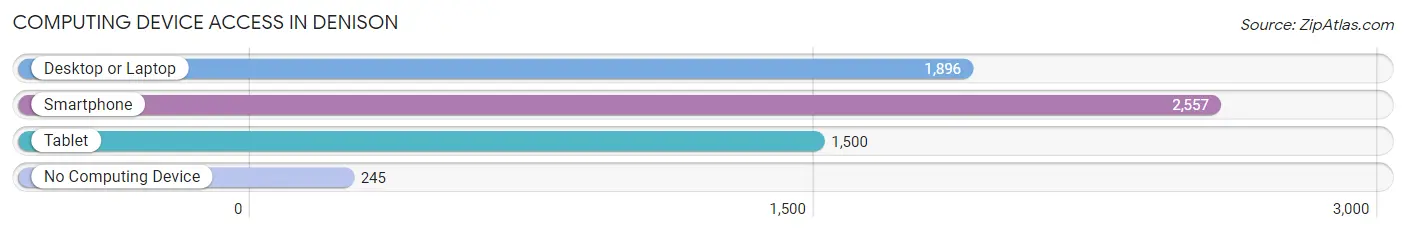
| Device Type | # Households | % Households |
| Desktop or Laptop | 1,896 | 62.6% |
| Smartphone | 2,557 | 84.4% |
| Tablet | 1,500 | 49.5% |
| No Computing Device | 245 | 8.1% |
| Total | 3,029 | 100.0% |
Internet Access in Denison
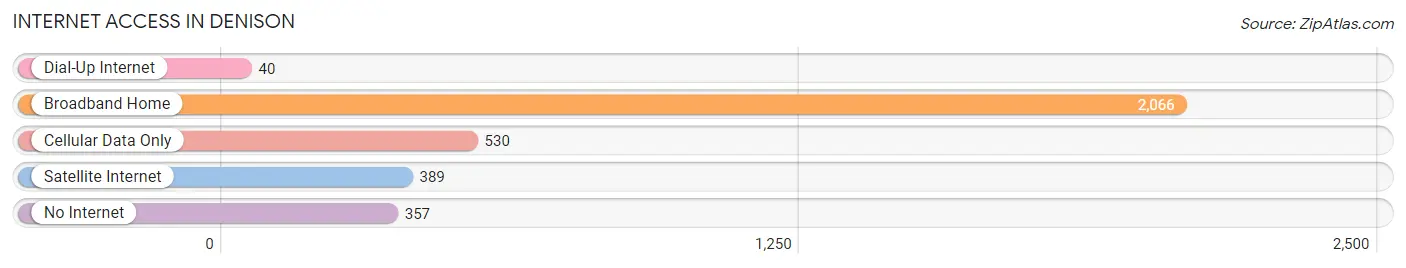
| Internet Type | # Households | % Households |
| Dial-Up Internet | 40 | 1.3% |
| Broadband Home | 2,066 | 68.2% |
| Cellular Data Only | 530 | 17.5% |
| Satellite Internet | 389 | 12.8% |
| No Internet | 357 | 11.8% |
| Total | 3,029 | 100.0% |
Denison Summary
Denison, Iowa is a city located in Crawford County in the western part of the state. It is the county seat and the largest city in the county. The city is situated along the Boyer River and is located about 40 miles northwest of Council Bluffs. As of the 2010 census, the population of Denison was 8,298.
History
The area that is now Denison was first settled in 1856 by a group of settlers from Ohio. The town was originally known as Dension, but the spelling was changed to Denison in 1857. The town was officially incorporated in 1876.
In the late 19th century, Denison was a major railroad hub, with the Chicago and North Western Railway and the Chicago, Milwaukee, St. Paul and Pacific Railroad both having lines that ran through the city. The railroads brought a great deal of economic growth to the city, and Denison quickly became a major agricultural center.
Geography
Denison is located at 42°02'N 95°22'W (42.03, -95.37). According to the United States Census Bureau, the city has a total area of 4.3 square miles (11.2 km2), all of it land.
Economy
Denison is a major agricultural center, with a large number of farms located in the area. The city is also home to several manufacturing companies, including Denison Industries, which produces a variety of industrial products.
The city is also home to a number of retail stores, restaurants, and other businesses. Denison is also home to a number of medical facilities, including the Crawford County Memorial Hospital.
Demographics
As of the 2010 census, there were 8,298 people, 3,521 households, and 2,092 families residing in the city. The population density was 1,921.3 people per square mile (741.2/km2). There were 3,845 housing units at an average density of 890.2 per square mile (344.3/km2). The racial makeup of the city was 95.2% White, 0.7% African American, 0.2% Native American, 0.5% Asian, 0.1% Pacific Islander, 2.2% from other races, and 1.1% from two or more races. Hispanic or Latino of any race were 4.3% of the population.
There were 3,521 households, out of which 28.2% had children under the age of 18 living with them, 44.2% were married couples living together, 11.7% had a female householder with no husband present, and 39.3% were non-families. 34.3% of all households were made up of individuals, and 17.2% had someone living alone who was 65 years of age or older. The average household size was 2.30 and the average family size was 2.94.
In the city, the population was spread out, with 24.2% under the age of 18, 8.2% from 18 to 24, 25.2% from 25 to 44, 22.3% from 45 to 64, and 20.1% who were 65 years of age or older. The median age was 39 years. For every 100 females, there were 91.2 males. For every 100 females age 18 and over, there were 87.2 males.
The median income for a household in the city was $33,917, and the median income for a family was $41,944. Males had a median income of $30,917 versus $20,917 for females. The per capita income for the city was $17,845. About 8.2% of families and 11.2% of the population were below the poverty line, including 15.2% of those under age 18 and 8.7% of those age 65 or over.
Common Questions
What is Per Capita Income in Denison?
Per Capita income in Denison is $25,944.
What is the Median Family Income in Denison?
Median Family Income in Denison is $62,141.
What is the Median Household income in Denison?
Median Household Income in Denison is $57,744.
What is Income or Wage Gap in Denison?
Income or Wage Gap in Denison is 19.4%.
Women in Denison earn 80.6 cents for every dollar earned by a man.
What is Inequality or Gini Index in Denison?
Inequality or Gini Index in Denison is 0.44.
What is the Total Population of Denison?
Total Population of Denison is 8,316.
What is the Total Male Population of Denison?
Total Male Population of Denison is 4,052.
What is the Total Female Population of Denison?
Total Female Population of Denison is 4,264.
What is the Ratio of Males per 100 Females in Denison?
There are 95.03 Males per 100 Females in Denison.
What is the Ratio of Females per 100 Males in Denison?
There are 105.23 Females per 100 Males in Denison.
What is the Median Population Age in Denison?
Median Population Age in Denison is 33.7 Years.
What is the Average Family Size in Denison
Average Family Size in Denison is 3.0 People.
What is the Average Household Size in Denison
Average Household Size in Denison is 2.6 People.
How Large is the Labor Force in Denison?
There are 4,054 People in the Labor Forcein in Denison.
What is the Percentage of People in the Labor Force in Denison?
63.1% of People are in the Labor Force in Denison.
What is the Unemployment Rate in Denison?
Unemployment Rate in Denison is 6.2%.