Cities with the Highest Percentage of Salvadoran Population in Minnesota
RELATED REPORTS & OPTIONS
Salvadoran
Minnesota
Compare Cities
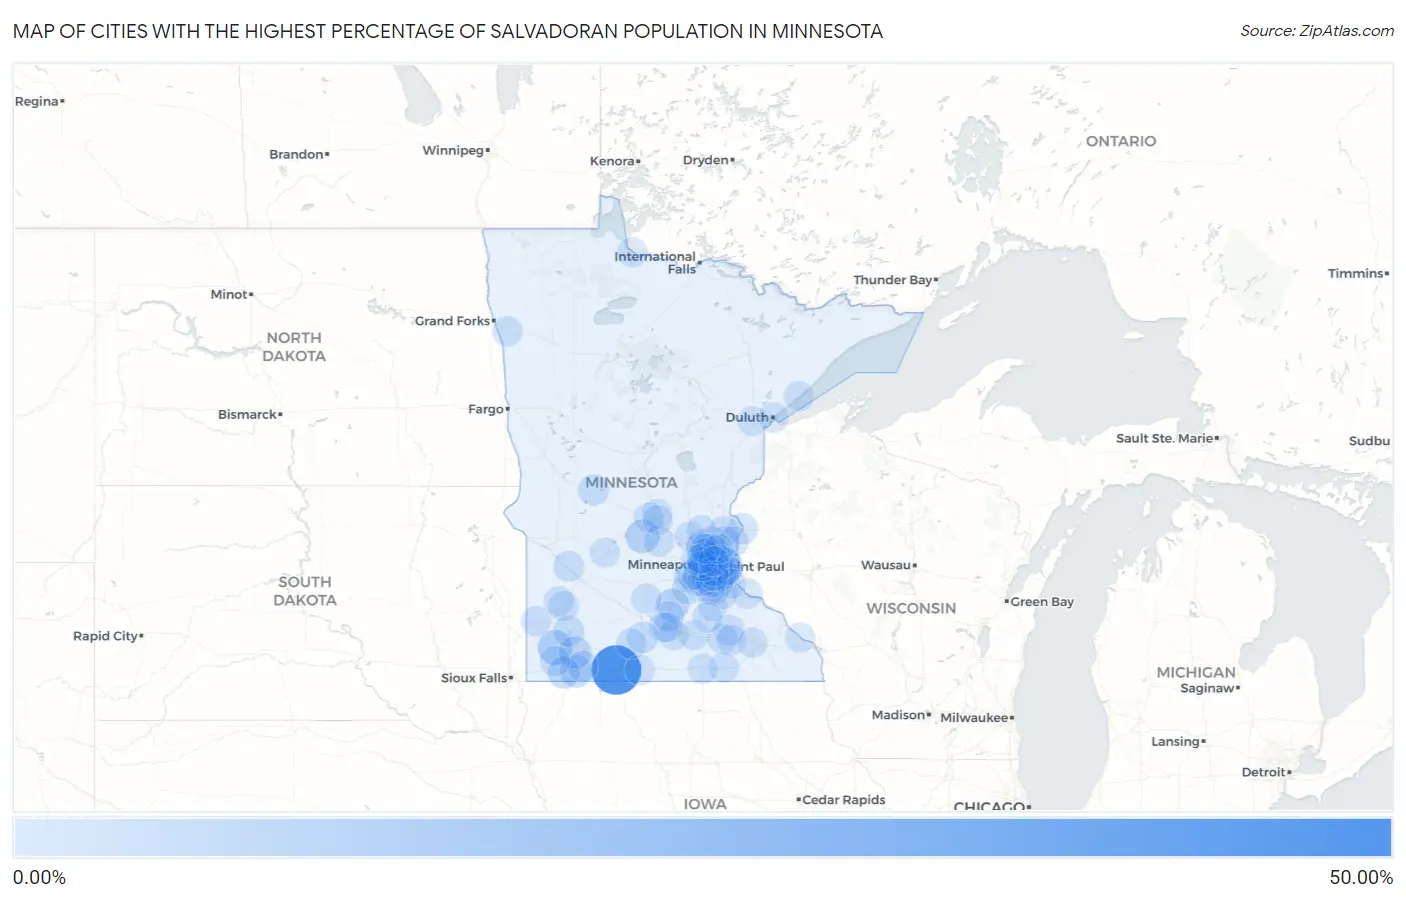
Map of Cities with the Highest Percentage of Salvadoran Population in Minnesota
0.00%
50.00%
Cities with the Highest Percentage of Salvadoran Population in Minnesota
| City | Salvadoran | vs State | vs National | |
| 1. | Alpha | 42.98% | 0.23%(+42.8)#1 | 0.72%(+42.3)#1 |
| 2. | Landfall | 15.11% | 0.23%(+14.9)#2 | 0.72%(+14.4)#79 |
| 3. | Chandler | 9.75% | 0.23%(+9.52)#3 | 0.72%(+9.03)#143 |
| 4. | Watkins | 7.34% | 0.23%(+7.12)#4 | 0.72%(+6.62)#210 |
| 5. | Le Sueur | 6.15% | 0.23%(+5.93)#5 | 0.72%(+5.43)#272 |
| 6. | Worthington | 5.25% | 0.23%(+5.03)#6 | 0.72%(+4.53)#325 |
| 7. | Fulda | 4.87% | 0.23%(+4.64)#7 | 0.72%(+4.14)#355 |
| 8. | Rushmore | 4.45% | 0.23%(+4.23)#8 | 0.72%(+3.73)#390 |
| 9. | South St Paul | 2.44% | 0.23%(+2.21)#9 | 0.72%(+1.72)#775 |
| 10. | Jordan | 2.44% | 0.23%(+2.21)#10 | 0.72%(+1.72)#777 |
| 11. | Madelia | 2.34% | 0.23%(+2.11)#11 | 0.72%(+1.62)#808 |
| 12. | Newport | 2.33% | 0.23%(+2.10)#12 | 0.72%(+1.61)#809 |
| 13. | The Lakes | 2.16% | 0.23%(+1.94)#13 | 0.72%(+1.44)#863 |
| 14. | Nelson | 2.06% | 0.23%(+1.84)#14 | 0.72%(+1.34)#890 |
| 15. | Taylors Falls | 1.89% | 0.23%(+1.66)#15 | 0.72%(+1.17)#965 |
| 16. | Hilltop | 1.69% | 0.23%(+1.47)#16 | 0.72%(+0.970)#1,055 |
| 17. | Brewster | 1.68% | 0.23%(+1.45)#17 | 0.72%(+0.957)#1,066 |
| 18. | Brooklyn Center | 1.56% | 0.23%(+1.33)#18 | 0.72%(+0.834)#1,149 |
| 19. | Montevideo | 1.48% | 0.23%(+1.25)#19 | 0.72%(+0.755)#1,200 |
| 20. | St James | 1.47% | 0.23%(+1.25)#20 | 0.72%(+0.750)#1,204 |
| 21. | Annandale | 1.31% | 0.23%(+1.09)#21 | 0.72%(+0.591)#1,319 |
| 22. | Farmington | 1.13% | 0.23%(+0.907)#22 | 0.72%(+0.411)#1,457 |
| 23. | Richfield | 1.12% | 0.23%(+0.897)#23 | 0.72%(+0.400)#1,469 |
| 24. | West Concord | 1.03% | 0.23%(+0.806)#24 | 0.72%(+0.309)#1,574 |
| 25. | Stacy | 1.00% | 0.23%(+0.778)#25 | 0.72%(+0.281)#1,609 |
| 26. | St Paul | 0.98% | 0.23%(+0.752)#26 | 0.72%(+0.255)#1,642 |
| 27. | Marshall | 0.97% | 0.23%(+0.749)#27 | 0.72%(+0.253)#1,645 |
| 28. | Anoka | 0.89% | 0.23%(+0.669)#28 | 0.72%(+0.173)#1,746 |
| 29. | St Peter | 0.87% | 0.23%(+0.647)#29 | 0.72%(+0.150)#1,769 |
| 30. | West St Paul | 0.84% | 0.23%(+0.611)#30 | 0.72%(+0.114)#1,813 |
| 31. | Fridley | 0.76% | 0.23%(+0.538)#31 | 0.72%(+0.042)#1,946 |
| 32. | Red Wing | 0.73% | 0.23%(+0.503)#32 | 0.72%(+0.006)#2,004 |
| 33. | Ham Lake | 0.72% | 0.23%(+0.490)#33 | 0.72%(-0.006)#2,027 |
| 34. | Arden Hills | 0.71% | 0.23%(+0.489)#34 | 0.72%(-0.008)#2,031 |
| 35. | Lismore | 0.68% | 0.23%(+0.460)#35 | 0.72%(-0.037)#2,076 |
| 36. | Hampton | 0.68% | 0.23%(+0.452)#36 | 0.72%(-0.045)#2,088 |
| 37. | Rosemount | 0.66% | 0.23%(+0.433)#37 | 0.72%(-0.064)#2,133 |
| 38. | Lake Benton | 0.61% | 0.23%(+0.383)#38 | 0.72%(-0.114)#2,230 |
| 39. | Inver Grove Heights | 0.59% | 0.23%(+0.361)#39 | 0.72%(-0.136)#2,285 |
| 40. | Lakeville | 0.56% | 0.23%(+0.339)#40 | 0.72%(-0.157)#2,336 |
| 41. | Claremont | 0.54% | 0.23%(+0.318)#41 | 0.72%(-0.178)#2,380 |
| 42. | Waseca | 0.53% | 0.23%(+0.307)#42 | 0.72%(-0.190)#2,410 |
| 43. | Spring Lake Park | 0.53% | 0.23%(+0.306)#43 | 0.72%(-0.191)#2,413 |
| 44. | Fisher | 0.52% | 0.23%(+0.297)#44 | 0.72%(-0.199)#2,437 |
| 45. | Columbia Heights | 0.49% | 0.23%(+0.261)#45 | 0.72%(-0.236)#2,519 |
| 46. | Edina | 0.46% | 0.23%(+0.239)#46 | 0.72%(-0.258)#2,570 |
| 47. | Ghent | 0.44% | 0.23%(+0.213)#47 | 0.72%(-0.284)#2,643 |
| 48. | Oakdale | 0.44% | 0.23%(+0.210)#48 | 0.72%(-0.286)#2,654 |
| 49. | Bloomington | 0.40% | 0.23%(+0.179)#49 | 0.72%(-0.317)#2,747 |
| 50. | Hopkins | 0.40% | 0.23%(+0.175)#50 | 0.72%(-0.322)#2,761 |
| 51. | Winthrop | 0.39% | 0.23%(+0.161)#51 | 0.72%(-0.336)#2,810 |
| 52. | St Clair | 0.38% | 0.23%(+0.155)#52 | 0.72%(-0.341)#2,828 |
| 53. | Forest Lake | 0.37% | 0.23%(+0.150)#53 | 0.72%(-0.347)#2,856 |
| 54. | Shakopee | 0.37% | 0.23%(+0.149)#54 | 0.72%(-0.348)#2,859 |
| 55. | Burnsville | 0.37% | 0.23%(+0.145)#55 | 0.72%(-0.352)#2,871 |
| 56. | Scandia | 0.30% | 0.23%(+0.078)#56 | 0.72%(-0.419)#3,127 |
| 57. | Dodge Center | 0.28% | 0.23%(+0.057)#57 | 0.72%(-0.439)#3,217 |
| 58. | Elk River | 0.27% | 0.23%(+0.049)#58 | 0.72%(-0.448)#3,248 |
| 59. | Austin | 0.26% | 0.23%(+0.039)#59 | 0.72%(-0.458)#3,284 |
| 60. | Circle Pines | 0.26% | 0.23%(+0.035)#60 | 0.72%(-0.461)#3,299 |
| 61. | St Francis | 0.26% | 0.23%(+0.031)#61 | 0.72%(-0.466)#3,311 |
| 62. | New Brighton | 0.25% | 0.23%(+0.030)#62 | 0.72%(-0.467)#3,319 |
| 63. | North Mankato | 0.24% | 0.23%(+0.014)#63 | 0.72%(-0.483)#3,406 |
| 64. | Duluth | 0.23% | 0.23%(+0.002)#64 | 0.72%(-0.495)#3,460 |
| 65. | Two Harbors | 0.22% | 0.23%(-0.004)#65 | 0.72%(-0.501)#3,493 |
| 66. | Minneapolis | 0.22% | 0.23%(-0.009)#66 | 0.72%(-0.506)#3,523 |
| 67. | Maplewood | 0.17% | 0.23%(-0.058)#67 | 0.72%(-0.555)#3,763 |
| 68. | Fairmont | 0.16% | 0.23%(-0.062)#68 | 0.72%(-0.558)#3,774 |
| 69. | Blaine | 0.16% | 0.23%(-0.062)#69 | 0.72%(-0.559)#3,777 |
| 70. | Brooklyn Park | 0.16% | 0.23%(-0.064)#70 | 0.72%(-0.560)#3,784 |
| 71. | Chaska | 0.15% | 0.23%(-0.070)#71 | 0.72%(-0.567)#3,810 |
| 72. | Woodbury | 0.14% | 0.23%(-0.081)#72 | 0.72%(-0.577)#3,861 |
| 73. | Willmar | 0.13% | 0.23%(-0.092)#73 | 0.72%(-0.588)#3,952 |
| 74. | Chanhassen | 0.13% | 0.23%(-0.094)#74 | 0.72%(-0.590)#3,965 |
| 75. | Rochester | 0.13% | 0.23%(-0.096)#75 | 0.72%(-0.593)#3,977 |
| 76. | Eden Prairie | 0.12% | 0.23%(-0.109)#76 | 0.72%(-0.605)#4,049 |
| 77. | Savage | 0.11% | 0.23%(-0.114)#77 | 0.72%(-0.611)#4,095 |
| 78. | Northfield | 0.10% | 0.23%(-0.123)#78 | 0.72%(-0.619)#4,155 |
| 79. | Cloquet | 0.096% | 0.23%(-0.130)#79 | 0.72%(-0.626)#4,202 |
| 80. | Baudette | 0.089% | 0.23%(-0.137)#80 | 0.72%(-0.633)#4,247 |
| 81. | Champlin | 0.085% | 0.23%(-0.141)#81 | 0.72%(-0.637)#4,274 |
| 82. | Plymouth | 0.078% | 0.23%(-0.148)#82 | 0.72%(-0.644)#4,316 |
| 83. | Albert Lea | 0.076% | 0.23%(-0.149)#83 | 0.72%(-0.646)#4,327 |
| 84. | Little Canada | 0.075% | 0.23%(-0.150)#84 | 0.72%(-0.646)#4,333 |
| 85. | Sauk Rapids | 0.072% | 0.23%(-0.153)#85 | 0.72%(-0.649)#4,355 |
| 86. | Golden Valley | 0.072% | 0.23%(-0.153)#86 | 0.72%(-0.649)#4,357 |
| 87. | Apple Valley | 0.065% | 0.23%(-0.160)#87 | 0.72%(-0.657)#4,416 |
| 88. | Mankato | 0.061% | 0.23%(-0.164)#88 | 0.72%(-0.661)#4,456 |
| 89. | St Joseph | 0.057% | 0.23%(-0.169)#89 | 0.72%(-0.665)#4,483 |
| 90. | Mendota Heights | 0.052% | 0.23%(-0.174)#90 | 0.72%(-0.670)#4,512 |
| 91. | Faribault | 0.049% | 0.23%(-0.176)#91 | 0.72%(-0.673)#4,535 |
| 92. | Eagan | 0.048% | 0.23%(-0.177)#92 | 0.72%(-0.673)#4,543 |
| 93. | St Louis Park | 0.042% | 0.23%(-0.183)#93 | 0.72%(-0.679)#4,589 |
| 94. | New Hope | 0.042% | 0.23%(-0.184)#94 | 0.72%(-0.680)#4,594 |
| 95. | Coon Rapids | 0.030% | 0.23%(-0.195)#95 | 0.72%(-0.692)#4,665 |
| 96. | Winona | 0.027% | 0.23%(-0.198)#96 | 0.72%(-0.695)#4,684 |
| 97. | Lino Lakes | 0.019% | 0.23%(-0.207)#97 | 0.72%(-0.703)#4,736 |
| 98. | Roseville | 0.011% | 0.23%(-0.214)#98 | 0.72%(-0.711)#4,777 |
| 99. | St Cloud | 0.010% | 0.23%(-0.215)#99 | 0.72%(-0.712)#4,782 |
| 100. | Hastings | 0.0091% | 0.23%(-0.216)#100 | 0.72%(-0.713)#4,790 |
Common Questions
What are the Top 10 Cities with the Highest Percentage of Salvadoran Population in Minnesota?
Top 10 Cities with the Highest Percentage of Salvadoran Population in Minnesota are:
#1
42.98%
#2
15.11%
#3
9.75%
#4
7.34%
#5
6.15%
#6
5.25%
#7
4.87%
#8
4.45%
#9
2.44%
#10
2.44%
What city has the Highest Percentage of Salvadoran Population in Minnesota?
Alpha has the Highest Percentage of Salvadoran Population in Minnesota with 42.98%.
What is the Percentage of Salvadoran Population in the State of Minnesota?
Percentage of Salvadoran Population in Minnesota is 0.23%.
What is the Percentage of Salvadoran Population in the United States?
Percentage of Salvadoran Population in the United States is 0.72%.