Fort Sumner, NM Map & Demographics
Fort Sumner Map
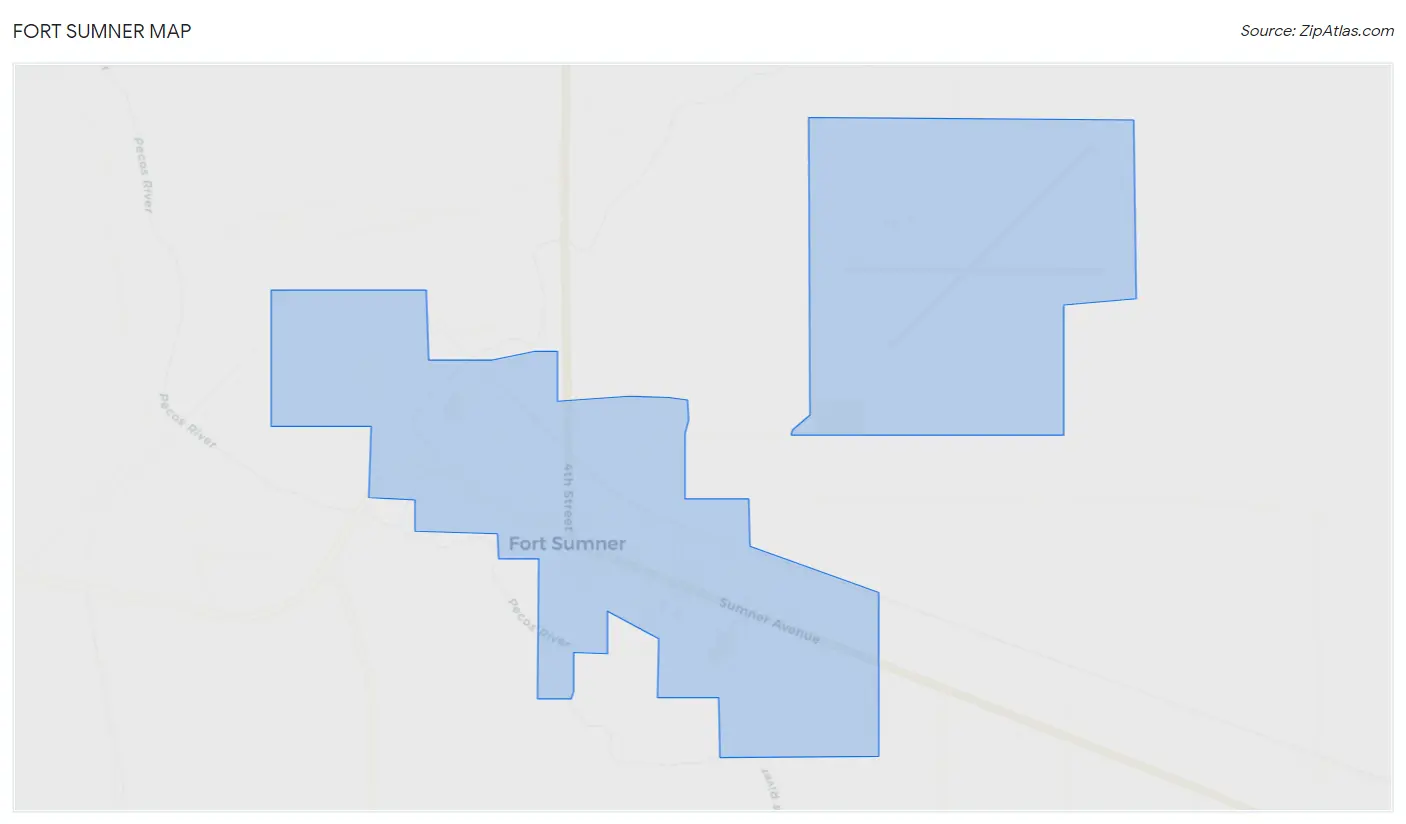
Fort Sumner Overview
$25,034
PER CAPITA INCOME
$78,390
AVG FAMILY INCOME
0.40
INEQUALITY / GINI INDEX
1,206
TOTAL POPULATION
702
MALE POPULATION
504
FEMALE POPULATION
139.29
MALES / 100 FEMALES
71.79
FEMALES / 100 MALES
27.1
MEDIAN AGE
3.9
AVG FAMILY SIZE
2.9
AVG HOUSEHOLD SIZE
538
LABOR FORCE [ PEOPLE ]
64.2%
PERCENT IN LABOR FORCE
10.0%
UNEMPLOYMENT RATE
Fort Sumner Zip Codes
Fort Sumner Area Codes
Income in Fort Sumner
Income Overview in Fort Sumner
| Characteristic | Number | Measure |
| Per Capita Income | 1,206 | $25,034 |
| Median Family Income | 249 | $78,390 |
| Mean Family Income | 249 | $77,631 |
| Median Household Income | 411 | $0 |
| Mean Household Income | 411 | $66,512 |
| Income Deficit | 249 | $0 |
| Wage / Income Gap (%) | 1,206 | 0.00% |
| Wage / Income Gap ($) | 1,206 | 100.00¢ per $1 |
| Gini / Inequality Index | 1,206 | 0.40 |
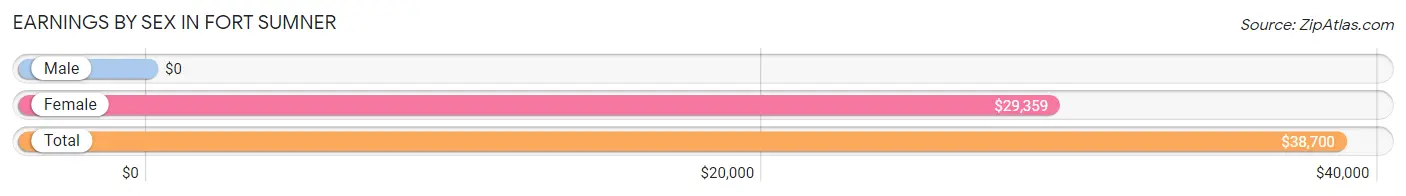
Earnings by Sex in Fort Sumner
| Sex | Number | Average Earnings |
| Male | 402 (70.8%) | $0 |
| Female | 166 (29.2%) | $29,359 |
| Total | 568 (100.0%) | $38,700 |
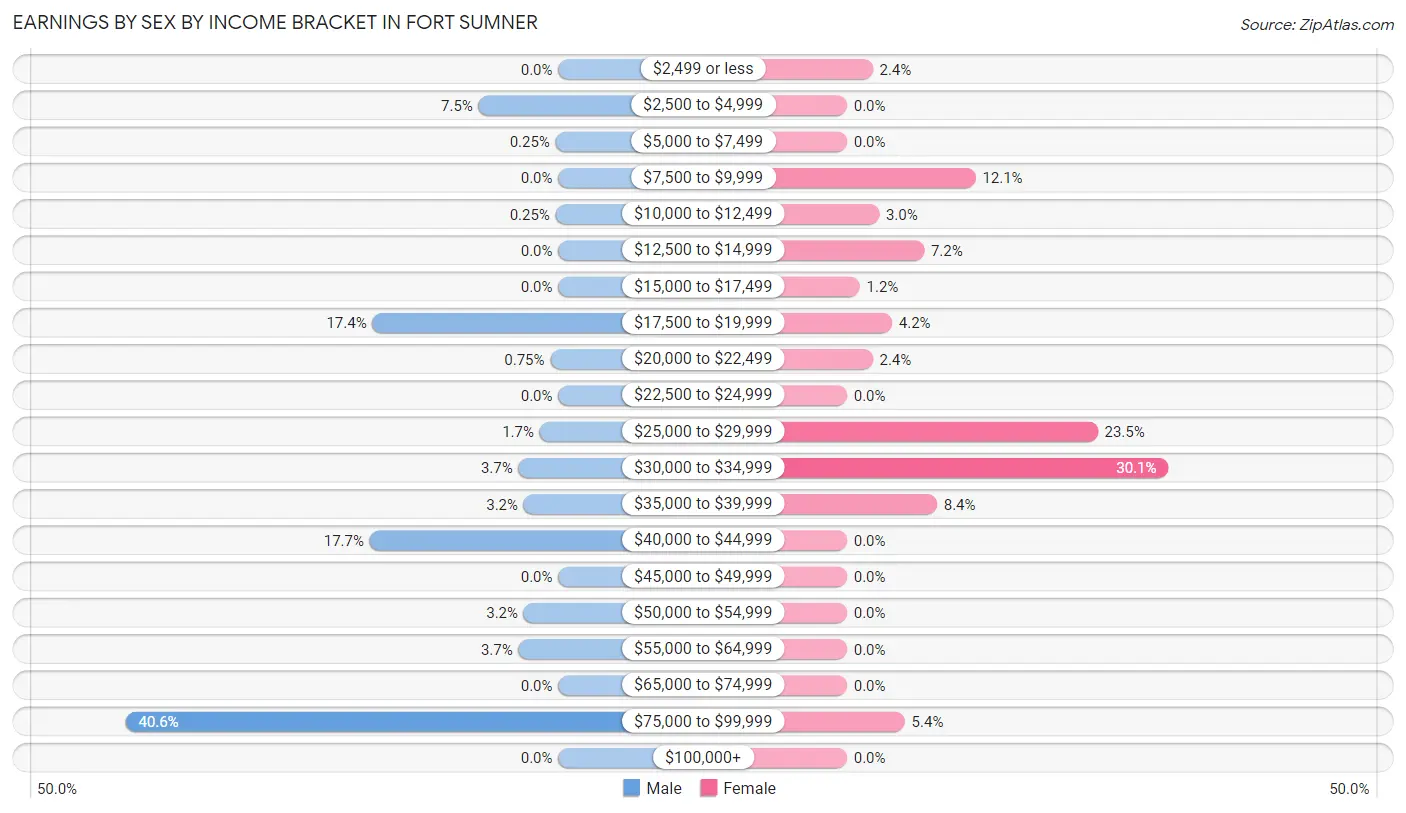
Earnings by Sex by Income Bracket in Fort Sumner
The most common earnings brackets in Fort Sumner are $75,000 to $99,999 for men (163 | 40.6%) and $30,000 to $34,999 for women (50 | 30.1%).
| Income | Male | Female |
| $2,499 or less | 0 (0.0%) | 4 (2.4%) |
| $2,500 to $4,999 | 30 (7.5%) | 0 (0.0%) |
| $5,000 to $7,499 | 1 (0.3%) | 0 (0.0%) |
| $7,500 to $9,999 | 0 (0.0%) | 20 (12.0%) |
| $10,000 to $12,499 | 1 (0.3%) | 5 (3.0%) |
| $12,500 to $14,999 | 0 (0.0%) | 12 (7.2%) |
| $15,000 to $17,499 | 0 (0.0%) | 2 (1.2%) |
| $17,500 to $19,999 | 70 (17.4%) | 7 (4.2%) |
| $20,000 to $22,499 | 3 (0.7%) | 4 (2.4%) |
| $22,500 to $24,999 | 0 (0.0%) | 0 (0.0%) |
| $25,000 to $29,999 | 7 (1.7%) | 39 (23.5%) |
| $30,000 to $34,999 | 15 (3.7%) | 50 (30.1%) |
| $35,000 to $39,999 | 13 (3.2%) | 14 (8.4%) |
| $40,000 to $44,999 | 71 (17.7%) | 0 (0.0%) |
| $45,000 to $49,999 | 0 (0.0%) | 0 (0.0%) |
| $50,000 to $54,999 | 13 (3.2%) | 0 (0.0%) |
| $55,000 to $64,999 | 15 (3.7%) | 0 (0.0%) |
| $65,000 to $74,999 | 0 (0.0%) | 0 (0.0%) |
| $75,000 to $99,999 | 163 (40.6%) | 9 (5.4%) |
| $100,000+ | 0 (0.0%) | 0 (0.0%) |
| Total | 402 (100.0%) | 166 (100.0%) |
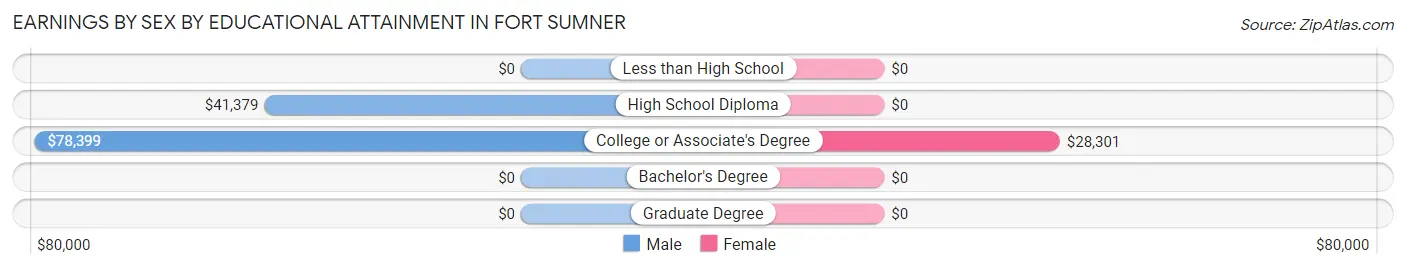
Earnings by Sex by Educational Attainment in Fort Sumner
Average earnings in Fort Sumner are $76,875 for men and $29,359 for women, a difference of 61.8%. Men with an educational attainment of college or associate's degree enjoy the highest average annual earnings of $78,399, while those with high school diploma education earn the least with $41,379. Women with an educational attainment of college or associate's degree earn the most with the average annual earnings of $28,301, while those with college or associate's degree education have the smallest earnings of $28,301.
| Educational Attainment | Male Income | Female Income |
| Less than High School | - | - |
| High School Diploma | $41,379 | $0 |
| College or Associate's Degree | $78,399 | $28,301 |
| Bachelor's Degree | - | - |
| Graduate Degree | - | - |
| Total | $76,875 | $29,359 |
Family Income in Fort Sumner
Family Income Brackets in Fort Sumner
According to the Fort Sumner family income data, there are 146 families falling into the $75,000 to $99,999 income range, which is the most common income bracket and makes up 58.6% of all families.
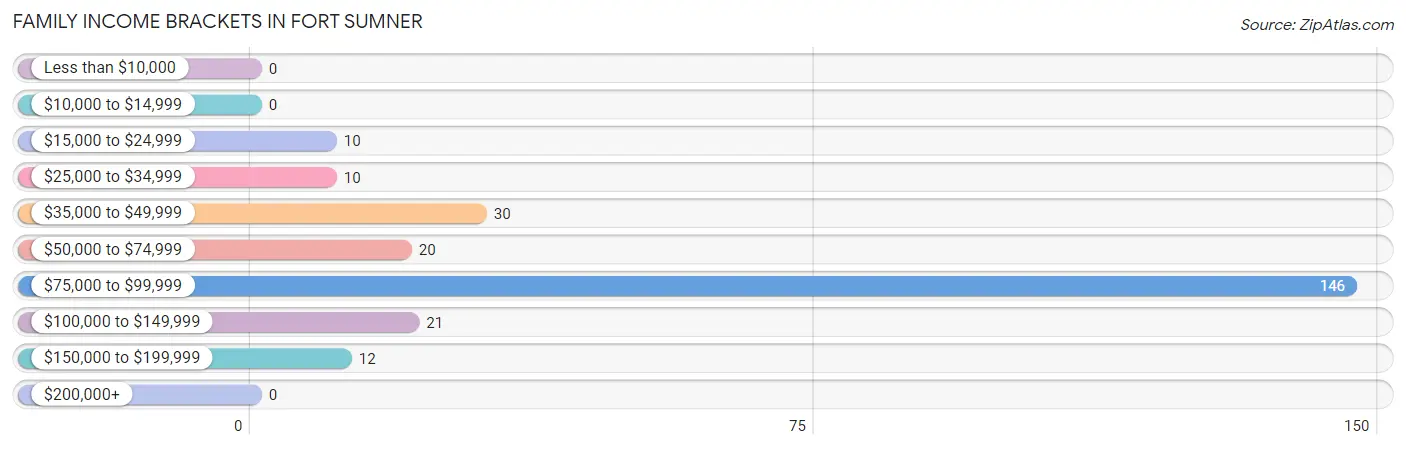
| Income Bracket | # Families | % Families |
| Less than $10,000 | 0 | 0.0% |
| $10,000 to $14,999 | 0 | 0.0% |
| $15,000 to $24,999 | 10 | 4.0% |
| $25,000 to $34,999 | 10 | 4.0% |
| $35,000 to $49,999 | 30 | 12.0% |
| $50,000 to $74,999 | 20 | 8.0% |
| $75,000 to $99,999 | 146 | 58.6% |
| $100,000 to $149,999 | 21 | 8.4% |
| $150,000 to $199,999 | 12 | 4.8% |
| $200,000+ | 0 | 0.0% |
Family Income by Famaliy Size in Fort Sumner
4-person families (171 | 68.7%) account for the highest median family income in Fort Sumner with $78,462 per family, while 4-person families (171 | 68.7%) have the highest median income of $19,616 per family member.
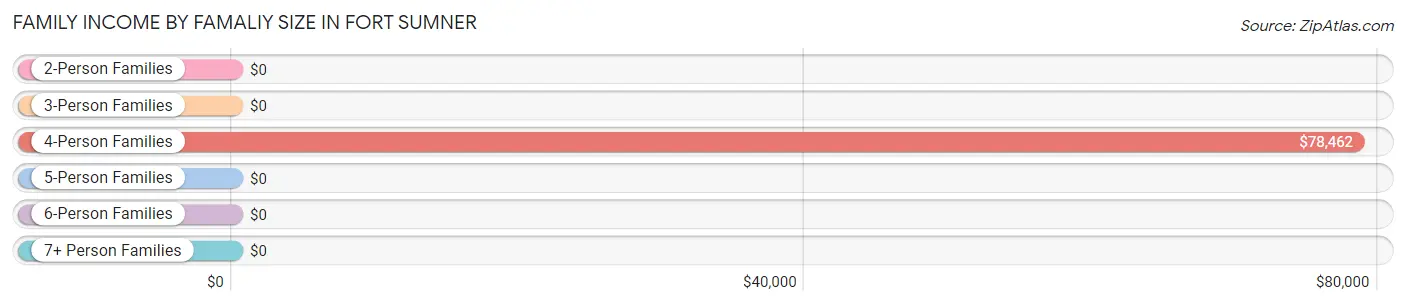
| Income Bracket | # Families | Median Income |
| 2-Person Families | 25 (10.0%) | $0 |
| 3-Person Families | 33 (13.3%) | $0 |
| 4-Person Families | 171 (68.7%) | $78,462 |
| 5-Person Families | 0 (0.0%) | $0 |
| 6-Person Families | 20 (8.0%) | $0 |
| 7+ Person Families | 0 (0.0%) | $0 |
| Total | 249 (100.0%) | $78,390 |
Family Income by Number of Earners in Fort Sumner
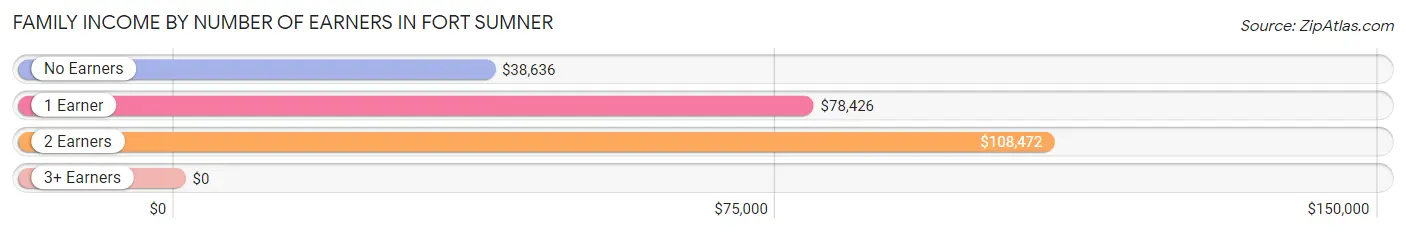
| Number of Earners | # Families | Median Income |
| No Earners | 16 (6.4%) | $38,636 |
| 1 Earner | 179 (71.9%) | $78,426 |
| 2 Earners | 39 (15.7%) | $108,472 |
| 3+ Earners | 15 (6.0%) | $0 |
| Total | 249 (100.0%) | $78,390 |
Household Income in Fort Sumner
Household Income Brackets in Fort Sumner
With 171 households falling in the category, the $100,000 to $149,999 income range is the most frequent in Fort Sumner, accounting for 41.6% of all households.
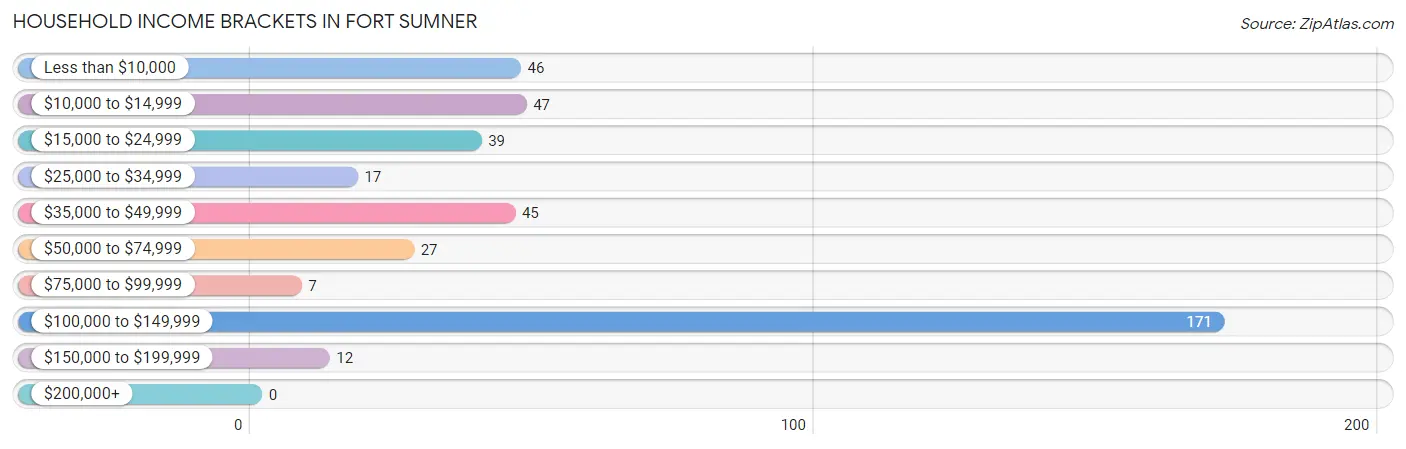
| Income Bracket | # Households | % Households |
| Less than $10,000 | 46 | 11.2% |
| $10,000 to $14,999 | 47 | 11.4% |
| $15,000 to $24,999 | 39 | 9.5% |
| $25,000 to $34,999 | 17 | 4.1% |
| $35,000 to $49,999 | 45 | 10.9% |
| $50,000 to $74,999 | 27 | 6.6% |
| $75,000 to $99,999 | 7 | 1.7% |
| $100,000 to $149,999 | 171 | 41.6% |
| $150,000 to $199,999 | 12 | 2.9% |
| $200,000+ | 0 | 0.0% |
Household Income by Householder Age in Fort Sumner
The median household income in Fort Sumner is $0, with the highest median household income of $108,291 found in the 25 to 44 years age bracket for the primary householder. A total of 194 households (47.2%) fall into this category.
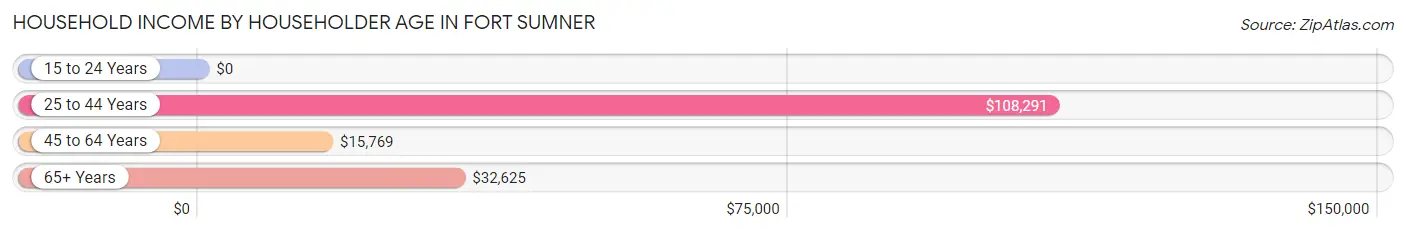
| Income Bracket | # Households | Median Income |
| 15 to 24 Years | 0 (0.0%) | $0 |
| 25 to 44 Years | 194 (47.2%) | $108,291 |
| 45 to 64 Years | 88 (21.4%) | $15,769 |
| 65+ Years | 129 (31.4%) | $32,625 |
| Total | 411 (100.0%) | $0 |
Poverty in Fort Sumner
Income Below Poverty by Sex and Age in Fort Sumner
With 4.3% poverty level for males and 27.4% for females among the residents of Fort Sumner, 55 to 64 year old males and 12 to 14 year old females are the most vulnerable to poverty, with 23 males (41.8%) and 10 females (100.0%) in their respective age groups living below the poverty level.
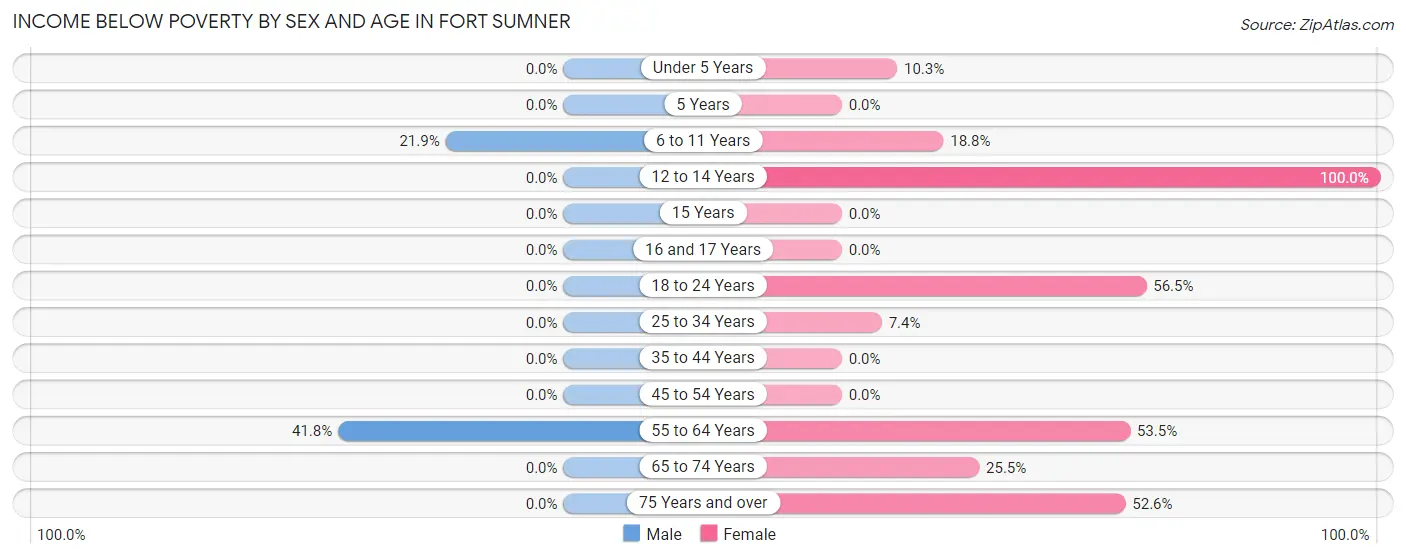
| Age Bracket | Male | Female |
| Under 5 Years | 0 (0.0%) | 8 (10.3%) |
| 5 Years | 0 (0.0%) | 0 (0.0%) |
| 6 to 11 Years | 7 (21.9%) | 13 (18.8%) |
| 12 to 14 Years | 0 (0.0%) | 10 (100.0%) |
| 15 Years | 0 (0.0%) | 0 (0.0%) |
| 16 and 17 Years | 0 (0.0%) | 0 (0.0%) |
| 18 to 24 Years | 0 (0.0%) | 26 (56.5%) |
| 25 to 34 Years | 0 (0.0%) | 4 (7.4%) |
| 35 to 44 Years | 0 (0.0%) | 0 (0.0%) |
| 45 to 54 Years | 0 (0.0%) | 0 (0.0%) |
| 55 to 64 Years | 23 (41.8%) | 23 (53.5%) |
| 65 to 74 Years | 0 (0.0%) | 13 (25.5%) |
| 75 Years and over | 0 (0.0%) | 40 (52.6%) |
| Total | 30 (4.3%) | 137 (27.4%) |
Income Above Poverty by Sex and Age in Fort Sumner
According to the poverty statistics in Fort Sumner, males aged under 5 years and females aged 15 years are the age groups that are most secure financially, with 100.0% of males and 100.0% of females in these age groups living above the poverty line.
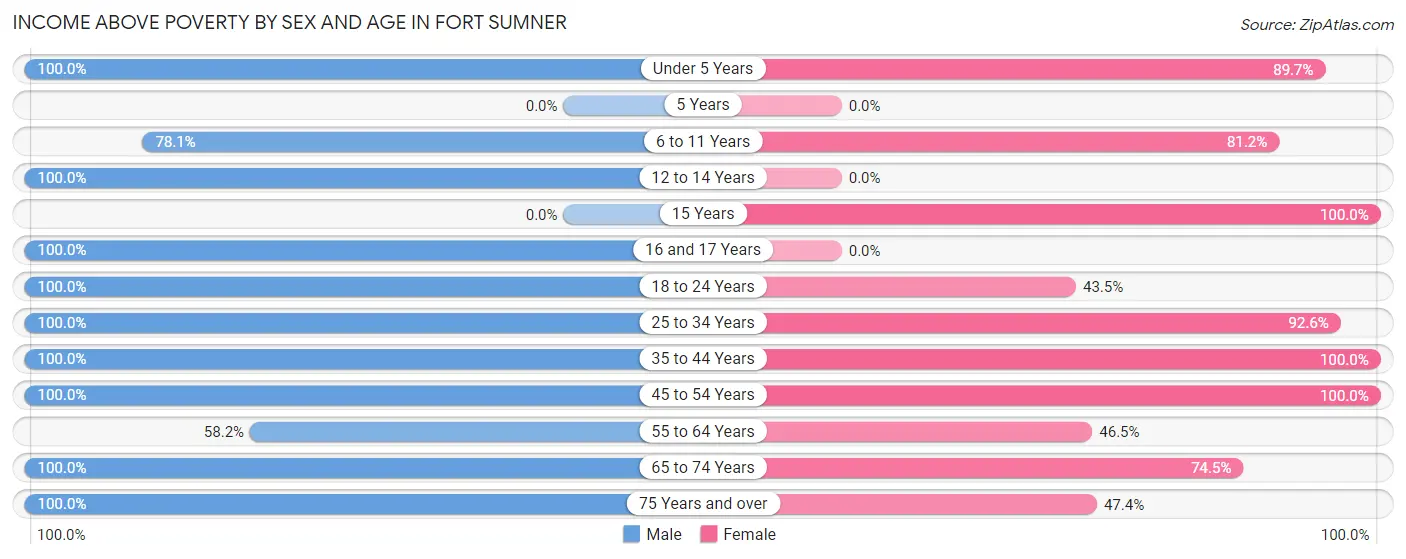
| Age Bracket | Male | Female |
| Under 5 Years | 142 (100.0%) | 70 (89.7%) |
| 5 Years | 0 (0.0%) | 0 (0.0%) |
| 6 to 11 Years | 25 (78.1%) | 56 (81.2%) |
| 12 to 14 Years | 30 (100.0%) | 0 (0.0%) |
| 15 Years | 0 (0.0%) | 7 (100.0%) |
| 16 and 17 Years | 41 (100.0%) | 0 (0.0%) |
| 18 to 24 Years | 64 (100.0%) | 20 (43.5%) |
| 25 to 34 Years | 225 (100.0%) | 50 (92.6%) |
| 35 to 44 Years | 41 (100.0%) | 65 (100.0%) |
| 45 to 54 Years | 10 (100.0%) | 2 (100.0%) |
| 55 to 64 Years | 32 (58.2%) | 20 (46.5%) |
| 65 to 74 Years | 38 (100.0%) | 38 (74.5%) |
| 75 Years and over | 11 (100.0%) | 36 (47.4%) |
| Total | 659 (95.7%) | 364 (72.7%) |
Income Below Poverty Among Married-Couple Families in Fort Sumner
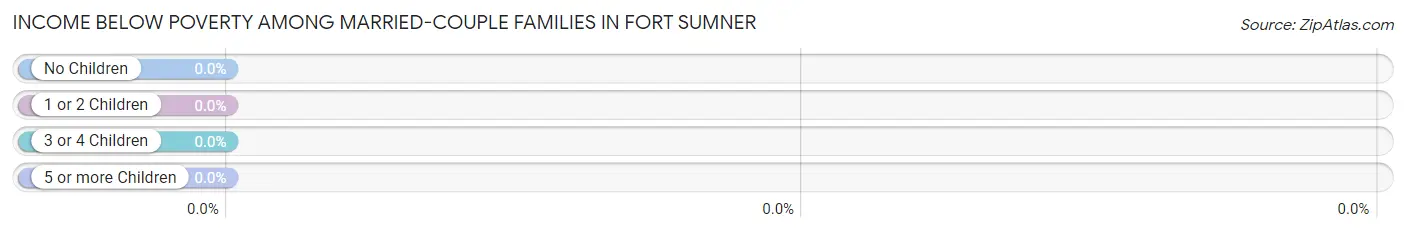
| Children | Above Poverty | Below Poverty |
| No Children | 41 (100.0%) | 0 (0.0%) |
| 1 or 2 Children | 36 (100.0%) | 0 (0.0%) |
| 3 or 4 Children | 10 (100.0%) | 0 (0.0%) |
| 5 or more Children | 0 (0.0%) | 0 (0.0%) |
| Total | 87 (100.0%) | 0 (0.0%) |
Income Below Poverty Among Single-Parent Households in Fort Sumner
According to the poverty data in Fort Sumner, 3.8% or 6 single-father households and 100.0% or 4 single-mother households are living below the poverty line. Among single-father households, those with 1 or 2 children have the highest poverty rate, with 6 households (100.0%) experiencing poverty. Likewise, among single-mother households, those with 1 or 2 children have the highest poverty rate, with 4 households (100.0%) falling below the poverty line.
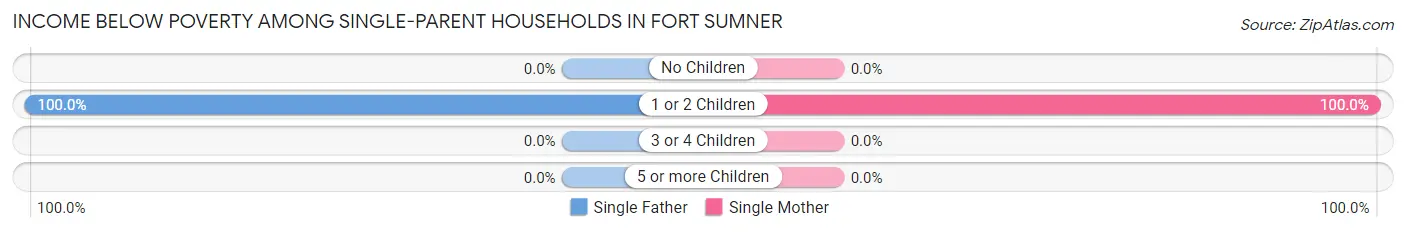
| Children | Single Father | Single Mother |
| No Children | 0 (0.0%) | 0 (0.0%) |
| 1 or 2 Children | 6 (100.0%) | 4 (100.0%) |
| 3 or 4 Children | 0 (0.0%) | 0 (0.0%) |
| 5 or more Children | 0 (0.0%) | 0 (0.0%) |
| Total | 6 (3.8%) | 4 (100.0%) |
Income Below Poverty Among Married-Couple vs Single-Parent Households in Fort Sumner
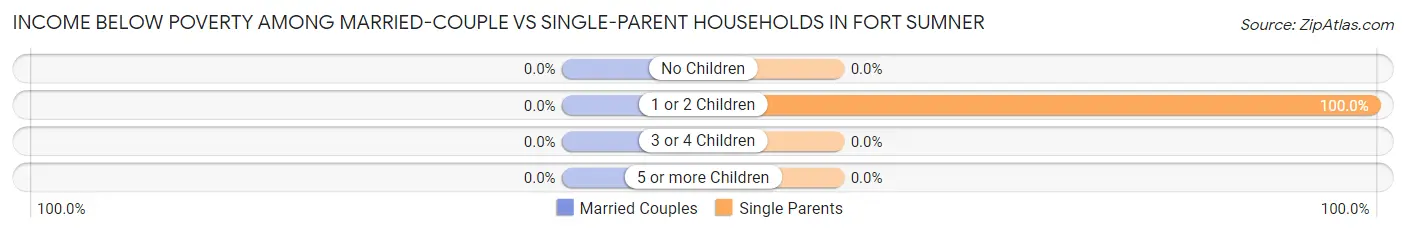
| Children | Married-Couple Families | Single-Parent Households |
| No Children | 0 (0.0%) | 0 (0.0%) |
| 1 or 2 Children | 0 (0.0%) | 10 (100.0%) |
| 3 or 4 Children | 0 (0.0%) | 0 (0.0%) |
| 5 or more Children | 0 (0.0%) | 0 (0.0%) |
| Total | 0 (0.0%) | 10 (6.2%) |
Race in Fort Sumner
The most populous races in Fort Sumner are Hispanic or Latino (896 | 74.3%), Some other Race (696 | 57.7%), and White / Caucasian (400 | 33.2%).
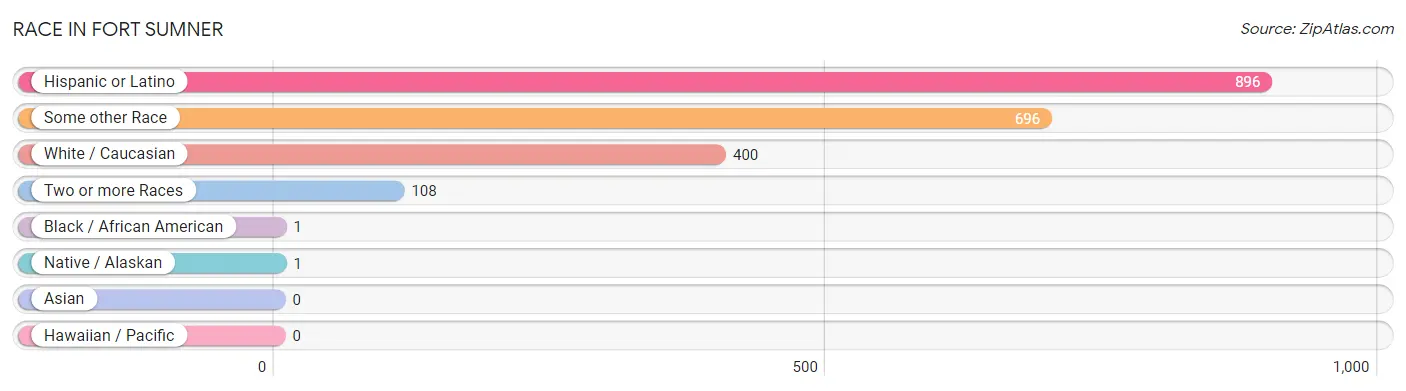
| Race | # Population | % Population |
| Asian | 0 | 0.0% |
| Black / African American | 1 | 0.1% |
| Hawaiian / Pacific | 0 | 0.0% |
| Hispanic or Latino | 896 | 74.3% |
| Native / Alaskan | 1 | 0.1% |
| White / Caucasian | 400 | 33.2% |
| Two or more Races | 108 | 9.0% |
| Some other Race | 696 | 57.7% |
| Total | 1,206 | 100.0% |
Ancestry in Fort Sumner
The most populous ancestries reported in Fort Sumner are Mexican (332 | 27.5%), Central American (235 | 19.5%), Salvadoran (235 | 19.5%), Irish (141 | 11.7%), and Dutch West Indian (59 | 4.9%), together accounting for 83.1% of all Fort Sumner residents.
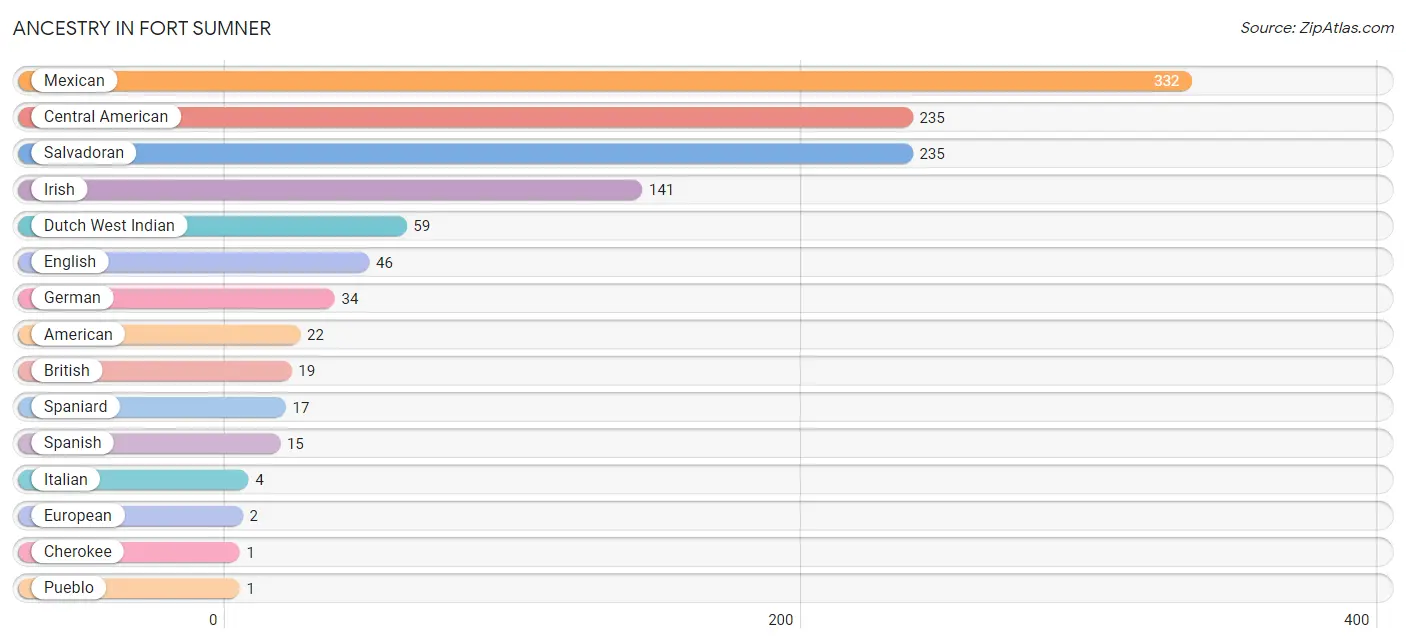
| Ancestry | # Population | % Population |
| American | 22 | 1.8% |
| British | 19 | 1.6% |
| Central American | 235 | 19.5% |
| Cherokee | 1 | 0.1% |
| Dutch West Indian | 59 | 4.9% |
| English | 46 | 3.8% |
| European | 2 | 0.2% |
| German | 34 | 2.8% |
| Irish | 141 | 11.7% |
| Italian | 4 | 0.3% |
| Mexican | 332 | 27.5% |
| Pueblo | 1 | 0.1% |
| Salvadoran | 235 | 19.5% |
| Spaniard | 17 | 1.4% |
| Spanish | 15 | 1.2% | View All 15 Rows |
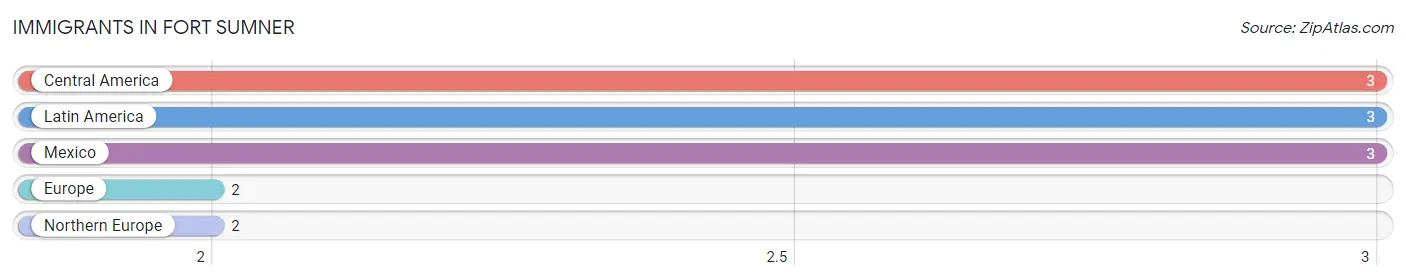
Immigrants in Fort Sumner
The most numerous immigrant groups reported in Fort Sumner came from Central America (3 | 0.3%), Latin America (3 | 0.3%), Mexico (3 | 0.3%), Europe (2 | 0.2%), and Northern Europe (2 | 0.2%), together accounting for 1.1% of all Fort Sumner residents.
| Immigration Origin | # Population | % Population |
| Central America | 3 | 0.3% |
| Europe | 2 | 0.2% |
| Latin America | 3 | 0.3% |
| Mexico | 3 | 0.3% |
| Northern Europe | 2 | 0.2% | View All 5 Rows |
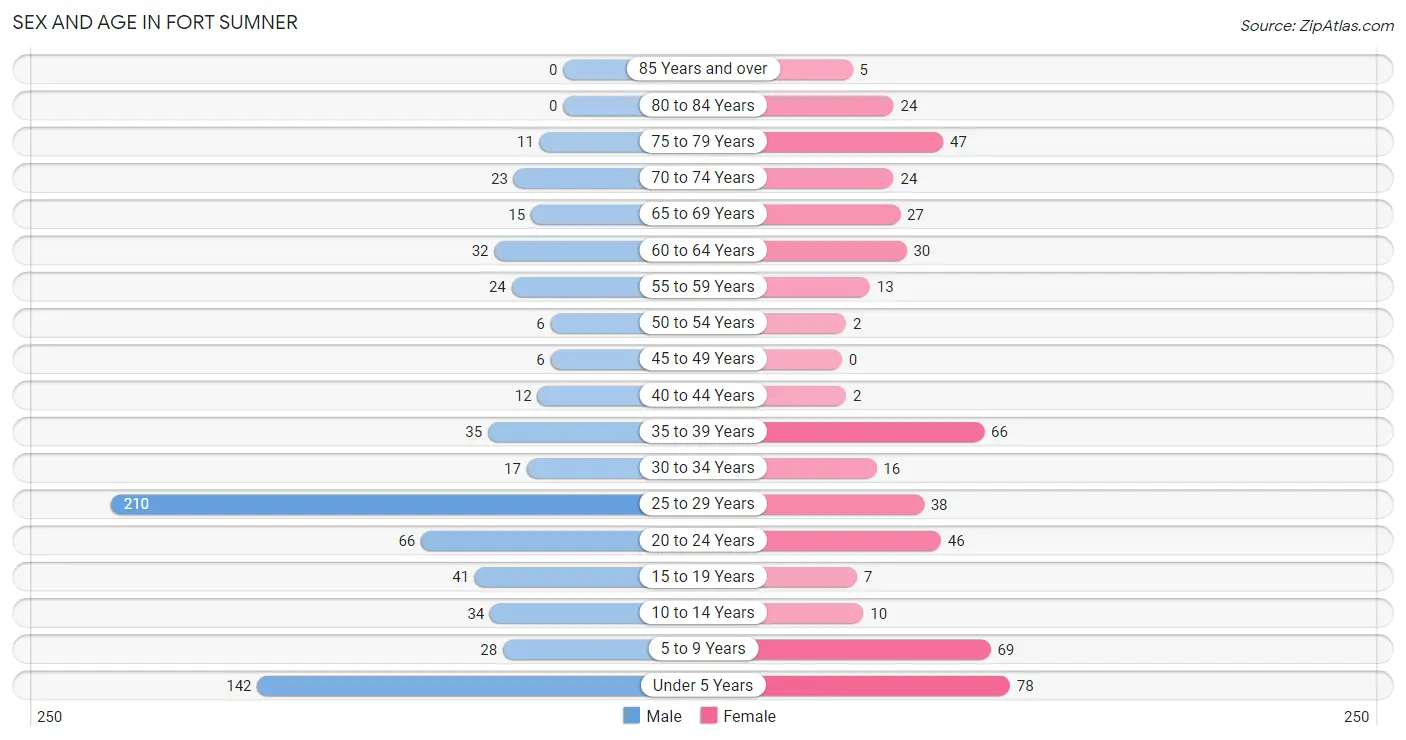
Sex and Age in Fort Sumner
Sex and Age in Fort Sumner
The most populous age groups in Fort Sumner are 25 to 29 Years (210 | 29.9%) for men and Under 5 Years (78 | 15.5%) for women.
| Age Bracket | Male | Female |
| Under 5 Years | 142 (20.2%) | 78 (15.5%) |
| 5 to 9 Years | 28 (4.0%) | 69 (13.7%) |
| 10 to 14 Years | 34 (4.8%) | 10 (2.0%) |
| 15 to 19 Years | 41 (5.8%) | 7 (1.4%) |
| 20 to 24 Years | 66 (9.4%) | 46 (9.1%) |
| 25 to 29 Years | 210 (29.9%) | 38 (7.5%) |
| 30 to 34 Years | 17 (2.4%) | 16 (3.2%) |
| 35 to 39 Years | 35 (5.0%) | 66 (13.1%) |
| 40 to 44 Years | 12 (1.7%) | 2 (0.4%) |
| 45 to 49 Years | 6 (0.9%) | 0 (0.0%) |
| 50 to 54 Years | 6 (0.9%) | 2 (0.4%) |
| 55 to 59 Years | 24 (3.4%) | 13 (2.6%) |
| 60 to 64 Years | 32 (4.6%) | 30 (5.9%) |
| 65 to 69 Years | 15 (2.1%) | 27 (5.4%) |
| 70 to 74 Years | 23 (3.3%) | 24 (4.8%) |
| 75 to 79 Years | 11 (1.6%) | 47 (9.3%) |
| 80 to 84 Years | 0 (0.0%) | 24 (4.8%) |
| 85 Years and over | 0 (0.0%) | 5 (1.0%) |
| Total | 702 (100.0%) | 504 (100.0%) |
Families and Households in Fort Sumner
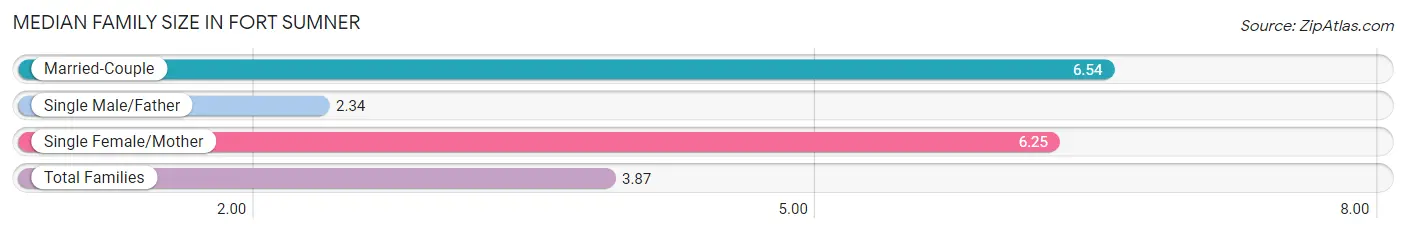
Median Family Size in Fort Sumner
The median family size in Fort Sumner is 3.87 persons per family, with married-couple families (87 | 34.9%) accounting for the largest median family size of 6.54 persons per family. On the other hand, single male/father families (158 | 63.4%) represent the smallest median family size with 2.34 persons per family.
| Family Type | # Families | Family Size |
| Married-Couple | 87 (34.9%) | 6.54 |
| Single Male/Father | 158 (63.4%) | 2.34 |
| Single Female/Mother | 4 (1.6%) | 6.25 |
| Total Families | 249 (100.0%) | 3.87 |
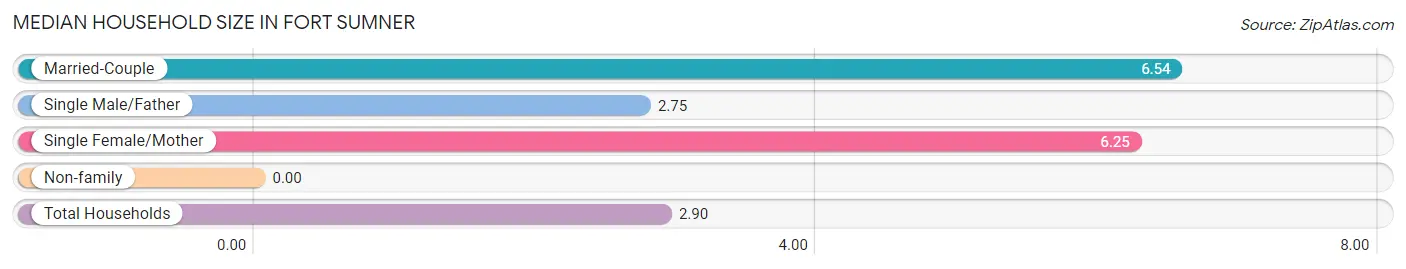
Median Household Size in Fort Sumner
| Household Type | # Households | Household Size |
| Married-Couple | 87 (21.2%) | 6.54 |
| Single Male/Father | 158 (38.4%) | 2.75 |
| Single Female/Mother | 4 (1.0%) | 6.25 |
| Non-family | 162 (39.4%) | - |
| Total Households | 411 (100.0%) | 2.90 |
Household Size by Marriage Status in Fort Sumner
Out of a total of 411 households in Fort Sumner, 249 (60.6%) are family households, while 162 (39.4%) are nonfamily households. The most numerous type of family households are 5-person households, comprising 152, and the most common type of nonfamily households are 1-person households, comprising 162.
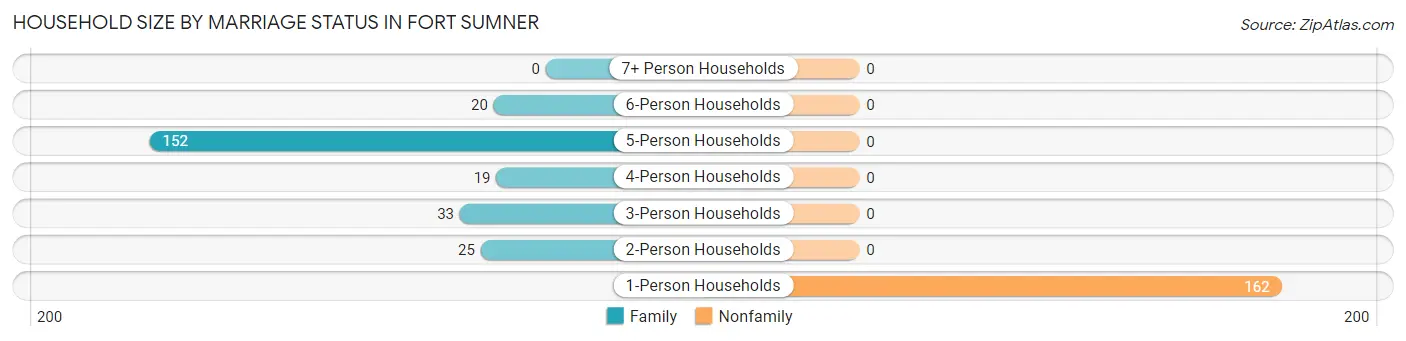
| Household Size | Family Households | Nonfamily Households |
| 1-Person Households | - | 162 (39.4%) |
| 2-Person Households | 25 (6.1%) | 0 (0.0%) |
| 3-Person Households | 33 (8.0%) | 0 (0.0%) |
| 4-Person Households | 19 (4.6%) | 0 (0.0%) |
| 5-Person Households | 152 (37.0%) | 0 (0.0%) |
| 6-Person Households | 20 (4.9%) | 0 (0.0%) |
| 7+ Person Households | 0 (0.0%) | 0 (0.0%) |
| Total | 249 (60.6%) | 162 (39.4%) |
Female Fertility in Fort Sumner
Fertility by Age in Fort Sumner
Average fertility rate in Fort Sumner is 423.0 births per 1,000 women. Women in the age bracket of 20 to 34 years have the highest fertility rate with 740.0 births per 1,000 women. Women in the age bracket of 20 to 34 years acount for 100.0% of all women with births.
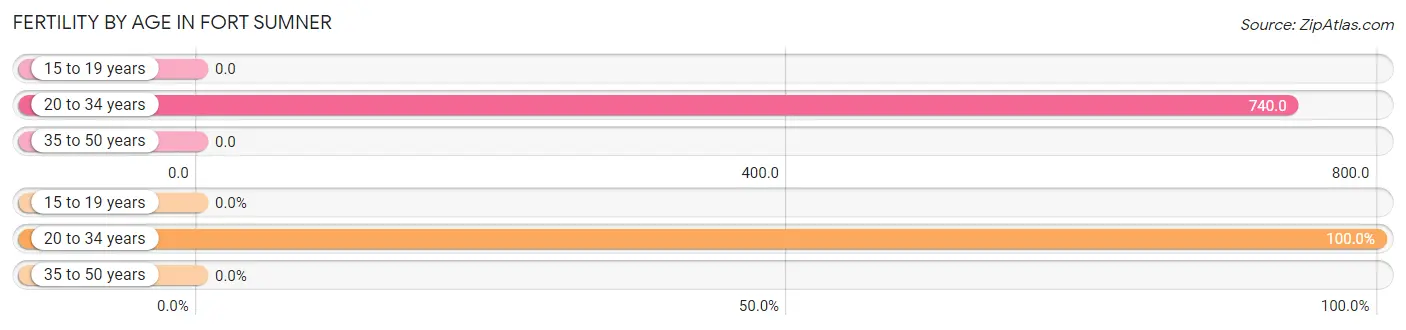
| Age Bracket | Women with Births | Births / 1,000 Women |
| 15 to 19 years | 0 (0.0%) | 0.0 |
| 20 to 34 years | 74 (100.0%) | 740.0 |
| 35 to 50 years | 0 (0.0%) | 0.0 |
| Total | 74 (100.0%) | 423.0 |
Fertility by Age by Marriage Status in Fort Sumner
13.5% of women with births (74) in Fort Sumner are married. The highest percentage of unmarried women with births falls into 20 to 34 years age bracket with 86.5% of them unmarried at the time of birth, while the lowest percentage of unmarried women with births belong to 20 to 34 years age bracket with 86.5% of them unmarried.

| Age Bracket | Married | Unmarried |
| 15 to 19 years | 0 (0.0%) | 0 (0.0%) |
| 20 to 34 years | 10 (13.5%) | 64 (86.5%) |
| 35 to 50 years | 0 (0.0%) | 0 (0.0%) |
| Total | 10 (13.5%) | 64 (86.5%) |
Fertility by Education in Fort Sumner
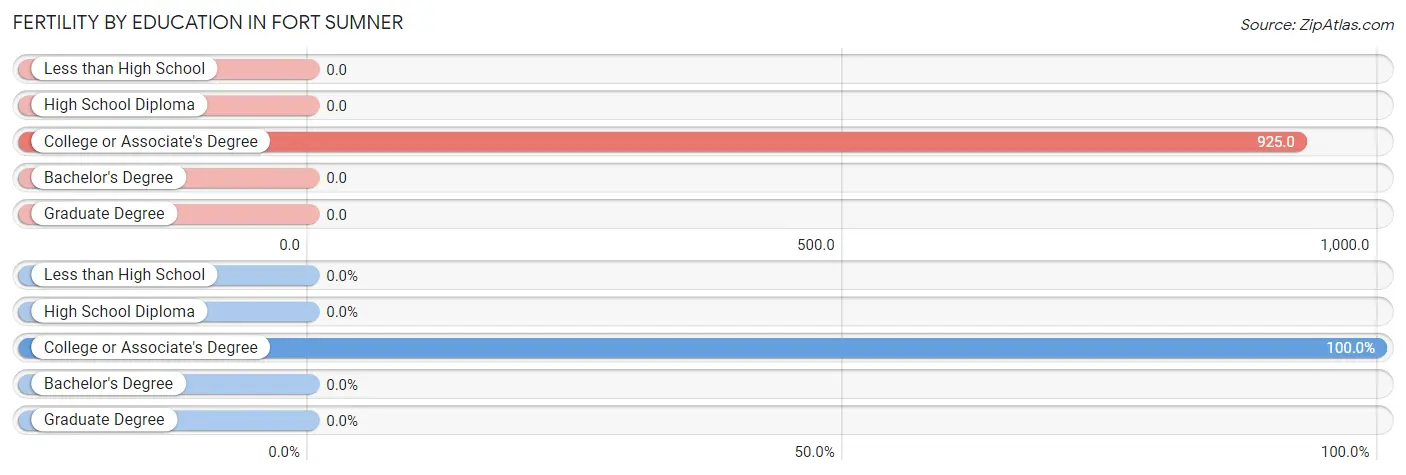
| Educational Attainment | Women with Births | Births / 1,000 Women |
| Less than High School | 0 (0.0%) | 0.0 |
| High School Diploma | 0 (0.0%) | 0.0 |
| College or Associate's Degree | 74 (100.0%) | 925.0 |
| Bachelor's Degree | 0 (0.0%) | 0.0 |
| Graduate Degree | 0 (0.0%) | 0.0 |
| Total | 74 (100.0%) | 423.0 |
Fertility by Education by Marriage Status in Fort Sumner
86.5% of women with births in Fort Sumner are unmarried. Women with the educational attainment of college or associate's degree are most likely to be married with 13.5% of them married at childbirth, while women with the educational attainment of college or associate's degree are least likely to be married with 86.5% of them unmarried at childbirth.
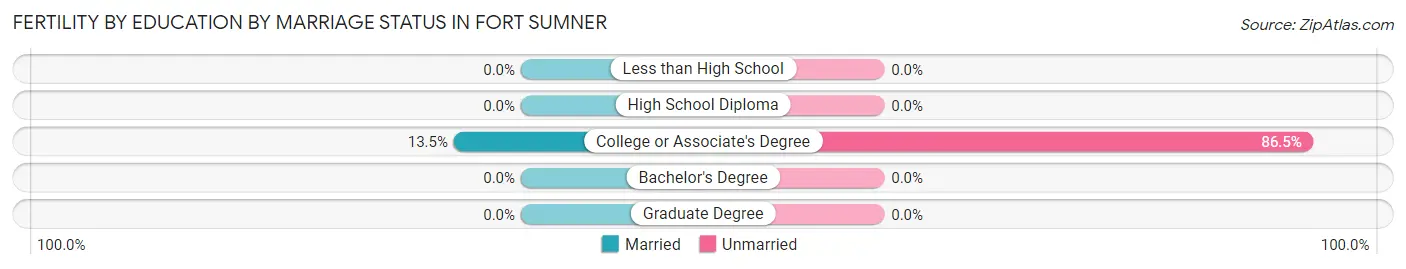
| Educational Attainment | Married | Unmarried |
| Less than High School | 0 (0.0%) | 0 (0.0%) |
| High School Diploma | 0 (0.0%) | 0 (0.0%) |
| College or Associate's Degree | 10 (13.5%) | 64 (86.5%) |
| Bachelor's Degree | 0 (0.0%) | 0 (0.0%) |
| Graduate Degree | 0 (0.0%) | 0 (0.0%) |
| Total | 10 (13.5%) | 64 (86.5%) |
Employment Characteristics in Fort Sumner
Employment by Class of Employer in Fort Sumner
Among the 477 employed individuals in Fort Sumner, private company employees (396 | 83.0%), self-employed (incorporated) (22 | 4.6%), and state government employees (21 | 4.4%) make up the most common classes of employment.
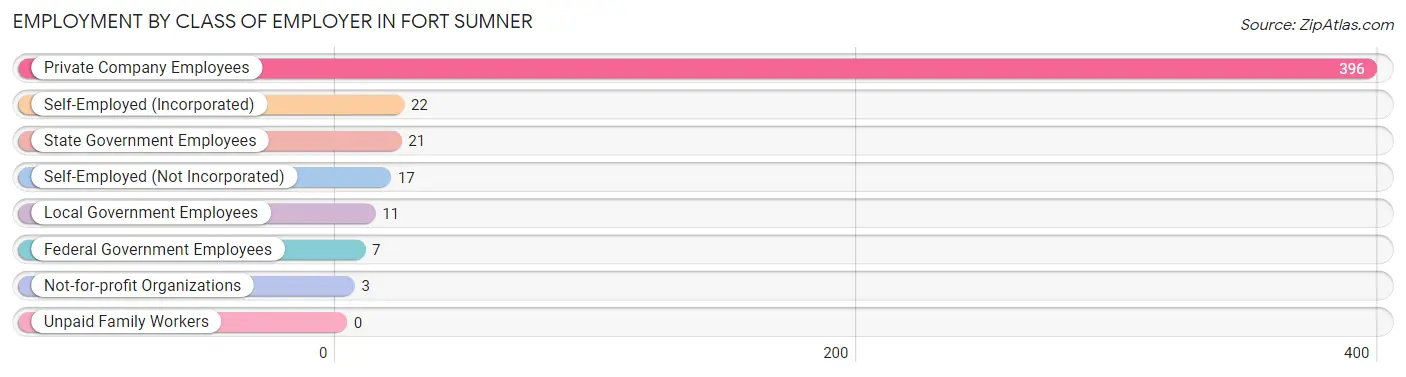
| Employer Class | # Employees | % Employees |
| Private Company Employees | 396 | 83.0% |
| Self-Employed (Incorporated) | 22 | 4.6% |
| Self-Employed (Not Incorporated) | 17 | 3.6% |
| Not-for-profit Organizations | 3 | 0.6% |
| Local Government Employees | 11 | 2.3% |
| State Government Employees | 21 | 4.4% |
| Federal Government Employees | 7 | 1.5% |
| Unpaid Family Workers | 0 | 0.0% |
| Total | 477 | 100.0% |
Employment Status by Age in Fort Sumner
According to the labor force statistics for Fort Sumner, out of the total population over 16 years of age (838), 64.2% or 538 individuals are in the labor force, with 10.0% or 54 of them unemployed. The age group with the highest labor force participation rate is 25 to 29 years, with 98.8% or 245 individuals in the labor force. Within the labor force, the 75 years and over age range has the highest percentage of unemployed individuals, with 56.3% or 9 of them being unemployed.
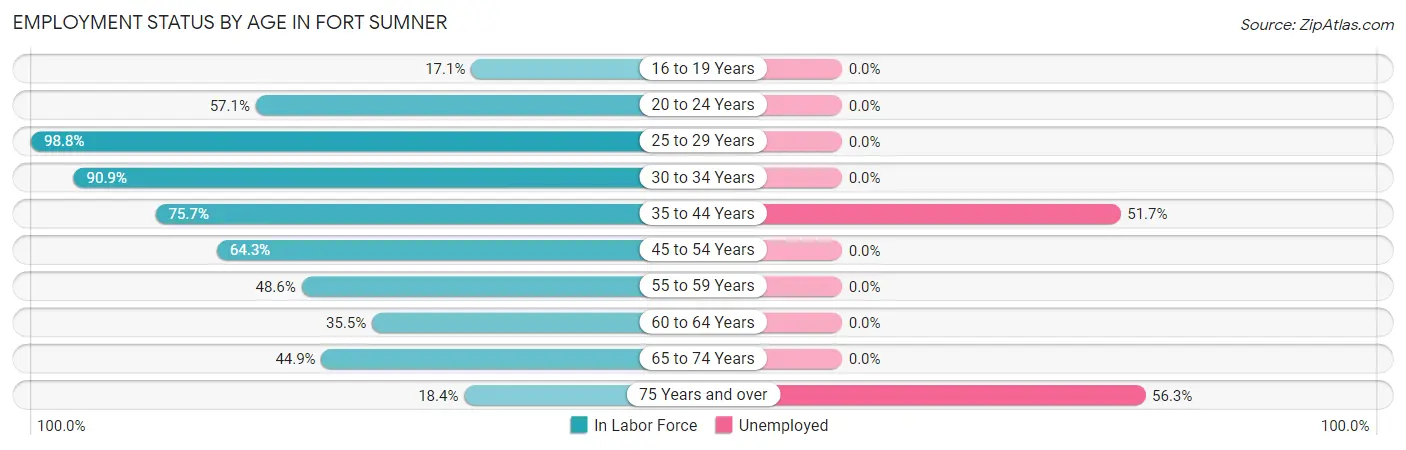
| Age Bracket | In Labor Force | Unemployed |
| 16 to 19 Years | 7 (17.1%) | 0 (0.0%) |
| 20 to 24 Years | 64 (57.1%) | 0 (0.0%) |
| 25 to 29 Years | 245 (98.8%) | 0 (0.0%) |
| 30 to 34 Years | 30 (90.9%) | 0 (0.0%) |
| 35 to 44 Years | 87 (75.7%) | 45 (51.7%) |
| 45 to 54 Years | 9 (64.3%) | 0 (0.0%) |
| 55 to 59 Years | 18 (48.6%) | 0 (0.0%) |
| 60 to 64 Years | 22 (35.5%) | 0 (0.0%) |
| 65 to 74 Years | 40 (44.9%) | 0 (0.0%) |
| 75 Years and over | 16 (18.4%) | 9 (56.3%) |
| Total | 538 (64.2%) | 54 (10.0%) |
Employment Status by Educational Attainment in Fort Sumner
According to labor force statistics for Fort Sumner, 80.7% of individuals (411) out of the total population between 25 and 64 years of age (509) are in the labor force, with 10.9% or 45 of them being unemployed. The group with the highest labor force participation rate are those with the educational attainment of bachelor's degree or higher, with 86.7% or 13 individuals in the labor force. Within the labor force, individuals with less than high school education have the highest percentage of unemployment, with 81.8% or 45 of them being unemployed.
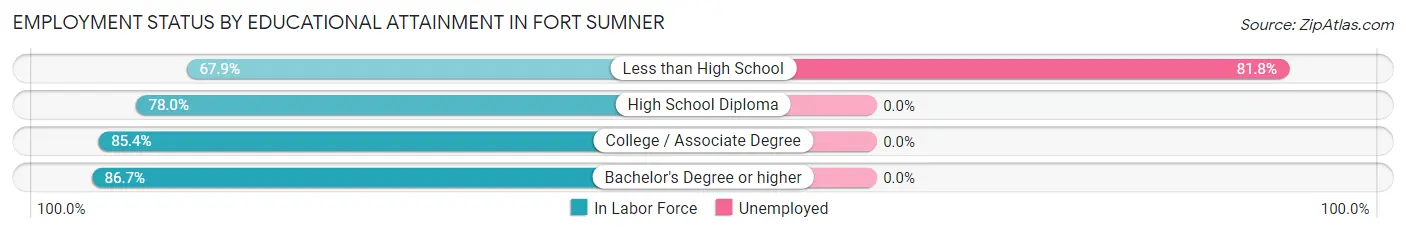
| Educational Attainment | In Labor Force | Unemployed |
| Less than High School | 55 (67.9%) | 66 (81.8%) |
| High School Diploma | 103 (78.0%) | 0 (0.0%) |
| College / Associate Degree | 240 (85.4%) | 0 (0.0%) |
| Bachelor's Degree or higher | 13 (86.7%) | 0 (0.0%) |
| Total | 411 (80.7%) | 55 (10.9%) |
Employment Occupations by Sex in Fort Sumner
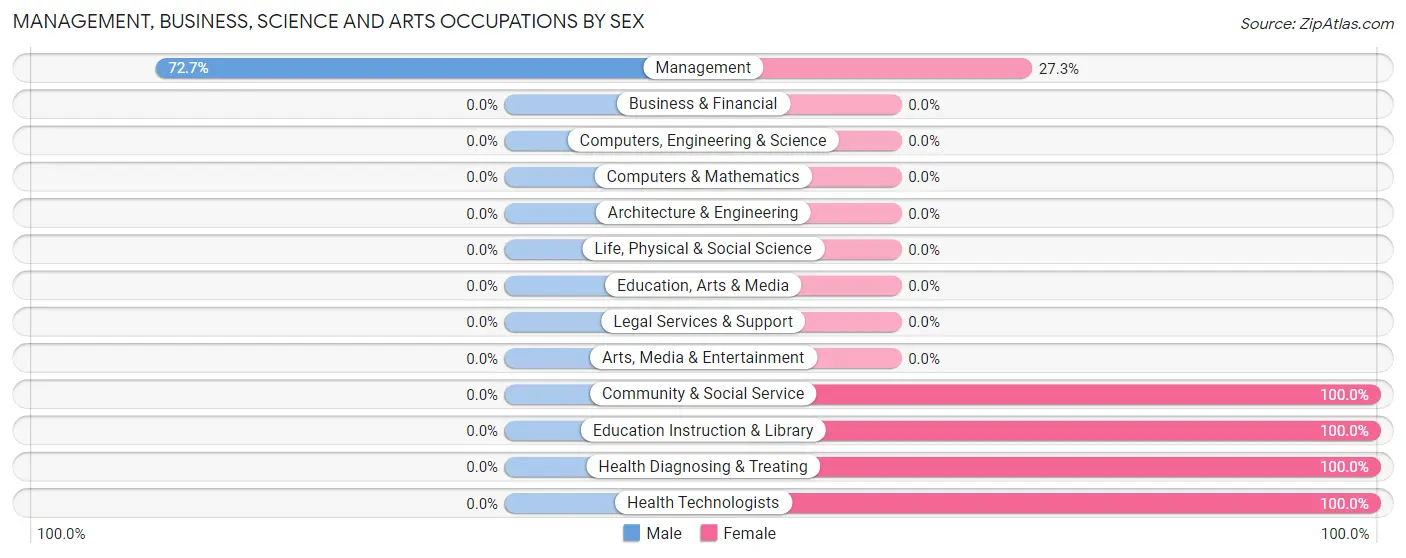
Management, Business, Science and Arts Occupations
The most common Management, Business, Science and Arts occupations in Fort Sumner are Management (33 | 6.8%), Health Diagnosing & Treating (20 | 4.1%), Community & Social Service (12 | 2.5%), Education Instruction & Library (12 | 2.5%), and Health Technologists (12 | 2.5%).
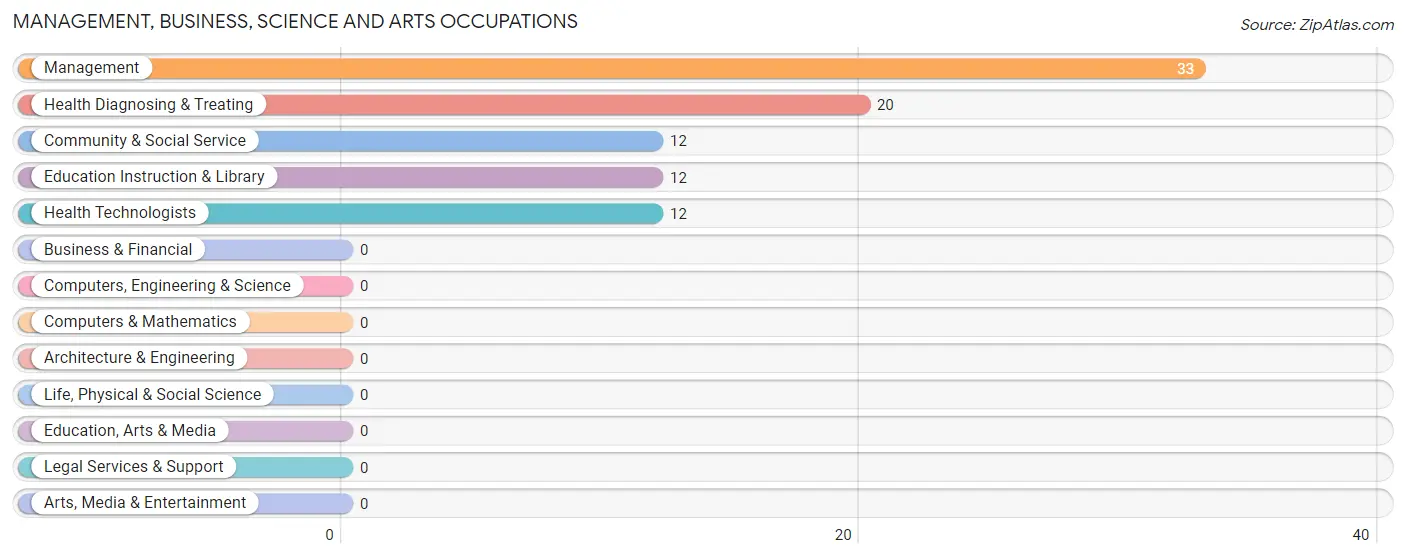
Management, Business, Science and Arts Occupations by Sex
| Occupation | Male | Female |
| Management | 24 (72.7%) | 9 (27.3%) |
| Business & Financial | 0 (0.0%) | 0 (0.0%) |
| Computers, Engineering & Science | 0 (0.0%) | 0 (0.0%) |
| Computers & Mathematics | 0 (0.0%) | 0 (0.0%) |
| Architecture & Engineering | 0 (0.0%) | 0 (0.0%) |
| Life, Physical & Social Science | 0 (0.0%) | 0 (0.0%) |
| Community & Social Service | 0 (0.0%) | 12 (100.0%) |
| Education, Arts & Media | 0 (0.0%) | 0 (0.0%) |
| Legal Services & Support | 0 (0.0%) | 0 (0.0%) |
| Education Instruction & Library | 0 (0.0%) | 12 (100.0%) |
| Arts, Media & Entertainment | 0 (0.0%) | 0 (0.0%) |
| Health Diagnosing & Treating | 0 (0.0%) | 20 (100.0%) |
| Health Technologists | 0 (0.0%) | 12 (100.0%) |
| Total (Category) | 24 (36.9%) | 41 (63.1%) |
| Total (Overall) | 373 (77.1%) | 111 (22.9%) |
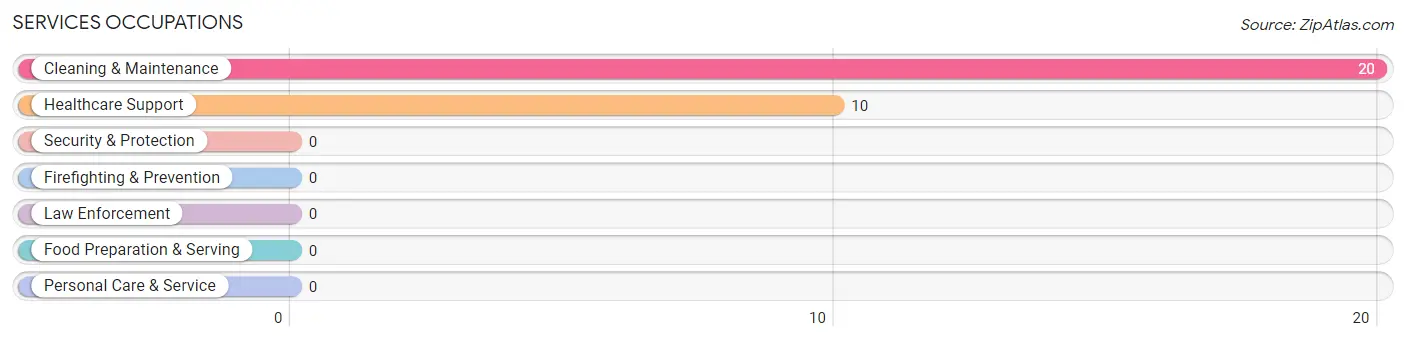
Services Occupations
The most common Services occupations in Fort Sumner are Cleaning & Maintenance (20 | 4.1%), and Healthcare Support (10 | 2.1%).
Services Occupations by Sex
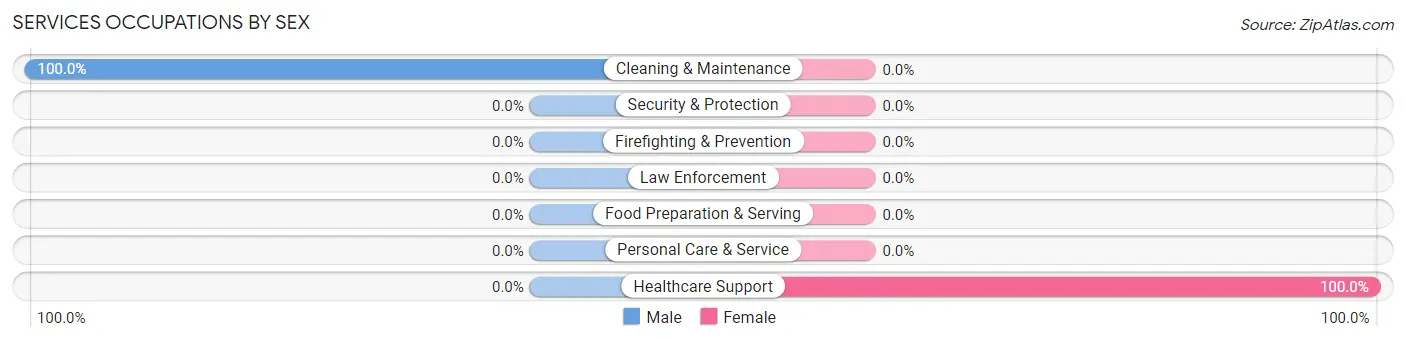
| Occupation | Male | Female |
| Healthcare Support | 0 (0.0%) | 10 (100.0%) |
| Security & Protection | 0 (0.0%) | 0 (0.0%) |
| Firefighting & Prevention | 0 (0.0%) | 0 (0.0%) |
| Law Enforcement | 0 (0.0%) | 0 (0.0%) |
| Food Preparation & Serving | 0 (0.0%) | 0 (0.0%) |
| Cleaning & Maintenance | 20 (100.0%) | 0 (0.0%) |
| Personal Care & Service | 0 (0.0%) | 0 (0.0%) |
| Total (Category) | 20 (66.7%) | 10 (33.3%) |
| Total (Overall) | 373 (77.1%) | 111 (22.9%) |
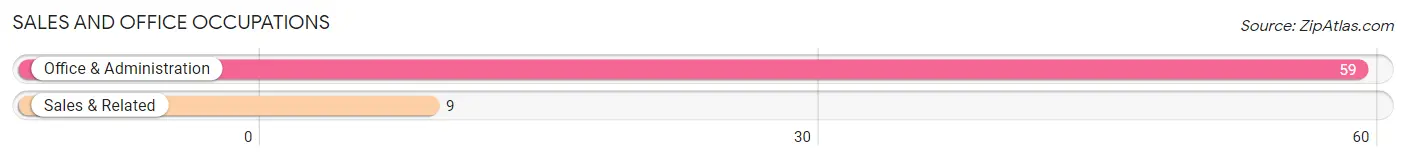
Sales and Office Occupations
The most common Sales and Office occupations in Fort Sumner are Office & Administration (59 | 12.2%), and Sales & Related (9 | 1.9%).
Sales and Office Occupations by Sex
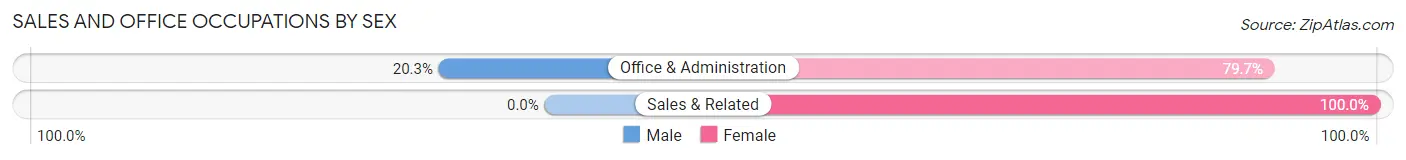
| Occupation | Male | Female |
| Sales & Related | 0 (0.0%) | 9 (100.0%) |
| Office & Administration | 12 (20.3%) | 47 (79.7%) |
| Total (Category) | 12 (17.6%) | 56 (82.4%) |
| Total (Overall) | 373 (77.1%) | 111 (22.9%) |
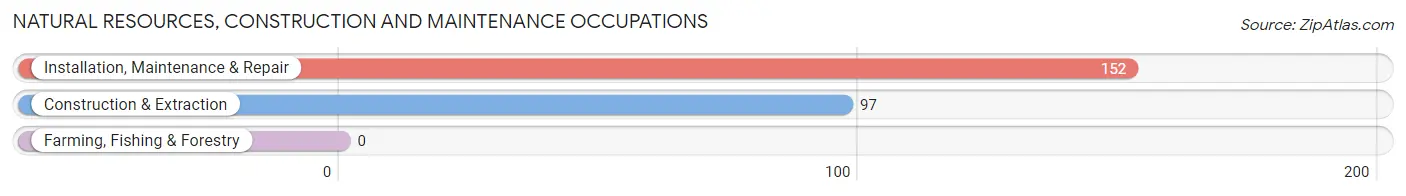
Natural Resources, Construction and Maintenance Occupations
The most common Natural Resources, Construction and Maintenance occupations in Fort Sumner are Installation, Maintenance & Repair (152 | 31.4%), and Construction & Extraction (97 | 20.0%).
Natural Resources, Construction and Maintenance Occupations by Sex
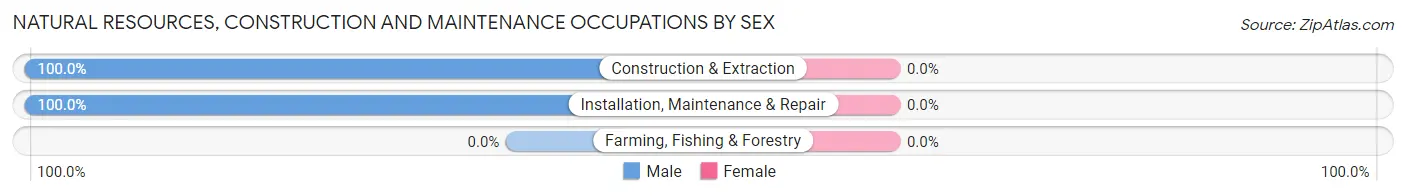
| Occupation | Male | Female |
| Farming, Fishing & Forestry | 0 (0.0%) | 0 (0.0%) |
| Construction & Extraction | 97 (100.0%) | 0 (0.0%) |
| Installation, Maintenance & Repair | 152 (100.0%) | 0 (0.0%) |
| Total (Category) | 249 (100.0%) | 0 (0.0%) |
| Total (Overall) | 373 (77.1%) | 111 (22.9%) |
Production, Transportation and Moving Occupations
The most common Production, Transportation and Moving occupations in Fort Sumner are Production (68 | 14.1%), and Transportation (4 | 0.8%).
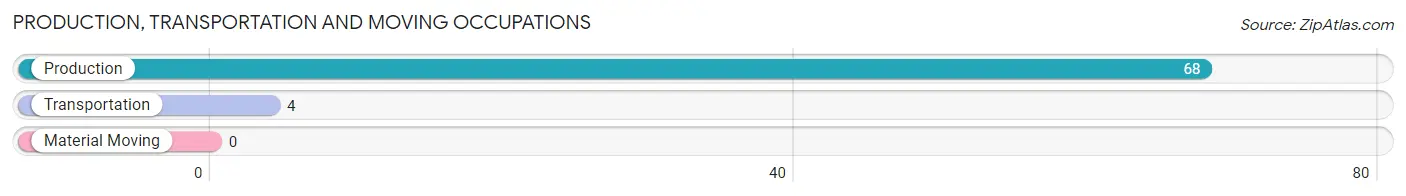
Production, Transportation and Moving Occupations by Sex
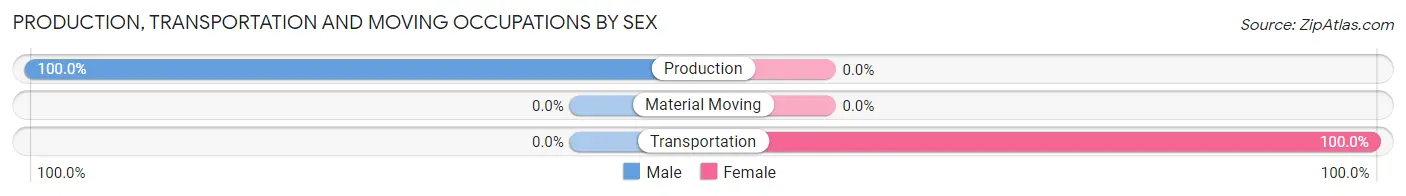
| Occupation | Male | Female |
| Production | 68 (100.0%) | 0 (0.0%) |
| Transportation | 0 (0.0%) | 4 (100.0%) |
| Material Moving | 0 (0.0%) | 0 (0.0%) |
| Total (Category) | 68 (94.4%) | 4 (5.6%) |
| Total (Overall) | 373 (77.1%) | 111 (22.9%) |
Employment Industries by Sex in Fort Sumner
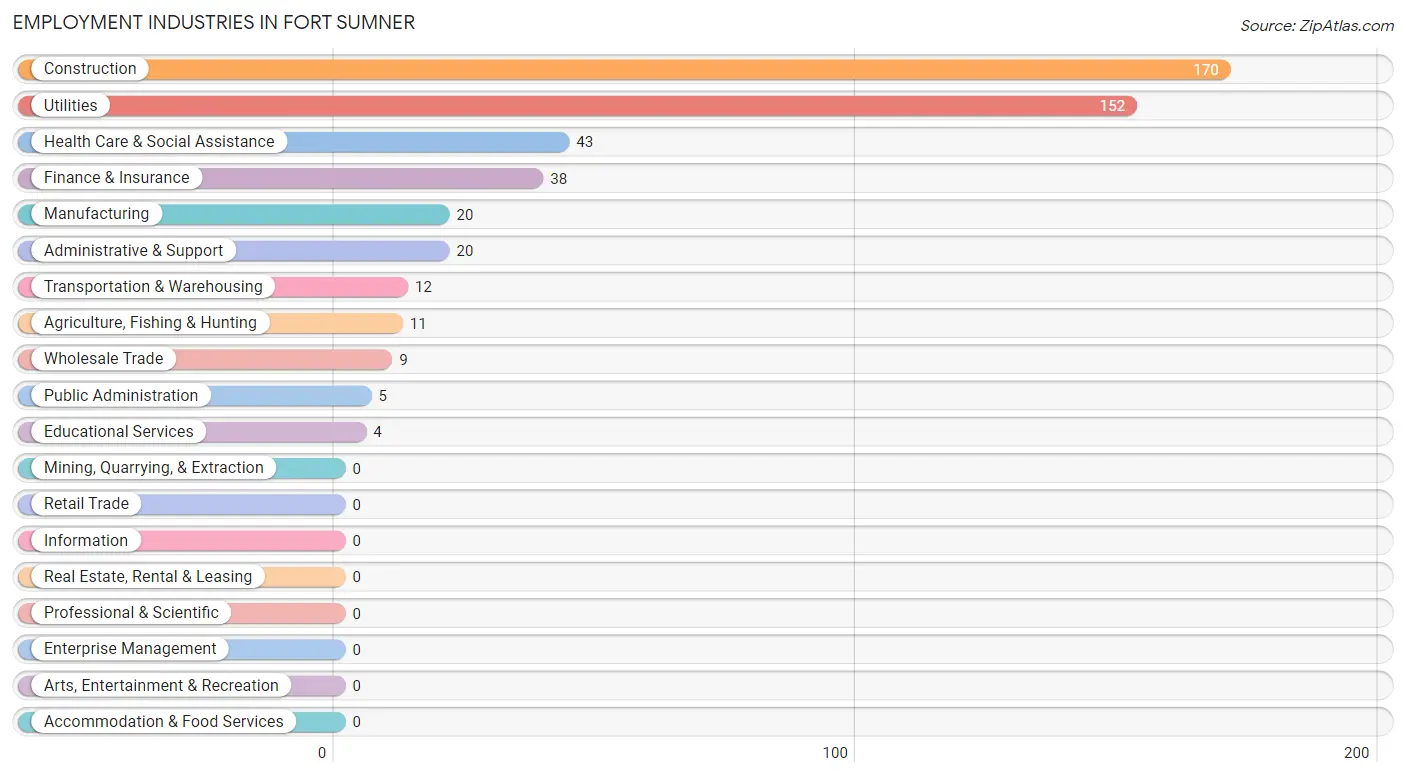
Employment Industries in Fort Sumner
The major employment industries in Fort Sumner include Construction (170 | 35.1%), Utilities (152 | 31.4%), Health Care & Social Assistance (43 | 8.9%), Finance & Insurance (38 | 7.9%), and Manufacturing (20 | 4.1%).
Employment Industries by Sex in Fort Sumner
The Fort Sumner industries that see more men than women are Agriculture, Fishing & Hunting (100.0%), Manufacturing (100.0%), and Transportation & Warehousing (100.0%), whereas the industries that tend to have a higher number of women are Wholesale Trade (100.0%), Finance & Insurance (100.0%), and Educational Services (100.0%).
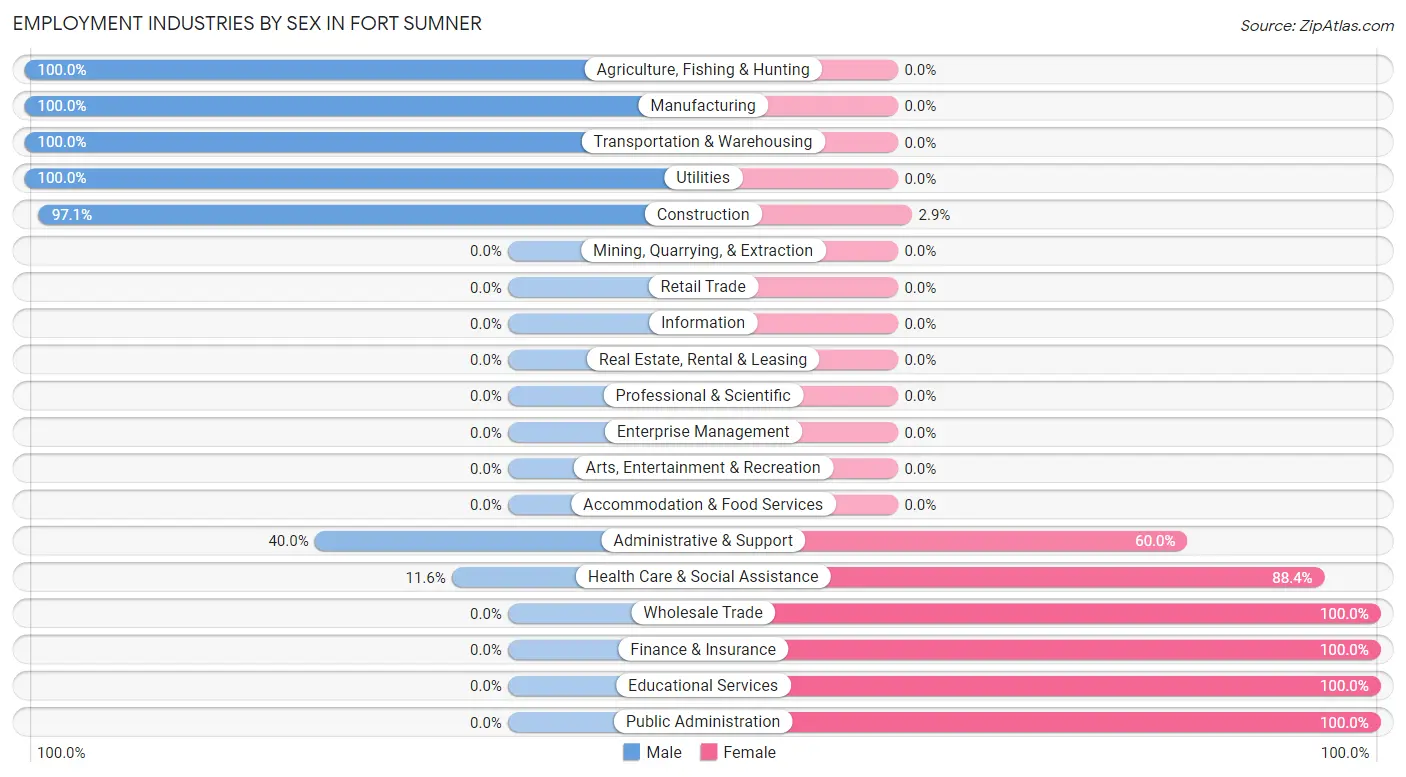
| Industry | Male | Female |
| Agriculture, Fishing & Hunting | 11 (100.0%) | 0 (0.0%) |
| Mining, Quarrying, & Extraction | 0 (0.0%) | 0 (0.0%) |
| Construction | 165 (97.1%) | 5 (2.9%) |
| Manufacturing | 20 (100.0%) | 0 (0.0%) |
| Wholesale Trade | 0 (0.0%) | 9 (100.0%) |
| Retail Trade | 0 (0.0%) | 0 (0.0%) |
| Transportation & Warehousing | 12 (100.0%) | 0 (0.0%) |
| Utilities | 152 (100.0%) | 0 (0.0%) |
| Information | 0 (0.0%) | 0 (0.0%) |
| Finance & Insurance | 0 (0.0%) | 38 (100.0%) |
| Real Estate, Rental & Leasing | 0 (0.0%) | 0 (0.0%) |
| Professional & Scientific | 0 (0.0%) | 0 (0.0%) |
| Enterprise Management | 0 (0.0%) | 0 (0.0%) |
| Administrative & Support | 8 (40.0%) | 12 (60.0%) |
| Educational Services | 0 (0.0%) | 4 (100.0%) |
| Health Care & Social Assistance | 5 (11.6%) | 38 (88.4%) |
| Arts, Entertainment & Recreation | 0 (0.0%) | 0 (0.0%) |
| Accommodation & Food Services | 0 (0.0%) | 0 (0.0%) |
| Public Administration | 0 (0.0%) | 5 (100.0%) |
| Total | 373 (77.1%) | 111 (22.9%) |
Education in Fort Sumner
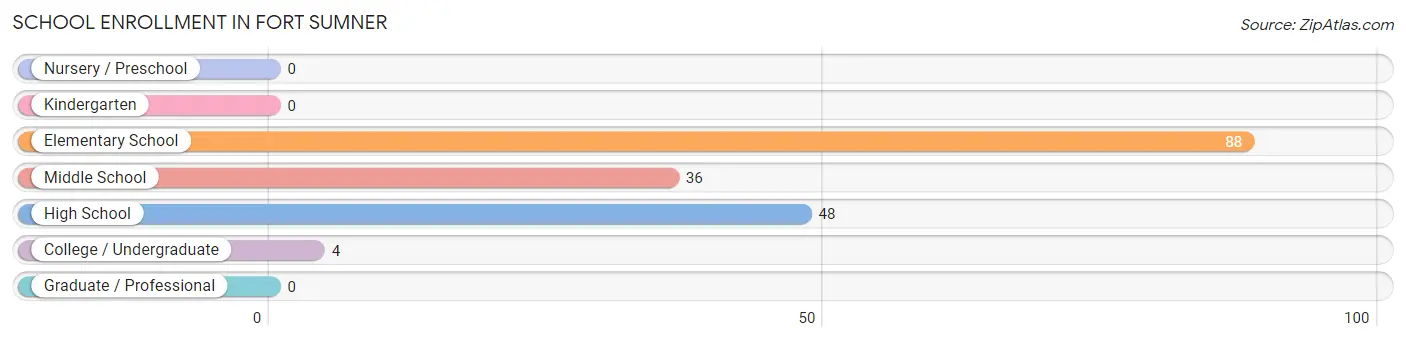
School Enrollment in Fort Sumner
The most common levels of schooling among the 176 students in Fort Sumner are elementary school (88 | 50.0%), high school (48 | 27.3%), and middle school (36 | 20.4%).
| School Level | # Students | % Students |
| Nursery / Preschool | 0 | 0.0% |
| Kindergarten | 0 | 0.0% |
| Elementary School | 88 | 50.0% |
| Middle School | 36 | 20.4% |
| High School | 48 | 27.3% |
| College / Undergraduate | 4 | 2.3% |
| Graduate / Professional | 0 | 0.0% |
| Total | 176 | 100.0% |
School Enrollment by Age by Funding Source in Fort Sumner
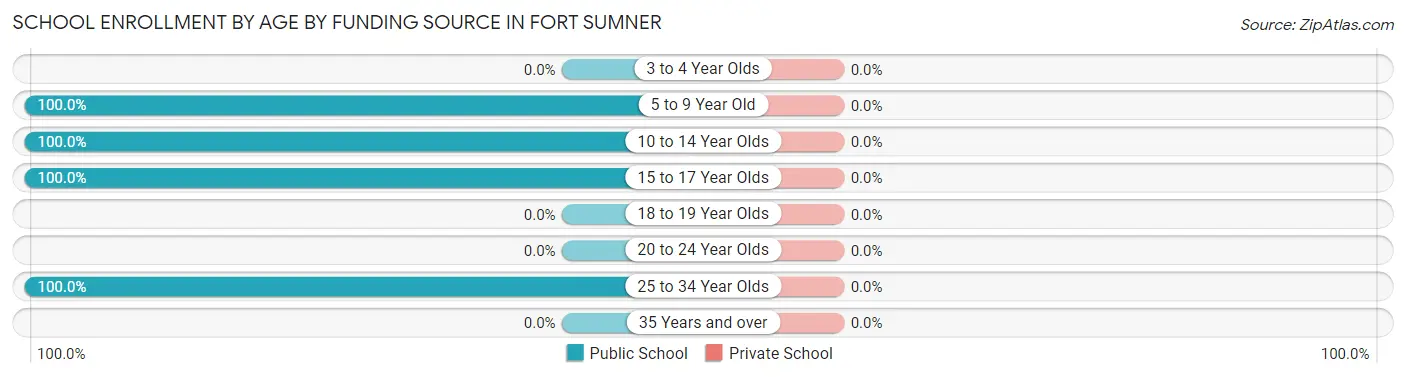
| Age Bracket | Public School | Private School |
| 3 to 4 Year Olds | 0 (0.0%) | 0 (0.0%) |
| 5 to 9 Year Old | 88 (100.0%) | 0 (0.0%) |
| 10 to 14 Year Olds | 36 (100.0%) | 0 (0.0%) |
| 15 to 17 Year Olds | 48 (100.0%) | 0 (0.0%) |
| 18 to 19 Year Olds | 0 (0.0%) | 0 (0.0%) |
| 20 to 24 Year Olds | 0 (0.0%) | 0 (0.0%) |
| 25 to 34 Year Olds | 4 (100.0%) | 0 (0.0%) |
| 35 Years and over | 0 (0.0%) | 0 (0.0%) |
| Total | 176 (100.0%) | 0 (0.0%) |
Educational Attainment by Field of Study in Fort Sumner
Education (24 | 64.9%), and physical & health sciences (13 | 35.1%) are the most common fields of study among 37 individuals in Fort Sumner who have obtained a bachelor's degree or higher.
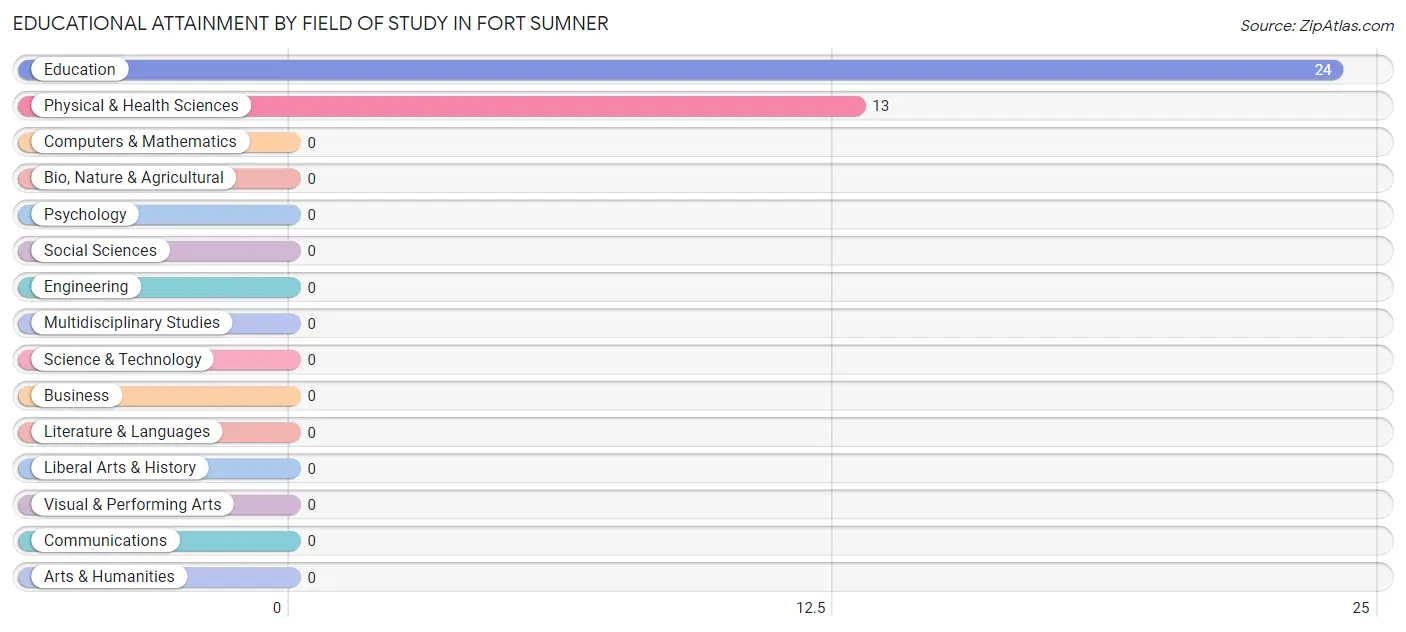
| Field of Study | # Graduates | % Graduates |
| Computers & Mathematics | 0 | 0.0% |
| Bio, Nature & Agricultural | 0 | 0.0% |
| Physical & Health Sciences | 13 | 35.1% |
| Psychology | 0 | 0.0% |
| Social Sciences | 0 | 0.0% |
| Engineering | 0 | 0.0% |
| Multidisciplinary Studies | 0 | 0.0% |
| Science & Technology | 0 | 0.0% |
| Business | 0 | 0.0% |
| Education | 24 | 64.9% |
| Literature & Languages | 0 | 0.0% |
| Liberal Arts & History | 0 | 0.0% |
| Visual & Performing Arts | 0 | 0.0% |
| Communications | 0 | 0.0% |
| Arts & Humanities | 0 | 0.0% |
| Total | 37 | 100.0% |
Transportation & Commute in Fort Sumner
Vehicle Availability by Sex in Fort Sumner
The most prevalent vehicle ownership categories in Fort Sumner are males with 2 vehicles (176, accounting for 47.4%) and females with 2 vehicles (69, making up 166.0%).
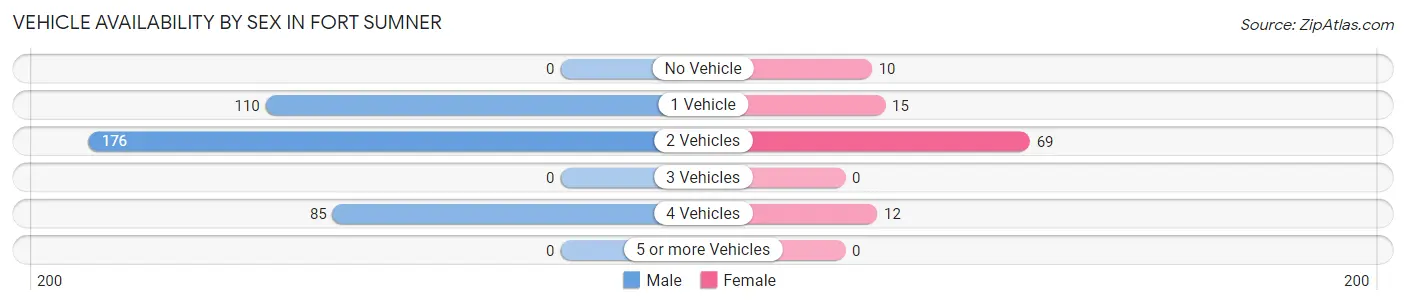
| Vehicles Available | Male | Female |
| No Vehicle | 0 (0.0%) | 10 (9.4%) |
| 1 Vehicle | 110 (29.6%) | 15 (14.1%) |
| 2 Vehicles | 176 (47.4%) | 69 (65.1%) |
| 3 Vehicles | 0 (0.0%) | 0 (0.0%) |
| 4 Vehicles | 85 (22.9%) | 12 (11.3%) |
| 5 or more Vehicles | 0 (0.0%) | 0 (0.0%) |
| Total | 371 (100.0%) | 106 (100.0%) |
Commute Time in Fort Sumner
The most frequently occuring commute durations in Fort Sumner are 5 to 9 minutes (251 commuters, 52.6%), 10 to 14 minutes (85 commuters, 17.8%), and less than 5 minutes (75 commuters, 15.7%).
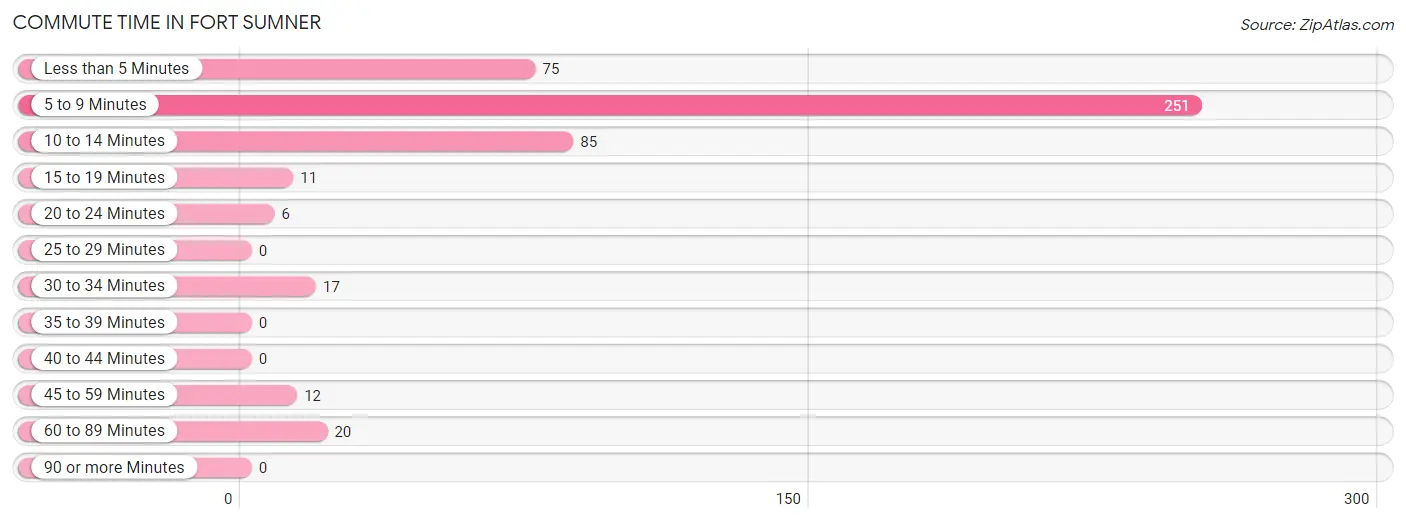
| Commute Time | # Commuters | % Commuters |
| Less than 5 Minutes | 75 | 15.7% |
| 5 to 9 Minutes | 251 | 52.6% |
| 10 to 14 Minutes | 85 | 17.8% |
| 15 to 19 Minutes | 11 | 2.3% |
| 20 to 24 Minutes | 6 | 1.3% |
| 25 to 29 Minutes | 0 | 0.0% |
| 30 to 34 Minutes | 17 | 3.6% |
| 35 to 39 Minutes | 0 | 0.0% |
| 40 to 44 Minutes | 0 | 0.0% |
| 45 to 59 Minutes | 12 | 2.5% |
| 60 to 89 Minutes | 20 | 4.2% |
| 90 or more Minutes | 0 | 0.0% |
Commute Time by Sex in Fort Sumner
The most common commute times in Fort Sumner are 5 to 9 minutes (194 commuters, 52.3%) for males and 5 to 9 minutes (57 commuters, 53.8%) for females.
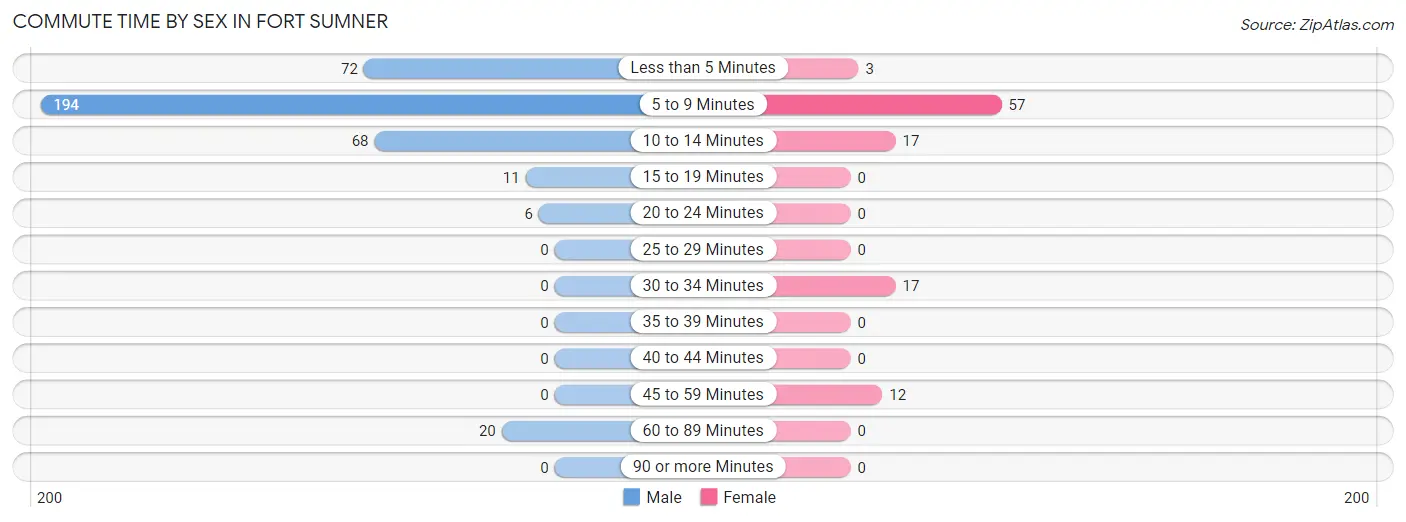
| Commute Time | Male | Female |
| Less than 5 Minutes | 72 (19.4%) | 3 (2.8%) |
| 5 to 9 Minutes | 194 (52.3%) | 57 (53.8%) |
| 10 to 14 Minutes | 68 (18.3%) | 17 (16.0%) |
| 15 to 19 Minutes | 11 (3.0%) | 0 (0.0%) |
| 20 to 24 Minutes | 6 (1.6%) | 0 (0.0%) |
| 25 to 29 Minutes | 0 (0.0%) | 0 (0.0%) |
| 30 to 34 Minutes | 0 (0.0%) | 17 (16.0%) |
| 35 to 39 Minutes | 0 (0.0%) | 0 (0.0%) |
| 40 to 44 Minutes | 0 (0.0%) | 0 (0.0%) |
| 45 to 59 Minutes | 0 (0.0%) | 12 (11.3%) |
| 60 to 89 Minutes | 20 (5.4%) | 0 (0.0%) |
| 90 or more Minutes | 0 (0.0%) | 0 (0.0%) |
Time of Departure to Work by Sex in Fort Sumner
The most frequent times of departure to work in Fort Sumner are 7:30 AM to 7:59 AM (155, 41.8%) for males and 7:30 AM to 7:59 AM (40, 37.7%) for females.
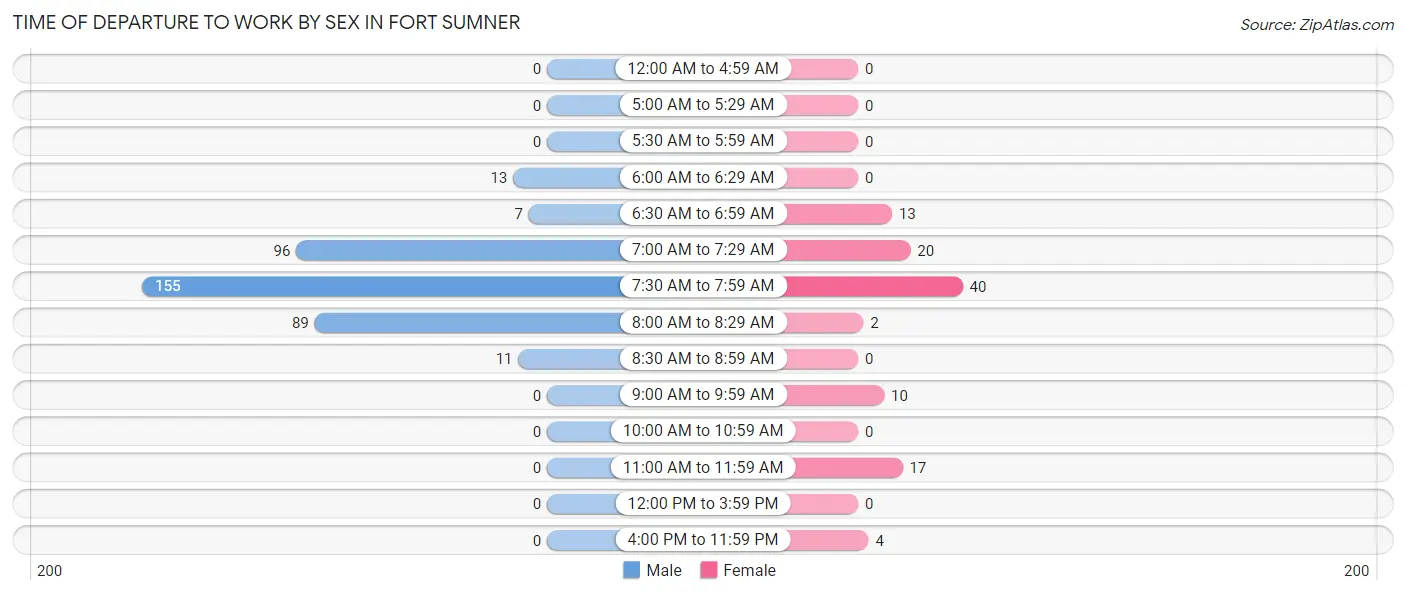
| Time of Departure | Male | Female |
| 12:00 AM to 4:59 AM | 0 (0.0%) | 0 (0.0%) |
| 5:00 AM to 5:29 AM | 0 (0.0%) | 0 (0.0%) |
| 5:30 AM to 5:59 AM | 0 (0.0%) | 0 (0.0%) |
| 6:00 AM to 6:29 AM | 13 (3.5%) | 0 (0.0%) |
| 6:30 AM to 6:59 AM | 7 (1.9%) | 13 (12.3%) |
| 7:00 AM to 7:29 AM | 96 (25.9%) | 20 (18.9%) |
| 7:30 AM to 7:59 AM | 155 (41.8%) | 40 (37.7%) |
| 8:00 AM to 8:29 AM | 89 (24.0%) | 2 (1.9%) |
| 8:30 AM to 8:59 AM | 11 (3.0%) | 0 (0.0%) |
| 9:00 AM to 9:59 AM | 0 (0.0%) | 10 (9.4%) |
| 10:00 AM to 10:59 AM | 0 (0.0%) | 0 (0.0%) |
| 11:00 AM to 11:59 AM | 0 (0.0%) | 17 (16.0%) |
| 12:00 PM to 3:59 PM | 0 (0.0%) | 0 (0.0%) |
| 4:00 PM to 11:59 PM | 0 (0.0%) | 4 (3.8%) |
| Total | 371 (100.0%) | 106 (100.0%) |
Housing Occupancy in Fort Sumner
Occupancy by Ownership in Fort Sumner
Of the total 411 dwellings in Fort Sumner, owner-occupied units account for 317 (77.1%), while renter-occupied units make up 94 (22.9%).
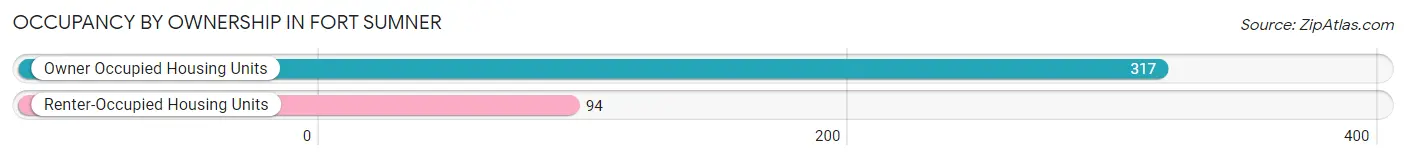
| Occupancy | # Housing Units | % Housing Units |
| Owner Occupied Housing Units | 317 | 77.1% |
| Renter-Occupied Housing Units | 94 | 22.9% |
| Total Occupied Housing Units | 411 | 100.0% |
Occupancy by Household Size in Fort Sumner
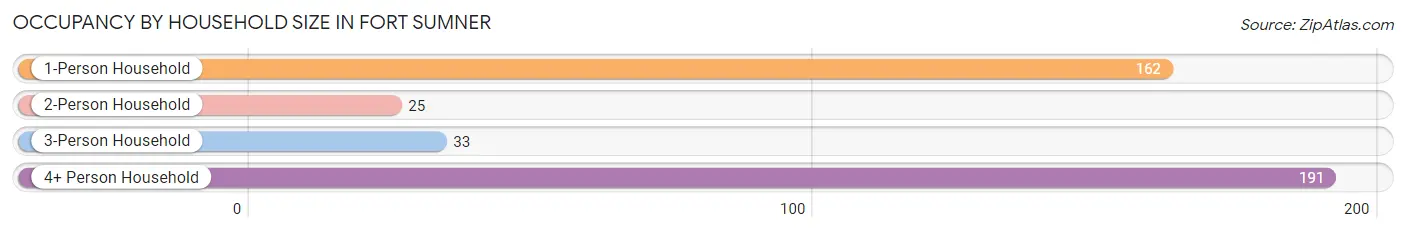
| Household Size | # Housing Units | % Housing Units |
| 1-Person Household | 162 | 39.4% |
| 2-Person Household | 25 | 6.1% |
| 3-Person Household | 33 | 8.0% |
| 4+ Person Household | 191 | 46.5% |
| Total Housing Units | 411 | 100.0% |
Occupancy by Ownership by Household Size in Fort Sumner
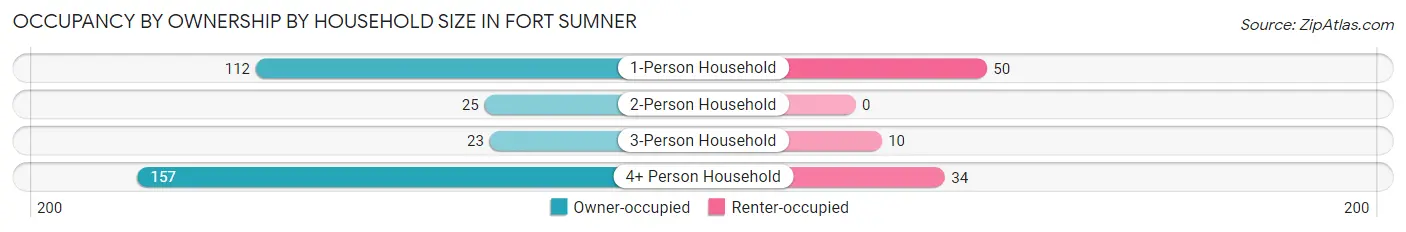
| Household Size | Owner-occupied | Renter-occupied |
| 1-Person Household | 112 (69.1%) | 50 (30.9%) |
| 2-Person Household | 25 (100.0%) | 0 (0.0%) |
| 3-Person Household | 23 (69.7%) | 10 (30.3%) |
| 4+ Person Household | 157 (82.2%) | 34 (17.8%) |
| Total Housing Units | 317 (77.1%) | 94 (22.9%) |
Occupancy by Educational Attainment in Fort Sumner
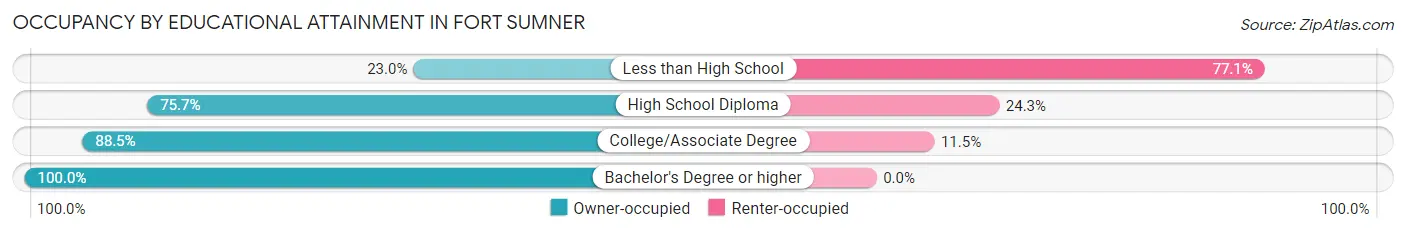
| Household Size | Owner-occupied | Renter-occupied |
| Less than High School | 14 (23.0%) | 47 (77.0%) |
| High School Diploma | 56 (75.7%) | 18 (24.3%) |
| College/Associate Degree | 224 (88.5%) | 29 (11.5%) |
| Bachelor's Degree or higher | 23 (100.0%) | 0 (0.0%) |
Occupancy by Age of Householder in Fort Sumner
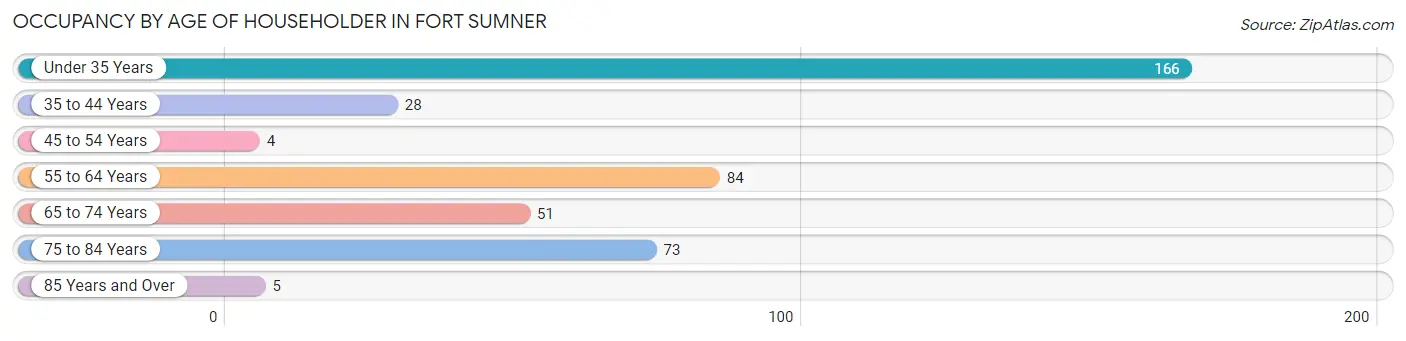
| Age Bracket | # Households | % Households |
| Under 35 Years | 166 | 40.4% |
| 35 to 44 Years | 28 | 6.8% |
| 45 to 54 Years | 4 | 1.0% |
| 55 to 64 Years | 84 | 20.4% |
| 65 to 74 Years | 51 | 12.4% |
| 75 to 84 Years | 73 | 17.8% |
| 85 Years and Over | 5 | 1.2% |
| Total | 411 | 100.0% |
Housing Finances in Fort Sumner
Median Income by Occupancy in Fort Sumner
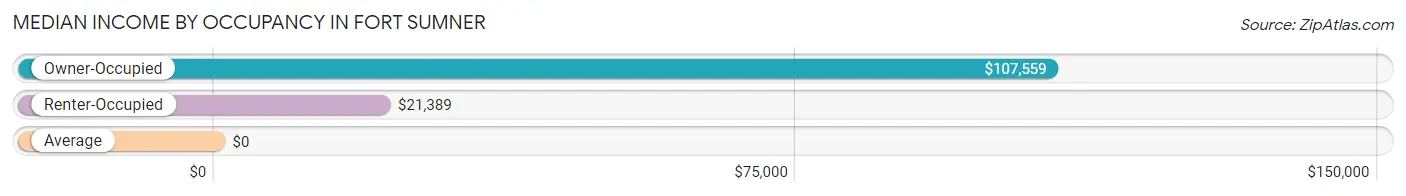
| Occupancy Type | # Households | Median Income |
| Owner-Occupied | 317 (77.1%) | $107,559 |
| Renter-Occupied | 94 (22.9%) | $21,389 |
| Average | 411 (100.0%) | $0 |
Occupancy by Householder Income Bracket in Fort Sumner
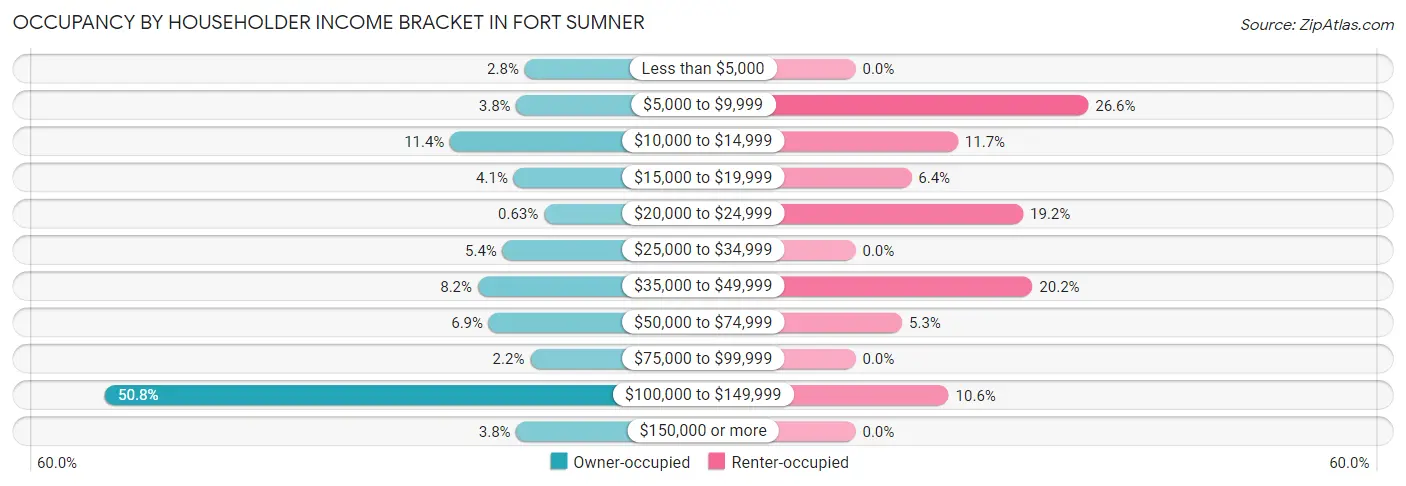
| Income Bracket | Owner-occupied | Renter-occupied |
| Less than $5,000 | 9 (2.8%) | 0 (0.0%) |
| $5,000 to $9,999 | 12 (3.8%) | 25 (26.6%) |
| $10,000 to $14,999 | 36 (11.4%) | 11 (11.7%) |
| $15,000 to $19,999 | 13 (4.1%) | 6 (6.4%) |
| $20,000 to $24,999 | 2 (0.6%) | 18 (19.2%) |
| $25,000 to $34,999 | 17 (5.4%) | 0 (0.0%) |
| $35,000 to $49,999 | 26 (8.2%) | 19 (20.2%) |
| $50,000 to $74,999 | 22 (6.9%) | 5 (5.3%) |
| $75,000 to $99,999 | 7 (2.2%) | 0 (0.0%) |
| $100,000 to $149,999 | 161 (50.8%) | 10 (10.6%) |
| $150,000 or more | 12 (3.8%) | 0 (0.0%) |
| Total | 317 (100.0%) | 94 (100.0%) |
Monthly Housing Cost Tiers in Fort Sumner
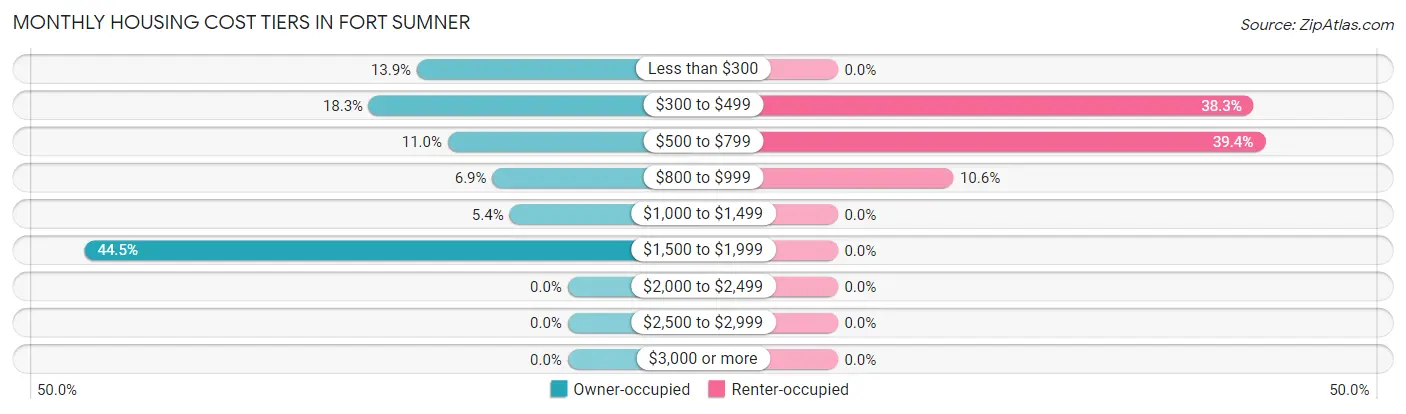
| Monthly Cost | Owner-occupied | Renter-occupied |
| Less than $300 | 44 (13.9%) | 0 (0.0%) |
| $300 to $499 | 58 (18.3%) | 36 (38.3%) |
| $500 to $799 | 35 (11.0%) | 37 (39.4%) |
| $800 to $999 | 22 (6.9%) | 10 (10.6%) |
| $1,000 to $1,499 | 17 (5.4%) | 0 (0.0%) |
| $1,500 to $1,999 | 141 (44.5%) | 0 (0.0%) |
| $2,000 to $2,499 | 0 (0.0%) | 0 (0.0%) |
| $2,500 to $2,999 | 0 (0.0%) | 0 (0.0%) |
| $3,000 or more | 0 (0.0%) | 0 (0.0%) |
| Total | 317 (100.0%) | 94 (100.0%) |
Physical Housing Characteristics in Fort Sumner
Housing Structures in Fort Sumner
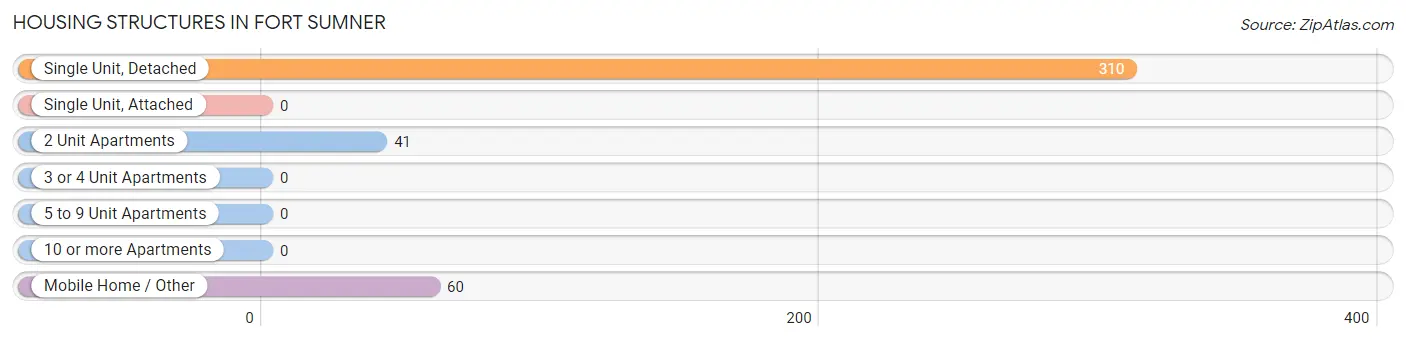
| Structure Type | # Housing Units | % Housing Units |
| Single Unit, Detached | 310 | 75.4% |
| Single Unit, Attached | 0 | 0.0% |
| 2 Unit Apartments | 41 | 10.0% |
| 3 or 4 Unit Apartments | 0 | 0.0% |
| 5 to 9 Unit Apartments | 0 | 0.0% |
| 10 or more Apartments | 0 | 0.0% |
| Mobile Home / Other | 60 | 14.6% |
| Total | 411 | 100.0% |
Housing Structures by Occupancy in Fort Sumner
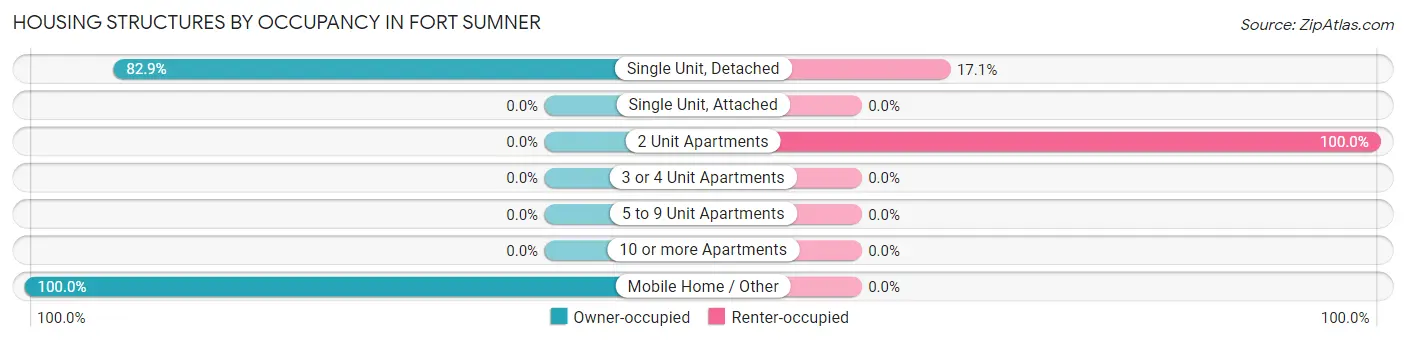
| Structure Type | Owner-occupied | Renter-occupied |
| Single Unit, Detached | 257 (82.9%) | 53 (17.1%) |
| Single Unit, Attached | 0 (0.0%) | 0 (0.0%) |
| 2 Unit Apartments | 0 (0.0%) | 41 (100.0%) |
| 3 or 4 Unit Apartments | 0 (0.0%) | 0 (0.0%) |
| 5 to 9 Unit Apartments | 0 (0.0%) | 0 (0.0%) |
| 10 or more Apartments | 0 (0.0%) | 0 (0.0%) |
| Mobile Home / Other | 60 (100.0%) | 0 (0.0%) |
| Total | 317 (77.1%) | 94 (22.9%) |
Housing Structures by Number of Rooms in Fort Sumner
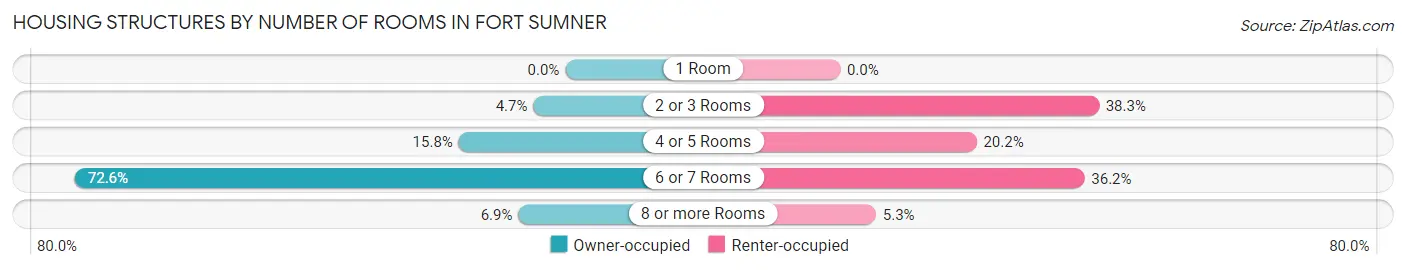
| Number of Rooms | Owner-occupied | Renter-occupied |
| 1 Room | 0 (0.0%) | 0 (0.0%) |
| 2 or 3 Rooms | 15 (4.7%) | 36 (38.3%) |
| 4 or 5 Rooms | 50 (15.8%) | 19 (20.2%) |
| 6 or 7 Rooms | 230 (72.6%) | 34 (36.2%) |
| 8 or more Rooms | 22 (6.9%) | 5 (5.3%) |
| Total | 317 (100.0%) | 94 (100.0%) |
Housing Structure by Heating Type in Fort Sumner
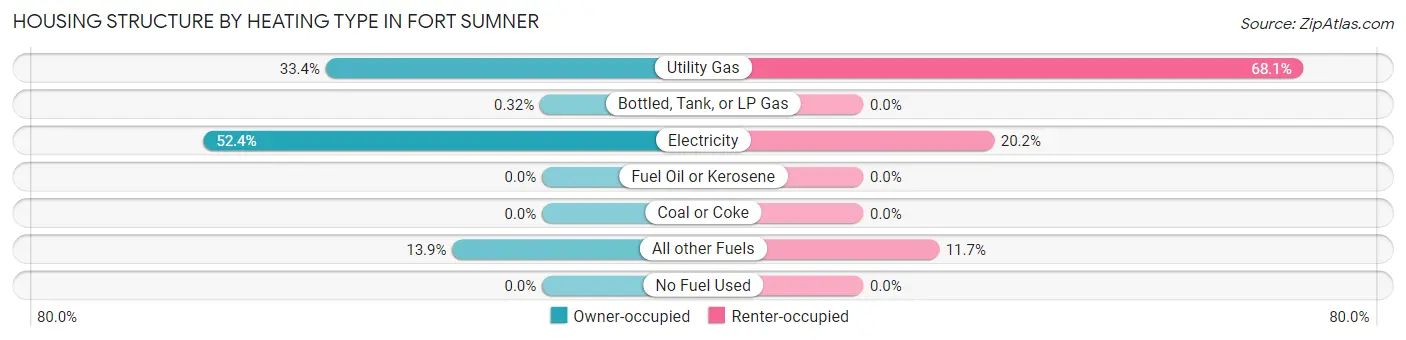
| Heating Type | Owner-occupied | Renter-occupied |
| Utility Gas | 106 (33.4%) | 64 (68.1%) |
| Bottled, Tank, or LP Gas | 1 (0.3%) | 0 (0.0%) |
| Electricity | 166 (52.4%) | 19 (20.2%) |
| Fuel Oil or Kerosene | 0 (0.0%) | 0 (0.0%) |
| Coal or Coke | 0 (0.0%) | 0 (0.0%) |
| All other Fuels | 44 (13.9%) | 11 (11.7%) |
| No Fuel Used | 0 (0.0%) | 0 (0.0%) |
| Total | 317 (100.0%) | 94 (100.0%) |
Household Vehicle Usage in Fort Sumner
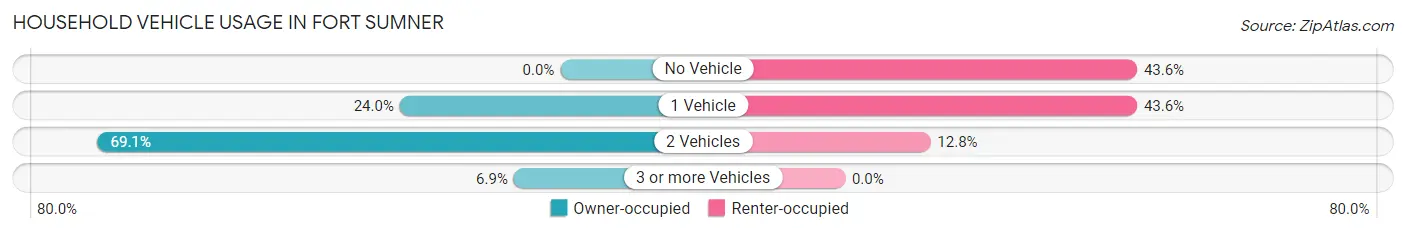
| Vehicles per Household | Owner-occupied | Renter-occupied |
| No Vehicle | 0 (0.0%) | 41 (43.6%) |
| 1 Vehicle | 76 (24.0%) | 41 (43.6%) |
| 2 Vehicles | 219 (69.1%) | 12 (12.8%) |
| 3 or more Vehicles | 22 (6.9%) | 0 (0.0%) |
| Total | 317 (100.0%) | 94 (100.0%) |
Real Estate & Mortgages in Fort Sumner
Real Estate and Mortgage Overview in Fort Sumner
| Characteristic | Without Mortgage | With Mortgage |
| Housing Units | 145 | 172 |
| Median Property Value | $109,700 | $269,100 |
| Median Household Income | $33,625 | $0 |
| Monthly Housing Costs | $381 | $0 |
| Real Estate Taxes | $558 | $2 |
Property Value by Mortgage Status in Fort Sumner
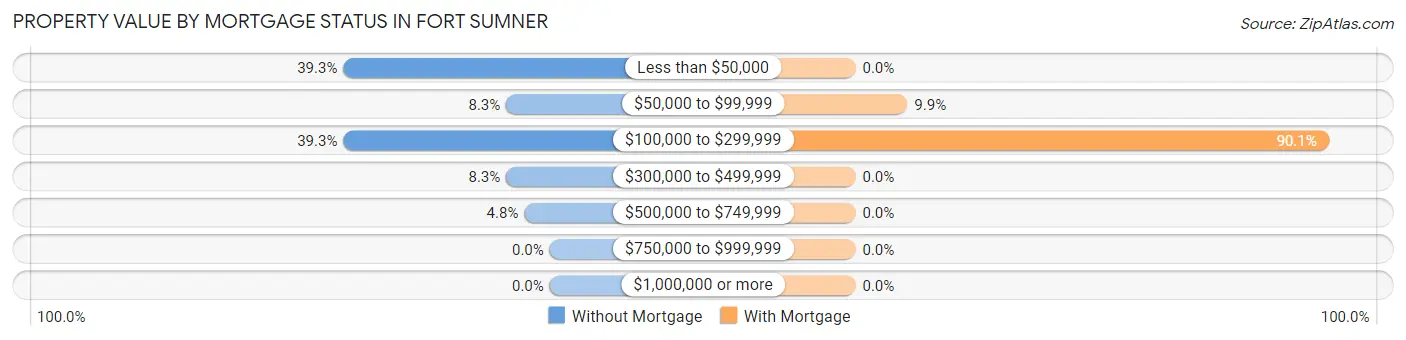
| Property Value | Without Mortgage | With Mortgage |
| Less than $50,000 | 57 (39.3%) | 0 (0.0%) |
| $50,000 to $99,999 | 12 (8.3%) | 17 (9.9%) |
| $100,000 to $299,999 | 57 (39.3%) | 155 (90.1%) |
| $300,000 to $499,999 | 12 (8.3%) | 0 (0.0%) |
| $500,000 to $749,999 | 7 (4.8%) | 0 (0.0%) |
| $750,000 to $999,999 | 0 (0.0%) | 0 (0.0%) |
| $1,000,000 or more | 0 (0.0%) | 0 (0.0%) |
| Total | 145 (100.0%) | 172 (100.0%) |
Household Income by Mortgage Status in Fort Sumner
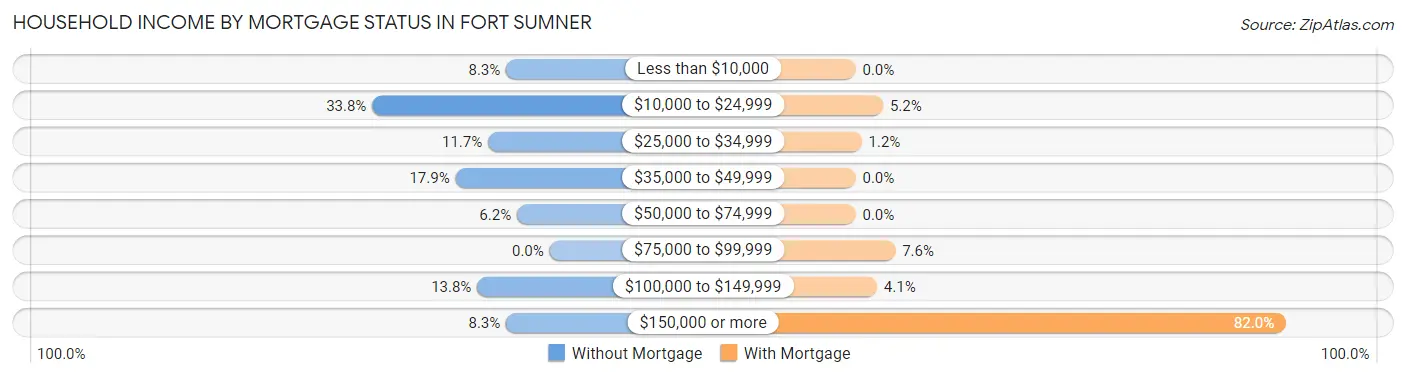
| Household Income | Without Mortgage | With Mortgage |
| Less than $10,000 | 12 (8.3%) | 0 (0.0%) |
| $10,000 to $24,999 | 49 (33.8%) | 9 (5.2%) |
| $25,000 to $34,999 | 17 (11.7%) | 2 (1.2%) |
| $35,000 to $49,999 | 26 (17.9%) | 0 (0.0%) |
| $50,000 to $74,999 | 9 (6.2%) | 0 (0.0%) |
| $75,000 to $99,999 | 0 (0.0%) | 13 (7.6%) |
| $100,000 to $149,999 | 20 (13.8%) | 7 (4.1%) |
| $150,000 or more | 12 (8.3%) | 141 (82.0%) |
| Total | 145 (100.0%) | 172 (100.0%) |
Property Value to Household Income Ratio in Fort Sumner
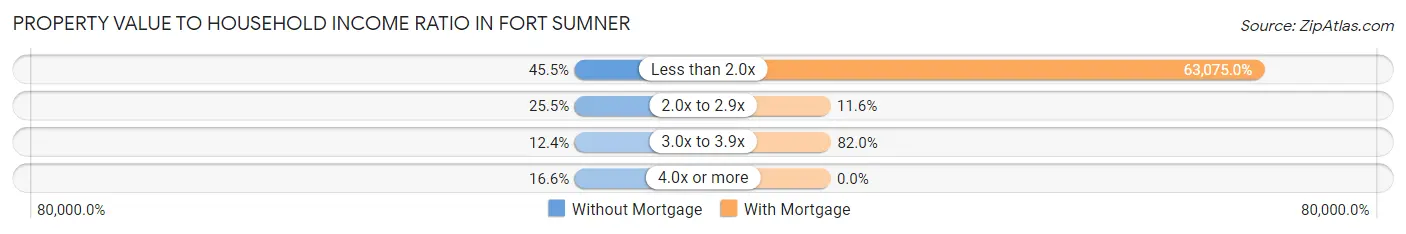
| Value-to-Income Ratio | Without Mortgage | With Mortgage |
| Less than 2.0x | 66 (45.5%) | 108,489 (63,075.0%) |
| 2.0x to 2.9x | 37 (25.5%) | 20 (11.6%) |
| 3.0x to 3.9x | 18 (12.4%) | 141 (82.0%) |
| 4.0x or more | 24 (16.6%) | 0 (0.0%) |
| Total | 145 (100.0%) | 172 (100.0%) |
Real Estate Taxes by Mortgage Status in Fort Sumner
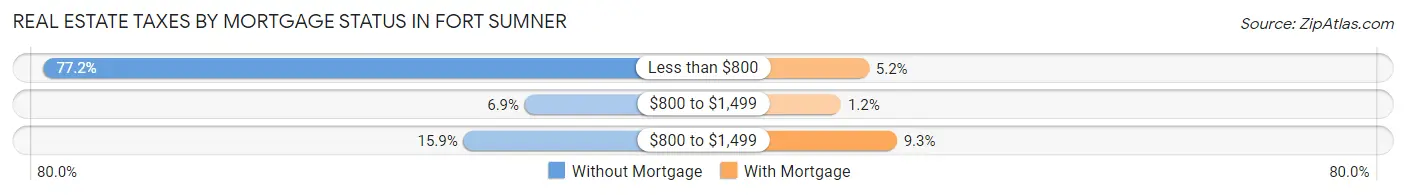
| Property Taxes | Without Mortgage | With Mortgage |
| Less than $800 | 112 (77.2%) | 9 (5.2%) |
| $800 to $1,499 | 10 (6.9%) | 2 (1.2%) |
| $800 to $1,499 | 23 (15.9%) | 16 (9.3%) |
| Total | 145 (100.0%) | 172 (100.0%) |
Health & Disability in Fort Sumner
Health Insurance Coverage by Age in Fort Sumner
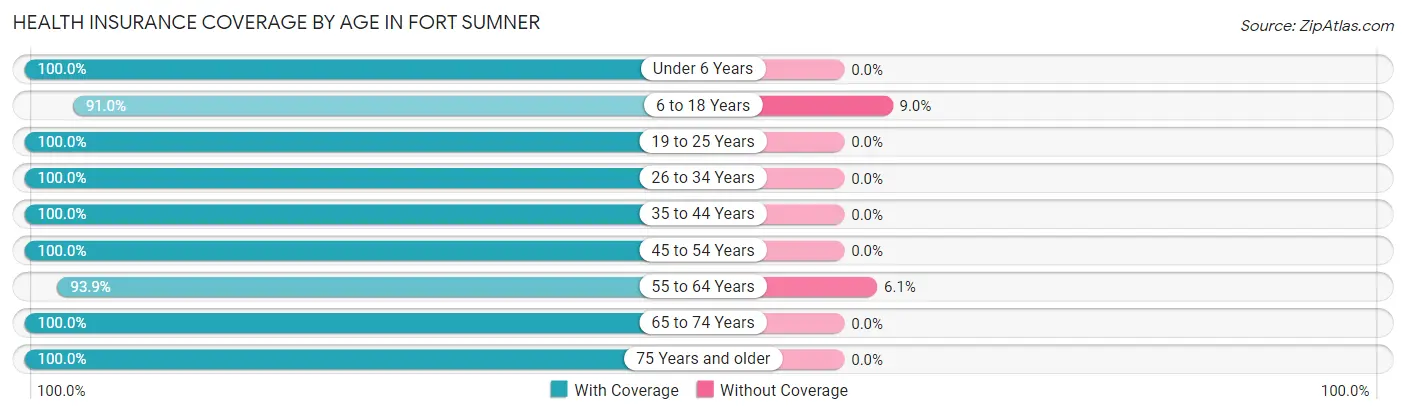
| Age Bracket | With Coverage | Without Coverage |
| Under 6 Years | 220 (100.0%) | 0 (0.0%) |
| 6 to 18 Years | 172 (91.0%) | 17 (9.0%) |
| 19 to 25 Years | 112 (100.0%) | 0 (0.0%) |
| 26 to 34 Years | 277 (100.0%) | 0 (0.0%) |
| 35 to 44 Years | 106 (100.0%) | 0 (0.0%) |
| 45 to 54 Years | 12 (100.0%) | 0 (0.0%) |
| 55 to 64 Years | 92 (93.9%) | 6 (6.1%) |
| 65 to 74 Years | 89 (100.0%) | 0 (0.0%) |
| 75 Years and older | 87 (100.0%) | 0 (0.0%) |
| Total | 1,167 (98.1%) | 23 (1.9%) |
Health Insurance Coverage by Citizenship Status in Fort Sumner
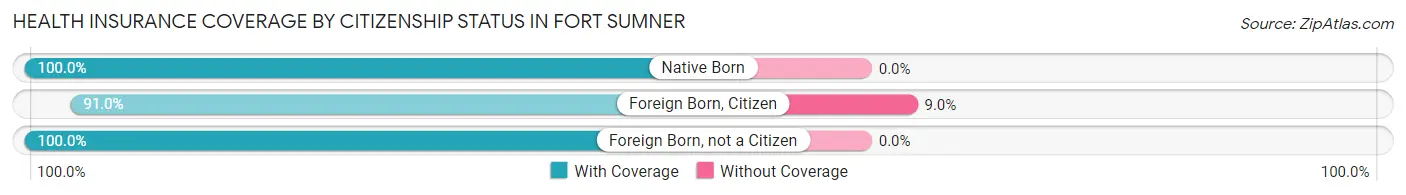
| Citizenship Status | With Coverage | Without Coverage |
| Native Born | 220 (100.0%) | 0 (0.0%) |
| Foreign Born, Citizen | 172 (91.0%) | 17 (9.0%) |
| Foreign Born, not a Citizen | 112 (100.0%) | 0 (0.0%) |
Health Insurance Coverage by Household Income in Fort Sumner
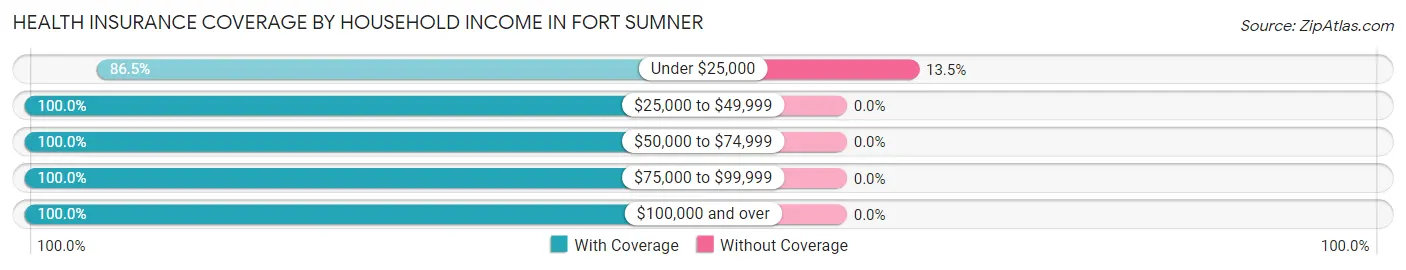
| Household Income | With Coverage | Without Coverage |
| Under $25,000 | 147 (86.5%) | 23 (13.5%) |
| $25,000 to $49,999 | 177 (100.0%) | 0 (0.0%) |
| $50,000 to $74,999 | 133 (100.0%) | 0 (0.0%) |
| $75,000 to $99,999 | 90 (100.0%) | 0 (0.0%) |
| $100,000 and over | 620 (100.0%) | 0 (0.0%) |
Public vs Private Health Insurance Coverage by Age in Fort Sumner
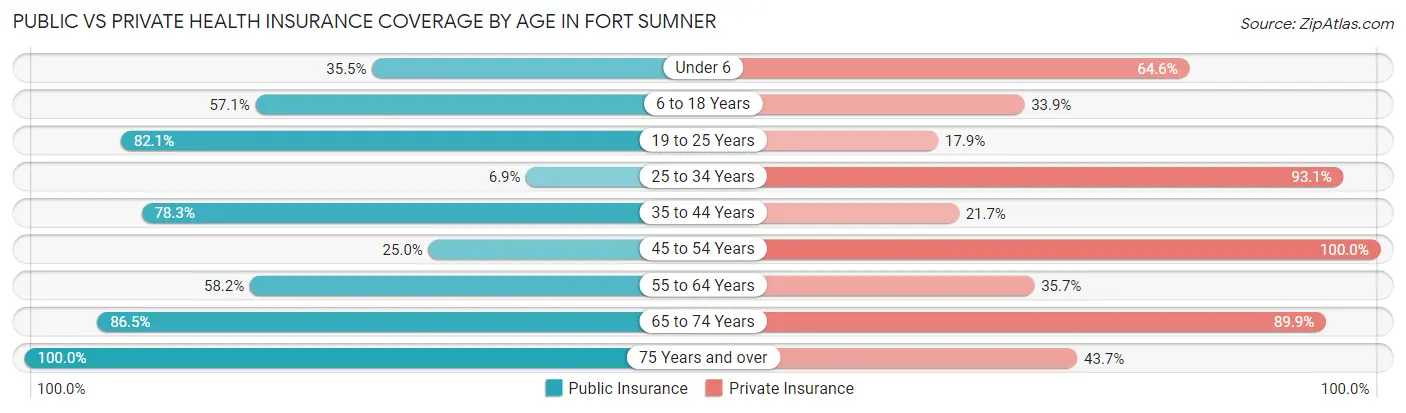
| Age Bracket | Public Insurance | Private Insurance |
| Under 6 | 78 (35.4%) | 142 (64.5%) |
| 6 to 18 Years | 108 (57.1%) | 64 (33.9%) |
| 19 to 25 Years | 92 (82.1%) | 20 (17.9%) |
| 25 to 34 Years | 19 (6.9%) | 258 (93.1%) |
| 35 to 44 Years | 83 (78.3%) | 23 (21.7%) |
| 45 to 54 Years | 3 (25.0%) | 12 (100.0%) |
| 55 to 64 Years | 57 (58.2%) | 35 (35.7%) |
| 65 to 74 Years | 77 (86.5%) | 80 (89.9%) |
| 75 Years and over | 87 (100.0%) | 38 (43.7%) |
| Total | 604 (50.8%) | 672 (56.5%) |
Disability Status by Sex by Age in Fort Sumner
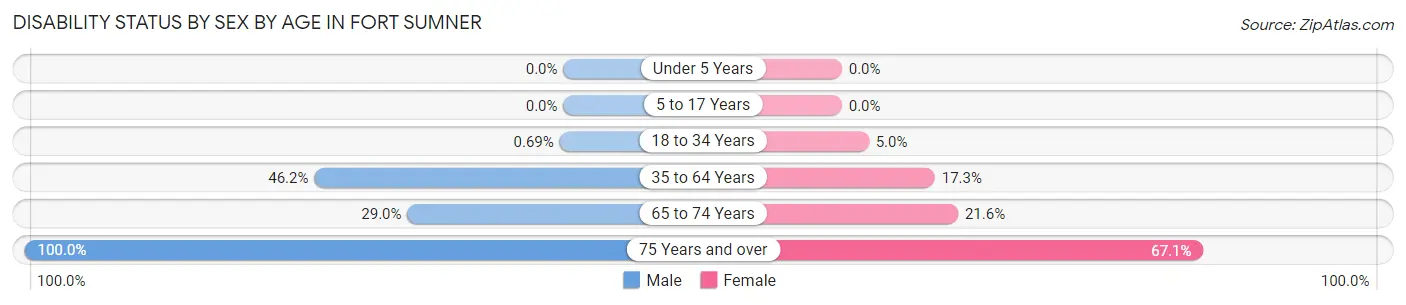
| Age Bracket | Male | Female |
| Under 5 Years | 0 (0.0%) | 0 (0.0%) |
| 5 to 17 Years | 0 (0.0%) | 0 (0.0%) |
| 18 to 34 Years | 2 (0.7%) | 5 (5.0%) |
| 35 to 64 Years | 49 (46.2%) | 19 (17.3%) |
| 65 to 74 Years | 11 (28.9%) | 11 (21.6%) |
| 75 Years and over | 11 (100.0%) | 51 (67.1%) |
Disability Class by Sex by Age in Fort Sumner
Disability Class: Hearing Difficulty
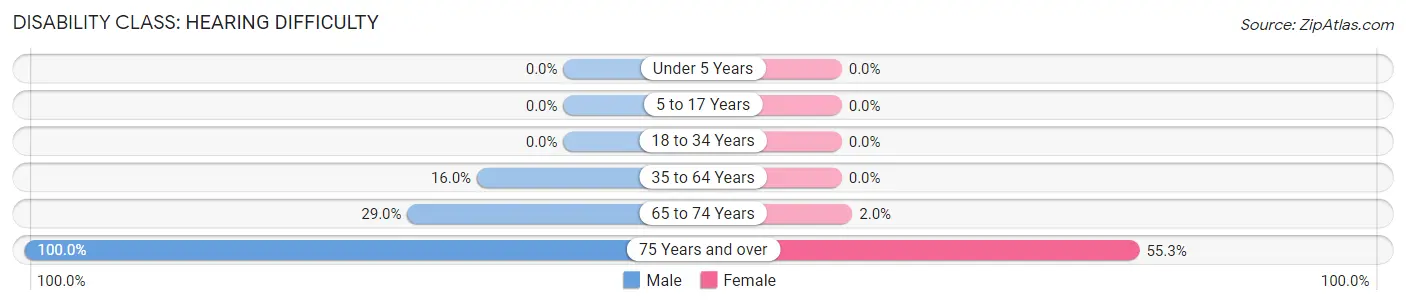
| Age Bracket | Male | Female |
| Under 5 Years | 0 (0.0%) | 0 (0.0%) |
| 5 to 17 Years | 0 (0.0%) | 0 (0.0%) |
| 18 to 34 Years | 0 (0.0%) | 0 (0.0%) |
| 35 to 64 Years | 17 (16.0%) | 0 (0.0%) |
| 65 to 74 Years | 11 (28.9%) | 1 (2.0%) |
| 75 Years and over | 11 (100.0%) | 42 (55.3%) |
Disability Class: Vision Difficulty
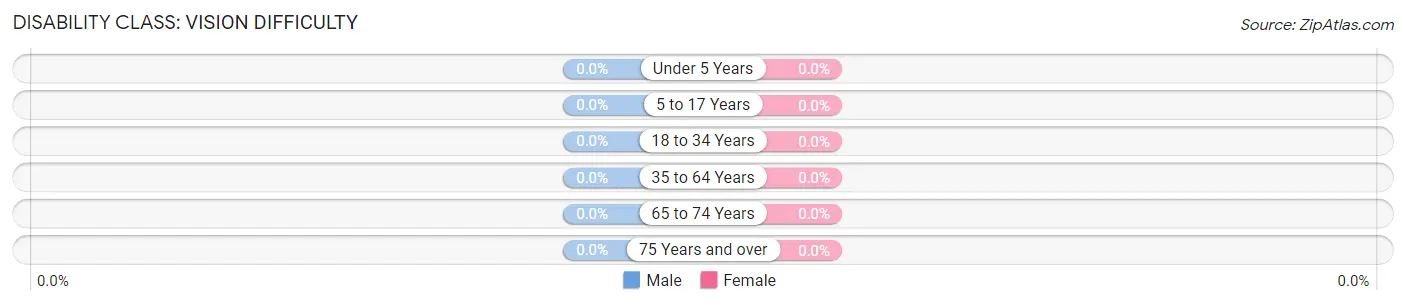
| Age Bracket | Male | Female |
| Under 5 Years | 0 (0.0%) | 0 (0.0%) |
| 5 to 17 Years | 0 (0.0%) | 0 (0.0%) |
| 18 to 34 Years | 0 (0.0%) | 0 (0.0%) |
| 35 to 64 Years | 0 (0.0%) | 0 (0.0%) |
| 65 to 74 Years | 0 (0.0%) | 0 (0.0%) |
| 75 Years and over | 0 (0.0%) | 0 (0.0%) |
Disability Class: Cognitive Difficulty
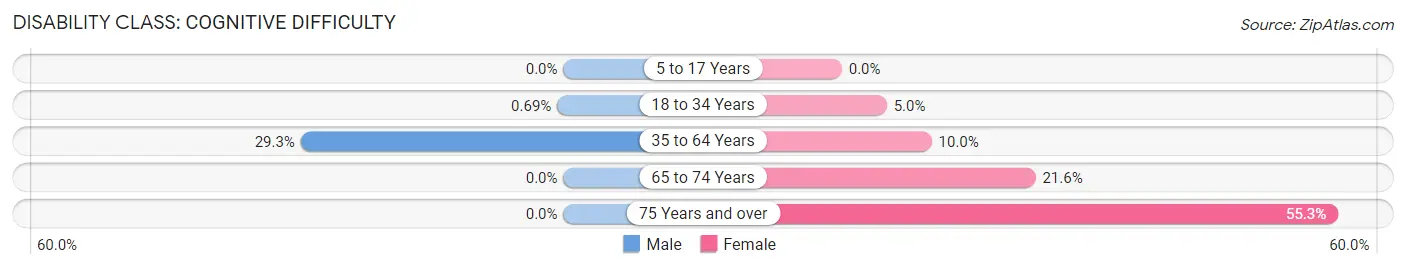
| Age Bracket | Male | Female |
| 5 to 17 Years | 0 (0.0%) | 0 (0.0%) |
| 18 to 34 Years | 2 (0.7%) | 5 (5.0%) |
| 35 to 64 Years | 31 (29.2%) | 11 (10.0%) |
| 65 to 74 Years | 0 (0.0%) | 11 (21.6%) |
| 75 Years and over | 0 (0.0%) | 42 (55.3%) |
Disability Class: Ambulatory Difficulty
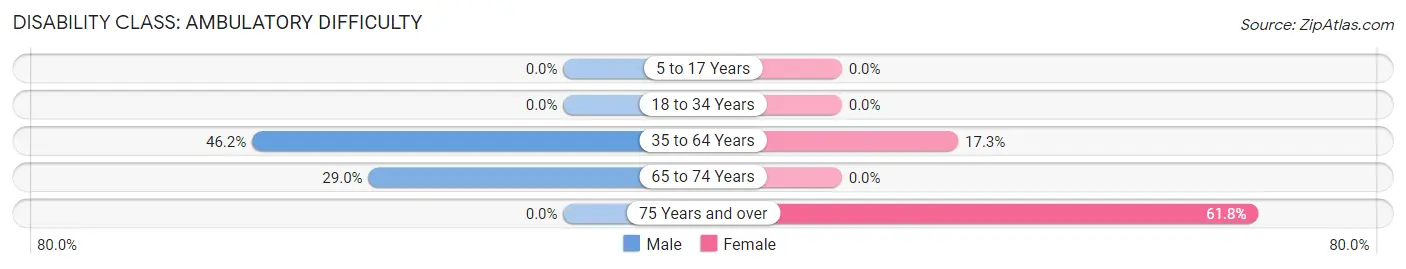
| Age Bracket | Male | Female |
| 5 to 17 Years | 0 (0.0%) | 0 (0.0%) |
| 18 to 34 Years | 0 (0.0%) | 0 (0.0%) |
| 35 to 64 Years | 49 (46.2%) | 19 (17.3%) |
| 65 to 74 Years | 11 (28.9%) | 0 (0.0%) |
| 75 Years and over | 0 (0.0%) | 47 (61.8%) |
Disability Class: Self-Care Difficulty
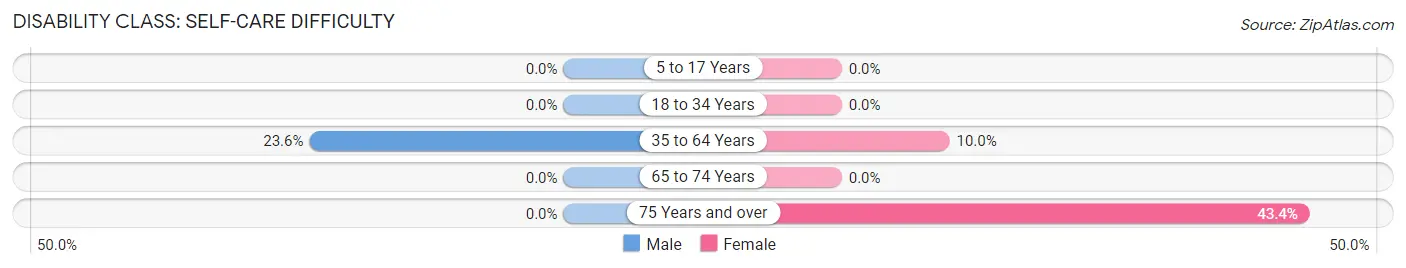
| Age Bracket | Male | Female |
| 5 to 17 Years | 0 (0.0%) | 0 (0.0%) |
| 18 to 34 Years | 0 (0.0%) | 0 (0.0%) |
| 35 to 64 Years | 25 (23.6%) | 11 (10.0%) |
| 65 to 74 Years | 0 (0.0%) | 0 (0.0%) |
| 75 Years and over | 0 (0.0%) | 33 (43.4%) |
Technology Access in Fort Sumner
Computing Device Access in Fort Sumner
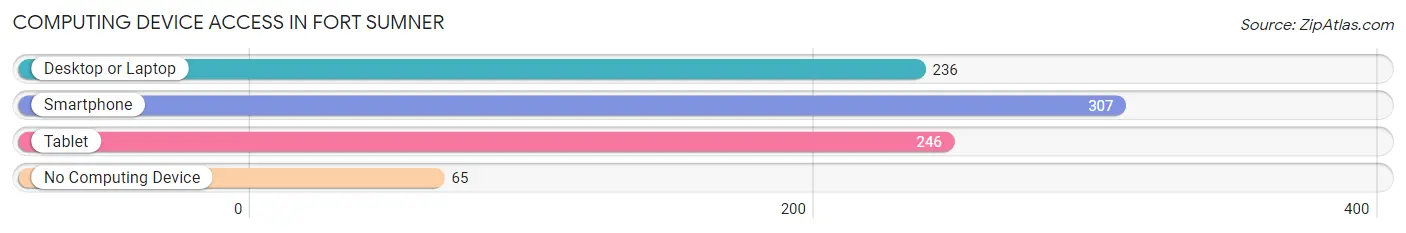
| Device Type | # Households | % Households |
| Desktop or Laptop | 236 | 57.4% |
| Smartphone | 307 | 74.7% |
| Tablet | 246 | 59.9% |
| No Computing Device | 65 | 15.8% |
| Total | 411 | 100.0% |
Internet Access in Fort Sumner
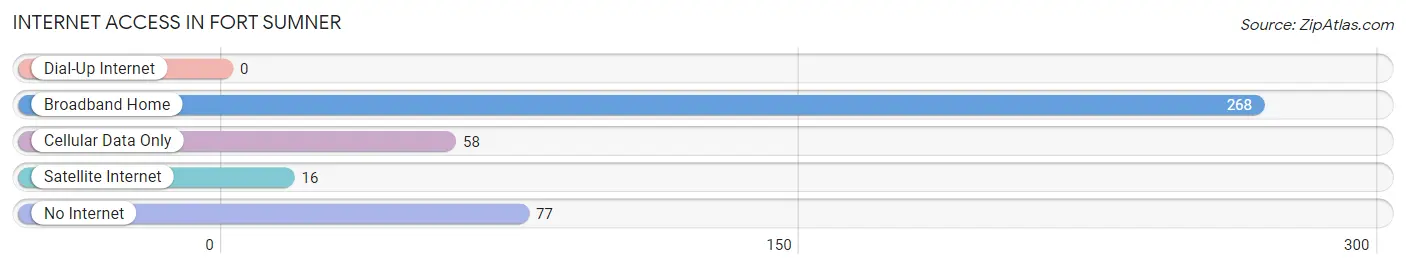
| Internet Type | # Households | % Households |
| Dial-Up Internet | 0 | 0.0% |
| Broadband Home | 268 | 65.2% |
| Cellular Data Only | 58 | 14.1% |
| Satellite Internet | 16 | 3.9% |
| No Internet | 77 | 18.7% |
| Total | 411 | 100.0% |
Fort Sumner Summary
Fort Sumner is a small town located in De Baca County, New Mexico. It is situated on the Pecos River, approximately 80 miles east of Roswell. The town was founded in 1864 by the United States Army as a military post to protect settlers from Native American raids. The town was named after General Edwin Vose Sumner, who served in the Mexican-American War.
Geography
Fort Sumner is located in the eastern part of New Mexico, in the high plains region of the state. The town is situated on the Pecos River, which is a tributary of the Rio Grande. The town is surrounded by rolling hills and mesas, and is located at an elevation of 4,000 feet. The climate in the area is semi-arid, with hot summers and cold winters.
Economy
The economy of Fort Sumner is largely based on agriculture and ranching. The town is home to several large farms and ranches, which produce a variety of crops and livestock. The town is also home to several small businesses, including restaurants, stores, and service providers.
Demographics
As of the 2010 census, the population of Fort Sumner was 1,031. The racial makeup of the town was 75.3% White, 0.7% African American, 0.9% Native American, 0.2% Asian, 0.1% Pacific Islander, and 22.8% from other races. The median household income in the town was $25,972, and the median family income was $31,250.
History
Fort Sumner was founded in 1864 by the United States Army as a military post to protect settlers from Native American raids. The town was named after General Edwin Vose Sumner, who served in the Mexican-American War. The fort was abandoned in 1868, and the town was incorporated in 1881.
In the late 19th century, Fort Sumner became a major stop on the Santa Fe Trail. The town was also home to the famous outlaw Billy the Kid, who was held in the local jail before his escape in 1881.
In the early 20th century, Fort Sumner became an important agricultural center. The town was home to several large farms and ranches, which produced a variety of crops and livestock. The town also became a major shipping point for cattle and sheep.
Today, Fort Sumner is a small town with a population of just over 1,000 people. The town is home to several small businesses, including restaurants, stores, and service providers. The town is also home to several historic sites, including the Billy the Kid Museum and the Fort Sumner State Monument.
Common Questions
What is Per Capita Income in Fort Sumner?
Per Capita income in Fort Sumner is $25,034.
What is the Median Family Income in Fort Sumner?
Median Family Income in Fort Sumner is $78,390.
What is Inequality or Gini Index in Fort Sumner?
Inequality or Gini Index in Fort Sumner is 0.40.
What is the Total Population of Fort Sumner?
Total Population of Fort Sumner is 1,206.
What is the Total Male Population of Fort Sumner?
Total Male Population of Fort Sumner is 702.
What is the Total Female Population of Fort Sumner?
Total Female Population of Fort Sumner is 504.
What is the Ratio of Males per 100 Females in Fort Sumner?
There are 139.29 Males per 100 Females in Fort Sumner.
What is the Ratio of Females per 100 Males in Fort Sumner?
There are 71.79 Females per 100 Males in Fort Sumner.
What is the Median Population Age in Fort Sumner?
Median Population Age in Fort Sumner is 27.1 Years.
What is the Average Family Size in Fort Sumner
Average Family Size in Fort Sumner is 3.9 People.
What is the Average Household Size in Fort Sumner
Average Household Size in Fort Sumner is 2.9 People.
How Large is the Labor Force in Fort Sumner?
There are 538 People in the Labor Forcein in Fort Sumner.
What is the Percentage of People in the Labor Force in Fort Sumner?
64.2% of People are in the Labor Force in Fort Sumner.
What is the Unemployment Rate in Fort Sumner?
Unemployment Rate in Fort Sumner is 10.0%.