Brittany Farms The Highlands, PA Map & Demographics
Brittany Farms The Highlands Map
Brittany Farms The Highlands Overview
$51,985
PER CAPITA INCOME
$117,372
AVG FAMILY INCOME
$103,534
AVG HOUSEHOLD INCOME
32.3%
WAGE / INCOME GAP [ % ]
67.7¢/ $1
WAGE / INCOME GAP [ $ ]
0.37
INEQUALITY / GINI INDEX
4,286
TOTAL POPULATION
2,052
MALE POPULATION
2,234
FEMALE POPULATION
91.85
MALES / 100 FEMALES
108.87
FEMALES / 100 MALES
46.3
MEDIAN AGE
3.0
AVG FAMILY SIZE
2.4
AVG HOUSEHOLD SIZE
2,601
LABOR FORCE [ PEOPLE ]
71.5%
PERCENT IN LABOR FORCE
5.8%
UNEMPLOYMENT RATE
Income in Brittany Farms The Highlands
Income Overview in Brittany Farms The Highlands
Per Capita Income in Brittany Farms The Highlands is $51,985, while median incomes of families and households are $117,372 and $103,534 respectively.
| Characteristic | Number | Measure |
| Per Capita Income | 4,286 | $51,985 |
| Median Family Income | 1,170 | $117,372 |
| Mean Family Income | 1,170 | $139,680 |
| Median Household Income | 1,772 | $103,534 |
| Mean Household Income | 1,772 | $124,754 |
| Income Deficit | 1,170 | $0 |
| Wage / Income Gap (%) | 4,286 | 32.28% |
| Wage / Income Gap ($) | 4,286 | 67.72¢ per $1 |
| Gini / Inequality Index | 4,286 | 0.37 |
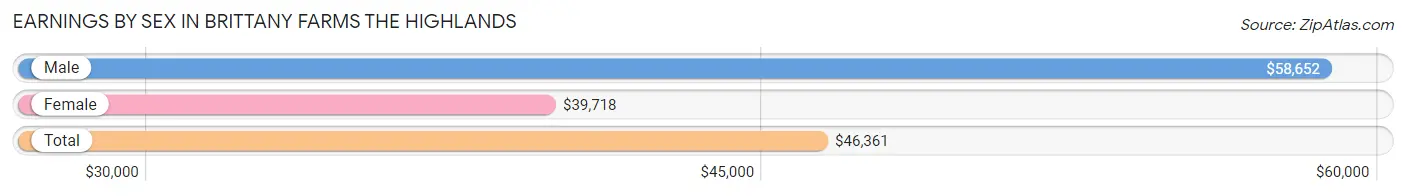
Earnings by Sex in Brittany Farms The Highlands
Average Earnings in Brittany Farms The Highlands are $46,361, $58,652 for men and $39,718 for women, a difference of 32.3%.
| Sex | Number | Average Earnings |
| Male | 1,369 (50.5%) | $58,652 |
| Female | 1,340 (49.5%) | $39,718 |
| Total | 2,709 (100.0%) | $46,361 |
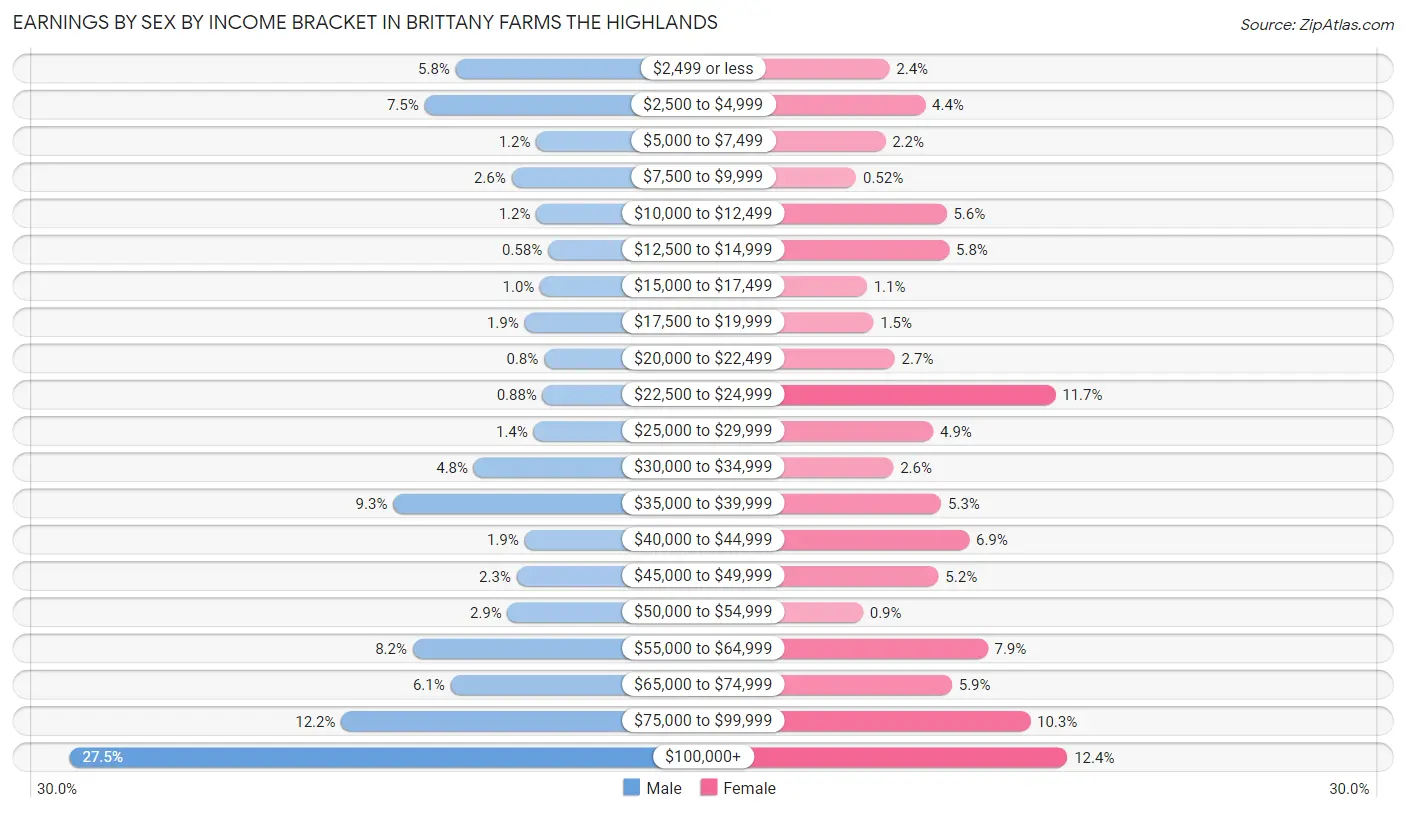
Earnings by Sex by Income Bracket in Brittany Farms The Highlands
The most common earnings brackets in Brittany Farms The Highlands are $100,000+ for men (376 | 27.5%) and $100,000+ for women (166 | 12.4%).
| Income | Male | Female |
| $2,499 or less | 79 (5.8%) | 32 (2.4%) |
| $2,500 to $4,999 | 103 (7.5%) | 59 (4.4%) |
| $5,000 to $7,499 | 17 (1.2%) | 29 (2.2%) |
| $7,500 to $9,999 | 36 (2.6%) | 7 (0.5%) |
| $10,000 to $12,499 | 17 (1.2%) | 75 (5.6%) |
| $12,500 to $14,999 | 8 (0.6%) | 77 (5.8%) |
| $15,000 to $17,499 | 14 (1.0%) | 15 (1.1%) |
| $17,500 to $19,999 | 26 (1.9%) | 20 (1.5%) |
| $20,000 to $22,499 | 11 (0.8%) | 36 (2.7%) |
| $22,500 to $24,999 | 12 (0.9%) | 157 (11.7%) |
| $25,000 to $29,999 | 19 (1.4%) | 65 (4.9%) |
| $30,000 to $34,999 | 65 (4.8%) | 35 (2.6%) |
| $35,000 to $39,999 | 127 (9.3%) | 71 (5.3%) |
| $40,000 to $44,999 | 26 (1.9%) | 92 (6.9%) |
| $45,000 to $49,999 | 32 (2.3%) | 69 (5.1%) |
| $50,000 to $54,999 | 39 (2.9%) | 12 (0.9%) |
| $55,000 to $64,999 | 112 (8.2%) | 106 (7.9%) |
| $65,000 to $74,999 | 83 (6.1%) | 79 (5.9%) |
| $75,000 to $99,999 | 167 (12.2%) | 138 (10.3%) |
| $100,000+ | 376 (27.5%) | 166 (12.4%) |
| Total | 1,369 (100.0%) | 1,340 (100.0%) |
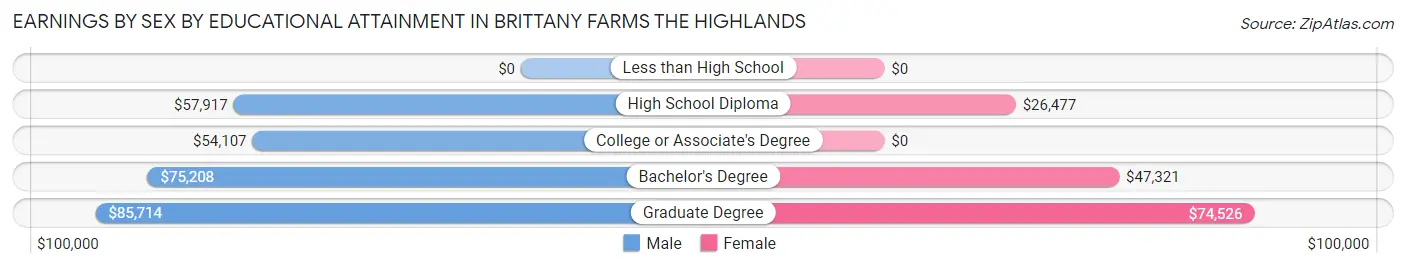
Earnings by Sex by Educational Attainment in Brittany Farms The Highlands
Average earnings in Brittany Farms The Highlands are $66,742 for men and $44,955 for women, a difference of 32.6%. Men with an educational attainment of graduate degree enjoy the highest average annual earnings of $85,714, while those with college or associate's degree education earn the least with $54,107. Women with an educational attainment of graduate degree earn the most with the average annual earnings of $74,526, while those with high school diploma education have the smallest earnings of $26,477.
| Educational Attainment | Male Income | Female Income |
| Less than High School | - | - |
| High School Diploma | $57,917 | $26,477 |
| College or Associate's Degree | $54,107 | $0 |
| Bachelor's Degree | $75,208 | $47,321 |
| Graduate Degree | $85,714 | $74,526 |
| Total | $66,742 | $44,955 |
Family Income in Brittany Farms The Highlands
Family Income Brackets in Brittany Farms The Highlands
According to the Brittany Farms The Highlands family income data, there are 248 families falling into the $75,000 to $99,999 income range, which is the most common income bracket and makes up 21.2% of all families.
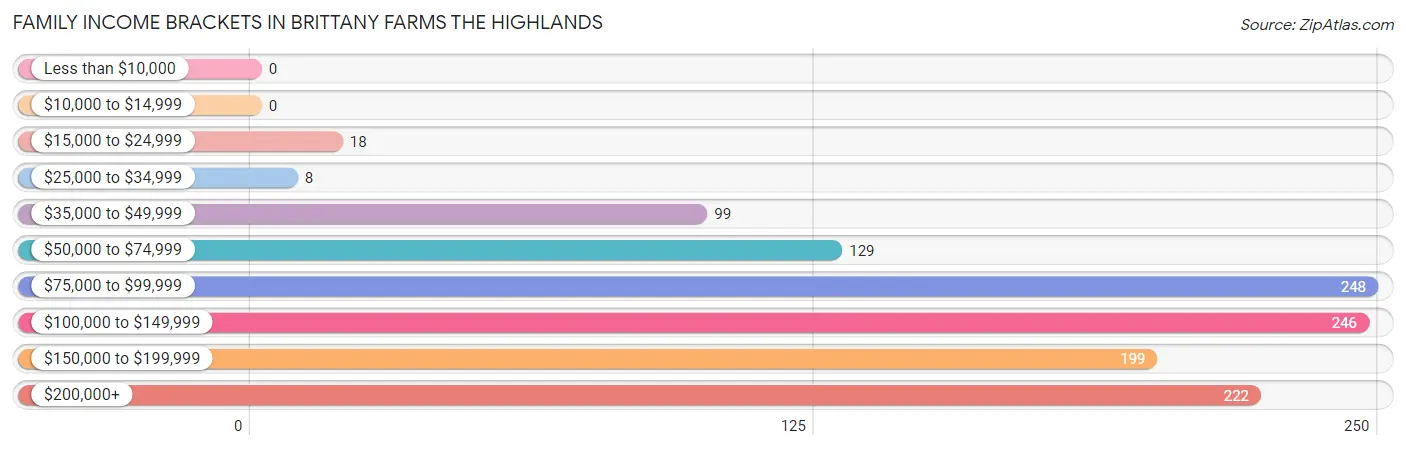
| Income Bracket | # Families | % Families |
| Less than $10,000 | 0 | 0.0% |
| $10,000 to $14,999 | 0 | 0.0% |
| $15,000 to $24,999 | 18 | 1.5% |
| $25,000 to $34,999 | 8 | 0.7% |
| $35,000 to $49,999 | 99 | 8.5% |
| $50,000 to $74,999 | 129 | 11.0% |
| $75,000 to $99,999 | 248 | 21.2% |
| $100,000 to $149,999 | 246 | 21.0% |
| $150,000 to $199,999 | 199 | 17.0% |
| $200,000+ | 222 | 19.0% |
Family Income by Famaliy Size in Brittany Farms The Highlands
5-person families (99 | 8.5%) account for the highest median family income in Brittany Farms The Highlands with $198,958 per family, while 2-person families (526 | 45.0%) have the highest median income of $60,375 per family member.
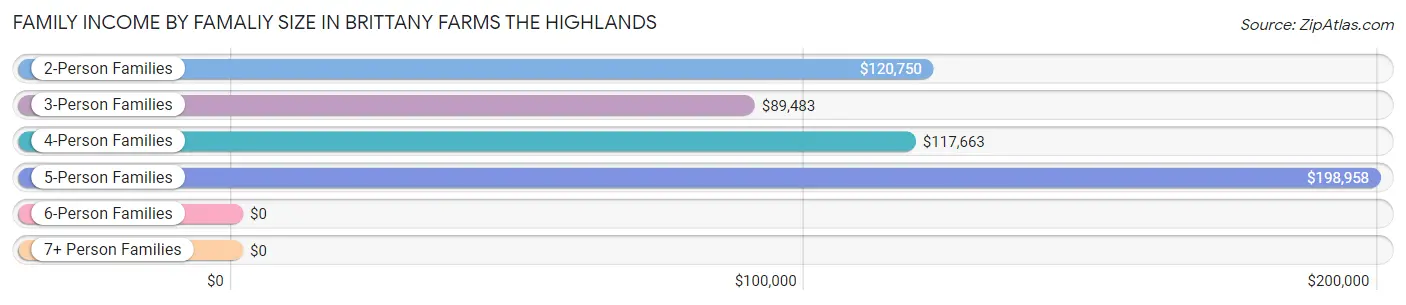
| Income Bracket | # Families | Median Income |
| 2-Person Families | 526 (45.0%) | $120,750 |
| 3-Person Families | 324 (27.7%) | $89,483 |
| 4-Person Families | 203 (17.3%) | $117,663 |
| 5-Person Families | 99 (8.5%) | $198,958 |
| 6-Person Families | 18 (1.5%) | $0 |
| 7+ Person Families | 0 (0.0%) | $0 |
| Total | 1,170 (100.0%) | $117,372 |
Family Income by Number of Earners in Brittany Farms The Highlands
The median family income in Brittany Farms The Highlands is $117,372, with families comprising 2 earners (508) having the highest median family income of $137,188, while families with no earners (97) have the lowest median family income of $56,042, accounting for 43.4% and 8.3% of families, respectively.
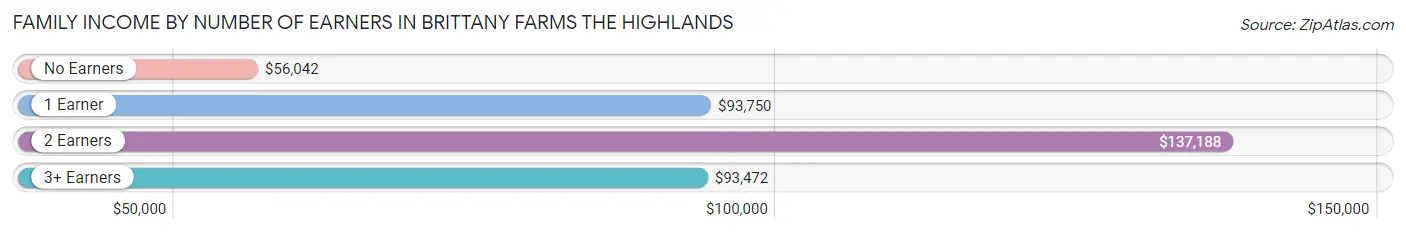
| Number of Earners | # Families | Median Income |
| No Earners | 97 (8.3%) | $56,042 |
| 1 Earner | 318 (27.2%) | $93,750 |
| 2 Earners | 508 (43.4%) | $137,188 |
| 3+ Earners | 247 (21.1%) | $93,472 |
| Total | 1,170 (100.0%) | $117,372 |
Household Income in Brittany Farms The Highlands
Household Income Brackets in Brittany Farms The Highlands
With 409 households falling in the category, the $100,000 to $149,999 income range is the most frequent in Brittany Farms The Highlands, accounting for 23.1% of all households.
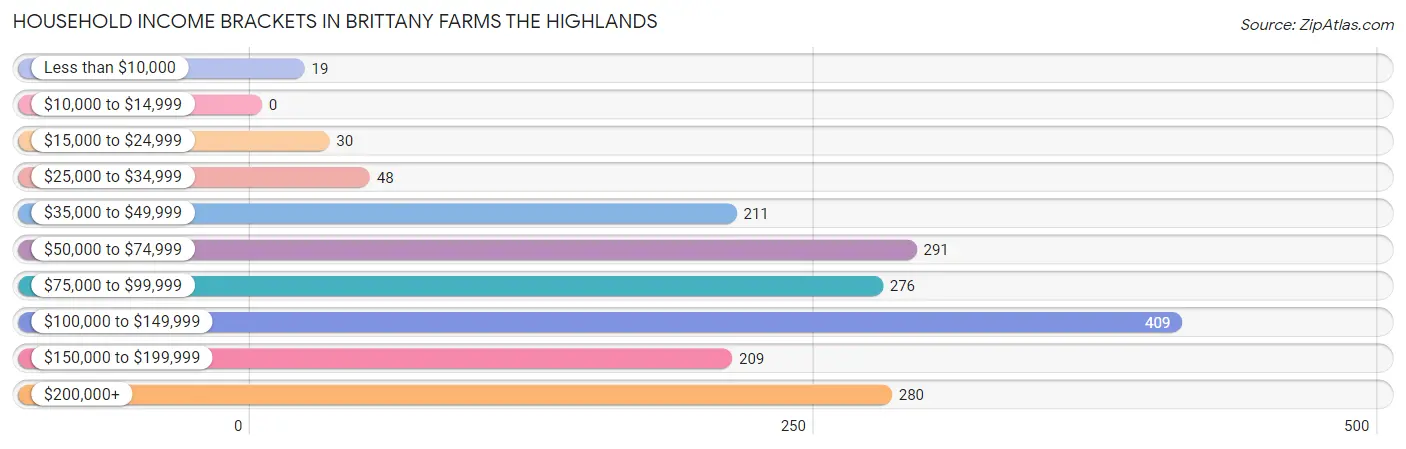
| Income Bracket | # Households | % Households |
| Less than $10,000 | 19 | 1.1% |
| $10,000 to $14,999 | 0 | 0.0% |
| $15,000 to $24,999 | 30 | 1.7% |
| $25,000 to $34,999 | 48 | 2.7% |
| $35,000 to $49,999 | 211 | 11.9% |
| $50,000 to $74,999 | 291 | 16.4% |
| $75,000 to $99,999 | 276 | 15.6% |
| $100,000 to $149,999 | 409 | 23.1% |
| $150,000 to $199,999 | 209 | 11.8% |
| $200,000+ | 280 | 15.8% |
Household Income by Householder Age in Brittany Farms The Highlands
The median household income in Brittany Farms The Highlands is $103,534, with the highest median household income of $120,972 found in the 45 to 64 years age bracket for the primary householder. A total of 793 households (44.8%) fall into this category. Meanwhile, the 15 to 24 years age bracket for the primary householder has the lowest median household income of $0, with 7 households (0.4%) in this group.
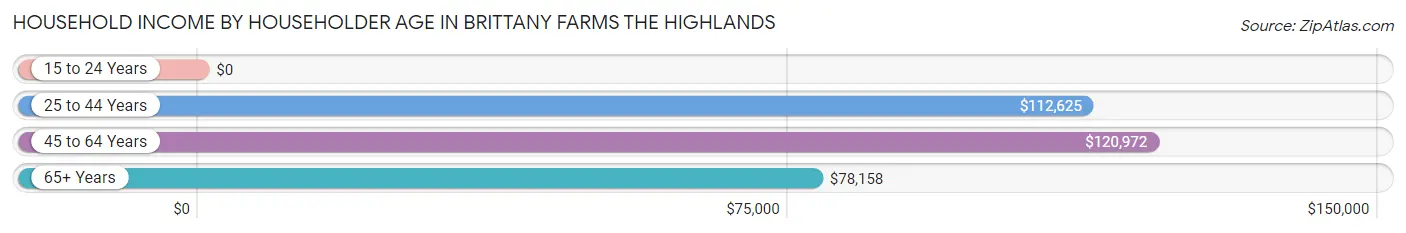
| Income Bracket | # Households | Median Income |
| 15 to 24 Years | 7 (0.4%) | $0 |
| 25 to 44 Years | 368 (20.8%) | $112,625 |
| 45 to 64 Years | 793 (44.8%) | $120,972 |
| 65+ Years | 604 (34.1%) | $78,158 |
| Total | 1,772 (100.0%) | $103,534 |
Poverty in Brittany Farms The Highlands
Income Below Poverty by Sex and Age in Brittany Farms The Highlands
With 0.8% poverty level for males and 1.6% for females among the residents of Brittany Farms The Highlands, 45 to 54 year old males and 25 to 34 year old females are the most vulnerable to poverty, with 17 males (4.8%) and 16 females (7.1%) in their respective age groups living below the poverty level.
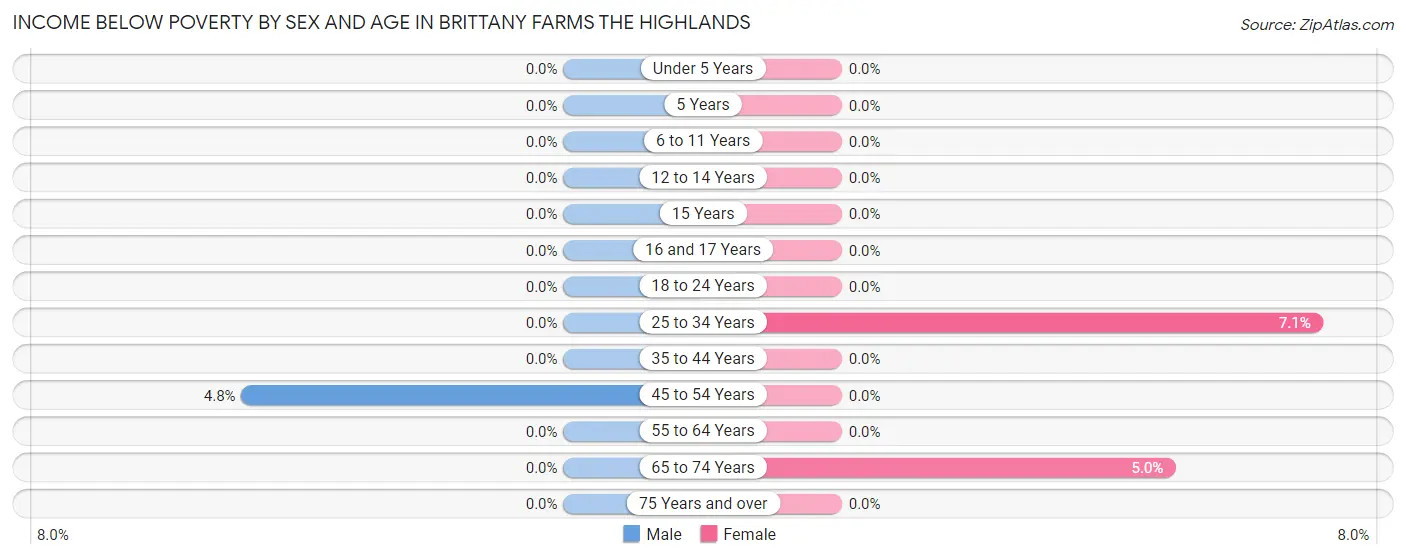
| Age Bracket | Male | Female |
| Under 5 Years | 0 (0.0%) | 0 (0.0%) |
| 5 Years | 0 (0.0%) | 0 (0.0%) |
| 6 to 11 Years | 0 (0.0%) | 0 (0.0%) |
| 12 to 14 Years | 0 (0.0%) | 0 (0.0%) |
| 15 Years | 0 (0.0%) | 0 (0.0%) |
| 16 and 17 Years | 0 (0.0%) | 0 (0.0%) |
| 18 to 24 Years | 0 (0.0%) | 0 (0.0%) |
| 25 to 34 Years | 0 (0.0%) | 16 (7.1%) |
| 35 to 44 Years | 0 (0.0%) | 0 (0.0%) |
| 45 to 54 Years | 17 (4.8%) | 0 (0.0%) |
| 55 to 64 Years | 0 (0.0%) | 0 (0.0%) |
| 65 to 74 Years | 0 (0.0%) | 19 (5.0%) |
| 75 Years and over | 0 (0.0%) | 0 (0.0%) |
| Total | 17 (0.8%) | 35 (1.6%) |
Income Above Poverty by Sex and Age in Brittany Farms The Highlands
According to the poverty statistics in Brittany Farms The Highlands, males aged under 5 years and females aged under 5 years are the age groups that are most secure financially, with 100.0% of males and 100.0% of females in these age groups living above the poverty line.
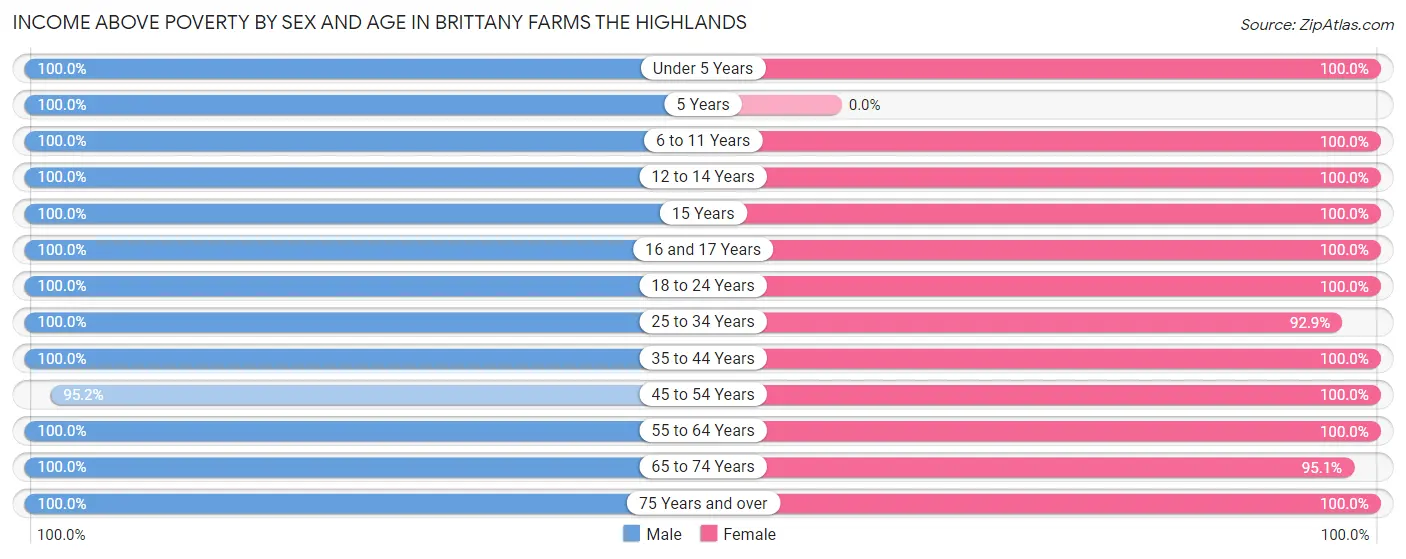
| Age Bracket | Male | Female |
| Under 5 Years | 92 (100.0%) | 22 (100.0%) |
| 5 Years | 55 (100.0%) | 0 (0.0%) |
| 6 to 11 Years | 157 (100.0%) | 173 (100.0%) |
| 12 to 14 Years | 61 (100.0%) | 44 (100.0%) |
| 15 Years | 36 (100.0%) | 8 (100.0%) |
| 16 and 17 Years | 52 (100.0%) | 50 (100.0%) |
| 18 to 24 Years | 135 (100.0%) | 260 (100.0%) |
| 25 to 34 Years | 184 (100.0%) | 208 (92.9%) |
| 35 to 44 Years | 247 (100.0%) | 220 (100.0%) |
| 45 to 54 Years | 339 (95.2%) | 339 (100.0%) |
| 55 to 64 Years | 336 (100.0%) | 309 (100.0%) |
| 65 to 74 Years | 246 (100.0%) | 365 (95.1%) |
| 75 Years and over | 95 (100.0%) | 201 (100.0%) |
| Total | 2,035 (99.2%) | 2,199 (98.4%) |
Income Below Poverty Among Married-Couple Families in Brittany Farms The Highlands
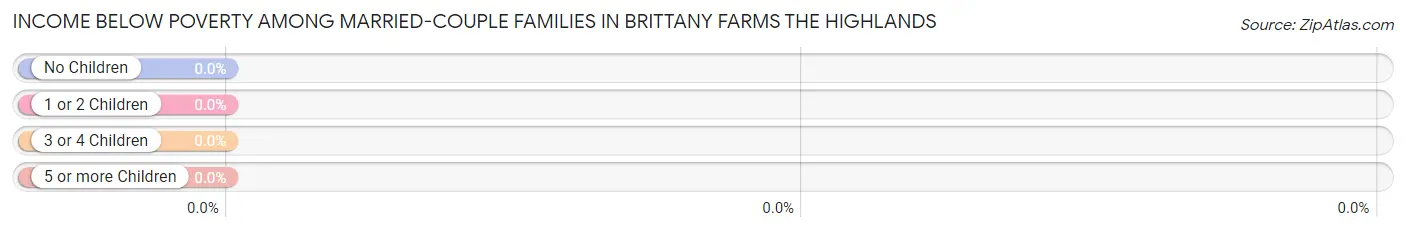
| Children | Above Poverty | Below Poverty |
| No Children | 519 (100.0%) | 0 (0.0%) |
| 1 or 2 Children | 306 (100.0%) | 0 (0.0%) |
| 3 or 4 Children | 41 (100.0%) | 0 (0.0%) |
| 5 or more Children | 0 (0.0%) | 0 (0.0%) |
| Total | 866 (100.0%) | 0 (0.0%) |
Income Below Poverty Among Single-Parent Households in Brittany Farms The Highlands
| Children | Single Father | Single Mother |
| No Children | 0 (0.0%) | 0 (0.0%) |
| 1 or 2 Children | 0 (0.0%) | 0 (0.0%) |
| 3 or 4 Children | 0 (0.0%) | 0 (0.0%) |
| 5 or more Children | 0 (0.0%) | 0 (0.0%) |
| Total | 0 (0.0%) | 0 (0.0%) |
Income Below Poverty Among Married-Couple vs Single-Parent Households in Brittany Farms The Highlands
| Children | Married-Couple Families | Single-Parent Households |
| No Children | 0 (0.0%) | 0 (0.0%) |
| 1 or 2 Children | 0 (0.0%) | 0 (0.0%) |
| 3 or 4 Children | 0 (0.0%) | 0 (0.0%) |
| 5 or more Children | 0 (0.0%) | 0 (0.0%) |
| Total | 0 (0.0%) | 0 (0.0%) |
Race in Brittany Farms The Highlands
The most populous races in Brittany Farms The Highlands are White / Caucasian (3,590 | 83.8%), Black / African American (328 | 7.6%), and Two or more Races (230 | 5.4%).
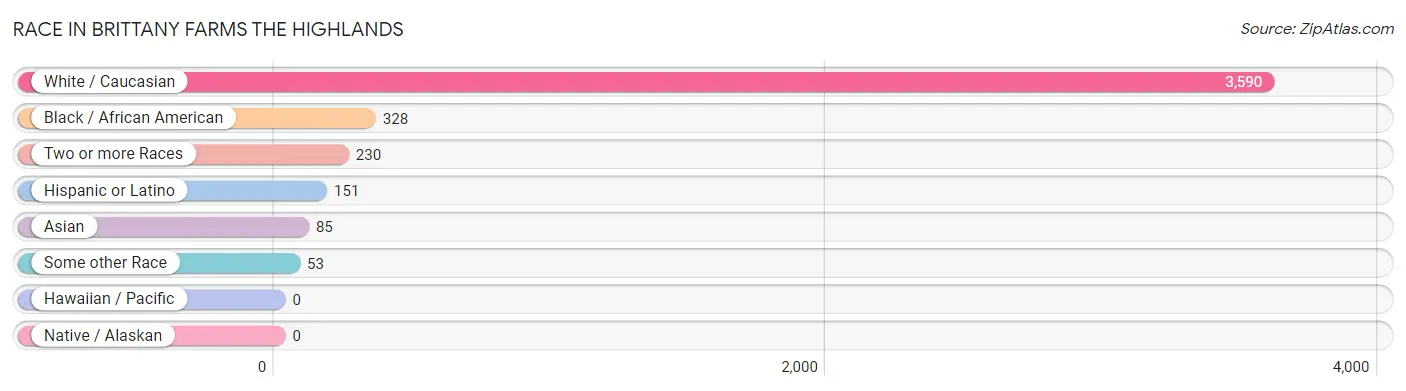
| Race | # Population | % Population |
| Asian | 85 | 2.0% |
| Black / African American | 328 | 7.6% |
| Hawaiian / Pacific | 0 | 0.0% |
| Hispanic or Latino | 151 | 3.5% |
| Native / Alaskan | 0 | 0.0% |
| White / Caucasian | 3,590 | 83.8% |
| Two or more Races | 230 | 5.4% |
| Some other Race | 53 | 1.2% |
| Total | 4,286 | 100.0% |
Ancestry in Brittany Farms The Highlands
The most populous ancestries reported in Brittany Farms The Highlands are Irish (1,274 | 29.7%), Italian (1,000 | 23.3%), German (942 | 22.0%), English (332 | 7.7%), and Polish (223 | 5.2%), together accounting for 88.0% of all Brittany Farms The Highlands residents.
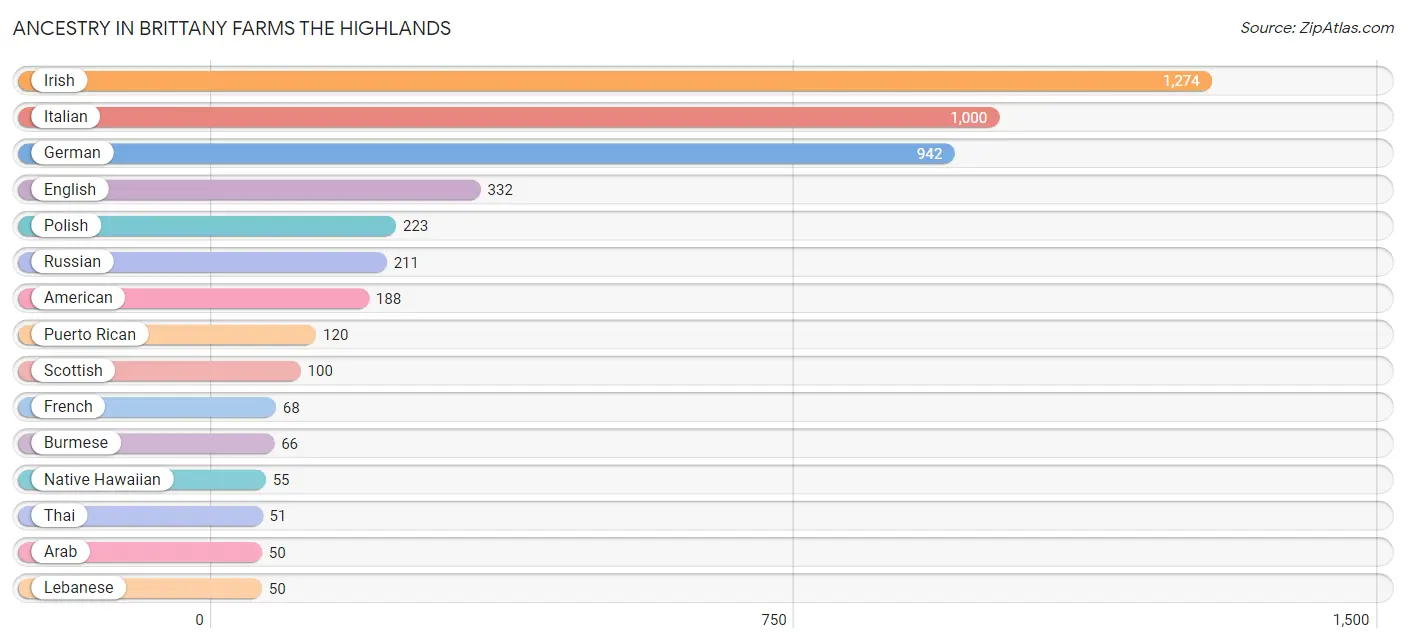
| Ancestry | # Population | % Population |
| American | 188 | 4.4% |
| Arab | 50 | 1.2% |
| Austrian | 35 | 0.8% |
| Belgian | 19 | 0.4% |
| Bhutanese | 45 | 1.1% |
| Burmese | 66 | 1.5% |
| Canadian | 7 | 0.2% |
| Cherokee | 21 | 0.5% |
| Cuban | 9 | 0.2% |
| Danish | 10 | 0.2% |
| Dutch | 18 | 0.4% |
| Eastern European | 37 | 0.9% |
| English | 332 | 7.7% |
| European | 11 | 0.3% |
| Filipino | 20 | 0.5% |
| French | 68 | 1.6% |
| German | 942 | 22.0% |
| Greek | 8 | 0.2% |
| Hungarian | 31 | 0.7% |
| Irish | 1,274 | 29.7% |
| Italian | 1,000 | 23.3% |
| Lebanese | 50 | 1.2% |
| Lithuanian | 35 | 0.8% |
| Mexican | 22 | 0.5% |
| Native Hawaiian | 55 | 1.3% |
| Nigerian | 26 | 0.6% |
| Northern European | 9 | 0.2% |
| Norwegian | 17 | 0.4% |
| Pennsylvania German | 12 | 0.3% |
| Polish | 223 | 5.2% |
| Portuguese | 35 | 0.8% |
| Puerto Rican | 120 | 2.8% |
| Russian | 211 | 4.9% |
| Scandinavian | 26 | 0.6% |
| Scottish | 100 | 2.3% |
| Slovak | 12 | 0.3% |
| Subsaharan African | 36 | 0.8% |
| Swedish | 16 | 0.4% |
| Thai | 51 | 1.2% |
| Welsh | 41 | 1.0% | View All 40 Rows |
Immigrants in Brittany Farms The Highlands
The most numerous immigrant groups reported in Brittany Farms The Highlands came from Caribbean (115 | 2.7%), Latin America (115 | 2.7%), Trinidad and Tobago (115 | 2.7%), Europe (60 | 1.4%), and Asia (54 | 1.3%), together accounting for 10.7% of all Brittany Farms The Highlands residents.
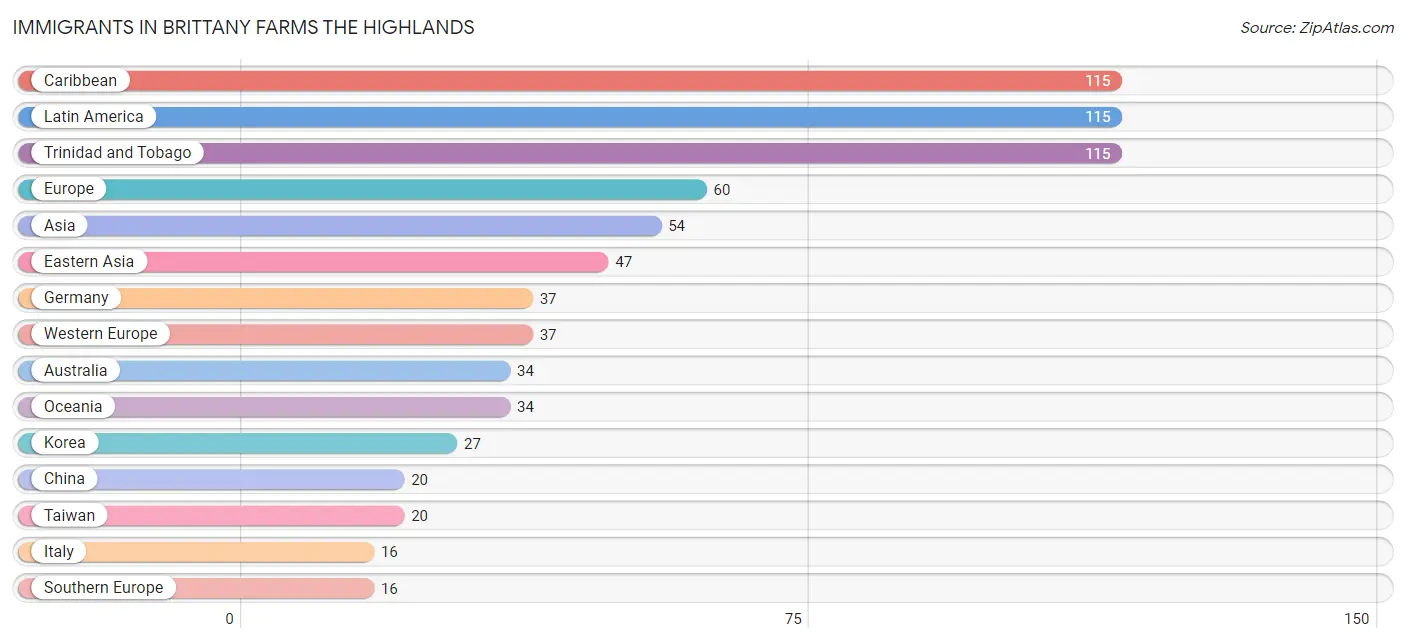
| Immigration Origin | # Population | % Population |
| Asia | 54 | 1.3% |
| Australia | 34 | 0.8% |
| Canada | 7 | 0.2% |
| Caribbean | 115 | 2.7% |
| China | 20 | 0.5% |
| Eastern Asia | 47 | 1.1% |
| Eastern Europe | 7 | 0.2% |
| Europe | 60 | 1.4% |
| Germany | 37 | 0.9% |
| Italy | 16 | 0.4% |
| Korea | 27 | 0.6% |
| Latin America | 115 | 2.7% |
| Malaysia | 7 | 0.2% |
| Oceania | 34 | 0.8% |
| Poland | 7 | 0.2% |
| South Eastern Asia | 7 | 0.2% |
| Southern Europe | 16 | 0.4% |
| Taiwan | 20 | 0.5% |
| Trinidad and Tobago | 115 | 2.7% |
| Western Europe | 37 | 0.9% | View All 20 Rows |
Sex and Age in Brittany Farms The Highlands
Sex and Age in Brittany Farms The Highlands
The most populous age groups in Brittany Farms The Highlands are 55 to 59 Years (230 | 11.2%) for men and 20 to 24 Years (214 | 9.6%) for women.
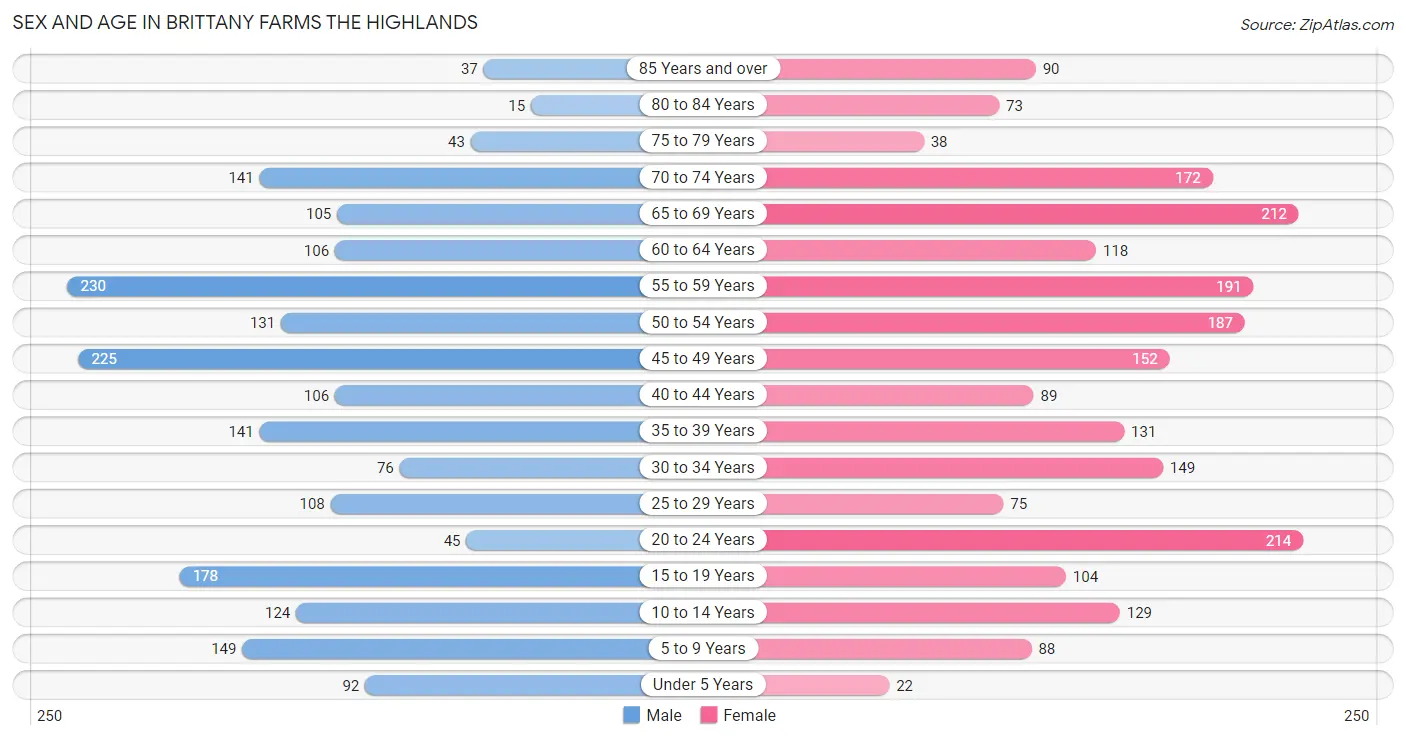
| Age Bracket | Male | Female |
| Under 5 Years | 92 (4.5%) | 22 (1.0%) |
| 5 to 9 Years | 149 (7.3%) | 88 (3.9%) |
| 10 to 14 Years | 124 (6.0%) | 129 (5.8%) |
| 15 to 19 Years | 178 (8.7%) | 104 (4.7%) |
| 20 to 24 Years | 45 (2.2%) | 214 (9.6%) |
| 25 to 29 Years | 108 (5.3%) | 75 (3.4%) |
| 30 to 34 Years | 76 (3.7%) | 149 (6.7%) |
| 35 to 39 Years | 141 (6.9%) | 131 (5.9%) |
| 40 to 44 Years | 106 (5.2%) | 89 (4.0%) |
| 45 to 49 Years | 225 (11.0%) | 152 (6.8%) |
| 50 to 54 Years | 131 (6.4%) | 187 (8.4%) |
| 55 to 59 Years | 230 (11.2%) | 191 (8.6%) |
| 60 to 64 Years | 106 (5.2%) | 118 (5.3%) |
| 65 to 69 Years | 105 (5.1%) | 212 (9.5%) |
| 70 to 74 Years | 141 (6.9%) | 172 (7.7%) |
| 75 to 79 Years | 43 (2.1%) | 38 (1.7%) |
| 80 to 84 Years | 15 (0.7%) | 73 (3.3%) |
| 85 Years and over | 37 (1.8%) | 90 (4.0%) |
| Total | 2,052 (100.0%) | 2,234 (100.0%) |
Families and Households in Brittany Farms The Highlands
Median Family Size in Brittany Farms The Highlands
The median family size in Brittany Farms The Highlands is 2.98 persons per family, with married-couple families (866 | 74.0%) accounting for the largest median family size of 3.02 persons per family. On the other hand, single male/father families (59 | 5.0%) represent the smallest median family size with 2.47 persons per family.
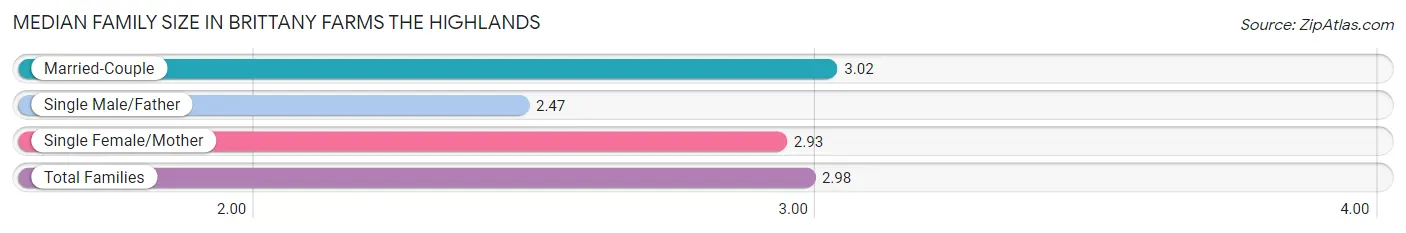
| Family Type | # Families | Family Size |
| Married-Couple | 866 (74.0%) | 3.02 |
| Single Male/Father | 59 (5.0%) | 2.47 |
| Single Female/Mother | 245 (20.9%) | 2.93 |
| Total Families | 1,170 (100.0%) | 2.98 |
Median Household Size in Brittany Farms The Highlands
The median household size in Brittany Farms The Highlands is 2.42 persons per household, with single female/mother households (245 | 13.8%) accounting for the largest median household size of 3.17 persons per household. non-family households (602 | 34.0%) represent the smallest median household size with 1.24 persons per household.
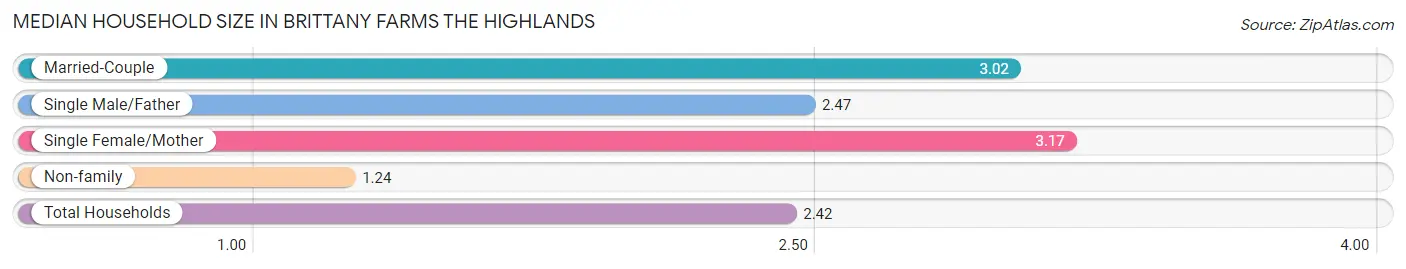
| Household Type | # Households | Household Size |
| Married-Couple | 866 (48.9%) | 3.02 |
| Single Male/Father | 59 (3.3%) | 2.47 |
| Single Female/Mother | 245 (13.8%) | 3.17 |
| Non-family | 602 (34.0%) | 1.24 |
| Total Households | 1,772 (100.0%) | 2.42 |
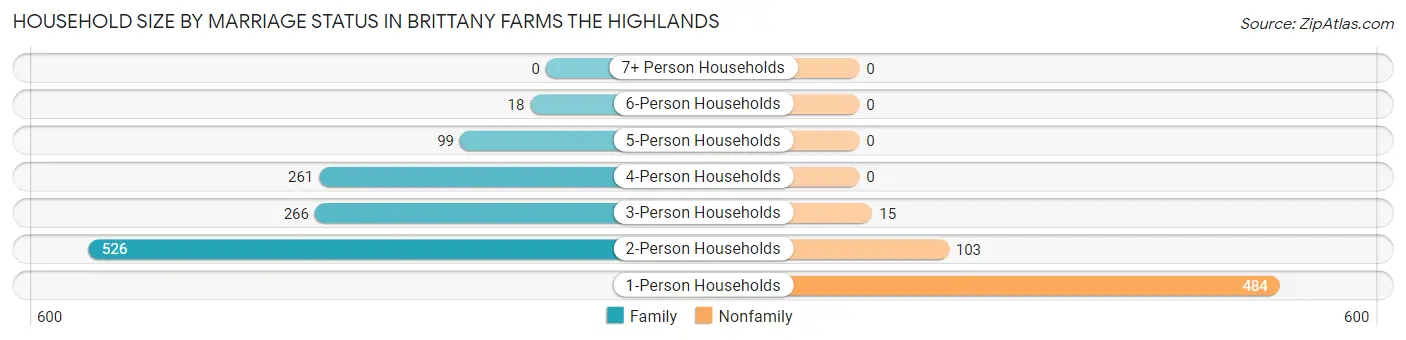
Household Size by Marriage Status in Brittany Farms The Highlands
Out of a total of 1,772 households in Brittany Farms The Highlands, 1,170 (66.0%) are family households, while 602 (34.0%) are nonfamily households. The most numerous type of family households are 2-person households, comprising 526, and the most common type of nonfamily households are 1-person households, comprising 484.
| Household Size | Family Households | Nonfamily Households |
| 1-Person Households | - | 484 (27.3%) |
| 2-Person Households | 526 (29.7%) | 103 (5.8%) |
| 3-Person Households | 266 (15.0%) | 15 (0.9%) |
| 4-Person Households | 261 (14.7%) | 0 (0.0%) |
| 5-Person Households | 99 (5.6%) | 0 (0.0%) |
| 6-Person Households | 18 (1.0%) | 0 (0.0%) |
| 7+ Person Households | 0 (0.0%) | 0 (0.0%) |
| Total | 1,170 (66.0%) | 602 (34.0%) |
Female Fertility in Brittany Farms The Highlands
Fertility by Age in Brittany Farms The Highlands
| Age Bracket | Women with Births | Births / 1,000 Women |
| 15 to 19 years | 0 (0.0%) | 0.0 |
| 20 to 34 years | 0 (0.0%) | 0.0 |
| 35 to 50 years | 0 (0.0%) | 0.0 |
| Total | 0 (0.0%) | 0.0 |
Fertility by Age by Marriage Status in Brittany Farms The Highlands
| Age Bracket | Married | Unmarried |
| 15 to 19 years | 0 (0.0%) | 0 (0.0%) |
| 20 to 34 years | 0 (0.0%) | 0 (0.0%) |
| 35 to 50 years | 0 (0.0%) | 0 (0.0%) |
| Total | 0 (0.0%) | 0 (0.0%) |
Fertility by Education in Brittany Farms The Highlands
| Educational Attainment | Women with Births | Births / 1,000 Women |
| Less than High School | 0 (0.0%) | 0.0 |
| High School Diploma | 0 (0.0%) | 0.0 |
| College or Associate's Degree | 0 (0.0%) | 0.0 |
| Bachelor's Degree | 0 (0.0%) | 0.0 |
| Graduate Degree | 0 (0.0%) | 0.0 |
| Total | 0 (0.0%) | 0.0 |
Fertility by Education by Marriage Status in Brittany Farms The Highlands
| Educational Attainment | Married | Unmarried |
| Less than High School | 0 (0.0%) | 0 (0.0%) |
| High School Diploma | 0 (0.0%) | 0 (0.0%) |
| College or Associate's Degree | 0 (0.0%) | 0 (0.0%) |
| Bachelor's Degree | 0 (0.0%) | 0 (0.0%) |
| Graduate Degree | 0 (0.0%) | 0 (0.0%) |
| Total | 0 (0.0%) | 0 (0.0%) |
Employment Characteristics in Brittany Farms The Highlands
Employment by Class of Employer in Brittany Farms The Highlands
Among the 2,429 employed individuals in Brittany Farms The Highlands, private company employees (1,581 | 65.1%), not-for-profit organizations (225 | 9.3%), and local government employees (194 | 8.0%) make up the most common classes of employment.
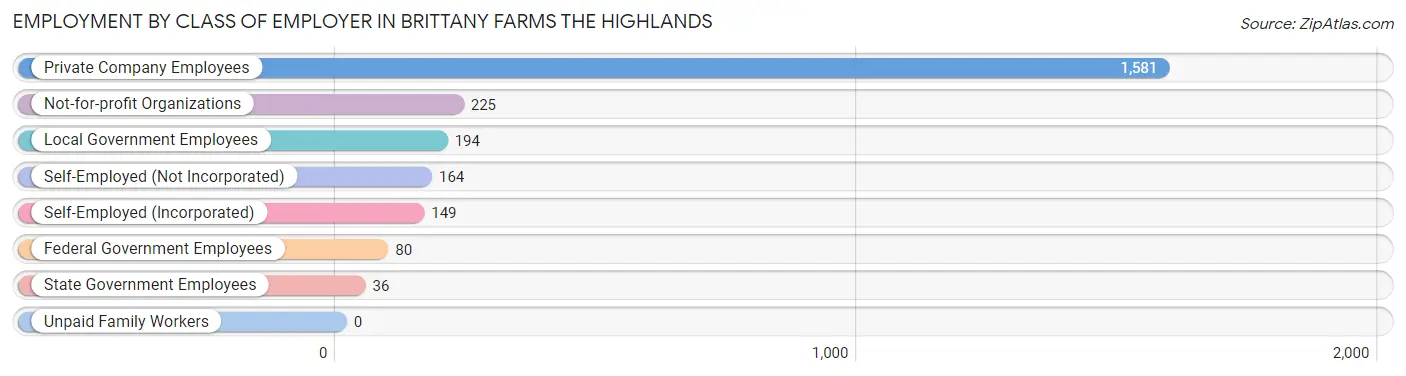
| Employer Class | # Employees | % Employees |
| Private Company Employees | 1,581 | 65.1% |
| Self-Employed (Incorporated) | 149 | 6.1% |
| Self-Employed (Not Incorporated) | 164 | 6.8% |
| Not-for-profit Organizations | 225 | 9.3% |
| Local Government Employees | 194 | 8.0% |
| State Government Employees | 36 | 1.5% |
| Federal Government Employees | 80 | 3.3% |
| Unpaid Family Workers | 0 | 0.0% |
| Total | 2,429 | 100.0% |
Employment Status by Age in Brittany Farms The Highlands
According to the labor force statistics for Brittany Farms The Highlands, out of the total population over 16 years of age (3,638), 71.5% or 2,601 individuals are in the labor force, with 5.8% or 151 of them unemployed. The age group with the highest labor force participation rate is 35 to 44 years, with 93.4% or 436 individuals in the labor force. Within the labor force, the 16 to 19 years age range has the highest percentage of unemployed individuals, with 23.2% or 26 of them being unemployed.
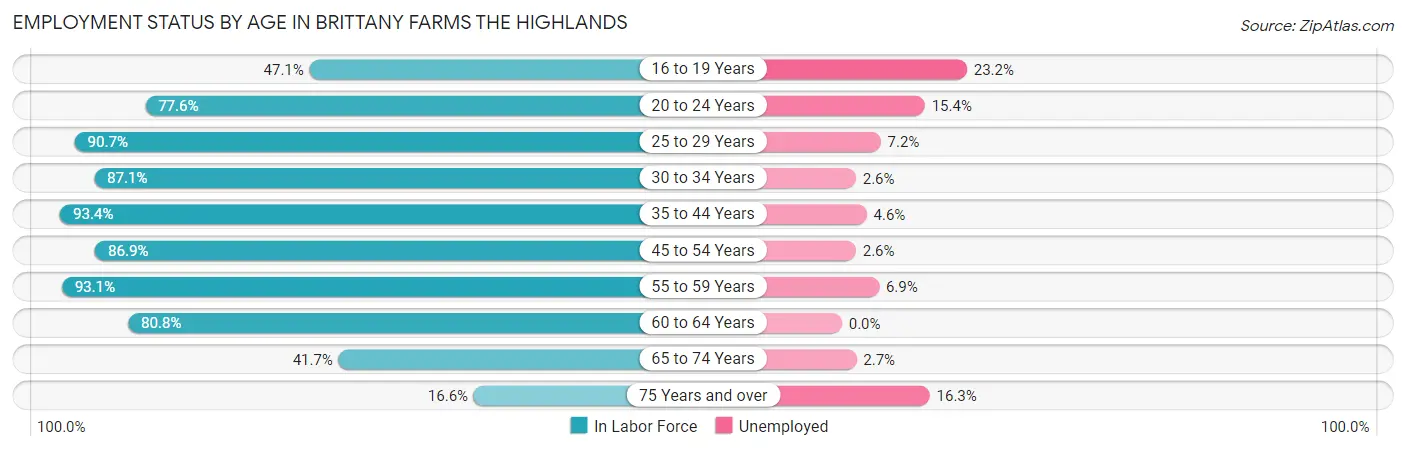
| Age Bracket | In Labor Force | Unemployed |
| 16 to 19 Years | 112 (47.1%) | 26 (23.2%) |
| 20 to 24 Years | 201 (77.6%) | 31 (15.4%) |
| 25 to 29 Years | 166 (90.7%) | 12 (7.2%) |
| 30 to 34 Years | 196 (87.1%) | 5 (2.6%) |
| 35 to 44 Years | 436 (93.4%) | 20 (4.6%) |
| 45 to 54 Years | 604 (86.9%) | 16 (2.6%) |
| 55 to 59 Years | 392 (93.1%) | 27 (6.9%) |
| 60 to 64 Years | 181 (80.8%) | 0 (0.0%) |
| 65 to 74 Years | 263 (41.7%) | 7 (2.7%) |
| 75 Years and over | 49 (16.6%) | 8 (16.3%) |
| Total | 2,601 (71.5%) | 151 (5.8%) |
Employment Status by Educational Attainment in Brittany Farms The Highlands
According to labor force statistics for Brittany Farms The Highlands, 89.2% of individuals (1,976) out of the total population between 25 and 64 years of age (2,215) are in the labor force, with 4.1% or 81 of them being unemployed. The group with the highest labor force participation rate are those with the educational attainment of bachelor's degree or higher, with 93.6% or 1,118 individuals in the labor force. Within the labor force, individuals with bachelor's degree or higher education have the highest percentage of unemployment, with 4.9% or 55 of them being unemployed.
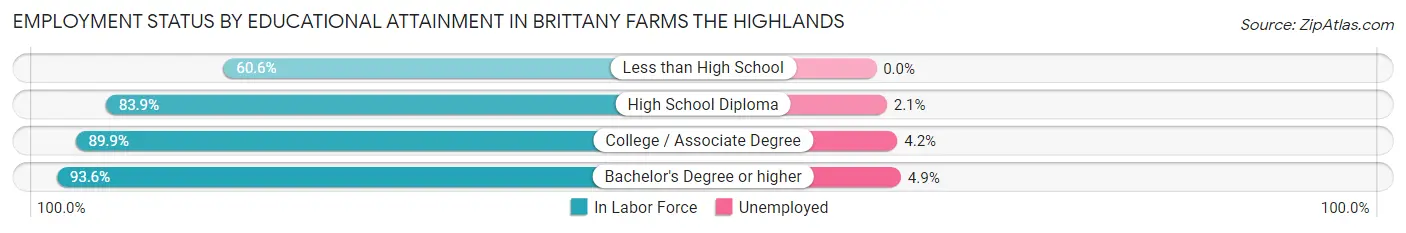
| Educational Attainment | In Labor Force | Unemployed |
| Less than High School | 66 (60.6%) | 0 (0.0%) |
| High School Diploma | 390 (83.9%) | 10 (2.1%) |
| College / Associate Degree | 402 (89.9%) | 19 (4.2%) |
| Bachelor's Degree or higher | 1,118 (93.6%) | 59 (4.9%) |
| Total | 1,976 (89.2%) | 91 (4.1%) |
Employment Occupations by Sex in Brittany Farms The Highlands
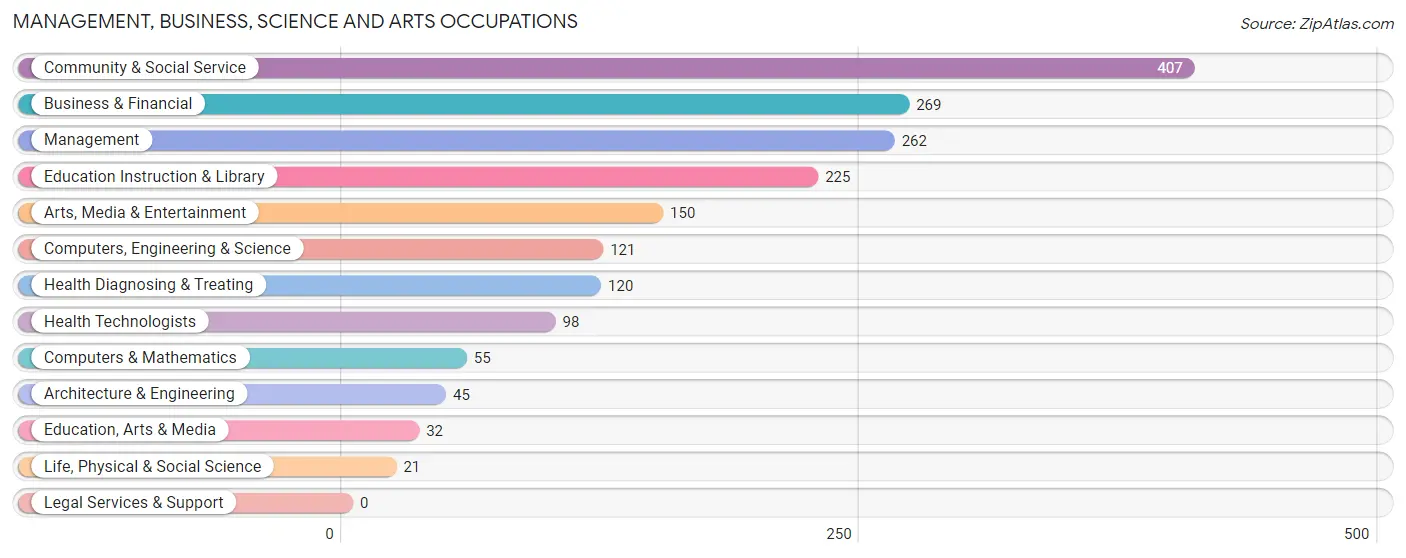
Management, Business, Science and Arts Occupations
The most common Management, Business, Science and Arts occupations in Brittany Farms The Highlands are Community & Social Service (407 | 16.6%), Business & Financial (269 | 11.0%), Management (262 | 10.7%), Education Instruction & Library (225 | 9.2%), and Arts, Media & Entertainment (150 | 6.1%).
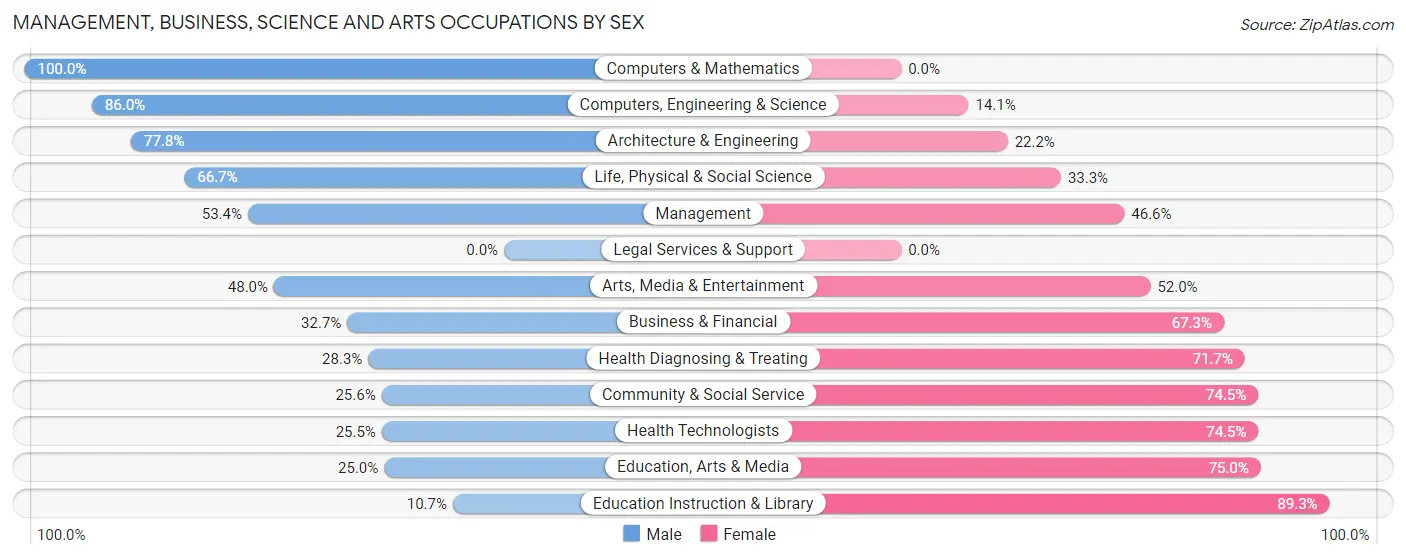
Management, Business, Science and Arts Occupations by Sex
Within the Management, Business, Science and Arts occupations in Brittany Farms The Highlands, the most male-oriented occupations are Computers & Mathematics (100.0%), Computers, Engineering & Science (86.0%), and Architecture & Engineering (77.8%), while the most female-oriented occupations are Education Instruction & Library (89.3%), Education, Arts & Media (75.0%), and Health Technologists (74.5%).
| Occupation | Male | Female |
| Management | 140 (53.4%) | 122 (46.6%) |
| Business & Financial | 88 (32.7%) | 181 (67.3%) |
| Computers, Engineering & Science | 104 (86.0%) | 17 (14.1%) |
| Computers & Mathematics | 55 (100.0%) | 0 (0.0%) |
| Architecture & Engineering | 35 (77.8%) | 10 (22.2%) |
| Life, Physical & Social Science | 14 (66.7%) | 7 (33.3%) |
| Community & Social Service | 104 (25.6%) | 303 (74.5%) |
| Education, Arts & Media | 8 (25.0%) | 24 (75.0%) |
| Legal Services & Support | 0 (0.0%) | 0 (0.0%) |
| Education Instruction & Library | 24 (10.7%) | 201 (89.3%) |
| Arts, Media & Entertainment | 72 (48.0%) | 78 (52.0%) |
| Health Diagnosing & Treating | 34 (28.3%) | 86 (71.7%) |
| Health Technologists | 25 (25.5%) | 73 (74.5%) |
| Total (Category) | 470 (39.9%) | 709 (60.1%) |
| Total (Overall) | 1,222 (49.9%) | 1,226 (50.1%) |
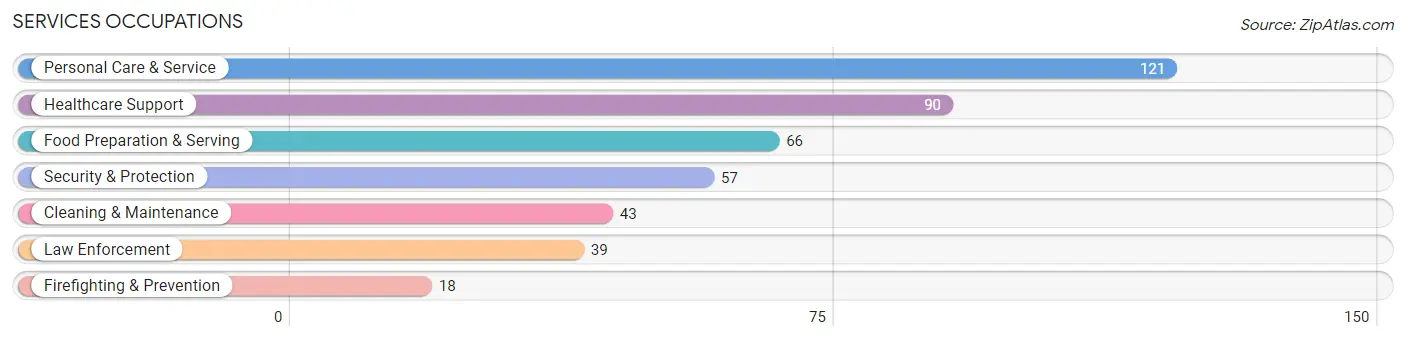
Services Occupations
The most common Services occupations in Brittany Farms The Highlands are Personal Care & Service (121 | 4.9%), Healthcare Support (90 | 3.7%), Food Preparation & Serving (66 | 2.7%), Security & Protection (57 | 2.3%), and Cleaning & Maintenance (43 | 1.8%).
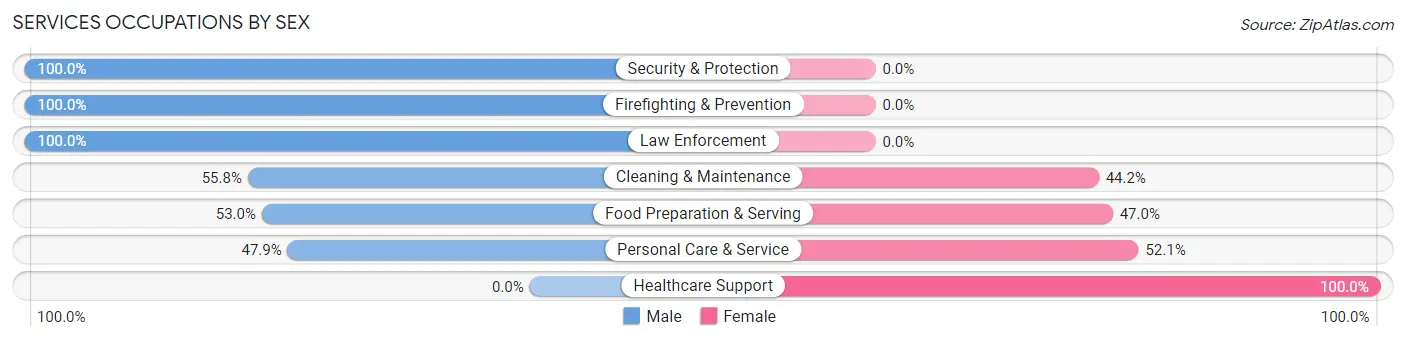
Services Occupations by Sex
Within the Services occupations in Brittany Farms The Highlands, the most male-oriented occupations are Security & Protection (100.0%), Firefighting & Prevention (100.0%), and Law Enforcement (100.0%), while the most female-oriented occupations are Healthcare Support (100.0%), Personal Care & Service (52.1%), and Food Preparation & Serving (47.0%).
| Occupation | Male | Female |
| Healthcare Support | 0 (0.0%) | 90 (100.0%) |
| Security & Protection | 57 (100.0%) | 0 (0.0%) |
| Firefighting & Prevention | 18 (100.0%) | 0 (0.0%) |
| Law Enforcement | 39 (100.0%) | 0 (0.0%) |
| Food Preparation & Serving | 35 (53.0%) | 31 (47.0%) |
| Cleaning & Maintenance | 24 (55.8%) | 19 (44.2%) |
| Personal Care & Service | 58 (47.9%) | 63 (52.1%) |
| Total (Category) | 174 (46.2%) | 203 (53.8%) |
| Total (Overall) | 1,222 (49.9%) | 1,226 (50.1%) |
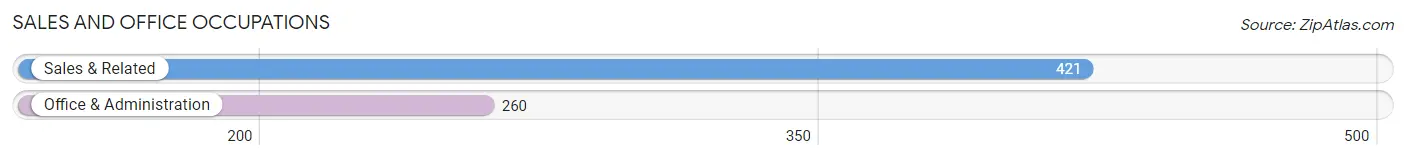
Sales and Office Occupations
The most common Sales and Office occupations in Brittany Farms The Highlands are Sales & Related (421 | 17.2%), and Office & Administration (260 | 10.6%).
Sales and Office Occupations by Sex
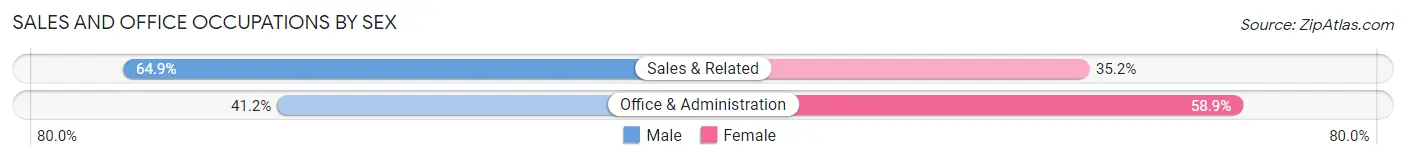
| Occupation | Male | Female |
| Sales & Related | 273 (64.8%) | 148 (35.1%) |
| Office & Administration | 107 (41.1%) | 153 (58.9%) |
| Total (Category) | 380 (55.8%) | 301 (44.2%) |
| Total (Overall) | 1,222 (49.9%) | 1,226 (50.1%) |
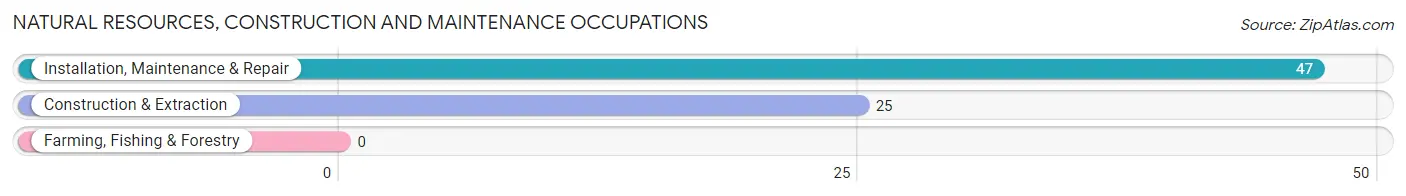
Natural Resources, Construction and Maintenance Occupations
The most common Natural Resources, Construction and Maintenance occupations in Brittany Farms The Highlands are Installation, Maintenance & Repair (47 | 1.9%), and Construction & Extraction (25 | 1.0%).
Natural Resources, Construction and Maintenance Occupations by Sex
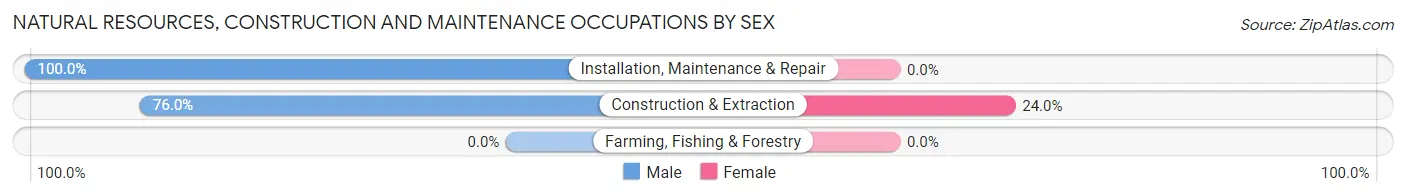
| Occupation | Male | Female |
| Farming, Fishing & Forestry | 0 (0.0%) | 0 (0.0%) |
| Construction & Extraction | 19 (76.0%) | 6 (24.0%) |
| Installation, Maintenance & Repair | 47 (100.0%) | 0 (0.0%) |
| Total (Category) | 66 (91.7%) | 6 (8.3%) |
| Total (Overall) | 1,222 (49.9%) | 1,226 (50.1%) |
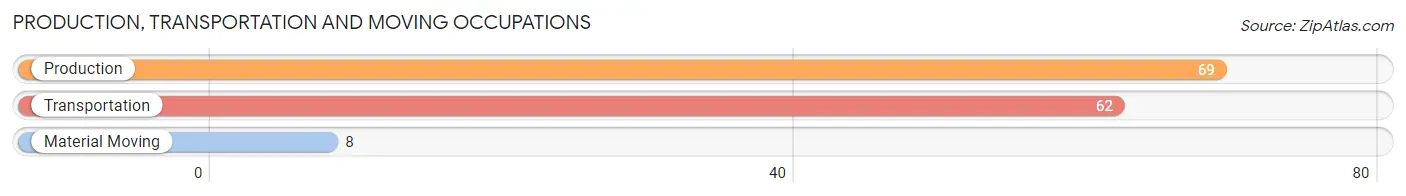
Production, Transportation and Moving Occupations
The most common Production, Transportation and Moving occupations in Brittany Farms The Highlands are Production (69 | 2.8%), Transportation (62 | 2.5%), and Material Moving (8 | 0.3%).
Production, Transportation and Moving Occupations by Sex
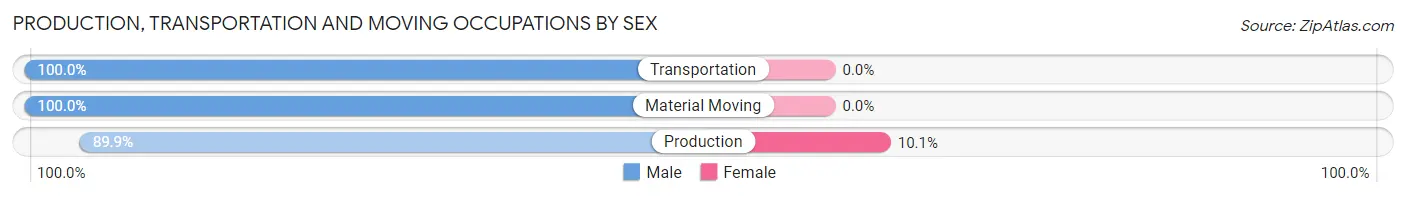
| Occupation | Male | Female |
| Production | 62 (89.9%) | 7 (10.1%) |
| Transportation | 62 (100.0%) | 0 (0.0%) |
| Material Moving | 8 (100.0%) | 0 (0.0%) |
| Total (Category) | 132 (95.0%) | 7 (5.0%) |
| Total (Overall) | 1,222 (49.9%) | 1,226 (50.1%) |
Employment Industries by Sex in Brittany Farms The Highlands
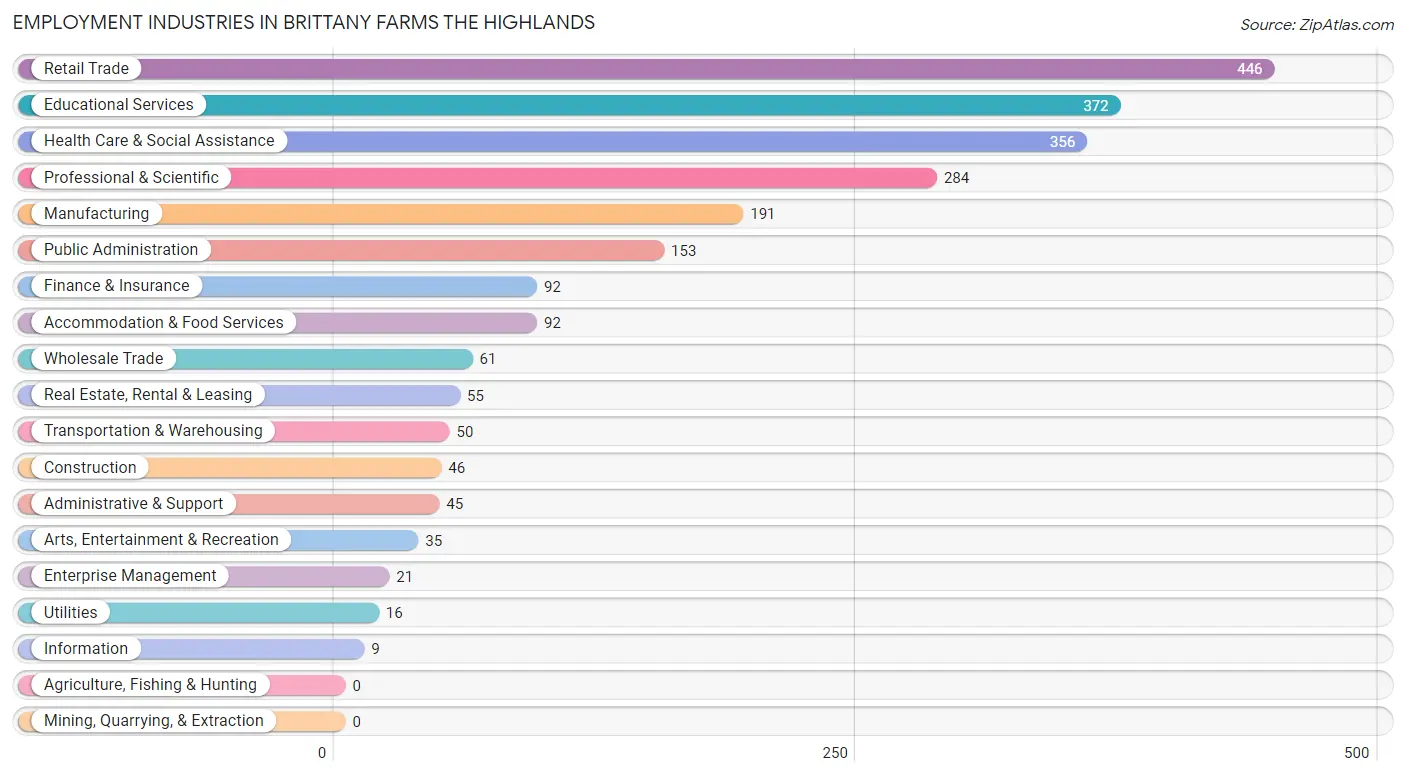
Employment Industries in Brittany Farms The Highlands
The major employment industries in Brittany Farms The Highlands include Retail Trade (446 | 18.2%), Educational Services (372 | 15.2%), Health Care & Social Assistance (356 | 14.5%), Professional & Scientific (284 | 11.6%), and Manufacturing (191 | 7.8%).
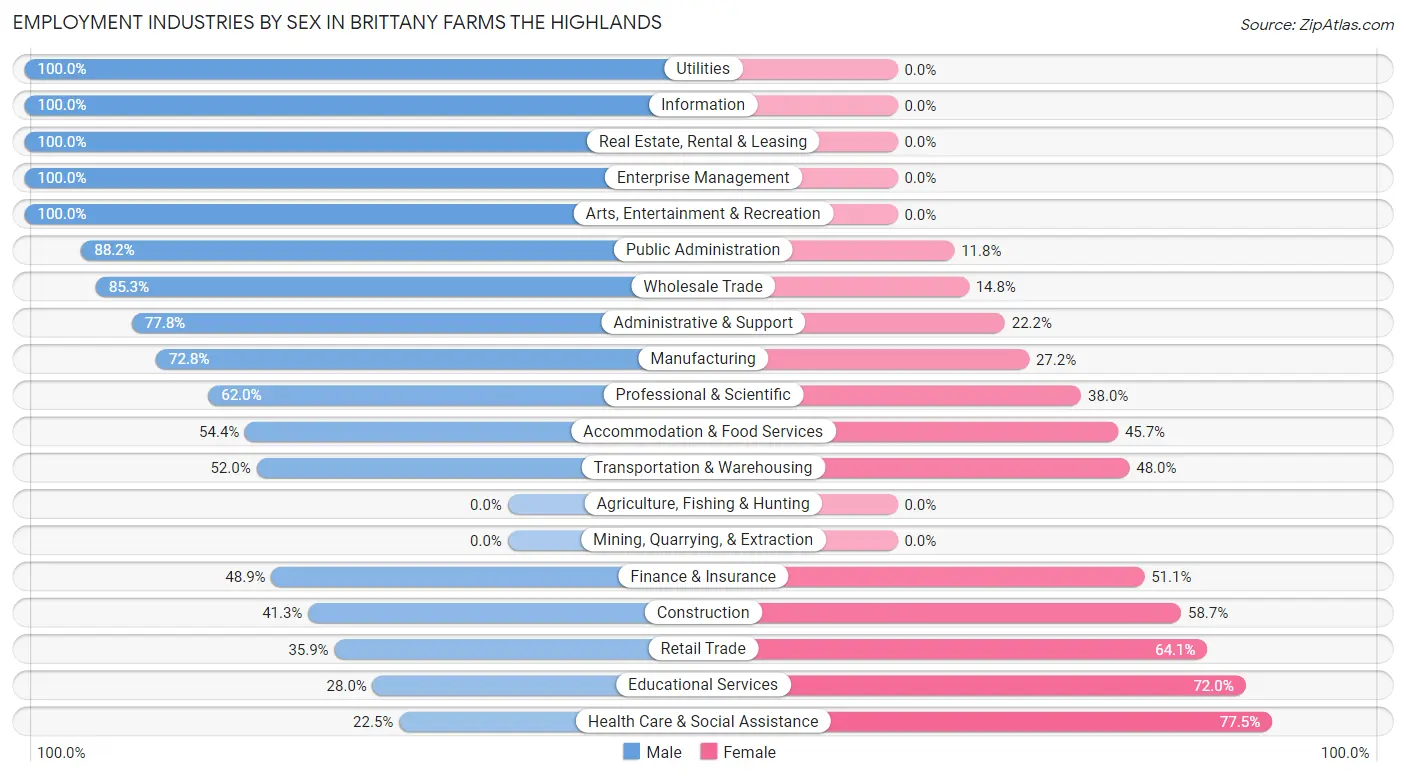
Employment Industries by Sex in Brittany Farms The Highlands
The Brittany Farms The Highlands industries that see more men than women are Utilities (100.0%), Information (100.0%), and Real Estate, Rental & Leasing (100.0%), whereas the industries that tend to have a higher number of women are Health Care & Social Assistance (77.5%), Educational Services (72.0%), and Retail Trade (64.1%).
| Industry | Male | Female |
| Agriculture, Fishing & Hunting | 0 (0.0%) | 0 (0.0%) |
| Mining, Quarrying, & Extraction | 0 (0.0%) | 0 (0.0%) |
| Construction | 19 (41.3%) | 27 (58.7%) |
| Manufacturing | 139 (72.8%) | 52 (27.2%) |
| Wholesale Trade | 52 (85.3%) | 9 (14.7%) |
| Retail Trade | 160 (35.9%) | 286 (64.1%) |
| Transportation & Warehousing | 26 (52.0%) | 24 (48.0%) |
| Utilities | 16 (100.0%) | 0 (0.0%) |
| Information | 9 (100.0%) | 0 (0.0%) |
| Finance & Insurance | 45 (48.9%) | 47 (51.1%) |
| Real Estate, Rental & Leasing | 55 (100.0%) | 0 (0.0%) |
| Professional & Scientific | 176 (62.0%) | 108 (38.0%) |
| Enterprise Management | 21 (100.0%) | 0 (0.0%) |
| Administrative & Support | 35 (77.8%) | 10 (22.2%) |
| Educational Services | 104 (28.0%) | 268 (72.0%) |
| Health Care & Social Assistance | 80 (22.5%) | 276 (77.5%) |
| Arts, Entertainment & Recreation | 35 (100.0%) | 0 (0.0%) |
| Accommodation & Food Services | 50 (54.3%) | 42 (45.7%) |
| Public Administration | 135 (88.2%) | 18 (11.8%) |
| Total | 1,222 (49.9%) | 1,226 (50.1%) |
Education in Brittany Farms The Highlands
School Enrollment in Brittany Farms The Highlands
The most common levels of schooling among the 969 students in Brittany Farms The Highlands are college / undergraduate (281 | 29.0%), elementary school (228 | 23.5%), and high school (171 | 17.6%).
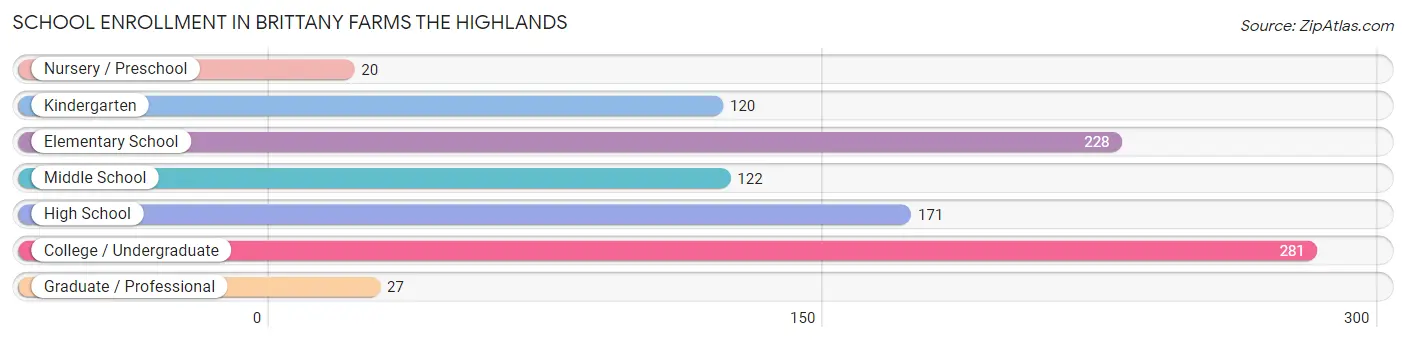
| School Level | # Students | % Students |
| Nursery / Preschool | 20 | 2.1% |
| Kindergarten | 120 | 12.4% |
| Elementary School | 228 | 23.5% |
| Middle School | 122 | 12.6% |
| High School | 171 | 17.6% |
| College / Undergraduate | 281 | 29.0% |
| Graduate / Professional | 27 | 2.8% |
| Total | 969 | 100.0% |
School Enrollment by Age by Funding Source in Brittany Farms The Highlands
Out of a total of 969 students who are enrolled in schools in Brittany Farms The Highlands, 274 (28.3%) attend a private institution, while the remaining 695 (71.7%) are enrolled in public schools. The age group of 25 to 34 year olds has the highest likelihood of being enrolled in private schools, with 44 (72.1% in the age bracket) enrolled. Conversely, the age group of 3 to 4 year olds has the lowest likelihood of being enrolled in a private school, with 8 (100.0% in the age bracket) attending a public institution.
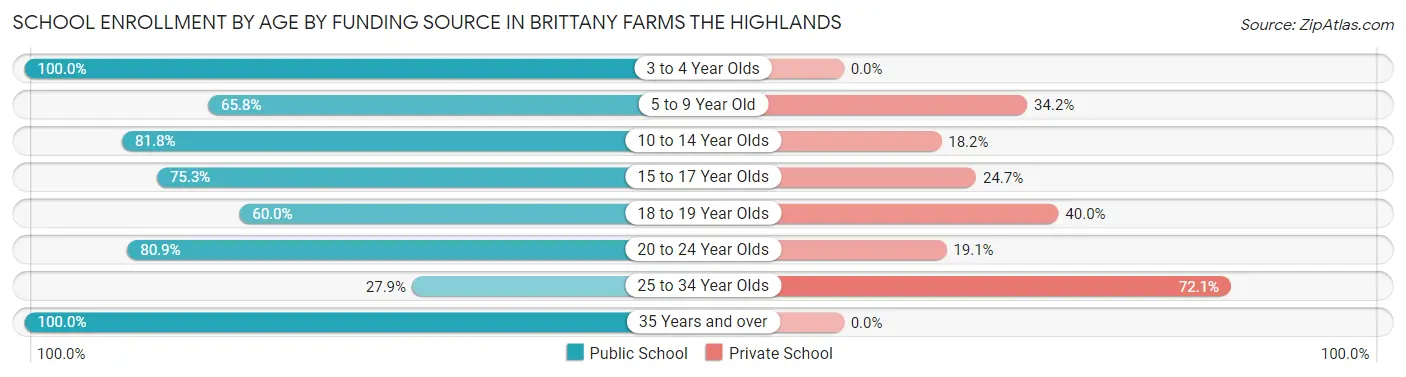
| Age Bracket | Public School | Private School |
| 3 to 4 Year Olds | 8 (100.0%) | 0 (0.0%) |
| 5 to 9 Year Old | 156 (65.8%) | 81 (34.2%) |
| 10 to 14 Year Olds | 207 (81.8%) | 46 (18.2%) |
| 15 to 17 Year Olds | 110 (75.3%) | 36 (24.7%) |
| 18 to 19 Year Olds | 54 (60.0%) | 36 (40.0%) |
| 20 to 24 Year Olds | 131 (80.9%) | 31 (19.1%) |
| 25 to 34 Year Olds | 17 (27.9%) | 44 (72.1%) |
| 35 Years and over | 12 (100.0%) | 0 (0.0%) |
| Total | 695 (71.7%) | 274 (28.3%) |
Educational Attainment by Field of Study in Brittany Farms The Highlands
Business (400 | 26.6%), education (244 | 16.2%), social sciences (152 | 10.1%), science & technology (134 | 8.9%), and arts & humanities (94 | 6.2%) are the most common fields of study among 1,503 individuals in Brittany Farms The Highlands who have obtained a bachelor's degree or higher.
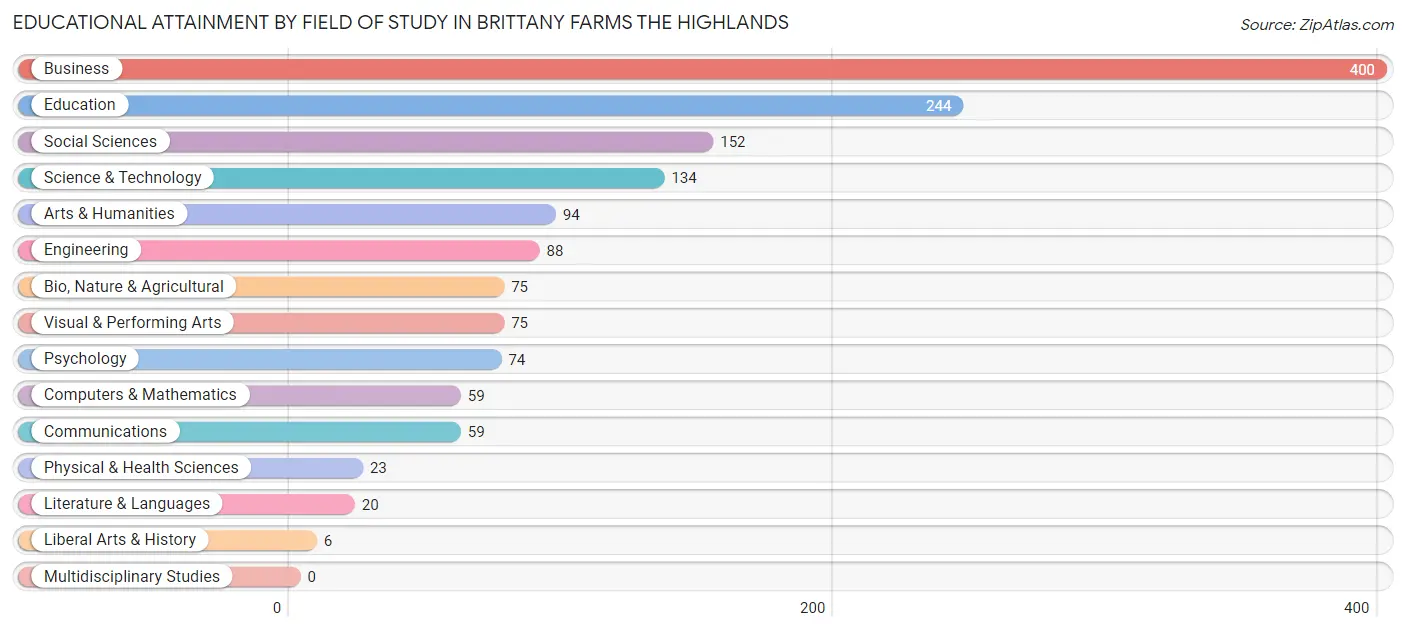
| Field of Study | # Graduates | % Graduates |
| Computers & Mathematics | 59 | 3.9% |
| Bio, Nature & Agricultural | 75 | 5.0% |
| Physical & Health Sciences | 23 | 1.5% |
| Psychology | 74 | 4.9% |
| Social Sciences | 152 | 10.1% |
| Engineering | 88 | 5.9% |
| Multidisciplinary Studies | 0 | 0.0% |
| Science & Technology | 134 | 8.9% |
| Business | 400 | 26.6% |
| Education | 244 | 16.2% |
| Literature & Languages | 20 | 1.3% |
| Liberal Arts & History | 6 | 0.4% |
| Visual & Performing Arts | 75 | 5.0% |
| Communications | 59 | 3.9% |
| Arts & Humanities | 94 | 6.2% |
| Total | 1,503 | 100.0% |
Transportation & Commute in Brittany Farms The Highlands
Vehicle Availability by Sex in Brittany Farms The Highlands
The most prevalent vehicle ownership categories in Brittany Farms The Highlands are males with 2 vehicles (605, accounting for 50.3%) and females with 2 vehicles (467, making up 49.3%).
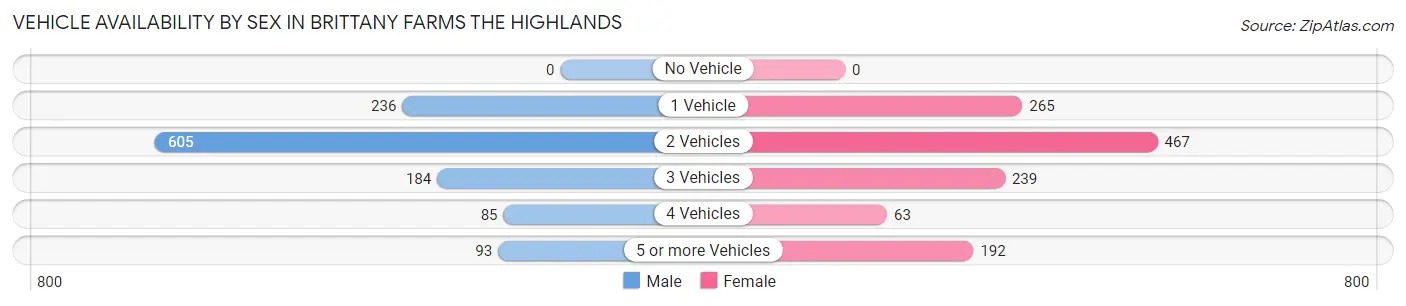
| Vehicles Available | Male | Female |
| No Vehicle | 0 (0.0%) | 0 (0.0%) |
| 1 Vehicle | 236 (19.6%) | 265 (21.6%) |
| 2 Vehicles | 605 (50.3%) | 467 (38.1%) |
| 3 Vehicles | 184 (15.3%) | 239 (19.5%) |
| 4 Vehicles | 85 (7.1%) | 63 (5.1%) |
| 5 or more Vehicles | 93 (7.7%) | 192 (15.7%) |
| Total | 1,203 (100.0%) | 1,226 (100.0%) |
Commute Time in Brittany Farms The Highlands
The most frequently occuring commute durations in Brittany Farms The Highlands are 15 to 19 minutes (434 commuters, 21.7%), 30 to 34 minutes (320 commuters, 16.0%), and 10 to 14 minutes (254 commuters, 12.7%).
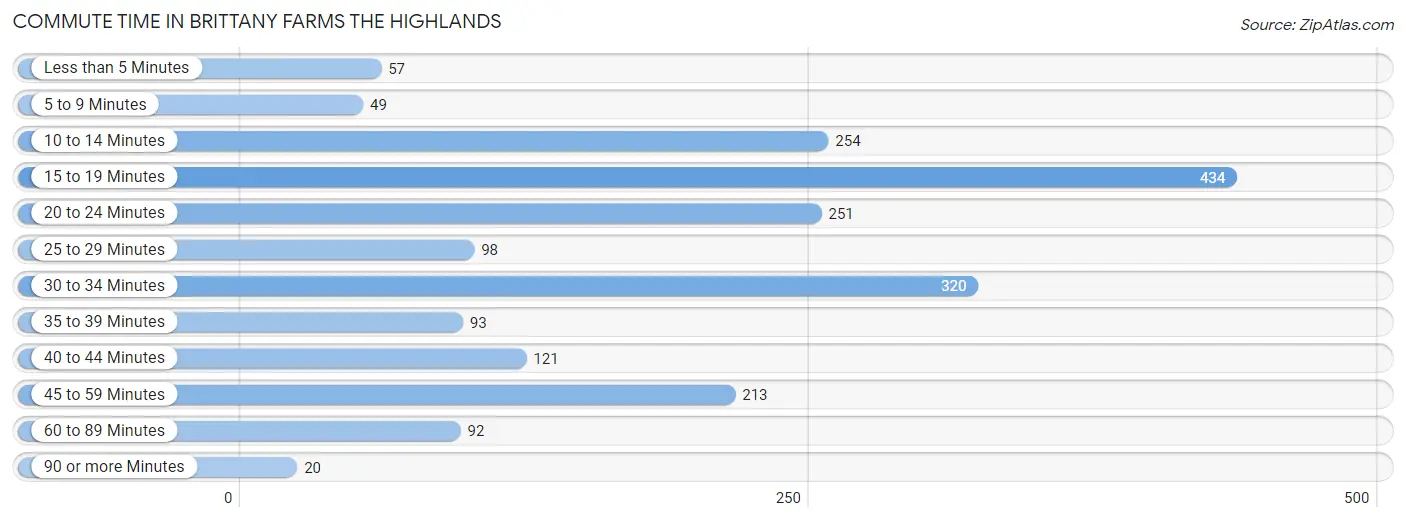
| Commute Time | # Commuters | % Commuters |
| Less than 5 Minutes | 57 | 2.9% |
| 5 to 9 Minutes | 49 | 2.5% |
| 10 to 14 Minutes | 254 | 12.7% |
| 15 to 19 Minutes | 434 | 21.7% |
| 20 to 24 Minutes | 251 | 12.5% |
| 25 to 29 Minutes | 98 | 4.9% |
| 30 to 34 Minutes | 320 | 16.0% |
| 35 to 39 Minutes | 93 | 4.6% |
| 40 to 44 Minutes | 121 | 6.0% |
| 45 to 59 Minutes | 213 | 10.6% |
| 60 to 89 Minutes | 92 | 4.6% |
| 90 or more Minutes | 20 | 1.0% |
Commute Time by Sex in Brittany Farms The Highlands
The most common commute times in Brittany Farms The Highlands are 30 to 34 minutes (252 commuters, 26.7%) for males and 15 to 19 minutes (310 commuters, 29.3%) for females.
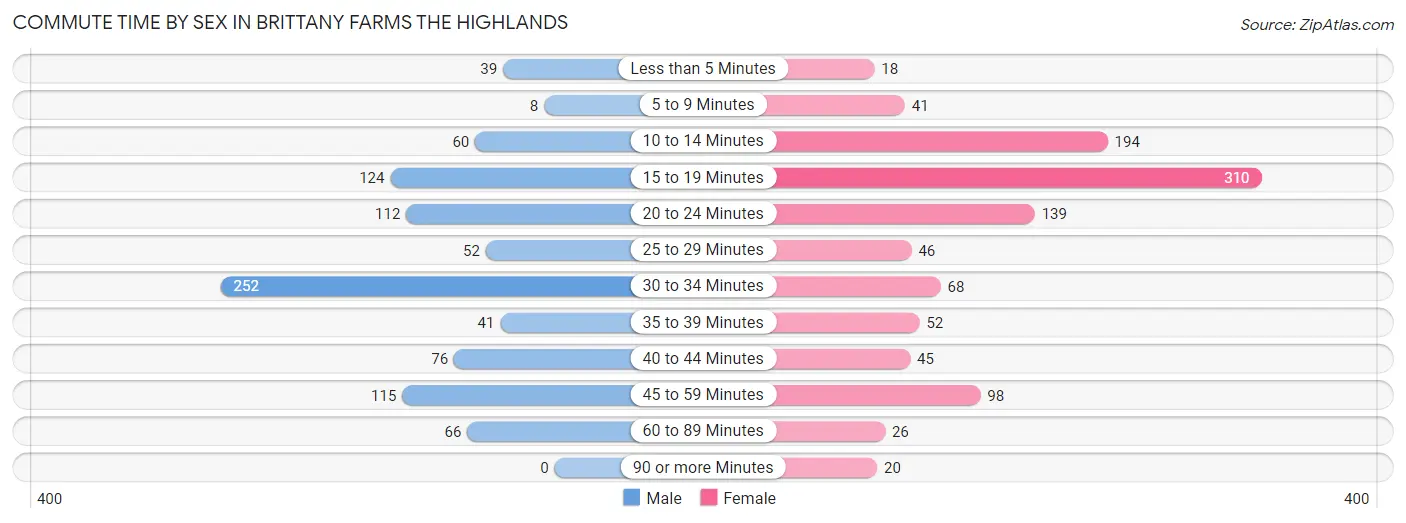
| Commute Time | Male | Female |
| Less than 5 Minutes | 39 (4.1%) | 18 (1.7%) |
| 5 to 9 Minutes | 8 (0.9%) | 41 (3.9%) |
| 10 to 14 Minutes | 60 (6.4%) | 194 (18.3%) |
| 15 to 19 Minutes | 124 (13.1%) | 310 (29.3%) |
| 20 to 24 Minutes | 112 (11.8%) | 139 (13.2%) |
| 25 to 29 Minutes | 52 (5.5%) | 46 (4.3%) |
| 30 to 34 Minutes | 252 (26.7%) | 68 (6.4%) |
| 35 to 39 Minutes | 41 (4.3%) | 52 (4.9%) |
| 40 to 44 Minutes | 76 (8.0%) | 45 (4.3%) |
| 45 to 59 Minutes | 115 (12.2%) | 98 (9.3%) |
| 60 to 89 Minutes | 66 (7.0%) | 26 (2.5%) |
| 90 or more Minutes | 0 (0.0%) | 20 (1.9%) |
Time of Departure to Work by Sex in Brittany Farms The Highlands
The most frequent times of departure to work in Brittany Farms The Highlands are 7:00 AM to 7:29 AM (155, 16.4%) for males and 8:00 AM to 8:29 AM (197, 18.6%) for females.
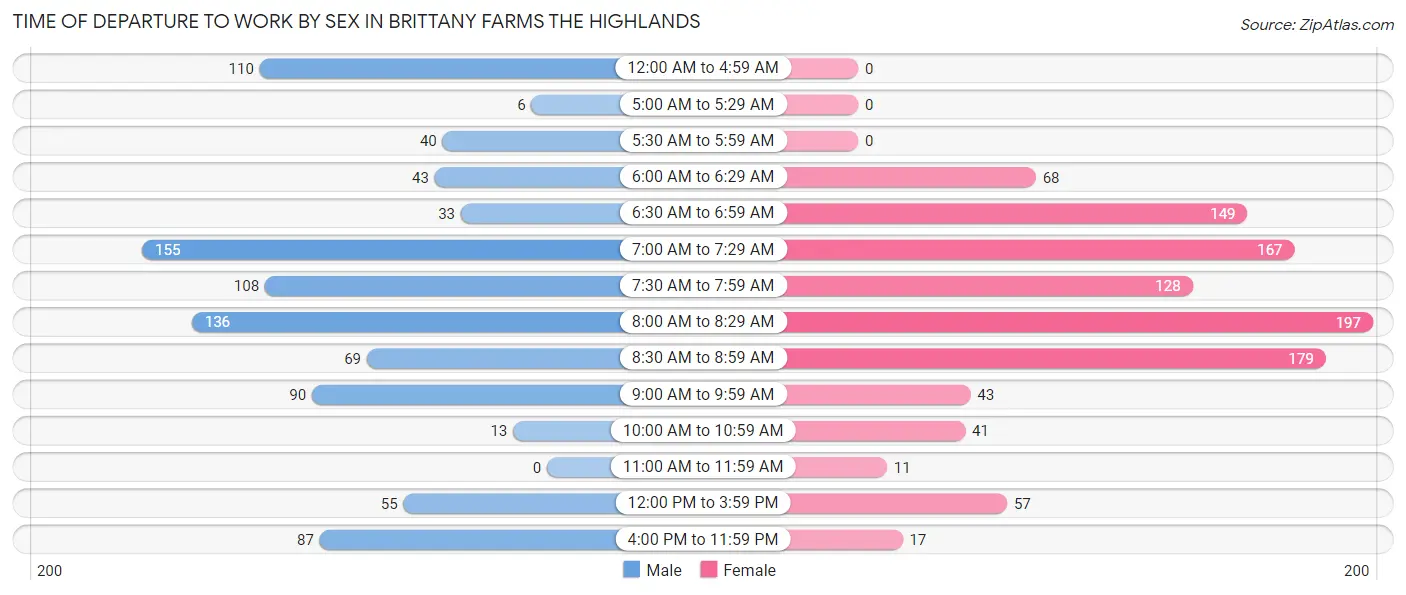
| Time of Departure | Male | Female |
| 12:00 AM to 4:59 AM | 110 (11.6%) | 0 (0.0%) |
| 5:00 AM to 5:29 AM | 6 (0.6%) | 0 (0.0%) |
| 5:30 AM to 5:59 AM | 40 (4.2%) | 0 (0.0%) |
| 6:00 AM to 6:29 AM | 43 (4.5%) | 68 (6.4%) |
| 6:30 AM to 6:59 AM | 33 (3.5%) | 149 (14.1%) |
| 7:00 AM to 7:29 AM | 155 (16.4%) | 167 (15.8%) |
| 7:30 AM to 7:59 AM | 108 (11.4%) | 128 (12.1%) |
| 8:00 AM to 8:29 AM | 136 (14.4%) | 197 (18.6%) |
| 8:30 AM to 8:59 AM | 69 (7.3%) | 179 (16.9%) |
| 9:00 AM to 9:59 AM | 90 (9.5%) | 43 (4.1%) |
| 10:00 AM to 10:59 AM | 13 (1.4%) | 41 (3.9%) |
| 11:00 AM to 11:59 AM | 0 (0.0%) | 11 (1.0%) |
| 12:00 PM to 3:59 PM | 55 (5.8%) | 57 (5.4%) |
| 4:00 PM to 11:59 PM | 87 (9.2%) | 17 (1.6%) |
| Total | 945 (100.0%) | 1,057 (100.0%) |
Housing Occupancy in Brittany Farms The Highlands
Occupancy by Ownership in Brittany Farms The Highlands
Of the total 1,772 dwellings in Brittany Farms The Highlands, owner-occupied units account for 1,274 (71.9%), while renter-occupied units make up 498 (28.1%).
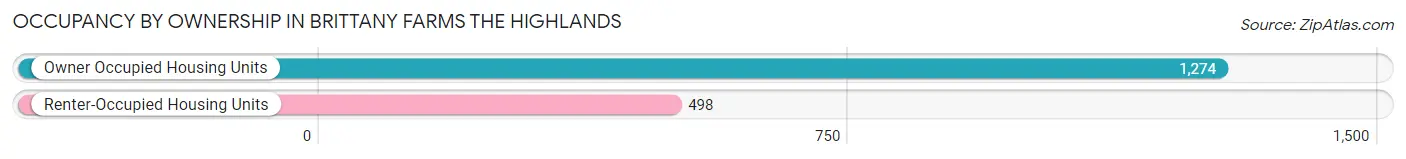
| Occupancy | # Housing Units | % Housing Units |
| Owner Occupied Housing Units | 1,274 | 71.9% |
| Renter-Occupied Housing Units | 498 | 28.1% |
| Total Occupied Housing Units | 1,772 | 100.0% |
Occupancy by Household Size in Brittany Farms The Highlands
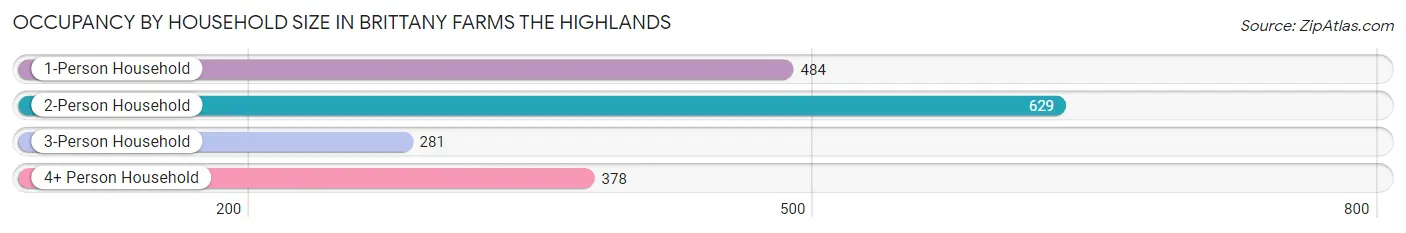
| Household Size | # Housing Units | % Housing Units |
| 1-Person Household | 484 | 27.3% |
| 2-Person Household | 629 | 35.5% |
| 3-Person Household | 281 | 15.9% |
| 4+ Person Household | 378 | 21.3% |
| Total Housing Units | 1,772 | 100.0% |
Occupancy by Ownership by Household Size in Brittany Farms The Highlands
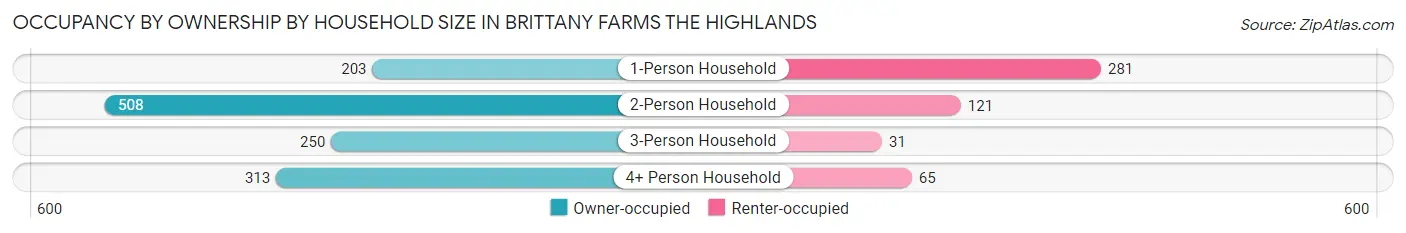
| Household Size | Owner-occupied | Renter-occupied |
| 1-Person Household | 203 (41.9%) | 281 (58.1%) |
| 2-Person Household | 508 (80.8%) | 121 (19.2%) |
| 3-Person Household | 250 (89.0%) | 31 (11.0%) |
| 4+ Person Household | 313 (82.8%) | 65 (17.2%) |
| Total Housing Units | 1,274 (71.9%) | 498 (28.1%) |
Occupancy by Educational Attainment in Brittany Farms The Highlands
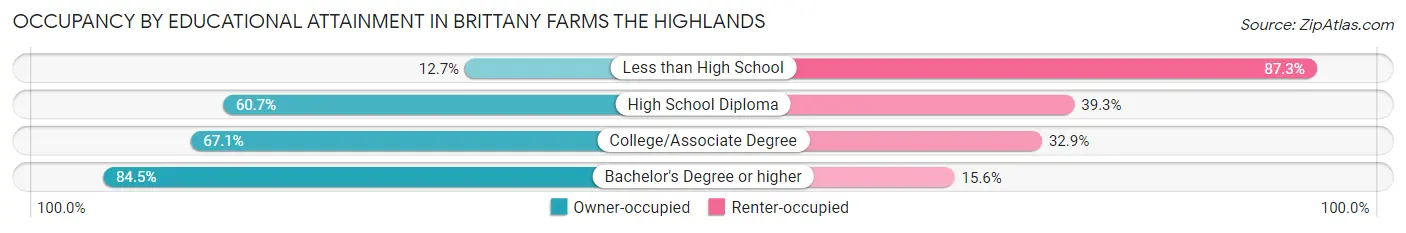
| Household Size | Owner-occupied | Renter-occupied |
| Less than High School | 8 (12.7%) | 55 (87.3%) |
| High School Diploma | 224 (60.7%) | 145 (39.3%) |
| College/Associate Degree | 347 (67.1%) | 170 (32.9%) |
| Bachelor's Degree or higher | 695 (84.5%) | 128 (15.5%) |
Occupancy by Age of Householder in Brittany Farms The Highlands
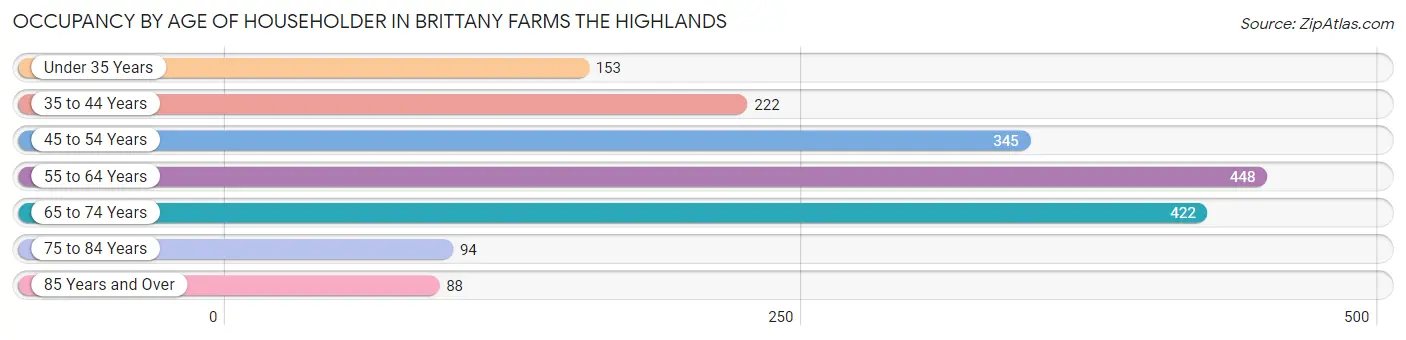
| Age Bracket | # Households | % Households |
| Under 35 Years | 153 | 8.6% |
| 35 to 44 Years | 222 | 12.5% |
| 45 to 54 Years | 345 | 19.5% |
| 55 to 64 Years | 448 | 25.3% |
| 65 to 74 Years | 422 | 23.8% |
| 75 to 84 Years | 94 | 5.3% |
| 85 Years and Over | 88 | 5.0% |
| Total | 1,772 | 100.0% |
Housing Finances in Brittany Farms The Highlands
Median Income by Occupancy in Brittany Farms The Highlands
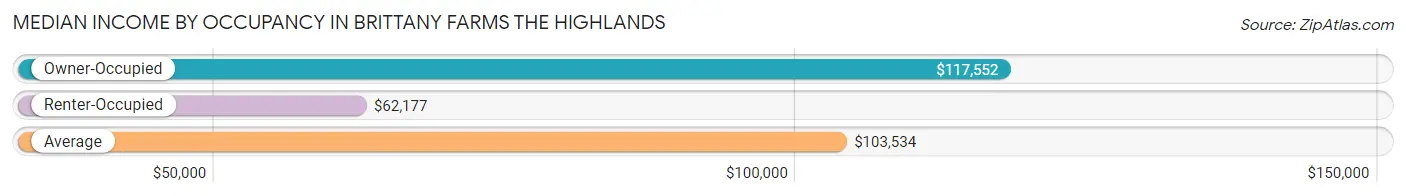
| Occupancy Type | # Households | Median Income |
| Owner-Occupied | 1,274 (71.9%) | $117,552 |
| Renter-Occupied | 498 (28.1%) | $62,177 |
| Average | 1,772 (100.0%) | $103,534 |
Occupancy by Householder Income Bracket in Brittany Farms The Highlands
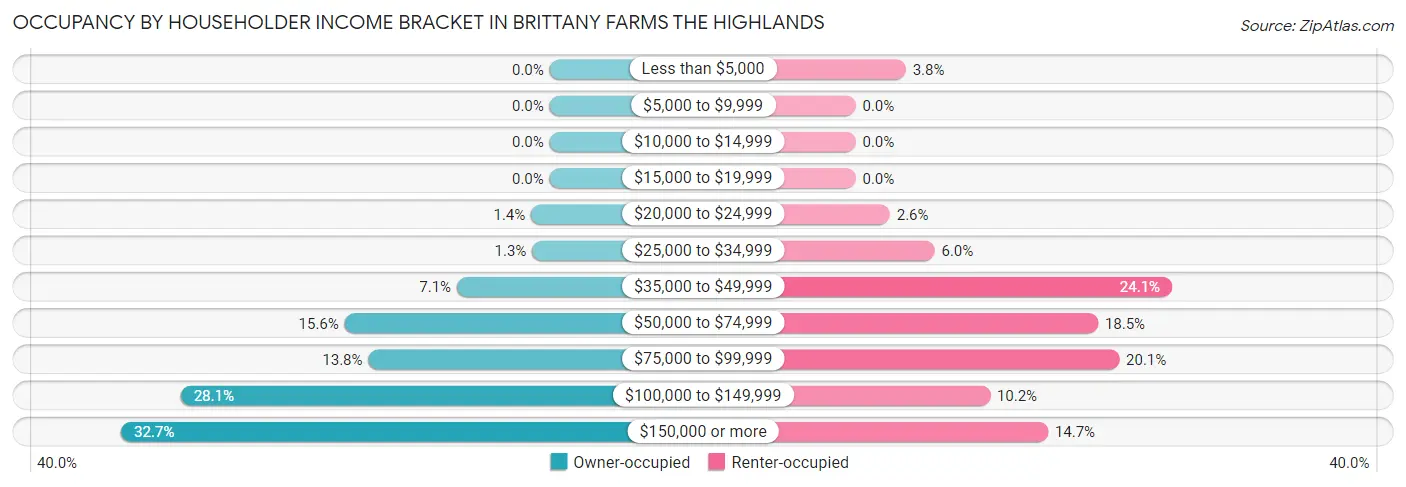
| Income Bracket | Owner-occupied | Renter-occupied |
| Less than $5,000 | 0 (0.0%) | 19 (3.8%) |
| $5,000 to $9,999 | 0 (0.0%) | 0 (0.0%) |
| $10,000 to $14,999 | 0 (0.0%) | 0 (0.0%) |
| $15,000 to $19,999 | 0 (0.0%) | 0 (0.0%) |
| $20,000 to $24,999 | 18 (1.4%) | 13 (2.6%) |
| $25,000 to $34,999 | 17 (1.3%) | 30 (6.0%) |
| $35,000 to $49,999 | 90 (7.1%) | 120 (24.1%) |
| $50,000 to $74,999 | 199 (15.6%) | 92 (18.5%) |
| $75,000 to $99,999 | 176 (13.8%) | 100 (20.1%) |
| $100,000 to $149,999 | 358 (28.1%) | 51 (10.2%) |
| $150,000 or more | 416 (32.7%) | 73 (14.7%) |
| Total | 1,274 (100.0%) | 498 (100.0%) |
Monthly Housing Cost Tiers in Brittany Farms The Highlands
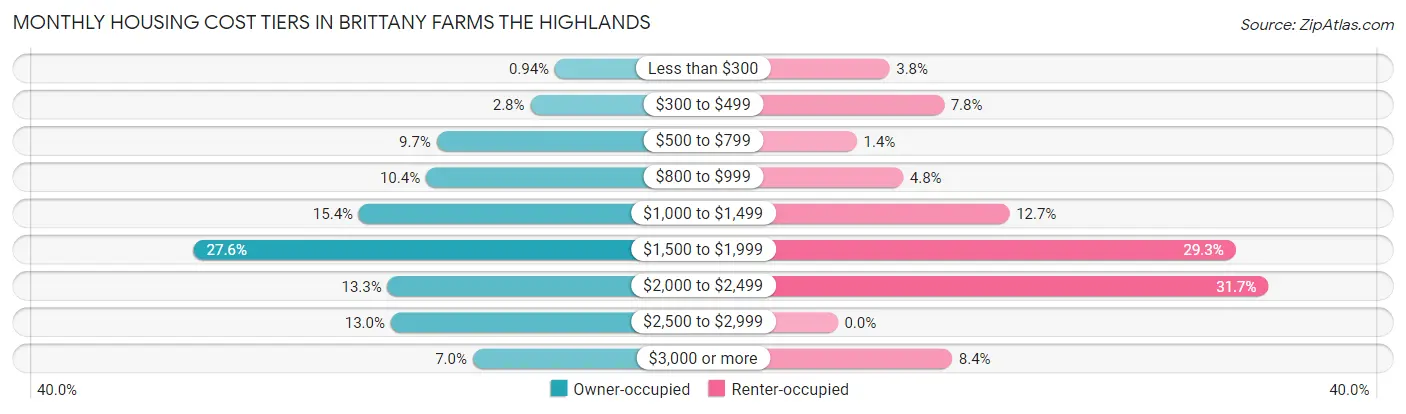
| Monthly Cost | Owner-occupied | Renter-occupied |
| Less than $300 | 12 (0.9%) | 19 (3.8%) |
| $300 to $499 | 35 (2.8%) | 39 (7.8%) |
| $500 to $799 | 123 (9.7%) | 7 (1.4%) |
| $800 to $999 | 133 (10.4%) | 24 (4.8%) |
| $1,000 to $1,499 | 196 (15.4%) | 63 (12.7%) |
| $1,500 to $1,999 | 351 (27.6%) | 146 (29.3%) |
| $2,000 to $2,499 | 169 (13.3%) | 158 (31.7%) |
| $2,500 to $2,999 | 166 (13.0%) | 0 (0.0%) |
| $3,000 or more | 89 (7.0%) | 42 (8.4%) |
| Total | 1,274 (100.0%) | 498 (100.0%) |
Physical Housing Characteristics in Brittany Farms The Highlands
Housing Structures in Brittany Farms The Highlands
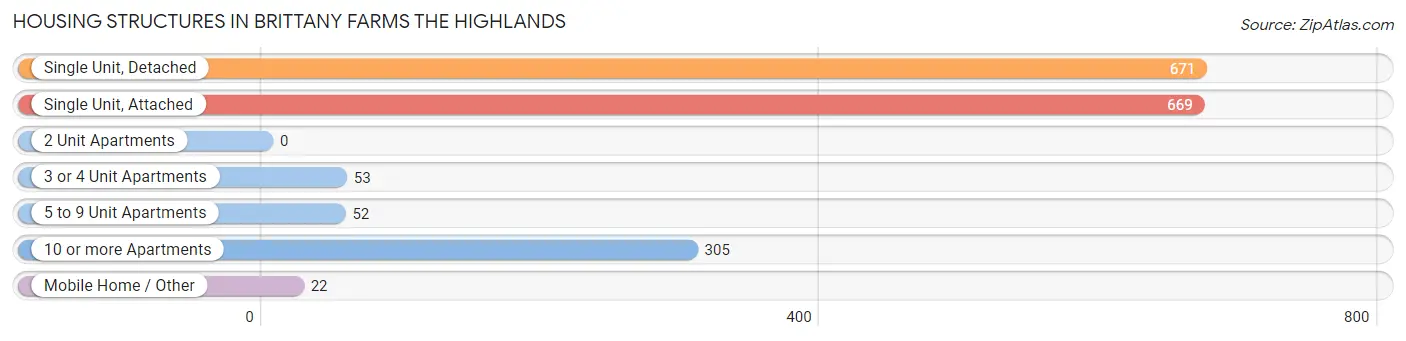
| Structure Type | # Housing Units | % Housing Units |
| Single Unit, Detached | 671 | 37.9% |
| Single Unit, Attached | 669 | 37.8% |
| 2 Unit Apartments | 0 | 0.0% |
| 3 or 4 Unit Apartments | 53 | 3.0% |
| 5 to 9 Unit Apartments | 52 | 2.9% |
| 10 or more Apartments | 305 | 17.2% |
| Mobile Home / Other | 22 | 1.2% |
| Total | 1,772 | 100.0% |
Housing Structures by Occupancy in Brittany Farms The Highlands
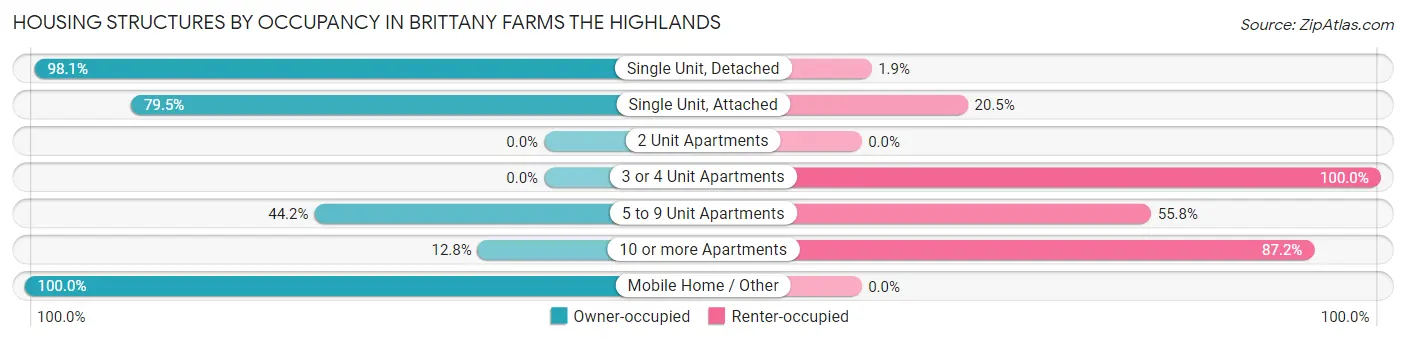
| Structure Type | Owner-occupied | Renter-occupied |
| Single Unit, Detached | 658 (98.1%) | 13 (1.9%) |
| Single Unit, Attached | 532 (79.5%) | 137 (20.5%) |
| 2 Unit Apartments | 0 (0.0%) | 0 (0.0%) |
| 3 or 4 Unit Apartments | 0 (0.0%) | 53 (100.0%) |
| 5 to 9 Unit Apartments | 23 (44.2%) | 29 (55.8%) |
| 10 or more Apartments | 39 (12.8%) | 266 (87.2%) |
| Mobile Home / Other | 22 (100.0%) | 0 (0.0%) |
| Total | 1,274 (71.9%) | 498 (28.1%) |
Housing Structures by Number of Rooms in Brittany Farms The Highlands
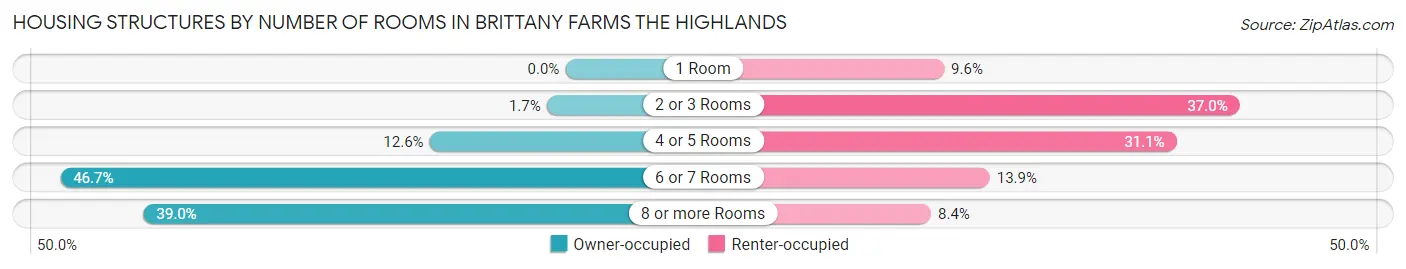
| Number of Rooms | Owner-occupied | Renter-occupied |
| 1 Room | 0 (0.0%) | 48 (9.6%) |
| 2 or 3 Rooms | 22 (1.7%) | 184 (36.9%) |
| 4 or 5 Rooms | 160 (12.6%) | 155 (31.1%) |
| 6 or 7 Rooms | 595 (46.7%) | 69 (13.9%) |
| 8 or more Rooms | 497 (39.0%) | 42 (8.4%) |
| Total | 1,274 (100.0%) | 498 (100.0%) |
Housing Structure by Heating Type in Brittany Farms The Highlands
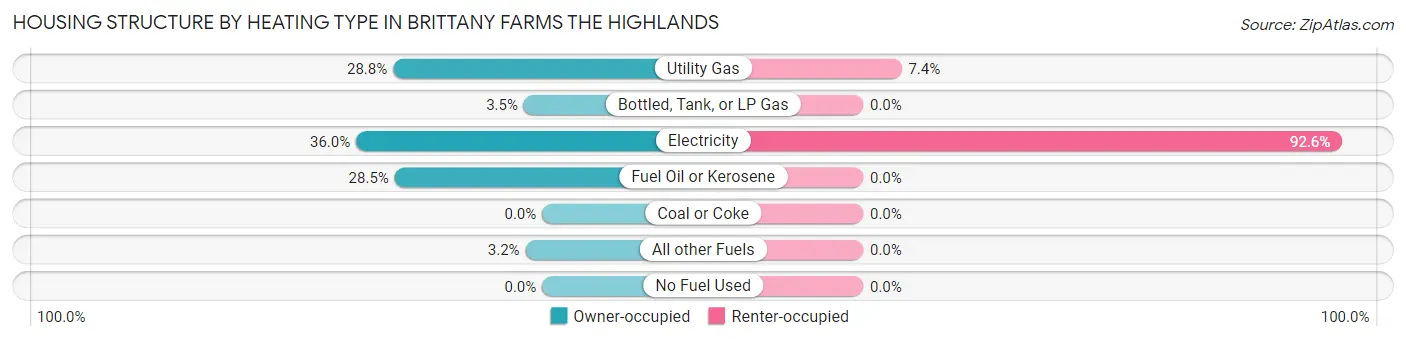
| Heating Type | Owner-occupied | Renter-occupied |
| Utility Gas | 367 (28.8%) | 37 (7.4%) |
| Bottled, Tank, or LP Gas | 45 (3.5%) | 0 (0.0%) |
| Electricity | 458 (35.9%) | 461 (92.6%) |
| Fuel Oil or Kerosene | 363 (28.5%) | 0 (0.0%) |
| Coal or Coke | 0 (0.0%) | 0 (0.0%) |
| All other Fuels | 41 (3.2%) | 0 (0.0%) |
| No Fuel Used | 0 (0.0%) | 0 (0.0%) |
| Total | 1,274 (100.0%) | 498 (100.0%) |
Household Vehicle Usage in Brittany Farms The Highlands
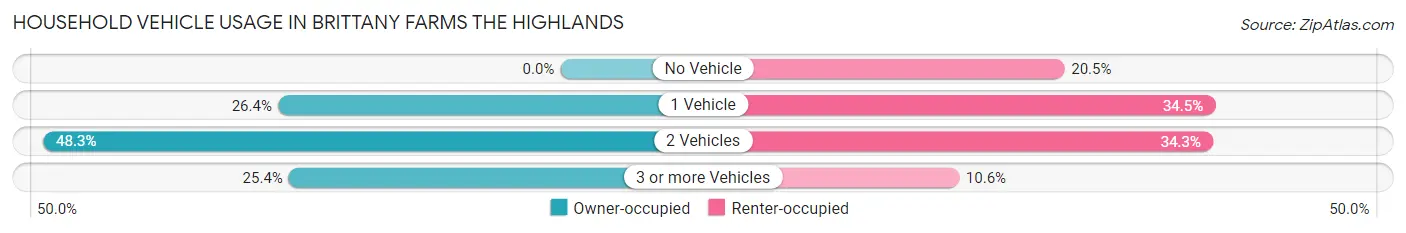
| Vehicles per Household | Owner-occupied | Renter-occupied |
| No Vehicle | 0 (0.0%) | 102 (20.5%) |
| 1 Vehicle | 336 (26.4%) | 172 (34.5%) |
| 2 Vehicles | 615 (48.3%) | 171 (34.3%) |
| 3 or more Vehicles | 323 (25.4%) | 53 (10.6%) |
| Total | 1,274 (100.0%) | 498 (100.0%) |
Real Estate & Mortgages in Brittany Farms The Highlands
Real Estate and Mortgage Overview in Brittany Farms The Highlands
| Characteristic | Without Mortgage | With Mortgage |
| Housing Units | 315 | 959 |
| Median Property Value | $351,100 | $378,000 |
| Median Household Income | $117,330 | $277 |
| Monthly Housing Costs | $774 | $89 |
| Real Estate Taxes | $4,456 | $0 |
Property Value by Mortgage Status in Brittany Farms The Highlands
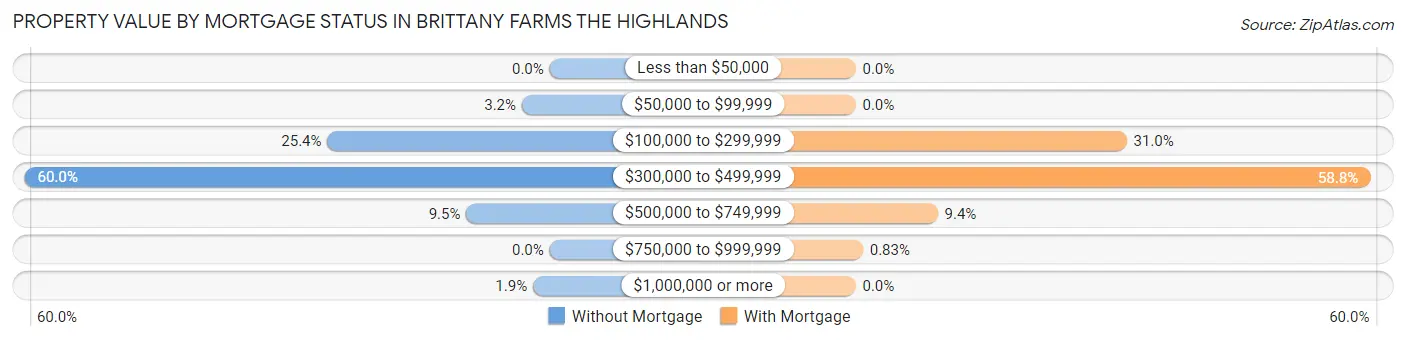
| Property Value | Without Mortgage | With Mortgage |
| Less than $50,000 | 0 (0.0%) | 0 (0.0%) |
| $50,000 to $99,999 | 10 (3.2%) | 0 (0.0%) |
| $100,000 to $299,999 | 80 (25.4%) | 297 (31.0%) |
| $300,000 to $499,999 | 189 (60.0%) | 564 (58.8%) |
| $500,000 to $749,999 | 30 (9.5%) | 90 (9.4%) |
| $750,000 to $999,999 | 0 (0.0%) | 8 (0.8%) |
| $1,000,000 or more | 6 (1.9%) | 0 (0.0%) |
| Total | 315 (100.0%) | 959 (100.0%) |
Household Income by Mortgage Status in Brittany Farms The Highlands
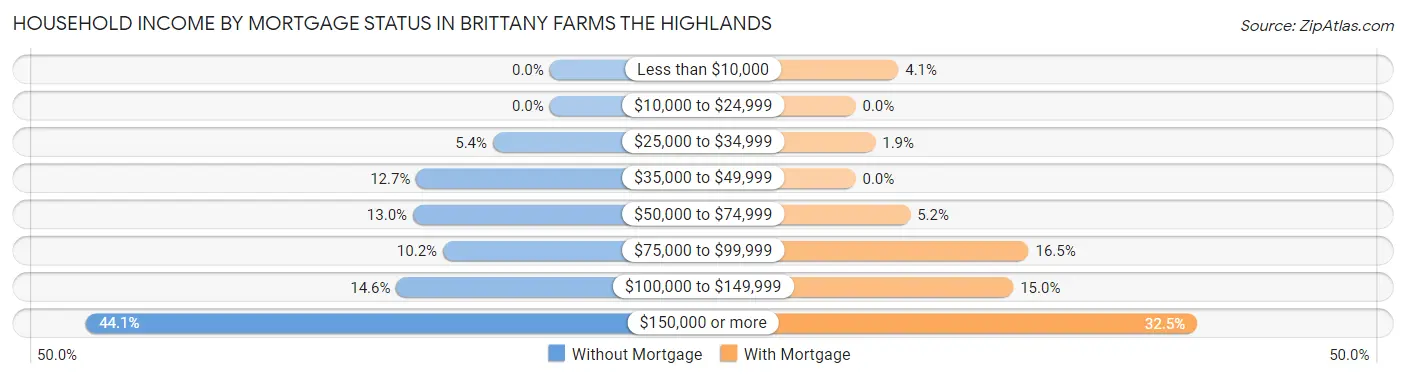
| Household Income | Without Mortgage | With Mortgage |
| Less than $10,000 | 0 (0.0%) | 39 (4.1%) |
| $10,000 to $24,999 | 0 (0.0%) | 0 (0.0%) |
| $25,000 to $34,999 | 17 (5.4%) | 18 (1.9%) |
| $35,000 to $49,999 | 40 (12.7%) | 0 (0.0%) |
| $50,000 to $74,999 | 41 (13.0%) | 50 (5.2%) |
| $75,000 to $99,999 | 32 (10.2%) | 158 (16.5%) |
| $100,000 to $149,999 | 46 (14.6%) | 144 (15.0%) |
| $150,000 or more | 139 (44.1%) | 312 (32.5%) |
| Total | 315 (100.0%) | 959 (100.0%) |
Property Value to Household Income Ratio in Brittany Farms The Highlands
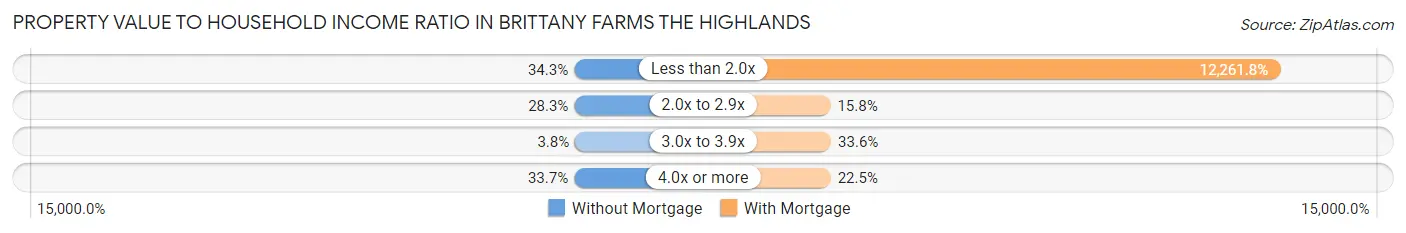
| Value-to-Income Ratio | Without Mortgage | With Mortgage |
| Less than 2.0x | 108 (34.3%) | 117,591 (12,261.8%) |
| 2.0x to 2.9x | 89 (28.2%) | 151 (15.8%) |
| 3.0x to 3.9x | 12 (3.8%) | 322 (33.6%) |
| 4.0x or more | 106 (33.7%) | 216 (22.5%) |
| Total | 315 (100.0%) | 959 (100.0%) |
Real Estate Taxes by Mortgage Status in Brittany Farms The Highlands
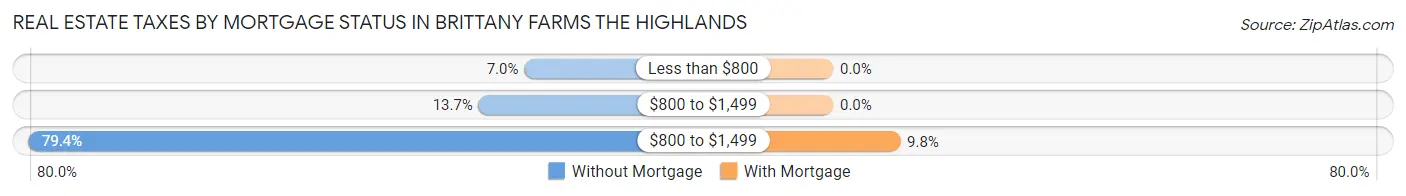
| Property Taxes | Without Mortgage | With Mortgage |
| Less than $800 | 22 (7.0%) | 0 (0.0%) |
| $800 to $1,499 | 43 (13.7%) | 0 (0.0%) |
| $800 to $1,499 | 250 (79.4%) | 94 (9.8%) |
| Total | 315 (100.0%) | 959 (100.0%) |
Health & Disability in Brittany Farms The Highlands
Health Insurance Coverage by Age in Brittany Farms The Highlands
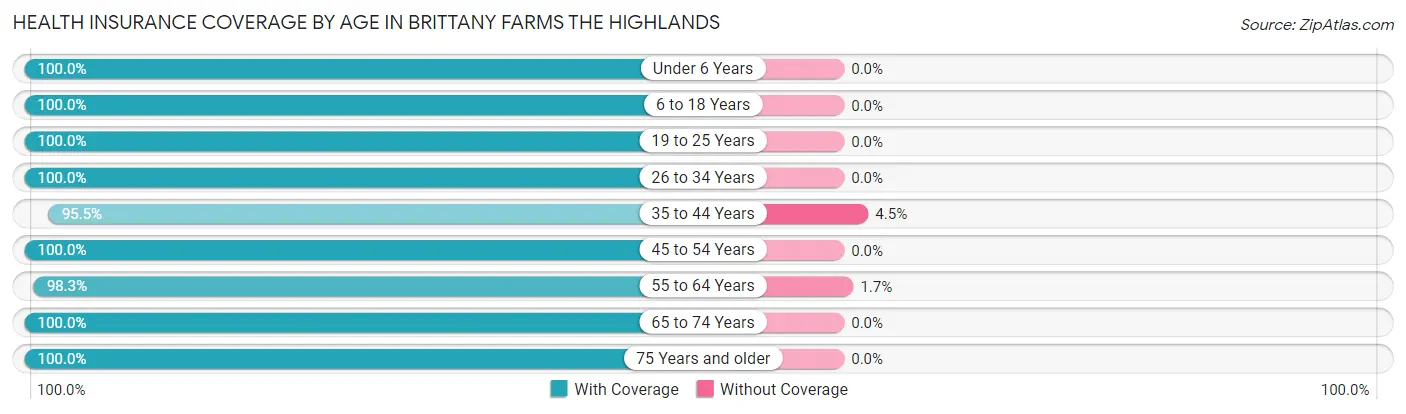
| Age Bracket | With Coverage | Without Coverage |
| Under 6 Years | 169 (100.0%) | 0 (0.0%) |
| 6 to 18 Years | 663 (100.0%) | 0 (0.0%) |
| 19 to 25 Years | 366 (100.0%) | 0 (0.0%) |
| 26 to 34 Years | 355 (100.0%) | 0 (0.0%) |
| 35 to 44 Years | 446 (95.5%) | 21 (4.5%) |
| 45 to 54 Years | 695 (100.0%) | 0 (0.0%) |
| 55 to 64 Years | 634 (98.3%) | 11 (1.7%) |
| 65 to 74 Years | 630 (100.0%) | 0 (0.0%) |
| 75 Years and older | 296 (100.0%) | 0 (0.0%) |
| Total | 4,254 (99.3%) | 32 (0.7%) |
Health Insurance Coverage by Citizenship Status in Brittany Farms The Highlands
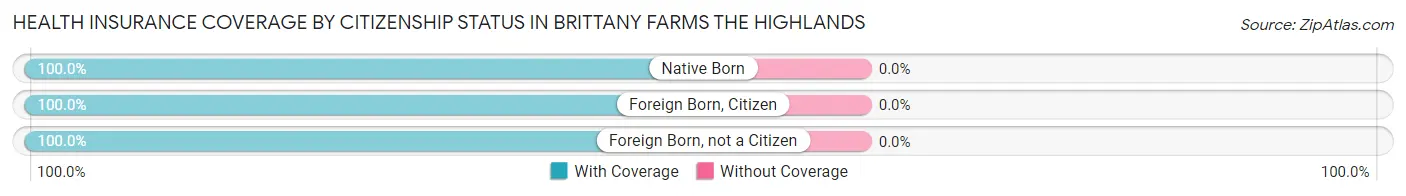
| Citizenship Status | With Coverage | Without Coverage |
| Native Born | 169 (100.0%) | 0 (0.0%) |
| Foreign Born, Citizen | 663 (100.0%) | 0 (0.0%) |
| Foreign Born, not a Citizen | 366 (100.0%) | 0 (0.0%) |
Health Insurance Coverage by Household Income in Brittany Farms The Highlands
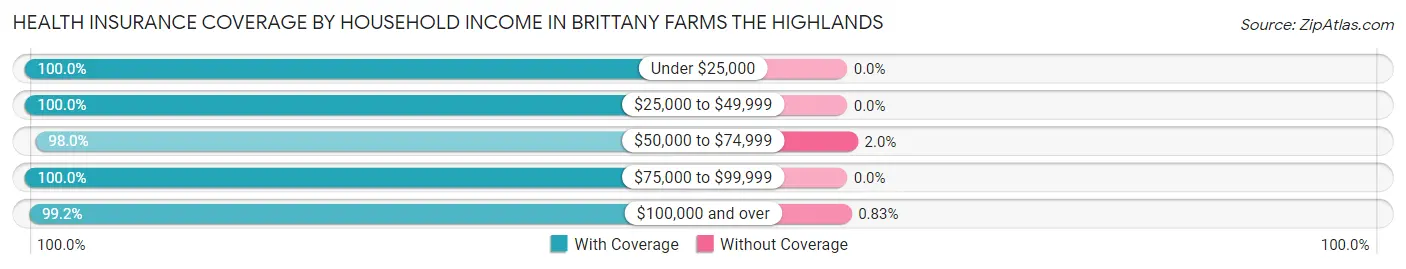
| Household Income | With Coverage | Without Coverage |
| Under $25,000 | 69 (100.0%) | 0 (0.0%) |
| $25,000 to $49,999 | 404 (100.0%) | 0 (0.0%) |
| $50,000 to $74,999 | 533 (98.0%) | 11 (2.0%) |
| $75,000 to $99,999 | 734 (100.0%) | 0 (0.0%) |
| $100,000 and over | 2,514 (99.2%) | 21 (0.8%) |
Public vs Private Health Insurance Coverage by Age in Brittany Farms The Highlands
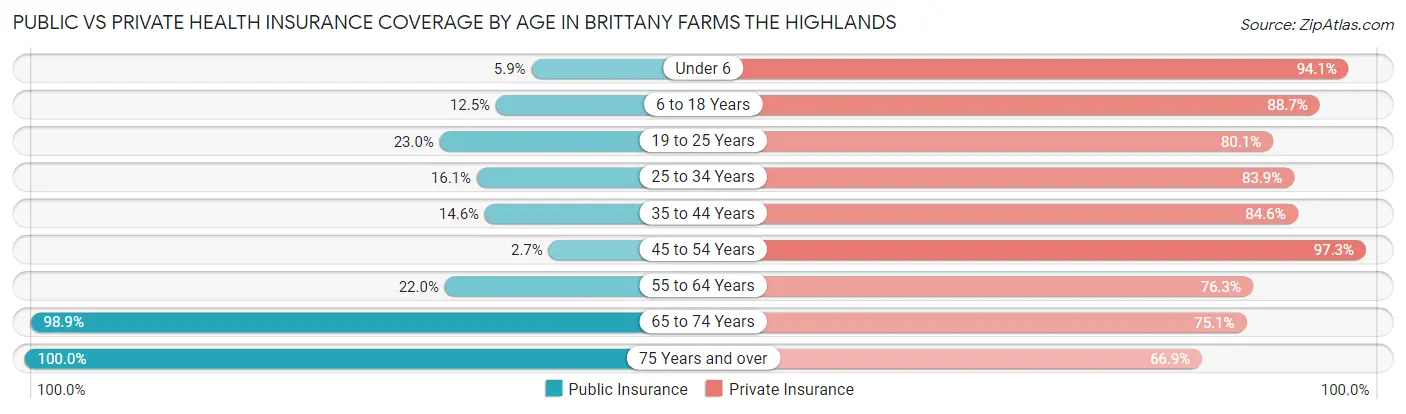
| Age Bracket | Public Insurance | Private Insurance |
| Under 6 | 10 (5.9%) | 159 (94.1%) |
| 6 to 18 Years | 83 (12.5%) | 588 (88.7%) |
| 19 to 25 Years | 84 (23.0%) | 293 (80.0%) |
| 25 to 34 Years | 57 (16.1%) | 298 (83.9%) |
| 35 to 44 Years | 68 (14.6%) | 395 (84.6%) |
| 45 to 54 Years | 19 (2.7%) | 676 (97.3%) |
| 55 to 64 Years | 142 (22.0%) | 492 (76.3%) |
| 65 to 74 Years | 623 (98.9%) | 473 (75.1%) |
| 75 Years and over | 296 (100.0%) | 198 (66.9%) |
| Total | 1,382 (32.2%) | 3,572 (83.3%) |
Disability Status by Sex by Age in Brittany Farms The Highlands
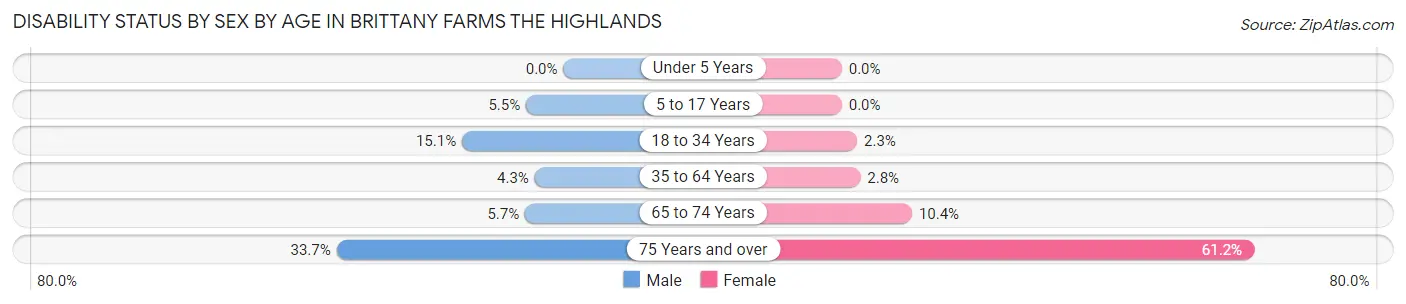
| Age Bracket | Male | Female |
| Under 5 Years | 0 (0.0%) | 0 (0.0%) |
| 5 to 17 Years | 20 (5.5%) | 0 (0.0%) |
| 18 to 34 Years | 48 (15.0%) | 11 (2.3%) |
| 35 to 64 Years | 40 (4.3%) | 24 (2.8%) |
| 65 to 74 Years | 14 (5.7%) | 40 (10.4%) |
| 75 Years and over | 32 (33.7%) | 123 (61.2%) |
Disability Class by Sex by Age in Brittany Farms The Highlands
Disability Class: Hearing Difficulty
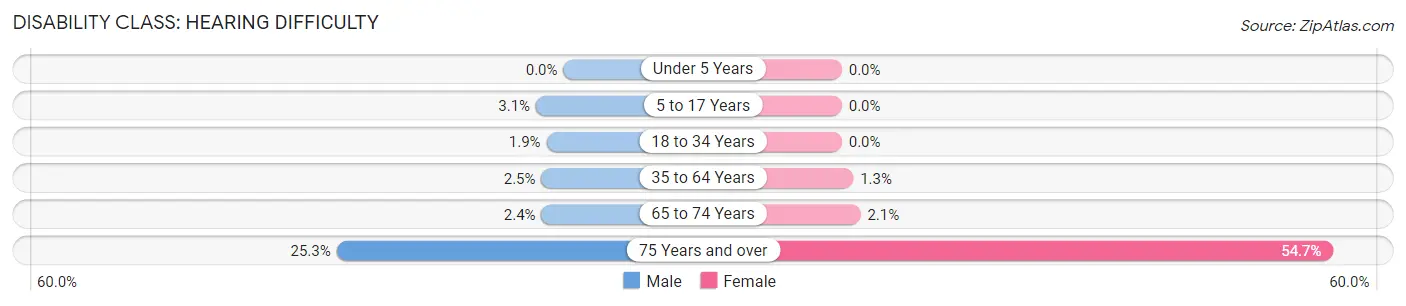
| Age Bracket | Male | Female |
| Under 5 Years | 0 (0.0%) | 0 (0.0%) |
| 5 to 17 Years | 11 (3.0%) | 0 (0.0%) |
| 18 to 34 Years | 6 (1.9%) | 0 (0.0%) |
| 35 to 64 Years | 23 (2.5%) | 11 (1.3%) |
| 65 to 74 Years | 6 (2.4%) | 8 (2.1%) |
| 75 Years and over | 24 (25.3%) | 110 (54.7%) |
Disability Class: Vision Difficulty
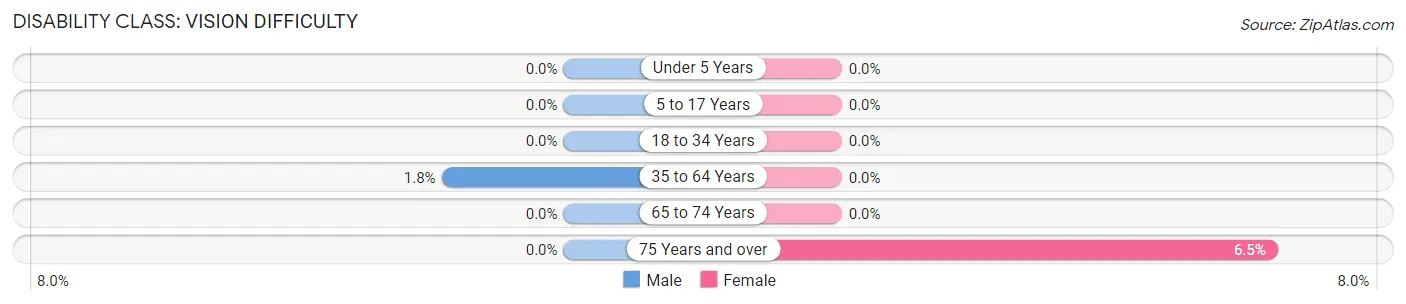
| Age Bracket | Male | Female |
| Under 5 Years | 0 (0.0%) | 0 (0.0%) |
| 5 to 17 Years | 0 (0.0%) | 0 (0.0%) |
| 18 to 34 Years | 0 (0.0%) | 0 (0.0%) |
| 35 to 64 Years | 17 (1.8%) | 0 (0.0%) |
| 65 to 74 Years | 0 (0.0%) | 0 (0.0%) |
| 75 Years and over | 0 (0.0%) | 13 (6.5%) |
Disability Class: Cognitive Difficulty
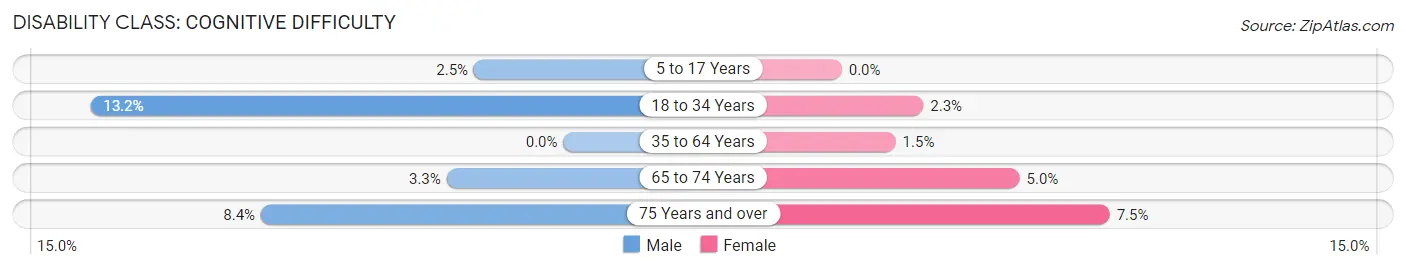
| Age Bracket | Male | Female |
| 5 to 17 Years | 9 (2.5%) | 0 (0.0%) |
| 18 to 34 Years | 42 (13.2%) | 11 (2.3%) |
| 35 to 64 Years | 0 (0.0%) | 13 (1.5%) |
| 65 to 74 Years | 8 (3.3%) | 19 (5.0%) |
| 75 Years and over | 8 (8.4%) | 15 (7.5%) |
Disability Class: Ambulatory Difficulty
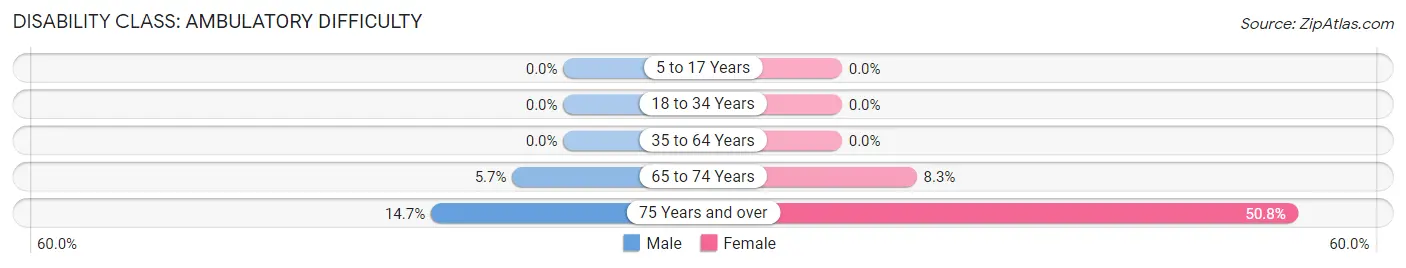
| Age Bracket | Male | Female |
| 5 to 17 Years | 0 (0.0%) | 0 (0.0%) |
| 18 to 34 Years | 0 (0.0%) | 0 (0.0%) |
| 35 to 64 Years | 0 (0.0%) | 0 (0.0%) |
| 65 to 74 Years | 14 (5.7%) | 32 (8.3%) |
| 75 Years and over | 14 (14.7%) | 102 (50.7%) |
Disability Class: Self-Care Difficulty
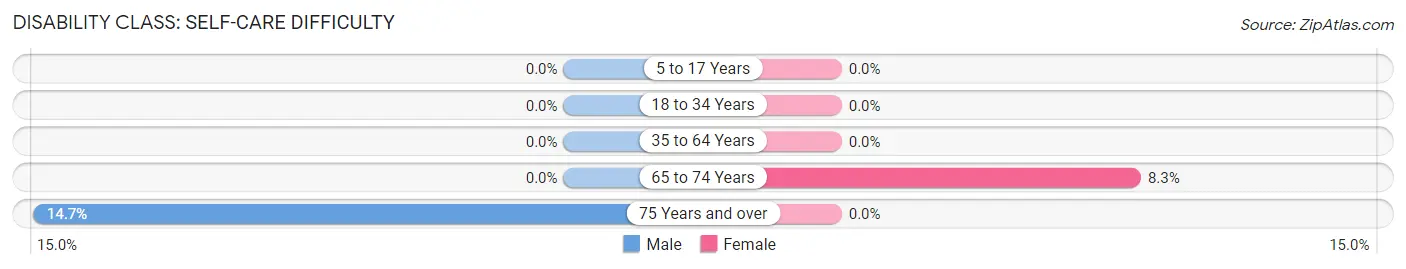
| Age Bracket | Male | Female |
| 5 to 17 Years | 0 (0.0%) | 0 (0.0%) |
| 18 to 34 Years | 0 (0.0%) | 0 (0.0%) |
| 35 to 64 Years | 0 (0.0%) | 0 (0.0%) |
| 65 to 74 Years | 0 (0.0%) | 32 (8.3%) |
| 75 Years and over | 14 (14.7%) | 0 (0.0%) |
Technology Access in Brittany Farms The Highlands
Computing Device Access in Brittany Farms The Highlands
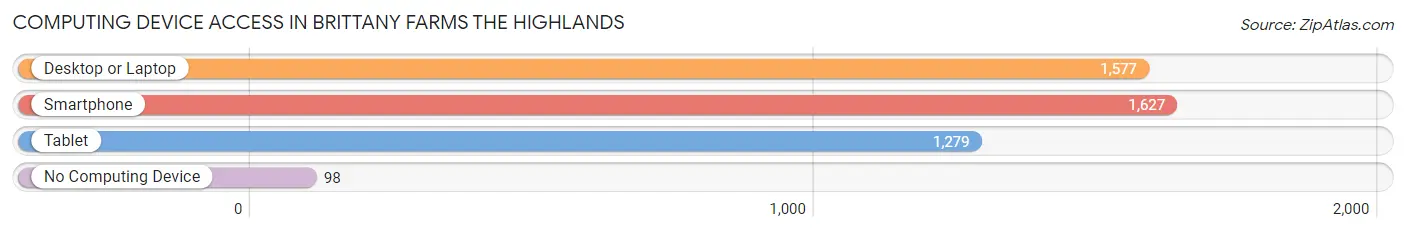
| Device Type | # Households | % Households |
| Desktop or Laptop | 1,577 | 89.0% |
| Smartphone | 1,627 | 91.8% |
| Tablet | 1,279 | 72.2% |
| No Computing Device | 98 | 5.5% |
| Total | 1,772 | 100.0% |
Internet Access in Brittany Farms The Highlands
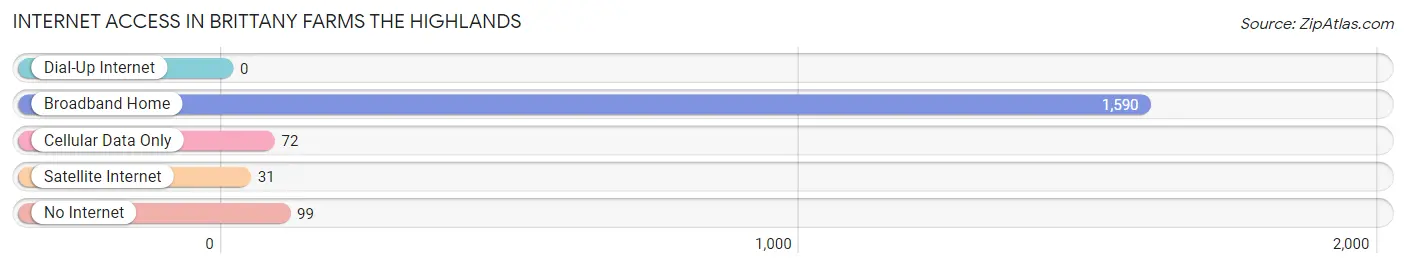
| Internet Type | # Households | % Households |
| Dial-Up Internet | 0 | 0.0% |
| Broadband Home | 1,590 | 89.7% |
| Cellular Data Only | 72 | 4.1% |
| Satellite Internet | 31 | 1.8% |
| No Internet | 99 | 5.6% |
| Total | 1,772 | 100.0% |
Brittany Farms The Highlands Summary
Brittany Farms The Highlands, PA is a small, rural community located in the northern part of Pennsylvania. It is situated in the foothills of the Allegheny Mountains, and is part of the greater Pittsburgh metropolitan area. The community is home to approximately 1,500 people, and is known for its rural charm and close-knit community.
History
The area that is now known as Brittany Farms The Highlands, PA was first settled in the late 1700s by a group of German immigrants. The area was originally known as “The Highlands” due to its location in the foothills of the Allegheny Mountains. The area was primarily used for farming and logging, and the first settlers built small log cabins and cleared the land for farming.
In the early 1900s, the area began to experience a population boom as more people moved to the area to take advantage of the fertile land and the abundance of natural resources. The area was also home to a number of small businesses, including a sawmill, a gristmill, and a general store.
In the 1950s, the area began to experience a decline in population as people moved away to larger cities in search of better job opportunities. In the late 1970s, the area was purchased by a group of investors who wanted to create a rural community that would be a haven for those looking to escape the hustle and bustle of city life. The investors named the area Brittany Farms The Highlands, PA, and began to develop the area into a residential community.
Geography
Brittany Farms The Highlands, PA is located in the northern part of Pennsylvania, in the foothills of the Allegheny Mountains. The area is known for its rolling hills and lush forests, and is home to a number of small streams and creeks. The area is also home to a number of small lakes, including Lake Arthur and Lake Wallenpaupack.
The area is located approximately 30 miles from the city of Pittsburgh, and is easily accessible by car or public transportation. The area is also home to a number of small towns and villages, including Tunkhannock, Factoryville, and Nicholson.
Economy
The economy of Brittany Farms The Highlands, PA is primarily based on agriculture and tourism. The area is home to a number of small farms, and the local farmers produce a variety of crops, including corn, soybeans, and hay. The area is also home to a number of small businesses, including restaurants, shops, and bed and breakfasts.
The area is also home to a number of tourist attractions, including the Lackawanna State Park, the Steamtown National Historic Site, and the Lackawanna River. The area is also home to a number of wineries, and the local wineries produce a variety of wines, including Chardonnay, Merlot, and Cabernet Sauvignon.
Demographics
As of the 2010 census, the population of Brittany Farms The Highlands, PA was 1,500. The population is primarily white (96.7%), with a small percentage of African Americans (1.3%) and Hispanics (1.0%). The median household income in the area is $45,000, and the median age is 43.
Conclusion
Brittany Farms The Highlands, PA is a small, rural community located in the northern part of Pennsylvania. The area is known for its rolling hills and lush forests, and is home to a number of small farms and businesses. The area is also home to a number of tourist attractions, and the local economy is primarily based on agriculture and tourism. The population of the area is primarily white, with a small percentage of African Americans and Hispanics.
Common Questions
What is Per Capita Income in Brittany Farms The Highlands?
Per Capita income in Brittany Farms The Highlands is $51,985.
What is the Median Family Income in Brittany Farms The Highlands?
Median Family Income in Brittany Farms The Highlands is $117,372.
What is the Median Household income in Brittany Farms The Highlands?
Median Household Income in Brittany Farms The Highlands is $103,534.
What is Income or Wage Gap in Brittany Farms The Highlands?
Income or Wage Gap in Brittany Farms The Highlands is 32.3%.
Women in Brittany Farms The Highlands earn 67.7 cents for every dollar earned by a man.
What is Inequality or Gini Index in Brittany Farms The Highlands?
Inequality or Gini Index in Brittany Farms The Highlands is 0.37.
What is the Total Population of Brittany Farms The Highlands?
Total Population of Brittany Farms The Highlands is 4,286.
What is the Total Male Population of Brittany Farms The Highlands?
Total Male Population of Brittany Farms The Highlands is 2,052.
What is the Total Female Population of Brittany Farms The Highlands?
Total Female Population of Brittany Farms The Highlands is 2,234.
What is the Ratio of Males per 100 Females in Brittany Farms The Highlands?
There are 91.85 Males per 100 Females in Brittany Farms The Highlands.
What is the Ratio of Females per 100 Males in Brittany Farms The Highlands?
There are 108.87 Females per 100 Males in Brittany Farms The Highlands.
What is the Median Population Age in Brittany Farms The Highlands?
Median Population Age in Brittany Farms The Highlands is 46.3 Years.
What is the Average Family Size in Brittany Farms The Highlands
Average Family Size in Brittany Farms The Highlands is 3.0 People.
What is the Average Household Size in Brittany Farms The Highlands
Average Household Size in Brittany Farms The Highlands is 2.4 People.
How Large is the Labor Force in Brittany Farms The Highlands?
There are 2,601 People in the Labor Forcein in Brittany Farms The Highlands.
What is the Percentage of People in the Labor Force in Brittany Farms The Highlands?
71.5% of People are in the Labor Force in Brittany Farms The Highlands.
What is the Unemployment Rate in Brittany Farms The Highlands?
Unemployment Rate in Brittany Farms The Highlands is 5.8%.